SECURITIES AND EXCHANGE COMMISSION
Washington, D.C. 20549
Form 10-K
ANNUAL REPORT PURSUANT TO SECTION 13 OR 15(d) OF THE
SECURITIES EXCHANGE ACT OF 1934
For the Fiscal Year Ended April 1, 2012
Commission File No. 0-7647
|
| | |
| | |
| Form 10-K |
| ANNUAL REPORT PURSUANT TO SECTION 13 OR 15(d) OF THE |
| SECURITIES EXCHANGE ACT OF 1934 |
For the Fiscal Year Ended March 30, 2014 |
| Commission File No. 0-7647 |
| | |
(Exact Name of Registrant as specified in its Charter)
|
| | |
MINNESOTA | | 41-0771293 |
| MINNESOTA | | 41-0771293 |
| (State of Incorporation) | | Identification No.)
|
3100 East Hennepin Avenue, Minneapolis,
2381 Rosegate, Roseville, Minnesota
| | 5541355113 |
| (Address of Principal Executive Offices) | | (Zip Code) |
(Registrant’s Telephone Number, Including Area Code)
|
| | | | |
| | | | |
| Securities registered pursuant to Section 12(b) of the Act: | | COMMON STOCK, PAR VALUE $.05 PER SHARE |
Name of exchange on which registered: | | NASDAQ Global Market |
Securities registered pursuant to Section 12(g) of the Act: | | NONE |
| | | | |
Indicate by check mark if the registrant is a well-known seasoned issuer, as defined in Rule 405 of the Securities Act. Yes ¨ No þ Indicate by check mark if the registrant is not required to file reports pursuant to Section 13 or Section 15(d) of the Act. Yes ¨ No þ Indicate by check mark whether the Registrant (1) has filed all reports required to be filed by Section 13 or 15(d) of the Securities Exchange Act of 1934 during the preceding twelve months (or for such shorter period that the Registrant was required to file such reports) and (2) has been subject to such filing requirements for the past 90 days. Yes þ No ¨ Indicate by check mark whether the registrant has submitted electronically and posted on its corporate Web site, if any, every Interactive Data File required to be submitted and posted pursuant to Rule 405 of Regulation S-T during the preceding 12 months (or for such shorter period that the registrant was required to submit and post such files). Yes þ No ¨ Indicate by check mark if disclosure of delinquent filers pursuant to Item 405 of Regulation S-K is not contained herein, and will not be contained, to the best of the Registrant’s knowledge, in definitive proxy or information statements incorporated by reference in Part III of this Form 10-K or any amendment to this Form 10-K. þ¨ Indicate by check mark whether the registrant is a large accelerated filer, an accelerated filer, a non-accelerated filer, or a smaller reporting company. See the definitions of “large accelerated filer,” “accelerated filer” and “smaller reporting company” in Rule 12b-2 of the Exchange Act. (Check one):
|
| | | | | | | | | | |
| Large accelerated filer | | ¨ | | Non-accelerated filer | ¨ | | Accelerated filer | | þ |
| | | | |
Non-accelerated filer | | ¨ | | (Do not check if a smaller reporting company) | | Smaller reporting company | | ¨o |
Indicate by check mark whether the registrant is a shell company (as defined in Rule 12b-2 of the Exchange Act). Yes ¨ No þ The aggregate market value of voting stock held by non-affiliates of the Registrant on
October 2, 2011September 29, 2013 (the last business day of the Registrant’s most recently completed second fiscal quarter) was approximately
$285.4$358.3 million based upon the closing sale price for the Registrant’s common stock on that date as reported by The NASDAQ Stock Market, excluding all shares held by officers and directors of the Registrant and by the Trustees of the Registrant’s Employee Stock Ownership Plan and Trust.
As of May 25, 2012,23, 2014, the Registrant had 10,470,31510,612,640 shares of common stock outstanding. DOCUMENTS INCORPORATED BY REFERENCE
Portions of our Proxy Statement for the annual meeting of shareholders to be held August
2, 2012,7, 2014, are incorporated by reference in Part III.
FORWARD-LOOKING STATEMENTS
The information presented in this Annual Report on Form 10-K contains forward-looking statements within the meaning of Section 21E of the Securities Exchange Act of 1934, as amended (the “Exchange Act”). These forward-looking statements have been made pursuant to the provisions of the Private Securities Litigation Reform Act of 1995. These statements are not historical facts, but rather are based on our current expectations, estimates and projections, and our beliefs and assumptions. We intend words such as “anticipate,” “expect,” “intend,” “plan,” “believe,” “seek,” “estimate,” “will” and similar expressions to identify forward-looking statements. These statements are not guarantees of future performance and are subject to certain risks, uncertainties and other factors, some of which are beyond our control and are difficult to predict. These factors could cause actual results to differ materially from those expressed or forecasted in the forward-looking statements. These risks and uncertainties are described in the risk factors and elsewhere in this Annual Report on Form 10-K. We caution you not to place undue reliance on these forward-looking statements, which reflect our management’s view only as of the date of this Annual Report on Form 10-K. We are not obligated to update these statements or publicly release the result of any revisions to them to reflect events or circumstances after the date of this Annual Report on Form 10-K or to reflect the occurrence of unanticipated events.
As used in this Annual Report on Form 10-K, except where otherwise stated or indicated by the context, “Hawkins,” “we,” “us,” “the Company,” “our,” or “the Registrant” means Hawkins, Inc. References to “fiscal
2015” means our fiscal year ending March 29, 2015, “fiscal 2014” means our fiscal year ending March 30, 2014, “fiscal 2013” means our fiscal year
endingended March 31, 2013, “fiscal 2012” means our fiscal year
endingended April 1, 2012
and “fiscal 2011” means our fiscal year ended April 3,
2011, “fiscal 2010” means our fiscal year ended March 28, 2010, and “fiscal 2009” means our fiscal year ended March 29, 2009.2011.
Annual Report on Form 10-K
For the Fiscal Year Ended
April 1, 2012March 30, 2014 | | | |
| | |
| | | | | Page | |
PART I | | | | |
ITEM 1.
| | Business | | | 4 | Page |
PART I |
| ITEM 1. | | |
| ITEM 1A. | | | | | 6 | |
ITEM 1B. | | | | | 11 | |
ITEM 2. | | | | | 11 | |
ITEM 3. | | | | | 13 | |
ITEM 4. | | | | | 13 | |
| PART II | | | | |
ITEM 5. | | | | | 14 | |
ITEM 6. | | | | | 15 | |
ITEM 7. | | | | | 16 | |
ITEM 7A. | | | | | 23 | |
ITEM 8. | | | | | 24 | |
ITEM 9. | | | | | 47 | |
ITEM 9A. | | | | | 47 | |
ITEM 9B. | | | | | 48 | |
| PART III | | | | |
ITEM 10. | | | | | 49 | |
ITEM 11. | | | | | 50 | |
ITEM 12. | | | | | 50 | |
ITEM 13. | | | | | 50 | |
ITEM 14. | | | | | 50 | |
| PART IV | | | | |
ITEM 15. | | | | | 51 | |
PART I
Hawkins, Inc. distributes,
bulk chemicalsblends and
blends, manufactures
and distributes specialty chemicals for our customers in a wide variety of industries. We began our operations primarily as a distributor of bulk chemicals with a strong customer focus. Over the years, we have maintained
theour strong customer focus and have expanded our business by increasing our sales of value-added
specialty chemical products, including repackaging, blending,
manufacturing and
manufacturingdiluting certain
products. In recent years, we significantly expanded the sales of our higher-margin blended and manufactured products. We believe that we create value for our customers through superb service and support, quality products, personalized applications and
our trustworthy, creative employees.
We currently conduct our business in two segments: Industrial and Water Treatment. Financial information regarding these segments is reported in
our Financial Statements and Notes to Financial Statements. See Items 7 and 8 of this Annual Report on Form 10-K.
Industrial Segment. Our Industrial Group operates this segment of our business, which specializes in providing industrial chemicals, products and services primarily to theindustries such as agriculture, energy, electronics, food, chemical processing, pulp and paper, pharmaceutical, medical device and plating industries.plating. The group’s principal products are acids, alkalis and industrial and food-grade salts.
Receives, stores and distributes various chemicals in bulk quantities, including liquid caustic soda, sulfuric acid, hydrochloric acid, phosphoric acid, potassium hydroxide and aqua ammonia;
| • | | Manufactures sodium hypochlorite (bleach), agricultural products and certain food-grade products, including our patented Cheese-Phos® liquid phosphate, lactates and other blended products;
|
Manufactures sodium hypochlorite (bleach), agricultural products and certain food-grade products, including liquid phosphates, lactates and other blended products;
Repackages water treatment chemicals for our Water Treatment Group and bulk industrial chemicals to sell in smaller quantities to our customers;
Performs custom blending of certain chemicals for customers according to customer formulas; and
Performs contract and private label packaging for household chemicals.bleach packaging.
The group’s sales are concentrated primarily in Illinois, Iowa, Minnesota, Missouri, North Dakota, South Dakota, Tennessee and Wisconsin while the group’s food-grade products are sold nationally. The Industrial Group relies on a specially trained sales staff that works directly with customers on their specific needs. The group conducts its business primarily through distribution centers and terminal operations.
During the third quarter of fiscal 2012, we purchased a 28-acre parcel of land in Rosemount, Minnesota and began construction of a new facility on the site, which is expected to be operational in late fiscal 2013. The site provides capacity for future business growth and lessens our dependence on our flood-prone sites on the Mississippi River. While we expect to transfer some blending and manufacturing activity to the Rosemount site, we do not intend to close any sites we currently operate.
In the fourth quarter of fiscal 2011, we completed the acquisition of substantially all of the assets of Vertex Chemical Corporation (“Vertex”), a manufacturer of sodium hypochlorite in the central Midwest. In addition to the manufacture of sodium hypochlorite bleaches, Vertex distributes and provides terminal services for bulk liquid inorganic chemicals, and contract and private label packaging for household chemicals. Its corporate headquarters are located in St. Louis, Missouri, with manufacturing sites in Dupo, Illinois, Camanche, Iowa, and Memphis, Tennessee. In connection with the acquisition we paid the sellers $27.2 million and assumed certain liabilities of Vertex. Vertex’s business is part of our Industrial Group.
In fiscal 2010, we completed two new facilities to expand our ability to service our customers and facilitate growth within our Industrial Group. Our facility in Centralia, Illinois began operations in July 2009 and primarily serves our food-grade and agriculture products businesses. We also opened a facility in Minneapolis, Minnesota, to handle bulk chemicals sold to pharmaceutical manufacturers.
Water Treatment Segment. Our Water Treatment Group operates this segment of our business, which specializes in providing chemicals, equipment and solutions for potable water, municipal and industrial wastewater, industrial process water and non-residential swimming pool water. The group has the resources and flexibility to treat systems ranging in size from a single small single well to a multi-million gallon-per-day treatmentmulti-million-gallon-per-day facility.
The group utilizes delivery routes operated by our employees who serve as route driver, salesperson and
highly trained technician to deliver our products and diagnose our customers’ water treatment needs. We believe that the high level of service provided by these individuals allows us to serve as the trusted water treatment expert for many of the municipalities and other customers that we serve. We also believe that we are able to obtain a competitive cost position on many of the chemicals sold by the Water Treatment Group due to the volumes of these chemicals purchased by our Industrial Group.
The group operates out of warehouses in
1820 cities supplying products and services to customers
primarily in Arkansas, Illinois, Indiana, Iowa, Kansas, Michigan, Minnesota, Missouri, Montana, Nebraska, North Dakota, Oklahoma, South Dakota, Tennessee, Wisconsin and Wyoming. We opened one
new warehouse in each of
these warehouses in fiscal
2014, 2013 and 2012,
two in fiscal 2011, and expect to continue to invest in existing and new branches to expand the group’s geographic coverage. Our Water Treatment Group has historically experienced higher sales during April to September, primarily due to a seasonal increase in chemicals used by municipal water treatment facilities.
Discontinued Operations. In February 2009, we entered into two agreements whereby we agreed to sell our inventory and enter into a marketing relationship regarding the business of our Pharmaceutical segment, which provided pharmaceutical chemicals to retail pharmacies and small-scale pharmaceutical manufacturers. The transaction closed in May 2009 and we have no significant obligations to fulfill under the agreements. The results of the Pharmaceutical segment have been reported as discontinued operations in our consolidated financial statements for all periods presented in this Annual Report on Form 10-K.Raw Materials. We have numerous suppliers, including many of the major chemical producers in the United States. We typically have written distributorship agreements or supply contracts with our suppliers that are periodically renewed. We believe that most of the products we purchase can be obtained from alternative sources should existing relationships be terminated. We are dependent upon the availability of our raw materials. In the event that certain raw materials become generally unavailable, suppliers may
extend lead times or limit or cut off the supply of materials to us. As a result, we may not be able to supply or manufacture products for our customers. While we believe
that we have adequate sources of supply for our raw material and product requirements, we cannot be sure that supplies will be consistently available in the
future should shortages occur.future.
Intellectual Property. Our intellectual property portfolio is of economic importance to our business. When appropriate, we have pursued, and we will continue to pursue, patents covering our products. We also have obtained certain trademarks for our products to distinguish them from our competitors’ products. The patent for our Cheese-Phos® liquid phosphate product, which is manufactured by our Industrial group, is scheduled to expire in November 2013. We regard much of the formulae, information and processes that we generate and use in the conduct of our business as proprietary and protectable under applicable copyright, patent, trademark, trade secret and unfair competition laws.
Customer Concentration. No single In fiscal 2014, none of our customers accounted for 10.0% or more of our total sales. Sales to our largest customer represents more than 10%represented 6.9% of either our total sales or thein fiscal 2014, 7.4% of our total sales in fiscal 2013 and 7.2% of our total sales in fiscal 2012. Aggregate sales to our five largest customers, all of which are in our Industrial segment, represented 20.8% of our total sales in fiscal 2014, 21.8% of our total sales in fiscal 2013 and 24.8% of our total sales in fiscal 2012. No other customer represented more than 2.0% of our total sales in fiscal 2014. The loss of any of our segments, but the losslargest customers, or a substantial portion of our five largest customerstheir business, could have a material adverse effect on our results of operations. Total aggregate sales to our five largest customers were $55.6 million in fiscal 2010, $64.3 million in fiscal 2011 and $72.2 million in fiscal 2012.
Competition. We operate in a competitive industry and compete with many producers, distributors and sales agents offering chemicals equivalent to substantially all of the products we handle.offer. Many of our competitors are larger than we are and may have greater financial resources, although no one competitor is dominant in our industry. We compete by offering quality products at competitive prices coupled with outstanding customer service. Because of our long-standing relationships with many of our suppliers, we are often able to leverage those relationships to obtain products when supplies are scarce or to obtain competitive pricing.
Geographic Information. Substantially all of our revenues are generated in,by sales to customers within, and long-lived assets are located in, the United States.States, with only approximately 0.5% of our total revenues to customers outside of the U.S. in fiscal 2014.
Employees. We had 343361 employees as of April 1, 2012,March 30, 2014, including 4851 covered by a collective bargaining agreement.agreements.
About Us. Hawkins, Inc. was founded in 1938 and incorporated in Minnesota in 1955. We became a publicly-traded company in 1972. Our principal executive offices are located at 3100 East Hennepin Avenue, Minneapolis,2381 Rosegate, Roseville, Minnesota.
Available Information. We have made available, free of charge, through our Internet website (http://www.hawkinsinc.com), our Annual Reports on Form 10-K, Quarterly Reports on Form 10-Q, Current Reports on Form 8-K, and, if applicable, amendments to those reports, as soon as reasonably practicable after we electronically file these materials with, or furnish them to, the Securities and Exchange Commission. Reports of beneficial ownership filed by our directors and executive officers pursuant to Section 16(a) of the Exchange Act are also available on our website. We are not including the information contained on our website as part of, or incorporating it by reference into, this Annual Report on Form 10-K.
ITEM 1A. RISK FACTORS
| RISK FACTORS |
You should consider carefully the following risks when reading the information,including the financial information, contained in this Annual Report onForm 10-K.
We operate in a highly competitive environment and face significant competition andprice pressure.
We operate in a highly competitive industry and compete with producers, manufacturers, distributors and sales agents offering chemicals equivalent to substantially all of the products we offer. Competition is based on several key criteria, including product price, product performance, product quality, product availability and security of supply, breadth of product offerings, geographic reach, responsiveness of product development in cooperation with customers, technical expertise and customer service. Many of our competitors are larger than we are and may have greater financial resources, more product offerings and a greater geographic reach. As a result, these competitors may be able to offer a broader array of products to a larger geographic area and may be better able than us to withstand changes in conditions within our industry, changes in the prices and availability of raw materials, changes in general economic conditions and be able to introduce innovative products that reduce demand for or the profit of our products. Additionally, competitors’ pricing decisions could compel us to decrease our prices, which could adversely affect our margins and profitability. Our ability to maintain or increase our profitability is dependent upon our ability to offset competitive decreases in the prices and margins of our products by improving production efficiency, investing in infrastructure to reduce freight costs, identifying and selling higher margin chemical products, providing higher levels of technical expertise and customer service, and improving existing products through innovation and research and development. If we are unable to maintain our profitability or competitive position, we could lose market share to our competitors and experience reduced profitability.
Fluctuations in the prices and availability of commodity chemicals,our chemical raw materials, which are may becyclical in nature, could have a material adverse effect on our operations and themargins we receive on sales of our products.Periodically, we
We experience
significantregular and
rapidrecurring fluctuations in the
commodity pricing of
our raw materials.
Those fluctuations can be significant and occur rapidly. The cyclicality of commodity chemical markets, such as caustic soda, primarily results from changes in the balance between supply and demand and the level of general economic activity. We cannot predict whether the markets for our
commodity chemicalschemical raw materials will favorably impact
our operations or
whethernegatively impact the margins we
will experience a negative impact due to oversupply and lower prices.can realize.
Our principal raw materials are generally purchased under supply contracts. The prices we pay under these contracts generally lag the market prices of the underlying raw material and the cost of inventory we have on hand generally will lag the current market pricing of such inventory. The pricing within our supply contracts generally adjusts quarterly or monthly. While we attempt to maintain competitive pricing and stable margin dollars, the
variabilitypotential variance in our cost of inventory from the current market pricing can cause significant volatility in our margins realized. In periods of rapidly increasing market prices,
theour inventory cost position will tend to be favorable,
to us, possibly by material amounts, which may positively impact our margins. Conversely, in periods of rapidly decreasing market prices,
theour inventory cost position will tend to be unfavorable,
to us, possibly by material amounts, which may negatively impact our margins. We do not engage in futures or other derivatives contracts to hedge against fluctuations in future prices. We may enter into sales contracts where the selling prices for our products are fixed for a period of time, exposing us to volatility in raw materials prices that we acquire on a spot market or short-term contractual basis. We attempt to pass commodity pricing changes to our customers, but we may be unable to or be delayed in doing so. Our inability to pass through price increases or any limitation or delay in our passing through price increases could adversely affect our profit margins.
We are also dependent upon the availability of our raw materials. In the event that raw materials are in short supply or unavailable, raw material suppliers may extend lead times or limit or cut off supplies. As a result, we may not be able to supply or manufacture products for some or all of our customers.
For example, in calendar 2008 a miners’ strike in Canada significantly limited supplies of potassium chloride, a key component of some of our products. Due to the resulting shortage, many chemical companies were unable to supply their customers. While we were able to obtain a supply of the product sufficient to meet our customers’ needs, we cannot be certain that such supplies would be available in the future should other similar shortages occur. Constraints on the supply or delivery of critical raw materials could disrupt our operations and adversely affect the performance of our business.
We operate in a highly competitive environment and face significant competition and price pressure.We operate in a highly competitive industry and compete with producers, manufacturers, distributors and sales agents offering chemicals equivalent to substantially all of the products we handle. Competition is based on several key criteria, including product price, product performance and quality, product availability and security of supply, responsiveness of product development in cooperation with customers, and customer service. Many of our competitors are larger than we are and may have greater financial resources. As a result, these competitors may be better able than us to withstand changes in conditions within our industry, changes in the prices and availability of raw materials, changes in general economic conditions and be able to introduce innovative products that reduce demand for or the profit of our products. Additionally, competitors’ pricing decisions could compel us to decrease our prices, which could adversely affect our margins and profitability. Our ability to maintain or increase our profitability is dependent upon our ability to offset competitive decreases in the prices and margins of our products by improving production efficiency and volume, identifying higher margin chemical products and improving existing products through innovation and research and development. If we are unable to maintain our profitability or competitive position, we could lose market share to our competitors and experience reduced profitability.
Demand for our products is affected by general economic conditions and by thecyclical nature of many of the industries we serve, which could cause significantfluctuations in our sales volumes and results.
Demand for our products is affected by general economic conditions. A decline in general economic or business conditions in the industries served by our customers could have a material adverse effect on our business. Although we sell to areas traditionally considered non-cyclical, such as water treatment and food products, many of our customers are in businesses that are cyclical in nature, such as the industrial manufacturing, surface finishing and energy industries which include the ethanol and agriculture industries. Downturns in these industries could adversely affect our sales and our financial results by affecting demand for and pricing of our products.
Changes in our customers’ productsneeds or failure of our products to meet customers’ quality specifications could adversely affect our sales and profitability.
Our chemicals are used for a broad range of applications by our customers. Changes in our customers’
productsproduct needs or processes may enable our customers to reduce or eliminate consumption of the chemicals that we provide. Customers may also find alternative materials or processes that no longer require our products. Consequently, it is important that we develop new products to replace the sales of products that mature and decline in use.
Our products provide important performance attributes to our customers’ products. If our products fail to
meet the customers’ specifications, perform in a manner consistent with quality specifications or have a shorter useful life than
guaranteed,required, a customer could seek replacement of the product or damages for costs incurred as a result of the product
failing to perform as expected.failure. A successful claim or series of claims against us could have a material adverse effect on our financial condition and results of operations and could result in a loss of one or more customers.
Our business is subject to hazards common to chemical businesses, any of which couldinterrupt our production and adversely affect our results of operations.
Our business is subject to hazards common to chemical manufacturing, storage, handling and transportation, including explosions, fires, severe weather, natural disasters, mechanical failure, unscheduled downtime, transportation interruptions,
traffic accidents involving our delivery vehicles, chemical spills, discharges or releases of toxic or hazardous substances or gases and other risks. These hazards could cause personal injury and loss of life, severe damage to or destruction of property and equipment, and environmental contamination. In addition, the occurrence of material operating problems at
any of our facilities due to any of these hazards may
diminishmake it impossible for us to make sales to our
ability to meet our output goalscustomers and
may result in a negative public or political reaction. Many of our facilities are
bordered bynear significant residential populations which
increaseincreases the risk of negative public or political reaction should an environmental issue occur and could lead to adverse zoning
or other regulatory actions that could limit our ability to operate our business in those locations. Accordingly, these hazards and their consequences could have a material adverse effect on our operations as a whole, including our results of operations and cash flows, both during and after the period of operational difficulties.
We are highly dependent upon transportation infrastructure to ship and receive our products and delays in these shipments could adversely affect our results of operations.
Although we maintain a number of owned trucks and trailers, we rely heavily upon transportation provided by third parties (including common carriers, barge companies and rail companies) to deliver products to us and to our customers. Our access to third-party transportation is not guaranteed, and we may be unable to transport our products in a timely manner, or at all, in certain circumstances, or at economically attractive rates. Disruptions in transportation are increasingly common, are often out of our control, and can happen suddenly and without warning. Rail limitations, such as limitations in rail capacity, availability of railcars and adverse weather conditions have disrupted or delayed rail shipments in the past and we expect they will continue into the future. Barge shipments are delayed or impossible under certain circumstances, including during times of high or low water levels and when waterways are frozen. Truck transportation has been negatively impacted by a number of factors, including limited availability of qualified drivers and equipment, and limitations on drivers’ hours of service, and we expect these conditions will continue into the future. Our failure to ship or receive products in a timely and efficient manner could have a material adverse effect on our financial condition and results of operations.
Environmental, health and safety, transportation and storage laws and regulations cause us to incur substantialcosts and may subject us to future liabilities.liabilities and risks.
We are subject to numerous federal, state and local environmental, health and safety laws and regulations in the jurisdictions in which we operate, including those governing the discharge of pollutants into the air and water, and the management,
storage and disposal of hazardous substances and wastes. The nature of our business exposes us to risks of liability under these laws and regulations due to the production, storage, use, transportation and sale of materials that can cause contamination or personal injury if released into the environment. Ongoing compliance with such laws and regulations is an important consideration for us and we invest substantial capital and incur significant operating costs in our compliance efforts. Governmental regulation has become increasingly strict in recent years. We expect this trend to continue and anticipate that compliance will continue to require increased capital expenditures and operating costs.
In addition, we operate a fleet of more than 100 vehicles, primarily in our Water Treatment Group, which are highly regulated, including by the U.S. Department of Transportation (“DOT”). The DOT governs transportation matters including authorization to engage in motor carrier service, including the necessary permits to conduct our business, equipment operation, and safety. We
are audited periodically by the DOT to ensure that we are in compliance with various safety, hours-of-service, and other rules and regulations. If we were found to be out of compliance, the DOT could severely restrict or otherwise impact our operations, which could have a material adverse effect on our operations as a whole, including our results of operations and cash flows.
If we violate environmental, health and safety,
transportation or storage laws or regulations, in addition to being required to correct such violations, we could be held liable in administrative, civil or criminal proceedings for substantial fines and other sanctions that could disrupt,
limit or
limithalt our
operations.operations, which could have a material adverse effect on our operations as a whole, including our results of operations and cash flows. Liabilities associated with the investigation and cleanup
of releases of hazardous substances, as well as personal injury, property damages or natural resource damages arising out of such
releases of hazardous substances, may be imposed in many situations without regard to violations of laws or regulations or other fault, and may also be imposed jointly and severally (so that a responsible party may be held liable for more than its share of the losses involved, or even the entire loss). Such liabilities can be difficult to identify and the extent of any such liabilities can be difficult to predict. We use, and in the past have used, hazardous substances at many of our facilities, and have generated, and continue to generate, hazardous wastes at a number of our facilities. We have in the past
been, and may in the future be, subject to claims relating to exposure to hazardous materials and the associated liabilities may be material.
Costs related to a multi-employer pension plan, which has liabilities in excess of plan assets, may have a material adverse effect on our financial condition and results of operations.We participate in the Central States Southeast and Southwest Areas Pension Fund (“CSS” or “the Fund” or “the plan”), a multi-employer pension plan. Our participation is pursuant to two collective bargaining agreements that expire in February 2013 (the “CBAs”). Our obligation to continue to participate in the plan does not automatically expire upon expiration of the CBAs.
CSS’s actuarial certification for the plan year beginning January 1, 2008 placed the Fund in “critical status,” a legal term that essentially means that the Fund’s assets were less than 65% of its liabilities. As a result, the plan adopted a rehabilitation plan. CSS’s 2011 Annual Funding Notice stated that, as of January 1, 2011, the Fund remained in critical status with a funded percentage of 58.9%, which was down from a funded percentage of
63.4% as of January 1, 2010. This decrease in the plan’s funded percentage was despite having adopted an “updated rehabilitation plan” that implemented additional measures to improve the funded level, including requiring higher employer contributions, establishing an increased minimum retirement age, and actuarially adjusting certain pre-age-65 benefits for participants who retire after July 1, 2011. We can make no assurances of whether or to what extent the updated rehabilitation plan will improve the funded status of the plan.
We continue to contribute cash to the Fund, as required by the CBAs. We record the required cash contributions to the Fund as an expense in the period incurred and recognize a liability for any contributions due and unpaid, consistent with the accounting rules for multi-employer defined benefit plans. In addition, we are responsible for our proportional share of any unfunded vested benefits related to the Fund as a whole. However, under applicable accounting rules, we do not record a liability for our portion of any unfunded vested benefit liability until withdrawal liability has been triggered by a partial or full withdrawal from the plan.
A partial or full withdrawal from the plan may be triggered by circumstances beyond our control, such as union members voting to decertify their union. Our withdrawal from the plan as the result of collective bargaining negotiations with the unions would also trigger withdrawal liability. If a withdrawal from the plan occurs, we will record our proportional share of any unfunded vested benefit liability in the period in which the withdrawal occurs. The ultimate amount of the withdrawal liability assessed by the plan is impacted by a number of factors, including but not limited to the plan’s investment returns and benefit levels, interest rates, financial difficulty of other participating employers in the plan such as bankruptcy, and the continued participation by our company and other employers in the plan.
Based upon the most recent information available from the trustees managing CSS, our share of the unfunded vested benefit liability for the plan was estimated to be approximately $7.9 million if the withdrawal had occurred in calendar year 2011, an increase from an estimate of approximately $5.1 million if the withdrawal had occurred in calendar year 2009. These estimates were calculated by the trustees managing CSS. Although we believe the most recent plan data available from CSS was used in computing this 2011 estimate, the actual withdrawal liability amount is subject to change based on, among other things, the plan’s investment returns and benefit levels, interest rates, financial difficulty of other participating employers in the plan such as bankruptcy, and continued participation by the company and other employers in the plan, each of which could impact the ultimate withdrawal liability. If withdrawal liability were to be triggered, we would have the option to make payments over a period of 20 years instead of paying the withdrawal liability in a lump sum.
If the collective bargaining process results in our withdrawal from the Fund, the withdrawal would likely take effect in the fourth quarter of fiscal 2013. We are currently unable to predict the ultimate outcome of those negotiations. However, if we are able to successfully withdraw from the plan, we anticipate it would trigger withdrawal liability in an amount that would have a material impact on our financial results.
A number of our employees are unionized, and our business and results of operations could be adversely affected if labor negotiations or contracts further restrict our ability to maximize the efficiency of our operations.
A significant portion of our production employees in the Twin Cities are unionized under two separate collective bargaining agreements that have expiration dates in February 2013. As a result, we are required to collectively bargain the wages, salaries, benefits, staffing levels and other terms with the bargaining representatives of those employees. Our results could be materially adversely affected if those labor negotiations further restrict our ability to maximize the efficiency of our operations, if we experience labor unrest (including but not limited to strikes, lockouts, slowdowns or other business interruptions or interferences) in connection with labor negotiations, or if we are unable to negotiate new collective bargaining agreements on reasonable terms acceptable to the affected parties.
Our business, particularly that of our Water Treatment Group and our agricultural product sales, is subject to seasonality andweather conditions, which could adversely affect our results of operations.
Our Water Treatment Group has historically experienced higher sales during April to September, primarily due to a seasonal increase in chemicals used by municipal water treatment facilities.
Our agricultural product sales are also seasonal, primarily corresponding with the planting and harvesting seasons. Demand
in both of these areas is also affected by weather conditions, as either higher or lower than normal precipitation or temperatures may affect water usage and the
timing and the amount of consumption of our products. We cannot assure you that seasonality or fluctuating weather conditions will not have a material adverse effect on our results of
operations and financial condition.operations.
The insurance that we maintain may not fully cover all potential exposures.
We maintain property, business interruption and casualty insurance, but such insurance may not cover all risks associated with the hazards of our business and is subject to limitations, including deductibles and limits on the liabilities covered. We may incur losses beyond the limits or outside the coverage of our insurance policies, including liabilities for environmental remediation. In addition, from time to time, various types of insurance for companies in the
specialty chemical industry have not been available on commercially acceptable terms or, in some cases, have not been available at all. In the future, we may not be able to obtain coverage at current levels, and our premiums may increase significantly on coverage that we maintain.
If we are unable to retain key personnel or attract new skilled personnel, it couldhave an adverse impact on our business.
Because of the specialized and technical nature of our business, our future performance is dependent on the continued service of, and on our ability to attract and retain, qualified management, scientific, technical and support personnel. The unanticipated departure of key members of our management team could have an adverse impact on our business.
We may not be able to successfully consummate future acquisitions or integrateacquisitions into our business, which could result in unanticipated expenses andlosses.
As part of our business growth strategy, we have acquired businesses and may pursue acquisitions in the future. Our ability to pursue this strategy will be limited by our ability to identify appropriate acquisition candidates and our financial resources, including available cash and borrowing capacity. The expense incurred in consummating acquisitions, the time it takes to integrate an acquisition or our failure to integrate businesses successfully could result in unanticipated expenses and losses. Furthermore, we may not be able to realize the anticipated benefits from acquisitions.
The process of integrating acquired operations into our existing operations may result in unforeseen operating difficulties and may require significant financial resources that would otherwise be available for the ongoing development or expansion of existing operations. The risks associated with the integration of acquisitions include potential disruption of our ongoing business and distraction of management, unforeseen claims, liabilities, adjustments, charges and write-offs, difficulty in conforming the acquired business’ standards, processes, procedures and controls with our operations, and challenges arising from the increased scope, geographic diversity and complexity of the expanded operations.
Our business is subject to risks stemming from natural disasters or otherextraordinary events outside of our control, which could interrupt our production andadversely affect our results of operations.
Natural disasters have the potential of interrupting our operations and damaging our properties, which could adversely affect our business. Since 1963, flooding of the Mississippi River has required the Company’s terminal operations to be temporarily shifted out of its buildings seven times, including three times since the spring of 2010. We can give no assurance that flooding or other natural disasters will not recur or that there will not be material damage or interruption to our operations in the future from such disasters.
Chemical-related assets may be at greater risk of future terrorist attacks than other possible targets in the United States. Federal law imposes
new site security requirements, specifically on chemical facilities, which
requirehave increased
capital spending and increase our overhead expenses.
New federalFederal regulations have
alreadyalso been adopted to increase the security of the transportation of hazardous chemicals in the United States. We ship and receive materials that are classified as hazardous and we believe we have met these requirements, but additional federal and local regulations that limit the distribution of hazardous materials are being considered. Bans on movement of hazardous materials through certain cities could adversely affect the efficiency of our logistical operations. Broader restrictions on hazardous material movements could lead to additional investment and could change where and what products we provide.
The occurrence of extraordinary events, including future terrorist attacks and the outbreak or escalation of hostilities, cannot be predicted, but their occurrence can be expected to negatively affect the economy in general, and specifically the markets for our products. The resulting damage from a direct attack on our assets, or assets used by us, could include loss of life and property damage. In addition, available insurance coverage may not be sufficient to cover all of the damage incurred or, if available, may be prohibitively expensive.
We may not be able to renew our leases of land where four of our operationsfacilities reside.
We lease the land where our three main terminals are located and where
aanother significant manufacturing plant is located. We do not have guaranteed lease renewal options and may not be able to renew our leases in the future. Our current lease renewal periods extend out to
2014 (one lease), 2018 (two leases)
, 2023 (one lease) and 2029 (one lease). The failure to secure extended lease terms on any one of these facilities may have a material adverse impact on our business, as they are where a significant portion of our chemicals are manufactured and where the majority of our bulk chemicals are stored. While we can make no assurances, based on historical experience and anticipated future needs, we intend to extend these leases and believe that we will be able to renew our leases as the renewal periods expire. If we are unable to renew three of our leases (two relate to terminals and one to manufacturing) any property remaining on the land becomes the property of the lessor, and the lessor has the option to either maintain the property or remove the property at our expense. These asset retirement obligations and the cost to relocate our operations could have a material adverse effect on our results of operations and financial condition.
ITEM 1B. | UNRESOLVED STAFF COMMENTS |
ITEM 1B. UNRESOLVED STAFF COMMENTS
ITEM 2. PROPERTIES
Our corporate office is located in Roseville, Minnesota, where we lease approximately 40,000 square feet under a lease with an initial term through December 31, 2021. We own our principal
manufacturing, warehousing, and distribution location
in Minneapolis, Minnesota, which consists of approximately 11 acres of land,
in Minneapolis, Minnesota, with six buildings containing a total of 177,000 square feet of office and warehouse space primarily used by our Industrial Group.
Our principal office is located in one of these buildings, at 3100 East Hennepin Avenue. We have installed sprinkler systems in substantially all of our warehouse facilities for fire protection. We
believe that we carry customary levels of insurance covering the replacement of damaged property.
In addition to the facilities described previously, our other facilities are described below. We believe that these facilities, together with those described above, are adequate and suitable for the purposes they serve. Unless noted, each facility is owned by us and is primarily used as office and warehouse.
| |
| | | | |
Group
| | Location | | Approx.
Square Feet | |
Industrial
| Group | Location | | Approx. Square Feet |
| Industrial | St. Paul, MN(1) | | | 32,000 | |
| | Minneapolis, MN(2) | | | 29,000 | 9,000 |
| | Centralia, IL(3) | | | 77,000 | |
| | Camanche, IA(4) | IA | | 95,000 | |
| | St Louis, MO(4) | MO | | 6,000 | |
| | Dupo, IL(4) | | | 64,000 | |
| | Rosemount, MN(5) | | | 63,000 | |
| Water Treatment | | Fargo, ND | | | 20,000 | |
| | Fond du Lac, WI | | | 24,000 | |
| | Washburn, ND | | | 14,000 | |
| | Billings, MT | | | 9,000 | |
| | Sioux Falls, SD | | | 27,000 | |
| | Rapid City, SD | | | 9,000 | |
| | Peotone, IL(6) | | | 18,000 | |
| | Superior, WI | | | 17,000 | |
| | Slater, IA | | | 12,000 | |
| | Lincoln, NE(6) | | | 16,000 | |
| | Eldridge, IA | | | 6,000 | |
| | Columbia, MO(6) | | | 14,000 | |
| | Garnett, KS | | | 18,000 | |
| | Ft. Smith, AR(6) | | | 17,000 | |
| | Muncie, IN(7)IN | | 12,000 |
| | | 12,000 | |
| Centralia, IL | | Centralia, IL(7)39,000 |
| | | 39,000Havana, IL | | 16,000 |
| | Tulsa, OK | | 7,300 |
| Industrial and Water Treatment | | St. Paul, MN(8)MN(7) | | 59,000 |
| | | 59,000 | |
| | Memphis, TN(4) | TN | | 41,000 |
| (1) | Our terminal operations, located at two sites on opposite sides of the Mississippi River, are made up of three buildings, outside storage tanks for the storage of liquid bulk chemicals, including caustic soda, as well as numerous smaller tanks for storing and mixing chemicals. The land is leased from the Port Authority of the City of St. Paul, Minnesota. The applicable leases run until December 2013, at which time we have an option to renew the leases for an additional five-year period on the same terms and conditions subject to renegotiation of rent.2018. |
| |
| (2) | This facility is leased from a third party to serve our bulk pharmaceutical customers.and is warehouse space. |
| |
| (3) | This facility includes 10 acres of land located in Centralia, Illinois owned by the company. The facility became operational in July 2009includes manufacturing capacity and primarily serves our food-grade products business. Prior to fiscal 2011 this facility was shared with the Water Treatment Group. |
| |
| (4) | The acquisition of Vertex in fiscal 2011 included an office building located in St Louis, Missouri andland for this manufacturing and warehouse facilities located in Memphis, Tennessee; Camanche, Iowa; and Dupo, Illinois. All of the facilities and land are owned by the company with the exception of the land in Dupo, Illinois, whichpackaging facility is leased from a third party. Theparty, with the lease runs throughexpiring in May 2014. The2023. |
| |
| (5) | This facility in Memphis is shared betweenincludes 28 acres of land owned by the Industrialcompany. This manufacturing facility was constructed by us and Water Treatment Groups.has outside storage tanks for the storage of bulk chemicals, as well as numerous smaller tanks for storing and mixing chemicals. |
(5) | In October 2011 we acquired a 28-acre parcel of land located in Rosemount, MN. We began construction of a new facility on the site during the third quarter of fiscal 2012 and expect it to be operational in late fiscal 2013. |
| (6) | This facility is leased from a third party. |
(7) | This facility was purchased in fiscal 2011. |
(8)(7) | Our Red Rock facility, which consists of a 59,000 square-foot building located on approximately 10 acres of land, has outside storage capacity for liquid bulk chemicals, as well as numerous smaller tanks for storing and mixing chemicals. The land is leased from the Port Authority of the City of St. Paul, Minnesota and the lease runs until 2029. |
On November 3, 2009, ICL Performance Products, LP (“ICL”), a chemical supplier to us, filed a lawsuit in the United States District Court for the Eastern District of Missouri, asserting breach of a contract for the sale of 75% purified phosphoric acid in 2009 (the “2009 Contract”). ICL seeks to recover $7.3 million in damages and pre-judgment interest, and additionally seeks to recover its costs and attorneys’ fees. ICL also claimed that we breached a contract for the sale of 75% purified phosphoric acid in 2008 (the “2008 Contract”). ICL has since dropped its claim for breach of the 2008 Contract. We have counterclaimed against ICL alleging that ICL falsely claimed to have a shortage of raw materials that prevented it from supplying us with the contracted quantity of 75% purified phosphoric acid for 2008. We claim that ICL used this alleged shortage and the threat of discontinued shipments of 75% purified phosphoric acid to force us to pay increased prices for the remainder of 2008, and to sign the 2009 Contract. Based on this alleged conduct, we have brought four alternate causes of action including: (1) breach of contract, (2) breach of the implied covenant of good faith and fair dealing, (3) negligent misrepresentation, and (4) intentional misrepresentation. We seek to recover $1.5 million in damages, and additionally seek to recover punitive damages, pre- and post-judgment interest, and our costs and attorneys’ fees. After the completion of discovery, both parties moved for summary judgment in their favor. On February 7, 2012, the Court denied both parties’ motions for summary judgment. ICL moved for reconsideration of parts of its motion for summary judgment. On April 24, 2012, the Court granted ICL’s motion for reconsideration in part, and denied it in part. In its April 24, 2012 Memorandum and Order, the Court interpreted the meaning and effect of a specific phrase in the 2009 Contract, and concluded that, if the 2009 Contract is a legally enforceable contract, Hawkins remained obligated to purchase 50% of its requirements for 75% purified phosphoric acid from ICL in 2009. Trial is scheduled to begin on July 23, 2012. We
ITEM 3. LEGAL PROCEEDINGS
There are
not able to predict the ultimate outcome of this litigation, butno material pending legal proceedings,
such as this can result in substantial costs and divertother than ordinary routine litigation incidental to the business, to which we or any of our
management’s attention and resources, which may have a material adverse effect on our business and results of operations, including cash flows.Wesubsidiaries are a party from time to time in other legal proceedings arising in the ordinary courseor of which any of our business. To date, none ofproperty is the litigation has had a material effect on us.
ITEM 4. | MINE SAFETY DISCLOSURES |
subject.
ITEM 4. MINE SAFETY DISCLOSURES
PART II
ITEM 5. ITEM 5. | MARKET FOR THE COMPANY’S COMMON EQUITY, RELATED SHAREHOLDER MATTERS, AND ISSUER PURCHASES OF EQUITY SECURITIES |
| | | | | | | | |
Quarterly Stock Data | | High | | | Low | |
Fiscal 2012 | | | | | | | | |
4th Quarter | | $ | 42.93 | | | $ | 34.36 | |
3rd Quarter | | | 40.89 | | | | 29.05 | |
2nd Quarter | | | 38.66 | | | | 30.14 | |
1st Quarter | | | 47.48 | | | | 33.30 | |
Fiscal 2011 | | | | | | | | |
4th Quarter | | $ | 46.86 | | | $ | 36.00 | |
3rd Quarter | | | 50.18 | | | | 34.03 | |
2nd Quarter | | | 37.45 | | | | 24.21 | |
1st Quarter | | | 29.50 | | | | 23.14 | |
| | | | | | | | |
Cash Dividends | | Declared | | | Paid | |
Fiscal 2013 | | | | | | | | |
1st Quarter | | | | | | $ | 0.32 | |
Fiscal 2012 | | | | | | | | |
4th Quarter | | $ | 0.32 | | | | | |
3rd Quarter | | | | | | $ | 0.32 | |
2nd Quarter | | $ | 0.32 | | | | | |
1st Quarter | | | | | | $ | 0.30 | |
Fiscal 2011 | | | | | | | | |
4th Quarter | | $ | 0.30 | | | | | |
3rd Quarter | | | | | | $ | 0.40 | |
2nd Quarter | | $ | 0.40 | | | | | |
1st Quarter | | | | | | $ | 0.28 | |
MARKET FOR THE COMPANY’S COMMON EQUITY, RELATED SHAREHOLDER MATTERS, AND ISSUER PURCHASES OF EQUITY SECURITIES
|
| | | | | | | | | |
| | Quarterly Stock Data | | High | | Low |
| | Fiscal 2014 | | | | |
| | 4th Quarter | | $ | 37.29 |
| | $ | 33.25 |
|
| | 3rd Quarter | | 38.21 |
| | 35.29 |
|
| | 2nd Quarter | | 44.00 |
| | 36.50 |
|
| | 1st Quarter | | 41.00 |
| | 35.92 |
|
| | Fiscal 2013 | | | | |
| | 4th Quarter | | $ | 40.96 |
| | $ | 37.25 |
|
| | 3rd Quarter | | 42.04 |
| | 36.18 |
|
| | 2nd Quarter | | 42.29 |
| | 35.77 |
|
| | 1st Quarter | | 38.53 |
| | 31.06 |
|
|
| | | | | | | | | |
| | Cash Dividends | | Declared | | Paid |
| | Fiscal 2015 | | | | |
| | 1st Quarter | | — |
| | $ | 0.36 |
|
| | Fiscal 2014 | | | | |
| | 4th Quarter | | $ | 0.36 |
| | — |
|
| | 3rd Quarter | | — |
| | $ | 0.36 |
|
| | 2nd Quarter | | $ | 0.36 |
| | — |
|
| | 1st Quarter | | — |
| | $ | 0.34 |
|
| | Fiscal 2013 | | | | |
| | 4th Quarter | | $ | 0.34 |
| | — |
|
| | 3rd Quarter | | — |
| | $ | 0.34 |
|
| | 2nd Quarter | | $ | 0.34 |
| | — |
|
| | 1st Quarter | | — |
| | $ | 0.32 |
|
Our common shares are traded on The NASDAQ Global Market under the symbol “HWKN.” The price information represents closing sale prices as reported by The NASDAQ Global Market. As of
April 1, 2012,May 23, 2014, shares of our common stock were held by approximately
501476 shareholders of record.
We first started paying cash dividends in 1985 and have continued to do so since.
In July 2010, in recognition of the Company’s strong financial performance in fiscal 2010, its strong cash position and no debt, the Board of Directors authorized a special dividend of $0.10 per share in addition to a regular semi-annual cash dividend of $0.30 per share for July 2010. Future dividend levels will be dependent upon our consolidated results of operations, financial position, cash flows and other factors, and
will be evaluatedare subject to approval by our Board of Directors.
We did not sell or repurchase any shares of our common stock during the fourth quarter of fiscal 2014.
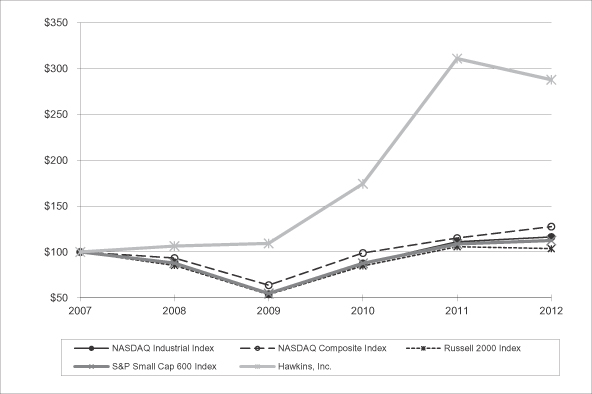
The following graph compares the cumulative total shareholder return on our common shares with the cumulative total returns of the NASDAQ Industrial Index, the NASDAQ Composite Index, the Russell 2000 Index and the Standard & Poor’s (“S&P”) Small Cap 600 Index for our last five completed fiscal years. The graph assumes the investment of $100 in our stock, the NASDAQ Industrial Index, the NASDAQ Composite Index, the Russell 2000 Index and the S&P Small Cap 600 Index on March 30,
2007,2009, and reinvestment of all dividends.
ITEM 6. | SELECTED FINANCIAL DATA |
ITEM 6. SELECTED FINANCIAL DATA
Selected financial data for the
CompanyCompany’s continuing operations is presented in the table below and should be read in conjunction with Management’s Discussion and Analysis of Financial Condition and Results of Operations included in Item 7 and the Company’s consolidated financial statements and notes thereto included in Item 8 herein.
| | | | | | | | | | | | | | | | | | | | |
| | | Fiscal Years | |
| | | 2012 | | | 2011 | | | 2010 | | | 2009 | | | 2008 | |
| | | (In thousands, except per share data) | |
Sales from continuing operations | | $ | 343,834 | | | $ | 297,641 | | | $ | 257,099 | | | $ | 284,356 | | | $ | 186,664 | |
Gross profit from continuing operations | | | 65,868 | | | | 61,902 | | | | 64,445 | | | | 62,420 | | | | 38,528 | |
Income from continuing operations | | | 21,628 | | | | 20,314 | | | | 23,738 | | | | 23,424 | | | | 8,488 | |
Basic earnings per common share from continuing operations | | | 2.09 | | | | 1.98 | | | | 2.32 | | | | 2.29 | | | | 0.83 | |
Diluted earnings per common share from continuing operations | | | 2.08 | | | | 1.96 | | | | 2.31 | | | | 2.29 | | | | 0.83 | |
Cash dividends declared per common share | | | 0.64 | | | | 0.70 | | | | 0.66 | | | | 0.52 | | | | 0.48 | |
Cash dividends paid per common share | | | 0.62 | | | | 0.68 | | | | 0.64 | | | | 0.50 | | | | 0.46 | |
Total assets | | $ | 204,081 | | | $ | 185,005 | | | $ | 160,293 | | | $ | 136,290 | | | $ | 108,943 | |
ITEM 7. | MANAGEMENT’S DISCUSSION AND ANALYSIS OF FINANCIAL CONDITION AND RESULTS OF OPERATIONS |
Total assets shown below are for the Company’s total operations.
|
| | | | | | | | | | | | | | | | | | | | | |
| | | Fiscal Years |
| | | 2014 | | 2013 | | 2012 | | 2011 | | 2010 | |
| | | (In thousands, except per share data) |
| Sales | | $ | 348,263 |
| | $ | 350,387 |
| | $ | 343,834 |
| | $ | 297,641 |
| | $ | 257,099 |
| |
| Gross profit | | 61,600 |
| | 56,936 |
| | 65,868 |
| | 61,902 |
| | 64,445 |
| |
| Income from continuing operations | | 18,094 |
| | 17,108 |
| | 21,628 |
| | 20,314 |
| | 23,738 |
| |
| Basic earnings per common share | | 1.72 |
| | 1.64 |
| | 2.09 |
| | 1.98 |
| | 2.32 |
| |
| Diluted earnings per common share | | 1.71 |
| | 1.62 |
| | 2.08 |
| | 1.96 |
| | 2.31 |
| |
| Cash dividends declared per common share | | 0.72 |
| | 0.68 |
| | 0.64 |
| | 0.70 |
| | 0.66 |
| |
| Cash dividends paid per common share | | 0.70 |
| | 0.66 |
| | 0.62 |
| | 0.68 |
| | 0.64 |
| |
| Total assets | | $ | 237,193 |
| | $ | 222,148 |
| | $ | 204,081 |
| | $ | 185,005 |
| | $ | 160,293 |
| |
We acquired substantially all the assets of Vertex Chemical Corporation (“Vertex”) in late fiscal 2011. The results of its operations since the acquisition date are included in our consolidated results of operations.
ITEM 7. MANAGEMENT’S DISCUSSION AND ANALYSIS OF FINANCIAL CONDITION AND RESULTS OF
OPERATIONS
The following is a discussion and analysis of our financial condition and results of operations for fiscal
2012, 20112014, 2013 and
2010.2012. This discussion should be read in conjunction with the Financial Statements and Notes to Financial Statements included in Item 8 of this Annual Report on Form 10-K.
We derive substantially all of our revenues from the sale of
bulk and specialty chemicals to our customers in a wide variety of industries. We began our operations primarily as a distributor of bulk chemicals with a strong customer focus. Over the years, we have maintained the strong customer focus and have expanded our business by increasing our sales of value-added
specialty chemical products, including repackaging, blending,
manufacturing and
manufacturingdiluting certain products.
In recent years, we significantly expanded the sales of our higher-margin blended and manufactured products, including our food-grade products.
We have continued to invest in
growing ourinfrastructure to support increased business. During fiscal
2012,2013, we
purchased a 28-acre parcel of land in Rosemount, Minnesota and begancompleted construction of a new
Industrial manufacturing facility
on the site, which is expected to be operational in
late fiscal 2013.Rosemount, Minnesota. The site provides capacity for future business growth and lessens our dependence on our flood-prone sites on the Mississippi River.
While we expectWe incurred incremental costs to
transfer some blending and manufacturing activityoperate this new facility during fiscal 2014 as compared to
the Rosemount site, we do not intend to close any sites we currently operate.fiscal 2013 of approximately $1.7 million, which have been recorded in cost of sales in our Industrial segment.
In the fourthfirst quarter of fiscal 2011,2014, we completedmoved into a new corporate headquarters located in Roseville, Minnesota. The move was necessary because we had outgrown our former corporate headquarters that had been our home for over 60 years. As a result of this move, we incurred incremental costs during fiscal 2014 as compared to fiscal 2013 of approximately $1.0 million, recorded in selling, general and administrative expenses and allocated among both our Water Treatment and Industrial segments.
In fiscal 2014, we vacated the acquisitionleased facility used to serve our bulk pharmaceutical customers and transferred production of certain products to our other Industrial production facilities while discontinuing production of the remaining product lines. As a result, we recorded incremental costs in our Industrial segment during fiscal 2014 as compared to fiscal 2013 of approximately $0.4 million related to accelerated depreciation on leasehold improvements and manufacturing equipment related to this facility.
In the third quarter of fiscal 2014, we acquired substantially all
of the assets of
Vertex,Advance Chemical Solutions, Inc. (“ACS”), under the terms of an asset purchase agreement with ACS and its shareholders. We paid $2.4 million in cash, and may be obligated to pay an aggregate of $0.5 million in additional consideration to ACS over the next three years depending upon the achievement of certain financial performance targets. ACS had revenues of approximately $4.0 million for
approximately $27.2 million. In addition to the
manufacture12 months ended September 30, 2013. The results of
sodium hypochlorite bleaches, Vertex distributes and provides terminal services for bulk liquid inorganic chemicals, and contract and private label packaging for household chemicals. We believeits operations since the acquisition
strengthens our market position in the Midwest. Operating results of Vertexdate are included in our
consolidated results of operations from the date of acquisition in this Annual Report on Form 10-K as part of our IndustrialWater Treatment segment.
See Note 2 to the Consolidated Financial Statements for further information.In fiscal 2010, we completed two new facilities to expand our ability to service our customers and facilitate growth within our Industrial Group. Our facility in Centralia, Illinois began operations in July 2009 and primarily serves our food-grade and agriculture products businesses. We also opened a facility in Minneapolis, Minnesota, to handle bulk chemicals sold to pharmaceutical manufacturers.
We opened one new branch for our Water Treatment Group in fiscal
20122013 and
two new branchesone in fiscal
20112012 and expect to continue to invest in existing and new branches to expand our Water Treatment Group’s geographic coverage. The cost of these branch expansions is not expected to be material. In addition, we
have selectively addedcontinue to add route sales personnel to certain existing Water Treatment Group branch offices to spur growth within our existing geographic coverage area.
In February 2009,the third quarter of fiscal 2013, we agreed to sellrecorded a pre-tax charge of $7.2 million in our inventoryIndustrial segment (approximately $4.5 million after tax, or $0.43 per share, fully diluted). This charge represented the discounted value of our estimated withdrawal payment obligation from the Central States, Southeast and Southwest Areas Pension Fund (“CSS”), a collectively bargained multiemployer pension plan. The withdrawal liability will be paid over 20 years and our payments began in the third quarter of fiscal 2014.
In fiscal 2013, we entered into a
marketingsettlement agreement
regardingwith a chemical supplier to us, pursuant to which we mutually resolved the
businesspreviously disclosed litigation and all disputes among us. The settlement agreement provided for a cash payment by us to the supplier and provided that both parties enter into new contracts for the supply by the supplier of
our Pharmaceutical segment, which provided pharmaceuticalcertain chemicals to
retail pharmacies and small-scale pharmaceutical manufacturers. The transaction closed in May 2009 and we have no significantus. Our obligations
to fulfill under the
agreement. The resultssettlement agreement resulted in a $3.2 million charge to pre-tax income recorded in cost of
the Pharmaceutical segment have been reported as discontinued operationssales in our
Consolidated Financial Statements for all periods presentedIndustrial segment (approximately $2.0 million after tax, or $0.19 per share, fully diluted) in
this Annual Report on Form 10-K.Ourthe first quarter of fiscal 2013.
An overview of our financial performance in fiscal 2012 was highlighted by:2014 is provided below: Sales from continuing operations of $343.8$348.3 million, a 15.5% increase0.6%decrease from fiscal 2011;2013;
Gross profit from continuing operations of $65.9$61.6 million, or 19.2%17.7% of sales, a $4.0$4.7 millionincrease in gross profit dollars from fiscal 2011;2013. Fiscal 2013 gross profit was adversely impacted by non-recurring charges of $7.2 million related to our withdrawal from the CSS pension plan and $3.2 million related to the litigation settlement discussed above;
Net cash provided by operating activities of $33.7 million;$34.6 million; and
Cash and cash equivalents and investments available for sale were $45.9of $63.2 million as of the end of fiscal 2012.2014, an increase of $13.2 million from the end of fiscal 2013.
We seek to maintain relatively constant gross profit dollars
per unit sold on each of our products as the cost of our raw materials increase or
decrease.decrease, subject to competitive pricing pressures that may negatively impact our gross profit dollars per unit sold. Since we expect that we will continue to experience fluctuations in our raw material costs and resulting prices in the future, we believe that gross profit dollars is the best measure of our profitability from the sale of our
products. If we maintain relatively stableproducts, as opposed to gross profit
dollars on eachas a percentage of
our products, our reported gross profit percentage will decrease when the cost of the product increases and will increase when the cost of the product decreases.sales.
We use the last in, first out (“LIFO”) method of valuing the vast majority of Hawkins’our inventory, which causes the most recent product costs to be recognized in our income statement. The valuation of LIFO inventory for interim periods is based on our estimates of fiscal year-end inventory levels and costs. The LIFO inventory valuation method and the resulting cost of sales are consistent with our business practices of pricing to current commodity chemical raw material prices. Our LIFO reserve increaseddecreased by $1.6$1.9 million in fiscal 2012 primarily due to volumes2014 and mix of commodity chemicals$0.4 million in inventory at the end of the year. The increased reserve decreasedfiscal 2013, increasing our reported gross profit for both of these years. The reduction in the year. Our LIFO reserve increased by $3.9 million in fiscal 20112014 was primarily due to rising costs and higherlower levels of inventory volumes on hand at year-end, maintained to meet customer requirementsdriven by unusually cold and wintry weather that resulted in rail car and barge shipment delays during an anticipated flood. Thisthe fourth quarter of fiscal 2014. We anticipate our LIFO reserve will increase in fiscal 2015, decreasing our gross profit recorded, as we anticipate our inventory will return to levels consistent with historical levels at the end of fiscal 2015. The amount of the reserve decreasedincrease will depend on our reported gross profitactual fiscal year-end inventory levels and costs.
We disclose the sales of our bulk commodity products as a percentage of total sales dollars. We reviewed and revised the definition of bulk commodity products so that it now consists of products that we do not modify in
fiscal 2011.any way, but receive, store, and ship from our facilities, or direct ship to our customers in large quantities. This definition is more consistent with the business of a company primarily focused on bulk chemical distribution. The disclosures in this document referring to sales of bulk commodity products have been recalculated for all periods presented based on this revised definition.
The following table sets forth certain items from our statement of income as a percentage of sales from period to period: | | | | | | | | | | | | |
| | | Fiscal
2012 | | | Fiscal
2011 | | | Fiscal
2010 | |
Sales | | | 100.0 | % | | | 100.0 | % | | | 100.0 | % |
Cost of sales | | | (80.8 | )% | | | (79.2 | )% | | | (74.9 | )% |
| | | | | | | | | | | | |
Gross profit | | | 19.2 | % | | | 20.8 | % | | | 25.1 | % |
Selling, general and administrative expenses | | | (9.0 | )% | | | (10.1 | )% | | | (10.0 | )% |
| | | | | | | | | | | | |
Operating income | | | 10.2 | % | | | 10.7 | % | | | 15.1 | % |
Investment income | | | 0.1 | % | | | 0.1 | % | | | 0.1 | % |
| | | | | | | | | | | | |
Income from continuing operations before income taxes | | | 10.3 | % | | | 10.8 | % | | | 15.2 | % |
Provision for income taxes | | | (4.0 | )% | | | (4.0 | )% | | | (6.1 | )% |
| | | | | | | | | | | | |
Income from continuing operations | | | 6.3 | % | | | 6.8 | % | | | 9.1 | % |
Income from discontinued operations, net of tax | | | 0.3 | % | | | 0.0 | % | | | 0.1 | % |
| | | | | | | | | | | | |
Net income | | | 6.6 | % | | | 6.8 | % | | | 9.2 | % |
| | | | | | | | | | | | |
|
| | | | | | | | | |
| | | Fiscal 2014 | | Fiscal 2013 | | Fiscal 2012 |
| Sales | | 100.0 | % | | 100.0 | % | | 100.0 | % |
| Cost of sales | | (82.3 | )% | | (81.7 | )% | | (80.8 | )% |
| Pension withdrawal | | — | % | | (2.1 | )% | | — | % |
| Gross profit | | 17.7 | % | | 16.2 | % | | 19.2 | % |
| Selling, general and administrative expenses | | (9.6 | )% | | (9.0 | )% | | (9.0 | )% |
| Operating income | | 8.1 | % | | 7.2 | % | | 10.2 | % |
| Interest (expense) income, net | | — | % | | 0.1 | % | | 0.1 | % |
| Income from continuing operations before income taxes | | 8.1 | % | | 7.3 | % | | 10.3 | % |
| Income tax provision | | (2.9 | )% | | (2.4 | )% | | (4.0 | )% |
| Income from continuing operations | | 5.2 | % | | 4.9 | % | | 6.3 | % |
| Income from discontinued operations, net of tax | | — | % | | — | % | | 0.3 | % |
| Net income | | 5.2 | % | | 4.9 | % | | 6.6 | % |
Fiscal
20122014 Compared to Fiscal
20112013
Sales
SalesSales increased $46.2decreased$2.1 million, or 15.5%0.6%, to $343.8$348.3 million for fiscal 2012,2014, as compared to sales of $297.6$350.4 million for fiscal 2011. Vertex,2013. Sales of bulk commodity products, using the revised definition for these products discussed above, were approximately 21% of sales in fiscal 2014 and 23% in fiscal 2013.
Industrial Segment. Industrial segment sales decreased $3.7 million, or 1.5%, to $244.9 million for fiscal 2014. Overall volumes increased slightly year-over-year, with the increase driven by higher volumes of bulk commodity products sold, which generally carry lower per-unit selling prices and margins. In addition, competitive pricing pressures resulted in lower overall per-unit selling prices.
Water Treatment Segment. Water Treatment segment sales increased $1.5 million, or 1.5%, to $103.4 million for fiscal 2014. Sales volumes in this segment were largely unchanged as compared to the prior year. Sales growth in our newer branches, including the Oklahoma branch we acquired in connection with the ACS acquisition, together with increased sales of certain specialty chemical products and equipment, more than offset the negative impact of unfavorable weather conditions during the fourth quarter of 2011, contributed $32.9 millionmajority of the increase inspring and summer months and reduced sales volumes of bulk commodity products.
Gross Profit
Gross profit was $61.6 million, or 17.7% of sales, for fiscal 2012. We2014, as compared to $56.9 million, or 16.2% of sales, for fiscal 2013. The prior year’s gross profit was adversely impacted by the $7.2 million CSS pension withdrawal charge and the $3.2 million charge resulting from the litigation settlement, both of which were recorded in our Industrial segment. Together, these charges constituted 3.0% of sales for fiscal 2013. The LIFO method of valuing inventory increased gross profit by $1.9 million for fiscal 2014 and $0.4 million for fiscal 2013, primarily due to lower levels of inventory of many of our products at year-end.
Industrial Segment. Gross profit for the Industrial segment was $32.0 million, or 13.1% of sales, for fiscal 2014, as compared to $28.9 million, or 11.6% of sales, for fiscal 2013. The prior year’s gross profit for this segment was negatively impacted by the $7.2 million CSS pension withdrawal charge and the $3.2 million charge resulting from the litigation settlement, which charges together constituted 4.2% of Industrial segment sales for the fiscal year. Gross profit for fiscal 2014 was adversely impacted by $1.7 million in incremental costs to operate our new Rosemount manufacturing facility as compared to fiscal 2013, and a $0.4 million year-over-year difference in costs incurred to exit the leased facility used to serve our bulk pharmaceutical customers. Despite slightly higher overall sales volumes, gross profit was also experiencednegatively impacted by competitive pricing pressures and
higher volumes of lower margin products sold as compared to the prior year. The LIFO method of valuing inventory increased gross profit by $1.6 million in fiscal 2014 and increased gross profit by $0.4 million in fiscal 2013.
Water Treatment Segment. Gross profit for the Water Treatment segment was $29.6 million, or 28.6% of sales, for fiscal 2014, as compared to $28.1 million, or 27.6% of sales, for fiscal 2013. Growth at our newer branches, including the Oklahoma branch we acquired in connection with the ACS acquisition, along with a favorable product mix shift to specialty chemical products from bulk commodities, more than offset the impact to gross profit of unfavorable weather conditions during the spring and summer months. The LIFO method of valuing inventory increased gross profit by $0.3 million in fiscal 2014 and had a nominal impact on gross profit in fiscal 2013.
Selling, General and Administrative Expenses
Selling, general and administrative expenses were $33.5 million, or 9.6% of sales, for fiscal 2014, as compared to $31.6 million, or 9.0% of sales, for fiscal 2013. The increase in expenses was driven by incremental costs of $1.0 million related to our new headquarters facility, as well as additional sales and infrastructure support staffing costs in the Water Treatment segment, including our newly-acquired ACS operation.
Operating Income
Operating income was $28.1 million, or 8.1% of sales, for fiscal 2014, as compared to $25.3 million, or 7.2% of sales, for fiscal 2013. Operating income for the Industrial segment increased by $3.3 million as a result of the $7.2 million CSS pension withdrawal charge and the $3.2 million litigation settlement charge recorded in the prior year, largely offset by the reductions in gross profit in fiscal 2014 as discussed above. Operating income for the Water Treatment segment decreased $0.5 million primarily as a result of higher selling, prices duegeneral and administrative expenses, more than offsetting increases in gross profit as discussed above.
Interest (expense) income, net
Interest income on cash and investments of $0.2 million was offset by interest expense related to our pension withdrawal liability of $0.2 million during fiscal 2014. Interest income of $0.1 million for fiscal 2013 consisted primarily of interest income on cash and investments.
Income Tax Provision
Our effective income tax rate was 35.5% for fiscal 2014 compared to 32.7% for fiscal 2013. Our effective tax rate for fiscal 2014 was reduced by a non-recurring state tax benefit of $0.4 million. During fiscal 2013, we amended previously filed U.S. Federal tax returns resulting in an increase of $0.8 million in the benefits related to the domestic manufacturing deduction and investment tax credits, which reduced our tax rate for that year. The effective tax rate is generally impacted by projected levels of taxable income, permanent items, and state taxes.
Fiscal 2013 Compared to Fiscal 2012
Sales
Sales increased
commodity chemical prices.$6.6 million, or 1.9%, to $350.4 million for fiscal 2013, as compared to sales of $343.8 million for fiscal 2012. Sales of bulk
chemicals, including caustic soda,commodity products, using the revised definition for these products discussed above, were approximately 23% of sales compared to approximately 20% in the previous year.
The increase in the bulkchemical sales percentage for fiscal 2012 was primarily attributable to a full year of Vertex sales volumes compared to a partial year of sales volumes in fiscal 2011.
Industrial Segment. Industrial segment sales increased $42.7decreased $2.9 million, or 20.5%1.2%, to $251.4$248.6 million for fiscal 2012. Vertex contributed $32.9 million of the increase2013. While overall volumes increased year-over-year, competitive pricing pressure resulted in sales for fiscal 2012. We experienced higherlower overall per-unit selling prices due to increased commodity chemical prices.
Water Treatment Segment. Water Treatment segment sales increased $3.5$9.4 million, or 3.9%10.2%, to $92.4$101.8 million for fiscal 2012.2013. The increase in sales increase was primarily attributable to increased sales volumes related to manufactured and specialty chemical products and higher bulk chemical selling prices due to increasedvolume growth resulting from favorable weather conditions in the first half of fiscal 2013 and additional sales of bulk commodity chemical prices for those products.
Gross profit was $56.9 million, or 16.2% of sales, for fiscal 2013, as compared to $65.9 million, or 19.2% of sales, for fiscal 2012,2012. Fiscal 2013 gross profit was adversely impacted by the $7.2 million CSS pension withdrawal and the $3.2 million charge resulting from the litigation settlement, which charges together constituted 3.0% of sales for the fiscal year. Additionally, gross profit was
negatively impacted by $1.3 million in incremental costs related to our new Rosemount manufacturing facility in fiscal 2013 as compared to
$61.9fiscal 2012, and $0.4 million
or 20.8% of
sales, foraccelerated depreciation charges related to a facility we vacated in fiscal
2011.2014. The LIFO method of valuing inventory
negatively impactedincreased gross profit by $0.4 million for fiscal 2013 primarily due to reduced inventory of certain products at year end. In the prior year, LIFO reduced gross profit by $1.6 million
for fiscal 2012 primarily due to
volumeshigher inventory levels and
the mix of
commodity chemicals in inventory at the end of the year.
In the prior year, LIFO negatively impacted gross profit by $3.9 million due to rising raw material costs and higher inventory volumes on hand at year-end maintained to meet customer requirements during an anticipated flood.
Industrial Segment. Gross profit for the Industrial segment was $40.4$28.9 million, or 16.1%11.6% of sales, for fiscal 2012,2013, as compared to $36.9$40.4 million, or 17.7%16.0% of sales, for fiscal 2011. The increase in2012. Fiscal 2013 gross profit dollars resultedfor this segment was negatively impacted by the $7.2 million CSS pension withdrawal charge and the $3.2 million charge resulting from the additionlitigation settlement, which charges together constituted 4.2% of Industrial segment sales for the Vertex business tofiscal year. Gross profit for this segment partially offsetwas also negatively impacted by lower selling prices due toheightened competitive pricing pressurespressure, resulting in overall lower per-unit margins, $1.3 million in incremental costs for the new Rosemount facility, and lower volumes.by $0.4 million of accelerated depreciation charges related to the facility we vacated as noted above. The LIFO method of valuing inventory negatively impactedincreased gross profit by $0.4 million in this segmentfiscal 2013 and reduced gross profit by $1.5 million in fiscal 2012 and $2.9 million in fiscal 2011.2012.
Water Treatment Segment. Gross profit for the Water Treatment segment was $28.1 million, or 27.6% of sales, for fiscal 2013, as compared to $25.5 million, or 27.6% of sales, for fiscal 2012, as compared to $25.0 million, or 28.1% of sales, for fiscal 2011.2012. The increase in gross profit dollars was primarily due to increased sales volumes in the latter half of the fiscal 2012 more than offsetting lower volumes resulting from unfavorablefavorable weather conditions during the first half of the year, andpartially offset by higher volumes of lower selling prices duemargin products sold as compared to competitive pricing pressures.the prior year. The LIFO method of valuing inventory had no significant impact on gross profit in fiscal 2013 and negatively impacted gross profit in this segment by $0.1 million in fiscal 2012 and $1.1 million in fiscal 2011.2012.
Selling, General and Administrative Expenses
Selling, general and administrative
(“SG&A”) expenses were
$30.8$31.6 million, or 9.0% of sales, for fiscal
2012,2013, as compared to
$29.9$30.8 million, or
10.1%8.9% of sales, for fiscal
2011.2012. The increase was primarily due to
the addition of expenses relatedhigher selling costs due to
the Vertex business, which we acquired in the fourth quarter of fiscal 2011,additional sales staff, partially offset by
one-time costs we incurred in fiscal 2011 but did not experience in fiscal 2012. Fiscal 2011 included approximately $1.0 million in expense as a result of the death of John Hawkins, our former Chief Executive Officer, through payments due under his retention bonus agreement, and the accelerated vesting of his previously granted performance-based restricted stock units and stock options as well as approximately $0.7 million in Vertex acquisitionlower administration costs.
Operating income was $35.1$25.3 million, or 7.2% of sales, for fiscal 2013, as compared to $35.1 million, or 10.2% of sales, for fiscal 2012, as compared to $32.02012. An $11.6 million or 10.7% of sales, for fiscal 2011. A $3.4 million increasedecrease in operating income for the Industrial segment resulted primarily from the addition of the Vertex business,was partially offset by a $0.3$1.8 million decreaseincrease in operating income for the Water Treatment segment. Both segments wereOperating income for the Industrial segment was negatively impacted by the CSS pension withdrawal, the litigation settlement agreement, heightened competitive pricing pressure, the addition of a new production facility and the accelerated depreciation related to the anticipated exit of a leased facility. The LIFO method of valuing inventory increased our operating income in fiscal 2012 and2013, but reduced our operating income in fiscal 2011.Investment Income2012.
Interest (expense) income, net
Investment income was $0.1 million for
both fiscal
20122013 and
$0.3 million in fiscal 2011. The decrease in investment income was primarily due to lower cash and investment balances.Provision for 2012.
Income
Taxestax provision
Our effective income tax rate was
32.7% for fiscal 2013 compared to 38.6% for fiscal
2012 compared2012. During fiscal 2013, we amended previously filed U.S. Federal tax returns resulting in an increase of $0.8 million in the benefits related to
37.1%the domestic manufacturing deduction and investment tax credits, which positively impacted our tax rate for
fiscal 2011.the year. The
higher effective tax rate
for fiscal 2012 was primarily due to decreased permanent tax benefits and somewhat higher effective state tax rates.Fiscal 2011 Compared to Fiscal 2010
Sales
Sales increased $40.5 million, or 15.8%, to $297.6 million for fiscal 2011, as compared to sales of $257.1 million for fiscal 2010. The sales increase was primarily driven by higher sales of manufactured and specialty chemical products and somewhat higher selling prices for bulk chemicals due to increasing commodity chemical costs. Sales of these bulk products were approximately 20% of sales compared to approximately 19% in the previous year. Additionally, the acquisition of Vertex, which closed in the fourth quarter of fiscal 2011, contributed $9.2 million in revenue.
Industrial Segment. Industrial segment sales increased $33.8 million, or 19.3%, to $208.7 million for fiscal 2011. The sales increase was primarily attributable to higher sales of manufactured and specialty chemical products and somewhat higher selling prices for commodity bulk chemicals due to increased commodity chemical costs. In addition, Vertex revenues of $9.2 million are included in fiscal 2011 Industrial segment sales.
Water Treatment Segment. Water Treatment segment sales increased $6.7 million, or 8.2%, to $88.9 million for fiscal 2011. The sales increase was primarily attributable to increased sales of manufactured and specialty chemical products.
Gross Profit
Gross profit was $61.9 million, or 20.8% of sales, for fiscal 2011, as compared to $64.4 million, or 25.1% of sales, for fiscal 2010. The LIFO method of valuing inventory negatively impacted gross profit by $3.9 million for fiscal 2011 due to increased raw material costs and higher volumes of inventory at year end maintained to meet customer requirements during an anticipated flood. In the prior year, LIFO positively impacted gross profit by $12.6 million due to decreases in certain raw material costs during that period.
Industrial Segment. Gross profit for the Industrial segment was $36.9 million, or 17.7% of sales, for fiscal 2011, as compared to $37.3 million, or 21.3% of sales, for fiscal 2010. Competitive pricing pressures and increased operational overhead costs contributed to the lower gross profit levels in the Industrial segment. This group incurred $0.3 million of overhead costs associated with flood control efforts in the fourth quarter of fiscal 2011. These reductions in gross profit were partially offset by higher sales of higher margin manufactured and specialty chemical products. The LIFO method of valuing inventory negatively impacted gross profit in this segment by $2.9 million in fiscal 2011, as compared to positively impacting gross profit by $10.2 million in fiscal 2010.
Water Treatment Segment. Gross profit for the Water Treatment segment was $25.0 million, or 28.1% of sales, for fiscal 2011, as compared to $27.2 million, or 33.0% of sales, for fiscal 2010. The decrease in gross profit dollars was primarily due to competitive pricing pressures and increased operational overhead costs, partially offset by increased sales. Additionally, the LIFO method of valuing inventory negatively impacted gross profit in this segment by $1.1 million in fiscal 2011, as compared to positively impacting gross profit by $2.4 million in fiscal 2010.
Selling, General and Administrative Expenses
Selling, general and administrative (“SG&A”) expenses increased $4.3 million to $29.9 million, or 10.1% of sales, for fiscal 2011, as compared to $25.6 million, or 10.0% of sales, for fiscal 2010. We incurred approximately $1.0 million in additional expense as a result of the death of John Hawkins, our former Chief Executive Officer, through payments due under his retention bonus agreement and the accelerated vesting of his previously granted performance-based restricted stock units and stock options. Other items driving the increased expenses include acquisition costs of approximately $0.7 million relating to the Vertex acquisition in addition to higher equity incentive plan costs and litigation defense costs.
Operating Income
Operating income was $32.0 million, or 10.7% of sales, for fiscal 2011, as compared to $38.8 million, or 15.1% of sales, for fiscal 2010. The decrease in operating income was the result of reduced gross profits and increased SG&A expenses. Both reporting segments saw a decline in their gross profit dollars due to competitive pricing pressures and higher operational overhead costs. Both segments were also negativelyis generally impacted by the LIFO methodprojected levels of valuing inventory in fiscal 2011.
Investment Income
Investment income was $0.3 million for fiscal 2011 and fiscal 2010.
Provision for Income Taxes
Our effective income tax rate was 37.1% for fiscal 2011 compared to 39.3% for fiscal 2010. The lower effective tax rate for fiscal 2011 was primarily due to increased permanent tax differences, lower taxable income, levelspermanent items, and somewhat lower effective state tax rates.
taxes.
Liquidity and Capital Resources
Cash provided by operating activities in fiscal 20122014 was $33.7$34.6 million compared to $28.5$35.5 million in fiscal 20112013 and $38.8$33.7 million in fiscal 2010. The increase in cash provided by operating activities in fiscal 2012 from fiscal 2011 was primarily due to increases in net income and depreciation and amortization. Higher working capital balances used $1.9 million in cash in fiscal 2012 compared to cash used of $0.4 million for working capital in fiscal 2011. The net increase in working capital balances in fiscal 2012 was primarily due to increasing commodity chemical costs and the resulting increase in selling prices, which resulted in an increase in trade receivables, lower accounts payable and income tax payable balances due to the timing of payments.. Due to the nature of our operations, which includes purchases of large quantities of bulk chemicals, the timing of purchases can result in significant changes in working capital investment and the resulting operating cash flow. Historically, our cash requirements for working capital increase during the period from April through November as caustic soda inventory levels increase as the majority of barges are received during this period.
Cash used in investing activities was $23.1 million in fiscal 2014 compared to $30.4 million in fiscal 2013 and $20.4 million in fiscal 2012. Capital expenditures were $12.3 million in fiscal 2014, $26.7 million in fiscal 2013 and $20.1 million in fiscal 2012. Capital expenditures in fiscal 2014 included $1.5 million related to our new headquarters facility and $1.2 million for our
new Industrial manufacturing facility, compared to capital expenditure totaling $16.9 million for those two facilities in fiscal 2013. Other fiscal 2014 capital spending consisted of approximately $3.0 million related to business expansion and process improvement projects and $6.6 million for other facility improvements, truck and vehicle replacement, and returnable containers. Total capital spending in fiscal 2015 is currently projected to be approximately $20 million.
Cash used in financing activities was $3.7$6.7 million in fiscal 20122014 compared to $6.9$4.9 million in fiscal 20112013 and $6.6$3.7 million in fiscal 2010.2012. The decreaseincrease in cash used in financing activities in fiscal 20122014 was primarily due to an increase in dividend payments, an increase in shares surrendered for payroll taxes, and lower proceeds from the exercise of employee stock options recognitionduring the fiscal year. During the second quarter of excess tax benefitsfiscal 2014, our Board of Directors increased our semi-annual cash dividend by 5.9% to $0.36 per share from share-based compensation$0.34 per share. We have paid cash dividends continuously since 1985. Future dividend levels will be dependent upon our results of operations, financial position, cash flows and proceeds from the issuanceother factors, and are subject to approval by our Board of new shares of common stock for the Company’s employee stock purchase plan.Directors.
Cash and investments available-for-sale was $63.2 million at March 30,2014, an increase of $45.9$13.2 million at April 1, 2012 increased by $8.5 million as compared with April 3, 2011,March 31,2013, primarily due to cash generated from operations proceeds from the exercise of employee stock options and proceeds from the issuance of new shares of common stock through the Company’s employee stock purchase plan, partially offset by capital expenditures and dividend payments. Investments available-for-sale as of April 1, 2012March 30,2014 and April 3, 2011March 31,2013 consisted of certificates of deposit and municipal bonds with maturities ranging from three months to twothree years.Capital Expenditures
Capital expenditures were $20.1 million in fiscal 2012, $12.4 million in fiscal 2011 and $8.3 million in fiscal 2010. Significant capital expenditures in fiscal 2012 consisted of approximately $12.1 million related to business expansion and process improvement projects including the new facility in Rosemount, Minnesota and Water Treatment segment expansion, $2.2 million for regulatory and safety improvements and $3.0 million for other facility improvements and returnable containers. We expect that recurring capital expenditures and safety improvements, facilities improvements and returnable containers, in fiscal 2013 will be comparable to the spending in fiscal 2012. We are projecting increased total capital spending in fiscal 2013 as compared with fiscal 2012, as we complete the Rosemount facility and make other expansion investments. Total capital spending in fiscal 2013 is currently projected to be approximately $30 million. We expect cash balances and our cash flows from operations will be sufficient to fund our cash requirements in fiscal 2013.
Dividends2015.
During
As part of our business growth strategy, we have acquired businesses and may pursue acquisitions or other strategic relationships in the
second quarter of fiscal 2012,future that we believe will complement or expand our
Board of Directors increasedexisting businesses or increase our
semi-annualcustomer base. We expect our cash
dividend by 6.7% to $0.32 per sharebalances and cash flows from
$0.30 per share. We first started paying cash dividends in 1985 and have continued to do so since. Future dividend levelsoperations will be
dependent uponsufficient to fund our
results of operations,cash requirements including acquisitions or other strategic relationships for the foreseeable future. We periodically evaluate opportunities to borrow funds or sell additional equity or debt securities for strategic reasons or to further strengthen our financial
position, cash flows and other factors, and will be evaluated by our Board of Directors.position.
Off-Balance Sheet Arrangements
We do not have any off-balance sheet arrangements.
Contractual Obligations and Commercial Commitments
The following table provides aggregate information about our contractual payment obligations and the periods in which payments are due: | | | | | | | | | | | | | | | | | | | | | | | | | | | | |
| | | Payments Due by Period | |
Contractual Obligation | | 2013 | | | 2014 | | | 2015 | | | 2016 | | | 2017 | | | More than
5 Years | | | Total | |
| | | (In thousands) | |
Operating lease obligations | | $ | 709 | | | $ | 723 | | | $ | 712 | | | $ | 657 | | | $ | 598 | | | $ | 3,381 | | | $ | 6,780 | |
|
| | | | | | | | | | | | | | | | | | | | | | | | | | | | | |
| | | Payments Due by Period |
| Contractual Obligation | | 2015 | | 2016 | | 2017 | | 2018 | | 2019 | | More than 5 Years | | Total |
| | | (In thousands) |
| Operating lease obligations | | $ | 1,478 |
| | $ | 1,254 |
| | $ | 1,111 |
| | $ | 1,054 |
| — |
| $ | 1,061 |
| | $ | 4,061 |
| | $ | 10,019 |
|
| Pension withdrawal liability (1) | | $ | 467 |
| | $ | 467 |
| | $ | 467 |
| | $ | 467 |
| | $ | 467 |
| | $ | 6,774 |
| | $ | 9,109 |
|
| |
| (1) | The amounts shown in the table above relate to our withdrawal from the CSS multiemployer pension plan. Payments on this obligation began in fiscal 2014 and will continue through 2034. |
Critical Accounting Policies
In preparing the financial statements, we follow U.S. generally accepted accounting principles (“GAAP”). The preparation of these financial statements requires us to make estimates and judgments that affect the reported amounts of assets, liabilities, sales and expenses, and related disclosure of contingent assets and liabilities. We re-evaluate our estimates on an on-going basis. Our estimates are based on historical experience and on various other assumptions that are believed to be reasonable under the circumstances. Actual results may differ from these estimates under different assumptions and conditions. We consider the following policies to involve the most judgment in the preparation of our financial statements.
Revenue Recognition — - We recognize revenue when there is evidence that the customer has agreed to purchase the product, the price and terms of the sale are fixed, the product has shipped and title passeshas passed to our customer, performance has occurred, and collection of the receivable is reasonably assured.
LIFO Reserve — - Inventories with the exception of Vertex inventories, are primarily valued at the lower of cost or market with cost being determined using the LIFO method. We may incur significant fluctuations in our LIFO reserve and, as a result, gross margins, due primarily to changes in the level of
inventory on hand and the per-unit cost of a single, large-volume component of our inventory. The price of this inventory component may fluctuatefluctuates depending on the balance between supply and demand. Management reviews the LIFO reserve on a quarterly basis. Vertex inventoriesInventories not valued used the LIFO method are valued at the lower of cost or market with cost being determined using the FIFO method.
Goodwill and Infinite-life Intangible Assets Goodwill —- Goodwill represents the excess of the cost of acquired businesses over the fair value of identifiable tangible net assets and identifiable intangible assets purchased. Goodwill is tested at least annually for impairment, and is tested for impairment more frequently if events or changes in circumstances indicate that the asset might be impaired. The impairment testAs of January 1, 2014, the company performed an analysis of qualitative factors to determine whether it is performed using a two-step process. In the first step,more likely than not that the fair value of thea reporting unit is compared with theless than its carrying amount of the reporting unit, including goodwill. If the estimated fair valueas a basis for determining whether it is less than the carrying amount of the reporting unit, an indication thatnecessary to perform a two-step goodwill impairment exists andtest. Based on management’s analysis of qualitative factors, we determined that it was not necessary to perform a second step must be completed in order to determine the amount of thetwo-step goodwill impairment if any, which should be recorded. In the second step, an impairment loss would be recognizedtest for any excess of the carrying amount of theeither reporting unit’s goodwill over the implied fair value of that goodwill. The implied fair value of goodwill is determined by allocating the fair value of the reporting unit in a manner similar to a purchase price allocation. The fair value of the reporting unit is determined using a discounted cash flow analysis. Projecting discounted future cash flows requires us to make significant estimates regarding future revenues and expenses, projected capital expenditures, changes in working capital and the appropriate discount rate. The projections also take into account several factors including current and estimated economic trends and outlook, costs of raw materials, consideration of our market capitalization in comparison to the estimated fair values of our reporting units determined using discounted cash flow analyses and other factors which are beyond our control.unit.
We completed step one of our annual goodwill impairment evaluation during the fourth quarter of fiscal 2012 and determined that our reporting units’ fair value substantially exceeded their carrying value. Accordingly, step two of the impairment analysis was not required. We also completed an impairment test of infinite-life intangible assets during the fourth quarter, in which the fair value exceeded the carrying amount. Additionally, no impairment charges were required for fiscal 2011 or 2010.
Impairment of Long-Lived Assets — We review the recoverability of long-lived assets to be held and used, such as property, plant and equipment and intangible assets subject to amortization, when events or changes in circumstances occur that indicate the carrying value of the asset or asset group may not be recoverable, such as prolonged industry downturn or significant reductions in projected future cash flows. The assessment of possible impairment is based on our ability to recover the carrying value of the asset or asset group from the expected future pre-tax cash flows (undiscounted) of the related operations. If these cash flows are less than the carrying value of such asset or asset group, an impairment is recognized equal to the amount by which the carrying value exceeds the fair value of the long-lived assets. The measurement of impairment requires us to estimate future cash flows and the fair value of long-lived assets. Significant judgments and assumptions are required in the forecast of future operating results used in the preparation of the estimated future cash flows. We periodically review the appropriateness of the estimated useful lives of our long-lived assets. Changes in these estimates could have a material effect on the assessment of long-lived assets subject to amortization. There were no triggering events that required long-lived assets to be evaluated for impairment during fiscal 2012.ITEM 7A. Income Taxes — In the preparation of our financial statements, management calculates income taxes. This includes estimating the current tax liability as well as assessing temporary differences resulting from different treatment of items for tax and book accounting purposes. These differences result in deferred tax assets and liabilities, which are recorded on the balance sheet. These assets and liabilities are analyzed regularly and management assesses the likelihood that deferred tax assets will be recovered from future taxable income. A valuation allowance is established to the extent that management believes that recovery is not likely. Reserves are also established for potential and ongoing audits of federal and state tax issues. We routinely monitor the potential impact of such situations and believe that it is properly reserved. Valuations related to amounts owed and tax rates could be impacted by changes to tax codes, changes in statutory tax rates, our future taxable income levels and the results of tax audits.QUANTITATIVE AND QUALITATIVE DISCLOSURE ABOUT MARKET RISK
Recently Issued Accounting Pronouncements
See Item 8, “Note 1 — Nature of Business and Significant Accounting Policies” of the Notes to Consolidated Financial Statements for information regarding recently adopted accounting standards or accounting standards to be adopted in the future.
ITEM 7A. | QUANTITATIVE AND QUALITATIVE DISCLOSURE ABOUT MARKET RISK |
We are subject to the risk inherent in the cyclical nature of commodity chemical prices. However, we do not currently purchase forward contracts or otherwise engage in hedging activities with respect to the purchase of commodity chemicals. We attempt to pass changes in
material pricesthe cost of our materials on to our
customers,customers; however, there are no assurances that we will be able to pass on the increases in the future.
ITEM 8. | FINANCIAL STATEMENTS AND SUPPLEMENTARY DATA |
REPORT OF INDEPENDENT REGISTERED PUBLIC ACCOUNTING FIRMITEM 8. FINANCIAL STATEMENTS AND SUPPLEMENTARY DATA
Report of Independent Registered Public Accounting Firm
The Board of Directors and
ShareholdersStockholders of Hawkins, Inc.:
We have audited the accompanying consolidated balance sheets of Hawkins, Inc. and subsidiaries (the Company) as of April 1, 2012March 30, 2014 and April 3, 2011,March 31, 2013, and the related consolidated statements of income, shareholders’ equity and comprehensive income, (loss),shareholders’ equity, and cash flows for each of the years in the three-year period ended April 1, 2012.March 30, 2014. In connection with our audits of the consolidated financial statements, we also have also audited the financial statement schedule for each of the years in the three-year period ended March 30, 2014, listed in the Index at Item 15, asschedule II of and for the years ended April 1, 2012, April 3, 2011 and March 28, 2010.this Form 10-K. We also have audited the Company’s internal control over financial reporting as of April 1, 2012,March 30, 2014, based on criteria established inInternal Control —- Integrated Framework (1992)issued by the Committee of Sponsoring Organizations of the Treadway Commission (COSO). The Company’s management is responsible for these consolidated financial statements, and financial statement schedule, for maintaining effective internal control over financial reporting, and for its assessment of the effectiveness of internal control over financial reporting, included in the accompanying Management’s Report on Internal Control Over Financial Reporting. Our responsibility is to express an opinion on these consolidated financial statements and financial statement schedule and an opinion on the Company’s internal control over financial reporting based on our audits. We conducted our audits in accordance with the standards of the Public Company Accounting Oversight Board (United States). Those standards require that we plan and perform the
auditaudits to obtain reasonable assurance about whether the financial statements are free of material misstatement and whether effective internal control over financial reporting was maintained in all material respects. Our audits of the consolidated financial statements
includesincluded examining, on a test basis, evidence supporting the amounts and disclosures in the financial statements, assessing the accounting principles used and significant estimates made by management, and evaluating the overall financial statement presentation. Our audit of internal control over financial reporting
includesincluded obtaining an understanding of internal control over financial reporting, assessing the risk that a material weakness exists, and testing and evaluating the design and operating effectiveness of internal control based on the assessed risk. Our
auditaudits also
includesincluded performing such other procedures as we considered necessary in the circumstances. We believe that our audits provide a reasonable basis for our opinions.
A company’s internal control over financial reporting is a process designed to provide reasonable assurance regarding the reliability of financial reporting and the preparation of financial statements for external purposes in accordance with generally accepted accounting principles. A company’s internal control over financial reporting includes those policies and procedures that (1) pertain to the maintenance of records that, in reasonable detail, accurately and fairly reflect the transactions and dispositions of the assets of the company; (2) provide reasonable assurance that transactions are recorded as necessary to permit preparation of financial statements in accordance with generally accepted accounting principles, and that receipts and expenditures of the company are being made only in accordance with authorizations of management and directors of the company; and (3) provide reasonable assurance regarding prevention or timely detection of unauthorized acquisition, use, or disposition of the company’s assets that could have a material effect on the financial statements.
Because of its inherent limitations, internal control over financial reporting may not prevent or detect misstatements. Also, projections of any evaluation of effectiveness to future periods are subject to the risk that controls may become inadequate because of changes in conditions, or that the degree of compliance with the policies or procedures may deteriorate.
In our opinion, the consolidated financial statements referred to above present fairly, in all material respects, the financial position of Hawkins, Inc. and subsidiaries as of April 1, 2012, April 3, 2011March 30, 2014 and March 28, 2010,31, 2013, and the results of their operations and their cash flows for each of the years in the three-year period ended April 1, 2012,March 30, 2014, in conformity with U.S. generally accepted accounting principles. Also, in our opinion, suchthe financial statement schedule referred to above, when considered in relation to the basic consolidated financial statements taken as a whole, presents fairly, in all material respects, the information set forth therein as of April 1, 2012, April 3, 2011 and March 28, 2010 and for each of the years in the three-year period ended April 1, 2012. Furthermore,therein. Also in our opinion, Hawkins, Inc. and subsidiaries maintained, in all material respects, effective internal control over financial reporting as of April 1, 2012,March 30, 2014, based on criteria established inInternal Control —- Integrated Framework (1992)issued by the Committee of Sponsoring Organizations of the Treadway Commission.
Minneapolis, Minnesota
June 1, 2012
May 29, 2014
CONSOLIDATED BALANCE SHEETS
(In thousands, except share data)
| | | | | | | | |
| | | April 1, 2012 | | | April 3, 2011 | |
| | |
ASSETS | | | | | | | | |
| | |
CURRENT ASSETS: | | | | | | | | |
Cash and cash equivalents | | $ | 28,566 | | | $ | 18,940 | |
Investments available-for-sale | | | 12,210 | | | | 15,286 | |
Trade receivables — less allowance for doubtful accounts: | | | | | | | | |
$460 for 2012 and $406 for 2011 | | | 38,069 | | | | 35,736 | |
Inventories | | | 27,633 | | | | 29,217 | |
Income taxes receivable | | | 2,447 | | | | 2,197 | |
Prepaid expenses and other current assets | | | 1,930 | | | | 2,872 | |
| | | | | | | | |
Total current assets | | | 110,855 | | | | 104,248 | |
| | |
PROPERTY, PLANT, AND EQUIPMENT: | | | | | | | | |
Land | | | 7,931 | | | | 4,362 | |
Buildings and improvements | | | 55,066 | | | | 47,107 | |
Machinery and equipment | | | 39,432 | | | | 35,740 | |
Transportation equipment | | | 14,842 | | | | 14,036 | |
Office furniture and equipment including computer systems | | | 10,027 | | | | 11,729 | |
| | | | | | | | |
| | | 127,298 | | | | 112,974 | |
Less accumulated depreciation and amortization | | | 54,033 | | | | 50,579 | |
| | | | | | | | |
Net property, plant, and equipment | | | 73,265 | | | | 62,395 | |
OTHER ASSETS: | | | | | | | | |
Goodwill | | | 6,495 | | | | 6,231 | |
Intangible assets — less accumulated amortization: | | | | | | | | |
$1,790 for 2012 and $1,165 for 2011 | | | 8,186 | | | | 8,811 | |
Long-term investments | | | 5,139 | | | | 3,175 | |
Other | | | 141 | | | | 145 | |
| | | | | | | | |
Total other assets | | | 19,961 | | | | 18,362 | |
| | | | | | | | |
Total assets | | $ | 204,081 | | | $ | 185,005 | |
| | | | | | | | |
LIABILITIES AND SHAREHOLDERS’ EQUITY | | | | | | | | |
| | |
CURRENT LIABILITIES: | | | | | | | | |
Accounts payable — trade | | $ | 18,623 | | | $ | 23,350 | |
Dividends payable | | | 3,337 | | | | 3,095 | |
Accrued payroll and employee benefits | | | 8,481 | | | | 7,760 | |
Deferred income taxes | | | 3,170 | | | | 2,619 | |
Container deposits | | | 987 | | | | 978 | |
Other accruals | | | 1,691 | | | | 1,669 | |
| | | | | | | | |
Total current liabilities | | | 36,289 | | | | 39,471 | |
OTHER LONG-TERM LIABILITIES | | | 763 | | | | 1,215 | |
DEFERRED INCOME TAXES | | | 10,422 | | | | 7,876 | |
| | | | | | | | |
Total liabilities | | | 47,474 | | | | 48,562 | |
| | |
COMMITMENTS AND CONTINGENCIES | | | | | | | | |
| | |
SHAREHOLDERS’ EQUITY: | | | | | | | | |
Common stock; authorized: 30,000,000 shares of $0.05 par value; 10,430,874 and 10,307,177 shares issued and outstanding for 2012 and 2011, respectively | | | 522 | | | | 515 | |
Additional paid-in capital | | | 45,169 | | | | 41,060 | |
Retained earnings | | | 111,039 | | | | 95,013 | |
Accumulated other comprehensive loss | | | (123 | ) | | | (145 | ) |
| | | | | | | | |
Total shareholders’ equity | | | 156,607 | | | | 136,443 | |
| | | | | | | | |
| | $ | 204,081 | | | $ | 185,005 | |
| | | | | | | | |
See accompanying notes to consolidated financial statements.
HAWKINS, INC.
CONSOLIDATED STATEMENTS OF INCOME
(In thousands, except share and per-share data)
| | | | | | | | | | | | |
| | | Fiscal Year Ended | |
| | | April 1, 2012 | | | April 3, 2011 | | | March 28, 2010 | |
Sales | | $ | 343,834 | | | $ | 297,641 | | | $ | 257,099 | |
Cost of sales | | | (277,966 | ) | | | (235,739 | ) | | | (192,654 | ) |
| | | | | | | | | | | | |
Gross profit | | | 65,868 | | | | 61,902 | | | | 64,445 | |
Selling, general and administrative expenses | | | (30,759 | ) | | | (29,940 | ) | | | (25,605 | ) |
| | | | | | | | | | | | |
Operating income | | | 35,109 | | | | 31,962 | | | | 38,840 | |
Investment income | | | 145 | | | | 333 | | | | 286 | |
| | | | | | | | | | | | |
Income from continuing operations before income taxes | | | 35,254 | | | | 32,295 | | | | 39,126 | |
Provision for income taxes | | | (13,626 | ) | | | (11,981 | ) | | | (15,388 | ) |
| | | | | | | | | | | | |
Income from continuing operations | | | 21,628 | | | | 20,314 | | | | 23,738 | |
Income from discontinued operations, net of tax | | | 1,057 | | | | — | | | | 109 | |
| | | | | | | | | | | | |
Net income | | $ | 22,685 | | | $ | 20,314 | | | $ | 23,847 | |
| | | | | | | | | | | | |
Weighted average number of shares outstanding-basic | | | 10,339,391 | | | | 10,260,135 | | | | 10,250,978 | |
| | | | | | | | | | | | |
Weighted average number of shares outstanding-diluted | | | 10,408,573 | | | | 10,352,633 | | | | 10,282,993 | |
| | | | | | | | | | | | |
Basic earnings per share | | | | | | | | | | | | |
Earnings per share from continuing operations | | $ | 2.09 | | | $ | 1.98 | | | $ | 2.32 | |
Earnings per share from discontinued operations | | | 0.10 | | | | — | | | | 0.01 | |
| | | | | | | | | | | | |
Basic earnings per share | | $ | 2.19 | | | $ | 1.98 | | | $ | 2.33 | |
| | | | | | | | | | | | |
Diluted earnings per share | | | | | | | | | | | | |
Earnings per share from continuing operations | | $ | 2.08 | | | $ | 1.96 | | | $ | 2.31 | |
Earnings per share from discontinued operations | | | 0.10 | | | | — | | | | 0.01 | |
| | | | | | | | | | | | |
Diluted earnings per share | | $ | 2.18 | | | $ | 1.96 | | | $ | 2.32 | |
| | | | | | | | | | | | |
Cash dividends declared per common share | | $ | 0.64 | | | $ | 0.70 | | | $ | 0.66 | |
| | | | | | | | | | | | |
|
| | | | | | | | |
| | | March 30, 2014 | | March 31, 2013 |
| ASSETS | | | | |
| CURRENT ASSETS: | | | | |
| Cash and cash equivalents | | $ | 33,486 |
| | $ | 28,715 |
|
| Investments available-for-sale | | 13,843 |
| | 15,625 |
|
| Trade receivables — less allowance for doubtful accounts: | | | | |
| $477 for 2014 and $469 for 2013 | | 37,946 |
| | 35,920 |
|
| Inventories | | 26,192 |
| | 28,208 |
|
| Prepaid expenses and other current assets | | 3,160 |
| | 2,613 |
|
| Total current assets | | 114,627 |
| | 111,081 |
|
| PROPERTY, PLANT, AND EQUIPMENT: | | | | |
| Land | | 8,038 |
| | 8,038 |
|
| Buildings and improvements | | 68,801 |
| | 68,268 |
|
| Machinery and equipment | | 53,089 |
| | 50,389 |
|
| Transportation equipment | | 17,764 |
| | 16,156 |
|
| Office furniture and equipment including computer systems | | 11,183 |
| | 10,204 |
|
| | | 158,875 |
| | 153,055 |
|
| Less accumulated depreciation | | 68,406 |
| | 62,081 |
|
| Net property, plant, and equipment | | 90,469 |
| | 90,974 |
|
| OTHER ASSETS: | | | | |
| Goodwill | | 7,392 |
| | 6,495 |
|
| Intangible assets — less accumulated amortization: | | | | |
| $3,069 for 2014 and $2,398 for 2013 | | 8,509 |
| | 7,678 |
|
| Long-term investments | | 15,852 |
| | 5,597 |
|
| Other | | 344 |
| | 323 |
|
| Total other assets | | 32,097 |
| | 20,093 |
|
| Total assets | | $ | 237,193 |
| | $ | 222,148 |
|
| LIABILITIES AND SHAREHOLDERS’ EQUITY | | | | |
| CURRENT LIABILITIES: | | | | |
| Accounts payable — trade | | $ | 18,306 |
| | $ | 18,516 |
|
| Dividends payable | | 3,823 |
| | 3,592 |
|
| Accrued payroll and employee benefits | | 5,555 |
| | 5,391 |
|
| Deferred income taxes | | 2,900 |
| | 2,554 |
|
| Income tax payable | | 1,444 |
| | 1,446 |
|
| Other current liabilities | | 3,801 |
| | 3,626 |
|
| Total current liabilities | | 35,829 |
| | 35,125 |
|
| PENSION WITHDRAWAL LIABILITY | | 6,887 |
| | 7,136 |
|
| OTHER LONG-TERM LIABILITIES | | 1,878 |
| | 1,653 |
|
| DEFERRED INCOME TAXES | | 10,186 |
| | 8,062 |
|
| Total liabilities | | 54,780 |
| | 51,976 |
|
| COMMITMENTS AND CONTINGENCIES | | — |
| | — |
|
| SHAREHOLDERS’ EQUITY: | | | | |
| Common stock; authorized: 30,000,000 shares of $0.05 par value; 10,562,400 and 10,495,427 shares issued and outstanding for 2014 and 2013, respectively | | 528 |
| | 525 |
|
| Additional paid-in capital | | 50,502 |
| | 48,779 |
|
| Retained earnings | | 131,427 |
| | 120,974 |
|
| Accumulated other comprehensive loss | | (44 | ) | | (106 | ) |
| Total shareholders’ equity | | 182,413 |
| | 170,172 |
|
| Total liabilities and shareholders’ equity | | $ | 237,193 |
| | $ | 222,148 |
|
See accompanying notes to consolidated financial statements.
CONSOLIDATED STATEMENTS OF
SHAREHOLDERS’ EQUITY AND COMPREHENSIVE INCOME
(LOSS)(In thousands, except share
and per-share data)
| | | | | | | | | | | | | | | | | | | | | | | | |
| | | Common Stock | | | Additional
Paid-in
Capital | | | Retained
Earnings | | | Accumulated
Other
Comprehensive
Income (Loss) | | | Total
Shareholders’
Equity | |
| | Shares | | | Amount | | | | | |
BALANCE — March 29, 2009 | | | 10,246,458 | | | $ | 512 | | | $ | 38,368 | | | $ | 64,860 | | | $ | (10 | ) | | $ | 103,730 | |
Cash dividends | | | | | | | | | | | | | | | (6,786 | ) | | | | | | | (6,786 | ) |
Stock compensation expense | | | | | | | | | | | 659 | | | | | | | | | | | | 659 | |
Vesting of restricted stock | | | 7,000 | | | | 1 | | | | — | | | | | | | | | | | | 1 | |
Comprehensive income: | | | | | | | | | | | | | | | | | | | | | | | | |
Unrealized gain on available-for-sale investments, net of tax | | | | | | | | | | | | | | | | | | | 66 | | | | 66 | |
Unrealized loss on post-retirement plan liability, net of tax | | | | | | | | | | | | | | | | | | | (19 | ) | | | (19 | ) |
Net income | | | | | | | | | | | | | | | 23,847 | | | | | | | | 23,847 | |
| | | | | | | | | | | | | | | | | | | | | | | | |
Comprehensive income | | | | | | | | | | | | | | | | | | | | | | | 23,894 | |
| | | | | | | | | | | | | | | | | | | | | | | | |
BALANCE — March 28, 2010 | | | 10,253,458 | | | $ | 513 | | | $ | 39,027 | | | $ | 81,921 | | | $ | 37 | | | $ | 121,498 | |
Cash dividends | | | | | | | | | | | | | | | (7,222 | ) | | | | | | | (7,222 | ) |
Stock compensation expense | | | | | | | | | | | 1,952 | | | | | | | | | | | | 1,952 | |
Tax benefit on share-based compensation plans | | | | | | | | | | | 281 | | | | | | | | | | | | 281 | |
Vesting of restricted stock | | | 58,653 | | | | 3 | | | | (3 | ) | | | | | | | | | | | — | |
Shares surrendered for payroll taxes | | | (4,934 | ) | | | (1 | ) | | | (197 | ) | | | | | | | | | | | (198 | ) |
Comprehensive income: | | | | | | | | | | | | | | | | | | | | | | | | |
Unrealized loss on available-for-sale investments, net of tax | | | | | | | | | | | | | | | | | | | (63 | ) | | | (63 | ) |
Unrealized loss on post-retirement plan liability, net of tax | | | | | | | | | | | | | | | | | | | (119 | ) | | | (119 | ) |
Net income | | | | | | | | | | | | | | | 20,314 | | | | | | | | 20,314 | |
| | | | | | | | | | | | | | | | | | | | | | | | |
Comprehensive income | | | | | | | | | | | | | | | | | | | | | | | 20,132 | |
| | | | | | | | | | | | | | | | | | | | | | | | |
BALANCE — April 3, 2011 | | | 10,307,177 | | | $ | 515 | | | $ | 41,060 | | | $ | 95,013 | | | $ | (145 | ) | | $ | 136,443 | |
Cash dividends | | | | | | | | | | | | | | | (6,659 | ) | | | | | | | (6,659 | ) |
Stock compensation expense | | | | | | | | | | | 1,350 | | | | | | | | | | | | 1,350 | |
Tax benefit on share-based compensation plans | | | | | | | | | | | 698 | | | | | | | | | | | | 698 | |
Vesting of restricted stock | | | 18,663 | | | | 1 | | | | (1 | ) | | | | | | | | | | | — | |
Shares surrendered for payroll taxes | | | (3,980 | ) | | | — | | | | (150 | ) | | | | | | | | | | | (150 | ) |
Stock Options Exercised | | | 85,332 | | | | 5 | | | | 1,461 | | | | | | | | | | | | 1,466 | |
ESPP Shares Issued | | | 23,682 | | | | 1 | | | | 751 | | | | | | | | | | | | 752 | |
Comprehensive income: | | | | | | | | | | | | | | | | | | | | | | | | |
Unrealized loss on available-for-sale investments, net of tax | | | | | | | | | | | | | | | | | | | (4 | ) | | | (4 | ) |
Unrealized gain on post-retirement plan liability, net of tax | | | | | | | | | | | | | | | | | | | 26 | | | | 26 | |
Net income | | | | | | | | | | | | | | | 22,685 | | | | | | | | 22,685 | |
| | | | | | | | | | | | | | | | | | | | | | | | |
Comprehensive income | | | | | | | | | | | | | | | | | | | | | | | 22,707 | |
| | | | | | | | | | | | | | | | | | | | | | | | |
BALANCE — April 1, 2012 | | | 10,430,874 | | | $ | 522 | | | $ | 45,169 | | | $ | 111,039 | | | $ | (123 | ) | | $ | 156,607 | |
| | | | | | | | | | | | | | | | | | | | | | | | |
|
| | | | | | | | | | | | |
| | Fiscal Year Ended |
| | | March 30, 2014 | | March 31, 2013 | | April 1, 2012 |
| Sales | | $ | 348,263 |
| | $ | 350,387 |
| | $ | 343,834 |
|
| Cost of sales | | (286,663 | ) | | (286,241 | ) | | (277,966 | ) |
| Pension withdrawal | | — |
| | (7,210 | ) | | — |
|
| Gross profit | | 61,600 |
| | 56,936 |
| | 65,868 |
|
| Selling, general and administrative expenses | | (33,510 | ) | | (31,606 | ) | | (30,759 | ) |
| Operating income | | 28,090 |
| | 25,330 |
| | 35,109 |
|
| Interest (expense) income, net | | (29 | ) | | 84 |
| | 145 |
|
| Income from continuing operations before income taxes | | 28,061 |
| | 25,414 |
| | 35,254 |
|
| Income tax provision | | (9,967 | ) | | (8,306 | ) | | (13,626 | ) |
| Income from continuing operations | | 18,094 |
| | 17,108 |
| | 21,628 |
|
| Income from discontinued operations, net of tax | | — |
| | 18 |
| | 1,057 |
|
| Net income | | $ | 18,094 |
| | $ | 17,126 |
| | $ | 22,685 |
|
| Weighted average number of shares outstanding-basic | | 10,544,467 |
| | 10,464,820 |
| | 10,339,391 |
|
| Weighted average number of shares outstanding-diluted | | 10,599,755 |
| | 10,541,142 |
| | 10,408,573 |
|
| Basic earnings per share: | | | | | | |
| Earnings per share from continuing operations | | $ | 1.72 |
| | $ | 1.64 |
| | $ | 2.09 |
|
| Earnings per share from discontinued operations | | — |
| | — |
| | 0.10 |
|
| Basic earnings per share | | $ | 1.72 |
| | $ | 1.64 |
| | $ | 2.19 |
|
| Diluted earnings per share: | | | | | | |
| Earnings per share from continuing operations | | $ | 1.71 |
| | $ | 1.62 |
| | $ | 2.08 |
|
| Earnings per share from discontinued operations | | — |
| | — |
| | 0.10 |
|
| Diluted earnings per share | | $ | 1.71 |
| | $ | 1.62 |
| | $ | 2.18 |
|
| Cash dividends declared per common share | | $ | 0.72 |
| | $ | 0.68 |
| | $ | 0.64 |
|
See accompanying notes to consolidated financial statements.
CONSOLIDATED STATEMENTS OF
CASH FLOWSCOMPREHENSIVE INCOME
(In
thousands) | | | | | | | | | | | | |
| | | Fiscal Year Ended | |
| | | April 1, 2012 | | | April 3, 2011 | | | March 28, 2010 | |
CASH FLOWS FROM OPERATING ACTIVITIES: | | | | | | | | | | | | |
Net income | | $ | 22,685 | | | $ | 20,314 | | | $ | 23,847 | |
Reconciliation to cash flows: | | | | | | | | | | | | |
Depreciation and amortization | | | 8,458 | | | | 7,148 | | | | 6,292 | |
Deferred income taxes | | | 3,082 | | | | (600 | ) | | | 7,152 | |
Stock compensation expense | | | 1,350 | | | | 1,952 | | | | 659 | |
Loss from property disposals | | | 2 | | | | 127 | | | | 12 | |
Changes in operating accounts (using) providing cash, net of effects of acquisition: | | | | | | | | | | | | |
Trade receivables | | | (2,407 | ) | | | (5,929 | ) | | | 4,050 | |
Inventories | | | 1,319 | | | | (3,141 | ) | | | 514 | |
Accounts payable | | | (1,846 | ) | | | 5,356 | | | | (462 | ) |
Accrued liabilities | | | 343 | | | | 158 | | | | (322 | ) |
Income taxes | | | (251 | ) | | | 2,529 | | | | (2,404 | ) |
Other | | | 947 | | | | 619 | | | | (556 | ) |
| | | | | | | | | | | | |
Net cash provided by operating activities | | | 33,682 | | | | 28,533 | | | | 38,782 | |
| | | |
CASH FLOWS FROM INVESTING ACTIVITIES: | | | | | | | | | | | | |
Additions to property, plant, and equipment | | | (20,057 | ) | | | (12,421 | ) | | | (8,331 | ) |
Purchases of investments | | | (14,165 | ) | | | (14,210 | ) | | | (41,240 | ) |
Sale and maturities of investments | | | 15,270 | | | | 30,545 | | | | 6,450 | |
Proceeds from property disposals | | | 255 | | | | 143 | | | | 148 | |
Acquisition of Vertex | | | (1,709 | ) | | | (25,500 | ) | | | — | |
| | | | | | | | | | | | |
Net cash used in investing activities | | | (20,406 | ) | | | (21,443 | ) | | | (42,973 | ) |
| | | |
CASH FLOWS FROM FINANCING ACTIVITIES: | | | | | | | | | | | | |
Cash dividends paid | | | (6,417 | ) | | | (7,005 | ) | | | (6,573 | ) |
New Shares Issued | | | 752 | | | | — | | | | — | |
Stock Options Exercised | | | 1,466 | | | | — | | | | — | |
Excess tax benefit from share-based compensation | | | 699 | | | | 281 | | | | — | |
Shares surrendured for payroll taxes | | | (150 | ) | | | (198 | ) | | | — | |
| | | | | | | | | | | | |
Net cash used in financing activities | | | (3,650 | ) | | | (6,922 | ) | | | (6,573 | ) |
| | | | | | | | | | | | |
NET INCREASE (DECREASE) IN CASH AND CASH EQUIVALENTS | | | 9,626 | | | | 168 | | | | (10,764 | ) |
| | | |
CASH AND CASH EQUIVALENTS- | | | | | | | | | | | | |
Beginning of period | | | 18,940 | | | | 18,772 | | | | 29,536 | |
| | | | | | | | | | | | |
CASH AND CASH EQUIVALENTS- | | | | | | | | | | | | |
End of period | | $ | 28,566 | | | $ | 18,940 | | | $ | 18,772 | |
| | | | | | | | | | | | |
SUPPLEMENTAL DISCLOSURES OF CASH FLOW INFORMATION- | | | | | | | | | | | | |
Cash paid during the year for income taxes | | $ | 10,788 | | | $ | 9,771 | | | $ | 10,654 | |
| | | | | | | | | | | | |
Noncash investing activities- | | | | | | | | | | | | |
Acquisition purchase price in accounts payable | | $ | — | | | $ | 1,709 | | | $ | — | |
Capital expenditures in accounts payable | | $ | 279 | | | $ | 1,450 | | | $ | 1,118 | |
thousands, except share data)
|
| | | | | | | | | | | |
| | Fiscal Year Ended |
| | March 30, 2014 | | March 31, 2013 | | April 1, 2012 |
| Net income | $ | 18,094 |
| | $ | 17,126 |
| | $ | 22,685 |
|
| Other comprehensive income (loss), net of tax: | | | | | |
| Unrealized gain (loss) on available-for-sale investments | (47 | ) | | 12 |
| | (4 | ) |
| Unrealized gain on post-retirement liability | 109 |
| | 5 |
| | 26 |
|
| Total other comprehensive income | 62 |
| | 17 |
| | 22 |
|
| Total comprehensive income | $ | 18,156 |
| | $ | 17,143 |
| | $ | 22,707 |
|
See accompanying notes to consolidated financial statements.
CONSOLIDATED STATEMENTS OF SHAREHOLDERS’ EQUITY
(In thousands, except share data)
|
| | | | | | | | | | | | | | | | | | | | | | | |
| | | Common Stock | | Additional Paid-in Capital | | Retained Earnings | | Accumulated Other Comprehensive Income (Loss) | | Total Shareholders’ Equity |
| Shares | | Amount | |
| BALANCE — April 3, 2011 | | 10,307,177 |
| | $ | 515 |
| | $ | 41,060 |
| | $ | 95,013 |
| | $ | (145 | ) | | $ | 136,443 |
|
| Cash dividends declared | | | | | | | | (6,659 | ) | | | | (6,659 | ) |
| Share-based compensation expense | | | | | | 1,350 |
| | | | | | 1,350 |
|
| Tax benefit on share-based compensation plans | | | | | | 698 |
| | | | | | 698 |
|
| Vesting of restricted stock | | 18,663 |
| | 1 |
| | (1 | ) | |
| | | | — |
|
| Shares surrendered for payroll taxes | | (3,980 | ) | | — |
| | (150 | ) | | | | | | (150 | ) |
| Stock Options Exercised | | 85,332 |
| | 5 |
| | 1,461 |
| | | | | | 1,466 |
|
| ESPP Shares Issued | | 23,682 |
| | 1 |
| | 751 |
| | | | | | 752 |
|
| Other comprehensive income, net of tax | | | | | | | | | | 22 |
| | 22 |
|
| Net income | | | | | | | | 22,685 |
| | | | 22,685 |
|
| BALANCE — April 1, 2012 | | 10,430,874 |
| | $ | 522 |
| | $ | 45,169 |
| | $ | 111,039 |
| | $ | (123 | ) | | $ | 156,607 |
|
| Cash dividends declared | |
| |
| |
| | (7,191 | ) | |
| | (7,191 | ) |
| Share-based compensation expense | |
| |
| | 1,630 |
| |
| |
| | 1,630 |
|
| Tax benefit on share-based compensation plans | |
| |
| | 510 |
| |
| |
| | 510 |
|
| Vesting of restricted stock | | 6,120 |
| | — |
| | (1 | ) | |
| |
| | (1 | ) |
| Stock Options Exercised | | 27,999 |
| | 1 |
| | 514 |
| |
| |
| | 515 |
|
| ESPP Shares Issued | | 30,434 |
| | 2 |
| | 957 |
| |
| |
| | 959 |
|
| Other comprehensive income, net of tax | |
| |
| |
| |
| | 17 | | 17 |
|
| Net income | |
| |
| |
| | 17,126 |
| |
| | 17,126 |
|
| BALANCE — March 31, 2013 | | 10,495,427 |
| | $ | 525 |
| | $ | 48,779 |
| | $ | 120,974 |
| | $ | (106 | ) | | $ | 170,172 |
|
| Cash dividends declared | | | | | | | | (7,641 | ) | | | | (7,641 | ) |
| Share-based compensation expense | | | | | | 1,322 |
| | | | | | 1,322 |
|
| Tax benefit on share-based compensation plans | | | | | | (214 | ) | | | | | | (214 | ) |
| Vesting of restricted stock | | 41,906 |
| | 2 |
| | (2 | ) | | | | | | — |
|
| Shares surrendered for payroll taxes | | (12,480 | ) | | (1 | ) | | (484 | ) | | | | | | (485 | ) |
| Stock Options Exercised | | 9,333 |
| | 1 |
| | 185 |
| | | | | | 186 |
|
| ESPP Shares Issued | | 28,214 |
| | 1 |
| | 916 |
| | | | | | 917 |
|
| Other comprehensive income, net of tax | | | | | | | | | | 62 |
| | 62 |
|
| Net income | | | | | | | | 18,094 |
| | | | 18,094 |
|
| BALANCE — March 30, 2014 | | 10,562,400 |
| | $ | 528 |
| | $ | 50,502 |
| | $ | 131,427 |
| | $ | (44 | ) | | $ | 182,413 |
|
See accompanying notes to consolidated financial statements.
HAWKINS, INC.
CONSOLIDATED STATEMENTS OF CASH FLOWS
(In thousands)
|
| | | | | | | | | | | | |
| | Fiscal Year Ended |
| | | March 30, 2014 | | March 31, 2013 | | April 1, 2012 |
| CASH FLOWS FROM OPERATING ACTIVITIES: | | | | | | |
| Net income | | $ | 18,094 |
| | $ | 17,126 |
| | $ | 22,685 |
|
| Reconciliation to cash flows: | | | | | | |
| Depreciation and amortization | | 12,605 |
| | 10,248 |
| | 8,458 |
|
| Deferred income taxes | | 2,150 |
| | (2,985 | ) | | 3,082 |
|
| Pension withdrawal | | — |
| | 7,210 |
| | — |
|
| Share-based compensation expense | | 1,322 |
| | 1,621 |
| | 1,350 |
|
| Loss from property disposals | | 111 |
| | 153 |
| | 2 |
|
| Changes in operating accounts (using) providing cash, net of effects of acquisition: | | | | | | |
| Trade receivables | | (1,698 | ) | | 2,149 |
| | (2,407 | ) |
| Inventories | | 2,122 |
| | (573 | ) | | 1,319 |
|
| Accounts payable | | 335 |
| | (1,185 | ) | | (1,846 | ) |
| Accrued liabilities | | 141 |
| | (1,319 | ) | | 343 |
|
| Income taxes | | (2 | ) | | 3,893 |
| | (251 | ) |
| Other | | (568 | ) | | (864 | ) | | 947 |
|
| Net cash provided by operating activities | | 34,612 |
| | 35,474 |
| | 33,682 |
|
| CASH FLOWS FROM INVESTING ACTIVITIES: | | | | | | |
| Additions to property, plant, and equipment | | (12,261 | ) | | (26,660 | ) | | (20,057 | ) |
| Purchases of investments | | (25,161 | ) | | (18,755 | ) | | (14,165 | ) |
| Sale and maturities of investments | | 16,612 |
| | 14,900 |
| | 15,270 |
|
| Proceeds from property disposals | | 115 |
| | 233 |
| | 255 |
|
| Acquisitions | | (2,416 | ) | | (100 | ) | | (1,709 | ) |
| Net cash used in investing activities | | (23,111 | ) | | (30,382 | ) | | (20,406 | ) |
| CASH FLOWS FROM FINANCING ACTIVITIES: | | | | | | |
| Cash dividends paid | | (7,410 | ) | | (6,936 | ) | | (6,417 | ) |
| New shares issued | | 917 |
| | 968 |
| | 752 |
|
| Stock options exercised | | 186 |
| | 515 |
| | 1,466 |
|
| Excess tax benefit from share-based compensation | | 62 |
| | 510 |
| | 699 |
|
| Shares surrendered for payroll taxes | | (485 | ) | | — |
| | (150 | ) |
| Net cash used in financing activities | | (6,730 | ) | | (4,943 | ) | | (3,650 | ) |
| NET INCREASE IN CASH AND CASH EQUIVALENTS | | 4,771 |
| | 149 |
| | 9,626 |
|
| CASH AND CASH EQUIVALENTS- | | | | | | |
| Beginning of period | | 28,715 |
| | 28,566 |
| | 18,940 |
|
| CASH AND CASH EQUIVALENTS- | | | | | | |
| End of period | | $ | 33,486 |
| | $ | 28,715 |
| | $ | 28,566 |
|
| SUPPLEMENTAL DISCLOSURES OF CASH FLOW INFORMATION- | | | | | | |
| Cash paid during the year for income taxes | | $ | 7,757 |
| | $ | 6,900 |
| | $ | 10,788 |
|
| Noncash investing activities- | | | | | | |
| Capital expenditures in accounts payable | | $ | 699 |
| | $ | 1,401 |
| | $ | 279 |
|
See accompanying notes to consolidated financial statements.
HAWKINS, INC.
NOTES TO CONSOLIDATED FINANCIAL STATEMENTS
Note 1 — Nature of Business and Significant Accounting Policies
Nature of Business —- We have two reportable segments: Industrial and Water Treatment. The Industrial Group operates our Industrial segment and specializes in providing industrial chemicals, products and services to theindustries such as agriculture, energy, electronics, food, chemical processing, pulp and paper, pharmaceutical, medical device and plating industries.plating. The group also manufactures and sells certain food-grade products, including our patented Cheese Phos®liquid phosphate,phosphates, lactates and other blended products. The Water Treatment Group operates our Water Treatment segment and specializes in providing chemicals, equipment and solutions for potable water, municipal and industrial wastewater, industrial process water and non-residential swimming pool water. The group has the resources and flexibility to treat systems ranging in size from a single small single well to a multi-million gallon-per-daymulti-million-gallon-per-day facility.
Fiscal Year —- Our fiscal year is a 52/53-week year ending on the Sunday closest to March 31. Our fiscal year endingyears ended March 30, 2014 (“fiscal 2014”), March 31, 2013 (“fiscal 2013”) and April 1, 2012 (“fiscal 2012”) is a 52-week year. The fiscal year ended April 3, 2011 (“fiscal 2011”) was a 53-week year,were, and the fiscal year ended March 28, 2010 (“fiscal 2010”) was a 52-week year. The fiscal year ending on March 31, 201329, 2015 (“fiscal 2013”2015”) will be, a 52-week year. Beginning in fiscal 2012, we changed our quarterly interim reporting to a 13-week convention.52 weeks.
Principles of Consolidation —- The consolidated financial statements include the accounts of Hawkins, Inc. and its wholly-owned subsidiaries. All intercompany transactions and accounts have been eliminated.
Estimates— - The preparation of financial statements in conformity with U.S. generally accepted accounting principles (“GAAP”) requires management to make estimates and assumptions that affect the reported amounts of assets and liabilities and disclosure of contingent assets and liabilities at the date of the financial statements and the reported amounts of revenues and expenses during the reported period. Actual results could differ from those estimates.
Revenue Recognition —- We recognize revenue when there is evidence that the customer has agreed to purchase the product, the price and terms of the sale are fixed, the product has shipped and title passeshas passed to our customer, performance has occurred, and collection of the receivable is reasonably assured.
Shipping and Handling —- All shipping and handling amounts billed to customers are included in revenues. Costs incurred related to the shipping and the handling of products are included in cost of sales.
Fair Value Measurements —The Financial Accounting Standards Board (“FASB”) issued an accounting standard codified in ASC 820 “Fair Value Measurements and Disclosures” that provides a single definition for fair value, establishes a framework for measuring fair value and expands disclosures about fair value measurements. Under this standard, fair value is defined as the exit price, or the amount that would be received to sell an asset or paid to transfer a liability in an orderly transaction between market participants as of the measurement date. This standard also establishes a hierarchy for inputs used in measuring fair value that maximizes the use of observable inputs and minimizes the use of unobservable inputs by requiring that the most observable inputs be used when available. Observable inputs are inputs market participants would use in valuing the asset or liability developed based on market data obtained from sources independent of us. Unobservable inputs are inputs that reflect our assumptions about the factors market participants would use in valuing the asset or liability developed based upon the best information available in the circumstances.- The financial assets and liabilities that are re-measured and reported at fair value for each reporting period include marketable securities. Other thansecurities and contingent consideration payable related to the application of purchase accounting as a result of the Vertex acquisition, there wereACS Acquisition. There are no fair value measurements with respect to nonfinancial assets or liabilities that are
HAWKINS, INC.
NOTES TO CONSOLIDATED FINANCIAL STATEMENTS — (Continued)
recognized or disclosed at fair value in our consolidated financial statements on a recurring basis subsequent to the effective date of this standard.
basis.
Assets and liabilities measured at fair value are classified using the following hierarchy, which is based upon the transparency of inputs to the valuation as of the measurement date:
Level 1: Valuation is based on observable inputs such as quoted market prices (unadjusted) for identical assets or liabilities in active markets.
Level 2: Valuation is based on inputs such as quoted market prices for similar assets or liabilities in active markets or other inputs that are observable for the asset or liability, either directly or indirectly, for substantially the full term of the financial instrument.
Level 3: Valuation is based upon other unobservable inputs that are significant to the fair value measurement.
In making fair value measurements, observable market data must be used when available. When inputs used to measure fair value fall within different levels of the hierarchy, the level within which the fair value measurement is categorized is based on the lowest level input that is significant to the fair value measurement.
Cash Equivalents —- Cash equivalents include all liquid debt instruments (primarily cash funds and money market accounts and certificates of deposit)accounts) purchased with an original maturity of three months or less. The balances maintained at financial institutions may, at times, exceed federally insured limits.
HAWKINS, INC.
NOTES TO CONSOLIDATED FINANCIAL STATEMENTS — (Continued)
Investments —- Available-for-sale securities consist of certificates of deposit (“CD’s”) and municipal bonds and are valued at current market value, with the resulting unrealized gains and losses excluded from earnings and reported, net of tax, as a separate component of shareholders’ equity until realized. Any impairment loss to reduce an investment’s carrying amount to its fair market value is recognized in income when a decline in the fair market value of an individual security below its cost or carrying value is determined to be other than temporary.
Trade Receivables and Concentrations of Credit Risk —- Financial instruments, which potentially subject us to a concentration of credit risk, principally consist of trade receivables. We sell our principal products to a large number of customers in many different industries. There are no concentrations of business transactedcredit risk with a particularsingle customer or sales from a particular service or geographic area that would significantly impact us in the near term. To reduce credit risk, we routinely assess the financial strength of our customers. We record an allowance for doubtful accounts to reduce our receivables to an amount we estimate is collectible from our customers. Estimates used in determining the allowance for doubtful accounts are based on historical collection experience, current trends, aging of accounts receivable and periodic evaluations of our customers’ financial condition. We invest our excess cash balances at times in certificates of depositCD’s, municipal bonds and a money market account at two separate financial institutions where the cash balances may exceed federally insured limits. The institutions are two of the largest commercial banking institutions in the country and both have maintained a AA credit rating.
Inventories —- Inventories, consisting primarily of finished goods, are primarily valued at the lower of cost or net realizable value, with cost beingfor the vast majority of our inventory determined using the last-in, first-out (“LIFO”) method. Vertex’sThe amount of inventory cost, whichvalued using the first-in, first-out (“FIFO”) method represents approximately 10%9% of the total FIFO inventory balance at April 1, 2012, is determined using the first-in, first-out (“FIFO”) method.March 30, 2014.
HAWKINS, INC.NOTES TO CONSOLIDATED FINANCIAL STATEMENTS — (Continued)
Property, Plant and Equipment —- Property is stated at cost and depreciated or amortized over the lives of the assets, using the straight-line method. Estimated lives are: 10 to 40 years for buildings and improvements; 3 to 20 years for machinery and equipment; 3 to 10 years for transportation equipment; and 3 to 10 years for office furniture and equipment including computer systems. Leasehold improvements are depreciated over the lesser of their estimated useful lives or the remaining lease term.
Significant improvements that add to productive capacity or extend the lives of properties are capitalized. Costs for repairs and maintenance are charged to expense as incurred. When property is retired or otherwise disposed of, the cost and related accumulated depreciation or amortization are removed from the accounts and any related gains or losses are included in income.
We review the recoverability of long-lived assets to be held and used, such as property, plant and equipment, when events or changes in circumstances occur that indicate the carrying value of the
asset or asset group may not be recoverable, such as prolonged industry downturn or significant reductions in projected future cash flows. The assessment of possible impairment is based on our ability to recover the carrying value of the asset
or asset group from the expected future pre-tax cash flows (undiscounted) of the related operations. If these cash flows are less than the carrying value of such asset
or asset group, an impairment loss would be measured by the amount the carrying value exceeds the fair value of the long-lived
assets.asset group. The measurement of impairment requires us to estimate future cash flows and the fair value of long-lived assets. No material long-lived assets were determined to be impaired during fiscal
2012, 2011,years 2014, 2013 or
2010.2012.
Goodwill and Identifiable Intangible Assets —- Goodwill represents the excess of the cost of acquired businesses over the fair value of identifiable tangible net assets and identifiable intangible assets purchased. Goodwill is tested at least annually for impairment, and is tested for impairment more frequently if events or changes in circumstances indicate that the asset might be impaired. The impairment testAs of January 1, 2014, the company performed an analysis of qualitative factors to determine whether it is performed using a two-step process. In the first step,more likely than not that the fair value of thea reporting unit is compared with theless than its carrying amount of the reporting unit, including goodwill. If the estimated fair valueas a basis for determining whether it is less than the carrying amount of the reporting unit, an indication thatnecessary to perform a two-step goodwill impairment exists andtest. Based on management’s analysis of qualitative factors, we determined that it was not necessary to perform a second step must be completed in order to determine the amount of thetwo-step goodwill impairment if any, which should be recorded. In the second step, an impairment loss would be recognizedtest for any excess of the carrying amount of theeither reporting unit’s goodwill over the implied fair value of that goodwill. The implied fair value of goodwill is determined by allocating the fair value of the reporting unit in a manner similar to a purchase price allocation. The fair value of the reporting unit is determined using a discounted cash flow analysis. Projecting discounted future cash flows requires us to make significant estimates regarding future revenues and expenses, projected capital expenditures, changes in working capital and the appropriate discount rate. The projections also take into account several factors including current and estimated economic trends and outlook, costs of raw materials, consideration of our market capitalization in comparison to the estimated fair values of our reporting units determined using discounted cash flow analyses and other factors which are beyond our control.unit.
Our primary identifiable intangible assets include customer lists, trade secrets, non-compete agreements, trademarks, and trade names acquired in previous business acquisitions. Identifiable intangibles with finite lives are amortized and those identifiable intangibles with indefinite lives are not amortized. The values assigned to the intangible assets with finite lives are being amortized on average over approximately 14 years.13 years. Identifiable intangible assets that are subject to amortization are evaluated for impairment whenever events or changes in circumstances indicate that the carrying amount may not be recoverable. Identifiable intangible assets not subject to amortization are tested for impairment annually or more frequently if events warrant. The impairment test consists of a comparisonqualitative assessment to determine whether it is more likely than not that the asset is impaired. Based on management’s analysis of the fair value of the intangible asset with its carrying amount.We completed step one of our annual goodwill impairment evaluation during the fourth quarter of fiscal 2012 andqualitative factors, we determined that our reporting units’ fair value substantially exceeded their carrying value. Accordingly,
it was not necessary to perform a quantitative impairment test for fiscal 2014.
NOTES TO CONSOLIDATED FINANCIAL STATEMENTS — (Continued)step two of the impairment analysis was not required. We
Impairment tests were also completed
an impairment test of infinite-life intangible assets duringin the fourth
quarter,quarters of fiscal 2013 and 2012, which resulted in
which the fair value exceeded the carrying amount. Additionally, no impairment charges
were required for
either of these fiscal
2011 or 2010.years.
Income Taxes —- In the preparation of our consolidated financial statements, management calculatesthe calculation of income taxes by management is based upon the estimated effective rate applicable to operating results for the full fiscal year. This includes estimating the current tax liability as well as assessing differences resulting from different treatment of items for tax and book accounting purposes. These differencesDifferences that are temporary in nature result in deferred tax assets and liabilities, which are recorded on the balance sheet. Thesesheet, while the differences that are permanent in nature impact the income tax expense recorded on the income statement and impact the effective tax rate for the fiscal year. The deferred tax assets and liabilities are analyzed regularly and management assesses the likelihood that deferred tax assets will be recovered from future taxable income. We record any interest and penalties related to income taxes as income tax expense in the statements of income.
The effect of income tax positions are recognized only if those positions are more likely than not of being sustained. Changes in recognition or measurement are made as facts and circumstances change.
Stock-Based Compensation —- We account for stock-based compensation on a fair value basis. The estimated grant date fair value of each stock-based award is recognized in expense over the requisite service period (generally the vesting period). The estimated fair value of each option is calculated using the Black-Scholes option-pricing model. Non-vested share awards are recorded as compensation expense over the requisite service periods based on the market value on the date of grant.
Earnings Per Share —- Basic earnings per share (“EPS”) are computed by dividing net income by the weighted-average number of common shares outstanding. Diluted EPS are computed by dividing net income by the weighted-average number of common shares outstanding including the incremental shares assumed to be issued upon the exercise of stock options and the incremental shares assumed to be issued as performance units and restricted stock. Basic and diluted EPS were calculated using the following: | | | | | | | | | | | | |
| | | April 1, 2012 | | | April 3, 2011 | | | March 28, 2010 | |
Weighted average common shares outstanding — basic | | | 10,339,391 | | | | 10,260,135 | | | | 10,250,978 | |
Dilutive impact of stock options, performance units, and restricted stock | | | 69,182 | | | | 92,498 | | | | 32,015 | |
| | | | | | | | | | | | |
Weighted average common shares outstanding — diluted | | | 10,408,573 | | | | 10,352,633 | | | | 10,282,993 | |
| | | | | | | | | | | | |
|
| | | | | | | | | |
| | | March 30, 2014 | | March 31, 2013 | | April 1, 2012 |
| Weighted average common shares outstanding — basic | | 10,544,467 |
| | 10,464,820 |
| | 10,339,391 |
|
| Dilutive impact of stock performance units, restricted stock, and stock options | | 55,288 |
| | 76,322 |
| | 69,182 |
|
| Weighted average common shares outstanding — diluted | | 10,599,755 |
| | 10,541,142 |
| | 10,408,573 |
|
There were no shares or stock options excluded from the calculation of weighted average common shares for diluted EPS for fiscal
20122014, 2013 or
fiscal 2011. Stock options totaling 70,665 in fiscal 2010 have been excluded from the calculation of diluted EPS because the effect of including the shares would be anti-dilutive.2012.
Derivative Instruments and Hedging Activities —- We do not have any freestanding or embedded derivatives and it is our policypractice to not enter into contracts that contain them.Recently Issued Accounting Pronouncements —
Intangibles – Goodwill and Other — In September 2011, the FASB issued Accounting Standards Update (“ASU”) No. 2011-08, “Testing Goodwill for Impairment” which amended the guidance on goodwill impairment testing to allow companies to first assess qualitative factors to determine whether it is necessary to perform the two-step quantitative goodwill impairment test. If, as a result of the qualitative assessment, an entity determines that it is more-likely-than-not that the fair value of a reporting unit is less than its carrying amount,
HAWKINS, INC.
NOTES TO CONSOLIDATED FINANCIAL STATEMENTS — (Continued)
the quantitative impairment test is required. Otherwise, no further testing is required. The amendment is effective for fiscal years beginning after December 15, 2011, which is our fiscal year 2013, but early adoption is permitted. We intend to adopt the amendment in fiscal 2013 and do not expect it to materially affect our financial position or results of operations.
Multiemployer Pension Plans —In September 2011, FASB issued ASU No. 2011-09, “Disclosures about an Employer’s Participation in a Multiemployer Plan”, to require expanded disclosures for entities participating in multiemployer plans. The expanded disclosures are designed to assist financial statement users in assessing the potential impact of an entity’s participation in multiemployer plans on future cash flow. This guidance is effective for annual reporting periods ending after December 15, 2011. We adopted this ASU during fiscal 2012. This ASU does not change the accounting for an employer’s participation in a multiemployer plan. See Note 8 — Profit Sharing, Employee Stock Ownership and Employee Stock Purchase Plans for disclosures related to this ASU.
Note 2 — Business Combinations
In the fourth quarter
Acquisition of fiscal 2011, we completed the acquisition of the assets of VertexAdvance Chemical Corporation, Novel Wash Co.Solutions, Inc. and R.H.A. Corporation, (collectively, “Vertex”), pursuant to an Asset Purchase Agreement dated as of January 10, 2011 (the “Asset Purchase Agreement”). As provided in the Asset Purchase Agreement,: On October 1, 2013, we acquired substantially all of the assets used in Vertex’s business, which is primarilyof Advance Chemical Solutions, Inc. (“ACS”), under the manufactureterms of an asset purchase agreement with ACS and distribution of sodium hypochlorite and the distribution of caustic soda, hydrochloric acid and related products.its shareholders. We paid $2.4 million in cash, and may be obligated to pay an aggregate of $25.5$0.5 million at closingin additional consideration to ACS over the next three years. The amount of such additional payments will be based on the achievement of certain financial performance targets for each of the next three years. Costs associated with this transaction were not material to our company and assumed certain liabilities of Vertex. The purchase price was revised to $27.2 millionwere expensed as provided in the Asset Purchase Agreement to reflect a final working capital adjustment of $1.7 million, which was paid in early fiscal 2012. In connection with the acquisition we incurred acquisition related costs during fiscal 2011 of $0.7 million, which were recorded as selling, general and administrative expenses in the Consolidated Statements of Income.incurred.
The acquisition has been accounted for under the acquisition method of accounting,
in accordance with ASC Topic 805,Business Combinations. Under the acquisition method of accounting,under which the total estimated purchase price is allocated to the net tangible and intangible assets of
VertexACS acquired in connection with the acquisition, based on their estimated fair values.
The allocation
In connection with this acquisition, we estimated the fair value of the
purchase pricefuture contingent consideration payable and recorded $0.4 million for such consideration on our balance sheet. We have determined that this liability is a Level 3 fair value measurement within the FASB’s fair value hierarchy, and such liability is adjusted to
assets acquiredfair value at each reporting date, with the adjustment reflected in selling, general and
liabilities assumed follows: | | | | |
| (In thousands) | | Amount | |
Accounts receivable | | $ | 4,975 | |
Inventories | | | 4,486 | |
Other current assets | | | 198 | |
Property, plant and equipment | | | 8,991 | |
Goodwill | | | 5,291 | |
Intangibles | | | 5,490 | |
Accounts payable | | | (2,012 | ) |
Accrued employee benefits | | | (210 | ) |
| | | | |
Total purchase price | | $ | 27,209 | |
| | | | |
administrative expenses. The fair value adjustments recorded during the twelve months ended March 30, 2014 were immaterial.
NOTES TO CONSOLIDATED FINANCIAL STATEMENTS — (Continued)The allocation of
We estimated the
purchase price tofair value of the assets acquired and liabilities assumed
resulted in the recognition of the following intangible assets: | | | | | | | | |
| (In thousands) | | Amount | | | Weighted
Average Life | |
Customer relationships | | $ | 3,450 | | | | 20 years | |
Trademark | | | 1,240 | | | | 10 years | |
Carrier relationships | | | 800 | | | | 10 years | |
| | | | | | | | |
Intangible assets acquired | | $ | 5,490 | | | | | |
| | | | | | | | |
The fair value of the identified intangible assets was estimated using an income approach. Under the income approach an intangible asset’s fair value is equal to the present value of future economic benefits to be derived from ownership$2.8 million using a discounted cash flow analysis (income approach). Fair values of an asset. Indicationsacquired assets and liabilities include: $0.4 million of value are developed by discounting future net cash flowsworking capital and fixed assets; $1.5 million to their present value at market-based rates of return.
intangible assets; and $0.9 million to goodwill. The goodwill recognized as a result of the VertexACS acquisition is primarily attributable to expected synergies, as well as Vertex’s assembled work force.
Vertex operatingsynergies. Such goodwill is deductible for tax purposes.
ACS had revenues of approximately $4 million for the 12 months ended September 30, 2013. The results
of its operations since the acquisition date, and the assets including the goodwill associated with this acquisition, are included in our
Consolidated Statements of Income in our Industrial segment from the date of acquisition.The following unaudited pro forma condensed consolidated financial results of operations for the year ended April 3, 2011 is presented as if the Vertex acquisition had been completed at the beginning of the period. The amounts shown for the year ended April 1, 2012 are based on actual results for the period:
| | | | | | | | |
| | | Years Ended | |
| | | April 1,
2012 | | | April 3,
2011 | |
| (In thousands, except share and per-share data) | | |
Pro forma net sales | | $ | 343,834 | | | $ | 329,653 | |
Pro forma net earnings | | | 22,685 | | | | 21,888 | |
Pro forma earnings per share: | | | | | | | | |
Basic | | $ | 2.19 | | | $ | 2.13 | |
Diluted | | | 2.18 | | | | 2.11 | |
Weighted average common shares outstanding: | | | | | | | | |
Basic | | | 10,339,391 | | | | 10,260,135 | |
Diluted | | | 10,408,573 | | | | 10,352,633 | |
These unaudited pro forma condensed consolidated financial results have been prepared for illustrative purposes only and do not purport to be indicative of the results of operations that actually would have resulted had the acquisition occurred on the first day of each fiscal period presented, or of future results of the consolidated entities. The unaudited pro forma condensed consolidated financial information does not reflect any operating efficiencies and cost savings that may have been realized from the integration of the acquisition.
HAWKINS, INC.
NOTES TO CONSOLIDATED FINANCIAL STATEMENTS — (Continued)
Water Treatment segment.
Note 3 — Cash and Cash Equivalents and Investments
The following table presents information about our financial assets and liabilities that are measured at fair value on a recurring basis as of April 1, 2012March 30, 2014 and April 3, 2011,March 31, 2013, and indicates the fair value hierarchy of the valuation techniques utilized to determine such fair value. | | | | | | | | | | | | | | | | |
Description | | April 1,
2012 | | | Level 1 | | | Level 2 | | | Level 3 | |
| (In thousands) | | | | |
Assets: | | | | | | | | | | | | | | | | |
Cash | | $ | 28,006 | | | $ | 28,006 | | | $ | — | | | $ | — | |
Certificates of deposit | | | 17,349 | | | | — | | | | 17,349 | | | | — | |
Money market securities | | | 560 | | | | 560 | | | | — | | | | — | |
| | | | | | | | | | | | | | | | |
Description | | April 3,
2011 | | | Level 1 | | | Level 2 | | | Level 3 | |
| (In thousands) | | | | |
Assets: | | | | | | | | | | | | | | | | |
Cash | | $ | 18,485 | | | $ | 18,485 | | | $ | — | | | $ | — | |
Certificates of deposit | | | 18,461 | | | | — | | | | 18,461 | | | | — | |
Money market securities | | | 455 | | | | 455 | | | | — | | | | — | |
|
| | | | | | | | | | | | | | | | |
| Description | | March 30, 2014 | | Level 1 | | Level 2 | | Level 3 |
| (In thousands) | |
| Assets: | | | | | | | | |
| Cash | | $ | 33,486 |
| | $ | 33,486 |
| | $ | — |
| | $ | — |
|
| Certificates of deposit | | 24,437 |
| | — |
| | 24,437 |
| | — |
|
| Municipal Bonds | | 5,258 |
| | — |
| | 5,258 |
| | — |
|
| | | | | | | | | |
| Description | | March 31, 2013 | | Level 1 | | Level 2 | | Level 3 |
| (In thousands) | |
| Assets: | | | | | | | | |
| Cash | | $ | 28,715 |
| | $ | 28,715 |
| | $ | — |
| | $ | — |
|
| Certificates of deposit | | 21,222 |
| | — |
| | 21,222 |
| | — |
|
Our financial assets that are measured at fair value on a recurring basis are certificates of deposit (“CD’s”),CD’s and municipal bonds, with maturities ranging from three months to twothree years which fall within valuation technique Level 2. The CD’s and municipal bonds are classified as investments in current assets and noncurrent assets on the Consolidated Balance Sheets.condensed consolidated balance sheets. As of April 1, 2012,March 30, 2014, the CD’s in current assets haveand municipal bonds had a fair value of $12.2$13.8 million in current assets and$15.9 million in noncurrent assets, the CD’s have a fair value of $5.1 million.assets.
The carrying value of cash and cash equivalents accounts approximates fair value, as maturities are three months or less. We did not have any financial liability instruments subject to recurring fair value measurements as of April 1, 2012 and April 3, 2011.less
. The contractual maturities of available-for-sale securities at
April 1, 2012March 30, 2014 and March 31, 2013 are shown in the table
below. | | | | | | | | | | | | |
| (In thousands) | | Amortized
Cost | | | Fair Value | | | Unrealized
Gain/(loss) | |
Within one year | | $ | 12,205 | | | $ | 12,210 | | | $ | 5 | |
Between one and two years | | | 5,145 | | | | 5,139 | | | | (6 | ) |
| | | | | | | | | | | | |
Total available-for-sale securities | | $ | 17,350 | | | $ | 17,349 | | | $ | (1 | ) |
| | | | | | | | | | | | |
The contractual maturities of available-for-sale securities at April 3, 2011 are shown in the table below.
| | | | | | | | | | | | |
| (In thousands) | | Amortized
Cost | | | Fair Value | | | Unrealized
Gain/(loss) | |
Within one year | | $ | 15,270 | | | $ | 15,286 | | | $ | 16 | |
Between one and two years | | | 3,185 | | | | 3,175 | | | | (10 | ) |
| | | | | | | | | | | | |
Total available-for-sale securities | | $ | 18,455 | | | $ | 18,461 | | | $ | 6 | |
| | | | | | | | | | | | |
below:
|
| | | | | | | | | | | | | | | | | | | | | | | | |
| | March 30, 2014 | | March 31, 2013 |
| (In thousands) | | Amortized Cost | | Fair Value | | Unrealized Gain/(loss) | | Amortized Cost | | Fair Value | | Unrealized Gain/(loss) |
| Within one year | | $ | 13,864 |
| | $ | 13,843 |
| | $ | (21 | ) | | $ | 15,615 |
| | $ | 15,625 |
| | $ | 10 |
|
| Between one and three years | | 15,890 |
| | 15,852 |
| | (38 | ) | | 5,590 |
| | 5,597 |
| | 7 |
|
| Total available-for-sale securities | | $ | 29,754 |
| | $ | 29,695 |
| | $ | (59 | ) | | $ | 21,205 |
| | $ | 21,222 |
| | $ | 17 |
|
Realized gains and losses were not material for fiscal
2012, fiscal 20112014, 2013 and
fiscal 2010.2012.
Note 4 — Inventories
Inventories at March 30, 2014 and March 31, 2013 consisted of the following:
|
| | | | | | | | |
| | | 2014 | | 2013 |
| (In thousands) | | | | |
| Inventory (FIFO basis) | | $ | 31,344 |
| | $ | 35,281 |
|
| LIFO reserve | | (5,152 | ) | | (7,073 | ) |
| Net inventory | | $ | 26,192 |
| | $ | 28,208 |
|
NOTES TO CONSOLIDATED FINANCIAL STATEMENTS — (Continued)
Note 4 — InventoriesInventories at April 1, 2012 and April 3, 2011 consisted of the following:
| | | | | | | | |
| | | 2012 | | | 2011 | |
| (In thousands) | | | | | | |
Finished goods (FIFO basis) | | $ | 35,072 | | | $ | 35,071 | |
LIFO reserve | | | (7,439 | ) | | | (5,854 | ) |
| | | | | | | | |
Net inventory | | $ | 27,633 | | | $ | 29,217 | |
| | | | | | | | |
The FIFO value of inventories accounted for under the LIFO method were $30.6was $28.5 million at March 30, 2014 and $30.3 million at April 1, 2012 and $28.6 million at April 3, 2011.March 31, 2013. The remainder of the inventory was valued and accounted for under the FIFO method.
We increaseddecreased the LIFO reserve by $1.6$1.9 million in fiscal 20122014 and $0.4 million in fiscal 2013 due primarily to the volume and mixlower levels of commodity chemicals in inventory at the end of the year. In fiscal 2011 we increased the LIFO reserve by $3.9 million due primarily to rising inventory costs, as well as higher inventory volumes at the end of fiscal 2011. Note 5 — Goodwill and Other Identifiable Intangible Assets
The changes in the carrying amount of goodwill were as follows:
| | | | |
| (In thousands) | | Amount | |
Balance as of March 28, 2010 | | $ | 1,204 | |
Vertex acquisition | | | 5,027 | |
| | | | |
Balance as of April 3, 2011 | | | 6,231 | |
Fiscal 2012 adjustment | | | 264 | |
| | | | |
Balance as of April 1, 2012 | | $ | 6,495 | |
| | | | |
|
| | | |
| (In thousands) | Amount |
| Balance as of April 1, 2012 | $ | 6,495 |
|
| Fiscal 2013 activity | — |
|
| | |
| Balance as of March 31, 2013 | 6,495 |
|
| Fiscal 2014 activity (ACS Acquisition) | 897 |
|
| | |
| Balance as of March 30, 2014 | $ | 7,392 |
|
| | |
Through fiscal 2013, all of our goodwill was related to our Industrial operating segment. The increase in goodwill during fiscal
20122014 relates to the
finalizationacquisition of
the determination of the fair value of inventory acquiredACS, and is recorded as part of
the acquisition of Vertex.Aour Water Treatment segment.
The following is a summary of our intangible assets as of
April 1, 2012March 30, 2014 and
April 3, 2011 were as follows: | | | | | | | | | | | | |
| | | 2012 | |
| | | Gross Carrying
Amount | | | Accumulated
Amortization | | | Net | |
| (In thousands) | | | | | | | | | |
Finite-life intangible assets: | | | | | | | | | | | | |
Customer relationships | | $ | 5,508 | | | $ | (706 | ) | | $ | 4,802 | |
Trademark | | | 1,240 | | | | (150 | ) | | | 1,090 | |
Trade secrets | | | 862 | | | | (521 | ) | | | 341 | |
Carrier relationships | | | 800 | | | | (96 | ) | | | 704 | |
Other finite-life intangible assets | | | 339 | | | | (317 | ) | | | 22 | |
| | | | | | | | | | | | |
Total finite-life intangible assets | | | 8,749 | | | | (1,790 | ) | | | 6,959 | |
Indefinite-life intangible assets | | | 1,227 | | | | — | | | | 1,227 | |
| | | | | | | | | | | | |
Total intangible assets, net | | $ | 9,976 | | | $ | (1,790 | ) | | $ | 8,186 | |
| | | | | | | | | | | | |
March 31, 2013:
|
| | | | | | | | | | | | | | | | | | | | | | | | |
| | | 2014 | | 2013 |
| | | Gross Amount | | Accumulated Amortization | | Net | | Gross Amount | | Accumulated Amortization | | Net |
| (In thousands) | | | | | | | | | | | | |
| Finite-life intangible assets: | | | | | | | | | | | | |
| Customer relationships | | $ | 6,913 |
| | $ | (1,292 | ) | | $ | 5,621 |
| | $ | 5,508 |
| | $ | (981 | ) | | $ | 4,527 |
|
| Trademark | | 1,335 |
| | (421 | ) | | 914 |
| | 1,240 |
| | (274 | ) | | 966 |
|
| Trade secrets | | 962 |
| | (768 | ) | | 194 |
| | 962 |
| | (640 | ) | | 322 |
|
| Carrier relationships | | 800 |
| | (257 | ) | | 543 |
| | 800 |
| | (177 | ) | | 623 |
|
| Other finite-life intangible assets | | 341 |
| | (331 | ) | | 10 |
| | 339 |
| | (326 | ) | | 13 |
|
| Total finite-life intangible assets | | 10,351 |
| | (3,069 | ) | | 7,282 |
| | 8,849 |
| | (2,398 | ) | | 6,451 |
|
| Indefinite-life intangible assets | | 1,227 |
| | — |
| | 1,227 |
| | 1,227 |
| | — |
| | 1,227 |
|
| Total intangible assets, net | | $ | 11,578 |
| | $ | (3,069 | ) | | $ | 8,509 |
| | $ | 10,076 |
| | $ | (2,398 | ) | | $ | 7,678 |
|
HAWKINS, INC.NOTES TO CONSOLIDATED FINANCIAL STATEMENTS — (Continued)
| | | | | | | | | | | | |
| | | 2011 | |
| | | Gross Carrying
Amount | | | Accumulated
Amortization | | | Net | |
| (In thousands) | | | | | | | | | |
Finite-life intangible assets: | | | | | | | | | | | | |
Customer relationships | | $ | 5,508 | | | $ | (423 | ) | | $ | 5,085 | |
Trademark | | | 1,240 | | | | (26 | ) | | | 1,214 | |
Trade secrets | | | 862 | | | | (413 | ) | | | 449 | |
Carrier relationships | | | 800 | | | | (18 | ) | | | 782 | |
Other finite-life intangible assets | | | 339 | | | | (285 | ) | | | 54 | |
| | | | | | | | | | | | |
Total finite-life intangible assets | | | 8,749 | | | | (1,165 | ) | | | 7,584 | |
Indefinite-life intangible assets | | | 1,227 | | | | — | | | | 1,227 | |
| | | | | | | | | | | | |
Total intangible assets, net | | $ | 9,976 | | | $ | (1,165 | ) | | $ | 8,811 | |
| | | | | | | | | | | | |
Intangible asset amortization expense was $0.6$0.7 million during fiscal 2012, $0.32014, $0.6 million during fiscal 2011,2013, and $0.2$0.6 million during fiscal 2010.
2012.
The estimated future amortization expense for identifiable intangible assets during the next five years is as follows:
| | | | | | | | | | | | | | | | | | | | |
| (In thousands) | | 2013 | | | 2014 | | | 2015 | | | 2016 | | | 2017 | |
Estimated amortization expense | | $ | 596 | | | $ | 592 | | | $ | 592 | | | $ | 502 | | | $ | 479 | |
|
| | | | | | | | | | | | | | | | | | | | |
| (In thousands) | | 2015 | | 2016 | | 2017 | | 2018 | | 2019 |
| Estimated amortization expense | | $ | 730 |
| | $ | 616 |
| | $ | 570 |
| | $ | 558 |
| | $ | 550 |
|
Note 6 — Accumulated Other Comprehensive Income (Loss)
Components of accumulated other comprehensive income (loss)
, on our balance sheet, net of tax, were as follows:
| | | | | | | | | | | | |
| (In thousands) | | 2012 | | | 2011 | | | 2010 | |
Unrealized gain (loss) on: | | | | | | | | | | | | |
Available-for-sale investments | | $ | (4 | ) | | $ | 3 | | | $ | 66 | |
Post-retirement plan liability adjustments | | | 26 | | | | (148 | ) | | | (29 | ) |
| | | | | | | | | | | | |
Accumulated other comprehensive income (loss) | | $ | 22 | | | $ | (145 | ) | | $ | 37 | |
| | | | | | | | | | | | |
|
| | | | | | | | |
| (In thousands) | | 2014 | | 2013 |
| Unrealized gain (loss) on: | | | | |
| Available-for-sale investments | | $ | (36 | ) | | $ | 11 |
|
| Post-retirement plan liability adjustments | | (8 | ) | | (117 | ) |
| Accumulated other comprehensive loss | | $ | (44 | ) | | $ | (106 | ) |
HAWKINS, INC.
NOTES TO CONSOLIDATED FINANCIAL STATEMENTS — (Continued)
Note 7 — Share-Based Compensation
Stock Option Awards. Our Board of Directors has approved a long-term incentive equity compensation arrangement for our executive officers. This long-term incentive arrangement provides for the grant of nonqualified stock options that vest at the end of a three-year period and expire no later than 10 years after the grant date. We used the Black-Scholes valuation model to estimate the fair value of the options at grant date based on the following assumptions: | | | | | | | | |
| | | Fiscal 2010 grant | | | Fiscal 2009 grant | |
Dividend yield | | | 2.5 | % | | | 3.2 | % |
Volatility | | | 31.4 | % | | | 28.0 | % |
Risk-free interest rate | | | 2.1 | % | | | 3.0 | % |
Expected life in years | | | 4 | | | | 4 | |
HAWKINS, INC.
NOTES TO CONSOLIDATED FINANCIAL STATEMENTS — (Continued)
Volatility was calculated using the past four years of historical stock prices of our common stock. The expected life is estimated based on expected future trends and the terms and vesting periods of the options granted. The risk-free interest rate is an interpolation of the relevant U.S. Treasury Bond Rate as of the grant date.
The following table represents the stock option activity for fiscal 2012 and fiscal 2011:
| | | | | | | | | | | | | | | | | | | | | | | | |
| | | 2012 | |
| | | Total Outstanding | | | Exercisable | |
| (In thousand, except share data) | | Shares | | | Weighted-
Average
Exercise
Price | | | Aggregate
Intrinsic
Value | | | Shares | | | Weighted-
Average
Exercise
Price | | | Aggregate
Intrinsic
Value | |
Outstanding at beginning of year | | | 131,997 | | | $ | 17.82 | | | $ | 4,908 | | | | 66,666 | | | $ | 17.67 | | | $ | 2,482 | |
Granted | | | — | | | | — | | | | | | | | — | | | | — | | | | | |
Vested | | | — | | | | — | | | | | | | | 27,999 | | | | 15.43 | | | | | |
Exercised | | | (85,332 | ) | | | 17.18 | | | | | | | | (85,332 | ) | | | 17.18 | | | | | |
Forfeited or expired | | | — | | | | — | | | | | | | | | | | | | | | | | |
| | | | | | | | | | | | | | | | | | | | | | | | |
Outstanding at end of year | | | 46,665 | | | $ | 19.01 | | | $ | 1,547 | | | | 9,333 | | | $ | 15.43 | | | $ | 320 | |
| | | | | | | | | | | | | | | | | | | | | | | | |
| | | | | | | | | | | | | | | | | | | | | | | | |
| | | 2011 | |
| | | Total Outstanding | | | Exercisable | |
| (In thousand, except share data) | | Shares | | | Weighted-
Average
Exercise
Price | | | Aggregate
Intrinsic
Value | | | Shares | | | Weighted-
Average
Exercise
Price | | | Aggregate
Intrinsic
Value | |
Outstanding at beginning of year | | | 131,997 | | | $ | 17.82 | | | $ | 2,607 | | | | — | | | $ | — | | | $ | — | |
Granted | | | — | | | | — | | | | | | | | — | | | | — | | | | | |
Vested | | | — | | | | — | | | | | | | | 66,666 | | | | 17.67 | | | | | |
Exercised | | | — | | | | — | | | | | | | | — | | | | — | | | | | |
Forfeited or expired | | | — | | | | — | | | | | | | | — | | | | — | | | | | |
| | | | | | | | | | | | | | | | | | | | | | | | |
Outstanding at end of year | | | 131,997 | | | $ | 17.82 | | | $ | 4,908 | | | | 66,666 | | | $ | 17.67 | | | $ | 2,482 | |
| | | | | | | | | | | | | | | | | | | | | | | | |
The weighted average grant date fair value of options was estimated to be $4.33 and $2.95 for options granted in fiscal 2010 and fiscal 2009, respectively. The weighted average remaining life of all outstanding and exercisable options is 6.1 years.
Annual expense related to the value of stock options was $0.1 million for fiscal 2012, $0.2 million for fiscal 2011 and $0.1 million for fiscal 2010, substantially all of which was recorded in SG&A expense in the Consolidated Statements of Income. Options awarded to John Hawkins, former Chief Executive Officer, became fully vested and exercisable upon his death in March 2011, resulting in the acceleration of expense of $0.1 million. The total fair value of options vested during fiscal 2012 was $0.1 million compared to $0.2 million during fiscal 2011. Unrecognized compensation expense related to outstanding stock options as of April 1, 2012 was not material and is expected to be recognized over a weighted average period of 0.2 years.
Performance-Based Restricted Stock Units. Our Board of Directors has approved a performance-based equity compensation arrangement for our executive officers. This performance-based arrangement provides for the grant of performance-based restricted stock units that represent a possible future issuance of restricted shares
HAWKINS, INC.
NOTES TO CONSOLIDATED FINANCIAL STATEMENTS — (Continued)
of our common stock based on our pre-tax income target for the applicable fiscal year. The actual number of restricted shares to be issued to each executive officer will be determined when our final financial information becomes available after the applicable fiscal year and will be between zero shares and 43,02239,833 shares in the aggregate for fiscal 2012.2014. The restricted shares issued will fully vest two years after the last day of the fiscal year on which the performance is based. We are recording the compensation expense for the outstanding performance share units and then-converted restricted stock over the life of the awards.
Performance-based restricted stock units were awarded to our executive officers on June 8, 2011, June 2, 2010 and June 10, 2009 under this arrangement.
The following table represents the restricted stock activity for fiscal 2014:
|
| | | | | | | |
| | | Shares | | Weighted- Average Grant Date Fair Value |
| Outstanding at beginning of year | | 63,244 |
| | $ | 34.26 |
|
| Granted | | 28,648 |
| | 40.25 |
|
| Vested | | (36,182 | ) | | 35.20 |
|
| Forfeited or expired | | (3,606 | ) | | 33.01 |
|
| Outstanding at end of year | | 52,104 |
| | $ | 36.99 |
|
The weighted average grant date fair value of restricted shares issued in fiscal 2014, 2013 and 2012 was $40.25, $33.01, and fiscal 2011: | | | | | | | | | | | | | | | | |
| | | 2012 | | | 2011 | |
| | | Shares | | | Weighted-
Average Grant
Date Fair Value | | | Shares | | | Weighted-
Average Grant
Date Fair Value | |
Outstanding at beginning of year | | | 11,667 | | | $ | 25.81 | | | | 23,000 | | | $ | 19.90 | |
Granted | | | 33,321 | | | | 35.39 | | | | 41,320 | | | | 30.02 | |
Vested | | | (11,667 | ) | | | 25.81 | | | | (52,653 | ) | | | 26.53 | |
Forfeited or expired | | | — | | | | — | | | | — | | | | — | |
| | | | | | | | | | | | | | | | |
Outstanding at end of year | | | 33,321 | | | $ | 35.39 | | | | 11,667 | | | $ | 25.81 | |
| | | | | | | | | | | | | | | | |
related to the shares issuedon performance-based restricted stock of approximately $0.8 million for fiscal 2010 and fiscal 2011 and the potential issuance of shares2014, $1.1 million for fiscal 2012 of approximately $0.82013 and $0.8 million for fiscal 2012, $1.6 million for fiscal 2011 and $0.4 million for fiscal 2010, substantially all of which was recorded in selling, general and administrative (“SG&A&A”) expense in the Consolidated Statements of Income. The performance-based restricted stock units previously awarded to John Hawkins, totaling 39,820 shares, became fully vested and payable upon his death in March 2011, resulting in the acceleration of compensation expense of $0.4 million. The total fair value of performance-based restricted stock units vested in fiscal 20122014 was $0.3$1.3 million compared to $1.4zero in fiscal 2013 and $0.3 million in fiscal 2011.2012.
Until the performance-based restricted stock units result in the issuance of restricted stock, the amount of expense recorded each period is dependent upon our estimate of the number of shares that will ultimately be issued and our then current common stock price. Upon issuance of restricted stock, we record compensation expense over the remaining vesting period using the award date closing price, which was $25.81 per share on June 2, 2010 and $35.39 per share on June 8, 2011.price. Unrecognized compensation expense related to non-vested restricted stock and non-vested restricted share units as of April 1, 2012March 30, 2014 was $1.1$1.0 million and is expected to be recognized over a weighted average period of 1.41.0 years.In conjunction with the vesting of restricted stock held by certain of our executive officers, 3,980 shares were forfeited during fiscal 2012 to cover the executive officers statutory minimum income tax withholding.
The benefits of tax deductions in excess of recognized compensation costs (excess tax benefits)from share-based compensation are recorded as a change in additional paid inpaid-in capital rather than a deduction of taxes paid. The amount of excess tax benefit (expense) recognized and recorded in additional paid inpaid-in capital resulting from share-based compensation cost was $0.7$(0.2) million in fiscal 20122014, $0.5 million in fiscal 2013 and $0.3$0.7 million during fiscal 2011. in 2012.
Restricted Stock Awards. As part of their retainer, the Board of Directors receives restricted stock for their Board services. The restricted stock awards are expensed over the requisite vesting period, which begins on theHAWKINS, INC.
NOTES TO CONSOLIDATED FINANCIAL STATEMENTS — (Continued)
date of issuance and ends on the date of the next Annual Meeting of Shareholders, based on the market value on the date of grant. The following table represents the Board’s restricted stock activity for fiscal 2012 and fiscal 2011:
| | | | | | | | | | | | | | | | |
| | | 2012 | | | 2011 | |
| | | Shares | | | Weighted-
Average Grant
Date Fair Value | | | Shares | | | Weighted-
Average Grant
Date Fair Value | |
Outstanding at beginning of period | | | 6,996 | | | $ | 30.00 | | | | 6,000 | | | $ | 18.68 | |
Granted | | | 6,120 | | | | 34.31 | | | | 6,966 | | | | 30.00 | |
Vested | | | (6,996 | ) | | | 30.00 | | | | (6,000 | ) | | | 18.68 | |
Forfeited or expired | | | — | | | | — | | | | — | | | | — | |
| | | | | | | | | | | | | | | | |
Outstanding at end of period | | | 6,120 | | | $ | 34.31 | | | | 6,966 | | | $ | 30.00 | |
| | | | | | | | | | | | | | | | |
2014:
|
| | | | | | | |
| | | Shares | | Weighted- Average Grant Date Fair Value |
| Outstanding at beginning of period | | 5,724 |
| | $ | 36.65 |
|
| Granted | | 6,055 |
| | 40.42 |
|
| Vested | | (5,724 | ) | | 36.65 |
|
| Forfeited or expired | | — |
| | — |
|
| Outstanding at end of period | | 6,055 |
| | $ | 40.42 |
|
Annual expense related to the value of restricted stock was $0.2$0.2 million for each of fiscal 20122014, 2013 and $0.2 million for fiscal 2011 and $0.1 million for fiscal 2010,2012, all of which was recorded in SG&A expense in the Consolidated Statements of Income. Unrecognized compensation expense related to non-vested
HAWKINS, INC.
NOTES TO CONSOLIDATED FINANCIAL STATEMENTS — (Continued)
restricted stock awards as of April 1, 2012March 30, 2014 was $0.1$0.1 million and is expected to be recognized over a weighted average period of 0.3 years.
Stock Option Awards. Our Board of Directors (the “Board”) previously approved a long-term incentive equity compensation arrangement for our executive officers that provided for the grant of non-qualified stock options that vested at the end of a three-year period, although no stock options have been granted under this arrangement since the fiscal year ended March 28, 2010. As of March 30, 2014 we had 9,333 stock options outstanding and exercisable at a weighted average exercise price of $19.90. No expense was recorded in fiscal 2014 or 2013 related to the value of stock options. Expense related to the value of stock options was $0.1 million for fiscal year 2012, substantially all of which was recorded in SG&A expense in the Consolidated Statements of Income. The weighted average remaining life of all outstanding and exercisable options as of March 30, 2014 is 5.2 years years.
The following table represents the stock option activity for fiscal 2014:
|
| | | | | | | | | | | | | | | | | | | | | | |
| | | Total Outstanding | | Exercisable |
| (In thousands, except share data) | | Shares | | Weighted-
Average
Exercise
Price | | Aggregate
Intrinsic
Value | | Shares | | Weighted-
Average
Exercise
Price | | Aggregate
Intrinsic
Value |
| Outstanding at beginning of year | | 18,666 |
| | $ | 19.90 |
| | $ | 665 |
| | 18,666 |
| | $ | 19.90 |
| | $ | 665 |
|
| Granted | | — |
| | — |
| | | | — |
| | — |
| | |
| Vested | | — |
| | — |
| | | | — |
| | — |
| | |
| Exercised | | (9,333 | ) | | 19.90 |
| | | | (9,333 | ) | | 19.90 |
| | |
| Forfeited or expired | | — |
| | — |
| | | | — |
| | — |
| | |
| Outstanding at end of year | | 9,333 |
| | $ | 19.90 |
| | $ | 297 |
| | 9,333 |
| | $ | 19.90 |
| | $ | 297 |
|
Note 8 — Profit Sharing, Employee Stock Ownership, Employee Stock Purchase and Pension Plans
Company sponsored plansEffective April 1, 2009, we converted our defined contribution pension plan covering substantially. Substantially all of our non-bargaining unit employees are eligible to participate in a company sponsored profit sharing plan. It is our policy to fund all costs accrued. Contributions are made at our discretion subject to a maximum amount allowed under the Internal Revenue Code. Our cost forBeginning in fiscal 2013, the profit sharing plan contribution level for each employee will depend upon date of hire, with those employees hired after April 1, 2012 eligible to receive a contribution that is 50% of the contribution made for employees hired on or before April 1, 2012. Our contribution to the profit sharing plan for fiscal 2014 and pension planfiscal 2013 was 15%5% of each employee’s eligible compensation in each of the fiscal years 2012, 2011 and 2010. Beginning in fiscal 2013, profit sharing plan contributions are variable and aligned with company performance with a targeted contribution of between 2.5% and 5% of an employee’s eligible compensation, depending upon date of hire.for employees hired on or before April 1, 2012. In addition to the changes in the profit sharing plan for fiscal 2013, we introduced a 401(k) plan that will allow employees to contribute pre-tax earnings up to the maximum amount allowed under the Internal Revenue Code, with an employer match of up to 5% of the employee’s eligible compensation.
Our contribution to the profit sharing plan was 15% of each employee’s eligible compensation in fiscal year 2012.
We have an employee stock ownership plan (“ESOP”) covering substantially all of our non-bargaining unit employees. Contributions are made at our discretion subject to a maximum amount allowed under the Internal Revenue Code. Our cost forBeginning in fiscal 2013, the ESOP contribution level for each employee will depend upon date of hire, with those employees hired after April 1, 2012 eligible to receive a contribution that is 50% of the contribution made for employees hired on or before April 1, 2012. Our contribution to the ESOP for fiscal 2014 and fiscal 2013 was 5% of each employee’s eligible compensation infor employees hired on or before April 1, 2012. Our contribution to the ESOP was 5% of each of the fiscal years 2012, 2011 and 2010. Beginning in fiscal 2013, ESOP contributions are variable and aligned with company performance with a targeted contribution of between 2.5% and 5% of an employee’s eligible compensation depending upon date of hire.for fiscal year 2012.
We have an employee stock purchase plan (“ESPP”) covering substantially all of our employees. The ESPP allows employees to purchase newly-issued shares of the Company’s common stock at a discount from
market, with no employee contribution match from the Company. Prior to fiscal 2012, this plan had a monthly employer match of 75% of each employee’s contribution, up to a maximum of $375 per month, with the ESPP shares of the Company purchased on the open market.
In fiscal 2012, Vertex employees participated in a 401(k) plan that included an employer match of up to 3% of the employee’s eligible compensation and a discretionary Company contribution. The total company contribution to this plan was $0.2 million.$0.2 million. Beginning in fiscal 2013, Vertex employees are included within the Company’s retirement plans outlined above. In March 2013, concurrent with our withdrawal from a multiemployer pension plan described below, we established a retirement plan and ESOP for our collective bargaining unit employees. Each of these plans is subject to a maximum amount allowed under the Internal Revenue Code. The retirement plan provides for a contribution of 5% of each employee’s eligible wages annually for employees who were eligible to enter the plan on March 1, 2013 and a contribution of 2.5% of each employee’s eligible wages annually for employees who entered the plan subsequent to March 1, 2013. Additionally, the retirement plan includes a 401(k) plan that will allow employees to contribute pre-tax earnings up to the maximum amount allowed under the Internal Revenue
NOTES TO CONSOLIDATED FINANCIAL STATEMENTS — (Continued)
Code, with an employer match of up to 5% of the employee’s eligible compensation. The ESOP provides for contributions of 5% of each employee’s eligible wages annually for employees who were eligible to enter the plan on March 1, 2013 and a contribution of 2.5% of each employee’s eligible wages annually for employees who enter the plan subsequent to March 1, 2013.
The following represents the contribution expense for the
company sponsored profit sharing, ESOP, ESPP and 401(k)
plans: | | | | | | | | | | | | |
Benefit Plan | | 2012 | | | 2011 | | | 2010 | |
| (In thousands) | | | | | | | | | |
Profit sharing | | $ | 2,616 | | | $ | 2,675 | | | $ | 2,844 | |
ESOP | | | 802 | | | | 815 | | | | 899 | |
ESPP | | | 262 | | | | 648 | | | | 650 | |
Vertex plan | | | 175 | | | | — | | | | — | |
| | | | | | | | | | | | |
Total contribution expense | | $ | 3,855 | | | $ | 4,138 | | | $ | 4,393 | |
| | | | | | | | | | | | |
plans for fiscal 2014, 2013 and 2012:
|
| | | | | | | | | | | | |
| Benefit Plan | | 2014 | | 2013 | | 2012 |
| (In thousands) | | | | | | |
| Non-bargaining unit employee plans: | | | | | | |
| Profit sharing | | $ | 1,231 |
| | $ | 1,204 |
| | $ | 2,616 |
|
| 401(K) matching contributions | | 980 |
| | 1,206 |
| | — |
|
| ESOP | | 1,231 |
| | 1,203 |
| | 802 |
|
| Vertex plan | | — |
| | — |
| | 175 |
|
| Bargaining unit employee plans | | 500 |
| | — |
| | — |
|
| ESPP - all employees | | 257 |
| | 289 |
| | 262 |
|
| Total contribution expense | | $ | 4,199 |
| | $ | 3,902 |
| | $ | 3,855 |
|
Multiemployer pension plan. We participate in a union sponsored, collectively bargained multiemployer pension plan (“Union Plan”). Contributions are determined in accordanceIn fiscal 2013, we concluded negotiations with the provisions of negotiated labor contracts and generally are based on the number of hours worked. The risks of participating in multiemployer pension plans are different from single-employer plans in the following aspects: (i) Assets contributedtwo collective bargaining units to a multiemployer plan by one employer may be used to provide benefits to employees of other participating employers; (ii) If a participating employer stops contributing to the plan, the unfunded obligations of the plan may be borne by the remaining participating employers; and (iii) if we stop participating in the multiemployer plan, we may be required to pay the plan an amount based on the underfunded status of the plan, referred to as a withdrawal liability.The Company’sdiscontinue our participation in the Central States, Southeast and Southwest Areas Pension Fund (“Central States”CSS” or “the plan”) is outlined in, a collectively bargained multiemployer pension plan, and as a result we recorded a pre-tax charge of $7.2 million (approximately $4.5 million after tax, or $0.43 per share, fully diluted). This charge represents the table below. The Pension Protection Act (“PPA”) Zone Status available in fiscal 2012discounted value of our estimated withdrawal payment obligation and fiscal 2011 is for the plan’s year ended December 31, 2010 and December 31, 2009, respectively. The zone status is based on information that we obtained from Central States and is certified by the plan’s actuary. Among other factors, plans in the red zone are generally less than 65% funded. The “FIP/RP Status Pending/Implemented” column indicates if a funding improvement plan (“FIP”) or a rehabilitation plan (“RP”) is either pending or has been implemented.
| | | | | | | | | | | | | | | | | | | | | | | | | | | | |
Pension Fund
| | Employer
Identification
Number | | | Pension
Plan
Number | | | PPA Zone Status | | | FIP/RP
Status
Pending/
Implemented | | | Surcharge
Imposed | | | Expiration Daterecorded as a charge to cost of sales in our Industrial segment.
Payment of Collective
Bargaining
Agreements | |
| | | | | |
| | | April 1,
2012 | | | April 3,
2011 | | | | |
| | | | | | |
Central States, Southeast and Southwest Areas Pension Fund
| | | 36-6044243 | | | | 001 | | | | Red | | | | Red | | | | Implemented | | | | Yes | | | | 02/28/2013 | |
Based upon the most recent information available from the trustees managing CSS, our share of the unfunded vested benefit liability for the plan was estimated towill be approximately $7.9 million if the withdrawal had occurred in calendar year 2011, an increase from an estimate of approximately $5.1 million if the withdrawal had occurred in calendar year 2009. These estimates were calculated by the trustees managing CSS. Although we believe the most recent plan data available from CSS was used in computing this 2011 estimate, the actual withdrawal liability amountmade over 20 years and is subject to change based on, among other things,a cap. At the plan’s investment returns andend of the 20-year period we will have no further liability, even if our share of the unfunded vested benefit levels, interest rates, financial difficulty of other participating employersliability had not yet been paid in full. The aggregate cash payments to be made total approximately $9.3 million, or $467,000 per year. Our payments began in the plan such as bankruptcy, and continued participation by the company and other employersthird quarter of fiscal 2014.
We made contributions to CSS of approximately $0.4 million in the plan, each of which could impact the ultimate withdrawal liability. If withdrawal liability were to be triggered, we would have the option to make payments over a period of 20 years instead of paying the withdrawal liability in a lump sum.HAWKINS, INC.
NOTES TO CONSOLIDATED FINANCIAL STATEMENTS — (Continued)
We made contribution to the plan of approximately $0.4 million in fiscal 2012, 20112013 and 2010 and expect to make contributions to the plan of approximately $0.5 million during fiscal 2013.
2012.
Note 9 — Commitments and Contingencies
Leases —We have various operating leases for trucksprimarily buildings and land and buildings on which some of our operations are located. Future minimum lease payments due under operating leases with an initial term of one year or more at April 1, 2012March 30, 2014 are as follows: | | | | | | | | | | | | | | | | | | | | | | | | |
| (In thousands) | | 2013 | | | 2014 | | | 2015 | | | 2016 | | | 2017 | | | Thereafter | |
Minimum lease payment | | $ | 709 | | | $ | 723 | | | $ | 712 | | | $ | 657 | | | $ | 598 | | | $ | 3,381 | |
|
| | | | | | | | | | | | | | | | | | | | | | | | |
| (In thousands) | | 2015 | | 2016 | | 2017 | | 2018 | | 2019 | | Thereafter |
| Minimum lease payment | | $ | 1,478 |
| | $ | 1,254 |
| | $ | 1,111 |
| | $ | 1,054 |
| | $ | 1,061 |
| | $ | 4,061 |
|
Total rental expense for the fiscal years
2014, 2013 and 2012
2011 and 2010 werewas as follows:
| | | | | | | | | | | | |
| | | 2012 | | | 2011 | | | 2010 | |
| (In thousands) | | | | | | | | | |
Minimum rentals | | $ | 617 | | | $ | 552 | | | $ | 577 | |
Contingent rentals | | | 102 | | | | 114 | | | | 102 | |
| | | | | | | | | | | | |
Total rental expense | | $ | 719 | | | $ | 666 | | | $ | 679 | |
| | | | | | | | | | | | |
|
| | | | | | | | | | | | |
| | | 2014 | | 2013 | | 2012 |
| (In thousands) | | | | | | |
| Minimum rentals | | $ | 1,223 |
| | $ | 818 |
| | $ | 617 |
|
| Contingent rentals | | 110 |
| | 110 |
| | 102 |
|
| Total rental expense | | $ | 1,333 |
| | $ | 928 |
| | $ | 719 |
|
Litigation — We- As of March 30, 2014 there were no material pending legal proceedings, other than ordinary routine litigation incidental to the business, to which we or any of our subsidiaries are a party from time to time in litigation arising in the ordinary courseor of which any of our business. To date, none ofproperty is the litigation has had a material effect on us.subject. Legal fees associated with such matters are expensed as incurred.On November 3, 2009, ICL Performance Products, LP (“ICL”),
In the first quarter of fiscal 2013, we entered into a settlement agreement with a chemical supplier to us,
filedpursuant to which we mutually resolved the previously disclosed litigation and all disputes among us. The settlement agreement provided for a
lawsuit incash payment by us to the
United States District Courtsupplier and provided that both parties enter into new contracts for the
Eastern Districtsupply by the supplier of
Missouri, asserting breach of a contract for the sale of 75% purified phosphoric acid in 2009 (the “2009 Contract”). ICL seeks to recover $7.3 million in damages and pre-judgment interest, and additionally seeks to recover its costs and attorneys’ fees. ICL also claimed that we breached a contract for the sale of 75% purified phosphoric acid in 2008 (the “2008 Contract”). ICL has since dropped its claim for breach of the 2008 Contract. We have counterclaimed against ICL alleging that ICL falsely claimed to have a shortage of raw materials that prevented it from supplying us with the contracted quantity of 75% purified phosphoric acid for 2008. We claim that ICL used this alleged shortage and the threat of discontinued shipments of 75% purified phosphoric acid to force us to pay increased prices for the remainder of 2008, and to sign the 2009 Contract. Based on this alleged conduct, we have brought four alternate causes of action including: (1) breach of contract, (2) breach of the implied covenant of good faith and fair dealing, (3) negligent misrepresentation, and (4) intentional misrepresentation. We seek to recover $1.5 million in damages, and additionally seek to recover punitive damages, pre- and post-judgment interest, and our costs and attorneys’ fees. After the completion of discovery, both parties moved for summary judgment in their favor. On February 7, 2012, the Court denied both parties’ motions for summary judgment. ICL moved for reconsideration of parts of its motion for summary judgment. On April 24, 2012, the Court granted ICL’s motion for reconsideration in part, and denied it in part. In its April 24, 2012 Memorandum and Order, the Court interpreted the meaning and effect of a specific phrase in the 2009 Contract, and concluded that, if the 2009 Contract is a legally enforceable contract, Hawkins remained obligated to purchase 50% of its requirements for 75% purified phosphoric acid from ICL in 2009. Trial is scheduled to begin on July 23, 2012. We are not able to predict the ultimate outcome of this litigation, but legal proceedings such as this can result in substantial costs and divert our management’s attention and resources, which may have a material adverse effect on our business and results of operations, including cash flows.certain
NOTES TO CONSOLIDATED FINANCIAL STATEMENTS — (Continued)
chemicals to us. Our obligations under the settlement agreement resulted in a $3.2 million charge to pre-tax income recorded in cost of sales (approximately $2.0 million or $0.19 per share, fully diluted, after tax) in the first quarter of fiscal 2013.
Asset Retirement Obligations —- We have three leases of land (two relate to Hawkins and one relates to Vertex), andwhich contain terms that state that at the end of the lease term (currently 20142023 for the Vertexone lease and 2018 for the Hawkinsother two leases if the leases are not renewed), we have a specified amount of time to remove the property and buildings. At the end of the specified amount ofthat time, anything that remains on the land becomes the property of the lessor, and the lessor has the option to either maintain the property or remove the property at our expense. We have not been able to reasonably estimate the fair value of the asset retirement obligations, primarily due to the combination of the following factors: The Hawkins leases do not expire in the near future; we have a history of extending the leases with the lessors and currently intend to do so at expiration of the lease periods; the lessors do not have a history of terminating leases with itstheir tenants; and because it is more likely than not that the buildings will have value at the end of the lease life and therefore, may not be removed by either the lessee or the lessor. We are currently in negotiations with the landlord regarding the Vertex land lease which expires in 2014 and expect to sign a long-term extension in the near future. Therefore, in accordance with ASC 410-20, “Asset Retirementaccounting guidance related to asset retirement and Environmental Obligations,”environmental obligations, we have not recorded an asset retirement obligation as of April 1, 2012.March 30, 2014. We will continue to monitor the factors surrounding the requirement to record an asset retirement obligation and will recognize the fair value of a liability in the period in which it is incurred and a reasonable estimate can be made. The provisions for income taxes for fiscal
2012, 20112014, 2013 and
20102012 are as follows:
| | | | | | | | | | | | |
| | | 2012 | | | 2011 | | | 2010 | |
| (In thousands) | | | | | | | | | |
Federal — current | | $ | 8,632 | | | $ | 9,818 | | | $ | 6,601 | |
State — current | | | 2,546 | | | | 2,531 | | | | 1,634 | |
| | | | | | | | | | | | |
Total current | | | 11,178 | | | | 12,349 | | | | 8,235 | |
Federal — deferred | | | 2,796 | | | | (69 | ) | | | 5,739 | |
State — deferred | | | 316 | | | | (299 | ) | | | 1,413 | |
| | | | | | | | | | | | |
Total deferred | | | 3,112 | | | | (368 | ) | | | 7,152 | |
| | | | | | | | | | | | |
Total provision | | $ | 14,290 | | | $ | 11,981 | | | $ | 15,387 | |
| | | | | | | | | | | | |
|
| | | | | | | | | | | | |
| | | 2014 | | 2013 | | 2012 |
| (In thousands) | | | | | | |
| Federal — current | | $ | 7,612 |
| | $ | 8,967 |
| | $ | 8,632 |
|
| State — current | | 1,255 |
| | 2,417 |
| | 2,546 |
|
| Total current | | 8,867 |
| | 11,384 |
| | 11,178 |
|
| Federal — deferred | | 676 |
| | (2,466 | ) | | 2,796 |
|
| State — deferred | | 424 |
| | (600 | ) | | 316 |
|
| Total deferred | | 1,100 |
| | (3,066 | ) | | 3,112 |
|
| Total provision | | $ | 9,967 |
| | $ | 8,318 |
| | $ | 14,290 |
|
Our effective tax rate for fiscal 2014 was reduced by a non-recurring state tax benefit of $0.4 million. During fiscal 2013, we amended previously filed U.S. Federal tax returns resulting in an increase of $0.8 million in the benefits related to the domestic manufacturing deduction and investment tax credits, which reduced our tax rate for that year. Reconciliations of the provisions for income taxes, based on income from continuing operations, to the applicable federal statutory income tax rate of 35% are listed below. | | | | | | | | | | | | |
| | | 2012 | | | 2011 | | | 2010 | |
Statutory federal income tax | | | 35.0 | % | | | 35.0 | % | | | 35.0 | % |
State income taxes, net of federal deduction | | | 5.0 | | | | 4.7 | | | | 5.0 | |
ESOP dividend deduction on allocated shares | | | (0.7 | ) | | | (1.2 | ) | | | (1.0 | ) |
Domestic production deduction | | | (0.9 | ) | | | (1.3 | ) | | | (0.6 | ) |
Other — net | | | 0.2 | | | | (0.1 | ) | | | 0.9 | |
| | | | | | | | | | | | |
Total | | | 38.6 | % | | | 37.1 | % | | | 39.3 | % |
| | | | | | | | | | | | |
|
| | | | | | | | | |
| | | 2014 | | 2013 | | 2012 |
| Statutory federal income tax | | 35.0 | % | | 35.0 | % | | 35.0 | % |
| State income taxes, net of federal deduction | | 3.2 | % | | 4.9 | % | | 5.0 | % |
| ESOP dividend deduction on allocated shares | | (0.8 | )% | | (1.0 | )% | | (0.7 | )% |
| Domestic production deduction | | (2.1 | )% | | (2.7 | )% | | (0.9 | )% |
| Impact of amended tax returns | | — | % | | (3.3 | )% | | — | % |
| Other — net | | 0.2 | % | | (0.2 | )% | | 0.2 | % |
| Total | | 35.5 | % | | 32.7 | % | | 38.6 | % |
NOTES TO CONSOLIDATED FINANCIAL STATEMENTS — (Continued)
The tax effects of items comprising our net deferred tax asset (liability) as of
April 1, 2012March 30, 2014 and
April 3, 2011March 31, 2013 are as follows:
| | | | | | | | |
| (In thousands) | | 2012 | | | 2011 | |
Deferred tax assets: | | | | | | | | |
Trade receivables | | $ | 184 | | | $ | 162 | |
Stock compensation accruals | | | 601 | | | | 490 | |
Other accruals | | | 756 | | | | 919 | |
Other | | | 82 | | | | 169 | |
| | | | | | | | |
Total deferred tax assets | | $ | 1,623 | | | $ | 1,740 | |
| | | | | | | | |
Deferred tax liabilities: | | | | | | | | |
Inventories | | $ | (3,556 | ) | | $ | (3,190 | ) |
Prepaid | | | (703 | ) | | | (283 | ) |
Excess of tax over book depreciation | | | (10,807 | ) | | | (8,762 | ) |
Amortization of intangibles | | | (149 | ) | | | — | |
| | | | | | | | |
Total deferred tax liabilities | | $ | (15,215 | ) | | $ | (12,235 | ) |
| | | | | | | | |
Net deferred tax liabilities | | $ | (13,592 | ) | | $ | (10,495 | ) |
| | | | | | | | |
|
| | | | | | | | |
| (In thousands) | | 2014 | | 2013 |
| Deferred tax assets: | | | | |
| Trade receivables | | $ | 191 |
| | $ | 188 |
|
| Stock compensation accruals | | 1,031 |
| | 776 |
|
| Pension withdrawal liability | | 2,872 |
| | 2,902 |
|
| Other | | 842 |
| | 1,100 |
|
| Total deferred tax assets | | $ | 4,936 |
| | $ | 4,966 |
|
| Deferred tax liabilities: | | | | |
| Inventories | | $ | (3,618 | ) | | $ | (3,319 | ) |
| Prepaid | | (727 | ) | | (525 | ) |
| Excess of tax over book depreciation | | (13,221 | ) | | (11,385 | ) |
| Amortization of intangibles | | (456 | ) | | (354 | ) |
| Total deferred tax liabilities | | $ | (18,022 | ) | | $ | (15,583 | ) |
| Net deferred tax liabilities | | $ | (13,086 | ) | | $ | (10,617 | ) |
As of
April 1, 2012,March 30, 2014, the Company has determined that it is more likely than not that the deferred tax assets at
April 1, 2012March 30, 2014 will be realized either through future taxable income or reversals of taxable temporary differences. As of
April 1, 2012March 30, 2014 and
April 3, 2011,March 31, 2013, there were no unrecognized tax benefits. Accordingly, a tabular reconciliation from beginning to ending periods is not provided.
We are subject to U.S. federal income tax as well as income tax of multiple state jurisdictions. The tax years
beginning with 2007 remain openprior to our fiscal year ended March 29, 2009 are closed to examination by the Internal Revenue Service, and with few exceptions, state and local income tax jurisdictions.
Note 11 — Discontinued Operations
In February
During the fiscal year ended March 29, 2009, we agreed to sell our inventory and entered into a marketing agreement regarding the business of our Pharmaceutical segment, which provided pharmaceutical chemicals to retail pharmacies and small-scale pharmaceutical manufacturers. The inventory was sold in fiscal 2010 for cash of approximately $1.8 million which approximated its carrying value. The marketing agreement provides for annual payments based on a percentage of gross profit on future sales up to a maximum of approximately $3.5 million. We have no significant remaining obligations to fulfill under the agreement. Amounts received under the marketing agreement in excess of $1.7 million, the carrying value of intangible assets related to this business at the time of sale, have been recorded as a gain on sale of discontinued operations. Through fiscal 2012, we have recorded gains of approximately $1.7 million before taxes and expect to accrue a nominal amount in fiscal 2013 which will finalize the agreement. To date, we have received $2.2 million in cash under this marketing agreement and expect to collect the remaining $1.3 million in fiscal 2013. The results of the Pharmaceutical segment have been reported as discontinued operations for all periods presented.
NOTES TO CONSOLIDATED FINANCIAL STATEMENTS — (Continued)
Note 12 — Segment Information
We have two reportable segments: Industrial and Water Treatment. The accounting policies of the segments are the same as those described in the summary of significant accounting policies. Product costs and expenses for each segment are based on actual costs incurred along with cost allocation of shared and centralized functions. We evaluate performance based on profit or loss from operations before income taxes not including nonrecurring gains and losses. Reportable segments are defined primarily by product and type of customer. Segments are responsible for the sales, marketing and development of their products and services. The segments do not have separate accounting, administration, customer service or purchasing functions. There are no intersegment sales and no operating segments have been aggregated. Given our nature, it is not practical to disclose revenues from external customers for each product or each group of similar products. No single customer’s revenues amountamounted to 10% or more of our total revenue. No single customer represents 10% or more of either of our segments’ sales. Sales are primarily within the United States and all assets are located within the United States. | | | | | | | | | | | | |
| Reportable Segments | | Industrial | | | Water
Treatment | | | Total | |
| (In thousands) | | | | | | | | | |
Fiscal Year Ended April 1, 2012: | | | | | | | | | | | | |
Sales | | $ | 251,451 | | | $ | 92,383 | | | $ | 343,834 | |
Gross profit | | | 40,357 | | | | 25,511 | | | | 65,868 | |
Operating income | | | 20,552 | | | | 14,557 | | | | 35,109 | |
| | | | | | | | | | | | |
Identifiable assets* | | $ | 129,782 | | | $ | 23,543 | | | $ | 153,325 | |
| | | | | | | | | | | | |
Fiscal Year Ended April 3, 2011: | | | | | | | | | | | | |
Sales | | $ | 208,724 | | | $ | 88,917 | | | $ | 297,641 | |
Gross profit | | | 36,938 | | | | 24,964 | | | | 61,902 | |
Operating income | | | 17,110 | | | | 14,852 | | | | 31,962 | |
| | | | | | | | | | | | |
Identifiable assets* | | $ | 121,250 | | | $ | 21,139 | | | $ | 142,389 | |
| | | | | | | | | | | | |
Fiscal Year Ended March 28, 2010: | | | | | | | | | | | | |
Sales | | $ | 174,901 | | | $ | 82,198 | | | $ | 257,099 | |
Gross profit | | | 37,288 | | | | 27,157 | | | | 64,445 | |
Operating income | | | 20,937 | | | | 17,903 | | | | 38,840 | |
| | | | | | | | | | | | |
Identifiable assets* | | $ | 79,602 | | | $ | 19,152 | | | $ | 98,754 | |
| | | | | | | | | | | | |
* | Unallocated assets consisting primarily of cash and cash equivalents, investments and prepaid expenses were $48.0 million at April 1, 2012, $41.7 million at April 3, 2011 and $60.5 million at March 28, 2010. Additionally, assets associated with the discontinued operations of the Pharmaceutical segment were $1.2 million at April 1, 2012, $0.9 million at April 3, 2011 and $1.0 million at March 28, 2010. |
|
| | | | | | | | | | | | |
| Reportable Segments | | Industrial | | Water Treatment | | Total |
| (In thousands) | | | | | | |
| Fiscal Year Ended March 30, 2014: | | | | | | |
| Sales | | $ | 244,888 |
| | $ | 103,375 |
| | $ | 348,263 |
|
| Gross profit | | 32,041 |
| | 29,559 |
| | 61,600 |
|
| Selling, general, and administrative expenses | | 19,781 |
| | 13,729 |
| | 33,510 |
|
| Operating income | | 12,260 |
| | 15,830 |
| | 28,090 |
|
| Identifiable assets* | | $ | 141,506 |
| | $ | 29,001 |
| | $ | 170,507 |
|
| Fiscal Year Ended March 31, 2013: | | | | | | |
| Sales | | $ | 248,556 |
| | $ | 101,831 |
| | $ | 350,387 |
|
| Gross profit | | 28,878 |
| | 28,058 |
| | 56,936 |
|
| Selling, general, and administrative expenses | | 19,923 |
| | 11,683 |
| | 31,606 |
|
| Operating income | | 8,955 |
| | 16,375 |
| | 25,330 |
|
| Identifiable assets* | | $ | 143,827 |
| | $ | 25,448 |
| | $ | 169,275 |
|
| Fiscal Year Ended April 1, 2012: | | | | | | |
| Sales | | $ | 251,451 |
| | $ | 92,383 |
| | $ | 343,834 |
|
| Gross profit | | 40,357 |
| | 25,511 |
| | 65,868 |
|
| Selling, general, and administrative expenses | | 19,805 |
| | 10,954 |
| | 30,759 |
|
| Operating income | | 20,552 |
| | 14,557 |
| | 35,109 |
|
| Identifiable assets* | | $ | 129,782 |
| | $ | 23,543 |
| | $ | 153,325 |
|
* Unallocated assets consisting primarily of cash and cash equivalents, investments and prepaid expenses were $66.7 million at March 30, 2014, $52.9 million at March 31, 2013 and $48.0 million at April 1, 2012. Additionally, assets associated with the discontinued operations of the Pharmaceutical segment were zero at March 30, 2014 and March 31, 2013, and $1.2 million at April 1, 2012.
In fiscal 2013, gross profit for our Industrial segment was negatively impacted by a $7.2 million (pre-tax) charge related to our withdrawal from a multiemployer pension plan (see Note 8 for further discussion) as well as a $3.2 million (pre-tax) charge related to a legal settlement (see Note 9 for further discussion). The cumulative impact of these pre-tax charges to the industrial gross profit for fiscal 2013 was $10.4 million.
NOTES TO CONSOLIDATED FINANCIAL STATEMENTS — (Continued)
Note 13 — Selected Quarterly Financial Data (Unaudited)
|
| | | | | | | | | | | | | | | | |
| (In thousands, except per share data) | | Fiscal 2014 |
| | | First | | Second | | Third | | Fourth |
| Sales | | $ | 94,744 |
| | $ | 86,599 |
| | $ | 81,697 |
| | $ | 85,223 |
|
| Gross profit | | 17,231 |
| | 16,570 |
| | 13,550 |
| | 14,249 |
|
| Selling, general, and administrative expenses | | 8,970 |
| | 8,293 |
| | 8,167 |
| | 8,080 |
|
| Operating income | | 8,261 |
| | 8,277 |
| | 5,383 |
| | 6,169 |
|
| Income from continuing operations, net of tax | | 5,112 |
| | 5,207 |
| | 3,480 |
| | 4,295 |
|
| Income from discontinued operations, net of tax | | — |
| | — |
| | — |
| | — |
|
| Net income | | $ | 5,112 |
| | $ | 5,207 |
| | $ | 3,480 |
| | $ | 4,295 |
|
| Basic net income per share | | $ | 0.49 |
| | $ | 0.49 |
| | $ | 0.33 |
| | $ | 0.41 |
|
| Diluted net income per share | | $ | 0.48 |
| | $ | 0.49 |
| | $ | 0.33 |
| | $ | 0.40 |
|
| | | | | | | | | |
| | | Fiscal 2013 |
| | | First | | Second | | Third | | Fourth |
| Sales | | $ | 90,099 |
| | $ | 87,160 |
| | $ | 85,527 |
| | $ | 87,601 |
|
| Gross profit | | 15,307 |
| | 19,196 |
| | 8,126 |
| | 14,307 |
|
| Selling, general, and administrative expenses | | 8,227 |
| | 7,455 |
| | 7,617 |
| | 8,307 |
|
| Operating income | | 7,080 |
| | 11,741 |
| | 509 |
| | 6,000 |
|
| Income from continuing operations, net of tax | | 4,365 |
| | 7,230 |
| | 1,348 |
| | 4,165 |
|
| Income from discontinued operations, net of tax | | 18 |
| | — |
| | — |
| | — |
|
| Net income | | $ | 4,383 |
| | $ | 7,230 |
| | $ | 1,348 |
| | $ | 4,165 |
|
| Basic net income per share | | $ | 0.42 |
| | $ | 0.69 |
| | $ | 0.13 |
| | $ | 0.40 |
|
| Diluted net income per share | | $ | 0.42 |
| | $ | 0.69 |
| | $ | 0.13 |
| | $ | 0.39 |
|
In the first quarter of fiscal 2013, we recorded a | | | | | | | | | | | | | | | | |
| (In thousands, except per share data) | | | | | | | | | | | | |
| | | Fiscal 2012 | |
| | | First | | | Second | | | Third | | | Fourth | |
Sales | | $ | 88,594 | | | $ | 87,870 | | | $ | 84,160 | | | $ | 83,210 | |
Gross profit | | | 17,927 | | | | 18,750 | | | | 15,679 | | | | 13,512 | |
Operating income | | | 10,070 | | | | 10,906 | | | | 8,516 | | | | 5,617 | |
Income from continuing operations, net of tax | | | 6,353 | | | | 6,717 | | | | 5,285 | | | | 3,273 | |
Income from discontinued operations, net of tax | | | 374 | | | | 184 | | | | 267 | | | | 232 | |
| | | | | | | | | | | | | | | | |
Net income | | $ | 6,727 | | | $ | 6,901 | | | $ | 5,552 | | | $ | 3,505 | |
| | | | | | | | | | | | | | | | |
Basic net income per share | | $ | 0.65 | | | $ | 0.67 | | | $ | 0.54 | | | $ | 0.34 | |
| | | | | | | | | | | | | | | | |
Diluted net income per share | | $ | 0.65 | | | $ | 0.67 | | | $ | 0.53 | | | $ | 0.34 | |
| | | | | | | | | | | | | | | | |
| |
| | | Fiscal 2011 | |
| | | First | | | Second | | | Third | | | Fourth | |
Sales | | $ | 74,665 | | | $ | 70,398 | | | $ | 70,620 | | | $ | 81,957 | |
Gross profit | | | 18,447 | | | | 17,742 | | | | 13,726 | | | | 11,986 | |
Operating income | | | 11,786 | | | | 10,928 | | | | 6,833 | | | | 2,414 | |
Income from continuing operations, net of tax | | | 7,337 | | | | 6,832 | | | | 4,254 | | | | 1,891 | |
Income from discontinued operations, net of tax | | | — | | | | — | | | | — | | | | — | |
| | | | | | | | | | | | | | | | |
Net income | | $ | 7,337 | | | $ | 6,832 | | | $ | 4,254 | | | $ | 1,891 | |
| | | | | | | | | | | | | | | | |
Basic net income per share | | $ | 0.72 | | | $ | 0.67 | | | $ | 0.41 | | | $ | 0.18 | |
| | | | | | | | | | | | | | | | |
Diluted net income per share | | $ | 0.71 | | | $ | 0.66 | | | $ | 0.41 | | | $ | 0.18 | |
| | | | | | | | | | | | | | | | |
ITEM 9. | CHANGES IN AND DISAGREEMENTS WITH ACCOUNTANTS ON ACCOUNTING AND FINANCIAL DISCLOSURE |
$3.2 million (pre-tax) charge related to a legal settlement (see Note 9 for further discussion). In the third quarter of fiscal 2013, we recorded a $7.2 million (pre-tax) charge related to our withdrawal from a multiemployer pension plan (see Note 8 for further discussion). Both items negatively impacted gross profit.
ITEM 9. CHANGES IN AND DISAGREEMENTS WITH ACCOUNTANTS ON ACCOUNTING AND FINANCIAL
DISCLOSURE
Not applicable.
ITEM 9A. | CONTROLS AND PROCEDURES |
ITEM 9A. CONTROLS AND PROCEDURES
Evaluation of disclosure controls and procedures
As of the end of the period covered by this Annual Report on Form 10-K, we conducted an evaluation, under supervision and with the participation of management, including the chief executive officer and chief financial officer, of the effectiveness of the design and operation of our disclosure controls and procedures pursuant to Rules 13a-15(f) and 15d-15(f) of the Exchange Act. Based upon that evaluation, our chief executive officer and chief financial officer concluded that our disclosure controls and procedures are effective. Disclosure controls and procedures are defined by Rules 13a-15(e) and 15d-15(e) of the Exchange Act as controls and other procedures that are designed to ensure that information required to be disclosed by us in reports filed with the SEC under the Exchange Act is recorded, processed, summarized and reported within the time periods specified in the SEC’s rules and forms. Disclosure controls and procedures include, without limitation, controls and procedures designed to ensure that information required to be disclosed by us in reports filed under the Exchange Act is accumulated and communicated to our management, including our principal executive and principal financial officers, or person performing similar functions, as appropriate to allow timely decisions regarding required disclosure.
Management’s Report on Internal Control Over Financial Reporting
Our management is responsible for establishing and maintaining adequate internal control over financial reporting as defined in Rules 13a-15(f) and 15d-15(f) of the Securities Exchange Act. Our internal control over financial reporting is designed to provide reasonable assurance regarding the reliability of financial reporting and the preparation of financial statements for external purposes in accordance with generally accepted accounting principles. Our internal control over financial reporting includes those policies and procedures that (1) pertain to maintenance of records that, in reasonable detail, accurately and fairly reflect the transactions and dispositions of our assets; (2) provide reasonable assurance that transactions are recorded as necessary to permit preparation of the financial statements in accordance with generally accepted accounting principles, and that our receipts and expenditures are being made only in accordance with authorizations of our management and directors; and (3) provide reasonable assurance regarding prevention or timely detection of unauthorized acquisition, use or disposition of our assets that could have a material effect on the financial statements.
Because of its inherent limitations, internal control over financial reporting may not prevent or detect misstatements. Projections of any evaluation of the effectiveness of internal control over financial reporting to future periods are subject to the risk that the controls may become inadequate because of changes in conditions, or that the degree of compliance with the policies or procedures may deteriorate.
Our management assessed the effectiveness of our internal control over financial reporting as of April 1, 2012,March 30, 2014, based on the criteria described inInternalControl —- Integrated Framework (1992) issued by the Committee of Sponsoring Organizations (“COSO”) of the Treadway Commission. Based on this assessment, management believes that our internal control over financial reporting was effective as of April 1, 2012.March 30, 2014.
Our independent registered public accounting firm has issued an attestation report on our internal control over financial reporting for April 1, 2012.March 30, 2014. That attestation report is set forth immediately following this management report. |
| | | | |
| | |
/s/ Patrick H. Hawkins | | | | /s/ Kathleen P. Pepski |
| Patrick H. Hawkins | | | | Kathleen P. Pepski |
Chief Executive Officer and President June 1, 2012
| | | | Vice President, Chief Financial Officer,
and Treasurer |
| May 29, 2014 | | | | June 1, 2012May 29, 2014 |
Attestation Report of Registered Public Accounting Firm
The attestation report required under this Item 9A is contained in Item 8 of this Annual Report on 10-K under the caption “Report of Independent Registered Public Accounting Firm.”
Changes in Internal Control Procedures
There was no change in our internal control over financial reporting during the fourth quarter of fiscal 20122014 that has materially affected, or is reasonably likely to materially affect, our internal control over financial reporting. Beginning in fiscal 2012 management has included Vertex in management’s assessment of the effectiveness of our internal control over financial reporting.ITEM 9B. | OTHER INFORMATION |
ITEM 9B. OTHER INFORMATION
Certain information required by Part III is incorporated by reference from Hawkins’ definitive Proxy Statement for the Annual Meeting of Shareholders to be held on August 2, 20127, 2014 (the “2012“2014 Proxy Statement”). Except for those portions specifically incorporated in this Form 10-K by reference to the 20122014 Proxy Statement, no other portions of the 20122014 Proxy Statement are deemed to be filed as part of this Form 10-K.ITEM 10. | DIRECTORS, EXECUTIVE OFFICERS, AND CORPORATE GOVERNANCE |
ITEM 10. DIRECTORS, EXECUTIVE OFFICERS, AND CORPORATE GOVERNANCE
Our executive officers, their ages and offices held, as of May
25, 201223, 2014 are set forth below:
| |
| | | | |
Name | | Age | | | Office |
Patrick H. Hawkins | | | 41 | 43 | | Chief Executive Officer and President |
Kathleen P. Pepski | | | 57 | 59 | | Vice President, Chief Financial Officer, and Treasurer |
Mark A. Beyer
| Richard G. Erstad | | 50 | | | Vice President — Operations |
Richard G. Erstad
| | | 48 | | | Vice President, General Counsel and Secretary |
Thomas J. Keller | | | 52 | 54 | | Vice President — Water Treatment Group |
Steven D. Matthews II | | 43 | | Vice President — Operations |
| Theresa R. Moran | | | 49 | 51 | | Vice President — Quality and Support |
John R. Sevenich | | | 54 | 56 | | Vice President — Industrial Group |
Patrick H. Hawkinswas appointed to serve ashas been our Chief Executive Officer and President inand member of our board since March 2011. He had previously been promoted to the position of President in March 2010 as part of the Board’sboard’s succession planning efforts. He joined the Company in 1992 and served as the Business Director —- Food and Pharmaceuticals, a position he held from 2009 to 2010. Previously he served as Business Manager —- Food and Co-Extrusion Products from 2007 to 2009 and Sales Representative —- Food Ingredients from 2002 to 2007. He previously served the Company in various other capacities, including Plant Manager, Quality Director and Technical Director.
Kathleen P. Pepskihas been the Company’sour Vice President, Chief Financial Officer and Treasurer since February 2008 and was Secretary from February 2008 to November 2008. She was the Executive Vice President and Chief Financial Officer of PNA Holdings, LLC and Katun Corporation, a supplier of business equipment parts, from 2003 to 2007, the Vice President of Finance of Hoffman Enclosures, a manufacturer of systems enclosures and a subsidiary of Pentair, Inc., from 2002 to 2003, Senior Vice President and Chief Financial Officer of BMC Industries, Inc., a manufacturer of lenses and aperture masks, from 2000 to 2001, and Vice President and Controller at Valspar Corporation, a paint and coatings manufacturer, from 1994 to 2000.
Mark A. Beyerhas been the Company’s Vice President of Operations since September 2009. Mr. Beyer previously held operations leadership positions with Boston Scientific Corporation, a medical device manufacturer, and General Mills, Inc., a diversified food company. He was self-employed as a consultant from January 2005 to September 2009.Richard G. Erstadhas been the Company’sour Vice President, General Counsel and Secretary since November 2008. He was General Counsel and Secretary of BUCA, Inc., a restaurant company, from 2005 to 2008. Mr. Erstad had previously been an attorney with the corporate group of Faegre & Benson LLP, a law firm, from 1996 to 2005, where his practice focused on securities law and mergers and acquisitions. He is a member of the Minnesota Bar.
Thomas J. Kellerhas been the Company’sour Vice President —- Water Treatment Group since April 2012. Prior to attaining this position, Mr. Keller held various positions during his 32-year tenure withsince joining the Company in 1980, most recently as its Water Treatment General Manager, a position he held since June 2011. Previously, Mr. Keller served as a Regional Manager of the Water Treatment Group from 2002 to 2011.
Steven D. Matthews II was appointed to serve as our Vice President - Operations in December 2013. He was a Regional General Manager in the Paperboard Converting Division of Newark Recycled Paperboard Solutions, a producer of recycled paperboard, from 2012 to 2013. Previously, he spent a total of fifteen years during two different periods at General Electric in a variety of engineering, Six Sigma, supply chain and plant leadership positions in the Plastics, Aircraft Engines, Lighting and Water divisions. From 2005-2008, he was a Corporate Supply Chain Engagement Leader with Ingersoll Rand, a global diversified industrial company.
Theresa R. Moranhas been the Company’sour Vice President —- Quality and Support since February 2010. Since joining the Company in 1981, Ms. Moran has served the Company in a variety of positions, including Administration Operations Manager from 1999 to 2007 and most recently as Director —- Process Improvement, a position she held from 2007 until the time of her promotion.
John R. Sevenichhas been the Company’sour Vice President —- Industrial Group since May 2000. He was the Business Unit Manager of Manufacturing from 1998 to 2000 and was a Sales Representative with the Company from 1989 to 1998.
“Election of Directors,” “Corporate Governance,” and “Section 16(a) Beneficial Ownership Reporting Compliance” of the 20112013 Proxy Statement are incorporated herein by reference.
Steven D. Matthews II filed a bankruptcy petition related to the dissolution of a small family business of which Mr. Matthews was an owner and guarantor. The bankruptcy was discharged in 2009.
We have adopted a Code of Business Conduct and Ethics that applies to all of our directors and employees, including our principal executive officer, principal financial officer, controller and other persons performing similar functions. We have posted the Code of Business Conduct and Ethics on our website located at http://www.hawkinsinc.com. Hawkins’ Code of Business Conduct and Ethics is also available in print to any shareholder who requests it in writing from our Corporate Secretary. We intend to post on our website any amendment to, or waiver from, a provision of our Code of Business Conduct and Ethics that applies to our principal executive officer, principal financial officer, controller and other persons performing similar functions within four business days following the date of such amendment or waiver. We are not including the information contained on our website as part of, or incorporating it by reference into, this report.
ITEM 11. EXECUTIVE COMPENSATION | EXECUTIVE COMPENSATION |
“Compensation of Executive Officers and Directors” of the 20122014 Proxy Statement is incorporated herein by this reference.
ITEM 12. SECURITY OWNERSHIP OF CERTAIN BENEFICIAL OWNERS AND MANAGEMENT AND RELATED STOCKHOLDER MATTERS | SECURITY OWNERSHIP OF CERTAIN BENEFICIAL OWNERS AND MANAGEMENT AND RELATED STOCKHOLDER MATTERS |
“Security Ownership of Management and Beneficial Ownership” and “Equity Compensation Plan Information” of the 20122014 Proxy Statement are incorporated herein by this reference.
ITEM 13. CERTAIN RELATIONSHIPS AND RELATED TRANSACTIONS, AND DIRECTOR INDEPENDENCE | CERTAIN RELATIONSHIPS AND RELATED TRANSACTIONS, AND DIRECTOR INDEPENDENCE |
“Election of Directors” and “Related Party Transactions” of the 20122014 Proxy Statement are incorporated herein by this reference.
ITEM 14. PRINCIPAL ACCOUNTANT FEES AND SERVICES | PRINCIPAL ACCOUNTANT FEES AND SERVICES |
“Independent Registered Public Accounting Firm’s Fees” of the 20122014 Proxy Statement is incorporated herein by this reference.
PART IV
ITEM 15. EXHIBITS AND FINANCIAL STATEMENT SCHEDULES ITEM 15. | EXHIBITS AND FINANCIAL STATEMENT SCHEDULES |
| | |
| |
(a)(1) | | FINANCIAL STATEMENTS OF THE COMPANY |
| |
| | The following financial statements of Hawkins, Inc. are filed as part of this Annual Report on Form 10-K: |
| |
| | ReportsReport of Independent Registered Public Accounting Firms.Firm. |
| |
| | Consolidated Balance Sheets at April 1, 2012March 30, 2014 and April 3, 2011.March 31, 2013. |
| |
| | Consolidated Statements of Income for the fiscal years ended March 31, 2014, March 31, 2013, and April 1, 2012, April 3, 2011, and March 28, 2010.2012. |
| |
| | Consolidated Statements of Comprehensive Income for the fiscal years ended March 30, 2014, March 31, 2013, and April 1, 2012. |
| |
| | Consolidated Statements of Shareholders’ Equity for the fiscal years ended March 30, 2014, March 31, 2013 and April 1, 2012, April 3, 2011, and March 28, 2010.2012. |
| |
| | Consolidated Statements of Cash Flows for the fiscal years ended March 30, 2014, March 31, 2013 and April 1, 2012, April 3, 2011, and March 28, 2010.2012. |
| | |
| | Notes to Consolidated Financial Statements. |
| |
(a)(2) | | FINANCIAL STATEMENT SCHEDULES OF THE COMPANY |
| |
| | The additional financial data listed below is included as a schedule to this Annual Report on Form 10-K and should be read in conjunction with the financial statements presented in Part II, Item 8. Schedules not included with this additional financial data have been omitted because they are not required or the required information is included in the financial statements or the notes. |
| |
| | The following financial statement schedule for the fiscal years 2012, 20112014, 2013 and 2010.2012. |
| |
| | Schedule II — Valuation and Qualifying Accounts. |
| |
(a)(3) | | EXHIBITS |
| |
| | The exhibits of this Annual Report on Form 10-K included herein are set forth on the attached Exhibit Index. |
Pursuant to the requirements of Section 13 or 15(d) of the Securities Exchange Act of 1934, the Company has duly caused this report to be signed on its behalf by the undersigned, thereunto duly authorized.
|
| | | | | |
| | | | HAWKINS, INC. |
| | | |
Date: June 1, 2012 | May 29, 2014 | | By | | /s/ Patrick H. Hawkins |
| | | | | Chief Executive Officer and President |
Each of the undersigned directors of the Company, does hereby make, constitute and appoint Patrick H. Hawkins and Kathleen P. Pepski, and either of them, the undersigned’s true and lawful attorney-in-fact and agent, acting alone, with full power of substitution, for the undersigned and in the undersigned’s name, place and stead, to sign and affix the undersigned’s name as such director of the Company, in any and all capacities, to any and all amendments to this Annual Report on Form 10-K and to file the same, with all exhibits thereto, and other documents in connection wherewith, with the Securities and Exchange Commission, granting unto said attorney-in-fact, and either of them, full power and authority to do and perform each and every act necessary or incidental to the performance and execution of the powers herein expressly granted.
Pursuant to the requirements of the Securities Exchange Act of 1934, this report has also been signed below by the following persons on behalf of the Company and in the capacities indicated on the date set forth beside their signature.
|
| | | |
| | | |
| /s/ Patrick H. Hawkins | | Date: June 1, 2012 | May 29, 2014 |
Patrick H. Hawkins, Chief Executive Officer and President (Principal Executive Officer) and Director | | | |
| |
/s/ Kathleen P. Pepski | | Date: June 1, 2012 | May 29, 2014 |
Kathleen P. Pepski, Vice President, Chief Financial Officer, and Treasurer (Principal Financial Officer and Principal Accounting Officer) | | | |
| |
/s/ John S. McKeon | | Date: June 1, 2012 | May 29, 2014 |
| John S. McKeon, Director, Chairman of the Board | | | |
| |
/s/ Duane M. Jergenson | | Date: June 1, 2012 | May 29, 2014 |
| Duane M. Jergenson, Director | | | |
| |
/s/ Daryl I. Skaar | | Date: June 1, 2012 | May 29, 2014 |
| Daryl I. Skaar, Director | | | |
| |
/s/ James A. Faulconbridge | | Date: June 1, 2012 | May 29, 2014 |
| James A. Faulconbridge, Director | | | |
| |
/s/ James T. Thompson | | Date: June 1, 2012 | May 29, 2014 |
| James T. Thompson, Director | | | |
| |
/s/ Jeffrey L. Wright | | Date: June 1, 2012 | May 29, 2014 |
| Jeffrey L. Wright, Director | | | |
| | | |
| /s/ Mary J. Schumacher | | Date: | May 29, 2014 |
| Mary J. Schumacher, Director | | | |
| | | |
Schedule
SCHEDULE II
HAWKINS, INC.
VALUATION AND QUALIFYING ACCOUNTS
SCHEDULE II
HAWKINS, INC.
VALUATION AND QUALIFYING ACCOUNTS
FOR THE FISCAL YEARS ENDED
MARCH 30, 2014, MARCH 31, 2013, AND APRIL 1, 2012
APRIL 3, 2011, AND MARCH 28, 2010 | | | | | | | | | | | | | | | | | | | | |
| | | | | | Additions | | | | | | | |
Description | | Balance at
Beginning
of Year | | | Charged to
Costs and
Expenses | | | Charged to
Other
Accounts | | | Deductions
Write-Offs | | | Balance at
End of Year | |
| | | (In thousands) | |
Reserve deducted from asset to which it applies: | | | | | | | | | | | | | | | | | | | | |
Year Ended April 1, 2012: | | | | | | | | | | | | | | | | | | | | |
Allowance for doubtful accounts | | $ | 406 | | | $ | 78 | | | $ | — | | | $ | 24 | | | $ | 460 | |
Year Ended April 3, 2011: | | | | | | | | | | | | | | | | | | | | |
Allowance for doubtful accounts | | $ | 300 | | | $ | 120 | | | $ | — | | | $ | 14 | | | $ | 406 | |
Year Ended March 28, 2010: | | | | | | | | | | | | | | | | | | | | |
Allowance for doubtful accounts | | $ | 350 | | | $ | (29 | ) | | $ | — | | | $ | 21 | | | $ | 300 | |
|
| | | | | | | | | | | | | | | | | | | | |
| | | | | Additions | | | | |
| Description | | Balance at Beginning of Year | | Charged to Costs and Expenses | | Charged to Other Accounts | | Deductions Write-Offs | | Balance at End of Year |
| | | (In thousands) |
| Reserve deducted from asset to which it applies: | | | | | | | | | | |
| Year Ended March 30, 2014: | | | | | | | | | | |
| Allowance for doubtful accounts | | $ | 469 |
| | $ | 44 |
| | $ | — |
| | $ | 36 |
| | $ | 477 |
|
| Year Ended March 31, 2013: | | | | | | | | | | |
| Allowance for doubtful accounts | | $ | 460 |
| | $ | 201 |
| | $ | — |
| | $ | 192 |
| | $ | 469 |
|
| Year Ended April 1, 2012: | | | | | | | | | | |
| Allowance for doubtful accounts | | $ | 406 |
| | $ | 78 |
| | $ | — |
| | $ | 24 |
| | $ | 460 |
|
Unless otherwise indicated, all documents incorporated into this Annual Report on Form 10-K by reference to a document filed with the SEC are located under file number 0-7647.
|
| | | | | |
Exhibit |
| | Description | | Method of Filing |
| | |
| | | |
| 3.1 |
| | Amended and Second Restated Articles of Incorporation.(1) | | Incorporated by Reference |
| | |
| 3.2 |
| | Amended and Restated By-Laws.(2) | | Incorporated by Reference |
| | |
| 10.1* | | Description of Consulting Arrangement with John S. McKeon.(3) | | Incorporated by Reference |
| | |
10.2*
| | Hawkins, Inc. 2004 Omnibus Stock Plan.(4)(3) | | Incorporated by Reference |
| | |
10.3* | | Form of Restricted Stock Agreement under the Company’s 2004 Omnibus Stock Plan.(5) | | Incorporated by Reference |
| 10.2* | | |
10.4* | | Form of Restricted Stock Agreement (Directors) under the Company’s 2004 Omnibus Stock Plan.(6) | | Incorporated by Reference |
| | |
10.5*
| | Form of Non-Statutory Stock Option Agreement under the Company’s 2004 Omnibus Stock Plan.(7)(4) | | Incorporated by Reference |
| | |
10.6* | | Form of Performance-Based Restricted Stock Unit Award Notice and Restricted Stock Agreement under the Company’s 2004 Omnibus Stock Plan.(8) | | Incorporated by Reference |
| 10.3* | | |
10.7*
| | Hawkins, Inc. 2010 Omnibus Incentive Plan.(9)(5) | | Incorporated by Reference |
| | |
10.8*10.4* |
| | Form of Performance-Based Unit Award Notice and Restricted Stock Agreement under the Company’s 2010 Omnibus Incentive Plan.(10)(6) | | Incorporated by Reference |
| | |
10.9*10.5* |
| | Form of Restricted Stock Agreement under the Company’s 2010 Omnibus Incentive Plan.(11)(7) | | Incorporated by Reference |
| | |
10.10*10.6* |
| | Hawkins, Inc. Executive Severance Plan.(12)(8) | | Incorporated by Reference |
| | |
| 21 |
| | Subsidiaries of the registrant | | Filed Electronically |
| | | | |
| 23.1 |
| | Consent of Independent Registered Public Accounting Firm. | | Filed Electronically |
| | |
| 31.1 |
| | Certification by Chief Executive Officer pursuant to Rule 13a-14(a) of the Exchange Act. | | Filed Electronically |
| | |
| 31.2 |
| | Certification by Chief Financial Officer pursuant to Rule 13a-14(a) of the Exchange Act. | | Filed Electronically |
| | |
| 32.1 |
| | Section 1350 Certification by Chief Executive Officer. | | Filed Electronically |
| | |
| 32.2 |
| | Section 1350 Certification by Chief Financial Officer. | | Filed Electronically |
| | |
| 101 |
| | Financial statements from the Annual Report on Form 10-K of Hawkins, Inc. for the period ended April 1, 2012,March 30, 2014, filed with the SEC on June 1, 2012,May 29, 2014, formatted in Extensible Business Reporting Language (XBRL); (i) the Condensed Consolidated Balance Sheets at April 1, 2012March 30, 2014 and April 3, 2011,March 31, 2013 , (ii) the Condensed Consolidated Statements of Income for the fiscal years ended March 30, 2014, March 31, 2013, and April 1, 2012 April 3, 2011 and March 28, 2010, (iii) the CondensedConsolidated Statements of Comprehensive Income (Loss) for the fiscal years ended March 30, 2014, March 31, 2013, and April 1, 2012 (iv) the Consolidated Statements of Shareholders’ Equity for the fiscal years ended March 30, 2014, March 31, 2013 and April 1, 2012 (v) Consolidated Statements of Cash Flows for the fiscal years ended March 30, 2014, March 31, 2013 and April 1, 2012 April 3, 2011 and March 28, 2010, and (iv) Notes to Condensed Consolidated Financial Statements. | | Filed Electronically |
|
| |
| * | Management contract or compensation plan or arrangement required to be filed as an exhibit to this Annual Report on Form 10-K. |
| |
| (1) | Incorporated by reference to Exhibit 3.1 to the Company’s Quarterly Report on Form 10-Q for the quarterly period ended June 30, 2010. |
| |
| (2) | Incorporated by reference to Exhibit 3.1 to the Company’s Current Report on Form 8-K dated October 28, 2009 and filed November 3, 2009. |
(3) | Incorporated by reference to Item 1.01 of the Company’s Current Report on Form 8-K dated August 5, 2009 and filed August 11, 2009. |
(4)(3) | Incorporated by reference to Appendix B to the Company’s Proxy Statement for the 2004 Annual Meeting of Shareholders filed July 23, 2004. |
(5) | Incorporated by reference to Exhibit 10.2 to the Company’s Quarterly Report on Form 10-Q for the quarterly period ended September 30. |
(6) | Incorporated by reference to Exhibit 10.1 to the Company’s Quarterly Report on Form 10-Q for the quarterly period ended September 30, 2008. |
(7)(4) | Incorporated by reference to Exhibit 10.1 to the Company’s Quarterly Report on Form 10-Q for the quarterly period ended June 30, 2008. |
(8) | Incorporated by reference to Exhibit 10.2 to the Company’s Quarterly Report on Form 10-Q for the quarterly period ended June 30, 2008. |
(9)(5) | Incorporated by reference to Exhibit 10.1 to the Company’s Registration Statement on Form S-8 filed June 6, 2011 (file no. 333-174735). |
(10) | |
| (6) | Incorporated by reference to Exhibit 10.1 to the Company’s Quarterly Report on Form 10-Q for the quarterly period ended June 30, 2010. |
(11) | |
| (7) | Incorporated by reference to Exhibit 10.2 to the Company’s Quarterly Report on Form 10-Q for the quarterly period ended June 30, 2010. |
(12) | |
| (8) | Incorporated by reference to Exhibit 10.1 to the Company’s Quarterly Report on Form 10-Q for the quarterly period ended July 3, 2011. |
55
