UNITED STATES
SECURITIES AND EXCHANGE COMMISSION
Washington, D.C. 20549
FORM 10-K
| x | ANNUAL REPORT PURSUANT TO SECTION 13 or 15(d) OF THE SECURITIES EXCHANGE ACT OF 1934 |
For the fiscal year ended September 29, 201226, 2015
Commission File Number 1-33268
CENTRAL GARDEN & PET COMPANY
(Exact name of registrant as specified in its charter)
| Delaware | 68-0275553 | |
| (State or other jurisdiction of incorporation or organization) | (IRS Employer Identification Number) |
1340 Treat Boulevard, Suite 600, Walnut Creek, California 94597
(Address of principal executive offices) (Zip Code)
Telephone Number: (925) 948-4000
SECURITIES REGISTERED PURSUANT TO SECTION 12(b) OF THE ACT:
Title of Each Class | Name of Each Exchange on Which Registered | |
Common Stock Class A Common Stock | Nasdaq Nasdaq |
SECURITIES REGISTERED PURSUANT TO SECTION 12(g) OF THE ACT: None
Indicate by check mark if the registrant is a well-known seasoned issuer, as defined in Rule 405 of the Securities Act. Yes ¨ No x
Indicate by check mark if the registrant is not required to file reports pursuant to Section 13 or Section 15(d) of the Act. Yes ¨ No x
Indicate by check mark whether the registrant (1) has filed all reports required to be filed by Section 13 or 15(d) of the Securities Exchange Act of 1934 during the preceding 12 months (or for such shorter period that the registrant was required to file such reports), and (2) has been subject to such filing requirements for the past 90 days. Yes x No ¨
Indicate by check mark whether the registrant has submitted electronically and posted on its corporate Web site, if any, every Interactive Data File required to be submitted and posted pursuant to Rule 405 of Regulation S-T (§ 232.405 of this chapter) during the preceding 12 months (or for such shorter period that the registrant was required to submit and post such files). Yes x No ¨
Indicate by check mark if disclosure of delinquent filers pursuant to Item 405 of Regulation S-K (§ 229.405 of this chapter) is not contained herein, and will not be contained, to the best of registrant’s knowledge, in definitive proxy or information statements incorporated by reference in Part III of this Form 10-K or any amendment to this Form10-K. ¨
Indicate by check mark whether the registrant is a large accelerated filer, an accelerated filer, or a non-accelerated filer, or a smaller reporting company. See definition of “large accelerated filer,” “accelerated filer” and “smaller reporting company” in Rule 12b-2 of the Exchange Act. (Check one):
Large Accelerated Filer ¨ | Accelerated Filer x | |
Non-Accelerated Filer ¨ (Do not check if a smaller reporting company) | Smaller Reporting Company ¨ | |
Indicate by check mark whether the registrant is a shell company (as defined in Rule 12b-2 of the Exchange Act). Yes ¨ No x
At March 24, 2012,28, 2015, the aggregate market value of the registrant’s Common Stock, Class A Common Stock and Class B Stock held by non-affiliates of the registrant was approximately $96.2$100.4 million, $285.0$346.6 million and $57,100,$63,000, respectively.
At November 30, 2012,2015, the number of shares outstanding of the registrant’s Common Stock was 12,247,35911,908,317 and the number of shares of Class A Common Stock was 34,753,392.36,489,570. In addition, on such date, the registrant had outstanding 1,652,262 shares of its Class B Stock, which are convertible into Common Stock on a share-for-share basis.
DOCUMENTS INCORPORATED BY REFERENCE
Definitive Proxy Statement for the Company’s 20132016 Annual Meeting of Stockholders – Part III of this Form 10-K.
Index to Annual Report on Form 10-K
For the fiscal year ended September 29, 201226, 2015
| Page | ||||||
| PART I | ||||||
| Item 1. | 1 | |||||
| Item 1A. | 14 | |||||
| Item 1B. | 23 | |||||
| Item 2. | 23 | |||||
| Item 3. | ||||||
| Item 4. | ||||||
| PART II | ||||||
| Item 5. | Market for the Registrant’s Common Equity, Related Stockholder Matters and Issuer Purchases of Equity Securities | |||||
| Item 6. | ||||||
| Item 7. | Management’s Discussion and Analysis of Financial Condition and Results of Operations | |||||
| Item 7A. | ||||||
| Item 8. | ||||||
| Item 9. | Changes in and Disagreements With Accountants on Accounting and Financial Disclosure | |||||
| Item 9A. | ||||||
| Item 9B. | ||||||
| PART III | ||||||
| Item 10. | ||||||
| Item 11. | ||||||
| Item 12. | Security Ownership of Certain Beneficial Owners and Management and Related Stockholder Matters | |||||
| Item 13. | Certain Relationships and Related Transactions, and Director Independence | |||||
| Item 14. | ||||||
| PART IV | ||||||
| Item 15. | ||||||
i
FORWARD-LOOKING STATEMENTS
This Form 10-K includes “forward-looking statements.” Forward-looking statements include statements concerning our plans, objectives, goals, strategies, future events, future revenues or performance, our transformational efforts,projected cost savings, capital expenditures, financing needs, plans or intentions relating to acquisitions, our competitive strengths and weaknesses, our business strategy our ability to pass through grain and other raw material price increases and the trends we anticipate in the industries and economiesmarkets in which we operate and other information that is not historical information. When used in this Form 10-K, the words “estimates,” “expects,” “anticipates,” “projects,” “plans,” “intends,” “believes” and variations of such words or similar expressions are intended to identify forward-looking statements. All forward-looking statements, including, without limitation, our examination of historical operating trends, are based upon our current expectations and various assumptions. Our expectations, beliefs and projections are expressed in good faith, and we believe there is a reasonable basis for them, but we cannot assure you that our expectations, beliefs and projections will be realized.
There are a number of risks and uncertainties that could cause our actual results to differ materially from the forward-looking statements contained in this Form10-K. Important factors that could cause our actual results to differ materially from the forward-looking statements we make in this Form10-K are set forth in this Form10-K, including the factors described in the section entitled “Item 1A – Risk Factors.” If any of these risks or uncertainties materialize,materializes, or if any of our underlying assumptions areis incorrect, our actual results may differ significantly from the results that we express in or imply by any of our forward-looking statements. We do not undertake any obligation to revise these forward-looking statements to reflect future events or circumstances. Presently known risk factors include, but are not limited to, the following factors:
the success of our transformational change initiatives;
disruptions in our business as we implement our transformational change initiatives and the resulting consequences to our business and results of operations;
increased costs and expenses associated with our transformational change initiatives;
seasonality and fluctuations in our operating results and cash flow;
fluctuations in market prices for seeds and grains and other raw materials;
our abilityinability to pass through cost increases in a timely manner;
the impending retirement of our CEO, dependence upon him and our other key executives and the ability to execute on our succession plan;
risks associated with new product introductions, including the risk that our new products will not produce sufficient sales to recoup our investment;
declines in consumer spending during economic downturns;
inflation, deflation and other adverse macro-economic conditions;
supply shortages in small animals and pet birds;
adverse weather conditions;
risks associated with our acquisition strategy;
fluctuations in energy prices, fuel and related petrochemical costs;
access to and cost of additional capital;
dependence on a small number of customers for a significant portion of our business;
consolidation trends in the retail industry;
uncertainty about new product innovations and marketing programs;
competition in our industries;
risks associated with our acquisition strategy;potential goodwill or intangible asset impairment;
dependence upon our key executives;
ii
continuing implementation of a newan enterprise resource planning information technology system;
our ability to protect our intellectual property rights;
potential environmental liabilities;
ii
risk associated with international sourcing;
litigation and product liability claims;
regulatory issues;
the impact of product recalls;
potential costs and risks associated with actual or anticipated cyber attacks;
the voting power associated with our Class B stock; and
potential dilution from issuance of authorized shares.
iii
MARKET, RANKING AND OTHER DATA
The data included in this Form 10-K regarding markets and ranking, including the size of certain markets and our position and the position of our competitors and products within these markets, are based on both independent industry publications, including Packaged Facts,The Freedonia Group Lawn & Garden Consumables July 2014; Freedonia Landscaping Products in the U.S. 2012; Mintel, Marketing to Pet Owners – U.S., 2012;August 2015; Packaged Facts U.S. Pet MarketingMarket Outlook 2012-2013;2015-2016; Packaged Facts Pet Treats and Chews in the U.S. June 2015; American Pet Products Association (APPA) National Pet Owners Survey 2011-2012;2015-2016; U.S. Census Bureau, and our estimates based on management’s knowledge and experience in the markets in which we operate. Our estimates have been based on information provided by customers, suppliers, trade and business organizations and other contacts in the markets in which we operate. We believe theseWhile we are not aware of any misstatements regarding our market and ranking data presented herein, our estimates involve risks and uncertainties and are subject to be accurate as ofchange based on various factors, including those discussed under the date ofheading “Risk factors” in this Form 10-K. However, thisThis information may prove to be inaccurate because of the method by which we obtained some of the data for our estimates or because this information cannot always be verified with complete certainty due to the limits on the availability and reliability of raw data, the voluntary nature of the data gathering process and other limitations and uncertainties inherent in a survey of market size. As a result, you should be aware that market, ranking and other similar data included in this Form 10-K,herein, and estimates and beliefs based on that data, may not be reliable. We cannot guarantee the accuracy or completeness of such information contained herein.
iv
PART I
Our Company
Central Garden & Pet Company (“Central”) is a leading innovator, marketer and producer, of quality branded products. We are oneproducts and distributor of the largest suppliersthird party products in the pet and lawn and garden supplies industries in the United States. The total pet food, treats and supplies industry isin 2014 was estimated by Packaged Facts to behave been approximately $30$49.2 billion in annual retail sales. We estimate the annual retail sales of the pet supplies and consumables and super premium pet food markets in the categories in which we participate to be approximately $15$28.1 billion. The total lawn and garden consumables and decorative products industry in the United States which includes equipment, supplies and services, is estimated to be approximately $21$22.0 billion in annual retail sales.sales, including fertilizer, pesticides, growing media, seeds, mulch, other consumables and decorative products. We estimate the annual retail sales of the lawn and garden suppliesconsumables and decorative products markets in the categories in which we participate to be approximately $6$12.0 billion. In addition, we participate in the pottery and seasonal décor markets.
Our pet supplies products include products for dogs and cats, including edible bones, premium healthy edible and non-edible chews, super premium dog and cat food and treats, toys, pet carriers, grooming supplies and other accessories; products for birds, small animals and specialty pets, including food, cages and habitats, toys, chews and related accessories; animal and household health and insect control products; products for fish, reptiles and other aquarium-based pets, including aquariums, furniture and lighting fixtures, pumps, filters, water conditioners, food and supplements, and information and knowledge resources; and products for horses and livestock. These products are sold under a number of brand namesthe brands including AdamsTM, Altosid, Aqueon®, Avoderm®, BioSpotBio Spot Active Care®TM, CoralifeCadet®, Farnam®, Four Paws®, Interpet, Kaytee®, Kent Marine®, Nylabone®, Oceanic Systems®, Pet Select®, Pre-Strike®, Pinnacle®, Super Pet®, TFHTM, Zilla® as well as a number of other brands including Altosid, Comfort Zone®, Coralife®, Interpet, Kent Marine®, Pet Select®, Super Pet®, and Zodiac®.
Our lawn and garden supplies products include proprietary and non-proprietary grass seed; wild bird feed, bird feeders, bird houses and other birding accessories; weed, grass, ant and other herbicide, insecticide and pesticide products; and decorative outdoor lifestyle and lighting products including pottery, trellises and other wood products and holiday lighting. These products are sold under a number of brand names includingthe brands AMDRO®, GKI/Bethlehem Lighting®, Grant’s®, Ironite®, Pennington®, and Sevin®, as well as a number of other brand names including Lilly Miller®, Matthews Four SeasonsTM, New England Pottery®, Norcal Pottery®, Pennington®, Over-N-Out®, Sevin®, Smart Seed® and The Rebels®.
In fiscal 2012,2015, our consolidated net sales were $1.7 billion, of which our Petpet segment, or Pet, accounted for approximately $931$895 million and our lawn and Gardengarden segment, or Garden, accounted for approximately $769$756 million. Fiscal 2012 included an extra week compared to fiscal 2011. In fiscal 2012,2015, our income from operations before corporate expenses and eliminations of $67.5 million was $74$158.9 million, of which the Pet segment accounted for $88$98.8 million and the Garden segment accounted for $40 million, before corporate expenses and eliminations of $54$60.1 million. See Note 1819 to our consolidated financial statements for financial information about our two operating segments.
We were incorporated in Delaware in JuneMay 1992 as the successor to a California corporation that was formed in 1955. Our executive offices are located at 1340 Treat Boulevard, Suite 600, Walnut Creek, California 94597, and our telephone number is (925) 948-4000. Our website iswww.central.com. The information on our website is not incorporated by reference in this annual report.
Recent Developments
Fiscal 2012 Operating Performance. Although we experiencedEarnings per fully diluted share increased sales$0.46 per share to $0.64 per share and our operating income increased 63% to $91.4 million as compared to fiscal 2014, due to increased earnings in both our segments. The Pet segment was impacted by a $7.3 million non-cash intangible asset impairment charge in fiscal 2012, rising input costs,2015. In fiscal 2014, the Garden segment was impacted by a changecharge related to the discontinuance of certain products introduced in sales mix, operational disruptions2013 and increased costs associated with our transformational change initiatives,a gain on the sale of manufacturing plant assets. The items impacting fiscal 2015 and unfavorable weather resulted2014 are excluded for purposes of the non-GAAP presentation elsewhere in increased expenses and continuing pressure on gross margins.
Financial summary:this Form 10-K.
Net sales for fiscal 20122015 increased $71.4$46.3 million, or 4%2.9%, to $1.7 billion.$1,650.7 million. Our Pet segment sales increased 9.3%5.8%, partially offset by a 1.0% decrease inand our Garden segment.segment sales decreased 0.4%.
Gross profit for fiscal 2015 increased $34.0 million, or 7.5%, to $488.0 million from $454.0 million in fiscal 2014. Gross margin decreased 10increased 130 basis points in fiscal 20122015 to 30.2%29.6%, from 30.3%28.3% in 2011.2014.
Selling, general & administrative expensesOur operating income increased $31.0$35.2 million, or 7.6%62.7%, to $439.7$91.4 million in fiscal 2012,2015, and increased as a percentage of net sales to 25.9%5.5% from 25.1%3.5%. On an adjusted basis, operating income increased $30.5 million, or 44.6%.
Net earnings for fiscal 2012 were $21.2income was $32.0 million, or $0.44$0.64 per share on a fully diluted basis, a decreasecompared to net income in fiscal 2014 of $7.1$8.8 million, and $0.06or $0.18 per share on a fully diluted basis. On an adjusted basis, comparednet income increased to $36.6 million, or $0.74 per share, in fiscal 2011.2015 from $16.4 million, or $0.33 per share, in fiscal 2014.
We generatedOur net cash flows fromprovided by operating activities of approximately $89.2was $87.4 million duringin fiscal 2012, an increase of approximately $38.22015, compared to $126.5 million fromin fiscal 2011. Our cash and short term investments at September 29, 2012 were approximately $71.2 million, compared with $29.9 million at September 24, 2011.2014.
RepurchaseLeadership
In July 2015, we amended the employment agreement of John R. Ranelli, our Chief Executive Officer. Under the amended agreement, Mr. Ranelli has agreed to continue as Chief Executive Officer until his planned retirement at the end of fiscal 2016 and to continue to consult for the Company Stock.– During fiscal 2012,for an additional four years. In order to facilitate an orderly transition, we repurchased $20.9 million ofplan to launch a search in the near future for our common stock which consisted of 0.7 million shares of our voting common stock (CENT)next Chief Executive Officer.
Our former Chief Financial Officer, Lori Varlas, resigned effective September 2, 2015 to accept a senior level position at an aggregate cost of approximately $5.6 million, or approximately $8.02 per share, and 1.9 million shares of our non-voting Class A common stock (CENTA) at an aggregate cost of approximately $15.3 million, or approximately $8.05 per share. During fiscal 2011, ouranother company. The Board of Directors authorized a new $100 million share repurchase program, under which approximately $52 million remains availablenamed David N. Chichester as Acting Chief Financial Officer through February 2016. Mr. Chichester has served for repurchases in fiscal 201313 years on Central’s Board and thereafter.
Transformational Change. – In fiscal 2012, we continuedas our Audit Committee financial expert. He brings significant financial management, accounting, disclosure, and risk assessment experience to the process of transformational change we embarked upon in fiscal 2011, consisting of a comprehensive series of organizational and operational initiatives intended to improve our sales and marketing, profitability and operational effectiveness. We expect to continue these initiatives over the next several years. The strategic objective of these initiatives is to transform the Company from a portfolio of separately run businesses into an integrated, multi-brand company. In connection with this change, we are strengthening our management team, reorganizing operating units, consolidating facilities, eliminating duplicative services, standardizing processes, training employees in new approaches and investing in systems, facilities and people. For example, in fiscal 2011, we began the process of combining our Garden and Pet supply chains as an integrated unit responsible for distribution, transportation, manufacturing, sourcing and sales and operations planning. In fiscal 2012, we began consolidating transactional processing in a newly created centralized shared services center in Boise, Idaho.Acting Chief Financial Officer role. We are in the process of movingpositioning our accounts payable, accounts receivablekey senior financial officers to assume Mr. Chichester’s responsibilities in an orderly fashion when he completes his tenure as Acting Chief Financial Officer in February 2016.
Our Chairman of the Board, Bill Brown, commenced a leave of absence in July as he continues to recover from injuries he sustained in an accident in his home earlier in the year. Jack Balousek, our Lead Independent Director, is acting as Interim non-executive Chairman until Mr. Brown returns.
IMS Trading Corp Acquisition
On July 31, 2015, we purchased substantially all of the assets of IMS Trading Corp. (“IMS”) for a purchase price of approximately $23 million. IMS was a manufacturer, importer and order management functionsdistributor of rawhide, natural dog treats and pet products throughout the United States and internationally. This acquisition is expected to this centralized service center. During fiscal 2012,complement our existing dog and cat business.
Debt Refinancing
In November 2015, we incurred approximately $12.1issued $400 million aggregate principal amount of additional expense6.125% senior notes due November 2023 (the “2023 Notes”). The 2023 Notes are unconditionally guaranteed on a senior basis by each of
our existing and future domestic restricted subsidiaries which are borrowers under or guarantors of our senior secured revolving credit facility. We used the net proceeds from the offering, together with available cash, to redeem our outstanding 8.25% senior subordinated notes due March 1, 2018 (the “2018 Notes”) and pay fees and expenses related to transformation activities.
There can be no assurance thatthe offering. As a result of our redemption of the 2018 Notes, we will be able to successfully implement the transformational change initiatives or that we will be able to do so within the anticipated time period. During the process of implementation, we will be making substantial investmentsrecognize a charge in our business and will incur substantial transitional costs, which will adversely affect our operating results until the transformation process is complete.
Fiscal 2013.– Hurricane Sandy negatively impacted our northeastern businesses. While damage was minimal, some of our businesses experienced disruption which will impact ourfiscal 2016 first quarter 2013 results.of approximately $8.3 million related to the payment of the call premium, a one-time payment of overlapping interest expense for 30 days of approximately $2.8 million and a $3.2 million non-cash charge for the write-off of unamortized financing costs in interest expense. We expect our annual interest expense on the 2023 Notes going forward to be approximately $8.5 million less than under the 2018 Notes.
DMC Acquisition
On December 1, 2015, we purchased the pet bedding and certain other assets of National Consumers Outdoors Corp., formerly known as Dallas Manufacturing Company (“DMC”), for a cash purchase price of $61 million. This acquisition is expected to complement our existing dog and cat business.
Competitive Strengths
We believe we have the following competitive strengths, which serve as the foundation of our business strategy:
| • | Market Leadership Positions Built on a Strong Brand Portfolio. We are one of the leaders in the premium branded U.S. pet supplies market and in the U.S. consumer lawn and garden supplies market. We have a diversified portfolio of brands, many of which we believe are among the leading brands in their respective U.S. market categories. The majority of our brands have been marketed and sold for more than 25 years. |
| • | History of Innovative New |
| • | Strong Relationships with Retailers. We have developed strong relationships with major and independent retailers, as well as e-commerce retailers through product innovation, premium |
| • | Favorable Long-Term Industry Characteristics. |
under 18 and the number of adults over age 55. Households with children tend to own more pets, and adults over 55 are more likely to be “empty nesters” that keep pets as companions and have more disposable income and leisure time available for both pets and garden activities. According to the |
| • | Sales and Logistics Networks. We are a leading supplier to independent specialty retailers for the pet and lawn and garden supplies markets through our sales and logistics networks. We believe our sales and logistics networks give us a significant competitive advantage over other suppliers. These networks provide us with key access to independent pet specialty retail stores and retail lawn and garden customers that require two-step distribution for our branded products facilitating: |
acquisition and maintenance of premium shelf placement;
prompt product replenishment;
customization of retailer programs;
quick responses to changing customer and retailer preferences;
rapid deployment and feedback for new products; and
immediate exposure for new internally developed and acquired brands.
We plan to continue to utilize our team of dedicated sales people and our sales and logistics networks to expand sales of our branded products.
|
Business Strategy
Our objective is to increase market share, revenue, earnings and cash flow and profitability by enhancing our position as one of the leading companies in the U.S. pet supplies industry and lawn and garden supplies industry.industries. To achieve our objective, we plan to capitalize on our strengths and the favorable industry trends by implementing the following key elements of our business strategy:
| • |
|
| • | Build Existing Brands. With our broad product assortment, strong brand names, strong sell-through and innovative products and packaging, we believe we can further strengthen our relationships with existing and new retailers, as well as e-commerce retailers, to increase shelf space and sales. Under our master branding strategy, we |
| • | Continue New Product and Packaging Innovation. We will continue to build and leverage the strength of our leading brand names by introducing innovative new products and packaging, extending existing |
product lines and entering new product categories. Our product strategy seeks to capitalize on |
| • | Improve |
|
| • | Pursue Strategic Acquisitions. We plan to continue to make selected strategic acquisitions of |
| • | Reduce Our Investment In Working Capital. We believe there are opportunities to reduce our investment in working capital over the long term by focusing on specific balance sheet metrics. In particular, we believe that the improvement in our fill rates as a result of tighter linkage between our businesses and supply chain |
Products – General
The following table indicates each class of similar products which represented approximately 10% or more than 10% of our consolidated net sales in the fiscal years presented (in millions).
Category | 2012 | 2011 | 2010 | 2015 | 2014 | 2013 | ||||||||||||||||||
Pet supplies (excluding wild bird feed) | $ | 847.1 | $ | 773.1 | $ | 766.5 | $ | 827.7 | $ | 774.2 | $ | 807.4 | ||||||||||||
Garden controls and fertilizer products | 281.7 | 260.0 | 255.5 | 286.3 | 262.5 | 274.9 | ||||||||||||||||||
Wild bird feed | 205.1 | 197.5 | 168.9 | 193.2 | 202.1 | 210.8 | ||||||||||||||||||
Other garden supplies | 185.7 | 212.1 | 196.0 | 181.4 | 182.5 | 183.5 | ||||||||||||||||||
Grass seed | 180.4 | 185.9 | 136.7 | 162.1 | 183.1 | 177.0 | ||||||||||||||||||
|
|
|
|
|
| |||||||||||||||||||
Total | $ | 1,700.0 | $ | 1,628.6 | $ | 1,523.6 | $ | 1,650.7 | $ | 1,604.4 | $ | 1,653.6 | ||||||||||||
|
|
|
|
|
| |||||||||||||||||||
Pet Segment
Overview
We are one of the leading marketers and producers of premium branded pet supplies in the United States. In addition, our Pet segment operates one of the largest sales and logistics networknetworks in the industry strategically supporting itsour brands. In fiscal 2012,2015, the Pet segment accounted for $931$895 million of our consolidated net sales and $87$98.8 million of our consolidated income from operations before corporate expenses and eliminations.
Industry Background
According to the 2011-2012 APPASimmons Fall 2014 National Pet OwnersConsumer Survey, U.S. pet ownership is at its highest level, with 73 million households, or 62%, owning a pet. During the past decade, the number of pet-owningU.S. households increased 15%.with dogs or cats in 2014 declined to 51.1% from a previous high of 53.3% in the prior year, which is consistent with the 51 – 53% range since 2011.
The pet industry includes food, supplies, veterinarian care, and services and live animals. We operate primarily in the pet supplies segment of the industry. This segment includes: products for dogs and cats, including edible bones, premium healthy edible and non-edible chews, rawhide, toys, pet carriers, grooming supplies and other accessories; products for birds, small animals and specialty pets, including food,
cages and habitats, toys, chews, and related accessories; animal and household health and insect control products; products for fish, reptiles and other aquarium-based pets, including aquariums, furniture and lighting fixtures, pumps, filters, water conditioners and supplements, and information and knowledge resources; and products for horses and livestock. According to Mintel, U.S. retail sales ofPackaged Facts, the pet food and supplies in 2017 are expected to total approximately $35 billion, from approximately $28segment was $14.5 billion in 2010.revenue in 2014, up 2.5% from 2013. We also operate in the super premium category of dog and cat food and treats. Mintel estimates the total pet food market to be approximately $21 billion in 2017. We believe the pet food market is experiencing an upscale thrust, featuring products that are natural, functional and address specific dietary needs of animals, primarily dogs and cats. We estimate the current applicable market opportunity for our high-end, premium and super-premium dog and cat food and treats to be approximately $4 billion.
We believe this industry growth is due in significant part to favorable demographic and leisure trends, which we expect to continue, albeit potentially at a slower rate due to recessionary pressuresa lower rate of growth in the broader U.S. economy. The key demographics bolstering the U.S. pet supplies market are the growth rates in the number of children under 18 and the number of adults over age 55. According to 20102012 U.S. interim census data, approximately 40%41% of the population is 45 years or older. Households with children tend to own more pets, and adults over 55 are more likely to be “empty nesters,”nesters” who keep pets as companions and have more disposable income and leisure time available for pets. In addition, many pet supplies products (e.g., dog and cat food, dog chews, bird food, grooming supplies, pest control, etc.) are routinely consumed and replenished. For example, as many as 87% of dog owners and 67% of cat owners regularly purchase some type of treat.
The U.S. pet supplies market is highly fragmented with approximately 1,400 manufacturers, consisting primarily of small companies with limited product lines. The majority of these manufacturers do not have a captive sales and logistics network and must rely on us or other independent distributors to supply their products to regional pet specialty chains and independent retailers. According to Mintel,Packaged Facts, pet supplies sales are up 19 percentincreased 14.9% over the lastpast five years,years. Sales are expected to increase an additional 13% to $16.8 billion by 2019, indicating thatthe strength of this category has been able to weather the recession fairly well.category.
The pet food and supplies industry retail channel also remains fragmented, with approximately 7,6008,300 independent pet supply stores in the United States and only two national specialty retailers, PetSmart and PETCO. These two “pet superstores” have grown rapidly, and pet products have also become a growing category in mass merchandisers, discounters, grocery outlets and grocery outlets.the e-commerce channel. PetSmart and PETCO typically offer the broadest product selection with competitive prices and a growing array of pet services. Mass merchandisers, supermarkets and discounters have historically carried a limited product assortment that features primarily pet food, but we believe these retailers are devoting more shelf space to meet increased consumer demand for premium pet supplies. Independent pet stores typically have a relatively broad product selection and attempt to differentiate themselves by offering premier brands and knowledgeable service.
Proprietary Branded Pet Products
Our principal pet supplies categories are dog &and cat, aquatics, bird &and small animal, foodwild bird feed and animal health and nutrition products.
Dog & Cat.We are a leading marketerThe dog and producer ofcat category, featuring the brands Nylabone, Four Paws, Cadet®, TFH Publications, Pet Select, Pet Love and Mikki®, is an industry leader in manufacturing and marketing premium healthy edible and non-edible chews, interactive toys, super premium dog and cat food, toys, grooming supplies, pet carriers and other accessories, and information and knowledge resources featuring the brands Nylabone, Four Paws, TFH, Pet Select, Interpet, Pet Love and Mikki®. Nylabone has a strong history of developing innovative new products such as the NutriDent® Edible Dental Brush Chews, Toro and Lobo as well as numerous other award winning dog toys. Four Paws products include grooming supplies and toys,pet-care print and digital content.
| • | Nylabone is made in the United States and has a strong history of developing innovative products such as NutriDent® Edible Dental Brush Chews, as well as numerous other award-winning dog toys and healthy chews. |
Four Paws Products include industry leaders in grooming and waste management products under the Wee Wee and Magic Coat Brands.
TFH Publications is a leading producer andglobally recognized publisher of both pet books and magazines. an aquatics magazine.
| • | Breeder’s Choice, featuring the Pinnacle®, AvoDerm®, Simply Natural® and Active Care® brands, is a manufacturer of super premium natural pet food and treats. |
IMS is regarded by the industry as onea manufacturer and supplier of the highesta full-line of quality developersrawhide and manufacturers of super premiumother natural pet fooddog chews, and treats. Breeder’s Choice brands include Pinnacle®, Avoderm®, Simply Natural® and Active Care®.
Aquatics. We are a leading supplier of aquariums and related fixtures and furniture, water conditioners and supplements, sophisticated lighting systems and accessories featuring the brands Aqueon, Zilla, Oceanic Systems, Kent Marine, Coralife and Blagdon.
Small Animal & Wild Bird Feed. We are a leading marketer and producer of specialty pet food for birds,pet and wild birds and small animals, vitamins and nutritional supplements, bird and small animal cages, habitats, transportation devices, toys and other accessories designed for the small animal marketplace featuring the brands Kaytee®, Super Pet®, Critter Trail® and Canopy Scientific®. Kaytee is one of the largest producers of specialty bird feed.
Animal Health. We are a leading marketer and producer of flea, tick, mosquito and other insect control products produced by Wellmark International and sold primarily under the Zodiac,Bio Spot Active CareTM, Adams, Altosid, Pre Strike and Extinguish® brand names. Wellmark is the only domestic producer of (S)-Methoprene, which is an active ingredient to control mosquitoes, fleas, ticks, ants and mites in many professional and consumer insect control applications. We also sell (S)-Methoprene to manufacturers of other insect control products, including Frontline Plus. In addition, through our Farnam operations, we are a leading manufacturer and marketer of innovative health care products for horses, household pets and livestock.horses. Farnam’s portfolio of industry leading brands includes the Farnam umbrella brand, Equicare®, ComboCare ™, IverCare®, Bronco®, Super Mask® and Repel-XII, Endure® for horses, D-Worm ™, BioSpot, Horseshoer’s Secret® and ScratchexVetrolin® for household pets, and Adams ™ and Bite Free ™ insect controls for home and yard care..
Sales Network
Our domestic sales network exists primarily to promote both our proprietary brands and third party partner brands. It provides value-added service to approximately 4,0006,000 customers, the majority of which are independent specialty retail stores for our branded products.with fewer than 10 locations. This includes acquisition and maintenance of premium shelf placement, prompt product replenishment, customization of retailer programs, quick response to changing customer and retailer preferences, rapid deployment and feedback for new products and immediate exposure for acquired brands. The combination of brands in the network also sells many other manufacturers’ brands of pet supplies and combines these products with our branded products intosupplied in single shipments enablingenables our independent customers to dealwork with us on a cost effective basis to meet their pet supplies requirements. We also operate onea sales and logistics facility in the United Kingdom.
Sales and Marketing
Our sales strategy is multi-tiered and designed to capture maximum market share with retailers. Our customers include retailers, such as regional and national specialty pet stores, independent pet retailers, mass merchants, grocery and drug stores.stores, as well as the e-commerce channel. In addition, we also serve the professional market with insect control and health and wellness products tofor use by veterinarians, municipalities, farmers and equine product suppliers. PetSmart accounted for approximately 12%8% of our Pet segment’s net sales in both fiscal 2012 and2015, 10% in fiscal 2011,2014 and 11% in fiscal 2010.2013. PETCO is also a significant customer.
To optimize our product placement and visibility in retail stores, our focused sales resources are segmented as follows:
a sales organization operating by category and channel;
dedicated account teams servicing our largest customers;
a group of account managers focused on regional chains;
a geographic based group of territory managers dedicated to the independent retailer; and
a specialized group of account managers dedicated to the professional and equine markets.
These sales teams deliver our marketing strategy that is consumer, brand and channel driven. We provide value creation with a focus on innovation, product quality and performance, premium packaging, product positioning and consumer value. To execute with excellence, weWe collaborate closely with our customers to identify their needs, jointly develop strategies to meet those needs and deliver programs that include print, broadcast, direct mail and digital execution.
Competition
The pet supplies industry is highly competitive and has experienced considerable consolidation coupled with the emergence of the e-commerce channel in the last fiverecent years. Our branded pet products compete against national and regional branded products and private label products produced by various suppliers. Our largest competitors in most product categories are Spectrum Brands and Hartz Mountain. The Pet segment competes primarily on the basis of brand recognition, innovation, upscale packaging, quality and service. Our Pet segment’s sales and logistics operations compete with Animal Supply Co., Phillips Pet Food & Supplies and a number of smaller local and regional distributors, with competition based on product selection, price, value-added services and personal relationships.
Garden Segment
Overview
We are a leading company in the consumer lawn and garden market in the United States and offer both premium and value-oriented branded products. We market and produce a broad array of premium brands, including Pennington, The Rebels, AMDRO, Grant’s, Lilly Miller, Ironite, Sevin, Over-N-Out, Norcal Pottery, New England Pottery, GKI/Bethlehem Lighting and Matthews Four Seasons.Over-N-Out. We also produce value brands at lower prices, including numerous private label brands. In addition, our Garden segment operates a sales and logistics network that strategically supports its brands. In fiscal 2012,2015, the Garden segment accounted for $769$756 million of our consolidated net sales and $40$60.1 million of our consolidated income from operations before corporate expenses and eliminations.
Industry Background
We believe that gardening is one of the most popular leisure activities in the United States, although in recent years our gardenGarden segment has been adversely impacted by thefluctuations in input costs weather and global recessionary economic environment. Packaged Facts assertsweather. The Freedonia Group predicts that the economy has brought more homeowners into their yards.household participation in lawn and garden activities will rebound slightly through 2018. The key demographic bolstering our lawn and garden market is the growth rate in the number of adults over age 55 who arewhich is projected to increase from 88 million in 2015 to 99 million in 2020. This age group is more likely to be “empty nesters” and have more disposable income and leisure time available for garden activities. As the baby boom generation ages, this segment is expected to grow faster than the total population. According to 20102012 U.S. interim census data, approximately 40%41% of the population is 45 years or older. We believe that this demographic should increase the number of lawn and garden product users. With more people gardening in their yards and the potential trends of food gardening and organic gardening, we perceive this market as staying intact and showing slow positive growth. We estimate the retail sales of the lawn and garden supplies industry in the categories in which we participate to be approximately $6$12.0 billion. In addition, we participate in the pottery and seasonal décor markets.market. We believe that the industry will continue to grow, albeit potentially at a slower rate in the near term due to industry dynamics.
Lawn and garden products are sold to consumers through a number of distribution channels, including home centers, mass merchants, independent nurseries and hardware stores. Home and garden centers and mass merchants oftentypically carry one or twomultiple premium product lines or brands and one value brand.brands. Due to the rapid expansion and consolidation of mass merchants and home and garden centers in the last 15 years, the concentration of purchasing power for the lawn and garden category has increased dramatically. We expect the growth of home and garden centers, such as Home Depot and Lowe’s, and mass merchants, such as Wal*Mart, to continue to concentrate industry distribution.
Proprietary Branded Lawn and Garden Products
Our principal lawn and garden product lines are grass seed, wild bird feed, insect control products, lawn and garden care products, decorative outdoor patio products and Christmas products and lighting. Our Pennington brand is one of the largest in grass seed, pottery and wild bird feed, and our Amdro brand is a leading portfolio of fire ant baitcontrol products. We are also a leading marketer of indoor and outdoor pottery products through our Norcal Pottery and New England Pottery brands.
Grass Seed. We are a leading marketer, producer and producerdistributor of numerous mixtures and blends of cool and warm season turf grass for both the residential and professional markets, as well as forage and wild game seed mixtures. We sell these products under the Pennington Seed, Pennington, Penkoted® , Max-Q®, ProSelect ™, Tournament Quality CM, MasterTurf®, The Rebels and Smart Seed® brand names. We also produce numerous private label brands of grass seed. The Pennington grass seed manufacturing facilities are some of the largest and most modern seed coating and conditioning facilities in the industry. In fiscal 2012, Pennington Seed enhanced its Smart SeedTM and 1-Step Complete ™ in its premium grass seed line with a new proprietary mix of multiple fiber sources, polymers and biostimulants to ensure seeds stay in place, germinate and produce deeper, healthy roots to reinforce the benefits of these premium products. Smart Seed is a drought-tolerant grass seed product that develops strong, deep root systems and requires up to 30% less water compared to ordinary grass seed. 1-Step Complete is a pre-mixed combination of mulch, Smart Seed premium grass seed and fertilizer that grows thicker and requires less water to establish.
Wild Bird Products. We are a leading marketer, producer and producerdistributor of wild bird feed, bird feeders, bird houses and other birding accessories in the United States. These products are sold primarily under the Pennington brand name. OurMost of our wild bird feed is treated with Bird-Kote®, a nutritious coating made up of vegetable oil fortified with oil-soluble vitamins and elements needed by wild birds.
Fertilizers and Controls. We are a leading marketer, producer and distributor of lawn and garden weed, moss, insect and pest control products and soil supplements and stimulants. We sell these products under the Knockout®, StrikeAMDRO®, Lilly Miller, Alaska Fish FertilizerMoss Out®, Corry’s®, IMAGE®, Sevin, Over-N-Out, and RooToneRootboost®., Knockout®, Strike® brand names and the Eliminator private label for Wal*Mart. We are also a leading marketer of fire ant bait, sold primarily in the southern United States, under the AMDRO brand name. In addition, we market ant baits, animal repellents and garden aid products under the Grant’s brand name. We manufacture several lines of lawn and garden fertilizers and soil supplements, in granular and liquid form, under the Pennington, Alaska Fish Fertilizer®,, Pro Care, Green Care, Green Charm, Ironite and other private and controlled labels.
Outdoor & Seasonal Decor. We are a leading marketer and distributor of decorative indoor and outdoor pottery products in the United States. We sell theseThese products, sold under the Pennington Norcal Pottery and New England Pottery brand names whichname, include terra cotta, stoneware, ceramic and porcelain pots. We also market seasonal Christmas products and lighting under the brand name GKI/Bethlehem Lighting, and we manufacture a complete line of wooden garden products, including planters, barrel fountains, arbors and trellises that are sold under the Pennington brand name.
Sales Network
Our sales and logistics network exists primarily to promote our proprietary brands and provides us with key access to retail stores for our branded products, acquisition and maintenance of premium shelf placement, prompt product replenishment, customization of retailer programs, quick responses to changing customer and retailer preferences, rapid deployment and feedback for new products, immediate exposure for acquired brands and comprehensive and strategic information. The network also sells other manufacturers’ brands of lawn and garden supplies and combines these products with our branded products into single shipments enabling our customers to deal with us on a cost-effective basis to meet their lawn and garden supplies requirements.requirements.
Sales and Marketing
The marketing strategy for our premium products is focused on meeting consumer needs through product performance, innovation, quality, upscale packaging and retail shelf placement. The marketing strategy for our value products is focused on promotion of the quality and efficacy of our value brands at a lower cost relative to premium brands. Our customers include retailers, such as mass merchants, home improvement centers, independent lawn and garden nurseries, drug and grocery stores, and professional end users. Sales to Wal*Mart represented approximately 30%31%, 28%31% and 31%30%, sales to Lowe’s represented approximately 20%18%, 24%15% and 22%17%, and sales to Home Depot represented approximately 16%, 15%17% and 18%, of our Garden segment’s net sales in fiscal 2012, 20112015, 2014 and 2010,2013, respectively.
To maximize our product placement and visibility in retail stores, we market our products through the following four complementary strategies:
dedicated sales forces represent our combined brand groups;
retail sales and logistics network, which provides in-store training and merchandising for our customers, especially during the prime spring and summer seasons;
dedicated account-managers and sales teams located near and dedicated to serve several of our largest customers; and
selected independent distributors who sell our brands.
Our marketing department begins with the voice of the customer, initiates the product development process and develops our consumer and retailer support plans, including broadcast, print, internet advertising and other media.
Competition
The lawn and garden products industry is highly competitive. Our lawn and garden products compete against national and regional products and private label products produced by various suppliers. Our turf and forage grass seed products, fertilizers, pesticides and combination products compete principally against products marketed by The Scotts Miracle-Gro Company (“Scotts”). Scotts’ dominant position in the lawn and garden industry is a significant competitive disadvantage for our similar garden products. In addition, Spectrum Brands is a strong competitor in yard and household insecticides. Our Garden segment competes primarily on the basis of its strong premium and value brands, quality, service, price and low cost manufacturing. Our Garden segment’s sales and logistics operations also compete with a large number of distributors, with competition based on price, service and personal relationships.
Supply ChainManufacturing
We operate one integrated supply chain responsible for manufacturing, logistics, purchasing and sales and operations planning for both our Pet and Garden segments.
Manufacturing
Central manufacturesmanufacture the majority of itsour branded products in 3231 manufacturing facilities, located primarily in the United States. In addition, certain of our proprietary branded products are manufactured by contract manufacturers. We have also entered into an exclusive arrangement with a third party to manufacture one of our registered active ingredients, (S)-Methoprene, the active ingredientfor use in ourthat third party’s flea and tick control products.
Purchasing
Central purchasesWe purchase most of itsour raw materials from a number of different suppliers. In addition, we purchase one of the raw materials used to manufacture (S)-Methoprene from a single source of supply. The Company
maintainsWe maintain an inventory of this raw material (in addition to our (S)-Methoprene inventory) to reduce the possibility of any interruption in the availability of (S)-Methoprene, but a prolonged delay in obtaining (S)-Methoprene or this raw material could result in a temporary delay in product shipments and have an adverse effect on our Pet Products’segment’s financial results.
The key ingredients in our fertilizer and insect and weed control products are commodity and specialty chemicals, including phosphates, urea, potash, herbicides, insecticides and fungicides.
The principal raw materials required for theour wild bird feed operations are bulk commodity grains, including millet, milo and sunflower seeds, which are generally purchased from large national commodity companies and local grain cooperatives. In order to ensure an adequate supply of grains and seed to satisfy expected production volume, Central enterswe enter into contracts to purchase a portion of itsour expected grain and seed requirements at future dates by fixing the quantity, and often the price, at the commitment date. Although we have never experienced a severe interruption of supply, we are exposed to price risk with respect to the portion of our supply which is not covered by contracts with a fixed price.
From the fourth quarter ofIn fiscal 2006 to fiscal 2008,2013, prices for some of our key raw material inputs for our bird feed grains increased substantially. In fiscal 2009 and fiscal 2010, grain costs declined due primarily to deflationary pressures impacting the broader economy. During fiscal 2011, prices for some of our key inputs increased substantially. In fiscal 2012, prices continued to increase from 2012 increases due in part to drought conditions throughout much of the United States. Although by the end of the year, prices began to decline for
certain commodities. In fiscal 2014, prices decreased substantially compared to fiscal 2013. Our weighted average cost per pound for our primary bird feed grains increaseddecreased approximately 11%32% for fiscal year 20122014 compared to fiscal 2011. Although we have been able2013, and also decreased slightly in fiscal year 2015 compared to negotiate some price increases withfiscal 2014. The decrease in commodity costs is reflected in decreased sale prices to our retailers, it is possible price increases may not fully offset rising costs in the future, resulting in margin erosion.retailers.
Logistics Network
Our distribution network consists of 28 facilities strategically placed across the United States and one facility in the United Kingdom to allow us to service both our mass market customers as well as our independent specialty retail stores for our branded products. This network also supports distribution of many other manufacturers’ brands and combines these products with our branded products into single shipments, enabling us to serve our customers in an effective and cost efficient manner.
Significant Customers
Wal*Mart, our largest customer, represented approximately 17%16%, 16%17% and 17%16% of our total company net sales in fiscal 2012, 2011,2015, 2014 and 2010,2013, respectively, and represented approximately 30%, 28% and 31% of our Garden segment’s net sales in both fiscal 2012, 20112015 and 2010,2014, and 30% in fiscal 2013. Sales to Lowe’s represented approximately 8%, 7% and 8% of our total company net sales in fiscal 2015, 2014 and 2013, respectively, and represented approximately 18%, 15% and 17% of our Garden segment’s net sales in fiscal 2015, 2014 and 2013, respectively. Sales to Home Depot represented approximately 7% of our total company net sales in fiscal 2015 and 8% in both fiscal 2014 and 2013, and represented approximately 16%, 15%17% and 18% of our Garden segment’s net sales in fiscal 2012, 20112015, 2014 and 2010, respectively. Sales to Lowe’s represented approximately 9%, 12% and 10% of our total company net sales in fiscal 2012, 2011 and 2010, respectively, and represented approximately 20%, 24% and 22% of our Garden segment’s net sales in fiscal 2012, 2011 and 2010,2013, respectively. PetSmart represented approximately 12%8% of our Pet segment’s net sales in fiscal 2012 and2015, 10% in fiscal 2011,2014 and 11% of our Pet segment’s net sales in fiscal 2010.2013. PETCO is also a significant customer.
Patents and Other Proprietary Rights
Our branded products companies hold numerous patents in the United States and in other countries and have several patent applications pending. We consider the development of patents through creative research and the maintenance of an active patent program to be advantageous to our business, but we do not regard the holding of any particular patent as essential to our operations.
In addition to patents, we have numerous active ingredient registrations, end-use product registrations and trade secrets, including certain technology used in the Wellmark operations for the production of (S)-Methoprene, which has been licensed to us from Novartis. This license is perpetual but non-exclusive. In addition, we have developed certain improvements that are proprietary to usimprovements relating to the synthesis of (S)-Methoprene. The success of certain portions of our business, especially our Wellmarkanimal health operations, partly depends on our ability to continue to maintain trade secret information which has been licensed to us, and to keep both licensed and owned trade secret information confidential.
Along with patents, active ingredient registrations, end use product registrations and trade secrets, we own a number of trademarks, service marks, trade names and logotypes. Many of our trademarks are registered but some are not. We are not aware of any reason we cannot continue to use our trademarks, service marks and trade names in the way that we have been using them.
Employees
As of September 29, 2012,26, 2015, we had approximately 3,6003,300 employees, of which approximately 3,4003,100 were full-time employees and 200 were temporary or part-time employees. We also hire substantial numbers of additional temporary employees for the peak lawn and garden shipping season of February through June to meet the increased demand experienced during the spring and summer months. The majority of our temporary
employees are paid on an hourly basis. NoneExcept for 47 employees at a facility in Puebla, Mexico, none of our employees areis represented by a labor union. We consider our relationships with our employees to be good.
Environmental and Regulatory Considerations
Many of the products that we manufacture or distribute are subject to local, state, federal and foreign laws and regulations relating to environmental matters. Such regulations are often complex and are subject to change. In the United States, all pesticides must be registered with the United States Environmental Protection Agency (the “EPA”), in addition to individual state and/or foreign agency registrations, before they can be sold. Fertilizer products are also subject to state Department of Agriculture registration and foreign labeling regulations. Grass seed is also subject to state, federal and foreign labeling regulations.
The Food Quality Protection Act (FQPA), establishes a standard for food-use pesticides, which is a reasonable certainty that no harm will result from the cumulative effect of pesticide exposures. Under this Act, the EPA is evaluating the cumulative risks from dietary and non-dietary exposures to pesticides. The pesticides in our products, which are also used on foods, will be evaluated by the EPA as part of this non-dietary exposure risk assessment.
In addition, the use of certain pesticide and fertilizer products is regulated by various local, state, federal and foreign environmental and public health agencies. These regulations may include requirements that only certified or professional users apply the product or that certain products be used only on certain types of locations (such as “not for use on sod farms or golf courses”), may require users to post notices on properties to which products have been or will be applied, may require notification of individuals in the vicinity that products will be applied in the future or may ban the use of certain ingredients. We believe we are operating in substantial compliance with, or taking action aimed at ensuring compliance with, these laws and regulations.
Various federal, state and local laws, including the federal Food Safety Modernization Act, also regulate pet food products and give regulatory authorities the power to recall or require re-labeling of products. We believe we are in substantial compliance or are taking steps to ensure that we are in compliance with these provisions.
Various local, state, federal and foreign environmental laws also impose obligations on various entities to clean up contaminated properties or to pay for the cost of such remediation, often upon parties that did not actually cause the contamination. Accordingly, we may become liable, either contractually or by operation of
law, for remediation costs even if the contaminated property is not presently owned or operated by us, or if the contamination was caused by third parties during or prior to our ownership or operation of the property. With our extensive acquisition history, we have acquired a number of manufacturing and distribution facilities, and most of these facilities have not been subjected to Phase II environmental tests to determine whether they are contaminated.
Environmental regulations may affect us by restricting the manufacturing or use of our products or regulating their disposal. Regulatory or legislative changes may cause future increases in our operating costs or otherwise affect operations. Although we believe we are and have been in substantial compliance with such regulations and have strict internal guidelines on the handling and disposal of our products, there is no assurance that in the future we may not be adversely affected by such regulations or incur increased operating costs in complying with such regulations. However, neither the compliance with regulatory requirements nor our environmental procedures can ensure that we will not be subject to claims for personal injury, property damages or governmental enforcement.
Executive Officers
The following table sets forth the name, age and position of our executive officers as of November 30, 2012.December 1, 2015.
Name | Age | Position | ||||
John R. Ranelli | 69 | President, Chief Executive Officer and acting President – Pet Segment | ||||
William E. Brown | Chairman of the Board | |||||
| ||||||
| ||||||
| ||||||
| ||||||
| ||||||
Michael A. Reed | Executive Vice President | |||||
George Yuhas | General Counsel | |||||
| ||||||
John R. Ranelli. Mr. Ranelli has been our President and Chief Executive Officer since February 2013. Since March 2013, Mr. Ranelli has also been our acting President – Pet Segment. From 2011 to 2012, Mr. Ranelli was President and CEO of Woolrich Inc., an outdoor clothing company. From 2008 to 2011, Mr. Ranelli was an advisor to a number of companies and private equity firms. From 2007 to 2008, Mr. Ranelli was President and CEO of Mikasa Inc., a global dinnerware, crystal and home accessories company. From 1999 to 2006, Mr. Ranelli was Chairman, Chief Executive Officer and President of FGX International, a global optical and jewelry company. Previously, he served in senior executive capacities with Stride Rite Corporation, Deckers Outdoor Corporation, TLC Beatrice and The Timberland Company. Mr. Ranelli is a director of Woolrich, Inc. and serves as its non-executive Chairman.
William E. Brown. Mr. Brown, who is currently on leave, has been our Chairman since 1980. SinceFrom 1980 to June 2003 and from October 2007 to February 2013, Mr. Brown has also served as our Chief Executive Officer, a position he previously held from 1980 to June 2003.Officer. From 1977 to 1980, Mr. Brown was Senior Vice President of the Vivitar Corporation with responsibility for Finance, Operations, and Research & Development. From 1972 to 1977, he was with McKesson Corporation where he was responsible for its 200-site data processing organization. Prior to joining McKesson Corporation, Mr. Brown spent the first 10 years of his business career at McCormick, Inc. in manufacturing, engineering and data processing.
Janet Brady.David N. Chichester. Ms. BradyMr. Chichester has been ourActing Chief Financial Officer since September 2015. As a Partner of Tatum, a Randstad company, he served as interim CFO or as a consultant for several companies from 2005 through 2015. Mr. Chichester served as Senior Vice President Human Resources since February 2011. Ms. Brady was an executive at the Clorox CompanyFinance Starbucks Corporation from 19762001 to 2003 and, in Tokyo, as Chief Financial Officer Starbucks Coffee Japan, Ltd. from 2003 to 2004. Mr. Chichester served as its Vice President, Human ResourcesChief Financial Officer at Red Roof Inns, Inc. from 19931996 to 2003.
Gus Halas. Mr. Halas has1999. Prior to these positions, he held senior management positions in finance at Integrated Health Services, Inc., Marriott Corporation and General Electric Credit Corporation, and served as Presidentan investment banker at Warburg Paribas Becker Incorporated and Chief Executive Officerin several roles at The First National Bank of Chicago. He has also been on the Central Operating Companies since April 2011. Mr. Halas was a consultant to the Company from 2009 until April 2011. From 2003 to 2009, Mr. Halas was Chairman, President and CEOboard of T3 Energy Services. He previously served as President and Chief Executive Officerdirectors of Clore Automotive and Marley Cooling Tower Company and held senior executive positions with a number of other companies including Ingersoll-Dresser Pump Company and Sulzer Industries. Mr. Halas is also a director of Triangle Petroleum Corporation, an energy exploration and production company.
Paul Hibbert. Mr. Hibbert has been Senior Vice President, Supply Chain since October 2011 and for the prior two years served as Vice President, Supply Chain Garden Products. In 2009, Mr. Hibbert served as a supply chain consultant for BioLab, Inc/Chemtura. From 2007 to 2008, Mr. Hibbert was the Vice President Supply Chain for United Industries. From 2003 to 2007, he was the Director of Supply Chain with Biolab, Inc.
Steven LaMonte. Mr. LaMonte has been our Executive Vice President, President – Garden Segment since May 2012. From 2009 to May 2012, Mr. LaMonte served as VP Latin America & Asia Pacific Regions for Johnson & Johnson’s McNeil Laboratories division. From 2006 to 2009, Mr. LaMonte was Worldwide Vice President, RX-OTC Switch & Innovation at Johnson & Johnson. Mr. LaMonte previously held numerous leadership positions at Pfizer Consumer Healthcare, Schering-Plough, Nestle Foods and other consumer productsseveral companies.
Frank Palantoni. Mr. Palantoni has been our Executive Vice President, President – Pet Segment division since February 2011. From 2006 to 2011, Mr. Palantoni was chief executive officer of P3 Capital Management LLC, an advisory and private equity firm specializing in consumer goods acquisitions and product development. He previously served as president and chief executive officer of Prestige Brands, Inc. and as a senior executive of Novartis Pharmaceuticals AG, Gerber Products Company and Groupe Danone.
Michael A. Reed. Mr. Reed has been Executive Vice President since June 2000 and was President of the Garden Products division from October 2007 to May 2012. Mr. Reed served as President of the Pet Products division from 2003 to 2004. Previously, Mr. Reed served as President and CEO of PM Ag Products, Inc., a wholly owned subsidiary of global agri-business Tate & Lyle, PLC.
George Yuhas. Mr. Yuhas has been our General Counsel since March 2011. He previously served as2011 and our Secretary since September 2015. From 1984 to March 2011, he was a partner specializing in litigation at Orrick, Herrington & Sutcliffe LLP since 1984.LLP.
Lori A. Varlas.Ms. Varlas has been Senior Vice President, Chief Financial Officer and Secretary since December 2010. From 2006 to 2010, Ms. Varlas served as Vice President Finance at Sun Microsystems. Prior to joining Sun, Ms. Varlas was Vice President of Finance at PeopleSoft and held a variety of senior finance positions from 1998 to 2005. Ms. Varlas also held positions at Chiron Corporation, Specialty Foods and Price Waterhouse.
Available Information
Our web site iswww.central.com. We make available free of charge, on or through our web site, our annual, quarterly and current reports, and any amendments to those reports, as soon as reasonably practicable after electronically filing or furnishing such reports with the Securities and Exchange Commission. Information contained on our web site is not part of this report.
This Form 10-K contains forward-looking statements that involve risks and uncertainties. Our actual results could differ materially from those anticipated in these forward-looking statements as a result of factors both in and out of our control, including the risks faced by us described below and elsewhere in this Form 10-K.
You should carefully consider the risks described below. In addition, the risks described below are not the only ones facing us. We have only described the risks we consider to be material. However, there may be additional risks that are viewed by us as not material at the present time or are not presently known to us. Conditions could change in the future, or new information may come to our attention that could impact our assessment of these risks.
If any of the events described below were to occur, our business, prospects, financial condition and/or results of operations could be materially adversely affected. When we say below that something could or will
have a material adverse effect on us, we mean that it could or will have one or more of these effects. In any such case, the price of our common stock could decline, and you could lose all or part of your investment in our company.
We are in the process of implementing a transformational change within our company, which could result in increased expenses over the next few years.
In fiscal 2012, we continued the process of transformational change that we embarked upon in fiscal 2011, consisting of a comprehensive series of organizational and operational initiatives intended to improve our sales and marketing, profitability and operational effectiveness. We expect to continue to implement these initiatives over the next several years. The strategic objective of these initiatives is to transform the Company from a portfolio of separately run businesses into an integrated, multi-brand company. In connection with this change, we are strengthening our management team, reorganizing operating units, consolidating facilities, developing a system of shared services and eliminating duplicative services, standardizing processes, training employees in new approaches and investing in systems, facilities and people.
During fiscal 2012, we closed nine distribution and manufacturing facilities, while opening and upgrading others, leaving us with a net reduction of five facilities for fiscal year 2012. The operational issues associated with the closures, along with other supply issues, resulted in execution disruptions that delayed fulfilling orders for some customers as we transitioned certain operational activities. These disruptions adversely affected our revenues and operating earnings. While we believe we have resolved these particular issues, we may experience other operational issues as we continue to implement our transformational initiatives. These operational issues could have a material adverse effect on our performance and financial results.
During fiscal 2012, we incurred approximately $12.1 million of costs related to our transformational change initiatives. We anticipate incurring substantial additional costs relating to the transformation in each of the next several years.
There can be no assurance that we will be able to successfully execute the transformational change initiatives or that we will be able to do so within the anticipated time period. During the process of implementation we will be making substantial investments in our business and will incur substantial transitional costs. We anticipate that these investments and transitional costs will adversely affect our operating results until the transformation process is complete.
Our operating results and cash flow are susceptible to fluctuations.
We expect to continue to experience variability in our net sales, net income and cash flow on a quarterly basis. Factors that may contribute to this variability include:
seasonality and adverse weather conditions;
fluctuations in prices of commodity grains and other input costs;
seasonality and adverse weather conditions;
costs or operational problems arising from our transformational change initiatives;problems;
shifts in demand for lawn and garden and pet products;
changes in product mix, service levels, marketing and pricing by us and our competitors;
the effect of acquisitions, including the costs of acquisitions that are not completed;acquisitions; and
economic stability of and strength of our relationshiprelationships with retailers.
These fluctuations could negatively impact our business and the market price of our common stock.
Seeds and grains we use to produce bird feed and grass seed are commodity products subject to price volatility that has had, and could have, a negative impact on us.
Our financial results are partially dependent upon the cost of raw materials and our ability to pass along increases in these costs to our customers. In particular, our Pennington and Kaytee businesses are exposed to fluctuations in market prices for commodity seeds and grains used to produce bird feed. Historically, market prices for commodity seeds and grains have fluctuated in response to a number of factors, including changes in United States government farm support programs, changes in international agricultural and trading policies and weather conditions during the growing and harvesting seasons.
To mitigate our exposure to changes in market prices, we enter into purchase contracts for grains, bird feed and grass seed to cover a limited portion of our purchase requirements for a selling season. Since these contracts
cover only a portion of our purchase requirements, as market prices for such products increase, our cost of production increases as well. In contrast, if market prices for such products decrease, we may end up purchasing grains and seeds pursuant to the purchase contracts at prices above market.
In fiscal 2011 and fiscal 2012, prices for some of2013, our key crops increased substantially. Our weighted average cost per pound for our primary bird feed grains increased approximately 11% for fiscal year 201215% compared to fiscal 2011.2012. In fiscal 2014, our weighted average cost per pound for our primary bird feed grains decreased approximately 32% compared with fiscal year 2013. In fiscal 2015, our weighted average cost per pound for our primary bird feed grains decreased slightly from fiscal 2014. Although we have been able to negotiate some price increases in the past with our retailers, it is possible that price increases may not fully offset rising costs in the future, resulting in margin erosion. We can provide no assurance as to the timing or extent of our ability to implement additional price adjustments in the context of rising costs or in the event of increased costs in the future. Similarly, we can provide no assurance of our ability to retain pricing with our retailers in the context of declining costs. We also cannot predict to what extent price increases may negatively affect our sales volume. As retailers pass along price increases, consumers may shift to our lower margin bird feed, switch to competing products or reduce purchases of wild bird feed products.
Our success depends upon our retaining key personnel.
Our performance is substantially dependent upon the continued services of our senior management team. We have entered into an amendment to the employment agreement with John R. Ranelli, our President, Chief Executive Officer and acting President – Pet Segment which contemplates his retirement in September 2016, and plan to launch a search for his successor during fiscal 2016. William E. Brown, our Chairman of the Board, commenced a leave of absence in July as he continues to recover from injuries he sustained in an accident in his home earlier in the year. In addition, in September 2015, our Chief Financial Officer resigned, and our board of directors appointed David N. Chichester, a member of our board, as Acting Chief Financial Officer through February 2016. The loss of the services of these persons could have a material adverse effect on our business unless adequate replacements are found. Our future performance depends on our ability to attract and retain skilled employees, including a new Chief Executive Officer and new Chief Financial Officer. We cannot assure you that we will be able to retain our existing personnel or attract additional qualified employees in the future.
We are subject to significant risks associated with innovation, including the risk that our new product innovations will not produce sufficient sales to recoup our investment.
We believe that our future success will depend upon, in part, our ability to continue to improve our existing products through product innovation and to develop, market and produce new products. We cannot assure you that we will be successful in the introduction, marketing and production of any new products or product innovations, or that we will develop and introduce in a timely manner improvements to our existing products which satisfy customer needs or achieve market acceptance. Our failure to develop new products and introduce them successfully and in a timely manner could harm our ability to grow our business and could have a material adverse effect on our business, results of operations and financial condition.
During fiscal 2013, we introduced two new Garden products. Despite support from our retailers and substantial marketing spend, the new products did not sell through as expected, and we took an $11.2 million charge related to inventory and product and packaging changes at the end of the fourth quarter of fiscal 2013 relating to the new products. Despite a concerted effort to improve consumer takeaway of the products through product, packaging and placement changes, as well as aggressive promotions, we continued to experience weak consumer sales of the products in their second season and late in the third quarter of fiscal 2014 major retailers indicated that they would not support the products going forward. Consequently, we made the decision to discontinue the two products at the end of the 2014 garden season. As a result, we recorded a $16.9 million charge to operating income in fiscal 2014, to write off the remaining inventory of these products and to account for product returns, promotional allowances and other costs related to the discontinuance of the products. We believe that the period of time to gain consumer acceptance of major innovations is longer in the garden industry than in many industries, which compounds the risks generally associated with major new product innovations.
A decline in consumers’ discretionary spending or a change in consumer preferences could reduce our sales and harm our business.
Our sales ultimately depend on consumer discretionary spending, which is influenced by factors beyond our control, including general economic conditions, the availability of discretionary income and credit, weather, consumer confidence and unemployment levels. For fiscal 2009 and 2010, we experienced declines in sales as the result of the economic downturn. Any material decline in the amount of consumer discretionary spending could reduce our sales and harm our business. Since substantially all of our sales are in the United States, a declining U.S. economy may have a greater impact on us than on our competitors, some of which have substantial international sales. These economic and market conditions, combined with continuing difficulties in the credit markets and the resulting pressures on liquidity, may also place a number of our key retail customers under financial stress, which would increase our credit risk and potential bad debt exposure.
The success of our business also depends in part on our ability to identify and respond to evolving trends in demographics and consumer preferences. For example, from fiscal 2006 through fiscal 2009, the demand for aquatics products declined significantly. In fiscal 2010 and 2011, the demand for aquatic products stabilized and in fiscal 2012 it increased. Similarly, in fiscal 2010, the demand for wild bird feed declined and in fiscal 2011, demand increased. Our failure to timely identify or effectively respond to changing consumer tastes, preferences, spending patterns and lawn and garden and pet care needs could adversely affect the demand for our products and our profitability.
Inflation, deflation, economic uncertainty and other adverse macro-economic conditions may harm our business.
Our revenues and margins are dependent on various economic factors, including rates of inflation or deflation, energy costs, consumer attitudes toward discretionary spending, currency fluctuations, and other
macro-economic factors which may impact levels of consumer spending. In 2009 and 2010, our business was negatively impacted by the downturn in the housing market and by the decline in consumer confidence, as well as other macro-economic factors. During the last two years, we have experienced a significant increase in raw material input costs. Although we increased prices for many of our products, our price increases did not fully offset the increases in our costs, and our margins and profitability suffered as a result. If we are unable to pass through rising input costs and raise the price of our products, or consumer confidence continues to weaken, we may experience gross margin declines.
Supply disruptions in pet birds and small animals may negatively impact our sales.
The federal government and many state governments have increased restrictions on the importation of pet birds and the supply of small animals. These restrictions have resulted in reduced availability of new pet birds and animals and thus reduced demand for pet bird and small animal food and supplies. If these restrictions become more severe, our future sales of these products would likely suffer, which would negatively impact our profitability. In addition, some countries have experienced outbreaks of avian flu. While the number of cases worldwide has declined, a significant outbreak in the United States would reduce demand for our pet and wild bird food and negatively impact our financial results.
Our lawn and garden sales are highly seasonal and subject to adverse weather.
Because our lawn and garden products are used primarily in the spring and summer, the Garden business is seasonal. In fiscal 2012,2015, approximately 66% of our Garden segment’s net sales and 59%58% of our total net sales occurred during our second and third fiscal quarters. Substantially all of the Garden segment’s operating income is generated in this period. Our working capital needs and our borrowings generally peak in our second fiscal quarter, because we are generating lower revenues while incurring expenses in preparation for the spring selling season. If cash on hand and borrowings under our credit facility are ever insufficient to meet our seasonal needs or if cash flow generated during the spring and summer is insufficient to repay our borrowings on a timely basis, this seasonality could have a material adverse effect on our business.
Because demand for lawn and garden products is significantly influenced by weather, particularly weekend weather during the peak gardening season, our results of operations and cash flow could also be adversely affected by certain weather patterns such as unseasonably cool or warm temperatures, heavy rains, water shortages or floods.
Rising energy prices could adversely affect our operating results.
During fiscal 2011 and 2012, energy prices increased substantially, which resulted in increased fuel costs for our businesses and increased raw materials costs for many of our branded products. Energy prices have significantly declined since then. Rising energy prices in the future could adversely affect consumer spending and demand for our products and increase our operating costs, both of which would reduce our sales and operating income.
We depend on a few customers for a significant portion of our business.
Wal*Mart, our largest customer, accounted for approximately 16% of our net sales in fiscal 2015, 17% of our net sales in fiscal 2012,2014 and 16% in fiscal 2011 and 17% in fiscal 2010.2013. Lowe’s accounted for approximately 9%8% of our net sales in fiscal 2012, 12%2015, 7% in fiscal 20112014 and 10%8% in fiscal 2010.2013. Home Depot accounted for approximately 7% of our net sales in fiscal 2015, 8% in fiscal 2014 and 8% in fiscal 2013. In addition, Home Depot, PetSmart and PETCO are also significant customers, although each accounted for less than 10% of our net sales and together with Wal*Mart, Lowe’s and Lowe’s,Home Depot, accounted for approximately 45%40% of our net sales in fiscal 2012and fiscal 2011, and 46%2015, 41% in fiscal 2010.2014 and 43% in fiscal 2013. The market shares of many of these key retailers have increased and may continue to increase in future years.
The loss of, or significant adverse change in, our relationship with any of these key retailers could cause our net sales, income from operations and cash flow to decline. The loss of, or reduction in, orders from any significant customer, losses arising from customer disputes regarding shipments, fees, merchandise condition or related matters, or our inability to collect accounts receivable from any major customer could reduce our income from operations and cash flow.
We may be adversely affected by trends in the retail industry.
With the growing trend towards retail trade consolidation, we are increasingly dependent upon key retailers whose leverage is growing. Our business may be negatively affected by changes in the policies of our retailers, such as inventory destocking, limitations on access to shelf space, price demands and other conditions. In addition, as a result of the desire of retailers continue to more closely manage inventory levels there is a growing trend among retailers toand make purchases on a “just-in-time” basis. This requires us to shorten our lead time for production in certain cases and to more closely anticipate demand, which could in the future require the carrying of additional inventories and an increase in our working capital and related financing requirements. This shift to “just-in-time” can also cause retailers to delay purchase orders, which can cause a shift in sales from quarter to quarter. Decisions to move in or out of a market category by leading retailers can also have a significant impact on our business.
A significant deterioration in the financial condition of one of our major customers could have a material adverse effect on our sales, profitability and cash flow. We continually monitor and evaluate the credit status of our customers and attempt to adjust sales terms as appropriate. Despite these efforts, a bankruptcy filing or liquidation by a key customer could have a material adverse effect on our business, results of operations and financial condition in the future.
We cannot be certain that our product innovations and marketing successes will continue.
We believe that our past performance has been based on, and our future success will depend upon, in part, our ability to continue to improve our existing products through product innovation and to develop, market and produce new products. We cannot assure you that we will be successful in the introduction, marketing and production of any new products or product innovations, or that we will develop and introduce in a timely manner innovations to our existing products which satisfy customer needs or achieve market acceptance. Our failure to develop new products and introduce them successfully and in a timely manner could harm our ability to grow our business and could have a material adverse effect on our business, results of operations and financial condition.
Issues with products may lead to product liability, personal injury or property damage claims, recalls, withdrawals, replacements of products, regulatory actions by governmental authorities that could divert resources, affect business operations, decrease sales, increase costs, and put us at a competitive disadvantage, any of which could have a significant adverse effect on our results of operations and financial condition.
We have experienced, and may in the future experience, issues with products that may lead to product liability, recalls, withdrawals, replacements of products, or regulatory actions by governmental authorities. For example, during 2012, we experienced four unrelated recalls relating to one batch of baby bird feed products, one batch of mice, rat and hamster feed, one batch of dog food and a line of Christmas tree bases. In 2012, we recorded approximately $4.9 million of costs related to these recalls. TheseProduct recalls or future recallsother governmental regulatory action directed at product sales could result in increased governmental scrutiny, reputational harm, reduced demand by consumers for our products, decreased willingness by retailer customers to purchase or provide marketing support for those products, absenceunavailability or increased
cost of insurance, or additional safety and testing requirements. Such results could divert development and management resources, adversely affect our business operations, decrease sales, increase legal fees and other costs, and put us at a competitive disadvantage compared to other manufacturers not affected by similar issues with products, any of which could have a significant adverse effect on our results of operations and financial condition.
Competition in our industries may hinder our ability to execute our business strategy, increase our profitability or maintain relationships with existing customers.
We operate in highly competitive industries, which have experienced increased consolidation in recent years. We compete against numerous other companies, some of which are more established in their industries
and have substantially greater revenue and resources than we do. Our products compete against national and regional products and private label products produced by various suppliers. Our largest competitors in the Pet segment are Spectrum Brands and Hartz Mountain, and our largest competitors in the Garden segment are Scotts and Spectrum Brands.
To compete effectively, among other things, we must:
develop and grow brands with leading market positions;
grow market share;
maintain and expand our relationships with key retailers;
continually develop innovative new products that appeal to consumers;
implement effective marketing and sales promotion programs;
maintain strict quality standards;
deliver products on a reliable basis at competitive prices; and
effectively integrate acquired companies.
Competition could lead to lower sales volumes, price reductions, reduced profits, losses, or loss of market share. Our inability to compete effectively could have a material adverse effect on our business, results of operations and financial condition.
Our acquisition strategy involves a number of risks.
We have completed numerous acquisitions and intend further growth through the acquisition of additional companies.
We are regularly engaged in acquisition discussions with a number ofother companies and anticipate that one or more potential acquisition opportunities, including those that would be material, may become available in the near future. If and when appropriate acquisition opportunities become available, we intend to pursue them actively. Acquisitions involve a number of special risks, including:
failure of the acquired business to achieve expected results, as well as the potential impairment of the acquired assets if operating results decline after an acquisition;
diversion of management’s attention;
failure to retain key personnel of the acquired business;
additional financing, if necessary and available, which could increase leverage and costs, dilute equity, or both;
the potential negative effect on our financial statements from the increase in goodwill and other intangibles;
the high cost and expenses of identifying, negotiating and completing acquisitions; and
risks associated with unanticipated events or liabilities.
These risks could have a material adverse effect on our business, results of operations and financial condition.
We have faced, and expect to continue to face, intense competition for acquisition candidates, which may limit our ability to make acquisitions and may lead to higher acquisition prices. We cannot assure you that we
will be able to identify, acquire or manage profitably additional businesses or to integrate successfully any acquired businesses into our existing business without substantial costs, delays or other operational or financial difficulties. In future acquisitions, we also could incur additional indebtedness or pay consideration in excess of fair value, which could have a material adverse effect on our business, results of operations and financial condition.
Our success depends uponIf our retaining key personnel.goodwill, indefinite-lived intangible assets or other long-term assets become impaired, we will be required to record impairment charges, which may be significant.
Our future performance is substantially dependent uponA significant portion of our long-term assets consists of goodwill and other intangible assets recorded as a result of past acquisitions. We do not amortize goodwill and indefinite-lived intangible assets, but rather review them for impairment on a periodic basis or whenever events or changes in circumstances indicate that their carrying value may not be recoverable. We consider whether circumstances or conditions exist which suggest that the continued servicescarrying value of William E. Brown, our Chairmangoodwill and Chief Executive Officer, Gus Halas,other long-lived intangible assets might be impaired. If such circumstances or conditions exist, further steps are required to determine whether the President and Chief Executive Officercarrying value of each of the Central Operating Companies, and our other senior officers. Theindividual assets exceeds its fair value. If analysis indicates that an individual asset’s carrying value does exceed its fair value, we would record a loss equal to the excess of the servicesindividual asset’s carrying value over its fair value.
The steps required by GAAP entail significant amounts of judgment and subjectivity. Events and changes in circumstances that may indicate that there may be an impairment and that interim impairment testing is necessary include, but are not limited to: competitive conditions; the impact of the economic environment on our customer base and on broad market conditions that drive valuation considerations by market participants; our internal expectations with regard to future revenue growth and the assumptions we make when performing impairment reviews; a significant decrease in the market value of our assets; a significant adverse change in the extent or manner in which our assets are used; a significant adverse change in the business climate that could affect our assets; and significant changes in the cash flows associated with an asset. As a result of such circumstances, we may be required to record a significant charge to earnings in our financial statements during the period in which any impairment of these personsour goodwill, indefinite-lived intangible assets or other long-term assets is determined. Any such impairment charges could have a material adverse effect upon us. In addition,on our results of operations and financial condition.
During fiscal 2015, 2014 and 2013, we performed evaluations of the fair value of our indefinite-lived trade names and trademarks. Our expected revenues were based on our future performance depends onoperating plan and market growth or decline estimates for future years. In fiscal 2015, we recognized a $7.3 million non-cash impairment charge related to certain indefinite-lived intangible assets in our ability to attract and retain skilled employees. We cannot assure you that we will be able to retain our existing personnel or attract additional qualified employeesPet Segment as a result of increased competition in the future.marketplace and an expected decline in the volume of sales. The fair value of the indefinite-lived intangible assets exceeded the remaining $15.0 million carrying value at September 26, 2015. No impairment was indicated during our fiscal 2014 or 2013 analysis of our indefinite-lived trade names and trademarks.
Our goodwill is associated with one of the reporting units within our Pet segment. In connection with our annual goodwill impairment testing performed during fiscal 2015, the first step of such testing indicated that the fair value of our reporting segments exceeded their carrying value by more than 10%, and accordingly, no further testing of goodwill was required. During fiscal 2014, the reporting unit’s operating income declined approximately 50% from the comparable fiscal 2013 period. In connection with our annual goodwill impairment testing performed during fiscal 2014, the first step of such testing indicated that the fair value of our reporting segments exceeded their carrying value by more than 10%, and accordingly, no further testing of goodwill was required.
We are implementing a newcontinue to implement an enterprise resource planning information technology system.
In fiscal 2005, we began incurring costs associated with designing and implementing SAP, a new company-wide enterprise resource planning (ERP) software system with the objective of gradually migrating to the new system. Upon completion, thisThis new system will replace ourreplaces numerous existing accounting and financial reporting systems, most of which were obtained in connection with business acquisitions. To date, we have reduced the number of ERP systems from 26 to 7 and expect to further reduce the number of systems during fiscal 2013. We invested an additional $14.4 million in fiscal 2012 for implementation.7. Capital expenditures for our new enterprise resource planning software system for fiscal 20132016 and beyond will depend upon the pace of conversion for those remaining legacy systems. We accelerated the pace of our enterprise resource planning conversion in fiscal 2012. If the accelerated implementation is not executed successfully, thiswe could result inexperience business interruptions. If we do not complete the implementation of the project timely and successfully, we may experience, among other things, additional costs associated with completing this project and a delay in our ability to improve existing operations, support future growth and enable us to take advantage of new applications and technologies. All of this may also result in a distraction of management’s time, diverting their attention from our operations and strategy.
Our inability to protect our trademarks and any other proprietary rights may have a significant, negative impact on our business.
We consider our trademarks to be of significant importance in our business. Although we devote resources to the establishment and protection of our trademarks, we cannot assure you that the actions we have taken or will take in the future will be adequate to prevent violation of our trademarks and proprietary rights by others or prevent others from seeking to block sales of our products as an alleged violation of their trademarks and proprietary rights. There can be no assurance that future litigation by or against us will not be necessary to enforce our trademarks or proprietary rights or to defend ourselves against claimed infringement or the rights of others. Any future litigation of this type could result in adverse determinations that could have a material adverse effect on our business, financial condition or results of operations. Our inability to use our trademarks and other proprietary rights could also harm our business and sales through reduced demand for our products and reduced revenues.
Some of the products that we manufacture and distribute require governmental permits and also subject us to potential environmental liabilities.
Some of the products that we manufacture and distribute are subject to regulation by federal, state, foreign and local authorities. Environmental health and safety laws and regulations are often complex and are subject to change. Environmental health and safety laws and regulations may affect us by restricting the manufacture, sale
or use of our products or regulating their disposal. Regulatory or legislative changes may cause future increases in our operating costs or otherwise affect operations. There is no assurance that in the future we may not be adversely affected by such laws or regulations, incur increased operating costs in complying with such regulations or that we will not be subject to claims for personal injury, property damages or governmental enforcement. In addition, due to the nature of our operations and the frequently changing nature of environmental compliance standards and technology, we cannot predict with any certainty that future material capital expenditures will not be required.
In addition to operational standards, environmental laws also impose obligations on various entities to clean up contaminated properties or to pay for the cost of such remediation, often upon parties that did not actually cause the contamination. Accordingly, we may become liable, either contractually or by operation of law, for remediation costs even if the contaminated property is not presently owned or operated by us, or if the contamination was caused by third parties during or prior to our ownership or operation of the property. With our extensive acquisition history, we have acquired a number of manufacturing and distribution facilities. Given the nature of the past operations conducted by us and others at these properties, there can be no assurance that all potential instances of soil or groundwater contamination have been identified, even for those properties where an environmental site assessment has been conducted. Future events, such as changes in existing laws or policies or their enforcement, or the discovery of currently unknown contamination, may give rise to future remediation liabilities that may be material.
Our business is dependent upon our ability to continue to source products from China.
We outsource a significant amount of our manufacturing requirements to third party manufacturers located in China. This international sourcing subjects us to a number of risks, including: the impact on sourcing or manufacturing of public health and contamination risks in China; quality control issues; social and political disturbances and instability; export duties, import controls, tariffs, quotas and other trade barriers; shipping and transportation problems; and fluctuations in currency values. Because we rely on Chinese third-partythird party manufacturers for a substantial portion of our product needs, any disruption in our relationships with these manufacturers could adversely affect our operations.
The products that we manufacture and distribute could expose us to product liability claims.
Our business exposes us to potential product liability risks in the manufacture and distribution of certain of our products. Although we generally seek to insure against such risks, there can be no assurance that such coverage is adequate or that we will be able to maintain such insurance on acceptable terms. A successful product liability claim in excess of our insurance coverage could have a material adverse effect on us and could prevent us from obtaining adequate product liability insurance in the future on commercially reasonable terms.
Deterioration in operating results could prevent us from fulfilling our obligations under the terms of our indebtedness or impact our ability to refinance our debt on favorable terms as it matures.
We have, and we will continue to have, a significant amount of indebtedness. As of September 29, 2012,26, 2015, we had total indebtedness of approximately $449.8$400 million. This level of indebtedness and future borrowing needs could have material adverse consequences for our business, including:
make it more difficult for us to satisfy our obligations with respect to the terms of our indebtedness;
require us to dedicate a large portion of our cash flow to pay principal and interest on our indebtedness, which would reduce the availability of our cash flow to fund working capital, capital expenditures, acquisitions and other business activities;
increase our vulnerability to adverse industry conditions, including unfavorable weather conditions or continued commodity price increases;
limit our flexibility in planning for, or reacting to, changes in our business and the industries in which we operate;
restrict us from making strategic acquisitions or exploiting business opportunities;
place us at a competitive disadvantage compared to competitors that have less debt; and
limit our ability to borrow additional funds at reasonable rates, if at all.
In addition, since a portion of our debt commitments bear interest at variable rates, an increase in interest rates or interest rate margins as defined under the credit agreement will create higher debt service requirements, which would adversely affect our cash flow.
We are subject to cyber security risks and may incur increasing costs in an effort to minimize those risks.
Our business employs systems and websites that allow for the secure storage and transmission of proprietary or confidential information regarding our customers, employees, suppliers and others, including personal identification information. Security breaches could expose us to a risk of loss or misuse of this information, litigation, and potential liability. We may not have the resources or technical sophistication to anticipate or prevent rapidly-evolving types of cyber attacks. Attacks may be targeted at us, our customers and suppliers, or others who have entrusted us with information. Actual or anticipated attacks may cause us to incur increasing costs, including costs to deploy additional personnel and protection technologies, train employees, and engage third-partythird party experts and consultants. Advances in computer capabilities, new technological discoveries, or other developments may result in the technology used by us to protect transaction or other data being breached or compromised. In addition, data and security breaches can also occur as a result of non-technical issues, including
breach by us or by persons with whom we have commercial relationships that result in the unauthorized release of personal or confidential information. Any compromise or breach of our security could result in a violation of applicable privacy and other laws, significant legal and financial exposure, and a loss of confidence in our security measures, which could have an adverse effect on our results of operations and our reputation.
We do not presently expect to pay dividends in the foreseeable future.
We have never declared nor paid any cash dividends on our common stock or Class A common stock and currently do not intend to do so. Provisions of our credit facility and the indenture governing our senior subordinated notes restrict our ability to pay cash dividends. Any future determination to pay cash dividends will be at the discretion of our Board of Directors, subject to limitations under applicable law and contractual restrictions, and will depend upon our results of operations, financial condition and other factors deemed relevant by our Board of Directors.
We may issue additional shares of our common stock or Class A common stock that could dilute the value and market price of your stock.
We may decide or be required to issue, including upon the exercise of any outstanding stock options, or in connection with any acquisition made by us, additional shares of our common stock or Class A common stock that could dilute the value of your common stock or Class A common stock and may adversely affect the market price of our common stock or Class A common stock.
Our Chairman, through his holdings of our Class B common stock, could exerciseexercises effective control of the Company, which may discourage potential acquisitions of our business and could have an adverse effect on the market price of our stock.
Holders of our Class B common stock are entitled to the lesser of ten votes per share or 49% of the total votes cast, and each share of Class B common stock is convertible at any time into one share of our common stock. Holders of our common stock are entitled to one vote for each share owned. Holders of our Class A common stock and Series B preferred stock have no voting rights, except as required by Delaware law.
As of November 30, 2012,2015, William E. Brown, our Chairman, beneficially owned 1,600,459 shares of our Class B common stock (out of a total of 1,652,262 outstanding shares), 1,418,063 shares of our common stock and 3,259,404 shares of our Class A common stock and thereby controlled approximately 55% of the voting power of our capital stock. Accordingly, except to the extent that a class vote of the common stock is required by applicable law, he can effectively control all matters requiring stockholder approval, including the election of our directors, and can exert substantial control over our management and policies. The disproportionate voting rights of our common stock and Class B common stock and Mr. Brown’s substantial holdings of Class B common stock could have an adverse effect on the market price of our common stock and Class A common stock. Also, such disproportionate voting rights and Mr. Brown’s controlling interest may make us a less attractive target for a takeover than we otherwise might be, or render more difficult or discourage a merger proposal, tender offer or proxy contest, even if such actions were favored by our other stockholders, which could thereby deprive holders of common stock or Class A common stock of an opportunity to sell their shares for a “take-over” premium.
We have authorized the issuance of shares of common stock, Class A common stock and preferred stock, which may discourage potential acquisitions of our business and could have an adverse effect on the market price of our common stock and our Class A common stock.
Pursuant to our Fourth Amended and Restated Certificate of Incorporation, the Board of Directors is authorized to issue up to 80,000,000 shares of our common stock, 100,000,000 shares of our nonvoting Class A common stock and up to 1,000,000 additional shares of preferred stock without seeking the approval or consent of our stockholders, unless required by the NASDAQ Global Market. Although the issuance of the nonvoting Class A common stock would not dilute the voting rights of the existing stockholders, it couldwould have a dilutive effect on the economic interest of currently outstanding shares of common stock and Class B common stock similar to the dilutive effect of subsequent issuances of ordinary common stock. The issuance of the preferred
stock could, depending on the rights and privileges designated by the board with respect to any particular series, have a dilutive effect on the voting interests of the common stock and Class B common stock and the economic interests of our common stock, Class A common stock and Class B common stock. In addition, the disproportionate voting rights of our common stock, preferred stock, Class B common stock and Class A common stock, and the ability of the board to issue stock to persons friendly to current management, may make us a less attractive target for a takeover than we otherwise might be or render more difficult or discourage a merger proposal, tender offer or proxy contest, even if such actions were favored by our common stockholders, which could thereby deprive holders of common stock of an opportunity to sell their shares for a “take-over” premium.
Item 1B. Unresolved Staff Comments
None.
We currently operate 3233 manufacturing facilities totaling approximately 3,354,0004.1 million square feet and 29 sales and logistics facilities totaling approximately 3,693,0003.5 million square feet. Most sales and logistics centers consist of office and warehouse space, and several large bays for loading and unloading. Each sales and logistics center provides warehouse, distribution, sales and support functions for its geographic area. Our executive offices are located in Walnut Creek, California.
The table below lists the Pet segment’s manufacturing and sales and logistics facilities. Numbers in parenthesisparentheses represent multiple locations.
Location | Type of Facility | Owned or Leased | ||
Phoenix, AZ (2) | Sales and Logistics | Owned | ||
Irwindale, CA | Manufacturing | Leased | ||
Sacramento, CA | Sales and Logistics | Leased | ||
Santa Fe Springs, CA | Sales and Logistics | Leased | ||
Aurora, CO | Sales and Logistics | Leased | ||
Tampa, FL | Sales and Logistics | Leased | ||
Council Bluffs, IA | Manufacturing | Owned | ||
| ||||
Jamesburg, | ||||
| Sales and Logistics | Leased | ||
Neptune City, NJ | Manufacturing | Owned | ||
Neptune City, NJ | Manufacturing | Leased | ||
South Brunswick, NJ | Sales and Logistics | Leased | ||
Wood-Ridge, NJ | Manufacturing | Leased | ||
Fairfield, OH | Sales and Logistics | Leased | ||
Cressona, PA | Manufacturing | Owned | ||
Pottsville, PA | Sales and Logistics | Leased | ||
Athens, TX (2) | Manufacturing | Leased | ||
Dallas, TX | Manufacturing | Owned | ||
Dallas, TX | Sales and Logistics | Leased | ||
Algona, WA | Sales and Logistics | Leased | ||
Chilton, WI | Manufacturing | Owned | ||
Franklin, WI | Manufacturing | Leased | ||
Franklin, WI | Manufacturing | Owned | ||
| Sales and Logistics | Leased | ||
Guelph, Ontario, Canada | Manufacturing | Leased | ||
Guangzhou, China | Manufacturing | Leased | ||
Atlixco, Puebla, Mexico | Manufacturing | Owned | ||
Dorking, Surrey, UK | Manufacturing | Leased | ||
Taunton, Somerset, UK | Sales and Logistics | Leased |
The table below lists the Garden segment’s manufacturing and sales and logistics facilities. Numbers in parenthesisparentheses represent multiple locations.
Location | Type of Facility | Owned or Leased | ||
Cullman, AL | Sales and Logistics | Owned | ||
Cullman, AL | Sales and Logistics | Leased | ||
Roll, AZ | Manufacturing | Owned | ||
Yuma, AZ | Manufacturing | Leased | ||
El Centro, CA | Manufacturing | Owned | ||
Ontario, CA | Sales and Logistics | Leased | ||
| ||||
Longmont, CO | Manufacturing | Owned | ||
Covington, GA | Sales and Logistics | Leased | ||
Eatonton, GA | Manufacturing | Owned | ||
Eatonton, GA | Sales and Logistics | Leased | ||
Madison, GA | Manufacturing | Leased | ||
Madison, GA (2) | Manufacturing | Owned | ||
Madison, GA | Sales and Logistics | |||
| ||||
| Owned | |||
Taunton, MA | Sales and Logistics | Leased | ||
Laurel, MD | Sales and Logistics | Leased | ||
Greenfield, MO (2) | Manufacturing | Owned | ||
Greenfield, MO | Sales and Logistics | Owned | ||
Neosho, MO | Manufacturing | Owned | ||
Charlotte, NC | Sales and Logistics | Leased | ||
Sidney, NE | Manufacturing | Owned | ||
Fairfield, OH | Sales and Logistics | Leased | ||
Peebles, OH | ||||
| ||||
| Manufacturing | Owned | ||
Albany, OR | ||||
Lebanon, OR | Manufacturing | Owned | ||
Portland, OR | Sales and Logistics | Leased | ||
Columbia, SC | Sales and Logistics | Owned | ||
Grand Prairie, TX | Sales and Logistics | Leased | ||
Kenbridge, VA | Sales and Logistics | Leased | ||
Northbend, WA | Manufacturing | Leased |
As part of our transformational change initiatives, weWe are reviewing the number, location and size of our manufacturing facilities and expect to make changes over time in order to optimize our manufacturing footprint. In addition, we are in the process of combining our garden and pet products operations in the same warehouses where practical and reducing the number of distribution centers.
We lease 1113 of our manufacturing facilities and 23 of our sales and logistics facilities. These leases generally expire between 20132016 and 2020.2021. Substantially all of the leases contain renewal provisions with automatic rent escalation clauses. The facilities we own are subject to major encumbrances under our principal credit facility. In addition to the facilities that are owned, our fixed assets are comprised primarily of machinery and equipment, trucks and warehousing, transportation and computer equipment.
We may from time to time become involved in legal proceedings in the ordinary course of business. Currently, we are not a party to any legal proceedings that management believes would have a material adverse effect on our financial position or results of operations.
Item 4. Mine Safety Disclosures
Not applicable.
PART II
| Item 5. | Market for the Registrant’s Common Equity, Related Stockholder Matters and Issuer Purchases of Equity Securities |
Our common stock has beenis traded on the NASDAQ Stock Market under the symbol CENT, sinceand our initial public offering in July 1993. Our Classclass A common stock has beenis traded on the NASDAQ Stock Market under the symbol CENTA since February 2007.CENTA. Our Class B stock is not listed on any market and generally cannot be transferred unless converted to common stock on a one-for-one basis. The following table sets forth the high and low closing sale prices for our common stock and our Class A common stock, as reported by the NASDAQ Global Select Market, for each quarterly period during our fiscal years set forth below.
| Common Stock | Class A Common Stock | Common Stock | Class A Common Stock | |||||||||||||||||||||||||||||
| High | Low | High | Low | High | Low | High | Low | |||||||||||||||||||||||||
Fiscal 2011 | ||||||||||||||||||||||||||||||||
Fiscal 2014 | ||||||||||||||||||||||||||||||||
First Quarter | $ | 10.96 | $ | 8.88 | $ | 11.08 | $ | 9.01 | $ | 7.80 | $ | 6.16 | $ | 7.93 | $ | 6.18 | ||||||||||||||||
Second Quarter | 10.51 | 8.80 | 10.39 | 8.83 | 8.01 | 6.08 | 8.15 | 6.04 | ||||||||||||||||||||||||
Third Quarter | 11.06 | 8.71 | 10.95 | 9.01 | 9.58 | 7.40 | 9.58 | 7.64 | ||||||||||||||||||||||||
Fourth Quarter | 10.58 | 6.50 | 10.48 | 6.67 | 9.19 | 7.66 | 9.43 | 8.04 | ||||||||||||||||||||||||
Fiscal 2012 | ||||||||||||||||||||||||||||||||
Fiscal 2015 | ||||||||||||||||||||||||||||||||
First Quarter | $ | 9.24 | $ | 6.66 | $ | 9.44 | $ | 6.76 | $ | 8.85 | $ | 6.61 | $ | 9.47 | $ | 7.04 | ||||||||||||||||
Second Quarter | 9.42 | 7.99 | 10.12 | 8.21 | 10.41 | 8.45 | 11.24 | 9.10 | ||||||||||||||||||||||||
Third Quarter | 10.93 | 8.25 | 11.10 | 8.45 | 10.61 | 9.26 | 11.51 | 9.67 | ||||||||||||||||||||||||
Fourth Quarter | 12.61 | 9.05 | 13.27 | 9.40 | 16.43 | 9.19 | 17.00 | 10.08 | ||||||||||||||||||||||||
As of November 15, 2012,30, 2015, there were approximately 125104 holders of record of our common stock, approximately 207328 holders of record of our Class A nonvoting common stock and five5 holders of record of our Class B stock.
We have not paid any cash dividends on our common stock, our Class A common stock or our Class B Stock. We currently intend to retain any earnings for use in our business and do not presently anticipate paying any cash dividends on our common stock, our Class A common or our Class B stock in the foreseeable future. In addition, our credit facility and senior subordinated notes restrict our ability to pay dividends. See Note 1011 to our fiscal 2012 consolidated financial statements.
Stock Performance Graph
The following graph compares the percentage change of our cumulative total stockholder return on our Common Stock (“CENT”) for the period from September 29, 200725, 2010 to September 29, 201226, 2015 with the cumulative total return of the NASDAQ Composite (U.S.) Index and the Dow Jones Non-Durable Household Products Index, a peer group index consisting of approximately 30 manufacturers and distributors of household products.
The comparisons in the graph below are based on historical data and are not indicative of, or intended to forecast, the possible future performance of our Common Stock.
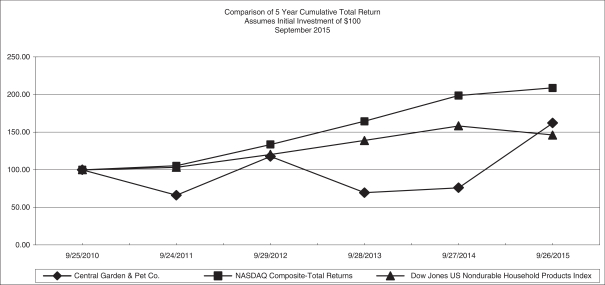
Total Return Analysis
| 9/29/07 | 9/27/08 | 9/26/09 | 9/25/10 | 9/24/11 | 9/29/12 | 9/25/10 | 9/24/11 | 9/29/12 | 9/28/13 | 9/27/14 | 9/26/15 | |||||||||||||||||||||||||||||||||||||
Central Garden & Pet Company | 100.00 | 68.65 | 132.13 | 113.48 | 75.17 | 133.60 | 100.00 | 66.24 | 117.72 | 69.60 | 76.14 | 162.28 | ||||||||||||||||||||||||||||||||||||
NASDAQ Composite | 100.00 | 81.42 | 78.79 | 90.54 | 95.32 | 121.04 | 100.00 | 105.29 | 133.69 | 164.57 | 198.75 | 208.80 | ||||||||||||||||||||||||||||||||||||
Dow Jones US Nondurable Household Products | 100.00 | 99.54 | 87.12 | 96.07 | 99.16 | 115.77 | 100.00 | 103.21 | 120.50 | 138.89 | 158.37 | 146.19 | ||||||||||||||||||||||||||||||||||||
Purchases of Equity Securities by the Issuer and Affiliated Purchasers
The following table sets forth the repurchases of any equity securities during the fourth quarter of the fiscal year ended September 29, 201226, 2015 and the dollar amount of authorized share repurchases, remaining under our stock repurchase program.
Period | Total Number of Shares (or Units) Purchased | Average Price Paid per Share (or Units) | Total Number of Shares (or Units) Purchased as Part of Publicly Announced Plans or Programs | Maximum Number (or Approximate Dollar Value) of Shares (or Units) that May Yet Be Purchased Under the Plans or Programs (1) | ||||||||||||
June 24, 2012 – July 28, 2012 | 1,844 | (2) | $ | 11.01 | — | $ | 51,595,000 | |||||||||
July 29, 2012 – August 25, 2012 | 34,929 | (2) | 11.05 | — | 0 | |||||||||||
August 26, 2012 – September 29, 2012 | 30,943 | (2) | 12.48 | — | 0 | |||||||||||
|
|
|
|
|
|
|
| |||||||||
Total | 67,716 | $ | 11.70 | — | $ | 51,595,000 | ||||||||||
Period | Total Number of Shares (or Units) Purchased | Average Price Paid per Share (or Unit) | Total Number of Shares (or Units) Purchased as Part of Publicly Announced Plans or Programs | Maximum Number (or Approximate Dollar Value) of Shares (or Units) that May Yet Be Purchased Under the Plans or Programs (1) | ||||||||||||
June 28, 2015 – August 1, 2015 | 940 | (2) | $ | 11.38 | 0 | $ | 34,968,000 | |||||||||
August 2, 2015 – August 29, 2015 | 1,227 | (2) | 11.54 | 0 | 34,968,000 | |||||||||||
August 30, 2015 – September 26, 2015 | 358 | (2) | 14.55 | 0 | 34,968,000 | |||||||||||
|
|
|
| |||||||||||||
Total | 2,525 | $ | 11.91 | 0 | $ | 34,968,000 | ||||||||||
| (1) | During the third quarter of fiscal 2011, our Board of Directors authorized a |
| (2) | Shares purchased during the period indicated represent withholding of a portion of shares to cover taxes in connection with the vesting of restricted |
Item 6. Selected Financial Data
The following selected statement of operations and balance sheet data as of and for the five fiscal years in the period ended September 29, 2012 has26, 2015 have been derived from our audited consolidated financial statements. The financial data set forth below should be read in conjunction with our consolidated financial statements and related notes thereto in “Item 8 – Financial Statements and Supplementary Data” and “Item 7 – Management’s Discussion and Analysis of Financial Condition and Results of Operations” included elsewhere herein.
| Fiscal Year Ended | Fiscal Year Ended | |||||||||||||||||||||||||||||||||||||||
| September 29, 2012 | September 24, 2011 | September 25, 2010 | September 26, 2009 | September 27, 2008 | September 26, 2015 | September 27, 2014 | September 28, 2013 | September 29, 2012 | September 24, 2011 | |||||||||||||||||||||||||||||||
| (in thousands, except per share amounts) | (in thousands, except per share amounts) | |||||||||||||||||||||||||||||||||||||||
Statement of Operations Data: | ||||||||||||||||||||||||||||||||||||||||
Statement of Operations Data (1): | ||||||||||||||||||||||||||||||||||||||||
Net sales | $ | 1,700,013 | $ | 1,628,652 | $ | 1,523,648 | $ | 1,614,300 | $ | 1,705,386 | $ | 1,650,737 | $ | 1,604,357 | $ | 1,653,633 | $ | 1,700,013 | $ | 1,628,652 | ||||||||||||||||||||
Cost of goods sold and occupancy | 1,185,855 | 1,134,733 | 1,008,482 | 1,086,974 | 1,184,058 | 1,162,685 | 1,150,333 | 1,189,731 | 1,185,855 | 1,134,733 | ||||||||||||||||||||||||||||||
|
|
|
|
|
|
|
|
|
| |||||||||||||||||||||||||||||||
Gross profit | 514,158 | 493,919 | 515,166 | 527,326 | 521,328 | 488,052 | 454,024 | 463,902 | 514,158 | 493,919 | ||||||||||||||||||||||||||||||
Selling, general and administrative expenses | 439,737 | 408,744 | 394,092 | 401,340 | 415,978 | 389,345 | 397,811 | 416,038 | 439,737 | 408,744 | ||||||||||||||||||||||||||||||
Goodwill and other impairments (2) | — | — | 12,000 | — | 429,764 | |||||||||||||||||||||||||||||||||||
Intangible asset and goodwill impairments (2) | 7,272 | — | 7,709 | — | — | |||||||||||||||||||||||||||||||||||
|
|
|
|
|
|
|
|
|
| |||||||||||||||||||||||||||||||
Income (loss) from operations | 74,421 | 85,175 | 109,074 | 125,986 | (324,414 | ) | ||||||||||||||||||||||||||||||||||
Income from operations (3) | 91,435 | 56,213 | 40,155 | 74,421 | 85,175 | |||||||||||||||||||||||||||||||||||
Interest expense, net | (40,170 | ) | (37,748 | ) | (33,587 | ) | (22,061 | ) | (37,273 | ) | (39,898 | ) | (42,750 | ) | (42,970 | ) | (40,170 | ) | (37,748 | ) | ||||||||||||||||||||
Other income | 678 | 550 | 419 | 52 | 2,116 | |||||||||||||||||||||||||||||||||||
Other income (expense) | 13 | 403 | (677 | ) | 678 | 550 | ||||||||||||||||||||||||||||||||||
|
|
|
|
|
|
|
|
|
| |||||||||||||||||||||||||||||||
Income (loss) before income taxes and noncontrolling interest | 34,929 | 47,977 | 75,906 | 103,977 | (359,571 | ) | 51,550 | 13,866 | (3,492 | ) | 34,929 | 47,977 | ||||||||||||||||||||||||||||
Income taxes (tax benefit) | 12,816 | 19,595 | 28,110 | 36,368 | (93,069 | ) | ||||||||||||||||||||||||||||||||||
Income tax expense (benefit) | 18,535 | 4,045 | (2,592 | ) | 12,816 | 19,595 | ||||||||||||||||||||||||||||||||||
|
|
|
|
|
|
|
|
|
| |||||||||||||||||||||||||||||||
Income (loss) including noncontrolling interest | 22,113 | 28,382 | 47,796 | 67,609 | (266,502 | ) | 33,015 | 9,821 | (900 | ) | 22,113 | 28,382 | ||||||||||||||||||||||||||||
Net income attributable to noncontrolling interest | 940 | 59 | 1,963 | 1,661 | 833 | 1,044 | 1,017 | 1,029 | 940 | 59 | ||||||||||||||||||||||||||||||
|
|
|
|
|
|
|
|
|
| |||||||||||||||||||||||||||||||
Net income (loss) attributable to Central Garden & Pet Company | $ | 21,173 | $ | 28,323 | $ | 45,833 | $ | 65,948 | $ | (267,335 | ) | |||||||||||||||||||||||||||||
Net income (loss) attributable to Central Garden & Pet | $ | 31,971 | $ | 8,804 | $ | (1,929 | ) | $ | 21,173 | $ | 28,323 | |||||||||||||||||||||||||||||
|
|
|
|
|
|
|
|
|
| |||||||||||||||||||||||||||||||
Net income (loss) per share attributable to Central Garden & Pet Company: | ||||||||||||||||||||||||||||||||||||||||
Net income (loss) per share attributable to Central Garden & Pet: | ||||||||||||||||||||||||||||||||||||||||
Basic | $ | 0.44 | $ | 0.50 | $ | 0.71 | $ | 0.95 | $ | (3.76 | ) | $ | 0.66 | $ | 0.18 | $ | (0.04 | ) | $ | 0.44 | $ | 0.50 | ||||||||||||||||||
|
|
|
|
|
|
|
|
|
| |||||||||||||||||||||||||||||||
Diluted | $ | 0.44 | $ | 0.50 | $ | 0.70 | $ | 0.94 | $ | (3.76 | ) | $ | 0.64 | $ | 0.18 | $ | (0.04 | ) | $ | 0.44 | $ | 0.50 | ||||||||||||||||||
|
|
|
|
|
|
|
|
|
| |||||||||||||||||||||||||||||||
Weighted average shares used in the computation of income (loss) per share (3): | ||||||||||||||||||||||||||||||||||||||||
Weighted average shares used in the computation of income (loss) per share: | ||||||||||||||||||||||||||||||||||||||||
Basic | 47,622 | 56,217 | 64,272 | 69,499 | 71,117 | 48,562 | 48,880 | 48,094 | 47,622 | 56,217 | ||||||||||||||||||||||||||||||
Diluted (3) | 48,374 | 56,645 | 65,091 | 70,264 | 71,117 | |||||||||||||||||||||||||||||||||||
Diluted | 49,638 | 49,397 | 48,094 | 48,374 | 56,645 | |||||||||||||||||||||||||||||||||||
Other Data: | ||||||||||||||||||||||||||||||||||||||||
Depreciation and amortization | $ | 30,425 | $ | 28,566 | $ | 28,869 | $ | 29,155 | $ | 32,517 | $ | 33,703 | $ | 35,781 | $ | 32,968 | $ | 30,425 | $ | 28,566 | ||||||||||||||||||||
Capital expenditures | $ | 39,592 | $ | 31,563 | $ | 24,190 | $ | 16,505 | $ | 22,349 | $ | 22,030 | $ | 17,173 | $ | 25,172 | $ | 39,592 | $ | 31,563 | ||||||||||||||||||||
Cash from operating activities | $ | 89,169 | $ | 51,008 | $ | 135,229 | $ | 221,638 | $ | 115,028 | ||||||||||||||||||||||||||||||
Cash provided (used) by operating activities | $ | 87,449 | $ | 126,467 | $ | (28,282 | ) | $ | 89,169 | $ | 51,008 | |||||||||||||||||||||||||||||
Cash used in investing activities | $ | (44,477 | ) | $ | (56,237 | ) | $ | (41,266 | ) | $ | (20,542 | ) | $ | (15,406 | ) | $ | (49,854 | ) | $ | (35,181 | ) | $ | (25,122 | ) | $ | (44,477 | ) | $ | (56,237 | ) | ||||||||||
Cash from (used in) financing activities | $ | (8,575 | ) | $ | (73,997 | ) | $ | (88,167 | ) | $ | (142,011 | ) | $ | (93,935 | ) | |||||||||||||||||||||||||
Cash provided (used) by financing activities | $ | (68,370 | ) | $ | (27,759 | ) | $ | 20,309 | $ | (8,575 | ) | $ | (73,997 | ) | ||||||||||||||||||||||||||
Ratio of earnings to fixed charges (4) | 1.84 | 2.23 | 3.20 | 5.36 | — | 2.27x | 1.32x | — | 1.84x | 2.23x | ||||||||||||||||||||||||||||||
| September 29, 2012 | September 24, 2011 | September 25, 2010 | September 26, 2009 | September 27, 2008 | September 26, 2015 | September 27, 2014 | September 28, 2013 | September 29, 2012 | September 24, 2011 | |||||||||||||||||||||||||||||||
Balance Sheet Data: | ||||||||||||||||||||||||||||||||||||||||
Cash and short term investments | $ | 71,180 | $ | 29,851 | $ | 106,780 | $ | 85,668 | $ | 26,929 | $ | 47,584 | $ | 88,666 | $ | 32,976 | $ | 71,180 | $ | 29,851 | ||||||||||||||||||||
Working capital | 445,299 | 410,655 | 433,705 | 427,243 | 450,704 | 476,916 | 498,454 | 490,325 | 445,299 | 410,655 | ||||||||||||||||||||||||||||||
Total assets | 1,149,547 | 1,093,003 | 1,130,884 | 1,150,925 | 1,259,318 | 1,134,754 | 1,148,727 | 1,161,160 | 1,149,547 | 1,093,003 | ||||||||||||||||||||||||||||||
Total debt | 449,814 | 435,609 | 400,271 | 408,085 | 523,147 | 400,139 | 450,239 | 472,587 | 449,814 | 435,609 | ||||||||||||||||||||||||||||||
Equity | 464,883 | 456,782 | 532,143 | 547,335 | 511,425 | 506,380 | 486,453 | 470,024 | 464,883 | 456,782 | ||||||||||||||||||||||||||||||
| (1) | Fiscal years |
| (2) | During |
| (3) |
| (4) | For the purposes of determining the ratio of earnings to fixed charges, earnings consist of income (loss) before income taxes and noncontrolling interest and after eliminating undistributed earnings of equity method investees and before fixed charges. Fixed charges consist of interest expense incurred, the portion of rental expense under operating leases deemed by management to be representative of the interest factor and amortization of deferred financing costs. For the fiscal year ended September |
Item 7. Management’s Discussion and Analysis of Financial Condition and Results of Operations
The following is management’s discussion of the financial results, liquidity and other key items related to our performance. This discussion should be read in conjunction with our consolidated financial statements and the related notes and other financial information appearing elsewhere in this Form 10-K. This Form 10-K contains forward-looking statements that involve risks and uncertainties. Our actual results may differ materially from those indicated in forward-looking statements. See “Forward-Looking Statements” and “Item 1A – Risk Factors.”
Business Overview
Central Garden & Pet Company (“Central”) is a leading innovator, marketer and producer, of quality branded products. We are oneproducts and distributor of the largest suppliersthird party products in the pet and lawn and garden supplies industries in the United States. The total pet food, treats and supplies industry isin 2014 was estimated by Packaged Facts to behave been approximately $30$49.2 billion in annual retail sales. We estimate the annual retail sales of the pet supplies and super-premiumconsumables and super premium pet food markets in the categories in which we participate to be approximately $15$28.1 billion. The total lawn and garden consumables industry in the United States is estimated to be approximately $21$22.0 billion in annual retail sales.sales, including fertilizer, pesticides, growing media, seeds, mulch, other consumables and decorative products. We estimate the annual retail sales of the lawn and garden suppliesconsumables and decorative products markets in the categories in which we participate to be approximately $6$12.0 billion.
Our pet supplies products include products for dogs and cats, including edible bones, premium healthy edible and non-edible chews, super premium dog and cat food and treats, toys, pet carriers, grooming supplies and other accessories; products for birds, small animals and specialty pets, including food, cages and habitats, toys, chews and related accessories; animal and household health and insect control products; products for fish, reptiles and other aquarium-based pets, including aquariums, furniture and lighting fixtures, pumps, filters, water conditioners, food and supplements, and information and knowledge resources; and products for horses and livestock. These products are sold under a number of brand namesthe brands including Adams™AdamsTM, Altosid, Aqueon®, Avoderm®, BioSpotBio Spot Active Care®TM, CoralifeCadet®, Farnam®, Four Paws®, Interpet, Kaytee®, Kent Marine®, Nylabone®, Oceanic Systems®, Pet Select®, Pre Strike®, Pinnacle®, Super Pet®, TFHTM, Zilla® as well as a number of other brands including Altosid, Comfort Zone®, Coralife®, Interpet, Kent Marine®, Pet Select®, Super Pet®, and Zodiac®.
Our lawn and garden supplies products include proprietary and non-proprietary grass seed; wild bird feed, bird feeders, bird houses and other birding accessories; weed, grass, ant and other herbicide, insecticide and pesticide products; and decorative outdoor lifestyle and lighting products including pottery, trellises and other wood products and holiday lighting. These products are sold under a number of brand names including:the brands AMDRO®, GKI/Bethlehem Lighting®, Grant’s®, Ironite®, Pennington®, and Sevin®, as well as a number of other brand names including Lilly Miller®, Matthews Four SeasonsTM, New England Pottery®, Norcal Pottery®, Pennington®, Over-N-Out®, Sevin®, Smart Seed® and The Rebels®.
In fiscal 2012,2015, our consolidated net sales were $1.7 billion, of which our pet segment, or Pet, segment accounted for approximately $931$895 million and our garden segment, or Garden, segment accounted for approximately $769$756 million. Fiscal 2012 included an extra week as compared to fiscal 2011. In fiscal 2012, our branded product sales were approximately $1.4 billion, or approximately 84% of total sales, sales of other manufacturers’ products were approximately 16% of total sales, and our gross profit margins were 30.2%. In fiscal 2012,2015, our income from operations was $74 million, of which our Pet segment accounted for $88 million and our Garden segment accounted for $40 million, before corporate expenses and eliminations of $54$67.5 million was $158.9 million, of which the Pet segment accounted for $98.8 million and the Garden segment accounted for $60.1 million.
Recent DevelopmentsFiscal 2015 Financial Highlights
Earnings per fully diluted share increased $0.46 per share to $0.64 per share and our operating income increased 63% to $91.4 million as compared to fiscal 2014, due to increased earnings in both our segments. The Pet segment was impacted by a $7.3 million non-cash intangible asset impairment charge in fiscal 2015. In fiscal 2014, the Garden segment was impacted by a charge related to the discontinuance of certain products introduced
in 2013 and the gain on the sale of manufacturing plant assets. The items impacting fiscal 2015 and 2014 are excluded for purposes of the non-GAAP presentation elsewhere in this Form 10-K.
Fiscal 2012 Operating Performance. Although we experienced increased sales in fiscal 2012, rising input costs, a change in sales mix, operational disruptions and increased costs associated with our transformational change initiatives, and unfavorable weather resulted in increased expenses and continuing pressure on gross margins.
Financial summary:
Net sales for fiscal 20122015 increased $71.4$46.3 million, or 4.4%2.9%, to $1.7 billion.$1,650.7 million. Our Pet segment sales increased 9.3%5.8%, partially offset by a 1.0% decrease inand our Garden segment.segment sales decreased 0.4%.
Gross profit for fiscal 2015 increased $34.0 million, or 7.5%, to $488.0 million from $454.0 million in fiscal 2014. Gross margin decreased 10increased 130 basis points in fiscal 20122015 to 30.2%29.6%, from 30.3%28.3% in 2011.2014.
Selling, general & administrative expensesOur operating income increased $31.0$35.2 million, or 7.6%62.7%, to $439.7$91.4 million in fiscal 2012,2015, and increased as a percentage of net sales to 25.9%5.5% from 25.1%3.5%. The increase was due primarily toOn an adjusted basis, operating income increased selling and delivery expense.$30.5 million, or 44.6%.
Net earnings for fiscal 2012 were $21.2income was $32.0 million, or $0.44$0.64 per share on a fully diluted basis, a decreasecompared to net income in fiscal 2014 of $7.1$8.8 million, and $0.06or $0.18 per share on a fully diluted basis. On an adjusted basis, comparednet income increased to $36.6 million, or $0.74 per share, in fiscal 2011.2015 from $16.4 million, or $0.33 per share, in fiscal 2014.
We generatedOur net cash flows fromprovided by operating activities of approximately $89.2was $87.4 million duringin fiscal 2012, an increase of approximately $38.22015, compared to $126.5 million fromin fiscal 2011. Our cash and short term investments at September 29, 2012 were approximately $71.2 million, compared with $29.9 million at September 24, 2011.2014.
Recent Developments
RepurchaseLeadership
In July 2015, we amended the employment agreement of John R. Ranelli, our Chief Executive Officer. Under the amended agreement, Mr. Ranelli has agreed to continue as Chief Executive Officer until his planned retirement at the end of fiscal 2016 and to continue to consult for the Company Stock.– During fiscal 2012,for an additional four years. In order to facilitate an orderly transition, we repurchased $20.9 million ofplan to launch a search in the near future for our common stock which consisted of 0.7 million shares of our voting common stock (CENT)next Chief Executive Officer.
Our former Chief Financial Officer, Lori Varlas, resigned effective September 2, 2015 to accept a senior level position at an aggregate cost of approximately $5.6 million, or approximately $8.02 per share, and 1.9 million shares of our non-voting Class A common stock (CENTA) at an aggregate cost of approximately $15.3 million, or approximately $8.05 per share. During fiscal 2011, ouranother company. The Board of Directors authorized a new $100 million share repurchase program, under which approximately $52 million remains availablenamed David N. Chichester as Acting Chief Financial Officer through February 2016. Mr. Chichester has served for repurchases in fiscal 201313 years on Central’s Board and thereafter.
Transformational Change. – In fiscal 2012, we continuedas our Audit Committee financial expert. He brings significant financial management, accounting, disclosure, and risk assessment experience to the process of transformational change we embarked upon in fiscal 2011, consisting of a comprehensive series of organizational and operational initiatives intended to improve our sales and marketing, profitability and operational effectiveness. We expect to continue these initiatives over the next several years. The strategic objective of these initiatives is to transform the Company from a portfolio of separately run businesses into an integrated, multi-brand company. In connection with this change, we are strengthening our management team, reorganizing operating units, consolidating facilities, eliminating duplicative services, standardizing processes, training employees in new approaches and investing in systems, facilities and people. For example, in fiscal 2011, we began the process of combining our Garden and Pet supply chains as an integrated unit responsible for distribution, transportation, manufacturing, sourcing and sales and operations planning. In fiscal 2012, we began consolidating transactional processing in a newly created centralized shared services center in Boise, Idaho.Acting Chief Financial Officer role. We are in the process of movingpositioning our accounts payable, accounts receivablekey senior financial officers to assume Mr. Chichester’s responsibilities in an orderly fashion when he completes his tenure as Acting Chief Financial Officer in February 2016.
Our Chairman of the Board, Bill Brown, commenced a leave of absence in July as he continues to recover from injuries he sustained in an accident in his home earlier in the year. Jack Balousek, our Lead Independent Director, is acting as Interim non-executive Chairman until Mr. Brown returns.
IMS Trading Corp. Acquisition
On July 31, 2015, we purchased substantially all of the assets of IMS Trading Corp. (“IMS”) for a purchase price of approximately $23 million. IMS was a manufacturer, importer and orderdistributor of rawhide, natural dog treats and pet products throughout the United States and internationally. This acquisition is expected to complement our existing dog and cat business.
Debt Refinancing
In November 2015, we issued $400 million aggregate principal amount of 6.125% senior notes due November 2023 (the “2023 Notes”). The 2023 Notes are unconditionally guaranteed on a senior basis by each of our existing and future domestic restricted subsidiaries which are borrowers under or guarantors of our senior
secured revolving credit facility. We used the net proceeds from the offering, together with available cash, to redeem our outstanding 8.25% senior subordinated notes due March 1, 2018 (the “2018 Notes”) and pay fees and expenses related to the offering. As a result of our redemption of the 2018 Notes, we will recognize a charge in our fiscal 2016 first quarter of approximately $8.3 million related to the payment of the call premium, a one-time payment of overlapping interest expense for 30 days of approximately $2.8 million and a $3.2 million non-cash charge for the write-off of unamortized financing costs in interest expense. We expect our annual interest expense on the 2023 Notes going forward to be approximately $8.5 million less than under the 2018 Notes.
DMC Acquisition
On December 1, 2015, we purchased the pet bedding and certain other assets of National Consumers Outdoors Corp., formerly known as Dallas Manufacturing Company (“DMC”), for a cash purchase price of approximately $61 million. This acquisition is expected to complement our existing dog and cat business.
Use of Non-GAAP Financial Measures
We report our financial results in accordance with U.S. generally accepted accounting principles (GAAP). However, management functionsbelieves that certain non-GAAP financial measures that exclude the impact of a non-cash intangible asset impairment charge in fiscal 2015, a garden charge in fiscal 2014, and the gain from the sale of manufacturing plant assets in fiscal 2014, may be useful in certain instances to this one centralizedprovide additional meaningful comparisons between current results and results in prior operating periods that should be considered when assessing our ongoing performance. Additionally, we have provided a comparison of our free cash flow which can be used as a measure of our operating performance on page 42. Free cash flow does not represent cash available only for discretionary expenditures, since we have mandatory debt service center. requirements and other contractual and non-discretionary expenditures. We believe that these non-GAAP financial measures provide useful information to investors and other users of its financial statements, such as lenders. Management also uses these non-GAAP financial measures in making financial, operating and planning decisions and in evaluating our performance. While our management believes that non-GAAP measurements are useful supplemental information, such adjusted results are not intended to replace our GAAP financial results and should be read in conjunction with those GAAP results.
Pet Segment Intangible Asset Impairment Charge
During the fourth quarter of fiscal 2015, we recognized a non-cash charge in our Pet segment of $7.3 million related to the impairment of certain indefinite-lived intangible assets caused by increased competition and declining volume of sales.
Garden Segment Discontinued Product Charge
During fiscal 2012,2013, we incurred approximately $12.1introduced two new Garden products. Despite support from our retailers and substantial marketing spend, the new products did not sell through as expected, and we recorded an $11.2 million charge to operating income relating to the new products. Despite a concerted effort to improve consumer takeaway of additional expensethe products through product, packaging and placement changes, as well as aggressive promotions, we continued to experience weak consumer sales of the products in their second season. Late in the third quarter of fiscal 2014, major retailers indicated that they would not support the products going forward. Consequently, we made the decision to discontinue the two products at the end of the 2014 garden season. As a result, we recorded a $16.9 million charge (“garden charge”) to operating income in the quarter ended June 28, 2014 to write off the remaining inventory of these products and to account for product returns, promotional allowances and other costs related to transformation activities.the discontinuance of the products.
Gain on Sale of Manufacturing Plant Assets
There can be no assurance thatDuring fiscal 2014, we will be able to successfully implement the transformational change initiatives or that we will be able to do so within the anticipated time period. During the process of implementation, we will be making substantial investmentsrecorded a $4.9 million gain in our business and will incur substantial transitional costs, which will adversely affect our operating results untilGarden segment from the transformation process is complete.
Fiscal 2013.– Hurricane Sandy negatively impacted our northeastern businesses. While damage was minimal, somesale of our businesses experienced disruption which will impact our first quarter 2013 results.
Fiscal 2011 Reported Earnings and Significant Items.
Fiscal 2011 Operating Performance. Althoughmanufacturing plant assets related to a seasonal product we experienced increased sales in fiscal 2011, rising input costs, a change in sales mix dueintend to competitive pressures and unfavorable weather resulted in increased expenses and lower gross margins.
Financial summary:purchase rather than produce.
Net sales for fiscal 2011 increased $105 million, or 7%, to $1.6 billion.
| GAAP to Non-GAAP Reconciliation (unaudited, in thousands, except per share amounts) For the Year Ended September 26, 2015 | ||||||||||||
| Fiscal 2015 GAAP | Intangible Impairment | Fiscal 2015 As Adjusted | ||||||||||
Net sales | $ | 1,650,737 | $ | — | $ | 1,650,737 | ||||||
Cost of goods sold and occupancy | 1,162,685 | — | 1,162,685 | |||||||||
|
|
|
|
|
| |||||||
Gross profit | 488,052 | — | 488,052 | |||||||||
Selling, general and administrative expenses and impairment | 396,617 | (7,272 | ) | 389,345 | ||||||||
|
|
|
|
|
| |||||||
Income from operations | $ | 91,435 | $ | 7,272 | $ | 98,707 | ||||||
|
|
|
|
|
| |||||||
Net income (loss) | $ | 31,971 | $ | 4,654 | $ | 36,625 | ||||||
|
|
|
|
|
| |||||||
Earnings per share – Diluted | $ | 0.64 | $ | 0.74 | ||||||||
Weighted shares outstanding | 49,638 | 49,638 | ||||||||||
Gross margin | 29.6 | % | 29.6 | % | ||||||||
Selling, general and administrative expenses and impairment as a percentage of sales | 24.0 | % | 23.6 | % | ||||||||
Operating margin | 5.5 | % | 6.0 | % | ||||||||
Net earnings for fiscal 2011 were $28 million, or $0.50 per share on a diluted basis, a decrease of $18 million and $.0.20 per share on a diluted basis, compared to fiscal 2010.
| GAAP to Non-GAAP Reconciliation (unaudited, in thousands, except per share amounts) For the Year Ended September 27, 2014 | ||||||||||||||||
| Fiscal 2014 GAAP | Garden Charge (A) | Gain on Sale of Plant Assets (B) | Fiscal 2014 As Adjusted | |||||||||||||
Net sales | $ | 1,604,357 | $ | 7,035 | — | $ | 1,611,392 | |||||||||
Cost of goods sold and occupancy | 1,150,333 | (9,873 | ) | — | 1,140,460 | |||||||||||
|
|
|
|
|
|
|
| |||||||||
Gross profit | 454,024 | 16,908 | 470,932 | |||||||||||||
Selling, general and administrative expenses | 397,811 | — | 4,875 | 402,686 | ||||||||||||
|
|
|
|
|
|
|
| |||||||||
Income from operations | $ | 56,213 | $ | 16,908 | $ | (4,875 | ) | $ | 68,246 | |||||||
|
|
|
|
|
|
|
| |||||||||
Net income | $ | 8,804 | $ | 10,652 | $ | (3,071 | ) | $ | 16,385 | |||||||
|
|
|
|
|
|
|
| |||||||||
Earnings per share – Diluted | $ | 0.18 | $ | 0.33 | ||||||||||||
Weighted shares outstanding | 49,397 | 49,397 | ||||||||||||||
Gross margin | 28.3 | % | 29.2 | % | ||||||||||||
Selling, general and administrative expenses as a percentage of sales | 24.8 | % | 25.0 | % | ||||||||||||
Operating margin | 3.5 | % | 4.2 | % | ||||||||||||
Gross margin decreased 350 basis points in fiscal 2011 to 30.3%, due primarily to rising raw material input costs.
| Non-GAAP Consolidated Comparative Summary (unaudited, $ in thousands) | ||||||||
| Fiscal 2015 | Fiscal 2014 | |||||||
Adjusted net sales | $ | 1,650,737 | $ | 1,611,392 | ||||
Adjusted gross profit | $ | 488,052 | $ | 470,932 | ||||
Adjusted gross margin | 29.6 | % | 29.2 | % | ||||
Adjusted selling, general and administrative expenses | $ | 389,345 | $ | 402,686 | ||||
Adjusted selling, general and administrative as a percentage of sales | 23.6 | % | 25.0 | % | ||||
Adjusted income from operations | $ | 98,707 | $ | 68,246 | ||||
Adjusted operating margin | 6.0 | % | 4.2 | % | ||||
Adjusted EPS – diluted | $ | 0.74 | $ | 0.33 | ||||
Selling, general & administrative expenses increased $14.6 million, or 3.7%, to $408.7 million in fiscal 2011, but decreased as a percentage of net sales to 25.1% from 25.9%.
| Fiscal 2015 | Fiscal 2014 | |||||||||||||||
| Pet Segment: | Income from Operations | Operating Margin | Income from Operations | Operating Margin | ||||||||||||
Fiscal year as reported (GAAP) | $ | 98,798 | 11.0 | % | $ | 88,070 | 10.4 | % | ||||||||
Intangible asset impairment charge (A) | 7,272 | — | ||||||||||||||
|
|
|
| |||||||||||||
Fiscal year as adjusted | $ | 106,070 | 11.9 | % | $ | 88,070 | 10.4 | % | ||||||||
|
|
|
| |||||||||||||
| (A) | In fiscal 2015, we recognized a non-cash intangible asset impairment charge within our Pet segment. |
We generated cash flows from operating activities of approximately $51.0 million during fiscal 2011 and had a cash balance of approximately $12.0 million at September 24, 2011.
| Garden Segment | Fiscal 2015 Net Sales | Fiscal 2014 Net Sales | ||||||
Fiscal year as reported (GAAP) | $ | 756,188 | $ | 758,852 | ||||
Garden charge (B) | — | 7,035 | ||||||
|
|
|
| |||||
Fiscal year as adjusted | $ | 756,188 | $ | 765,887 | ||||
|
|
|
| |||||
Senior Credit Facility – On June 8, 2011, we amended our credit agreement dated June 25, 2010 to increase the aggregate principal borrowing amount from $275 million to $375 million, extend the maturity date to June 8, 2016, and reduce the interest rates, commitment fees and interest coverage requirements.
| Fiscal 2015 | Fiscal 2014 | |||||||||||||||
| Income from Operations | Operating Margin | Income from Operations | Operating Margin | |||||||||||||
Fiscal year as reported (GAAP) | $ | 60,145 | 8.0 | % | $ | 41,020 | 5.4 | % | ||||||||
Garden charge (B) | — | 16,908 | ||||||||||||||
Gain on sale of plant assets (C) | — | (4,875 | ) | |||||||||||||
|
|
|
| |||||||||||||
Fiscal year as adjusted | $ | 60,145 | 8.0 | % | $ | 53,053 | 6.9 | % | ||||||||
|
|
|
| |||||||||||||
| (B) | The garden charges reflect the impact of a Garden segment charge in fiscal 2014 related to the discontinuance of certain products introduced in 2013. |
| (C) | In fiscal 2014, we recognized a gain from the sale of manufacturing plant assets related to a product the Garden segment will now purchase rather than produce. |
Repurchase of Company Stock.– During fiscal 2011, we repurchased $108.7 million of our common stock which consisted of 3.3 million shares of our voting common stock (CENT) at an aggregate cost of approximately $30.2 million, or approximately $9.10 per share and 8.6 million shares of our non-voting Class A common stock (CENTA) at an aggregate cost of approximately $78.5 million, or approximately $9.08 per share.
Results of Operations (GAAP)
The following table sets forth, for the periods indicated, the relative percentages that certain income and expense items bear to net sales:
| Fiscal Year Ended | Fiscal Year Ended | |||||||||||||||||||||||
| September 29, 2012 | September 24, 2011 | September 25, 2010 | September 26, 2015 | September 27, 2014 | September 28, 2013 | |||||||||||||||||||
Net sales | 100.0 | % | 100.0 | % | 100.0 | % | 100.0 | % | 100.0 | % | 100.0 | % | ||||||||||||
Cost of goods sold and occupancy | 69.8 | 69.7 | 66.2 | 70.4 | 71.7 | 71.9 | ||||||||||||||||||
|
|
|
|
|
| |||||||||||||||||||
Gross profit | 30.2 | 30.3 | 33.8 | 29.6 | 28.3 | 28.1 | ||||||||||||||||||
Selling, general and administrative | 25.9 | 25.1 | 25.9 | 23.6 | 24.8 | 25.2 | ||||||||||||||||||
Intangible asset impairments | — | — | 0.8 | |||||||||||||||||||||
Intangible asset and goodwill impairment | 0.5 | — | 0.5 | |||||||||||||||||||||
|
|
|
|
|
| |||||||||||||||||||
Income from operations | 4.3 | 5.2 | 7.1 | 5.5 | 3.5 | 2.4 | ||||||||||||||||||
Interest expense, net | (2.4 | ) | (2.3 | ) | (2.2 | ) | (2.4 | ) | (2.7 | ) | (2.6 | ) | ||||||||||||
Other income | 0.1 | — | — | — | — | — | ||||||||||||||||||
Income taxes | (0.7 | ) | (1.2 | ) | (1.8 | ) | 1.1 | 0.3 | (0.2 | ) | ||||||||||||||
Noncontrolling interest | (0.1 | ) | — | (0.1 | ) | 0.1 | 0.1 | 0.1 | ||||||||||||||||
|
|
|
|
|
| |||||||||||||||||||
Net income | 1.2 | % | 1.7 | % | 3.0 | % | ||||||||||||||||||
|
|
| ||||||||||||||||||||||
Net income (loss) | 1.9 | % | 0.5 | % | (0.1 | )% | ||||||||||||||||||
Fiscal 20122015 Compared to Fiscal 20112014
Net Sales
Net sales for fiscal 20122015 increased $71.4$46.3 million, or 4.4 %,2.9%, to $1,700.0$1650.7 million from $1,628.6$1604.4 million in fiscal 2011.2014. Our branded product sales increased $10.3 million, and sales of other manufacturers’ products increased $36.0 million. Branded product sales include products we produce under Central brand names and products we produce under third party brands. Sales of our branded products represented 79.7% of our total sales in fiscal 2015 compared with 81.3% in fiscal 2014. Private label sales represented less than 10% of our consolidated net sales.
The following table indicates each class of similar products which represented approximately 10% or more of our consolidated net sales in the fiscal years presented (in millions):
Category | 2015 | 2014 | 2013 | |||||||||
Pet supplies (excluding wild bird feed) | $ | 827.7 | $ | 774.2 | $ | 807.4 | ||||||
Garden controls and fertilizers | 286.3 | 262.5 | 274.9 | |||||||||
Wild bird feed | 193.2 | 202.1 | 210.8 | |||||||||
Other garden supplies | 181.4 | 182.5 | 183.5 | |||||||||
Grass seed | 162.1 | 183.1 | 177.0 | |||||||||
|
|
|
|
|
| |||||||
Total | $ | 1,650.7 | $ | 1,604.4 | $ | 1,653.6 | ||||||
|
|
|
|
|
| |||||||
Our Pet segment’s net sales for fiscal 2015 increased $49.0 million, or 5.8%, to $894.5 million from $845.5 million in fiscal 2014. Pet branded product sales increased $25.3 million from fiscal 2014 due principally to a $20.7 million increase in our animal health category due primarily to growth in active ingredient sales and our Envincio acquisition in the prior year. Also, our dog and cat category net sales increased approximately $12.5 million due primarily to our fourth quarter fiscal 2015 IMS acquisition. Collectively, the acquisition of IMS in fiscal 2015 and Envincio in fiscal 2014 contributed $17.3 million of the $25.3 million increase in our Pet branded product sales in fiscal 2015. These increases were partially offset by a $4.6 million price driven decrease in wild bird feed. Sales of other manufacturers’ products increased approximately $23.7 million in fiscal 2015 benefitting from expanded distribution.
Our Garden segment’s net sales for fiscal 2015 decreased $2.7 million, or 0.4%, to $756.2 million from $758.9 million in fiscal 2014. Garden branded product sales decreased $15.0 million due primarily to decreases of $21.0 million in grass seed and $11.1 million in Décor. Grass seed sales declined due primarily to weather related lower volumes and the impact of the strong dollar on export sales. Lower volumes in Décor were due primarily to higher promotional sales in the prior year along with an unfavorable change in product mix due to lost distribution. These declines were partially offset by a $23.8 million increase in our controls and fertilizers category. The increase in controls and fertilizers was primarily volume related and reflects a $7.0 million charge to sales in the prior year for the impact on sales for two discontinued garden products. Excluding the $7.0 million charge in the prior year, controls and fertilizer sales increased $16.8 million. Sales of other manufacturers’ products increased approximately $12.3 million compared to fiscal 2014 due primarily to increased distribution to existing customers.
Gross Profit
Gross profit for fiscal 2015 increased $34.0 million, or 7.5%, to $488.0 million from $454.0 million in fiscal 2014. Gross margin increased to 29.6% in fiscal 2015 from 28.3% in fiscal 2014, with improvement in both our Garden and Pet segments. Gross profit for fiscal 2015 increased $17.1 million, or 3.6%, from adjusted gross profit of $470.9 million in fiscal 2014, which was impacted by the $16.9 million prior year garden charge. Gross margin for fiscal 2015 increased to 29.6% from the adjusted gross margin of 29.2% for fiscal 2014.
In the Pet segment, gross profit increased in fiscal 2015 due to a $49.0 million increase in sales and an improved gross margin. The improvement in gross profit was due primarily to increased sales in our animal health category, which includes our professional business, and our dog and cat category. Because our animal health sales tend to be higher margin, the animal health category’s increased sales had a positive impact on both our product mix and our gross margin. Gross margin also improved in our dog and cat category, although the improvement was partially offset by the lower margin of the increased sales.
In the Garden segment, gross profit increased in fiscal 2015 due to an improved gross margin which was partially offset by a $2.7 million decrease in sales. The Garden segment gross profit and gross margin were impacted in fiscal 2014 by the garden charge. After adjusting for the fiscal 2014 garden charge, the gross margin in the Garden segment was the same in both fiscal years 2015 and 2014. Within the Garden segment, the garden controls and fertilizer gross profit improved, even after adjusting for the prior year garden charge, primarily due to increased volumes and favorable product mix. These improvements were partially offset by a decreased gross margin in Décor that, in addition to the decrease in sales, was also impacted in fiscal 2015 by an increase in excess and obsolete inventories.
Selling, General and Administrative
Selling, general and administrative expenses decreased $8.5 million, or 2.1%, from $397.8 million in fiscal 2014 to $389.3 million in fiscal 2015. As a percentage of net sales, selling, general and administrative expenses decreased from 24.8% in fiscal 2014 to 23.6% in fiscal 2015. Excluding the gain on the sale of plant assets in fiscal 2014, selling, general and administrative expenses decreased $13.4 million from fiscal 2014, and the expenses as a percentage of net sales decreased from 25.0% in fiscal 2014. The change in selling, general and administrative expenses, discussed further below, was due primarily to decreased selling and delivery expense. Corporate expenses are included within administrative expense and relate to the costs of unallocated executive, administrative, finance, legal, human resource, and information technology functions.
Selling and delivery expense decreased $6.2 million, or 2.9%, from $216.4 million in fiscal 2014 to $210.2 million in fiscal 2015 and as a percentage of net sales decreased from 13.5% in fiscal 2014 to 12.7% in fiscal 2015. The decrease was due primarily to decreased marketing expenditures and headcount reductions in our Garden segment.
Warehouse and administrative expense decreased $2.3 million, or 1.3%, from $181.4 million in fiscal 2014 to $179.1 million in fiscal 2015. A $5.9 million decrease in corporate costs was partially offset by increased costs in both our operating segments. Corporate administrative expense decreased due primarily to the non-recurrence of a $5.9 million long-lived software charge in fiscal 2014. Increased costs in our operating segments were due primarily to the non-recurrence of a $4.9 million gain recorded in fiscal 2014 in our Garden segment from the sale of plant assets and increased payroll related and third party provider costs in our Pet segment.
Impairment
We evaluate long-lived assets, including amortizable and indefinite-lived intangible assets, for impairment whenever events or changes in circumstances indicate the carrying value may not be recoverable. Additionally, we evaluate indefinite-lived intangible assets on an annual basis. In fiscal 2015, we recognized a non-cash $7.3 million impairment charge in our Pet segment related to certain indefinite-lived intangible assets as a result of increased competition and an expected decline in the volume of sales. The fair value of the indefinite-lived intangible assets exceeded the remaining $15.0 million carrying value at September 26, 2015.
Operating Income
Operating income increased $35.2 million in fiscal 2015, or 62.7%, to $91.4 million from $56.2 million in fiscal 2014. Increased sales of $46.3 million, a 130 basis point gross margin improvement and an $8.5 million decrease in selling, general and administrative costs all contributed to the increase in operating income. Partially offsetting these improvements was a $7.3 million intangible asset impairment charge. Operating margin was 5.5% for fiscal 2015 and 3.5% for fiscal 2014. Adjusting for the current year intangible asset impairment charge in our Pet segment and for the prior year garden charge and the gain on the sale of plant assets in our Garden segment, operating income increased $30.5 million to $98.7 million in fiscal 2015 from $68.2 million in fiscal 2014. Adjusted operating margin improved to 6.0% from 4.2% in fiscal 2014.
Pet operating income increased $10.7 million, or 12.2%, to $98.8 million for fiscal 2015 from $88.1 million for fiscal 2014. The increase was due primarily to increased sales and improved gross margin, which were partially offset by an intangible impairment charge and a slight increase in selling, general and administrative expenses. Pet operating margin increased to 11.0% for fiscal 2015 from 10.4% for fiscal 2014. Adjusting for the current year intangible asset impairment charge, fiscal 2015 operating income was $106.1 million and the operating margin was 11.9%.
Garden operating income increased $19.1 million, or 46.6%, to $60.1 million for fiscal 2015 from $41.0 million for fiscal 2014. Garden operating margin increased to 8.0% for fiscal 2015 from 5.4% for fiscal 2014. Adjusting the prior year for the garden charge and the gain on the sale of plant assets, Garden operating income increased $7.1 million from $53.0 million in fiscal 2014 and the operating margin increased from 6.9% to 8.0%. The adjusted Garden operating income increase of $7.1 million was due to a $44.4decrease in selling, general and administrative expenses, partially offset by lower net sales as adjusted gross margin remained unchanged for both fiscal years.
Net Interest Expense
Net interest expense decreased $2.9 million, or 3.2%6.7%, increasefrom $42.8 million in fiscal 2014 to $39.9 million in fiscal 2015. The decrease was due to lower interest expense due primarily to lower average debt outstanding during fiscal 2015 primarily as a result of the redemption of $50 million of our 2018 notes in March 2015 partially offset by the related write-off of unamortized deferred financing costs and a call premium of $1.6 million. Debt outstanding on September 26, 2015 was $400.1 million compared to $450.2 million as of September 27, 2014.
Other Income (Expense)
Other income (expense) is comprised of income from investments accounted for under the equity method of accounting, foreign currency exchange gains and losses, and realized and unrealized gains and losses from derivative contracts used to economically hedge anticipated commodity purchases for use in our products. Other income decreased $0.4 million from fiscal 2014. The decrease was primarily due to equity method losses from the two newly formed entities we invested in during our second quarter of fiscal 2015.
Income Taxes
Our effective income tax rate was 36.0% for fiscal 2015 compared to 29.2% for fiscal 2014. The increased effective income tax rate in fiscal 2015 as compared to fiscal 2014 was due primarily to the removal of valuation allowances on international deferred tax assets in fiscal 2014.
Fiscal 2014 Compared to Fiscal 2013
Net Sales
Net sales for fiscal 2014 decreased $49.2 million, or 3.0%, to $1,604.4 million from $1,653.6 million in fiscal 2013. Our branded product sales and a $27.0decreased $70.7 million, or 10.7%, increase in theand sales of other manufacturers’ products.products increased $21.5 million. Branded product sales include products we manufacture under Central brand names and products we manufacture under third-partythird party brands. Sales of our branded products represented 83.5%81.3% of our total sales in fiscal 2012. In addition,2014 compared with 83.2% in fiscal 2012 included an extra week as compared to fiscal 2011.2013.
The following table indicates each class of similar products which represented approximately 10% or more than 10% of our consolidated net sales in the fiscal years presented (in millions):
Category | 2012 | 2011 | 2010 | 2014 | 2013 | 2012 | ||||||||||||||||||
Pet supplies (excluding wild bird feed) | $ | 847.1 | $ | 773.1 | $ | 766.5 | $ | 774.2 | $ | 807.4 | $ | 847.1 | ||||||||||||
Controls and fertilizers | 281.7 | 260.0 | 255.5 | |||||||||||||||||||||
Garden controls and fertilizers | 262.5 | 274.9 | 281.7 | |||||||||||||||||||||
Wild bird feed | 205.1 | 197.5 | 168.9 | 202.1 | 210.8 | 205.1 | ||||||||||||||||||
Other garden supplies | 185.7 | 212.1 | 196.0 | 182.5 | 183.5 | 185.7 | ||||||||||||||||||
Grass seed | 180.4 | 185.9 | 136.7 | 183.1 | 177.0 | 180.4 | ||||||||||||||||||
|
|
|
|
|
| |||||||||||||||||||
Total | $ | 1,700.0 | $ | 1,628.6 | $ | 1,523.6 | $ | 1,604.4 | $ | 1,653.6 | $ | 1,700.0 | ||||||||||||
|
|
|
|
|
| |||||||||||||||||||
Our Pet segment’s net sales for fiscal 2012 increased $79.42014 decreased $42.7 million, or 9.3%4.8%, to $930.7$845.5 million from $851.3$888.2 million in fiscal 2011.2013. The decline in pet sales was due principally to industry weakness, lost shelf space and increased competition in the categories in which we participate. Pet branded product sales decreased $63.4 million from fiscal 2013 due primarily to a $20.2 million decrease in our animal health category, an $18.0 million decrease in our bird and small animal category and a $15.4 million decrease in our aquatics category; all of these decreases were primarily volume driven. Our animal health category was impacted by lower sales in the flea and tick category, which resulted from a weak flea and tick season, lost shelf space, rebranding and repackaging resulting in return of the superceded product and increased $62.6 million and salescompetition. Sales of other manufacturers’ products increased $16.8approximately $20.7 million as compared with fiscal 2011. We experienced sales increases in most of our Pet categories, including a $37.1 million increase in our Animal Health category, due primarily to innovation and increased distribution of our flea and tick products. Additionally, our aquatics product sales increased $11.0 million due primarily to increased consumables sales.benefitting from expanded distribution.
Our Garden segment’s net sales for fiscal 20122014 decreased $8.0$6.5 million, or 1.0%0.9%, to $769.3$758.9 million from $777.3$765.4 million in fiscal 2011. In fiscal 2012, garden2013. Garden branded product sales declined $18.2decreased $7.3 million due primarily to a $12.4 million decrease in our controls and fertilizer category which was impacted by reduced volumes and increased charges related to returns and promotional allowances for two discontinued garden products introduced in 2013. The decrease in controls and fertilizers was partially offset by an increase in grass seed sales primarily due to increased pricing. Sales of other manufacturers’ products increased $10.2approximately $0.8 million compared withto fiscal 2011. Garden branded product sales declined due primarily to a $26.3 million decrease in revenues of our other garden supply products, including a $24.8 million decline in seasonal décor products and a $2.4 million decline in pottery products, partially offset by a $21.7 million increase in sales of controls and fertilizers. Seasonal décor products were impacted by decreased sales programs in the current fiscal year and by increased sales returns. The majority of the decrease in seasonal décor and pottery occurred in our fourth fiscal quarter. Garden controls and fertilizer sales increased primarily due to growth in overall category demand, but were adversely affected by an early season surge in demand which coincided with operational disruptions arising from our transformational activities during our second fiscal quarter.2013.
Gross Profit
Gross profit increased $20.2decreased $9.9 million, or 4.1%2.1%, to $514.1$454.0 million from $493.9$463.9 million in fiscal 2011.2013. Gross profit as a percentage of net sales declinedincreased from 30.3%28.1% in fiscal 20112013 to 30.2%28.3% for fiscal 2012. 2014, with both the Pet segment and the Garden segment, including the garden charge, contributing to the small increase. Adjusting for the charges and gains reflected in the adjusted results, gross profit for fiscal 2014 decreased $4.1 million, or 0.9%, to $470.9 million from fiscal 2013. Adjusted gross margin increased from 28.7% for fiscal 2013 to 29.2% for fiscal 2014.
Gross profit as a percentage of net sales decreased in the gardenPet segment and wasin fiscal 2014 due to a $42.7 million decrease in sales, partially offset by animproved gross margin. Most of our pet businesses had increased gross margins. The largest contributor to the margin increase was our bird and small animal business which benefitted from operational improvements in small animal and from lower commodity costs in bird feed. These gross margin increases were partially offset by a lower gross margin in our animal health category which was impacted by a mix shift in professional and a lower gross margin in our flea and tick category due primarily to the pet segment. In fiscal 2012, pressure on our margins from increases in raw material input costs experiencedrebranding and packaging efforts undertaken in fiscal 20112014.
In the Garden segment, gross profit remained relatively constant as the 0.9% decrease in net sales was somewhat mitigated in fiscal 2012offset by price increases.
Bothincreased gross margin. The Garden segment gross profit and gross margin increasedwere impacted in both fiscal 2014 and fiscal 2013 by the Petgarden charges. The Garden segment gross margin improved slightly due primarily to increased sales of our flea and tick productsan improved gross margin in our Animal Health category, and increased margin on sales of wild bird feed, products, which was heavily impactedbenefitted from lower commodity costs and seasonal décor, due primarily to the elimination of less profitable products. These improvements to gross margin were partially offset by a decreased gross margin in the prior yeargrass seed, due primarily to higher prices of key commodity ingredients. These increases were partially offset by decreased margincosts, and in the dog & cat category which wascontrols and fertilizers, impacted by operational disruptions in our second fiscal quarter.
Grosslower sales volumes, and a sales mix shift adversely affected gross profit and gross margin decreased in the Garden segment. Seasonal décor products were impacted by reduced revenues in fiscal 2012, primarily due to a decrease in seasonal sales programs, increased sales returns and expenses. Grass seed was impacted by sales mix and increased costs in part due to lower than expected sales volumes. Additionally, the sales increase in garden controls and fertilizer products led to increased gross profit but decreased margin due to higher input and production costs as a result of a number of factors, including the operational disruptions encountered in our second fiscal quarter.margin.
Selling, General and Administrative
Selling, general and administrative expenses increased $31.0decreased $18.2 million, or 7.6%4.4%, from $408.7$416.0 million in fiscal 20112013 to $439.7$397.8 million in fiscal 2012.2014. As a percentage of net sales, selling, general and administrative expenses increaseddecreased from 25.1%25.2% in fiscal 20112013 to 25.9%24.8% in fiscal 2012.2014. The change in selling, general and administrative expenses, discussed further below, was due primarily to increaseddecreased selling and delivery expense. Corporate expenses are included within administrative expense and relate to the costs of unallocated executive, administrative, finance, legal, human resource, and information technology functions.
Selling and delivery expense increased by $28.8decreased $17.6 million, or 12.7%7.5%, from $227.2$234.0 million in fiscal 20112013 to $256.0$216.4 million in fiscal 2012. The increased expense was due primarily to increased advertising and marketing program expenditures, including brand building activities, increased marketing personnel and variable compensation expenses related to the increase in sales, and delivery expenses also related to the increased sales in the period. The increased costs noted above include approximately $6.0 million of expenses previously reported within warehouse and administrative expense, discussed further below.2014. Selling and delivery expensesexpense as a percentage of net sales increaseddecreased from 14.0%14.2% in fiscal 20112013 to 15.1%13.5% in fiscal 2012. We expect2014. The decrease was due primarily to continue to increasedecreased marketing expenses, primarily advertising, associated with the controls and fertilizers and grass seed categories in our marketing-related expenditures in future periods to help grow our existing and new products and brands.Garden segment.
Warehouse and administrative expense increased $2.2decreased $0.6 million, or 1.2%0.3%, from $181.5$182.0 million in fiscal 20112013 to $183.7$181.4 million in fiscal 2012. We have reorganized2014. Decreased costs in both our operating units, realigned reporting linessegments were partially offset by a $9.3 million increase in corporate costs. In our Pet segment, the prior year warehouse consolidations are now yielding savings, and departments and moved personnel between departments in an effortour Garden segment, we recorded a $4.9 million gain from the sale of manufacturing plant assets related to aligna seasonal product we intend to purchase rather than produce. Corporate operating expense increased $9.3 million as a result of $5.9 million of software costs expensed (due primarily to changes in our operations withand related plans for future SAP implementations), increased medical insurance program costs and information technology third party provider costs related to our transformational objectives. As such, approximately $6.0SAP implementation.
Impairment
We perform an annual goodwill test for impairment. An impairment loss is recognized for goodwill if its carrying value exceeds its fair value. The goodwill fair values are estimated using the discounted cash flow
related to the assets. During the fourth quarter of fiscal 2013, we recognized a non-cash charge of $7.7 million related to the impairment of expenses previously reportedgoodwill within warehouseour Garden segment due to its continuing poor performance. We did not have an impairment charge in fiscal 2014.
Operating Income
Operating income increased $16.0 million in fiscal 2014, or 40.0%, to $56.2 million from $40.2 million in fiscal 2013. Lower selling, general and administrative expense are now includedexpenses and increased gross margin were partially offset by lower sales and the $16.9 million garden charge. Operating margin was 3.5% for fiscal 2014 and 2.4% for fiscal 2013. Excluding the garden charges, the gain on the sale of manufacturing plant assets and the goodwill impairment in sellingthe Garden segment, adjusted operating income was $68.2 million, as compared to $59.0 million in the prior year, and delivery expense. The increaseoperating margin improved to 4.2% as compared to 3.6% in warehouse and administrative expense, after taking into account the $6.0 million amount now part of selling and delivery expense, was $8.2prior year.
Pet segment operating income decreased $7.3 million, or 4.5%.7.7%, to $88.1 million for fiscal 2014 from $95.4 million for fiscal 2013. The increasedecrease was due primarily to approximately $6.7decreased sales, which drove lower gross profit, partially offset by decreased selling, general and administrative expenses. Pet operating margin decreased from 10.7% for fiscal 2013 to 10.4% for fiscal 2014. Garden operating income increased $32.7 million, of additional expense relatedor 395%, to transformation activities. These transformation costs include costs$41.0 million for severance, facility exitfiscal 2014 from $8.3 million for fiscal 2013. Adjusted operating income in Garden increased $25.9 million to $53.1 million for fiscal 2014 from $27.2 million in fiscal 2013, and the adjusted operating margin was 6.9% as compared to 3.5% in fiscal 2013. Garden adjusted operating income increased due primarily to a $20.1 million decrease in selling, general and administrative expenses. Corporate operating expenses increased $9.3 million due primarily to a $5.9 million long-lived software charge, increased medical insurance program costs and our shared service center start upinformation technology third party provider costs.
Within warehouse and administrative expense, approximately $5.3 million of expense shifted from our operating segments and are now part of corporate expense. These expenses were primarily related to our supply chain management team and our operational excellence teams.
Net Interest Expense
Net interest expense increased $2.4decreased $0.2 million, or 6.4%0.5%, from $37.8$43.0 million in fiscal 20112013 to $40.2$42.8 million in fiscal 2012. Interest expense increased2014. The decrease was due to an increase in thelower interest expense due primarily to lower average debt outstanding during fiscal 2014 as compared to $474fiscal 2013 partially offset by the write-off of unamortized deferred financing costs related to our prior revolving credit facility resulting in a non-cash charge of $1.7 million in the first quarter of fiscal 2012 compared to $443 million in fiscal 2011. In February 2012, we issued an additional $50 million aggregate principal amount of 8.25% senior subordinated notes due 2018 at a price of 98.501% of the principal amount of the notes. The notes are part of a series of 8.25% senior subordinated notes due 2018 issued by the Company in March 2010.
Our average interest rates for fiscal 2012 and 2011 were 8.2% and 8.1%, respectively.2014. Debt outstanding on September 29, 201227, 2014 was $449.8$450.2 million compared to $435.6$472.6 million as of September 24, 2011.28, 2013.
Other Income (Expense)
Other income increased $0.1 million from $0.6 million in fiscal 2011 to $0.7 million in fiscal 2012. While the majority(expense) is comprised of the amounts in both fiscal 2012 and fiscal 2011 are related to earningsincome from investments accounted for under the equity method investment of accounting, the increaseforeign currency exchange gains and losses, and realized and unrealized gains and losses from derivative contracts used to economically hedge anticipated commodity purchases for use in our products. Other income increased $1.1 million from $0.7 million of expense in fiscal 2013 to $0.4 million of income in fiscal 2014. The improvement was due primarily due to lower foreign exchange losses.realized and unrealized losses incurred in fiscal 2013 from derivative contracts used to economically hedge anticipated commodity purchases that did not reoccur in fiscal 2014.
Income Taxes
Our effective income tax rate inwas 29.2% for fiscal 2012 decreased to 36.7%,2014 compared to 40.8% ina 74.2% benefit for fiscal 2011 due primarily to increased2013. Our 2014 tax rate benefited from the removal of valuation allowances in fiscal 2011.
Fiscal 2011 Compared to Fiscal 2010
Net Sales
Net sales for fiscal 2011 increased $105.0 million, or 6.9%, to $1,628.6 million from $1,523.6 million in fiscal 2010. The increase was due to a $114.7 million, or 9.1%, increase in our branded product sales offset by a $9.7 million, or 3.7%, decrease in the sales of other manufacturers’ products. Branded product sales include products we manufacture under Central brand names and products we manufacture under third-party brands. Sales of our branded products represented 84% of our total sales in fiscal 2011.
Our Pet segment’s net sales for fiscal 2011 increased $10.8 million, or 1.3%, to $851.3 million from $840.5 million in fiscal 2010. In fiscal 2011, Pet branded product sales increased $10.4 million and sales of other manufacturers’ products increased $0.4 million as compared with fiscal 2010. The increase in sales was due primarily to increased sales of approximately $4.9 million in wild bird feed and $4.4 of aquatic products. The sales increase in wild bird feed was price driven while the increase in aquatic products was volume driven. Our pet health products decreased slightly due primarily to decreased sales of our flea, tick and mosquito products partially offset by increased sales of lower margin products such as rodenticide and dewormer products. The decrease in our flea and tick business was due primarily to the competition from generic fipronil and unfavorable weather.
Our Garden segment’s net sales for fiscal 2011 increased $94.2 million, or 13.8%, to $777.3 million from $683.1 million in fiscal 2010. In fiscal 2011, garden branded product sales increased $104.3 million and sales of other manufacturers’ products declined $10.1 million compared with fiscal 2010. The increase in branded product sales was due primarily to a $49.2 million increase in grass seed sales, a $23.7 million increase in bird feed sales and a $4.5 million increase in garden control and fertilizer products. The increase in grass seed sales was due primarily to increased volumes driven by customer demand and increased investment in brand building. The increase in bird feed sales was due to both volume and price increases. The net sales increase of $4.5 million in garden control and fertilizer products was due primarily to an increase of $20 million in fertilizer sales, partially offset by decreased control product sales.
Gross Profit
Gross profit decreased $21.2 million, or 4.1% to $493.9 million from $515.2 million in fiscal 2010. Gross profit as a percentage of net sales declined from 33.8% in fiscal 2010 to 30.3% for fiscal 2011. Gross profit as a percentage of net sales decreased in both segments. In fiscal 2011, the continual increases in raw material input costs put pressure on our margins. For example, our weighted average cost per pound for our primary grains increased approximately 41% for fiscal year 2011 compared to fiscal 2010.
Both gross profit and gross margin decreased in the Pet segment due primarily to higher prices of key commodity ingredients, such as milo, millet, sunflower and corn which impacted both our wild bird feed businessinternational deferred tax assets, and our super premium pet food, and a change in product mix in our health products, which shifted away from sales of higher margin flea, tick and mosquito products towards increased sales of lower margin products.
Gross profit increased in the Garden segment but gross margin decreased due primarily to higher commodity ingredient costs and the sales mix shift of garden control and fertilizer products. The higher ingredient costs impacted both bird feed and garden controls and fertilizer products. Additionally, there was a sales mix shift within garden controls and fertilizers whereby decreased sales of higher margin control products were offset by increased sales of lower margin fertilizer products.
Selling, General and Administrative
Selling, general and administrative expenses increased $14.6 million, or 3.7%, from $394.1 million in fiscal 2010 to $408.7 million in fiscal 2011. As a percentage of net sales, selling, general and administrative expenses
decreased from 25.9% in fiscal 2010 to 25.1% in fiscal 2011. The change in selling, general and administrative expenses, discussed further below, was due primarily to increased selling and delivery expense.
Selling and delivery expense increased by $21.4 million, or 10.4%, from $205.8 million in fiscal 2010 to $227.2 million in fiscal 2011. The increased expense was due primarily to increased advertising and marketing program expenditures, including brand building activities and increased variable expenses related to the increase in sales. Selling and delivery expenses as a percentage of net sales increased from 13.5% in fiscal 2010 to 14.0% in fiscal 2011. We expect to continue to increase our marketing-related expenditures in future periods to help grow our existing and new products and brands.
Facilities expense decreased $1.0 million, or 9.2%, from $10.9 million for fiscal 2010 to $9.9 million for fiscal 2011 due primarily to cost savings from warehouse consolidation in our garden segment.
Warehouse and administrative expense decreased $5.8 million, or 3.3%, from $177.4 million in fiscal 2010 to $171.6 million in fiscal 2011. The decrease in fiscal 2011 was due primarily to a reduction in performance-based compensation expense and lower third party provider costs, primarily legal costs.
Interest Expense
Net interest expense increased $4.2 million, or 12.4%, from $33.6 million in fiscal 2010 to $37.8 million in fiscal 2011. Interest expense increased due to both increased average debt outstanding of $443 million in fiscal 2011 compared to $409 million in fiscal 2010, and increased borrowing rates. Our average interest rates for fiscal 2011 and 2010 were 8.1% and 6.8%, respectively. Interest expense in fiscal 2010 included $3.9 million related to the tender for our 2013 Subordinated Notes and the issuance of our 2018 Subordinated Notes.
Debt outstanding on September 24, 2011 was $435.6 million compared to $400.3 million as of September 25, 2010.
Other Income
Other income increased $0.2 million from $0.4 million in fiscal 2010 to $0.6 million in fiscal 2011. The increase was due primarily to higher earnings from an investment accounted for under the equity method investment of accounting.
Income Taxes
Our effective income tax rate benefited primarily from additional tax credits available in fiscal 2011 increased to 40.8%, compared to 37.0% in fiscal 2010. The increase in our effective tax rate was due primarily to our reduced ability to use tax benefits due to the decrease in fiscal 2011 income and increased tax valuation allowances.2013.
Inflation
Our revenues and margins are dependent on various economic factors, including rates of inflation, energy costs, consumer attitudes toward discretionary spending, currency fluctuations, and other macro-economic factors which may impact levels of consumer spending. Historically, inIn certain fiscal periods, we have been adversely
impacted by rising input costs related to domestic inflation, particularly relating to grain and seed prices, fuel prices and the ingredients used in our garden fertilizercontrols and chemicals.fertilizer. Rising costs in those periods have made it difficult for us to increase prices to our retail customers at a pace sufficient to enable us to maintain margins.
In fiscal 2010, 2011 and 2012,recent years, our business was negatively impacted by low consumer confidence, as well as other macro-economic factors. InThroughout most of fiscal 2012,2013, commodity costs continued to increase. We are developing plansIn fiscal 2014, commodity costs declined overall, although we were impacted by increases in the event current cost levels fail to moderate orour grass seed costs. In fiscal 2015, commodity costs further declined from fiscal 2014 levels. We continue to increase.monitor commodity prices in order to be in a position to take action to mitigate the impact of increasing raw material costs.
Weather and Seasonality
Our sales of lawn and garden products are influenced by weather and climate conditions in the different markets we serve. Additionally, our Garden segment’s business is highly seasonal. In fiscal 2012,2015, approximately 66% of our Garden segment’s net sales and 59%58% of our total net sales occurred during our second and third fiscal quarters. Substantially all of the Garden segment’s operating income is typically generated in this period, which has historically offset the operating loss incurred during the first fiscal quarter of the year.
Liquidity and Capital Resources
We have financed our growth through a combination of internally generated funds, bank borrowings, supplier credit, and sales of equity and debt securities to the public.
Historically, ourOur business has beenis seasonal and our working capital requirements and capital resources trackedtrack closely to this seasonal pattern. DuringGenerally, during the first fiscal quarter, accounts receivable reach their lowest level while inventory, accounts payable and short-term borrowings begin to increase. During the second fiscal quarter, receivables, accounts payable and short-term borrowings increase, reflecting the build-up of inventory and related payables in anticipation of the peak lawn and garden selling season. During the third fiscal quarter, inventory levels remain relatively constant while accounts receivable peak and short-term borrowings start to decline as cash collections are received during the peak selling season. During the fourth fiscal quarter, inventory levels are at their lowest, and accounts receivable and payables are substantially reduced through conversion of receivables to cash.
We service two broad markets: pet supplies and lawn and garden supplies. Our Pet segment involvespet supplies businesses involve products that have a year round selling cycle with a slight degree of seasonality. As a result, it is not necessary to maintain large quantities of inventory to meet peak demands. On the other hand, our Garden segment isOur lawn and garden businesses are highly seasonal with approximately 66% of theour Garden segment’s net sales occurring during the second and third fiscal quarters. For many manufacturers of garden products, thisThis seasonality requires them to shipthe shipment of large quantities of their product well ahead of the peak consumer buying periods. To encourage retailers and distributors to carry lawn and garden products,stock large quantities of inventory, industry practice has been for manufacturers to give extended credit terms and/or promotional discounts.
CashOperating Activities
Net cash provided by operating activities decreased $39.1 million, from $126.5 million in fiscal 2014 to $87.4 million in fiscal 2015. The decrease in cash provided by operating activities was due primarily to an increased use of cash related to working capital accounts. Increased sales for fiscal 2015 drove an increase in accounts receivable for the current year as compared to the prior year. Inventory levels, excluding the impact of inventory acquired through acquisitions, decreased in 2015, though not to the same extent as in the prior year period. Elevated levels of inventory on-hand at the end of fiscal 2013 were brought down to lower levels by the end of fiscal 2014, which generated a larger amount of cash in that year, compared to the change in inventory levels and cash provided during the current fiscal year. We remain focused on bringing our investment in inventory down over time, while maintaining high fill rates and service levels to our customers.
Net cash provided by operating activities increased $38.2$154.8 million, from $51.0$28.3 million of cash used in operating activities in fiscal 20112013 to $89.2$126.5 million of cash provided by operating activities in fiscal 2012.2014. The increase in cash provided by operating activities was due primarily to a decrease indecreased working capital investment, principally inventory, as the growth in inventory in prior years was not necessary in the current year. Our working capital accounts decreased approximately $6.6 million from the end of fiscal 2011 due primarily tospecifically our decreased investment in inventory. In fiscal 2013, we built safety stock to ensure our ability to service our customers would not be disrupted. In fiscal 2014, we managed our inventory during fiscal 2012 as compared to fiscal 2011.lower levels.
Investing Activities
Net cash used in investing activities decreased $11.7increased $14.7 million from approximately $56.2$35.2 million in fiscal 20112014 to approximately $44.5$49.9 million in fiscal 2012.2015. The decreaseincrease in cash used in investing activities was due primarily to increased payments made to acquire businesses and investments in joint ventures during fiscal 2015, as well as an increase in capital expenditures during fiscal 2015 related to investments in our facilities. Additionally, there was a decrease in proceeds from the sale of certain property and equipment in fiscal 20122014 that did not recur during the current year.
Net cash used in investing activities increased $10.1 million, from $25.1 million in fiscal 2013 to $35.2 million in fiscal 2014. The increase in cash used in investing activities was due primarily to our acquisition of certain assets of a privately-held maker of premium fertilizer for the professional and retail marketsEnvincio LLC in April 2014 for approximately $23$20 million and an increase in amounts invested in restricted cash in our Garden segment in fiscal 2011,and short-term investments. These increases were partially offset by an increaseproceeds received from the sale of $8.0 million ofthe Garden segment manufacturing plant propertyassets and equipment investmentlower capital expenditures in fiscal 2012.2014 compared to fiscal 2013 due to reduced expenditures related to facilities and our SAP implementation.
Financing Activities
Net cash used in financing activities decreased $65.4increased $40.6 million from $74.0$27.8 million in fiscal 20112014 to $8.6$68.4 million in fiscal 2012.2015. The decreaseincrease in cash used was due primarily to our private placementredemption of an additional $50 million aggregate principal of our 2018 Notes during the second quarter of fiscal 2012, lower net borrowings under our revolving credit facility in the current year compared to the prior year period, and lower repurchasesMarch 2015 at 102.063%, as well as increased purchases of our common stock during fiscal 2012.stock. During fiscal 2012,2015, we repurchased $20.9$15.1 million of our common stock on the open market, which consisted of 0.70.5 million shares of our voting common stock (CENT) at an aggregate cost of approximately $5.6$4.5 million, or approximately $8.02$9.00 per share, and 1.91.2 million shares of our non-voting Class A common stock (CENTA) at an aggregate cost of approximately $15.3$10.6 million, or approximately $8.05$8.83 per share.
Net cash used in financing activities increased $48.1 million from $20.3 million of cash provided by financing activities in fiscal 2013 to $27.8 million of cash used in financing activities in fiscal 2014. The increase in cash used was due primarily to net repayments under our revolving credit facility during fiscal 2014 compared to net borrowings in fiscal 2013.
We expect that our principal sources of funds will be cash generated from our operations and, if necessary, borrowings under our $375$390 million revolving creditasset backed loan facility. Based on our anticipated cash needs, availability under our revolving creditasset backed loan facility and the scheduled maturity of our debt, we believe that our sources of liquidity should be adequate to meet our working capital, capital spending and other cash needs for at least the next 12 months. However, we cannot assure you that these sources will continue to provide us with sufficient liquidity and, should we require it, that we will be able to obtain financing on terms satisfactory to us, or at all.
We believe that cash flows from operating activities, funds available under our revolving creditasset backed loan facility, and arrangements with suppliers will be adequate to fund our presently anticipated working capital requirements for the foreseeable future. We anticipate that our capital expenditures, will not exceed $40 million for the next 12 months, which are related primarily to replacements and upgrades to plant and equipment and investment in our implementation of a scalable enterprise-wide information technology platform.platform, will not exceed $40 million for the next 12 months. We are investing in this information technology platform to improve existing operations, to support future growth and enable us to take advantage of new applications and technologies. We have invested approximately $78.5 million from fiscal 2005 through fiscal 2012 in this initiative and plan to invest up to an additional $11.0 million in fiscal 2013 for planned implementations. Capital expenditures for 2013 and beyond will depend upon the pace of conversion of those remaining legacy systems. This initiative, when complete, will combine our numerous information systems into one enterprise system and create a common business model and common data, which should create greater efficiency and effectiveness.
As part of our growth strategy, we have acquired a number of companies in the past, and we anticipate that we will continue to evaluate potential acquisition candidates in the future. If one or more potential acquisition opportunities, including those that would be material, become available in the near future, we may require additional external capital. In addition, such acquisitions would subject us to the general risks associated with acquiring companies, particularly if the acquisitions are relatively large.
Free Cash Flow
| 2015 | 2014 | 2013 | ||||||||||
Net cash provided by operations | $ | 87,449 | $ | 126,467 | $ | (28,282 | ) | |||||
Less: capital expenditures | (22,030 | ) | (17,173 | ) | (25,172 | ) | ||||||
|
|
|
|
|
| |||||||
Free cash flow | $ | 65,419 | $ | 109,294 | $ | (53,454 | ) | |||||
|
|
|
|
|
| |||||||
Free cash flow as a percentage of net sales | 4.0 | % | 6.8 | % | (3.2 | %) | ||||||
Free cash flow as a percentage of net sales decreased in fiscal year 2015, primarily due to an increase in working capital requirements due to increased sales and the inventory related to our acquisition of IMS. Free cash flow as a percentage of net sales increased in fiscal year 2014, primarily due to favorable changes in working capital, including a $66 million reduction in inventory, and increased earnings.
Stock Repurchases
During fiscal 2012,2015, we repurchased $20.9$15.1 million of our common stock, which consisted of 0.70.5 million shares of our voting common stock (CENT) at an aggregate cost of approximately $5.6$4.5 million, or approximately $8.02$9.00 per share, and 1.91.2 million shares of our non-voting Class A common stock (CENTA) at an aggregate cost of approximately $15.3$10.6 million, or approximately $8.05$8.83 per share. During the third quarter ofIn fiscal 2011, our Board of Directors authorized a new $100 million share repurchase program, under which approximately $52$35.0 million isremains available for repurchases in fiscal 20132016 and thereafter.
Total Debt
At September 29, 2012,26, 2015, our total debt outstanding was $449.8$400.1 million versus $435.6$450.2 million at September 24, 2011.
Senior Credit Facility
On June 8, 2011, we amended our $275 million, five-year senior secured revolving credit facility (the “Credit Facility”) included in our Amended and Restated Credit Agreement (the “Credit Agreement”). Under the modified terms, the Credit Facility has a borrowing capacity of $375 million, an increase of $100 million, and a maturity date of June 2016. The Credit Facility bears lower interest rates and commitment fees and requires less interest coverage. We continue to have the option to increase the size of the Credit Facility by an additional $200 million of incremental term loans and/or revolving loans should we exercise our option and one or more lenders are willing to make such increased amounts available to us. There was no outstanding balance as of September 29, 2012 under the Credit Facility. There were no letters of credit outstanding under the Credit Facility as of September 29, 2012. There were other letters of credit of $15.7 million outstanding as of September 29, 2012. As of September 29, 2012, there were $375.0 million of unused commitments under the Credit Facility or, after giving effect to the financial covenants in the Credit Agreement, $225.5 million of remaining borrowing capacity.
Interest on the amended Credit Facility is based, at our option, on a rate equal to the Alternate Base Rate (ABR), which is the greatest of the prime rate, the Federal Funds rate plus 1/2 of 1% or one month LIBOR plus 1%, plus a margin, which fluctuates from 0.75% to 1.75%, or LIBOR plus a margin, which fluctuates from 1.75% to 2.75% and commitment fees that range from 0.30% to 0.50%, determined quarterly based on consolidated total debt to consolidated EBITDA for the most recent trailing 12-month period. As of September 29, 2012, the applicable interest rate on the Credit Facility related to alternate base rate borrowings was 5.0%, and the applicable interest rate related to LIBOR rate borrowings was 3.0%.
The Credit Facility is guaranteed by our material subsidiaries and is secured by our assets, excluding real property but including substantially all of the capital stock of our subsidiaries. The Credit Agreement contains certain financial and other covenants which require us to maintain minimum levels of interest coverage and maximum levels of senior debt to EBITDA and that restrict our ability to repurchase our stock, make investments in or acquisitions of other businesses and pay dividends above certain levels over the life of the Credit Facility. Under the terms of our Credit Facility, we may make restricted payments, including cash dividends and stock repurchases, in an aggregate amount initially not to exceed $200 million over the life of the Credit Facility, subject to qualifications and baskets as defined in the Credit Agreement. As of September 29, 2012, our Total Leverage Ratio, as defined in the Credit Agreement, was 4.0 to 1.0, and our Senior Secured Leverage Ratio, as defined in the Credit Agreement with a maximum of 2.0 to 1.0, was 0.01 to 1.0. Our minimum Interest Coverage Ratio was reduced to 2.50 times, from 2.75 times as part of the modification of the Credit Facility. As of September 29, 2012, our Interest Coverage ratio was 2.9 times. Apart from the covenants limiting restricted payments and capital expenditures, the Credit Facility does not restrict the use of retained earnings or net income. We were in compliance with all financial covenants as of September 29, 2012.27, 2014.
Senior Subordinated Notes
OnIn March 8, 2010, we issued $400 million aggregate principal amount of 8.25% senior subordinated notes due March 1, 2018 (the “2018 Notes”).
On February 13, 2012, we issued an additional $50 million aggregate principal amount of our 2018 Notes at a price of 98.501%, plus accrued interest from September 1, 2011, in a private placement. We used the net proceeds from the offering to pay a portion of the outstanding balance under our Credit Facility.
We incurred approximately $1.7 million of debt issuance costs in conjunction with this offering, which included underwriter fees and legal, accounting and rating agency expenses. The debt issuance costs are being amortized over the remaining term of the 2018 Notes.
The estimated fair value of our $450$400 million of 2018 Notes as of September 29, 201226, 2015 was approximately $483$410.5 million. The estimated fair value is based on quoted market prices for these notes.
In March 2015, we redeemed $50.0 million of our 2018 Notes at a price of 102.063% of the principal amount of the notes redeemed. In conjunction with this transaction, we recognized a charge in interest expense of approximately $1.6 million in our second quarter of fiscal 2015 related to the payment of the call premium and the non-cash write-off of unamortized financing costs.
The 2018 Notes contained customary high yield covenants, including covenants limiting debt incurrence and restricted payments, subject to certain baskets and exceptions. We were in compliance with all financial covenants as of September 26, 2015.
Issuance of $400 Million 6.125% Senior Notes
In November 2015, we issued $400 million aggregate principal amount of 6.125% senior unsecured notes due November 2023 (the “2023 Notes”). The 2023 Notes require semiannual interest payments which commenced on September 1, 2010.November 15 and May 15, commencing May 15, 2016. The 20182023 Notes are unsecured senior subordinated obligations and are subordinated to all of our existing and future senior debt, including our Credit Facility. The obligations under the 2018 Notes are fully and unconditionally guaranteed on a senior subordinated basis by each of our existing and future domestic restricted subsidiaries which are borrowers under or guarantors of our senior secured revolving credit facility. We used the net proceeds from the offering, together with certain exceptions. The guarantees are general unsecured senior subordinated obligationsavailable cash, to redeem our outstanding 2018 Notes and pay fees and expenses related to the offering. As a result of our redemption of the guarantors and are subordinated2018 Notes, we will recognize a charge in our fiscal 2016 first quarter of approximately $8.3 million related to all existing and future senior debtthe payment of the guarantors.call premium, a one-time payment of overlapping interest expense for 30 days of approximately $2.8 million and a $3.2 million non-cash charge for the write-off of unamortized financing costs in interest expense. We expect our annual interest expense on the 2023 Notes going forward to be approximately $8.5 million less than under the 2018 Notes.
We may redeem some or all of the 2018 Notes at any time prior to March 1, 2014 at the principal amount plus a “make whole” premium. We may redeem some or all of the 20182023 Notes at any time on or after March 1, 2014November 15, 2018 for 104.125%104.594%, after March 1, 2015 for 102.063% and after March 1, 2016 for 100%, plus accrued and unpaid interest. Additionally, at any time prior to March 1, 2013, we may redeem up to 35% of the 2018 Notes with any proceeds we receive from certain equity offerings at a redemption price of 108.25% of the principal amount, plus accrued and unpaid interest. The holders of the 20182023 Notes have the right to require us to repurchase all or a portion of the 20182023 Notes at a purchase price equal to 101% of the principal amount of the notes repurchased, plus accrued and unpaid interest upon the occurrence of a change of control.
The 20182023 Notes contain customary high yield covenants, including covenants limiting debt incurrence and restricted payments, subject to certain baskets and exceptions.
Asset Backed Loan Facility
On December 5, 2013, we entered into a credit agreement which provides up to a $390 million principal amount senior secured asset-based revolving credit facility, with up to an additional $200 million principal amount available with the consent of the Lenders if we exercise the accordion feature set forth therein (collectively, the “Credit Facility”). The Credit Facility matures on December 5, 2018 and replaced our prior revolving credit facility. We may borrow, repay and reborrow amounts under the Credit Facility until its maturity date, at which time all amounts outstanding under the Credit Facility must be repaid in full. As of September 26, 2015, there were no borrowings or letters of credit outstanding under the Credit Facility. There were other letters of credit of $6.0 million outstanding as of September 26, 2015.
The Credit Facility is subject to a borrowing base, calculated using a formula based upon eligible receivables and inventory, minus certain reserves and subject to restrictions. The borrowing availability as of September 26, 2015 was $307 million. Borrowings under the Credit Facility bear interest at an index based on LIBOR or, at our option, the Base Rate (defined as the highest of (a) the SunTrust prime rate, (b) the Federal Funds Rate plus 0.5% and (c) one-month LIBOR plus 1.00%), plus, in either case, an applicable margin based on our total outstanding borrowings. Such applicable margin for LIBOR-based borrowings fluctuates between 1.25%-1.75% (1.25% at September 26, 2015) and such applicable margin for Base Rate borrowings fluctuates between 0.25%-0.75% (0.25% at September 26, 2015). As of September 26, 2015, the applicable interest rate related to Base Rate borrowings was 3.5%, and the applicable interest rate related to LIBOR-based borrowings was 1.4%.
The Credit Facility contains customary covenants, including financial covenants which require us to maintain a minimum fixed charge coverage ratio of 1.00:1.00 upon reaching certain borrowing levels. The Credit Facility is secured by substantially all of our assets. We were in compliance with all financial covenants under the Credit Facility during the period ended September 26, 2015.
We incurred approximately $3.1 million of costs in conjunction with this transaction, which included banking fees and legal expenses. These costs will be amortized over the term of the Credit Facility.
We recorded a non-cash charge of $1.7 million for the three month period ended December 28, 2013 as part of September 29, 2012.interest expense, related to the write-off of unamortized deferred financing costs under the prior revolving credit facility.
Contractual Obligations
The table below presents our significant contractual cash obligations by fiscal year:
Contractual Obligations | Fiscal 2016 | Fiscal 2017 | Fiscal 2018 | Fiscal 2019 | Fiscal 2020 | Thereafter | Total | |||||||||||||||||||||
| (in millions) | ||||||||||||||||||||||||||||
| $ | 0.3 | $ | 0.1 | $ | 400.0 | $ | — | $ | — | $ | — | $ | 400.4 | ||||||||||||||
Interest payment obligations (2) | 33.0 | 33.0 | 16.5 | — | — | — | 82.5 | |||||||||||||||||||||
Operating leases | 19.1 | 16.0 | 9.5 | 8.0 | 4.5 | 1.0 | 58.1 | |||||||||||||||||||||
Purchase commitments (3) | 111.1 | 39.2 | 24.4 | 15.4 | 6.8 | 1.4 | 198.3 | |||||||||||||||||||||
Performance-based payments (4) | — | — | — | — | — | — | — | |||||||||||||||||||||
Total | $ | 163.5 | $ | 88.3 | $ | 450.4 | $ | 23.4 | $ | 11.3 | $ | 2.4 | $ | 739.3 | ||||||||||||||
| (1) | Excludes $6.0 million of outstanding letters of credit related to normal business transactions. Excludes unamortized discount of $0.3 million related to the 2018 Notes. See Note 11 to the consolidated financial statements for further discussion of long-term debt. |
| (2) | Estimated interest payments to be made on our 2018 Notes. In November 2015, we issued $400 million aggregate principal amount of 6.125% senior notes due November 2023. We used the net proceeds from the offering, together with available cash, to redeem our 2018 Notes and pay fees and expenses related to the offering. As a result of our redemption of the 2018 Notes, we will recognize a charge in our fiscal 2016 first quarter of approximately $8.3 million related to the payment of the call premium, a one-time payment of overlapping interest expense for 30 days of approximately $2.8 million and a $3.2 million non-cash charge for the write-off of unamortized financing costs in interest expense. We expect our annual interest expense on the 2023 Notes going forward to be approximately $8.5 million less than under the 2018 Notes. See Note 11 to the consolidated financial statements for description of interest rate terms. |
| (3) | Contracts for purchases of grains, grass seed and pet food ingredients, used primarily to mitigate risk associated with increases in market prices and commodity availability. |
| (4) | Possible performance-based payments associated with prior acquisitions of businesses are not included in the above table,
As of September 26, 2015, we had unrecognized tax benefits of $0.1 million. These amounts have been excluded from the contractual obligations table because a reasonably reliable estimate of the timing of future tax settlements cannot be determined. Off-Balance Sheet Arrangements We have not entered into any transactions with unconsolidated entities whereby we have financial guarantees, subordinated retained interests, derivative instruments or other contingent arrangements that expose us to material continuing risks, contingent liabilities, or any other obligation under a variable interest in an unconsolidated entity that provides financing, liquidity, market risk or credit risk support to us. Recent Accounting Pronouncements
In for reporting discontinued operations and disclosures of disposals of components. The amended guidance raises the threshold for disposals to qualify as discontinued operations and permits significant continuing involvement and continuing cash flows with the discontinued operation. In addition, the amended guidance requires additional disclosures for discontinued operations and new disclosures for individually material disposal transactions that do not meet the definition of a discontinued operation. The amended guidance is effective for annual periods and interim periods within those annual periods beginning after December 15, 2014 and became effective for us prospectively commencing September 27, 2015. The adoption of the applicable sections of this ASC may have an impact on the accounting for any future discontinued operations we may have. Revenue Recognition In May 2014, the Financial Accounting Standards Board (FASB) issued Accounting Standards Update No. 2014-09 (ASU 2014-09),Revenue from Contracts with Customers. This update was issued as Accounting Standards Codification Topic 606. The core principle of this amendment is that an entity should recognize revenue to depict the transfer of promised goods or services to customers in an amount that reflects the consideration to which the entity expects to be entitled in exchange for those goods or services. On July 9, 2015, the FASB deferred the effective date of ASU 2014-09 for one year. ASU 2014-09 is now effective for us in the first quarter of our fiscal year ending September 28, 2019. Earlier adoption is not permitted before the original effective date. The guidance permits two implementation approaches, one requiring retrospective application of the new standard with restatement of prior years and one requiring prospective application of the new standard with disclosure of results under old standards. The adoption of this guidance is not expected to have a significant impact on our consolidated financial statements. Stock Based Compensation In June 2014, the FASB issued ASU No.
Consolidation In February 2015, the FASB issued ASU 2015-02 (ASU 2015-02), Amendments to the Consolidation Analysis to ASC Topic 810, Consolidation. ASU 2015-02 modifies the evaluation of whether limited partnerships and Debt Issuance Costs In Standards Board (FASB) issued Accounting Standards Update (ASU) 2015-15, Interest – Imputation of Interest (Subtopic 835-30). This ASU provides additional guidance Cloud Computing Costs In April 2015, the FASB issued ASU No. 2015-05(ASU 2015-05),Intangibles – Goodwill and Other – Internal-Use Software (Subtopic 350-40): Customer’s Accounting for Fees Paid in Inventory Measurement In July 2015, the FASB issued ASU 2015-11 (ASU 2015-11),Simplifying the Measurement of Inventory. Under ASU 2015-11, inventory will be measured at the “lower of cost and net realizable value” and options that currently exist for “market value” will be eliminated. The standard defines net realizable value as the “estimated selling prices in the ordinary course of business, less reasonably predictable costs of completion, disposal, and transportation.” No other changes were made to the current guidance on inventory measurement. ASU 2015-11 is effective for interim and annual periods beginning after December 15,
In
Critical Accounting Policies, Estimates and Judgments Our discussion and analysis of our financial condition and results of operations compensation, deferred and current income taxes, self-insurance accruals and the impact of contingencies and litigation. We base our estimates on historical experience and on various other assumptions that are believed to be reasonable under the circumstances, the result of which forms the basis for making judgments about the carrying value of assets and liabilities that are not readily apparent from other sources. Actual results may differ from those estimates under different assumptions or conditions. Although not all inclusive, we believe that the following represent the more critical accounting policies, which are subject to estimates and assumptions used in the preparation of our consolidated financial statements. Allowance for Doubtful Accounts We record an allowance for credit losses and disputed balances associated with our customers’ failure to make required payments. We estimate our allowance based on Inventory Inventory, which primarily consists of lawn and garden products and pet supplies finished goods, is stated at the lower of first-in first-out (“FIFO”) cost or market. Cost includes certain indirect purchasing, merchandise handling and storage costs incurred to acquire or manufacture inventory, costs to unload, process and put away shipments received to prepare them to be picked for orders, and certain overhead costs. We compute the amount of such costs capitalized to inventory based on an estimate of costs related to the procurement and processing of inventory to prepare it for sale compared to total product purchases. When necessary, we have reduced the carrying value of our inventory if market conditions indicate that we will not recover the carrying cost upon sale. Future adverse changes in market conditions related to our products could result in an additional charge to income in the period in which such conditions occur. Goodwill Goodwill represents the excess of cost of an acquired business over the fair value of the identifiable tangible and intangible assets acquired and liabilities assumed in a business combination. Identifiable intangible assets acquired in business combinations are recorded based on their fair values at the date of acquisition. Goodwill and identifiable intangible assets with indefinite lives are not subject to amortization but must be evaluated for impairment. We test goodwill for impairment annually (on the first day of the fourth fiscal quarter), or whenever events occur or circumstances change that would more likely than not reduce the fair value of a reporting unit below its carrying amount, by initially comparing the fair value of each of our four reporting units to their related carrying values. If the fair value of the reporting unit is less than its carrying value, we perform an additional step to determine the implied fair value of goodwill associated with that reporting unit. The implied fair value of goodwill is determined by first allocating the fair value of the reporting unit to all of its assets and liabilities and then computing the excess of the reporting unit’s fair value over the amounts assigned to the assets and liabilities. If the carrying value of goodwill exceeds the implied fair value of goodwill, such excess represents the amount of goodwill impairment, and, accordingly, we recognize such impairment. Our goodwill impairment analysis also includes a comparison of the aggregate estimated fair value of all four reporting units to our total market capitalization. Determining the fair value of a reporting unit involves the use of significant estimates and assumptions. The estimate of fair value of each of our reporting units is based on our projection of revenues, gross margin, operating costs and cash flows considering historical and estimated future results, general economic and market conditions as well as the impact of planned business and operational strategies. We base our fair value estimates on assumptions we believe to be reasonable at the time, but such assumptions are subject to inherent uncertainty. Assumptions critical to our fair value estimates were: (i) discount rates used in determining the fair value of the reporting units; (ii) estimated future cash flows; and (iii) projected revenue and operating profit growth rates used in the reporting unit models. Actual results may differ from those estimates. The valuations employ present value techniques to measure fair value and consider market factors. Our goodwill is associated with one of the reporting units within our Pet segment. In connection with our annual goodwill impairment testing performed during fiscal Changes in the judgments and estimates underlying our analysis of goodwill for possible impairment, including expected future cash flows and discount rate, could result in a significantly different estimate of the fair value of the reporting units in the future and could result in additional impairment of goodwill. Intangible assets Indefinite-lived intangible assets consist primarily of acquired trade names and trademarks. Indefinite-lived intangible assets are tested annually for impairment or whenever events or changes in circumstances occur indicating that the carrying amount of the asset may not be recoverable. An impairment loss would be recognized for an intangible asset with an indefinite useful life if its carrying value exceeds its fair value. Indefinite-lived intangible assets are tested for impairment by comparing the fair value of the asset to the carrying value. Fair value is determined based on discounted cash flow analyses that include significant management assumptions such as revenue growth rates, discount rates, weighted average cost of capital, and assumed royalty rates. Future net sales and short-term growth rates are estimated for trade names based on management’s forecasted financial results which consider key business drivers such as specific revenue growth initiatives, market share changes and general economic factors such as consumer spending. During fiscal future years. In fiscal
Long-Lived Assets We review our long-lived assets, including amortizable intangibles and property, plant and equipment, for potential impairment whenever events or changes in business circumstances indicate that the carrying amount of the assets may not be fully recoverable. An impairment loss would be recognized for amortizable intangible assets and property, plant and equipment when estimated undiscounted future cash flows expected to result from use of the asset are less than its carrying amount. Management determines fair value by estimating future cash flows as a result of forecasting sales and costs. Impairment, if any, is measured as the amount by which the carrying amount of a long-lived asset exceeds its fair value. No factors indicating the carrying value of our tangible long-lived assets may not be recoverable were present in fiscal testing was performed on these assets. No factors indicating the carrying value of our long-lived assets may not be recoverable were present in fiscal
Accruals for Self-Insurance We maintain insurance for certain risks, including workers’ compensation, general liability and vehicle liability, and are self-insured for employee related health care benefits. Our workers’ compensation, general liability and vehicle liability insurance policies include deductibles of $250,000 to $350,000 per occurrence, with a separate deductible of $50,000 for physical damage. We maintain excess loss insurance that covers any health care claims in excess of $700,000 per person per year. We maintain a self-insurance reserve for losses, determined with assistance from a Acquisitions In connection with businesses we acquire, management must determine the fair values of assets acquired and liabilities assumed. Considerable judgment and estimates are required to determine such amounts, particularly as they relate to identifiable intangible assets, and the applicable useful lives related thereto. Under different assumptions, the resulting valuations could be materially different, which could materially impact the operating results we report. Our contractual commitments are presented Item 7A. Quantitative and Qualitative Disclosure About Market Risk We are exposed to market risks, which include changes in U.S. interest rates and commodity prices and, to a lesser extent, foreign exchange rates. We do not engage in financial transactions for trading or speculative purposes. Interest Rate Risk. The interest payable on our Commodity Prices.We are exposed to fluctuations in market prices for grains, grass seed, chemicals, fertilizer ingredients and pet food ingredients. To mitigate risk associated with increases in market prices Foreign Currency Risks.Our market risk associated with foreign currency rates is not considered to be material.To date, we have had minimal sales outside of the United States. Purchases made by our U.S. subsidiaries from foreign vendors are primarily made in U.S. dollars. Our international subsidiary transacts most of its business in British pounds. Therefore, we have only minimal exposure to foreign currency exchange risk. We do not hedge against foreign currency risks and believe that foreign currency exchange risk is immaterial to our current business. Item 8. Financial Statements and Supplementary Data See pages beginning at F-1. Item 9. Changes in and Disagreements With Accountants on Accounting and Financial Disclosure None. Item 9A. Controls and Procedures (a)Evaluation of Disclosure Controls and Procedures. Our Chief Executive Officer and Acting Chief Financial Officer have reviewed, as of the end of the period covered by this report, the “disclosure controls and procedures” (as defined in the Securities Exchange Act of 1934 Rules 13a-15(e) and 15d-15(e)) that ensure that information relating to the Company required to be disclosed by us in the reports that we file or submit under the Exchange Act is recorded, processed, summarized and reported in a timely and proper manner and that such information is accumulated and communicated to our management, including our Chief Executive Officer and Acting Chief Financial Officer, as appropriate to allow timely decisions regarding required disclosure. Based upon this review, such officers concluded that our disclosure controls and procedures were effective as of September (b)Changes in Internal Control Over Financial Reporting. (c)Management’s Report on Internal Control Over Financial Reporting. A copy of our management’s report and the report of Deloitte & Touche LLP, our independent registered public accounting firm, are included in our Financial Statements and Supplementary Data beginning on page F-1. None. PART III Item 10. Directors, Executive Officers and Corporate Governance We have adopted a code of ethics that applies to all of our executive officers and directors, a copy of which is filed The remaining information required by this item is incorporated by reference from Central’s Definitive Proxy Statement for its Item 11. Executive Compensation The information required by this item is incorporated by reference from Central’s Definitive Proxy Statement for its
The information required by this item is incorporated by reference from Central’s Definitive Proxy Statement for its Item 13. Certain Relationships and Related Transactions, and Director Independence The information required by this item is incorporated by reference from Central’s Definitive Proxy Statement for its Item 14. Principal Accountant Fees and Services The information required by this item is incorporated by reference from Central’s Definitive Proxy Statement for its PART IV Item 15. Exhibits and Financial Statement Schedules
Management’s Report on Internal Control Over Financial Reporting Report of Independent Registered Public Accounting Firm Consolidated Balance Sheets Consolidated Statements of Operations Consolidated Statements of Comprehensive Income (Loss) Consolidated Statements of Shareholders’ Equity Consolidated Statements of Cash Flows Notes to Consolidated Financial Statements All other schedules are omitted because of the absence of conditions under which they are required or because the required information is included in the consolidated financial statements or notes thereto.
See attached Exhibit Index. SIGNATURES Pursuant to the requirements of Section 13 or 15(d) of the Securities Exchange Act of 1934, the registrant has duly caused this report to be signed on its behalf by the undersigned, thereunto duly authorized. Date: December
Pursuant to the requirements of the Securities Exchange Act of 1934, this report has been signed below by the following persons on behalf of the registrant and in the capacities indicated.
INDEX TO CONSOLIDATED FINANCIAL STATEMENTS
MANAGEMENT’S REPORT ON INTERNAL CONTROL OVER FINANCIAL REPORTING Central Garden & Pet Company’s management, under the supervision of Central’s Chief Executive Officer and Chief Financial Officer, is responsible for establishing and maintaining effective internal control over financial reporting (as defined in Rule 13a-15(f) or 15d-15(f) under the Exchange Act). Management evaluated the effectiveness of Central’s internal control over financial reporting based on the framework inInternalControl –Integrated Framework (1992) issued by the Committee of Sponsoring Organizations (“COSO”) of the Treadway Commission. Based on evaluation of the criteria set forth by COSO inInternal Control –Integrated Framework(1992),management concluded that our internal control over financial reporting was effective as of September Our independent registered public accounting firm, Deloitte & Touche LLP, has issued a report on our internal control over financial reporting, which appears on page F-3 of this Form 10-K. Because of the inherent limitations of internal control over financial reporting, including the possibility of collusion or improper management override of controls, material misstatements due to error or fraud may not be prevented or detected on a timely basis. Also, projections of any evaluation of the effectiveness of the internal control over financial reporting to future periods are subject to the risk that the controls may become ineffective because of changes in conditions, or that the degree of compliance with the policies or procedures may deteriorate. REPORT OF INDEPENDENT REGISTERED PUBLIC ACCOUNTING FIRM To the Board of Directors and Shareholders of Central Garden & Pet Company: We have audited the accompanying consolidated balance sheets of Central Garden & Pet Company and subsidiaries (the “Company”) as of September We conducted our audits in accordance with the standards of the Public Company Accounting Oversight Board (United States). Those standards require that we plan and perform the audit to obtain reasonable assurance about whether the financial statements are free of material misstatement and whether effective internal control over financial reporting was maintained in all material respects. Our audits of the financial statements included examining, on a test basis, evidence supporting the amounts and disclosures in the financial statements, assessing the accounting principles used and significant estimates made by management, and evaluating the overall financial statement presentation. Our audit of internal control over financial reporting included obtaining an understanding of internal control over financial reporting, assessing the risk that a material weakness exists, and testing and evaluating the design and operating effectiveness of internal control based on the assessed risk. Our audits also included performing such other procedures as we considered necessary in the circumstances. We believe that our audits provide a reasonable basis for our opinions. A company’s internal control over financial reporting is a process designed by, or under the supervision of, the company’s principal executive and principal financial officers, or persons performing similar functions, and effected by the company’s board of directors, management, and other personnel to provide reasonable assurance regarding the reliability of financial reporting and the preparation of financial statements for external purposes in accordance with generally accepted accounting principles. A company’s internal control over financial reporting includes those policies and procedures that (1) pertain to the maintenance of records that, in reasonable detail, accurately and fairly reflect the transactions and dispositions of the assets of the company; (2) provide reasonable assurance that transactions are recorded as necessary to permit preparation of financial statements in accordance with generally accepted accounting principles, and that receipts and expenditures of the company are being made only in accordance with authorizations of management and directors of the company; and (3) provide reasonable assurance regarding prevention or timely detection of unauthorized acquisition, use, or disposition of the company’s assets that could have a material effect on the financial statements. Because of the inherent limitations of internal control over financial reporting, including the possibility of collusion or improper management override of controls, material misstatements due to error or fraud may not be prevented or detected on a timely basis. Also, projections of any evaluation of the effectiveness of the internal control over financial reporting to future periods are subject to the risk that the controls may become inadequate because of changes in conditions, or that the degree of compliance with the policies or procedures may deteriorate. In our opinion, the consolidated financial statements referred to above present fairly, in all material respects, the financial position of Central Garden & Pet Company and subsidiaries as of September /s/ San Francisco, California December CONSOLIDATED BALANCE SHEETS
See notes to consolidated financial statements. CONSOLIDATED STATEMENTS OF OPERATIONS
See notes to consolidated financial statements. CONSOLIDATED STATEMENTS OF COMPREHENSIVE INCOME (LOSS) (in thousands, except per share amounts)
See notes to consolidated financial statements. CONSOLIDATED STATEMENTS OF EQUITY (dollars in thousands)
See notes to consolidated financial statements CONSOLIDATED STATEMENTS OF CASH FLOWS
See notes to consolidated financial statements. NOTES TO CONSOLIDATED FINANCIAL STATEMENTS Fiscal Years Ended September September 1. Organization and Significant Accounting Policies Organization – Central Garden & Pet Company (“Central”), a Delaware corporation, and subsidiaries (the “Company”), is a leading marketer and producer of quality branded products Basis of Consolidation and Presentation – The consolidated financial statements include the accounts of Central and all majority-owned subsidiaries. Noncontrolling Interest – Noncontrolling interest in the Company’s Use of Estimates – The preparation of financial statements in conformity with accounting principles generally accepted in the United States of America requires that management make estimates and assumptions that affect the reported amounts of assets and liabilities and disclosure of contingent assets and liabilities as of the date of the financial statements and the reported amounts of revenues and expenses during the reporting period including realization of accounts receivable and inventory and valuation of Revenue Recognition – Sales are recognized when merchandise is shipped, risk of loss and title passes to the customer and the Company has no further obligations to provide services related to such merchandise. Discounts, volume-based rebate incentives and most cooperative advertising amounts are recorded as a reduction of sales. The Company’s Cost of goods sold and occupancy consists of cost of product, inbound freight charges, purchasing and receiving costs, certain indirect purchasing, merchandise handling and storage costs, internal transfer costs as well as allocations of overhead costs, including depreciation, related to the Company’s facilities. Cost of goods sold excludes substantially all shipping and handling and out-bound freight costs to customers, which are included in selling, general and administrative expenses as delivery expenses. The cost of shipping and handling, including internal costs and payments to third parties, included in delivery expenses within selling, general and administrative expenses for the fiscal years ended September Advertising Costs – The Company expenses the costs of advertising as incurred. Advertising expenses were
401(k) Plans– The Company sponsors several 401(k) plans which cover substantially all employees. The Company’s matching contributions expensed under these plans were CENTRAL GARDEN & PET COMPANY NOTES TO CONSOLIDATED FINANCIAL STATEMENTS—(Continued) million for fiscal year 2014 and $2.1 million for fiscal years 2013. In fiscal Other income consists principally of earnings from equity method investments and foreign exchange gains and losses. Income taxes are accounted for under the asset and liability method. Deferred income taxes result primarily from bad debt allowances, inventory and goodwill write-downs, amortization and U. S. income taxes have not been provided on undistributed earnings (approximately $2.3 million at September 26, 2015) of our foreign subsidiary since all such earnings are considered indefinitely reinvested overseas. The Cash and cash equivalents include cash and all highly liquid Restricted cash and cash equivalentsinclude cash and highly liquid instruments that are used as collateral for stand–alone letter of credit agreements. Short term investmentsinclude investments with original maturities greater than three months and remaining maturities of one year or less. Accounts receivableare carried at their estimated collectible amounts. Trade credit is generally extended on a short-term basis; thus trade receivables do not bear interest, although a finance charge may be applied to such receivables that are past due. Allowance for doubtful accounts – Trade accounts receivable are regularly evaluated for collectability based on past credit history with customers, their expected returns and their current financial condition. Inventories, which primarily consist of garden products and pet supplies finished goods, are stated at the lower of FIFO cost or market. Cost includes certain indirect purchasing, merchandise handling and storage costs incurred to acquire or manufacture inventory, costs to unload, process and put away shipments received in order to prepare them to be picked for orders, and certain other overhead costs. The amount of such costs capitalized to inventory is computed based on an estimate of costs related to the procurement and processing of inventory to prepare it for sale compared to total product purchases. Land, buildings, improvements and equipment are stated at cost. Depreciation is computed by the straight-line method over thirty years for buildings. Improvements are amortized on a straight-line basis over the shorter of the useful life of the asset or the terms of the related leases. Depreciation on equipment and capitalized software is computed by the straight-line and accelerated methods over the estimated useful lives of 3 to 10 years. Long-Lived Assets – The Company reviews its long-lived assets, including amortizable and indefinite-lived intangible assets and property, plant and equipment, for potential impairment whenever events or changes in business circumstances indicate that the carrying amount of the assets may not be fully recoverable, and annually CENTRAL GARDEN & PET COMPANY NOTES TO CONSOLIDATED FINANCIAL STATEMENTS—(Continued) for indefinite-lived intangible assets. An impairment loss would be recognized for amortizable intangible
by the Company in determining the fair value of assets change, or management changes plans regarding the future use of certain assets, additional charges to operations may be required in the period in which such conditions occur. See Note
Goodwill represents the excess of cost of an acquired business over the fair value of the identifiable tangible and intangible assets acquired and liabilities assumed in a business combination. Identifiable intangible assets acquired in business combinations are recorded based on their fair values at the date of acquisition. Goodwill is not subject to amortization but must be evaluated for impairment annually. The Company tests for goodwill impairment annually or whenever events occur or circumstances change that would more likely than not reduce the fair value of a reporting unit below its carrying amount. See Note Investments – The Company owns membership interests approximating 50% in Accruals For Insurance – The Company maintains insurance for certain risks, including workers’ compensation, general liability and vehicle liability, and is self-insured for employee related health care benefits. The Company’s workers’ compensation, general liability and vehicle liability insurance policies include deductibles of $250,000 to $350,000 per occurrence. The Company maintains excess loss insurance that covers any health care claims in excess of $700,000 per person per year. The Company establishes reserves for losses based on its claims experience and actuarial estimates of the ultimate loss amount inherent in the claims, including claims incurred but not yet reported. Costs are recognized in the period the claim is incurred, and the financial statement accruals include an estimate of claims incurred but not yet reported. Fair Value of Financial Instruments – At September Derivative Financial Instruments – The Company reports all derivative financial instruments on the balance sheet at fair value. Changes in fair value are recognized in earnings, or are deferred, depending on the nature of the underlying exposure being hedged and how effective the derivative is at offsetting a change in the underlying exposure. CENTRAL GARDEN & PET COMPANY NOTES TO CONSOLIDATED FINANCIAL STATEMENTS—(Continued) The Company principally uses a combination of purchase orders and various short and long-term supply arrangements in connection with the purchase of raw materials, including certain commodities. The Company also enters into commodity futures, options and
contracts is to achieve greater certainty with regard to the future price of commodities purchased for use in its supply chain. These derivative contracts are entered into for periods consistent with the related underlying exposures and do not constitute positions independent of those exposures. The Company does not enter into derivative contracts for speculative purposes and does not use leveraged instruments.
Stock-Based Compensation – Stock-based compensation cost is estimated at the grant date based on the fair value of the award and is expensed ratably over the service period of the award. Total compensation costs recognized under all share-based arrangements in fiscal Total Comprehensive Income (Loss)– Total comprehensive income (loss) consists of two components: net income and other comprehensive Recent Accounting Pronouncements Discontinued Operations In Revenue Recognition In
CENTRAL GARDEN & PET COMPANY NOTES TO CONSOLIDATED FINANCIAL STATEMENTS—(Continued) one year. ASU 2014-09 is now effective for the Company in the first quarter of its fiscal year ending September 28, 2019. Early adoption is not permitted before the original effective date. The guidance permits two implementation approaches, one requiring retrospective application of the new standard with restatement of prior years and one requiring prospective application of the new standard with disclosure of results under old standards. The adoption of this guidance is not expected to have a significant impact on the Company’s consolidated financial statements. Stock Based Compensation In June 2014, the FASB issued ASU No. 2014-12 (ASU 2014-12),Compensation – Stock Compensation (Topic 718): Accounting for Share-Based Payments When the Terms of an Award Provide That a PerformanceTarget Could Be Achieved after the Requisite Service Period. ASU 2014-12 requires that a performance target that affects vesting and that could be achieved after the requisite service period should be treated as a performance condition. A reporting entity should apply existing guidance in Topic 718 as it relates to awards with performance conditions that affect vesting to account for such awards. As such, the performance target should not be reflected in estimating the grant-date fair value of the award. ASU 2014-12 is effective for annual periods and interim periods within those annual periods beginning after December 15, 2015, or the Company’s first quarter of fiscal 2017. Earlier adoption is permitted. The Company is currently evaluating the impact that the adoption of this standard will have on its consolidated financial statements. Consolidation In February 2015, the FASB issued ASU 2015-02 (ASU 2015-02), Amendments to the Consolidation Analysis to ASC Topic 810, Consolidation. ASU 2015-02 modifies the evaluation of whether limited partnerships and similar legal entities are VIEs or voting interest entities, eliminates the presumption that a general partner should consolidate a limited partnership and affects the consolidation analysis of reporting entities that are involved with VIEs, particularly those that have fee arrangements and related party relationships. ASU 2015-02 is effective for fiscal years that begin after December 15, 2015, or the Company’s first quarter of fiscal 2017. The Company is currently evaluating the impact the adoption of ASU 2015-02 will have on its consolidated financial statements. Debt Issuance Costs In April 2015, the FASB issued ASU No. 2015-03(ASU 2015-03), Interest – Imputation of Interest (Subtopic 835-30): Simplifying the Presentation of Debt Issuance Costs. This standard amends the existing guidance to require that debt issuance costs be presented in the balance sheet as a deduction from the carrying amount of the related debt liability instead of as a deferred charge. In August 2015, the Financial Accounting Standards Board (FASB) issued Accounting Standards Update (ASU) 2015-15, Interest – Imputation of Interest (Subtopic 835-30). This ASU provides additional guidance on ASU 2015-03 with respect to line of credit arrangements, whereby specify debt issuance costs as part of line-of-credit arrangements may continue to be deferred and presented as an asset on the balance sheet. Recognition and measurement guidance for debt issuance costs are not affected. These ASUs are effective for annual periods beginning after December 15, 2015, or the Company’s first quarter of fiscal 2017. Early adoption is permitted. As of September 26, 2015, the Company had approximately $3.4 million of net deferred financing costs that would be reclassified from a long-term asset to a reduction in the carrying amount of its debt upon adoption of the standard. Cloud Computing Costs In April 2015, the FASB issued ASU No. 2015-05(ASU 2015-05),Intangibles – Goodwill and Other – Internal-Use Software (Subtopic 350-40): Customer’s Accounting for Fees Paid in a Cloud Computing CENTRAL GARDEN & PET COMPANY NOTES TO CONSOLIDATED FINANCIAL STATEMENTS—(Continued)
Inventory Measurement In July 2015, the FASB issued ASU 2015-11 (ASU 2015-11),Simplifying the Measurement of Inventory. Under ASU 2015-11, inventory will be measured at the “lower of cost and net realizable value” and options that currently exist for “market value” will be eliminated. The standard defines net realizable value as the “estimated selling prices in the ordinary course of business, less reasonably predictable costs of completion, disposal, and transportation.” No other changes were made to the current guidance on inventory measurement. ASU 2015-11 is effective for interim and annual periods beginning after December 15,
Business Combinations In September
2. Fair Value Measurements
Level 1 – Quoted prices in active markets for identical assets or liabilities. Level 2 – Inputs other than quoted prices included within Level 1 that are observable for the asset or liability, either directly or indirectly. Level 3 – Unobservable inputs for the asset or liability, which reflect the Company’s own assumptions about the assumptions that market participants would use in pricing the asset or liability (including assumptions about risk). The Company’s financial instruments include cash and equivalents, restricted cash and equivalents, short term investments, accounts receivable and payable, derivative instruments, short-term borrowings, and accrued liabilities. The carrying amount of these instruments approximates fair value because of their short-term nature. CENTRAL GARDEN & PET COMPANY NOTES TO CONSOLIDATED FINANCIAL STATEMENTS—(Continued)
Assets and Liabilities Measured at Fair Value on a Recurring Basis The
The following table presents our financial assets and liabilities at fair value on a recurring basis based upon the level within the fair value hierarchy in which the fair value measurements fall, as of September 27, 2014 (in thousands):
The following table provides a summary of changes in fair value of our Level 3 financial instruments for the years ended September 26, 205 and September 27, 2014 (in thousands):
Assets and Liabilities Measured at Fair Value on a Non-Recurring Basis
The Company measures certain non-financial assets and liabilities, including long-lived assets, goodwill and intangible assets, at fair value on a non-recurring basis. Fair value measurements of non-financial assets and non-financial liabilities are used primarily in the impairment analyses of long-lived assets, goodwill and other intangible assets using discounted cash flows with Level 3 inputs in the fair value hierarchy. CENTRAL GARDEN & PET COMPANY NOTES TO CONSOLIDATED FINANCIAL STATEMENTS—(Continued) year ended September 26, 2015, the carrying During the fiscal year ended September 28, 2013, the Company recognized a non-cash charge of $7.7 million, as the carrying value of its Garden segment goodwill exceeded the implied fair value of the goodwill. The fair market value of these non-financial assets was determined using an income approach and Level 3 inputs, which required management to make significant estimates about future cash flows. See Note 9 – Goodwill.
the Company’s remaining $400.0 million aggregate principal amount of the 2018 Notes as of September 26, 2015 was $410.5 million, compared to a carrying value of $399.7 million. The estimated fair value of the Company’s $450 million 3. Derivative Instruments Our operations are exposed to market risks from adverse changes in commodity prices affecting the cost of raw materials. In the normal course of business, these risks are managed through a variety of strategies, including the use of derivatives. The utilization of these financial transactions is governed by policies covering acceptable counterparty exposure, instrument types and other practices. The Company does not enter into derivative contracts for speculative purposes. The Company performs assessments of its counterparty credit risk regularly, including a review of credit ratings and potential nonperformance of the counterparty, and minimizes counterparty concentrations. Commodity and commodity index futures, swaps and option contracts are used to economically hedge commodity input prices on grains and proteins. These derivative contracts are entered into for periods consistent with the related underlying exposures and do not constitute positions independent of those exposures. Generally, the Company economically hedges a portion of its anticipated consumption of commodity inputs for periods of up to 12 months. As of September 26, 2015 and September 27, 2014, the Company had no outstanding derivative instruments. The Company recognizes all derivative instruments as either assets or liabilities at fair value in the consolidated balance sheets, with the exception of normal purchases and normal sales expected to result in physical delivery. The Company’s derivative financial instruments have not been designated as hedging instruments for accounting purposes. The Company recognizes realized and unrealized gains and losses from derivatives used to economically hedge anticipated commodity consumption in other income (expense) on the consolidated statement of operations. During the fiscal year ended September 28, 2013, the Company recorded a charge of approximately $1.0 million in other income (expense) related to commodity contracts. CENTRAL GARDEN & PET COMPANY NOTES TO CONSOLIDATED FINANCIAL STATEMENTS—(Continued) 4. Acquisitions and Investments in Joint Ventures Fiscal Purishield LLC and Ceregenin LLC On December 30, 2014, the Company invested $16.0 million in cash for a 50% interest in two newly formed entities. The two entities own rights to commercialize products which incorporate features covered by certain patents, technology and associated intellectual property rights in the fields of animal health and pesticide applications. The investment is being accounted for under the equity method of accounting and is not expected to contribute to earnings in the near future. IMS Trading Corp On July 31, 2015, the Company Fiscal Envincio LLC On The following table summarizes the recording of the fair values of the assets acquired and liabilities assumed as of the acquisition date and subsequent adjustments:
CENTRAL GARDEN & PET COMPANY NOTES TO CONSOLIDATED FINANCIAL STATEMENTS—(Continued) During fiscal 2015, the fair value measurements of assets acquired and liabilities assumed of Envincio LLC as of the acquisition date were finalized. This refinement did not have a significant impact on the Company’s condensed consolidated statements of operations, balance sheets or cash flows in any period and, therefore, the Company has not retrospectively adjusted its financial statements. Fiscal 2013 In December 2012, the Company acquired
mosquito abatement. 5. Concentration of Credit Risk and Significant Customers and Suppliers Customer Concentration – Approximately Supplier Concentration – While the Company purchases products from many different manufacturers and suppliers, approximately 6. Allowance for Doubtful Accounts Changes in the allowance for doubtful accounts are summarized below (in thousands):
CENTRAL GARDEN & PET COMPANY NOTES TO CONSOLIDATED FINANCIAL STATEMENTS—(Continued) 7. Inventories, net Inventories, net of allowance for obsolescence, consist of the following (in thousands):
8. Property and Equipment, Net Property and equipment consists of the following (in thousands):
Depreciation and amortization expense, including the amortization of intangible assets, charged to operations was $33.7 million, $35.8 million and $33.0 million for fiscal 2015, 2014 and 2013, respectively. CENTRAL GARDEN & PET COMPANY NOTES TO CONSOLIDATED FINANCIAL STATEMENTS—(Continued)
Changes in the carrying amount of goodwill for the fiscal years ended September
Additions or reductions to goodwill include acquisitions, purchase price adjustments and adjustments of amounts upon finalization of purchase accounting. The Company tests goodwill for impairment annually (on the first day of the fourth fiscal quarter), or whenever events occur or circumstances change that would more likely than not reduce the fair value of a reporting unit below its carrying amount, by initially comparing the fair value of Determining the fair value of a reporting unit involves the use of significant estimates and assumptions. The estimate of fair value of each of the Company’s reporting units is based on the Company’s projection of revenues, gross margin, operating costs and cash flows considering historical and estimated future results,
general economic and market conditions as well as the impact of planned business and operational strategies. The CENTRAL GARDEN & PET COMPANY NOTES TO CONSOLIDATED FINANCIAL STATEMENTS—(Continued) Company bases its fair value estimates on assumptions the Company believes to be reasonable at the time, but such assumptions are subject to inherent uncertainty. Assumptions critical to the Company’s fair value estimates were: (i) discount rates used in determining the fair value of the reporting units; (ii) estimated future cash flows; and (iii) projected revenue and operating profit growth rates used in the reporting unit models. Actual results may differ from those estimates. The valuations employ present value techniques to measure fair value and consider market factors. In connection with the Company’s annual goodwill impairment testing performed during fiscal In connection with the Company’s annual goodwill impairment testing performed during fiscal 2014, the first step of such testing indicated that the fair value of the Company’s reporting segments exceeded their carrying value by more than 10%, and accordingly, no further testing of goodwill was required. In connection with the Company’s annual goodwill impairment testing performed during fiscal 2013, the first step of such testing indicated that the fair value of the Company’s Pet segment reporting units exceeded their carrying value, and accordingly, no further testing of goodwill was required for the Pet segment. However, the carrying value of the Company’s Garden segment reporting units exceeded their fair value, indicating potential impairment. Based on further analysis, it was determined that the entire carrying value of the Company’s Garden segment goodwill was impaired, resulting in a non-cash goodwill impairment charge of $7.7 million. Changes in the judgments and estimates underlying
NOTES TO CONSOLIDATED FINANCIAL STATEMENTS—(Continued) 10. Other Intangible Assets The following table summarizes the components of gross and net acquired intangible assets:
Other acquired intangible assets
The Company is currently amortizing its acquired intangible assets with definite lives over periods ranging from 1 to 25 years; over weighted average remaining lives of six years for marketing-related intangibles, 14 years for customer-related intangibles and 14 years for other acquired intangibles. Amortization expense for intangibles subject to amortization was approximately $4.3 million, $4.3 million and $5.1 million, for fiscal 2015, 2014 and 2013, respectively, and is classified within operating expenses in the consolidated statements of operations. Estimated annual amortization expense related to acquired intangible assets in each of the succeeding five years is estimated to be approximately $4 million per year from fiscal 2016 through fiscal 2020. The Company evaluates long-lived assets, including amortizable and indefinite-lived intangible assets, for impairment whenever events or changes in circumstances indicate the carrying value may not be recoverable. CENTRAL GARDEN & PET COMPANY NOTES TO CONSOLIDATED FINANCIAL STATEMENTS—(Continued) The Company evaluates indefinite-lived intangible assets on an annual basis.
Long-term debt consists of the following:
Senior Subordinated Notes On March 8, 2010, the Company issued $400 million aggregate principal amount of 8.25% senior subordinated notes due March 1, 2018 (the “2018 Notes”). On February
The 2018 Notes In March 2015, the Company redeemed $50.0 million of its 2018 Notes at a price of 102.063% of the principal amount of the notes redeemed. In conjunction with this transaction, the Company recognized a charge in interest expense of approximately $1.6 million in its second quarter of fiscal 2015 related to the payment of the call premium and the non-cash write-off of unamortized financing costs. The Company
CENTRAL GARDEN & PET COMPANY NOTES TO CONSOLIDATED FINANCIAL STATEMENTS—(Continued) The 2018 Notes Issuance of $400 Million 6.125% Senior Notes On November 9, 2015, the Company issued $400 million aggregate principal amount of 6.125% senior notes due November 2023 (the “2023 Notes”). The 2023 Notes are unconditionally guaranteed on a senior basis by each of its existing and future domestic restricted subsidiaries which are borrowers under or guarantors of Central’s senior secured revolving credit facility. Central used the net proceeds from the offering to redeem its outstanding 2018 Notes. See Note 21 – Subsequent Event. Asset Backed Loan Facility On December 5, 2013, the Company entered into a credit agreement which provides up to a $390 million principal amount senior secured asset-based revolving credit facility, with up to an additional $200 million principal amount available with the consent of the Lenders if the Company exercises the accordion feature set forth therein (collectively, the “Credit Facility”). The Credit Facility matures on December 5, 2018 and replaced the Company’s prior revolving credit facility. The Company may borrow, repay and reborrow amounts under the Credit Facility until its maturity date, at which time all amounts outstanding under the Credit Facility must be repaid in full. As of September 26, 2015, there were no borrowings outstanding under the Credit Facility. There were no letters of credit outstanding under the Credit Facility as of September 26, 2015. There were other letters of credit of $6.0 million outstanding as of September 26, 2015. The Credit Facility is subject to a borrowing base, calculated using a formula based upon eligible receivables and inventory, minus certain reserves and subject to restrictions. The borrowing availability as of September 26, 2015 was $307 million. Borrowings under the Credit Facility bear interest at an index based on LIBOR or, at the option of the Company, the Base Rate (defined as the highest of (a) the SunTrust prime rate, (b) the Federal Funds Rate plus 0.5% and (c) one-month LIBOR plus 1.00%), plus, in either case, an applicable margin based on the Company’s total outstanding borrowings. Such applicable margin for LIBOR-based borrowings fluctuates between 1.25%-1.75% (and was 1.25% at September 26, 2015) and such applicable margin for Base Rate borrowings fluctuates between 0.25%-0.75% (and was 0.25% at September 26, 2015). As of September 26, 2015, the applicable interest rate related to Base Rate borrowings was 3.5%, and the applicable interest rate related to LIBOR-based borrowings was 1.4%. The Credit Facility contains customary covenants, including financial covenants which require the Company to maintain a minimum fixed charge coverage ratio of 1.00:1.00 upon reaching certain borrowing levels. The Credit Facility is secured by substantially all assets of the Company. The Company was in compliance with all covenants under the Credit Facility during the fiscal year ended September 26, 2015. The Company incurred approximately $3.1 million of costs in conjunction with this transaction, which included banking fees and legal expenses. These costs will be amortized over the term of the Credit Facility. The Company recorded a non-cash charge of $1.7 million for the three month period ended December 28, 2013 as part of interest expense, related to the write-off of unamortized deferred financing costs under the prior revolving credit facility. CENTRAL GARDEN & PET COMPANY NOTES TO CONSOLIDATED FINANCIAL STATEMENTS—(Continued) The scheduled principal repayments on long-term debt as of September
Commitments Letters of credit–The Company had Purchase commitments – Production and purchase agreements (primarily for grass seed and grains) entered into in the ordinary course of business obligate the Company to make future purchases based on estimated yields. The terms of these contracts vary and have fixed prices or quantities. At September Leases – The Company has operating lease agreements principally for office and warehouse facilities and equipment. Such leases have remaining terms of 1 to Certain facility leases have renewal options and include escalation clauses. Minimum lease payments include scheduled rent increases pursuant to these escalation provisions. Aggregate minimum annual payments on non-cancelable operating leases at September 26, 2015 are as follows:
CENTRAL GARDEN & PET COMPANY NOTES TO CONSOLIDATED FINANCIAL STATEMENTS—(Continued)
Contingencies The Company may from time to time become involved in The Company has received notices from several states stating that they have appointed an agent to conduct an examination of the books and records of the Company to determine whether it has complied with state unclaimed property laws. In addition to seeking unclaimed property subject to escheat laws, the states may seek interest, penalties and other relief. The examinations are at an early stage and, as such, management is unable to determine the impact, if any, on the Company’s financial position or results of operations. The Company has experienced, and may in the future experience, issues with products that may lead to product liability, recalls, withdrawals, replacements of products, or regulatory actions by governmental authorities.
The provision for income tax expense (benefit) consists of the following:
A reconciliation of the statutory federal income tax rate to the Company’s effective income tax rate is as follows:
CENTRAL GARDEN & PET COMPANY NOTES TO CONSOLIDATED FINANCIAL STATEMENTS—(Continued) Deferred income taxes reflect the impact of “temporary differences” between asset and liability amounts for financial reporting purposes and such amounts as determined based on existing tax laws. The tax effect of temporary differences and carryforwards which give rise to deferred tax assets and liabilities are as follows:
The The Company
The Company classifies uncertain tax positions as non-current income tax liabilities unless expected to be paid within one year. The Company recognizes interest and/or penalties related to income tax matters as a component of pretax income. As of September CENTRAL GARDEN & PET COMPANY NOTES TO CONSOLIDATED FINANCIAL STATEMENTS—(Continued) The following table, which excludes interest and penalties, summarizes the activity related to the Company’s unrecognized tax benefits for fiscal years ended September
As of September The Company is principally subject to taxation by the United States and various states within the United States. The Company’s tax filings in major jurisdictions are open to examination by tax authorities by the Internal Revenue Service from fiscal year ended The Company does not believe there will be any significant change in its unrecognized tax benefits within the next twelve months.
Compensation Committee of the Board of Directors, which is comprised only of independent directors, and which must approve individual awards to be granted, vesting and exercise of share conditions. In connection with a dividend payable in the form of two shares of the Class A Common Stock for each outstanding share of Common Stock and Class B Common Stock on February 5, 2007, the 2003 Plan was amended to include 9,734,982 shares of Class A Common Stock authorized for issuance. The Company has a Nonemployee Director Stock Option Plan (the “Director Plan”) which provides for the grant of options and restricted stock to nonemployee directors of the Company. The Director Plan, as amended, CENTRAL GARDEN & PET COMPANY NOTES TO CONSOLIDATED FINANCIAL STATEMENTS—(Continued) provides for the granting to each independent director of options to purchase a number of shares equal to $200,000 divided by the fair market value of the Company’s common stock on the date of each annual meeting of stockholders and a number of shares of restricted stock equal to $20,000 divided by such fair market value. As of September 26, 2015, there were approximately 1.5 million shares of Common Stock, 6.3 million shares of Class A Common Stock and no shares of Preferred Stock reserved for outstanding equity awards, and there were approximately 3.4 million shares of Common Stock, 10.3 million shares of Class A Common Stock and 0.5 million shares of Preferred Stock remaining for future awards. Stock Option Awards The Company recognized share-based compensation expense of
From fiscal 2008 to fiscal 2011, the Company granted stock options under its 2003 Plan that included performance targets and time-based vesting to key employees and executives.
In March 2012, the Company eliminated all of the past and future performance goals relating to stock options granted from fiscal 2008 to fiscal 2011, except for the performance goals relating to the overall Company performance. The Company took this action because, as a result of the Company’s reorganization around functional lines during 2011, the extent to which cumulative performance targets for segments or business units have been or may be achieved The During fiscal The fair value of each option award is estimated on the date of grant using the Black-Scholes option valuation model. Expected stock price volatilities are estimated based on the Company’s historical volatility. The expected term of options granted is based on analyses of historical employee termination rates, option exercises and the contractual term of the option. The risk-free rates are based on U.S. Treasury yields, for notes with comparable terms as the option grants, in effect at the time of the grant. For purposes of this valuation model, no dividends have been assumed. CENTRAL GARDEN & PET COMPANY NOTES TO CONSOLIDATED FINANCIAL STATEMENTS—(Continued) The Company’s calculations were made using the Black-Scholes option pricing model with the following weighted average assumptions: expected life from the date of grant, 3.6 years in fiscal 2015, 3.5 years in fiscal
The following table summarizes option activity for the period ended September
The price of options to purchase shares of common stock and Class A common stock outstanding at September 26, 2015, September 27, 2014 and September 28, 2013 was $6.43 to $15.00 per share, $6.43 to $16.23 per share and $4.60 to $16.23 per share, respectively. The weighted average grant date fair value of options granted during the fiscal years ended September As of September CENTRAL GARDEN & PET COMPANY NOTES TO CONSOLIDATED FINANCIAL STATEMENTS—(Continued) Restricted Stock Awards As of September Restricted stock award activity during the three fiscal years in the period ended September
The weighted average grant date fair value of restricted stock awards granted during the fiscal years ended September As of September
At September There are 3,000,000 shares of Class B stock ($0.01 par value) authorized, of which 1,652,262 were outstanding at September CENTRAL GARDEN & PET COMPANY NOTES TO CONSOLIDATED FINANCIAL STATEMENTS—(Continued) 49% of the total votes cast, (ii) stock dividends on common stock may be paid only in shares of common stock and stock dividends on Class B stock may be paid only in shares of Class B stock and (iii) shares of Class B stock have certain conversion rights and are subject to certain restrictions on ownership and transfer. Each share of Class B stock is convertible into one share of common stock, at the option of the holder. Additional shares of Class B stock may only be issued with majority approval of the holders of the common stock and Class B stock, voting as separate classes.
The following is a reconciliation of the numerators and denominators of the basic and diluted earnings (loss) per share (EPS) computations:
For fiscal 2013, 10.4 million options were not included in the computation of diluted earnings per share because the option exercise prices were greater than the average market price of the common shares and, therefore, the effect of including these options would be anti-dilutive. Regardless of exercise price, all outstanding stock options were excluded in the calculation due to the net loss recorded for the period ended September 28, 2013. In periods where net earnings are reported, these options may become dilutive if the average market price of our common stock exceeds the exercise price of the outstanding options.
CENTRAL GARDEN & PET COMPANY NOTES TO CONSOLIDATED FINANCIAL STATEMENTS—(Continued) 17. Quarterly Financial Data – Unaudited
During fiscal
The Company’s chief operating CENTRAL GARDEN & PET COMPANY NOTES TO CONSOLIDATED FINANCIAL STATEMENTS—(Continued) operations. The Company’s Corporate division is included in the following presentation since certain expenses of this division are not allocated separately to the two operating segments. Segment assets exclude cash equivalents, short-term investments, goodwill, and deferred taxes. Management has determined that the Company has two operating segments which are also reportable segments based on the level at which the chief operating decision The Pet segment consists of Four Paws Products, TFH Publications, Kaytee, Aquatics, Interpet, IMS, Pets International, Breeder’s Choice and Life Sciences. These businesses are engaged in the manufacturing, purchase, sale and delivery of internally and externally produced pet supplies, books and food principally to independent pet distributors, national and regional retail chains, grocery stores, mass merchants and bookstores. The Garden segment consists of Pennington Seed, Matthews Four Seasons, Grant’s, AMBRANDS, Lilly Miller, the Pottery
Group, Gulfstream and GKI/Bethlehem Lighting. Products manufactured, designed and sourced, or distributed are products found typically in the lawn and garden sections of mass merchandisers, warehouse-type clubs, home improvement centers and nurseries and include grass seed, bird feed, clay pottery, outdoor wooden planters and trellises, herbicides and insecticides. These products are sold directly to national and regional retail chains, independent garden distributors, grocery stores, nurseries and garden supply retailers. The Corporate division includes expenses associated with corporate functions and projects, certain employee benefits, The following table indicates each class of similar products which represented approximately 10% or more
CENTRAL GARDEN & PET COMPANY NOTES TO CONSOLIDATED FINANCIAL STATEMENTS—(Continued)
Financial information relating to the Company’s business segments for each of the three most recent fiscal years is presented in the table below
Noncontrolling interest is associated with the Garden segment.
CENTRAL GARDEN & PET COMPANY NOTES TO CONSOLIDATED FINANCIAL STATEMENTS—(Continued)
Certain 100% wholly-owned subsidiaries of the Company (as listed below, collectively the “Guarantor Subsidiaries”) have guaranteed fully and unconditionally, on a joint and several basis, the obligation to pay principal and interest on the Company’s Farnam Companies, Inc. Four Paws Products Ltd. Gulfstream Home & Garden, Inc. Kaytee Products, Inc. Matson, LLC New England Pottery, LLC Pennington Seed, Inc. (including Gro Tec, Inc. and All-Glass Aquarium Co., Inc.) Pets International, Ltd. T.F.H. Publications, Inc. Wellmark International (including B2E Corporation and B2E Biotech LLC)
In lieu of providing separate audited financial statements for the Guarantor Subsidiaries, the Company has included the accompanying consolidating condensed financial statements based on the Company’s understanding of the Securities and Exchange Commission’s interpretation and application of Rule 3-10 of the Securities and Exchange Commission’s Regulation S-X.
Net sales Cost of goods sold and occupancy Gross profit Selling, general and administrative expenses Income (loss) from operations Interest expense Interest income Other income (expense) Income (loss) before taxes and equity in earnings of affiliates Income tax expense (benefit) Equity in earnings of affiliates Net income including noncontrolling interest Noncontrolling interest Net income attributable to Central Garden & Pet Company
CENTRAL GARDEN & PET COMPANY NOTES TO CONSOLIDATED FINANCIAL STATEMENTS—(Continued)
CENTRAL GARDEN & PET COMPANY NOTES TO CONSOLIDATED FINANCIAL STATEMENTS—(Continued)
CENTRAL GARDEN & PET COMPANY NOTES TO CONSOLIDATED FINANCIAL STATEMENTS—(Continued)
CENTRAL GARDEN & PET COMPANY NOTES TO CONSOLIDATED FINANCIAL STATEMENTS—(Continued)
ASSETS Cash and cash equivalents Restricted cash Short term investments Accounts receivable, net Inventories Prepaid expenses and other assets Total current assets Land, buildings, improvements and equipment, net Goodwill Other long term assets Intercompany receivable Investment in subsidiaries Total LIABILITIES AND EQUITY Accounts payable Accrued expenses and other liabilities Total current liabilities Long-term debt Intercompany payable Losses in excess of investment in subsidiaries Other long-term obligations Shareholders’ equity attributable to Central Garden & Pet Noncontrolling interest Total equity Total
CENTRAL GARDEN & PET COMPANY NOTES TO CONSOLIDATED FINANCIAL STATEMENTS—(Continued)
CENTRAL GARDEN & PET COMPANY NOTES TO CONSOLIDATED FINANCIAL STATEMENTS—(Continued)
CENTRAL GARDEN & PET COMPANY NOTES TO CONSOLIDATED FINANCIAL STATEMENTS—(Continued)
21. Subsequent Events Debt Refinancing In November 2015, the Company issued $400 million aggregate principal amount of 6.125% senior notes due November 2023 (the“2023 Notes”). The 2023 Notes are unconditionally guaranteed on a senior basis by each of the Company’s existing and future domestic restricted subsidiaries which are borrowers under or guarantors of the senior secured revolving credit facility. The Company used the net proceeds from the offering, together with available cash, to redeem its outstanding 8.25% senior subordinated notes due March 1, 2018 (the “2018 Notes”) and pay fees and expenses related to the offering. As a result of the Company’s redemption of the 2018 Notes, it will recognize a charge in its fiscal 2016 first quarter of approximately $8.3 million related to the payment of the call premium, a one-time payment of overlapping interest expense for 30 days of approximately $2.8 million and a $3.2 million non-cash charge for the write-off of unamortized financing costs in interest expense. The Company expects its annual interest expense on the 2023 Notes going forward to be approximately $8.5 million less than under the 2018 Notes. DMC Acquisition On December 1, 2015, the Company purchased the pet bedding and certain other assets of National Consumers Outdoors Corp., formerly known as Dallas Manufacturing Company (“DMC”), for a cash purchase price of $61 million. This acquisition is expected to complement the Company’s existing dog and cat business. EXHIBIT INDEX Set forth below is a list of exhibits that are being filed or incorporated by reference into this Form 10-K:
| ||||||||||||||||||||||||||||||||||||||||||||||||||||||||||||||||||||||||||||||||||||||||||||||||||||||||||||||||||||||||||||||||||||||||||||||||||||||||||||||||||||||||||||||||||||||||||||||||||||||||||||||||||||||||||||||||||||||||||||||||||||||||||||||||||||||||||||||||||||||||||||||||||||||||||||||||||||||||||||||||||||||||||||||||||||||||||||||||||||||||||||||||||||||||||||||||||||||||||||||||||||||||||||||||||||||||||||||||||||||||||||||||||||||||||||||||||||||||||||||||||||||||||||||||||||||||||||||||||||||||||||||||||||||||||||||||||||||||||||||||||||||||||||||||||||||||||||||||||||||||||||||||||||||||||||||||||||||||||||||||||||||||||||||||||||||||||||||||||||||||||||||||||||||||||||||||||||||||||||||||||||||||||||||||||||||||||||||||||||||||||||||||||||||||||||||||||||||||||||||||||||||||||||||||||||||||||||||||||||||||||||||||||||||||||||||||||||||||||||||||||||||||||||||||||||||||||||||||||||||||||||||||||||||||||||||||||||||||||||||||||||||||||||||||||||||||||||||||||||||