
UNITED STATES
SECURITIES AND EXCHANGE COMMISSION
Washington, D.C. 20549
FORMFORM 10-K
x | ANNUAL REPORT PURSUANT TO SECTION 13 OR 15(d) OF THE | |
| SECURITIES EXCHANGE ACT OF 1934 | ||
| For the fiscal year ended December 31, 2014 | ||
For the fiscal year ended December 31, 2012
OR
¨ | TRANSITION REPORT PURSUANT TO SECTION 13 OR 15(d) OF THE | |
| SECURITIES EXCHANGE ACT OF 1934 | ||
For the transition period fromto | ||
For the transition period fromto
Commission File No.: 000-51826
MERCER INTERNATIONAL INC.
(Exact name of Registrant as specified in its charter)
| Washington | 47-0956945 | |
(State or other jurisdiction | (IRS Employer Identification No.) | |
| of incorporation or organization ) |
|
Suite 1120, 700 West Pender Street, Vancouver, British Columbia, Canada, V6C 1G8
Suite 1120, 700 West Pender Street, Vancouver, British Columbia, Canada | V6C 1G8 (Zip Code) | |
| (Address of Principal Executive Office) |
Address of Office
Registrant’s telephone number including area code:(604) 684-1099
Securities registered pursuant to Section 12(b) of the Act:
Title of each class | Name of each exchange on which registered | |
| Common Stock, par value $1.00 per share | NASDAQ Global Select Market |
Securities registered pursuant to Section 12(g) of the Act:
None
Indicate by check mark if the registrantRegistrant is a well-known seasoned issuer, as defined in Rule 405 of the Securities Act. ¨ Yes x No
Indicate by check mark if the registrantRegistrant is not required to file reports pursuant to Section 13 or Section 15(d) of the Securities Act. ¨ Yes x No
Indicate by check mark whether the registrantRegistrant (1) has filed all reports required to be filed by Section 13 or 15(d) of theSecurities Exchange Act of 1934during the preceding 12 months (or for such shorter period that the registrantRegistrant was required to file such reports), and (2) has been subject to such filing requirements for the past 90 days. Yes x No ¨
Indicate by check mark whether registrantRegistrant has submitted electronically and posted on its corporate Web site, if any, every Interactive Data File required to be submitted and posted pursuant to Rule 405 of Regulation S-T (§ 232.405 of this chapter) during the preceding 12 months (or for such shorter period that the registrantRegistrant was required to submit and post such files). Yes x No ¨
Indicate by check mark if disclosure of delinquent filers pursuant to Item 405 of Regulation S-K is not contained herein, and will not be contained, to the best of the registrant’sRegistrant’s knowledge, in definitive proxy or information statements incorporated by reference in Part III of this Form 10-K or any amendment to this Form 10-K. x
Indicate by check mark whether the registrantRegistrant is a large accelerated filer, an accelerated filer, a non-accelerated filer, or a non-accelerated filer.smaller reporting company. See the definitions of “large accelerated filer,” “accelerated filer” and “smaller reporting company” in Rule 12b-2 of the Exchange Act. (Check one):
| Large accelerated filer¨ | Accelerated filerx | Smaller reporting company ¨ | ||||||
(Do not check if a smaller reporting company) |
Indicate by check mark whether the registrantRegistrant is a shell company (as defined in Rule 12b-2 of the Act). ¨ Yes x No
The aggregate market value of the registrant’sRegistrant’s voting and non-voting common equity held by non-affiliates of the registrantRegistrant as of June 30, 2012,2014, the last business day of the registrant’sRegistrant’s most recently completed second fiscal quarter, based on the closing price of the voting stock on the NASDAQ Global Select Market on such date, was approximately $318,707,670.$674,869,524.
As of February 13, 2013,12, 2015, the registrantRegistrant had 55,815,70464,414,322 shares of common stock, $1.00 par value per share, outstanding.
DOCUMENTS INCORPORATED BY REFERENCE
Certain information that will be contained in the definitive proxy statement for the Registrant’s annual meeting to be held in 20132015 is incorporated by reference into Part III of this Form 10-K.
| 5 |
| ||||||
| 5 | ||||||
| 5 | ||||||
| 7 | ||||||
| 8 |
2
EXCHANGE RATES
Our3
CHANGE IN REPORTING CURRENCY
Effective October 1, 2013, we changed our reporting currency from the Euro to the U.S. dollar, as management is of the opinion that a U.S. dollar reporting currency enhances communication and understanding with our shareholders, analysts and other stakeholders and improves comparability of our financial information with our competitors and peer group companies. Consolidated financial statements issued prior to October 1, 2013 were prepared using the Euro as the reporting currency; however, subsequent to October 1, 2013, both current and historical financial information have been translated to U.S. dollars in accordance with the method described in Note 1, “The Company and Summary of Significant Accounting Policies – Foreign Operations and Currency Translation”, of the consolidated financial statements included in this annual report are in Euros, as a significant majority of our business transactions are originally denominated in Euros. We translate non-Euro denominated assets and liabilities at the rate of exchange on the balance sheet date. Revenues and expenses are translated at the average rate of exchange prevailing during the period.Form 10-K.
The following table sets out exchange rates, based on the noon buying rates in New York City for cable transfers in foreign currencies as certified for customs purposes by the Federal Reserve Bank of New York, referred to as the “Noon Buying Rate”, for the conversion of U.S. dollars to Euros and Canadian dollars to U.S. dollars in effect at the end of the following periods, the average exchange rates during these periods (based on daily Noon Buying Rates) and the range of high and low exchange rates for these periods:
| Year Ended December 31, | Year Ended December 31, | |||||||||||||||||||||||||||||
| 2012 | 2011 | 2010 | 2009 | 2008 | 2014 | 2013 | 2012 | 2011 | 2010 | |||||||||||||||||||||
| (€/$) | ($/€) | |||||||||||||||||||||||||||||
End of period | 0.7584 | 0.7708 | 0.7536 | 0.6977 | 0.7184 | 1.2101 | 1.3779 | 1.3186 | 1.2973 | 1.3269 | ||||||||||||||||||||
High for period | 0.7428 | 0.6723 | 0.6879 | 0.6623 | 0.6246 | 1.2101 | 1.2774 | 1.2062 | 1.2926 | 1.1959 | ||||||||||||||||||||
Low for period | 0.8290 | 0.7736 | 0.8362 | 0.7970 | 0.8035 | 1.3927 | 1.3816 | 1.3463 | 1.4875 | 1.4536 | ||||||||||||||||||||
Average for period | 0.7782 | 0.7186 | 0.7541 | 0.7176 | 0.6826 | 1.3297 | 1.3281 | 1.2859 | 1.3931 | 1.3261 | ||||||||||||||||||||
| (C$/$) | ($/C$) | |||||||||||||||||||||||||||||
End of period | 0.9958 | 1.0168 | 1.0009 | 1.0461 | 1.2240 | 0.8620 | 0.9401 | 1.0042 | 0.9835 | 0.9991 | ||||||||||||||||||||
High for period | 0.9710 | 0.9448 | 0.9960 | 1.0289 | 0.9717 | 0.8588 | 0.9348 | 0.9600 | 0.9430 | 0.9280 | ||||||||||||||||||||
Low for period | 1.0417 | 1.0605 | 1.0776 | 1.2995 | 1.2971 | 0.9423 | 1.0164 | 1.0299 | 1.0584 | 1.0040 | ||||||||||||||||||||
Average for period | 0.9995 | 0.9887 | 1.0298 | 1.1412 | 1.0660 | 0.9060 | 0.9712 | 1.0007 | 1.0121 | 0.9714 | ||||||||||||||||||||
On February 8, 2013, the date of9, 2015, the most recent weekly publication of the daily Noon Buying Rate before the filing of this annual report on Form 10-K reported that the Noon Buying Rate as of February 6, 2015 for the conversion of U.S. dollars to Euros and Canadian dollars to U.S. dollars was €0.7482$1.1330 per U.S. dollarEuro and C$1.0021$0.7985 per U.S.Canadian dollar.
In addition, certain financial information relating to our Celgar mill included in this annual report on Form 10-K is stated in Canadian dollars while we report our financial results in Euros. The following table sets out exchange rates, based on the noon rate provided by the Bank of Canada, referred to as the “Daily Noon Rate”, for the conversion of Canadian dollars to Euros in effect at the end of the following periods, the average exchange rates during these periods (based on Daily Noon Rates) and the range of high and low exchange rates for these periods:
| Year Ended December 31, | ||||||||||||||||||||
| 2012 | 2011 | 2010 | 2009 | 2008 | ||||||||||||||||
| (C$/€) | ||||||||||||||||||||
End of period | 1.3118 | 1.3193 | 1.3319 | 1.5000 | 1.7046 | |||||||||||||||
High for period | 1.2153 | 1.2847 | 1.2478 | 1.4936 | 1.4489 | |||||||||||||||
Low for period | 1.3446 | 1.4305 | 1.5067 | 1.6920 | 1.7316 | |||||||||||||||
Average for period | 1.2850 | 1.3761 | 1.3671 | 1.5851 | 1.5603 | |||||||||||||||
On February 14, 2013, the Daily Noon Rate for the conversion of Canadian dollars to Euros was C$1.3344 per Euro.
| ITEM 1. | BUSINESS |
In this document, please note the following:
references to “we”, “our”, “us”, the “Company” or “Mercer” mean Mercer International Inc. and its subsidiaries, unless the context clearly suggests otherwise, and references to “Mercer Inc.” mean Mercer International Inc. excluding its subsidiaries;
| • | references to “we”, “our”, “us”, the “Company” or “Mercer” mean Mercer International Inc. and its subsidiaries, unless the context clearly suggests otherwise, and references to “Mercer Inc.” mean Mercer International Inc. excluding its subsidiaries; |
references to “ADMTs” mean air-dried metric tonnes;
| • | references to “ADMTs” mean air-dried metric tonnes; |
references to “MW” mean megawatts and “MWh” mean megawatt hours; and
| • | references to “MW” mean megawatts and “MWh” mean megawatt hours; and |
“€” refers to Euros, which is our reporting currency; “$” refers to U.S. dollars; and “C$” refers to Canadian dollars.
| • | all references to “$” shall mean U.S. dollars, which is our reporting currency, unless otherwise stated; “€” refers to Euros; and “C$” refers to Canadian dollars. |
Due to rounding, numbers presented throughout this report may not add up precisely to totals we provide and percentages may not precisely reflect the absolute figures.
General
We operate in the pulp business and are among the largest publicly traded producers of market northern bleached softwood kraft, or “NBSK”, pulp in the world. Mercer Inc. reorganized as a companycorporation under the laws of the State of Washington in 2006 from a Washington business trust. Its common stock is quoted and listed for trading on the NASDAQ Global Select Market (MERC) and the Toronto Stock Exchange (MRI.U).
We are the sole NBSK producer, and the only significant producer of pulp for resale, known as “market pulp”, in Germany, which is the largest pulp import market in Europe. We also generate and sell a significant amount of surplus “green” energy to regional utilities. Our operations are located in Eastern Germany and Western Canada. We currently employ approximately 1,5001,430 people. We operate three NBSK pulp mills with a consolidated annual production capacity of approximately 1.5 million ADMTs of NBSK pulp and 259305 MW of electrical generation:
| • | Rosenthal mill. Our wholly-owned subsidiary, Rosenthal, owns and operates the Rosenthal mill, a modern, efficient ISO 9001, 14001 and 50001 certified NBSK pulp mill that has an annual production capacity of approximately |
| • | Stendal mill. Our subsidiary, Stendal owns and operates the Stendal mill, a state-of-the-art, single-line, ISO 9001 and 14001 certified NBSK pulp mill that has an annual production capacity of approximately 660,000 ADMTs and 148 MW of electrical generation. The Stendal mill generated and exported 509,773 MWh of electricity during the year ended December 31, 2014, resulting in approximately $56.8 million in revenues. The Stendal mill is located near the town of Stendal, Germany, approximately 130 kilometers west of Berlin. We previously owned 83% of Stendal. In September 2014, we made a further investment and acquired substantially all of the minority shareholder’s interest and certain other rights and now own 100% of the economic interest of Stendal. |
5
| • | Celgar mill. Our wholly-owned subsidiary, Celgar, owns and operates the Celgar mill, a modern, efficient ISO 9001 and 14001 certified NBSK pulp mill with an annual production capacity of approximately 520,000 ADMTs and 100 MW of electrical generation. The Celgar mill generated and exported |
|
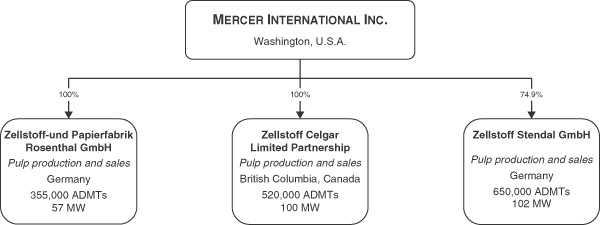
Organizational Chart
The following chart sets out our directly and indirectly owned principal operating subsidiaries, their jurisdictions of organization, their principal activities and their annual pulp production and electrical generation capacity:
History and Development of Business
WeIn 1994, we commenced pulp operations with the acquisition of our Rosenthal mill in 1994.mill. In 1999, we completed a major capital project which, among other things, converted that mill to the production of kraft pulp from sulphite pulp, increased its annual production capacity and improved efficiencies. The aggregate cost of this project was approximately €361.0$385.7 million, of which approximately €102.0$100.8 million was financed through government grants. Subsequent capital investments and efficiency improvements have reduced emissions and energy costs and increased the Rosenthal mill’s annual production capacity to approximately 355,000360,000 ADMTs. Our Rosenthal mill completed a capital project to also produce and sell tall oil in the fourth quarter of 2014.
In September 2004, we completed construction of the Stendal mill at an aggregate cost of approximately €1.0$1.1 billion. The Stendal mill is one of the largest NBSK pulp mills in Europe. The Stendal mill was financed through a combination of government grants totaling approximately €275.0$332.0 million, low-cost, long-term project debt which iswas largely severally guaranteed by the federal government and a state government in Germany, and equity contributions.
We currently haveinitially had a 74.9%63.6% ownership interest in Stendal. We subsequently increased our interest in Stendal through acquisitions and/or further investments to 70.6% in 2006, 74.9% in 2009 and Stendal’s noncontrolling83.0% in 2013. In September 2014, we made an additional capital investment in Stendal and acquired all of the shareholder are parties toloans and substantially all of the shares of the minority shareholder in Stendal and other rights. As a shareholders’ agreement dated August 26, 2002, as amended, to govern our respective interestsresult of such transactions, we now consolidate all of the economic interest in Stendal. The agreement contains terms and conditions customary for these types of agreements, including restrictions on transfers of share capital and shareholder loans other than to affiliates, rights of first refusal on share and shareholder loan transfers, pre-emptive rights and piggyback rights on dispositions of our interest. The shareholders are not obligated to fund any further equity capital contributions to the project. The shareholders’ agreement provides that Stendal’s managing directors are appointed by holders of a simple majority of its share capital. Further, shareholder decisions, other than those mandated by law or for the provision of financial assistance to a shareholder, are determined by a simple majority of Stendal’s share capital.
In 2012,December 2013, our Stendal mill commenced an approximate €40.0completed a $49.3 million project, referred to as “Project Blue Mill”, which iswas designed to increase production and efficiency through debottlenecking initiatives including the installation of an additional 4046 MW steam turbine at our Stendal mill. The debottlenecking which, among other
6
things, requires therequired a new turbine in order to enhance and efficiently utilize steam production iswas designed to increase the mill’s annual pulp production capacity by 30,000 ADMTs. The new turbine is also expectedpermits the mill to
initially produce an additional 109,000 MWh annually of surplus renewable energy for sale at premium pricing. Project Blue Millpricing and is currently expected to be completed and start to generate power resources in or about September 2013.fully operational.
A significant portion of the capital investments at our German mills, including the construction of the Stendal mill, were financed through government grants. Since 1999,1998, our German mills have benefited from an aggregate €386.3approximately $468.6 million in government grants. These grants reduce the cost basis of the assets purchased when the grants are received and are not reported in our income.
In February 2005, we acquired the Celgar mill for $210.0 million plus $16.0 million for the defined working capital of the mill. The Celgar mill was completely rebuilt in the early 1990s through a C$850.0 million modernization and expansion project, which transformed it into a modern and competitive producer.
Since its acquisition, we have effected several capital projects and other initiatives at the Celgar mill to increase its annual pulp production capacity to 520,000 ADMTs and its production of “green” energy. This includes a capital project, referred to as the “Celgar Energy Project”, which was completed in September 2010 and increased the Celgar mill’s production of “green” energy and optimized its power generation capacity, at an aggregate cost of approximately C$64.9$60.6 million, of which approximately C$48.0$44.6 million was financed by grants from the Canadian federal government.
Our competitive strengths include the following:
| • |
|
| • | Stable Income Source from the Sale of Surplus Renewable Energy and |
| • |
|
7
| • | Strategic Locations Providing Cost and |
|
| • | Proximity of Abundant Fiber Supply.Although fiber is cyclical in both price and supply, there is a significant amount of high-quality fiber within a close radius of each of our mills. This fiber supply, combined with our purchasing power and our |
| • | Experienced Management Team.Our directors and senior managers have extensive experience in the pulp and forestry industries. We also have experienced managers at all of our mills. Our management has a proven track record of implementing new initiatives and capital projects in order to reduce costs throughout our operations as well as identifying and harnessing new revenue opportunities. |
Our corporate strategy is to create shareholder value by focusing on the expansion ofexpand our asset and earnings base through organic growth and acquisitions, primarily in Europe and North America. We pursue organic growth through active management and targeted capital expenditures to generate a high return by increasing pulp, energy and energychemical production, reducing costs and improving efficiency. We are also developing innovative new products based on other derivatives of the kraft pulping process. We seek to acquire interests in companies and assets in the pulp industry and related businesses where we can leverage our experience and expertise in adding value through a focused management approach. Key featureselements of our strategy include:
| • |
|
|
Premium Grade NBSK Market Pulp.We produce NBSK pulp because it is a premium grade kraft pulp and generally obtains the highest price relative to other kraft pulps. Although demand is cyclical, between |
| • | Increasing Stable Revenues from Renewable Energy and Chemical Sales. We focus on the generation and sales of surplus renewable energy and chemicals and, because there are minimal associated incremental costs, such sales are highly profitable. These sales provide us with a stable income source unrelated to cyclical changes in pulp prices. In 2014, our mills sold 807,758 MWh of surplus electricity and generated approximately $101.5 million in revenues from energy and chemical sales, compared with 699,051 MWh and $92.2 million in 2013. In |
8
December 2013, our Stendal mill completed Project Blue Mill to increase production and efficiency through debottlenecking initiatives and the installation of a 46 MW steam turbine at the mill. The new turbine permits the mill to produce an additional 109,000 MWh of surplus electricity annually. Our Rosenthal mill implemented a capital project to produce and sell tall oil, which was completed in the fourth quarter of 2014. We continually explore and pursue initiatives to enhance our energy and chemical generation and sales in order to reduce volatility and increase our revenues from a stable source, while favorably impacting our profitability. |
| • | Targeted Capital Expenditures to Enhance Production Capacity and Efficiency. We operate three large modern pulp mills which provide us with a platform to be an efficient and competitive producer of high-quality NBSK pulp without the need for significant sustaining capital. We seek to make targeted capital expenditures that increase the production and operational efficiency of the mills, reduce costs and improve product quality and electricity generation. Over the last five years, we have invested approximately $187.0 million (including $65.0 million in associated government grants) in growth capital expenditures for capacity expansions, operational efficiencies and renewable energy and chemical production. |
| • | Achieving Operational Excellence. Operating our mills reliably and at a competitive cost is important for our financial performance. In addition to our capital expenditure program, we continuously strive to develop maintenance systems and procedures that will improve the throughput of our products by increasing the reliability of our manufacturing processes. We also seek to reduce operating costs by better managing certain operating activities such as fiber procurement, sales, marketing and logistics activities. We believe that our continued focus on operational excellence should allow us to achieve improved profitability and cash flows. |
| • | Strategic Opportunities.We believe there will be continuing change and consolidation in the pulp and paper industry as industry participants continually seek to lower costs, refocus their product lines and react to ever changing global market conditions. We take an opportunistic approach to |
General
Pulp is used in the production of paper, tissues and paper-related products. Pulp is generally classified according to fiber type, the process used in its production and the degree to which it is bleached. Kraft pulp, a type of chemical pulp, is produced through a sulphate chemical process in which lignin, the component of wood which binds individual fibers, is dissolved in a chemical reaction. Chemically prepared pulp allows the wood’s fiber to retain its length and flexibility, resulting in stronger paper products. Kraft pulp can be bleached to increase its brightness. Kraft pulp is noted for its strength, brightness and absorption properties and is used to produce a variety of products, including lightweight publication grades of paper, tissues and other paper-related products.
There are two main types of bleached kraft pulp, being softwood kraft made from coniferous trees and hardwood kraft made from deciduous trees. Softwood species generally have long, flexible fibers which add strength to paper while fibers from species of hardwood contain shorter fibers which lend bulk and opacity. Generally, list prices for softwood pulp are higher than list prices for hardwood pulp.
We produce and sell NBSK pulp, which is a bleached kraft pulp manufactured using species of northern softwood and is considered a premium grade because of its strength. It generally obtains the highest price relative to other kraft pulps. Southern bleached softwood kraft pulp is kraft pulp manufactured using southern softwood species and does not possess the strength found in NBSK pulp. NBSK pulp is the sole pulp product of our mills.
9
Most paper users of market kraft pulp use a mix of softwood and hardwood grades to optimize production and product qualities. In 2012,2014, market kraft pulp consumption was approximately 53% hardwood bleached kraft, 45%43% softwood bleached kraft and the remainder comprised of sulphite and unbleached pulp. Over the last several years, production of hardwood pulp, based on fast growing plantation fiber primarily from Asia and South America, has increased much more rapidly than that of softwood grades that have longer growth cycles. Hardwood kraft generally has a cost advantage over softwood kraft as a result of lower fiber costs, higher wood yields and, for newer hardwood mills, economies of scale. As a result of this growth in supply and lower costs, kraft pulp customers have substituted some of the pulp content in their products to hardwood pulp.
Counteracting customers’ increased usage ofability to substitute lower priced hardwood pulp has beenfor NBSK pulp is the requirement for strength and formation characteristics in finished goods. Paper and tissue makers focus on larger paper machines with higher speeds and lower basis weights for certain papers which require the strength characteristics of softwood pulp. Additionally, where paper products are lightweight or specialized, like direct mail, magazine paper or premium tissue, or where strength or absorbency are important, softwood kraft forms a significant proportion of the fiber used. As a result, we believe that the ability of kraft pulp users to continue to further substitute hardwood for softwood pulp is limited by such requirements.
Kraft pulp can be made in different grades, with varying technical specifications, for different end uses. High-quality kraft pulp is valued for its reinforcing role in mechanical printing papers, while other grades of kraft pulp are used to produce lower priced grades of paper, including tissues and paper-related products.
Markets
We believe that over 130130.0 million ADMTs of chemical pulp are converted annually into tissues, printing and writing papers, tissues, carton boards and other whitespecialty grades of paper and paperboard around the world. We also believe that over one third of this pulp is sold on the open market as market pulp, while the remainder is produced for internal purposes by integrated paper and paperboard manufacturers.
Demand for kraft pulp is cyclical in nature and is generally related to global and regional levels of economic activity. In 2008, overallOverall global demand for all kraft pulp types, including softwood, was negatively impacted by the weak global economic conditions and global financial and credit turmoil the world began to experience in the second halflatter part of that year2008 and which continued intocontinuing through the first half of 2009. Significant producer shutdowns and curtailments, along with strong demand from China, resulted in an improved supply-demand balance and improved prices in the second half of 2009 through 2010. Although global pulp markets continued to strengthen in the first half of 2011, mainly driven by demand from Asia, economic uncertainty in Europe and credit tightening in China resulted in a decrease in demand and weaker pulp prices in the fourth quarter of 2011. In 2012, there was continued economic uncertainty in Europe, and credit tightening in China in the first half of the year. Further, in the latter part of 2012,and weak demand for paper in Europe resulted in some integrated producers curtailing their paper production and selling their pulp on the market, primarily in China. These factors negatively impacted demand and supply of pulp and resulted in generally weak pulp prices. In 2013, demand from China was stable throughout the year and supply was slightly under-balanced, which resulted in higher prices in 2013. In 2014, demand in both European and Chinese markets was stable, while supply was slightly under-balanced throughout the year which kept prices at relatively high levels.
10
Between 20032005 and 2012,2014, worldwide demand for chemical market pulp grew at an average rate of approximately 2.0% annually.2% annually, with worldwide demand for bleached softwood kraft market pulp having grown at an average of approximately 1% per annum. The following chart illustrates the global demand for chemical market pulp for the periods indicated:
Estimated Global Chemical Market Pulp Demand

Two key macro-economic trends in worldwide NBSK pulp demand over the last several years have been:
| • | a significant increase in demand from emerging markets, and in particular China, which has more than offset a decline in demand in the mature markets of Europe, North America and Japan; and |
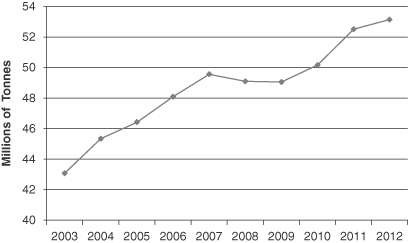
Source: PPPC 2012
| • | partly related to the foregoing, there has been a significant shift in demand by end use, as demand from tissue and specialty producers has increased markedly and offset the secular decline in demand for printing and writing paper resulting from the rapid growth in digital media. |
Since 2007,2005, demand for chemical softwood market pulp has grown in the emerging markets of Asia, Eastern Europe and Latin America. China in particular has experienced substantial growth and its imports of softwood market pulp grew by approximately 14%11% per annum between 20032005 and 2012.2014. We believe the emerging markets now account for approximately 51% of total world demand. China now accounts for approximately 26%29% of global bleached softwood kraft market pulp demand, compared to only 10%13% in 2003.2005. Western Europe currently accounts for approximately 27% of global bleached softwood kraft market pulp demand, compared to approximately 38%37% in 2003.2005. The demand in the mature markets of Europe, North America and Japan in 2014 declined by approximately 2.8 million ADMTs from its peak in 2005.
11
The following chart sets forth industry-wide bleached softwood kraft delivery levels to China between 2003 tofor the present:periods indicated:
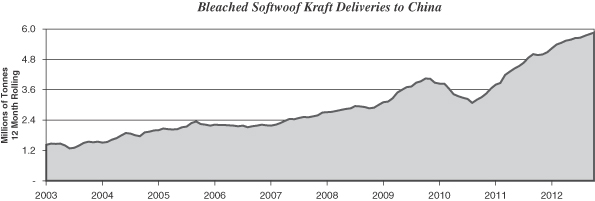
Source: PPPC 2012
Growth in NBSK pulp demand in China and other emerging markets has, to a large extent, been driven by increased demand from tissue producers, as a result of economic growth and rising income levels and living standards in such markets. These factors generally contribute to a greater demand for personal hygiene products in such regions. In China alone, two large tissue producers have publicly announced plans to add a total of 5030 tissue paper machines at various sites by the end ofduring 2015 to increase their annual tissue capacity by approximately 2.31.2 million ADMTs. At this time there can be no assurance as to when and how much of such capacity expansion will be implemented.
This has also led to an overall shift in demand for NBSK pulp, as demand from tissue producers has increased, while demand from printing and writing end uses has decreased. Between 2003 and 2012,2013, NBSK pulp demand for tissue production increased by approximately 106% which has more than offset the secular decline in168%, an approximate 10% compound annual growth rate. From 2003 to 2013, a period very affected by “digital substitution” of traditional paper grades, total NBSK demand in printing and writing papers resulting from the rapid growth of digital media.grew by 14%.
12
The following chart compares NBSK pulp demand by end use in each of 2003 and 2012:2013 (the latest year for which figures are currently available).
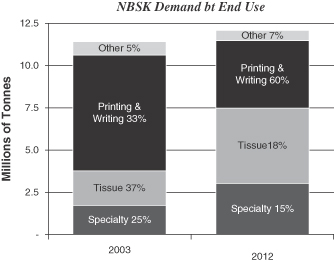

Source: Brian McClay 2012 (end use) / Hawkins Wright 2012 (total demand)We believe 2014 NBSK demand by end use was generally consistent with the trend in the chart above.
A measure of demand for kraft pulp is the ratio obtained by dividing the worldwide demand of kraft pulp by the worldwide capacity for the production of kraft pulp, or the “demand/capacity ratio”. An increase in this ratio generally occurs when there is an increase in global and regional levels of economic activity. An increase in this ratio also generally indicates greater demand as consumption increases, which often results in rising kraft pulp prices and a reduction of inventories by producers and buyers. As prices continue to rise, producers continue to run at higher operating rates. However, an adverse change in global and regional levels of economic activity generally negatively affects demand for kraft pulp, often leading buyers to reduce their purchases and rely on existing pulp inventories. As a result, producers run at lower operating rates by taking downtime to limit the build-up of their own inventories. The demand/capacity ratio for softwood kraft pulp was approximately 93%, 92%94% and 93%94% in 2012, 20112014, 2013 and 2010,2012, respectively.
A significant factor affecting our market is the amount of closures of old, high-cost capacity. Over the last sevenseveral years, several mills in North America, Finland and Sweden and Africa were permanently or indefinitely closed. Although some capacity was restarted in late 2009 and 2010 in response to very high NBSK pulp prices, we believe the overall net effect reduced NBSK pulp supply and positively impacted markets. Between 2011 and 2014, we believe approximately 800,000 ADMTs of thesepulp capacity was idled or shut down through mill closures and restarts is an estimated 3.4 million tonnes of capacity removed from the market since 2006.or curtailments. Further, in efforts to improve environmental and safety standards, China has publicly stated that it will be reducing existing pulp and paper capacity in the near term by closing “old” mills.mills, targeting a removal of 4.9 million ADMTs by the end of 2014. At this time, there can be no certainty as to the actual amount and timing of any such closures.
WeBy the end of 2014, the global supply of bleached hardwood kraft pulp increased by approximately 1.6 million ADMTs, primarily from South America. This increase in bleached hardwood kraft pulp is largely targeted at the growing demand for pulp in developing markets, particularly in China, by producers of tissues, specialty papers and packaging. If such additional bleached hardwood kraft pulp supply is not absorbed by such demand growth, as a result of generally lower prices for bleached hardwood kraft pulp, this supply increase could
13
put downward pressure on NBSK pulp prices. However, we believe customers’ ability to further substitute NBSK pulp for lower priced bleached hardwood kraft pulp is limited by the strength characteristic of NBSK pulp which is required by large modern paper machines to run lower basis-weight paper products efficiently. As pulp prices are aware ofhighly cyclical, there can be no assurances that prices will not decline in the future.
In 2013, one new NBSK mill was started up in Russia, which is scheduled to start upresulted in early 2013. When ramped up, the new mill is expected to provide a netan incremental increase in annual pulp production capacity of approximately 490,000 ADMTs. Other than the foregoing,ADMTs in annual production capacity. Currently, we are unawareaware of several publicly announced modernization and expansion projects for NBSK mills in Europe that may be implemented over the next three years, ranging from small expansions of existing mills to potential “greenfield” mills. We currently believe a few of these projects will be implemented while others are currently subject to various conditions including financing and further development. We believe that, because of fiber constraints, any new materialsignificant expansion of NBSK capacity in the region would require the closure of older mills. At this time, we cannot predict which of the publicly announced expansion projects will be completed or how much additional NBSK production capacity may come online.
In addition, certain integrated pulp and paper producers have the ability to discontinue paper production by idling their paper machines and selling their NBSK pulp capacity that has been announced.production on the market, if market conditions, prices and trends warrant such actions. We believe that the absence of other plant expansions is due in part to fiber supply constraints and high capital costs.
NBSK Pulp Pricing
Pulp prices are highly cyclical. In general, kraft pulp is a globally traded commodity. Pricing and demand are influenced by the balance between supply and demand, as affected by global macroeconomic conditions, changes in consumption and capacity, the level of customer and producer inventories and fluctuations in exchange rates. As Northern Europe has historically been the world’s largest market and NBSK is the premium grade, the European NBSK market pricingprice is generally used as a benchmark price by the industry.
The average annual European list prices for NBSK pulp since 20002005 have ranged fromfluctuated between a low of approximately $447$575 per ADMT toin 2009 and a high of $1,030 per ADMT.ADMT in 2011.
The following chart sets out the changes in list prices for NBSK pulp in Europe, as stated in U.S. dollars, Canadian dollars and Euros for the periods indicated:
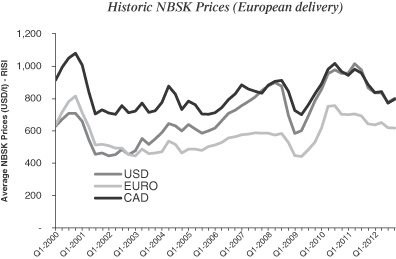

Source: RISI pricing report.
14
In 2006, pulp prices increased steadily from approximately $600 per ADMT in Europe to $870 per ADMT at the end of 2007. These price increases resulted from increased demand and the closure of several pulp mills, particularly in North America, which reduced NBSK capacity. In the second half of 2008, list prices for NBSK pulp decreased markedly due to weak global economic conditions. As a result, list prices for NBSK pulp in Europe decreased from $900 per ADMT in mid-2008 to $635 per ADMT at the end of the year. Such pulp price weakness continued into early 2009, though commencing in mid-2009, pulp markets began to strengthen which led to improved prices. Strong demand from China, capacity closures and historically low global inventories for bleached softwood kraft pulp helped support upward price momentum. During the second half of 2009, several price increases raised European list prices by a total of $170 per ADMT to $800 per ADMT by year end. Such price increases were partially offset by the continued weakening of the U.S. dollar versus the Euro and Canadian dollar during the period.
In 2010, several increases lifted prices to record levels in the middle of the year and at the end of 2010 list prices were near historic highs of $950, $960 and $840 per ADMT in Europe, North America and China, respectively. Pulp
In 2011, pulp prices remained strong in 2011,the first half of the year, reaching record levels of $1,030 per ADMT in Europe and $1,035 and $920 per ADMT in North America and China, respectively. However, uncertainty concerning the economic situation in Europe, along with credit tightening in China in the last part of the year, caused pulp prices to drop sharply to $825 per ADMT in Europe and $890 and $670 per ADMT in North America and China, respectively, by the end of the year. Economic uncertainty in Europe and China continued to dampen demand and NBSK pulp prices, which remained generally weak in 2012. Year-endIn 2012, year-end list prices were approximately $810, $870 and $655 per ADMT in Europe, North America and China, respectively.
In 2013, demand from China was stable throughout the year and supply was slightly under-balanced, which resulted in higher year-end list prices of $905 per ADMT in Europe and $990 and $750 per ADMT in North America and China, respectively. In 2014, demand in both Europe and China was stable, while supply was slightly under-balanced throughout the year which kept prices relatively high. At the end of 2014, list prices in Europe were approximately $935 per ADMT, while list prices in North America and China were approximately $1,020 and $700 per ADMT, respectively.
A producer’s net sales realizations are list prices, net of customer discounts, commissions and other selling concessions. While there are differences between NBSK list prices in Europe, North America and Asia, European prices are generally regarded as the global benchmark and pricing in other regions tends to follow European trends. The nature of the pricing structure in Asia is different in that, while quoted list prices tend to be lower than Europe, customer discounts and commissions tend to berebates are much lower, resulting in net sales realizations that are generally similar to other markets.
The majority of market NBSK pulp is produced and sold by Canadian and Northern European producers, while the price of NBSK pulp is generally quoted in U.S. dollars. As a result, NBSK pricing is often affected by fluctuations in the currency exchange rates for the U.S. dollar versus the Canadian dollar, the Euro and local currencies. NBSK pulp price increases during 2006, 2007 and the first half of 2008 were in large part offset by the negative impact on our operating costs of a weakening of the U.S. dollar. Similarly, the strengthening of the U.S. dollar against the Canadian dollar and the Euro towards the end of 2008 helped partially offset pulp price decreases caused by the deterioration in global economic conditions. The overall strengthening of the U.S. dollar against the Euro in 2010, and in particular in the first half of 2010, improved the operating margins of our German mills. Although the U.S. dollar weakened against the Euro for most of 2011, it strengthened at the end of 2011. Overall, the U.S. dollar was 8% stronger against the Euro in 2012 compared to 2011, partially offsetting pulp price decreases in 2012.2011. In 2013, the U.S. dollar was 3% weaker against the Euro, compared to 2012, which reduced the operating margins of our German mills. However, by the end of 2014, the U.S. dollar was 12% and 8% stronger against the Euro and the Canadian dollar, respectively, compared to 2013, which increased the operating margins of our three mills.
15
The global supply and demand balance for NBSK pulp is a key determinant in pulp pricing. Generally, we and other producers consider global NBSK pulp supply and demand to be evenly balanced when world inventory levels are at about 30 days’ supply.
The following chart sets forth changes in FOEX PIX Pulp index prices for NBSK pulp and global bleached softwood kraft inventory levels between 2003 to 2012:2005 and 2014:
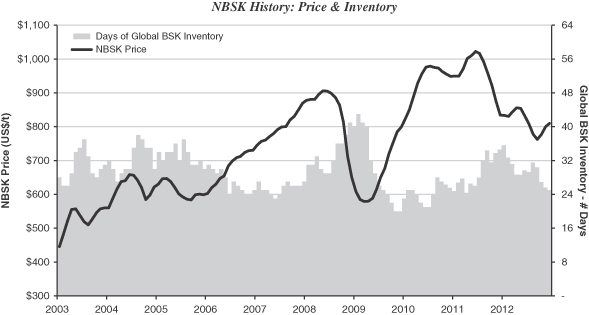

Source: Factset FOEX PIX PulpSeasonality
We are exposed to fluctuations in quarterly sales volumes and expenses due to seasonal factors. These factors are common in the NBSK (prices) PPPC (inventories).pulp industry. We generally have weaker pulp demand in Europe during the summer holiday months and in China in the period relating to its lunar new year. We typically have a seasonal build-up in raw material inventories in the early winter months as our mills build up their fiber supply for the winter when there is reduced availability.
Competition
Pulp markets are large and highly competitive. Producers ranging from small independent manufacturers to large integrated companies produce pulp worldwide. Our pulp and customer services compete with similar products manufactured and distributed by others. While many factors influence our competitive position, particularly in weak economic times, a key factor is price. Other factors include service, quality and convenience of location. Some of our competitors are larger than we are in certain markets and have substantially greater financial resources. These resources may afford those competitors more purchasing power, increased financial flexibility, more capital resources for expansion and improvement and enable them to compete more effectively. Our key NBSK pulp competitors are principally located in Northern Europe and Canada.
16
The Manufacturing Process
The following diagram provides a simplified description of the kraft pulp manufacturing process at our pulp mills:

In order to transform wood chips into kraft pulp, wood chips undergo a multi-step process involving the following principal stages: chip screening, digesting, pulp washing, screening, bleaching and drying.
In the initial processing stage, wood chips are screened to remove oversized chips and sawdust and are conveyed to a pressurized digester where they are heated and cooked with chemicals. This occurs in a continuous process at the Celgar and Rosenthal mills and in a batch process at the Stendal mill. This process softens and eventually dissolves the phenolic material called lignin that binds the fibers to each other in the wood.
Cooked pulp flows out of the digester and is washed and screened to remove most of the residual spent chemicals and partially cooked wood chips. The pulp then undergoes a series of bleaching stages where the brightness of the pulp is gradually increased. Finally, the bleached pulp is sent to the pulp machine where it is dried to achieve a dryness level of more thanapproximately 90%. The pulp is then ready to be baled for shipment to customers.
A significant feature of kraft pulping technology is the recovery system, whereby chemicals used in the cooking process are captured and extracted for re-use, which reduces chemical costs and improves environmental performance. During the cooking stage, dissolved organic wood materials and used chemicals, collectively known as black liquor, are extracted from the digester. After undergoing an evaporation process, black liquor is burned in a recovery boiler. The chemical compounds of the black liquor are collected from the recovery boiler and are reconstituted into cooking chemicals used in the digesting stage through additional processing in the recausticizing plant.
17
The heat produced by the recovery boiler is used to generate high-pressure steam. Additional steam is generated by a power boiler through the combustion of biomass consisting of bark and other wood residuals from sawmills and our woodrooms and residue generated by the effluent treatment system. Additionally, during times of upset, we may use natural gas to generate steam. The high pressure steam produced by the recovery and power boilers is used to power a turbine generator to generate electricity, as well aslow pressure steam coming off the turbine is then used to provide heat for the digesting and pulp drying processes.
We, along with other pulp producers both individually and through industry associations, are conducting research and development focused on developing innovative new products that are based on derivatives of the kraft pulping process. Currently these derivatives are focused in two broad categories:
| • | the further refinement of materials contained in black liquor, the extractive chemical and lignin containing compounds that are a result of the kraft pulping process; and |
| • | the further refinement of cellulose materials that are currently the basis of NBSK kraft pulp. |
We are engaged with several research partners to participate in and develop new innovative products. To date, one of the most well-developed of these projects is a cellulose derivative generally referred to in the industry as “cellulose filaments”. Cellulose filaments are the result of a new process that unbinds the individual filaments that make up a cellulose fiber. In northern softwoods, there are approximately 1,000 filaments making up a single fiber. The filaments resulting from this patented process are long, ribbon-like structures that have unique strength characteristics similar to other chemical derivatives, such as aramids. We believe that this material may have commercial potential in many applications, including strength enhancers, solution stabilizers and specialty solutions for numerous other industries.
We are part of an industry association that has made considerable progress in developing a particular manufacturing process. We, along with other member companies, including certain other NBSK producers, have license rights to further develop and market existing intellectual property registered under patent to our industry association. Further, such association, in conjunction with one of its member companies, is constructing a pilot production facility and we have access to its product for development purposes. While there remains much research and development to be done, we are encouraged enough to continue to expend resources to develop this technology, both individually and in joint development arrangements with third parties. We estimate expenditures totaling approximately $3.0 million over the three-year period from 2014 to 2016.
Such research and development is still at an early stage and there has been no commercialization of the research to date. We currently estimate it may take between three and five years before we can determine if product applications can be commercialized. However, there can be no assurance that such research and development will ever result in commercialization or the production or sales of any products by us at a profit or at all.
We manufacture and sell NBSK pulp produced from woodchipswood chips and pulp logs at our three mills.
18
The following table sets out our pulp production capacity and actual production by mill for the periods indicated:
| Annual Production Capacity(1) | Year Ended December 31, | Annual Production Capacity(1) | Year Ended December 31, | |||||||||||||||||||||||||||||
| 2012 | 2011 | 2010 | 2014 | 2013 | 2012 | |||||||||||||||||||||||||||
| Pulp Production by Mill: | (ADMTs) | |||||||||||||||||||||||||||||||
| Pulp Production by Mill: | (ADMTs) | |||||||||||||||||||||||||||||||
Rosenthal | 355,000 | 337,959 | 344,389 | 324,194 | 360,000 | 360,463 | 361,724 | 337,959 | ||||||||||||||||||||||||
Celgar | 520,000 | 490,018 | 488,007 | 502,107 | 520,000 | 453,104 | 447,935 | 490,018 | ||||||||||||||||||||||||
Stendal | 650,000 | 640,298 | 621,281 | 599,985 | 660,000 | 671,444 | 634,816 | 640,298 | ||||||||||||||||||||||||
|
|
|
|
|
|
|
| |||||||||||||||||||||||||
Total pulp production | 1,525,000 | 1,468,275 | 1,453,677 | 1,426,286 | 1,540,000 | 1,485,011 | 1,444,475 | 1,468,275 | ||||||||||||||||||||||||
|
|
|
|
|
|
|
| |||||||||||||||||||||||||
| (1) | Capacity is the rated capacity of the plants for the year ended December 31, |
Rosenthal Mill.The Rosenthal mill is situated on a 220230 acre site in the town of Blankenstein in the state of Thüringia, approximately 300 kilometers south of Berlin. The Saale river flows through the site of the mill. In late 1999, we completed a major capital project which converted the Rosenthal mill to the production of kraft pulp. It is a single line mill with a current annual production capacity of approximately 355,000360,000 ADMTs of kraft pulp. The mill is self-sufficient in steam and electrical power. Some excess electrical power which is constantly generated is sold to the regional power grid. The facilities at the mill include:
an approximately 315,000 square feet fiber storage area;
| • | an approximately 425,000 square feet fiber storage area; |
debarking and chipping facilities for pulp logs;
| • | debarking and chipping facilities for pulp logs; |
an approximately 300,000 square feet roundwood yard;
| • | an approximately 700,000 square feet roundwood yard; |
a fiber line, which includes a Kamyr continuous digester and bleaching facilities;
| • | a fiber line, which includes a Kamyr continuous digester and bleaching facilities; |
a pulp machine, which includes a dryer, a cutter and a baling line;
| • | a pulp machine, which includes a dryer, a cutter and a baling line; |
an approximately 63,000 square feet finished goods storage area;
| • | an approximately 60,000 square feet finished goods storage area; |
a chemical recovery line, which includes a recovery boiler, evaporation plant, recausticizing plant and lime kiln;
| • | a chemical recovery line, which includes a recovery boiler, evaporation plant, recausticizing plant and lime kiln; |
a fresh water plant;
| • | a fresh water plant; |
a wastewater treatment plant; and
| • | a wastewater treatment plant; and |
a power station with a turbine capable of producing 57 MW of electric power from steam produced by the recovery boiler and a power boiler.
| • | a power station with a turbine capable of producing 57 MW of electric power from steam produced by the recovery boiler and a power boiler. |
The kraft pulp produced at the Rosenthal mill is a long-fibered softwood pulp produced by a sulphate cooking process and manufactured primarily from wood chips and pulp logs. A number of factors beyond economic supply and demand have an impact on the market for chemical pulp, including requirements for pulp bleached without any chlorine compounds or without the use of chlorine gas. The Rosenthal mill has the capability of producing both “totally chlorine free” and “elemental chlorine free” pulp. Totally chlorine free pulp
is bleached to a high brightness using oxygen, ozone and hydrogen peroxide as bleaching agents, whereas elemental chlorine free pulp is produced by substituting chlorine dioxide for chlorine gas in the bleaching process. This substitution virtually eliminates complex chloro-organic compounds from mill effluent.
Kraft pulp is valued for its reinforcing role in mechanical printing papers and is sought after by producers of paper for the publishing industry, primarily for magazines and advertising materials. Kraft pulp is also an important ingredient for tissue manufacturing, and tissue demand tends to increase with living standards in developing countries. Kraft pulp produced for reinforcement fibers is considered the highest grade of kraft
19
pulp and generally obtains the highest price. The Rosenthal mill produces pulp for reinforcement fibers to the specifications of certain of our customers. We believe that a number of our customers consider us their supplier of choice.
Stendal Mill.The Stendal mill is situated on a 200 acre site owned by Stendal that is part of a larger 1,250 acre industrial park near the town of Stendal in the state ofSaxony-Anhalt, approximately 300 kilometers north of the Rosenthal mill and 130 kilometers west of Berlin. The mill is adjacent to the Elbe river and has access to harbor facilities for water transportation. The mill is a single line mill with a current annual design production capacity of approximately 650,000660,000 ADMTs of kraft pulp. The Stendal mill is self-sufficient in steam and electrical power. Some excess electrical power which is constantly being generated is sold to the regional power grid. The facilities at the mill include:
an approximately 920,000 square feet fiber storage area;
| • | an approximately 920,000 square feet fiber storage area; |
debarking and chipping facilities for pulp logs;
| • | debarking and chipping facilities for pulp logs; |
a fiber line, which includes ten SuperBatch™ digesters and bleaching facilities;
| • | a fiber line, which includes ten SuperBatch™ digesters and bleaching facilities; |
a pulp machine, which includes a dryer, a cutter and a baling line;
| • | a pulp machine, which includes a dryer, a cutter and a baling line; |
an approximately 108,000 square feet finished goods storage area;
| • | an approximately 108,000 square feet finished goods storage area; |
a chemical recovery line, which includes a recovery boiler, evaporation plant, recausticizing plant and lime kiln;
| • | a chemical recovery line, which includes a recovery boiler, evaporation plant, recausticizing plant and lime kiln; |
a fresh water plant;
| • | a fresh water plant; |
a wastewater treatment plant; and
| • | a wastewater treatment plant; and |
a power station with a turbine capable of producing approximately 102 MW of electric power from steam produced by the recovery boiler and a power boiler. Upon completion of Project Blue Mill, the mill will have two turbines and is expected to be able to produce 142 MW of electrical power.
| • | a power station with two turbines capable of producing 148 MW of electrical power since the completion of Project Blue Mill in December 2013. |
The kraft pulp produced at the Stendal mill is of a slightly different grade than the pulp produced at the Rosenthal mill as the mix of softwood fiber used is slightly different. This results in a complementary product more suitable for different end uses. The Stendal mill is capable of producing both totally chlorine free and elemental chlorine free pulp.
Celgar Mill.The Celgar mill is situated on a 400 acre site near the city of Castlegar, British Columbia. The mill is located on the south bank of the Columbia River, approximately 600 kilometers east of the port city of Vancouver, British Columbia, and approximately 32 kilometers north of theCanada-U.S. border. The city of Seattle, Washington is approximately 650 kilometers southwest of Castlegar. ItThe Celgar mill is a single line mill with a current annual production capacity of approximately 520,000 ADMTs of kraft pulp. Internal power generating capacity resulting from the completion of the Celgar Energy Project in 2010 enables the Celgar mill to be self-sufficient in electrical power and to sell surplus electricity. The facilities at the Celgar mill include:
chip storage facilities with a capacity of 200,000 cubic meters of chips;
| • | chip storage facilities with a capacity of 250,000 cubic meters of chips; |
a woodroom containing debarking and chipping equipment for pulp logs;
| • | a woodroom containing debarking and chipping equipment for pulp logs; |
a fiber line, which includes a dual vessel hydraulic digester, two stage oxygen delignification and a four stage bleach plant;
two pulp machines, which each include a dryer, a cutter and a baling line;
| • | a fiber line, which includes a dual vessel hydraulic digester, two stage oxygen delignification and a four stage bleach plant; |
a chemical recovery line, which includes a recovery boiler, evaporation plant, recausticizing area and wastewater treatment system; and
| • | two pulp machines, which each include a dryer, a cutter and a baling line; |
| • | a chemical recovery line, which includes a recovery boiler, evaporation plant, recausticizing area and wastewater treatment system; and |
two turbines and generators capable of producing approximately 48 MW and 52 MW, respectively, of electric power from steam produced by the recovery boiler and a power boiler.
| • | two turbines and generators capable of producing approximately 48 MW and 52 MW, respectively, of electric power from steam produced by the recovery boiler and a power boiler. |
20
The Celgar mill produces high-quality kraft pulp that is made from a unique blend of slow growing/long-fiber Western Canadian tree species. It is used in the manufacture of high-quality paper and tissue products. We believe the Celgar mill’s pulp is known for its excellent product characteristics, including tensile strength, wet strength and brightness. The Celgar mill is a long-established supplier to paper and tissue producers in Asia.
Generation and Sales of “Green” Energy and Chemicals at our Mills
Our pulp mills are large scale bio-refineries that, in addition to pulp, also produce surplus “carbon neutral” or “green” energy. As part of the pulp production process our mills generate “green” energy using carbon-neutral biofuelsbio-fuels such as black liquor and wood waste. Through the incineration of biofuelsbio-fuels in the recovery and power boilers, our mills produce sufficient steam to cover all of our steam requirements and allow us to produce surplus electricity which we sell to third party utilities. As a result, we have benefittedbenefited from “green” energy legislation, incentives and commercialization that hashave developed over the last few years in Europe and Canada. In addition, in recent years we have applied considerable resources to increasing our Stendal mill also producescapacity to produce and sell chemicals, primarily tall oil as a by-product of its production processes and sells the samefor use in the market.numerous applications including bio-fuels.
Our surplus energy and chemical sales provide our mills with a new stable revenue source unrelated to pulp prices. Since our energy and chemical production is a by-productare by-products of our pulp production process, there are minimal incremental costs and our surplus energy and chemical sales are highly profitable. We believe that this revenue source from power sales gives our mills a competitive advantage over other older mills which do not have the equipment or capacity to produce and/or sell surplus power and/or chemicals in a meaningful amount.
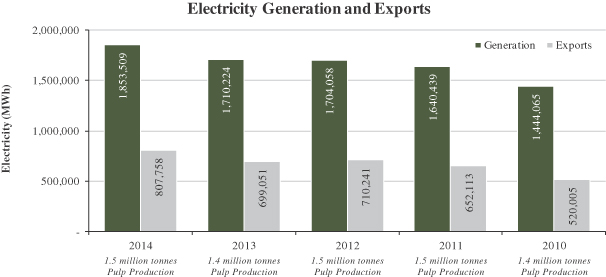
In 20122014 and 2011, we2013, our mills sold 710,241807,758 MWh and 652,113699,051 MWh of surplus energy,electricity, respectively, and recorded revenues of €60.6$88.8 million and €58.0$79.4 million, respectively, from such energy sales. In 2014 and 2013, revenues from the sale of chemicals were $12.7 million and $12.8 million, respectively.
The following table sets out our electricity generation and surplus electricity sales for the last five years:years ended December 31, 2014:

21
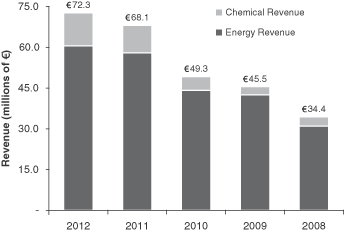
The following chart sets forth our consolidated revenues from electricity and chemical sales for the last five years:
Energy and Chemical Revenueyears ended December 31, 2014:

German Mills
Our Rosenthal and Stendal mills participate in a program established pursuant to the Renewable Energy Act in Germany.Act. Such Act, in existence since 2000, requires that public electric utilities give priority to electricity produced from renewable energy sources by independent power producers and pay a fixed tariff for a period of 20 years. Under the program, our German mills now sell their surplus energy to the local electricity grid at the rates stipulated by the Renewable Energy Act for biomass energy.
Since 2005, our German mills have also benefited from the sale of emission allowances under the European Union Carbon Emissions Trading Scheme, referred to as “EU���EU ETS”. However, our eligibility for special tariffs under the Renewable Energy Act has reduced the amount of emissions allowances granted to our German mills under the EU ETS.
In 2012,2014, our Rosenthal and Stendal mills sold approximately 178,266 MWh and 509,773 MWh of electricity, respectively, for proceeds of $21.9 million and $56.8 million, respectively.
In December 2013, we commencedcompleted Project Blue Mill which is designed to increasepermits the Stendal mill’smill to produce an annual pulp production byincremental 30,000 ADMTs of pulp and initially produce an additional 109,000 MWh of surplus renewable electricity. Project Blue Millelectricity and is eligiblefully operational. Sales of such incremental surplus electricity generated approximately $9.7 million in revenues for €12.0 million of non-refundable government grants and theStendal in 2014.
In 2014, our Stendal mill arranged a €17.0 million secured term debt facility, amortized over five-years, of which 80% will be government guaranteed. The balance of Project Blue Mill will be funded through operating cash flow of the Stendal mill and up to an aggregate of €6.5 million in pro rata shareholder loans from Mercer Inc. and its noncontrolling shareholder.
In 2012, we generated €11.6$11.9 million from the sale of tall oil, a by-product of our production process.
In 2012,2014, our Rosenthal mill completed a capital project to also produce and Stendal mills soldsell tall oil. We estimate that, based on current pricing, the project should permit the Rosenthal mill to generate approximately 169,613 MWh and 368,634 MWh of electricity, respectively, for proceeds of €15.1$3.5 million and €32.2 million, respectively.in annual revenues from tall oil sales.
Celgar Mill
In September 2010, we completed the Celgar Energy Project at the Celgar mill to increase and optimize the mill’s production of “green” energy. The project included the installation of a 48 MW condensing turbine,
22
which brought the mill’s installed generating capacity up to 100 MW, and upgrades to the mill’s bark boiler and steam consuming facilities. The Celgar mill has an Electricity Purchase Agreement with British Columbia Hydro and
Power Authority, referred to as “B.C. Hydro”, for the sale of power generated from such project. Under the Electricity Purchase Agreement, the Celgar mill agreed to supply a minimum of approximately 238,000 MWh of surplus electrical energy annually to the utility over a ten-year term. We financed the Celgar Energy Project principally with funding of approximately C$48.0$44.6 million of Canadian governmental grants.
In 2012,2014, we sold roughly 171,994approximately 119,719 MWh of surplus renewable electricity at our Celgar mill which generated approximately C$17.2$10.1 million in annual revenues.
Our major costs of production are fiber, labor, energy and chemicals. Fiber, comprised of wood chips and pulp logs, is our most significant operating expense. Given the significance of fiber to our total operating expenses and our limited ability to control its costs, compared with our other operating costs, volatility in fiber costs can materially affect our margins and results of operations.
Fiber
Our mills are situated in regions which generally provide a relatively stable supply of fiber. The fiber consumed by our mills consists of wood chips produced by sawmills as a by-product of the sawmillsawmilling process and pulp logs. Wood chips are small pieces of wood used to make pulp and are either wood residuals from the sawmillsawmilling process or logs or pulp logs chipped especially for this purpose. Pulp logs consist of lower quality logs not used in the production of lumber. Wood chips and pulp logs are cyclical in both price and supply.
Generally, the cost of wood chips and pulp logs is primarily affected by the supply and demand for lumber. Additionally, regional factors such as harvesting levels and weather conditions can also have a material effect on the supply, demand and price for fiber.
In Germany, since 2006, the price and supply of wood chips has been affected by increasing demand from alternative or renewable energy producers and government initiatives for carbon neutral energy. Declining energy prices, and weakeningweaker economies or warm winters such as in 2014 temper the first half of 2009 tempered the increased demand for wood chips that resultedresulting from initiatives by European governments to promote the use of wood as a carbon neutral energy. Over the long-term, we expect this non-traditional demand for fiber to continue to increase.
In April 2008, the Russian government raised tariffs on the export of sawmill and pulp wood to 25% from 20%. A further increase to 80% was initially scheduled for January 1, 2009 but was officially deferred twice and Russia’s export tariff remained unchanged at 25% in 2011. In August 2012, Russia entered the World Trade Organization, or “WTO”, and, due to inclusion in the WTO, Russia has lowered its export tariffs for certain softwood species to between 13% and 15%, which we believe has had a positive impact on the European fiber supply.
During the past few years, certain customers have endeavored to purchase pulp that is produced using fiber that meets certain recognized wood certification requirements from forest certification agencies like FSC, PEFC, SFI-CSA. If the fiber we purchase does not meet certain wood certifications required by customers, it may make it more difficult or prevent us from selling our pulp to such customers. The chain of custody wood certification process is a voluntary process which allows a company to demonstrate that they use forest resources in accordance with strict principles and standards in the areas of sustainable forest management practices and environmental management. In an effort to procure wood only from sustainably managed sources, we employ an FSC Chain of Custody protocol which requires tracking of fiber origins and preparing risk based assessments regarding the region and operator. In the areas where we operate, we are actively engaged in the further development of certification processes. Although wood certification requirements continue to evolve and are not
23
consistent from jurisdiction to jurisdiction, we currently do not expect certification requirements to have a material adverse impact on our fiber procurement and pulp sales.
Offsetting some of the increases in demand for wood fiber have been initiatives in which we and other producers are participating to increase harvest levels in Germany, particularly from small private forest owners. We believe that Germany has the highest availability of softwood forests in Europe suitable for harvesting and manufacturing. We believe private ownership of such forests is approximately 50%. Many of these forest ownership stakes are very small and have been harvested at rates much lower than their rate of growth. In 2009, forest owners began to reduce their harvesting rates in response to slowing economies and weaker demand for pulp logs, leading to an undersupply which resulted in increased fiber prices during that year. Fiber prices continued to increase through most of 2010 and 2011, driven by a weak lumber market, lower harvesting in central Germany and increased demand for wood from the energy sector for heating and other bio-energy purposes.
In 2012, fiber prices in Germany decreased by approximately 10%17% (in U.S. dollar terms), mainly due to reduced demand for fiber from the European particle board industry and other regional residual fiber users and the start of a recovery in lumber markets. In 2013, fiber prices in Germany increased by approximately 13%, mainly due to strong demand from the European board producers and sawmills, along with the increased demand for pellets due to an unusually cold winter. In addition to increased demand, high snow levels and summer floods in some areas in which we operate led to lower fiber supply levels during much of 2013. In 2014, our per unit fiber costs in Germany decreased by 6% due to sawmills running at high rates, a stronger supply of logs and lower demand from pellet producers and board manufacturers.
We believe we are the largest consumer of wood chips and pulp logs in Germany and often provide the best long-term economic outlet for the sale of wood chips in Eastern Germany. We coordinate the wood procurement activities for our German mills to reduce overall personnel and administrative costs, provide greater purchasing power and coordinate buying and trading activities. This coordination and integration of fiber flows also allows us to optimize transportation costs, and the species and fiber mix for both mills.
In 2012,2014, the Rosenthal mill consumed approximately 1.71.8 million cubic meters of fiber. Approximately 63%69% of such consumption was in the form of sawmill wood chips and approximately 37%31% was in the form of pulp logs. The wood chips for the Rosenthal mill are sourced from approximately 2726 sawmills located primarily in the states of Bavaria, Baden-Württemberg and Thüringia and are within a 300 kilometer radius of the Rosenthal mill. Within this radius, the Rosenthal mill is the largest consumer of wood chips. Given its location and size, the Rosenthal mill is often the best economic outlet for the sale of wood chips in the area. Approximately 75%71% of the fiber consumed by the Rosenthal mill is spruce and the remainder is pine. While fiber costs and supply are subject to cyclical changes largely in the sawmill industry, we expect that we will be able to continue to obtain an adequate supply of fiber on reasonably satisfactory terms for the Rosenthal mill due to its location and our long-term relationships with suppliers. We have not historically experienced any significant fiber supply interruptions at the Rosenthal mill.
Wood chips for the Rosenthal mill are normally sourced from sawmills under one yearone-year contracts with quarterly adjustments for market pricing. Substantially all of our chip supply is sourced from suppliers with which we have a long-standing relationship. Pulp logs are sourced from the state forest agencies in Thüringia, Saxony and Bavaria on a contract basis and partly from private holders and traders on the same basis as wood chips. Like the wood chip supply arrangements, these contracts tend to be for one-year terms with quarterly adjustments for market pricing. We organize the transportation of pulp logs sourced from the state agencies in Thüringia, Saxony and Bavaria after discussions with the agencies regarding the quantities of pulp logs that we require.
In 2012,2014, the Stendal mill consumed approximately 3.33.4 million cubic meters of fiber. Approximately 24%30% of such fiber was in the form of sawmill wood chips and approximately 76%70% in the form of pulp logs. The core wood supply region for the Stendal mill includes most of the Northern part of Germany within an approximate 300 kilometer radius of the mill. We also purchase wood chips from Southwestern and Southern
24
Germany. The fiber base in the wood supply area for the Stendal mill consisted of approximately 66%55% pine, and 34%44% spruce and 1% other species in 2012.2014. The Stendal mill has sufficient chipping capacity to fully operate solely using pulp logs, if required. We source pulp logs partly from private forest holders, municipal forest owners and partly from state forest agencies in Thüringia,Saxony-Anhalt, Mecklenburg-Western Pomerania, Saxony, Lower Saxony, North Rhine-Westphalia, Hesse and Brandenburg.Brandenburg, Bavaria, Schleswig-Holstein, Rhineland Palatinate and the City of Berlin. The volumes are distributed at optimal costs between the mills. In addition, in 2013 and 2014, the Stendal mill also imported fiber from Poland and the Baltic Sea region.
In 2012,2014, the Celgar mill consumed approximately 2.62.4 million cubic meters of fiber. Approximately 69%78% of such fiber was in the form of sawmill wood chips and the remaining 31%22% came from pulp logs processed through its woodroom or chipped by a third party. The source of fiber at the mill is characterized by a mixture of species (whitewoods(pine, douglas fir, hemlock, cedar and cedar)spruce) and the mill sources fiber from a number of Canadian and U.S. suppliers.
As a result of the cyclical decline in sawmill chip supply resulting from lower lumber production in British Columbia commencing in 2008, the Celgar mill increased its U.S. purchases of fiber, diversified its suppliers and, where possible, increased chip production through third party field chipping contracts and existing sawmill suppliers. In 2009, the Celgar mill upgraded its woodroom which, along with subsequent improvements during the year, increased its capacity to be able to process up to 50%40% of the mill’s fiber needs. The woodroom upgrades also increased the mill’s ability to process smallsmaller diameter logs and facilitate an efficient flow of fiber. This has increased the overall volume of fiber being processed and helped mitigate increases in the price of fiber. A recovery in U.S. housing starts which commenced in the latter part of 2012 and continued in 2013 and 2014 resulted in increased sawmill activity. This increased the supply of wood chips for the Celgar mill and reduced its need for pulp logs, which are generally a higher cost for the mill than wood chips.
The Celgar mill has access to approximately 2529 different suppliers from Canada and the U.S., representing approximately 75%78% of its total annual fiber requirements. The Celgar mill’s woodroom and third party chippers supplied the remaining 25%22% of the mill’s fiber requirements in 2012.2014. Chips are purchased in Canada and the U.S. in accordance with chip purchase agreements. Generally, pricing is reviewed and adjusted periodically to reflect market prices. One
of the longer-term contracts is a so-called “evergreen” agreement, where the contract remains in effect until one of the parties elects to terminate. Termination requires a minimum of two and, in some cases, five years’ writtenterminate after providing the stipulated notice. All other contracts are generally for one year with quarterly adjustments or on three-month terms.
To secure the volume of pulp logs required by its woodroom, the Celgar mill has entered into pulp log supply agreements, which can range from three-month to one-year terms, with a number of different suppliers, many of whom are also contract chip suppliers to the mill. All of the pulp log agreements can be terminated by either party for any reason, upon seven days’ written notice. The Celgar mill also purchased two non-renewable licenses at a cost of $1.3 million, which will provide saw logs to sawmills in the area and pulp logs for the Celgar mill to use.
In 2012,2014, our fiber costs per unit at the Celgar mill were approximately 6% higher11% lower than in 2011,2013, as a result of the impact of foreign exchange changes more than offsetting improved availability of wood chips.strong sawmill activity in the region.
Labor
Our labor costs are generally steady, with small overall increases due to inflation in wages and health care costs. Over the last three years, we have been able to largely offset such increases by increasing our efficiencies and production and streamlining operations.
In July 2013, we determined to reduce the Celgar mill’s workforce by approximately 85 employees in order to reduce the mill’s fixed costs. In 2013, we incurred pre-tax charges of approximately $5.0 million for severance and other personnel-related expenses in connection with this reduction. We estimated that our Celgar
25
mill would realize approximately $8.0 million to $10.0 million in annual pre-tax costs savings once such restructuring has been completed and expected to realize approximately 80% of such savings in 2014. As at December 31, 2014, we had realized the expected cost savings.
Energy
Our energy is primarily generated from renewable carbon neutral sources, such as black liquor and wood waste. Our mills produce all of our steam requirements and generate excess energy which we sell to third party utilities. In 2012,2014, we generated 1,704,0581,853,509 MWh and sold 710,241807,758 MWh of surplus energy. See also “—“– Generation and Sales of ‘Green’ Energy and Chemicals at our Mills”. We utilize fossil fuels, such as natural gas, in limited circumstances primarily in our lime kilns and we use a limited amount for start-up and shutdownshut-down operations. Additionally, from time to time, mill process disruptions occur and we consume small quantities of purchased electricity and fossil fuels to maintain operations. As a result, all of our mills are subject to fluctuations in the prices for fossil fuels.
Chemicals
Our mills use certain chemicals which are generally available from several suppliers and sourcing is primarily based upon pricing and location. Although chemical prices have risen slightly over the last three years, we have been able to partially reduce our costs through improved efficiencies and capital expenditures. In connection with our focus on the growing bio-energy market, we sell tall oil, a by-product of our production process which is used as both a chemical additive and as a green“green” energy source. In 2012,2014, we generated €11.6$12.1 million from the sale of tall oil. In 2014, our Rosenthal mill completed a capital project which will allow it to process and sell tall oil. We currently expect the proceeds from the sale of tall oil sales to remain stableincrease in future periods.
Consolidated cash production costs per ADMT for our pulp mills are set out in the following table for the periods indicated:
| Year Ended December 31, | Year Ended December 31, | |||||||||||||||||||||||
| 2012 | 2011 | 2010 | 2014 | 2013 | 2012 | |||||||||||||||||||
Cash Production Costs | (per ADMT) | (per ADMT) | ||||||||||||||||||||||
Fiber | € | 257 | € | 275 | € | 256 | $ | 332 | $ | 356 | $ | 331 | ||||||||||||
Labor | 47 | 43 | 42 | 58 | 62 | 60 | ||||||||||||||||||
Chemicals | 49 | 46 | 41 | 59 | 63 | 63 | ||||||||||||||||||
Energy | 19 | 20 | 20 | 29 | 32 | 24 | ||||||||||||||||||
Other | 46 | 56 | 54 | 57 | 64 | 59 | ||||||||||||||||||
|
|
|
|
|
| |||||||||||||||||||
Total cash production costs(1) | € | 418 | € | 440 | € | 413 | $ | 535 | $ | 577 | $ | 537 | ||||||||||||
|
|
|
|
|
| |||||||||||||||||||
| (1) | Cost of production per ADMT produced excluding depreciation. |
26
Sales, Marketing and Distribution
Our pulp revenues by geographic area are set out in the following table for the periods indicated:
| Year Ended December 31, | Year Ended December 31, | |||||||||||||||||||||||
| 2012 | 2011 | 2010 | 2014 | 2013 | 2012 | |||||||||||||||||||
Revenues by Geographic Area | (in thousands) | (in thousands) | ||||||||||||||||||||||
Germany | $ | 336,594 | $ | 309,399 | $ | 293,733 | ||||||||||||||||||
Italy | 80,730 | 65,654 | 55,443 | |||||||||||||||||||||
Other European Union countries(1) | 250,952 | 224,988 | 216,846 | |||||||||||||||||||||
United States | 39,146 | 30,404 | 61,103 | |||||||||||||||||||||
China | € | 230,007 | € | 234,654 | € | 196,022 | 276,848 | 300,827 | 295,797 | |||||||||||||||
Germany | 228,402 | 256,563 | 278,348 | |||||||||||||||||||||
Other European Union countries(1) | 168,616 | 175,937 | 182,246 | |||||||||||||||||||||
North America | 47,513 | 69,345 | 92,628 | |||||||||||||||||||||
Italy | 43,112 | 51,509 | 56,301 | |||||||||||||||||||||
Other Asia | 33,197 | 30,872 | 37,561 | 69,711 | 49,855 | 42,692 | ||||||||||||||||||
Other countries | 1,632 | 823 | 1,503 | 9,366 | 2,748 | 2,099 | ||||||||||||||||||
|
|
|
|
|
| |||||||||||||||||||
Total(2) | € | 752,479 | € | 819,703 | € | 844,609 | $ | 1,063,347 | $ | 983,875 | $ | 967,713 | ||||||||||||
|
|
|
|
|
| |||||||||||||||||||
| (1) | Not including Germany or Italy; includes new entrant countries to the European Union from their time of admission. |
| (2) | Excluding intercompany sales and third party transportation revenues. |
The following charts illustrate the geographic distribution of our pulp revenues as a percentage of our total pulp revenues for the periods indicated:
Year Ended December 31, 2014 | Year Ended December 31, 2013 | Year Ended December 31, 2012 |
|
| ||||
| ||||||||
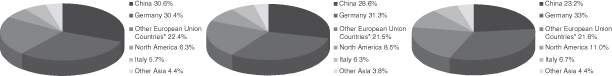 |  | 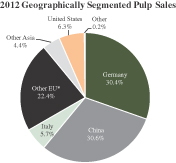 |
*Not including Germany or Italy; includes new entrant countries to the European Union from their time of admission.
The distribution of our pulp sales by end customeruse are set out in the following table for the periods indicated:
| Year Ended December 31, | Year Ended December 31, | |||||||||||||||||||||||
| 2012 | 2011 | 2010 | 2014 | 2013 | 2012 | |||||||||||||||||||
| (in thousands of ADMTs) | (in thousands of ADMTs) | |||||||||||||||||||||||
Tissue | 576 | 602 | 610 | 542 | 523 | 576 | ||||||||||||||||||
Specialty | 214 | 222 | 180 | 205 | 181 | 214 | ||||||||||||||||||
Printing & Writing | 639 | 563 | 597 | 705 | 662 | 639 | ||||||||||||||||||
Other | 44 | 41 | 42 | 34 | 74 | 45 | ||||||||||||||||||
|
|
| ||||||||||||||||||||||
| 1,486 | 1,440 | 1,474 | ||||||||||||||||||||||
|
|
| ||||||||||||||||||||||
Our global sales and marketing group is responsible for conducting all sales and marketing of the pulp produced at our mills and currently has approximately 1914 employees engaged full time in such activities. This group largely handles all European and North American sales directly. Sales to Asia are made directly or through commission agents overseen by our sales group. The global sales and marketing group handles sales to
27
approximately 200209 customers. We coordinate and integrate the sales and marketing activities of our German mills to realize on a number of synergies between them. These include reduced overall administrative and personnel costs and coordinated selling, marketing and transportation activities. We also coordinate sales from the Celgar mill with our German mills on a global basis, thereby providing our larger customers with seamless service across all major geographies. In marketing our pulp, we
seek to establish long-term relationships by providing a competitively priced, high-quality, consistent product and excellent service. In accordance with customary practice, we maintain long-standing relationships with our customers, pursuant to which we periodically reach agreements on specific volumes and prices.
Our pulp sales are on customary industry terms. At December 31, 2012,2014, we had no material payment delinquencies. In 2014, one customer at a number of its individual mills accounted for 13% of our pulp sales. In 2013, two customers at a number of their individual mills accounted for 10% and 11%, respectively, of our pulp sales. In 2012, one customer at a number of its individual mills accounted for 11% of our pulp sales. In 2011, no single customer accounted for more than 10% of our pulp sales. In 2010, one customer which purchased for several of its mills accounted for 11% of pulp sales. We do not believe our pulp sales are dependent upon the activities of any single customer.customer and the loss of any single customer would not have a material adverse effect on us.
Approximately 54%50%, 58%49% and 55%54% of our sales were to tissue and specialty paper product manufacturers for the years ended December 31,in 2014, 2013 and 2012, 2011respectively. In 2013 and 2010, respectively. The balance2012, our Celgar mill shifted sales of ourapproximately 55,000 ADMTs per annum from a very large North American tissue producer to certain printing and writing customers in China as it could obtain higher margins on these particular sales for such periods was to other paper product manufacturers. Over the last five years, our sales tovolumes. Generally tissue and specialty paper product manufacturers have increased by over 15%. Generally suchproducer customers are not as sensitive to cyclical declines in demand caused by downturns in economic activity. The balance of our sales was to other paper product manufacturers.
We transport our NBSK pulp generally by truck, rail and ocean carriers through third-party carriers. Our carrier contracts are generally from one to two years.We have a small fleet of trucks in Germany that deliver some of our German mills’ pulp.
Our German mills are currently the only significant market kraft pulp producers in Germany, which is the largest import market for kraft pulp in Europe. We therefore have a competitive transportation cost advantage compared to Canadian and Northern European pulp producers when shipping to customers in Europe. Due to the location of our German mills, we are able to deliver pulp to many of our customers primarily by truck.truck and rail. Most trucks that deliver goods into Eastern Germany generally do not have significant backhaul opportunities as the region is primarily an importer of goods. We are therefore frequently able to obtain relatively low backhaul freight rates for the delivery of our products to many of our customers. Since many of our customers are located within a 500 kilometer radius of our German mills, we can generally supply pulp to customers of these mills faster than our competitors because of the short distances between the mills and our customers.
The Celgar mill’s pulp is transported to customers by rail, truck and ocean carrier using third party warehouses to ensure timely delivery. The majority of Celgar’s pulp for overseas markets is initially delivered primarily by rail to the Port of Vancouver for shipment overseas by ocean carrier. Based in Western Canada, the Celgar mill is well positioned to service Asian customers. The majority of the Celgar mill’s pulp for domestic markets is shipped by rail directly to the customer or to third party warehouses in the U.S. or directly to the customer.
In each of the years ended December 31,2014, 2013 and 2012, 2011 and 2010, outbound transportation costs comprised approximately 9% of our total consolidated cost of sales. Generally, in recent years, our transportation costs have increased due to increases in fuel costs and lower shipping capacity. As a result, we have taken initiatives to target sales to the most “freight logical” customers for overseas sales.
28
In 2012,2014, we continued with our capital investment programs designed to increase pulp, “green” energy and green energychemical production capacity, reduce costs and improve efficiency and environmental performance at our mills. The improvements made at our mills over the years have reduced operating costs and increased the competitive position of our facilities.
Total capital expenditures at our mills are set out in the following table for the periods indicated:
| Year Ended December 31, | Year Ended December 31, | |||||||||||||||||||||||
| 2012 | 2011 | 2010 | 2014 | 2013 | 2012 | |||||||||||||||||||
| (in thousands) | (in thousands of dollars) | |||||||||||||||||||||||
Rosenthal | € | 15,436 | € | 13,718 | € | 4,033 | $ | 16,624 | $ | 8,375 | $ | 19,851 | ||||||||||||
Stendal | € | 14,767 | € | 8,296 | € | 3,625 | 8,700 | 32,524 | 18,990 | |||||||||||||||
Celgar | € | 6,461 | € | 15,718 | € | 30,642 | 9,288 | 4,798 | 8,309 | |||||||||||||||
Capital investments at the Rosenthal mill in 2014 related primarily to an automated chip reclamation project and tall oil project, while, in 2013, they related primarily to the completion of the recovery upgrade project and the replacement of capital. In 2012, capital investments related primarily to the mill’s recovery boiler upgrade, which we believe will reducereduced our wastewater fees, while, in 2011, they related primarily to the installation of a new chipper and upgrades to the recovery process. In 2010, capital expenditures related mainly to the upgrade of a bleaching line and a washer project which helped offset three years of wastewater fees that would otherwise be payable.fees.
Capital investments at the Stendal mill in 20122014 related primarily to the commencement ofa wastewater reduction project. In 2013 and 2012, capital investments related primarily to Project Blue Mill. In 2011 and 2010, capital investments related mainly to relatively small projects designed to improve safety and environmental performance as well as improve the overall efficiency of the mill.
In 2012,December 2013, the Stendal mill commencedcompleted Project Blue Mill, to increasewhich increased production and efficiency at the mill through debottlenecking initiatives, including the installation of an additional 4046 MW steam turbine. Project Blue Mill is estimated to require approximately €40.0required $49.3 million in capital expenditures over about 21 months, which will bewas primarily funded through €12.0approximately €11.3 million ($15.0 million) of non-refundable German government grants and a new €17.0 million ($22.2 million) five-year amortizing secured term debt facility, of which 80% will be government guaranteed.facility. The balance of Project Blue Mill will bewas funded through operating cash flow of the Stendal mill and up to an aggregate of €6.5 million in pro rata shareholder loans from Mercer Inc. and Stendal’s noncontrolling shareholder. Project Blue Mill is currently expected to be completed and start to generate electricity sales in or about September 2013. As of December 31, 2012, we had expended an aggregate €13.3 million on Project Blue Mill.contributions.
Certain of our capital investment programs in Germany were partially financed through government grants made available by German federal and state governments. Under legislation adopted by the federal and certain state governments of Germany, government grants are provided to qualifying businesses operating in Eastern Germany to finance capital investments. The grants are made to encourage investment and job creation. For example, the government grants received in connection with Project Blue Mill require us to maintain the employment of core employees for five years after completion of the project. Currently, grants are available for up to 30% of the cost of qualified investments. Previously, government grants were available for up to 35% of the cost of qualified investments, such as for the construction of our Stendal mill. These grants at the 35% of cost level required that at least one permanent job be created for each €0.5 million ($0.6 million) of capital investment eligible for such grants and that such jobs be maintained for a period of five years from the completion of the capital investment project. Generally, government grants are not repayable by a recipient unless itsuch recipient fails to complete the proposed capital investment or, if applicable, fails to create or maintain the requisite amount of jobs. In the case of such failure, the government is entitled to revoke the grants and seek repayment unless such failure resulted from material unforeseen market developments beyond the control of the recipient, whereinin which case the government may refrain from reclaiming previous grants. Pursuant to such legislation in effect at the time, the Stendal mill receivedrecorded approximately €278.0$350.0 million of government grants. We believe that we are in compliance in all material respects with all of the terms and conditions governing the government grants we have received in Germany. See “Legal“Item 3. – Legal Proceedings”.
29
The following table sets out, foras at the periodsdates indicated, the effect of these government grants on the recorded value of such assets in our Consolidated Balance Sheets:
| As at December 31, | As at December 31, | |||||||||||||||||||||||
| 2012 | 2011 | 2010 | 2014 | 2013 | 2012 | |||||||||||||||||||
| (in thousands) | (in thousands) | |||||||||||||||||||||||
Property, plant and equipment, gross amount less amortization | € | 1,085,593 | € | 1,112,639 | € | 1,144,759 | $ | 1,188,195 | $ | 1,403,990 | $ | 1,431,355 | ||||||||||||
Less: government grants less amortization | 276,715 | 291,665 | 297,992 | 305,045 | 365,359 | 364,849 | ||||||||||||||||||
|
|
|
|
|
| |||||||||||||||||||
Property, plant and equipment, net (as shown on the Consolidated Balance Sheet) | € | 808,878 | € | 820,974 | € | 846,767 | $ | 883,150 | $ | 1,038,631 | $ | 1,066,506 | ||||||||||||
|
|
|
|
|
| |||||||||||||||||||
The following table sets forth, as at the dates indicated, the gross amount of all government grants we have received and capitalized in our balance sheet, the associated amortization and the resulting net balance we include in our property, plant and equipment for the periods indicated:equipment:
| As at December 31, | ||||||||||||
| 2012 | 2011 | 2010 | ||||||||||
| (in thousands) | ||||||||||||
Government grants—gross | € | 431,580 | € | 429,946 | € | 419,891 | ||||||
Less: accumulated amortization | 154,865 | 138,281 | 121,889 | |||||||||
|
|
|
|
|
| |||||||
Government grants less accumulated amortization | € | 276,715 | € | 291,665 | € | 297,992 | ||||||
|
|
|
|
|
| |||||||
| As at December 31, | ||||||||||||
| 2014 | 2013 | 2012 | ||||||||||
| (in thousands) | ||||||||||||
Government grants - gross | $ | 532,696 | $ | 600,158 | $ | 569,039 | ||||||
Less: Accumulated amortization | 227,651 | 234,799 | 204,190 | |||||||||
|
|
|
|
|
| |||||||
Government grants less accumulated amortization | $ | 305,045 | $ | 365,359 | $ | 364,849 | ||||||
|
|
|
|
|
| |||||||
Qualifying capital investments at industrial facilities in Germany that reduce effluent discharges offset wastewater fees that would otherwise be required to be paid. For more information about our environmental capital expenditures, see “—“– Environmental”.
In 2012,2014, capital expendituresinvestments at the Celgar mill includesincluded a new chip screening project, a logistics warehousing project and maintenance projects, while, in 2013, they included maintenance projects. In 2012, capital investments included a project to recover/recycle chemicals from the mill’s effluent, referredeffluent.
In January 2014, we commenced the implementation of a new enterprise resource planning, or “ERP”, system to as the “GAP Project”, while in 2011 such expenditures related to a project to improve the Celgar mill’s fiber line and oxygen delignification process, referred to as the “Oxygen Delignification Project” and the GAP Project. We completed the Celgar Energy Project in 2010 to increase the mill’s productionreplace our existing business software applications at an estimated cost of “green” energy and optimize its power generation capacity.$12.0 million. The project cost approximately C$64.7 million (€49.0 million) and includedis designed to be completed in stages over the next two years. After considerable due diligence, we selected SAP, a global leader in the development of ERP solutions for medium to large sized international businesses.
The ERP system installation will replace a suite of a second turbine with a design capacity of 48 MW.existing legacy systems which, while functional, will begin becoming obsolete in the near future. The project increased the Celgar mill’s installed generating capacity to 100 MW and upgraded the mill’s power boiler and steam facilities.
In October 2009, as part of the GTP, the Canadian government, through Natural Resources Canada, referred to as “NRCan”, agreed toERP solution introduces state-of-the-art, end-to-end business solutions that will provide approximately C$57.7 million in credits towards the capital costs to improve energy efficiency or effect environmental improvements at the Celgar mill. Of the same, we used approximately C$46.8 million in connection with the Celgar Energy Project. Such credits reduced the cost basis of the assets purchased and were not recorded in our income. The balance of the credits were utilized by the Celgar mill on other qualifying projects. We utilized approximately C$10.9 millionautomation for most aspects of our allocated GTP funding towardsbusiness including finance, payroll, inventory management, sales, fiber management, supply chain, business analytics and forecasting.
To assist us through the Oxygen Delignification Project and several small projects at our Celgar mill.implementation, we have engaged third party advisors with extensive experience in ERP implementations using contemporary systems implementation methodologies that will address not only the technical complexities of such an implementation but also assist with maintaining internal controls over financial reporting.
Excluding costs for projects financed through government grants, capital expenditures, for all of our millsincluding ERP expenditures, in 20132015 are expected to be approximately €32.0$56.0 million, comprised principally of expenditures on Project Blue Mill at our Stendal mill and an array of small projects at our other mills.of:
| • | a wastewater reduction project, automated chip reclamation project and maintenance projects at the Rosenthal mill, aggregating approximately $18.7 million; |
30
| • | a wastewater reduction project and maintenance projects at the Stendal mill, aggregating approximately $23.1 million; |
| • | a small log project, logistics warehousing project and maintenance projects at the Celgar mill, aggregating approximately $9.1 million; and |
| • | an ERP software implementation across the entire company, aggregating approximately $5.1 million. |
Our operations are subject to a wide range of environmental laws and regulations, dealing primarily with water, air and land pollution control. We devote significant management and financial resources to comply with all applicable environmental laws and regulations. In particular, the operation of our plants is subject to permits, authorizations and approvals and we have to comply with certain emission limits. Compliance with these requirements is monitored by local authorities and non-compliance may result in administrative orders, fines or closures of the non-compliant mill. Our total capital expenditures on environmental projects at our mills were approximately €9.3$6.1 million in 2012 (approximately €7.12014, approximately $1.9 million in 2011).2013 and approximately $12.0 million in 2012. In 2015, capital expenditures for environmental projects are expected to be approximately $22.1 million. These capital expenditures are expected to reduce our German mills’ effluent discharges and effectively offset wastewater fees that would otherwise be payable.
We believe we have obtained all required environmental permits, authorizations and approvals for our operations. We believe our operations are currently in substantialmaterial compliance with the requirements of all applicable environmental laws and regulations and our respective operating permits.
Under German state environmental rules relating to effluent discharges, industrial users are required to pay wastewater fees based upon the amount of their effluent discharge. These rules also provide that an industrial user which undertakes environmental capital expenditures and lowers certain effluent discharges to prescribed levels may offset the amount of these expenditures against the wastewater fees that they would otherwise be required to pay. We estimate that the aggregate wastewater fees we saved in 2012 as a result of environmentalexpect capital expenditures and initiatives to reduce allowable emissions and discharges at our Stendal mill was approximately €4.2 million. The estimated amount of accrued wastewater fees we expect to recover at our Rosenthal mill is approximately €6.6 million. Capital investment programs and other environmental initiatives at our German mills mostlywill continue to offset the wastewater fees that wereare payable for 2012 and we believe they will ensure that our operations continue in substantial compliance with prescribed standards.
Environmental compliance is a priority for our operations. To ensure compliance with environmental laws and regulations, we regularly monitor emissions at our mills and periodically perform environmental audits of operational sites and procedures both with our internal personnel and outside consultants. These audits identify opportunities for improvement and allow us to take proactive measures at the mills as considered appropriate.
The Rosenthal mill has a relatively modern biological wastewater treatment and oxygen bleaching facility. We have significantly reduced our levels of absorbable organic halogen discharge at the Rosenthal mill and we believe the Rosenthal mill’s absorbable organic halogen and chemical oxygen demand discharges are in compliance with the standards currently mandated by the German government.
The Stendal mill is in substantial compliance with applicable environmental laws, regulations and permits. Management believes that, as the Stendal mill is a state-of-the-art facility, it will be able to continue to operate in compliance with the applicable environmental requirements.
TheManagement further believes that Celgar mill has beenwill continue to operate in substantial compliance with the requirements of all applicable environmental laws regulations and permits. In 2012, after a hearing, the Celgar mill was required to pay C$30,000 as a fine and C$120,000 as a contribution to a conservation trust fund for environmental projects in respect of a minor 2008 spill of diluted black liquor in the nearby Columbia River. The spill was promptly reported by the mill to authorities at the time of occurrence and remediated to the satisfaction of the overseeing environmental authorities.
The Celgar mill operates two landfills, one of which is an older site that the mill is in the process of decommissioning. The mill is continuing work on finalizing a closure plan for such site and then reviewing such plan with the British Columbia Ministry of Environment, or “MOE”. A portion of this older landfill is still being utilized. We currently expect to finalize our closure plan in 2013 and receive MOE approval for it in 2014. The actual closure activities shall be effected pursuant to a timetable agreed to by the mill and the MOE. The cost of closing the landfill is expected to be approximately €2.4 million.regulations.
Future regulations or permits may place lower limits on allowable types of emissions, including air, water, waste and hazardous materials, and may increase the financial consequences of maintaining compliance with environmental laws and regulations or conducting remediation. Our ongoing monitoring and policies have
31
enabled us to develop and implement effective measures to maintain emissions in substantial compliance with environmental laws and regulations to date in a cost-effective manner. However, there can be no assurances that this will be the case in the future.
ThereOver the past several years, changing weather patterns and climatic conditions due to natural and man-made causes have added to the unpredictability and frequency of natural disasters, such as hurricanes, earthquakes, hail storms, wildfires, snow storms and ice storms, which could also affect our mills or cause variations in the cost of raw materials, such as fiber. However, as there are differing scientific studies and opinions relating to the severity, extent and speed at which climate change is or may be occurring. As a result,occurring, we cannot identify and predict all of the consequences of climate change on our business and operations.
So far, the potential and/orThe effects and perceived effects of climate change and social and governmental responses to it have created both business opportunities and the potential for negative consequences for our business.
The focus on climate change has generated a substantial increase in demand and in legislative requirements for “carbon neutral” or “green” energy in both Europe and, increasingly, in North America. Pulp mills consume wood residuals, being wood chips and pulp logs, as the base raw material for their production process. Wood chips are residuals left over from lumber production and pulp logs are generally lower quality logs left over from logging that are unsuitable for the production of lumber.
As part of their production process, our mills take wood residuals and process them through a digester where cellulose is separated from the wood to be used in pulp production and the remaining residuals, called “black liquor”, isare used for green“green” energy production. As a result of their use of wood residuals and because our mills generate combined heat and power in a process known as cogeneration, they are efficient producers of energy. This energy is carbon neutral and produced from a renewable source. Our relatively modern mills generate a substantial amount of energy that is surplus to their operational requirements.
These factors, along with governmental initiatives in respect of renewable or green“green” energy legislation, have provided business opportunities for us to enhance our generation and sales of green“green” energy to regional utilities. In early 2012December 2013, we commencedcompleted Project Blue Mill, a project at our Stendal mill to install a new 4046 MW steam turbine which we expect will initiallypermits the mill to produce an additional 109,000 MWh of surplus renewable electricity.electricity annually.
We are constantly exploring other initiatives to enhance our generation and sales of surplus green“green” energy and chemical by-products. Other potential opportunities that may result from climate change include:
the expansion of softwood forests and increased growth rates for such forests;
| • | the expansion of softwood forests and increased growth rates for such forests; |
more intensive forestry practices and timber salvaging versus harvesting standing timber;
| • | more intensive forestry practices and timber salvaging versus harvesting standing timber; |
greater demand for sustainable energy and cellulosic biomass fuels; and
| • | greater demand for sustainable energy and cellulosic biomass fuels; and |
additional governmental incentives and/or legislative requirements to enhance biomass energy production.
| • | additional governmental incentives and/or legislative requirements to enhance biomass energy production. |
At this time, we cannot predict which, if any, of these potential opportunities will be available to, or realized by us or their economic effect on our business.
While all of the specific consequences to our business from climate change are not yet predictable, the most visible negativeadverse consequence to date is that the focus on renewable energy will continue to createhas created greater demand and competition for the wood residuals or fiber that is consumed by our mills as part of their production process.from renewable energy producers like the pellet industry in Germany.
In Germany, since 2006, the price and supply of wood residuals have been affected by an increasing demand from alternative or renewable energy producers and governmental initiatives for carbon neutral energy. Declining energy prices, weaker economies or warm winters such as in 2014 temper the demand for wood chips resulting
32
from initiatives by European governments to promote the use of wood as a carbon neutral energy. Over the long term, this non-traditional demand for fiber is expected to increase in Europe. Additionally, the growing interest and focus in British Columbia for renewable green“green” energy is also expected to create additional competition for such fiber in that region over time. Such additional demand for wood residuals may increase the competition and prices for wood residuals over time. See “—“– Production Costs—Costs – Fiber”.
Governmental action or legislation may also have an important effect on the demand and prices for wood residuals. As governments pursue green“green” energy initiatives, they risk creating incentives and demand for wood residuals from renewable energy producers that “cannibalizes” or adversely affects existing traditional users, such as lumber and pulp and paper producers. We are continually engaged in dialogue with government to educate and try to ensure potential initiatives recognize the traditional and continuing role of our mills in the overall usage of forestry resources and the economies of local communities.
Other potential negative consequences from climate change that over time that may affect our business include:
a greater susceptibility of northern softwood forest to disease, fire and insect infestation;
| • | a greater susceptibility of northern softwood forests to disease, fire and insect infestation; |
the disruption of transportation systems and power supply lines due to more severe storms;
| • | the disruption of transportation systems and power supply lines due to more severe storms; |
the loss of fresh water transportation for logs and our finished goods inventories due to lower water levels;
| • | the loss of fresh water transportation for logs due to lower water levels; |
decreases in quantity and quality of processed water for our mill operations;
| • | decreases in the quantity and quality of processed water for our mill operations; |
the loss of northern softwood boreal forests in areas in sufficient proximity to our mills to competitively acquire fiber; and
| • | the loss of northern softwood forests in areas in sufficient proximity to our mills to competitively acquire fiber; and |
| • | lower harvest levels decreasing the supply of harvestable timber and, as a consequence, wood residuals. |
lower harvest levels decreasing the supply of harvestable timber and, as a consequence, wood residuals.
We currently employ approximately 1,5001,430 people. We have approximately 1,0441,025 employees working in our German operations, including our wood procurement, transportation and sales subsidiaries. In addition, there are approximately 1620 people employed at the office we maintain in Vancouver, British Columbia, Canada. Celgar currently employs approximately 443385 people in its operations, the vast majority of which are unionized.
Rosenthal which employs approximately 441444 people, isthe majority of whom are bound by collective agreements negotiated with Industriegewerkschaft Bergbau, Chemie, Energie, or “IGBCE”, a national union that represents pulp and paper workers. In December 2011, we successfully negotiatedJuly 2013, our Rosenthal mill renewed its collective agreement for a new agreement with IGBCE substantially upon the same terms as the previous labor contract.two-year period until June 2015. The new collective agreement provided for an initial 1.8% wage increase and a one-time payment of €200 per employee, an approximately 3.0%subsequent 3% wage increase in 2012 and a further 1.6% wage increase in 2013. This collective agreement has an 18-month term and is scheduled to expire in May 2013.2014.
Stendal and its subsidiaries employemploys approximately 597581 people. In 2011, Stendal entered into a seven-year collective agreement with IGBCE effective July 2011. Since, prior to entering into this collective agreement, Stendal’s employees had relatively lower wages compared to their peers at other German pulp mills, this agreement provided for an approximately 5.5% wage increase in 2012. The collective agreement provides for a further 2.5% minimum annual wage increase from 2013 to 2015. The collective agreement is scheduled to expire in 2018.
We negotiatedIn 2012, Celgar entered into a five-year collective agreement in November 2012, effective May 1, 2012, with ourits hourly workers at the Celgar mill to replace the collective agreement which expired on April 30, 2012.workers. The agreement providesprovided for lump sum payments of $3,750C$3,750 for all active employees in 2012 and 2013 and wage increases of 2.0%, 2.5% or 3.0% in each of 2014, 2015 and 2016. The collective agreement is scheduled to expire in April 2017.
We consider the relationships with our employees to be good. Although no assurances can be provided, we have not had any significant work stoppages at any of our operations and we would therefore expect to enter into new labor agreements with our workers when the current labor agreements expire without any significant work stoppages.
33
Description of Certain Indebtedness
The following summaries ofsummarizes certain material provisions of: (i) our Senior Notes;New Stendal Revolving Credit Facility; (ii) the Stendal Loan Facility;Interest Rate Swap Contract; (iii) a €17.0 million amortizing term facility at our Stendal mill in respect of Project Blue Mill, referred2019 and 2022 Senior Notes; (iv) our credit facilities related to as the “Blue Mill Facility”; (iv) the working capital facilities and investment loan associated with our Rosenthal mill; and (v) the Celgar Working Capital Facility, as such terms are referred to below,Facility. The summaries are not complete and these provisions, including definitions of certain terms, are qualified by reference to the applicable documents and the applicable amendments to such documents on file with the U.S. SecuritiesSEC and Exchange Commission,incorporated by reference herein.
New Stendal Revolving Credit Facility
On November 25, 2014, our subsidiary, Stendal, entered into a €75.0 million revolving credit facility, referred to as the “SEC”“New Stendal Revolving Credit Facility”, with UniCredit Bank AG, Credit Suisse AG, London Branch, Royal Bank of Canada and Barclays Bank PLC as original lenders. The principal terms of the New Stendal Revolving Credit Facility are as follows:
| • | The total availability under the facility is €75.0 million. |
| • | The facility matures on the earlier of October 31, 2019 and one month prior to the stated maturity of the 2019 Senior Notes. |
| • | The facility may be utilized in the form of cash advances or advances by letters of credit or bank guarantees of up to €5.0 million. Borrowings accrue interest at a rate of Euribor plus a 3.50% margin. Fees of 2.25% per annum are payable on issued but undrawn letters of credit and bank guarantees. There is a commitment fee of 1.10% per annum payable on unused availability. |
| • | The facility is secured by a first ranking registered security interest on the inventories and receivables of Stendal. All shareholder loans made by Mercer Inc. to Stendal are subordinated to the indebtedness under the facility. The lenders’ security interest under the facility rankspari passu with the claims of Stendal’s hedge provider under the Stendal Interest Rate Swap Contract (as defined below). |
| • | The facility contains financial maintenance covenants which will be tested semi-annually on June 30 and December 31, commencing June 30, 2015, which require Stendal to maintain (i) a leverage ratio of “net debt” (excluding shareholder loans) to EBITDA of not greater than 2.50:1.00, (ii) an interest coverage ratio (EBITDA to interest expense) of not less than 1.20:1.00 and (iii) a current ratio (current assets to current liabilities) of at least 1.10:1.00. |
| • | Stendal is permitted under the facility to make (i) distributions for regularly scheduled interest payments on its shareholder loans from Mercer Inc. in an amount of up to $23.0 million per year, provided it maintains pro forma liquidity (availability under the facility plus unencumbered cash) of at least €20.0 million and no event of default is occurring and (ii) other distributions to Mercer Inc. semi-annually, provided it maintains pro forma liquidity of at least €20.0 million, no event of default is occurring and it has (A) a leverage ratio (excluding shareholder loans) of not greater than 2.50:1.00, (B) a trailing six-month interest coverage ratio of at least 1.40:1.00 and (C) a current ratio of at least 1.25:1.00. |
| • | The facility contains other customary restrictive covenants which, among other things, govern the ability of Stendal to incur liens, sell assets, incur indebtedness, make investments, enter into joint ventures, change its business and issue, repurchase or redeem shares. The facility also contains customary events of default. |
Stendal Interest Rate Swap Contract
Stendal previously entered into variable-to-fixed interest rate swaps, referred to as the “Stendal Interest Rate Swap Contract”, at a fixed interest rate of 5.28%, which matures in September 2017 and, as at December 31, 2014, had a mark-to-market termination liability of $32.8 million.
34
Pursuant to the terms of the New Stendal Revolving Credit Facility, Stendal has provided €8.5 million as partial cash collateral for the Stendal Interest Rate Swap Contract. Further, the Stendal Interest Rate Swap Contract sharespari passu in the security for the New Stendal Revolving Credit Facility. For further information related to the Stendal Interest Rate Swap Contract, see “Quantitative and Qualitative Disclosures About Market Risk” and the notes to our consolidated financials included herein.
2019 and 2022 Senior Notes
InOn November 2010,26, 2014, we issued $300.0$250.0 million in aggregate principal amount of 9.5%7.000% Senior Notes due 2019, referred to as the “2019 Senior Notes”, and $400.0 million in aggregate principal amount of 7.750% Senior Notes due 2022, referred to as the “2022 Senior Notes” and, together with the 2019 Senior Notes, the “2019 and 2022 Senior Notes”, to refinance our outstanding 9.50% Senior Notes due 2017, referred to as the “Senior“2017 Senior Notes” to principally refinance our 9.25% Senior Notes due 2013,, Stendal’s senior €828.0 million project finance facility, referred to as the “2013 Senior Notes”“Prior Stendal Loan Facility”, and Stendal’s €17.0 million amortizing term facility, referred to as the “Blue Mill Facility” and, together with the Prior Stendal Loan Facility, the “Prior Stendal Facilities”. The Senior Notes bear interest at a rate of 9.5% per annum, payable semi-annually in arrears on December 1 and June 1, commencing June 1, 2011. The2019 Senior Notes mature on December 1, 2017. The2019 and interest on the 2019 Senior Notes are our senior unsecured obligationswill be payable semi-annually in arrears on each June 1 and accordingly, rank junior in rightDecember 1, commencing June 1, 2015. Interest will be payable to holders of payment to all existing and future secured indebtedness and all indebtedness and liabilitiesrecord of our subsidiaries, equal in right of payment with all of our existing and future unsecured senior indebtedness and senior in right of payment to any current or future subordinated indebtedness. Thethe 2019 Senior Notes were issued under an indenture which,on the immediately preceding May 15 and November 15 and will be computed on the basis of a 360-day year consisting of twelve 30-day months. The 2022 Senior Notes mature on December 1, 2022 and interest on the 2022 Senior Notes will be payable semi-annually in arrears on each June 1 and December 1, commencing June 1, 2015. Interest will be payable to holders of record of the 2022 Senior Notes on the immediately preceding May 15 and November 15 and will be computed on the basis of a 360-day year consisting of twelve 30-day months.
Commencing December 1, 2016, the 2019 Senior Notes will become redeemable at our option at a price equal to 103.500% of the principal amount redeemed and declining ratably on December 1 of each year thereafter to 100.000% on or after December 1, 2018. Commencing December 1, 2017, the 2022 Senior Notes will become redeemable at our option at a price equal to 105.813% of the principal amount redeemed and declining ratably on December 1 of each year thereafter to 100.000% on or after December 1, 2020.
The indentures governing the 2019 and 2022 Senior Notes contain covenants limiting, among other things, restricts our ability and the ability of our restricted subsidiaries under the indenture to: (i) incur additional indebtedness or issue preferred stock; (ii) pay dividends or make other distributions to our stockholders; (iii)shareholders; purchase or redeem capital stock or subordinated indebtedness; (iv) make investments; (v) create liens and enter into sale and lease back transactions; (vi)liens; incur restrictions on the ability of our restricted subsidiaries to pay dividends or make other payments to us; (vii) sell assets; (viii) consolidate or merge with or into other companies or transfer all or substantially all of our assets; and (ix) engage in transactions with affiliates. These limitationsAs of December 31, 2014, all of our subsidiaries are subjectrestricted subsidiaries.
The 2019 and 2022 Senior Notes are unsecured and are not guaranteed by any of our operating subsidiaries, all of which are located outside the United States. Our obligations under the 2019 and 2022 Senior Notes rank: effectively junior in right of payment to important qualificationsall of our existing and exceptions.
In orderfuture secured indebtedness, to take into account the natureextent of the non-recourse “project financing” of the loan facility for our Stendal millassets securing such indebtedness, and to enhance our financing flexibility, the indenture governing our Senior Notes provides for a “Restricted Group”all indebtedness and an “unrestricted group”. The terms of the indenture are applicable to the Restricted Group and are generally not applicable to the unrestricted group. Currently, the Restricted Group is comprised of Mercer Inc., the Rosenthal and Celgar mills and certain holding subsidiaries. The Restricted Group excludes our Stendal mill. The working capital facilities and Rosenthal Investment Loan at our Rosenthal and Celgar mills are obligations of the Restricted Group. The Stendal Loan Facility and Blue Mill Facility are obligationsliabilities of our unrestricted group.subsidiaries; equal in right of payment with all of our existing and future unsecured senior indebtedness; and senior in right of payment to any of our future subordinated indebtedness.
We have purchased and cancelled an aggregate of approximately $15.6As at December 31, 2014, $250.0 million in aggregate principal amount of our2019 Senior Notes in connection with our share and debt repurchase program. As at December 31, 2012, approximately $284.4$400.0 million in aggregate principal amount of 2022 Senior Notes remainedwere outstanding.
Stendal Loan Facility
In August 2002, Stendal entered into a senior €828.0 million project finance facility, referred to as the “Stendal Loan Facility”. The Stendal Loan Facility was comprised of several tranches which covered, among other things, project construction and development costs, financing and start-up costs and working capital, as well as the financing of the debt service reserve account, or “DSRA”, approved cost overruns and a revolving loan facility that covered time lags for receipt of grant funding and value-added tax refunds, which has been repaid. The DSRA is an account maintained to hold and, if needed, pay up to one year’s principal and interest due under the facility as partial security for the lenders. Other than the revolving working capital tranche, no further advances are currently available under the Stendal Loan Facility.
Pursuant to the Stendal Loan Facility, interest accrues at variable rates between Euribor plus 0.90% and Euribor plus 1.80% per year. The facility provides for Stendal to manage its risk exposure to interest rate risk, currency risk and pulp price risk by way of interest rate swaps, Euro and U.S. dollar swaps and pulp hedging transactions, subject to certain controls, including certain maximum notional and at-risk amounts. Pursuant to the terms of the facility, in 2002 Stendal entered into interest rate swap agreements in respect of borrowings to fix most of the interest costs under the Stendal Loan Facility at a rate of 5.28% plus an applicable margin, until final payment in October 2017.
The tranches are generally repayable in installments and the Stendal Loan Facility matures in September 2017.
In February 2009, we completed an agreement with Stendal’s lending syndicate to amend the Stendal Loan Facility, referred to as the “Amendment”. Pursuant to the Amendment, Stendal’s obligation to repay €164.0 million of scheduled principal payments, referred to as the “Deferred Amount”, is deferred until maturity of the facility in September 2017. Until the Deferred Amount is repaid in full, Stendal may not make distributions, in the form of interest and capital payments on shareholder debt or dividends on equity invested, to its shareholders, including us. The Amendment also provides for a 100% cash sweep, referred to as the “Cash Sweep”, of any excess cash of Stendal which will be used first to fund the DSRA to a level sufficient to service the amounts due and payable under the Stendal Loan Facility during the then following 12 months, or “Fully Funded”, and second to prepay the Deferred Amount. Not included in the Cash Sweep is an amount of €15.0 million which Stendal is permitted to retain for working capital purposes. The DSRA balance as at December 31, 2012 was approximately €33.0 million.
The Amendment implemented a permitted leverage ratio of total debt under the Stendal Loan Facility to EBITDA, or “Senior Debt/EBITDA Cover Ratio”, to be effective from December 31, 2009 and to decline over time from 13.0x on its effective date to 4.5x on June 30, 2017. Subsequently, Stendal’s lending syndicate waived compliance with the permitted leverage ratio for the year ended December 31, 2009. The Amendment also revised the Stendal Loan Facility’s annual debt service cover ratio, or “Annual Debt Ratio”, requirement to be at least 1.1x for the period from December 31, 2011 to December 31, 2013 and 1.2x from January 1, 2014 until maturity.
The Amendment includes the following as events of default:
|
if the DSRA is fully drawn and Stendal exercises its current six-month principal payment deferral right in respect of the next repayment date;
failure to meet the Senior Debt/EBITDA Cover Ratio or Annual Debt Ratio as set out above; or
if, from December 31, 2011 until the date the Stendal Loan Facility is fully repaid, Mercer Inc. raises proceeds from an equity financing (subject to certain exceptions) and the DSRA is not Fully Funded and if we fail to contribute the lesser of 50% of the net proceeds raised or €10.0 million to the capital of Stendal.
The Amendment provides that Stendal and its shareholders may, once per fiscal year, cure a deficiency in each of the Annual Debt Ratio or the Senior Debt/EBITDA Cover Ratio by way of a capital contribution or fully subordinated shareholder loan to Stendal in the amount necessary to cure such deficiency and thereby prevent the occurrence of an event of default. Our ability to fund this cure is substantially limited by the terms of the Senior Notes.
The tranches under the Stendal Loan Facility are severally guaranteed by German federal and state governments in respect of an aggregate of 80% of the principal amount of these tranches. Under the guarantees, the German federal and state governments that provide the guarantees are responsible for the performance of our payment obligations for the guaranteed amounts. Such governmental guarantees permit the Stendal Loan Facility to benefit from lower interest costs and other credit terms than would otherwise be unavailable. The Stendal Loan Facility is secured by substantially all of the assets of Stendal.
In order to permit Stendal to enter into the Blue Mill Facility (as described below), the Stendal Loan Facility was amended. In particular, the funds in the DSRA may now be used to bridge any deficiency in funding for Project Blue Mill, payments to Stendal’s capital reserves are no longer an equity cure measure under the Stendal Loan Facility and the Stendal Loan Facility now has a cross-default provision with the Blue Mill Facility.
In connection with the Stendal Loan Facility, we entered into a shareholders’ undertaking agreement, referred to as the “Undertaking”, dated August 26, 2002, as amended, with Stendal’s then minority shareholders
and the lenders in order to finance the shareholders’ contribution to the Stendal mill. Under the terms of the Undertaking, we have agreed, for as long as Stendal has any liability under the Stendal Loan Facility, to retain control over at least 51% of the voting shares of Stendal.
Since completion of the Stendal mill in September 2004, Stendal has repaid €215.0 million of the Stendal Loan Facility. As at December 31, 2012, the principal amount outstanding under the Stendal Loan Facility was €452.9 million.
Blue Mill Facility
In January 2012, our Stendal mill entered into the Blue Mill Facility, being a €17.0 million amortizing term facility, to finance Project Blue Mill. The Blue Mill Facility, 80% of which is guaranteed by the State of Saxony-Anhalt, bears interest at a rate of Euribor plus 3.5% per annum and is scheduled to mature in September 2017. The Blue Mill Facility’s annual debt service cover ratio and permitted ratio of total debt to EBITDA are identical to the Annual Debt Ratio and the Senior Debt/EBITDA Cover Ratio in the Stendal Loan Facility (including cure provisions). There is also a cross default for the Stendal Loan Facility. The Blue Mill Facility will be repaid in nine half-yearly installments, together with accrued interest commencing September 30, 2013 and will be non-recourse to Mercer Inc. This facility was undrawn as at December 31, 2012.
Rosenthal Loan Facilities
Our Rosenthal mill has the following credit facilities:
a €25.0 million revolving working capital facility that matures October 2016, referred to as the “Rosenthal Loan Facility”. The Rosenthal Loan Facility consists of a revolving credit facility which may be utilized by way of cash advances or advances by way of letter of credit or bank guarantees. The interest payable on cash advances is Euribor plus 3.5%, plus certain other costs incurred by the lenders in connection with the facility. Each cash advance is to be repaid on the last day of the respective interest period and in full on the termination date and each advance by way of a letter of credit or bank guarantee shall be repaid on the applicable expiry date of such letter of credit or bank guarantee. An interest period for cash advances shall be one, three or six months or any other period as Rosenthal and the lenders may determine. There is also a 1.1% per annum commitment fee on the unused and uncancelled amount of the revolving facility which is payable semi-annually in arrears. This facility is secured by a first ranking security interest on the inventories, receivables and accounts of Rosenthal. It also provides Rosenthal with a hedging facility relating to the hedging of the interest, currency and pulp prices as they affect Rosenthal pursuant to a strategy agreed to by Rosenthal and the lender from time to time. As at December 31, 2012, €23.7 million was available under this facility;
| • | a €25.0 million revolving working capital facility that matures October 2016, referred to as the “Rosenthal Loan Facility”. The Rosenthal Loan Facility consists of a revolving credit facility |
a €4.4 million investment loan, referred to as the “Rosenthal Investment Loan”, with a lender, relating to the purchase of a new wash press in 2009 at our Rosenthal mill. The four-year amortizing investment loan bears interest at the rate of Euribor plus 2.75%. Borrowings under this agreement are secured by the wash press equipment. As at December 31, 2012, the principal amount outstanding under the Rosenthal Investment Loan was €1.6 million; and35
which may be utilized by way of cash advances or advances by way of letter of credit or bank guarantees. The interest payable on cash advances is Euribor plus 3.5%, plus certain other costs incurred by the lenders in connection with the facility. Each cash advance is to be repaid on the last day of the respective interest period and in full on the termination date and each advance by way of a letter of credit or bank guarantee shall be repaid on the applicable expiry date of such letter of credit or bank guarantee. An interest period for cash advances shall be one, three or six months or any other period as Rosenthal and the lenders may determine. There is also a 0.90% per annum commitment fee on the unused and uncancelled amount of the revolving facility which is payable semi-annually in arrears. This facility is secured by a first ranking security interest on the inventories and receivables of Rosenthal. It also provides Rosenthal with a hedging facility relating to the hedging of the interest, currency and pulp prices as they affect Rosenthal pursuant to a strategy agreed to by Rosenthal and the lender from time to time. As at December 31, 2014, €0.4 million was supporting bank guarantees, leaving approximately €24.6 million available under this facility; and |
| • | a €5.0 million revolving credit facility for our Rosenthal mill which bears interest at the rate of the three-month Euribor plus 3.5%. Borrowings under this agreement are secured by certain land at the Rosenthal mill. The facility matures in December 2015. As at December 31, 2014, €1.1 million was supporting bank guarantees, leaving approximately €3.9 million available under this facility. |
a €3.5��million revolving credit facility for our Rosenthal mill which bears interest at the rate of Euribor plus 3.5%. The facility matures in December 2015. As at December 31, 2012, €2.5 million was available under this facility.
As of December 31, 2012, the total amount of funds available under the working capital facilities associated with the Rosenthal mill was €26.2 million.
Celgar Working Capital Facility
OurOn October 21, 2014, we amended our Celgar mill has amill’s C$40.0 million revolving working capital credit facility that matures May 2013,with Canadian Imperial Bank of Commerce, referred to as the “Celgar Working Capital Facility”. It, to extend its term and reduce certain costs thereunder. The Celgar Working Capital Facility matures on May 2, 2019 and is available by way of: (i) Canadian and U.S. denominated advances, which bear interest at a designated prime rate plus 2.0% for Canadian advances and at a
designated base rate plus 2.0% per annum, for U.S. advances; (ii) banker’s acceptance equivalent loans, which bear interest at the applicable Canadian dollar bankers’banker’s acceptance rate plus 3.75%1.50% per annum; and/orannum and (iii) U.S. dollar LIBOR advances, which bear interest at the applicable LIBOR plus 3.75%1.50% per annum. The Celgar Working Capital Facility also incorporatesfacility includes a C$3.0 million lettersub-limit for letters of credit sub line.credit. Celgar is also required to pay a 0.5%0.25% per annum standby fee monthly in arrears on any unutilized portionunused availability under the facility and 1.25% per annum on issued but undrawn letters of the revolving facility. Availabilitycredit. The availability of drawdowns under the facility is subject to a borrowing base limit that is based uponon the Celgar mill’s eligible accounts receivable and inventory levels from time to time. The Celgar Working Capital Facility is secured by, among other things, a first fixedpriority charge on the current assetsinventories and receivables of Celgar.
As at December 31, 2012, C$24.0 million The facility is guaranteed by Mercer Inc. and all material subsidiaries of funds were availableCelgar. The facility includes a springing financial covenant, which is measured when excess availability under the facility is less than C$5.0 million and which requires Celgar Working Capital Facility.to comply with a 1.10:1.00 fixed charge coverage ratio. The facility also contains restrictive covenants which, among other things, restrict the ability of Celgar to declare and pay dividends, incur indebtedness, incur liens and make payments on subordinated debt. The facility contains customary events of default.
Internet Availability and Additional Information
We make available free of charge on or through our website atwww.mercerint.com annual reports on Form 10-K, quarterly reports on Form 10-Q and current reports on Form 8-K, and all amendments to these reports, as soon as reasonably practicable after we file these materials with, or furnish these materials to, the SEC. The public may read and copy any material we file with the SEC at the SEC’s Public Reference Room at 100 F Street, NE, Washington, DC 20549. The public may also obtain information on the operation of the Public Reference Room by calling the SEC at 1-800-SEC-0330. The SEC maintains an internet site atwww.sec.gov that also contains our current and periodic reports, including our proxy and information statements.
36
All websites referred to herein are inactive textual references only, meaning that the information contained on such websites is not incorporated by reference herein and you should not consider information contained on such websites as part of this document unless expressly specified.
The statements in this “Risk Factors” section describe material risks to our business and should be considered carefully. You should review carefully the risk factors listed below, as well as those factors listed in other documents we file with the SEC. In addition, these statements constitute our cautionary statements under thePrivate Securities Litigation Reform Act of 1995.1995. Our disclosure and analysis in this annual report on Form 10-K and in our annual report to shareholders contain some forward-looking statements that set forth anticipated results based on management’s current plans and assumptions.
There are a number of important factors, many of which are beyond our control that could cause actual conditions, events or results to differ significantly from those described in the forward-looking statements. These factors include, but are not limited to, the following:
the highly cyclical nature of our business;
| • | the highly cyclical nature of our business; |
our level of indebtedness could negatively impact our financial condition and results of operations;
| • | our level of indebtedness could negatively impact our financial condition, results of operations and liquidity; |
a weakening of the global economy could adversely affect our business and financial results and have a material adverse effect on our liquidity and capital resources;
| • | a weakening of the global economy could adversely affect our business and financial results and have a material adverse effect on our liquidity and capital resources; |
cyclical fluctuations in the price and supply of our raw materials could adversely affect our business;
| • | cyclical fluctuations in the price and supply of our raw materials could adversely affect our business; |
we operate in highly competitive markets;
| • | we operate in highly competitive markets; |
we are exposed to currency exchange rate and interest rate fluctuations;
| • | we are exposed to currency exchange rate and interest rate fluctuations; |
we use derivatives to manage certain risks which has caused significant fluctuations in our operating results;
we are subject to extensive environmental regulation and we could have environmental liabilities at our facilities;
| • | we periodically use derivatives to manage certain risks which has caused significant fluctuations in our operating results; |
our business is subject to risks associated with climate change and social government responses thereto;
| • | we are subject to extensive environmental regulation and we could have environmental liabilities at our facilities; |
our operations require substantial capital and we may be unable to maintain adequate capital resources to provide for such requirements;
| • | our business is subject to risks associated with climate change and social and government responses thereto; |
future acquisitions may result in additional risks and uncertainties in our business;
| • | our new ERP system may cost more than expected, be delayed, fail to perform as planned and interrupt operational transactions during and following the implementation, which could adversely affect our operations and results of operations; |
changes in credit ratings issued by nationally recognized statistical rating organizations could adversely affect our cost of financing and have an adverse effect on the market price of our securities;
| • | our operations require substantial capital and we may be unable to maintain adequate capital resources to provide for such requirements; |
Project Blue Mill might not generate the results we expect;
| • | future acquisitions may result in additional risks and uncertainties in our business; |
we are subject to risks related to our employees;
| • | changes in credit ratings issued by nationally recognized statistical rating organizations could adversely affect our cost of financing and have an adverse effect on the market price of our securities; |
we rely on German federal and state government grants and guarantees and participate in European statutory programs;
| • | we are subject to risks related to our employees; |
we are dependent on key personnel;
| • | we rely on German federal and state government grants and participate in German and European statutory energy programs; |
we may experience material disruptions to our production;
| • | we are dependent on key personnel; |
if our long-lived assets become impaired, we may be required to record non-cash impairment that could have a material impact on our results of operations;37
| • | we may experience material disruptions to our production (including as a result of, among other things, planned and unplanned maintenance shutdowns); |
we may incur losses as a result of unforeseen or catastrophic events, including the emergence of a pandemic, terrorist attacks or natural disasters;
| • | if our long-lived assets become impaired, we may be required to record non-cash impairment that could have a material impact on our results of operations; |
our insurance coverage may not be adequate;
| • | we may incur losses as a result of unforeseen or catastrophic events, including the emergence of a pandemic, terrorist attacks or natural disasters; |
we rely on third parties for transportation services; and
| • | our insurance coverage may not be adequate; |
| • | we rely on third parties for transportation services; |
the price of our common stock may be volatile.
| • | failures or security breaches of our information technology systems could disrupt our operations and negatively impact our business; |
| • | the price of our common stock may be volatile; and |
| • | a small number of our shareholders could significantly influence our business. |
From time to time, we also provide forward-looking statements in other materials we release as well as oral forward-looking statements. Such statements give our current expectations or forecasts of future events; they do not relate strictly to historical or current facts.
Statements in the future tense, and all statements accompanied by terms such as “may”, “will”, “believe”, “project”, “expect”, “estimate”, “assume”, “intend”, “design”, “anticipate”, “plan”, “should” and variations thereof and similar terms are intended to be forward-looking statements as defined by federal securities law. You can find examples of these statements throughout this annual report on Form 10-K, including in the description of business in “Item 1. Business” and “Item 7. Management’s Discussion and Analysis of Financial Condition and Results of Operations”. While these forward-looking statements reflect our best estimates when made, the following risk factors could cause actual results to differ materially from estimates or projections.
We intend that all forward-looking statements we make will be subject to safe harbor protection of the federal securities laws pursuant to Section 27A of theSecurities Act of 1933,, as amended, (thereferred to as the “Securities Act”), and Section 21E of theSecurities Exchange Act of 1934,, as amended, (thereferred to as the “Exchange Act”).
You should consider the limitations on, and risks associated with, forward-looking statements and not unduly rely on the accuracy of predictions contained in such forward-looking statements. As noted above, these forward-looking statements speak only as of the date when they are made. We do not undertake any obligation to update forward-looking statements to reflect events, circumstances, changes in expectations, or the occurrence of unanticipated events after the date of those statements. Moreover, in the future, we may make forward-looking statements that involve the risk factors and other matters described in this document as well as other risk factors subsequently identified.
Our business is highly cyclical in nature.
The pulp business is highly cyclical in nature and markets are characterized by periods of supply and demand imbalance, which in turn affects prices. Pulp markets are highly competitive and are sensitive to cyclical changes in the global economy, industry capacity and foreign exchange rates, all of which can have a significant influence on selling prices and our operating results. The length and magnitude of industry cycles have varied over time but generally reflect changes in macro-economic conditions and levels of industry capacity. Pulp is a commodity that is generally available from other producers. Because commodity products have few distinguishing qualities from producer to producer, competition is generally based upon price, which is generally determined by supply relative to demand.
38
Industry capacity can fluctuate as changing industry conditions can influence producers to idle production capacity or permanently close mills. In addition, to avoid substantial cash costs in idling or closing a mill, some producers will choose to operate at a loss, sometimes even a cash loss, which can prolong weak pricing environments due to oversupply. Oversupply of our products can also result from producers introducing new capacity in response to favorable pricing trends. Certain integrated pulp and paper producers have the ability to discontinue paper production by idling their paper machines and selling their NBSK pulp production on the market, if market conditions, prices and trends warrant such actions.
By the end of 2014, the global supply of bleached hardwood kraft pulp increased by approximately 1.6 million ADMTs, primarily from South America. This increase in bleached hardwood kraft pulp is largely targeted at the growing demand for pulp in developing markets, particularly in China, by producers of tissues, specialty papers and packaging. If such additional bleached hardwood kraft pulp supply is not absorbed by such demand growth, as a result of generally lower prices for bleached hardwood kraft pulp, this supply increase could put downward pressure on NBSK pulp prices.
Demand for pulp has historically been determined primarily by general global macroeconomic conditions and has been closely tied to overall business activity. From 2006 to mid-2008,NBSK pulp prices steadily improved. However, the global economic crisiscan fluctuate widely over time. Between 2005 and 2014, European list prices for NBSK pulp have fluctuated between a low of approximately $575 per ADMT in the latter half of 2008 resulted in a sharp decline of pulp prices from2009 to a high of €900$1,030 per ADMT to €635 per ADMT at the end of 2008. Pulp prices began to increase in the second half of 2009 and continued to increase to record levels through June of 2010, before declining slightly in the fourth quarter of 2010. Pulp prices again rebounded to record levels in2011.
In the first half of 2011, pulp prices were near record levels but declined sharply in the latter part of the year and into 2012, primarily due to economic uncertainty in Europe and credit tightening in China. Economic uncertainty in Europe and China, respectively, impacted both demand and prices. In 2012, list prices were on average approximately 15% lower than 2011. At the end of 2012, list prices for NBSK pulp were approximately $810 per ADMT in Europe, $870 per ADMT in North America and $655 per ADMT in China. At the end of 2013, list prices were approximately $905 per ADMT in Europe, $990 per ADMT in North America and $750 per ADMT in China. In 2014, list prices were on average approximately 7% higher than 2013. At the end of 2014, list prices in Europe were approximately $935 per ADMT and in North America and China were approximately $1,020 and $700 per ADMT, respectively.
A producer’s actual sales price realizations are list prices net of customer discounts, rebates and other selling concessions. Over the last three years, these have increased as producers compete for customers and sales. Our sales price realizations may also be affected by NBSK price movements between the order and shipment dates.
Accordingly, prices for pulp are driven by many factors outside our control, and we have little influence over the timing and extent of price changes, which are often volatile. Because market conditions beyond our control determine the price for pulp, prices may fall below our cash production costs, requiring us to either incur short-term losses on product sales or cease production at one or more of our mills. Therefore, our profitability depends on managing our cost structure, particularly raw materials which represent a significant component of our operating costs and can fluctuate based upon factors beyond our control. If the prices of our products decline, or if prices for our raw materials increase, or both, our results of operations and cash flows could be materially adversely affected.
Our level of indebtedness could negatively impact our financial condition and results of operations.
As of December 31, 2012,2014, we had approximately €711.4$687.5 million of indebtedness outstanding, of which €452.9 million relates to the Stendal Loan Facility.outstanding. We may also incur additional indebtedness in the future. Our high debt levels may have important consequences for us, including, but not limited to the following:
| • | our ability to obtain additional financing for working capital, capital expenditures, general corporate and other purposes or to fund future operations may not be available on terms favorable to us or at all; |
39
| • | a significant amount of our operating cash flow is dedicated to the payment of interest and principal on our indebtedness, thereby diminishing funds that would otherwise be available for our operations and for other purposes; |
| • | increasing our vulnerability to current and future adverse economic and industry conditions; |
| • | a substantial decrease in net operating cash flows or increase in our expenses could make it more difficult for us to meet our debt service requirements, which could force us to modify our operations; |
| • | our leveraged capital structure may place us at a competitive disadvantage by hindering our ability to adjust rapidly to changing market conditions or by making us vulnerable to a downturn in our business or the economy in general; |
| • | causing us to offer debt or equity securities on terms that may not be favorable to us or our shareholders; |
| • | limiting our flexibility in planning for, or reacting to, changes and opportunities in our business and our industry; and |
| • | our level of indebtedness increases the possibility that we may be unable to generate cash sufficient to pay the principal or interest due in respect of our indebtedness. |
The indentures that govern our operating cash flow is dedicated to the payment of interest2019 and principal on our indebtedness, thereby diminishing funds that would otherwise be available for our operations and for other purposes;
increasing our vulnerability to current and future adverse economic and industry conditions;
a substantial decrease in net operating cash flows or increase in our expenses could make it more difficult for us to meet our debt service requirements, which could force us to modify our operations;
our leveraged capital structure may place us at a competitive disadvantage by hindering our ability to adjust rapidly to changing market conditions or by making us vulnerable to a downturn in our business or the economy in general;
causing us to offer debt or equity securities on terms that may not be favorable to us or our shareholders;
limiting our flexibility in planning for, or reacting to, changes and opportunities in our business and our industry; and
our level of indebtedness increases the possibility that we may be unable to generate cash sufficient to pay the principal or interest due in respect of our indebtedness.
The indenture governing our2022 Senior Notes and our bank credit facilities contain restrictive covenants which impose operating and other restrictions on us and our subsidiaries. These restrictions will affect, and in many respects will limit or prohibit, our ability to, among other things, incur or guarantee additional indebtedness, or enter into sale/leaseback transactions, pay dividends or make distributions on capital stock or redeem or repurchase capital stock, make investments or acquisitions, create liens and enter into mergers, consolidations or transactions with affiliates. The terms of our indebtedness also restrict our ability to sell certain assets, apply the proceeds of such sales and reinvest in our business.
Certain of the agreements governing our indebtedness including the Stendal Loan Facility, have covenants that require us to maintain prescribed financial ratios and tests. Failure to comply with such covenants could result in events of default and could have a material adverse effect on our liquidity, results of operations and financial condition.
Our ability to repay or refinance our indebtedness will depend on our future financial and operating performance. Our performance, in turn, will be subject to prevailing economic and competitive conditions, as well as financial, business, legislative, regulatory, industry and other factors, many of which are beyond our control. Our ability to meet our future debt service and other obligations in particular the Stendal Loan Facility, may depend in significant part on the extent to which we can implement successfully our business strategy. We cannot assure you that we will be able to implement our strategy fully or that the anticipated results of our strategy will be realized. Over the next several years, we will require financing to refinance maturing debt obligations (unless extended), and such refinancing may not be available on favorable terms or at all.
A weakening of the global economy could adversely affect our business and financial results and have a material adverse effect on our liquidity and capital resources.
Principally, as pulp demand has historically been determined by general global macroeconomic activities, demand and prices for our product have historically decreased substantially during economic slowdowns. For example, economic weakness in Europe since the 2008 global financial crisis has adversely affected demand for pulp. Additionally, restricted credit availability restrains our customers’ ability or willingness to purchase our products resulting in lower revenues. Depending on their severity and duration, the effects and consequences of a global economic downturn could have a material adverse effect on our liquidity and capital resources, including our ability to raise capital, if needed, and otherwise negatively impact our business and financial results.
40
Cyclical fluctuations in the price and supply of our raw materials could adversely affect our business.
Our main raw material is fiber in the form of wood chips and pulp logs. Such fiber is cyclical in terms of both price and supply. The cost of wood chips and pulp logs is primarily affected by the supply and demand for lumber. Demand for these raw materials is generally determined by the volume of pulp and paper products produced globally and regionally. Since 2006, generally higher energy prices and a focus on, and governmental initiatives related to, “green” or renewable energy have led to an increase in renewable energy projects in Europe, including Germany. Demand for wood residuals from such energy producers, combined with lower harvesting rates, has generally put upward pressure on prices for wood residuals, such as wood chips, in Germany and its neighboring countries. This has resulted in higher fiber costs for our German mills and such trend could continue to put further upward pressure on wood chip prices. Wood chip supply in Germany was stable during the course of 2014 due to stable sawmill production and lower demand from pellet producers and board manufacturers; however, there is no assurance that wood chip supply will continue to be stable.
Similarly, North American sawmill activity declined significantly during the recession, reducing the supply of chips and availability of pulp logs to our Celgar mill. Additionally, North American energy producers are exploring the viability of renewable energy initiatives and governmental initiatives in this field are increasing, all of which could lead to higher demand for sawmill residual fiber, including chips. A recovery in U.S. housing starts, which commenced in the latter part of 2012 and continued in 2013, resulted in increased sawmill activity. This increased the supply of wood chips for the Celgar mill and reduced its need for pulp logs, which are generally a higher cost for the mill than wood chips. Sawmill activity remained stable in Canada during 2014; however, there is no assurance that sawmill activity will continue to remain stable. The cyclical nature of pricing for these raw materials represents a potential risk to our profit margins if pulp producers are unable to pass along price increases to their customers or we cannot offset such costs through higher prices for our surplus energy.
We do not own any timberlands or have any material long-term governmental timber concessions and we currently have few long-term fiber contracts at our German operations. Raw materials are available from a number of suppliers and we have not historically experienced material supply interruptions or substantial sustained price increases. However, our requirements have increased and may continue to do so as we expand capacity through capital projects or other efficiency measures at our mills. As a result, we may not be able to purchase sufficient quantities of these raw materials to meet our production requirements at prices acceptable to us during times of tight supply. In addition, the quantity, quality and price of fiber we receive could be affected as a result of industrial disputes, material curtailments or shut-down of operations by suppliers, government orders and legislation (including new taxes or tariffs), weather conditions, acts of God and other events beyond our control. An insufficient supply of fiber or reduction in the quality of fiber we receive would materially adversely affect our business, financial condition, results of operations and cash flow. In addition to the supply of wood fiber, we are dependent on the supply of certain chemicals and other inputs used in our production facilities. Any disruption in the supply of these chemicals or other inputs could affect our ability to meet customer demand in a timely manner and could harm our reputation. Any material increase in the cost of these chemicals or other inputs could have a material adverse effect on our business, results of operations, financial condition and cash flows.
We operate in highly competitive markets.
We sell our pulp globally, with a large percentage sold in Europe, North America and Asia. The markets for pulp are highly competitive. A number of other global companies compete in each of these markets and no company holds a dominant position. Our pulp is considered a commodity because many companies produce similar and largely standardized products. As a result, the primary basis for competition in our markets has been price. Many of our competitors have greater resources and lower leverage than we do and may be able to adapt more quickly to industry or market changes or devote greater resources to the sale of products than we can. There can be no assurance that we will continue to be competitive in the future. Prices for our products are affected by many factors outside of our control and we have no influence over the timing and extent of price changes, which
41
are often volatile. Our profitability with respect to these products depends, in part, on managing our costs, particularly raw material and energy costs which represent significant components of our operating costs and can fluctuate based upon factors beyond our control.
The global pulp market has historically been characterized by considerable swings in prices which have and will result in variability in our earnings. Prices are typically denominated in U.S. dollars.
We are exposed to currency exchange rate and interest rate fluctuations.
The majority of our sales are in products quoted in U.S. dollars while mostMost of our operating costs and expenses, other than those of the Celgar mill, are incurred in Euros. In addition, allEuros while the majority of theour sales are in products sold by the Celgar mill are quoted in U.S. dollars anddollars. In addition, the Celgar mill costs are primarily incurred in Canadian dollars and the pulp sold by the Celgar mill is quoted in U.S. dollars. Our results of operations and financial condition are reported in Euros.U.S. dollars. As a result, our revenuesexpenses are adversely affected by a decrease in the value of the U.S. dollar relative to the Euro and to the Canadian dollar. Such shifts in currencies relative to the Euro and the Canadian dollar reduce our operating margins and the cash flow available to fund our operations and to service our debt. This could have a material adverse effect on our business, financial condition, results of operations and cash flows.
In 2002, Stendal entered into variable-to-fixed interest rate swaps to fix interest paymentsInterest on borrowings under the Stendal Loan Facility, which has kept Stendal from benefiting from the general declineour revolving credit facilities are at “floating” rates. As a result, increases in interest rates that ensued. These derivatives are marked to market at the endwill increase our costs of each reporting periodborrowing and all unrealized gains and losses are recognized as earnings or losses for the relevant reporting periods.reduce our operating margins.
We periodically use derivatives to manage certain risk which has caused significant fluctuations in our operating results.
We use derivative instruments to limit our exposure to interest rate and pulp price fluctuations. Concurrently with enteringIn 2002, Stendal entered into the Stendal financing, Stendal entered into variable-to-fixed rateInterest Rate Swap Contract to fix interest swaps forpayments under the full term of ourPrior Stendal Loan Facility, to manage itswhich for several years prevented Stendal from benefiting from the general decline in interest rate risk exposure with respect to the full principal amount of this facility.rates that ensued. Because we effectively fixed the rate on our Prior Stendal Loan Facility, the value of our derivative position moves inversely to interest rates. We have also recently entered into fixed price pulp swap contracts with a bank.The Stendal Interest Rate Swap Contract remains in place after the Prior Stendal Loan Facility was repaid.
We record unrealized gains or losses on our derivative instruments when they are marked to market at the end of each reporting period and realized gains or losses on them when they are settled. These unrealized and realized gains and losses can materially impact our operating results for any reporting period.
If any of the variety of instruments and strategies we utilize are not effective, we may incur losses which may have a materially adverse effect on our business, financial condition, results of operations and cash flow. The purpose of our derivative activity may also be considered speculative in nature; we do not use these instruments with respect to any pre-set percentage of revenues or other formula, but either to augment our potential gains or reduce our potential losses depending on our perception of future economic events and developments.
We are subject to extensive environmental regulation and we could have environmental liabilities at our facilities.
Our operations are subject to numerous environmental laws and regulations as well as permits, guidelines and policies. These laws, regulations, permits, guidelines and policies govern, among other things:
unlawful discharges to land, air, water and sewers;
| • | unlawful discharges to land, air, water and sewers; |
waste collection, storage, transportation and disposal;
| • | waste collection, storage, transportation and disposal; |
hazardous waste;
| • | hazardous waste; |
dangerous goods and hazardous materials and the collection, storage, transportation and disposal of such substances;
| • | dangerous goods and hazardous materials and the collection, storage, transportation and disposal of such substances; |
| • | the clean-up of unlawful discharges; |
land use planning;42
| • | land use planning; |
municipal zoning; and
| • | municipal zoning; and |
employee health and safety.
| • | employee health and safety. |
In addition, as a result of our operations, we may be subject to remediation, clean-up or other administrative orders or amendments to our operating permits, and we may be involved from time to time in administrative and judicial proceedings or inquiries. Future orders, proceedings or inquiries could have a material adverse effect on our business, financial condition and results of operations. Environmental laws and land use laws and regulations are constantly changing. New regulations or the increased enforcement of existing laws could have a material adverse effect on our business and financial condition. In addition, compliance with regulatory requirements is expensive, at times requiring the replacement, enhancement or modification of equipment, facilities or operations. There can be no assurance that we will be able to maintain our profitability by offsetting any increased costs of complying with future regulatory requirements.
We are subject to liability for environmental damage at the facilities that we own or operate, including damage to neighboring landowners, residents or employees, particularly as a result of the contamination of soil, groundwater or surface water and especially drinking water. The costs of such liabilities can be substantial. Our potential liability may include damages resulting from conditions existing before we purchased or operated these facilities. We may also be subject to liability for any offsite environmental contamination caused by pollutants or hazardous substances that we or our predecessors arranged to transport, treat or dispose of at other locations. In addition, we may be held legally responsible for liabilities as a successor owner of businesses that we acquire or have acquired. Except for Stendal, our facilities have been operating for decades and we have not done invasive testing to determine whether or to what extent any such environmental contamination exists. As a result, these businesses may have liabilities for conditions that we discover or that become apparent, including liabilities arising from non-compliance with environmental laws by prior owners. Because of the limited availability of insurance coverage for environmental liability, any substantial liability for environmental damage could materially adversely affect our results of operations and financial condition.
Enactment of new environmental laws or regulations or changes in existing laws or regulations might require significant capital expenditures. We may be unable to generate sufficient funds or access other sources of capital to fund unforeseen environmental liabilities or expenditures.
Our business is subject to risks associated with climate change and social and government responses thereto.
Currently, there are differing scientific studies and opinions relating to the severity, extent and speed at which climate change is or may be occurring around the world. As a result, we are currently unable to identify and predict all of the specific consequences of climate change on our business and operations.
To date, the potential and/or perceived effects of climate change and social and government responses to it have created both opportunities, such as enhanced sales of surplus “green” energy, and risks for our business.
While all of the specific consequences from climate change are not yet predictable, we are subject to risks thatIn Germany, government and social focus on and demand for “carbon neutral” or “green” energy will createhas created greater demand and competition for the wood residuals or fiber that is consumed by our pulp mills as part of their production process. This has helped drive up the cost of fiber for German mills. In addition, further or new governmental initiatives or legislation may also increase both the demand and prices for wood residuals. As governments pursue green“green” energy initiatives, they may implement financial, tax, pricing or other legislated incentives for renewable energy producers that “cannibalize” or materially adversely affect fiber supplies for existing traditional users, such as lumber and pulp and paper producers.
Such additional demand for wood residuals and/or governmental initiatives may materially increase the competition and prices for wood residuals over time. This could increase our fiber costs and/or restrict our ability to acquire fiber at competitive prices or at all during times of shortages. If our fiber costs increase and we cannot pass on these costs to our customers or offset them through higher prices for our sales of surplus energy, it will
43
negatively affect our operating margins, results of operations and financial position. If we cannot obtain the fiber required to operate our mills, we may have to curtail and/or shut down production. This could have a material adverse effect on operations, financial results and financial position.
Other potential risks to our business from climate change include:
a greater susceptibility of northern softwood forest to disease, fire and insect infestation, which could diminish fiber availability;
| • | a greater susceptibility of northern softwood forests to disease, fire and insect infestation, which could diminish fiber availability; |
the disruption of transportation systems and power supply lines due to more severe storms;
| • | the disruption of transportation systems and power supply lines due to more severe storms; |
the loss of water transportation for logs and our finished goods inventories due to lower water levels;
| • | the loss of water transportation for logs due to lower water levels; |
decreases in quantity and quality of processed water for our mill operations;
| • | decreases in the quantity and quality of processed water for our mill operations; |
| • | the loss of northern softwood forests in areas in sufficient proximity to our mills to competitively acquire fiber; and |
the loss of northern softwood boreal forests in areas in sufficient proximity to our mills to competitively acquire fiber; and
lower harvest levels decreasing the supply of harvestable timber and, as a consequence, wood residuals.
| • | lower harvest levels decreasing the supply of harvestable timber and, as a consequence, wood residuals. |
The occurrence of some or all of these events could have a material adverse effect on our operations and/or financial results.
Our new ERP system may cost more than expected, be delayed, fail to perform as planned or interrupt operational transactions during and following the implementation, which could adversely affect our operations and results of operations.
In January 2014, we commenced the implementation of a new ERP solution to replace our existing business software applications at a total estimated cost of $12.0 million. The project is designed to be completed in stages over the next two years. Such projects are inherently complex, resource intensive and lengthy. As a result, we could experience unplanned or unforeseen issues that could adversely affect the project, our business and/or our results of operations, including:
| • | costs of implementation that materially exceed our expectation; |
| • | delays in the go-live of one or more of the stages of the project, resulting in additional costs or time for completion; |
| • | errors in implementation resulting in errors in the commencement or reporting of business transactions; |
| • | failure in the deliverables of our key partners, suppliers and implementation advisors, resulting in an inferior product, reduced business efficacy and the project not providing expected benefits; |
| • | deficiencies in the training of employees in the use of the new solution, resulting in errors in the recording of data or transactions, leading to delays in input deliveries and production impairment; |
| • | a control failure during or post implementation, which may result in a material weakness in our internal controls over financial reporting; and |
| • | other implementation issues leading to delays and impacts on our business. |
Our operations require substantial capital and we may be unable to maintain adequate capital resources to provide for all of our capital requirements.
Our business is capital intensive and requires that we regularly incur capital expenditures to maintain our equipment, improve efficiencies and, as a result of changes to environmental regulations that require capital
44
expenditures, bring our operations into compliance with such regulations. In addition, our senior management and board of directors may approve projects in the future that will require significant capital expenditures. Increased capital expenditures could have a material adverse effect on our cash flow and our ability to satisfy our debt obligations. If our available cash resources and cash generated from operations are not sufficient to fund our operating needs and capital expenditures, we would have to obtain additional funds from borrowings or other available sources or reduce or delay our capital expenditures. RecentThe global financial crisis in 2008 adversely affected global credit conditions, and thecaused a downturn in the global economy haveand resulted in a significant declinetightening in the credit markets and the overall availability of credit. Our indebtedness could adversely affect our financial health, limit our operations andor impair our ability to raise additional capital. If this occurs, we may not be able to obtain additional funds on favorable terms or at all. If we cannot maintain or upgrade our equipment as may be required from time to time, we may become unable to manufacture products that compete effectively. An inability to make required capital expenditures in a timely fashion could have a material adverse effect on our growth, business, financial condition or results of operations.
Future acquisitions may result in additional risks and uncertainties in our business.
In order to grow our business, we may seek to acquire additional assets or companies. Our ability to pursue selective and accretive acquisitions will be dependent on management’s ability to identify, acquire, and develop suitable acquisition targets in both new and existing markets, but, in certain circumstances, acceptable acquisition targets might not be available. In pursuing acquisition and investment opportunities, we face competition from other companies having similar growth strategies, many of which may have substantially greater resources than us. Competition for these acquisitions or investment targets could result in increased acquisition or investment prices, higher risks and a diminished pool of businesses or assets available for acquisition.
Acquisitions also frequently result in recording of goodwill and other intangible assets, which are subject to potential impairments in the future that could have a material adverse effect on our operating results. Furthermore, the costs of integrating acquired businesses (including restructuring charges associated with the acquisitions, as well as other acquisition costs, such as accounting fees, legal fees and investment banking fees) could significantly impact our operating results.
Although we perform diligence on the businesses we purchase, in light of the circumstances of each transaction, an unavoidable level of risk remains regarding the actual condition of these businesses. We may not be able to ascertain the value or understand the potential liabilities of the acquired businesses and their operations until we assume operating control of the assets and operations of these businesses.
Furthermore, any future acquisitions of businesses or facilities could entail a number of risks, including:
problems with the effective integration of operations;
| • | problems with the effective integration of operations; |
inability to maintain key pre-acquisition business relationships;
| • | inability to maintain key pre-acquisition business relationships; |
increased operating costs;
| • | increased operating costs; |
exposure to substantial unanticipated liabilities; and
| • | exposure to substantial unanticipated liabilities; and |
difficulties in realizing projected efficiencies, synergies and cost savings.
| • | difficulties in realizing projected efficiencies, synergies and cost savings. |
In addition, geographic and other expansions, acquisitions or joint ventures may require significant managerial attention, which may be diverted from our other operations. If we are unsuccessful in overcoming these risks, our business, financial condition or results of operations could be materially and adversely affected.
Changes in credit ratings issued by nationally recognized statistical rating organizations could adversely affect our cost of financing and have an adverse effect on the market price of our securities.
Credit rating agencies rate our debt securities on factors that include our operating results, actions that we take, their view of the general outlook for our industry and their view of the general outlook for the economy.
45
Actions taken by the rating agencies can include maintaining, upgrading or downgrading the current rating or placing the company on a watch list for possible future downgrading. Downgrading the credit rating of our debt securities or placing us on a watch list for possible future downgrading could limit our access to the credit markets, increase our cost of financing and have an adverse effect on the market price of our securities.securities, including the 2019 and 2022 Senior Notes.
Project Blue Mill may not generate the results or benefits we expect.
Project Blue Mill is subject to customary risks and uncertainties inherent for large capital projects which could result in the project not completing on schedule or as budgeted. The Stendal mill could experience operating difficulties or delays during the start-up period when the new 40 MW turbine is being ramped up. Project Blue Mill may not increase the Stendal mill’s pulp production and energy generating capacity to the levels we had planned. Cost overruns, equipment breakdowns or failures to perform to design specifications could have a material adverse effect on our Stendal mill’s results of operations and financial performance.
We are subject to risks related to our employees.
The majority of our employees are unionized and we have collective agreements in place with our employees at all of our mills. Although we have not experienced any work stoppages in the past, there can be no assurance that we will be able to negotiate acceptable collective agreements or other satisfactory arrangements with our employees upon the expiration of our collective agreements. This could result in a strike or work stoppage by the affected workers. The registration or renewal of the collective agreements or the outcome of our wage negotiations could result in higher wages or benefits paid to union members. Accordingly, we could experience a significant disruption of our operations or higher on-going labor costs, which could have a material adverse effect on our business, financial condition, results of operations and cash flow. In addition, whenever we seek to reduce workforce at any of our mills, the affected mill’s labor force could seek to hinder or delay such actions, we could incur material severance or other costs, and our operations could be disrupted.
We rely on government grants and guarantees and participate in European statutory programs.
We currently benefit from a subsidized capital expenditure program and lower cost of financing as a result of German federal and state government grants and guarantees at our Stendal mill.grants. Should either the German federal or state governments be prohibited from honoring legislative grants, and guarantees at Stendal, or should we be required to repay any such legislative grants, this may have a material adverse effect on our business, financial condition, results of operations and cash flow.
Since 2005, our German mills have benefittedbenefited from sales of emission allowances under the EU ETS. As a result ofSince our Rosenthal and Stendal mills’ eligibility forGerman mills receive stipulated special tariffs under the Renewable Energy Act, the amount of emissions allowances granted to our German mills under the EU ETS has been reduced. Additionally, all such German legislation isemission allowances are subject to statutory amendment or change in the future.
In 2014, in response to an investigation by the European Commission into whether portions of the Renewable Energy Act constituted unpermitted state aid, the German government amended the Renewable Energy Act. As a result of such amendment, our operations at Rosenthal and Stendal are grand-fathered under a program which could adversely affect(i) allows the eligibility of our Rosenthal and Stendal mills, as “existing installations”, to participatecontinue to sell “green” energy into the market at stipulated prices or “tariffs” and (ii) provides an exemption from certain tariffs on consumption of our own energy that we generate, or “auto-generation”. The grand-fathering of the auto-generation tariff exemption under the Renewable Energy Act is set to be re-considered in this statutory program and/2017. Our costs of energy for our operations in Germany could increase in the event of any of the following: (a) the auto-generation tariff exemption is removed or reduced in the future, (b) our auto-generation is no longer grand-fathered under the Renewable Energy Act or (c) we acquire or develop new operations that do not benefit from the auto-generation tariff exemption. Additionally, if the stipulated tariffs paid thereunder. Asfor energy currently sold by our mills are reduced or we acquire or develop new operations that are not entitled to the same favorable pricing, our energy sales in Germany may not be as profitable. Any of the foregoing situations or any combination of them could have a result we cannot predict with any certainty the amountmaterial adverse effect on our results of future sales of surplus energy we may be able to generate.operations.
We are dependent on key personnel.
Our future success depends, to a large extent, on the efforts and abilities of our executive and senior mill operating officers. Such officers are industry professionals many of whom have operated through multiple business cycles. Our officers play an integral role in, among other things:
| • | sales and marketing; |
reducing operating costs;
identifying capital projects which provide a high rate of return; and46
| • | reducing operating costs; |
| • | identifying capital projects which provide a high rate of return; and |
prioritizing expenditures and maintaining employee relations.
| • | prioritizing expenditures and maintaining employee relations. |
The loss of one or more of our officers could make us less competitive in these areas which could materially adversely affect our business, financial condition, results of operations and cash flows. We do not maintain any key person life insurance for any of our executive or senior mill operating officers.
We may experience material disruptions to our production.
A material disruption at one of our manufacturing facilities could prevent us from meeting customer demand, reduce our pulp and energy sales and/or negatively impact our results of operations. Any of our mills could cease operations unexpectedly due to a number of events, including:
unscheduled maintenance outages;
| • | unscheduled maintenance outages; |
prolonged power failures;
| • | prolonged power failures; |
equipment failure;
| • | equipment failure; |
employee errors or failures;
| • | employee errors or failures; |
design error or employee or contractor error;
| • | design error or employee or contractor error; |
chemical spill or release;
| • | chemical spill or release; |
explosion of a boiler;
| • | explosion of a boiler; |
disruptions in the transportation infrastructure, including roads, bridges, railway tracks, tunnels, canals and ports;
| • | disruptions in the transportation infrastructure, including roads, bridges, railway tracks, tunnels, canals and ports; |
fires, floods, earthquakes or other natural catastrophes;
| • | fires, floods, earthquakes or other natural catastrophes; |
prolonged supply disruption of major inputs;
| • | prolonged supply disruption of major inputs; |
labor difficulties; and
| • | labor difficulties; |
| • | capital projects that require temporary cost increases or curtailment of production; and |
other operational problems.
| • | other operational problems. |
Any such downtime or facility damage could prevent us from meeting customer demand for our products and/or require us to make unplanned capital expenditures. If any of our facilities were to incur significant downtime, our ability to meet our production capacity targets and satisfy customer requirements would be impaired and could have a material adverse effect on our business, financial condition, results of operations and cash flows.
If our long-lived assets become impaired, we may be required to record non-cash impairment charges that could have a material impact on our results of operations.
We review the carrying value of long-lived assets for impairment when events or changes in circumstances indicate that the carrying amount of the assets may not be recoverable. Should the markets for our products deteriorate or should we decide to invest capital differently or should other cash flow assumptions change, it is possible that we will be required to record non-cash impairment charges in the future that could have a material adverse effect on our results of operations.
We may incur losses as a result of unforeseen or catastrophic events, including the emergence of a pandemic, terrorist attacks or natural disasters.
The occurrence of unforeseen or catastrophic events, including the emergence of a pandemic or other widespread health emergency (or concerns over the possibility of such an emergency), terrorist attacks or natural
47
disasters, could create economic and financial disruptions and could lead to operational difficulties (including travel limitations) that could impair our ability to manage or operate our business and adversely affect our results of operations.
Our insurance coverage may not be adequate.
We have obtained insurance coverage that we believe would ordinarily be maintained by an operator of facilities similar to our mills. Our insurance is subject to various limits and exclusions. Damage or destruction to our facilities could result in claims that are excluded by, or exceed the limits of, our insurance coverage. Additionally, the weak global and financial markets have also reduced the availability and extent of credit insurance for our customers. If we cannot obtain adequate credit insurance for our customers, we may be forced to amend or curtail our planned operations which could negatively impact our sales revenues, results of operations and financial position.
We rely on third parties for transportation services.
Our business primarily relies upon third parties for the transportation of pulp to our customers, as well as for the delivery of our raw materials to our mills. Our pulp and raw materials are principally transported by truck, barge, rail and sea-going vessels, all of which are highly regulated. Increases in transportation rates can also materially adversely affect our results of operations.
Further, if our transportation providers fail to deliver our pulp in a timely manner, it could negatively impact our customer relationships and we may be unable to sell it at full value. If our transportation providers fail to deliver our raw materials in a timely fashion, we may be unable to manufacture pulp in response to customer orders. Also, if any of our transportation providers were to cease operations, we may be unable to replace them at a reasonable cost. The occurrence of any of the foregoing events could materially adversely affect our results of operations.
Failures or security breaches of our information technology systems could disrupt our operations and negatively impact our business.
We use information technologies to securely manage our operations and various business functions. We rely on various technologies to process, store and report on our business and to communicate electronically between our facilities, personnel, customers and suppliers. We also use information technologies to process financial information and results of operations for internal reporting purposes and to comply with regulatory, legal and tax requirements. Despite our security design and controls, and those of our third party providers, our information technology systems may be vulnerable to a variety of interruptions, including during the process of upgrading or replacing software, databases or components thereof, natural disasters, terrorist attacks, telecommunications failures, computer viruses, cyber-attacks, hackers, unauthorized access attempts and other security issues or may be breached due to employee error, malfeasance or other disruptions. Any such interruption or breach could result in operational disruptions or the misappropriation of sensitive data that could subject us to civil and criminal penalties, litigation or have a negative impact on our reputation. There can be no assurance that such disruptions or misappropriations and the resulting repercussions will not negatively impact our cash flows and materially affect our results of operations or financial condition.
The price of our common stock may be volatile.
The market price of our common stock may be influenced by many factors, some of which are beyond our control, including those described above and the following:
actual or anticipated fluctuations in our operating results or our competitors’ operating results;
| • | actual or anticipated fluctuations in our operating results or our competitors’ operating results; |
| • | announcements by us or our competitors of new products, capacity changes, significant contracts, acquisitions or strategic investments; |
our growth rate and our competitors’ growth rates;48
| • | our growth rate and our competitors’ growth rates; |
the financial market and general economic conditions;
| • | the financial market and general economic conditions; |
changes in stock market analyst recommendations regarding us, our competitors or the forest products industry generally or lack of analyst coverage of our common stock;
| • | changes in stock market analyst recommendations regarding us, our competitors or the forest products industry generally or lack of analyst coverage of our common stock; |
sales of common stock by our executive officers, directors and significant stockholders; and
| • | sales of common stock by our executive officers, directors and significant shareholders; and |
changes in accounting principles.
| • | changes in accounting principles. |
In addition, there has been significant volatility in the market price and trading volume of securities of companies operating in the forest products industry that often has been unrelated to the operating performance of particular companies. Some companies that have had volatile market prices for their securities have had securities litigation brought against them. If litigation of this type is brought against us, it could result in substantial costs and would divert management’s attention and resources.
A small number of our shareholders could significantly influence our business.
As of December 31, 2014, we believe that our top three shareholders control approximately 58% of our common stock. These few significant shareholders, either individually or acting together, may be able to exercise significant influence over matters requiring shareholder approval, including the election of directors and approval of significant corporate transactions, such as a merger or other sale of the company or our assets. This concentration of ownership may make it more difficult for other shareholders to effect substantial changes in the company, may have the effect of delaying, preventing or expediting, as the case may be, a change in control of the company, and may adversely affect the market price of our common stock. Further, the interests of these few shareholders may not be in the best interests of all shareholders.
ITEM 1B. UNRESOLVED STAFF COMMENTS
None.
We own the Rosenthal and Celgar mills and the underlying property.properties. The Stendal mill is situated on property owned by Stendal, our 74.9% owned subsidiary.subsidiary in which we own 100% of the economic interest. For a description of our mills, please see “Part I.— – Item 1. Business—Business – Our Mills and Product”.
We lease offices in Vancouver, British Columbia, Berlin, Arneburg and Hamburg, Germany, and Seattle, Washington.
At the end of 2012, substantially all2014, the New Stendal Revolving Credit Facility was secured by first charges against the inventories and receivables of the assets relating to the Stendal mill were pledged to secure the Stendal Loan Facility and the Blue Mill Facility.mill. The €3.5€5.0 million Rosenthal working capital facility is secured by certain land at the Rosenthal mill. The other working capital loan facilities established for the Rosenthal and Celgar mills are secured by first charges against the inventories and receivables atof the respective mills.
In October 2005, our wholly-owned subsidiary, Zellstoff Celgar Limited, received a re-assessment for real property transfer tax payable in British Columbia, Canada, in the amount of approximately €3.0 million (C$4.5 million) in connection with the acquisition of the Celgar mill. We are currently contesting the re-assessment and we currently expect the Supreme Court of British Columbia to hold a hearing on this matter in 2013. The reassessment has been fully paid and the amount, if any, that may be reimbursed to us in connection with this matter remains uncertain.
In September of 2010, the Celgar mill received a letter from the Upper Columbia River Natural Resources Trustee Council, an organization consisting of aboriginal groups and US government representatives, referred to as the “Council”, alleging that, based on their preliminary assessment, (theor the “Preliminary Assessment”), between 1961 to 1993, the Celgar mill had discharged chlorinated organic compounds into the Columbia River. The Preliminary Assessment was conducted to evaluate the need to conduct a formal natural resource damage assessment under the U.S.Comprehensive Environmental Response, Compensation and Liability Act, referred to as “CERCLA”. Although we did not acquire the Celgar mill until 2005, and the Celgar mill’s alleged discharges
49
occurred prior to our acquisition of the mill, the Council determined to proceed with a formal natural resource damage assessment under the CERCLA. Although at this time it is unclear as to whether any harm was caused by these alleged discharges and, in any event, we do not believe we are liable, due to the preliminary nature of the assessment, we cannot at this time quantify the costs, if any, associated with this matter.
In January 2012, we served a Notice of Intent to Submit a Claim to Arbitration on the Government of Canada, referred to as the “NAFTA Notice”, for breaches by it of its obligations under the North American Free Trade Agreement, referred to as “NAFTA”. The Company’s NAFTA claim, referred to as the “NAFTA Claim”, relates to its investments in the Celgar mill and arises from the treatment of the Celgar mill’s energy generation assets and operations by the Province of British Columbia, primarily through the actions of B.C. Hydro, a provincially owned and controlled enterprise, and the British Columbia Utilities Commission, a provincial government regulatory agency. Our NAFTA Claim is against the Government of Canada, rather than the Province of British Columbia as, under NAFTA, the Canadian federal government is responsible for the actions of its provinces. Our NAFTA Claim alleges that our Celgar mill has received unfair and discriminatory treatment regarding the mill’s ability to purchase and sell energy compared to other pulp mills and entities that generate and sell electricity within the Province of British Columbia. Subsequent to the filing of the NAFTA Notice, our representatives met with representatives of the Government of Canada and the Province of British Columbia to attempt to settle our NAFTA Claim through consultation and negotiation, as required under NAFTA Article 1118. However, no resolution was achieved. As a result, we served a Request for Arbitration on the Government of Canada under NAFTA in order to meet the applicable filing deadline and to preserve and progress our NAFTA Claim. Under our NAFTA Claim, we are seeking approximately C$250250.0 million in damages consisting of past losses of approximately C$19.0 million per year accruing since 2008 and the net present value of projected losses that would result from the ongoing application of discriminatory Provincial policies should the status quo remain
unchanged. Our NAFTA Claim is being instituted under Chapter 11 of NAFTA and will be heard by a tribunal appointed in accordance with Article 1123 of NAFTA. At this time, there can be no assurance whether we will be successful in such claim and we cannot quantify the amount we may recover, if any, under such proceedings if we were successful.
In 2012, as a result of a regular tax field audit for the Stendal mill, German public authorities commenced a preliminary investigation into a past and thethen current managers of the mill relating to whether certain settlement amounts received by the Stendal mill in 2007, 2010 and 2011 from the main contractor under the Engineering, Procurement and Construction Contract for the construction of the Stendal mill should have reduced the assessment base for the original investment subsidies granted to the mill by German authorities. The payments were made by the contractor to the Stendal mill to settle certain warranty, performance and remediation claims that the Stendal mill made against the contractor after completion of mill construction in 2004. The amounts currently under review aggregate approximately €17.0 million.€8.7 million ($10.5 million). Investment subsidies received by the Stendal mill were generally based upon a percentage of the assessment base for subsidies of the mill. If the settlement payments received by the Stendal mill result in a reduction of the assessment base for subsidies under applicable German rules there could be a proportionate reduction in the investment subsidies and the difference could be repayable by the Stendal mill. The Stendal mill believes that it has properly recorded the settlement amounts received from the contractor and that the same do not reduce the assessment base for subsidies of the mill. However, at this time, there can be no certainty as to the outcome of the current investigation.
We are also subject to routine litigation incidental to our business. We do not believe that the outcome of such litigation will have a material adverse effect on our business or financial condition.
ITEM 4. MINE SAFETY DISCLOSURES
Not applicable.
50
| ITEM 5. | MARKET FOR REGISTRANT’S COMMON EQUITY, |
(a)Market Information.Our shares are quoted for trading on the NASDAQ Global Select Market under the symbol “MERC” and listed in U.S. dollars on the Toronto Stock Exchange under the symbol “MRI.U”. The following table sets forth the high and low sale prices of our shares on the NASDAQ Global Select Market for each quarter in the two-year period ended December 31, 2012:2014:
Fiscal Quarter Ended | High | Low | High | Low | ||||||||||||
2012 | ||||||||||||||||
2014 | ||||||||||||||||
March 31 | $ | 8.80 | $ | 6.15 | $ | 9.95 | $ | 7.05 | ||||||||
June 30 | 8.10 | 5.55 | $ | 10.54 | $ | 7.08 | ||||||||||
September 30 | 7.51 | 5.05 | $ | 11.41 | $ | 9.06 | ||||||||||
December 31 | 7.80 | 6.18 | $ | 14.08 | $ | 9.25 | ||||||||||
2011 | ||||||||||||||||
2013 | ||||||||||||||||
March 31 | $ | 14.71 | $ | 7.45 | $ | 7.51 | $ | 6.50 | ||||||||
June 30 | 15.27 | 9.62 | $ | 7.07 | $ | 5.87 | ||||||||||
September 30 | 11.34 | 6.79 | $ | 7.84 | $ | 6.22 | ||||||||||
December 31 | 7.59 | 5.30 | $ | 10.55 | $ | 7.04 | ||||||||||
(b)Shareholder Information.As at February 13, 2013,12, 2015, there were approximately 308287 holders of record of our shares and a total of 55,815,70464,414,322 shares were outstanding.
(c)Dividend Information.The declaration and payment of dividends is at the discretion of our board of directors. Our board of directors has not declared or paid any dividends on our shares in the past two yearsthree years. However, the declaration and does not anticipate declaringpayment of dividends is at the discretion of our board of directors and will depend upon various factors, including our earnings, financial condition, restrictions imposed by our credit facilities and the terms of any other indebtedness that may be outstanding, cash requirements, future prospects and other factors deemed relevant by our board of directors. The indentures governing our 2019 and 2022 Senior Notes and our bank credit facilities limit our ability to pay dividends or paying dividends in the foreseeable future.make other distributions on capital stock. See “Part I. – Item 1. Business – Description of Certain Indebtedness”.
(d)Equity Compensation Plans.The following table sets forth information as at December 31, 2012 regarding2014 with respect to the shares of our common stock that may be issued under our existing equity compensation plans approved by our shareholders. As at December 31, 2012, 1,124,957 of our shares were available for future issuance pursuant to grants of options, stock appreciation rights, restricted stock, restricted stock rights, performance shares and performance units under our 2010 Stock Incentive Plan, referred to as the “2010 Plan”, which was adopted in June 2010 and which replaced our 2004 Stock Incentive Plan, referred to as the “2004 Plan”. Our Amended and Restated 1992 Non-Qualified Stock Option Plan expired in 2008.plans.
| Number of Shares to be Issued Upon Exercise of Outstanding Options | Weighted-average Exercise Price of Outstanding Options | Number of Shares Available for Future Issuance Under Plan | ||||||||||
2010 Stock Incentive Plan | — | $ | — | 1,124,957 | (1)(2) | |||||||
2004 Stock Incentive Plan | 30,000 | (3) | $ | 7.30 | — | |||||||
Amended and Restated 1992 Non-Qualified Stock Option Plan | 145,000 | (4) | $ | 6.35 | — | (5) | ||||||
| Number of securities to be issued upon exercise of outstanding options, warrants and rights (a) | Weighted-average exercise price of outstanding options, warrants and rights (b) | Number of securities remaining available for future issuance under equity compensation plans (excluding securities reflected in column (a)) (c) | ||||
Plan Category | ||||||
Equity compensation plans | 55,000(2) | $7.58(3) | 2,533,958(4) | |||
Equity compensation plans not approved by shareholders | - | - | - |
| (1) |
|
Excludes 118,000 outstanding restricted shares, 78,000 of which vest in 2015 and 40,000 of which vest in 2016, and 969,544 outstanding performance share units, 160,608 of which had vested as at December 31, 2014. The underlying shares of common stock relating to the vested performance share units were issued in February 2015. Of the remaining 808,936 performance share units, 160,000 will vest in 2015 |
51
| and 648,936 will vest in 2017. The actual number of shares of common stock issued in respect of unvested performance share units will vary from 0% to 200% of performance share units granted, based upon achievement of performance objectives established for such awards. |
| (3) | The |
Our 2010 Plan provides for options, restricted stock rights, restricted stock, performance shares, performance share units and stock appreciation rights to be awarded to employees, consultants and non-employee directors. The 2010 Plan replaced the Company’s 2004 Plan. However, the terms of the 2004 Plan govern prior awards until all awards granted under the 2004 Plan have been exercised, forfeited, cancelled, expired, or otherwise terminated in accordance with the terms of such plan. The Company may grant up to a maximum of 2,000,000 common shares under the 2010 Plan, plus the number of common shares remaining available for grant pursuant to the 2004 Plan.
| (4) | Represents the number of shares of our common stock remaining available for issuance under the 2010 Plan as of December 31, 2014. Our 2010 Plan replaced the 2004 Plan and the 1992 Plan expired in 2008. Our 2010 Plan provides for options, restricted stock rights, restricted shares, performance shares, performance share units and stock appreciation rights to be awarded to employees, consultants and non-employee directors. |
We do not have any equity compensation plans that have not been approved by shareholders.
(e)Performance Graph.The following graph shows a five-year comparison of cumulative total shareholder return, calculated on an assumed dividend reinvested basis, for our common stock, the NASDAQ Stock Market Index (the “NASDAQ Index”) and Standard Industrial Classification, or “SIC”, Code Index (SIC Code 2611—2611-pulp mills) (the “Industry Index”). The graph assumes $100 was invested in each of our common stock, the NASDAQ Index and the Industry Index on December 31, 2007.2009. Data points on the graph are annual.
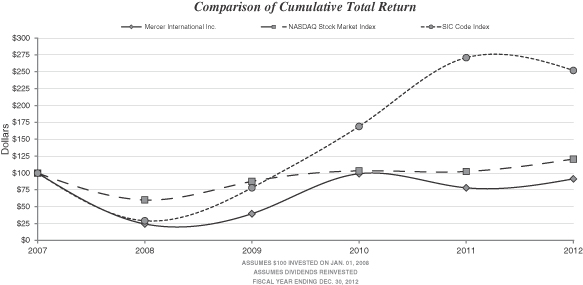

| 2007 | 2008 | 2009 | 2010 | 2011 | 2012 | 2009 | 2010 | 2011 | 2012 | 2013 | 2014 | |||||||||||||||||||||||||||||||||||||
Mercer International Inc. | 100.00 | 24.52 | 39.59 | 98.98 | 77.91 | 91.44 | 100.00 | 250.00 | 196.77 | 230.97 | 321.61 | 396.45 | ||||||||||||||||||||||||||||||||||||
SIC Code Index | 100.00 | 29.09 | 78.01 | 168.84 | 270.89 | 252.09 | 100.00 | 153.81 | 154.02 | 166.26 | 194.04 | 181.15 | ||||||||||||||||||||||||||||||||||||
NASDAQ Stock Market Index | 100.00 | 60.02 | 87.24 | 103.08 | 102.26 | 120.41 | 100.00 | 118.02 | 117.04 | 137.47 | 192.62 | 221.02 | ||||||||||||||||||||||||||||||||||||
52
| ITEM 6. | SELECTED FINANCIAL DATA |
The following table sets forth selected historical financial and operating data as at and for the periodsyears indicated. Our consolidated financial statements as at and for each of the years in the three-year period ended December 31, 2012 were reported using the Euro. Effective October 1, 2013, we changed our reporting currency to the U.S. dollar. With the change in reporting currency, all comparative financial information has been recast from Euros to U.S. dollars to reflect our consolidated financial statements as if they had been historically reported in U.S. dollars, consistent with Accounting Standards Codification Topic 830. The Consolidated Balance Sheet information was translated into the U.S. dollar reporting currency by translating assets and liabilities at the rate of exchange on the balance sheet date and translating equity accounts using historical exchange rates. The Consolidated Statement of Operations information was translated into U.S. dollars using the weighted average exchange rate for the period. Unrealized gains or losses from these translations are recorded in our Consolidated Statement of Comprehensive Income (Loss) and do not affect our net earnings.
The following selected financial data is qualified in its entirety by, and should be read in conjunction with, our consolidated financial statements and related notes contained in this annual report and “Item 7. Management’s Discussion and Analysis of Financial Condition and Results of Operations”.
| Year Ended December 31, | Year Ended December 31, | |||||||||||||||||||||||||||||||||||||||
| 2012 | 2011 | 2010 | 2009 | 2008 | 2014 | 2013 | 2012 | 2011 | 2010 | |||||||||||||||||||||||||||||||
| (Euro in thousands, other than per share and per ADMT amounts) | (in thousands, other than per share and per ADMT amounts) | |||||||||||||||||||||||||||||||||||||||
Statement of Operations Data | ||||||||||||||||||||||||||||||||||||||||
Revenues | ||||||||||||||||||||||||||||||||||||||||
Pulp | € | 761,854 | € | 831,396 | € | 856,311 | € | 577,298 | € | 689,320 | $ | 1,073,632 | $ | 996,187 | $ | 979,770 | $ | 1,157,206 | $ | 1,136,595 | ||||||||||||||||||||
Energy and chemicals | € | 72,289 | € | 68,079 | € | 49,288 | € | 45,540 | € | 34,358 | 101,480 | 92,198 | 92,966 | 94,758 | 65,421 | |||||||||||||||||||||||||
|
|
|
|
|
|
|
|
|
| |||||||||||||||||||||||||||||||
| € | 834,143 | € | 899,475 | € | 905,599 | € | 622,838 | € | 723,678 | $ | 1,175,112 | $ | 1,088,385 | $ | 1,072,736 | $ | 1,251,964 | $ | 1,202,016 | |||||||||||||||||||||
Costs and expenses | € | 785,138 | € | 788,356 | € | 737,856 | € | 635,637 | € | 710,349 | $ | 1,013,314 | $ | 1,056,725 | $ | 1,009,714 | $ | 1,097,299 | $ | 979,368 | ||||||||||||||||||||
Operating income (loss) | € | 49,005 | € | 111,119 | € | 167,743 | € | (12,799 | ) | € | 13,329 | |||||||||||||||||||||||||||||
Operating income | $ | 161,798 | $ | 31,660 | $ | 63,022 | $ | 154,665 | $ | 222,648 | ||||||||||||||||||||||||||||||
Interest expense | € | 55,805 | € | 58,995 | € | 67,621 | € | 64,770 | € | 65,756 | $ | 67,516 | $ | 69,156 | $ | 71,767 | $ | 82,114 | $ | 89,754 | ||||||||||||||||||||
Gain (loss) on settlement of debt | $ | 3,357 | $ | - | $ | - | $ | - | $ | (9,947 | ) | |||||||||||||||||||||||||||||
Gain (loss) on derivative instruments | € | 3,741 | € | (1,418 | ) | € | 1,899 | € | (5,760 | ) | € | (25,228 | ) | $ | 11,501 | $ | 19,709 | $ | 4,812 | $ | (1,974 | ) | $ | 2,521 | ||||||||||||||||
Other income (expense) | € | (58 | ) | € | 1,501 | € | 468 | € | (1,804 | ) | € | (1,174 | ) | $ | (4,948 | ) | $ | 1,215 | $ | (179 | ) | $ | 3,625 | $ | (7,510 | ) | ||||||||||||||
Income (loss) after income taxes(1) | € | (10,491 | ) | € | 54,006 | € | 94,748 | € | (72,125 | ) | € | (85,540 | ) | |||||||||||||||||||||||||||
Net income (loss)(1)(2) | $ | 113,154 | $ | (26,375 | ) | $ | (15,670 | ) | $ | 69,699 | $ | 114,521 | ||||||||||||||||||||||||||||
Net income (loss) per share(2) | ||||||||||||||||||||||||||||||||||||||||
Basic | € | (0.22 | ) | € | 1.00 | € | 2.24 | € | (1.71 | ) | € | (2.00 | ) | $ | 1.82 | $ | (0.47 | ) | $ | (0.28 | ) | $ | 1.39 | $ | 2.97 | |||||||||||||||
Diluted | € | (0.22 | ) | € | 0.89 | € | 1.56 | € | (1.71 | ) | € | (2.00 | ) | $ | 1.81 | $ | (0.47 | ) | $ | (0.28 | ) | $ | 1.24 | $ | 2.07 | |||||||||||||||
Weighted average shares outstanding (in thousands) | ||||||||||||||||||||||||||||||||||||||||
Weighted average shares outstanding | ||||||||||||||||||||||||||||||||||||||||
Basic | 55,597 | 50,117 | 38,591 | 36,297 | 36,285 | 62,013 | 55,674 | 55,597 | 50,117 | 38,591 | ||||||||||||||||||||||||||||||
Diluted | 55,597 | 56,986 | 56,963 | 36,297 | 36,285 | 62,515 | 55,674 | 55,597 | 56,986 | 56,963 | ||||||||||||||||||||||||||||||
Balance Sheet Data | ||||||||||||||||||||||||||||||||||||||||
Current assets | € | 344,998 | € | 373,226 | € | 356,880 | € | 200,934 | € | 258,901 | $ | 377,835 | $ | 471,773 | $ | 454,880 | $ | 484,149 | $ | 477,897 | ||||||||||||||||||||
Current liabilities | € | 136,425 | € | 126,067 | € | 125,197 | € | 101,784 | € | 104,527 | $ | 115,503 | $ | 180,259 | $ | 179,876 | $ | 163,534 | $ | 167,651 | ||||||||||||||||||||
Working capital | € | 208,573 | € | 247,159 | € | 231,683 | € | 99,150 | € | 154,374 | $ | 262,332 | $ | 291,514 | $ | 275,004 | $ | 320,615 | $ | 310,246 | ||||||||||||||||||||
Total assets | € | 1,183,603 | € | 1,217,250 | € | 1,216,075 | € | 1,083,831 | € | 1,151,600 | $ | 1,326,807 | $ | 1,548,559 | $ | 1,560,581 | $ | 1,579,017 | $ | 1,628,445 | ||||||||||||||||||||
Long-term liabilities | € | 768,253 | € | 807,641 | € | 877,315 | € | 896,074 | € | 914,970 | $ | 772,424 | $ | 1,019,983 | $ | 1,012,943 | $ | 1,047,672 | $ | 1,174,812 | ||||||||||||||||||||
Total equity | € | 278,925 | € | 283,542 | € | 213,563 | € | 85,973 | € | 132,103 | $ | 438,880 | $ | 348,317 | $ | 367,762 | $ | 367,811 | $ | 285,982 | ||||||||||||||||||||
Other Data | ||||||||||||||||||||||||||||||||||||||||
Pulp sales volume (ADMTs) | 1,473,519 | 1,427,924 | 1,428,638 | 1,445,461 | 1,423,300 | 1,486 | 1,440 | 1,474 | 1,428 | 1,429 | ||||||||||||||||||||||||||||||
Pulp production (ADMTs) | 1,468,275 | 1,453,677 | 1,426,286 | 1,397,441 | 1,424,987 | 1,485 | 1,444 | 1,468 | 1,454 | 1,426 | ||||||||||||||||||||||||||||||
Average pulp price realized (per ADMT)(3) | € | 511 | € | 574 | € | 591 | € | 393 | € | 478 | ||||||||||||||||||||||||||||||
Average pulp price realized (per ADMT)(3) | $ | 715 | $ | 683 | $ | 657 | $ | 799 | $ | 785 | ||||||||||||||||||||||||||||||
| (1) | We do not report the effect of government grants relating to our assets in our income. These grants reduce the cost basis of the assets purchased. See “Item |
| (2) | Attributable to common shareholders. |
| (3) | Average realized pulp price for the |
53
| ITEM 7. | MANAGEMENT’S DISCUSSION AND ANALYSIS OF FINANCIAL CONDITION AND RESULTS OF OPERATIONS |
The following discussion and analysis of our financial condition and results of our operations for the years ended December 31, 2012, 20112014, 2013 and 20102012 is based upon and should be read in conjunction with the consolidated financial statements and related notes included elsewhere in this annual report. This annual report contains forward-looking statements that involve risks and uncertainties. Our actual results may differ materially from those indicated in forward-looking statements. See “Cautionary Note Regarding Forward-Looking Statements”.
Effective October 1, 2013, we changed our reporting currency from Euros to the U.S. dollar. As a result of our change in reporting currency, all comparative financial information for the year ended December 31, 2012 has been recast from Euros to U.S. dollars to reflect our financial statements as if they had been historically reported in U.S. dollars, consistent with the method described in Note 1, “The Company and Summary of Significant Accounting Policies – Foreign Operations and Currency Translation”, of the consolidated financial statements included in this annual report on Form 10-K.
General
We operate in the pulp business and our operations are located in Germany and Western Canada. Our mills have a current combined annual production capacity of approximately 1.5 million ADMTs of NBSK pulp and 259305 MW of electrical generation.
Markets for NBSK pulp are global, cyclical and commodity based. Our financial performance depends on a number of variables that impact sales and production costs. Sales and production results for kraft pulp are influenced largely by the market price for NBSK pulp, fiber costs and foreign currency exchange rates. Kraft pulp markets are highly cyclical, with prices determined by supply and demand. In general, kraft pulp is a globally traded commodity. Pricing and demand are influenced by the balance between supply and demand, as affected by global macroeconomic conditions, changes in consumption and industry capacity, the level of customer and producer inventories and fluctuations in exchange rates. The average European list prices for NBSK pulp between 20002005 and 2012 ranged from2014 have fluctuated between a low of $447$575 per ADMT in 20022009 to a high of $1,030 per ADMT in 2011.
In 2010, the supply/demand balance for softwood market pulp improved due to strong demand in China and supply reductions resulting from the closure of several older mills and the residual effect of earthquakes in Chile. During the year, several increases lifted prices to record levels in the middle of the year. Although pulp list prices continued to increase through the first half of 2011, economic uncertainty in Europe and credit tightening in China resulted in a decline in pulp prices commencing in the fourth quarter of 2011. In 2012, there was continuingContinuing economic uncertainty in Europe and credit tightening in China in the first half of the year. Further,2012 and weak demand for paper in Europe in the latter part of 2012, weak demand for paper in Europewhich resulted in some integrated producers curtailing their paper production and selling their pulp on the market, primarily in China. These factorsChina, negatively impacted demand and supply and list prices for NBSK pulp.pulp in 2012. In 2013, demand from China was stable throughout the year and supply was slightly under-balanced, which resulted in higher prices. At the end of 2013, list prices were approximately $905 per ADMT in Europe and $990 and $750 per ADMT in North America and China, respectively. On average, NBSK list prices in Europe increased by approximately 6% in 2013 from the prior year and increased by approximately 7% in 2014 from 2013. List prices in Europe, North America and China increased slowly through the first quarter of 2014 and remained essentially flat in Europe and North America through the second quarter of 2014 due to steady demand while declining in China in the same quarter due to market expectations that declining hardwood prices would pressure NBSK prices. NBSK list prices were down approximately 15% in 2012essentially flat during the third quarter of 2014 compared to 2011.the second quarter of 2014 due to steady demand, with a modest increase in Europe. At the end of 2012,2014, the NBSK list prices wereprice in North America was approximately $810$1,020 per ADMT and $935 and $700 per ADMT in Europe and $870 and $655 in North America and China, respectively, at the end of 2012.respectively.
Our sales realizations are list prices, net of customer discounts, commissionsrebates and other selling concessions. Our reported average sale price realizations are affected by NBSK price movements betweencommissions. Over the orderlast three years, these discounts, rebates and shipment dates.commissions have increased as producers compete for customers and sales.
54
Surplus energy and chemicals are by-products of our pulp production and the volumes generated and sold are primarily related to the rate of pulp production. Prices for our energy and chemical sales are generally stable and unrelated to cyclical changes in pulp prices.
Production and sales of surplus energy and chemicals are key revenue sources for us. In 2012, 20112014, 2013 and 2010,2012, our mills generated 710,241and sold 807,758 MWh, 652,113699,051 MWh and 520,005710,241 MWh, respectively, of surplus energy, primarily from a renewable carbon-neutral source. Initiatives to increase our generation and sales of surplus renewable energy and chemicals will continue to be a key focus for us. In the last quarter of 2013, our Stendal mill completed Project Blue Mill, which produced an incremental 102,000 MWh of surplus energy and is fully operational. Additionally, at the end of 2014, our StendalRosenthal mill is expectedcompleted a capital project at a cost of approximately $3.7 million to both increase pulp productionprocess and efficiencies through debottlenecking and increase surplus electricity production by approximately 109,000 MWh.sell tall oil, a chemical by-product. Further initiatives to increase energy generation and chemical sales may require additional capital spending.
Our production costs are influenced by the availability and cost of raw materials, energy and labor, and our plant efficiencies and productivity. Our main raw material is fiber in the form of wood chips and pulp logs. Wood chip and pulp log costs are primarily affected by the supply of, and demand for, lumber and pulp, which are both highly cyclical. Over the last three years, the demand and competition for fiber has also been impacted by renewable energy producers in Germany, particularly by wood pellet producers. Higher fiber costs could affect producer profit margins if they are unable to pass along price increases to pulp customers or purchasers of surplus energy.
OverallGenerally weak lumber markets in 2010, 2011 andfor most of 2012 resulted in reduced sawmill activity and log harvesting in the regional fiber baskets for our mills. This has reducedIn 2013, the lumber markets improved globally which had the effect of increasing supply of both wood residuals such as chips and increased demand for saw logs and higher quality pulp logs. This cyclical supply reductionlogs, which put upward pressure on fiber prices.log pricing. Additionally, higher energy prices and a focus on “green” or renewable energy, while benefiting our surplus power sales, has also led to an overall increase in demand for wood residuals in Germany from other renewable energy producers such as pellet producers. This increased demand and competition for fiber put upward pressure on fiber prices. A recovery in U.S. housing starts which commenced in the latter part of 2012 hasand continued in 2013 and 2014 resulted in increased sawmill activity and is expected to increaseactivity. This increased the supply of woodchipswood chips for the Celgar mill.mill and reduced its need for pulp logs, which are generally a higher cost for the mill than wood chips. Wood chip supply in Germany was stable during the course of 2014 due to stable sawmill production and lower demand from pellet producers and board manufacturers resulting from lower energy prices and warmer winter weather.
Production costs also depend on the total volume of production. High operating rates and production efficiencies permit us to lower our average cost by spreading fixed costs over more units. Higher operating rates also permit us to increase our generation and sales of surplus renewable energy and chemicals. Our production levels are also dependent on, among other things, the number of days of scheduled and unscheduled downtime at our mills. In 2014, 2013 and 2012, we had 24, 33 and 40 days of scheduled maintenance downtime, respectively. Going forward in 2015, we have scheduled maintenance downtime of 36 days, or approximately 50,200 ADMTs. Unexpected productionmaintenance downtime, which has not materially affected us during any of the periods described in this discussion, can be particularly disruptive in our industry.
Our product mix is also important because premium grades of NBSK pulp generally achieve higher prices and profit margins.
Our financial performance for any reporting period is impacted by changes in the U.S. dollar to Euro and Canadian dollar exchange rates and in interest rates. Changes in currency rates affect our operating results because the price for our principal product, NBSK pulp, is generally based on a global industry benchmark that is quoted in U.S. dollars, even though a significant portion of the sales from our German mills is invoiced in Euros and we report our results in Euros. Therefore, a weakening of the U.S. dollar against the Euro and the Canadian dollar will generally reduce the amount of our pulp operations’ revenues. Mostmost of our operating costs at our German mills including our debt obligations under the Stendal Loan Facility, are incurred in Euros. Most of our operating costs at the Celgar mill including the mill’s working capital facility, are in Canadian dollars. These costs do not fluctuate with the U.S. dollar to Euro or Canadian dollar exchange rates. Thus, an increase in the strength of the U.S. dollar versus the Euro and the Canadian dollar decreases our operating costs and increases our operating margins and income from operations. Conversely, a weakening of the
55
U.S. dollar against the Euro and the Canadian dollar tends to reduceincrease our sales revenue, gross profitoperating costs and decrease our operating margins and income from operations. Conversely, an increaseOur energy and chemical sales are made in local currencies and, as a result, decline in U.S. dollar terms when the U.S. dollar strengthens and increase when the U.S. dollar weakens.
On average, in 2013, the U.S. dollar declined by approximately 3% and increased by approximately 3%, respectively, versus the Euro and the Canadian dollar positively impacts our revenuescompared to 2012. Based upon the exchange rate at the end of 2014, the U.S. dollar strengthened by approximately 12% and increases our operating margins8% in value against the Euro and cash flow.the Canadian dollar, respectively, since the end of 2013.
We also periodically enter into interest rate, foreign currency, pulp price and energy price derivative contracts to partially protect against the effect of such changes. Gains or losses on such derivatives are included in our earnings, either as they are settled or as they are marked to market for each reporting period. Stendal as required underentered into the Stendal Loan Facility, entered into variable-to-fixed rate interest swaps, referred to as the “Stendal Interest Rate Swap Contract”,Contract in August 2002 to fix the interest rate on such indebtedness forduring the full term of the Prior Stendal Loan Facility. The Stendal Interest Rate Swap Contract remains in place after the Prior Stendal Loan Facility was repaid. Changes in long-term interest rates result in our recording unrealized non-cash gains or losses on the Stendal Interest Rate Swap Contract when it is marked to market on a quarterly basis. Such non-realized gains or losses can materially impact our operating results for any reporting period. See “Quantitative and Qualitative Disclosures about Market Risk”.
We do not believe that inflation has had a material impact on revenues or income during 2014.
Significant Actions
In 2012,2014, we took the following significant actions:
Commenced Project Blue Mill at our Stendal mill. The project is expected to increase the mill’s production of pulp and green energy. When completed in the latter part of 2013, it should further enhance our stable stream of income from energy and chemical sales;
| • | in April 2014, we completed our registered public offering of 8,050,000 shares of our common stock for net proceeds of approximately $53.9 million; |
| • | in September 2014, we amended and restated the Prior Stendal Facilities to provide Stendal with greater financial flexibility, recapitalized our Stendal mill and acquired substantially all of the prior minority shareholder’s interest and certain other rights to acquire all of the economic interest in Stendal and eliminate the minority interest in our Stendal mill; |
Completed an upgrade to the Rosenthal mill’s recovery boiler in the second quarter of 2012 to reduce the mill’s emissions, increase production capacity and lower operating costs; and
| • | in the fourth quarter of 2014, we amended the Celgar Working Capital Facility to, among other things, extend its term and reduce its borrowing cost; |
| • | in the fourth quarter of 2014, we paid out and discharged our 2017 Senior Notes and the Prior Stendal Facilities through the issuance of the 2019 and 2022 Senior Notes, cash on hand and borrowings under our revolving credit facilities and we established the New Stendal Revolving Credit Facility, referred to herein as the “Refinancing”; |
| • | we reduced our debt by over $290.0 million, increased our total equity by over $90.0 million and, as a result, improved our balance sheet; |
| • | we significantly increased our financial and operational flexibility and simplified our structure by eliminating restrictive covenants within the Prior Stendal Facilities, reducing our debt, extending the maturity of our long-term debt, enhancing the terms of our revolving credit facilities and eliminating our “Restricted Group” structure; |
Continued to improve mill operations and efficiencies, which allowed us to achieve record annual pulp production and energy generation.56
Current Market Environment• we had record pulp production, pulp sales volumes and energy sales volumes; • we implemented a tall oil plant at the Rosenthal mill and a chip screening project at the Celgar mill; and • we continued to improve mill operations and efficiencies, which allowed us to achieve record annual pulp production and energy generation.
Economic uncertaintyDemand from China was stable throughout the year and supply was slightly under-balanced, which resulted in Europe and China negatively impacted demand and listhigher prices forin 2014 compared to 2013.
At year end, world producer inventories of NBSK pulp through 2012.were at about 31 days’ supply. In addition, we expect to see continued growth in NBSK demand in emerging markets, particularly in China, driven by increasing strong demand from tissue producers.
As our operating costs are primarily incurred in Euros and Canadian dollars and our principal product, NBSK pulp, is quoted in U.S. dollars, our business and operating margins materially benefit from the fourth quartercurrent strengthening of 2012, although supply and demand were balanced, prices were generally stagnant with only modest price increases.
We believe that the market is currently balanced andU.S. dollar. Going forward, while we currently expect thatcontinue to benefit from a modest price recoverystronger U.S. dollar, it will continuepartially be offset as in 2013. As2015 the rapid strengthening of the U.S. dollar has put downward pressure on pulp prices, are highly cyclical, there can be no assurance that prices will not decline in the future.as a stronger U.S. dollar increases costs to our European and Asian customers.
Summary Financial Highlights
| Year Ended December 31, | Year Ended December 31, | |||||||||||||||||||||||
| 2012 | 2011 | 2010 | 2014 | 2013 | 2012 | |||||||||||||||||||
| (in thousands of Euros, other than per share amounts) | (in thousands, other than per share amounts) | |||||||||||||||||||||||
Pulp revenues | € | 761,854 | € | 831,396 | € | 856,311 | $ | 1,073,632 | $ | 996,187 | $ | 979,770 | ||||||||||||
Energy and chemical revenues | 72,289 | 68,079 | 49,288 | $ | 101,480 | $ | 92,198 | $ | 92,966 | |||||||||||||||
Operating income | 49,005 | 111,119 | 167,743 | $ | 161,798 | $ | 31,660 | $ | 63,022 | |||||||||||||||
Gain (loss) on derivative instruments | 3,741 | (1,418 | ) | 1,899 | ||||||||||||||||||||
Foreign exchange gain (loss) on debt | — | 1,175 | (6,126 | ) | ||||||||||||||||||||
Operating EBITDA* | $ | 239,810 | $ | 110,305 | $ | 137,679 | ||||||||||||||||||
Gain on settlement of debt | $ | 3,357 | $ | - | $ | - | ||||||||||||||||||
Gain on derivative instruments | $ | 11,501 | $ | 19,709 | $ | 4,812 | ||||||||||||||||||
Income tax benefit (provision) | (7,293 | ) | 695 | 5,879 | $ | 16,774 | $ | (9,196 | ) | $ | (9,379 | ) | ||||||||||||
Net income (loss)(1) | (12,185 | ) | 50,075 | 86,279 | ||||||||||||||||||||
Net income (loss) per share(1) | ||||||||||||||||||||||||
Net income (loss)(1) | $ | 113,154 | $ | (26,375 | ) | $ | (15,670 | ) | ||||||||||||||||
Net income (loss) per share(1) | ||||||||||||||||||||||||
Basic | € | (0.22 | ) | € | 1.00 | € | 2.24 | $ | 1.82 | $ | (0.47 | ) | $ | (0.28 | ) | |||||||||
Diluted | € | (0.22 | ) | € | 0.89 | € | 1.56 | $ | 1.81 | $ | (0.47 | ) | $ | (0.28 | ) | |||||||||
Common shares outstanding at period end | 64,274 | 55,854 | 55,816 | |||||||||||||||||||||
| (1) | Attributable to common shareholders. |
* Operating EBITDA is not a measure of financial performance under accounting principles generally accepted in the United States (“GAAP”) and should not be considered in isolation or as a substitute for analysis of our results as reported under GAAP. See page 60 of this Management’s Discussion and Analysis for a reconciliation of net income (loss) attributable to common shareholders to Operating EBITDA.
57
Selected Production, Sales and Other Data
Selected production, sales and exchange rate data for the periods indicated:
| Year Ended December 31, | ||||||||||||
| 2012 | 2011 | 2010 | ||||||||||
Consolidated | ||||||||||||
Pulp Production (‘000 ADMTs) | 1,468.3 | 1,453.7 | 1,426.3 | |||||||||
Scheduled Production Downtime (‘000 ADMTs) | 50.9 | 52.4 | 43.5 | |||||||||
Scheduled Production Downtime (days) | 40 | 35 | 31 | |||||||||
Pulp Sales (‘000 ADMTs) | 1,473.5 | 1,427.9 | 1,428.6 | |||||||||
Average NBSK pulp list prices in Europe ($/ADMT)(1) | $ | 813 | $ | 956 | $ | 938 | ||||||
Average NBSK pulp list prices in Europe (€/ADMT) | € | 632 | € | 687 | € | 707 | ||||||
Average pulp sales realizations (€/ADMT)(2) | € | 511 | € | 574 | € | 591 | ||||||
Energy Production (‘000 MWh) | 1,704.1 | 1,640.4 | 1,444.1 | |||||||||
Energy Sales (‘000 MWh) | 710.2 | 652.1 | 520.0 | |||||||||
Average energy sales realizations (€/MWh) | € | 85 | € | 89 | € | 85 | ||||||
Average Spot Currency Exchange Rates | ||||||||||||
€ / $(3) | 0.7782 | 0.7186 | 0.7541 | |||||||||
C$ / $(3) | 0.9995 | 0.9887 | 1.0298 | |||||||||
C$ / €(4) | 1.2850 | 1.3761 | 1.3671 | |||||||||
| Year Ended December 31, | ||||||||||||
| 2014 | 2013 | 2012 | ||||||||||
Pulp production (‘000 ADMTs) | 1,485.0 | 1,444.5 | 1,468.3 | |||||||||
Scheduled maintenance downtime (‘000 ADMTs) | 31.6 | 47.8 | 50.9 | |||||||||
Scheduled maintenance downtime (days) | 24 | 33 | 40 | |||||||||
Pulp sales (‘000 ADMTs) | 1,486.4 | 1,440.1 | 1,473.5 | |||||||||
Average NBSK pulp list price in Europe ($/ADMT)(1) | 928 | 864 | 813 | |||||||||
Average pulp sales realizations ($/ADMT)(2) | 715 | 683 | 657 | |||||||||
Energy production (‘000 MWh) | 1,853.5 | 1,710.2 | 1,704.1 | |||||||||
Energy sales (‘000 MWh) | 807.8 | 699.1 | 710.2 | |||||||||
Average Spot Currency Exchange Rates | ||||||||||||
$ / €(3) | 1.3297 | 1.3281 | 1.2859 | |||||||||
$ / C$(3) | 0.9060 | 0.9712 | 1.0007 | |||||||||
| (1) | Source: RISI pricing report. |
| (2) |
| (3) | Average Federal Reserve Bank of New York noon spot rate over the reporting period. |
Year Ended December 31, 20122014 Compared to Year Ended December 31, 20112013
In the year ended December 31, 2012, pulpTotal revenues decreasedin 2014 increased by approximately 8% to €761.9$1,175.1 million from €831.4$1,088.4 million in 2011,2013, primarily due to lower average pulp sales realizations, partially offset by higher pulp sales volumesrevenues and a stronger U.S. dollar relative to the Euro. In 2012, there was continuing economic uncertainty in Europe and credit tightening in China in the first half of the year. Further, in the latter part of 2012, weak demand for paper in Europe resulted in some integrated producers curtailing their paper production and selling their pulp on the market, primarily in China. These factors negatively impacted demand and supply and list prices for NBSK pulp. NBSK pulp prices remained relatively stable during the first quarter of 2012 before decreasing in the middle part of the year and were generally stagnant in the latter part of 2012.
In 2012, surplushigher energy and chemicals saleschemical revenues.
Pulp revenues in 2014 increased by approximately 6%8% to an annual record of €72.3$1,073.6 million from €68.1$996.2 million in 2011,2013, due to higher pulp price realizations and higher sales volumes.
Energy and chemical revenues increased by approximately 10% to $101.5 million in 2014 from $92.2 million in 2013, primarily as a resultbecause of record pulp production. In 2012, tall oil, whichenergy sales volumes resulting from Project Blue Mill coming online at our Stendal mill at the end of 2013.
Pulp production increased by approximately 3% to 1,485,011 ADMTs in 2014 from 1,444,475 ADMTs in 2013. We had previously been classified as an offsetaggregate of 24 days (approximately 31,600 ADMTs) of scheduled maintenance downtime at our mills in 2014, compared to operating costs, has been included with revenues as we currently expect proceeds33 days in 2013. During 2014, our Celgar mill took ten days of scheduled maintenance downtime, or approximately 14,000 ADMTs, our Stendal mill took four days of scheduled maintenance downtime, or approximately 7,500 ADMTs, and our Rosenthal mill took ten days of scheduled maintenance downtime, or approximately 10,100 ADMTs.
Pulp sales volumes increased by approximately 3% to 1,486,356 ADMTs in 2014 from the sale of tall oil1,440,147 ADMTs in 2013, primarily due to remain stable in future periods.generally steady demand throughout 2014.
ListAverage list prices for NBSK pulp in Europe averagedwere approximately $813 (€632)$928 per ADMT in 2012,2014, compared to $956 (€687)approximately $864 per ADMT in 2011. At the end of 2012, list prices were $810 (€614) per ADMT in Europe and $870 (€660) and $655 (€497) per ADMT in North America and China, respectively.2013. Average pulp sales realizations increased by approximately 5% to $715 per ADMT in 2014 from approximately $683 per ADMT last year, primarily due to higher list prices.
Costs and expenses in 2014 decreased by approximately 11%4% to €511 per ADMT$1,013.3 million from $1,056.7 million in 2012 from €574 per ADMT in 2011,2013, primarily due to lower pulp prices, only partially offset by aper unit fiber costs and the overall impact on costs of the stronger U.S. dollar relativedollar.
In 2014, operating depreciation and amortization marginally decreased to the Euro. At the end of 2012, reported global inventories for softwood kraft were approximately 29 days’ supply, while at the end of 2011 inventories for softwood kraft were approximately 36 days’ supply.$77.7 million from $78.3 million in 2013.
Pulp sales volume increasedSelling, general and administrative expenses decreased to $47.9 million from $51.2 million in 2013.
58
Transportation costs decreased to $88.6 million in 2014 from $90.0 million in 2013.
On average, our overall per unit fiber costs in 2014 decreased by approximately 3% to a record 1,473,519 ADMTs in 20127% from 1,427,924 ADMTs in 2011,2013, primarily as a result of increased sales to Chinalower average fiber costs in 2012.
Pulp production increased to a record level of 1,468,275 ADMTs in 2012the markets from 1,453,677 ADMTs in 2011, primarily due to increased pulp production at our Stendal and Celgar mills. In 2012 and 2011, we took a total of 40 and 35 days scheduled maintenance downtime, respectively, atwhich our mills source their fiber and expect to take approximately 35 days in 2013.
Costs and expenses marginally decreased to €785.1 million in the year ended December 31, 2012 from €788.4 million in 2011, primarily due to lower fiber costs, partially offset by higher pulp sales volumes in 2012. Our costs and expenses in 2012 included approximately €13.9 million for regularly scheduled maintenance costs, compared to €17.4 million in 2011. Several competing producers and membersstrengthening of the peer group that we benchmark our performance against now report their financial results in accordance with International Financial Reporting Standards which permit a significant portion of such maintenance costs to be capitalized instead of expensed. Such costs are not charged to EBITDA byU.S. dollar versus the peer group companies but instead are expensed as depreciation.
On average, in 2012, ourCanadian dollar. Our per unit fiber costs decreased by approximately 7% compared to 2011, primarily due to lower fiber costs in Germany caused by decreased demand from the European particle board industry and other regional residual fiber users. Fiber costs atfor our Celgar mill were higher, primarilydecreased during 2014 compared to last year due to the impact of foreign exchange changes more than offsetting improved wood chip availability forstrong sawmill activity in the region. We currently expectOur per unit fiber costs at our German mills declined due to increase slightlysawmills running at high rates, a stronger supply of logs and lower demand from pellet producers and board manufacturers. In 2015, we currently expect our overall per unit fiber costs to be generally flat, largely as a result of the continued strengthening of the U.S. dollar versus the Euro and Canadian dollar, offsetting the impact of an expected slight reduction in the short—German chip supply and increased demand for chips from British Columbia’s coastal mills.
In 2014, our operating income increased to mid-term,$161.8 million from $31.7 million in 2013, primarily due to higher demandpulp price realizations, lower per unit fiber costs, the strengthening of the U.S. dollar and record energy sales volumes.
Interest expense in 2014 decreased to $67.5 million from pellet and board producers which has been compounded by winter weather conditions limiting wood supply, though we expect these costs to be partially offset by price decreases in Canada as a result of strong sawmill activity in British Columbia.
Operating depreciation and amortization increased to €57.8$69.2 million in 2012 from €55.8 million in 2011. Selling, general and administrative expenses marginally decreased to €38.3 million in 2012 from €38.8 million in 2011.
For the year ended December 31, 2012, operating income decreased to €49.0 million from €111.1 million in 2011,2013, primarily due to lower average pulp sales realizations, partiallyindebtedness.
During 2014, we recorded a net gain on the settlement of debt of $3.4 million, which reflected a gain of $31.9 million on our acquisition of all of the shareholder loans of the former noncontrolling shareholder in Stendal, in large part offset by a stronger U.S. dollar relativeloss of $28.5 million on the settlement of debt resulting from the Refinancing.
In 2014, we recorded a non-cash derivative gain of $11.5 million on the mark to market adjustment of our Stendal mill’s interest rate derivative, compared to a net derivative gain of $19.7 million last year.
The noncontrolling shareholder’s interest in the Euro and lower fiber costs.
Interest expenseStendal mill’s net income in 2012 decreased2014 was $7.8 million, compared to €55.8 million from €59.0$0.6 million in 2011,the prior year. We eliminated such noncontrolling interest in the third quarter of 2014.
During 2014, we recorded a net income tax benefit of $16.8 million, compared to a net income tax expense of $9.2 million in 2013, primarily due to reduced debt levelsthe recognition of income tax loss carry-forwards associated with our Stendal millmill.
We had net income attributable to common shareholders of $113.2 million, or $1.82 per basic and $1.81 per diluted share, in 2014, which included a non-cash unrealized gain on the conversioninterest rate derivative of our remaining convertible notes in 2011.$11.5 million, a gain of $3.4 million on the settlement of debt and a deferred income tax benefit of $22.0 million. In 2013, the net loss attributable to common shareholders was $26.4 million, or $0.47 per basic and diluted share, which included a net gain of $19.7 million on the Stendal interest rate derivative and fixed price pulp swaps and a deferred tax provision of $11.5 million.
Transportation costsIn 2014, Operating EBITDA increased by 117% to €71.8$239.8 million from $110.3 million in 2012 from €67.8 million in 2011,2013, primarily as a result of higher pulp prices, lower per unit fiber costs, the strengthening of the U.S. dollar versus the Euro and Canadian dollar and higher energy sales volumes and the impact of foreign exchange on our shipments from Celgar.
In 2012, we recorded an unrealized gain of €1.7 million on the Stendal Interest Rate Swap Contract, compared to an unrealized loss of €1.4 million in 2011, which was primarily the result of an increase in short-term European interest rates. We entered into various fixed pulp swap contracts with a bank in 2012. Under the first contract, 5,000 metric tonnes, referred to as “MT”, of pulp per month was fixed at a price of $915 per MT for each month between May and December of 2012. Under contracts entered into in November 2012, 3,000 MT of pulp per month is fixed at prices ranging from $880 to $890 per MT per month and expire in December 2013. We recorded a gain of approximately €2.0 million related to these swap contracts during the year ended December 31, 2012.
A portion of our long-term debt is denominated and repayable in foreign currencies, principally U.S. dollars. In 2012, we recorded neither a foreign exchange loss or gain on our debt, compared to a gain of €1.2 million in 2011.
We recorded losses on the extinguishment of debt of €0.1 million in each of 2012 and 2011, primarily in connection with the purchase and extinguishment of some of our outstanding Senior Notes.
In 2012, the noncontrolling shareholder’s proportionate interest in the Stendal mill’s income was €1.7 million, compared to €3.9 million in 2011.
In 2012, deferred tax recoveries were €0.1 million, compared to deferred tax recoveries of €2.4 million in 2011, primarily due to the timing of recognizing deferred tax assets based on forecasted income.
In 2012, we reported net loss of €12.2 million, or €0.22 per basic and diluted share. This included an unrealized non-cash gain of €1.7 million on Stendal interest rate derivatives and a realized gain of €1.2 million and an unrealized gain of €0.8 million on pulp price derivatives. In 2011, we reported net income of €50.1 million, or €1.00 per basic and €0.89 per diluted share. This included a non-cash loss of €1.4 million on our Stendal Interest Rate Swap Contract.
In 2012, “Operating EBITDA” decreased to €107.1 million from €167.1 million in 2011.volumes. Operating EBITDA is defined as operating income (loss) plus depreciation and amortization and non-recurring capital asset impairment charges. Management usesWe use Operating EBITDA as a benchmark measurement of itsour own operating results, and as a benchmark relative to itsour competitors. Management considersWe consider it to be a meaningful supplement to operating income as a performance measure primarily because depreciation expense and non-recurring capital asset impairment charges are not an actual cash cost,costs, and depreciation expense varies widely from company to company in a manner that management considerswe consider largely independent of the underlying cost efficiency of theirour operating facilities. In addition, we believe Operating EBITDA is commonly used by securities analysts, investors and other interested parties to evaluate our financial performance.
59
Operating EBITDA does not reflect the impact of a number of items that affect our net income (loss) attributable to common shareholders, including financing costs and the effect of derivative instruments. Operating EBITDA is not a measure of financial performance under the accounting principles generally accepted in the United States of America, referred to as “GAAP”, and should not be considered as an alternative to net income (loss) or income (loss) from operations as a measure of performance, nor as an alternative to net cash from operating activities as a measure of liquidity.
Operating EBITDA has significant limitations as an analytical tool, and should not be considered in isolation, or as a substitute for analysis of our results as reported under GAAP. Some of these limitations are that Operating EBITDA does not reflect: (i) our cash expenditures, or future requirements, for capital expenditures or contractual commitments; (ii) changes in, or cash requirements for, working capital needs; (iii) the significant interest expense, or the cash requirements necessary to service interest or principal payments, on our outstanding debt; (iv) noncontrolling interest oninterests in our Stendal NBSK pulp mill operations;operations prior to our acquisition of 100% of the economic interest of Stendal in September 2014; (v) the impact of realized or marked to market changes in our derivative positions, which can be substantial; and (vi) Operating EBITDA does not reflect the impact of impairment charges against our investments or assets. Because of these limitations, Operating EBITDA should only be considered as a supplemental performance measure and should not be considered as a measure of liquidity or cash available to us to invest in the growth of our business. See the Statement of Cash Flows set out in our consolidated financial statements included herein. Because all companies do not calculate Operating EBITDA in the same manner, Operating EBITDA as calculated by us may differ from Operating EBITDA or EBITDA as calculated by other companies. We compensate for these limitations by using Operating EBITDA as a supplemental measure of our performance and by relying primarily on our GAAP financial statements.
The following table provides a reconciliation of net income (loss) attributable to common shareholders to operating income and Operating EBITDA for the periods indicated:
| Year Ended December 31, | Year Ended December 31, | |||||||||||||||
| 2012 | 2011 | 2014 | 2013 | |||||||||||||
| (in thousands) | (in thousands) | |||||||||||||||
Net income (loss) attributable to common shareholders | € | (12,185 | ) | € | 50,075 | $ | 113,154 | $ | (26,375 | ) | ||||||
Net income attributable to noncontrolling interest | 1,694 | 3,931 | 7,812 | 607 | ||||||||||||
Income tax provision (benefit) | 7,293 | (695 | ) | (16,774 | ) | 9,196 | ||||||||||
Interest expense | 55,805 | 58,995 | 67,516 | 69,156 | ||||||||||||
Loss (gain) on derivative financial instruments | (3,741 | ) | 1,418 | |||||||||||||
Loss on extinguishment of debt | 81 | 71 | ||||||||||||||
Foreign exchange gain on debt | — | (1,175 | ) | |||||||||||||
Gain on settlement of debt | (3,357 | ) | - | |||||||||||||
Gain on derivative instruments | (11,501 | ) | (19,709 | ) | ||||||||||||
Other expense (income) | 58 | (1,501 | ) | 4,948 | (1,215 | ) | ||||||||||
|
|
|
| |||||||||||||
Operating income | 49,005 | 111,119 | 161,798 | 31,660 | ||||||||||||
Add: Depreciation and amortization | 58,052 | 56,005 | 78,012 | 78,645 | ||||||||||||
|
|
|
| |||||||||||||
Operating EBITDA | € | 107,057 | € | 167,124 | $ | 239,810 | $ | 110,305 | ||||||||
|
|
|
| |||||||||||||
Year Ended December 31, 20112013 Compared to Year Ended December 31, 20102012
In the year ended December 31, 2011,2013, pulp revenues decreasedincreased by approximately 3%2% to €831.4$996.2 million from a record €856.3$979.8 million in 2010,2012, primarily due to a weaker U.S. dollar relative tohigher average pulp sales realizations, partially offset by lower sales volume. In 2013, demand from China was stable throughout the Euro. Pulpyear and supply was slightly under-balanced, which resulted in higher prices were higher in the first half of 2011 before declining in the second half because of economic uncertainty in Europe and credit tightening in China. 2013.
In 2011, revenues from the sale of excess2013, surplus energy and chemicals increased by approximately 38%sales marginally decreased to €68.1$92.2 million from €49.3$93.0 million in 2010 due to record energy2012, primarily as a result of lower sales at all of our mills.volumes.
List prices for NBSK pulp in Europe averaged approximately $956 (€687)$864 per ADMT in 2011,2013, compared to $938 (€707)$813 per ADMT in 2010.2012. At the end of 2011,2013, list prices decreased to $825 (€636)were $905 per ADMT in Europe and $990 and $750 per
and $890 (€686) and $670 (€516) per 60
ADMT in North America and China, respectively. Average pulp sales realizations decreasedincreased by approximately 3%4% to €574$683 per ADMT in 20112013 from €591$657 per ADMT in 2010,2012, primarily due to a weaker U.S. dollar relative to the Euro.higher pulp prices. At the end of 2011,2013, reported global inventories for softwood kraft were approximately 3627 days’ supply, while at the end of 20102012 inventories for softwood kraft were approximately 2529 days’ supply.
Pulp sales volume marginally decreased by approximately 2% to 1,427,9241,440,147 ADMTs in 20112013 from 1,428,6381,473,519 ADMTs in 2010.
Pulp production increased to a record level of 1,453,677 ADMTs in 2011 from 1,426,286 ADMTs in 2010,2012, primarily as a result of record annual pulplower production levels at our Celgar mill.
Pulp production decreased to 1,444,475 ADMTs in 2013 from 1,468,275 ADMTs in 2012, primarily due to lower production at our German mills.Celgar mill. In 20112013 and 2010,2012, we took a total of 3533 and 31 days40 days’ scheduled maintenance downtime, respectively, at our mills. During the second quarter of 2013, our Celgar mill took its annual scheduled major maintenance shutdown. As a result of a combination of a lightning strike at the mill and equipment and execution issues, the shutdown which was planned for 11 days took 15 days instead. Further, the start-up of the mill was slower than budgeted. The shutdown and slower start-up resulted in a loss of approximately 30,300 ADMTs of NBSK pulp production (of which approximately 14,300 ADMTs was unplanned) and a consequential loss of energy production.
Costs and expenses increased to €788.4$1,056.7 million in the year ended December 31, 20112013 from €737.9$1,009.7 million in 2010, primarily due to higher fiber costs.
On average, in 2011, our per unit fiber costs increased by approximately 7% compared to 2010, primarily as a result of higher fiber costs at our Celgar mill caused by increased competition for fiber in the second half of 2011. Fiber prices at our German mills also increased slightly, primarily as a result of low harvesting activity in Germany and competition from board producers in the first half of 2011.
Selling, general and administrative expenses increased to €38.8 million in 2011 from €33.3 million in 2010, primarily as a result of a higher non-cash stock compensation expense resulting from a higher share price and increased foreign exchange losses.
Operating depreciation and amortization decreased marginally to €55.8 million in 2011 from €55.9 million in 2010.
For the year ended December 31, 2011, operating income decreased to €111.1 million from €167.7 million in 2010,2012, primarily due to higher fiber costs at our German mills and the impact of a weaker U.S. dollar relative to the Euro on our German mill expenses and restructuring costs, partially offset by lower sales volume. Our costs and expenses in 2013 included approximately $24.7 million for regularly scheduled maintenance costs, compared to $17.9 million in 2012. Several competing producers and members of the peer group that we benchmark our performance against report their financial results in accordance with International Financial Reporting Standards which permit a significant portion of such maintenance costs to be capitalized instead of expensed. Such costs are not charged to EBITDA by the peer group companies but instead are expensed as depreciation.
On average, in 2013, our overall per unit fiber costs increased by approximately 8% compared to 2012, primarily due to a 13% increase in per unit fiber costs in Germany, only partially offset by a 12% decrease in per unit fiber costs in Canada. Fiber costs in Germany were higher energy revenues.because of strong demand from the European pellet and board producers and sawmills, which increased prices for pulp logs, the major source of fiber for the Stendal mill. Further, in 2013, fiber supply in Germany was negatively impacted by several different factors. These included harsh winter conditions at the start of 2013, which later resulted in record flooding and mild, very wet conditions at the end of 2013. All these conditions hampered harvesting and fiber logistics during 2013. Fiber costs at our Celgar mill were lower, primarily due to strong sawmill activity in the region, which reduces Celgar’s need for pulp logs, which are generally a higher cost for the mill than wood chips.
Operating depreciation and amortization increased to $78.3 million in 2013 from $74.3 million in 2012. Selling, general and administrative expenses increased to $51.2 million in 2013 from $49.3 million in 2012.
In 2013, we had restructuring expenses of $6.4 million, primarily related to the workforce reduction at our Celgar mill.
In 2013, operating income decreased to $31.7 million from $63.0 million in 2012, primarily due to higher fiber costs in Germany, the impact of a weaker U.S. dollar relative to the Euro on our German mill expenses and the Celgar restructuring, partially offset by a higher realized sales price.
Interest expense in 20112013 decreased to €59.0$69.2 million from €67.6$71.8 million in 2010,2012, primarily due to the conversion of our convertible notes in 2011, and reduced debt levels of debt associated with our Stendal mill.
Transportation costs marginally increaseddecreased to €67.8$90.0 million in 20112013 from €66.4$92.3 million in 2010.2012, primarily as a result of lower sales volume.
61
In 2011,2013, we recorded an unrealized lossgain of €1.4$22.5 million on the Stendal Interest Rate Swap Contract, compared to an unrealized gain of €1.9$2.2 million in 2010,2012, which was primarily the result of a small decreasean increase in long-termshort-term European interest rates.
A portion of our long-term debt is denominated and repayable in foreign currencies, principally U.S. dollars. In 2011, we We recorded a foreign exchange gain on our debtloss of €1.2approximately $2.8 million in 2011,related to fixed pulp price swap contracts during the year ended December 31, 2013, compared to a lossgain of €6.1$2.6 million in 2010.
During 2011, we recorded losses onduring the extinguishment of debt of €0.1 million, primarily in connection with the purchase and extinguishment of some of our outstanding Senior Notes. In 2010, we recorded losses of €7.5 million, primarily in connection with the purchase of our 2013 Senior Notes.year ended December 31, 2012.
In 2011,2013, the noncontrolling shareholder’s proportionate interest in the Stendal mill’smill was income was €3.9of $0.6 million, compared to €8.5$2.2 million in 2010.2012.
In 2011,2013, we recognized a deferred tax recoveries were €2.4expense of $11.5 million, compared to €9.8 millionprimarily as a result of an increase in 2010, primarily due to the timingvaluation allowance against the carrying value of recognizing deferred tax assets based on forecasted income.our balance sheet, compared to a recovery of $0.2 million in 2012. This is a non-cash charge and does not reduce our underlying tax attributes or hinder our ability to use them. See “— Critical Accounting Policies — Deferred Taxes”.
In 2011,2013, we reported a net income attributable to common shareholdersloss of €50.1$26.4 million, or €1.00$0.47 per basic and €0.89 per diluted share. This included a non-cashnet gain of $19.7 million on Stendal interest rate derivatives and pulp price derivatives, restructuring expenses of $6.4 million and $11.5 million of a deferred tax expense. In 2012, we reported a net loss of €1.4$15.7 million, or $0.28 per basic and diluted share. This included a net gain of $4.8 million on our Stendal Interest Rate Swap Contract. In 2010, we reported net income attributable to common shareholders of €86.3 million, or €2.24 per basicinterest rate derivatives and €1.56 per diluted share. This included aggregate non-cash unrealized losses of €0.5 million, comprised of a non-cash gain of €1.9 million on our Stendal Interest Rate Swap Contract, a non-cash foreign exchange loss of €6.1 million on our long-term debt, a non-cash loss of €2.6 million on the extinguishment of our 2013 Senior Notes and a net non-cash income tax benefit of €6.3 million.fixed price pulp derivatives.
In 2011,2013, “Operating EBITDA” decreased to €167.1$110.3 million from €224.0$137.7 million in 2010.2012 for the same reasons that operating income declined. See the discussion of our results for the year ended December 31, 20122014 compared to the year ended December 31, 20112013 for the definition of Operating EBITDA, significant limitations in Operating EBITDA as an analytical tool and additional information relating to such limitations of Operating EBITDA.
The following table provides a reconciliation of net income (loss) attributable to common shareholders to operating income and Operating EBITDA for the periods indicated:
| Year Ended December 31, | ||||||||
| 2011 | 2010 | |||||||
| (in thousands) | ||||||||
Net income attributable to common shareholders | € | 50,075 | € | 86,279 | ||||
Net income attributable to noncontrolling interest | 3,931 | 8,469 | ||||||
Income tax benefits | (695 | ) | (5,879 | ) | ||||
Interest expense | 58,995 | 67,621 | ||||||
Loss (gain) on derivative financial instruments | 1,418 | (1,899 | ) | |||||
Foreign exchange (gain) loss on debt | (1,175 | ) | 6,126 | |||||
Loss on extinguishment of debt | 71 | 7,494 | ||||||
Other income | (1,501 | ) | (468 | ) | ||||
|
|
|
| |||||
Operating income | 111,119 | 167,743 | ||||||
Add: Depreciation and amortization | 56,005 | 56,231 | ||||||
|
|
|
| |||||
Operating EBITDA | € | 167,124 | € | 223,974 | ||||
|
|
|
| |||||
| Year Ended December 31, | ||||||||
| 2013 | 2012 | |||||||
| (in thousands) | ||||||||
Net income (loss) attributable to common shareholders | $ | (26,375 | ) | $ | (15,670 | ) | ||
Net income attributable to noncontrolling interest | 607 | 2,179 | ||||||
Income tax provision | 9,196 | 9,379 | ||||||
Interest expense | 69,156 | 71,767 | ||||||
Gain on derivative instruments | (19,709 | ) | (4,812 | ) | ||||
Other expense (income) | (1,215 | ) | 179 | |||||
|
|
|
| |||||
Operating income | 31,660 | 63,022 | ||||||
Add: Depreciation and amortization | 78,645 | 74,657 | ||||||
|
|
|
| |||||
Operating EBITDA | $ | 110,305 | $ | 137,679 | ||||
|
|
|
| |||||
Our earnings are sensitive to, among other things, fluctuations in:
NBSK Pulp Price. NBSK pulp is a global commodity that is priced in U.S. dollars, whose markets are highly competitive and cyclical in nature. As a result, our earnings are sensitive to NBSK pulp price changes. Based upon our 20122014 sales volume (and assuming all other factors remained constant), each $10.00 per tonne change in NBSK list pulp prices yields a change in Operating EBITDA of approximately €11.5$12.6 million.
62
Foreign Exchange.As Our operating costs are in Euros for our German mills and Canadian dollars for our Celgar mill and our principal product, NBSK pulp, is principally quoted in U.S. dollars. As a result, our operating costs when translated into U.S. dollars the amount of revenues we generate fluctuateswill fluctuate with changes in the value of the U.S.U.S dollar relative to the Euro.Euro and Canadian dollar. Our business and operating margins have materially benefited from the current strengthening of the U.S. dollar. Based uponon our 2012 revenues,2014 operating costs, each €0.01$0.01 change in the value of the U.S. dollar relative to the Euro and the Canadian dollar yields a total change in annual gross sales revenueoperating costs of approximately €9.8$8.0 million.
Our energy and chemical sales are made in local currencies and, as a result, decline in U.S. dollar terms when the U.S. dollar strengthens. Based on our 2014 chemical and energy revenues, each $0.01 change in the value of the U.S. dollar relative to the Euro and the Canadian dollar yields a total change in chemical and energy revenues of approximately $0.8 million.
Seasonal Influences.We are exposed to fluctuations in quarterly sales volumes and expenses due to seasonal factors. These factors are common in the NBSK pulp industry. We generally have weaker pulp demand in Europe during the summer holiday months and in China in the period relating to its lunar new year. We typically have a seasonal build-up in raw material inventories in the early winter months as theour mills build up their fiber supply for the winter when there is reduced availability.
Liquidity and Capital Resources
Summary of Cash Flows
| Year Ended December 31, | Year Ended December 31, | |||||||||||||||||||||||
| 2012 | 2011 | 2010 | 2014 | 2013 | 2012 | |||||||||||||||||||
| (in thousands) | (in thousands) | |||||||||||||||||||||||
Net cash provided by (used in) operating activities | € | 45,973 | € | 111,055 | € | 91,279 | ||||||||||||||||||
Net cash provided by operating activities | $ | 144,588 | $ | 36,325 | $ | 59,115 | ||||||||||||||||||
Net cash provided by (used in) investing activities | (23,838 | ) | (46,318 | ) | (36,049 | ) | (49,105 | ) | (44,968 | ) | (30,610 | ) | ||||||||||||
Net cash provided by (used in) financing activities | (22,865 | ) | (60,064 | ) | (6,128 | ) | (175,752 | ) | 15,233 | (29,667 | ) | |||||||||||||
Effect of exchange rate on changes in cash and cash equivalents | (103 | ) | 1,377 | (1,371 | ) | (14,287 | ) | 3,699 | 2,302 | |||||||||||||||
|
|
|
|
|
| |||||||||||||||||||
Net increase (decrease) in cash and cash equivalents | € | (833 | ) | € | 6,050 | € | 47,731 | $ | (94,556 | ) | $ | 10,289 | $ | 1,140 | ||||||||||
|
|
|
|
|
| |||||||||||||||||||
Cash Flows from Operating Activities.We operate in a cyclical industry and our operating cash flows vary accordingly. Our principal operating cash expenditures are for labor, fiber, chemicals and debt service.
Working capital levels fluctuate throughout the year and are affected by maintenance downtime, changing sales patterns, seasonality and the timing of receivables and the payment of payables and expenses. Generally, finished goods inventories are increased prior to scheduled maintenance downtime to maintain sales volume while production is stopped. Our fiber inventories exhibit seasonal swings as we increase pulp log and wood chip inventories to ensure adequate supply of fiber to our mills during the winter months. Changes in sales volume can affect the level of receivables and influence overall working capital levels. We believe our management practices with respect to working capital conform to common business practices.
Cash provided by operating activities in 2012 declined2014 increased to €46.0$144.6 million from €111.1$36.3 million in 20112013 and €91.3 million in 2010 due to decreased operating income as a result of lower average pulp sales realizations. A decrease in receivables, excluding non-cash items, provided cash of €8.4$59.1 million in 2012 due to higher operating income. An increase in receivables used cash of $25.1 million in 2014, compared to increases in receivables usingproviding cash of €1.6$14.0 million in 20112013 and €40.0$10.8 million in 2010.2012. A decrease in inventories provided cash of €1.3$6.4 million in 2012,2014, compared to increasesan increase in inventories using cash of €17.7$14.6 million in 20112013 and €24.5a decrease in inventories providing cash of $1.7 million in 2010.2012. A decrease in accounts payable and accrued expenses used cash of €14.0$5.4 million in 2012,2014, compared to an increase in accounts payable and accrued expenses providing cash of €14.3$11.6 million in 20112013 and a decrease in accounts payable and accrued expenses using cash of €3.1$18.0 million in 2010.2012.
63
Cash Flows from Investing Activities. Investing activities in 2014 used cash of $49.1 million, primarily related to capital expenditures of $34.6 million and intangible asset purchases of $4.8 million, primarily related to our ERP project. Investing activities in 2013 used cash of $45.0 million, primarily due to capital spending of $45.7 million. Investing activities in 2012 used cash of €23.8$30.6 million, primarily related towhich included capital expenditures of €36.7 million. The$47.2 million, partially offset by the maturity of government bonds in 2012which provided cash of €12.2$15.8 million. Investing activities in 2011
In 2014, capital expenditures, primarily related to a new chip screening project and a logistics warehousing project at our Celgar mill and an automated chip reclamation project and a new tall oil plant at our Rosenthal mill, used cash of €46.3 million,$34.6 million. In 2013, capital expenditures, primarily duerelated to capital spending of €37.8 million and the purchase of marketable securities of €12.2 million. Investing activities in 2010Project Blue Mill, used cash of €36.0 million, primarily due to capital spending of €38.3$45.7 million.
In 2012, capital expenditures, primarily related to Project Blue Mill and the recovery boiler upgrade at our Rosenthal mill, used cash of €36.7 million. In 2011, capital expenditures, primarily related to various projects at our mills, used cash of €37.8 million. In 2010, capital expenditures, primarily related to the Celgar Energy Project, used cash of €38.3$47.2 million.
Cash Flows from Financing Activities. In 2014, financing activities used cash of $175.8 million, primarily due to the repurchase of the 2017 Senior Notes and the payout and discharge of the Prior Stendal Facilities, which used cash of approximately $891.0 million, and the payment of $20.2 million in associated costs, partially offset by the issuance of shares of our common stock, which provided cash of approximately $53.9 million, the issuance of our 2019 and 2022 Senior Notes, which provided cash of $650.0 million and borrowings on our credit facilities, which provided cash of $26.3 million. In 2014, we received $6.7 million in government grants. In 2013, financing activities provided net cash of $15.2 million, primarily due to borrowings by the Stendal mill under the Blue Mill loan facility, which provided cash of $22.2 million, and the issuance of an additional $50.0 million of 2017 Senior Notes, which provided cash of $52.3 million, partially offset by principal repayments under Stendal’s project finance facility, which used cash of $55.0 million. In 2013, we received $9.3 million in government grants. In 2012, financing activities used net cash of €22.9$29.7 million, primarily due to €24.6$32.1 million used to repay principal under the Prior Stendal Loan Facility and €1.6$2.0 million to purchase and extinguish some of our 2017 Senior Notes. In 2012, we received €3.9$5.0 million in government grants. In 2011, financing activities used net cash of €60.1 million, primarily due to using cash of €15.2 million to redeem all of our remaining 2013 Senior Notes, €23.2 million to repay principal under the Stendal Loan Facility, €14.7 million to repay the balance of our Celgar Working Capital Facility, €7.5 million to purchase shares of our common stock and €9.7 million to purchase and extinguish some of our Senior Notes. In 2011, we received
€14.2 million in government grants. In 2010, financing activities used net cash of €6.1 million, primarily due to cash used to repurchase our 2013 Senior Notes and €13.9 million in cash used to pay down the Stendal Loan Facility, partially offset by the receipt of €16.7 million in government grants for the Celgar Energy Project and the proceeds received from the sale of the Senior Notes.
The following table is a summary of selected financial information for the dates indicated:
| December 31, | December 31, | |||||||||||||||
| 2012 | 2011 | 2014 | 2013 | |||||||||||||
| (in thousands) | (in thousands) | |||||||||||||||
Financial Position | ||||||||||||||||
Cash and cash equivalents | € | 104,239 | € | 105,072 | $ | 53,172 | $ | 147,728 | ||||||||
Marketable securities | 184 | 12,372 | (1) | |||||||||||||
Working capital | 208,573 | 247,159 | $ | 262,332 | $ | 291,514 | ||||||||||
Total assets | 1,183,603 | 1,217,250 | $ | 1,326,807 | $ | 1,548,559 | ||||||||||
Long-term liabilities | 768,253 | 807,641 | $ | 772,424 | $ | 1,019,983 | ||||||||||
Total equity | 278,925 | 283,542 | $ | 438,880 | $ | 348,317 | ||||||||||
Our principal sources of funds are cash flows from operations, cash and cash equivalents on hand and theour revolving working capital loan facilities for our Celgar and Rosenthal mills.facilities. Our principal uses of funds consist of operating expenditures, payments of principal and interest on the Stendal Loan Facility, capital expenditures and interest payments on our outstanding 2019 and 2022 Senior Notes.
As at December 31, 2012,2014, our cash and cash equivalents were €104.2$53.2 million, compared to cash and cash equivalents and short-term German federal government bonds aggregating €117.3of $147.7 million at the end of 2011.2013. As at the end of 2014, we also had cash of $10.3 million held by Stendal used to secure the Stendal Interest Rate Swap Contract.
As at December 31, 2012,2014, we had approximately €26.2 million and C$24.0$133.0 million available under our Rosenthal and Celgar facilities, respectively.revolving credit facilities.
64
In 2013,2015, excluding amounts being financed through government grants, we currently expect capital expenditures to be approximately €29.0$56.0 million, primarily related to Project Blue Milla wastewater reduction project, additional spending on the automated chip reclamation project and various smallermaintenance at the Rosenthal mill, wastewater reduction and maintenance projects at all of our mills. In 2012, we committed to implementing Project Blue Mill at a cost of €40.0 million, which will primarily be funded through €12.0 million of non-refundable German government grants and the €17.0 million Blue Mill Facility. The balance of Project Blue Mill will be funded through operating cash flow of the Stendal mill, a small log project, a logistics warehousing project and up to an aggregate €6.5 million in pro rata shareholder loans from usmaintenance projects at the Celgar mill and Stendal’s noncontrolling shareholder.additional spending on the ERP software implementation project across the entire company.
As at December 31, 2012, other then planned capital expenditures,2014, we had no material commitments to acquire assets or operating businesses.
Based upon the current level of operations and our current expectations for future periods in light of the current economic environment, and in particular, current and expected pulp pricing and foreign exchange rates, we believe that cash flow from operations and available cash, together with available borrowings under our Celgar Working Capital Facility and Rosenthal Loan Facility,revolving credit facilities, will be adequate to meet the future liquidity needs during the next 12 months.
In the future we may make acquisitions of businesses or assets or commitments to additional capital projects. To achieve the long-term goals of expanding our assets and earnings, including through acquisitions, capital resources will be required. Depending on the size of a transaction, the capital resources that will be required can be substantial. The necessary resources will be generated from cash flow from operations, cash on hand, borrowing against our assets or the issuance of securities.
DebtCredit Facility and Debt Covenants
We had the following amounts outstanding under our debtcredit facilities, 2017 Senior Notes, 2019 Senior Notes and 2022 Senior Notes as at the dates indicated:
| December 31, | ||||||||
| 2012 | 2011 | |||||||
| (in thousands) | ||||||||
Rosenthal Loan Facility | € | — | € | — | ||||
Rosenthal Investment Loan | 1,632 | 2,719 | ||||||
Rosenthal revolving €3.5 million facility | — | — | ||||||
Celgar Working Capital Facility | 4,574 | — | ||||||
Senior Notes | 215,670 | 220,753 | ||||||
Stendal Loan Facility | 452,907 | 477,490 | ||||||
Blue Mill Facility | — | n/a | ||||||
| December 31, | ||||||||
| 2014 | 2013 | |||||||
| (in thousands) | ||||||||
Rosenthal Loan Facility | $ | - | $ | - | ||||
Rosenthal Investment Loan | $ | - | $ | 749 | ||||
Rosenthal revolving €5.0 million facility | $ | - | $ | - | ||||
Celgar Working Capital Facility | $ | - | $ | - | ||||
2017 Senior Notes | $ | - | $ | 336,382 | ||||
2019 Senior Notes | $ | 250,000 | $ | - | ||||
2022 Senior Notes | $ | 400,000 | $ | - | ||||
Stendal project finance facility | $ | - | $ | 568,945 | ||||
Blue Mill loan facility | $ | - | $ | 21,179 | ||||
New Stendal Revolving Credit Facility | $ | 25,412 | $ | - | ||||
For a description of such indebtedness, see “Item 1—Business—“Part I. – Item 1. Business – Description of Certain Indebtedness”.
Certain of our long-term obligations contain various financial tests and covenants customary to these types of arrangements.
TheUnder the New Stendal LoanRevolving Credit Facility, contains an annual debt service cover ratio which, pursuant to the terms of the Amendment,our Stendal mill must not fall below 1.1x for the period from December 31, 2011 to December 31, 2013 and 1.2x for the period after January 1, 2014 until maturity on September 30, 2017. The Amendment also implementsexceed a permitted leverage ratio of totalnet debt to EBITDA which is effective from December 31, 2009. Thisof 2.50:1 in any 12-month period and there must be a ratio is setof EBITDA to decline over time from 13.0x on its effective dateinterest expense equal to 4.5x on June 30, 2017. Failureor in excess of 1.20:1 for each 12-month period. Additionally, current assets to comply with either ratio constitutes an event of default, but may be cured by the shareholders of Stendal with a once-per-fiscal-year ratio deficiency cure through a capital contributioncurrent liabilities must equal or subordinated loan in the amount necessary to cure such deficiency. The Stendal Blue Mill Facility requires the Stendal mill to maintain similar debt service and leverage ratios as the Stendal Loan Facility and contains similar cure provisions.exceed 1.1:1.
Under the Rosenthal Loan Facility, our Rosenthal mill must not exceed a ratio of net debt to EBITDA of 3:1 in any 12-month period and there must be a ratio of EBITDA to interest expense equal to or in excess of 1.2:1.0 for each 12 month period. Additionally, current assets to current liabilities must equal or exceed 1.1:1.0.
65
The Celgar Working Capital Facility includes a covenant that, for so long as the excess amount under the facility is less than C$2.05.0 million, then until it becomes equal to or greater than such amount, the Celgar mill must maintain a fixed charge coverage ratio of not less than 1.1:1.0 for each 12-month period.
The New Stendal LoanRevolving Credit Facility is provided by a syndicate of elevenfour financial institutions the Stendal Blue Mill Facility by two financial institutions and each of our Celgar Working Capital Facility and our Rosenthal Loan Facilityfacilities are each provided by one financial institution. To date we have not experienced any reductions in credit availability with respect to these credit facilities. However, if any of these financial institutions were to default on their commitment to fund, we could be adversely affected.
The indentureindentures governing the 2019 and 2022 Senior Notes doesdo not contain any financial maintenance covenants and there are no scheduled principal payments until maturity. We pay interestInterest on our 2019 Senior Notes at the rate of 9.5%is payable semi-annually in arrears on June 1 and December 1, commencing June 1, 2015, at the rate of each year7.000% and they mature in December 2017.2019. Interest on our 2022 Senior Notes is payable semi-annually in arrears on June 1 and December 1, commencing June 1, 2015, at the rate of 7.750% and they mature in December 2022.
As at December 31, 2012,2014, we were in full compliance with all of the covenants of our indebtedness.
At December 31, 20122014 and 2011,2013, we had no off-balance-sheetoff-balance sheet arrangements.
Contractual Obligations and Commitments
The following table sets out our contractual obligations and commitments as at December 31, 2012.2014.
| Payments Due By Period | Payments Due By Period | |||||||||||||||||||||||||||||||||||||||
Contractual Obligations | 2013 | 2014-2015 | 2016-2017 | Beyond 2017 | Total | 2015 | 2016-2017 | 2018-2019 | Beyond 2019 | Total | ||||||||||||||||||||||||||||||
| (in thousands) | (in thousands) | |||||||||||||||||||||||||||||||||||||||
Long-term debt(1) | € | 5,662 | € | 544 | € | 252,290 | € | — | € | 258,496 | ||||||||||||||||||||||||||||||
Debt, Stendal(2) | 40,000 | 84,000 | 328,907 | — | 452,907 | |||||||||||||||||||||||||||||||||||
Debt(2) | $ | 12,101 | $ | - | $ | 275,412 | $ | 400,000 | $ | 687,513 | ||||||||||||||||||||||||||||||
Interest rate derivative | 14,832 | 17,962 | - | - | 32,794 | |||||||||||||||||||||||||||||||||||
Interest on debt(3) | 41,854 | 65,078 | 73,507 | — | 180,439 | 51,648 | 100,669 | 100,042 | 93,000 | 345,359 | ||||||||||||||||||||||||||||||
Capital lease obligations(4) | 1,998 | 2,807 | 2,048 | 2,900 | 9,753 | 3,088 | 5,165 | 4,120 | 571 | 12,944 | ||||||||||||||||||||||||||||||
Operating lease obligations(5) | 2,973 | 3,080 | 1,803 | 1,553 | 9,409 | 1,994 | 2,484 | 2,006 | - | 6,484 | ||||||||||||||||||||||||||||||
Purchase obligations(6) | 14,911 | 1,484 | 852 | 331 | 17,578 | 2,501 | - | - | - | 2,501 | ||||||||||||||||||||||||||||||
Other long-term liabilities(7) | 2,194 | 1,557 | 1,812 | 5,615 | 11,178 | 4,953 | 7,009 | 7,387 | 19,682 | 39,031 | ||||||||||||||||||||||||||||||
|
|
|
|
|
|
|
|
|
| |||||||||||||||||||||||||||||||
Total | € | 109,592 | € | 158,550 | € | 661,219 | € | 10,399 | € | 939,760 | $ | 91,117 | $ | 133,289 | $ | 388,967 | $ | 513,253 | $ | 1,126,626 | ||||||||||||||||||||
|
|
|
|
|
|
|
|
|
| |||||||||||||||||||||||||||||||
| (1) | We have identified approximately $4.8 million of asset retirement obligations. However, due to the uncertain timing related to these potential liabilities, we are unable to allocate the payments in the contractual obligations table. |
| (2) | This reflects the future principal payments due under our long-term debt |
| (3) | Amounts presented for interest payments |
| (4) | Capital lease obligations relate to transportation vehicles and production equipment. These amounts reflect principal and interest. |
| (5) | Operating lease obligations relate to transportation vehicles and other production and office equipment. |
| (6) | Purchase obligations relate primarily to take-or-pay contracts, including for purchases of raw materials, made in the ordinary course of business. |
| (7) | Other long-term liabilities relate primarily to future payments that will be made for post-employment |
OurEffective October 1, 2013, our reporting currency is the Euro as the majority of our business transactions are denominated in Euros.U.S. dollar. However, we hold certain assets and liabilities in U.S.Euros and Canadian dollars and the majority of our expenditures are denominated in Euros or Canadian dollars. Accordingly, our consolidated financial results are subject to foreign currency exchange rate fluctuations.
66
We translate foreign denominated assets and liabilities into EurosU.S. dollars at the rate of exchange on the balance sheet date. Equity accounts are translated using historical exchange rates. Unrealized gains or losses from these translations are recorded in our Consolidated Statement of Comprehensive Income (Loss) and do not affect our net earnings.
In the year ended December 31, 2012,2014, we reported a net €4.5$81.0 million foreign currency translation gainloss and, as a result, the cumulative foreign exchange translation gain reported within accumulated other comprehensive income (loss) increaseddecreased to €41.0a loss of $33.3 million as at December 31, 2012.2014. In the year ended December 31, 2011,2013, we reported a net €2.3$1.7 million foreign currency translation loss.
Based upon the exchange rate at December 31, 2012,2014, the U.S. dollar has decreasedincreased by approximately 2%12% in value against the Euro and increased by approximately 8% in value against the Canadian dollar since December 31, 2011.2013. See “Item 7A—7A. Quantitative and Qualitative Disclosures about Market Risk”.
Results of Operations of the Restricted Group under Our Senior Note Indenture
General
The indenture governing our Senior Notes requires that we also provide a discussion in annual and quarterly reports we file with the SEC under Management’s Discussion and Analysis of Financial Condition and Results of Operations of the results of operations and financial condition of Mercer Inc. and our restricted subsidiaries under the indenture, referred to as the “Restricted Group”. The Restricted Group is comprised of Mercer Inc., our Rosenthal and Celgar mills and certain holding subsidiaries. The Restricted Group excludes our Stendal mill.
Summary Financial Highlights for the Restricted Group
| Year Ended December 31, | ||||||||||||
| 2012 | 2011 | 2010 | ||||||||||
| (in thousands of Euros, other than per share amounts) | ||||||||||||
Pulp revenues | € | 423,943 | € | 473,992 | € | 490,020 | ||||||
Energy and chemical revenues | 28,489 | 25,473 | 15,145 | |||||||||
Operating income | 7,631 | 62,943 | 93,691 | |||||||||
Gain (loss) on derivative instruments | 2,028 | — | — | |||||||||
Foreign exchange gain (loss) on debt | — | 1,175 | (6,126 | ) | ||||||||
Income tax benefit (provision) | (5,482 | ) | (4,614 | ) | 8,651 | |||||||
Net income (loss) | (14,221 | ) | 39,809 | 62,327 | ||||||||
Selected Production, Sales and Other Data for the Restricted Group
Selected production, sales and exchange rate data for the Restricted Group for the periods indicated:
| Year Ended December 31, | ||||||||||||
| 2012 | 2011 | 2010 | ||||||||||
Restricted Group | ||||||||||||
Pulp Production (‘000 ADMTs) | 828.0 | 832.4 | 826.3 | |||||||||
Scheduled Production Downtime (‘000 ADMTs) | 32.8 | 24.5 | 25.3 | |||||||||
Scheduled Production Downtime (days) | 30 | 20 | 21 | |||||||||
Pulp Sales (‘000 ADMTs) | 826.9 | 823.2 | 826.3 | |||||||||
Average NBSK pulp list prices in Europe ($/ADMT)(1) | $ | 813 | $ | 956 | $ | 938 | ||||||
Average NBSK pulp list prices in Europe (€/ADMT) | € | 632 | € | 687 | € | 707 | ||||||
Average pulp sales realizations (€/ADMT)(2) | € | 512 | € | 575 | € | 592 | ||||||
Energy Production (‘000 MWh) | 930.1 | 893.7 | 718.6 | |||||||||
Energy Sales (‘000 MWh) | 341.6 | 301.4 | 194.2 | |||||||||
Average energy sales realizations (€/MWh) | € | 83 | € | 85 | € | 78 | ||||||
Average Spot Currency Exchange Rates | ||||||||||||
€ / $(3) | 0.7782 | 0.7186 | 0.7541 | |||||||||
C$ / $(3) | 0.9995 | 0.9887 | 1.0298 | |||||||||
C$ / €(4) | 1.2850 | 1.3761 | 1.3671 | |||||||||
The following is a discussion of the results of operations and financial condition of the Restricted Group. For further information regarding the Restricted Group including, without limitation, a reconciliation to our consolidated results of operations, see Note 20 of the consolidated financial statements included in this annual report on Form 10-K.
Year Ended December 31, 2012 Compared to Year Ended December 31, 2011
Pulp revenues for the Restricted Group for the year ended December 31, 2012 decreased by approximately 11% to €423.9 million from €474.0 million in the comparative period of 2011, primarily due to lower average pulp sales realizations, partially offset by higher sales volumes and a stronger U.S. dollar relative to the Euro. The U.S. dollar was approximately 8% stronger versus the Euro in 2012 compared to 2011.
In 2012, revenues from the sale of excess energy increased by approximately 12% to a record €28.5 million from €25.5 million in 2011, primarily due to record annual energy sales at both our Rosenthal and Celgar mills.
Pulp prices were lower in 2012 than in 2011. Average list prices for NBSK pulp in Europe were $813 (€632) per ADMT in 2012, compared to $956 (€687) per ADMT in 2011. In China, average list prices were $655 (€497) per ADMT in 2012 and $834 (€599) per ADMT in 2011. In 2012, average pulp sales realizations for the Restricted Group decreased by approximately 11% to €512 per ADMT from €575 per ADMT in the previous year.
Pulp sales volume of the Restricted Group marginally increased to 826,921 ADMTs in 2012 from 823,183 ADMTs in 2011.
Pulp production for the Restricted Group decreased to 827,977 ADMTs in 2012 from 832,396 ADMTs in 2011. In 2012 and 2011, our Celgar and Rosenthal mills had an aggregate of 30 days (approximately 32,800 ADMTs) and 20 days (approximately 24,500 ADMTs) of scheduled maintenance downtime, respectively, and expect to take approximately 23 days in 2013.
Costs and expenses for the Restricted Group in 2012 increased to €444.8 million from €436.5 million in 2011, primarily due to foreign exchange and higher sales volumes, partially offset by lower fiber costs during the year. The Restricted Group’s costs and expenses in 2012 included approximately €7.5 million for regularly scheduled maintenance costs, compared to €9.8 million in 2011. Several competing producers and members of the peer group that we benchmark the Restricted Group’s performance against now report their financial results in accordance with International Financial Reporting Standards which permit a significant portion of such maintenance costs to be capitalized instead of expensed. Such costs are not charged to EBITDA by the peer group companies but instead are expensed as depreciation.
Overall, per unit fiber costs of the Restricted Group decreased by approximately 3% in 2012 compared to 2011, primarily due to decreased fiber costs in Germany, partially offset by increased fiber costs in Canada.
In 2012, operating depreciation and amortization for the Restricted Group increased to €31.2 million from €29.8 million in the same period last year. Selling, general and administrative expenses marginally increased to €24.6 million from €24.1 million in 2011.
In 2012, the Restricted Group reported operating income of €7.6 million, compared to operating income of €62.9 million in 2011, primarily due to lower average pulp sales realizations, partially offset by a stronger U.S. dollar relative to the Euro and lower fiber costs in 2012.
Transportation costs for the Restricted Group marginally increased to €51.4 million in 2012 from €50.8 million in 2011.
Interest expense for the Restricted Group decreased to €23.4 million in 2012 from €24.9 million in 2011, primarily due to the conversion of our convertible notes in 2011.
Most of the long-term debt of the Restricted Group is denominated and repayable in foreign currencies, principally in U.S. dollars. In 2012, the Restricted Group recorded neither a loss nor gain on foreign currency denominated debt, compared to a gain of €1.2 million in 2011.
The Restricted Group recorded a loss of approximately €0.1 million on the purchase and subsequent extinguishment of some of our Senior Notes in each of 2012 and 2011.
During 2012, the Restricted Group recorded €5.5 million of net income tax expense, compared to €4.6 million in 2011.
For the reasons discussed above, the Restricted Group reported net loss for 2012 of €14.2 million, compared to net income of €39.8 million in 2011 and Operating EBITDA of €39.1 million, compared to Operating EBITDA of €93.0 million in the comparative period of 2011. See the discussion of our results for the year ended December 31, 2012 compared to the year ended December 31, 2011 for the definition of Operating EBITDA, significant limitations in Operating EBITDA as an analytical tool and additional information relating to such limitations and Operating EBITDA.
The following table provides a reconciliation of net income (loss) to operating income and Operating EBITDA for the Restricted Group for the periods indicated:
| Year Ended December 31, | ||||||||
| 2012 | 2011 | |||||||
| (in thousands) | ||||||||
Restricted Group(1) | ||||||||
Net income (loss) | € | (14,221 | ) | € | 39,809 | |||
Income tax provision | 5,482 | 4,614 | ||||||
Interest expense | 23,425 | 24,886 | ||||||
Gain on derivative instruments | (2,028 | ) | — | |||||
Foreign exchange (gain) loss on debt | — | (1,175 | ) | |||||
Loss on extinguishment of debt | 81 | 71 | ||||||
Other income | (5,108 | ) | (5,262 | ) | ||||
|
|
|
| |||||
Operating income | 7,631 | 62,943 | ||||||
Add: Depreciation and amortization | 31,471 | 30,086 | ||||||
|
|
|
| |||||
Operating EBITDA | € | 39,102 | € | 93,029 | ||||
|
|
|
| |||||
|
Year Ended December 31, 2011 Compared to Year Ended December 31, 2010
Pulp revenues for the Restricted Group for the year ended December 31, 2011 slightly decreased by approximately 3% to €474.0 million from €490.0 million in the comparative period of 2010, primarily due to a weaker U.S. dollar. In 2011, revenues from the sale of excess energy increased by 68% to a record €25.5 million from €15.1 million in 2010, primarily due to record annual energy sales at both our Rosenthal and Celgar mills.
Pulp prices were higher in 2011 than in 2010. Average list prices for NBSK pulp in Europe were $956 (€687) per ADMT in 2011, compared to $938 (€707) per ADMT in 2010. In China, average list prices were $834 (€599) per ADMT in 2011 and $821 (€618) per ADMT in 2010. In 2011, average pulp sales realizations for the Restricted Group decreased by approximately 3% to €575 per ADMT from €592 per ADMT in the previous year.
Pulp sales volume of the Restricted Group marginally decreased to 823,183 ADMTs in 2011 from 826,340 ADMTs in 2010.
Pulp production for the Restricted Group increased to 832,396 ADMTs in 2011 from 826,301 ADMTs in 2010, primarily as a result of record annual production at our Rosenthal mill. In 2011, our Celgar and Rosenthal mills had an aggregate of 20 days (approximately 24,500 ADMTs) of scheduled maintenance downtime, compared to 21 days (approximately 25,300 ADMTs) of scheduled maintenance downtime in 2010.
Costs and expenses for the Restricted Group in 2011 increased to €436.5 million from €411.5 million in 2010, primarily due to higher fiber costs.
Overall, per unit fiber costs of the Restricted Group increased by approximately 9% in 2011 compared to 2010, primarily due to higher fiber costs at our Celgar mill caused by increased competition for fiber.
In 2011, operating depreciation and amortization for the Restricted Group decreased marginally to €29.8 million from €30.0 million in the same period last year.
Selling, general and administrative expenses increased to €24.1 million from €20.2 million in 2010, primarily as a result of a higher non-cash stock compensation expense resulting from a higher share price and increased foreign exchange losses.
In 2011, the Restricted Group reported operating income of €62.9 million, compared to operating income of €93.7 million in 2010, primarily due to higher fiber costs in 2011 and a weaker U.S. dollar.
Transportation costs for the Restricted Group marginally increased to €50.8 million in 2011 from €50.5 million in 2010.
Interest expense for the Restricted Group decreased to €24.9 million in 2011 from €31.5 million in 2010, primarily due to the conversion of our convertible notes in 2011.
Most of the long-term debt of the Restricted Group is denominated and repayable in foreign currencies, principally in U.S. dollars. In 2011, the Restricted Group recorded a gain on foreign currency denominated debt of €1.2 million, compared to a loss of €6.1 million in 2010.
During 2011, the Restricted Group recorded a loss of approximately €0.1 million on the purchase and subsequent extinguishment of some of our Senior Notes. In 2010, the Restricted Group recorded a loss of approximately €7.5 million on the extinguishment of the 2013 Senior Notes.
During 2011, the Restricted Group recorded €4.6 million of net income tax expense, compared to net income tax recoveries of €8.7 million in 2010, primarily due to the timing of recognizing deferred tax assets based on forecasted income. The tax recoveries in 2010 reflected our expectation that certain of our tax assets will be utilized to reduce taxable income in the future.
For the reasons discussed above, the Restricted Group reported net income for 2011 of €39.8 million, compared to net income of €62.3 million in 2010 and Operating EBITDA of €93.0 million, compared to Operating EBITDA of €124.0 million in the comparative period of 2010. See the discussion of our consolidated results for the year ended December 31, 2012 compared to the year ended December 31, 2011 for the definition of Operating EBITDA, significant limitations in Operating EBITDA as an analytical tool and additional information relating to such limitations and Operating EBITDA.
The following table provides a reconciliation of net income to operating income and Operating EBITDA for the Restricted Group for the periods indicated:
| Year Ended December 31, | ||||||||
| 2011 | 2010 | |||||||
| (in thousands) | ||||||||
Restricted Group(1) | ||||||||
Net income | € | 39,809 | € | 62,327 | ||||
Income tax (benefits) | 4,614 | (8,651 | ) | |||||
Interest expense | 24,886 | 31,498 | ||||||
Foreign exchange (gain) loss on debt | (1,175 | ) | 6,126 | |||||
Loss on extinguishment of debt | 71 | 7,494 | ||||||
Other income | (5,262 | ) | (5,103 | ) | ||||
|
|
|
| |||||
Operating income | 62,943 | 93,691 | ||||||
Add: Depreciation and amortization | 30,086 | 30,270 | ||||||
|
|
|
| |||||
Operating EBITDA | € | 93,029 | € | 123,961 | ||||
|
|
|
| |||||
|
Liquidity and Capital Resources
Summary of Cash Flows
| Year Ended December 31, | ||||||||||||
| 2012 | 2011 | 2010 | ||||||||||
| (in thousands) | ||||||||||||
Net cash provided by (used in) operating activities | € | (2,590 | ) | € | 66,679 | € | 54,581 | |||||
Net cash provided by (used in) investing activities | (9,359 | ) | (38,508 | ) | (33,311 | ) | ||||||
Net cash provided by (used in) financing activities | 3,937 | (35,373 | ) | 10,120 | ||||||||
Effect of exchange rate on changes in cash and cash equivalents | (103 | ) | 1,377 | (1,371 | ) | |||||||
Net increase (decrease) in cash and cash equivalents | (8,115 | ) | (5,825 | ) | 30,019 | |||||||
Cash Flows from Operating Activities. Operating activities for the Restricted Group used cash of €2.6 million in 2012 compared to providing cash of €66.7 million in 2011 and €54.6 million in 2010. An increase in receivables used cash of €0.6 million in 2012, compared to a decrease in receivables providing cash of €3.3 million in 2011 and an increase in receivables using cash of €25.9 million in 2010. An increase in inventories used cash of €4.0 million in 2012, compared to an increase in inventories using cash of €10.2 million in 2011 and €2.9 million in 2010. A decrease in accounts payable and accrued expenses used cash of €7.4 million in 2012, compared to an increase in accounts payable and accrued expenses providing cash of €5.9 million in 2011 and a decrease in accounts payable and accrued expenses using cash of €10.3 million in 2010.
Cash Flows from Investing Activities.Investing activities used cash of €9.4 million, €38.5 million and €33.3 million in 2012, 2011 and 2010, respectively. In 2012, capital expenditures used cash of €21.9 million primarily related to various projects at our Rosenthal and Celgar mills, including €9.3 million relating to the recovery upgrade project at our Rosenthal mill. Capital expenditures in 2011 and 2010 used cash of €29.5 million and €34.7 million, respectively.
Cash Flows from Financing Activities.Financing activities provided net cash of €3.9 million in 2012, primarily due to cash of €4.6 million provided from proceeds from our credit facilities and €3.1 million provided from government grants, primarily offset by the use of €2.7 million to purchase and extinguish some of our Senior Notes and make scheduled payments for the Rosenthal Investment Loan. Financing activities used net cash of €35.4 million in 2011 and provided net cash of €10.1 million in 2010.
Balance Sheet Data of the Restricted Group
The following table is a summary of selected financial information for the Restricted Group for the dates indicated:
| December 31, | ||||||||
| 2012 | 2011 | |||||||
| (in thousands) | ||||||||
Restricted Group Financial Position(1) | ||||||||
Cash and cash equivalents | € | 36,714 | € | 44,829 | ||||
Marketable securities | 184 | 12,372 | (2) | |||||
Working capital | 132,130 | 149,973 | ||||||
Total assets | 644,119 | 658,844 | ||||||
Long-term liabilities | 260,185 | 262,770 | ||||||
Total equity | 335,353 | 344,415 | ||||||
Sources and Uses of Funds of the Restricted Group
The Restricted Group’s principal sources of funds are cash flows from operations, cash and cash equivalents on hand and the revolving working capital loan facilities for our Celgar and Rosenthal mills. The Restricted Group’s principal uses of funds consist of operating expenditures, capital expenditures and interest payments on our outstanding Senior Notes.
As at December 31, 2012, the Restricted Group’s cash and cash equivalents were €36.7 million, compared to cash and cash equivalents and short-term German federal government bonds aggregating €57.0 million at the end of 2011.
As at December 31, 2012, we had €26.2 million available under the credit facilities related to the Rosenthal mill and C$24.0 million under the Celgar Working Capital Facility.
In 2013, excluding amounts being financed by governmental grants, we currently expect capital expenditures to be approximately €11.5 million, primarily for various small projects at the Rosenthal and Celgar mills.
We expect the Restricted Group to meet its interest and debt service obligations and meet the working and maintenance capital requirements for its current operations from cash flow from operations, cash and cash equivalents on hand, the Rosenthal Loan Facility and the Celgar Working Capital Facility.
In the future we may make acquisitions of businesses or assets or commitments to additional projects. To achieve the long-term goals of expanding our assets and earnings, including through acquisitions, capital resources will be required. Depending on the size of a transaction, the capital resources that will be required can be substantial. The necessary resources will be generated from cash flow from operations, cash on hand, borrowing against our assets or the issuance of securities.
Credit Ratings of 2019 and 2022 Senior Notes
Standard & Poor’s Rating Services, referred to as “S&P”, and Moody’s Investors Service, Inc., referred to as “Moody’s”, base their assessment of the credit risk on our 2019 and 2022 Senior Notes on the business and financial profile of Mercer Inc. and our restricted subsidiaries under the Restricted Group only.indentures governing the 2019 and 2022 Senior Notes. As of December 31, 2014, all of our subsidiaries are restricted subsidiaries. Factors that may affect our credit rating include changes in our operating performance and liquidity. Credit rating downgrades can adversely impact, among other things, future borrowing costs and access to capital markets.
During the second quarter of 2011, we were subject to improved rating actions by S&P. In July 2011,November 2014, S&P raised its ratings&P’s rating on the 2019 and 2022 Senior Notes towas B+ from B and improved its recovery rating from “4” towas “3”. The improved ratings reflect our balance sheet deleveraging in and Moody’s rating on the first half of 20112019 and S&P’s belief that demand for NBSK pulp should remain robust2022 Senior Notes was B2 and that our liquidity position should continue to improve.
In November 2011, Moody’s upgraded its outlook from “stable” to “positive” while keeping the rating for our Senior Notes at B3. In December 2012, Moody’s maintained its B3 rating for our Senior Notes, while changing its outlook towas “stable”.
Credit ratings are not recommendations to buy, sell or hold securities and may be subject to revision or withdrawal by the assigning rating organization. Each rating should be evaluated independently of any other rating.
The preparation of financial statements and related disclosures in conformity with GAAP requires management to make estimates and assumptions that affect both the amount and the timing of recording of assets, liabilities, revenues and expenses in the consolidated financial statements and accompanying note disclosures. Our management routinely makes judgments and estimates about the effects of matters that are inherently uncertain. As the number of variables and assumptions affecting the probable future resolution of the uncertainties increase, these judgments become even more subjective and complex.
Our significant accounting policies are disclosed in Note 1 to our audited annual consolidated financial statements included in Part IV of this annual report. While all of the significant accounting policies are important to the consolidated financial statements, some of these policies may be viewed as having a high degree of judgment. On an ongoing basis using currently available information, management reviews its estimates, including those related to accounting for, among other things, doubtful accountspensions and reserves,other post-retirement benefit obligations, deferred income taxes (valuation allowance), depreciation and amortization, future cash flows associated with impairment testing for long-lived assets, derivative financial instruments, environmental conservation and legal liabilities asset retirement obligations, pensions and post-retirement benefit obligations, income taxes, contingencies, and inventory obsolescence and provisions.contingencies. Actual results could differ materially from these estimates, and changes in these estimates are recorded when known.
The following accounting policies require management’s most difficult, subjective and complex judgments, and are subject to a fair degree of measurement uncertainty.
Derivative Instruments.Pensions
We occasionally enter into derivative financial instruments, including foreign currency forward contracts, electricity forward contracts, interest rate swapsmaintain a defined benefit pension plan and pulp price swaps to limit exposures to changes in foreign currency exchange rates, energy prices, interest rates,other post-retirement benefit plan for our salaried employees at our Celgar mill which is funded and pulp prices. These derivative instruments are not designated as hedging instruments. Derivative instruments are measurednon-contributory. We recognize the net funded status of the
67
plan and we record net periodic benefit costs associated with these net obligations. As at December 31, 2014, we had pension and other post-retirement benefit obligations aggregating $71.5 million and accumulated pension plan assets with a fair value of $35.7 million. Our 2014 net periodic pension and other post-retirement benefit costs were $2.5 million. The amounts recorded for the net pension and other post retirement obligations include various judgments and uncertainties.
The following inputs are used to determine our net obligations and our net periodic benefit costs each year and the determination of these inputs requires judgment:
| • | discount rate – used to determine the net present value of our pension and other post-retirement benefit obligations and to determine the interest cost component of our net periodic pension and other post-retirement benefit costs; |
| • | return on assets – used to estimate the growth in the value of invested assets that are available to satisfy pension and other post-retirement benefit obligations and to determine the expected return on plan assets component of our net periodic pension and other post-retirement benefit obligations costs; |
| • | mortality rate – used to estimate the impact of mortality on pension and other post-retirement benefit obligations; |
| • | rate of compensation increase – used to calculate the impact future pay increases will have on pension benefit obligations; and |
| • | health care cost trend rate – used to calculate the impact of future health care costs on other post-retirement benefit obligations. |
For the discount rate, we use the rates available on high-quality corporate bonds with a duration that is expected to match the timing of expected pension and other post-retirement benefit obligations. High-quality corporate bonds are those with a rating of “AA” or better.
In determining the expected return on assets, we consider the historical long-term returns, expected asset mix and the active management premium.
For the mortality rate we use actuarially-determined mortality tables that are consistent with our historical mortality experience and future expectations for mortality of the employees who participate in our pension and other post-retirement benefit plans.
In determining the rate of compensation increase, we review general wage increases and incorporate expected promotion and merit increases. We compare our salary increase rates to those of our industry.
For the health care cost trend rate, we consider historical trends for these costs, as well as recently enacted healthcare legislation. We also compare our health care rate to those of our industry.
Variations in assumptions described above could have a significant effect on the pension and other post-retirement benefit net periodic benefit cost and obligation reported in our balance sheet as assets or liabilities. Theconsolidated financial statements. For example, a one-percentage point change in fair valueany one of electricity derivative contracts is includedthe following assumptions would have increased (decreased) our 2014 net periodic benefit cost and our benefit obligation as follows:
| Net periodic benefit cost | Accrued benefit obligation | |||||||||||||||
Assumption | 1% increase | 1% decrease | 1% increase | 1% decrease | ||||||||||||
Discount rate | 48 | (119 | ) | (9,181 | ) | 10,588 | ||||||||||
Return on assets | (307 | ) | 307 | N/A | N/A | |||||||||||
Rate of compensation | 25 | (25 | ) | 584 | (575 | ) | ||||||||||
Health care cost trend rate | 52 | (53 | ) | 790 | (767 | ) | ||||||||||
68
Deferred Taxes
As at December 31, 2014, we had $63.0 million in operating costsdeferred tax assets and $28.9 million in our Consolidated Statementdeferred tax liabilities, resulting in a net deferred tax asset of Operations$34.1 million. Our tax assets are net of an $87.9 million valuation allowance. Our deferred tax assets are comprised primarily of tax loss carryforwards and any changesdeductible temporary differences, both of which will reduce taxable income in the fair valuefuture. We assess the realization of foreign currency, interest ratethese deferred tax assets at each reporting period to determine whether it is more likely than not that the deferred tax asset will be realized. Our assessment includes a review of all available positive and pulp price derivative contractsnegative evidence, including, but not limited to, the following:
| • | the history of the tax loss carryforwards and their expiry dates; |
| • | future reversals of temporary differences; |
| • | our historical and projected earnings; and |
| • | tax planning opportunities. |
Significant judgment is required when evaluating the positive and negative evidence, specifically the Company’s estimates of future earnings. The weight given to negative and positive evidence is commensurate with the extent to which it can be objectively verified. Operating results during the most recent three-year period are recognized in gain (loss) on derivative instruments in our Consolidated Statementgenerally given more weight than expectations of Operations. Periodically, we enter into derivative contracts to supply materials for our own use,future profitability, which are exempt from mark-to-market accounting.inherently uncertain. A cumulative loss position during the most recent three-year period is considered significant negative evidence in assessing the realizability of deferred income tax assets that is difficult to overcome.
In 2012, we reported an unrealized non-cash holding gain of €2.5 million before noncontrolling interest in respectOnce our evaluation of the Stendal Interest Rate Swap Contractevidence is complete, if we believe that it is more likely than not that some of the deferred tax assets will not be realized, based on currently available information, an income tax valuation allowance is recorded against the deferred tax assets.
If market conditions improve or tax planning opportunities arise in the future, we will reduce our valuation allowance, resulting in future tax benefits. If market conditions deteriorate in the future, we will increase our valuation allowance, resulting in future tax expenses. Any change in tax laws may change the valuation allowances in future periods.
Property, Plant and our pulp price swap contracts.Equipment
Impairment of Long-Lived Assets.We stateAs at December 31, 2014, we had property, plant and equipment at cost less accumulated depreciation. Depreciationrecorded in our Consolidated Balance Sheet of buildings$883.2 million. In 2014, we recorded depreciation and productionamortization for the property, plant and equipment is based onof $78.0 million.
The calculation of depreciation and amortization of property, plant and equipment requires us to apply judgment in selecting the estimatedremaining useful lives of the assetsassets. The remaining useful life of an asset must address both physical and is computed using the straight-line method. Buildings are depreciated over 10 to 50economic considerations. The remaining economic life of property, plant and equipment may be shorter than its physical life. The pulp industry in recent years has been characterized by considerable uncertainty in business conditions. Estimates of future economic conditions for our property, plant and production equipment and other primarily over 25 years.therefore, their remaining useful economic life, require considerable judgment.
If our estimate of the remaining useful life changes, such a change is accounted for prospectively in our determination of depreciation and amortization. Actual depreciation and amortization charges for an individual asset may therefore be significantly accelerated if the outlook for its remaining useful life is shortened considerably.
We evaluate long-lived assetsproperty, plant and equipment for impairment whenever events or changes in circumstances indicate that the carrying value of an asset may not be recoverable. In performing the review of
69
recoverability, we estimate future cash flows expected to result from the use of the asset and its eventual disposition. The estimates of future cash flows, based on reasonable and supportable assumptions and projections, require management to make subjective
judgments. In addition, the time periods for estimating future cash flows is often lengthy, which increases the sensitivity of the assumptions made. Depending on the assumptions and estimates used, the estimated future cash flows projected in the evaluation of long-lived assetsproperty, plant and equipment can vary within a wide range of outcomes. Our management considers the likelihood of possible outcomes in determining the best estimate of future cash flows. If actual results are not consistent with the assumptions and judgments used in estimating future cash flows and asset fair values, actual impairment losses could vary materially, either positively or negatively, from estimated impairment losses.
The costsContingent Liabilities
We are subject to lawsuits, investigations and other claims related to environmental, product and other matters, and are required to assess the likelihood of major rebuilds, replacements and those expenditures that substantially increase the useful lives of existing property, plant, and equipment are capitalized,any adverse judgments or outcomes to these matters, as well as interest costs associated with major capital projects until ready for their intended use. The costpotential ranges of repairs and maintenance as well as planned shutdown maintenance performed on manufacturing facilities, composed of labor, materials and other incremental costs, is charged to operations as incurred.
Leases which transfer to us substantially all the risks and benefits incidental to ownership of the leased item are capitalized at the present value of the minimum lease payments. Capital leases are depreciated over the lease term. Operating lease payments are recognized as an expense in our Consolidated Statement of Operations on a straight-line basis over the lease term.
probable losses. We provide for asset retirement obligationsdisclose contingent liabilities when there is a legislated or contractual basis for those obligations. Obligations are recorded as a liability at fair value, with a corresponding increasereasonable possibility that an ultimate loss may occur and we record contingent liabilities when it becomes probable that we will have to property, plant,make payments and equipment,the amount of loss can be reasonably estimated.
Assessing probability of loss and are amortized over the remaining useful lifeestimating probable losses requires analysis of the related assets. The liability is accreted using a risk-free interest rate.
As a result of current market conditions, we concluded that there were no impairment indicators. Accordingly, we did not undertake a long-lived asset impairment review in 2012.
Deferred Taxes.We currently have deferred tax assets which are comprised primarily of tax loss carryforwards and deductible temporary differences, both of which will reduce taxable income in the future. The amounts recorded for deferred tax are based upon various judgments, assumptions and estimates. We assess the realization of these deferred tax assets on a periodic basis to determine whether a valuation allowance is required. We determine whether it is more likely than not that all or a portion of the deferred tax assets will be realized, based on currently available information,multiple factors, including, but not limited to, the following:
the history of the tax loss carryforwards and their expiry dates;
| • | historical experience; |
future reversals of temporary differences;
| • | judgments about the potential actions of third party claimants and courts; and |
| • | recommendations of legal counsel. |
our historical and projected earnings; and
tax planning opportunities.
If we believe that it is more likely than not that some of these deferred tax assets will not be realized, based on currently available information, an income tax valuation allowance is recorded against these deferred tax assets. Additionally, based on guidance noted in FASB Accounting Standards Codification Topic 740,Income Taxes, tax assets are not permitted to be recognized where the entity does not have a strong history of profitability. As at December 31, 2012, we had €22.0 million in deferred tax assets and €5.8 million in deferred taxContingent liabilities resulting in a net deferred tax asset of €16.3 million. Our tax assets are net of a €93.8 million valuation allowance. For the year ended December 31, 2012, our review concluded that it was appropriate to increase the valuation allowance against loss carryforwards by approximately €12.0 million, after considering expected future earnings and reversals of temporary differences.
If market conditions improve or tax planning opportunities arise in the future, we will reduce our valuation allowances, resulting in future tax benefits. If market conditions deteriorate in the future, we will increase our valuation allowances, resulting in future tax expenses. Any change in tax laws will change the valuation allowances in future periods.
Government Grants.We record investment grants from federal and state governments when the conditions of their receipt are complied with and there is reasonable assurance that the grants will be received. Grants related to assets are government grants whose primary condition is that the company qualifying for them should purchase, construct or otherwise acquire long-term assets. Secondary conditions may also be attached, including restricting the type or location of the assets and/or other conditions that must be met. Grants related to assets are deducted from the asset costs in our balance sheet.
Grants related to income are government grants which are either unconditional, related to reduced environmental emissions or related to our normal business operations, and are reported as a reduction of related expenses in our Consolidated Statement of Operations when received.
We are required to pay certain fees based on water consumption levels at our German mills. Unpaid fees can be reduced by wastewater grants upon the mills’ demonstration of reduced environmental emissions. The fees are expensed as incurred and the grants are recognized once the German regulators have evaluated and accepted the measurement of the wastewater emission reduction. There may be a significant period of time between recognition of the wastewater expense and recognition of the wastewater grant.
To the extent that government grants have been received and not applied, these grants are recorded in cash with a corresponding adjustment to accounts payable and other in our Consolidated Balance Sheet due to the short-term nature of the related payments.
Foreign Operations and Currency Translation.We translate foreign assets and liabilities of our subsidiaries, other than those denominated in Euros, at the rate of exchange at our balance sheet date. Revenues and expenses are translated at the average rate of exchange throughout the year. Transaction gains and losses related to net assets primarily located in Canada are recognized as unrealized foreign currency translation adjustments within accumulated other comprehensive income in shareholders’ equity, until all of the investment in the subsidiaries is sold or liquidated. The translation adjustments do not recognize the effect of income tax when we expect earnings of the foreign subsidiary to be indefinitely reinvested. The income tax effect on currency translation adjustments related to foreign subsidiaries that are not considered indefinitely reinvested is recorded as a component of deferred taxes in our Consolidated Balance Sheet with an offset to other comprehensive income. Gains and losses resulting from foreign currency transactions (transactions denominated in a currency other than the entity’s functional currency) are included in costs and expenses in our Consolidated Statement of Operations. Where inter-company loans are of a long-term investment nature, the after-tax effect of exchange rate changes are included as an unrealized foreign currency translation adjustment within accumulated other comprehensive income in shareholders’ equity.
Inventory Provisions.Inventories of NBSK pulp and logs and wood chips are valued at the lower of cost, using the weighted-average cost method, or net realizable value. We estimate the net realizable value based on future cash flows expected to result from the sale of our product (NBSK pulp). The cash flows are estimated based on the expected time it will take to exhaust the respective inventory, including estimates ofbest information available and actual losses in any future period are inherently uncertain. If estimated probable future losses or actual losses exceed our recorded liability for such claims, we would record additional costs that will need to be incurred to bring that inventory to a salable state. The future cash flows, based on reasonablecharges. These exposures and supportable assumptions and projections, require management to make subjective judgments. Depending on the assumptions and estimates used, the estimated future cash flows can vary within a wide range of outcomes. We consider the likelihood of possible outcomes in determining the best estimate of future cash flows. If actual results are not consistent with the assumptions and judgments used in estimating future cash flows, actual inventory provisions could vary materially, either positively or negatively, from estimated inventory provisions.
As at December 31, 2012, we did not record an inventory provision against any of our finished goods and raw materials inventories.
Environmental Conservation.Liabilities for environmental conservation are recorded when it is probable that obligations have been incurred and their fair valueproceedings can be reasonably estimated. Any potential recoveriessignificant and the ultimate negative outcomes could be material to our operating results or liquidity in any given quarter or year.
See Note 1 to our consolidated financial statements included in Item 15 of such liabilities are recorded when there is an agreement with the reimbursing entity and recovery is assessed as likely to occur.this annual report onForm 10-K.
Cautionary Statement RegardingForward-Looking Information
The statements in this annual report on Form 10-K that are not reported financial results or other historical information are “forward-looking“forward-looking statements” within the meaning of thePrivate Securities LitigationReform Act of 1995, as amended. These statements appear in a number of different places in this report and can be identified by words such as “estimates”, “projects”, “expects”, “intends”, “believes”, “plans”, or their negatives or other comparable words. Also look for discussions of strategy that involve risks and uncertainties.Forward-looking statements include statements regarding the outlook for our future operations, forecasts of future costs and expenditures, the evaluation of market conditions, the outcome of legal proceedings, the adequacy of reserves, or other business plans. You are cautioned that any suchforward-looking statements are not guarantees and may involve risks and uncertainties. Our actual results may differ materially from those in theforward-looking statements due to risks facing us or due to actual facts differing from the assumptions underlying our estimates. Some of these risks and assumptions include those set forth in reports and other documents we have filed with or furnished to the SEC, including in our annual report on Form 10-K for the fiscal year ended December 31, 2012.2014. We advise you that these cautionary remarks expressly qualify in their entirety allforward-looking statements attributable to us or persons acting on our behalf. Unless required by law, we do
70
not assume any obligation to updateforward-looking statements based on unanticipated events or changed expectations. However, you should carefully review the reports and other documents we file from time to time with the SEC. Factors that could cause actual results to differ materially include, but are not limited to those set forth under “Item 1A—1A. Risk Factors” in this annual report on Form 10-K.
We do not believe that inflation has had a material impact on revenues or income during 2012.
71
ITEM 7A. QUANTITATIVE AND QUALITATIVE DISCLOSURES ABOUT MARKET RISK
We are exposed to market risks from changes in interest rates and foreign currency exchange rates, particularly the exchange rates between the Euro and the U.S. dollar and the Canadian dollar versus the U.S. dollar and the Euro.dollar. Changes in these rates may affect our results of operations and financial condition and, consequently, our fair value. We seek to manage these risks through internal risk management policies as well as the periodic use of derivatives. We may use derivatives to reduce or limit our exposure to interest rate and currency risks. We may also use derivatives to reduce or limit our exposure to fluctuations in pulp prices. We use derivatives to reduce our potential losses or to augment our potential gains, depending on our management’s perception of future economic events and developments. These types of derivatives are generally highly speculative in nature. They are also very volatile as they are highly leveraged given that margin requirements are relatively low in proportion to notional amounts.
Many of our strategies, including the use of derivatives, and the types of derivatives selected by us, are based on historical trading patterns and correlations and our management’s expectations of future events. However, these strategies may not be effective in all market environments or against all types of risks. Unexpected market developments may affect our risk management strategies during this time, and unanticipated developments could impact our risk management strategies in the future. If any of the variety of instruments and strategies we utilize is not effective, we may incur significant losses.
Derivatives are contracts between two parties where payments between the parties are dependent upon movements in the price of an underlying asset, index or financial rate. Examples of derivatives include swaps, options and forward rate agreements. The notional amount of the derivatives is the contract amount used as a reference point to calculate the payments to be exchanged between the two parties and the notional amount itself is not generally exchanged by the parties.
The principal derivatives we periodically use are foreign exchange derivatives, interest rate derivatives, pulp price derivatives, and energy derivatives.
Foreign exchange derivatives include currency swaps which involve the exchange of fixed payments in one currency for the receipt of fixed payments in another currency. Such cross currency swaps involve the exchange of both interest and principal amounts in two different currencies. They also include foreign exchange forwards which are contractual obligations in which two counterparties agree to exchange one currency for another at a specified price for settlement at a pre-determined future date. Forward contracts are effectively tailor-made agreements that are transacted between counterparties in the over-the-counter market.derivatives.
Interest rate derivatives include interest rate forwards (forward rate agreements) which are contractual obligations to buy or sell an interest-rate-sensitive financial instrument on a future date at a specified price. They also include interest rate swaps which are over-the-counter contracts in which two counterparties exchange interest payments based upon rates applied to a notional amount.
Pulp price derivatives include fixed price pulp swaps which are contracts in which two counterparties exchange payments based upon the difference between the market price of pulp and the notional amount in the contract.
Energy derivatives include fixed electricity forward sales and purchase contracts which are contractual obligations to buy or sell electricity at a future specified date. Our mills produce surplus electricity that we sell to third parties. As a result, we monitor the electricity market closely. Where possible and to the extent we think it is advantageous, we may sell into the forward market through forward contracts.
Foreign exchange derivatives include currency swaps which involve the exchange of fixed payments in one currency for the receipt of fixed payments in another currency. Such cross currency swaps involve the exchange of both interest and principal amounts in two different currencies. They also include foreign exchange forwards which are contractual obligations in which two counterparties agree to exchange one currency for another at a specified price for settlement at a pre-determined future date. Forward contracts are effectively tailor-made agreements that are transacted between counterparties in the over-the-counter market.
72
We occasionally use foreign exchange derivatives to convert some of our costs (including currency swaps relating to our long-term indebtedness) from Euros to U.S. dollars as our principal product is priced in U.S. dollars. We have also converted some of our costs to U.S. dollars by issuing long-term U.S. dollar denominated debt in the form of our 2019 and 2022 Senior Notes. We may use interest rate derivatives to fix the rate of interest on indebtedness, including underindebtedness.
In August 2002, Stendal entered into the Stendal Loan Facility.
The interest rate derivatives we entered into were pursuantInterest Rate Swap Contract in connection with its long-term indebtedness relating to the Stendal mill to fix the interest rate under the Prior Stendal Loan Facility which provides facilities for foreign exchange derivatives,at the then low level, relative to its historical trend and projected variable interest rate derivativesrate. These contracts were entered into under a specific credit line under the Prior Stendal Loan Facility and commodities derivatives,were subject to prescribed controls, including certain maximum amounts for notional and at-risk amounts. Under the Stendal Interest Rate Swap Contract, Stendal pays a fixed rate and receives a floating rate with the interest payments being calculated on a notional amount. The interest rates payable under the Prior Stendal Loan Facility is secured by substantially allwere swapped into fixed rates based on the Eur-Euribor rate for the repayment periods of the assetstranches under the Prior Stendal Loan Facility. Stendal effectively converted the Prior Stendal Loan Facility from a variable interest rate loan into a fixed interest rate loan, thereby reducing interest rate uncertainty. The Stendal Interest Rate Swap Contract was left in place following the repayment of the Prior Stendal mill and has the benefit of certain German governmental guarantees. This credit facility does not have a separate margin requirement when derivatives are entered into and is subsequently marked to market each period.Loan Facility.
The Rosenthal Loan Facility also allows us to enter into derivative instruments to manage risks relating to its operations but, as at December 31, 2012,2014, we had not entered into any such derivative instruments.
We record unrealized gains and losses on our outstanding derivatives when they are marked to market at the end of each reporting period and realized gains or losses on them when they are settled. We determine market valuations based primarily upon valuations provided by our counterparties.
In August 2002, Stendal entered into the Stendal Interest Rate Swap Contract in connection with its long-term indebtedness relating to the Stendal mill to fix the interest rate under the Stendal Loan Facility at the then low level, relative to its historical trend and projected variable interest rate. These contracts were entered into under a specific credit line under the Stendal Loan Facility and are subject to prescribed controls, including certain maximum amounts for notional and at-risk amounts. Under the Stendal Interest Rate Swap Contract, Stendal pays a fixed rate and receives a floating rate with the interest payments being calculated on a notional amount. The interest rates payable under the Stendal Loan Facility were swapped into fixed rates based on the Eur-Euribor rate for the repayment periods of the tranches under the Stendal Loan Facility. Stendal effectively converted the Stendal Loan Facility from a variable interest rate loan into a fixed interest rate loan, thereby reducing interest rate uncertainty.
In May 2012, we entered into a fixed price pulp swap contract with a bank. Under the contract, 5,000 MTsmetric tonnes, referred to as “MT”, of pulp per month iswere fixed at a price of $915 per MT for each month between May and December of 2012. The contract expiredmatured in December 2012. In November 2012, we entered into two additional contracts. Under the terms of these contracts, 3,000 MTs of pulp per month iswere fixed at prices which rangeranged from $880 to $890 per MT. These contracts expirematured in December 2013.
We are exposed to very modest credit related risks in the event of non-performance by counterparties to derivative contracts. However, we do not expect that the counterparties, which are major financial institutions and large utilities, will fail to meet their obligations.
The following table and the notes thereto sets forth the maturity date, the notional amount, the recognized gain or loss and the strike and swap rates for derivatives that were in effect during 20122014 and 2011:2013:
| December 31, 2012 | December 31, 2011 | December 31, 2014 | December 31, 2013 | |||||||||||||||||||||||||||||||||||
Derivative Instrument | Maturity Date | Notional Amount | Recognized Gain (Loss) | Notional Amount | Recognized Gain (Loss) | Maturity Date | Notional Amount | Recognized Gain (Loss) | Notional Amount | Recognized Gain (Loss) | ||||||||||||||||||||||||||||
| (in millions) | (in thousands) | (in millions) | (in thousands) | (in millions) | (in thousands) | (in millions ) | (in thousands) | |||||||||||||||||||||||||||||||
Stendal interest rate swap(1) | October 2017 | € | 357.6 | € | 1,713 | € | 404.4 | € | (1,418 | ) | October 2017 | $ | 304.7 | $ | 11,501 | $ | 422.7 | $ | 22,476 | |||||||||||||||||||
Fixed price pulp swap(2) | December 2012 | € | 27.6 | € | 2,028 | € | — | € | — | December 2013 | $ | - | $ | - | $ | - | $ | (2,767 | ) | |||||||||||||||||||
| (1) | In connection with the Prior Stendal Loan Facility, in the third quarter of 2002, Stendal entered into the Stendal Interest Rate Swap Contract, which are variable-to-fixed interest rate swaps, for the term of the Prior Stendal Loan Facility, with respect to an aggregate maximum amount of approximately €612.6 million of the |
| principal amount of the long-term indebtedness under the Prior Stendal Loan Facility. The remaining contract commenced in April 2005 for a notional amount of €612.6 million, with an interest rate of 5.28%, and the notional amount gradually decreases and the contract terminates |
| (2) | In |
73
Fluctuations in interest rates may affect the fair value of fixed interest rate financial instruments which are sensitive to such fluctuations. A decrease in interest rates may increase the fair value of such fixed interest rate financial instrument assets and an increase in interest rates may decrease the fair value of such fixed interest rate financial instrument liabilities, thereby increasing our fair value. An increase in interest rates may decrease the fair value of such fixed interest rate financial instrument assets and a decrease in interest rates may increase the fair value of such fixed interest rate financial instrument liabilities, thereby decreasing our fair value. We may seek to manage our interest rate risks through the use of interest rate derivatives. For a discussion of our interest rate derivatives including maturities, notional amounts, gains or losses and swap rates, see “Derivatives” in this Item 7A.
The following tables provide information about our exposure to interest rate fluctuations for the carrying amount of financial instruments sensitive to such fluctuations as at December 31, 20122014 and expected cash flows from these instruments:
| As at December 31, 2012 | ||||||||||||||||||||||||||||||||
| Carrying Value | Fair Value | Expected maturity date | ||||||||||||||||||||||||||||||
| 2013 | 2014 | 2015 | 2016 | 2017 | Thereafter | |||||||||||||||||||||||||||
| (in thousands) | ||||||||||||||||||||||||||||||||
Liabilities | ||||||||||||||||||||||||||||||||
Long-term debt: | ||||||||||||||||||||||||||||||||
Fixed rate ($)(1) | € | 215,670 | € | 228,071 | € | — | € | — | € | — | € | — | € | 215,670 | € | — | ||||||||||||||||
Average interest rate | 9.5 | % | 9.5 | % | 9.5 | % | ||||||||||||||||||||||||||
Variable rate (€)(2) | € | 452,907 | € | 452,907 | € | 40,000 | € | 40,000 | € | 44,000 | € | 44,000 | € | 284,907 | € | — | ||||||||||||||||
Average interest rate | 1.78 | % | 1.78 | % | 1.78 | % | 1.78 | % | 1.78 | % | 1.78 | % | 1.78 | % | ||||||||||||||||||
Variable rate (€)(3) | € | 1,632 | € | 1,632 | € | 1,088 | € | 544 | € | — | € | — | € | — | € | — | ||||||||||||||||
Average interest rate | 3.4 | % | 3.4 | % | 3.4 | % | 3.4 | % | ||||||||||||||||||||||||
| As at December 31, 2014 | ||||||||||||||||||||||||||||||||||||||||||||||||||||||||||||||||
| Carrying Value | Fair Value | Expected maturity date | ||||||||||||||||||||||||||||||||||||||||||||||||||||||||||||||
| 2015 | 2016 | 2017 | 2018 | 2019 | Thereafter | |||||||||||||||||||||||||||||||||||||||||||||||||||||||||||
| (in thousands, other than percentages) | ||||||||||||||||||||||||||||||||||||||||||||||||||||||||||||||||
Liabilities | ||||||||||||||||||||||||||||||||||||||||||||||||||||||||||||||||
Long-term debt: | ||||||||||||||||||||||||||||||||||||||||||||||||||||||||||||||||
Fixed rate ($)(1)(2) | 650,000 | 657,500 | - | - | - | - | 250,000 | 400,000 | ||||||||||||||||||||||||||||||||||||||||||||||||||||||||
Average interest rate | 7.46% | 7.46% | ||||||||||||||||||||||||||||||||||||||||||||||||||||||||||||||
Fixed rate ($)(3) | 12,101 | 12,101 | 12,101 | - | - | - | - | - | ||||||||||||||||||||||||||||||||||||||||||||||||||||||||
Average interest rate | 4.00% | 4.00% | ||||||||||||||||||||||||||||||||||||||||||||||||||||||||||||||
Variable rate ($)(4) | 25,412 | 25,412 | - | - | - | - | 25,412 | - | ||||||||||||||||||||||||||||||||||||||||||||||||||||||||
Average interest rate | 3.55% | 3.55% | - | - | - | - | 3.55% | - | ||||||||||||||||||||||||||||||||||||||||||||||||||||||||
| Nominal Amount | Fair Value | Expected maturity date | ||||||||||||||||||||||||||||||||||||||||||||||||||||||||||||||
| 2013 | 2014 | 2015 | 2016 | 2017 | Thereafter | Notional Amount | Fair Value | Expected maturity date | ||||||||||||||||||||||||||||||||||||||||||||||||||||||||
| (in thousands) | 2015 | 2016 | 2017 | 2018 | 2019 | Thereafter | ||||||||||||||||||||||||||||||||||||||||||||||||||||||||||
| Interest Rate Derivatives | (in thousands, other than percentages) | |||||||||||||||||||||||||||||||||||||||||||||||||||||||||||||||
Interest rate swap: | ||||||||||||||||||||||||||||||||||||||||||||||||||||||||||||||||
Variable to fixed (€)(4) | € | 357,576 | € | (50,678 | ) | € | 50,794 | € | 54,959 | € | 59,388 | € | 64,100 | € | 128,335 | € | — | |||||||||||||||||||||||||||||||||||||||||||||||
Variable to fixed ($)(5) | 304,731 | (32,794 | ) | 71,865 | 77,567 | 155,299 | - | - | - | |||||||||||||||||||||||||||||||||||||||||||||||||||||||
Average pay rate | 5.3 | % | 5.3 | % | 5.3 | % | 5.3 | % | 5.3 | % | 5.3 | % | 5.3 | % | 5.3% | 5.3% | 5.3% | 5.3% | 5.3% | - | - | - | ||||||||||||||||||||||||||||||||||||||||||
Average receive rate | 0.4 | % | 0.4 | % | 0.4 | % | 0.4 | % | 0.4 | % | 0.4 | % | 0.4 | % | 0.2% | 0.2% | 0.2% | 0.2% | 0.2% | - | - | - | ||||||||||||||||||||||||||||||||||||||||||
| (1) | 2019 Senior Notes bearing interest at |
| (2) | 2022 Senior Notes bearing interest at 7.750%, principal amount $400.0 million. |
| (3) | Payment-in-kind note. |
| (4) | New Stendal |
| Interest rate swap originally put in place on the Prior Stendal Loan |
Foreign Currency Exchange Rate Risk
Our reporting currency is the Euro.U.S. dollar. However, we hold financial instruments denominated in U.S. dollarsEuros and Canadian dollars which are sensitive to foreign currency exchange rate fluctuations. A depreciation of these currencies against the EuroU.S. dollar will decrease the fair value of such financial instrument assets and an appreciation of these currencies against the EuroU.S. dollar will increase the fair value of such financial instrument liabilities, thereby decreasing our fair value. An appreciation of these currencies against the EuroU.S. dollar will increase the fair value of such financial instrument assets and a depreciation of these currencies against the EuroU.S. dollar will decrease the fair value of financial instrument liabilities, thereby increasing our fair value. We may seek to manage our foreign currency risks by utilizing foreign exchange rate derivatives. For a discussion of such derivatives including maturities, notional amounts, gains or losses and strike rates, see “Derivatives”“–Derivatives” in this Item 7A.
74
The following table provides information about our exposure to foreign currency exchange rate fluctuations for the carrying amount of financial instruments sensitive to such fluctuations as at December 31, 20122014 and expected cash flows from these instruments:
| As at December 31, 2012 | ||||||||||||||||||||||||||||||||
| Carrying Value | Fair Value | Expected maturity date | ||||||||||||||||||||||||||||||
| 2013 | 2014 | 2015 | 2016 | 2017 | Thereafter | |||||||||||||||||||||||||||
| (in thousands) | ||||||||||||||||||||||||||||||||
On-Balance Sheet Financial Instruments | ||||||||||||||||||||||||||||||||
Euro functional currency Liabilities: | ||||||||||||||||||||||||||||||||
Fixed rate ($) (1) | € | 215,670 | € | 228,071 | € | — | € | — | € | — | € | — | € | 215,670 | € | — | ||||||||||||||||
Average interest rate | 9.5 | % | 9.5 | % | ||||||||||||||||||||||||||||
| As at December 31, 2014 | ||||||||||||||||||||||||||||||||
| Carrying Value | Fair Value | Expected maturity date | ||||||||||||||||||||||||||||||
| Financial Instruments | 2015 | 2016 | 2017 | 2018 | 2019 | Thereafter | ||||||||||||||||||||||||||
| (in thousands) | ||||||||||||||||||||||||||||||||
Euro functional currency | ||||||||||||||||||||||||||||||||
Cash and cash equivalents | 13,171 | 13,171 | 13,171 | - | - | - | - | - | ||||||||||||||||||||||||
Cash, restricted | 8,500 | 8,500 | 8,500 | - | - | - | - | - | ||||||||||||||||||||||||
Receivables | 87,344 | 87,344 | 87,344 | - | - | - | - | - | ||||||||||||||||||||||||
Accounts payable and other | 56,070 | 56,070 | 56,070 | - | - | - | - | - | ||||||||||||||||||||||||
Derivative financial instruments | 27,100 | 27,100 | 12,257 | 9,143 | 5,700 | - | - | - | ||||||||||||||||||||||||
Debt | 31,000 | 31,000 | 10,000 | - | - | - | 21,000 | - | ||||||||||||||||||||||||
CAD functional currency | ||||||||||||||||||||||||||||||||
Cash and cash equivalents | 9,333 | 9,333 | 9,333 | - | - | - | - | - | ||||||||||||||||||||||||
Receivables | 1,292 | 1,292 | 1,292 | - | - | - | - | - | ||||||||||||||||||||||||
Accounts payable and other | 20,578 | 20,578 | 20,578 | - | - | - | - | - | ||||||||||||||||||||||||
Fluctuations in the price of pulp will affect the fair value of our pulp price swaps. A decrease in pulp prices will increase the fair value of the pulp price swaps and an increase in pulp prices will decrease the fair value of the pulp price swaps. As at December 31, 2014, we had no outstanding pulp price derivatives.
We are subject to some energy price risk, primarily for natural gas purchases. Our electricity price risks are mitigated by the ability of all of our mills to produce renewable energy.
| ITEM 8. | FINANCIAL STATEMENTS AND SUPPLEMENTARY DATA |
The consolidated financial statements and supplementary data required with respect to this Item 8, and as listed in Item 15 of this annual report on Form 10-K, are included in this annual report on Form 10-K commencing on page 85.
| ITEM 9. | CHANGES IN AND DISAGREEMENTS WITH ACCOUNTANTS ON ACCOUNTING AND FINANCIAL DISCLOSURE |
Not applicable.
| ITEM 9A. | CONTROLS AND PROCEDURES |
Evaluation of Disclosure Controls and Procedures
Our management, with the participation of our principal executive officer and principal financial officer, has evaluated the effectiveness of our disclosure controls and procedures (as such term is defined in Rules 13a-15(e)
and 15d-15(e) under the Exchange Act), as of the end of the period covered by this annual report on Form 10-K. Disclosure controls and procedures include, without limitation, controls and procedures designed to ensure that information required to be disclosed in the reports we file or submit under the Exchange Act is accumulated and communicated to management, including our principal executive officer and principal financial officer, as appropriate, to allow timely decisions regarding required disclosure. Based on such evaluation, our principal executive officer and principal financial officer have concluded that, as of the end of the period covered by this
75
report, our disclosure controls and procedures are effective in recording, processing, summarizing and reporting, on a timely basis, information required to be disclosed by us in the reports that we file or submit under the Exchange Act.
It should be noted that any system of controls is based in part upon certain assumptions designed to obtain reasonable (and not absolute) assurance as to its effectiveness, and there can be no assurance that any design will succeed in achieving its stated goals.
Management’s Report on Internal Control Over Financial Reporting
Our management is responsible for establishing and maintaining adequate internal control over financial reporting. Mercer Inc.’sMercer’s internal control over financial reporting is designed to provide reasonable assurance regarding the reliability of financial reporting and the preparation of financial statements for external purposes in accordance with generally accepted accounting principles.
Our internal control over financial reporting includes those policies and procedures that:
Pertain to the maintenance of records that, in reasonable detail, accurately and fairly reflect the transactions and dispositions of the assets of Mercer;
| • | Pertain to the maintenance of records that, in reasonable detail, accurately and fairly reflect the transactions and dispositions of the assets of Mercer; |
Provide reasonable assurance that transactions are recorded as necessary to permit preparation of financial statements in accordance with generally accepted accounting principles, and that receipts and expenditures are being made only in accordance with authorizations of management and directors; and
| • | Provide reasonable assurance that transactions are recorded as necessary to permit preparation of financial statements in accordance with generally accepted accounting principles, and that receipts and expenditures are being made only in accordance with authorizations of management and directors; and |
Provide reasonable assurance regarding prevention or timely detection of unauthorized acquisition, use or disposition of assets that could have a material effect on the financial statements.
| • | Provide reasonable assurance regarding prevention or timely detection of unauthorized acquisition, use or disposition of assets that could have a material effect on the financial statements. |
Because of its inherent limitations, internal control over financial reporting may not prevent or detect misstatements. Also, projections of any evaluation of effectiveness to future periods are subject to the risk that controls may become inadequate because of changes in conditions, or that the degree or compliance with the policies or procedures may deteriorate.
Management assessed the effectiveness of Mercer Inc.’sMercer’s internal control over financial reporting as of December 31, 2012.2014. In making this assessment, management used the criteria set forth inInternal Control-Integrated Framework, as issued in 2013 by the Committee of Sponsoring Organizations of the Treadway Commission. Based on our assessment and those criteria, management believesconcluded that Mercer Inc. maintained effective internal control over financial reporting as of December 31, 2012.2014.
The effectiveness of Mercer’s internal control over financial reporting as of December 31, 20122014 has been audited by PricewaterhouseCoopers LLP, an independent registered public accounting firm, as stated in their attestation report which appears within.
There have been no changes in our internal control over financial reporting (as defined in Rules 13a-15(f) and 15d-15(f) under the Exchange Act) during the year ended December 31, 2012period that have materially affected, or are reasonably likely to materially affect, our internal control over financial reporting.
| ITEM 9B. | OTHER INFORMATION |
Not applicable.
76
| ITEM 10. | DIRECTORS, EXECUTIVE OFFICERS AND CORPORATE GOVERNANCE |
We are governed by a board of directors, referred to as the “Board”, each member of which is elected annually. The following sets forth information relating to our directors and executive officers.
Jimmy S.H. Lee, age 55,57, has been aserved as director since May 1985 and President and Chief Executive Officer since 1992. Previously, during the period that MFC Bancorp Ltd. was our affiliate, he served as a director from 1986 and President from 1988 to December 1996 when it was spun out. Mr. Lee was also a director of Quinsam Capital Corp. from March 2004 to November 2007 and Fortress Paper Ltd. from August 2006 to April 2008. During Mr. Lee’s tenure with Mercer, we acquired the Rosenthal mill and converted it to the production of kraft pulp, constructed and commenced operations at the Stendal mill and acquired the Celgar mill. Mr. Lee possesses particular knowledge and experience in finance and banking, credit markets, derivative risk management and international pulp markets. He holds a Bachelor of Science Degree in Chemical Engineering from the University of British Columbia, Canada.
Eric Lauritzen, age 74,76, has beenserved as a director since June 2004. Mr. LauritzenFrom 1994 until his retirement in 1998, he was President and Chief Executive Officer of Harmac Pacific, Inc., a North AmericanTSX-listed pulp producer of softwood kraft pulp previously listed on the Toronto Stock Exchange andthat was acquired by Pope & Talbot Inc. in 1998, from MayFrom 1981 to 1994, to July 1998, when he retired. Mr. Lauritzen wasserved as Vice President, Pulp and Paper Marketing of MacMillan Bloedel Limited, a TSX-listed North American pulp and paper company previously listed on the Toronto Stock Exchange andthat was acquired by Weyerhaeuser Company LimitedLimited. Mr. Lauritzen has accumulated extensive executive, production and marketing experience in 1999,the pulp and paper industry, particularly in the softwood kraft pulp sector. He received his Bachelor of Commerce degree in 1961 from July 1981 to April 1994.the University of British Columbia and his M.B.A. in 1963 from Harvard Business School.
William D. McCartney, age 57,59, has beenserved as a director since January 2003. Mr. McCartneyHe has been the President and Chief Executive Officer of Pemcorp Management Inc., a corporate finance and management services company,consulting firm, since its inception in 1990. Mr. McCartneyFrom 1984 to 1990, he was a founding partner of Davidson & Company, Chartered Accountants, where he specialized in business advisory services. He has been involved with numerous capital restructuring and financing events involving several public companies and brings substantial knowledge relating to the financial accounting and auditing processes. He is also a member of the Local Advisory Committee of the TSX and TSX Ventures Exchanges. He is a chartered accountant and has been a member of the Canadian Institute of Chartered Accountants since 1980. He holds a Bachelor of Arts degree in Canada.Business Administration from Simon Fraser University.
Graeme A. Witts, age 74,76, has beenserved as a director since January 2003. Mr. WittsHe is also a Director and the former Chairman of Azure Property Group, SA, a European hotel group. He organized Sanne Trust Company Limited, a trust company located in the Channel Islands, in 1988 and was managing directorManaging Director from 1988 to 2000, when he retired. Mr. Witts has previous executive experience with the Procter & Gamble Company, as well as with Clarks shoes. He is now managing director of Azure Property Group, SA,also has experience in government auditing and brings significant financial accounting knowledge from a European hotel group.global perspective. Mr. Witts is also a fellow of the Institute of Chartered Accountants of England and Wales and has previous executive experience with the Procter & Gamble Company and Clarks Shoes, as well as government auditing.
Guy W. Adams, age 61, has beenholds a director since August 2003. Mr. Adams is the managing member of GWA Advisors, LLC, GWA Investments, LLC and GWA Capital Partners, LLC, where he has served since 2002. GWA Investments is an investment fund investingmasters degree in publicly traded securities managed by GWA Capital Partners, LLC, a registered investment advisor. Prior to 2002, Mr. Adams was the President of GWA Capital, which he founded in 1996 to invest his own capital in public and private equity transactions,chemistry from Oxford University and a business consultant to entities seeking refinancing or recapitalization.research degree in magnetic resonance.
Bernard Picchi, age 63,65, has beenserved as a director since June 2011. Mr. Picchi has been theHe is now Managing Director of Private Wealth Management for Palisade Capital Management, LLC, of Fort Lee, New Jersey, and has been in that role since July 2009. Prior to 2009,Before joining Palisade, Mr. Picchi has been an analyst and consultant for several mid-sized broker/dealers and investment advisory firms. In particular,served as Managing Partner of Willow Rock Associates from 1980 to 1999,August 2008 through June 2009, a company which advised securities firms on energy investments. From March 2003 through July 2008, Mr. Picchi served as Senior Energy Analyst at two independent research firms based in New York City, Foresight Research Solutions (2003-2005) and Wall Street Access (2006-2008). From 1999 through 2002, he was an All StarDirector of U.S. Equity Research at Pittsburgh-based Federated Investors, where he also managed the Capital Appreciation Fund, a 5-star rated energy analyst at Solomon(during his tenure)
77
$1.5 billion equity mutual fund. Before Federated Investors, Mr. Picchi enjoyed a 20-year career on Wall Street (Salomon Brothers, Kidder Peabody, and Lehman Brothers, whereBrothers) both as an award-winning energy analyst and as an executive (Director of U.S. Equity Research at Lehman in the mid-1990s). He began his post-college career at Mellon Bank in Pittsburgh, Pennsylvania. Mr. Picchi holds a Bachelor of Science degree in Foreign Service from Georgetown University, and he has achieved the professional designation Chartered Financial Analyst. He has also served as Director of U.S. Stock Research. Mr. Picchi has also been the sole manageron various non-profit boards, most notably that of the 5-Star rated $1.5 billion Capital Appreciation Fund of Federated Investors, whereGeorgetown University Library which he has served as U.S. Director of Research from January 2000 to June 2002. Mr. Picchi is also a Chartered Financial Analyst.for the past 30 years.
James Shepherd, age 60,62, has beenserved as a director since June 2011. He is also currently a director of Conifex Timber Inc., which is listed on the TSX Venture Exchange, and Buckman Laboratories International Inc. Mr. Shepherd was President and Chief Executive Officer of Canfor Corporation from 2004 to 2007 and Slocan Forest Products Ltd. from 1999 to 2004. Mr. ShepherdHe is also the former President of Crestbrook Forest Industries Ltd. and Finlay Forest Industries Limited and is the former Chairman of the Forest Products Association of Canada. Mr. Shepherd has been a director with Canfor Corporation, which is listed on the Toronto Stock Exchange, from 2004 to 2007 and has beenpreviously served as a director of Canfor Corporation as well as Canfor Pulp Income Fund from 2006 to 2007.(now Canfor Pulp Products Inc.). Mr. Shepherd is also currentlyholds a director of Conifex Timber Inc., which is listed on the TSX Venture Exchange, and Buckman Laboratories International Inc.
R. Keith Purchase, age 68,70, has beenserved as a director since AprilJune 2012. Mr. Purchase was Executive Vice-President and Chief Operating Officer offor MacMillan Bloedel Ltd. from 1998 to 1999, President and Chief Executive Officer of TimberWest Forest Ltd. from 1994 to 1998 and Managing Director of Tasman Pulp and Paper from 1990 to 1994. Mr. Purchase is currently a director of Hardwoods Distribution Inc., which is currently listed on the Toronto Stock Exchange. Mr. Purchase was also a trustee of Tree Island Wire Income Fund from 2003 to 2007 (and Chair of the board of directors from 2006 to 2007) which is listed on the Toronto Stock Exchange and waspreviously a director of Catalyst Paper Corporation and Chair of its board of directors. As he has held several senior positions in the forestry industry, Mr. Purchase brings to the Board extensive senior executive experience relevant to the Company’s operations, as well as significant board of director leadership experience from 2001a wide variety of companies.
Nancy Orr, age 64, has served as a director since May 2013. Ms. Orr is currently also a director of Blue Goose Capital Inc., Cavendish Health and Social Services Centre, Ressources Quebec Inc. and ProMetic Life Sciences Inc. Ms. Orr’s previous experience includes serving as President of Dynamis Group Inc. from 1991 to 2007 (andand Interim Chief Financial Officer of Redline Communications Inc., where she also served as a director, Chair of the boardAudit Committee and a member of directorsits Compensation Committee. Ms. Orr was also a director of Dundee Wealth Management Inc., Fibrek Inc. and FRV Media Inc. She brings to the Board significant experience as a senior executive, director and audit committee member of a wide variety of companies. Ms. Orr is a member of the Institute of Corporate Directors and has been a member of the Canadian Institute of Chartered Accountants since 1978. She holds a Master of Business and Administration from 2005 to 2007).Queen’s University and a Bachelor of Arts degree in Business Administration from the University of Western Ontario.
David M. Gandossi, age 55,57, has been Secretary,served as Executive Vice-President, and Chief Financial Officer since August 15, 2003. Mr. Gandossi was formerly the Chief Financial Officer and Executive Vice-President ofSecretary since August 2003. His previous roles included Chief Financial Officer and other senior executive positions with Formation Forest Products (a closely held corporation) from June 2002 to August 2003. Mr. Gandossi previously served as Chief Financial Officer, Vice-President, Finance and Secretary of Pacifica Papers Inc., a North American specialty pulp and paper manufacturing company previously listed on the Toronto Stock Exchange, from December 1999 to August 2001 and Controller and Treasurer from June 1998 to December 1999. From June 1998 to August 31, 1998, he also served as Secretary to Pacifica Papers Inc. From March 1998 to June 1998, Since 2007, Mr. Gandossi served as Controller, Treasurer and Secretary of MB Paper Ltd. From April 1994 to March 1998, Mr. Gandossi held the position of Controller and Treasurer with Harmac Pacific Inc., a Canadian pulp manufacturing company previously listed on the Toronto Stock Exchange. Mr. Gandossi participated in the Pulp and Paper Advisory Committee of the British Columbia Competition Council and was a member of the British Columbia Working Roundtable on Forestry. From February 2007 to present, he has chaired the B.C. Pulp and Paper Task Force, a joint government industry and labor effort that is mandated to identify measures to improve the competitiveness of the British Columbia pulp and paper industry. He also participated in the Pulp and Paper Advisory Committee to the BC Competition Council and was a member of BC’s Working Roundtable on Forestry. He is currently a Director of FPInnovations and Chair of the FPI National Research Advisory Committee. He also co-chairs the BC Bio-economy Transformation Council, a collaborative effort between Government and industry. Mr. Gandossi holds a Bachelor of Commerce Degree from the University of British Columbia and is a memberFellow of the Institute of Chartered Accountants in Canada.of British Columbia.
Claes-Inge IsacsonDavid K. Ure, age 67, has been our Chief Operating Officer since November 2006 and is based47, returned to Mercer in our Berlin office. Mr. Isacson brings over 24 yearsSeptember 2013, assuming the role of senior level pulp and paper management to our senior management team, with a focus on kraft pulp. Mr. Isacson held the positions of President Norske Skog Europe, and then Senior Vice President, Production for Norske Skogindustrier ASA between 1989Finance. Prior to serving as Vice President, Finance of Sierra Wireless Inc., Mr. Ure was Vice President, Controller at Mercer from 2006 to 2010. He has also served as Controller at various companies including Catalyst Paper Corp., Pacifica Papers Inc., and 2004. His most recent position was President, AF Process, a consultingTrojanLitho, as well as CFO and engineering company working worldwide.Secretary of Finlay Forest Industries Inc. Mr. Ure has over fifteen years’ experience in the forest products industry. He holds a Masters
78
Bachelor of Science, Mechanical Engineering.Commerce in Finance from the University of British Columbia, Canada and is a member of the Certified General Accountants’ Association of Canada.
Leonhard Nossol, age 55,57, has beenserved as our Group Controller for Europe since August 2005. He has also been a managing directorManaging Director of Rosenthal since 1997 and the sole managing directorManaging Director of Rosenthal since September 2005. Before joining Mercer, Mr. Nossol hadwas Director, Finance and Administration for a significant involvementGerman household appliance producer from 1992 to 1997. Prior to this, he was Operations Controller at Grundig AG (consumer electronics) in the conversionNürnberg. Mr. Nossol has been a member of the Rosenthal mill toGerman Industry Federation’s (BDI) Tax Committee since 2003. He was elected President of the productionGerman Wood Users Association (AGR) in 2013. Mr. Nossol holds a Political Science degree from Freie Universität Berlin and a degree in Business Management from the University of kraft pulpApplied Sciences in 1999 and increases in the mill’s annual production capacity to 355,000 ADMTs, as well as the reduction in production costs at the mill.Berlin.
Richard Short, age 45,47, has been ourserved as Vice President, Controller since DecemberFebruary 2014 and as Controller from November 2010 to February 2014, prior to which he was ourserved as Controller and Director, Corporate Finance since joining Mercer in 2007. Prior to joining Mercer, Mr. Short wasPrevious roles include Controller, Financial Reporting from 2006 to 2007 and Director, Corporate Finance from 2004 to 2006 with Catalyst Paper Corp.Corporation and Assistant Controller at the Alderwoods Group Inc. Mr. Short isholds a Bachelor of Arts in Psychology from the University of British Columbia and has been a member of the Canadian Institute of Chartered Accountants in Canada.since 1993.
David M. Cooper, age 59,61, has beenserved as Vice President of Sales and Marketing for Europe since June 2005. Mr. Cooper previously held a variety of senior positions around the world inat Sappi Ltd., a large global forest products group, from 1982 to 2005, including2005. These roles included the sales and marketing of various pulp and paper grades and the management of a manufacturing facility. HeMr. Cooper has more than 30thirty years of diversified experience in the international pulp and paper industry.
Eric X. Heine, age 49,51, has beenserved as Vice President of Sales and Marketing for North America and Asia since June 2005. Mr. Heine was previously Vice President Pulp and International Paper Sales and Marketing for
Domtar Inc., a global pulp and paper corporation, from 1999 to 2005. HeMr. Heine has over 18twenty-five years of experience in the pulp and paper industry, including developing strategic sales channels and market partners to build corporate brands. He holds a Bachelor of Science in Forestry (Wood Science) from the University of Toronto, Canada.
Wolfram Ridder, age 51, was appointed53, has served as Vice President of Business Development in Augustsince 2005, prior to which he was a managing director of Stendal.served as Managing Director at Mercer’s Stendal mill from 2001 to 2005. Mr. Ridder wasalso served as Vice President Pulp Operations, Assistant to CEO from 1999 to 2005 and Assistant Managing Director at the principal assistantRosenthal mill from 1995 to our Chief Executive Officer1998. Prior to joining Mercer, Mr. Ridder worked as a Scientist for pulping technology development at the German Federal Research Center for Wood Science and Technology in Hamburg from November 1995 until September 2002.1988 to 1995. Mr. Ridder has a Master of Business and Administration and a Master of Wood Science and Forest Product Technology from Hamburg University.
Genevieve Stannus, age 42,44, has been ourserved as Treasurer since July 2005, prior to which she was aserved as Senior Financial Analyst withsince joining Mercer fromin August 2003. Prior to joiningher role at Mercer, Ms. Stannus held Senior Treasury Analyst positions with Catalyst Paper Corporation and Pacifica Papers Inc. SheMs. Stannus has over ten years’twenty years of experience in the forest products industry. Ms. StannusShe is a member of the Certified General Accountants’Accountants Association of Canada.
Brian Merwin, age 39,41, has been ourserved as Vice President, of Strategic Initiatives since February 2009, prior to which he was our2009. Mr. Merwin previously held roles within Mercer such as Director, of Strategic and Business Initiatives, since August 2007 and Business Analyst since May 2005.Analyst. He was a key member of Celgar’s “Green” Energy Project, and was instrumental in the development of the BC Hydro energy purchase agreement and securing the ecoENERGY grant. Mr. Merwin has an MBAa Master of Business and Administration from the Richard Ivey School of Business atin Ontario, Canada and a Bachelor of Commerce Degree from the University of Western Ontario.British Columbia, Canada.
79
We also have experienced mill managers at all of our mills who have operated through multiple business cycles in the pulp industry.
The Board met tensix times during 20122014 and each current member of the Board attended 100% of the total number of such meetings and meetings of the committees of the Board on which they serve during their term. In addition, our independent directors regularly meet in separate executive sessions without any member of our management present. The Lead Director presides over these meetings. Although we do not have a formal policy with respect to attendance of directors at our annual meetings, all directors are encouraged and expected to attend such meetings if possible. All of our directors attended our 20122014 annual meeting.
The Board has developed corporate governance guidelines in respect of: (i) the duties and responsibilities of the Board, its committees and officers; and (ii) practices with respect to the holding of regular quarterly and strategic meetings of the Board including separate meetings of non-management directors. The Board has established four standing committees, the Audit Committee, the Compensation and Human Resource Committee, the Governance and Nominating Committee and the Environmental, Health and Safety Committee.
The Audit Committee was established in accordance with Section 3(a)(58)(A) of the Exchange Act and functions pursuant to a charter adopted by the directors. A copy of the current charter is incorporated by reference in the exhibits to this Form 10-K and is available on our website atwww.mercerint.com under the “Governance” link. The function of the Audit Committee generally is to meet with and review the results of the audit of our financial statements performed by the independent public accountants and to recommend the selection of independent public accountants. The members of the Audit Committee are Mr. McCartney, Mr. AdamsShepherd and Mr. Shepherd,Ms. Orr, each of whom is independent under applicable laws and regulations and the listing requirements of the NASDAQ Global Select Market. Mr. McCartney is a Chartered Accountant and a “financial expert” within the meaning of such term under theSarbanes-Oxley Act of 2002. The Audit Committee met fourfive times during 2012.2014.
The Audit Committee has established procedures for: (i) the receipt, retention and treatment of complaints received by us regarding accounting, internal accounting controls or auditing matters; and (ii) the confidential and anonymous submission by our employees and others of concerns regarding questionable accounting or
auditing matters. A person wishing to notify us of such a complaint or concern should send a written notice thereof, marked “Private & Confidential”, to the Chairman of the Audit Committee, Mercer International Inc., c/o Suite 1120, 700 West Pender Street, Vancouver, British Columbia, Canada V6C 1G8.
Compensation and Human Resource Committee
The Board has established a Compensation and Human Resource Committee. The Compensation and Human Resource Committee is responsible for reviewing and approving the strategy and design of our compensation,equity-based and benefits programs. The Compensation and Human Resource Committee functions pursuant to a charter adopted by the directors, a copy of which is available on our website atwww.mercerint.com in the Corporate Governance Guidelines under the “Governance” link. The Compensation and Human Resource Committee is also responsible for approving all compensation actions relating to executive officers. The members of the Compensation and Human Resource Committee are Mr. Picchi, Mr. Witts, and Mr. Purchase and Ms. Orr, each of whom is independent under applicable laws and regulations and the listing requirements of the NASDAQ Global Select Market. The Compensation and Human Resource Committee met four times during 2012.2014.
Governance and Nominating Committee
The Board has established a Governance and Nominating Committee comprised of Mr. Lauritzen, Mr. McCartney and Mr. Witts, each of whom is independent under applicable laws and regulations and the
80
listing requirements of the NASDAQ Global Select Market. The Governance and Nominating Committee functions pursuant to a charter adopted by the directors, a copy of which is incorporated by reference in the exhibits to this Form 10-K and is available on our website atwww.mercerint.com in the Corporate Governance Guidelines under the “Governance” link. The purpose of the committee is to: (i) manage the corporate governance system of the Board; (ii) assist the Board in fulfilling its duties to meet applicable legal and regulatory and self-regulatory business principles and codes of best practice; (iii) assist in the creation of a corporate culture and environment of integrity and accountability; (iv) in conjunction with the Lead Director, monitor the quality of the relationship between the Board and management; (v) review management succession plans; (vi) recommend to the Board nominees for appointment to the Board; (vii) lead the Board’s annual review of the Chief Executive Officer’s performance; and (viii) set the Board’s forward meeting agenda. The Governance and Nominating Committee met four times in 2012.2014.
Environmental, Health and Safety Committee
The Board established an Environmental, Health and Safety Committee in 2006, currently comprised of Mr. Shepherd, Mr. Purchase and Mr. Lee, to review on behalf of the Board the policies and processes implemented by management, and the resulting impact and assessments of all our environmental, health and safety related activities. The Environmental, Health and Safety Committee functions pursuant to a charter adopted by the directors, a copy of which is available on our website atwww.mercerint.com in the Corporate Governance Guidelines under the “Governance” link. More specifically, the Environmental, Health and Safety Committee is to: (i) review and approve, and if necessary revise, our environmental, health and safety policies and environmental compliance programs; (ii) monitor our environmental, health and safety management systems including internal and external audit results and reporting; and (iii) provide direction to management on the frequency and focus of external independent environmental, health and safety audits. The Environmental, Health and Safety Committee met four times in 2012.2014.
The Board appointed Mr. Lauritzen as Lead Director in 2012. The role of the Lead Director is to provide leadership to the non-management directors on the Board and to ensure that the Board can operate independently of management and that directors have an independent leadership contact. The duties of the Lead Director include, among other things: (i) ensuring that the Board has adequate resources to support itsdecision-making
process and ensuring that the Board is appropriately approving strategy and supervising management’s progress against that strategy; (ii) ensuring that the independent directors have adequate opportunity to meet to discuss issues without management being present; (iii) chairing meetings of directors in the absence of the Chairman and Chief Executive Officer; (iv) ensuring that delegated committee functions are carried out and reported to the Board; and (v) communicating to management, as appropriate, the results of private discussions among outside directors and acting as a liaison between the Board and the Chief Executive Officer.
Code of Business Conduct and Ethics
The Board has adopted a Code of Business Conduct and Ethics that applies to our directors, employees and executive officers. The code is incorporated by reference in the exhibits to this Form 10-K and is available on our website atwww.mercerint.com under the “Governance” link. A copy of the code may also be obtained without charge upon request to Investor Relations, Mercer International Inc., Suite 1120, 700 West Pender Street, Vancouver, British Columbia, Canada V6C 1G8 (Telephone: (604) 684-1099) or Investor Relations, Mercer International Inc., 14900 Interurban Avenue South, Suite 282, Seattle WA, U.S.A. 98168 (Telephone: (206) 674-4639).
Section 16(a) Beneficial Ownership Reporting Compliance
The information required under “Section 16(a) Beneficial Ownership Reporting Compliance” is incorporated by reference from the proxy statement relating to our annual meeting to be held in 2013,2015, which will be filed with the SEC within 120 days of our most recently completed fiscal year.
81
| ITEM 11. | EXECUTIVE COMPENSATION |
The information required by this Item 11 is incorporated by reference from the proxy statement relating to our annual meeting to be held in 2013,2015, which will be filed with the SEC within 120 days of our most recently completed fiscal year.
| ITEM 12. | SECURITY OWNERSHIP OF CERTAIN BENEFICIAL OWNERS AND MANAGEMENT AND RELATED STOCKHOLDER MATTERS |
The information required by this Item 12 is incorporated by reference from the proxy statement relating to our annual meeting to be held in 2013,2015, which will be filed with the SEC within 120 days of our most recently completed fiscal year.
| ITEM 13. | CERTAIN RELATIONSHIPS AND RELATED TRANSACTIONS, AND DIRECTOR INDEPENDENCE |
Review, Approval or Ratification of Transactions with Related Persons
Pursuant to the terms of the Audit Committee Charter, the Audit Committee is responsible for reviewing and approving the terms and conditions of all proposed transactions between us, any of our officers, directors or shareholders who beneficially own more than 5% of our outstanding shares of common stock, or relatives or affiliates of any such officers, directors or shareholders, to ensure that such related party transactions are fair and are in our overall best interest and that of our shareholders. In the case of transactions with employees, a portion of the review authority is delegated to supervising employees pursuant to the terms of our written Code of Business Conduct and Ethics.
The Audit Committee has not adopted any specific procedures for conduct of reviews and considers each transaction in light of the facts and circumstances. In the course of its review and approval of a transaction, the Audit Committee considers, among other factors it deems appropriate:
Whether the transaction is fair and reasonable to us;
| • | Whether the transaction is fair and reasonable to us; |
The business reasons for the transaction;
| • | The business reasons for the transaction; |
Whether the transaction would impair the independence of one of our non-employee directors; and
| • | Whether the transaction would impair the independence of one of our non-employee directors; and |
Whether the transaction is material, taking into account the significance of the transaction.
| • | Whether the transaction is material, taking into account the significance of the transaction. |
Any member of the Audit Committee who is a related person with respect to a transaction under review may not participate in the deliberations or vote respecting approval or ratification of the transaction, provided, however, that such director may be counted in determining the presence of a quorum at a meeting of the committee that considers the transaction.
The information called for by Items 404(a) and 407(a) of Regulation S-K required to be included under this Item 13 is incorporated by reference from the proxy statement relating to our annual meeting to be held in 2013,2015, which will be filed with the SEC within 120 days of our most recently completed fiscal year.
| ITEM 14. | PRINCIPAL ACCOUNTANT FEES AND SERVICES |
The information required by this Item 14 is incorporated by reference from the proxy statement relating to our annual meeting to be held in 2013,2015, which will be filed with the SEC within 120 days of our most recently completed fiscal year.
82
| ITEM 15. | EXHIBITS AND FINANCIAL |
| Page | |||||
| 85 | |||||
| 86 | |||||
| 87 | |||||
Consolidated Statements of | 88 | ||||
| 89 | |||||
| 90 | |||||
(a)(2) Financial Statement Schedules
All schedules are omitted because they are not applicable or the required information is shown in the consolidated financial statements or notes thereto.
(a)(3) Exhibits
Exhibits that are not filed herewith have been previously filed with the SEC and are incorporated herein by reference.
| 2.1 | Agreement and Plan of Merger among Mercer International Inc., Mercer International Regco Inc. and Mercer Delaware Inc. dated December 14, 2005. Incorporated by reference to the Proxy Statement/Prospectus filed on December 15, 2005. | |
| 3.1 | Articles of Incorporation of | |
| 3.2 | Bylaws of | |
| 4.1 | Indenture dated | |
| Form of Trustee’s Indemnity Agreement between Mercer International Inc. and its Trustees. Incorporated by reference from Form 10-K filed March 31, 2003. | ||
| Employment Agreement dated for reference August 7, 2003 between Mercer International Inc. and David Gandossi. Incorporated by reference from Form 8-K | ||
| Employment Agreement effective as of April 28, 2004 between Mercer International Inc. and Jimmy S.H. Lee. Incorporated by reference from Form 8-K | |||
| 2004 Stock Incentive Plan. Incorporated by reference from Form S-8 | |||
83
| Mercer International Inc. 2010 Stock Incentive Plan. Incorporated by reference from | ||
| Employment Agreement effective September 1, 2005 between Mercer International Inc. and Leonhard Nossol dated August 18, 2005. Incorporated by reference from Form 10-Q | ||
| Employment Agreement dated October 2, 2006 between Stendal Pulp Holding GmbH and Wolfram Ridder. Incorporated by reference from Form 8-K filed October 3, 2006. | ||
| 10.9 | Electricity Purchase Agreement effective January 27, 2009 between Zellstoff Celgar Limited Partnership and British Columbia Hydro and Power Authority. Incorporated by reference from Form 10-K filed March 2, 2009. Certain non-public information has been omitted from the appendices to Exhibit | |
| Revolving Credit Facility Agreement dated August 19, 2009 among D&Z Holding GmbH, Zellstoff-und Papierfabrik Rosenthal GmbH, D&Z Beteiligungs GmbH and ZPR Logistik GmbH and Bayerische Hypo-und Vereinsbank AG. Incorporated by reference from Form 8-K | ||
| Extension, Amendment and Confirmation Letter dated October 4, 2012 among | ||
| Second Amended and Restated Credit Agreement dated as of | ||
| First Amending Agreement dated October 21, 2014 between Zellstoff Celgar Limited Partnership, Mercer International Inc., as guarantor, and Canadian Imperial Bank of Commerce. Incorporated by reference from Form 10-Q filed October 31, 2014. | ||
| 10.14 | Registration Rights Agreement dated November 26, 2014 between Mercer International Inc. and Credit Suisse Securities (USA) LLC, related to 2019 Senior Notes. Incorporated by reference from Form 8-K filed on November 28, 2014. | |
| 10.15 | Registration Rights Agreement dated November 26, 2014 between Mercer International Inc. and Credit Suisse Securities (USA) LLC, related to 2022 Senior Notes. Incorporated by reference from Form 8-K filed on November 28, 2014. | |
| 14.1 | Code of Business Conduct and Ethics. Incorporated by reference from | |
| List of Subsidiaries of Registrant. | ||
| Consent of | ||
| Section 302 Certificate of Chief Executive Officer. | ||
| Section 302 Certificate of Chief Financial Officer. | ||
| 32.1* | Section 906 Certificate of Chief Executive Officer. | |
| 32.2* | Section 906 Certificate of Chief Financial Officer. | |
| 101* | The following financial statements from the Company’s annual report on Form 10-K for the year ended December 31, 2014, filed with the SEC on February 13, 2015, formatted in Extensible Business Reporting Language (XBRL): (i) Consolidated Balance Sheets; (ii) Consolidated Statements of Operations; (iii) Consolidated Statements of Comprehensive Income; (iv) Consolidated Statements of Changes in Shareholders’ Equity; (v) Consolidated Statements of Cash Flows; and (vi) Notes to Consolidated Financial Statements. | |
| * | Filed |

February 15, 2013

Report of Independent Registered Public Accounting Firm
To the Shareholders and Board of Directors of
Mercer International Inc.
We have auditedIn our opinion, the accompanying consolidated balance sheets of Mercer International Inc. and its subsidiaries as of December 31, 2012 and December 31, 2011 and the related consolidated statements of operations, comprehensive income (loss), changes in shareholders’ equity and cash flows for eachpresent fairly, in all material respects, the financial position of the years in the three-year period ended December 31, 2012. We also have audited Mercer International Inc. and its subsidiaries’subsidiaries (together the Company) at December 31, 2014 and December 31, 2013, and the results of their operations and their cash flows for each of the three years in the period ended December 31, 2014 in conformity with accounting principles generally accepted in the United States of America. Also in our opinion, the Company maintained, in all material respects, effective internal control over financial reporting as of December 31, 2012,2014, based on criteria established inInternal Control - Integrated Framework (2013) issued by the Committee of Sponsoring Organizations of the Treadway Commission (COSO). ManagementThe Company’s management is responsible for these consolidated financial statements, for maintaining effective internal control over financial reporting and for its assessment of the effectiveness of internal control over financial reporting, included in Management’s Report on Internal Control Overover Financial Reporting appearing under Item 9A. Our responsibility is to express an opinionopinions on these consolidated financial statements and on the company’sCompany’s internal control over financial reporting based on our integrated audits.
We conducted our audits in accordance with the standards of the Public Company Accounting Oversight Board (United States). Those standards require that we plan and perform the audits to obtain reasonable assurance about whether the consolidated financial statements are free of material misstatement and whether effective internal control over financial reporting was maintained in all material respects. Our audits of the consolidated financial statements included examining, on a test basis, evidence supporting the amounts and disclosures in the consolidated financial statements, assessing the accounting principles used and significant estimates made by management, and evaluating the overall consolidated financial statement presentation. Our audit of internal control over financial reporting included obtaining an understanding of internal control over financial reporting, assessing the risk that a material weakness exists, and testing and evaluating the design and operating effectiveness of internal control based on the assessed risk. Our audits also included performing such other procedures as we considered necessary in the circumstances. We believe that our audits provide a reasonable basis for our opinions.
A company’s internal control over financial reporting is a process designed to provide reasonable assurance regarding the reliability of financial reporting and the preparation of financial statements for external purposes in accordance with generally accepted accounting principles. A company’s internal control over financial reporting includes those policies and procedures that:that (i) pertain to the maintenance of records that, in reasonable detail, accurately and fairly reflect the transactions and dispositions of the assets of the company; (ii) provide reasonable assurance that transactions are recorded as necessary to permit preparation of financial statements in accordance with generally accepted accounting principles, and that receipts and expenditures of the company are being made only in accordance with authorizations of management and directors of the company; and (iii) provide reasonable assurance regarding prevention or timely detection of unauthorized acquisition, use, or disposition of the company’s assets that could have a material effect on the financial statements.
Because of its inherent limitations, internal control over financial reporting may not prevent or detect misstatements. Also, projections of any evaluation of effectiveness to future periods are subject to the risk that controls may become inadequate because of changes in conditions, or that the degree of compliance with the policies or procedures may deteriorate.
In our opinion, the consolidated financial statements referred to above present fairly, in all material respects, the financial position of Mercer International Inc. and its subsidiaries as of December 31, 2012 and December 31, 2011 and the results of their operations and their cash flows for each of the years in the three-year period ended December 31, 2012 in conformity with accounting principles generally accepted in the United States of America. Also, in our opinion, Mercer International Inc. and its subsidiaries maintained, in all material respects, effective internal control over financial reporting as of December 31, 2012, based on criteria established in Internal Control—Integrated Framework issued by COSO.
/s/ PricewaterhouseCoopers LLP
Chartered Professional Accountants
Vancouver, British Columbia
February 13, 2015
85
MERCER INTERNATIONAL INC.
(In thousands of Euros)U.S. dollars, except per share data)
| December 31, | ||||||||
| 2012 | 2011 | |||||||
ASSETS | ||||||||
Current assets | ||||||||
Cash and cash equivalents (Note 2) | € | 104,239 | € | 105,072 | ||||
Marketable securities (Note 3) | — | 12,216 | ||||||
Receivables (Note 4) | 110,087 | 120,487 | ||||||
Inventories (Note 5) | 118,300 | 120,539 | ||||||
Prepaid expenses and other | 7,907 | 8,162 | ||||||
Deferred income tax (Note 10) | 4,465 | 6,750 | ||||||
|
|
|
| |||||
Total current assets | 344,998 | 373,226 | ||||||
|
|
|
| |||||
Long-term assets | ||||||||
Property, plant and equipment (Note 6) | 808,878 | 820,974 | ||||||
Deferred note issuance and other | 12,162 | 10,763 | ||||||
Deferred income tax (Note 10) | 17,565 | 12,287 | ||||||
|
|
|
| |||||
| 838,605 | 844,024 | |||||||
|
|
|
| |||||
Total assets | € | 1,183,603 | € | 1,217,250 | ||||
|
|
|
| |||||
LIABILITIES | ||||||||
Current liabilities | ||||||||
Accounts payable and other (Note 7) | € | 89,950 | € | 99,640 | ||||
Pension and other post-retirement benefit obligations (Note 9) | 813 | 756 | ||||||
Debt (Note 8) | 45,662 | 25,671 | ||||||
|
|
|
| |||||
Total current liabilities | 136,425 | 126,067 | ||||||
|
|
|
| |||||
Long-term liabilities | ||||||||
Debt (Note 8) | 665,741 | 708,415 | ||||||
Unrealized interest rate derivative losses (Note 16) | 50,678 | 52,391 | ||||||
Pension and other post-retirement benefit obligations (Note 9) | 32,141 | 31,197 | ||||||
Capital leases and other (Note 18) | 13,936 | 13,053 | ||||||
Deferred income tax (Note 10) | 5,757 | 2,585 | ||||||
|
|
|
| |||||
| 768,253 | 807,641 | |||||||
|
|
|
| |||||
Total liabilities | 904,678 | 933,708 | ||||||
|
|
|
| |||||
EQUITY | ||||||||
Shareholders’ equity | ||||||||
Share capital (Note 11) | 248,371 | 247,642 | ||||||
Paid-in capital | (3,547 | ) | (4,857 | ) | ||||
Retained earnings | 25,800 | 37,985 | ||||||
Accumulated other comprehensive income (Note 13) | 25,181 | 21,346 | ||||||
|
|
|
| |||||
Total shareholders’ equity | 295,805 | 302,116 | ||||||
|
|
|
| |||||
Noncontrolling deficit | (16,880 | ) | (18,574 | ) | ||||
|
|
|
| |||||
Total equity | 278,925 | 283,542 | ||||||
|
|
|
| |||||
Total liabilities and equity | € | 1,183,603 | € | 1,217,250 | ||||
|
|
|
| |||||
Commitments and contingencies (Note 19) | ||||||||
| December 31, | ||||||||
| 2014 | 2013 | |||||||
ASSETS |
| |||||||
Current assets | ||||||||
Cash and cash equivalents | $ | 53,172 | $ | 147,728 | ||||
Restricted cash (Note 17) | 10,286 | - | ||||||
Receivables (Note 2) | 141,088 | 135,893 | ||||||
Inventories (Note 3) | 146,576 | 170,908 | ||||||
Prepaid expenses and other | 6,745 | 10,918 | ||||||
Deferred income tax (Note 9) | 19,968 | 6,326 | ||||||
|
|
|
| |||||
Total current assets | 377,835 | 471,773 | ||||||
|
|
|
| |||||
Long-term assets | ||||||||
Property, plant and equipment (Note 4) | 883,150 | 1,038,631 | ||||||
Other assets (Note 5) | 22,767 | 20,998 | ||||||
Deferred income tax (Note 9) | 43,055 | 17,157 | ||||||
|
|
|
| |||||
| 948,972 | 1,076,786 | |||||||
|
|
|
| |||||
Total assets | $ | 1,326,807 | $ | 1,548,559 | ||||
|
|
|
| |||||
LIABILITIES | ||||||||
Current liabilities | ||||||||
Accounts payable and other (Note 6) | $ | 102,225 | $ | 118,574 | ||||
Pension and other post-retirement benefit obligations (Note 8) | 1,177 | 1,330 | ||||||
Debt (Note 7) | 12,101 | 60,355 | ||||||
|
|
|
| |||||
Total current liabilities | 115,503 | 180,259 | ||||||
|
|
|
| |||||
Long-term liabilities | ||||||||
Debt (Note 7) | 675,412 | 919,017 | ||||||
Interest rate derivative liability (Note 17) | 17,962 | 31,757 | ||||||
Pension and other post-retirement benefit obligations (Note 8) | 34,837 | 35,466 | ||||||
Capital leases and other (Note 4 and Note 19) | 15,321 | 19,293 | ||||||
Deferred income tax (Note 9) | 28,892 | 14,450 | ||||||
|
|
|
| |||||
| 772,424 | 1,019,983 | |||||||
|
|
|
| |||||
Total liabilities | 887,927 | 1,200,242 | ||||||
|
|
|
| |||||
EQUITY | ||||||||
Shareholders’ equity | ||||||||
Common shares $1 par value; 200,000,000 authorized; | ||||||||
64,274,000 issued and outstanding (2013 - 55,854,000) | 386,338 | 328,549 | ||||||
Paid-in capital | 4,769 | (11,756) | ||||||
Retained earnings | 100,214 | 10,815 | ||||||
Accumulated other comprehensive income (loss) (Note 14) | (52,441) | 31,470 | ||||||
|
|
|
| |||||
Total share capital attributed to common shareholders | 438,880 | 359,078 | ||||||
|
|
|
| |||||
Noncontrolling interest (deficit) (Note 15) | - | (10,761) | ||||||
|
|
|
| |||||
Total equity | 438,880 | 348,317 | ||||||
|
|
|
| |||||
Total liabilities and equity | $ | 1,326,807 | $ | 1,548,559 | ||||
|
|
|
| |||||
Commitments and contingencies (Note 20)
The accompanying notes are an integral part of these consolidated financial statements.
86
MERCER INTERNATIONAL INC.
CONSOLIDATED STATEMENTS OF OPERATIONS
(In thousands of Euros,U.S. dollars, except per share data)
| For the Year Ended December 31, | For the Year Ended December 31, | |||||||||||||||||||||||
| 2012 | 2011 | 2010 | 2014 | 2013 | 2012 | |||||||||||||||||||
Revenues | ||||||||||||||||||||||||
Pulp | € | 761,854 | € | 831,396 | € | 856,311 | $ | 1,073,632 | $ | 996,187 | $ | 979,770 | ||||||||||||
Energy and chemicals | 72,289 | 68,079 | 49,288 | 101,480 | 92,198 | 92,966 | ||||||||||||||||||
|
|
|
|
|
| |||||||||||||||||||
| 834,143 | 899,475 | 905,599 | 1,175,112 | 1,088,385 | 1,072,736 | |||||||||||||||||||
Costs and expenses | ||||||||||||||||||||||||
Operating costs | 689,052 | 693,825 | 648,592 | 887,712 | 920,832 | 886,144 | ||||||||||||||||||
Operating depreciation and amortization | 57,776 | 55,760 | 55,932 | 77,675 | 78,309 | 74,302 | ||||||||||||||||||
|
|
| ||||||||||||||||||||||
| 87,315 | 149,890 | 201,075 | ||||||||||||||||||||||
Selling, general and administrative expenses | 38,310 | 38,771 | 33,332 | 47,927 | 51,169 | 49,268 | ||||||||||||||||||
Restructuring expenses (Note 13) | - | 6,415 | - | |||||||||||||||||||||
|
|
|
|
|
| |||||||||||||||||||
Operating income | 49,005 | 111,119 | 167,743 | 161,798 | 31,660 | 63,022 | ||||||||||||||||||
|
|
|
|
|
| |||||||||||||||||||
Other income (expense) | ||||||||||||||||||||||||
Interest expense | (55,805 | ) | (58,995 | ) | (67,621 | ) | (67,516) | (69,156) | (71,767) | |||||||||||||||
Gain (loss) on derivative instruments (Note 16) | 3,741 | (1,418 | ) | 1,899 | ||||||||||||||||||||
Foreign exchange gain (loss) on debt | — | 1,175 | (6,126 | ) | ||||||||||||||||||||
Loss on extinguishment of debt (Note 8(b)) | (81 | ) | (71 | ) | (7,494 | ) | ||||||||||||||||||
Gain on settlement of debt (Note 7) | 3,357 | - | - | |||||||||||||||||||||
Gain on derivative instruments (Note 17) | 11,501 | 19,709 | 4,812 | |||||||||||||||||||||
Other income (expense) | (58 | ) | 1,501 | 468 | (4,948) | 1,215 | (179) | |||||||||||||||||
|
|
|
|
|
| |||||||||||||||||||
Total other income (expense) | (52,203 | ) | (57,808 | ) | (78,874 | ) | (57,606) | (48,232) | (67,134) | |||||||||||||||
|
|
|
|
|
| |||||||||||||||||||
Income (loss) before income taxes | (3,198 | ) | 53,311 | 88,869 | 104,192 | (16,572) | (4,112) | |||||||||||||||||
Income tax benefit (provision) (Note 10) | ||||||||||||||||||||||||
Income tax benefit (provision) (Note 9) | ||||||||||||||||||||||||
Current | (7,411 | ) | (1,682 | ) | (3,881 | ) | (5,242) | 2,286 | (9,531) | |||||||||||||||
Deferred | 118 | 2,377 | 9,760 | 22,016 | (11,482) | 152 | ||||||||||||||||||
|
|
|
|
|
| |||||||||||||||||||
Net income (loss) | (10,491 | ) | 54,006 | 94,748 | 120,966 | (25,768) | (13,491) | |||||||||||||||||
Less: net income attributable to noncontrolling interest | (1,694 | ) | (3,931 | ) | (8,469 | ) | (7,812) | (607) | (2,179) | |||||||||||||||
|
|
|
|
|
| |||||||||||||||||||
Net income (loss) attributable to common shareholders | € | (12,185 | ) | € | 50,075 | € | 86,279 | $ | 113,154 | $ | (26,375) | $ | (15,670) | |||||||||||
|
|
|
|
|
| |||||||||||||||||||
Net income (loss) per share attributable to common shareholders (Note 14) | ||||||||||||||||||||||||
Net income (loss) per share attributable to common shareholders (Note 12) | ||||||||||||||||||||||||
Basic | € | (0.22 | ) | € | 1.00 | € | 2.24 | $ | 1.82 | $ | (0.47) | $ | (0.28) | |||||||||||
Diluted | € | (0.22 | ) | € | 0.89 | € | 1.56 | $ | 1.81 | $ | (0.47) | $ | (0.28) | |||||||||||
The accompanying notes are an integral part of these consolidated financial statements.
87
MERCER INTERNATIONAL INC.
CONSOLIDATED STATEMENTS OF COMPREHENSIVE INCOME (LOSS)
(In thousands of Euros)U.S. dollars)
| For the Year Ended December 31, | For the Year Ended December 31, | |||||||||||||||||||||||
| 2012 | 2011 | 2010 | 2014 | 2013 | 2012 | |||||||||||||||||||
Net income (loss) | € | (10,491 | ) | € | 54,006 | € | 94,748 | $ | 120,966 | $ | (25,768) | $ | (13,491) | |||||||||||
Other comprehensive income (loss), net of taxes | ||||||||||||||||||||||||
Foreign currency translation adjustments, net of tax benefit of €353 (2011 – expense of €683; 2010 – €nil) | 4,464 | (2,305 | ) | 11,333 | ||||||||||||||||||||
Change in unrecognized losses and prior service costs related to defined benefit plans, net of tax benefit of €nil (2011 – €nil; 2010 – €nil) (Note 9) | (628 | ) | (8,049 | ) | (3,314 | ) | ||||||||||||||||||
Change in unrealized losses on marketable securities, net of tax benefit of €nil (2011 – €nil; 2010 – €nil) | (1 | ) | (12 | ) | (2 | ) | ||||||||||||||||||
Foreign currency translation adjustment (net of tax effect | (81,024) | (1,733) | 11,635 | |||||||||||||||||||||
Change in unrecognized losses and prior service costs related to defined benefit plans (net of tax effect of $nil in all years) | (2,873) | 4,636 | (808) | |||||||||||||||||||||
Change in unrealized gains on marketable securities | (14) | (10) | (1) | |||||||||||||||||||||
|
|
|
|
|
| |||||||||||||||||||
Other comprehensive income (loss), net of taxes | 3,835 | (10,366 | ) | 8,017 | (83,911) | 2,893 | 10,826 | |||||||||||||||||
|
|
|
|
|
| |||||||||||||||||||
Total comprehensive income (loss) | (6,656 | ) | 43,640 | 102,765 | 37,055 | (22,875) | (2,665) | |||||||||||||||||
Comprehensive income attributable to noncontrolling interest | (1,694 | ) | (3,931 | ) | (8,469 | ) | (7,812) | (607) | (2,179) | |||||||||||||||
|
|
|
|
|
| |||||||||||||||||||
Comprehensive income (loss) attributable to common shareholders | € | (8,350 | ) | € | 39,709 | € | 94,296 | $ | 29,243 | $ | (23,482) | $ | (4,844) | |||||||||||
|
|
|
|
|
| |||||||||||||||||||
The accompanying notes are an integral part of these consolidated financial statements.
88
MERCER INTERNATIONAL INC.
CONSOLIDATED STATEMENTS OF CHANGES IN SHAREHOLDERS’ EQUITY
(In thousands of Euros)U.S. dollars)
| Common shares | Common shares | |||||||||||||||||||||||||||||||||||||||||||||||||||||||||||||||||||||||
| Number of Shares (thousands of shares) | Par Value | Amount Paid in Excess of Par Value | Paid-in Capital | Retained Earnings (Deficit) | Accumulated Other Comprehensive Income (Loss) | Shareholders’ Equity | Noncontrolling Interest (Deficit) | Total Equity | ||||||||||||||||||||||||||||||||||||||||||||||||||||||||||||||||
Balance at December 31, 2009 | 36,443 | € | 27,576 | € | 175,268 | € | (6,082 | ) | € | (97,235 | ) | € | 23,695 | € | 123,222 | € | (37,249 | ) | € | 85,973 | ||||||||||||||||||||||||||||||||||||||||||||||||||||
Shares issued on grants of restricted shares | 56 | — | — | 153 | — | — | 153 | — | 153 | |||||||||||||||||||||||||||||||||||||||||||||||||||||||||||||||
Shares issued on conversion of convertible notes | 6,500 | 4,961 | 11,406 | — | — | — | 16,367 | — | 16,367 | |||||||||||||||||||||||||||||||||||||||||||||||||||||||||||||||
Stock compensation expense | — | — | — | 2,030 | — | — | 2,030 | — | 2,030 | |||||||||||||||||||||||||||||||||||||||||||||||||||||||||||||||
Net income | — | — | — | — | 86,279 | — | 86,279 | 8,469 | 94,748 | |||||||||||||||||||||||||||||||||||||||||||||||||||||||||||||||
Foreign currency translation adjustments | — | — | — | — | — | 11,333 | 11,333 | — | 11,333 | |||||||||||||||||||||||||||||||||||||||||||||||||||||||||||||||
Change in unrecognized losses and prior service costs related to defined benefit plans | — | — | — | — | — | (3,314 | ) | (3,314 | ) | — | (3,314 | ) | ||||||||||||||||||||||||||||||||||||||||||||||||||||||||||||
Conversion of shareholder loans to a capital contribution | — | — | — | — | — | — | — | 6,275 | 6,275 | |||||||||||||||||||||||||||||||||||||||||||||||||||||||||||||||
Change in unrealized losses on marketable securities | — | — | — | — | — | (2 | ) | (2 | ) | — | (2 | ) | ||||||||||||||||||||||||||||||||||||||||||||||||||||||||||||
|
|
|
|
|
|
|
|
| ||||||||||||||||||||||||||||||||||||||||||||||||||||||||||||||||
Balance at December 31, 2010 | 42,999 | 32,537 | 186,674 | (3,899 | ) | (10,956 | ) | 31,712 | 236,068 | (22,505 | ) | 213,563 | ||||||||||||||||||||||||||||||||||||||||||||||||||||||||||||
Shares issued on grants of restricted shares | 238 | 74 | 296 | (370 | ) | — | — | — | — | — | ||||||||||||||||||||||||||||||||||||||||||||||||||||||||||||||
Shares issued on grants of performance shares | 358 | 243 | 3,585 | (3,828 | ) | — | — | — | — | — | ||||||||||||||||||||||||||||||||||||||||||||||||||||||||||||||
Shares issued on conversion of convertible notes | 13,447 | 9,499 | 21,076 | — | — | — | 30,575 | — | 30,575 | |||||||||||||||||||||||||||||||||||||||||||||||||||||||||||||||
Treasury shares retired | (1,263 | ) | (971 | ) | (5,371 | ) | — | (1,134 | ) | — | (7,476 | ) | — | (7,476 | ) | |||||||||||||||||||||||||||||||||||||||||||||||||||||||||
Stock compensation expense | — | — | — | 3,240 | — | — | 3,240 | — | 3,240 | |||||||||||||||||||||||||||||||||||||||||||||||||||||||||||||||
Net income | — | — | — | — | 50,075 | — | 50,075 | 3,931 | 54,006 | |||||||||||||||||||||||||||||||||||||||||||||||||||||||||||||||
Foreign currency translation adjustments | — | — | — | — | — | (2,305 | ) | (2,305 | ) | — | (2,305 | ) | ||||||||||||||||||||||||||||||||||||||||||||||||||||||||||||
Change in unrecognized losses and prior service costs related to defined benefit plans | — | — | — | — | — | (8,049 | ) | (8,049 | ) | — | (8,049 | ) | ||||||||||||||||||||||||||||||||||||||||||||||||||||||||||||
Change in unrealized losses on marketable securities | — | — | — | — | — | (12 | ) | (12 | ) | — | (12 | ) | ||||||||||||||||||||||||||||||||||||||||||||||||||||||||||||
|
|
|
|
|
|
|
|
| Number of Shares (thousands of shares) | Par Value | Amount Paid in Excess of Par Value | Paid-in Capital | Retained Earnings (Deficit) | Accumulated Other Comprehensive Income (Loss) | Shareholders’ Equity | Noncontrolling Interest (Deficit) | Total Equity | |||||||||||||||||||||||||||||||||||||||||||||||||||||||
Balance at December 31, 2011 | 55,779 | 41,382 | 206,260 | (4,857 | ) | 37,985 | 21,346 | 302,116 | (18,574 | ) | 283,542 | 55,779 | $ | 55,425 | $ | 271,396 | $ | (6,100) | $ | 52,860 | $ | 17,751 | $ | 391,332 | $ | (23,521) | $ | 367,811 | ||||||||||||||||||||||||||||||||||||||||||||
Shares issued on grants of restricted shares | 37 | 57 | 672 | (729 | ) | — | — | — | — | — | 37 | 78 | 919 | (997) | - | - | - | - | - | |||||||||||||||||||||||||||||||||||||||||||||||||||||
Stock compensation expense | — | — | — | 2,039 | — | — | 2,039 | — | 2,039 | - | - | - | 2,616 | - | - | 2,616 | - | 2,616 | ||||||||||||||||||||||||||||||||||||||||||||||||||||||
Net income (loss) | — | — | — | — | (12,185 | ) | — | (12,185 | ) | 1,694 | (10,491 | ) | - | - | - | - | (15,670) | - | (15,670) | 2,179 | (13,491) | |||||||||||||||||||||||||||||||||||||||||||||||||||
Foreign currency translation adjustments | — | — | — | — | — | 4,464 | 4,464 | — | 4,464 | - | - | - | - | - | 11,635 | 11,635 | - | 11,635 | ||||||||||||||||||||||||||||||||||||||||||||||||||||||
Change in unrecognized losses and prior service costs related to defined benefit plans | — | — | — | — | — | (628 | ) | (628 | ) | — | (628 | ) | - | - | - | - | - | (808) | (808) | - | (808) | |||||||||||||||||||||||||||||||||||||||||||||||||||
Change in unrealized losses on marketable securities | — | — | — | — | — | (1 | ) | (1 | ) | — | (1 | ) | ||||||||||||||||||||||||||||||||||||||||||||||||||||||||||||
Change in unrealized gains on marketable securities | - | - | - | - | - | (1) | (1) | - | (1) | |||||||||||||||||||||||||||||||||||||||||||||||||||||||||||||||
|
|
|
|
|
|
|
|
|
|
|
|
|
|
|
|
|
| |||||||||||||||||||||||||||||||||||||||||||||||||||||||
Balance at December 31, 2012 | 55,816 | € | 41,439 | € | 206,932 | € | (3,547 | ) | € | 25,800 | € | 25,181 | € | 295,805 | € | (16,880 | ) | € | 278,925 | 55,816 | 55,503 | 272,315 | (4,481) | 37,190 | 28,577 | 389,104 | (21,342) | 367,762 | ||||||||||||||||||||||||||||||||||||||||||||
Shares issued on grants of restricted shares | 38 | 77 | 654 | (731) | - | - | - | - | - | |||||||||||||||||||||||||||||||||||||||||||||||||||||||||||||||
Stock compensation expense | - | - | - | 3,574 | - | - | 3,574 | - | 3,574 | |||||||||||||||||||||||||||||||||||||||||||||||||||||||||||||||
Net income (loss) | - | - | - | - | (26,375) | - | (26,375) | 607 | (25,768) | |||||||||||||||||||||||||||||||||||||||||||||||||||||||||||||||
Foreign currency translation adjustments | - | - | - | - | - | (1,733) | (1,733) | - | (1,733) | |||||||||||||||||||||||||||||||||||||||||||||||||||||||||||||||
Capital contribution to acquire additional 8.1% of Stendal mill | - | - | - | (10,118) | - | - | (10,118) | 9,974 | (144) | |||||||||||||||||||||||||||||||||||||||||||||||||||||||||||||||
Change in unrecognized losses and prior service costs related to defined benefit plans | - | - | - | - | - | 4,636 | 4,636 | - | 4,636 | |||||||||||||||||||||||||||||||||||||||||||||||||||||||||||||||
Change in unrealized gains on marketable securities | - | - | - | - | - | (10) | (10) | - | (10) | |||||||||||||||||||||||||||||||||||||||||||||||||||||||||||||||
|
|
|
|
|
|
|
|
|
|
|
|
|
|
|
|
|
| |||||||||||||||||||||||||||||||||||||||||||||||||||||||
Balance at December 31, 2013 | 55,854 | 55,580 | 272,969 | (11,756) | 10,815 | 31,470 | 359,078 | (10,761) | 348,317 | |||||||||||||||||||||||||||||||||||||||||||||||||||||||||||||||
Shares issued through public share offering | 8,050 | 8,050 | 45,808 | - | - | - | 53,858 | - | 53,858 | |||||||||||||||||||||||||||||||||||||||||||||||||||||||||||||||
Shares issued on grants of restricted shares | 38 | 78 | 703 | (781) | - | - | - | - | - | |||||||||||||||||||||||||||||||||||||||||||||||||||||||||||||||
Shares issued on grants of performance shares | 332 | 332 | 2,818 | (3,150) | - | - | - | - | - | |||||||||||||||||||||||||||||||||||||||||||||||||||||||||||||||
Stock compensation expense | - | - | - | 1,471 | - | - | 1,471 | - | 1,471 | |||||||||||||||||||||||||||||||||||||||||||||||||||||||||||||||
Net income (loss) | - | - | - | - | 113,154 | - | 113,154 | 7,812 | 120,966 | |||||||||||||||||||||||||||||||||||||||||||||||||||||||||||||||
Foreign currency translation adjustments | - | - | - | - | - | (81,024) | (81,024) | - | (81,024) | |||||||||||||||||||||||||||||||||||||||||||||||||||||||||||||||
Acquisition of noncontrolling interest in the Stendal mill (Note 15) | - | - | - | 18,985 | (23,755) | - | (4,770) | 2,949 | (1,821) | |||||||||||||||||||||||||||||||||||||||||||||||||||||||||||||||
Change in unrecognized losses and prior service costs related to defined benefit plans | - | - | - | - | - | (2,873) | (2,873) | - | (2,873) | |||||||||||||||||||||||||||||||||||||||||||||||||||||||||||||||
Change in unrealized gains on marketable securities | - | - | - | - | - | (14) | (14) | - | (14) | |||||||||||||||||||||||||||||||||||||||||||||||||||||||||||||||
|
|
|
|
|
|
|
|
| ||||||||||||||||||||||||||||||||||||||||||||||||||||||||||||||||
Balance December 31, 2014 | 64,274 | $ | 64,040 | $ | 322,298 | $ | 4,769 | $ | 100,214 | $ | (52,441) | $ | 438,880 | $ | - | $ | 438,880 | |||||||||||||||||||||||||||||||||||||||||||||||||||||||
|
|
|
|
|
|
|
|
| ||||||||||||||||||||||||||||||||||||||||||||||||||||||||||||||||
The accompanying notes are an integral part of these consolidated financial statements.
89
MERCER INTERNATIONAL INC.
CONSOLIDATED STATEMENTS OF CASH FLOWS
(In thousands of U.S. dollars)
| For the Year Ended December 31, | ||||||||||||
| 2014 | 2013 | 2012 | ||||||||||
Cash flows from (used in) operating activities | ||||||||||||
Net income (loss) | $ | 120,966 | $ | (25,768) | $ | (13,491) | ||||||
Adjustments to reconcile net income (loss) to cash flows from operating activities | ||||||||||||
Gain on settlement of debt | (3,357) | - | - | |||||||||
Unrealized gain on derivative instruments | (11,501) | (21,494) | (3,186) | |||||||||
Depreciation and amortization | 78,012 | 78,645 | 74,657 | |||||||||
Deferred income taxes | (22,016) | 11,482 | (152) | |||||||||
Foreign exchange (gain) loss on debt | 4,011 | (656) | - | |||||||||
Pension and other post-retirement expense | 2,474 | 3,526 | 3,306 | |||||||||
Stock compensation expense | 1,586 | 3,574 | 2,616 | |||||||||
Other | 2,843 | 3,825 | 4,991 | |||||||||
Defined pension plan contributions | (2,951) | (2,878) | (2,941) | |||||||||
Changes in working capital | ||||||||||||
Receivables | (25,113) | 13,993 | 10,795 | |||||||||
Inventories | 6,445 | (14,563) | 1,726 | |||||||||
Accounts payable and accrued expenses | (5,382) | (11,569) | (17,992) | |||||||||
Other | (1,429) | (1,792) | (1,214) | |||||||||
|
|
|
|
|
| |||||||
Net cash from (used in) operating activities | 144,588 | 36,325 | 59,115 | |||||||||
|
|
|
|
|
| |||||||
Cash flows from (used in) investing activities | ||||||||||||
Purchase of property, plant and equipment | (34,612) | (45,707) | (47,203) | |||||||||
Purchase of intangible assets | (4,776) | - | - | |||||||||
Restricted cash | (10,627) | - | - | |||||||||
Proceeds on maturity of marketable securities | - | - | 15,753 | |||||||||
Other | 910 | 739 | 840 | |||||||||
|
|
|
|
|
| |||||||
Net cash from (used in) investing activities | (49,105) | (44,968) | (30,610) | |||||||||
|
|
|
|
|
| |||||||
Cash flows from (used in) financing activities | ||||||||||||
Repayment of debt and repurchase of notes | (891,019) | (56,416) | (35,440) | |||||||||
Proceeds from issuance of notes and borrowings of debt | 650,000 | 74,472 | - | |||||||||
Proceeds from issuance of shares | 53,859 | - | - | |||||||||
Repayment of capital lease obligations | (2,465) | (2,593) | (2,733) | |||||||||
Proceeds from sale and lease-back transactions | 1,533 | - | - | |||||||||
Proceeds from (repayment of) credit facilities, net | 26,254 | (5,640) | 6,031 | |||||||||
Payment of note issuance costs | (20,169) | (3,855) | (2,570) | |||||||||
Proceeds from government grants | 6,699 | 9,265 | 5,045 | |||||||||
Other | (444) | - | - | |||||||||
|
|
|
|
|
| |||||||
Net cash from (used in) financing activities | (175,752) | 15,233 | (29,667) | |||||||||
|
|
|
|
|
| |||||||
Effect of exchange rate changes on cash and cash equivalents | (14,287) | 3,699 | 2,302 | |||||||||
|
|
|
|
|
| |||||||
Net increase (decrease) in cash and cash equivalents | (94,556) | 10,289 | 1,140 | |||||||||
Cash and cash equivalents, beginning of year | 147,728 | 137,439 | 136,299 | |||||||||
|
|
|
|
|
| |||||||
Cash and cash equivalents, end of year | $ | 53,172 | $ | 147,728 | $ | 137,439 | ||||||
|
|
|
|
|
| |||||||
The accompanying notes are an integral part of these consolidated financial statements.
90
MERCER INTERNATIONAL INC.
CONSOLIDATED STATEMENTS OF CASH FLOWS (continued)
(In thousands of Euros)U.S. dollars)
| For the Year Ended December 31, | ||||||||||||
| 2012 | 2011 | 2010 | ||||||||||
Cash flows from (used in) operating activities | ||||||||||||
Net income (loss) | € | (10,491 | ) | € | 54,006 | € | 94,748 | |||||
Adjustments to reconcile net income (loss) to cash flows from operating activities | ||||||||||||
Unrealized loss (gain) on derivative instruments | (2,477 | ) | 1,418 | (1,899 | ) | |||||||
Foreign exchange loss (gain) on debt | — | (1,175 | ) | 6,126 | ||||||||
Loss on extinguishment of debt | 81 | 71 | 7,494 | |||||||||
Depreciation and amortization | 58,052 | 56,005 | 56,231 | |||||||||
Deferred income taxes | (118 | ) | (2,377 | ) | (9,760 | ) | ||||||
Stock compensation expense | 2,039 | 3,310 | 2,394 | |||||||||
Pension and other post-retirement expense, net of funding | 284 | (269 | ) | 418 | ||||||||
Other | 3,801 | 1,905 | 7,682 | |||||||||
Changes in working capital | ||||||||||||
Receivables | 8,394 | (1,604 | ) | (40,038 | ) | |||||||
Inventories | 1,342 | (17,713 | ) | (24,462 | ) | |||||||
Accounts payable and accrued expenses | (13,990 | ) | 14,252 | (3,089 | ) | |||||||
Other | (944 | ) | 3,226 | (4,566 | ) | |||||||
|
|
|
|
|
| |||||||
Net cash from (used in) operating activities | 45,973 | 111,055 | 91,279 | |||||||||
|
|
|
|
|
| |||||||
Cash flows from (used in) investing activities | ||||||||||||
Purchase of property, plant and equipment | (36,704 | ) | (37,809 | ) | (38,300 | ) | ||||||
Proceeds on sale of property, plant and equipment | 653 | 813 | 1,138 | |||||||||
Purchase of marketable securities | — | (12,187 | ) | — | ||||||||
Proceeds on maturity of marketable securities | 12,213 | — | — | |||||||||
Note receivable | — | 2,865 | 1,113 | |||||||||
|
|
|
|
|
| |||||||
Net cash from (used in) investing activities | (23,838 | ) | (46,318 | ) | (36,049 | ) | ||||||
|
|
|
|
|
| |||||||
Cash flows from (used in) financing activities | ||||||||||||
Repayment of notes payable and debt | (27,254 | ) | (49,193 | ) | (234,582 | ) | ||||||
Proceeds from borrowings of note payable and debt | — | — | 222,177 | |||||||||
Repayment of capital lease obligations | (2,125 | ) | (2,942 | ) | (2,920 | ) | ||||||
Proceeds from (repayment of) credit facilities, net | 4,559 | (14,652 | ) | (2,660 | ) | |||||||
Payment of note issuance costs | (1,933 | ) | — | (6,095 | ) | |||||||
Proceeds from government grants | 3,888 | 14,199 | 17,952 | |||||||||
Purchase of treasury shares | — | (7,476 | ) | — | ||||||||
|
|
|
|
|
| |||||||
Net cash from (used in) financing activities | (22,865 | ) | (60,064 | ) | (6,128 | ) | ||||||
|
|
|
|
|
| |||||||
Effect of exchange rate changes on cash and cash equivalents | (103 | ) | 1,377 | (1,371 | ) | |||||||
|
|
|
|
|
| |||||||
Net increase (decrease) in cash and cash equivalents | (833 | ) | 6,050 | 47,731 | ||||||||
Cash and cash equivalents, beginning of year | 105,072 | 99,022 | 51,291 | |||||||||
|
|
|
|
|
| |||||||
Cash and cash equivalents, end of year | € | 104,239 | € | 105,072 | € | 99,022 | ||||||
|
|
|
|
|
| |||||||
| For the Year Ended December 31, | ||||||||||||
| 2014 | 2013 | 2012 | ||||||||||
Supplemental disclosure of cash flow information | ||||||||||||
Cash paid during the year for | ||||||||||||
Interest | $ | 65,013 | $ | 65,747 | $ | 66,673 | ||||||
Income taxes | $ | 3,718 | $ | 7,307 | $ | 5,003 | ||||||
Supplemental schedule of non-cash investing and financing activities | ||||||||||||
Payment-in-kind note issued to acquire noncontrolling interest | $ | 12,101 | $ | - | $ | - | ||||||
Acquisition of production and other equipment under capital lease obligations | $ | 2,960 | $ | 2,112 | $ | 2,648 | ||||||
Increase (decrease) in accounts payable and accrued | $ | (1,873) | $ | (5,712) | $ | 7,986 | ||||||
Increase (decrease) in receivables of government grants for long-term assets | $ | (2,871) | $ | 2,871 | $ | (3,291) | ||||||
The accompanying notes are an integral part of these consolidated financial statements.
91
MERCER INTERNATIONAL INC.
CONSOLIDATED STATEMENTS OF CASH FLOWS (continued)
(In thousands of Euros)
| For the Year Ended December 31, | ||||||||||||
| 2012 | 2011 | 2010 | ||||||||||
Supplemental disclosure of cash flow information | ||||||||||||
Cash paid during the year for | ||||||||||||
Interest | € | 51,845 | € | 57,725 | € | 65,167 | ||||||
Income taxes | 3,890 | 3,197 | 461 | |||||||||
Supplemental schedule of non-cash investing and financing activities | ||||||||||||
Acquisition of production and other equipment under capital lease obligations | € | 2,059 | € | 2,782 | € | 2,087 | ||||||
Increase (decrease) in accounts payable for property, plant and equipment | 6,210 | 324 | (1,070 | ) | ||||||||
Increase (decrease) in receivables of government grants for long-term assets | (2,559 | ) | (6,835 | ) | 7,492 | |||||||
The accompanying notes are an integral part of these consolidated financial statements.
MERCER INTERNATIONAL INC.
NOTES TO THE CONSOLIDATED FINANCIAL STATEMENTS
(In thousands of Euros,U.S. dollars, except per share data)
Note 1. The Company and Summary of Significant Accounting Policies
Background
Mercer International Inc. (“Mercer Inc.” or the “Company”) is a Washington corporation and the Company’s shares of common stock are quoted and listed for trading on the NASDAQ Global Market and the Toronto Stock Exchange.
Mercer Inc. operates three pulp manufacturing facilities, one in Canada and two in Germany, and is one of the largest producers of market northern bleached softwood kraft (“NBSK”) pulp in the world.
In these Consolidated Financial Statements, unless otherwise indicated, all amounts are expressed in EurosUnited States dollars (“€$” or “U.S. dollar”). The term “U.S. dollars”symbol “€” refers to the Euro and the symbol “$” refer to United States dollars. The symbol “C$” refers to Canadian dollars.
Basis of Presentation
These Consolidated Financial Statements contained herein include the accounts of the Company and all of its wholly-owned and majority-owned subsidiaries (collectively, the “Company”). The Company’s consolidated financial statements have been prepared in accordance with accounting principles generally accepted in the United States of America (“GAAP”). All significant inter-company balances and transactions have been eliminated upon consolidation.
Use of Estimates
Preparation of financial statements and related disclosures in conformity with GAAP requires management to make estimates and assumptions that affect the amounts reported in the financial statements and accompanying notes. Significant management judgment is required in determining the accounting for, among other things, doubtful accountspensions and reserves,post-retirement benefit obligations, deferred income taxes (valuation allowance), depreciation and amortization, future cash flows associated with impairment testing for long-lived assets, derivative financial instruments, environmental conservation and legal liabilities asset retirement obligations, pensions and post-retirement benefit obligations, income taxes, contingencies, and inventory obsolescence and provisions.contingencies. Actual results could differ materially from these estimates, and changes in these estimates are recorded when known.
Cash and Cash Equivalents and Restricted Cash
Cash and cash equivalents include cash held in bank accounts and highly liquid investments with original maturities of three months or less. Restricted cash is comprised of cash deposits that cannot be withdrawn without prior notice or penalty.
InvestmentsAccounts Receivable
Investments in debt securities and equity investments in publicly traded companies in whichAccounts receivable are recorded at cost, net of an allowance for doubtful accounts. The Company reviews the collectability of receivables at each reporting date. The Company does not exercise significant influencemaintains an allowance for doubtful accounts at an amount estimated to cover the potential losses on certain uninsured receivables. Any amounts that are classified as available-for-sale securities. These securities are reported at fair values; based upon quoted market prices, with the unrealized gains or losses included in accumulated other comprehensive income as a separate component of shareholders’ equity, until realized. If a loss in value in available-for-sale securities is considereddetermined to be other than temporary,uncollectible and uninsured are offset against the loss is recognized in the determination of net income.allowance. The cost of all securities soldallowance is based on the specific identification methodCompany’s evaluation of numerous factors, including the payment history and financial position of the debtors. For certain customers the Company receives a letter of credit prior to determine realized gains or losses.shipping its product.
92
MERCER INTERNATIONAL INC.
NOTES TO THE CONSOLIDATED FINANCIAL STATEMENTS
(In thousands of Euros,U.S. dollars, except per share data)
Note 1. The Company and Summary of Significant Accounting Policies (continued)
Inventories
Inventories of raw materials, finished goods and work in progress are valued at the lower of cost, using the weighted-average cost method, or net realizable value. Other materials and spare parts are valued at the lower of cost and replacement cost. Cost includes labor, materials and production overhead and is determined by using the weighted average cost method. Raw materials inventories include both roundwood (logs) and wood chips. These inventories are located both at the pulp mills and at various offsite locations. In accordance with industry practice, physical inventory counts utilize standardized techniques to estimate quantities of roundwood and wood chip inventory volumes. These techniques historically have provided reasonable estimates of such inventories.
Property, Plant and Equipment
Property, plant and equipment is stated at cost less accumulated depreciation. Depreciation of buildings and production equipment is based on the estimated useful lives of the assets and is computed using the straight-line method. Buildings are depreciated over 10 to 50 years and production equipment and other primarily over 25 years.
The Company reviews its long-lived assets for impairment whenever events or changes in circumstances indicate that the carrying value of such assets may not be recoverable. To determine recoverability, the Company compares the carrying value of the assets to the estimated future undiscounted cash flows. Measurement of an impairment loss for long-lived assets held for use is based on the fair value of the asset.
The costs of major rebuilds, replacements and those expenditures that substantially increase the useful lives of existing property, plant, and equipment are capitalized, as well as interest costs associated with major capital projects until ready for their intended use. The cost of repairs and maintenance as well as planned shutdown maintenance performed on manufacturing facilities, composed of labor, materials and other incremental costs, is charged to operationsrecognized as an expense in the Consolidated Statement of Operations as incurred.
Leases which transfer to the Company substantially all the risks and benefits incidental to ownership of the leased item are capitalized at the present value of the minimum lease payments. Capital leases are depreciated over the lease term. Operating lease payments are recognized as an expense in the Consolidated Statement of Operations on a straight-line basis over the lease term.
The Company provides for asset retirement obligations when there is a legislated or contractual basis for those obligations. Obligations areAn obligation is recorded as a liability at fair value in the period in which the Company incurs a legal obligation associated with a corresponding increase to property, plant, and equipment, andthe retirement of an asset. The associated costs are amortized overcapitalized as part of the remaining useful lifecarrying value of the related assets.asset and amortized over its remaining useful life. The liability is accreted using a risk-free interest rate.
Government Grants
The Company records investment grants from federal and state governments when the conditions of their receipt are complied with and there is reasonable assurance that the grants will be received. Grants related to assets are government grants whose primary condition is that the company qualifying for them should purchase, construct or otherwise acquire long-term assets. Secondary conditions may also be attached, including restricting the type
93
MERCER INTERNATIONAL INC.
NOTES TO THE CONSOLIDATED FINANCIAL STATEMENTS
(In thousands of U.S. dollars, except per share data)
Note 1. The Company and Summary of Significant Accounting Policies (continued)
or location of the assets and/or other conditions that must be met. Grants related to assets are deducted from the asset costs in the Consolidated Balance Sheet.
MERCER INTERNATIONAL INC.
NOTES TO THE CONSOLIDATED FINANCIAL STATEMENTS
(In thousands of Euros, except per share data)
Note 1. The Company and Summary of Significant Accounting Policies (continued)
Grants related to income are government grants which are either unconditional, related to reduced environmental emissions or related to the Company’s normal business operations, and are reported as a reduction of related expenses in the Consolidated Statement of Operations when received.
The Company is required to pay certain fees based on water consumption levels at its German mills. Accrued fees can be reduced by wastewater grants upon the mills’ demonstration of reduced environmentalwastewater emissions. The fees are expensed as incurred and the grants arefee reduction is recognized once the Company has reasonable assurance that the German regulators have evaluated and acceptedwill accept the measurementreduced level of the wastewater emission reduction.emissions. There may be a significant period of time between recognition of the wastewater expense and recognition of the wastewater grant.fee reduction.
To the extent that government grants have been received and not applied, these grants are recorded in cash with a corresponding adjustment to accounts payable and other in the Consolidated Balance Sheet due to the short-term nature of the related payments.
Deferred Note Issuance Costs
Note issuance costs are deferred and amortized on a straight-line basis as a component of interest expense in the Consolidated Statement of Operations over the termcontractual life of the related debt instrument.
Pensions
The Company maintains a defined benefit pension plan for its salaried employees at its Celgar mill which is funded and non-contributory. The cost of the benefits earned by the salaried employees is determined using the projected benefit method prorated on services. The pension expense reflects the current service cost, the interest on the unfunded liability and the amortization over the estimated average remaining service life of the employees of (i) prior service costs, and (ii) the net actuarial gain or loss that exceeds 10% of the greater of the accrued benefit obligation and the fair value of plan assets as of the beginning of the period. The Company recognizes the net funded status of the plan.
In addition, hourly-paid employees at the Celgar mill are covered by a multiemployer pension plan for which contributions are charged against earnings in the Consolidated Statement of Operations.
Foreign Operations and Currency Translation
The Company determines its foreign subsidiaries’ functional currency by reviewing the currency of the primary economic environment in which the foreign subsidiaries operates, which is normally the currency of the environment in which the foreign subsidiaries generate and expend cash. The Company translates foreign assets and liabilities of its non-U.S. dollar functional currency subsidiaries other than those denominated in Euros, atinto U.S. dollars using the rate of exchangein effect at the balance sheet date. Revenuesdate and revenues and expenses are translated at the average rate of exchange throughout the year. TransactionForeign currency translation gains and losses related to net assets primarily located in Canada are recognized as unrealized foreign currency translation adjustments within accumulated other comprehensive income in shareholders’ equity, until allequity.
Transactions in foreign currencies are translated to the respective functional currencies of each operation using exchange rates at the dates of the investmenttransactions. Monetary assets and liabilities denominated in foreign currencies at the subsidiaries is sold or liquidated. The translation adjustments do not recognizereporting date are translated to the effect of income tax whenfunctional currency using the Company expects earnings ofexchange rate at that date. Non-monetary assets and liabilities denominated in foreign currencies are translated to the foreign subsidiary to be indefinitely reinvested. The income tax effect onfunctional currency translation adjustments related to foreign subsidiaries that are not considered indefinitely reinvested is recorded as a component of deferred taxes in the Consolidated Balance Sheet with an offset to other comprehensive income.using historical exchange rates. Gains and losses resulting from foreign currency transactions (transactions denominated in a currency other than the entity’s functional currency) are included in costs and expenses in the Consolidated Statement of Operations.
94
MERCER INTERNATIONAL INC.
NOTES TO THE CONSOLIDATED FINANCIAL STATEMENTS
(In thousands of U.S. dollars, except per share data)
Note 1. The Company and Summary of Significant Accounting Policies (continued)
Where inter-company loans are of a long-term investment nature, the after-tax effect of exchange rate changes are included as an unrealized foreign currency translation adjustment within accumulated other comprehensive income in shareholders’ equity.
MERCER INTERNATIONAL INC.
NOTES TO THE CONSOLIDATED FINANCIAL STATEMENTS
(In thousands of Euros, except per share data)
Note 1. The Company and Summary of Significant Accounting Policies (continued)
Revenue and Related Cost Recognition
The Company recognizes revenue from product, transportation, chemical and other sales when persuasive evidence of an arrangement exists, the sales price is fixed or determinable, title of ownership and risk of loss have passed to the customer and collectability is reasonably assured. Sales are reported net of discounts and allowances.
Amounts charged to customers for shipping and handling are recognized as revenue in the Consolidated Statement of Operations. Shipping and handling costs incurred by the Company are included in operating costs in the Consolidated Statement of Operations.
The Company reports revenue from sales of surplus electricity and the sale of chemicals as energy“energy and chemical revenueschemicals revenue” in the Consolidated Statement of Operations. Energy revenues are recognized as the electricity is consumed by the customers and when collection is reasonably assured. These revenues include an estimate of the value of electricity transferred to customers in the year but billed subsequent to year-end. Customer bills are based on agreed upon rates and meter readings that indicate electricity consumption.
Environmental ConservationShipping and Handling Costs
LiabilitiesAmounts charged to customers for environmental conservationshipping and handling costs are recorded when it is probable that obligations have beenrecognized as revenue in the Consolidated Statement of Operations. Shipping and handling costs incurred and their fair value can be reasonably estimated. Any potential recoveriesby the Company are included in operating costs in the Consolidated Statement of such liabilities are recorded when there is an agreement with the reimbursing entity and recovery is assessed as likely to occur.Operations.
Stock-Based Compensation
The Company recognizes stock-based compensation expense over an award’s vestingrequisite service period based on the award’s fair value in selling, general, and administrative expenses within the Consolidated Statement of Operations.
The fair value ofFor performance share units (“PSUs”) which have the same grant and service inception date, the fair value is re-measured at each balance sheet date by multiplyingbased upon the targeted number of shares to be awarded and the quoted market price of a share of Mercer Inc. commonthe Company’s shares byat that date. For PSUs where the expectedservice inception date precedes the grant date, the fair value is based upon the targeted number of commonshares awarded and the quoted price of the Company’s shares at each reporting date up to the grant date. The target number of shares is determined using management’s best estimate. The final determination of the number of shares to be awarded. The cumulative effectgranted is made by the Company’s Board of the change in fair value is recognized in the period of the change as an adjustment to compensation cost.Directors. The Company estimates forfeitures of performance share unitsPSUs based on management’s expectations and recognizes compensation cost only for those awards expected to vest. Estimated forfeitures are adjusted to actual experience at each balance sheet date.
The fair value of restricted share awardsshares is determined by multiplyingbased upon the marketnumber of shares granted and the quoted price of a share of Mercer Inc. commonthe Company’s shares on the grant date by the number of units granted.grant.
Income Taxes
Deferred income taxes are recognized using the asset and liability method, whereby deferred tax assets and liabilities are recognized for the future tax consequences attributable to differences between the financial statement carrying amounts of existing assets and liabilities and their respective tax bases, and operating loss and
95
MERCER INTERNATIONAL INC.
NOTES TO THE CONSOLIDATED FINANCIAL STATEMENTS
(In thousands of U.S. dollars, except per share data)
Note 1. The Company and Summary of Significant Accounting Policies (continued)
tax credit carryforwards. Valuation allowances are provided if, after considering both positive and negative available evidence, it is more likely than not that some or all of the net deferred tax assets will not be realized.
MERCER INTERNATIONAL INC.
NOTES TO THE CONSOLIDATED FINANCIAL STATEMENTS
(In thousands of Euros, except per share data)
Note 1. The Company and Summary of Significant Accounting Policies (continued)
Deferred income taxes are determined separately for each tax-paying component of the Company. For each tax-paying component, all current deferred tax liabilities and assets are offset and presented as a single net amount and all noncurrentnon-current deferred tax liabilities and assets are offset and presented as a single net amount.
Derivative Financial Instruments
The Company occasionally enters into derivative financial instruments, including foreign currency forward contracts, electricity forward contracts, interest rate swaps and pulp price swaps to limit exposures to changes in foreign currency exchange rates, energy prices, interest rates and pulp prices. These derivative instruments are not designated as hedging instruments. The change in fair value of electricity derivative contracts is included in operating costs in the Consolidated Statement of Operations and any changes in the fair value of foreign currency, interest rate and pulp price derivative contracts are recognized in gain (loss) on derivative instruments in the Consolidated Statement of Operations. Periodically, the Company enters into derivative contracts to supply materials for its own use and as such are exempt from mark-to-market accounting.
Fair Value Measurements
The fair value methodologies and, as a result, the fair value of the Company’s financial instruments are determined based on the fair value hierarchy provided in the Fair Value Measurements and Disclosures topic of the Financial Accounting Standards Board (“FASB”) Accounting Standards Codification, and are as follows:
Level 1 – Valuations based on quoted prices in active markets for identical assets and liabilities.
Level 2 – Valuations based on observable inputs in active markets for similar assets and liabilities, other than Level 1 prices, such as quoted commodity prices or interest or currency exchange rates.
Level 3 – Valuations based on significant unobservable inputs that are supported by little or no market activity, such as discounted cash flow methodologies based on internal cash flow forecasts.
The financial instrument’s fair value measurement level within the fair value hierarchy is based on the lowest level of any input that is significant to the fair value measurement.
Net Income (Loss) Per Share Attributable to Common Shareholders
Basic net income (loss) per share attributable to common shareholders (“EPS”) is computed by dividing net income (loss) available to common shareholders by the weighted average number of common shares outstanding in the period. Diluted income (loss) per share attributable to common shareholders is calculated to give effect to all potentially dilutive common shares outstanding by applying the “Treasury Stock” and “If-Converted” methods. Outstanding stock options, restricted shares, performance shares performance share units, and convertible notesPSUs represent the only potentially dilutive effects on the Company’s weighted average shares.
Reclassifications
Certain prior year amounts in the consolidated financial statements have been reclassified to conform to the current year presentation. DuringFor the year ended December 31, 2012,2013, the Company has presented revenue from the sale of chemicals within energy and chemical revenues in the Consolidated Statement of Operations. This revenue had previously been presented within operating costs. Chemical revenue for the year ended December 31, 2012 was €11,643 (2011 – €10,107; 2010 – €5,063).reclassified $14,760 related to
Note 2. Cash and Cash Equivalents
| December 31, | ||||||||
| 2012 | 2011 | |||||||
Cash and cash equivalents | € | 104,239 | € | 105,072 | ||||
|
|
|
| |||||
Cash and cash equivalents includes cash allocated for debt service reserves and for a capital project as required under certain debt agreements (see Note 8(a)(d)—Debt).96
MERCER INTERNATIONAL INC.
NOTES TO THE CONSOLIDATED FINANCIAL STATEMENTS
(In thousands of Euros,U.S. dollars, except per share data)
Note 1. The Company and Summary of Significant Accounting Policies (continued)
Note 3. Marketable Securities
The Company’s marketable securities at December 31, 2012future derivative payments to accounts payable and 2011 are summarized as follows:
| December 31, 2012 | Amortized Cost | Gross Unrealized Gains | Gross Unrealized Losses | Fair Value | ||||||||||||
Long-term | ||||||||||||||||
Equity securities | € | 65 | € | 154 | € | (35 | ) | € | 184 | |||||||
|
|
|
|
|
|
|
| |||||||||
| December 31, 2011 | Amortized Cost | Gross Unrealized Gains | Gross Unrealized Losses | Fair Value | ||||||||||||
Current | ||||||||||||||||
0.50% German federal government bonds due June 2012 | € | 2,008 | € | 3 | € | — | € | 2,011 | ||||||||
0.75% German federal government bonds due September 2012 | 7,036 | 19 | — | 7,055 | ||||||||||||
5.00% German federal government bonds due July 2012 | 3,143 | 7 | — | 3,150 | ||||||||||||
|
|
|
|
|
|
|
| |||||||||
| € | 12,187 | € | 29 | € | — | € | 12,216 | |||||||||
|
|
|
|
|
|
|
| |||||||||
Long-term | ||||||||||||||||
Equity securities | € | 65 | € | 132 | € | (41 | ) | € | 156 | |||||||
|
|
|
|
|
|
|
| |||||||||
In order to maintain the Company’s liquidity requirements and manage risk, the Company periodically invests in low risk and highly liquid marketable debt securities that are classified as available-for-sale investments and accordingly are carried at fair value. As at December31,2012, all debt securities had matured and the Company realized a gain of €26 in other income (expense) in the Consolidated Statement of Operations.
The Company has also invested nominal amounts in equity securities. The equity securities are classified as available-for-sale investments and accordingly are carried at fair value. The Company recognizes any gross unrealized gains or losses through accumulated other comprehensive income, and records investments in long-term marketable securities in the Consolidated Balance Sheet within deferred note issuance and other.
The Company reviews for other-than-temporary losses on a regular basis and has concluded that the gross unrealized losses indicated above are temporary in nature.
Note 4. Receivables
| December 31, | ||||||||
| 2012 | 2011 | |||||||
Sale of pulp, energy and chemicals, net of allowance of €112 (2011 – €105) | € | 101,451 | € | 108,094 | ||||
Value added tax | 4,290 | 7,411 | ||||||
Other non-trade receivables | 4,346 | 4,982 | ||||||
|
|
|
| |||||
| € | 110,087 | € | 120,487 | |||||
|
|
|
| |||||
MERCER INTERNATIONAL INC.
NOTES TO THE CONSOLIDATED FINANCIAL STATEMENTS
(In thousands of Euros, except per share data)
Note 4. Receivables (continued)
The Company reviews the collectability of receivables at each reporting date. The Company maintains an allowance for doubtful accounts at an amount estimated to cover the potential losses on certain uninsured receivables. Any amounts that are determined to be uncollectible and uninsured are offset against the allowance. The allowance is based on the Company’s evaluationtiming of numerous factors, includingthose payments. This amount was previously presented within long-term liabilities as interest rate derivative liability.
New Accounting Standards
In May 2014, the payment historyFASB issued ASU 2014-09, “Revenue Recognition - Revenue from Contracts with Customers” (“ASU 2014-09”) that requires companies to recognize revenue when a customer obtains control rather than when companies have transferred substantially all risks and rewards of a good or service. This update is effective for annual reporting periods beginning on or after December 15, 2016 and interim periods therein and requires expanded disclosures. The Company is currently assessing the impact the adoption of ASU 2014-09 will have on its consolidated financial position of the debtors. For certain customers the Company receives a letter of credit prior to shipping its product.statements.
Note 5. Inventories2. Receivables
| December 31, | ||||||||
| 2012 | 2011 | |||||||
Raw materials | € | 46,028 | € | 48,063 | ||||
Finished goods | 38,169 | 41,392 | ||||||
Spare parts and other | 34,103 | 31,084 | ||||||
|
|
|
| |||||
| € | 118,300 | € | 120,539 | |||||
|
|
|
| |||||
| December 31, | ||||||||
| 2014 | 2013 | |||||||
Sale of pulp, energy and chemicals, net of allowance | $ | 133,586 | $ | 124,579 | ||||
Value added tax | 2,894 | 4,545 | ||||||
Other non-trade receivables | 4,608 | 6,769 | ||||||
|
|
|
| |||||
| $ | 141,088 | $ | 135,893 | |||||
|
|
|
| |||||
Note 3. Inventories
| December 31, | ||||||||
| 2014 | 2013 | |||||||
Raw materials | $ | 52,877 | $ | 66,356 | ||||
Finished goods | 45,090 | 54,982 | ||||||
Spare parts and other | 48,609 | 49,570 | ||||||
|
|
|
| |||||
| $ | 146,576 | $ | 170,908 | |||||
|
|
|
| |||||
Note 6.4. Property, Plant and Equipment
| December 31, | December 31, | |||||||||||||||
| 2012 | 2011 | 2014 | 2013 | |||||||||||||
Land | € | 25,188 | € | 25,156 | $ | 30,803 | $ | 34,421 | ||||||||
Buildings | 134,394 | 133,316 | 172,626 | 194,676 | ||||||||||||
Production equipment and other | 1,165,274 | 1,125,953 | ||||||||||||||
Production and other equipment | 1,422,828 | 1,570,196 | ||||||||||||||
|
|
|
| |||||||||||||
| 1,324,856 | 1,284,425 | 1,626,257 | 1,799,293 | |||||||||||||
Less: accumulated depreciation | (515,978 | ) | (463,451 | ) | (743,107) | (760,662) | ||||||||||
|
|
|
| |||||||||||||
| € | 808,878 | € | 820,974 | $ | 883,150 | $ | 1,038,631 | |||||||||
|
|
|
| |||||||||||||
97
MERCER INTERNATIONAL INC.
NOTES TO THE CONSOLIDATED FINANCIAL STATEMENTS
(In thousands of U.S. dollars, except per share data)
Note 4. Property, Plant and Equipment (continued)
As at December 31, 2012,2014, property, plant and equipment was net of €276,715$305,045 of unamortized government investment grants (2011(2013 – €291,655)$365,359).
As at December31,2012, 2014, included in production equipment and other equipment is equipment under capital leases which had gross amounts of €16,466 (2011$20,325 (2013 – €17,036)$20,550), and accumulated depreciation of €8,375 (2011$6,218 (2013 – €9,096)$9,447). During the year, production equipment and other equipment totalling €2,059$2,960 was acquired under capital lease obligations (2011(2013 – €2,782; 2010$2,112; 2012 – €2,087)$2,648).
The Company maintains industrial landfills on its premises for the disposal of waste, primarily from the mill’smills’ pulp processing activities. The mills have obligations under their landfill permits to decommission these disposal facilities pursuant to certain regulations. As at December31,2012, 2014, the Company had recorded €4,251 (2011$4,798 (2013 – €4,170)$5,549) of asset retirement obligations in capital leases and other in the Consolidated Balance Sheet. The Company believes the accrued amounts recorded are sufficient.
MERCER INTERNATIONAL INC.Note 5. Other Assets
NOTES TO THE CONSOLIDATED FINANCIAL STATEMENTS
| December 31, | ||||||||
| 2014 | 2013 | |||||||
Deferred note issuance costs | $ | 14,012 | $ | 13,711 | ||||
Intangible assets | 5,448 | 2,659 | ||||||
Other assets | 3,307 | 4,628 | ||||||
|
|
|
| |||||
| $ | 22,767 | $ | 20,998 | |||||
|
|
|
| |||||
(In thousandsAs at December 31, 2014, included in intangible assets are costs related to enterprise resource planning (“ERP”) software which had gross amounts of Euros, except per share data)$4,648 (2013 – $1,025) and accumulated amortization of $193 (2013 – $nil). The ERP software is being depreciated over 5 years using the straight-line method as modules are implemented.
Note 7.6. Accounts Payable and Other
| December 31, | ||||||||
| 2012 | 2011 | |||||||
Trade payables | € | 30,259 | € | 45,751 | ||||
Accrued expenses | 35,852 | 28,422 | ||||||
Accrued interest | 8,739 | 10,054 | ||||||
Capital leases, current portion (Note 18) | 1,958 | 2,505 | ||||||
Current taxes payable (Note 10) | 7,217 | 2,541 | ||||||
Other (a) | 5,925 | 10,367 | ||||||
|
|
|
| |||||
| € | 89,950 | € | 99,640 | |||||
|
|
|
| |||||
Note 8. Debt
Trade payables Accrued expenses Interest rate derivative liability, current portion (Note 17) Accrued interest Capital leases, current portion (Note 19) Current taxes payable (Note 9) Other Debt consists of the following: December 31, 2014 2013 $ 34,329 $ 44,289 41,368 39,060 14,832 20,099 4,728 5,358 2,987 2,254 1,425 1,132 2,556 6,382 $ 102,225 $ 118,574
| December 31, | ||||||||
| 2012 | 2011 | |||||||
Note payable to bank, included in a total loan credit facility of €827,950 to finance the construction related to the Stendal mill (a) | € | 452,907 | € | 477,490 | ||||
Senior notes, interest at 9.50% accrued and payable semi-annually, unsecured (b) | 215,670 | 220,753 | ||||||
Credit agreement with a lender with respect to a revolving credit facility of C$40 million (c) | 4,574 | — | ||||||
Term bank facility for a project at the Stendal mill of €17,000 (d) | — | — | ||||||
Loans payable to the noncontrolling shareholder of the Stendal mill (e) | 36,620 | 33,124 | ||||||
Investment loan agreement with a lender with respect to a project at the Rosenthal mill of €4,351 (f) | 1,632 | 2,719 | ||||||
Credit agreement with a bank with respect to a revolving credit facility of €25,000 (g) | — | — | ||||||
Credit agreement with a bank with respect to a revolving credit facility of €3,500 (h) | — | — | ||||||
|
|
|
| |||||
| 711,403 | 734,086 | |||||||
Less: current portion | (45,662 | ) | (25,671 | ) | ||||
|
|
|
| |||||
Debt, less current portion | € | 665,741 | € | 708,415 | ||||
|
|
|
| |||||
98
MERCER INTERNATIONAL INC.
NOTES TO THE CONSOLIDATED FINANCIAL STATEMENTS
(In thousands of Euros,U.S. dollars, except per share data)
Note 8.7. Debt (continued)
| December 31, | ||||||||
| 2014 | 2013 | |||||||
2019 Senior Notes, unsecured (a) | $ | 250,000 | $ | - | ||||
2022 Senior Notes, unsecured (a) | 400,000 | - | ||||||
2017 Senior Notes, unsecured (a) | - | 336,382 | ||||||
Note payable to finance the construction related to the Stendal mill (b) | - | 568,945 | ||||||
Term bank facility for a project at the Stendal mill (b) | - | 21,179 | ||||||
Loans payable to a noncontrolling shareholder of the Stendal mill (c) | - | 52,117 | ||||||
Payment-in-kind note (c) | 12,101 | - | ||||||
Investment loan agreement for a project at the Rosenthal mill (d) | - | 749 | ||||||
Credit agreements | ||||||||
€75.0 million (e) | 25,412 | - | ||||||
C$40.0 million (f) | - | - | ||||||
€25.0 million (g) | - | - | ||||||
€5.0 million (h) | - | - | ||||||
|
|
|
| |||||
| 687,513 | 979,372 | |||||||
Less: current portion | (12,101) | (60,355) | ||||||
|
|
|
| |||||
Debt, less current portion | $ | 675,412 | $ | 919,017 | ||||
|
|
|
| |||||
The Company made repayments under these facilities of €27,254 in 2012, and expects the repayments to be €45,662 in 2013. As of December 31, 2012,2014, the maturities of debt are as follows:
Matures | Amount | Amount | ||||||
2013 | € | 45,662 | ||||||
2014 | 40,544 | |||||||
2015 | 44,000 | $ | 12,101 | |||||
2016 | 44,000 | - | ||||||
2017 | 537,197 | - | ||||||
2018 | - | |||||||
2019 | 275,412 | |||||||
Thereafter | — | 400,000 | ||||||
|
| |||||||
| € | 711,403 | $ | 687,513 | |||||
|
| |||||||
Certain of the Company’s debt instruments were issued under an indenturecertain indentures which, among other things, restrictsrestrict its ability and the ability of its restricted subsidiaries to make certain payments.payments, including dividends. These limitations are subject to specific exceptions. As at December 31, 2012,2014, the Company was in compliance with the terms of the indenture.indentures.
| (a) |
On March 13, 2009, the Company finalized an agreement with its lenders to amend its Stendal Loan Facility. The amendment deferred approximately €164,000 of scheduled principal payments until the maturity date, September 30, 2017. The amendment also provided for a 100% cash sweep, referred to as the “Cash Sweep”, of any cash, in excess of a €15,000 working capital reserve and the Guarantee Amount, as discussed in Note 19(b)—Commitments and Contingencies, and other amounts as contemplated in the amendment, held by Stendal which will be used first to fund the DSRA to a level sufficient to service the amounts due and payable under the Stendal Loan Facility during the then following 12 months, which means the DSRA is “Fully Funded”, and second to prepay the deferred principal amounts. As at December 31, 2012, the DSRA balance was €32,982 and was not Fully Funded.
| On November |
99
MERCER INTERNATIONAL INC.
NOTES TO THE CONSOLIDATED FINANCIAL STATEMENTS
(In thousands of U.S. dollars, except per share data)
Note 7. Debt (continued)
| 100% of their principal amount. The net proceeds from the Senior Notes |
In August 2011, the Company’s Board of Directors authorized the purchase of up to $25.0 million in aggregate principal amount of the Company’s Senior Notes from time to time, over a period ending August 2012. In June 2012, the Company’s Board of Directors authorized the purchase of up to €50,000 in aggregate principal amount of the Company’s Senior Notes from time to time, over a period ending
MERCER INTERNATIONAL INC.
NOTES TO THE CONSOLIDATED FINANCIAL STATEMENTS
(In thousands of Euros, except per share data)
Note 8. Debt (continued)
June 2013. During the year ended December 31, 2012, the Company purchased $2.0 million of its outstanding Senior Notes. During the year ended December 31, 2011, the Company purchased $13.6 million of its outstanding Senior Notes.
The Senior Notes are general unsecured senior obligations of the Company. The Senior NotesThey rank equal in right of payment with all existing and future unsecured senior unsecured indebtedness of the Company and are senior in right of payment to any current or future subordinated indebtedness of the Company. The Senior Notes are effectively junior in right of payment to all borrowingsexisting and future secured indebtedness, to the extent of the Company’s restricted subsidiaries, including borrowings underassets securing such indebtedness, and all indebtedness and liabilities of the Company’s credit agreements which are secured by certain assets of its restricted subsidiaries.
The Company may redeem all or a part of the Senior Notes, upon not less than 30 days’ or more than 60 days’ notice, at the redemption prices (expressed as percentages of principal amount) discussed below, plus accrued and unpaid interest to (but not including) the applicable redemption date. The 2019 Senior Notes redemption prices are equal to 104.75%103.500% for the twelve month period beginning on December 1, 2014, 102.38%2016, 101.750% for the twelve month period beginning on December 1, 2015,2017, and 100.00%100.000% beginning on December 1, 20162018 and at any time thereafter, plus accruedthereafter. The 2022 Senior Notes redemption prices are equal to 105.813% for the twelve month period beginning on December 1, 2017, 103.875% for the twelve month period beginning on December 1, 2018, 101.938% for the twelve month period beginning on December 1, 2019, and unpaid interest.100.000% beginning on December 1, 2020 and at any time thereafter.
On November 17, 2010, the Company completed a private offering of $300,000 in aggregate principal amount of senior notes due 2017 (“2017 Senior Notes”). In July 2013, the Company issued an additional $50,000 in aggregate principal amount of its 2017 Senior Notes.
The Company used $238,899 of the net proceeds from the Senior Notes offering, together with cash on hand of $112,967 to repurchase the 2017 Senior Notes. The settlement of the 2017 Senior Notes resulted in a loss of $20,523 recorded in the Consolidated Statement of Operations.
| (b) | Loan payable to bank, included in a total loan facility of €828.0 million to finance the construction related to the Stendal mill, interest at rates varying from Euribor plus 0.90% to Euribor plus 1.80%, and a €17.0 million amortizing term facility to partially finance a project at the Stendal Mill, interest at a rate of Euribor plus 3.5% per annum (collectively the “Prior Stendal Facilities”). On November 26, 2014, the Company used $397,050 of the net proceeds from the Senior Notes offering (Note 7(a)), together with cash on hand and borrowings under the Company’s revolving credit facilities to repay the principal and accrued interest amount outstanding under the Prior Stendal Facilities. The settlement of the Prior Stendal Facilities resulted in a loss of $7,971 recorded in the Consolidated Statement of Operations. |
| (c) | On September 30, 2014, the Company settled all of the outstanding loans payable to the noncontrolling shareholder of the Stendal mill in exchange for a loan of €12.5 million ($15,785), of which approximately €2.5 million ($3,322) was settled in cash and €10.0 million ($12,101) that is payable by way of a payment-in-kind note which matures in October 2015. The payment-in-kind note bears no interest for the six month period beginning on October 1, 2014 and 8.00% thereafter and can be settled in cash or shares of the Company’s common stock at the Company’s election. The settlement of the outstanding loans payable to the noncontrolling shareholder resulted in a gain of $31,851 recorded in the Consolidated Statement of Operations. |
100
MERCER INTERNATIONAL INC.
NOTES TO THE CONSOLIDATED FINANCIAL STATEMENTS
(In thousands of U.S. dollars, except per share data)
Note 7. Debt (continued)
| (d) | A €4.4 million investment loan agreement with a lender relating to the wash press project at the Rosenthal mill that matured in February 2014. |
| (e) | Credit agreement with respect to a revolving credit facility of up to €75.0 million for the Stendal mill. The credit facility matures October 2019. Borrowings under the facility are collateralized by the mill’s inventory and receivables and bear interest at Euribor plus 3.50%. As at December 31, 2014, €21.0 million ($25,412) of this facility was drawn and was accruing interest at a rate of 3.55%, and approximately €54.0 million ($65,345) was available. |
| (f) | Credit agreement with respect to a revolving credit facility of up to C$40.0 million for the Celgar mill. The credit |
In January 2012, the Stendal mill entered into two additional loans payable by the Stendal mill to its noncontrolling shareholder as part of the financing for Project Blue Mill. The first loan has a principal amount of €1,192 and the second loan has a principal amount of €440. Both loans bear interest at 7.00% per annum and are due in 2017, provided that the Project Blue Mill facility (Note 8(d)) and the Stendal Loan
MERCER INTERNATIONAL INC.
NOTES TO THE CONSOLIDATED FINANCIAL STATEMENTS
(In thousands of Euros, except per share data)
Note 8. Debt (continued)
Facility (Note 8(a)) have been fully repaid on such date. The second loan may be repaid prior to October 1, 2017 if the DSRA has been Fully Funded for the first time. The first loan is subordinated to all liabilities of the Stendal mill and the second loan is subordinated to all liabilities of the Stendal mill only until such time as the DSRA is Fully Funded for the first time.
As at December 31, 2012, accrued interest on these loans was €9,860 (2011 – €7,996).
| (g) | A |
| (h) | A |
Note 9.8. Pension and Other Post-Retirement Benefit Obligations
Included in pension and other post-retirement benefit obligations are amounts related to the Company’s Celgar and Rosenthal mills. The largest component of this obligation is with respect to the Celgar mill which maintains a defined benefit pension plan and post-retirement benefit plans for certain employees (“Celgar Plans”).
Pension benefits are based on employees’ earnings and years of service. The Celgar Plans are funded by contributions from the Company based on actuarial estimates and statutory requirements. Pension contributions during the year ended December 31, 20122014 totaled €2,288 (2011$2,951 (2013 – €2,039)$2,878).
Effective December 31, 2008, the defined benefit plan was closed to new members. In addition, the defined benefit service accrual ceased on December 31, 2008, and members began to receive pension benefits, at a fixed contractual rate, under a new defined contribution plan effective January 1, 2009. During the year ended December 31, 2012,2014, the Company made contributions of €618 (2011$759 (2013 – €524)$773) to this plan.
101
MERCER INTERNATIONAL INC.
NOTES TO THE CONSOLIDATED FINANCIAL STATEMENTS
(In thousands of Euros,U.S. dollars, except per share data)
Note 9.8. Pension and Other Post-Retirement Benefit Obligations (continued)
Information about the Celgar Plans, in aggregate for the year ended December 31,2012 2014 is as follows:
| 2012 | 2014 | |||||||||||||||||||||||
| Pension | Other Post- Retirement Benefit Obligations | Total | Pension | Other Post- Retirement Benefit Obligations | Total | |||||||||||||||||||
Change in benefit obligation | ||||||||||||||||||||||||
Benefit obligation, December 31, 2011 | € | 35,778 | € | 19,797 | € | 55,575 | ||||||||||||||||||
Benefit obligation, December 31, 2013 | $ | 43,566 | $ | 28,458 | $ | 72,024 | ||||||||||||||||||
Service cost | 112 | 564 | 676 | 121 | 724 | 845 | ||||||||||||||||||
Interest cost | 1,525 | 875 | 2,400 | 1,836 | 1,244 | 3,080 | ||||||||||||||||||
Benefit payments | (1,905 | ) | (605 | ) | (2,510 | ) | (2,571) | (825) | (3,396) | |||||||||||||||
Actuarial losses | 1,193 | 762 | 1,955 | 3,901 | 1,350 | 5,251 | ||||||||||||||||||
Foreign currency exchange rate changes | 186 | 81 | 267 | (3,780) | (2,486) | (6,266) | ||||||||||||||||||
|
|
|
|
|
| |||||||||||||||||||
Benefit obligation, December 31, 2012 | 36,889 | 21,474 | 58,363 | |||||||||||||||||||||
Benefit obligation, December 31, 2014 | 43,073 | 28,465 | 71,538 | |||||||||||||||||||||
|
|
| ||||||||||||||||||||||
|
|
| ||||||||||||||||||||||
Reconciliation of fair value of plan assets | ||||||||||||||||||||||||
Fair value of plan assets, December 31, 2011 | 23,734 | — | 23,734 | |||||||||||||||||||||
Fair value of plan assets, December 31, 2013 | $ | 35,372 | $ | - | $ | 35,372 | ||||||||||||||||||
Actual returns | 1,905 | — | 1,905 | 3,829 | - | 3,829 | ||||||||||||||||||
Contributions | 1,683 | 605 | 2,288 | 2,126 | 825 | 2,951 | ||||||||||||||||||
Benefit payments | (1,905 | ) | (605 | ) | (2,510 | ) | (2,571) | (825) | (3,396) | |||||||||||||||
Foreign currency exchange rate changes | 101 | — | 101 | (3,103) | - | (3,103) | ||||||||||||||||||
|
|
|
|
|
| |||||||||||||||||||
Fair value of plan assets, December 31, 2012 | 25,518 | — | 25,518 | |||||||||||||||||||||
Fair value of plan assets, December 31, 2014 | 35,653 | - | 35,653 | |||||||||||||||||||||
|
|
|
|
|
| |||||||||||||||||||
Funded status, December 31, 2012(1) | € | (11,371 | ) | € | (21,474 | ) | € | (32,845 | ) | |||||||||||||||
Funded status, December 31, 2014(1) | $ | (7,420) | $ | (28,465) | $ | (35,885) | ||||||||||||||||||
|
|
| ||||||||||||||||||||||
|
|
| ||||||||||||||||||||||
Components of the net benefit cost recognized | ||||||||||||||||||||||||
Service cost | € | 112 | € | 564 | € | 676 | $ | 121 | $ | 724 | $ | 845 | ||||||||||||
Interest cost | 1,525 | 875 | 2,400 | 1,836 | 1,244 | 3,080 | ||||||||||||||||||
Expected return on plan assets | (1,637 | ) | — | (1,637 | ) | (2,225) | - | (2,225) | ||||||||||||||||
Amortization of unrecognized items | 1,130 | 5 | 1,135 | 787 | (12) | 775 | ||||||||||||||||||
|
|
|
|
|
| |||||||||||||||||||
Net benefit costs | € | 1,130 | € | 1,444 | € | 2,574 | $ | 519 | $ | 1,956 | $ | 2,475 | ||||||||||||
|
|
|
|
|
| |||||||||||||||||||
| (1) | The total of |
102
MERCER INTERNATIONAL INC.
NOTES TO THE CONSOLIDATED FINANCIAL STATEMENTS
(In thousands of Euros,U.S. dollars, except per share data)
Note 9.8. Pension and Other Post-Retirement Benefit Obligations (continued)
Information about the Celgar Plans, in aggregate for the year ended December 31,2011 2013 is as follows:
| 2011 | 2013 | |||||||||||||||||||||||
| Pension | Other Post- Retirement Benefit Obligations | Total | Pension | Other Post- Retirement Benefit Obligations | Total | |||||||||||||||||||
Change in benefit obligation | ||||||||||||||||||||||||
Benefit obligation, December 31, 2010 | € | 32,068 | € | 16,643 | �� | 48,711 | ||||||||||||||||||
Benefit obligation, December 31, 2012 | $ | 48,639 | $ | 28,314 | $ | 76,953 | ||||||||||||||||||
Service cost | 87 | 469 | 556 | 137 | 753 | 890 | ||||||||||||||||||
Interest cost | 1,511 | 815 | 2,326 | 1,836 | 1,108 | 2,944 | ||||||||||||||||||
Benefit payments | (1,716 | ) | (461 | ) | (2,177 | ) | (2,772) | (767) | (3,539) | |||||||||||||||
Actuarial losses | 3,382 | 2,049 | 5,431 | |||||||||||||||||||||
Special termination benefits | 277 | - | 277 | |||||||||||||||||||||
Actuarial losses (gains) | (1,472) | 943 | (529) | |||||||||||||||||||||
Foreign currency exchange rate changes | 446 | 282 | 728 | (3,079) | (1,893) | (4,972) | ||||||||||||||||||
|
|
|
|
|
| |||||||||||||||||||
Benefit obligation, December 31, 2011 | 35,778 | 19,797 | 55,575 | |||||||||||||||||||||
Benefit obligation, December 31, 2013 | 43,566 | 28,458 | 72,024 | |||||||||||||||||||||
|
|
| ||||||||||||||||||||||
|
|
| ||||||||||||||||||||||
Reconciliation of fair value of plan assets | ||||||||||||||||||||||||
Fair value of plan assets, December 31, 2010 | 23,863 | — | 23,863 | |||||||||||||||||||||
Fair value of plan assets, December 31, 2012 | $ | 33,647 | $ | - | $ | 33,647 | ||||||||||||||||||
Actual returns | (204 | ) | — | (204 | ) | 4,686 | - | 4,686 | ||||||||||||||||
Contributions | 1,578 | 461 | 2,039 | 2,111 | 767 | 2,878 | ||||||||||||||||||
Benefit payments | (1,716 | ) | (461 | ) | (2,177 | ) | (2,772) | (767) | (3,539) | |||||||||||||||
Foreign currency exchange rate changes | 213 | — | 213 | (2,300) | - | (2,300) | ||||||||||||||||||
|
|
|
|
|
| |||||||||||||||||||
Fair value of plan assets, December 31, 2011 | 23,734 | — | 23,734 | |||||||||||||||||||||
Fair value of plan assets, December 31, 2013 | 35,372 | - | 35,372 | |||||||||||||||||||||
|
|
|
|
|
| |||||||||||||||||||
Funded status, December 31, 2011(1) | € | (12,044 | ) | € | (19,797 | ) | € | (31,841 | ) | |||||||||||||||
Funded status, December 31, 2013(1) | $ | (8,194) | $ | (28,458) | $ | (36,652) | ||||||||||||||||||
|
|
| ||||||||||||||||||||||
|
|
| ||||||||||||||||||||||
Components of the net benefit cost recognized | ||||||||||||||||||||||||
Service cost | € | 87 | € | 469 | € | 556 | $ | 137 | $ | 753 | $ | 890 | ||||||||||||
Interest cost | 1,511 | 815 | 2,326 | 1,836 | 1,108 | 2,944 | ||||||||||||||||||
Expected return on plan assets | (1,549 | ) | — | (1,549 | ) | (2,133) | - | (2,133) | ||||||||||||||||
Special termination benefits | 277 | - | 277 | |||||||||||||||||||||
Amortization of unrecognized items | 511 | (69 | ) | 442 | 1,439 | 116 | 1,555 | |||||||||||||||||
|
|
|
|
|
| |||||||||||||||||||
Net benefit costs | € | 560 | € | 1,215 | € | 1,775 | $ | 1,556 | $ | 1,977 | $ | 3,533 | ||||||||||||
|
|
|
|
|
| |||||||||||||||||||
| (1) | The total of |
103
MERCER INTERNATIONAL INC.
NOTES TO THE CONSOLIDATED FINANCIAL STATEMENTS
(In thousands of U.S. dollars, except per share data)
Note 8. Pension and Other Post-Retirement Benefit Obligations (continued)
The Company anticipates that it will make contributions to the Celgar Plans of approximately €1,509$1,602 in 2013.2015. Estimated future benefit payments under the Celgar Plans are as follows:
| Amount | ||||
2013 | € | 2,622 | ||
2014 | 2,765 | |||
2015 | 2,890 | |||
2016 | 3,030 | |||
2017 | 3,175 | |||
2018 – 2022 | 17,482 | |||
MERCER INTERNATIONAL INC.
NOTES TO THE CONSOLIDATED FINANCIAL STATEMENTS
(In thousands of Euros, except per share data)
Note 9. Pension and Other Post-Retirement Benefit Obligations (continued)
| Amount | ||||
2015 | $ | 3,351 | ||
2016 | 3,461 | |||
2017 | 3,548 | |||
2018 | 3,643 | |||
2019 | 3,744 | |||
2020 – 2024 | 19,682 | |||
During the year ended December 31, 2012,2014, the Company recognized a loss, net of tax of €628$2,873 in other comprehensive income (2011(2013 – income of $4,636; 2012 – loss of €8,049; 2010 – loss of €3,314)$808). As at December 31, 2012,2014, the pension related accumulated other comprehensive incomeloss balance of €15,969 (2011$19,287 (2013 – €15,341)$16,414) is primarily a result of net actuarial losses. These amounts have been stated net of tax. The Celgar Plans do not have any net transition asset or obligation recognized as a reclassification adjustment of other comprehensive income. The amount included in accumulated other comprehensive incomeloss which is expected to be recognized in 20132015 is approximately €1,221$977 of net actuarial losses. There are no plan assets that are expected to be returned to the Company in 2013.2015.
Summary of key assumptions:
| December 31, | December 31, | |||||||||||||||
| 2012 | 2011 | 2014 | 2013 | |||||||||||||
Benefit obligations | ||||||||||||||||
Discount rate | 4.00 | % | 4.25 | % | 3.75% | 4.50% | ||||||||||
Rate of compensation increase | 2.75 | % | 2.75 | % | 2.50% | 2.75% | ||||||||||
Net benefit cost for year ended | ||||||||||||||||
Discount rate | 4.25 | % | 5.00 | % | 4.50% | 4.00% | ||||||||||
Rate of compensation increase | 2.75 | % | 2.75 | % | 2.75% | 2.75% | ||||||||||
Expected rate of return on plan assets | 6.75 | % | 6.75 | % | 6.60% | 6.60% | ||||||||||
Assumed health care cost trend rate at | ||||||||||||||||
Assumed health care cost trend rate | ||||||||||||||||
Initial health care cost trend rate | 8.50 | % | 9.00 | % | 7.50% | 8.00% | ||||||||||
Annual rate of decline in trend rate | 0.50 | % | 0.50 | % | 0.50% | 0.50% | ||||||||||
Ultimate health care cost trend rate | 4.50 | % | 4.50 | % | 4.50% | 4.50% | ||||||||||
Medical services plan premiums trend rate | 6.00 | % | 6.00 | % | ||||||||||||
Medical service plan premiums trend rate | 4.50% | 4.50% | ||||||||||||||
The expected rate of return on plan assets is a management estimate based on, among other factors, historical long-term returns, expected asset mix and active management premium.
The discount rate assumption is adjusted annually to reflect the rates available on high-quality debt instruments, with a duration that is expected to match the timing of expected pension and other post-retirement benefit obligations. High-quality debt instruments are corporate bonds with a rating of “AA” or better.
104
MERCER INTERNATIONAL INC.
NOTES TO THE CONSOLIDATED FINANCIAL STATEMENTS
(In thousands of U.S. dollars, except per share data)
Note 8. Pension and Other Post-Retirement Benefit Obligations (continued)
A one-percentage point change in assumed health care cost trend rate would have the following effect on the post-retirement benefit obligations:
| December 31, 2012 | December 31, 2011 | |||||||||||||||
| 1% Increase | 1% Decrease | 1% Increase | 1% Decrease | |||||||||||||
Effect on total service and interest rate components | € | 39 | € | (41 | ) | € | 39 | € | (40 | ) | ||||||
Effect on post-retirement benefit obligation | € | 744 | € | (716 | ) | € | 621 | € | (600 | ) | ||||||
MERCER INTERNATIONAL INC.
NOTES TO THE CONSOLIDATED FINANCIAL STATEMENTS
(In thousands of Euros, except per share data)
Note 9. Pension and Other Post-Retirement Benefit Obligations (continued)
| December 31, 2014 | December 31, 2013 | |||||||||||||||
| 1% Increase | 1% Decrease | 1% Increase | 1% Decrease | |||||||||||||
Effect on total service and interest rate components | $ | 54 | $ | (56) | $ | 51 | $ | (53) | ||||||||
Effect on post-retirement benefit obligation | $ | 830 | $ | (806) | $ | 927 | $ | (896) | ||||||||
Asset allocation of funded plans:
| Target | 2012 | 2011 | Target | 2014 | 2013 | |||||||||||||
Equity securities | 60 | % | 58 | % | 56 | % | 60% | 61% | 64% | |||||||||
Debt securities | 40 | % | 42 | % | 44 | % | 40% | 39% | 36% | |||||||||
Cash and cash equivalents | 0 | % | 0 | % | 0 | % | 0% | 0% | 0% | |||||||||
|
|
|
| |||||||||||||||
| 100 | % | 100 | % | 100% | 100% | |||||||||||||
|
|
|
| |||||||||||||||
Investment Objective
The investment objective for the Celgar Plans is to sufficiently diversify invested plan assets to maintain a reasonable level of risk without imprudently sacrificing the return on the invested funds, and ultimately to achieve a long-term total rate of return, net of fees and expenses, at least equal to the long-term interest rate assumptions used for funding actuarial valuations. To achieve this objective, the Company’s overall investment strategy is to maintain an investment allocation mix of long-term growth investments (equities) and fixed income investments (debt securities). Investment allocation targets have been established by asset class as summarized above. The asset allocation targets are set after considering the nature of the liabilities, long-term return expectations, the risks associated with key asset classes, inflation and interest rates and related management fees and expenses. In addition, the Celgar Plans’ investment strategy seeks to minimize risk beyond legislated requirements by constraining the investment managers’ investment options. There are a number of specific constraints based on investment type, but they all have the general purpose of ensuring that the investments are fully diversified and that risk is appropriately managed. For example, no more than 10% of the book value of the assets can be invested in any one entity or group, investments in any one entity cannot exceed 30% of the voting shares and all equity holdings must be listed on a public exchange. Reviews of the investment objectives, key assumptions and the independent investment managers are performed periodically.
Celgar Plans’ asset fair value measurements at December 31, 2012:2014:
Asset category | Quoted Prices in Active Markets for Identical Assets | Significant Other Observable Inputs | Significant Unobservable Inputs | Total | Quoted Prices in Active Markets for Identical Assets | Significant Other Observable Inputs | Significant Unobservable Inputs | Total | ||||||||||||||||||||||||
Leith Wheeler Diversified Funds | € | 14,626 | € | — | € | — | € | 14,626 | $ | 21,816 | $ | - | $ | - | $ | 21,816 | ||||||||||||||||
Phillips, Hagar and North Bond Fund | 10,766 | — | — | 10,766 | 13,780 | - | - | 13,780 | ||||||||||||||||||||||||
Cash | 126 | — | — | 126 | 57 | - | - | 57 | ||||||||||||||||||||||||
|
|
|
|
|
|
|
| |||||||||||||||||||||||||
Total assets | € | 25,518 | € | — | € | — | € | 25,518 | $ | 35,653 | $ | - | $ | - | $ | 35,653 | ||||||||||||||||
|
|
|
|
|
|
|
| |||||||||||||||||||||||||
105
MERCER INTERNATIONAL INC.
NOTES TO THE CONSOLIDATED FINANCIAL STATEMENTS
(In thousands of U.S. dollars, except per share data)
Note 8. Pension and Other Post-Retirement Benefit Obligations (continued)
Concentrations of Risk in the Celgar Plans’ Assets
The Company has reviewed the Celgar Plans’ investments and determined that they are allocated based on the specific investment manager’s stated investment strategy with only slight over- or under-weightings within any specific category, and that those investments are within the constraints that have been set by the Company. Those constraints include a limitation on the value that can be invested in any one entity or group and the investment category targets noted above. In addition, we have two independent investment managers. The Company has concluded that there are no significant concentrations of risk.
MERCER INTERNATIONAL INC.
NOTES TO THE CONSOLIDATED FINANCIAL STATEMENTS
(In thousands of Euros, except per share data)
Note 9. Pension and Other Post-Retirement Benefit Obligations (continued)
Multiemployer Plan
The Company participates in a multiemployer plan for the hourly-paid employees at the Celgar mill. The contributions to the plan are determined based on an amount per hour workeda percentage of pensionable earnings pursuant to a collective bargaining agreement. The Company has no current or future contribution obligations in excess of the contractual contributions. The contributions during the year ended December 31, 2014 totaled $2,085 (2013 – $2,635; 2012 – $2,644). Plan details are included in the following table:
| Provincially Registered Plan Number | Expiration Date of Collective Bargaining Agreement | |||||||||||||||||||||||||||||
| Are the Company’s Contributions Greater Than 5% of Total Contributions | ||||||||||||||||||||||||||||||
| Company Contributions | Provincially Registered Plan Number | Expiration Date of Collective Bargaining Agreement | Are the Company’s Contributions Greater Than 5% of Total Contributions | |||||||||||||||||||||||||||
Legal name | 2012 | 2011 | 2012 | 2011 | 2014 | 2013 | ||||||||||||||||||||||||
The Pulp and Paper Industry Pension Plan | P085324 | April 30, 2017 | € | 2,056 | € | 1,760 | Yes | Yes | P085324 | April 30, 2017 | Yes | Yes | ||||||||||||||||||
Note 10.9. Income Taxes
Income (loss) before income taxes by taxing jurisdiction was as follows:
| Year Ended December��31, | ||||||||||||
| 2014 | 2013 | 2012 | ||||||||||
Domestic | $ | (55,089) | $ | (31,032) | $ | (23,268) | ||||||
Foreign | 159,281 | 14,460 | 19,156 | |||||||||
|
|
|
|
|
| |||||||
| $ | 104,192 | $ | (16,572) | $ | (4,112) | |||||||
|
|
|
|
|
| |||||||
The income tax benefit (provision) recognized in the Consolidated Statement of Operations for the years ended December 31, 2014, 2013 and 2012 is related to foreign tax jurisdictions.
The Company’s effective income tax rate can be affected by many factors, including but not limited to, changes in the mix of earnings in tax jurisdictions with differing statutory rates, changes in corporate structure, changes in the valuation of deferred tax assets and liabilities, the result of audit examinations of previously filed tax returns and changes in tax laws. The asset and liability approach is used to recognize deferred tax assets and liabilities for the expected future tax consequences of temporary differences between the carrying amounts and the tax bases of assets and liabilities.
106
MERCER INTERNATIONAL INC.
NOTES TO THE CONSOLIDATED FINANCIAL STATEMENTS
(In thousands of U.S. dollars, except per share data)
Note 9. Income Taxes (continued)
The Company and/or one or more of its subsidiaries file income tax returns in the United States (“U.S.”), Germany and Canada. Currently, the Company does not anticipate that the expiration of the statuestatute of limitations or the completion of audits in the next fiscal year will result in liabilities for uncertain income tax positions that are materially different than the amounts accrued or disclosed as of December 31, 2012.2014. However, this belief could change as tax years are examined by taxing authorities, the timing of those examinations, if any, are uncertain at this time. During 2012,2013, the German tax authorities completed examinations of 2008, 2009, and 2010 tax years2011 for all but two entities. For one German entity.of the entities, 2008 to 2013 tax years are being reviewed and the expected completion dates of the reviews are uncertain. For the other entity the 2010 examination is complete. The examination for this German entity will be completed in 2013. We believeCompany believes that we haveit has adequately provided for any reasonable foreseeable outcomes related to ourits tax audits and that any settlement will not have a material adverse effect on ourits consolidated results. However, there can be no assurances as to the possible outcomes. The Company is generally not subject to U.S., German, or Canadian income tax examinations for tax years before 2009, 2011 and 2008,2010, respectively.
As at December 31, 2012, the Company had approximately €62,900 of total gross unrecognized tax benefits, substantially all of which would affect the Company’s effective tax rate if recognized. A reconciliation of the beginning and ending amount of total gross unrecognized tax benefits is as follows:
| 2012 | 2011 | |||||||
Balance at January 1 | € | 1,100 | € | 500 | ||||
Reduction prior year tax positions | (1,100 | ) | (500 | ) | ||||
Addition of current year tax positions | 62,900 | 1,100 | ||||||
|
|
|
| |||||
Balance at December 31 | € | 62,900 | € | 1,100 | ||||
|
|
|
| |||||
MERCER INTERNATIONAL INC.
NOTES TO THE CONSOLIDATED FINANCIAL STATEMENTS
(In thousands of Euros, except per share data)
Note 10. Income Taxes (continued)
The liability in the Consolidated Balance Sheet related to unrecognized tax benefits was €6,526$nil as at December 31, 2012 (20112014 (2013 – €200)$nil). The Company recognizes interest and penalties related to unrecognized tax benefits in income tax benefit (provision) in the Consolidated Statement of Operations. During the year ended December 31, 2012,2014, the Company recognized approximately €104$nil in interest and penalties (2011(2013 – €nil), which was accrued at December 31, 2012 (2011 – €nil)$nil).
Subsequent to year end, the Company resolved an outstanding issue with the German tax authorities. As a result, the Company will reduce its unrecognized tax benefit from €6,526 to €nil and will record a current tax expense of approximately €3,200. Additionally, the Company will increase its valuation allowance by approximately €3,100, thereby reducing the deferred tax asset and increasing the deferred tax expense by this amount.
The provision for current income taxes consists primarily of non-U.S. taxes for the years ended December 31, 2012, 2011 and 2010, respectively.
Differences between the U.S. Federal Statutory and the Company’s effective rates are as follows:
| Year Ended December 31, | Year Ended December 31, | |||||||||||||||||||||||
| 2012 | 2011 | 2010 | 2014 | 2013 | 2012 | |||||||||||||||||||
U.S. Federal statutory rate | 35 | % | 35 | % | 34 | % | 35% | 35% | 35% | |||||||||||||||
U.S. Federal statutory rate on (income) loss before income taxes and noncontrolling interest | € | 1,119 | € | (18,659 | ) | € | (30,206 | ) | $ | (36,467) | $ | 5,797 | $ | 1,439 | ||||||||||
Tax differential on foreign income | 680 | 5,670 | 8,754 | 11,295 | 736 | 874 | ||||||||||||||||||
Effect of foreign earnings | (6,518 | ) | (9,906 | ) | (6,721 | ) | (9,998) | (945) | (8,382) | |||||||||||||||
Valuation allowance | (11,972 | ) | 7,069 | 13,326 | 52,906 | (17,040) | (17,529) | |||||||||||||||||
Tax benefit of partnership structure | 5,276 | 5,234 | 5,076 | 5,987 | 5,942 | 6,785 | ||||||||||||||||||
Pension adjustment | 135 | 1,864 | 937 | 747 | (1,206) | 174 | ||||||||||||||||||
Non-taxable foreign subsidiaries | 1,475 | 4,024 | — | 1,263 | 1,696 | 1,897 | ||||||||||||||||||
Research and development expense | 2,672 | — | — | - | 1,319 | 3,436 | ||||||||||||||||||
Change in undistributed earnings | — | — | 15,186 | |||||||||||||||||||||
Prior year adjustments | - | (5,749) | - | |||||||||||||||||||||
Foreign exchange on valuation allowance | (7,146) | 254 | 1,330 | |||||||||||||||||||||
Other | (160 | ) | 5,399 | (473 | ) | (1,813) | - | 597 | ||||||||||||||||
|
|
| ||||||||||||||||||||||
|
|
| $ | 16,774 | $ | (9,196) | $ | (9,379) | ||||||||||||||||
| € | (7,293 | ) | € | 695 | € | 5,879 |
|
|
| |||||||||||||||
|
|
| ||||||||||||||||||||||
Comprised of: | ||||||||||||||||||||||||
Current | € | (7,411 | ) | € | (1,682 | ) | € | (3,881 | ) | $ | (5,242) | $ | 2,286 | $ | (9,531) | |||||||||
Deferred | 118 | 2,377 | 9,760 | 22,016 | (11,482) | 152 | ||||||||||||||||||
|
|
|
|
|
| |||||||||||||||||||
| € | (7,293 | ) | € | 695 | € | 5,879 | $ | 16,774 | $ | (9,196) | $ | (9,379) | ||||||||||||
|
|
|
|
|
| |||||||||||||||||||
107
MERCER INTERNATIONAL INC.
NOTES TO THE CONSOLIDATED FINANCIAL STATEMENTS
(In thousands of Euros,U.S. dollars, except per share data)
Note 10.9. Income Taxes (continued)
Deferred income tax assets and liabilities are composed of the following:
| December 31, | December 31, | |||||||||||||||
| 2012 | 2011 | 2014 | 2013 | |||||||||||||
German tax loss carryforwards | € | 76,034 | € | 87,023 | $ | 99,948 | $ | 123,735 | ||||||||
U.S. tax loss carryforwards | 27,372 | 27,914 | 54,892 | 44,718 | ||||||||||||
Canadian tax loss carryforwards | 31,090 | 33,891 | 1,661 | 11,606 | ||||||||||||
Basis difference between income tax and financial reporting with respect to operating pulp mills | (53,994 | ) | (77,440 | ) | (61,205) | (64,252) | ||||||||||
Derivative financial instruments | 14,228 | 14,709 | 5,043 | 8,916 | ||||||||||||
Long-term debt | 1,567 | 1,367 | (3,889) | 2,204 | ||||||||||||
Payable and accrued expenses | (195 | ) | (89 | ) | 6,304 | 4,722 | ||||||||||
Deferred pension liability | 8,199 | 7,381 | 9,413 | 9,605 | ||||||||||||
Capital leases | 2,136 | 1,941 | 2,450 | 2,574 | ||||||||||||
Research and development expense pool | 2,672 | — | 4,193 | 4,573 | ||||||||||||
Other | 1,004 | 1,623 | 3,183 | 1,400 | ||||||||||||
|
|
|
| |||||||||||||
| 110,113 | 98,320 | 121,993 | 149,801 | |||||||||||||
Valuation allowance | (93,840 | ) | (81,868 | ) | (87,862) | (140,768) | ||||||||||
|
|
|
| |||||||||||||
Net deferred tax asset | € | 16,273 | € | 16,452 | $ | 34,131 | $ | 9,033 | ||||||||
|
|
|
| |||||||||||||
Comprised of: | ||||||||||||||||
Deferred income tax asset—current | € | 4,465 | € | 6,750 | ||||||||||||
Deferred income tax asset—non-current | 17,565 | 12,287 | ||||||||||||||
Deferred income tax liability—non-current | (5,757 | ) | (2,585 | ) | ||||||||||||
Deferred income tax asset – current | $ | 19,968 | $ | 6,326 | ||||||||||||
Deferred income tax asset – non-current | 43,055 | 17,157 | ||||||||||||||
Deferred income tax liability – non-current | (28,892) | (14,450) | ||||||||||||||
|
|
|
| |||||||||||||
Net deferred tax asset | € | 16,273 | € | 16,452 | $ | 34,131 | $ | 9,033 | ||||||||
|
|
|
| |||||||||||||
The Company is subject tofollowing table details the scheduled expiration dates of the Company’s net operating loss, interest and income tax audits on a continuing basis which may result in changes tocredit carryforwards as at December 31, 2014:
| Amount | Expiration Date | |||||
Germany | ||||||
Operating loss | $ | 409,300 | Indefinite | |||
Interest | $ | 138,000 | Indefinite | |||
U.S | ||||||
Operating loss | $ | 154,900 | 2019 – 2034 | |||
Tax credits | $ | 700 | 2030 – 2033 | |||
Canada | ||||||
Operating loss | $ | 6,400 | 2015 – 2034 | |||
Scientific research and experimental development tax credit | $ | 4,200 | 2030 – 2032 | |||
108
MERCER INTERNATIONAL INC.
NOTES TO THE CONSOLIDATED FINANCIAL STATEMENTS
(In thousands of U.S. dollars, except per share data)
Note 9. Income Taxes (continued)
At each reporting period, the Company assesses whether it is more likely than not that the deferred tax assets will be realized, based on the review of all available positive and liabilities. Duenegative evidence, including future reversals of existing taxable temporary differences, estimates of future taxable income, past operating results and prudent and feasible tax planning strategies. The carrying value of our deferred tax assets reflects our expected ability to uncertainties regardinggenerate sufficient future amounts of taxable income in Germany, Canadacertain tax jurisdictions to utilize these deferred income tax benefits. Significant judgment is required when evaluating this positive and negative evidence, specifically the United States, the Company has provided a valuation allowance against a portionCompany’s estimates of its deferred tax assets, which primarily consist of tax losses carried forward. However, duringfuture taxable income.
For the year based on forecasted taxable income forended December 31, 2014, the entities in each tax jurisdiction, income tax strategies, and its best estimates of the timing of temporary differences, the Company believesCompany’s assessment indicated that it is more likely than not that certainthe Stendal deferred tax assets will not be realized as Stendal demonstrated improved earnings resulting in three-year historical cumulative pre-tax income and accordinglyhas forecasted taxable income for the foreseeable future. Accordingly, the Company reversed its remaining valuation allowance for Stendal and recognized all of its deferred tax assets.
The following table summarizes the changes in valuation allowances related to net deferred tax assets:
| 2014 | 2013 | |||||||
Balance at January 1 | $ | 140,768 | $ | 123,728 | ||||
Additions (reversals) | ||||||||
U.S. | 9,433 | 10,134 | ||||||
Canada | (3,660) | 12,324 | ||||||
Germany | (51,533) | (5,672) | ||||||
The impact of changes in foreign exchange rates | (7,146) | 254 | ||||||
|
|
|
| |||||
Balance at December 31 | $ | 87,862 | $ | 140,768 | ||||
|
|
|
| |||||
As at December 31, 2014, the Company has increased certain valuation allowances by approximately €12,000. recognized all deferred tax assets for its German entities and has not recognized deferred tax assets for its U.S. or Canadian entities.
The Company’s tax asset recognition methodology consistsCompany has not provided U.S. income taxes and foreign withholding taxes on the undistributed earnings of forecasting taxable income intoforeign subsidiaries as of December 31, 2014 because it intends to permanently reinvest such earnings outside the U.S. If these foreign earnings were to be repatriated in the future, along withthe related temporary differences. The Company then estimates whichU.S. tax assets, basedliability may be reduced by any foreign income taxes previously paid on a variety of factors, are more likely than not to be realized, and recognizes tax assets accordingly. ASC 740 does not allow for tax assets to be recognized where the entity does not have a strong history of profitability. However, ASC 740 does not provide specific guidance with respect to what a strong history of profitability is. As a result, professional judgement is required when considering whether a company has a strong history of profitability or not. For example, the relative impact of negative and positive evidence of profitability where a company has cumulative losses in recent years. The weight given to negative and positive evidence is commensurate with the extent to which it can be objectively verified. Operating results during the most recent three-year period are generally given more weight than expectations of future profitability, which are inherently uncertain.
MERCER INTERNATIONAL INC.
NOTES TO THE CONSOLIDATED FINANCIAL STATEMENTS
(In thousands of Euros, except per share data)
Note 10. Income Taxes (continued)
The Company’s German tax loss carryforward amount includes corporate and trade tax losses totalling approximately €313,800 at December 31, 2012 which have no expiration date.these earnings. In addition, the Company has approximately €104,400 of German interestloss carryforwards which have no expiration date and canmay be used to reduce taxable income, with certain limitations. The Company’s U.S. loss carryforwards amount is approximately €78,200 atoffset any current tax liability.
As of December 31, 2012,2014, the cumulative amount of which approximately €4,800 and €73,400, if not used, will expire in the tax years ending 2018 to 2023 and 2024 to 2030, respectively. The Company’s Canadian tax loss carryforward amount is approximately €124,400 at December 31, 2012 of which approximately €10,000 will expire in 2016 and approximately €114,400 will begin to expire in the tax year ending 2026, if not used. The Company has Canadian investment tax credits for scientific research and experimental development of approximately €10,700 which begin to expire in the taxation year 2031. Management has concluded that it is more likely than not that a portion of the above noted losses will be utilized, under current circumstances, and accordingly has reserved any resulting potential tax benefit that is not expected to be realized in the near future.
The Company’s policy is to indefinitely reinvest undistributed earnings of Mercer’s foreign subsidiaries. Accordingly, no provision forupon which U.S. income taxes hashave not been made for such undistributed earnings.provided is approximately $59,800. The amount of unrecognized deferred tax liability related to these earnings is approximately $20,900.
Note 11.10. Share Capital
Common shares
The Company has authorized 200,000,000 common shares (2011 – 200,000,000) with a par value of $1 per share.
As at December 31, 2012, the Company had 55,815,704 common shares (2011 – 55,779,204) issued and outstanding. During the year ended December 31, 2012,2014, the Company issued 36,50038,000 restricted shares to directors of the Company.
Share Repurchase Program
In August 2011, the Company’s Board of Directors authorized a share repurchase program (the “Program”)Company and 331,584 shares were issued to repurchase up to $25.0 million worthemployees of the Company’s outstanding common shares from time to time over a period ending August 2012. In July 2012, the Company’s Board of Directors re-authorized the Program to allow for the repurchase of up to approximately $14.4 millionCompany as part of the Company’s outstanding common shares over a period ending August 2013. During the year ended December 31, 2012, the Company did not repurchase any of its common shares. During the year ended December 31, 2011, the Company repurchased 1,263,401 of its common shares at an aggregate cost of $10.6 million. The Company recorded these as treasury shares.share based performance plan.
The Company retired all outstanding treasury shares prior to December 31, 2011. The retired treasury shares had a carrying value of approximately €6,342. Upon the formal retirement of treasury shares, the Company reduced its share capital based on the estimated average cost of the common shares and reduced the treasury share account based on the repurchase price. The difference between the repurchase price and the original issue value was recorded as a reduction to retained earnings.
The Company may make additional repurchases of common shares under its Program, depending on prevailing market conditions, alternate uses of capital and other factors. Whether and when to initiate a purchase of common shares and the amount of common shares purchased is at the Company’s discretion. As at December 31, 2012, the Company had an authorized amount of $14.4 million remaining to repurchase its common shares.109
MERCER INTERNATIONAL INC.
NOTES TO THE CONSOLIDATED FINANCIAL STATEMENTS
(In thousands of Euros,U.S. dollars, except per share data)
Note 10. Share Capital (continued)
Note 11. Share Capital (continued)On April 2, 2014, the Company issued an aggregate of 8,050,000 common shares by way of public offering at a price of $7.15 per share for net proceeds of $53,859 after deducting the underwriters’ discounts and offering expenses. In September 2014, the Company contributed $20,000 of the net proceeds to further capitalize the Stendal mill. The Company used the balance of the net proceeds for capital expenditures, including expansion of our wood procurement and logistics operations in Germany, and for general corporate purposes.
Preferred shares
The Company has authorized 50,000,000 preferred shares (2011(2013 – 50,000,000) with $1 par value issuable in series, of which 2,000,000 shares have been designated as Series A. The preferred shares may be issued in one or more series and with such designations and preferences for each series as shall be stated in the resolutions providing for the designation and issue of each such series adopted by the Board of Directors of the Company. The Board of Directors is authorized by the Company’s articles of incorporation to determine the voting, dividend, redemption and liquidation preferences pertaining to each such series. As at December 31, 2012,2014, no preferred shares had been issued by the Company.
Note 12.11. Stock-Based Compensation
In June 2010, the Company adopted a new stock incentive plan (the “2010 Plan”) which provides for options, restricted stock rights, restricted shares, performance shares, performance share units (“PSUs”)PSUs and stock appreciation rights to be awarded to employees, consultants and non-employee directors. During the years ended December 31, 2014 and December 31, 2013, there were no issued and outstanding restricted stock rights, performance shares or stock appreciation rights. In May 2014, the Board of Directors of the Company approved an additional 2.0 million common shares be available for grant pursuant to the 2010 Plan. As at December 31, 2012,2014, after factoring in all allocated shares, there remain approximately 1.12.5 million common shares available for grant pursuant to the 2010 Plan.grant.
Performance Shares and PSUs
Performance shares are common shares granted to an employee which have restrictive conditions, such as the ability to sell the shares, until the Company and the grantee achieve certain performance objectives. PSUs comprise rights to receive common shares at a future date that are contingent on the Company and the grantee achieving certain performance objectives. The performance objective period is generally three years.
The fair value of the performance shares and PSUs is recorded as compensation expense over the vesting period. The fair value is determined based upon the targeted number of shares awarded and the quoted price of the Company’s shares at the reporting date. The target number of shares is determined using management’s best estimate. The final determination of the number of shares to be granted or unrestricted will be made by the Company’s Board of Directors. For the year ended December 31, 2012,2014, the Company recognized an expense of €1,207$1,023 related to the PSUs (2011(2013 – €916; 2010$2,882; 2012 – €2,255)$1,546).
As at December 31, 2012, there are no performance shares outstanding.
The following table summarizes PSU activity during the year:
| Number of PSUs | Number of PSUs | |||||||||||||||||||||||
| 2012 | 2011 | 2010 | 2014 | 2013 | 2012 | |||||||||||||||||||
Outstanding at January 1 | 795,312 | 534,783 | 565,165 | 791,432 | 786,129 | 795,312 | ||||||||||||||||||
Granted | 55,478 | 812,575 | 13,000 | 657,554 | 40,499 | 55,478 | ||||||||||||||||||
Vested and issued | — | (474,728 | ) | — | (331,584) | - | - | |||||||||||||||||
Cancelled | — | (60,055 | ) | — | ||||||||||||||||||||
Forfeited | (64,661 | ) | (17,263 | ) | (43,382 | ) | ||||||||||||||||||
Expired | (147,858) | (35,196) | (64,661) | |||||||||||||||||||||
|
|
|
|
|
| |||||||||||||||||||
Outstanding at December 31 | 786,129 | 795,312 | 534,783 | 969,544 | 791,432 | 786,129 | ||||||||||||||||||
|
|
|
|
|
| |||||||||||||||||||
110
MERCER INTERNATIONAL INC.
NOTES TO THE CONSOLIDATED FINANCIAL STATEMENTS
(In thousands of Euros,U.S. dollars, except per share data)
Note 11. Stock-Based Compensation (continued)
Note 12. Stock-Based Compensation (continued)
Restricted Shares
The fair value of restricted shares is determined based upon the number of shares granted and the quoted price of the Company’s shares on the date of grant. Restricted shares generally vest over one year; however, 200,000 restricted shares granted during the year ended December 31, 2011 vest in equal amounts over a five-year period commencing in 2012. The fair value of the restricted shares is recorded as compensation expense on a straight-line basis over the vesting period.
Expense recognized for the year ended December 31, 2014 was $563 (2013 – $692; 2012 was €832 (2011 – €998; 2010 – €139)$1,070). As at December 31, 2012,2014, the total remaining unrecognized compensation cost related to restricted stock amounted to approximately €711 (2011$284 (2013 – €1,381)$511), which will be amortized over the remaining vesting periods.
The following table summarizes restricted share activity during the year:
| Number of Restricted Shares | Number of Restricted Shares | |||||||||||||||||||||||
| 2012 | 2011 | 2010 | 2014 | 2013 | 2012 | |||||||||||||||||||
Outstanding at January 1 | 238,000 | 56,000 | 21,000 | 158,000 | 196,500 | 238,000 | ||||||||||||||||||
Granted | 36,500 | 238,000 | 56,000 | 38,000 | 38,000 | 36,500 | ||||||||||||||||||
Vested | (78,000 | ) | (56,000 | ) | (21,000 | ) | (78,000) | (76,500) | (78,000) | |||||||||||||||
|
|
|
|
|
| |||||||||||||||||||
Outstanding at December 31 | 196,500 | 238,000 | 56,000 | 118,000 | 158,000 | 196,500 | ||||||||||||||||||
|
|
|
|
|
| |||||||||||||||||||
Stock Options
The following table summarizes the status of options outstanding at December 31, 2012:2014:
| Outstanding Options | Exercisable Options | |||||||||||||||||||||
Exercise Price | Number | Weighted Average Remaining Contractual Life (Years) | Weighted Average Exercise Price | Number | Weighted Average Exercise Price | |||||||||||||||||
| $ | 5.65 | 100,000 | 0.69 | $ | 5.65 | 100,000 | $ | 5.65 | ||||||||||||||
| $ | 7.30 | 30,000 | 2.57 | $ | 7.30 | 30,000 | $ | 7.30 | ||||||||||||||
| $ | 7.92 | 45,000 | 2.69 | $ | 7.92 | 45,000 | $ | 7.92 | ||||||||||||||
Outstanding Options | Exercisable Options | |||||||||
Exercise Price | Number | Weighted | Weighted | Number | Weighted | |||||
$ 7.30 | 30,000 | 0.57 | $ 7.30 | 30,000 | $ 7.30 | |||||
$ 7.92 | 25,000 | 0.69 | $ 7.92 | 25,000 | $ 7.92 | |||||
During the years ended December 31, 2014 and December 31, 2013, no options were granted or exercised. During the year ended December 31, 2012 and 2011, no options were granted, exercised or cancelled. During the year ended December 31, 2012,2014, no options expired (2011(2013 – 15,000). 100,000; 2012 – nil) and 20,000 options were cancelled (2013 – nil; 2012 – nil) in exchange for $115.
The aggregate intrinsic value of options is calculated as the difference between the quoted market price for the Company’s common stock as at December 31, 2012,2014, and the exercise price of the stock options for those options where the exercise price is below the quoted market price. As at December 31, 2012,2014, the Company had 100,00055,000 options (2011(2013 – 75,000; 2012 – 100,000) with an exercise price below the quoted market price resulting in an aggregate intrinsic value of €115 (2011$259 (2013 – €32)$172; 2012 – $151). The Company issues new shares upon the exercise of stock options.
Stock compensation expenseExpense recognized for the year ended December 31, 2014 related to stock options was $nil (2013 – $nil; 2012 was €nil (2011 – €nil; 2010 – €nil)$nil).
111
MERCER INTERNATIONAL INC.
NOTES TO THE CONSOLIDATED FINANCIAL STATEMENTS
(In thousands of Euros,U.S. dollars, except per share data)
Note 13. Accumulated Other Comprehensive Income
The components of accumulated other comprehensive income are as follows:
| Year Ended December 31, | ||||||||
| 2012 | 2011 | |||||||
Foreign currency translation adjustments | € | 41,031 | € | 36,567 | ||||
Unrecognized losses and prior service costs related to defined benefit plans | (15,969 | ) | (15,341 | ) | ||||
Unrealized gains on marketable securities | 119 | 120 | ||||||
|
|
|
| |||||
Accumulated other comprehensive income | € | 25,181 | € | 21,346 | ||||
|
|
|
| |||||
Note 14.12. Net Income (Loss) Per Share Attributable to Common Shareholders
| Year Ended December 31, | Year Ended December 31, | |||||||||||||||||||||||
| 2012 | 2011 | 2010 | 2014 | 2013 | 2012 | |||||||||||||||||||
Net income (loss) attributable to common shareholders—basic | € | (12,185 | ) | € | 50,075 | € | 86,279 | |||||||||||||||||
Interest on convertible notes, net of tax | — | 797 | 2,439 | |||||||||||||||||||||
|
|
| ||||||||||||||||||||||
Net income (loss) attributable to common shareholders—diluted | € | (12,185 | ) | € | 50,872 | € | 88,718 | |||||||||||||||||
Net income (loss) attributable to common shareholders | ||||||||||||||||||||||||
Basic and diluted | $ | 113,154 | $ | (26,375) | $ | (15,670) | ||||||||||||||||||
|
|
| ||||||||||||||||||||||
Net income (loss) per share attributable to common shareholders | ||||||||||||||||||||||||
Basic | € | (0.22 | ) | € | 1.00 | € | 2.24 | $ | 1.82 | $ | (0.47) | $ | (0.28) | |||||||||||
|
|
|
|
|
| |||||||||||||||||||
Diluted | € | (0.22 | ) | € | 0.89 | € | 1.56 | $ | 1.81 | $ | (0.47) | $ | (0.28) | |||||||||||
|
|
|
|
|
| |||||||||||||||||||
| ||||||||||||||||||||||||
Weighted average number of common shares outstanding: | ||||||||||||||||||||||||
Basic(1) | 55,596,761 | 50,116,982 | 38,590,797 | 62,012,947 | 55,673,838 | 55,596,761 | ||||||||||||||||||
Effect of dilutive shares: | ||||||||||||||||||||||||
Performance shares and PSUs | — | 544,853 | 442,844 | |||||||||||||||||||||
PSUs | 406,922 | - | - | |||||||||||||||||||||
Restricted shares | — | 87,923 | 26,683 | 79,889 | - | - | ||||||||||||||||||
Stock options and awards | — | 57,483 | — | |||||||||||||||||||||
Convertible notes | — | 6,178,778 | 17,902,638 | |||||||||||||||||||||
Stock options | 15,112 | - | - | |||||||||||||||||||||
|
|
|
|
|
| |||||||||||||||||||
Diluted | 55,596,761 | 56,986,019 | 56,962,962 | 62,514,870 | 55,673,838 | 55,596,761 | ||||||||||||||||||
|
|
|
|
|
| |||||||||||||||||||
| (1) The basic weighted average number of shares excludes 118,000 restricted shares which have been issued, but have not vested as at December 31, 2014 (2013 –158,000 restricted shares; 2012 – 196,500 |
MERCER INTERNATIONAL INC.
NOTES TO THE CONSOLIDATED FINANCIAL STATEMENTS
(In thousands of Euros, except per share data)
Note 14. Net Income (Loss) Per Share Attributable to Common Shareholders (continued)
The calculation of diluted net income (loss) per share attributable to common shareholders does not assume the exercise of any instruments that would have an anti-dilutive effect on earningsnet income (loss) per share. The following table summarizes the instruments excluded from the calculation of net income (loss) per share attributable to common shareholders because they were anti-dilutive.
| Year Ended December 31, | Year Ended December 31, | |||||||||||||||||||||||
| 2012 | 2011 | 2010 | 2014 | 2013 | 2012 | |||||||||||||||||||
Stock options and awards | 175,000 | — | 190,000 | |||||||||||||||||||||
Stock options | - | 75,000 | 175,000 | |||||||||||||||||||||
PSUs | 786,129 | — | — | - | 791,432 | 786,129 | ||||||||||||||||||
Restricted shares | 196,500 | — | — | - | 158,000 | 196,500 | ||||||||||||||||||
112
MERCER INTERNATIONAL INC.
NOTES TO THE CONSOLIDATED FINANCIAL STATEMENTS
(In thousands of U.S. dollars, except per share data)
Note 13. Restructuring Expenses
In July 2013, the Company announced a workforce reduction at the Celgar mill. In connection with implementing this workforce reduction, during the year ended December 31, 2013, the Company recorded restructuring expenses of $5,029 for severance and other personnel expenses, such as termination benefits. As at December 31, 2014, the Company had a liability for these restructuring expenses of $642 (2013 – $2,898) in accounts payable and other.
In November 2013, the Company restructured the management team at the Stendal mill. In connection with this restructuring, during the year ended December 31, 2013, the Company recorded expenses of $1,386 for severance and other personnel expenses, such as termination benefits. As at December 31, 2014, the Company had a liability for these restructuring expenses of $nil (2013 – $1,096) in accounts payable and other.
During the year ended December 31, 2014, the Company did not incur additional expenses related to restructuring.
Note 14. Accumulated Other Comprehensive Income (Loss)
The components of accumulated other comprehensive income (loss) are as follows:
| Year Ended December 31, | ||||||||
| 2014 | 2013 | |||||||
Foreign currency translation adjustments | $ | (33,268) | $ | 47,756 | ||||
Unrecognized losses and prior service costs related to defined benefit plans | (19,287) | (16,414) | ||||||
Unrealized gains on marketable securities | 114 | 128 | ||||||
|
|
|
| |||||
Accumulated other comprehensive income (loss) | $ | (52,441) | $ | 31,470 | ||||
|
|
|
| |||||
Note 15. Noncontrolling Interest (Deficit)
In September 2014, concurrent with the settlement of the shareholder loans as discussed in Note 7(c) – Debt, the Company paid $444 (€0.35 million) to acquire substantially all of the remaining shares of the noncontrolling interest and other rights in the Stendal mill. Accordingly, the Company has included the noncontrolling interest in its consolidated results subsequent to this transaction. The increase in ownership was accounted for as an equity transaction and as a result, the noncontrolling interest was reduced by $2,949 and retained earnings, which includes legal fees of approximately $200 associated with the transaction, was reduced by $4,770. In addition, the Company reclassified to retained earnings $18,985 of negative paid-in capital concurrent with the buyout of the noncontrolling interest in the Stendal mill.
113
MERCER INTERNATIONAL INC.
NOTES TO THE CONSOLIDATED FINANCIAL STATEMENTS
(In thousands of U.S. dollars, except per share data)
Note 15.16. Business Segment Information
The Company has three operating segments, the individual pulp mills that are aggregated into one reportable business segment, market pulp.pulp, due to the similar economic characteristics of the mills. Accordingly, the results presented are those of the one reportable business segment.
The following table presents net sales to external customers by geographic area based on location of the customer.customer:
| Year Ended December 31, | Year Ended December 31, | |||||||||||||||||||||||
| 2012 | 2011 | 2010 | 2014 | 2013 | 2012 | |||||||||||||||||||
Pulp revenues | ||||||||||||||||||||||||
Germany | $ | 346,879 | $ | 321,711 | $ | 305,790 | ||||||||||||||||||
China | € | 230,007 | € | 234,654 | € | 196,022 | 276,848 | 300,827 | 295,797 | |||||||||||||||
Germany | 228,402 | 256,563 | 278,348 | |||||||||||||||||||||
Other European Union countries(1) | 168,616 | 175,937 | 182,246 | 250,952 | 224,988 | 216,846 | ||||||||||||||||||
North America | 47,513 | 69,345 | 92,628 | |||||||||||||||||||||
Italy | 43,112 | 51,509 | 56,301 | 80,730 | 65,654 | 55,443 | ||||||||||||||||||
Other Asia | 33,197 | 30,872 | 37,561 | 69,711 | 49,855 | 42,692 | ||||||||||||||||||
U.S. | 39,146 | 30,404 | 61,103 | |||||||||||||||||||||
Other countries | 1,632 | 823 | 1,503 | 9,366 | 2,748 | 2,099 | ||||||||||||||||||
|
|
|
|
|
| |||||||||||||||||||
| 752,479 | 819,703 | 844,609 | 1,073,632 | 996,187 | 979,770 | |||||||||||||||||||
Energy and chemical revenues | 72,289 | 68,079 | 49,288 | |||||||||||||||||||||
Third party transportation revenues | 9,375 | 11,693 | 11,702 | |||||||||||||||||||||
Germany | 91,375 | 79,948 | 75,781 | |||||||||||||||||||||
Canada | 10,105 | 12,250 | 17,185 | |||||||||||||||||||||
|
|
|
|
|
| |||||||||||||||||||
| € | 834,143 | € | 899,475 | € | 905,599 | $ | 1,175,112 | $ | 1,088,385 | $ | 1,072,736 | |||||||||||||
|
|
|
|
|
| |||||||||||||||||||
| (1) | Not including Germany or Italy; includes new entrant countries to the European Union from their time of admission. |
The following table presents total long-lived assets by geographic area based on location of the asset.asset:
| December 31, | ||||||||
| 2012 | 2011 | |||||||
Germany | € | 636,735 | € | 638,500 | ||||
Canada | 172,143 | 182,474 | ||||||
|
|
|
| |||||
| € | 808,878 | € | 820,974 | |||||
|
|
|
| |||||
MERCER INTERNATIONAL INC.
NOTES TO THE CONSOLIDATED FINANCIAL STATEMENTS
(In thousands of Euros, except per share data)
Note 15. Business Segment Information (continued)
| December 31, | ||||||||
| 2014 | 2013 | |||||||
Germany | $ | 711,368 | $ | 843,777 | ||||
Canada | 171,782 | 194,854 | ||||||
|
|
|
| |||||
| $ | 883,150 | $ | 1,038,631 | |||||
|
|
|
| |||||
In 2012,2014, one customer at a number of its individual mills accounted for 11%13% of the Company’s total pulp sales (2011—no single customer(2013 – two customers at a number of their individual mills accounted for 10% or more; 2010—and 11%, respectively, 2012 – one customer—customer at a number of its individual mills accounted for 11%).
114
MERCER INTERNATIONAL INC.
NOTES TO THE CONSOLIDATED FINANCIAL STATEMENTS
(In thousands of U.S. dollars, except per share data)
Note 16.17. Derivative Transactions
The Company is exposed to certain market risks relating to its ongoing business. The Company seeks to manage these risks through internal risk management policies as well as, from time to time, the use of derivatives. The Company currently manages its interest rate risk and a small portion of its pulp sales price risk with the use of derivative instruments. The derivatives are measured at fair value with changes in fair value immediately recognized in gain (loss) on derivative instruments in the Consolidated Statement of Operations.
Derivative assets are presented in prepaid expenses and other, and derivative liabilities are presented in unrealized interest rate derivative losses in the Consolidated Balance Sheet.
Interest Rate DerivativesDerivative
During 2004,2002, the Company entered into certain variable-to-fixed interest rate swaps in connection with the Stendal mill with respect to an aggregate maximum amount of approximately €612,600€612.6 million of the principal amount of the indebtedness under theStendal’s senior €828.0 million project finance facility (the “Prior Stendal Loan Facility.Facility”). Under the remaining interest rate swap, the Company pays a fixed rate and receives a floating rate with the interest payments being calculated on a notional amount. Currently, the contract has an aggregate notional amount of €357,576€251.8 million at a fixed interest rate of 5.28% and it matures in October 2017 (which for2017.
In November 2014, in connection with the most part matches the maturityrepayment of the Prior Stendal Loan Facility).Facility discussed in Note 7(b) – Debt, the Company maintained the interest rate swap and pledged as collateral 67% of the fair value of the interest rate swap up to €8.5 million to the derivative counter party. The calculation to determine the collateral will be performed semi-annually, with the final calculation in October 2017. As at December 31, 2014, €8.5 million ($10,286) has been pledged as collateral to the derivative counterparty. This cash has been accounted for as restricted cash in the Consolidated Balance Sheet.
The interest rate derivative contract is with a bank that is part of a banking syndicate that holds the Stendal Loan Facilitymulti-national financial institution and the Company does not anticipate non-performance by the bank.counterparty.
Pulp Price DerivativeDerivatives
DuringIn May 2012, the Company entered into a fixed price pulp swap contract with a bank. Under the terms of the contract, 5,000 metric tonnes (“MT”) of pulp per month waswere fixed at a price of $915915 U.S. dollars per MT. The contract expiredmatured in December 2012. In November 2012, the Company entered into two additional contracts. Under the terms of the contracts, 3,000 MT of pulp per month iswere fixed at prices which rangeranged from $880880 U.S. dollars to $890890 U.S. dollars per MT. The contracts expirematured in December 2013.
Energy Derivatives
The Company is also subject to price risk for electricity used in its manufacturing operations. The Company enters into electricity forward sales contracts when it sees an opportunity to sell forward electricity at opportunistic rates. No electricity forward sales contracts were entered into in 2012, 2011 or 2010. Although the Company does not currently have plans to enter into such transactions, the Company may enter into similar electricity derivative contracts in the future.
Foreign Exchange Derivatives
The Company did not enter into foreign exchange derivatives in 2012, 2011 and 2010.
MERCER INTERNATIONAL INC.
NOTES TO THE CONSOLIDATED FINANCIAL STATEMENTS
(In thousands of Euros, except per share data)
Note 16. Derivative Transactions (continued)
Credit Risk
The Company’s credit risk is primarily attributable to cash held in bank accounts and receivables. The Company maintains cash balances in foreign financial institutions in excess of insured limits. The Company limits its credit exposure on cash held in bank accounts by periodically investing cash in excess of short-term operating requirements and debt obligations in low risk government bonds, or similar debt instruments. The Company’s credit risk associated with the sale of pulp products is managed through establishing long-term contractual relationships with its customers, setting credit limits, the purchase of credit insurance and for certain customers a letter of credit is received prior to shipping its product. Concentrations of credit risk on the sale of pulp products are with customers and agents based in Germany, China, Italy and the United States.U.S.
The carrying amount of cash and cash equivalents of €104,239$53,172, restricted cash of $10,286 and receivables of €110,087$141,088 recorded in the Consolidated Balance Sheet, net of any allowances for losses, represents the Company’s maximum exposure to credit risk.
115
MERCER INTERNATIONAL INC.
NOTES TO THE CONSOLIDATED FINANCIAL STATEMENTS
(In thousands of U.S. dollars, except per share data)
Note 17. Derivative Transactions (continued)
The following table shows ourthe derivative gains and losses by instrument type of derivativeas they are recognized in gain (loss) on derivative instruments in the Consolidated Statement of Operations:
| Year Ended December 31, | Year Ended December 31, | |||||||||||||||||||||||
| 2012 | 2011 | 2010 | 2014 | 2013 | 2012 | |||||||||||||||||||
Interest rate derivative contract | € | 1,713 | € | (1,418 | ) | € | 1,899 | $ | 11,501 | $ | 22,476 | $ | 2,204 | |||||||||||
Pulp price derivative contracts | 2,028 | — | — | - | (2,767) | 2,608 | ||||||||||||||||||
|
|
|
|
|
| |||||||||||||||||||
| € | 3,741 | € | (1,418 | ) | € | 1,899 | $ | 11,501 | $ | 19,709 | $ | 4,812 | ||||||||||||
|
|
|
|
|
| |||||||||||||||||||
Note 17.18. Financial Instruments
The fair value of financial instruments as at December 31 is summarized as follows:
| 2012 | 2011 | |||||||||||||||
| Carrying Amount | Fair Value | Carrying Amount | Fair Value | |||||||||||||
Cash and cash equivalents | € | 104,239 | € | 104,239 | € | 105,072 | € | 105,072 | ||||||||
Marketable securities(1) | 184 | 184 | 12,372 | 12,372 | ||||||||||||
Receivables | 110,087 | 110,087 | 120,487 | 120,487 | ||||||||||||
Pulp price derivative contracts—asset | 745 | 745 | — | — | ||||||||||||
Accounts payable and other | 89,950 | 89,950 | 99,640 | 99,640 | ||||||||||||
Debt | 711,403 | 700,001 | 734,086 | 717,522 | ||||||||||||
Interest rate derivative contract—liability | 50,678 | 50,678 | 52,391 | 52,391 | ||||||||||||
| December 31, | ||||||||||||||||
| 2014 | 2013 | |||||||||||||||
| Carrying Amount | Fair Value | Carrying Amount | Fair Value | |||||||||||||
Cash and cash equivalents | $ | 53,172 | $ | 53,172 | $ | 147,728 | $ | 147,728 | ||||||||
Restricted cash | $ | 10,286 | $ | 10,286 | $ | - | $ | - | ||||||||
Marketable securities | $ | 196 | $ | 196 | $ | 217 | $ | 217 | ||||||||
Receivables | $ | 141,088 | $ | 141,088 | $ | 135,893 | $ | 135,893 | ||||||||
Accounts payable and other - excluding current portion of interest rate derivative liability | $ | 87,393 | $ | 87,393 | $ | 98,475 | $ | 98,475 | ||||||||
Debt | $ | 687,513 | $ | 695,013 | $ | 979,372 | $ | 980,982 | ||||||||
Interest rate derivative contract – liability | $ | 32,794 | $ | 32,794 | $ | 51,856 | $ | 51,856 | ||||||||
The carrying value of cash and cash equivalents, restricted cash and accounts payable and other approximates the fair value due to the immediate or short-term maturity of these financial instruments. The carrying value of receivables approximates the fair value due to their short-term nature and historical collectability. The fair value of debt reflects recent market transactions and discounted cash flow estimates. Marketable securities are recorded at fair value based on quoted prices in active markets.recent transactions. See the Fair Value Measurement and Disclosure section below for details on how the fair value of the pulp price derivative contracts and interest rate derivative contract and debt was determined.
MERCER INTERNATIONAL INC.
NOTES TO THE CONSOLIDATED FINANCIAL STATEMENTS
(In thousands of Euros, except per share data)
Note 17. Financial Instruments (continued)
Many of the Company’s transactions are denominated in foreign currencies, primarily the U.S. dollar. As a result of these transactions the Company and its subsidiaries have financial risk that the value of the Company’s financial instruments will vary due to fluctuations in foreign exchange rates.
Fair Value Measurement and Disclosure
The fair value methodologies and, as a result, the fair value of the Company’s investments and derivative instruments are determined based on the fair value hierarchy provided in the Fair Value Measurements and Disclosures topic of the FASB Accounting Standards Codification, and are as follows:
Level 1—Valuations based on quoted prices in active markets foridentical assets and liabilities.
Level 2—Valuations based on observable inputs in active markets forsimilar assets and liabilities, other than Level 1 prices, such as quoted commodity prices or interest or currency exchange rates.
Level 3—Valuations based on significant unobservable inputs that are supported by little or no market activity, such as discounted cash flow methodologies based on internal cash flow forecasts.
The Company classified its marketable securities within Level 1 of the valuationfair value hierarchy because quoted prices are available in an active market for boththe exchange-traded equities and the German federal government bonds. The Company classified the German federal government bonds as available-for-sale as it was not certain these investments would be held to maturity, nor did the Company intend to actively trade these investments.equities.
The Company’s interest rate and pulp price derivatives arederivative is classified within Level 2 of the valuationfair value hierarchy, as they are traded on the over-the-counter market and areit is valued using internal models that use as their basis readily observable market inputs, such as forward interest rates and yield curves observable at specified intervals and commodity price curves.intervals. The observable inputs reflect market data obtained from independent sources.
116
MERCER INTERNATIONAL INC.
NOTES TO THE CONSOLIDATED FINANCIAL STATEMENTS
(In addition,thousands of U.S. dollars, except per share data)
Note 18. Financial Instruments (continued)
The Company’s debt is recognized at amortized cost. The fair value of debt classified as Level 2 in the Company considered the risk of non-performance of the obligor, which in some casesfair value hierarchy reflects the Company’s own credit risk. The counterparty to ourrecent market transactions and discounted cash flow estimates. Discounted cash flow models use observable market inputs taking into consideration variables such as interest rate changes, comparative securities, subordination discount and pulp price derivativescredit rating changes. The fair value of debt classified as Level 3 in the fair value hierarchy is valued using discounted cash flow models or select comparable transactions, which require significant management estimates. These estimates are multi-national financial institutions.developed using available market, historical, and forecast data, including taking into account variables such as recent financing activities, the capital structure, and the lack of marketability of such debt.
The following table presents a summary of the Company’s outstanding financial instruments and their estimated fair values under the hierarchy defined in Fair Value Measurements and Disclosures Topic of the FASB Accounting Standards Codification:fair value hierarchy:
| Fair value measurements at December 31, 2012 using: | Fair value measurements at December 31, 2014 using: | |||||||||||||||||||||||||||||||
| Description | Level 1 | Level 2 | Level 3 | Total | Level 1 | Level 2 | Level 3 | Total | ||||||||||||||||||||||||
Assets | ||||||||||||||||||||||||||||||||
Marketable securities | $ | 196 | $ | - | $ | - | $ | 196 | ||||||||||||||||||||||||
Exchange traded equities | € | 184 | € | — | € | — | € | 184 | ||||||||||||||||||||||||
Pulp price derivative contracts | — | 745 | — | 745 | ||||||||||||||||||||||||||||
|
|
|
| |||||||||||||||||||||||||||||
Liabilities | ||||||||||||||||||||||||||||||||
Interest rate derivative contract | $ | - | $ | 32,794 | $ | - | $ | 32,794 | ||||||||||||||||||||||||
Debt | - | 682,912 | 12,101 | 695,013 | ||||||||||||||||||||||||||||
|
|
|
|
|
|
|
| |||||||||||||||||||||||||
| € | 184 | € | 745 | € | — | € | 929 | $ | - | $ | 715,706 | $ | 12,101 | $ | 727,807 | |||||||||||||||||
|
|
|
|
|
|
|
| |||||||||||||||||||||||||
| Fair value measurements at December 31, 2013 using: | ||||||||||||||||||||||||||||||||
| Description | Level 1 | Level 2 | Level 3 | Total | ||||||||||||||||||||||||||||
Assets | ||||||||||||||||||||||||||||||||
Marketable securities | $ | 217 | $ | - | $ | - | $ | 217 | ||||||||||||||||||||||||
|
|
|
| |||||||||||||||||||||||||||||
Liabilities | ||||||||||||||||||||||||||||||||
Interest rate derivative contract | € | — | € | 50,678 | € | — | € | 50,678 | $ | - | $ | 51,856 | $ | - | $ | 51,856 | ||||||||||||||||
Debt | - | 367,405 | 613,577 | 980,982 | ||||||||||||||||||||||||||||
|
|
|
|
|
|
|
| |||||||||||||||||||||||||
| $ | - | $ | 419,261 | $ | 613,577 | $ | 1,032,838 | |||||||||||||||||||||||||
|
|
|
| |||||||||||||||||||||||||||||
117
MERCER INTERNATIONAL INC.
NOTES TO THE CONSOLIDATED FINANCIAL STATEMENTS
(In thousands of Euros,U.S. dollars, except per share data)
Note 17. Financial Instruments (continued)
| Fair value measurements at December 31, 2011 using: | ||||||||||||||||
| Description | Level 1 | Level 2 �� | Level 3 | Total | ||||||||||||
Assets | ||||||||||||||||
Marketable securities | ||||||||||||||||
German federal government bonds | € | 12,216 | € | — | € | — | € | 12,216 | ||||||||
Exchange traded equities | 156 | — | — | 156 | ||||||||||||
|
|
|
|
|
|
|
| |||||||||
| € | 12,372 | € | — | € | — | € | 12,372 | |||||||||
|
|
|
|
|
|
|
| |||||||||
Liabilities | ||||||||||||||||
Interest rate derivative contract | € | — | € | 52,391 | € | — | € | 52,391 | ||||||||
|
|
|
|
|
|
|
| |||||||||
Note 18.19. Lease Commitments
Minimum lease payments, primarily for various vehicles, and plant and equipment under capital and non-cancellable operating leases and the present value of net minimum payments at December 31, 20122014 is as follows:
| Capital Leases | Operating Leases | Capital Leases | Operating Leases | |||||||||||||
2013 | € | 1,998 | € | 2,973 | ||||||||||||
2014 | 1,367 | 1,612 | ||||||||||||||
2015 | 1,440 | 1,468 | $ | 3,088 | $ | 1,994 | ||||||||||
2016 | 1,202 | 915 | 2,908 | 1,290 | ||||||||||||
2017 | 846 | 888 | 2,257 | 1,194 | ||||||||||||
2018 | 1,517 | 1,188 | ||||||||||||||
2019 | 2,603 | 818 | ||||||||||||||
Thereafter | 2,900 | 1,553 | 571 | - | ||||||||||||
|
|
|
| |||||||||||||
Total | 9,753 | € | 9,409 | 12,944 | $ | 6,484 | ||||||||||
|
| |||||||||||||||
Less: imputed interest | 1,510 | 1,394 | ||||||||||||||
|
| |||||||||||||||
Total present value of minimum capitalized payments | 8,243 | 11,550 | ||||||||||||||
Less: current portion of capital lease obligations | 1,958 | 2,987 | ||||||||||||||
|
| |||||||||||||||
Long-term capital lease obligations | € | 6,285 | $ | 8,563 | ||||||||||||
|
| |||||||||||||||
Rent expense under operating leases was €3,006$2,978 for the year ended December 31, 2014 (2013 – $3,497; 2012 (2011—€3,313; 2010—€2,246)– $3,866). The current portion of the capital lease obligations is included in accounts payable and other and the long-term portion is included in capital leases and other in the Consolidated Balance Sheet.
Note 19.20. Commitments and Contingencies
| (a) |
|
MERCER INTERNATIONAL INC.
NOTES TO THE CONSOLIDATED FINANCIAL STATEMENTS
(In thousands of Euros, except per share data)
Note 19. Commitments and Contingencies (continued)
The €10,000 was initially recognized as an increase in cash and a corresponding increase in accounts payable and other. As civil works remediation steps are agreed to with the noncontrolling shareholder an agreed to portion of the payable is reversed with the offset recorded in operating costs to offset the remediation expenditures. In January 2012, the noncontrolling shareholder contributed its required €1,632 from the Guarantee Amount as part of the financing agreement for Project Blue Mill. This contribution was reclassified to long-term debt as part of the loan payable to the noncontrolling shareholder. See Note 8(e)—Debt. As at December 31, 2012, the Company had Guarantee Amount proceeds of €1,768 remaining in accounts payable and other.
| The Company is involved in |
In 2012, as a result of a regular tax field audit for the Stendal mill, German public authorities commenced a preliminary investigation into a past and then current managers of the mill relating to whether certain settlement amounts received by the Stendal mill in 2007, 2010 and 2011 from the main contractor under the Engineering, Procurement and Construction Contract for the construction of the Stendal mill should have reduced the assessment base for the original investment subsidies granted to the mill by German authorities. The payments were made by the contractor to the Stendal mill to settle certain warranty, performance and remediation claims that the Stendal mill made against the contractor after completion of mill construction in 2004. The amounts currently under review aggregate approximately €8.7 million ($10,528). Investment subsidies received by the Stendal mill were generally based upon a percentage of the assessment base for subsidies of the mill. If the settlement payments received by the Stendal mill result in a reduction of the assessment base for subsidies under applicable German rules there could be a proportionate reduction in the investment subsidies and the difference could be repayable by the Stendal mill. The Stendal mill believes that it has properly recorded the settlement amounts received from the contractor and that the same do not |
118
MERCER INTERNATIONAL INC.
NOTES TO THE CONSOLIDATED FINANCIAL STATEMENTS
(In thousands of U.S. dollars, except per share data)
Note 20. Commitments and Contingencies (continued)
| reduce the assessment base for subsidies of the mill. While it is not reasonably possible to predict the outcome of the legal action and claim, it is the opinion of management that the outcome will not have a material adverse effect on the consolidated financial condition, results of operations or liquidity of the Company. |
| (c) | The Company is subject to regulations that require the handling and disposal of asbestos in a prescribed manner if a property undergoes a major renovation or demolition. Otherwise, the Company is not required to remove asbestos from its facilities. Generally asbestos is found on steam and condensate piping systems as well as certain cladding on buildings and in building insulation throughout older facilities. The Company’s obligation for the proper removal and disposal of asbestos products from the Company’s mills is a conditional asset retirement obligation. As a result of the longevity of the Company’s mills, due in part to the maintenance procedures and the fact that the Company does not have plans for major changes that require the removal of asbestos, the timing of the asbestos removal is indeterminate. As a result, the Company is currently unable to reasonably estimate the fair value of its asbestos removal and disposal obligation. The Company will recognize a liability in the period in which sufficient information is available to reasonably estimate its fair value. |
| The Company entered into certain minimum or fixed purchase commitments primarily related to the purchase of raw materials that extend beyond 2015, none of which are individually |
MERCER INTERNATIONAL INC.
NOTES TO THE CONSOLIDATED
119
SUPPLEMENTARY FINANCIAL STATEMENTSINFORMATION
(UNAUDITED)
Selected Quarterly Financial Data
(In thousands of Euros,U.S. Dollars, except per share data)
Note 20. Restricted Group Supplemental Disclosure
The terms of the indenture governing our Senior Notes require that we provide the results of operations and financial condition of Mercer International Inc. and our restricted subsidiaries under the indenture, collectively referred to as the “Restricted Group”. As at and during the years ended December 31, 2012 and 2011, the Restricted Group was comprised of Mercer International Inc., certain holding subsidiaries and our Rosenthal and Celgar mills. The Restricted Group excludes the Stendal mill.
Combined Condensed Balance Sheets
| Quarters Ended | ||||||||||||||||
| March 31 | June 30 | September 30 | December 31 | |||||||||||||
2014 | ||||||||||||||||
Revenues | $ | 305,685 | $ | 285,192 | $ | 301,610 | $ | 282,625 | ||||||||
Gross profit | 39,243 | 22,021 | 48,186 | 52,348 | ||||||||||||
Gain (loss) on settlement of debt | - | - | 31,851 | (28,494 | ) | |||||||||||
Net income (loss) attributable to common shareholders | 21,041 | 571 | 88,337 | 3,205 | ||||||||||||
Net income (loss) per share attributable to common shareholders* | $ | 0.37 | $ | 0.01 | $ | 1.37 | $ | 0.05 | ||||||||
2013 | ||||||||||||||||
Revenues | $ | 261,785 | $ | 274,700 | $ | 269,218 | $ | 282,682 | ||||||||
Gross profit | 12,607 | (1,169 | ) | 13,304 | 6,918 | |||||||||||
Net income (loss) attributable to common shareholders | (561 | ) | (13,015 | ) | (2,966 | ) | (9,833 | ) | ||||||||
Net income (loss) per share attributable to common shareholders* | $ | (0.01 | ) | $ | (0.23 | ) | $ | (0.05 | ) | $ | (0.18 | ) | ||||
| December 31, 2012 | ||||||||||||||||
| Restricted Group | Unrestricted Subsidiaries | Eliminations | Consolidated Group | |||||||||||||
ASSETS | ||||||||||||||||
Current assets | ||||||||||||||||
Cash and cash equivalents | € | 36,714 | € | 67,525 | € | — | € | 104,239 | ||||||||
Receivables | 61,212 | 48,875 | — | 110,087 | ||||||||||||
Inventories | 74,786 | 43,514 | — | 118,300 | ||||||||||||
Prepaid expenses and other | 5,811 | 2,096 | — | 7,907 | ||||||||||||
Deferred income tax | 2,188 | 2,277 | — | 4,465 | ||||||||||||
|
|
|
|
|
|
|
| |||||||||
Total current assets | 180,711 | 164,287 | — | 344,998 | ||||||||||||
Long-term assets | ||||||||||||||||
Property, plant and equipment | 345,311 | 463,567 | — | 808,878 | ||||||||||||
Deferred note issuance and other | 6,607 | 5,555 | — | 12,162 | ||||||||||||
Deferred income tax | 9,179 | 8,386 | — | 17,565 | ||||||||||||
Due from unrestricted group | 102,311 | — | (102,311 | ) | — | |||||||||||
|
|
|
|
|
|
|
| |||||||||
Total assets | € | 644,119 | € | 641,795 | € | (102,311 | ) | € | 1,183,603 | |||||||
|
|
|
|
|
|
|
| |||||||||
LIABILITIES | ||||||||||||||||
Current liabilities | ||||||||||||||||
Accounts payable and other | € | 42,106 | € | 47,844 | € | — | € | 89,950 | ||||||||
Pension and other post-retirement benefit obligations | 813 | — | — | 813 | ||||||||||||
Debt | 5,662 | 40,000 | — | 45,662 | ||||||||||||
|
|
|
|
|
|
|
| |||||||||
Total current liabilities | 48,581 | 87,844 | — | 136,425 | ||||||||||||
Long-term liabilities | ||||||||||||||||
Debt | 216,214 | 449,527 | — | 665,741 | ||||||||||||
Due to restricted group | — | 102,311 | (102,311 | ) | — | |||||||||||
Unrealized interest rate derivative losses | — | 50,678 | — | 50,678 | ||||||||||||
Pension and other post-retirement benefit obligations | 32,141 | — | — | 32,141 | ||||||||||||
Capital leases and other | 6,073 | 7,863 | — | 13,936 | ||||||||||||
Deferred income tax | 5,757 | — | — | 5,757 | ||||||||||||
|
|
|
|
|
|
|
| |||||||||
Total liabilities | 308,766 | 698,223 | (102,311 | ) | 904,678 | |||||||||||
|
|
|
|
|
|
|
| |||||||||
EQUITY | ||||||||||||||||
Total shareholders’ equity (deficit) | 335,353 | (39,548 | ) | — | 295,805 | |||||||||||
Noncontrolling deficit | — | (16,880 | ) | — | (16,880 | ) | ||||||||||
|
|
|
|
|
|
|
| |||||||||
Total liabilities and equity | € | 644,119 | € | 641,795 | € | (102,311 | ) | € | 1,183,603 | |||||||
|
|
|
|
|
|
|
| |||||||||
MERCER INTERNATIONAL INC.
NOTES TO THE CONSOLIDATED FINANCIAL STATEMENTS
(In thousands of Euros, except per share data)
Note 20. Restricted Group Supplemental Disclosure (continued)
Combined Condensed Balance Sheets
| December 31, 2011 | ||||||||||||||||
| Restricted Group | Unrestricted Subsidiaries | Eliminations | Consolidated Group | |||||||||||||
ASSETS | ||||||||||||||||
Current assets | ||||||||||||||||
Cash and cash equivalents | € | 44,829 | € | 60,243 | € | — | € | 105,072 | ||||||||
Marketable securities | 12,216 | — | — | 12,216 | ||||||||||||
Receivables | 62,697 | 57,790 | — | 120,487 | ||||||||||||
Inventories | 71,692 | 48,847 | — | 120,539 | ||||||||||||
Prepaid expenses and other | 5,019 | 3,143 | — | 8,162 | ||||||||||||
Deferred income tax | 5,179 | 1,571 | — | 6,750 | ||||||||||||
|
|
|
|
|
|
|
| |||||||||
Total current assets | 201,632 | 171,594 | — | 373,226 | ||||||||||||
Long-term assets | ||||||||||||||||
Property, plant and equipment | 353,925 | 467,049 | — | 820,974 | ||||||||||||
Deferred note issuance and other | 5,971 | 4,792 | — | 10,763 | ||||||||||||
Deferred income tax | 8,492 | 3,795 | — | 12,287 | ||||||||||||
Due from unrestricted group | 88,824 | — | (88,824 | ) | — | |||||||||||
|
|
|
|
|
|
|
| |||||||||
Total assets | € | 658,844 | € | 647,230 | € | (88,824 | ) | € | 1,217,250 | |||||||
|
|
|
|
|
|
|
| |||||||||
LIABILITIES | ||||||||||||||||
Current liabilities | ||||||||||||||||
Accounts payable and other | € | 49,815 | € | 49,825 | € | — | € | 99,640 | ||||||||
Pension and other post-retirement benefit obligations | 756 | — | — | 756 | ||||||||||||
Debt | 1,088 | 24,583 | — | 25,671 | ||||||||||||
|
|
|
|
|
|
|
| |||||||||
Total current liabilities | 51,659 | 74,408 | — | 126,067 | ||||||||||||
Long-term liabilities | ||||||||||||||||
Debt | 222,384 | 486,031 | — | 708,415 | ||||||||||||
Due to restricted group | — | 88,824 | (88,824 | ) | — | |||||||||||
Unrealized interest rate derivative losses | — | 52,391 | — | 52,391 | ||||||||||||
Pension and other post-retirement benefit obligations | 31,197 | — | — | 31,197 | ||||||||||||
Capital leases and other | 6,604 | 6,449 | — | 13,053 | ||||||||||||
Deferred income tax | 2,585 | — | — | 2,585 | ||||||||||||
|
|
|
|
|
|
|
| |||||||||
Total liabilities | 314,429 | 708,103 | (88,824 | ) | 933,708 | |||||||||||
|
|
|
|
|
|
|
| |||||||||
EQUITY | ||||||||||||||||
Total shareholders’ equity (deficit) | 344,415 | (42,299 | ) | — | 302,116 | |||||||||||
Noncontrolling deficit | — | (18,574 | ) | — | (18,574 | ) | ||||||||||
|
|
|
|
|
|
|
| |||||||||
Total liabilities and equity | € | 658,844 | € | 647,230 | € | (88,824 | ) | € | 1,217,250 | |||||||
|
|
|
|
|
|
|
| |||||||||
MERCER INTERNATIONAL INC.
NOTES TO THE CONSOLIDATED FINANCIAL STATEMENTS
(In thousands of Euros, except per share data)
Note 20. Restricted Group Supplemental Disclosure (continued)
Combined Condensed Statements of Operations
| Year Ended December 31, 2012 | ||||||||||||||||
| Restricted Group | Unrestricted Subsidiaries | Eliminations | Consolidated Group | |||||||||||||
Revenues | ||||||||||||||||
Pulp | € | 423,943 | € | 337,911 | € | — | € | 761,854 | ||||||||
Energy and chemicals | 28,489 | 43,800 | — | 72,289 | ||||||||||||
|
|
|
|
|
|
|
| |||||||||
| 452,432 | 381,711 | — | 834,143 | |||||||||||||
Operating costs | 388,966 | 300,086 | — | 689,052 | ||||||||||||
Operating depreciation and amortization | 31,195 | 26,581 | — | 57,776 | ||||||||||||
Selling, general and administrative expenses | 24,640 | 13,670 | — | 38,310 | ||||||||||||
|
|
|
|
|
|
|
| |||||||||
| 444,801 | 340,337 | — | 785,138 | |||||||||||||
|
|
|
|
|
|
|
| |||||||||
Operating income | 7,631 | 41,374 | — | 49,005 | ||||||||||||
|
|
|
|
|
|
|
| |||||||||
Other income (expense) | ||||||||||||||||
Interest expense | (23,425 | ) | (38,050 | ) | 5,670 | (55,805 | ) | |||||||||
Gain (loss) on derivative instruments | 2,028 | 1,713 | — | 3,741 | ||||||||||||
Loss on extinguishment of debt | (81 | ) | — | — | (81 | ) | ||||||||||
Other income (expense) | 5,108 | 504 | (5,670 | ) | (58 | ) | ||||||||||
|
|
|
|
|
|
|
| |||||||||
Total other income (expense) | (16,370 | ) | (35,833 | ) | — | (52,203 | ) | |||||||||
|
|
|
|
|
|
|
| |||||||||
Income (loss) before income taxes | (8,739 | ) | 5,541 | — | (3,198 | ) | ||||||||||
Income tax benefit (provision) | (5,482 | ) | (1,811 | ) | — | (7,293 | ) | |||||||||
|
|
|
|
|
|
|
| |||||||||
Net income (loss) | (14,221 | ) | 3,730 | — | (10,491 | ) | ||||||||||
Less: net income attributable to noncontrolling interest | — | (1,694 | ) | — | (1,694 | ) | ||||||||||
|
|
|
|
|
|
|
| |||||||||
Net income (loss) attributable to common shareholders | € | (14,221 | ) | € | 2,036 | € | — | € | (12,185 | ) | ||||||
|
|
|
|
|
|
|
| |||||||||
MERCER INTERNATIONAL INC.
NOTES TO THE CONSOLIDATED FINANCIAL STATEMENTS
(In thousands of Euros, except per share data)
Note 20. Restricted Group Supplemental Disclosure (continued)
Combined Condensed Statements of Operations
| Year Ended December 31, 2011 | ||||||||||||||||
| Restricted Group | Unrestricted Subsidiaries | Eliminations | Consolidated Group | |||||||||||||
Revenues | ||||||||||||||||
Pulp | € | 473,992 | € | 357,404 | € | — | € | 831,396 | ||||||||
Energy and chemicals | 25,473 | 42,606 | — | 68,079 | ||||||||||||
|
|
|
|
|
|
|
| |||||||||
| 499,465 | 400,010 | — | 899,475 | |||||||||||||
Operating costs | 382,555 | 311,270 | — | 693,825 | ||||||||||||
Operating depreciation and amortization | 29,841 | 25,919 | — | 55,760 | ||||||||||||
Selling, general and administrative expenses | 24,126 | 14,645 | — | 38,771 | ||||||||||||
|
|
|
|
|
|
|
| |||||||||
| 436,522 | 351,834 | — | 788,356 | |||||||||||||
|
|
|
|
|
|
|
| |||||||||
Operating income | 62,943 | 48,176 | — | 111,119 | ||||||||||||
|
|
|
|
|
|
|
| |||||||||
Other income (expense) | ||||||||||||||||
Interest expense | (24,886 | ) | (39,074 | ) | 4,965 | (58,995 | ) | |||||||||
Gain (loss) on derivative instruments | — | (1,418 | ) | — | (1,418 | ) | ||||||||||
Foreign exchange gain (loss) on debt | 1,175 | — | — | 1,175 | ||||||||||||
Loss on extinguishment of debt | (71 | ) | — | — | (71 | ) | ||||||||||
Other income (expense) | 5,262 | 1,204 | (4,965 | ) | 1,501 | |||||||||||
|
|
|
|
|
|
|
| |||||||||
Total other income (expense) | (18,520 | ) | (39,288 | ) | — | (57,808 | ) | |||||||||
|
|
|
|
|
|
|
| |||||||||
Income (loss) before income taxes | 44,423 | 8,888 | — | 53,311 | ||||||||||||
Income tax benefit (provision) | (4,614 | ) | 5,309 | — | 695 | |||||||||||
|
|
|
|
|
|
|
| |||||||||
Net income (loss) | 39,809 | 14,197 | — | 54,006 | ||||||||||||
Less: net income attributable to noncontrolling interest | — | (3,931 | ) | — | (3,931 | ) | ||||||||||
|
|
|
|
|
|
|
| |||||||||
Net income (loss) attributable to common shareholders | € | 39,809 | € | 10,266 | € | — | € | 50,075 | ||||||||
|
|
|
|
|
|
|
| |||||||||
MERCER INTERNATIONAL INC.
NOTES TO THE CONSOLIDATED FINANCIAL STATEMENTS
(In thousands of Euros, except per share data)
Note 20. Restricted Group Supplemental Disclosure (continued)
Combined Condensed Statements of Operations
| Year Ended December 31, 2010 | ||||||||||||||||
| Restricted Group | Unrestricted Subsidiaries | Eliminations | Consolidated Group | |||||||||||||
Revenues | ||||||||||||||||
Pulp | € | 490,020 | € | 366,291 | € | — | € | 856,311 | ||||||||
Energy and chemicals | 15,145 | 34,143 | — | 49,288 | ||||||||||||
|
|
|
|
|
|
|
| |||||||||
| 505,165 | 400,434 | — | 905,599 | |||||||||||||
Operating costs | 361,272 | 287,320 | — | 648,592 | ||||||||||||
Operating depreciation and amortization | 29,971 | 25,961 | — | 55,932 | ||||||||||||
Selling, general and administrative expenses | 20,231 | 13,101 | — | 33,332 | ||||||||||||
|
|
|
|
|
|
|
| |||||||||
| 411,474 | 326,382 | — | 737,856 | |||||||||||||
|
|
|
|
|
|
|
| |||||||||
Operating income | 93,691 | 74,052 | — | 167,743 | ||||||||||||
|
|
|
|
|
|
|
| |||||||||
Other income (expense) | ||||||||||||||||
Interest expense | (31,498 | ) | (40,852 | ) | 4,729 | (67,621 | ) | |||||||||
Gain (loss) on derivative instruments | — | 1,899 | — | 1,899 | ||||||||||||
Foreign exchange gain (loss) on debt | (6,126 | ) | — | — | (6,126 | ) | ||||||||||
Loss on extinguishment of debt | (7,494 | ) | — | — | (7,494 | ) | ||||||||||
Other income (expense) | 5,103 | 94 | (4,729 | ) | 468 | |||||||||||
|
|
|
|
|
|
|
| |||||||||
Total other income (expense) | (40,015 | ) | (38,859 | ) | — | (78,874 | ) | |||||||||
|
|
|
|
|
|
|
| |||||||||
Income (loss) before income taxes | 53,676 | 35,193 | — | 88,869 | ||||||||||||
Income tax benefit (provision) | 8,651 | (2,772 | ) | — | 5,879 | |||||||||||
|
|
|
|
|
|
|
| |||||||||
Net income (loss) | 62,327 | 32,421 | — | 94,748 | ||||||||||||
Less: net income attributable to noncontrolling interest | — | (8,469 | ) | — | (8,469 | ) | ||||||||||
|
|
|
|
|
|
|
| |||||||||
Net income (loss) attributable to common shareholders | € | 62,327 | € | 23,952 | € | — | € | 86,279 | ||||||||
|
|
|
|
|
|
|
| |||||||||
MERCER INTERNATIONAL INC.
NOTES TO THE CONSOLIDATED FINANCIAL STATEMENTS
(In thousands of Euros, except per share data)
Note 20. Restricted Group Supplemental Disclosure (continued)
Combined Condensed Statements of Cash Flows
| Year Ended December 31, 2012 | ||||||||||||
| Restricted Group | Unrestricted Subsidiaries | Consolidated Group | ||||||||||
Cash flows from (used in) operating activities | ||||||||||||
Net income (loss) | € | (14,221 | ) | € | 3,730 | € | (10,491 | ) | ||||
Adjustments to reconcile net income (loss) to cash flows from operating activities | ||||||||||||
Unrealized loss (gain) on derivative instruments | (764 | ) | (1,713 | ) | (2,477 | ) | ||||||
Loss on extinguishment of debt | 81 | — | 81 | |||||||||
Depreciation and amortization | 31,471 | 26,581 | 58,052 | |||||||||
Deferred income taxes | 5,179 | (5,297 | ) | (118 | ) | |||||||
Stock compensation expense | 2,039 | — | 2,039 | |||||||||
Pension and other post-retirement expense, net of funding | 284 | — | 284 | |||||||||
Other | 1,144 | 2,657 | 3,801 | |||||||||
Changes in working capital | ||||||||||||
Receivables | (587 | ) | 8,981 | 8,394 | ||||||||
Inventories | (3,991 | ) | 5,333 | 1,342 | ||||||||
Accounts payable and accrued expenses | (7,446 | ) | (6,544 | ) | (13,990 | ) | ||||||
Other(1) | (15,779 | ) | 14,835 | (944 | ) | |||||||
|
|
|
|
|
| |||||||
Net cash from (used in) operating activities | (2,590 | ) | 48,563 | 45,973 | ||||||||
|
|
|
|
|
| |||||||
Cash flows from (used in) investing activities | ||||||||||||
Purchase of property, plant and equipment | (21,937 | ) | (14,767 | ) | (36,704 | ) | ||||||
Proceeds on sale of property, plant and equipment | 365 | 288 | 653 | |||||||||
Proceeds on maturity of marketable securities | 12,213 | — | 12,213 | |||||||||
|
|
|
|
|
| |||||||
Net cash from (used in) investing activities | (9,359 | ) | (14,479 | ) | (23,838 | ) | ||||||
|
|
|
|
|
| |||||||
Cash flows from (used in) financing activities | ||||||||||||
Repayment of notes payable and debt | (2,671 | ) | (24,583 | ) | (27,254 | ) | ||||||
Repayment of capital lease obligations | (735 | ) | (1,390 | ) | (2,125 | ) | ||||||
Proceeds from (repayment of) credit facilities, net | 4,559 | — | 4,559 | |||||||||
Payment of note issuance costs | (312 | ) | (1,621 | ) | (1,933 | ) | ||||||
Proceeds from government grants | 3,096 | 792 | 3,888 | |||||||||
|
|
|
|
|
| |||||||
Net cash from (used in) financing activities | 3,937 | (26,802 | ) | (22,865 | ) | |||||||
|
|
|
|
|
| |||||||
Effect of exchange rate changes on cash and cash equivalents | (103 | ) | — | (103 | ) | |||||||
|
|
|
|
|
| |||||||
Net increase (decrease) in cash and cash equivalents | (8,115 | ) | 7,282 | (833 | ) | |||||||
Cash and cash equivalents, beginning of year | 44,829 | 60,243 | 105,072 | |||||||||
|
|
|
|
|
| |||||||
Cash and cash equivalents, end of year | € | 36,714 | € | 67,525 | € | 104,239 | ||||||
|
|
|
|
|
| |||||||
MERCER INTERNATIONAL INC.
NOTES TO THE CONSOLIDATED FINANCIAL STATEMENTS
(In thousands of Euros, except per share data)
Note 20. Restricted Group Supplemental Disclosure (continued)120
SIGNATURES
Combined Condensed Statements of Cash Flows
| Year Ended December 31, 2011 | ||||||||||||
| Restricted Group | Unrestricted Subsidiaries | Consolidated Group | ||||||||||
Cash flows from (used in) operating activities | ||||||||||||
Net income (loss) | € | 39,809 | € | 14,197 | € | 54,006 | ||||||
Adjustments to reconcile net income (loss) to cash flows from operating activities | ||||||||||||
Unrealized loss (gain) on derivative instruments | — | 1,418 | 1,418 | |||||||||
Foreign exchange loss (gain) on debt | (1,175 | ) | — | (1,175 | ) | |||||||
Loss on extinguishment of debt | 71 | — | 71 | |||||||||
Depreciation and amortization | 30,086 | 25,919 | 56,005 | |||||||||
Deferred income taxes | 2,989 | (5,366 | ) | (2,377 | ) | |||||||
Stock compensation expense | 3,310 | — | 3,310 | |||||||||
Pension and other post-retirement expense, net of funding | (269 | ) | — | (269 | ) | |||||||
Other | 1,413 | 492 | 1,905 | |||||||||
Changes in working capital | ||||||||||||
Receivables | 3,255 | (4,859 | ) | (1,604 | ) | |||||||
Inventories | (10,175 | ) | (7,538 | ) | (17,713 | ) | ||||||
Accounts payable and accrued expenses | 5,868 | 8,384 | 14,252 | |||||||||
Other(1) | (8,503 | ) | 11,729 | 3,226 | ||||||||
|
|
|
|
|
| |||||||
Net cash from (used in) operating activities | 66,679 | 44,376 | 111,055 | |||||||||
|
|
|
|
|
| |||||||
Cash flows from (used in) investing activities | ||||||||||||
Purchase of property, plant and equipment | (29,513 | ) | (8,296 | ) | (37,809 | ) | ||||||
Proceeds on sale of property, plant and equipment | 327 | 486 | 813 | |||||||||
Purchase of marketable securities | (12,187 | ) | — | (12,187 | ) | |||||||
Note receivable | 2,865 | — | 2,865 | |||||||||
|
|
|
|
|
| |||||||
Net cash from (used in) investing activities | (38,508 | ) | (7,810 | ) | (46,318 | ) | ||||||
|
|
|
|
|
| |||||||
Cash flows from (used in) financing activities | ||||||||||||
Repayment of notes payable and debt | (26,026 | ) | (23,167 | ) | (49,193 | ) | ||||||
Repayment of capital lease obligations | (1,310 | ) | (1,632 | ) | (2,942 | ) | ||||||
Proceeds from (repayment of) credit facilities, net | (14,652 | ) | — | (14,652 | ) | |||||||
Proceeds from government grants | 14,091 | 108 | 14,199 | |||||||||
Purchase of treasury shares | (7,476 | ) | — | (7,476 | ) | |||||||
|
|
|
|
|
| |||||||
Net cash from (used in) financing activities | (35,373 | ) | (24,691 | ) | (60,064 | ) | ||||||
|
|
|
|
|
| |||||||
Effect of exchange rate changes on cash and cash equivalents | 1,377 | — | 1,377 | |||||||||
|
|
|
|
|
| |||||||
Net increase (decrease) in cash and cash equivalents | (5,825 | ) | 11,875 | 6,050 | ||||||||
Cash and cash equivalents, beginning of year | 50,654 | 48,368 | 99,022 | |||||||||
|
|
|
|
|
| |||||||
Cash and cash equivalents, end of year | € | 44,829 | € | 60,243 | € | 105,072 | ||||||
|
|
|
|
|
| |||||||
MERCER INTERNATIONAL INC.
NOTES TO THE CONSOLIDATED FINANCIAL STATEMENTS
(In thousands of Euros, except per share data)
Note 20. Restricted Group Supplemental Disclosure (continued)
Combined Condensed Statements of Cash Flows
| Year Ended December 31, 2010 | ||||||||||||
| Restricted Group | Unrestricted Subsidiaries | Consolidated Group | ||||||||||
Cash flows from (used in) operating activities | ||||||||||||
Net income (loss) | € | 62,327 | € | 32,421 | € | 94,748 | ||||||
Adjustments to reconcile net income (loss) to cash flows from operating activities | ||||||||||||
Unrealized loss (gain) on derivative instruments | — | (1,899 | ) | (1,899 | ) | |||||||
Foreign exchange loss (gain) on debt | 6,126 | — | 6,126 | |||||||||
Loss on extinguishment of debt | 7,494 | — | 7,494 | |||||||||
Depreciation and amortization | 30,270 | 25,961 | 56,231 | |||||||||
Deferred income taxes | (9,760 | ) | — | (9,760 | ) | |||||||
Stock compensation expense | 2,394 | — | 2,394 | |||||||||
Pension and other post-retirement expense, net of funding | 418 | — | 418 | |||||||||
Other | 5,011 | 2,671 | 7,682 | |||||||||
Changes in working capital | ||||||||||||
Receivables | (25,913 | ) | (14,125 | ) | (40,038 | ) | ||||||
Inventories | (2,885 | ) | (21,577 | ) | (24,462 | ) | ||||||
Accounts payable and accrued expenses | (10,304 | ) | 7,215 | (3,089 | ) | |||||||
Other(1) | (10,597 | ) | 6,031 | (4,566 | ) | |||||||
|
|
|
|
|
| |||||||
Net cash from (used in) operating activities | 54,581 | 36,698 | 91,279 | |||||||||
|
|
|
|
|
| |||||||
Cash flows from (used in) investing activities | ||||||||||||
Purchase of property, plant and equipment | (34,675 | ) | (3,625 | ) | (38,300 | ) | ||||||
Proceeds on sale of property, plant and equipment | 251 | 887 | 1,138 | |||||||||
Note receivable | 1,113 | — | 1,113 | |||||||||
|
|
|
|
|
| |||||||
Net cash from (used in) investing activities | (33,311 | ) | (2,738 | ) | (36,049 | ) | ||||||
|
|
|
|
|
| |||||||
Cash flows from (used in) financing activities | ||||||||||||
Repayment of notes payable and debt | (220,665 | ) | (13,917 | ) | (234,582 | ) | ||||||
Proceeds from borrowings of notes payable and debt | 222,177 | — | 222,177 | |||||||||
Repayment of capital lease obligations | (589 | ) | (2,331 | ) | (2,920 | ) | ||||||
Proceeds from (repayment of) credit facilities, net | (2,660 | ) | — | (2,660 | ) | |||||||
Payment of note issuance costs | (6,095 | ) | — | (6,095 | ) | |||||||
Proceeds from government grants | 17,952 | — | 17,952 | |||||||||
|
|
|
|
|
| |||||||
Net cash from (used in) financing activities | 10,120 | (16,248 | ) | (6,128 | ) | |||||||
|
|
|
|
|
| |||||||
Effect of exchange rate changes on cash and cash equivalents | (1,371 | ) | — | (1,371 | ) | |||||||
|
|
|
|
|
| |||||||
Net increase (decrease) in cash and cash equivalents | 30,019 | 17,712 | 47,731 | |||||||||
Cash and cash equivalents, beginning of year | 20,635 | 30,656 | 51,291 | |||||||||
|
|
|
|
|
| |||||||
Cash and cash equivalents, end of year | € | 50,654 | € | 48,368 | € | 99,022 | ||||||
|
|
|
|
|
| |||||||
SUPPLEMENTARY FINANCIAL INFORMATION (UNAUDITED)
Quarterly Financial Data
(Thousands of Euros, except per share amounts)
| Quarters Ended | ||||||||||||||||
| March 31 | June 30 | September 30 | December 31 | |||||||||||||
2012 | ||||||||||||||||
Revenues | € | 218,358 | € | 204,062 | € | 223,275 | € | 188,448 | ||||||||
Gross profit | 16,243 | 18,296 | 7,214 | 7,252 | ||||||||||||
Net income (loss) attributable to common shareholders | 1,173 | 1,515 | (9,712 | ) | (5,161 | ) | ||||||||||
Net income (loss) per share attributable to common shareholders* | 0.02 | 0.03 | (0.17 | ) | (0.09 | ) | ||||||||||
2011 | ||||||||||||||||
Revenues | € | 226,330 | € | 234,495 | € | 207,065 | € | 231,585 | ||||||||
Gross profit | 36,644 | 36,211 | 35,307 | 2,957 | ||||||||||||
Net income (loss) attributable to common shareholders | 29,053 | 14,383 | 8,440 | (1,801 | ) | |||||||||||
Net income (loss) per share attributable to common shareholders* | 0.52 | 0.26 | 0.15 | (0.03 | ) | |||||||||||
* On a diluted basis
Pursuant to the requirements of Section 13 or 15(d) of theSecurities Exchange Act of 1934,, the Registrant has duly caused this report to be signed on its behalf by the undersigned, thereunto duly authorized.
| MERCER INTERNATIONAL INC. | ||||||||
| Dated: February | 13, 2015 | By: | ||||||
| Jimmy S.H. Lee | ||||||||
| Chairman | ||||||||
Pursuant to the requirements of theSecurities Exchange Act of 1934,, this report has been signed below by the following persons on behalf of the Registrant and in the capacities and on the dates indicated.
/s/ JIMMY S.H. LEE | ||||||
Jimmy S.H. Lee | ||||||
Chairman, Chief Executive Officer and Director | Date: February 13, 2015 | |||||
/s/ DAVID M. GANDOSSI | ||||||
David M. Gandossi | ||||||
Secretary, Executive Vice President, | ||||||
Chief Financial Officer and Principal | ||||||
Accounting Officer | Date: February 13, 2015 | |||||
/s/ ERIC LAURITZEN | ||||||
Eric Lauritzen | ||||||
Director | Date: February 13, 2015 | |||||
/s/ WILLIAM D. MCCARTNEY | ||||||
William D. McCartney | ||||||
Director | Date: February 13, 2015 | |||||
/s/ GRAEME A. WITTS | ||||||
Graeme A. Witts | ||||||
Director | ||||||
| Date: February | 13, 2015 | ||||
| ||||||
| ||||||
/s/ BERNARD PICCHI | ||||||
Bernard Picchi | ||||||
Director | Date: February 13, 2015 | |||||
/s/ JAMES SHEPHERD | ||||||
James Shepherd | ||||||
Director | Date: February 13, 2015 | |||||
/s/ KEITH PURCHASE | ||||||
Keith Purchase | ||||||
Director | Date: February 13, 2015 | |||||
/s/ NANCY ORR Nancy Orr Director | Date: February 13, 2015 | |||||
121
EXHIBIT INDEX
Exhibit No. | Description of Exhibit | |
| 2.1 | Agreement and Plan of Merger among Mercer International Inc., Mercer International Regco Inc. and Mercer Delaware Inc. dated December 14, 2005. Incorporated by reference to the Proxy Statement/Prospectus filed on December 15, 2005. | |
| 3.1 | Articles of Incorporation of | |
| 3.2 | Bylaws of | |
| 4.1 | Indenture dated | |
| ||
| ||
| ||
| ||
| ||
Form of Trustee’s Indemnity Agreement between Mercer International Inc. and its Trustees. Incorporated by reference from Form 10-K filed March 31, 2003. | ||
Employment Agreement dated for reference August 7, 2003 between Mercer International Inc. and David Gandossi. Incorporated by reference from Form 8-K | ||
Employment Agreement effective as of April 28, 2004 between Mercer International Inc. and Jimmy S.H. Lee. Incorporated by reference from Form 8-K | ||
2004 Stock Incentive Plan. Incorporated by reference from Form S-8 | ||
Mercer International Inc. 2010 Stock Incentive Plan. Incorporated by reference from | ||
| ||
| ||
Employment Agreement effective September 1, 2005 between Mercer International Inc. and Leonhard Nossol dated August 18, 2005. Incorporated by reference from Form 10-Q | ||
Employment Agreement dated October 2, 2006 between Stendal Pulp Holding GmbH and Wolfram Ridder. Incorporated by reference from Form 8-K filed October 3, 2006. | ||
| 10.9 | Electricity Purchase Agreement effective January 27, 2009 between Zellstoff Celgar Limited Partnership and British Columbia Hydro and Power Authority. Incorporated by reference from Form 10-K filed March 2, 2009. Certain non-public information has been omitted from the appendices to Exhibit | |
Revolving Credit Facility Agreement dated August 19, 2009 among D&Z Holding GmbH, Zellstoff-und Papierfabrik Rosenthal GmbH, D&Z Beteiligungs GmbH and ZPR Logistik GmbH and Bayerische Hypo-und Vereinsbank AG. Incorporated by reference from Form 8-K | |||
| |||
Extension, Amendment and Confirmation Letter dated October 4, 2012 among Zellstoff- und Papierfabrik Rosenthal GmbH, D&Z Holding GmbH, D&Z Beteiligungs GmbH, ZPR Logistik GmbH, Bayerische Hypo-und Vereinsbank AG and Mercer International Inc. Incorporated by reference from Form 10-Q | |||
Second Amended and Restated Credit Agreement dated as of | ||
First Amending Agreement dated October 21, 2014 between Zellstoff Celgar Limited Partnership, Mercer International Inc., as guarantor, and Canadian Imperial Bank of Commerce. Incorporated by reference from Form 10-Q filed October 31, 2014. | ||
| 10.14 | Registration Rights Agreement dated November 26, 2014 between Mercer International Inc. and Credit Suisse Securities (USA) LLC, related to 2019 Senior Notes. Incorporated by reference from Form 8-K filed on November 28, 2014. | |
| 10.15 | Registration Rights Agreement dated November 26, 2014 between Mercer International Inc. and Credit Suisse Securities (USA) LLC, related to 2022 Senior Notes. Incorporated by reference from Form 8-K filed on November 28, 2014. | |
| 14.1 | Code of Business Conduct and Ethics. Incorporated by reference from | |
| ||
| ||
| ||
| ||
| ||
| ||
| ||
Section 302 Certificate of Chief Executive Officer. | ||
Section 302 Certificate of Chief Financial Officer. | ||
| 32.1* | Section 906 Certificate of Chief Executive Officer. | |
| 32.2* | Section 906 Certificate of Chief Financial Officer. | |
| 101* | The following financial statements from the Company’s annual report on Form 10-K for the year ended December 31, 2014, filed with the SEC on February 13, 2015, formatted in Extensible Business Reporting Language (XBRL): (i) Consolidated Balance Sheets; (ii) Consolidated Statements of Operations; (iii) Consolidated Statements of Comprehensive Income; (iv) Consolidated Statements of Changes in Shareholders’ Equity; (v) Consolidated Statements of Cash Flows; and (vi) Notes to Consolidated Financial Statements. | |
| * | Filed |
|
