
1
UNITED STATES
SECURITIES AND EXCHANGE COMMISSION
Washington, D.C. 20549
FORM 10-K10-K/A
Amendment No. 1
☒ ANNUAL REPORT PURSUANT TO SECTION 13 OR 15(d) OF THE SECURITIES EXCHANGE ACT OF 1934
For the fiscal year ended December 31 2012, 2023
OR
☐TRANSITION REPORT PURSUANT TO SECTION 13 OR 15(d) OF THE SECURITIES EXCHANGE ACT OF 1934
For the transition period from to
Commission file number: 001-33767
Lumber Liquidators
LL Flooring Holdings, Inc.
(Exact Name of Registrant as Specified in its Charter)
Delaware | 27‑1310817 | |
(State or other jurisdiction of incorporation or organization) | (I.R.S. Employer Identification No.) | |
4901 Bakers Mill Lane,Richmond, Virginia | 23230 | |
(Address of principal executive offices) | (Zip Code) |
(757) 259-4280
(804) 463‑2000
(Registrant’s telephone number, including area code)
Securities registered pursuant to Section 12(b) of the Act:
Title of each class | Trading Symbol(s) | Name of each exchange on which registered |
Common Stock, par value $0.001 per share | LL | New York Stock Exchange |
Securities registered pursuant to Section 12(g) of the Act: None
Indicate by check mark if the registrant is a well-known seasoned issuer, as defined in Rule 405 of the Securities Act. Yes ¨Nox
Indicate by check mark if the registrant is not required to file reports pursuant to Section 13 or Section 15(d) of the Act. Yes ¨Nox
Indicate by check mark whether the Registrantregistrant: (1) has filed all reports required to be filed by Section 13 or 15(d) of the Securities Exchange Act of 1934 during the preceding 12 months (or for such shorter period that the Registrantregistrant was required to file such reports), and (2) has been subject to such filing requirements for the past 90 days. Yesx No ¨
Indicate by check mark whether the registrant has submitted electronically and posted on its corporate Web site, if any, every Interactive Data File required to be submitted and posted pursuant to Rule 405 of Regulation S-T (§232.405 of this chapter) during the preceding 12 months (or for such shorter period that the registrant was required to submit and post such files). xYes¨ No
Indicate by check mark if disclosure of delinquent filers pursuant to Item 405 of Regulation S-K is not contained herein, and will not be contained, to the best of Registrant’s knowledge, in definitive proxy or information statements incorporated by reference in Part III of this Form 10-K or any amendment to this Form 10-K. ¨
Indicate by check mark whether the registrant is a large accelerated filer, an accelerated filer, a non-accelerated filer, or a smaller reporting company or an emerging growth company. See definitions of “large accelerated filer,” “accelerated filer”filer,” “smaller reporting company” and “smaller reporting“emerging growth company” in Rule 12b-2 of the Exchange Act. (Check one):
| Accelerated | filer |
| ☐ Smaller reporting company | ☐ Emerging growth company |
If an emerging growth company, indicate by check mark if the registrant has elected not to use the extended transition period for complying with any new or revised financial accounting standards provided pursuant to Section 13(a) of the Exchange Act. ☐
Indicate by check mark whether the registrant has filed a report on and attestation to its management’s assessment of the effectiveness of its internal control over financial reporting under Section 404(b) of the Sarbanes-Oxley Act (15 U.S.C. 7262(b)) by the registered public accounting firm that prepared or issued its audit report.
If securities are registered pursuant to Section 12(b) of the Act, indicate by check mark whether the financial statements of the registrant included in the filing reflect the correction of an error to previously issued financial statements. ☐
Indicate by check mark whether any of those error corrections are restatements that required a recovery analysis of incentive-based compensation received by any of the registrant’s executive officers during the relevant recovery period pursuant to §240.10D-1(b). ☐
Indicate by check mark whether the registrant is a shell company (as defined in Rule 12b-212b‑2 of the Act). Yes ¨☐ No x
AtAs of June 30, 2012,2023, the last business day of the Registrant’sregistrant’s most recently completedrecent second fiscal quarter, the aggregate market value of the voting and non-votingregistrant’s common equitystock held by non-affiliates of the Registrant (based uponregistrant was $108.5 million based on the closing sale price of such sharesas reported on the New York Stock Exchange on June 29, 2012) was approximately $549 million. SharesExchange.
As of Registrant’sApril 19, 2024, 30,667,115 shares of the registrant's common stock, held by each executive officer and director and by each entity or person that, to the Registrant’s knowledge, owned 10% or more of Registrant’s outstanding common stock as of June 30, 2012 have been excluded in that such persons may be deemed to be affiliates of the Registrant. This determination of affiliate status is not necessarily a conclusive determination for other purposes.
Indicate the number of shares outstanding of each of the Registrant’s classes of common stock as of February 18, 2013:$0.001 par value per share, were outstanding.
|
DOCUMENTS INCORPORATED BY REFERENCE
None
Auditor Name: Ernst & Young LLP Auditor Location: Richmond, VA Auditor Firm ID: 42
EXPLANATORY NOTE
This Amendment No. 1 (“Amendment No. 1”) to the Annual Report on Form 10-K of LL Flooring Holdings, Inc. (together with our subsidiaries, “LL,” the “Company,” “we,” “us,” and “our”) for the fiscal year ended December 31, 2023 as filed with the Securities and Exchange Commission (the “SEC”) on March 1, 2024 (the “Annual Report”), is being filed to include in the Annual Report the information required by Part III incorporates certain(Items 10, 11, 12, 13 and 14) of Form 10-K. This information was previously omitted from the Annual Report in reliance on General Instruction G.(3) to Form 10-K, which permits the above-referenced items to be incorporated in the Annual Report on Form 10-K by reference from the Registrant’sa definitive proxy statement for the 2013 annual meeting of stockholders, which will be filed no later than 120 days after December 31, 2023. We are filing this Amendment No. 1 to include Part III information in our Form 10-K because we do not intend to file a definitive proxy statement containing this information within 120 days after the closeend of the Registrant’s fiscal year ended December 31, 2012.covered by Form 10-K. As such, the reference on the cover page of the Annual Report to the incorporation by reference of our definitive proxy statement into Part III of the Annual Report is hereby deleted.
This Amendment No. 1 amends and restates in their entirety Items 10 through 14 of the Annual Report. As required by Rule 12b-15 under the Securities Exchange Act of 1934 (the “Exchange Act”), new certificates of our chief executive officer and chief financial officer pursuant to Section 302 of the Sarbanes-Oxley Act of 2002 are being filed as exhibits to this Amendment No. 1. Because this Amendment No. 1 does not contain any financial statements and does not contain or amend any disclosure with respect to Items 307 and 308 of Regulation S-K, paragraphs 3, 4 and 5 of the certifications have been omitted. Because no financial statements are contained within this Amendment No. 1, we are not filing certifications pursuant to Section 906 of the Sarbanes-Oxley Act of 2002.
Except as otherwise expressly noted herein, this Amendment No. 1 does not amend any other information set forth in the Annual Report, and we have not updated disclosures contained therein to reflect any events that occurred at a date subsequent to the date of the filing of the Annual Report. Accordingly, this Amendment No. 1 should be read in conjunction with the Annual Report and our other filings with the SEC. Certain capitalized terms used and not otherwise defined in this Amendment No. 1 have the meanings given to them in the Annual Report.
LUMBER LIQUIDATORSLL FLOORING HOLDINGS, INC.
ANNUAL REPORT ON FORM 10-K10‑K
Page | ||||||
| ||||||
| 4 | |||||
| ||||||
| ||||||
| ||||||
| ||||||
| ||||||
| ||||||
| ||||||
| ||||||
| ||||||
| ||||||
| ||||||
| ||||||
| Directors, Executive Officers and Corporate Governance | 4 | ||||
9 | ||||||
Security Ownership of Certain Beneficial Owners and Management and Related Stockholder Matters | 25 | |||||
Certain Relationships and Related Transactions, and Director Independence | 27 | |||||
28 | ||||||
29 | ||||||
29 | ||||||
CAUTIONARY NOTE REGARDING FORWARD-LOOKING STATEMENT
This report includes statements of our expectations, intentions, plans and beliefs that constitute “forward-looking statements” within the meaning of Section 27A of the Securities Act of 1933 and Section 21E of the Securities Exchange Act of 1934 and are intended to come within the safe harbor protection provided by those sections. These statements, which involve risks and uncertainties, relate to matters such as sales growth, comparable store net sales, impact of cannibalization, price changes, earnings performance, stock-based compensation expense, margins, return on invested capital, strategic direction, the demand for our products and store openings. We have used words such as “may,” “will,” “should,” “expects,” “intends,” “plans,” “anticipates,” “believes,” “thinks,” “estimates,” “seeks,” “predicts,” “could,” “projects,” “potential” and other similar terms and phrases, including references to assumptions, in this report to identify forward-looking statements. These forward-looking statements are made based on expectations and beliefs concerning future events affecting us and are subject to uncertainties, risks and factors relating to our operations and business environments, all of which are difficult to predict and many of which are beyond our control, that could cause our actual results to differ materially from those matters expressed or implied by these forward-looking statements. These risks and other factors include those listed in this Item 1A. “Risk Factors,” and elsewhere in this report.
When considering these forward-looking statements, you should keep in mind the cautionary statements in this report and the documents incorporated by reference. New risks and uncertainties arise from time to time, and we cannot predict those events or how they may affect us. There may also be other factors that we cannot anticipate or that are not described in this report that could cause results to differ materially from our expectations. Forward-looking statements speak only as of the date they are made and we assume no obligation to update them after the date of this report as a result of new information, future events or subsequent developments, except as required by the federal securities laws.
Unless otherwise stated, references to “we,” “our” and “Lumber Liquidators” generally refers to Lumber Liquidators Holdings, Inc. and its consolidated subsidiaries.
PART I
Overview
Lumber Liquidators Holdings, Inc. and its subsidiaries operated 279 retail stores throughout the United States (“U.S.”), as well as nine retail stores in Ontario, Canada as of December 31, 2012. We operate as a single business segment, with our call center, website and customer service network supporting our store operations. We believe we have achieved a reputation for offering great value, superior service and a broad selection of high-quality hardwood flooring products. We offer an extensive assortment of exotic and domestic hardwood species, engineered hardwoods, laminates, bamboo and cork direct to the consumer. We also provide a wide selection of flooring enhancements and accessories, including moldings, noise-reducing underlay, adhesives and flooring tools. Our customer is primarily the homeowner, or a contractor on behalf of a homeowner.
Founded in 1994, Lumber Liquidators is the largest specialty retailer of hardwood flooring in North America. Our initial public offering was in November 2007, and our common stock trades on the New York Stock Exchange under the symbol “LL”. We are a Delaware corporation with headquarters in Toano, Virginia.
Competitive Strengths
We believe that our sourcing directly from the mill provides the foundation for the strongest value proposition in a highly-fragmented hardwood flooring market. We strengthen and support that value proposition with a unique store model, proprietary brands, extensive customer education and sales support resources and a comprehensive marketing and advertising strategy.
Sourcing Direct from the Mill
Our Suppliers. We believe that our vertically integrated business model enables us to offer a broad assortment of high-quality products to our customers at a lower cost than our competitors. We work directly with a select group of vendors and mills with whom we have cultivated strong relationships that provide for a consistent supply of our products. We select suppliers based on a variety of factors, including their ability to supply products that meet industry grading standards and our demanding product specifications, which support the high-quality nature of our brands. We believe that we are the largest customer for most of our suppliers, which we believe enables us to obtain better prices in some circumstances. As we have grown, we believe our supplier relationships have strengthened, which we believe helps to ensure our access to a broad selection of products. Further, many suppliers have expanded to support our business.
We currently purchase products from approximately 110 domestic and international vendors, which are primarily mills. In 2012, our top 10 suppliers accounted for approximately 50% of our supply purchases. We believe that alternative and competitive suppliers are available for most of our products. In 2012, approximately 43% of our product was sourced from Asia, 50% from North America, 6% from South America and 1% from other locations, including Europe and Australia. The majority of our foreign purchases are negotiated and paid for in U.S. dollars.
Sourcing Initiatives. In 2011, we began a process to continually challenge, and ultimately strengthen, the structure of our sourcing relationships with the best international and domestic mills. Our sourcing initiatives play a key role in maintaining the best combination of quality and value in our product assortment, while reducing product costs. These initiatives are segregated into three primary areas, which are being implemented independently over a multi-year time frame, as follows:
| 30 |
|
|
Supply Chain. We are committed to our complete product assortment being available to meet our customers’ expectations more timely than our competitors. We operate distribution centers in Hampton Roads and Toano, Virginia, a facility in Toronto, Canada, with both a store front and a small warehouse, and we lease the services of a third party consolidation center in China. On average, each store location has approximately 4,400 to 6,000 square feet of warehouse space stocked with a combination of customer-specific inventory waiting to be picked up or delivered and inventory levels of certain products we believe the customer expects to be immediately available. We generally expect each store to receive a truckload of product at least once per week. Further, we work with our mills to ship certain products directly to our stores or to our customers.
Our supply chain costs include:
international and domestic inbound transportation to either our distribution centers or stores;3
transportation charges from our distribution centers to our stores;
transportation charges between stores; and
third-party delivery services from our stores to our customers.
Our product is generally transported boxed and palletized, and the weight of our product generally increases our supply chain costs. International container rates, customs and duty charges, and domestic fuel costs can significantly impact our transportation costs, which in total represented 8.8% of net sales in 2012. Our supply chain initiatives seek the lowest rates, reductions in the number of miles traveled and the most efficient means to minimize the total cost per mile.
Our Value Proposition
Important components of our value proposition include:
|
|
|
|
|
Our Stores
Our stores are approximately 6,000 to 7,000 square feet, which includes a showroom format designed to emphasize our products, yet reflect our low-cost approach to doing business, and a warehouse. We believe our customers consider us a destination location. Therefore, we seek locations for our stores that have significant visibility to passing traffic and easy access from major highways, as well as certain retail synergies including home improvement, but are typically in areas with
lower rents than other retail locations. We can adapt to a range of existing buildings, whether free-standing or in shopping centers. We enter into short leases, generally for base terms of five years, with renewal options to maximize our real estate flexibility. We believe that our store design and locations reinforce our customers’ belief that they get a good deal when they buy from us.
In 2012, we completed the initial design to expand our average showroom from the 1,000 to 1,200 square feet previously targeted to 1,600 square feet. However, with an improved warehouse design and supply chain efficiencies, the total targeted store square footage is not expected to change. We refer to this new design as our “store of the future”, and beginning in 2013, we expect that all of our new stores and all remodels and relocations of existing stores will be in this format.
Our store showrooms have wall racks holding one-foot by two-foot display boards of our flooring products, presented within color palate and in a good-better-best format, and larger sample squares serving as the showroom floor. The showroom also displays an expanded selection of flooring enhancements and accessories to complement, install and maintain a customer’s new floor.
A typical store staff consists of a manager and two to three associates, with a compensation structure generally weighting sales-driven bonuses over a relatively low base salary. The store manager is responsible both for store operations and for overseeing our customers’ shopping experience. As people are a key component of our value proposition, we have an emphasis on identifying, hiring and empowering top performing employees who share a passion for our business philosophy. Many of our store managers have previous experience with the home improvement, retail flooring or flooring installation industries. We provide training opportunities for our store personnel including our Lumber Liquidators University (“LLU”) program, which is an annual training event for all of our regional and store managers that focuses on enhanced selling techniques, in-depth product training and strategic discussions with senior executives.
Customer Education and Resources
Our sales strategy emphasizes customer service by providing superior, convenient, educational tools for our customers to learn about our products and the installation process. Our website contains a broad range of information regarding our floors and accessories. Visitors to our website can search through a comprehensive knowledge base of tools on wood flooring, including browsing product reviews, frequently asked questions and an extensive “before and after” gallery from previous customers, as well as research detailed product information and how-to videos that explain the installation process.
Flooring samples of all the products we offer are available in our stores, and can be ordered through our call center and website. In addition, our iPhone and iPad app, The Floor Finder, gives consumers access to nearly 200 digital samples as well as a variety of tools designed to facilitate flooring purchase decisions, including visualizing any floor in their own home. The app also gives consumers flooring specifications, such as hardness and installation information. We are active in social media in order to connect to our consumers in the most convenient manner possible as well as build relationships with our satisfied customers. We have an active presence on Facebook, Pinterest, YouTube and three unique Twitter accounts.
Our call center is staffed by flooring experts cross-trained in sales, customer service and product support. In addition to receiving telephone calls, our call center staff chats online with visitors to our website, responds to emails from our customers and engages in telemarketing activities. Customers can contact our call center to place an order to be delivered directly to their home or picked up at a nearby store, to make an inquiry or to order a catalog.
Our Brands
We have invested significant resources developing our national brands, including our name and proprietary products, and expect to continue to invest resources in our advertising and marketing at a percentage of net sales that we believe is greater than our competitors. We believe Lumber Liquidators is now recognized across the United States as a destination for high-quality hardwood flooring at low prices, while our flagship Bellawood brand is known as a premium flooring brand within the industry. We are committed to supporting our proprietary brands and products through diverse national marketing campaigns that reach a wide variety of potential customers.
In order to control the quality of our Bellawood brand, we maintain a finishing facility in Toano, Virginia.In 2012, we finished approximately 92% of our Bellawood products at that facility, and we obtained the balance from qualified finishing suppliers in North America and South America. Bellawood products have one of the highest scuff resistant finishes in the
industry as measured by the Taber Abrasion Test, an abrasion testing method designed to measure the abrasion resistance of protective floor finishes. We also finish small quantities of certain of our other products at our Toano facility. We continually invest in improving our process controls and product quality, and we believe that our existing finishing infrastructure at our Toano facility can support our planned growth over at least the next three years with limited capital expenditures to increase capacity.
Our Marketing and Advertising
Reach and Frequency. Our marketing and advertising strategy includes a focus on broadening the reach and frequency of our message to increase the recognition of our value proposition and ultimately the number of customers served. We utilize a mix of traditional and new media, direct mail and financing offers to emphasize product credibility, value, brand awareness, customer education and direct selling. Though our primary focus remains on the more passionate do-it-yourself (“DIY”) customer, we believe our value proposition is reaching, and resonating with, a more casual consumer.
We increase brand awareness in a variety of ways, including celebrity endorsements and product placement opportunities. We have long-term relationships with respected, well-known home improvement celebrities Bob Vila and Ty Pennington. Bob Vila, in particular, has been associated specifically with our Bellawood brand for several years. We work with Ty Pennington on a proprietary line of flooring branded as the Ty Pennington Collection.
To increase brand awareness, we conduct ad campaigns on both a national and local level using both traditional and new media. We work with shows such as HGTV’s “Dream Home Sweepstakes,” which use our products and enable potential customers to see both what our flooring will look like after installation and the relative ease with which it can be installed. In addition, we use targeted television advertising on cable networks such as Discovery Channel, HGTV, TLC and DIY Network. We engage in sports marketing by participating in opportunities with, among others, Major League Baseball and National Basketball Association teams. On the Internet, our advertising efforts include the use of banner advertising, sponsoring links on well-known search engines, having storefronts with large e-tailers and having a large network of online affiliate partners. We also utilize local and national radio, primarily for promotional messaging.
Our direct mail strategy focuses on regular contact with our customers and the targeting of prospective purchasers. We have a healthy and growing database that we utilize to drive our direct mail and overall marketing strategies. We distribute our catalogs, as well as other direct mailings, to key consumer and commercial segments around specific store locations. Copies of our catalogs can also be obtained through our stores, our call center and our website. In addition, we utilize direct mail for call-to-action promotions. We believe these mailings contribute to increases in store traffic and call center volumes that lead to more sales. We expect to continue expanding our direct mailing efforts to prospective customers in markets where we have stores.
Financing.We offer our residential customers a financing alternative through a proprietary credit card, the Lumber Liquidators credit card, underwritten by GE Money Bank at no recourse to us. We generally utilize the credit program for promotional opportunities, including programs for up to 26 months of deferred interest with payments. Our customers may also use their Lumber Liquidators credit card to tender installation services provided by our installation service provider, The Home Service Store, Inc. (“HSS”).
We offer our commercial customers a financing alternative through the Lumber Liquidators Commercial Credit Program, A Credit Line for Pros. This program is underwritten by BlueTarp Financial, Inc., generally at no recourse to us. The commercial credit program also provides our professional customers a range of additional services that we believe add efficiency to their businesses.
Our Market
According to the December 2012 Floor Coverings Industry report from Catalina Research, Inc. (“Catalina”), the hardwood flooring market represents approximately 10% of the overall U.S. floor coverings market, which includes carpet and area rugs, solid and engineered hardwood, softwood and bamboo flooring, ceramic and stone floor and wall tile, resilient sheet and floor tile, and laminate flooring. Due to improvements in the quality and construction of certain products, ease of installation and lower average retail price points, hardwood flooring’s share of the overall U.S. floor coverings market continues to increase, primarily by taking share from soft surface flooring. Using Catalina estimates as a basis, we believe the 2012 retail value of the U.S. hardwood and laminate flooring markets were approximately $3.6 billion and $1.8 billion, respectively, and our share of the combined market was approximately 10.5% considering these products were approximately 70% of our sales mix in 2012.
The residential replacement wood flooring market is dependent on home-related, large-ticket discretionary spending, which is influenced by a number of complex economic and demographic factors that may vary locally, regionally and nationally. This market is impacted by, among other things, home remodeling activity, employment levels, housing turnover, home prices, new housing starts, consumer confidence, credit availability and the general health of consumer discretionary spending. In 2012, a number of these factors stabilized or improved, though remain at historically low levels. We believe our customer will remain cautious and price sensitive in 2013, with a number of macroeconomic risks providing uncertainty, and potentially volatile demand, even as a multi-year recovery in home remodeling may be forming. Catalina projects the hardwood flooring market will average annual growth of 4.0% per year through 2015, and perhaps greater, subject to the pace of macroeconomic recovery. We believe we are well-positioned to benefit from an improving housing market.
We believe the number of independent retailers serving the homeowner-based segment of the wood flooring market continues to shrink under the difficult macroeconomic pressures. According to Catalina, there are approximately 9,000 specialty floor coverings stores now operating in the U.S. We believe our results have benefited from our gain of market share in this environment and that we will continue to gain market share. We continue to believe that the longer term trends for our market remain favorable, including customer perception of hardwood flooring as an attractive alternative to other floor coverings, the evolution of the hardwood flooring market, overall home improvement spending and certain demographic trends.
Our Competition
We are the largest specialty retailer of hardwood flooring in North America, and compete in a hardwood flooring market that is highly fragmented. The majority of the market consists of smaller national specialty flooring chains and local and regional independent flooring retailers, including a large number of privately-owned single-site enterprises. We also compete against home improvement warehouse chains, and Catalina estimates that Lumber Liquidators, Home Depot and Lowes together represent approximately 37% of hardwood flooring retail sales. Additionally, we compete against regional and local independent retailers and smaller national chains which specialize in the lower-end, higher-volume flooring market and offer a wide range of home improvement products in addition to flooring.
Our Sales Strategy
We seek to appeal to customers who desire a high-quality product at an attractive value. We sell our products principally to existing homeowners, who we believe represent over 90% of our consumer count. Most of our other sales are to contractors, who are primarily small businesses that are either building a small number of new homes or have been hired by an owner to put in a new floor.
Historically, our customers are in their mid-30’s or older, are well-educated and have income levels above the average domestic household. We have found that homeowners prefer various characteristics of wood floors, including appearance and durability, ease of installation, renewability of resources and specific aspects of engineered, resilient and laminate flooring. Our research indicates that our customers will choose to replace their flooring primarily after they have lived in the home for a certain number of years, when a life event occurs such as a change in household members, and prior to or shortly after moving into a new home. According to Catalina, approximately 28% of buyers of an existing home undertake some type of flooring replacement job in the first year of ownership.
We have an integrated multi-channel sales model that enables our international store network, call center, website and catalogs to work together in a coordinated manner. We believe that due to the average size of the sale and the general infrequency of a hardwood flooring purchase, many of our customers conduct extensive research using multiple channels before making a purchase decision. Our research indicates that the average length for a hardwood flooring purchase, from initial interest to sale, is approximately 100 days.
Customers can purchase our complete assortment of products in our stores, or through our call center, website, a smartphone or a tablet. The prices available on our website and from our call center are the same as the prices in our stores. Once an order is placed, customers may have their purchases delivered or pick them up at a nearby store location. In 2012, approximately 11% of our customers utilized our delivery services. We strive to use our various sales channels to make our customers’ transactions easy and efficient. Our average sale was approximately $1,600 in 2012, and generally represents one or two rooms of flooring. We define “average sale” as the average invoiced sale per customer, measured on a monthly basis
and excluding transactions of less than $250 (which are generally sample orders, or add-ons or fill-ins to previous orders) and of more than $30,000 (which are usually contractor orders). Our goal is to provide our customers with everything needed to complete their flooring project – to remove the existing floor, install the new floor with complementary moldings and accessories, and finally, maintain the floor for its lifetime.
Installation.We have a national installation arrangement with HSS, allowing us to make consistent installation services available in every store in our chain. HSS manages fully insured and licensed providers of professional installation services that measure, deliver and install flooring at competitive prices. This arrangement allows us to increase service offerings to our customers, and we benefit from cross-promotional opportunities. Furthermore, we minimize risk associated with installation services and reduce time spent by store managers on installation service issues. We receive certain reimbursements from HSS based upon our customers’ use of their services. In 2012, less than 10% of our customers utilized HSS for installation.
Our Products.We offer a complete assortment of wood flooring that includes prefinished domestic and exotic hardwoods, engineered hardwoods, unfinished hardwoods, bamboo, cork and laminates, as well as resilient flooring. Our product offering is substantially comprised of our proprietary brands, led by our flagship Bellawood brand. Our hardwood flooring products are generally available in various widths and lengths. They are generally differentiated in terms of quality and price based on the species, grade of the hardwood and quality of finishing, in addition to the length of the warranty. Prefinished floors are finished in factories under controlled conditions and are ready to be enjoyed immediately after they are installed. We also offer a broad assortment of flooring enhancements and installation accessories, including moldings, noise-reducing underlay and tools, that complement our assortment of floor offerings. In total, we offer nearly 350 different flooring product stock-keeping units.
| 2012 | 2011 | 2010 | ||||||||||
| Percentage of Net Sales: | ||||||||||||
Solid and Engineered Hardwood | 47 | % | 50 | % | 54 | % | ||||||
Laminates | 22 | % | 23 | % | 21 | % | ||||||
Moldings and Accessories | 16 | % | 15 | % | 14 | % | ||||||
Bamboo, Cork and Resilient | 14 | % | 11 | % | 10 | % | ||||||
Other | 1 | % | 1 | % | 1 | % | ||||||
|
|
|
|
|
| |||||||
Total | 100 | % | 100 | % | 100 | % | ||||||
Solid and Engineered Hardwood.Our proprietary solid hardwood products are milled from one thick piece of wood, which can be sanded and refinished numerous times, and our proprietary engineered hardwood products are produced by bonding a layer of hardwood to a plywood or high-density fiber board backing. Engineered flooring is designed primarily to be installed in areas where traditional hardwood is not conducive, such as slab construction, basements and areas where moisture may be a factor. We offer flooring products made from more than 25 wood species, including both domestic woods, such as ash, beech, birch, hickory, northern hard maple, northern red oak, pine and American walnut, and exotic woods, such as bloodwood, cherry, cypress, ebony, koa, mesquite, mahogany, rosewood and teak. We sell our solid hardwood products either prefinished or unfinished, and our engineered hardwood products in either glue down or floating application. Our prefinished hardwoods typically carry a wear warranty from 25 to 100 years, and our Bellawood products carry a 100-year, transferable warranty.
Laminates.Our proprietary laminate flooring is typically constructed with a high-density fiber board core, inserted between a melamine laminate backing and high-quality photographic paper displaying an image of wood and a ceramic finish, abrasion-resistant laminate top. Our laminate flooring brands allow for easy-click installation, and some include a pre-glued undersurface, moisture repellent, soundproofing, single-strip format or a handscraped textured finish. Our laminates carry wear warranties ranging from 10 to 30 years.
Moldings and Accessories.We offer a wide variety of wood flooring moldings and accessories. Moldings are a required finishing detail to every floor and we sell a complete selection that matches virtually all of our floors or can complement them. We also sell stair treads and risers in both finished and unfinished versions. Accessories include sealers, adhesives and underlayments that are placed between the new floor and the sub-floor, insulating sound and cushioning the floors. In addition, we sell flooring tools, floor cleaning supplies and butcher-block kitchen countertops.
Bamboo, Cork and Resilient.Our proprietary bamboo products, harvested from the fast growing bamboo plant, are offered as a prefinished, natural or stained, solid or engineered floor. Our proprietary cork flooring is produced by harvesting the outer bark of the cork oak tree, and it is durable, acoustical and acts as an insulator. Produced from recycled materials, our resilient flooring planks come in realistic wood and tile looks, are water-resistant, highly durable and install with “peel-and-stick” or click-together ease. Our bamboo, cork and resilient flooring products carry wear warranties ranging from 10 to 50 years.
Our Employees
As of December 31, 2012, we had 1,420 employees, 96% of whom were full-time and none of whom were represented by a union. Of these employees, 70% work in our stores, 17% work in corporate store support infrastructure or similar functions (including our call center employees) and 13% work either on our finishing line or in our distribution centers. We believe that we have good relations with our employees.
Seasonality and Quarterly Results
Our quarterly results of operations fluctuate depending on the timing of our advertising expenses and the timing of, and income contributed by, our new stores. Our net sales also fluctuate slightly as a result of seasonal factors. We experience slightly higher net sales in spring and fall, when more home remodeling activities are taking place, and slightly lower net sales in holiday periods and during the hottest summer months. These seasonal fluctuations, however, are minimized to some extent by our national presence, as markets experience different seasonal characteristics.
Intellectual Property and Trademarks
We have a number of marks registered in the United States, including Lumber Liquidators®, Bellawood®, 1-800-HARDWOOD®, 1-800-FLOORING®, Dura-Wood®, Quickclic®, Virginia Mill Works Co. Hand Scraped and Distressed Floors®, Morning Star Bamboo Flooring®, Dream Home Laminate Floors®, Builder’s Pride®, Schön Engineered Floors®, Casa de Colour Collection® and other product line names. We have also registered certain marks in jurisdictions outside the United States, including the European Union, Canada, China, Australia and Japan. We regard our intellectual property as having significant value and these names are an important factor in the marketing of our brands. Accordingly, we take steps intended to protect our intellectual property including, where necessary, the filing of lawsuits and administrative actions to enforce our rights. We are not aware of any facts that could be expected to have a material adverse effect on our intellectual property.
Government Regulation
We are subject to extensive and varied federal, provincial, state and local government regulation in the jurisdictions in which we operate, including laws and regulations relating to our relationships with our employees, public health and safety, zoning and fire codes. We operate each of our stores, offices, finishing facility and distribution centers in accordance with standards and procedures designed to comply with applicable laws, codes and regulations.
Our operations and properties are also subject to federal, provincial, state and local laws and regulations relating to the use, storage, handling, generation, transportation, treatment, emission, release, discharge and disposal of hazardous materials, substances and wastes and relating to the investigation and cleanup of contaminated properties, including off-site disposal locations. We do not incur significant costs complying with environmental laws and regulations. However, we could be subject to material costs, liabilities or claims relating to environmental compliance in the future, especially in the event of changes in existing laws and regulations or in their interpretation.
Our suppliers are subject to the laws and regulations of their home countries, including in particular laws regulating labor, forestry and the environment. We consult with our suppliers as appropriate to ensure that they are in compliance with their applicable home country laws. We also support social and environmental responsibility among our supplier community and our suppliers agree to comply with our expectations concerning environmental, labor and health and safety matters. Those expectations include representations and warranties that our suppliers comply with the laws, rules and regulations of the countries in which they operate.
Products that we import into the United States and Canada are subject to laws and regulations imposed in conjunction with such importation, including those issued and/or enforced by U.S. Customs and Border Protection and the Canadian Border Services Agency. In addition, certain of our products are subject to laws and regulations relating to the importation, acquisition or sale of illegally harvested plants and plant products and the emissions of hazardous materials. We work closely with our suppliers to ensure compliance with the applicable laws and regulations in these areas.
We believe that we currently conduct, and in the past have conducted, our activities and operations in substantial compliance with applicable laws and regulations relating to the environment and protection of natural resources, and believe that any costs arising from such laws and regulations will not have a material adverse effect on our financial condition or results of operations. However, there can be no assurance that such laws will not become more stringent in the future or that we will not incur costs in the future in order to comply with such laws.
Available Information
We maintain a website at www.lumberliquidators.com. The information on or available through our website is not, and should not be considered, a part of this report. You may access our annual reports on Form 10-K, quarterly reports on Form 10-Q, current reports on Form 8-K and amendments to those reports, as well as other reports relating to us that are filed with or furnished to the Securities and Exchange Commission (“SEC”) free of charge at our website as soon as reasonably practicable after such material is electronically filed with, or furnished to, the SEC. In addition, you may read and copy any materials we file with the SEC at the SEC’s Public Reference Room at 100 F Street, NE, Washington, DC 20549. Information on the operation of the Public Reference Room may be obtained by calling the SEC at 1-800-SEC-0330. The SEC also maintains an Internet site, www.sec.gov, which contains reports, proxy and information statements, and other information that we file electronically with the SEC.
The risks described below could materially and adversely affect our business, results of operations, financial condition and cash flows. These risks are not the only risks that we face. Our business operations could also be affected by additional factors that apply to all companies operating in the United States and globally, as well as other risks that are not presently known to us or that we currently consider to be immaterial.
Risks Related to Economic Factors and Our Industry
Changes in economic conditions may adversely impact demand for our products, reduce access to credit and cause our customers and others with which we do business to suffer financial hardship, all of which could adversely impact our business, results of operations and financial condition.
Our business, financial condition and results of operations have and may continue to be affected by various economic factors. Changes in the current economic environment and uncertainty about the future could lead to reduced consumer and business spending, including by our customers. Such changes may also cause customers to shift their spending to products we either do not sell or do not sell as profitably. Further, a reduced access to credit may adversely affect the ability of consumers to purchase our products. This potential reduction in access to credit may include our ability to offer customers credit card financing through third-party credit providers on terms similar to those offered previously, or at all. In addition, economic conditions, including decreased access to credit, may result in financial difficulties leading to restructurings, bankruptcies, liquidations and other unfavorable events for our customers, suppliers and other service providers. If such conditions deteriorate, our industry, business and results of operations may be severely impacted.
The hardwood flooring industry depends on the economy, home remodeling activity, the homebuilding industry and other important factors.
The hardwood flooring industry is highly dependent on the remodeling of existing homes and new home construction. In turn, remodeling and new home construction depend on a number of factors which are beyond our control, including interest rates, tax policy, employment levels, consumer confidence, credit availability, real estate prices, demographic trends, weather conditions, natural disasters and general economic conditions. For example, discretionary consumer spending could be limited, spending on remodeling of existing homes could be reduced and purchases of new homes could decline if:
the national economy or any regional or local economy where we operate weakens;
interest rates rise;
credit becomes less available;
tax rates and health care costs increase;
regions where we operate experience unfavorable demographic trends;
fuel costs or utility expenses increase; or
home prices depreciate.
Any one or a combination of these factors could result in decreased demand for hardwood flooring, in remodeled and new homes, which would harm our business and operating results.
Competition could cause price declines, decrease demand for our products and decrease our market share.
We operate in the wood flooring industry, which is highly fragmented and competitive. We face significant competition from national and regional home improvement chains, national and regional specialty flooring chains, Internet-based companies and privately-owned single-site enterprises. We compete on the basis of price, customer service, store location and range, quality and availability of hardwood flooring we offer our customers. Our competitive position is also influenced by the availability, quality and cost of merchandise, labor costs, finishing, distribution and sales efficiencies and our productivity compared to that of our competitors. As we expand into new and unfamiliar markets, we may face different competitive environments than in the past. Likewise, as we continue to enhance and develop our product offerings, we may experience new competitive conditions.
Some of our competitors are larger organizations, have existed longer, are more diversified in the products they offer and have a more established market presence with substantially greater financial, marketing, personnel and other resources than we have. In addition, our competitors may forecast market developments more accurately than we do, develop products that are superior to ours or produce similar products at a lower cost, or adapt more quickly to new technologies or evolving customer requirements than we do. Intense competitive pressures from one or more of our competitors could cause price declines, decrease demand for our products and decrease our market share.
Hardwood flooring may become less popular as compared to other types of floor coverings in the future. For example, our products are made using various hardwood species, including rare exotic hardwood species, and concern over the environmental impact of tree harvesting could shift consumer preference towards synthetic or inorganic flooring. In addition, hardwood flooring competes against carpet, vinyl sheet, vinyl tile, ceramic tile, natural stone and other types of floor coverings. If consumer preferences shift toward types of floor coverings other than hardwood flooring, we may experience decreased demand for our products.
All of these competitive factors may harm us and reduce our net sales and operating results.
Risks Related to Our Suppliers, Products and Product Sourcing
Our ability to obtain products from abroad and the operations of many of our international suppliers are subject to risks that are beyond our control and that could harm our operations.
We rely on a select group of international suppliers to provide us with flooring products that meet our specifications. In 2012, approximately 43% of our product was sourced from Asia, approximately 6% was sourced from South America and approximately 1% was sourced from other locations outside of North America. As a result, we are subject to risks associated with obtaining products from abroad, including:
political unrest, terrorism and economic instability resulting in the disruption of trade from foreign countries where our products originate;
currency exchange fluctuations;
the imposition of new laws and regulations, including those relating to environmental matters and climate change issues; labor conditions; quality and safety standards; trade restrictions; and restrictions on funds transfers;
the imposition of new or different duties (including antidumping and countervailing duties), tariffs, taxes and/or other charges on exports or imports, including as a result of errors in the classification of products upon entry;
disruptions or delays in production, shipments, delivery or processing through ports of entry; and
changes in local economic conditions in countries where our suppliers are located.
These and other factors beyond our control could disrupt the ability of our suppliers to ship certain products to us cost-effectively or at all, which could harm our operations.
Our ability to offer hardwood flooring, particularly products made of more exotic species, depends on the continued availability of sufficient suitable hardwood.
Our business strategy depends on offering a wide assortment of hardwood flooring to our customers. We sell flooring made from species ranging from domestic maple, oak and pine to imported cherry, koa, mahogany and teak. Some of these species are scarce, and we cannot be assured of their continued availability. Our ability to obtain an adequate volume and quality of hard-to-find species depends on our suppliers’ ability to furnish those species, which, in turn, could be affected by many things including events such as forest fires, insect infestation, tree diseases, prolonged drought and other adverse weather and climate conditions. Government regulations relating to forest management practices also affect our suppliers’ ability to harvest or export timber, and changes to regulations and forest management policies, or the implementation of new laws or regulations, could impede their ability to do so. If our suppliers cannot deliver sufficient hardwood and we cannot find replacement suppliers, our net sales and operating results may be negatively impacted.
Our dependence on certain suppliers makes us vulnerable to the extent we rely on them.
We rely on a concentrated number of suppliers for the majority of our supply needs. We generally do not have long-term contracts with our suppliers, and we typically obtain our hardwood supplies on an order-by-order basis, writing orders for future deliveries from 90 to 180 days before delivery. In the future, our suppliers may be unable to supply us, or supply us on acceptable terms, due to various factors, which could include political instability in the supplier’s country, a supplier’s financial instability, inability or refusal to comply with applicable laws, trade restrictions or tariffs, duties, insufficient transport capacity and other factors beyond our control. If we can no longer obtain merchandise from our major suppliers, or they refuse to continue to supply us on commercially reasonable terms or at all, and we cannot find replacement suppliers, we could experience deterioration in our net sales and operating results.
If we fail to identify and develop relationships with a sufficient number of qualified suppliers, our ability to obtain products that meet our high quality standards could be harmed.
We purchase flooring directly from mills located around the world. We believe that these direct supplier relationships are relatively unique in our industry. In order to retain the competitive advantage that we believe results from these relationships, we need to continue to identify, develop and maintain relationships with qualified suppliers that can satisfy our high standards for quality and our requirements for hardwood in a timely and efficient manner. The need to develop new relationships will be particularly important as we seek to expand our operations and enhance our product offerings in the future. Any inability to do so could reduce our competitiveness, slow our plans for further expansion and cause our net sales and operating results to deteriorate. Moreover, the failure of our suppliers to adhere to the quality standards that we set for our products could lead to litigation and recalls, which could damage our reputation and our brands, increase our costs, and otherwise hurt our business.
If our suppliers do not use ethical business practices, comply with applicable laws and regulations and ensure that their products meet our quality standards, our reputation could be harmed due to negative publicity and we could be subject to legal risk.
While our suppliers agree to operate in compliance with applicable laws and regulations, including those relating to environmental and labor practices, we do not control our suppliers. Accordingly, we cannot guarantee that they comply with such laws and regulations or operate in a legal, ethical and responsible manner. Violation of environmental, labor or other laws by our suppliers or their failure to operate in a legal, ethical and responsible manner, could reduce demand for our products if, as a result of such violation or failure, we were to attract negative publicity. Further, such conduct could expose us to legal risks as a result of our purchase of product from non-compliant suppliers.
Increased hardwood costs could harm our results of operations.
The cost of the various species of hardwood that are used in our products is important to our profitability. Hardwood lumber costs fluctuate as a result of a number of factors including changes in domestic and international supply and demand, labor costs, competition, market speculation, product availability, environmental restrictions, government regulation and trade policies, duties, weather conditions, processing and freight costs, and delivery delays and disruptions. We generally do not have long-term supply contracts or guaranteed purchase amounts. As a result, we may not be able to anticipate or react to changing hardwood costs by adjusting our purchasing practices, and we may not always be able to increase the selling prices of our products in response to increases in supply costs. If we cannot address changing hardwood costs appropriately, it could cause our operating results to deteriorate.
Product liability claims could adversely affect our net sales, profitability and reputation.
We face an inherent risk of exposure to product liability claims in the event that the use of our products is alleged to have resulted in personal injury or property damage. In the event that any of our products proves to be defective, we may be required to recall or redesign such products. Further, in such instances, we may be subject to legal action. We maintain insurance against some forms of product liability claims, but such coverage may not be adequate for liabilities actually incurred. A successful claim brought against us in excess of available insurance coverage, or any claim or product recall that results in significant adverse publicity against us, may have a material adverse effect on our net sales and operating results.
We may not be able to successfully anticipate consumer trends and our failure to do so may adversely impact our net sales and profitability.
As part of our business proposition, it is important for us to anticipate and respond to changing preferences and consumer demands in a timely manner. If we fail to identify and respond to emerging trends, consumer acceptance of the merchandise in our stores and our image with our customers may be harmed, which could reduce customer traffic in our stores and adversely affect our net sales. Moreover, consumer demand within our mix of products may shift and such change may negatively impact our net sales and operating results.
Risks Related to Our Operations
Increasing our net sales and profitability depends substantially on our ability to open new stores and is subject to many unpredictable factors.
As of December 31, 2012, we had 288 stores throughout the United States and Canada, 172 of which we opened after January 1, 2008. We plan to open a significant number of new stores during each of the next several years. This growth strategy and the investment associated with the development of each new store may cause our operating results to fluctuate and be unpredictable or decrease our profits. Our future results will depend on various factors, including the following:
the successful selection of new markets and store locations;
the implementation of and results generated by our new showroom format;
our ability to negotiate leases on acceptable terms;
management of store opening costs;
the quality of our operations;
consumer recognition of the quality of our products;
our ability to meet customer demand;
the continued popularity of hardwood flooring; and
general economic conditions.
In addition, the following may impact the net sales and performance of our new stores compared to prior years:
as we open more stores, our rate of expansion relative to the size of our store base will decline;
we may not be able to identify suitable store locations in markets into which we seek to expand and may not be able to open as many stores as planned;
consumers in new markets may be less familiar with our brands, and we may need to increase brand awareness in those markets through additional investments in advertising;
new stores may have higher construction, occupancy or operating costs, or may have lower average store net sales, than stores opened in the past;
we may incur higher maintenance costs than in the past;
newly opened stores may not succeed or may reach profitability more slowly than we expect, and the ramp-up to profitability may become longer in the future as we enter more mid-sized and smaller markets and add stores to larger markets where we already have a presence; and
future markets and stores may not be successful and, even if we are successful, our average store net sales and our comparable store net sales may not increase at historical rates.
Finally, our progress in opening new stores from quarter to quarter may occur at an uneven rate, which may result in quarterly net sales and profit growth falling short of market expectations in some periods.
Our net sales and profit growth could be adversely affected if comparable store net sales are less than we expect.
While future net sales growth will depend substantially on our plans for new store openings, the level of comparable store net sales (which represent the change in period-over-period net sales for stores beginning their thirteenth full month of operation) will also affect our sales growth and business results. Among other things, increases in our baseline store volumes and the number of new stores opened in existing markets, which tend to open at a higher base level of net sales, will impact our comparable store net sales. As a result, it is possible that we will not achieve our targeted comparable store net sales growth or that the change in comparable store net sales could be negative. If this were to happen, net sales and profit growth would be adversely affected.
Increased transportation costs, particularly those relating to the cost of fuel, could harm our results of operations.
The efficient transportation of our products through our supply chain is a critical component of our operations. If the cost of fuel or other costs, such as import tariffs, duties and international container rates, rise, it could result in increases in our cost of sales due to additional transportation charges and in the fees delivery companies charge us to transport our products to our stores and customers. We may be unable to increase the price of our products to offset increased transportation charges, which could cause our operating results to deteriorate.
Damage, destruction or disruption of our Toano or Hampton Roads facilities could significantly impact our operations and impede our ability to finish and distribute our products.
Our Toano facility serves as our corporate headquarters and, among other things, houses our primary computer systems, which control our management information and inventory management systems. In addition, we currently finish approximately 92% of all Bellawood products, as well as small quantities of certain other products, there. In 2012, Bellawood flooring accounted for approximately 13% of our net sales. Further, the Toano facility, along with our facilities in Hampton Roads, serves as our distribution centers. If the Toano facility, the Hampton Roads facilities or our inventory held in those locations were damaged or destroyed by fire, wood infestation or other causes, our entire finishing and/or distribution processes would be disrupted, which could cause significant lost production and delays in delivery. This could impede our ability to stock our stores and deliver products to our customers, and cause our net sales and operating results to deteriorate.
Federal, provincial, state or local laws and regulations, or our failure to comply with such laws and regulations, could increase our expenses, restrict our ability to conduct our business and expose us to legal risks.
We are subject to a wide range of general and industry-specific laws and regulations imposed by federal, provincial, state and local authorities in the countries in which we operate including those related to customs, foreign operations (such as the Foreign Corrupt Practices Act), truth-in-advertising, consumer protection, privacy, zoning and occupancy matters as well as the operation of retail stores and warehouse, production and distribution facilities. In addition, various federal, provincial and state laws govern our relationship with and other matters pertaining to our employees, including wage and hour laws, requirements to provide meal and rest periods or other benefits, family leave mandates, requirements regarding working conditions and accommodations to certain employees, citizenship or work authorization and related requirements, insurance and workers’ compensation rules and anti-discrimination laws. If we fail to comply with these laws and regulations, we could be subject to legal risk, our operations could be impacted negatively and our reputation could be damaged. Likewise, if such laws and regulations should change, our costs of compliance may increase, thereby impacting our results and hurting our profitability.
Certain portions of our operations are subject to laws and regulations governing the use, storage, handling, generation, treatment, emission, release, discharge and disposal of certain hazardous materials and wastes, the remediation of contaminated soil and groundwater and the health and safety of employees. If we are unable to extend or renew a material approval, license or permit required by such laws, or if there is a delay in renewing any material approval, license or permit, that may cause our net sales and operating results to deteriorate or otherwise harm our business.
With regard to our products, we may spend significant time and resources to ensure compliance with applicable advertising, importation, exportation, environmental, health and safety laws and regulations. If we should violate these laws and regulations, we could experience delays in shipments of our goods, be subject to fines or penalties, be liable for costs and damages, or suffer reputational harm, which could reduce demand for our merchandise and hurt our business and results of operations. Further, if such laws and regulations should change, we may experience increased costs or incur decreased efficiency in order to adhere to the new standards.
The operation of stores in Canada may present increased risks due to our limited experience with that market.
We opened our first stores in Canada in 2011 and currently operate nine store locations there. As a result of our limited experience in the Canadian market, these stores may be less successful than we expect. Additionally, greater investments in advertising and promotional activity may be required to build brand awareness in that market. Furthermore, we have limited experience with the legal and regulatory environments and market practices outside of the United States and cannot guarantee that we will be able to operate in the Canadian market in a manner and with the results similar to our U.S. stores. We may also incur increased costs in complying with applicable Canadian laws and regulations as they pertain to both our products and our operations.
The operation of our Representative Office in China may present increased legal and operational risks.
In September 2011, we acquired certain assets of Sequoia Flooring Inc. (“Sequoia”) relating to Sequoia’s quality control and assurance, product development and logistics operations in China. In connection with the transaction, we established a representative office in Shanghai, China and assumed direct control of our product sourcing in China.
Our experience with the legal and regulatory practices and requirements in China is limited. As a result, we may incur costs in complying with applicable Chinese laws and regulations that exceed our expectations. Further, if we fail to comply with applicable laws and regulations, we could be subject to legal risk.
Failure to manage our growth effectively could harm our business and operating results.
Our plans call for a significant number of new stores, and increased orders from our website, call center and catalogs. Our existing management information systems, including our store management systems and financial and management controls, may be unable to support our expansion. Managing our growth effectively will require us to continue to enhance these systems, procedures and controls and to hire, train and retain regional managers, store managers and store staff. We may not respond quickly enough to the changing demands that our expansion will impose on our management, staff and existing infrastructure. Any failure to manage our growth effectively could harm our business and operating results.
Our insurance coverage and self-insurance reserves may not cover future claims.
We maintain various insurance policies for employee health, workers’ compensation, general liability and property damage. We are self-insured on certain health insurance plans and are responsible for losses up to a certain limit for these respective plans. We continue to be responsible for losses up to a certain limit for general liability and property damage insurance. In 2013, we intend to self-insure ourselves with regard to workers’ compensation coverage, in which case we will be responsible for losses up to certain retention limits on both a per-claim and aggregate basis.
For policies under which we are responsible for losses, we record a liability that represents our estimated cost of claims incurred and unpaid as of the balance sheet date. Our estimated liability is not discounted and is based on a number of assumptions and factors, including historical trends, actuarial assumptions and economic conditions, and is closely monitored and adjusted when warranted by changing circumstances. Fluctuating healthcare costs, our significant growth rate and changes from our past experience with workers’ compensation claims could affect the accuracy of estimates based on historical experience. Should a greater amount of claims occur compared to what was estimated or medical costs increase beyond what was expected, our accrued liabilities might not be sufficient and we may be required to record additional expense. Unanticipated changes may produce materially different amounts of expense than that reported under these programs, which could adversely impact our operating results.
We have entered into a number of lease agreements with companies controlled by our founder and this concentration of leases may pose certain business risks.
As of December 31, 2012, we lease our Toano facility, which includes a store location, and 27 of our other store locations from entities owned, in whole or in part, by Tom Sullivan, our founder and current chairman of our board of directors. Although our percentage of total stores leased from such entities has decreased over the last few years, this concentration of leases subjects us to risk in the event action or inaction by Tom or such entities impacts our leasehold interests in the locations.
Risks Related to Our Information Technology
If our management information systems experience disruptions, it could disrupt our business and reduce our net sales.
We depend on our management information systems to integrate the activities of our stores, website and call center, to process orders, to respond to customer inquiries, to manage inventory, to purchase merchandise and to sell and ship goods on a timely basis. We may experience operational problems with our information systems as a result of system failures, viruses, computer “hackers” or other causes. We may incur significant expenses in order to repair any such operational problems. Any significant disruption or slowdown of our systems could cause information, including data related to customer orders, to be lost or delayed, which could result in delays in the delivery of products to our stores and customers or lost sales. Moreover, our entire corporate network, including our telephone lines, is on an Internet-based network. Accordingly, if our network is disrupted, we may experience delayed communications within our operations and between our customers and ourselves, and may not be able to communicate at all via our network, including via telephones connected to our network.
The selection and implementation of information technology initiatives may impact our operational efficiency and productivity.
In order to better manage our business, we expect to invest in our information systems. In doing so, we must select the correct investments and implement them in an efficient manner. The costs, potential problems and interruptions associated with implementing technology initiatives could disrupt or reduce the efficiency of our operations. Furthermore, these initiatives might not provide the anticipated benefits or provide them in a delayed or more costly manner. Accordingly, issues relating to our selection and implementation of information technology initiatives may negatively impact our business and operating results.
Any disruption of our website or our call center could disrupt our business and lead to reduced net sales and reputational damage.
Our website and our call center are integral parts of our integrated multi-channel strategy. Customers use our website and our call center as information sources on the range of products available to them and to order our products, samples or catalogs. Our website, in particular, is vulnerable to certain risks and uncertainties associated with the Internet, including changes in required technology interfaces, website downtime and other technical failures, security breaches and consumer privacy concerns. If we cannot successfully maintain our website and call center in good working order, it could reduce our net sales and damage our reputation. Further, the costs associated with such maintenance may exceed our estimations.
We may incur costs and losses resulting from security risks we face in connection with our electronic processing, transmission and storage of confidential customer information.
We accept electronic payment cards for payment in our stores and through our call center. In addition, our online operations depend upon the secure transmission of confidential information over public networks, including information permitting cashless payments. As a result, we may become subject to claims for purportedly fraudulent transactions arising out of the actual or alleged theft of credit or debit card information, and we may also be subject to lawsuits or other proceedings relating to these types of incidents. Further, a compromise of our security systems that results in our customers’ personal information being obtained by unauthorized persons could adversely affect our reputation with our customers and others, as well as our operations, results of operations and financial condition, and could result in litigation against us or the imposition of penalties. A security breach could also require that we expend significant additional resources related to the security of information systems and could result in a disruption of our operations, particularly our online sales operations.
Additionally, privacy and information security laws and regulations change, and compliance with them may result in cost increases due to necessary systems changes and the development of new administrative processes. If we fail to comply with these laws and regulations or experience a data security breach, our reputation could be damaged, possibly resulting in lost future business, and we could be subjected to additional legal risk as a result of non-compliance.
Risks Related to Our Personnel
Our success depends substantially upon the continued retention of certain key personnel.
We believe that our success has depended and continues to depend to a significant extent on the efforts and abilities of our senior management team. The loss, for any reason, of the services of any of these key individuals and any negative market or industry perception arising from such loss, could damage our business and harm our reputation.
Our success depends upon our ability to meet our labor needs.
Our success depends in part on our ability to attract, hire, train and retain qualified managers and staff. Buying hardwood flooring is an infrequent event, and typical consumers have very little knowledge of the range, characteristics and suitability of the products available to them before starting the purchasing process. Therefore, consumers in the hardwood flooring market expect to have sales associates serving them who are knowledgeable about the entire assortment of products offered by the retailer and the process of choosing and installing hardwood flooring. As a result, competition for qualified store managers and sales associates among flooring retailers is intense. We may not succeed in attracting and retaining the personnel we require to conduct our current operations and support our potential future growth. In addition, as we expand into new markets, we may find it more difficult to hire, motivate and retain qualified employees.
Although none of our employees are currently covered under collective bargaining agreements, we cannot guarantee that our employees will not elect to be represented by labor unions in the future. If some or all of our workforce were to become unionized and collective bargaining agreement terms were significantly different from our current compensation arrangements or work practices, it could have a material adverse effect on our business and operating results.
Risks Relating to Our Marketing and Advertising
Our success depends on the effectiveness of our advertising strategy.
We believe that our growth was achieved in part through our successful investment in local and national advertising. Historically, we have used extensive advertising to encourage customers to drive to our stores, which were typically located some distance from population centers in areas that have lower rents than traditional retail locations. Further, a significant portion of our advertising was directed at the DIY consumer. While our marketing strategy continues to support our real estate strategy and remains focused on the DIY customer, we have broadened the reach and frequency of our advertising to increase the recognition our value proposition and the number of customers served. We may need to further increase our advertising expense to support our business strategy in the future. If our advertisements fail to draw customers in the future, or if the cost of advertising or other marketing materials increases significantly, we could experience declines in our net sales and operating results.
Failure to maintain relevant product endorsement agreements and product placement arrangements could harm our reputation and cause our net sales to deteriorate.
We have established relationships with well-known and respected home improvement celebrities to evaluate, promote and help establish with consumers the high-quality nature of our products. If these individuals were to stop promoting our products, if we were unable to renew our endorsement contracts with them or if we could not find other endorsers of a similar caliber, our net sales and reputation could be harmed. Similarly, any actions that persons endorsing our products may take, whether or not associated with our products, which harm their or our reputations could also harm our brand image with consumers and our reputation, and cause our net sales to deteriorate. We also have a number of product placement arrangements with home improvement-related television shows. We rely on these arrangements to increase awareness of our brands, and to enable potential customers to see both what our flooring will look like after installation and the relative ease with which it can be installed. Any failure to continue these arrangements could cause our brands to become less well-known and cause our net sales to deteriorate.
We may not be able to adequately protect our intellectual property, which could harm the value of our brands and impact our business.
Our intellectual property is material to the conduct of our business. Our ability to implement our business plan successfully depends in part on our ability to further build brand recognition using our trademarks, service marks and other proprietary intellectual property, including our name and logo and the names and logos of our brands. We may incur significant costs and expenses relating to our efforts to enforce our intellectual property rights. If our efforts to protect our intellectual property are inadequate, or if any third party infringes on or misappropriates our intellectual property, the value of our brands may be harmed, which could adversely affect our business and might prevent our brands from achieving or maintaining market acceptance.
We may initiate claims or litigation against parties for infringement of our intellectual property rights or to establish the invalidity, noninfringement, or unenforceability of the proprietary rights of others. Likewise, we may have similar claims or litigation brought against us by competitors and others. Under either situation and regardless of any ultimate determination on the merits, we could incur significant expense and be forced to divert the efforts of key employees from our operations. Moreover, such claims or litigation could harm our image, brand or competitive position and cause us to incur significant penalties and costs.
Risks Relating to Our Common Stock
Our common stock price may be volatile and you may lose all or part of your investment.
The market price of our common stock could fluctuate significantly. Those fluctuations could be based on various factors in addition to those otherwise described in this report, including:
our operating performance and the performance of our competitors;
the public’s reaction to our press releases, our other public announcements and our filings with the SEC;
changes in earnings estimates or recommendations by research analysts who follow Lumber Liquidators or other companies in our industry;
variations in general economic conditions;
actions of our current stockholders, including sales of common stock by our directors and executive officers;
the arrival or departure of key personnel; and
other developments affecting us, our industry or our competitors.
In addition, the stock market may experience significant price and volume fluctuations. These fluctuations may be unrelated to the operating performance of particular companies but may cause declines in the market price of our common stock. The price of our common stock could fluctuate based upon factors that have little or nothing to do with our company or its performance.
Our quarterly operating results may fluctuate significantly and could fall below the expectations of research analysts and investors due to various factors.
Our quarterly operating results may fluctuate significantly because of various factors, including:
changes in comparable store net sales and customer visits, including as a result of declining consumer confidence or the introduction of new products;
the timing of new store openings and related sales and expenses;
profitability and performance of our stores;
the impact of inclement weather, natural disasters and other calamities;
variations in general economic conditions;
the timing and scope of sales promotions and product introductions;
changes in consumer preferences and discretionary spending;
fluctuations in supply prices; and
tax expenses, impairment charges and other non-operating costs.
Due to these factors, results for any one quarter are not necessarily indicative of results to be expected for any other quarter or for any year. Average store net sales or comparable store net sales in any particular future period may decrease. In the future, operating results may fall below the expectations of research analysts and investors, which could cause the price of our common stock to fall.
Tom Sullivan has the ability to exercise influence over us and his interests in our business may be different than yours.
At December 31, 2012, Tom controlled approximately 3% of our outstanding common stock. Accordingly, he is able to exercise influence over our business policies and affairs and all matters requiring a stockholders’ vote. Tom’s interests may conflict with yours, and he may seek to cause us to take courses of action that, in his judgment, could enhance his investment in us, but which might involve risks to holders of our common stock or be harmful to our business or other investors. In addition, the timing and volume of any transactions involving our common stock by Tom may, among other things, cause fluctuations in the price of our common stock.
Our anti-takeover defense provisions may cause our common stock to trade at market prices lower than it might absent such provisions.
Our certificate of incorporation and bylaws contain several provisions that may make it more difficult or expensive for a third party to acquire control of us without the approval of our board of directors. These provisions include a staggered board, the availability of “blank check” preferred stock, provisions restricting stockholders from calling a special meeting of stockholders or requiring one to be called or from taking action by written consent and provisions that set forth advance notice procedures for stockholders’ nominations of directors and proposals of topics for consideration at meetings of stockholders. Our certificate of incorporation also provides that Section 203 of the Delaware General Corporation Law, which relates to business combinations with interested stockholders, applies to us. These provisions may delay, prevent or deter a merger, acquisition, tender offer, proxy contest or other transaction that might otherwise result in our stockholders receiving a premium over the market price for their common stock. In addition, these provisions may cause our common stock to trade at a market price lower than it might absent such provisions.
Risk Related to Accounting Standards
Changes in accounting standards and subjective assumptions, estimates and judgments by management related to complex accounting matters could significantly affect our financial results.
Generally accepted accounting principles and related accounting pronouncements, implementation guidelines and interpretations with regard to a wide range of matters that are relevant to our business, including but not limited to, revenue recognition, stock-based compensation, lease accounting, sales returns reserves, inventories, self-insurance, income taxes, unclaimed property laws and litigation, are highly complex and involve many subjective assumptions, estimates and judgments by our management. Changes in these rules or their interpretation or changes in underlying assumptions, estimates or judgments by our management could significantly change our reported or expected financial performance.
Item 1B. Unresolved Staff Comments.
None.
As of February 18, 2013, we operated 291 stores located in 46 states and Canada, including three opened since December 31, 2012. In addition to our nine stores in Ontario, Canada, the table below sets forth the locations (alphabetically by state) of our 282 U.S. stores in operation as of February 18, 2013.
State | Stores | State | Stores | State | Stores | State | Stores | |||||||
Alabama | 5 | Iowa | 3 | Nevada | 2 | Rhode Island | 1 | |||||||
Arizona | 5 | Kansas | 3 | New Hampshire | 4 | South Carolina | 4 | |||||||
Arkansas | 2 | Kentucky | 4 | New Jersey | 8 | South Dakota | 1 | |||||||
California | 27 | Louisiana | 5 | New Mexico | 1 | Tennessee | 6 | |||||||
Colorado | 6 | Maine | 3 | New York | 15 | Texas | 22 | |||||||
Connecticut | 5 | Maryland | 5 | North Carolina | 10 | Utah | 2 | |||||||
Delaware | 3 | Massachusetts | 7 | North Dakota | 1 | Vermont | 1 | |||||||
Florida | 19 | Michigan | 8 | Ohio | 10 | Virginia | 11 | |||||||
Georgia | 9 | Minnesota | 5 | Oklahoma | 2 | Washington | 7 | |||||||
Idaho | 2 | Mississippi | 2 | Oregon | 2 | West Virginia | 3 | |||||||
Illinois | 11 | Missouri | 5 | Pennsylvania | 13 | Wisconsin | 4 | |||||||
Indiana | 6 | Nebraska | 2 |
We lease all of our stores and our corporate headquarters located in Toano, Virginia, which includes our call center, corporate offices, and distribution and finishing facility. Our corporate headquarters has 307,784 square feet, of which approximately 32,000 square feet are office space, and is located on a 74-acre plot. In addition, we lease 603,661 square feet near the port in the Hampton Roads area in Virginia as our primary distribution facilities.
As of February 18, 2013, 28 of our store locations are leased from related parties. See discussion of properties leased from related parties in Note 6 to the consolidated financial statements included in Item 8 of this report and within Certain Relationships and Related Transactions, and Director Independence in Item 13 of this report.
On May 21, 2012, Harbor Freight Tools USA, Inc. and Central Purchasing, LLC (together, the “Plaintiffs”) filed an action, which was subsequently amended, in the Superior Court for the County of Los Angeles, California against us and certain purported employees of ours (the “State Court Action”). In the State Court Action, the Plaintiffs contended that they previously employed several individuals now working for us, and alleged, among other claims, the improper use and possession by us and/or our employees of trade secrets belonging to the Plaintiffs and unfair business practices. The Plaintiffs have sought unspecified monetary damages, punitive damages, injunctive, equitable and other relief.
On December 18, 2012, the Plaintiffs filed suit against us in the United States District Court for the Central District of California. In that suit, in addition to the claims raised as in the State Court Action, the Plaintiffs alleged that we violated certain of the Plaintiffs’ copyrights. The Plaintiffs have sought, among other things, a preliminary injunction precluding us from using the Plaintiffs’ purported confidential information and selling seven specific tool products. The Plaintiffs dismissed the State Court Action as it pertained to us but it remains pending as to the individual employees.
We strongly dispute the Plaintiffs’ contentions and have been litigating this matter aggressively. Nevertheless, the parties engaged in settlement processes and have reached a tentative understanding on certain matters. We cannot, however, make any assurance that this matter will ultimately settle. In the event that a settlement is not consummated, we will continue to defend this matter vigorously and believe that the ultimate outcome of the litigation will not have a material adverse effect on our results of operations, financial position or cash flows. Based upon the proceedings to date, we have recorded an accrual of approximately $0.5 million in the fourth quarter of 2012 as our best estimate of the probable loss at this time.
On August 30, 2012, Jaroslaw Prusak, a purported customer (“Prusak”), filed a putative class action lawsuit against us in the United States District Court for the Northern District of Illinois. Prusak alleges that we willfully violated the Fair and Accurate Credit Transactions Act (“FACTA”) amendment to the Fair Credit Reporting Act in connection with printed credit card receipts provided to our customers. Prusak, for himself and the putative class, seeks statutory damages of no less than
$100 and no more than $1,000 per violation, punitive damages, attorney’s fees and costs, and other relief. We intend to defend this matter vigorously. Given the uncertainty of litigation, the preliminary stage of the case and the legal standards that must be met for, among other things, class certification and success on the merits, no outcome can be predicted at this time. Based upon the current status of the matter and information available, we do not, at this time, expect the outcome of this proceeding to have a material adverse effect on our results of operations, financial position or cash flows.
We also are, from time to time, subject to claims and disputes arising in the normal course of business. In the opinion of management, while the outcome of any such claims and disputes cannot be predicted with certainty, our ultimate liability in connection with these matters is not expected to have a material adverse effect on our results of operations, financial position or cash flows.
Item 4. Mine Safety Disclosures.
None.
PART II
Market Information
Our common stock trades on the New York Stock Exchange (“NYSE”) under the trading symbol “LL.” We are authorized to issue up to 35,000,000 shares of common stock, par value $0.001. Total shares of common stock outstanding at February 18, 2013 were 27,164,204, and we had 9 stockholders of record.
The following table shows the high and low sales prices per share as reported by the NYSE for each quarter during the last two fiscal years.
| Price Range | ||||||||
| High | Low | |||||||
2012: | ||||||||
Fourth Quarter | $ | 58.04 | $ | 48.14 | ||||
Third Quarter | 53.73 | 32.49 | ||||||
Second Quarter | 33.79 | 23.47 | ||||||
First Quarter | 25.17 | 17.38 | ||||||
2011: | ||||||||
Fourth Quarter | $ | 17.80 | $ | 14.44 | ||||
Third Quarter | 26.06 | 13.87 | ||||||
Second Quarter | 26.97 | 22.40 | ||||||
First Quarter | 28.73 | 22.76 | ||||||
Issuer Purchases of Equity Securities
The following table presents our share repurchase activity for the quarter ended December 31, 2012 (dollars in thousands, except per share amounts):
Period | Total Number of Shares Purchased | Average Price Paid per Share | Total Number of Shares Purchased as Part of Publicly Announced Plans or Programs(2) | Maximum Dollar Value that May Yet Be Purchased Under the Plans or Programs(2) | ||||||||||||
October 1, 2012 to October 31, 2012 | — | $ | — | — | $ | 9,866 | ||||||||||
November 1, 2012 to November 30, 2012(1) | 61,590 | 54.23 | 58,700 | 56,681 | ||||||||||||
December 1, 2012 to December 31, 2012 | 112,500 | 51.08 | 112,500 | 50,932 | ||||||||||||
|
|
|
|
|
|
|
| |||||||||
Total | 174,090 | $ | 52.20 | 171,200 | $ | 50,932 | ||||||||||
|
|
|
|
|
|
|
| |||||||||
|
|
Dividend Policy
We have never paid any dividends on our common stock. Any future decision to pay cash dividends will be at the discretion of our board of directors and will be dependent on our results of operations, financial condition, contractual restrictions and other such factors that the board of directors considers relevant.
Securities Authorized for Issuance Under Equity Compensation Plans
See Item 12. “Security Ownership of Certain Beneficial Owners and Management and Related Stockholder Matters” for information regarding securities authorized for issuance under our equity compensation plans.
Performance Graph
The following graph compares the performance of our common stock during the period beginning December 31, 2007 through December 31, 2012, to that of the total return index for the NYSE Composite, the Dow Jones US Furnishings Index and the S&P SmallCap 600 Index (which includes Lumber Liquidators) assuming an investment of $100 on December 31, 2007. In calculating total annual stockholder return, reinvestment of dividends, if any, is assumed. The indices are included for comparative purpose only. They do not necessarily reflect management’s opinion that such indices are an appropriate measure of the relative performance of our common stock.
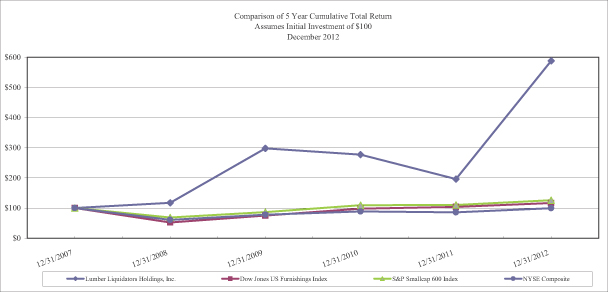
| 12/31/2007 | 12/31/2008 | 12/31/2009 | 12/31/2010 | 12/31/2011 | 12/31/2012 | |||||||||||||||||||
Lumber Liquidators Holdings, Inc. | $ | 100.00 | $ | 117.46 | $ | 298.11 | $ | 277.09 | $ | 196.44 | $ | 587.65 | ||||||||||||
NYSE Composite | $ | 100.00 | $ | 60.86 | $ | 78.24 | $ | 88.91 | $ | 85.62 | $ | 99.46 | ||||||||||||
Dow Jones US Furnishings Index | $ | 100.00 | $ | 52.16 | $ | 74.89 | $ | 98.15 | $ | 103.59 | $ | 116.82 | ||||||||||||
S&P Smallcap 600 Index | $ | 100.00 | $ | 68.93 | $ | 86.55 | $ | 109.33 | $ | 110.44 | $ | 126.00 | ||||||||||||
Item 6. Selected Financial Data.
The selected statements of income data for the years ended December 31, 2012, 2011 and 2010 and the balance sheet data as of December 31, 2012 and 2011 have been derived from our audited consolidated financial statements included in Item 8. “Consolidated Financial Statements and Supplementary Data” of this report. This information should be read in conjunction with those audited financial statements, the notes thereto, and Item 7. “Management’s Discussion and Analysis of Financial Condition and Results of Operations” of this report.
We reorganized effective December 31, 2009 to create a new holding company structure. As a result, a new parent company named Lumber Liquidators Holdings, Inc. was formed. Outstanding shares of the common stock of the former parent company, which was named Lumber Liquidators, Inc., were automatically converted, on a share for share basis, into identical shares of common stock of the new holding company. We operate as a single segment.
The selected balance sheet data set forth below as of December 31, 2010, 2009 and 2008, and income data for the years ended December 31, 2009 and 2008 are derived from our audited consolidated financial statements contained in reports previously filed with the SEC, not included herein. Our historical results are not necessarily indicative of our results for any future period.
| Year Ended December 31, | ||||||||||||||||||||
| 2012 | 2011 | 2010 | 2009 | 2008 | ||||||||||||||||
| (dollars in thousands, except per share amounts) | ||||||||||||||||||||
Statement of Income Data | ||||||||||||||||||||
Net sales | $ | 813,327 | $ | 681,587 | $ | 620,281 | $ | 544,568 | $ | 482,179 | ||||||||||
Comparable store net sales increase (decrease)(1) | 11.4 | % | (2.0 | %) | 2.1 | % | 0.0 | % | 1.6 | % | ||||||||||
Cost of sales | 504,542 | 440,912 | 404,451 | 349,891 | 314,501 | |||||||||||||||
|
|
|
|
|
|
|
|
|
| |||||||||||
Gross profit | 308,785 | 240,675 | 215,830 | 194,677 | 167,678 | |||||||||||||||
Selling, general and administrative expenses | 230,439 | 198,237 | 173,667 | 151,070 | 130,693 | |||||||||||||||
|
|
|
|
|
|
|
|
|
| |||||||||||
Operating income | 78,346 | 42,438 | 42,163 | 43,607 | 36,985 | |||||||||||||||
Interest expense | — | — | — | 2 | 27 | |||||||||||||||
Other (income) expense(2) | (140 | ) | (587 | ) | (579 | ) | (500 | ) | (834 | ) | ||||||||||
|
|
|
|
|
|
|
|
|
| |||||||||||
Income before income taxes | 78,486 | 43,025 | 42,742 | 44,105 | 37,792 | |||||||||||||||
Provision for income taxes | 31,422 | 16,769 | 16,476 | 17,181 | 15,643 | |||||||||||||||
|
|
|
|
|
|
|
|
|
| |||||||||||
Net income | $ | 47,064 | $ | 26,256 | $ | 26,266 | $ | 26,924 | $ | 22,149 | ||||||||||
|
|
|
|
|
|
|
|
|
| |||||||||||
Net income per common share: | ||||||||||||||||||||
Basic | $ | 1.71 | $ | 0.95 | $ | 0.96 | $ | 1.00 | $ | 0.83 | ||||||||||
Diluted | $ | 1.68 | $ | 0.93 | $ | 0.93 | $ | 0.97 | $ | 0.82 | ||||||||||
Weighted average common shares outstanding: | ||||||||||||||||||||
Basic | 27,448,333 | 27,706,629 | 27,384,095 | 26,983,689 | 26,772,288 | |||||||||||||||
Diluted | 28,031,453 | 28,379,693 | 28,246,453 | 27,684,547 | 27,090,593 | |||||||||||||||
|
|
| As of December 31, | ||||||||||||||||||||
| 2012 | 2011 | 2010 | 2009 | 2008 | ||||||||||||||||
| (dollars in thousands, except average sale data) | ||||||||||||||||||||
Balance Sheet Data | ||||||||||||||||||||
Cash and cash equivalents | $ | 64,167 | $ | 61,675 | $ | 34,830 | $ | 35,675 | $ | 35,139 | ||||||||||
Merchandise inventories | 206,704 | 164,139 | 155,131 | 133,342 | 88,731 | |||||||||||||||
Total assets | 347,387 | 294,854 | 242,290 | 205,880 | 152,405 | |||||||||||||||
Customer deposits and store credits | 25,747 | 18,120 | 12,039 | 9,805 | 10,418 | |||||||||||||||
Total debt and capital lease obligations, including current maturities | — | — | — | — | — | |||||||||||||||
Total stockholders’ equity | 234,541 | 215,084 | 180,505 | 148,434 | 114,397 | |||||||||||||||
Working capital(1) | 187,118 | 167,248 | 146,118 | 124,100 | 96,245 | |||||||||||||||
Other Data | ||||||||||||||||||||
Total stores in operation | 288 | 263 | 223 | 186 | 150 | |||||||||||||||
Average sale(2) | $ | 1,600 | $ | 1,560 | $ | 1,520 | $ | 1,560 | $ | 1,750 | ||||||||||
|
|
Item 7. Management’s Discussion and Analysis of Financial Condition and Results of Operations.
Overview and Trends
Lumber Liquidators is the largest specialty retailer of hardwood flooring in North America. We believe we have achieved a reputation for offering great value, superior service and a broad selection of high-quality hardwood flooring products. We offer an extensive selection of premium hardwood flooring products under multiple proprietary brands at low prices designed to appeal to a diverse customer base. We believe that our vertically integrated business model enables us to offer a broad assortment of high-quality products to our customers at a lower cost than our competitors. At December 31, 2012, we sold our products through 288 Lumber Liquidators stores in 46 states in the U.S. and in Canada, a call center, websites and catalogs.
In 2012, we implemented, or continued the implementation of, certain key, multi-year strategic initiatives to enhance our value proposition to the customer and improve our operating margin, including:
|
|
|
In 2013, we will continue to reinvest a portion of the benefits from these multi-year initiatives into the growth of our core business, driving annual operating income increases. We expect to aggressively broaden the reach and frequency of our advertising, and as a result, that expense may increase proportionate to, or even greater than, the net sales increase. We also intend to continue to implement both our sourcing initiatives and efforts to optimize our supply chain in 2013. Together, we believe gross margin will continue to expand in the future, though the incremental increase in 2013 is likely to be less than the increase in 2012. Our culture is focused on identifying and rewarding superior performance. In 2013, we will adjust certain management bonuses and equity awards to strengthen retention of our best people and better align their efforts with the long-term growth of operating income. We believe the continued focus on increasing the efficiency and effectiveness of our operations will continue to drive operating margin expansion in the future, though the incremental increase in 2013 is likely to be less than the increase in 2012.
We operate primarily in the highly fragmented wood flooring market for existing homeowners. This market is dependent on home-related, large-ticket discretionary spending, which is influenced by a number of complex economic and demographic factors that may vary locally, regionally and nationally. In 2012, a number of these factors stabilized or improved, though remain at historically low levels. We believe our customer will remain cautious and price sensitive in 2013, with a number of macroeconomic risks providing uncertainty, and potentially volatile demand, even as a multi-year recovery in home remodeling may be forming.
In 2012, we completed the initial design of an expanded store showroom to enhance the shopping experience for our customers. We refer to this showroom, coupled with an improved store warehouse design, as our “store of the future.” We expect a store of the future showroom to average 1,600 square feet versus the 1,000 to 1,200 square feet previously targeted, yet with a more efficient warehouse and inventory plan to allow the targeted total location to remain at 6,000 to 7,000 square feet. The assortment of flooring options presented will expand, grouped by product category, displayed within color palate and in a good-better-best format. The assortment of accessories displayed will expand dramatically. In 2013, we expect our 25 to 35 new store locations to be store of the future format, though the majority of the new locations will open after May 1st. We expect capital expenditures of approximately $200,000 for each new store location, and merchandise inventory levels carried in the store to increase approximately 10%. In addition to the new stores, we expect to remodel 20 to 25 existing stores, either in their current location or relocated within the primary trade area.
Expansion of our store base continues to be an important driver of our growth, and we now believe the U.S. market will support at least 600 store locations. In determining this location count, we coordinated efforts with certain third-party experts in considering available market share, demographic drivers and certain store level, or “four-wall,” economics. We expect the success of our multi-year strategic initiatives to continue to benefit key four-wall financial metrics, including operating income and return on invested capital. In addition, we believe our market, and therefore, our available share, will expand over the next three to five years. We expect four-wall financial metrics similar to our historical store model, adjusted for market size.
In February of 2012, our Board of Directors authorized the repurchase of up to $50.0 million of our common stock, and in November of 2012, authorized the repurchase of up to an additional $50.0 million. This stock repurchase program marks an important step in returning value to our shareholders, and expresses confidence in our proven store model. Through December 31, 2012, we had repurchased approximately 1.6 million shares of our common stock through open market purchases, using approximately $49.1 million in cash.
Results of Operations
Net Sales
| Year Ended December 31, | ||||||||||||
| 2012 | 2011 | 2010 | ||||||||||
| (dollars in thousands) | ||||||||||||
Net sales | $ | 813,327 | $ | 681,587 | $ | 620,281 | ||||||
Percentage increase | 19.3 | % | 9.9 | % | 13.9 | % | ||||||
Number of stores open at end of period | 288 | 263 | 223 | |||||||||
Number of stores opened in period | 25 | 40 | 37 | |||||||||
| Percentage increase (decrease) | ||||||||||||
Average sale1 | 2.5 | % | 2.8 | % | (2.4 | %) | ||||||
Average retail price per unit sold2 | 0.2 | % | 6.8 | % | (3.7 | %) | ||||||
Comparable Stores3: | ||||||||||||
Net sales | 11.4 | % | (2.0 | %) | 2.1 | % | ||||||
Customers invoiced4 | 8.6 | % | (4.7 | %) | 4.5 | % | ||||||
Net sales of stores operating for 13 to 36 months | 23.3 | % | 12.0 | % | 12.1 | % | ||||||
Net sales of stores operating for more than 36 months | 9.1 | % | (5.5 | %) | (1.1 | %) | ||||||
Net sales in markets with all stores comparable (no cannibalization) | 13.3 | % | 2.2 | % | 5.5 | % | ||||||
Net sales in cannibalized markets5 | 33.3 | % | 18.6 | % | 15.8 | % | ||||||
|
|
|
|
|
Net sales for 2012 increased $131.7 million, or 19.3%, over 2011 as net sales in comparable stores increased $77.2 million and net sales in non-comparable stores increased $54.5 million. Net sales for 2011 increased $61.3 million, or 9.9%, over 2010 due to an increase of $73.8 million in non-comparable store net sales which was offset by a $12.5 million decrease in comparable store net sales.
Net sales in comparable stores increased 11.4% comparing 2012 to 2011 driven by an 8.6% increase in the number of customers invoiced and a 2.5% increase in the average sale. Comparing 2011 to 2010, the 2.0% decrease in net sales at comparable stores resulted from a 4.7% decrease in the number of customers invoiced, offset by a 2.8% increase in the average sale.
The average sale over the past two years has benefited from an increase in the average retail price per unit sold. In comparing 2012 to 2011, the average sale also benefited from an increase in the volume of units sold, reversing a decrease in comparing 2011 to 2010. Key drivers of retail price and volume include:
The sales mix of moldings and accessories, which increased to 16.3% of total net sales in 2012 from 14.6% in 2011 and 13.7% in 2010. Moldings and accessories generally increase both the volume of units sold and the average retail price per unit sold.
Changes in the sales mix of flooring products and the total square footage of the project. In both 2012 and 2011, customer preference for premium products increased, particularly within certain product categories including laminates, engineered hardwood, bamboo, cork and resilient.
The number of customers invoiced in comparable stores has benefited from:
Greater recognition of our value proposition due to our efforts to expand our advertising reach and frequency, which we began in the fourth quarter of 2011.
Fewer non-comparable stores operating in existing markets. At December 31, 2012, we were operating 18 non-comparable stores in markets which included at least one comparable store, down from 24 stores at December 31, 2011 and 23 stores at December 31, 2010.
A greater number of stores in operation for 13 to 36 months, or the first two years as a comparable store, when increases in net sales are generally higher than average due primarily to greater brand awareness in the market.
In 2011, particularly in the first half of the year, we believe the number of customers invoiced decreased in comparison to 2010 due to our reduced productivity in serving customer demand and greater consumer caution with regard to large-ticket, discretionary purchases.
New store locations continue to positively impact our net sales growth. We opened 25 new locations in 2012, with approximately two-thirds of these locations in existing markets. In 2011, we opened 40 new locations in an equal split of new and existing markets. Due to the opening schedule of new store locations over the previous 24 months, the average non-comparable store operating in 2011 was more mature, as measured in months of operation, than the average non-comparable store operating in 2012, which approximated our historical average. In Canada, we had nine stores operating at December 31, 2012, up from seven at December 31, 2011.
Gross Profit and Gross Margin
| Year Ended December 31, | ||||||||||||
| 2012 | 2011 | 2010 | ||||||||||
| (dollars in thousands) | ||||||||||||
Net Sales | $ | 813,327 | $ | 681,587 | $ | 620,281 | ||||||
Cost of Sales | 504,542 | 440,912 | 404,451 | |||||||||
|
|
|
|
|
| |||||||
Gross Profit | $ | 308,785 | $ | 240,675 | $ | 215,830 | ||||||
Gross Margin | 38.0 | % | 35.3 | % | 34.8 | % | ||||||
We believe that the significant drivers of gross margin expansion and their estimated impact compared to the prior year are as follows:
| Year Ended December 31, | ||||||||||||||
Driver | Description | 2012 | 20111 | 20101 | ||||||||||
| expansion (contraction) in basis points | ||||||||||||||
Cost of Product | Cost of acquiring the products we sell from our suppliers, including the impact of our sourcing initiatives; Changes in the mix of products sold; Changes in the average retail price per unit sold. | 200 | 140 | 20 | ||||||||||
Transportation | International and domestic transportation costs, including the impact of international container rates; Customs and duty charges; Fuel and fuel surcharges; Impact of mill shipments received directly by our stores; Transportation charges from our distribution centers to our stores; Transportation charges between stores and the cost of delivery to our customers. | 40 | (60 | ) | (110 | ) | ||||||||
All Other | Investments in our quality control procedures; Warranty costs; Changes in finishing costs to produce a unit of our proprietary brands; Inventory shrink; Net costs of producing samples. | 30 | (30 | ) | — | |||||||||
|
|
|
|
|
| |||||||||
Total Change in Gross Margin from the prior year | 270 | 50 | (90 | ) | ||||||||||
|
|
|
|
|
| |||||||||
|
Cost of Product: In both 2012 and 2011, gross margin benefited from our sourcing initiatives and shifts in our sales mix. Our sourcing initiatives, originally launched in the first quarter of 2011, include vendor allowances, line reviews and increases in the percentage of product we source direct from the mill. Shifts in our sales mix benefiting gross margin in both 2012 and 2011 included increases in moldings and accessories, and increases in certain premium products, particularly in merchandise categories with a lower than average retail price point.
In September 2011, we entered into an agreement to acquire certain assets of Sequoia Floorings Inc. (“Sequoia”) relating to Sequoia’s quality control and assurance, product development, claims management and logistics operations in China. We believe our cost of product was reduced, primarily in 2012, due to both the net cost reduction of owning those services and the benefits of working directly with the mills.
Transportation: Gross margin benefited from initiatives launched in 2012 to enhance the efficiency of supply chain operations, including line reviews of significant contracts, strengthening the reliability of distribution from warehouse to store, and enhanced control over transfer and delivery costs. These benefits, which we expect to grow in 2013, were partially offset by generally higher inbound transportation costs capitalized into our unit cost and an increase in the average cost per domestic mile. In addition, 19.7% of our unit purchases in 2012 were received directly at our stores from either a mill or our Chinese consolidation center, compared to 23.0% in 2011 and 19.1% in 2010. Net transportation costs are generally lower when product is received directly by our stores.
All Other Costs: In 2011, we increased our investment in quality control, particularly in South America, and in 2012 levered and reduced the net cost of those services. Procedural discipline and enhanced coordination throughout the supply chain resulted in a reduction of unrecorded inventory shrink. Partially offsetting these benefits, greater turn within our assortment and generally higher carrying levels of inventory resulted in an increase in the reserve for obsolescence and shrink.
Operating Income and Operating Margin
| Year Ended December 31, | ||||||||||||
| 2012 | 2011 | 2010 | ||||||||||
| (dollars in thousands) | ||||||||||||
Gross Profit | $ | 308,785 | $ | 240,675 | $ | 215,830 | ||||||
SG&A Expenses | 230,439 | 198,237 | 173,667 | |||||||||
|
|
|
|
|
| |||||||
Operating Income | $ | 78,346 | $ | 42,438 | $ | 42,163 | ||||||
Operating Margin | 9.6 | % | 6.2 | % | 6.8 | % | ||||||
The following table sets forth components of our SG&A expenses for the periods indicated, as a percentage of net sales.
| Year Ended December 31, | ||||||||||||
| 2012 | 2011 | 2010 | ||||||||||
Total SG&A Expenses | 28.3 | % | 29.1 | % | 28.0 | % | ||||||
Salaries, Commissions and Benefits | 12.1 | % | 11.8 | % | 11.2 | % | ||||||
Advertising | 7.2 | % | 7.7 | % | 8.0 | % | ||||||
Occupancy | 3.8 | % | 4.0 | % | 3.6 | % | ||||||
Depreciation and Amortization | 1.2 | % | 1.2 | % | 0.9 | % | ||||||
Stock-based Compensation | 0.5 | % | 0.6 | % | 0.5 | % | ||||||
Other SG&A Expenses | 3.5 | % | 3.8 | % | 3.8 | % | ||||||
Operating income for 2012 increased $35.9 million over 2011 as the $68.1 million increase in gross profit was partially offset by a $32.2 million increase in SG&A expenses. Operating income for 2011 increased $0.3 million over 2010 as the $24.9 million increase in gross profit was almost fully offset by a $24.6 million increase in SG&A expenses. The increase in SG&A expenses included the following:
Salaries, commissions and benefits increased in 2012 primarily due to significantly higher accruals for our management bonus plan, an increase in certain benefit costs and higher commission rates earned by our store management. Salaries, commissions and benefits increased in 2011 primarily due to the growth in our store base and higher total benefit costs.
Advertising expenses decreased as a percentage of net sales in both 2012 and 2011 as we continued to both leverage our national advertising campaigns over a larger store base and reallocate our advertising to more effective media channels. Partially offsetting this benefit was increased spending to broaden our reach and frequency, beginning primarily in the fourth quarter of 2011.
Occupancy costs decreased as a percentage of net sales in 2012 primarily due to higher net sales, partially offset by store base expansion. In 2011, occupancy costs included expansion of both our store base and distribution network, including Canada.
Other SG&A expenses decreased as a percentage of net sales in 2012 primarily due to higher net sales and increased reimbursements from our primary installation partner, partially offset by higher bankcard discount rates related to certain extended-term promotional programs and the accrual of approximately $0.5 million related to a legal matter. In 2011, the benefit of higher net sales was matched by the combined increase in professional fees, primarily related to our integrated information technology solution, and an increase in bankcard discount fees, also for extended-term promotional programs.
Provision for Income Taxes
| Year Ended December 31, | ||||||||||||
| 2012 | 2011 | 2010 | ||||||||||
| (dollars in thousands) | ||||||||||||
Provision for Income Taxes | $ | 31,422 | $ | 16,769 | $ | 16,476 | ||||||
Effective Tax Rate | 40.0 | % | 39.0 | % | 38.5 | % | ||||||
The increase in the 2012 effective tax rate is due to a $1.3 million valuation allowance recorded in the fourth quarter. Our Canadian operations, which included the first stores opening in March 2011, had produced a cumulative net loss
through 2012. Management determined that the positive evidence supporting future realization of the deferred tax asset was outweighed by the more objectively verifiable negative evidence, and a full valuation allowance was recorded. During 2012, Canadian operations were profitable on an aggregate store four-wall basis, but that profitability was more than offset by the cost of management, infrastructure and administrative support. In 2013, continued maturity of the Canadian store base, and changes in both management and infrastructure, are expected to result in profitable operations, where net operating loss carryforwards may be utilized to offset taxable income. Absent the valuation allowance, the effective tax rate for 2012 would have approximated 38.5%.
The effective tax rate increase in comparing 2011 to 2010 is primarily due to foreign taxes and certain non-deductible expenses related to the Sequoia acquisition.
Net Income
| Year Ended December 31, | ||||||||||||
| 2012 | 2011 | 2010 | ||||||||||
| (dollars in thousands) | ||||||||||||
Net Income | $ | 47,064 | $ | 26,256 | $ | 26,266 | ||||||
As a percentage of net sales | 5.8 | % | 3.9 | % | 4.2 | % | ||||||
Net income for the year ended December 31, 2012 increased 79.2% over the year ended December 31, 2011, and remained flat comparing 2011 to 2010.
Liquidity and Capital Resources
Our principal liquidity and capital requirements are for capital expenditures to maintain and grow our business, working capital and general corporate purposes. In addition, we periodically use available funds to repurchase shares of our common stock under our stock repurchase program, with approximately $50.9 million remaining under our authorization of $100.0 million. Our principal sources of liquidity are $64.2 million of cash and cash equivalents at December 31, 2012, our cash flow from operations, and $50.0 million of availability under our revolving credit facility. We believe that our cash flow from operations, together with our existing liquidity sources, will be sufficient to fund our operations and anticipated capital expenditures for the foreseeable future.
In 2013, we expect capital expenditures to total between $16 million and $19 million. In addition to general capital requirements, we intend to:
open between 25 and 35 new store locations;
remodel or relocate 20 to 25 existing stores;
continue to invest in integrated information technology systems;
invest in our supply chain initiatives; and
continue to improve the effectiveness of our marketing programs.
Cash and Cash Equivalents
In 2012, cash and cash equivalents increased $2.5 million to $64.2 million. The increase of cash and cash equivalents was primarily due to $47.3 million of net cash provided by operating activities and $17.6 million of proceeds received from stock option exercises which was partially offset by the use of $49.4 million to repurchase common stock and $13.4 million for capital expenditures. In 2011, cash and cash equivalents increased $26.8 million to $61.7 million as $44.1 million of cash provided by operating activities and $4.8 million of proceeds received from stock option exercises were partially offset by the use of $17.0 million for capital expenditures and $4.7 million to acquire certain assets of Sequoia. In 2010, cash and cash equivalents decreased $0.8 million to $34.8 million primarily due to the use of $20.5 million for capital expenditures which was partially offset by $17.0 million in cash provided by operating activities and $3.1 million of proceeds received from stock option exercises.
Merchandise Inventories
Merchandise inventory is our most significant asset, and is considered either “available for sale” or “inbound in-transit,” based on whether we have physically received and inspected the products at an individual store location, in our distribution centers or in another facility where we control and monitor inspection.
Merchandise inventories and available inventory per store in operation on December 31 were as follows:
| 2012 | 2011 | 2010 | ||||||||||
| (in thousands) | ||||||||||||
Inventory—Available for Sale | $ | 168,409 | $ | 135,850 | $ | 136,179 | ||||||
Inventory—Inbound In-Transit | 38,295 | 28,289 | 18,952 | |||||||||
|
|
|
|
|
| |||||||
Total Merchandise Inventories | $ | 206,704 | $ | 164,139 | $ | 155,131 | ||||||
|
|
|
|
|
| |||||||
Available Inventory Per Store | $ | 585 | $ | 517 | $ | 611 | ||||||
|
|
|
|
|
| |||||||
Available inventory per store at December 31, 2012 was within our targeted range of $580,000 to $600,000, significantly higher than at December 31, 2011, which had been impacted by our sourcing initiatives and certain related fourth quarter steps to optimize inventory levels. During 2013, we expect seasonal builds in available inventory per store to increase our range to a high of $660,000, however, we expect to end the year between $580,000 and $600,000.
Inbound in-transit inventory generally varies due to the timing of certain international shipments, but may also be influenced by seasonal factors, including international holidays, rainy seasons and specific merchandise category planning. We planned for an earlier spring build in 2013 of certain products primarily supplied by Asian mills, thereby increasing the inbound in-transit inventory at December 31, 2012.
Cash Flows
Operating Activities.Net cash provided by operating activities was $47.3 million for 2012, $44.1 million for 2011 and $17.0 million for 2010. The $3.2 million increase in net cash comparing 2012 to 2011 is primarily due to more profitable operations which were partially offset by a larger build in merchandise inventories net of the change in accounts payable. The $27.1 million increase in net cash comparing 2011 to 2010 is due primarily to a reduction in merchandise inventories net of the change in accounts payable, customer deposits and store credits and certain other working capital items.
Investing Activities. Net cash used in investing activities was $13.4 million for 2012, $21.7 million for 2011 and $20.5 million for 2010. Net cash used in investing activities in each year included capital purchases of store fixtures, equipment and leasehold improvements for stores opened, relocated or remodeled, investment in certain equipment including our finishing line and forklifts, capital purchases related to our integrated information technology solution, routine capital purchases of computer hardware and software, and certain leasehold improvements in our Corporate Headquarters. In 2011, net cash used in investing activities included $4.7 million of cash paid for the Sequoia acquisition.
Financing Activities.Net cash used by financing activities was $31.9 million in 2012 primarily due to the use of $49.4 million to repurchase common stock, which was partially offset by proceeds received from stock option exercises. Net cash provided by financing activities was $4.5 million and $2.7 million in 2011 and 2010, respectively, primarily due to proceeds received from stock option exercises.
Revolving Credit Agreement
A revolving credit agreement (the “Revolver”) providing for borrowings up to $50.0 million is available to us through expiration on February 21, 2017. During 2012, 2011 and 2010, we did not borrow against the Revolver and at December 31, 2012 and 2011, there were no outstanding commitments under letters of credit. The Revolver is primarily available to fund inventory purchases, including the support of up to $10.0 million for letters of credit, and for general operations. The Revolver is secured by our inventory, has no mandated payment provisions and we pay a fee of 0.1% per annum, subject to adjustment based on certain financial performance criteria, on any unused portion of the Revolver. Amounts outstanding under the Revolver would be subject to an interest rate of LIBOR plus 1.125%, subject to adjustment based on certain financial performance criteria. The Revolver has certain defined covenants and restrictions, including the maintenance of certain defined financial ratios. We were in compliance with these financial covenants at December 31, 2012.
Related Party Transactions
See the discussion of related party transactions in Note 6 and Note 11 to the consolidated financial statements included in Item 8 of this report and within Certain Relationships and Related Transactions, and Director Independence in Item 13 of this report.
Contractual Commitments and Contingencies
Our significant contractual obligations and commitments as of December 31, 2012 are summarized in the following table:
| Payments Due by Period | ||||||||||||||||||||
| Total | Less Than 1 Year | 1 to 3 Years | 3 to 5 Years | 5+ Years | ||||||||||||||||
| (in thousands) | ||||||||||||||||||||
Contractual obligations | ||||||||||||||||||||
Operating lease obligations(1) | $ | 77,216 | $ | 19,130 | $ | 30,979 | $ | 18,636 | $ | 8,471 | ||||||||||
|
|
|
|
|
|
|
|
|
| |||||||||||
Total contractual obligations | $ | 77,216 | $ | 19,130 | $ | 30,979 | $ | 18,636 | $ | 8,471 | ||||||||||
|
|
|
|
|
|
|
|
|
| |||||||||||
|
Off-Balance Sheet Arrangements
We do not have any off-balance sheet arrangements or other financing activities with special-purpose entities.
Inflation
Inflationary factors such as increases in the cost of our product and overhead costs may adversely affect our operating results. Although we do not believe that inflation has had a material impact on our financial position or results of operations to date, a high rate of inflation in the future may have an adverse effect on our ability to maintain current levels of gross profit and selling, general and administrative expenses as a percentage of net sales if the selling prices of our products do not increase with these increased costs.
Critical Accounting Policies and Estimates
Critical accounting policies are those that we believe are both significant and that require us to make difficult, subjective or complex judgments, often because we need to estimate the effect of inherently uncertain matters. We base our estimates and judgments on historical experiences and various other factors that we believe to be appropriate under the circumstances. Actual results may differ from these estimates, and we might obtain different estimates if we used different assumptions or conditions. We believe the following critical accounting policies affect our more significant judgments and estimates used in the preparation of our financial statements:
Recognition of Net Sales
We recognize net sales for products purchased at the time the customer takes possession of the merchandise. We recognize service revenue, which consists primarily of freight charges for in-home delivery, when the service has been rendered. We report revenue net of sales and use taxes collected from customers and remitted to governmental taxing authorities. Net sales are reduced by an allowance for anticipated sales returns that we estimate based on historical sales trends and experience. We believe that our estimate for sales returns is an accurate reflection of future returns. Any reasonably likely changes that may occur in the assumptions underlying our allowance estimates would not be expected to have a material impact on our financial condition or operating performance. Actual sales returns did not vary materially from estimated amounts for 2012, 2011 or 2010.
In addition, customers who do not take immediate delivery of their purchases are generally required to leave a deposit of up to 50% of the retail sales amount with the balance payable when the products are delivered. These customer deposits benefit our cash flow and return on investment capital, because we receive partial payment for our customers’ purchases immediately. We record these deposits as a liability on our balance sheet under the line item “Customer Deposits and Store Credits” until the customer takes possession of the merchandise.
Merchandise Inventories
We value our merchandise inventories at the lower of merchandise cost or market value. We determine merchandise cost using the average cost method. All of the hardwood flooring we purchase from suppliers is either prefinished or unfinished, and in immediate saleable form. To the extent that we finish and box unfinished products, we include those costs
in the average unit cost of related merchandise inventory. In determining market value, we make judgments and estimates as to the market value of our products, based on factors such as historical results and current sales trends. Any reasonably likely changes that may occur in those assumptions in the future may require us to record charges for losses or obsolescence against these assets, but would not be expected to have a material impact on our financial condition or operating performance. Actual losses and obsolescence charges did not vary materially from estimated amounts for 2012, 2011 or 2010.
Stock-Based Compensation
We currently maintain a single equity incentive plan under which we may grant non-qualified stock options, restricted shares, stock appreciation rights and other equity awards to employees and non-employee directors. We recognize expense for our stock-based compensation based on the fair value of the awards that are granted. Measured compensation cost is recognized ratably over the service period of the related stock-based compensation award.
The fair value of stock options was estimated at the date of grant using the Black-Scholes-Merton valuation model. In order to determine the related stock-based compensation expense, we used the following assumptions for stock options granted during 2012:
Expected life of 6.5 years to 7.5 years;
Expected stock price volatility of 45%;
Risk-free interest rates from 1.0% to 1.6%; and
Dividends are not expected to be paid in any year.
The expected stock price volatility range is based on a combination of historical volatility of our stock price and the historical volatilities of companies included in a peer group that was selected by management whose shares or options are publicly available. The volatilities are estimated for a period of time equal to the expected term of the related option. The risk-free interest rate is based on the implied yield of U.S. Treasury zero-coupon issues with an equivalent remaining term. The expected term of the options represents the estimated period of time until exercise and is determined by considering the contractual terms, vesting schedule and expectations of future employee behavior. Had we arrived at different assumptions of stock price volatility or expected terms of our options, our stock-based compensation expense and result of operations could have been different.
New Accounting Pronouncements
In September 2011, the FASB issued guidance that revises the requirements around how entities test goodwill for impairment. The guidance allows companies to perform a qualitative assessment before calculating the fair value of the reporting unit. If entities determine, on the basis of qualitative factors, that the fair value of the reporting unit is more likely than not greater than the carrying amount, a quantitative calculation would not be needed. We adopted this guidance for our fiscal 2012 annual goodwill impairment test.
Item 7A. Quantitative and Qualitative Disclosures About Market Risk.
Interest Rate Risk.
We are exposed to interest rate risk through the investment of our cash and cash equivalents. We invest our cash in short-term investments with maturities of three months or less. Changes in interest rates affect the interest income we earn, and therefore impact our cash flows and results of operations. In addition, any future borrowings under our revolving credit agreement would be exposed to interest rate risk due to the variable rate of the facility.
We currently do not engage in any interest rate hedging activity and currently have no intention to do so in the foreseeable future. However, in the future, in an effort to mitigate losses associated with these risks, we may at times enter into derivative financial instruments, although we have not historically done so. We do not, and do not intend to, engage in the practice of trading derivative securities for profit.
Exchange Rate Risk.
The majority of our revenue, expense and capital purchasing activities are transacted in U.S. dollars. However, because a portion of our operations consists of activities outside of the U.S., we have transactions in or exposure to other currencies, including the Euro, Canadian dollar, Chinese yuan and Brazilian real.
We currently do not engage in any exchange rate hedging activity and currently have no intention to do so in the foreseeable future. However, in the future, in an effort to mitigate losses associated with these risks, we may at times engage in transactions involving various derivative instruments to hedge revenues, inventory purchases, assets and liabilities denominated in foreign currencies.
Item 8. Consolidated Financial Statements and Supplementary Data.
Report of Ernst & Young LLP, Independent Registered Public Accounting Firm
The Board of Directors and Stockholders of Lumber Liquidators Holdings, Inc.
We have audited the accompanying consolidated balance sheets of Lumber Liquidators Holdings, Inc. as of December 31, 2012 and 2011, and the related consolidated statements of income, other comprehensive income, stockholders’ equity, and cash flows for each of the three years in the period ended December 31, 2012. These financial statements are the responsibility of the Company’s management. Our responsibility is to express an opinion on these financial statements based on our audits.
We conducted our audits in accordance with the standards of the Public Company Accounting Oversight Board (United States). Those standards require that we plan and perform the audit to obtain reasonable assurance about whether the financial statements are free of material misstatement. An audit includes examining, on a test basis, evidence supporting the amounts and disclosures in the financial statements. An audit also includes assessing the accounting principles used and significant estimates made by management, as well as evaluating the overall financial statement presentation. We believe that our audits provide a reasonable basis for our opinion.
In our opinion, the financial statements referred to above present fairly, in all material respects, the consolidated financial position of Lumber Liquidators Holdings, Inc. at December 31, 2012 and 2011, and the consolidated results of its operations and its cash flows for each of the three years in the period ended December 31, 2012, in conformity with U.S. generally accepted accounting principles.
We also have audited, in accordance with the standards of the Public Company Accounting Oversight Board (United States), Lumber Liquidators Holdings, Inc.’s internal control over financial reporting as of December 31, 2012, based on criteria established in Internal Control—Integrated Framework issued by the Committee of Sponsoring Organizations of the Treadway Commission and our report dated February 20, 2013 expressed an unqualified opinion thereon.
/s/ Ernst & Young LLP
Richmond, Virginia
February 20, 2013
Report of Ernst & Young LLP, Independent Registered Public Accounting Firm, on
Internal Control over Financial Reporting
The Board of Directors and Stockholders of Lumber Liquidators Holdings, Inc.
We have audited Lumber Liquidators Holdings, Inc.’s internal control over financial reporting as of December 31, 2012, based on criteria established in Internal Control—Integrated Framework issued by the Committee of Sponsoring Organizations of the Treadway Commission (the COSO criteria). Lumber Liquidators Holdings, Inc.’s management is responsible for maintaining effective internal control over financial reporting, and for its assessment of the effectiveness of internal control over financial reporting included in the accompanying Management’s Annual Report on Internal Control over Financial Reporting. Our responsibility is to express an opinion on the Company’s internal control over financial reporting based on our audit.
We conducted our audit in accordance with the standards of the Public Company Accounting Oversight Board (United States). Those standards require that we plan and perform the audit to obtain reasonable assurance about whether effective internal control over financial reporting was maintained in all material respects. Our audit included obtaining an understanding of internal control over financial reporting, assessing the risk that a material weakness exists, testing and evaluating the design and operating effectiveness of internal control based on the assessed risk, and performing such other procedures as we considered necessary in the circumstances. We believe that our audit provides a reasonable basis for our opinion.
A company’s internal control over financial reporting is a process designed to provide reasonable assurance regarding the reliability of financial reporting and the preparation of financial statements for external purposes in accordance with generally accepted accounting principles. A company’s internal control over financial reporting includes those policies and procedures that (1) pertain to the maintenance of records that, in reasonable detail, accurately and fairly reflect the transactions and dispositions of the assets of the company; (2) provide reasonable assurance that transactions are recorded as necessary to permit preparation of financial statements in accordance with generally accepted accounting principles, and that receipts and expenditures of the company are being made only in accordance with authorizations of management and directors of the company; and (3) provide reasonable assurance regarding prevention or timely detection of unauthorized acquisition, use, or disposition of the company’s assets that could have a material effect on the financial statements.
Because of its inherent limitations, internal control over financial reporting may not prevent or detect misstatements. Also, projections of any evaluation of effectiveness to future periods are subject to the risk that controls may become inadequate because of changes in conditions, or that the degree of compliance with the policies or procedures may deteriorate.
In our opinion, Lumber Liquidators Holdings, Inc. maintained, in all material respects, effective internal control over financial reporting as of December 31, 2012, based on the COSO criteria.
We also have audited, in accordance with the standards of the Public Company Accounting Oversight Board (United States), the consolidated balance sheets of Lumber Liquidators Holdings, Inc. as of December 31, 2012 and 2011 and the related consolidated statements of income, other comprehensive income, stockholders’ equity and cash flows for each of the three years in the period ended December 31, 2012 and our report dated February 20, 2013 expressed an unqualified opinion thereon.
/s/ Ernst & Young LLP
Richmond, Virginia
February 20, 2013
Lumber Liquidators Holdings, Inc.
Consolidated Balance Sheets
(in thousands, except share data)
| December 31, | ||||||||
| 2012 | 2011 | |||||||
Assets | ||||||||
Current Assets: | ||||||||
Cash and Cash Equivalents | $ | 64,167 | $ | 61,675 | ||||
Merchandise Inventories | 206,704 | 164,139 | ||||||
Prepaid Expenses | 5,168 | 4,292 | ||||||
Other Current Assets | 12,106 | 7,863 | ||||||
|
|
|
| |||||
Total Current Assets | 288,145 | 237,969 | ||||||
Property and Equipment, net | 47,764 | 44,147 | ||||||
Goodwill | 9,693 | 9,693 | ||||||
Other Assets | 1,785 | 3,045 | ||||||
|
|
|
| |||||
Total Assets | $ | 347,387 | $ | 294,854 | ||||
|
|
|
| |||||
Liabilities and Stockholders’ Equity | ||||||||
Current Liabilities: | ||||||||
Accounts Payable | $ | 55,110 | $ | 38,161 | ||||
Customer Deposits and Store Credits | 25,747 | 18,120 | ||||||
Accrued Compensation | 7,969 | 2,509 | ||||||
Sales and Income Tax Liabilities | 4,314 | 5,092 | ||||||
Other Current Liabilities | 7,887 | 6,839 | ||||||
|
|
|
| |||||
Total Current Liabilities | 101,027 | 70,721 | ||||||
Deferred Rent | 3,653 | 3,328 | ||||||
Deferred Tax Liability | 8,166 | 5,721 | ||||||
Stockholders’ Equity: | ||||||||
Common Stock ($0.001 par value; 35,000,000 authorized; 27,214,144 and 27,894,543 outstanding, respectively) | 29 | 28 | ||||||
Treasury Stock, at cost (1,719,706 and 58,730 shares, respectively) | (50,552 | ) | (1,116 | ) | ||||
Additional Capital | 131,724 | 110,163 | ||||||
Retained Earnings | 153,267 | 106,203 | ||||||
Accumulated Other Comprehensive Income (Loss) | 73 | (194 | ) | |||||
|
|
|
| |||||
Total Stockholders’ Equity | 234,541 | 215,084 | ||||||
|
|
|
| |||||
Total Liabilities and Stockholders’ Equity | $ | 347,387 | $ | 294,854 | ||||
|
|
|
| |||||
See accompanying notes to consolidated financial statements
Lumber Liquidators Holdings, Inc.
Consolidated Statements of Income
(in thousands, except share data and per share amounts)
| Year Ended December 31, | ||||||||||||
| 2012 | 2011 | 2010 | ||||||||||
Net Sales | $ | 813,327 | $ | 681,587 | $ | 620,281 | ||||||
Cost of Sales | 504,542 | 440,912 | 404,451 | |||||||||
|
|
|
|
|
| |||||||
Gross Profit | 308,785 | 240,675 | 215,830 | |||||||||
Selling, General and Administrative Expenses | 230,439 | 198,237 | 173,667 | |||||||||
|
|
|
|
|
| |||||||
Operating Income | 78,346 | 42,438 | 42,163 | |||||||||
Other (Income) Expense | (140 | ) | (587 | ) | (579 | ) | ||||||
|
| �� |
|
|
| |||||||
Income Before Income Taxes | 78,486 | 43,025 | 42,742 | |||||||||
Provision for Income Taxes | 31,422 | 16,769 | 16,476 | |||||||||
|
|
|
|
|
| |||||||
Net Income | $ | 47,064 | $ | 26,256 | $ | 26,266 | ||||||
|
|
|
|
|
| |||||||
Net Income per Common Share—Basic | $ | 1.71 | $ | 0.95 | $ | 0.96 | ||||||
|
|
|
|
|
| |||||||
Net Income per Common Share—Diluted | $ | 1.68 | $ | 0.93 | $ | 0.93 | ||||||
|
|
|
|
|
| |||||||
Weighted Average Common Shares Outstanding: | ||||||||||||
Basic | 27,448,333 | 27,706,629 | 27,384,095 | |||||||||
Diluted | 28,031,453 | 28,379,693 | 28,246,453 | |||||||||
See accompanying notes to consolidated financial statements
Lumber Liquidators Holdings, Inc.
Consolidated Statements of Other Comprehensive Income
(in thousands)
| Year Ended December 31, | ||||||||||||
| 2012 | 2011 | 2010 | ||||||||||
Net Income | $ | 47,064 | $ | 26,256 | $ | 26,266 | ||||||
Foreign Currency Translation Adjustments | 267 | (194 | ) | — | ||||||||
|
|
|
|
|
| |||||||
Comprehensive Income | $ | 47,331 | $ | 26,062 | $ | 26,266 | ||||||
|
|
|
|
|
| |||||||
See accompanying notes to consolidated financial statements
Lumber Liquidators Holdings, Inc.
Consolidated Statements of Stockholders’ Equity
(in thousands, except share data)
| Common Stock | Treasury Stock | |||||||||||||||||||||||||||||||
| Shares | Par Value | Shares | Value | Additional Capital | Retained Earnings | Accumulated Other Comprehensive Income (Loss) | Total Stockholders’ Equity | |||||||||||||||||||||||||
Balance, December 31, 2009 | 27,234,222 | $ | 27 | 29,842 | $ | (478 | ) | $ | 95,204 | $ | 53,681 | $ | — | $ | 148,434 | |||||||||||||||||
Stock-Based Compensation Expense | — | — | — | — | 3,091 | — | — | 3,091 | ||||||||||||||||||||||||
Exercise of Stock Options | 206,821 | — | — | — | 1,796 | — | — | 1,796 | ||||||||||||||||||||||||
Excess Tax Benefits on Stock Option Exercises | — | — | — | — | 1,307 | — | — | 1,307 | ||||||||||||||||||||||||
Release of Restricted Stock | 48,084 | — | — | — | — | — | — | — | ||||||||||||||||||||||||
Common Stock Repurchased | (16,447 | ) | — | 16,447 | (389 | ) | — | — | — | (389 | ) | |||||||||||||||||||||
Net Income | — | — | — | — | — | 26,266 | — | 26,266 | ||||||||||||||||||||||||
|
|
|
|
|
|
|
|
|
|
|
|
|
|
|
| |||||||||||||||||
Balance, December 31, 2010 | 27,472,680 | $ | 27 | 46,289 | $ | (867 | ) | $ | 101,398 | $ | 79,947 | $ | — | $ | 180,505 | |||||||||||||||||
Stock-Based Compensation Expense | — | — | — | — | 4,005 | — | — | 4,005 | ||||||||||||||||||||||||
Exercise of Stock Options | 377,775 | 1 | — | — | 3,070 | — | — | 3,071 | ||||||||||||||||||||||||
Excess Tax Benefits on Stock Option Exercises | — | — | — | — | 1,690 | — | — | 1,690 | ||||||||||||||||||||||||
Release of Restricted Stock | 56,529 | — | — | — | — | — | — | — | ||||||||||||||||||||||||
Common Stock Repurchased | (12,441 | ) | — | 12,441 | (249 | ) | — | — | — | (249 | ) | |||||||||||||||||||||
Translation Adjustment | — | — | — | — | — | — | (194 | ) | (194 | ) | ||||||||||||||||||||||
Net Income | — | — | — | — | — | 26,256 | — | 26,256 | ||||||||||||||||||||||||
|
|
|
|
|
|
|
|
|
|
|
|
|
|
|
| |||||||||||||||||
Balance, December 31, 2011 | 27,894,543 | $ | 28 | 58,730 | $ | (1,116 | ) | $ | 110,163 | $ | 106,203 | $ | (194 | ) | $ | 215,084 | ||||||||||||||||
Stock-Based Compensation Expense | — | — | — | — | 3,977 | — | — | 3,977 | ||||||||||||||||||||||||
Exercise of Stock Options | 937,048 | 1 | — | — | 10,453 | — | — | 10,454 | ||||||||||||||||||||||||
Excess Tax Benefits on Stock Option Exercises | — | — | — | — | 7,131 | — | — | 7,131 | ||||||||||||||||||||||||
Release of Restricted Stock | 43,529 | — | — | — | — | — | — | — | ||||||||||||||||||||||||
Common Stock Repurchased | (1,660,976 | ) | — | 1,660,976 | (49,436 | ) | — | — | — | (49,436 | ) | |||||||||||||||||||||
Translation Adjustment | — | — | — | — | — | — | 267 | 267 | ||||||||||||||||||||||||
Net Income | — | — | — | — | — | 47,064 | — | 47,064 | ||||||||||||||||||||||||
|
|
|
|
|
|
|
|
|
|
|
|
|
|
|
| |||||||||||||||||
Balance, December 31, 2012 | 27,214,144 | $ | 29 | 1,719,706 | $ | (50,552 | ) | $ | 131,724 | $ | 153,267 | $ | 73 | $ | 234,541 | |||||||||||||||||
|
|
|
|
|
|
|
|
|
|
|
|
|
|
|
| |||||||||||||||||
See accompanying notes to consolidated financial statements
Lumber Liquidators Holdings, Inc.
Consolidated Statements of Cash Flows
(in thousands)
| Year Ended December 31, | ||||||||||||
| 2012 | 2011 | 2010 | ||||||||||
Cash Flows from Operating Activities: | ||||||||||||
Net Income | $ | 47,064 | $ | 26,256 | $ | 26,266 | ||||||
Adjustments to Reconcile Net Income to Net Cash Provided by Operating Activities: | ||||||||||||
Depreciation and Amortization | 9,957 | 8,328 | 5,773 | |||||||||
Deferred Income Taxes | 160 | 2,402 | 4,300 | |||||||||
Stock-Based Compensation Expense | 3,997 | 4,005 | 3,091 | |||||||||
Changes in Operating Assets and Liabilities: | ||||||||||||
Merchandise Inventories | (42,712 | ) | (9,197 | ) | (21,789 | ) | ||||||
Accounts Payable | 16,756 | 4,467 | 1,136 | |||||||||
Customer Deposits and Store Credits | 7,626 | 6,104 | 2,234 | |||||||||
Prepaid Expenses and Other Current Assets | (2,835 | ) | (1,943 | ) | (3,548 | ) | ||||||
Other Assets and Liabilities | 7,256 | 3,679 | (487 | ) | ||||||||
|
|
|
|
|
| |||||||
Net Cash Provided by Operating Activities | 47,269 | 44,101 | 16,976 | |||||||||
Cash Flows from Investing Activities: | ||||||||||||
Purchases of Property and Equipment | (13,376 | ) | (16,988 | ) | (20,535 | ) | ||||||
Cash Paid for Acquisition | — | (4,725 | ) | — | ||||||||
|
|
|
|
|
| |||||||
Net Cash Used in Investing Activities | (13,376 | ) | (21,713 | ) | (20,535 | ) | ||||||
Cash Flows from Financing Activities: | ||||||||||||
Payments for Stock Repurchases | (49,436 | ) | (249 | ) | (389 | ) | ||||||
Proceeds from the Exercise of Stock Options | 10,454 | 3,070 | 1,796 | |||||||||
Excess Tax Benefits on Stock Option Exercises | 7,131 | 1,690 | 1,307 | |||||||||
|
|
|
|
|
| |||||||
Net Cash (Used in) Provided by Financing Activities | (31,851 | ) | 4,511 | 2,714 | ||||||||
|
|
|
|
|
| |||||||
Effect of Exchange Rates on Cash and Cash Equivalents | 450 | (54 | ) | — | ||||||||
Net Increase (Decrease) in Cash and Cash Equivalents | 2,492 | 26,845 | (845 | ) | ||||||||
Cash and Cash Equivalents, Beginning of Year | 61,675 | 34,830 | 35,675 | |||||||||
|
|
|
|
|
| |||||||
Cash and Cash Equivalents, End of Year | $ | 64,167 | $ | 61,675 | $ | 34,830 | ||||||
|
|
|
|
|
| |||||||
See accompanying notes to consolidated financial statements
Lumber Liquidators Holdings, Inc.
Notes to Consolidated Financial Statements
(amounts in thousands, except share data and per share amounts)
NOTE 1. SUMMARY OF SIGNIFICANT ACCOUNTING POLICIES
Nature of Business
Lumber Liquidators Holdings, Inc. (the “Company”) is a multi-channel specialty retailer of hardwood flooring, and hardwood flooring enhancements and accessories, operating as a single business segment. The Company offers an extensive assortment of exotic and domestic hardwood species, engineered hardwoods and laminates direct to the consumer. The Company also features the renewable flooring products, bamboo and cork, and provides a wide selection of flooring enhancements and accessories, including moldings, noise-reducing underlay, adhesives and flooring tools. These products are primarily sold under the Company’s private label brands, including the premium Bellawood brand floors. The Company sells primarily to homeowners or to contractors on behalf of homeowners through a network of 279 store locations in primary or secondary metropolitan areas in 46 states and nine store locations in Canada at December 31, 2012. In addition to the store locations, the Company’s products may be ordered, and customer questions/concerns addressed, through both the call center in Toano, Virginia, and the website, www.lumberliquidators.com. The Company finishes the majority of the Bellawood products on its finishing line in Toano, Virginia, which along with the call center, corporate offices, and a distribution center, represent the “Corporate Headquarters.”
Organization and Basis of Financial Statement Presentation
The consolidated financial statements of the Company, a Delaware corporation, include the accounts of its wholly owned subsidiaries. All significant intercompany transactions have been eliminated in consolidation. The balance sheets and statements of stockholders’ equity reflect the segregation of treasury stock from additional capital.
Use of Estimates
The preparation of financial statements in conformity with accounting principles generally accepted in the United States requires management to make estimates and assumptions that affect the amounts reported in the consolidated financial statements and accompanying notes. Actual results could differ from those estimates.
Cash and Cash Equivalents
The Company had cash equivalents of $7,664 and $27,599 at December 31, 2012 and 2011, respectively. The Company considers all highly liquid investments with a maturity date of three months or less when purchased to be cash equivalents, of which there was $170 and $16,064 at December 31, 2012 and 2011, respectively. The Company accepts a range of debit and credit cards, and these transactions are generally transmitted to a bank for reimbursement within 24 hours. The payments due from the banks for these debit and credit card transactions are generally received, or settle, within 24-48 hours of the transmission date. The Company considers all debit and credit card transactions that settle in less than seven days to be cash and cash equivalents. Amounts due from the banks for these transactions classified as cash and cash equivalents totaled $7,494 and $11,535 at December 31, 2012 and 2011, respectively.
Credit Programs
Credit is offered to the Company’s customers through a proprietary credit card, the Lumber Liquidators credit card, underwritten by third party financial institutions and at no recourse to the Company. A credit line is offered to the Company’s professional customers through the Lumber Liquidators Commercial Credit Program. This commercial credit program is underwritten by a third party financial institution, generally with no recourse to the Company.
As part of the credit program with GE Money Bank (“GE”), the Company’s customers may use their Lumber Liquidators credit card to tender installation services provided by the Company’s installation partner, The Home Service Store, Inc. (“HSS”). GE funds HSS directly for these transactions and HSS is responsible for all credits and program fees. If GE is not able to collect net credits or fees from HSS within 60 days, the Company has agreed to indemnify GE against any losses related to HSS credits or fees. There are no maximum potential future payments under the guarantee. The Company is able to seek recovery from HSS of any amounts paid on its behalf. The Company believes that the risk of significant loss from the guarantee of these obligations is remote.
Lumber Liquidators Holdings, Inc.
Notes to Consolidated Financial Statements—(Continued)
(amounts in thousands, except share data and per share amounts)
Fair Value of Financial Instruments
The carrying amounts of financial instruments such as cash and cash equivalents, notes receivable, accounts payable and other liabilities approximate fair value because of the short-term nature of these items. Of these financial instruments, the cash equivalents are classified as Level 1 as defined in the Financial Accounting Standards Board (“FASB”) ASC 820 fair value hierarchy.
Merchandise Inventories
The Company values merchandise inventories at the lower of cost or market value. Merchandise cost is determined using the average cost method. All of the hardwood flooring purchased from vendors is either prefinished or unfinished, and in immediate saleable form. The Company adds the finish to, and boxes, various species of unfinished product, to produce certain proprietary products, primarily Bellawood, at its finishing facility. These finishing and boxing costs are included in the average unit cost of related merchandise inventory. The Company maintains an inventory reserve for loss or obsolescence, based on historical results and current sales trends. This reserve was $1,035 and $500 at December 31, 2012 and 2011, respectively.
Impairment of Long-Lived Assets
The Company evaluates potential impairment losses on long-lived assets used in operations when events and circumstances indicate that the assets may be impaired, and the undiscounted cash flows estimated to be generated by those assets are less than the carrying amounts of those assets. If impairment exists and the undiscounted cash flows estimated to be generated by those assets are less than the carrying amount of those assets, an impairment loss is recorded based on the difference between the carrying value and fair value of the assets. No impairment charges were recognized in 2012, 2011 or 2010.
Goodwill and Other Indefinite-Lived Intangibles
Goodwill represents the costs in excess of the fair value of net assets acquired associated with acquisitions by the Company. Other assets include $800 for an indefinite-lived intangible asset for the phone number 1-800-HARDWOOD and related internet domain names. The Company evaluates these assets for impairment on an annual basis, or whenever events or changes in circumstance indicate that the asset carrying value exceeds its fair value. Based on the analysis performed, the Company has concluded that no impairment in the value of these assets has occurred.
Self Insurance
The Company is self-insured for certain employee health benefit claims. The Company estimates a liability for aggregate losses below stop-loss coverage limits based on estimates of the ultimate costs to be incurred to settle known claims and claims not reported as of the balance sheet date. The estimated liability is not discounted and is based on a number of assumptions and factors including historical trends, actuarial assumptions and economic conditions. This liability could be affected if future occurrences and claims differ from these assumptions and historical trends. As of December 31, 2012 and 2011, an accrual of $679 and $593 related to estimated claims was included in other current liabilities, respectively.
Recognition of Net Sales
The Company recognizes net sales for products purchased at the time the customer takes possession of the merchandise. Service revenue, primarily freight charges for in-home delivery, is included in net sales and recognized when the service has been rendered. The Company reports sales exclusive of sales taxes collected from customers and remitted to governmental taxing authorities, and net of an allowance for anticipated sales returns based on historical and current sales trends and experience. The sales returns allowance and related changes were not significant for 2012, 2011 or 2010.
The Company generally requires customers to pay a deposit, equal to approximately half of the retail sales value, when purchasing merchandise inventories not regularly carried in a given store location, or not currently in stock. These deposits are included in customer deposits and store credits until the customer takes possession of the merchandise.
Lumber Liquidators Holdings, Inc.
Notes to Consolidated Financial Statements—(Continued)
(amounts in thousands, except share data and per share amounts)
Cost of Sales
Cost of sales includes the cost of the product sold, the transportation costs from vendor to the Company’s distribution center or store location, any applicable finishing costs related to production of the Company’s proprietary brands, the transportation costs from the distribution center to the store locations, transportation costs for the delivery of products from the store locations to customers, any inventory adjustments, including shrinkage, and the costs to produce samples, reduced by vendor allowances.
The Company offers a range of prefinished products with warranties on the durability of the finish ranging from 10 to 100 years. Warranty reserves are based primarily on claims experience, sales history and other considerations, and warranty costs are recorded in cost of sales. This reserve was $440 and $454 at December 31, 2012 and 2011, respectively.
Vendor allowances primarily consist of volume rebates that are earned as a result of attaining certain purchase levels and reimbursement for the cost of producing samples. Vendor allowances are accrued as earned, with those allowances received as a result of attaining certain purchase levels accrued over the incentive period based on estimates of purchases. Volume rebates earned are initially recorded as a reduction in merchandise inventories and a subsequent reduction in cost of sales when the related product is sold. Reimbursement received for the cost of producing samples is recorded as an offset against cost of sales.
Advertising Costs
Advertising costs charged to selling, general and administrative (“SG&A”) expenses, net of vendor allowances, were $58,548, $52,345 and $49,797 in 2012, 2011 and 2010, respectively. The Company uses various types of media to brand its name and advertise its products. Media production costs are generally expensed as incurred, except for direct mail, which is expensed when the finished piece enters the postal system. Media placement costs are generally expensed in the month the advertising occurs, except for contracted endorsements and sports agreements, which are generally expensed ratably over the contract period. Amounts paid in advance are included in prepaid expenses and totaled $1,649 and $818 at December 31, 2012 and 2011, respectively.
Store Opening Costs
Costs to open new store locations are charged to SG&A expenses as incurred, net of any vendor support.
Other Vendor Consideration
Consideration from non-merchandise vendors, including royalties and rebates, are generally recorded as an offset to SG&A expenses when earned.
Depreciation and Amortization
Property and equipment is carried at cost and depreciated on the straight-line method over the estimated useful lives. The estimated useful lives for leasehold improvements are the shorter of the estimated useful lives or the remainder of the lease terms. For leases with optional renewal periods, the Company uses the original lease term, excluding optional renewal periods, to determine the appropriate estimated useful lives. Capitalized software costs, including those related to the Company’s integrated information technology solution, are capitalized from the time that technological feasibility is established until the software is ready for use. The estimated useful lives are generally as follows:
| ||||
| ||||
| ||||
Lumber Liquidators Holdings, Inc.
Notes to Consolidated Financial Statements—(Continued)
(amounts in thousands, except share data and per share amounts)
Operating Leases
The Company has operating leases for its stores, Corporate Headquarters, supplemental office and distribution facilities and certain equipment. The lease agreements for certain stores and distribution facilities contain rent escalation clauses, rent holidays and tenant improvement allowances. For scheduled rent escalation clauses during the lease terms or for rental payments commencing at a date other than the date of initial occupancy, the Company records minimum rental expenses in SG&A expenses on a straight-line basis over the terms of the leases. The difference between the rental expense and rent paid is recorded as deferred rent in the consolidated balance sheets. For tenant improvement allowances, the Company records deferred rent in the consolidated balance sheets and amortizes the deferred rent over the terms of the leases as reductions to rental expense.
Stock-Based Compensation
The Company records compensation expense associated with stock options and other forms of equity compensation in accordance with FASB ASC 718. The Company may issue incentive awards in the form of stock options, restricted stock awards and other equity awards to employees and non-employee directors. The Company recognizes expense for its stock-based compensation based on the fair value of the awards that are granted. Measured compensation cost is recognized ratably over the requisite service period of the related stock-based compensation award.
Foreign Currency Translation
The Company’s Canadian operations use the Canadian dollar as the functional currency. Assets and liabilities are translated at exchange rates in effect at the balance sheet date. Revenues and expenses are translated at the average monthly exchange rates during the year. Resulting translation adjustments are recorded as a component of accumulated other comprehensive income on the consolidated balance sheets.
Income Taxes
Income taxes are accounted for in accordance with FASB ASC 740 (“ASC 740”). Income taxes are provided for under the asset and liability method and consider differences between the tax and financial accounting bases. The tax effects of these differences are reflected on the balance sheet as deferred income taxes and measured using the effective tax rate expected to be in effect when the differences reverse. ASC 740 also requires that deferred tax assets be reduced by a valuation allowance if it is more likely than not that some portion of the deferred tax asset will not be realized. In evaluating the need for a valuation allowance, the Company takes into account various factors, including the nature, frequency and severity of current and cumulative losses, expected level of future taxable income, the duration of statutory carryforward periods and tax planning alternatives. In future periods, any valuation allowance will be re-evaluated in accordance with ASC 740, and a change, if required, will be recorded through income tax expense in the period such determination is made.
The Company recognizes the tax benefit from an uncertain tax position only if it is more likely than not that the tax position will be sustained on examination by the relevant taxing authorities, based on the technical merits of its position. The tax benefits recognized in the financial statements from such a position are measured based on the largest benefit that has a greater than 50% likelihood of being realized upon ultimate settlement. The amount of unrecognized tax benefits was not significant for 2012, 2011 or 2010. The Company classifies interest and penalties related to income tax matters as a component of income tax expense.
Net Income per Common Share
Basic net income per common share is determined by dividing net income by the weighted average number of common shares outstanding during the year. Diluted net income per common share is determined by dividing net income by the weighted average number of common shares outstanding during the year, plus the dilutive effect of common stock equivalents, including stock options and restricted stock awards. Common stock and common stock equivalents included in the computation represent shares issuable upon assumed exercise of outstanding stock options and release of restricted stock awards, except when the effect of their inclusion would be antidilutive.
Lumber Liquidators Holdings, Inc.
Notes to Consolidated Financial Statements—(Continued)
(amounts in thousands, except share data and per share amounts)
Recent Accounting Pronouncements
In September 2011, the FASB issued guidance that revises the requirements around how entities test goodwill for impairment. The guidance allows companies to perform a qualitative assessment before calculating the fair value of the reporting unit. If entities determine, on the basis of qualitative factors, that the fair value of the reporting unit is more likely than not greater than the carrying amount, a quantitative calculation would not be needed. The Company adopted this guidance for its fiscal 2012 annual goodwill impairment test.
NOTE 2. NOTES RECEIVABLE
As of December 31, 2012, the Company’s only notes receivable from a merchandise vendor had been fully reserved with a $671 provision charge to SG&A expenses in the second quarter of 2012. As of December 31, 2011, the outstanding balance due to the Company was $696, of which $322 had been included in other current assets.
NOTE 3. ACQUISITION
On September 28, 2011, the Company entered into an agreement to acquire certain assets of Sequoia Floorings Inc. (“Sequoia”) relating to Sequoia’s quality control and assurance, product development, claims management and logistics operations in China. The acquisition agreement included a purchase price of approximately $8,300, of which approximately $4,700 was paid in cash. SG&A expenses in 2011 included acquisition-related expenses of approximately $600.
The purchase price for the acquisition was allocated to the assets acquired and liabilities assumed based upon their respective fair values. The excess consideration was recorded as goodwill and approximated $8,643, of which all is deductible for tax purposes.
NOTE 4. PROPERTY AND EQUIPMENT
Property and equipment consisted of:
| December 31, | ||||||||
| 2012 | 2011 | |||||||
Property and Equipment | $ | 36,847 | $ | 31,411 | ||||
Computer Software and Hardware | 33,344 | 29,680 | ||||||
Leasehold Improvements | 16,112 | 12,672 | ||||||
|
|
|
| |||||
| 86,303 | 73,763 | |||||||
Less: Accumulated Depreciation and Amortization | 38,539 | 29,616 | ||||||
|
|
|
| |||||
Property and Equipment, net | $ | 47,764 | $ | 44,147 | ||||
|
|
|
| |||||
As of December 31, 2012 and 2011, the Company had capitalized $24,398 and $21,483 of computer software costs respectively. Amortization expense related to these assets was $2,388, $2,094 and $896 for 2012, 2011 and 2010, respectively.
NOTE 5. REVOLVING CREDIT AGREEMENT
A revolving credit agreement (the “Revolver”) providing for borrowings up to $50,000 is available to the Company through expiration on February 21, 2017. During 2012 and 2011, the Company did not borrow against the Revolver and at December 31, 2012 and 2011, there were no outstanding commitments under letters of credit. The Revolver is primarily available to fund inventory purchases, including the support of up to $10,000 for letters of credit, and for general operations. The Revolver is secured by the Company’s inventory, has no mandated payment provisions and a fee of 0.1% per annum, subject to adjustment based on certain financial performance criteria, on any unused portion of the Revolver. Amounts outstanding under the Revolver would be subject to an interest rate of LIBOR plus 1.125%, subject to adjustment based on certain financial performance criteria. The Revolver has certain defined covenants and restrictions, including the maintenance of certain defined financial ratios. The Company was in compliance with these financial covenants at December 31, 2012.
Lumber Liquidators Holdings, Inc.
Notes to Consolidated Financial Statements—(Continued)
(amounts in thousands, except share data and per share amounts)
NOTE 6. LEASES
The Company has operating leases for its stores, Corporate Headquarters, supplemental office and distribution facilities and certain equipment. The store location leases are operating leases and generally have five-year base periods with one or more five-year renewal periods.
As of December 31, 2012, 2011 and 2010, the Company leased 27, 25 and 27 of its locations, representing 9.7%, 9.5% and 12.1% of the total number of store leases in operation, respectively, and the Corporate Headquarters from entities controlled by the Company’s founder (“Controlled Companies”). The Corporate Headquarters has an operating lease with a base term running through December 31, 2019.
Rental expense is as follows:
| Year Ended December 31, | ||||||||||||
| 2012 | 2011 | 2010 | ||||||||||
Rental expense | $ | 18,826 | $ | 16,575 | $ | 13,784 | ||||||
Rental expense related to Controlled Companies | 2,725 | 2,718 | 2,635 | |||||||||
The future minimum rental payments under non-cancellable operating leases, segregating Controlled Companies leases from all other operating leases, were as follows at December 31, 2012:
| Operating Leases | ||||||||||||||||
| Controlled Companies | Store & Other Leases | Total Operating Leases | ||||||||||||||
| Store Leases | Headquarters Lease | |||||||||||||||
2013 | $ | 1,566 | $ | 1,163 | $ | 16,401 | $ | 19,130 | ||||||||
2014 | 1,212 | 1,198 | 14,243 | 16,653 | ||||||||||||
2015 | 953 | 1,234 | 12,139 | 14,326 | ||||||||||||
2016 | 530 | 1,271 | 9,484 | 11,285 | ||||||||||||
2017 | 229 | 1,309 | 5,813 | 7,351 | ||||||||||||
Thereafter | 364 | 2,737 | 5,370 | 8,471 | ||||||||||||
|
|
|
|
|
|
|
| |||||||||
Total minimum lease payments | $ | 4,854 | $ | 8,912 | $ | 63,450 | $ | 77,216 | ||||||||
|
|
|
|
|
|
|
| |||||||||
NOTE 7. STOCKHOLDERS’ EQUITY
Net Income per Common Share
The following table sets forth the computation of basic and diluted net income per common share:
| Year Ended December 31, | ||||||||||||
| 2012 | 2011 | 2010 | ||||||||||
Net Income | $ | 47,064 | $ | 26,256 | $ | 26,266 | ||||||
|
|
|
|
|
| |||||||
Weighted Average Common Shares Outstanding—Basic | 27,448,333 | 27,706,629 | 27,384,095 | |||||||||
Effect of Dilutive Securities: | ||||||||||||
Common Stock Equivalents | 583,120 | 673,064 | 862,358 | |||||||||
|
|
|
|
|
| |||||||
Weighted Average Common Shares Outstanding—Diluted | 28,031,453 | 28,379,693 | 28,246,453 | |||||||||
|
|
|
|
|
| |||||||
Net Income per Common Share—Basic | $ | 1.71 | $ | 0.95 | $ | 0.96 | ||||||
|
|
|
|
|
| |||||||
Net Income per Common Share—Diluted | $ | 1.68 | $ | 0.93 | $ | 0.93 | ||||||
|
|
|
|
|
| |||||||
Lumber Liquidators Holdings, Inc.
Notes to Consolidated Financial Statements—(Continued)
(amounts in thousands, except share data and per share amounts)
The following have been excluded from the computation of Weighted Average Common Shares Outstanding—Diluted because the effect would be anti-dilutive:
| As of December 31, | ||||||||||||
| 2012 | 2011 | 2010 | ||||||||||
Stock Options | 16,969 | 845,414 | 287,857 | |||||||||
Restricted Stock Awards | 4,261 | 9,414 | — | |||||||||
Stock Repurchase Program
On February 22, 2012, the Company’s Board of Directors (“Board”) authorized the repurchase of up to $50,000 of the Company’s common stock, and on November 15, 2012, authorized the repurchase of up to an additional $50,000. The Company’s stock repurchase program allows it to repurchase its common stock from time to time on the open market or in privately negotiated transactions. During the year ended December 31, 2012, the Company repurchased 1,648,777 shares of its common stock on the open market at an average price of $29.74 per share for an aggregate cost of $49,068. The Company has not purchased any stock through privately negotiated transactions. At December 31, 2012, the Company had $50,932 remaining under Board authorization.
NOTE 8. STOCK-BASED COMPENSATION
Stock-based compensation expense included in SG&A expenses consisted of:
| Year Ended December 31, | ||||||||||||
| 2012 | 2011 | 2010 | ||||||||||
Stock Options, Restricted Stock Awards and Stock Appreciation Rights | $ | 3,997 | $ | 4,005 | $ | 2,962 | ||||||
Regional Manager Plan | — | — | 129 | |||||||||
|
|
|
|
|
| |||||||
Total | $ | 3,997 | $ | 4,005 | $ | 3,091 | ||||||
|
|
|
|
|
| |||||||
Overview
On May 6, 2011, the Company’s stockholders approved the Lumber Liquidators Holdings, Inc. 2011 Equity Compensation Plan (the “2011 Plan”), which succeeded the Lumber Liquidators Holdings, Inc. 2007 Equity Compensation Plan (the “2007 Plan”). The 2011 Plan is an equity incentive plan for employees, non-employee directors and other service providers from which the Company may grant stock options, restricted stock awards, stock appreciation rights (“SARs”) and other equity awards. The total number of shares of common stock authorized for issuance under the 2011 Plan is 5.3 million. As of December 31, 2012, 1.7 million shares of common stock were available for future grants. Stock options granted under the 2011 Plan expire no later than ten years from the date of grant and the exercise price shall not be less than the fair market value of the shares on the date of grant. Vesting periods are assigned to stock options and restricted stock awards on a grant by grant basis at the discretion of the Board of Directors. The Company issues new shares of common stock upon exercise of stock options and vesting of restricted stock awards.
The Company also maintains the Lumber Liquidators Holdings, Inc. Outside Directors Deferral Plan (the “Deferral Plan”) under which each of the Company’s non-employee directors has the opportunity to elect annually to defer certain fees until his departure from the Board of Directors. A non-employee director may elect to defer up to 100% of his fees and have such fees invested in deferred stock units. Deferred stock units must be settled in common stock upon the director’s departure from the Board. There were 47,334 and 32,960 deferred stock units outstanding at December 31, 2012 and 2011, respectively.
The Regional Manager Plan
The Company maintained a stock unit plan for regional store management, the 2006 Stock Unit Plan for Regional Managers (the “2006 Regional Plan”). In 2006, certain Regional Managers were granted a total of 85,000 stock units vesting
Lumber Liquidators Holdings, Inc.
Notes to Consolidated Financial Statements—(Continued)
(amounts in thousands, except share data and per share amounts)
over approximately a five year period. Through December 2010, vesting was complete and the Company’s founder contributed the 85,000 shares of common stock necessary to provide for the exercise of the stock units. No additional grants of stock units are available under the 2006 Regional Plan.
Stock Options
The following table summarizes activity related to stock options:
| Shares | Weighted Average Exercise Price | Remaining Average Contractual Term (Years) | Aggregate Intrinsic Value | |||||||||||||
Balance, December 31, 2009 | 2,046,976 | $ | 8.61 | 7.2 | $ | 37,237 | ||||||||||
|
|
|
| |||||||||||||
Granted | 289,026 | 24.35 | ||||||||||||||
Exercised | (206,821 | ) | 8.68 | |||||||||||||
Forfeited | (59,664 | ) | 13.24 | |||||||||||||
|
| |||||||||||||||
Balance, December 31, 2010 | 2,069,517 | $ | 10.67 | 6.6 | $ | 29,635 | ||||||||||
|
|
|
| |||||||||||||
Granted | 557,557 | 24.64 | ||||||||||||||
Exercised | (377,775 | ) | 8.14 | |||||||||||||
Forfeited | (54,952 | ) | 19.82 | |||||||||||||
|
| |||||||||||||||
Balance, December 31, 2011 | 2,194,347 | $ | 14.42 | 6.6 | $ | 12,746 | ||||||||||
|
|
|
| |||||||||||||
Granted | 182,281 | 25.73 | ||||||||||||||
Exercised | (937,048 | ) | 11.16 | |||||||||||||
Forfeited | (128,203 | ) | 19.94 | |||||||||||||
|
| |||||||||||||||
Balance, December 31, 2012 | 1,311,377 | $ | 17.79 | 6.5 | $ | 45,954 | ||||||||||
|
|
|
| |||||||||||||
Exercisable at December 31, 2012 | 670,420 | $ | 11.59 | 4.8 | $ | 27,647 | ||||||||||
|
|
|
| |||||||||||||
The aggregate intrinsic value is the difference between the exercise price and the closing price of the Company’s common stock on December 31. The intrinsic value of the stock options exercised during 2012, 2011 and 2010 was $22,881, $5,583 and $3,742, respectively.
As of December 31, 2012, total unrecognized compensation cost related to unvested options was approximately $4,877, net of estimated forfeitures, which is expected to be recognized over a weighted average period of approximately 2.6 years.
The fair value of each stock option award is estimated by management on the date of the grant using the Black-Scholes-Merton option pricing model. The weighted average fair value of options granted during 2012, 2011 and 2010 was $12.68, $12.57 and $11.44, respectively.
The following are the ranges of assumptions for the periods noted:
| Year Ended December 31, | ||||||||||||
| 2012 | 2011 | 2010 | ||||||||||
Expected dividend rate | 0 | % | 0 | % | 0 | % | ||||||
Expected stock price volatility | 45 | % | 45 | % | 45 | % | ||||||
Risk-free interest rate | 1.0-1.6 | % | 1.7-3.0 | % | 1.9-3.2 | % | ||||||
Expected term of options | 6.5-7.5 years | 7.5 years | 3.5-7.5 years | |||||||||
The expected stock price volatility range is based on a combination of historical volatility of the Company’s stock price and the historical volatilities of companies included in a peer group that was selected by management whose shares or options are publicly available. The volatilities are estimated for a period of time equal to the expected term of the related
Lumber Liquidators Holdings, Inc.
Notes to Consolidated Financial Statements—(Continued)
(amounts in thousands, except share data and per share amounts)
option. The risk-free interest rate is based on the implied yield of U.S. Treasury zero-coupon issues with an equivalent remaining term. The expected term of the options represents the estimated period of time until exercise and is determined by considering the contractual terms, vesting schedule and expectations of future employee behavior.
Restricted Stock Awards
The following table summarizes activity related to restricted stock awards:
| Shares | Weighted Average Grant Date Fair Value | |||||||
Nonvested, December 31, 2009 | 145,230 | $ | 12.19 | |||||
|
| |||||||
Granted | 67,811 | 24.69 | ||||||
Released | (48,245 | ) | 24.63 | |||||
Forfeited | (22,715 | ) | 14.26 | |||||
|
| |||||||
Nonvested, December 31, 2010 | 142,081 | $ | 13.60 | |||||
|
| |||||||
Granted | 79,236 | 23.28 | ||||||
Released | (56,529 | ) | 21.45 | |||||
Forfeited | (22,668 | ) | 18.61 | |||||
|
| |||||||
Nonvested, December 31, 2011 | 142,120 | $ | 15.08 | |||||
|
| |||||||
Granted | 66,425 | 27.62 | ||||||
Released | (43,529 | ) | 29.41 | |||||
Forfeited | (12,611 | ) | 21.58 | |||||
|
| |||||||
Nonvested, December 31, 2012 | 152,405 | $ | 15.19 | |||||
|
| |||||||
The fair value of restricted stock awards released during the years ended December 31, 2012, 2011 and 2010 was $1,391, $1,212 and $1,188, respectively. As of December 31, 2012, total unrecognized compensation cost related to unvested restricted stock awards was approximately $856, net of estimated forfeitures, which is expected to be recognized over a weighted average period of approximately 2.1 years.
Stock Appreciation Rights
The following table summarizes activity related to SARs:
| Shares | Weighted Average Exercise Price | Remaining Average Contractual Term (Years) | Aggregate Intrinsic Value | |||||||||||||
Balance, December 31, 2011 | — | $ | — | — | $ | — | ||||||||||
|
|
|
| |||||||||||||
Granted | 9,796 | 24.71 | ||||||||||||||
Forfeited | (165 | ) | 24.35 | |||||||||||||
|
| |||||||||||||||
Balance, December 31, 2012 | 9,631 | $ | 24.72 | 9.2 | $ | 271 | ||||||||||
|
|
|
| |||||||||||||
Exercisable at December 31, 2012 | — | $ | — | — | $ | — | ||||||||||
|
|
|
| |||||||||||||
The fair value method, estimated by management using the Black-Scholes-Merton option pricing model, is used to recognize compensation cost associated with SARs.
Lumber Liquidators Holdings, Inc.
Notes to Consolidated Financial Statements—(Continued)
(amounts in thousands, except share data and per share amounts)
NOTE 9. INCOME TAXES
The components of income before income taxes were as follows:
| Year Ended December 31, | ||||||||||||
| 2012 | 2011 | 2010 | ||||||||||
United States | $ | 80,565 | $ | 45,259 | $ | 43,306 | ||||||
Foreign | (2,079 | ) | (2,234 | ) | (564 | ) | ||||||
|
|
|
|
|
| |||||||
Total Income before Income Taxes | $ | 78,486 | $ | 43,025 | $ | 42,742 | ||||||
|
|
|
|
|
| |||||||
The provision for income taxes consists of the following:
| Year Ended December 31, | ||||||||||||
| 2012 | 2011 | 2010 | ||||||||||
Current | ||||||||||||
Federal | $ | 26,949 | $ | 12,291 | $ | 10,231 | ||||||
State | 4,195 | 2,063 | 1,945 | |||||||||
Foreign | | 118 | | | 13 | | — | |||||
|
|
|
|
|
| |||||||
Total Current | 31,262 | 14,367 | 12,176 | |||||||||
Deferred | ||||||||||||
Federal | (387 | ) | 2,483 | 3,926 | ||||||||
State | (164 | ) | 498 | 522 | ||||||||
Foreign | 711 | (579 | ) | (148 | ) | |||||||
|
|
|
|
|
| |||||||
Total Deferred | 160 | 2,402 | 4,300 | |||||||||
|
|
|
|
|
| |||||||
Total Provision for Income Taxes | $ | 31,422 | $ | 16,769 | $ | 16,476 | ||||||
|
|
|
|
|
| |||||||
The reconciliation of significant differences between income tax expense applying the federal statutory rate and the actual income tax expense at the effective rate are as follows:
| Year Ended December 31, | ||||||||||||||||||||||||
| 2012 | 2011 | 2010 | ||||||||||||||||||||||
Income Tax Expense at Federal Statutory Rate | $ | 27,470 | 35.0 | % | $ | 15,059 | 35.0 | % | $ | 14,960 | 35.0 | % | ||||||||||||
Increases (Decreases): | ||||||||||||||||||||||||
State Income Taxes, Net of Federal Income Tax Benefit | 2,542 | 3.2 | % | 1,632 | 3.8 | % | 1,478 | 3.5 | % | |||||||||||||||
Valuation Allowance | 1,267 | 1.6 | % | — | 0.0 | % | — | 0.0 | % | |||||||||||||||
Foreign Taxes | 283 | 0.4 | % | 208 | 0.5 | % | 49 | 0.1 | % | |||||||||||||||
Other | (140 | ) | (0.2 | %) | (130 | ) | (0.3 | %) | (11 | ) | (0.1 | %) | ||||||||||||
|
|
|
|
|
|
|
|
|
|
|
| |||||||||||||
Total | $ | 31,422 | 40.0 | % | $ | 16,769 | 39.0 | % | $ | 16,476 | 38.5 | % | ||||||||||||
|
|
|
|
|
|
|
|
|
|
|
| |||||||||||||
Lumber Liquidators Holdings, Inc.
Notes to Consolidated Financial Statements—(Continued)
(amounts in thousands, except share data and per share amounts)
The tax effects of temporary differences that result in significant portions of the deferred tax accounts are as follows:
| December 31, | ||||||||
| 2012 | 2011 | |||||||
Deferred Tax Liabilities: | ||||||||
Prepaid Expenses | $ | 402 | $ | 372 | ||||
Depreciation and Amortization | 12,729 | 11,629 | ||||||
Other | 655 | — | ||||||
|
|
|
| |||||
Total Gross Deferred Tax Liabilities | 13,786 | 12,001 | ||||||
Deferred Tax Assets: | ||||||||
Stock-Based Compensation Expense | 3,211 | 3,914 | ||||||
Reserves | 2,782 | 2,243 | ||||||
Employee Benefits | 1,685 | 118 | ||||||
Inventory Capitalization | 3,454 | 2,168 | ||||||
Foreign Operations | 1,267 | 728 | ||||||
Other | — | 342 | ||||||
|
|
|
| |||||
Total Gross Deferred Tax Assets | 12,399 | 9,513 | ||||||
|
|
|
| |||||
Less Valuation Allowance | (1,267 | ) | — | |||||
|
|
|
| |||||
Total Net Deferred Tax Assets | 11,132 | 9,513 | ||||||
|
|
|
| |||||
Net Deferred Tax Liability | $ | (2,654 | ) | $ | (2,488 | ) | ||
|
|
|
| |||||
In the fourth quarter of 2012, Canadian operations were in a cumulative loss position and the Company recorded a full valuation allowance of $1,267 on the net deferred tax assets in Canada. In future periods, the allowance could be reduced if sufficient evidence exists indicating that it is more likely than not that a portion or all of these deferred tax assets will be realized.
As of December 31, 2012, the Company had Canadian net operating losses carryforwards of $5,446 which begin to expire in 2030. These net operating losses may be carried forward up to 20 years to offset future taxable income.
The Company made income tax payments of $29,035, $7,067 and $14,282 in 2012, 2011 and 2010, respectively.
The Company files income tax returns with the U.S. federal government and various state and foreign jurisdictions. In the normal course of business, the Company is subject to examination by taxing authorities. The Internal Revenue Service has completed audits of the Company’s federal income tax returns for years through 2009.
NOTE 10. PROFIT SHARING PLAN
The Company maintains a profit-sharing plan, qualified under Section 401(k) of the Internal Revenue Code, for all eligible employees. Employees are eligible to participate following the completion of three months of service and attainment of age 21. The Company matches 50% of employee contributions up to 6% of eligible compensation. The Company’s matching contributions, included in SG&A expenses, totaled $749, $620 and $520 in 2012, 2011 and 2010, respectively.
NOTE 11. RELATED PARTY TRANSACTIONS
The Company is party to an agreement dated June 1, 2010 with Designers’ Surplus, LLC t/a Cabinets to Go (“CTG”). The Company’s founder is the sole member of an entity that owns a significant interest in CTG. Pursuant to the terms of the agreement, the Company provides certain advertising, marketing and other services. The Company charges CTG for its services at rates believed to be at fair market value. The revenue recognized by the Company from this agreement was $55, $83 and $124 in 2012, 2011 and 2010, respectively.
Lumber Liquidators Holdings, Inc.
Notes to Consolidated Financial Statements—(Continued)
(amounts in thousands, except share data and per share amounts)
As described in Note 6, the Company leases a number of its store locations and Corporate Headquarters from Controlled Companies.
NOTE 12. COMMITMENTS AND CONTINGENCIES
The Company is, from time to time, subject to claims and disputes arising in the normal course of business. In the opinion of management, while the outcome of any such claims and disputes cannot be predicted with certainty, the ultimate liability of the Company in connection with these matters is not expected to have a material adverse effect on the Company’s results of operations, financial position or cash flows.
On May 21, 2012, Harbor Freight Tools USA, Inc. and Central Purchasing, LLC (together, the “Plaintiffs”) filed an action, which was subsequently amended, in the Superior Court for the County of Los Angeles, California against the Company and certain purported Company employees (the “State Court Action”). In the State Court Action, the Plaintiffs contended that they previously employed several individuals now working for the Company, and alleged, among other claims, the improper use and possession by the Company and/or its employees of trade secrets belonging to the Plaintiffs and unfair business practices. The Plaintiffs have sought unspecified monetary damages, punitive damages, injunctive, equitable and other relief.
On December 18, 2012, the Plaintiffs filed suit against the Company in the United States District Court for the Central District of California. In that suit, in addition to the claims raised as in the State Court Action, the Plaintiffs alleged that the Company violated certain of the Plaintiffs’ copyrights. The Plaintiffs have sought, among other things, a preliminary injunction precluding the Company from using the Plaintiffs’ purported confidential information and selling seven specific tool products. The Plaintiffs dismissed the State Court Action as it pertained to the Company but it remains pending as to the individual employees.
The Company strongly disputes the Plaintiffs’ contentions and has been litigating this matter aggressively. Nevertheless, the parties engaged in settlement processes and have reached a tentative understanding on certain matters. The Company, however, cannot make any assurance that this matter will ultimately settle. In the event that a settlement is not consummated, the Company will continue to defend this matter vigorously and believes that the ultimate outcome of the litigation will not have a material adverse effect on its results of operations, financial position or cash flows. Based upon the proceedings to date, the Company has recorded an accrual of approximately $500 in the fourth quarter of 2012 as its best estimate of the probable loss at this time.
On August 30, 2012, Jaroslaw Prusak, a purported customer (“Prusak”), filed a putative class action lawsuit against the Company in the United States District Court for the Northern District of Illinois. Prusak alleges that the Company willfully violated the Fair and Accurate Credit Transactions Act (“FACTA”) amendment to the Fair Credit Reporting Act in connection with printed credit card receipts provided to its customers. Prusak, for himself and the putative class, seeks statutory damages of no less than $100 and no more than $1,000 per violation, punitive damages, attorney’s fees and costs, and other relief. The Company intends to defend this matter vigorously. Given the uncertainty of litigation, the preliminary stage of the case and the legal standards that must be met for, among other things, class certification and success on the merits, no outcome can be predicted at this time. Based upon the current status of the matter and information available, the Company does not, at this time, expect the outcome of this proceeding to have a material adverse effect on its results of operations, financial position or cash flows.
Lumber Liquidators Holdings, Inc.
Notes to Consolidated Financial Statements—(Continued)
(amounts in thousands, except share data and per share amounts)
NOTE 13. CONDENSED QUARTERLY FINANCIAL INFORMATION (unaudited)
The following tables present the Company’s unaudited quarterly results for 2012 and 2011.
| Quarter Ended | ||||||||||||||||
| March 31, 2012 | June 30, 2012 | September 30, 2012 | December 31, 2012 | |||||||||||||
| (dollars in thousands, except per share amounts) | ||||||||||||||||
Net Sales | $ | 188,034 | $ | 210,347 | $ | 204,291 | $ | 210,655 | ||||||||
Gross Profit | 70,137 | 78,480 | 77,886 | 82,282 | ||||||||||||
Selling, General and Administrative Expenses | 56,819 | 58,685 | 57,135 | 57,800 | ||||||||||||
Operating Income | 13,318 | 19,795 | 20,751 | 24,482 | ||||||||||||
Net Income | $ | 8,197 | $ | 12,177 | $ | 12,882 | $ | 13,808 | (1) | |||||||
|
|
|
|
|
|
|
| |||||||||
Net Income per Common Share – Basic | $ | 0.29 | $ | 0.44 | $ | 0.47 | $ | 0.51 | ||||||||
Net Income per Common Share – Diluted | $ | 0.29 | $ | 0.43 | $ | 0.46 | $ | 0.50 | ||||||||
Number of Stores Opened in Quarter | 4 | 10 | 7 | 4 | ||||||||||||
Comparable Store Net Sales Increase | 7.5 | % | 12.4 | % | 12.0 | % | 13.2 | % | ||||||||
Effective Tax Rate | 38.6 | % | 38.6 | % | 38.0 | % | 43.7 | % | ||||||||
| Quarter Ended | ||||||||||||||||
| March 31, 2011 | June 30, 2011 | September 30, 2011 | December 31, 2011 | |||||||||||||
| (dollars in thousands, except per share amounts) | ||||||||||||||||
Net Sales | $ | 159,680 | $ | 175,460 | $ | 171,993 | $ | 174,454 | ||||||||
Gross Profit | 57,793 | 59,724 | 61,248 | 61,910 | ||||||||||||
Selling, General and Administrative Expenses | 48,453 | 51,051 | 50,327 | 48,405 | ||||||||||||
Operating Income | 9,340 | 8,673 | 10,921 | 13,505 | ||||||||||||
Net Income | $ | 5,777 | $ | 5,287 | $ | 6,735 | $ | 8,458 | ||||||||
|
|
|
|
|
|
|
| |||||||||
Net Income per Common Share – Basic | $ | 0.21 | $ | 0.19 | $ | 0.24 | $ | 0.30 | ||||||||
Net Income per Common Share – Diluted | $ | 0.20 | $ | 0.19 | $ | 0.24 | $ | 0.30 | ||||||||
Number of Stores Opened in Quarter | 16 | 11 | 6 | 7 | ||||||||||||
Comparable Store Net Sales Increase (Decrease) | (4.3 | %) | (7.9 | %) | 3.0 | % | 1.9 | % | ||||||||
Effective Tax Rate | 38.7 | % | 39.5 | % | 39.2 | % | 38.7 | % | ||||||||
Item 9. Changes in and Disagreements with Accountants on Accounting and Financial Disclosure.
None.
Item 9A. Controls and Procedures.
An evaluation was performed under the supervision and with the participation of our management, including our Chief Executive Officer (principal executive officer) and Chief Financial Officer (principal financial officer), of the effectiveness of our disclosure controls and procedures, as defined in Rules 13a-15(e) and 15d-15(e) under the Securities Exchange Act of 1934, as amended (Exchange Act), as of the end of the period covered by this report. Based on that evaluation, our management, including our Chief Executive Officer and Chief Financial Officer, concluded that our disclosure controls and procedures were effective as of December 31, 2012 and designed to ensure that information required to be disclosed by us in reports that we file or submit under the Exchange Act, is recorded, processed, summarized and reported within the time periods specified in the rules and forms of the SEC and that such information is accumulated and communicated to our management, including our Chief Executive Officer and Chief Financial Officer, as appropriate to allow timely decisions regarding required disclosure.
Management’s Annual Report on Internal Control Over Financial Reporting
Our management is responsible for establishing and maintaining adequate internal control over financial reporting as defined in Rules 13a-15(f) and 15d-15(f) under the Exchange Act. Our internal control over financial reporting is designed to provide reasonable assurance regarding the reliability of financial reporting and the preparation of financial statements for external purposes in accordance with U.S. generally accepted accounting principles.
Because of its inherent limitations, internal control over financial reporting may not prevent or detect misstatements. Therefore, even those systems determined to be effective can provide only reasonable assurance of achieving their control objectives.
Our management assessed the effectiveness of our internal control over financial reporting as of December 31, 2012. In making this assessment, our management used the criteria set forth by the Committee of Sponsoring Organizations of the Treadway Commission (COSO) in Internal Control—Integrated Framework. Based on our assessment and those criteria, management believes that we maintained effective internal control over financial reporting as of December 31, 2012.
Our independent registered public accounting firm, Ernst & Young LLP, has issued a report on our internal controls over financial reporting as of December 31, 2012. See “Item 8. Consolidated Financial Statements and Supplementary Data.”
Changes in Internal Control over Financial Reporting
There have not been any changes in our internal control over financial reporting during the quarter ended December 31, 2012 that have materially affected, or are reasonably likely to materially affect, our internal control over financial reporting.
None.
PART III
Item 10. Directors, Executive Officers and Corporate Governance.
Board of Directors
The following individuals currently serve as members of the Company’s Board of Directors (the “Board”).
Name | Age | Position |
Nancy M. Taylor | 64 | Chairperson of the Board, Independent Director |
Terri Funk Graham | 58 | Independent Director |
David A. Levin | 72 | Independent Director |
Douglas T. Moore | 67 | Independent Director |
Joseph M. Nowicki | 62 | Independent Director |
Ashish Parmar | 48 | Independent Director |
Famous P. Rhodes | 49 | Independent Director |
Martin F. Roper | 61 | Independent Director |
Charles E. Tyson | 62 | Director, President and Chief Executive Officer |
Nancy M. Taylor. Ms. Taylor has served on the Board since 2014. Ms. Taylor is the former President and Chief Executive Officer of Tredegar Corporation, a manufacturing company, serving in such role from January 2010 to June 2015, and was a member of Tredegar’s board of directors from early 2010 until June 2015. Ms. Taylor has served as a director of TopBuild Corp., an installer and distributor or insulation and related building material products, since 2018 and as a director of Malibu Boats, Inc., a designer and manufacturer of recreational powerboats, since 2023 and was a director of Verso Corporation, a producer of coated papers, from November 2019 through March 2022.
Ms. Taylor has significant experience as a chief executive officer of a publicly-traded international manufacturer. Through her experience, she has gained and developed extensive business, finance, and leadership skills. Further, she possesses an understanding of strategic planning, risk assessment and international operations. In addition, she has experience serving as a director of a public company and brings strong corporate governance knowledge to the Board. Ms. Taylor has been a member of our Nominating and Corporate Governance Committee since January 2015 and a member of our Compliance and Regulatory Affairs Committee since May 2019. Ms. Taylor also served as a member of our Compensation Committee from May 2014 until May 2019. Additionally, Ms. Taylor was appointed Chairperson of our Board in November 2015. Through her service as a director, Ms. Taylor has gained insight, perspective and knowledge regarding our business, growth, operations, and personnel. Ms. Taylor has attained the designations of Board Leadership Fellow and NACD Directorship Certified.
Terri Funk Graham. Ms. Graham has served on the Board since 2018. Ms. Graham previously served as Chief Marketing Officer – Red Envelope for Provide Commerce, Inc., an e-commerce gifting company, from July 2013 to September 2014. Prior to that position, Ms. Graham joined Jack in the Box Inc., a restaurant company that operates and franchises Jack in the Box and Qdoba Mexican Grill restaurants, in 1990, and most recently served as its Senior Vice President and Chief Marketing Officer from September 2007 to December 2012. Ms. Graham has served as a director of Sprouts Farmers Market, Inc. since 2013 and previously served as a director of CV Sciences, Inc. from August 2019 until May 2022, 1-800 Contacts between 2015 to 2016 and Hot Topic, Inc. from June 2012 to June 2013.
Ms. Graham has over 30 years of branding and marketing experience in the retail industry, including extensive knowledge of digital and e-commerce business. Ms. Graham brings her public company board experience to our Board, including a strong corporate governance background. Ms. Graham has been a member of our Compensation Committee and Nominating and Corporate Governance Committee since September 2018. Ms. Graham became Chairperson of the Nominating and Corporate Governance Committee in May 2019. Ms. Graham has attained the designation of Board Leadership Fellow.
David A. Levin. Mr. Levin has served on the Board since 2017. Mr. Levin served as the President and Chief Executive Officer and Director of Destination XL Group, Inc., a specialty apparel retailer, from April 2000 to December 2018. From January 2019 to April 2019, Mr. Levin served as acting Chief Executive Officer of Destination XL Group, Inc. Mr. Levin previously served as a director of Christopher & Banks Corporation from 2012 to 2016.
Mr. Levin brings to the Board more than 30 years of retail experience and extensive experience as the president and chief executive officer of a public retail company. Mr. Levin has developed wide-ranging business and leadership skills in addition to
4
significant experience in the areas of merchandising, marketing, and operational issues. Further, he has experience serving on the boards of public companies. Mr. Levin has been a member of our Compensation Committee since May 2017, and its Chairperson since May 2019, and a member of our Audit Committee since May 2019. Mr. Levin also served as a member of our Compliance and Regulatory Affairs Committee from May 2017 until May 2019.
Douglas T. Moore. Mr. Moore has served on the Board since 2006. Mr. Moore is Chairman and Chief Executive Officer of CleanCore Solutions, Inc., since February 2024. CleanCore Solutions, Inc. is a manufacturer of residential and commercial cleaning products, which has filed a prospectus for an initial public offering. Mr. Moore continues in a limited role as a Managing Director of Fahrenheit Advisors where he has served since October 2022. Fahrenheit Advisors is a middle-market advisory firm that provides strategic consulting, and interim, fractional, and direct hire services. From 2020 to 2021, Mr. Moore served as the Chief Executive Officer and a director of 1847 Goedeker, Inc., an industry-leading direct-to-consumer appliance and furniture e-tailer. Prior to that time, Mr. Moore was Chief Executive Officer of Goedeker’s, an operating subsidiary of 1847 Holdings, LLC, from 2019 to 2020. Prior to that, he was Senior Vice President of FirstSTREET for Boomers and Beyond, Inc., a leading direct marketer of products for baby boomers, from October 2017 until August 2019.
Through his more than 25 years of retail experience, Mr. Moore has developed an understanding of strategic and tactical business issues that include store operations, merchandising, supply chain, sourcing, and human resource planning. He also possesses senior management, marketing, risk assessment and retail knowledge. He has been a member of our Nominating and Corporate Governance Committee since our initial public offering and a member of our Compliance and Regulatory and Affairs Committee since May 2016. Mr. Moore also served as a member of our Audit Committee from our initial public offering until May 2016 and as Chairperson of our Nominating and Corporate Governance Committee from our initial public offering until May 2019. Through his service as a director, Mr. Moore has gained insight, perspective and knowledge regarding our business, growth, operations, and personnel.
Joseph M. Nowicki. Mr. Nowicki served as Executive Vice President and Chief Financial Officer of Beacon Roofing Supply, Inc., a distributor of commercial and residential roofing products and related building materials, from 2013 until June 2020. Prior to assuming that position, he was Chief Financial Officer, Chief Compliance Officer and Treasurer of Spartan Motors, Inc., a specialty chassis, vehicle, truck body and aftermarket parts manufacturer for RV and emergency response customers. Mr. Nowicki has served as a director of UniFirst Corporation, a workwear and textile service company, since April 2022. Mr. Nowicki previously served as a director of Diversified Restaurant Holdings, Inc. from 2010 to 2020 and ASV Holdings, Inc. from 2017 to 2019.
Mr. Nowicki brings significant financial and information required by this Itemtechnology experience to the Board. As the former chief financial officer of a public corporation and having held other senior executive roles with other companies, Mr. Nowicki has developed operational and leadership aptitude in addition to his significant capability in the areas of strategic business planning, risk assessment and store operations. Mr. Nowicki has been a member of our Audit Committee since September 2020 and has served as Chairperson of our Audit Committee and as an “audit committee financial expert” since May 2021. Mr. Nowicki also has served as a member of our Compliance and Regulatory Affairs Committee since September 2020. Mr. Nowicki has attained the designations of Board Leadership Fellow and NACD Directorship Certified.
Ashish Parmar. Mr. Parmar has served on the Board since 2021. Mr. Parmar is incorporated by referencethe Chief Information Officer of Standard Industries, Inc., since February 2024. Standard Industries is a privately-held global industrial company. From May 2020 to January 2024, Mr. Parmar was the Senior Vice President & Chief Information Officer of Tapestry, Inc. and, prior to that, Mr. Parmar held various roles at Tapestry, including Senior Vice President, IT – Global Enterprise Solutions from 2017 to 2020; Vice President, IT – Supply Chain, and Enterprise Software Engineering & Architecture from 2016 to 2017; and Vice President, IT – Supply Chain, and Enterprise Software Engineering from 2014 to 2017. Mr. Parmar joined Tapestry in 2010 after serving as Director & Country Head of Information Technology with LF Logistics from 2007 to 2010.
Mr. Parmar brings more than 20 years of leadership and technology experience across luxury retail, logistics, and consumer electronics. Mr. Parmar has experience in leading digital transformations and delivering a seamless omnichannel experience. He is a key leader in strategic change initiatives to drive growth, develop corporate strategy, and drive new business opportunities. Mr. Parmar also has a breadth of international experience in both technology and supply chain and his experience as a Chief Information Officer is helpful to our oversight of cybersecurity. Mr. Parmar has attained the definitive proxy statementdesignation of NACD Directorship Certified and the CERT Certificate in Cybersecurity Oversight.
Famous P. Rhodes. Mr. Rhodes has served on the Board since 2017. Mr. Rhodes is the Chief Marketing Officer for Apex Service Partners, LLC, a residential HVAC, plumbing and electrical services provider, since January 2024. From November 2019 to January 2024, Mr. Rhodes was corporate Vice President, Chief Marketing and Technical Officer of Blue Compass RV, LLC (formerly RV Retailer, LLC), a recreational vehicle retail company. Prior to that, Mr. Rhodes was Executive Vice President and Chief Marketing Officer of Bluegreen Vacations Corporation, a vacation ownership company, from August 2017 to September 2019, Vice
5
President of Digital Marketing and Customer Experience for AutoNation, Inc., an automotive retailer, from 2015 to 2017, and Vice President of eCommerce for AutoNation, Inc. from 2012 to 2015.
Mr. Rhodes brings significant marketing and omnichannel retail experience to the Board. Currently serving as the chief marketing officer of a large retail corporation and having held other senior executive roles with other retail companies, Mr. Rhodes has developed operational and leadership aptitude in addition to his significant capability in the areas of digital technology and customer experience. Mr. Rhodes was a member of our Audit Committee from 2017 to 2021; has been a member of our Compensation Committee since 2018; and has been a member of our Nominating and Corporate Governance Committee since 2021.
Martin F. Roper. Mr. Roper has served on the Board since 2006. Mr. Roper is Chief Executive Officer and a director of The Vita Coco Company, Inc. (formerly All Market, Inc.), a healthy branded beverage and coconut water supplier, since May 2022. Prior to that time, Mr. Roper was Co-Chief Executive Officer of Vita Coco from January 2021 until May 2022. He was President of All Market, Inc., from September 2019 until January 2021. From January 2001 until April 2018, Mr. Roper served as the President and Chief Executive Officer of The Boston Beer Company, Inc., a craft brewer, where he had worked as an employee since 1994. Mr. Roper served on the board of directors of Boston Beer from 1999 until his retirement in April 2018. Since November 2018, Mr. Roper has served on the board of Financial Information Technologies, LLC (Fintech), a private company providing solutions to alcohol beverage distributors and retailers. Since September 2019, Mr. Roper has also served on the board of directors of Bio-Nutritional Research Group, Inc., a private company which is the producer and marketer of Power Crunch energy bars.
As a director and chief executive officer of a publicly-traded company, Mr. Roper has senior management, strategic development, and financial skills. In addition, Mr. Roper possesses experience in public relations, consumer marketing, investor relations, product development and risk management. Mr. Roper has been a member of the Audit Committee since our initial public offering and Chairperson of the Compliance and Regulatory Affairs Committee since May 2019. Mr. Roper also served as Chairperson of the Compensation Committee from our initial public offering until May 2019. His experience as a director has provided him with insight, perspective and knowledge regarding our business, growth, operations, and personnel. Mr. Roper has attained the designations of Board Leadership Fellow and NACD Directorship Certified.
Charles E. Tyson. Mr. Tyson was appointed President and Chief Executive Officer in May 2020 and concurrently joined LL Flooring’s Board of Directors. Mr. Tyson previously served as Interim President from February 2020 until May 2020 and served as Chief Customer Experience Officer from June 2018 until May 2020. From 2008 to 2017, Mr. Tyson held various roles at Advance Auto Parts, Inc., an automotive aftermarket parts provider, including Executive Vice President, Merchandising, Marketing and Supply Chain from 2013 annual meetingto 2017 and Senior Vice President, Merchandising and Replenishment, from 2008 to 2013. Prior to that, Mr. Tyson served in a variety of shareholders,Senior Vice President roles at Office Max and Office Depot. Mr. Tyson has served as a director of The Container Store Group, Inc. since March 2024.
Mr. Tyson has been with LL Flooring for over six years, including two years as Chief Customer Experience Officer. He currently serves as LL Flooring’s President and Chief Executive Officer. He has deep retail and commercial experience and has served in senior leadership roles at multiple publicly-traded companies. The Board benefits from his broad operating, supply chain, retail, merchandising, marketing, customer insights and strategic planning experience.
Executive Officers
The following table sets forth the names, ages, and positions of the Company’s current executive officers.
Name | Age | Position |
Charles E. Tyson | 62 | Director, President and Chief Executive Officer |
Matthew T. Argano | 51 | Senior Vice President, Chief Human Resources Officer |
Douglas S. Clark, Jr. | 45 | Senior Vice President, Merchandising and Supply Chain |
Alice G. Givens | 52 | Senior Vice President, Chief Legal, Ethics and Compliance Officer and Corporate Secretary |
Kristian B. Lesher | 54 | Senior Vice President, Chief Technology Officer |
Robert L. Madore | 59 | Executive Vice President, Chief Financial Officer |
Charles E. Tyson. See above
Matthew T. Argano, Ph.D., has been our Senior Vice President, Chief Human Resources Officer since April 2020.Prior to joining the Company, Dr. Argano was Senior Vice President, Chief People Officer of Altar'd State, Inc., a women’s fashion retailer
6
from 2016 to 2020. From 2012 to 2016, Dr. Argano was Senior Vice President, Human Resources of The Fresh Market, Inc., a specialty grocery retailer.
Douglas S. Clark, Jr., has been our Senior Vice President, Merchandising and Supply Chain since June 2020. Mr. Clark previously served as our Interim Senior Vice President, Merchandising and Supply Chain from February 2020 to June 2020 and served as Senior Vice President, Supply Chain from October 2018 to February 2020 and as Vice President, Inventory Management from February 2017 to October 2018. Prior to joining the Company, Mr. Clark held merchandising roles of increasing responsibility at DSW, Inc., a retailer of shoes and fashion accessories, most recently as Vice President, Merchandise Analysis & Operations from September 2016 to February 2017.
Alice G. Givens, has been our Senior Vice President, Chief Legal, Ethics and Compliance Officer and Corporate Secretary since October 2022 and, prior to that, was Senior Vice President, Chief Legal Officer and Corporate Secretary from September 2020 to October 2022. Prior to joining the Company, Ms. Givens was Senior Vice President, General Counsel, Chief Compliance Officer and Secretary of Ruth’s Hospitality Group, Inc. (“RHGI”), a fine dining restaurant company, from 2019 to 2020 and Vice President, General Counsel, Chief Compliance Officer & Secretary of RHGI from 2016 to 2019. From 2007 to 2016, Ms. Givens served as a legal officer at J. Crew Group, Inc., an omnichannel retailer of apparel, shoes, and accessories, where she most recently was Vice President and Associate General Counsel from 2012 to 2016.
Kristian B. Lesher, has been our Senior Vice President and Chief Technology Officer since January 2023. Prior to joining the Company, Mr. Lesher served as Vice President, Customer Facing Technologies, of Advance Auto Parts, Inc., an automotive aftermarket parts provider, from May 2015 until January 2023, and as Director of eCommerce Systems and Enterprise Services from April 2009 until May 2015.
Robert L. Madore, has been our Executive Vice President and Chief Financial Officer since July 2023. Prior to his appointment, Mr. Madore served as Interim Chief Financial Officer of F45 Training Holdings, Inc., a global fitness franchisor, from February 2023 to July 2023. Prior to joining F45, Mr. Madore was the Chief Financial Officer of Cronos Group, Inc., a global cannabinoid company, from 2021 to 2022 and EVP and Chief Financial Officer of American Eagle Outfitters, Inc., a global specialty retailer of clothing, accessories and personal care products, from 2016 to 2020. From 2004 until 2016, Mr. Madore was with Ralph Lauren Corporation, a global design, marketing and distributor or apparel, footwear & accessories, home, fragrance and hospitality products, including as Chief Financial Officer from 2015 to 2016, SVP Corporate Finance from 2011 to 2014, and Chief Financial Officer/SVP of Operations of Ralph Lauren Retail Group from 2004 to 2011. Mr. Madore is a Certified Public Accountant.
Delinquent Section 16(a) Reports
Section 16(a) of the Exchange Act requires our directors and executive officers and persons who own more than 10% of a registered class of our equity securities to file with the SEC initial reports of beneficial ownership and reports of changes in beneficial ownership of our equity securities. To facilitate compliance, we have undertaken the responsibility to prepare and file these reports on behalf of our officers and directors. Based on a review of the SEC-filed ownership reports during 2023 and written representation of our directors and officers, we believe that all Section 16(a) filing requirements were met during 2023 except for one Form 4 filing for each of Messrs. Parmar and Roper on May 10, 2023 to report grants of restricted stock units, which will bewere filed no later than 120 days after December 31, 2012.late due to administrative error.
Code of Ethics
We have a Code of Business Conduct and Ethics, which applies to all employees, officers and directors of Lumber LiquidatorsLL Flooring Holdings, Inc. and its direct and indirect subsidiaries. Our Code of Business Conduct and Ethics meets the requirements of a “code of ethics” as defined by Item 406 of Regulation S-K, and applies to our Chief Executive Officer, Chief Financial Officer (who is both ourprincipal executive officer and principal financial officer and principal accounting officer), as well as all other employees. Our Code of Business Conduct and Ethics also meets the requirements of a code of conduct under Rule 303A.10 of the NYSE Listed Company Manual. Our Code of Business Conduct and Ethics is posted on our website at www.lumberliquidators.comwww.LLFlooring.com in the “Corporate Governance” section of our Investor Relations home page.
We intend to provide any required disclosure of an amendment to or waiver from our Code of Business Conduct and Ethics on our website at www.LLFlooring.com in the “Corporate Governance” section of our Investor Relations home page promptly following the amendment or waiver. We may elect to disclose any such amendment or waiver in a report on Form 8‑K filed with the SEC either in addition to or in lieu of the website disclosure. The information contained on or connected to our website is not incorporated by reference in this report and should not be considered part of this or any other report that we file with or furnish to the SEC.
7
Corporate Governance
We are committed to having sound corporate governance principles. Our Code of Business Conduct and Ethics, which applies to our directors, officers and associates, our Corporate Governance Guidelines and the charters of the Audit, Compensation, Nominating and Corporate Governance and Compliance and Regulatory Affairs Committees are available on our website, https://investors.llflooring.com/corporate-governance, and are also available in print, free of charge, to any stockholder who requests them. Such requests should be directed to Corporate Secretary, LL Flooring Holdings, Inc., 4901 Bakers Mill Lane, Richmond, Virginia 23230.
Committees of the Board
The Board has established four standing committees: the Audit Committee, the Compensation Committee, the Nominating and Corporate Governance Committee, and the Compliance and Regulatory Affairs Committee, each composed entirely of directors that the Board has affirmatively determined to be independent. Each committee operates pursuant to a written charter adopted by the Board that sets forth its roles and responsibilities and provides for an annual evaluation of its performance. Each committee charter includes oversight responsibilities for environmental, social and governance (“ESG”) matters. The charters of all four standing committees are available at the investor relations page of our website at https://investors.llflooring.com/committee-chartersand will be provided to any stockholder without charge upon the stockholder’s written request to our Corporate Secretary.
Each year, committee and committee chair assignments are made at the Board meeting immediately following the Annual Meeting of Stockholders. The current composition of each committee is as follows:
Audit Committee
Joseph M. Nowicki (Chairperson)
David A. Levin
Ashish Parmar
Martin F. Roper
Compensation Committee
David A. Levin (Chairperson)
Terri Funk Graham
Ashish Parmar
Famous P. Rhodes
Nominating and Corporate Governance Committee
Terri Funk Graham (Chairperson)
Douglas T. Moore
Famous P. Rhodes
Nancy M. Taylor
Compliance and Regulatory Affairs Committee
Martin F. Roper (Chairperson)
Douglas T. Moore
Joseph M. Nowicki
Nancy M. Taylor
The Board may establish such other committees as it deems appropriate, in accordance with applicable law and regulations and our Certificate of Incorporation and Bylaws.
Audit Committee. The Audit Committee assists the Board in fulfilling the oversight responsibility of the Board relating to: (i) the integrity of our financial statements and financial reporting process and our systems of internal accounting and financial controls; (ii) the performance of the internal audit function; (iii) the annual independent audit of our financial statements; (iv) the engagement of our independent auditor and the evaluation of the independent auditor’s qualifications, independence and performance; (v) our compliance with legal and regulatory requirements as it relates to accounting, auditing and financial reporting matters; (vi) the
8
implementation and effectiveness of our disclosure controls and procedures and internal control over financial reporting; (vii) the framework for identification of enterprise risks; and (viii) other matters set forth in the charter of the Audit Committee. The Audit Committee has the sole authority to appoint, retain, compensate, evaluate, and terminate the independent auditor. The Audit Committee approves procedures for the pre-approval of the engagement of the independent auditor to provide audit and non-audit services. It is also responsible for establishing, publishing, and maintaining and overseeing our “whistleblower” procedures. The Audit Committee is responsible for reviewing and discussing with management the type and presentation of the Company’s ESG disclosures included in the Company’s periodic reporting or financial statements and the adequacy and effectiveness of applicable internal controls related to such disclosures. In addition, the Audit Committee periodically reviews and discusses with management the Company’s risks relating to cybersecurity, data privacy, and other information technology risks, controls, and procedures.
The Board, in its business judgment, has determined that all of the current members of the Audit Committee are, and each member who served on the Audit Committee during 2023 was, during the period in which he served, independent, as determined in accordance with the rules of the New York Stock Exchange (“NYSE”) and relevant federal securities laws and regulations. The Board also has determined that all of the Audit Committee members are financially literate as defined by the rules of the NYSE and that Mr. Nowicki qualifies as an “audit committee financial expert” as defined by regulations of the SEC.
Item 11. Executive Compensation.
Compensation Discussion and Analysis
Our compensation philosophy is to maintain effective compensation programs that are as practical and flexible as possible and permit us to make responsive adjustments to changing market conditions and other internal and external factors. We strive to provide our executives with compensation that is competitive within our industry. In doing so, we seek to attract and retain the key associates necessary to achieve the continued growth and success of our business while remaining mindful of our desire to control costs. Further, it is our intent to align executive officer pay with stockholders’ interests, recognize individual accomplishments, align executive management behind common objectives and strike a balance between risk and reward in designing our executive compensation programs.
The Compensation Committee of the Board is responsible for implementing and administering our executive compensation plans and programs. In that role, the Compensation Committee reviews our executive officer compensation program every year to review the appropriateness, rationale, and continued viability of our compensation philosophies, including the extent to which our programs might encourage associates to take unnecessary or excessive risks that could result in material adverse risk to the Company.
Compensation Governance Features
We believe the following practices and policies promote sound compensation governance and are in the best interests of our stockholders and executives:
WHAT WE DO | WHAT WE DON'T DO | ||
✓ | Balance of short-term and long-term incentives | ☒ | No payout of short-term or long-term awards greater |
✓ | Have a substantial portion of executive compensation | than 200% of target | |
at risk and tied to enhanced stockholder value | ☒ | No long-term or indefinite employment agreements | |
✓ | Establish different performance measures used for | ☒ | No hedging or pledging of shares as collateral |
short-term and long-term incentive programs | ☒ | No excessive perquisites | |
✓ | Utilize robust share ownership guidelines | ☒ | No issuance of excessive equity compensation that |
✓ | Have clawback provisions incorporated into | would dilute stockholder value | |
incentive compensation | ☒ | No excessive change-in-control severance benefits | |
✓ | Conduct annual Say-on-Pay votes | ||
✓ | Require a double trigger for the payment of most | ||
change-in-control benefits |
2023 Say On Pay Results
Our Compensation Committee and Board are very interested in the ideas and any concerns of our stockholders regarding executive compensation. An advisory vote on executive compensation was presented to our stockholders at last year’s Annual
9
Meeting of Stockholders and was approved by 88% of votes cast by stockholders. As our compensation programs continue to evolve, we will continue to seek input from our stockholders and reflect that in the structure of our compensation programs.
What Guides Our Program
Compensation Philosophy & Objectives
Our executive compensation program is designed to:
✓ | Link pay to performance | ✓ | Motivate and reward superior performance that supports |
✓ | Attract, develop, and retain an experienced and | our business and strategic plans and contributes to the | |
highly qualified executive officer team | long-term success of the Company | ||
✓ | Encourage long-term commitment and align the | ✓ | Promote internal pay equity |
interests of executive officers with those of our | ✓ | Reinforce our core values of thinking like our customers, | |
stockholders, customers, and other stakeholders by | acting like owners, succeeding as a team, expecting | ||
placing a substantial portion of pay at risk through | continuous improvement, and acting with integrity | ||
performance goals that, if achieved, are expected to | |||
increase total stockholder return and enhance | |||
customer service |
In determining the compensation of our executive officers, the Compensation Committee evaluates total overall compensation, as well as the mix of salary, cash bonus incentives, equity incentives and other components, using a number of factors including the following:
Elements of Pay
The Company’s compensation philosophy is supported by the following principal elements of pay:
Base Salary | Cash | Provides a competitive rate relative to comparable jobs at similar companies and enables the Company to attract and retain critical executive talent. |
Annual Cash Incentive Awards | Cash | Rewards individuals for performance if they attain pre-established financial and strategic targets that are set by the Compensation Committee at the beginning of the year. |
Long-Term Incentive Awards | Equity | Promotes a balanced focus on driving performance, retaining talent, and aligning the interests of the Company’s executives with those of its stockholders. |
Pay Mix
Our compensation program utilizes a mix of compensation elements, including base salary, short-term incentives, and long-term incentives.
10
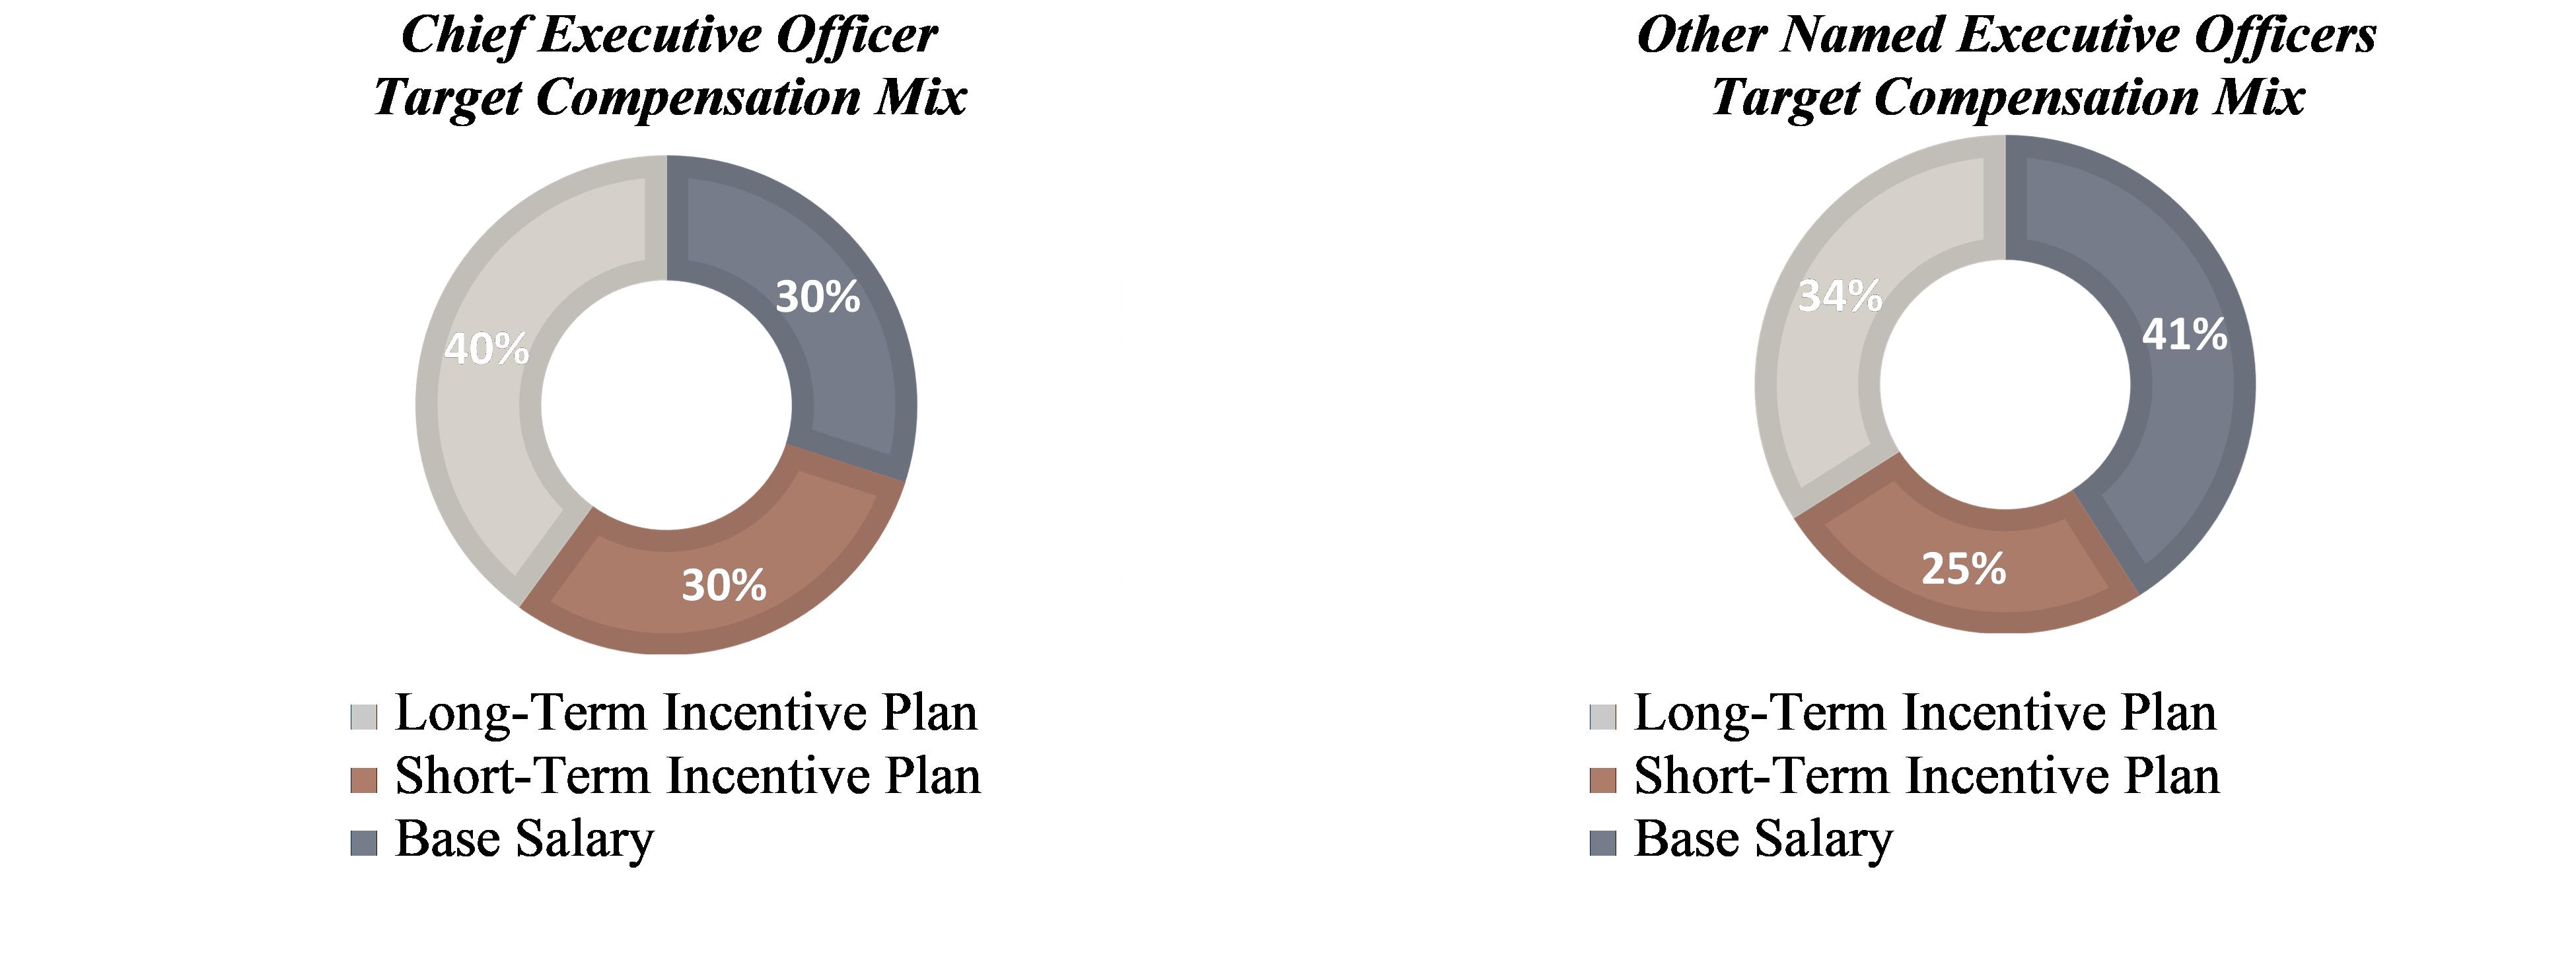
The Decision-Making Process
The Role of the Compensation Committee. Details of the Compensation Committee’s authority and responsibilities are specified in its charter, a copy of which is available on our investor relations page of our website at: https://investors.llflooring.com/committee-charters.
The Role of the Independent Compensation Consultant. The Compensation Committee has engaged Pearl Meyer as its independent compensation consultant. The Compensation Committee relies on Pearl Meyer for input on pay philosophy, current market trends, regulatory considerations, selection of the peer group, competitive market analysis and incentive plan design. Additionally, Pearl Meyer provides information about market trends in director pay practices and advises the Nominating and Corporate Governance Committee and the Board on director pay levels and program design.
The Compensation Committee, after considering the SEC and NYSE standards, including the six factors set forth in Section 10C-1(b)(4)(i) through (vi) under the Exchange Act, and other factors, determined that Pearl Meyer was independent and that its engagement did not present any conflicts of interest. Pearl Meyer also determined that it was independent and free from conflict with respect to the engagement and confirmed this in a written statement delivered to the Chairperson of the Compensation Committee.
Pearl Meyer reports directly to the Compensation Committee on all work assigned by the Compensation Committee. Pearl Meyer also interacts with management when necessary and appropriate to carry out its assignments. Pearl Meyer, in its discretion, from time to time seeks input from management regarding program design and the accuracy of information that is included in materials presented to the Compensation Committee.
Peer Group
The Compensation Committee may engage Pearl Meyer to review and assess the Company’s executive officer compensation program for purposes of assessing compensation components and levels for the following year. A review of the compensation peer group was conducted in the fall of 2022 to develop the 2023 peer group. This review focused on the composition of the peer group relative to the Company in terms of industry sector, revenues, market capitalization, growth, and profitability. The review also considered overlap between the Company’s peer group and the peer groups selected by proxy advisory firms. Pearl Meyer recommended the addition of two new companies to the peer group. As a result, the Compensation Committee determined American Woodmark Corporation and Tile Shop Holdings, Inc. be added. The following is a list of companies included in the peer group used for 2023 compensation decisions:
American Woodmark Corporation | Kirklands, Inc. |
Big 5 Sporting Goods Corporation | Monro, Inc. |
Citi Trends, Inc. | Purple Innovation, Inc. |
Conn’s, Inc. | Shoe Carnival, Inc. |
Ethan Allen Interiors Inc. | Sleep Number Corporation |
Floor & Décor Holdings, Inc. | The Container Store Group, Inc. |
Haverty Furniture Companies, Inc. | Tile Shop Holdings, Inc. |
11
Hibbett Sports, Inc. | Zumiez Inc. |
La-Z-Boy Incorporated |
2023 Executive Compensation Program in Detail
Base Salary
Base salary levels for our named executive officers are reviewed each year and adjusted based upon a variety of factors including the named executive officer’s tenure with us, scope of responsibility and influence on our operations, individual performance and accomplishments, internal equity, experience, and changes in the competitive marketplace, as well as the economic environment and expense considerations. The factors impacting base salary levels are not independently assigned specific weights.
The following table outlines the base salary adjustments provided to our named executive officers for 2023:
NEO | 2022 Base Salary | 2023 Base Salary | % Increase |
Charles E. Tyson | $772,500 | $772,500 | 0% |
Robert L. Madore(1) | Not applicable | $650,000 | N/A |
Alice G. Givens | $409,234 | $450,157 | 10.0% |
Matthew T. Argano | $372,393 | $409,632 | 10.0% |
Douglas S. Clark, Jr. | $370,594 | $409,540 | 10.5% |
(1) Mr. Madore was appointed our EVP, Chief Financial Officer as of July 10, 2023. Terry Blanchard is a Named Executive Officer for 2023 and served as our Interim Chief Financial Officer from March 13, 2023, until July 10, 2023, pursuant to a Services Agreement that the Company entered into with Randstad Professionals US, LLC d/b/a Tatum. Payments under this agreement are reported in the Summary Compensation Table below. Mr. Blanchard did not participate in the Company’s Annual Cash Bonus Awards or Long-Term Equity Incentive Plan Awards.
Annual Cash Bonus Awards
In 2023, our named executive officers had the opportunity to earn an annual cash bonus award under our Annual Bonus Plan for Executive Management (the “Bonus Plan”). The amounts payable under the Bonus Plan are expressed as a percentage of annual base salary for each participant (the “Target Bonus”). The Target Bonuses are reviewed annually and vary among the Bonus Plan participants based upon, among other things, their responsibilities, ability to influence operations and performance, internal equity considerations, and position. Historically, the maximum potential annual cash bonus award that the executive officers could achieve was 200% of target and the amount of the bonus payable at the threshold level of performance was 50%. Results below threshold result in no cash bonus paid.
For 2023, the Compensation Committee reduced the potential payout levels to make the Bonus Plan more affordable in light of the business challenges in 2023. As a result, the maximum potential annual cash bonus award that the executive officers could achieve was 100% of target and the amount of the bonus payable at the threshold level of performance was 25%. Results below threshold result in no cash bonus paid. Named executive officers that were hired during the year had the opportunity to earn a prorated bonus under the Bonus Plan based upon the duration of their service during the year.
For the Bonus Plan, the Compensation Committee also determined that it would not use Adjusted Operating Income as a metric in 2023 given the economic uncertainty and instead added Adjusted Gross Margin as a metric related to profitability. The 2023 Bonus Plan approved by the Compensation Committee was based 50% on Net Sales, 30% on Adjusted Gross Margin and 20% on a strategic goal related to deployment and utilization of a customer relationship management system (the “Strategic Goal”). Achievement of the Strategic Goal required that the Company (a) execute the four-stage deployment schedule launching customer relationship management capabilities to all store associates in August 2023, and (b) achieve 100% utilization of 1:1 activities/opportunities ratio by 80% of the stores by the end of 2023. Achievement of the Strategic Goal required both of these outcomes.
The performance goals for the 2023 Bonus Plan were as follows:
12
Net Sales (in ‘000) | Adjusted Gross Margin (%)(1) | Strategic Goal | Percent Target Bonus Awarded for Associates Eligible for Maximum Payout(2) | |
50% | 30% | 20% | ||
Less than $1,017,450 | Less than 38.10% | See above | 0% | |
Threshold | $1,017,450 | 38.10% | Achieved | 25% |
Target | $1,071,000 | 38.60% | Achieved | 50% |
Maximum | $1,285,200 | 39.10% | Achieved | 100% |
Actual Performance Achieved & % of Target Payout Earned | $904,746 | 37.5% | Achieved | 10% |
The following table provides the amount of the award under the Bonus Plan for each named executive officer:
NEO | Target Award Opportunity | Actual Award Earned | |
As a % of Target Bonus | $ Value | ||
Charles E. Tyson | 100% | 10% | $77,250 |
Robert L. Madore | 80% | 10% | $26,000(1) |
Alice G. Givens | 60% | 10% | $27,009 |
Matthew T. Argano | 60% | 10% | $24,578 |
Douglas S. Clark, Jr. | 60% | 10% | $24,571 |
Long-Term Equity Incentive Awards
The long-term component of our compensation program consists of equity awards. We intend equity awards to be a meaningful portion of our named executive officers’ total compensation in order to align their interests with our long-term growth and the creation of stockholder value as well as to promote retention of our executive team.
Historically, we issued annual equity awards using a mix of 50% performance-based restricted stock, 25% time-based restricted stock (which vest ratably over four years), and 25% stock options (which vest ratably over four years). In 2022, Pearl Meyer conducted an analysis of the market practices among the Company’s peer group with respect to short- and long-term incentive plan practices. For the long-term incentive plan, they noted that a vesting period of three years and a mix of time-based restricted stock and performance-based restricted stock was most prevalent.
As a result of this benchmarking, in March 2023 the Compensation Committee issued annual equity awards using a mix of 50% performance-based restricted stock and 50% time-based restricted stock (which vest ratably over three years).
The performance-based restricted stock granted historically vested based on obtaining an adjusted EBITDA goal. For the 2023 performance-based restricted stock grant, the Compensation Committee determined it would use a three-year relative total shareholder return (“rTSR”) compared to the S&P 600 Retailing Industry Group as the performance measure. This decision was based on the economic uncertainty, headwinds from customs issues related to vinyl flooring and challenges with historic plan performance.
For the 2023 performance-based restricted stock grant, none of these shares will vest unless the rTSR performance objectives are achieved at threshold, with payouts of 25% and 200% of target, for relative performance at the 25thand 75th percentiles, respectively. Any awards earned at the end of the three-year performance period will be paid at that time.
13
2023 Target Long-Term Incentive Award Grants
The table below shows the target annual long-term incentive award values granted during the 2023 fiscal year for each of the named executive officers:
| Performance-Based | Time-Based |
|
NEO | Restricted Stock | Restricted Stock | Total Value |
Charles E. Tyson | $500,000 | $500,000 | $1,000,000 |
Robert L. Madore | $175,000 | $425,000 | $600,000 |
Alice G. Givens | $175,000 | $175,000 | $350,000 |
Matthew T. Argano | $175,000 | $175,000 | $350,000 |
Douglas S. Clark, Jr. | $200,000 | $150,000 | $350,000 |
2021-2023 Long-Term Incentive Awards
In February 2021, the Company granted a performance-based restricted stock award that would vest based on obtaining an adjusted EBITDA goal over a three-year performance period from January 1, 2021, through December 31, 2023. None of these shares of performance-based restricted stock would vest unless the performance objectives were achieved at threshold or above. Actual performance over the three-year performance period ending December 31, 2023, was below threshold; therefore, none of these awards were earned or vested.
Performance Metric | Threshold (000s) | Target (000s) | Maximum (000s) | Actual (000s) | % of Target Payout Earned |
Adjusted EBITDA* | $234,850 | $293,563 | $352,275 | $44,000 | 0% |
*Adjusted EBITDA is a non-GAAP measure equal to net (loss) income before interest expense, income tax (benefit) expense, depreciation, and amortization, as further adjusted to exclude the effect of antidumping and countervailing adjustments, (recovery) accrual for legal matters and settlements, legal and professional fees, and goodwill impairment charges.
Other Practices, Policies & Guidelines
Stock Ownership Guidelines
We have a stock ownership guidelines policy (the “Ownership Guidelines”) for our non-employee directors and certain of our executive officers (as designated by the Board) in order to align the financial interests of such executive officers and non-employee directors with those of the Company’s stockholders and to further promote the Company’s commitment to sound corporate governance. The stock ownership requirements are as follows:
Position | Value of Shares |
Chief Executive Officer | 5 times base salary |
Chief Financial Officer | 2 times base salary |
Other Executive Officers | 1 times base salary |
Non-Employee Directors | 5 times annual board cash retainer (Exclusive of committee compensation, but inclusive of supplemental base retainer for the Board Chairperson) |
The participants in the Ownership Guidelines are expected to meet the applicable guideline no more than five years after first becoming subject to them and are expected to continuously own sufficient shares to meet the applicable guideline once attained. Due to a decline in the value of the Company’s stock, none of our executive officers and directors, except for Mr. Roper, were in compliance with the holding guidelines in the Ownership Guidelines as of December 31, 2023. As a result, the Ownership Guidelines provide that each such officer and director is prohibited from selling any common stock of the Company.
Stock that may be considered in determining compliance with the Ownership Guidelines includes:
14
The Compensation Committee is responsible for monitoring the application of the Ownership Guidelines as it pertains to our executive officers, and the Nominating and Corporate Governance Committee is responsible for monitoring the application of the Ownership Guidelines as it pertains to our non-employee directors.
Clawback Provisions
In 2023 we updated our policy for the recovery of erroneously awarded compensation to add requirements for the mandatory clawback of incentive compensation following an accounting restatement, as required by NYSE listing standards. The policy applies to current and former executive officers of the Company, including the named executive officers. In the event the Company is required to prepare an accounting restatement to correct material noncompliance with any financial reporting requirement under U.S. federal securities laws, it is the Company’s policy to recovery erroneously awarded incentive-based compensation received by its executive officers, with certain limited exceptions permitted under the NYSE listing standards. The recovery of such compensation applies regardless of whether an executive officer engaged in misconduct or otherwise caused or contributed to the requirement for a restatement.
We have also retained discretion in our equity incentive award agreements to recover, as deemed appropriate and to the extent permitted by law, any equity incentive compensation awarded to or received by an employee if as a result of material non-compliance with any financial information required to be reported under securities laws, the Company is required to prepare a restatement of its financial statements. This provision applies to the proceeds of all or a portion of the equity awarded within the three fiscal year-period preceding the date of such restatement. The forfeited or repayment amount shall equal the difference between the Restricted Stock awarded to the employee and the amount, if any, that would have been granted based on the restated financial statements. The Compensation Committee shall determine and approve the amount of such forfeited or repayment amount. Repayment required under the equity award agreements shall be enforced by the Board or its delegate, in the manner the Board or its delegate determines to be appropriate.
Prohibition on Pledging or Hedging Company Stock
Our Insider Trading Policy provides that no insider may pledge the Company’s securities or hold the Company’s securities in a margined account. Further, our policy prohibits our insiders and associates from buying or selling options, warrants, puts, and calls or similar instruments on the Company’s securities, selling the Company’s securities short or entering into hedging or monetization transactions or similar arrangements with respect to the Company’s securities. For purposes of our Insider Trading Policy, a copy of which can be found on our website, insiders include, among others, our officers and directors.
Retirement, Deferred Compensation and Pension Plans
Our executive officers who are eligible may participate at their election in our 401(k) retirement savings plan that provides all associates with an opportunity to contribute up to 50% of their eligible compensation, subject to Internal Revenue Service limitations, to the plan on a tax-deferred basis to be invested in specified investment options and distributed upon their retirement. In addition, a Roth feature allows all associates to contribute up to 50% of their eligible compensation on an after-tax basis. Consistent with the 401(k) plan, we match 100% of the first 3% of employee contributions and 50% of the next 2% of employee contributions. This matching contribution is allocated to both traditional 401(k) deferrals and Roth contributions. Associates are immediately 100% vested in the Company’s matching contributions. In 2022, each of the named executive officers contributed to the 401(k) plan and received matching contributions consistent with our Company-wide program described above.
Severance Agreements
We have entered into Severance Agreements with each of the named executive officers, as well as other members of the executive team. The Severance Agreements provide for a fixed term and certain severance payments and benefits to these executives upon termination of their employment under defined circumstances, including in connection with a change-in-control. In addition, in connection with the execution of the Severance Agreements, the Company and each of these executives entered into Confidentiality,
15
Non-Solicitation and Non-Competition Agreements (the “Non-Compete Agreements”). For further discussion of the Severance Agreements, see the “Potential Payments Upon Termination or Change of Control” herein.
Tax Deductibility Under Section 162(m)
Section 162(m) of the Internal Revenue Code generally sets a limit of $1 million on the amount of compensation that we may deduct for federal income tax purposes in any given year with respect to the compensation of each of our named executive officers. Effective for the years beginning on or after January 1, 2018, there is no exception under Section 162(m) for qualified performance-based compensation.
We will continue to consider the impact of the deduction limit under Section 162(m) when developing and implementing our executive compensation programs, but we believe the primary purpose of our executive compensation arrangements is to support our business strategy and the long-term interests of our stockholders. Therefore, we believe it is important that we maintain the flexibility to award compensation that may not be tax deductible to promote our various corporate goals.
Compensation Risk Assessment
Among other things, the Compensation Committee reviews our compensation policies and practices to determine whether they subject us to unnecessary or excessive risk. In so doing, the Compensation Committee considers whether such policies and practices are appropriately structured to promote the achievement of goals without encouraging the taking of unwarranted or undue risk. Additionally, the Compensation Committee reviews the relationship between our risk management policies and practices and compensation and evaluates compensation policies and practices that could mitigate risks relating to our compensation program.
We believe that our compensation programs discussed herein are designed with the appropriate balance of risk and reward in relation to our overall business strategy and do not incent executive officers or other associates to engage in conduct that creates unnecessary or unjustifiable risks. Specifically, our mix of rewards for short-term performance through base salary and annual cash bonus awards, and for long-term performance through equity incentive awards supports these compensation objectives. Moreover, we believe that our utilization of these different compensation components allows us to manage the risks inherent with performance-based compensation. Additionally, our use of mitigation tools such as clawback provisions, caps on our incentive plans, oversight by an independent committee of non-employee directors and significant vesting periods for equity awards, provide additional risk protection.
Based upon the review of our compensation policies and practices, including the allocation between fixed and variable compensation and short-term and long-term compensation, we have concluded that they do not create risks that are reasonably likely to have a materially adverse effect on the Company.
Compensation Committee Interlocks and Insider Participation
During the 2023 fiscal year, the members of the Compensation Committee were David A. Levin, Terri Funk Graham, Ashish Parmar, and Famous P. Rhodes. None of the members of our Compensation Committee will be or has ever been one of our officers or associates. None of our executive officers serves or has served as a member of the board of directors or compensation committee, or similar committee performing equivalent functions, of any other company whose executive officer(s) served as a member of our Board or our Compensation Committee.
Compensation Committee Report
The Compensation Committee has reviewed and discussed with management the Compensation Discussion and Analysis contained in this Amendment No. 1. Based upon that review and discussion, the Compensation Committee recommends to the Board that the Compensation Discussion and Analysis be included in this Amendment No. 1 to the Annual Report on Form 10-K for the fiscal year ended December 31, 2023.
COMPENSATION COMMITTEE
David A. Levin, Chairperson
Terri Funk Graham
Ashish Parmar
16
Famous P. Rhodes
Summary Compensation Table
The following table and descriptions set forth information concerning compensation paid to or earned by the president and chief executive officer, the chief financial officer, and the three other most highly compensated individuals who were serving as our executive officers at the end of the 2023 fiscal year, and one individual who served as interim chief financial officer for a portion of the 2023 fiscal year. We refer to these individuals throughout this Amendment No. 1 as our “Named Executive Officers.”
Name and Principal Occupation | Year | Salary ($) | Bonus ($) | Stock Awards ($)(1) | Option Awards ($)(1) | Non-Equity Incentive Plan Compensation ($)(2) | All Other Compensation ($) | Total |
Charles E. Tyson(3) President & Chief Executive Officer | 2023 2022 2021 | 772,500 767,740 740,385 | - - - | 1,000,000 749,985 749,973 | 0 249,994 249,987 | 77,250 245,614 407,107 | 26,692 25,709 26,636 | 1,876,443 2,039,043 2,174,088 |
Robert L. Madore(4) Chief Financial Officer | 2023 | 300,000 | 266,099 | 600,000 | 0 | 26,000 | 30 | 1,192,129 |
Alice G. Givens(5) Chief Legal, Ethics & Compliance Officer and Corporate Secretary | 2023 2022 2021 | 441,500 406,306 393,396 | - - - | 350,000 243,739 224,973 | 0 81,247 74,999 | 27,009 65,057 107,312 | 17,549 22,200 178,420 | 836,058 818,549 979,100 |
Matthew T. Argano(6) Chief Human Resources Officer | 2023 2022 2021 | 401,755 369,729 357,915 | 0 60,000 - | 350,000 224,969 149,990 | 0 74,993 50,000 | 24,578 59,201 97,651 | 22,706 16,958 43,315 | 799,038 805,849 698,872 |
Douglas S. Clark, Jr.(7) SVP, Merchandising & Supply Chain | 2023 2022 2021 | 401,277 368,311 357,915 | 0 60,000 - | 350,000 149,985 124,980 | 0 49,995 124,993 | 24,571 58,915 97,651 | 4,385 12,802 11,786 | 780,683 700,008 717,326 |
Terry F. Blanchard(8) Former Interim Chief Financial Officer | 2023 | 317,355 | - | - | - | - | 26,886 | 344,241 |
17
Grants of Plan-Based Awards
The following table provides information on grants of plan-based awards made to our named executive officers during the 2023 fiscal year:
|
|
|
|
| All Other Stock Awards: | Grant Date Fair Value of | ||||
Name/Award Type | Grant Date | Award Approval Date | Estimated Possible Payouts Under Non-Equity Incentive Plan Awards(1) | Estimated Future Payouts Under Equity Incentive Plan Awards(2) | Number of Shares of Stock or Units (#) | Stock and Option Awards ($)(6) | ||||
Threshold ($) | Target ($) | Maximum ($) | Threshold (#) | Target (#) | Maximum (#) | |||||
Charles E. Tyson | ||||||||||
Annual Bonus | 193,125 | 386,250 | 772,500 | |||||||
Restricted Stock | 5/10/23 | 5/10/23 | 151,515 (3) | 500,000 | ||||||
Perf Rest Stock | 5/10/23 | 5/10/23 | 56,180 | 112,359 | 224,718 | 500,000 | ||||
Robert L. Madore | ||||||||||
Annual Bonus | 130,000 | 260,000 | 520,000 | |||||||
Restricted Stock | 8/11/23 | 7/12/23 | 110,103 (4) | 425,000 | ||||||
Perf Rest Stock | 8/11/23 | 7/12/23 | 19,663 | 39,325 | 78,650 | 175,000 | ||||
Alice G. Givens | ||||||||||
Annual Bonus | 67,524 | 135,047 | 270,094 | |||||||
Restricted Stock | 5/10/23 | 5/10/23 | 53,030 (3) | 175,000 | ||||||
Perf Rest Stock | 5/10/23 | 5/10/23 | 19,663 | 39,325 | 78,650 | 175,000 | ||||
Matthew T. Argano | ||||||||||
Annual Bonus | 61,445 | 122,890 | 245,779 | |||||||
Restricted Stock | 5/10/23 | 5/10/23 | 53,030 (3) | 175,000 | ||||||
Perf Rest Stock | 5/10/23 | 5/10/23 | 19,663 | 39,325 | 78,650 | 175,000 | ||||
Douglas S. Clark, Jr. | ||||||||||
Annual Bonus | 61,426 | 122,853 | 245,705 | |||||||
Restricted Stock | 3/14/23 | 3/14/23 | 45,454 (5) | 175,000 | ||||||
Perf Rest Stock | 3/14/23 | 3/14/23 | 19,663 | 39,325 | 78,650 | 175,000 | ||||
Terry F. Blanchard | – | – | – | – | – | – | – | – | ||
18
Outstanding Equity Awards at Fiscal Year-End 2023
The following table sets forth the outstanding equity awards as of the end of the 2023 fiscal year for each of our named executive officers:
Option Awards | Stock Awards | |||||||
|
|
|
|
|
|
| Equity Incentive Plan Awards: Number | Equity Incentive Plan Awards: Market or Payout |
Name | Number of Securities Underlying Unexercised Options Exercisable (#) | Number of Securities Underlying Unexercisable Options Unexercised (#) | Option Exercise Price ($) | Option Expiration Date | Number of Shares or Units of Stock that Have Not Vested (#) | Market Value of Shares or Units of Stock that Have Not Vested ($)* | of Unearned Shares, Units or Other Rights that have Not Vested (#) | Value of Unearned Shares, Units or Other Rights that have Not Vested ($)* |
Charles E. Tyson | 98,328 | - | 19.49 | 8/3/2028 | ||||
13,447(1) | 4,483(1) | 9.80 | 2/28/2030 | |||||
20,707(2) | 6,903(2) | 10.00 | 6/1/2030 | |||||
9,398(3) | 9,398(3) | 23.55 | 3/5/2031 | |||||
7,335(4) | 22,007(4) | 15.72 | 3/9/2032 | |||||
2,232(1) | 8,705 | |||||||
3,438(2) | 13,408 | |||||||
5,308(3) | 20,701 | |||||||
11,928(4) | 46,519 | 31,806(6) | 124,043 | |||||
151,515(5) | 590,909 | 112,359(7) | 438,200 | |||||
Robert L. Madore | 110,103(8) | 429,402 | 39,325(7) | 153,368 | ||||
Alice G. Givens | 5,974(9) | 1,992(9) | 28.16 | 11/4/2030 | ||||
2,819 (3) | 2,820 (3) | 23.55 | 3/5/2031 | |||||
2,384 (4) | 7,152 (4) | 15.72 | 3/9/2032 | |||||
1,110(10) | 4,329 | |||||||
1,592 (3) | 6,209 | |||||||
3,876 (4) | 15,116 | 10,337(6) | 40,314 | |||||
53,030 (5) | 206,817 | 39,325(7) | 153,368 | |||||
Matthew T. Argano | 7,897(11) | 2,633 | 21.30 | 8/7/2030 | ||||
1,879 (3) | 1,880 | 23.55 | 3/5/2031 | |||||
2,200 (4) | 6,602 | 15.72 | 3/9/2032 | |||||
1,467(11) | 16,489 | |||||||
1,062 (3) | 4,142 | |||||||
3,578 (4) | 13,954 | 9,541(6) | 37,210 | |||||
53,030 (5) | 206,817 | 39,325(7) | 153,368 | |||||
Douglas S. Clark, Jr. | 4,315(12) | - | 17.39 | 2/24/2027 | ||||
1,158(13) | - | 23.31 | 3/2/2028 | |||||
3,227 (1) | 1,076 | 9.80 | 2/28/2030 | |||||
3,159(11) | 1,053 | 21.30 | 8/7/2030 | |||||
4,698 (3) | 4,700 | 23.55 | 3/5/2031 | |||||
1,467 (4) | 4,401 | 15.72 | 3/9/2032 | |||||
536 (1) | 2,090 | |||||||
587(11) | 2,289 | |||||||
2,654 (3) | 10,351 | |||||||
2,385 (4) | 9,302 | 6,361(9) | 24,808 | |||||
45,454(14) | 177,271 | 39,325(7) | 153,368 | |||||
Terry F. Blanchard | - | - | - | - | - | - | - | - |
* The value listed is based on the closing price of the Company’s stock of $3.90 on December 29, 2023, the last trading day of the year.
19
Option Exercises and Stock Vested for 2023
The following table provides information concerning the exercises of stock options and the vesting of restricted stock during the fiscal year 2023 on an aggregated basis for each of our named executive officers:
Option Awards | Stock Awards | ||||
Name | Number of Shares Acquired on Exercise (#) | Value Realized on Exercise ($) | Number of Shares Acquired on Vesting (#) | Value Realized on Vesting ($) | |
Charles E. Tyson | - | - | 16,010 | $67,349 | |
Robert L. Madore | - | - | - | - | |
Alice G. Givens | - | - | 3,198 | $12,506 | |
Matthew T. Argano | - | - | 3,190 | $12,127 | |
Douglas S. Clark, Jr. | - | - | 6,780 | $26,242 | |
Terry F. Blanchard | - | - | - | - | |
Potential Payments Upon Termination or Change of Control
We have agreed to provide payments or other benefits to our named executive officers (other than Mr. Blanchard) under certain scenarios related to a termination of employment. This section describes those payments and benefits and events that trigger them. Because Mr. Blanchard was not an employee of the Company and departed on July 10, 2023, he is not included in the discussion below.
Severance Agreements with Charles E. Tyson, Robert L. Madore, Alice G. Givens, Matthew T. Argano and Douglas S. Clark, Jr. We have entered into Severance Agreements with Messrs. Tyson, Madore, Clark, Dr. Argano and Ms. Givens. Under the terms of the Severance Agreements, if we terminate the executive’s employment other than for cause, death, or disability, or the executive terminates employment for good reason, in either case during the term of the Severance Agreement not in a change-in-control, the executive will be entitled to the following:
Under the terms of the Severance Agreements, if we terminate the executive’s employment other than for cause, death or disability, or the executive terminates employment for good reason inside a change-in-control period and the relevant change-in-control occurs, the executive will be entitled to the following:
20
As a condition to the receipt of any compensation and other benefits under the Severance Agreements, the executive is required to enter into a confidential waiver and release agreement. Any breach by the executive of the terms of the executive’s Non-Compete Agreement will constitute a material breach of the Severance Agreement, resulting in the waiver or forfeiture of all rights to future payments and benefits under the Severance Agreement and the requirement that the executive reimburse us for any compensation and benefits previously received by the executive under the Severance Agreement.
The term of the Severance Agreements will automatically renew for successive one-year periods unless notice of non-renewal is given at least ninety (90) days prior by either party to the other; provided, however, that the Severance Agreements will be extended automatically during any change-in-control period.
The following table shows the value to our named executive officers of benefits provided assuming termination not in a change-in-control period as of December 31, 2023 (or, if inside a change-in-control period, where the change-in-control is not consummated).
Name | Cash Severance ($)(1) | Health and Welfare Benefits ($) | Benefit Policy ($)(2) | Total Value of Benefits Provided Upon Termination Outside a Change of Control ($) |
Charles E. Tyson | 2,317,500 | 18,785 | 74,278 | 2,410,563 |
Robert L. Madore | 1,170,000 | 9,069 | 62,500 | 1,241,569 |
Alice G. Givens | 720,251 | 4,785 | 43,284 | 768,320 |
Matthew T. Argano | 655,411 | 16,851 | 39,388 | 711,650 |
Douglas S. Clark, Jr. | 655,214 | 4,785 | 39,376 | 699,376 |
21
The following table shows the value to our named executive officers of benefits provided assuming termination and a change-in-control as of December 31, 2023.
Name | Cash Severance ($)(1) | Health and Welfare Benefits ($) | Benefit Policy ($)(2) | Total Value of Stock Options or Award that may Accelerate Upon Change of Control ($)(3) | Total Value of Benefits Provided Upon Termination and Change of Control ($) |
Charles E. Tyson | 3,862,500 | 18,785 | 74,278 | 1,242,485 | 5,198,048 |
Robert L. Madore | 2,275,000 | 13,603 | 62,500 | 582,769 | 2,933,873 |
Alice G. Givens | 1,350,471 | 7,178 | 43,284 | 426,153 | 1,827,086 |
Matthew T. Argano | 1,228,896 | 25,276 | 39,388 | 421,212 | 1,714,772 |
Douglas S. Clark, Jr. | 1,228,527 | 7,178 | 39,376 | 379,478 | 1,654,559 |
Pay Ratio
As required by Item 402(u) of Regulation S-K, we are providing the following information regarding pay ratios. Our pay ratio is a reasonable estimate and has been calculated in a manner consistent with SEC rules based on the methodology described below. For the year ended December 31, 2023:
The methodology that we used and the material assumptions, adjustments and estimates that we used to identify the median employee and then determine annual total compensation for 2023 were as follows:
Employee population.As of December 31, 2023, our employee population consisted of approximately 2,109 individuals, with 2,087 associates, representing approximately 99% of our total employee population, located in the United States and 22 associates, representing approximately 1% of our total employee population, located outside of the United States. Our employee population for purposes of identifying our median employee on December 31, 2023, was 2,087, using the de minimis adjustment permitted by the SEC rules to exclude 22 individuals located in China.
Identification of Median. To identify the median of the annual total compensation of all of our associates (other than Mr. Tyson), we reviewed the annual wages of each of our associates as reported on box 5 of their W-2 tax forms (the “reported compensation”). In making this calculation, we annualized the reported compensation of all permanent associates who were hired in the year ended December 31, 2023, but did not work for us for the entire year. We did not make any cost-of-living adjustments to the reported compensation in identifying the median employee. Using this methodology, we determined that our median employee was a full-time, hourly employee. With respect to this median employee, we then identified and calculated the elements of such employee’s compensation for the year ended December 31, 2023, in accordance with the requirements of Item 402(c)(2)(x) of Regulation S-K, resulting in annual total compensation in the amount of $47,639.
22
Identification of Annual Total Compensation for our 2013President and Chief Executive Officer. With respect to the annual meetingtotal compensation of shareholders, whichour President and Chief Executive Officer, we used the amount reported in the “Total” column of our 2023 Summary Compensation Table included in this Amendment No. 1 for Mr. Tyson who was serving as our President and Chief Executive Officer on December 31, 2023, when we identified our median employee and who was compensated as an executive officer of the Company for all of 2023.
Given the different methodologies that various public companies will use to determine an estimate of their pay ratio, the estimated ratio reported above should not be used as a basis for comparison between companies.
Director Compensation
Non-Employee Director Compensation
The Board, at the recommendation of the Nominating and Corporate Governance Committee, approves the compensation of our non-employee directors. Directors who are employed by us do not receive compensation for their service on the Board or any Board committee. The Board did not make any changes to this compensation in 2023.
The following table sets forth the compensation for our non-employee directors:
Element of Compensation | 2023 - 2024 Compensation Amount(1) (2) |
Annual Board Compensation | |
Cash Retainer | $70,000 |
Equity Retainer | $100,000 |
Additional Chairperson Retainer | $100,000 |
Committee Chair Cash Retainers | |
Audit Committee | $20,000 |
Compliance and Regulatory Affairs Committee | $15,000 |
Compensation Committee | $15,000 |
Nominating and Corporate Governance Committee | $10,000 |
Committee Member Cash Retainers | |
Audit Committee | $10,000 |
Compliance and Regulatory Affairs Committee | $10,000 |
Compensation Committee | $7,500 |
Nominating and Corporate Governance Committee | $7,500 |
2023 Non-Employee Director Compensation
In 2023, our non-employee directors received a portion of the payment for the retainers in restricted stock and a portion in cash. The restricted stock portion of the retainer was granted on the date of the 2023 Annual Meeting and vests on the date of the 2024 Annual Meeting. In calculating the number of shares of restricted stock reflecting the value of the retainers for our non-employee directors, we used the closing price of our common stock on the date of the grant. Furthermore, our equity award agreements for our directors contain clawback provisions, so that any such awards are subject to such deductions, repayment and clawback as may be required by any applicable law, government regulation or stock exchange listing requirement (or any policy adopted by us pursuant to any such law, government regulation or stock exchange listing requirement). We reimburse non-employee directors for reasonable out-of-pocket expenses incurred in connection with their service as directors, including travel expenses for meeting attendance. We also permit our directors to participate in employee discount programs available to all our associates.
Our non-employee directors are subject to stock ownership guidelines, as described on page 14.
23
Director Compensation Table
The following table sets forth compensation earned by our directors who are not named executive officers in the fiscal year ended December 31, 2012.2023:
Name | Fees Earned or Paid in Cash ($) | Stock Awards(1) ($) | Total ($) |
Terri Funk Graham(2) | 87,500 | 100,000 | 187,500 |
David A. Levin(2) | 95,000 | 100,000 | 195,000 |
Douglas T. Moore(2) | 87,500 | 100,000 | 187,500 |
Joseph M. Nowicki(2) | 100,000 | 100,000 | 200,000 |
Ashish Parmar(3) | 87,500 | 100,000 | 187,500 |
Famous P. Rhodes(4) | 85,002 | 100,000 | 185,002 |
Martin F. Roper(5) | 95,000 | 100,000 | 195,000 |
Nancy M. Taylor(2) | 187,500 | 100,000 | 287,500 |
Outside Directors Deferral Plan
In November 2008, the Board adopted the Deferral Plan under which each of our non-employee directors can defer receipt of all or a portion of his or her fees until such director’s departure from the Board. In so doing, the Board intended to provide an incentive to the non-employee directors to own shares of our common stock, thereby aligning their interests more closely with the interests of our stockholders. Deferral elections must be made by December 31 for the deferral of fees in the next calendar year.
Under the Deferral Plan, a non-employee director may elect to defer up to 100% of his or her compensation in 25% increments and have such compensation invested in deferred stock units. Deferred stock units attributable to the deferral of cash compensation are credited as of the day on which such compensation is otherwise payable in accordance with our then applicable director compensation policies (the “Payment Date”), and the number of deferred stock units is determined by dividing the deferred compensation payable on the Payment Date by the closing price of our common stock as of the Payment Date with partial shares being disregarded. Deferred stock units credited with respect to restricted stock awards are determined using the closing price as of the grant date of the award of such shares of common stock.
In September 2022, the Board amended and restated the Deferral Plan to provide that a director may elect to have his or her deferred stock units settled in common stock in one of three timeframes upon the director’s departure from the Board: (i) in one lump-sum payment 60 days following his or her separation from service on the Board, (ii) in annual distributions over a three-year period beginning sixty days following his or her separation from service on the Board, or (ii) in annual distributions over a five-year period beginning sixty days following his or her separation from service on the Board. Previously, the Deferral Plan provided for all deferred stock units to be settled in one lump-sum payment 60 days following a director’s departure from the Board. The new timeframe elections apply to elections made for deferrals beginning in 2023.
There was an aggregate of 377,701 deferred stock units outstanding at December 31, 2023.
24
Item 12. Security Ownership of Certain Beneficial Owners and Management and Related Stockholder Matters.
The following table sets forth information requiredregarding ownership of our common stock by this Itemeach person (or group of affiliated persons) known to us to be the beneficial owner of more than 5% of the outstanding shares of our common stock and the shares of common stock owned by each director, by each named executive officer, and all of our directors and executive officers as a group as of April 19, 2024. Unless otherwise indicated below, the address of each beneficial owner listed below is incorporatedc/o LL Flooring Holdings, Inc., 4901 Bakers Mill Lane, Richmond, Virginia 23230.
Name of Beneficial Owner | Amount and Nature of Beneficial Ownership(1) | Percent of Class(2) |
5% or Greater Owners | ||
F9 Investments, LLC/Thomas D. Sullivan/John Jason Delves(3) 844 Alton Road Miami Beach, FL 33139 | 2,698,907 | 8.80% |
Hotchkis and Wiley Capital Management LLC(4) 601 S. Figueroa Street, 39th Floor Los Angeles, CA 90017 | 1,705,140 | 5.56% |
CRIMSON Asset Management Ltd.(5) 161 Bay Street, Suite 2700 Toronto, Ontario Canada M5J 2S1 | 1,685,816 | 5.50% |
Cowen Financial Products LLC(6) 599 Lexington Avenue New York, NY 10022 | 1,622,000 | 5.29% |
The Vanguard Group(7) 100 Vanguard Boulevard Malvern, PA 19355 | 1,618,526 | 5.28% |
Directors and Named Executive Officers | ||
Matthew T. Argano(8) | 78,181 | * |
Douglas S. Clark, Jr. (9) | 83,042 | * |
Alice G. Givens (10) | 80,791 | * |
Terri Funk Graham | 65,738 | * |
David A. Levin | 70,200 | * |
Robert L. Madore | 110,103 | * |
Douglas T. Moore | 57,479 | * |
Joseph M. Nowicki | 56,610 | * |
Ashish Parmar | 84,962 | * |
Famous P. Rhodes | 78,824 | * |
Martin F. Roper | 223,404 | * |
Nancy M. Taylor | 104,471 | * |
Charles E. Tyson(11) | 388,727 | 1.26% |
Terry F. Blanchard(12) | - | * |
All executive officers and directors as a group (15 persons) | 1,516,896 | 4.91% |
* Represents beneficial ownership of less than 1%
25
26
Equity Compensation Plan Information
The following table sets forth information as of December 31, 2012.2023, with respect to compensation plans under which shares of our common stock are authorized for issuance:
Plan Category | Number of Securities to be Issued Upon Exercise of Outstanding Options, Warrants and Rights (#) | Weighted-average Exercise Price of Outstanding Options, Warrants and Rights ($) | Number of Securities Remaining Available for Future Issuance Under Equity Compensation Plans (#) |
Equity Compensation Plans Approved by Security Holders(1) | 2,812,846(2) | 17.62(3) | 1,786,269 |
Equity Compensation Plans Not Approved by Security Holders | 324,945(4) | - | - |
Total | 3,137,791 | 17.62 | 1,786,269 |
Certain Relationships and Related Transactions
We have a formal written policy concerning related person transactions, a copy of which is available on our website. Under that policy, a related person transaction is a transaction, arrangement or relationship involving us, on the one hand, and (i) our director or executive officer, his or her immediate family members or any entity that any of them controls or in which any of them has a substantial beneficial ownership interest; or (ii) any person who is the beneficial owner of more than 5% of our voting securities or a member of the immediate family of such person. Any transactions between the Company and a related person that involve an amount exceeding $10,000 are reviewed with the Audit Committee.
The Audit Committee evaluates each related person transaction and may approve or ratify the related person Transaction only if the Audit Committee determines that, under all of the circumstances, the transaction is in, or is not inconsistent with, the interests of the Company and its stockholders. The Audit Committee will prohibit any related person transaction that it determines to be inconsistent with the interests of the Company and its stockholders. Relevant factors considered by the Audit Committee when evaluating a related person transaction include:
At least annually, management will provide the Audit Committee with information pertaining to related person transactions. Related person transactions entered into, but not approved or ratified as required by this Item is incorporated by reference from the definitive proxy statement for our 2013 annual meetingpolicy concerning related person transactions,
27
will be subject to termination by us or the relevant subsidiary, if so directed by the Audit Committee, taking into account factors as it deems appropriate and relevant.
Beginning in the second quarter of 2023, F9 Investments, LLC, filed no latera Schedule 13D (and three subsequent amendments) with the SEC indicating beneficial ownership of more than 120 days after5% of the Company's voting securities. During 2023, the Company leased 29 of its store locations, representing 6.6% of the total number of store leases in operation, from entities controlled by F9 Investments, LLC. The Company made total rental payments of $2.9 million associated with these store locations for the year ended December 31, 2012.2023. The Company is charged rent for these locations at rates believed to be at fair market value.
All of our directors, other than our Chief Executive Officer, are independent. The Board, in its business judgment, has affirmatively determined that the following eight of its nine current members are independent, including under the applicable independence standards contained in the rules of the NYSE and for the applicable Board committees on which they serve: Terri Funk Graham, David A. Levin, Douglas T. Moore, Joseph M. Nowicki, Ashish Parmar, Famous P. Rhodes, Martin F. Roper and Nancy M. Taylor. In reaching its conclusion regarding director independence, the Board considered whether we conduct business and have other relationships with organizations of which certain members of the Board or members of their immediate families are or were directors or officers. Some non-management directors or their related parties have purchased products and services from us in the ordinary course of business or have made purchases from us using the Company’s discount policy applicable to all employees and directors. We consider such purchases to be immaterial to such director’s independence.
Item 14. Principal Accountant Fees and Services.
The information required by this Item is incorporated by reference fromErnst & Young served as our independent registered public accounting firm for the definitive proxy statement for our 2013 annual meeting of shareholders, which will be filed no later than 120 days afteryears ended December 31, 2012.
The following information is furnished with respect to the fees billed by our independent registered public accounting firm for each of the last two fiscal years:
2023 | 2022 | |
Audit Fees | $1,273,367 | $1,162,000 |
Audit-Related Fees | $3,600 | $1,375 |
Tax Fees | - | - |
All Other Fees | - | - |
Total Fees | $1,276,967 | $1,163,375 |
Audit fees
The aggregate amount of fees billed to us by Ernst & Young for each of the last two fiscal years for professional services rendered in connection with the audits of our annual consolidated financial statements and our international subsidiaries, the reviews of the consolidated financial statements for the fiscal quarters during the year and accounting consultations that relate to the audited consolidated financial statements and are necessary to comply with auditing standards.
Audit-Related fees
The aggregate amount of fees billed to us by Ernst & Young in each of the last two fiscal years for professional services rendered in connection with accounting consultations, principally related to an accounting research tool.
Audit Committee Pre-Approval Policies and Procedures
The Audit Committee has determined that Ernst & Young’s rendering of all non-audit services is compatible with maintaining auditor independence. The Audit Committee has adopted a policy for the pre-approval of services provided by the independent registered public accounting firm. Under the policy, pre-approval is generally provided for particular services or categories of services, including planned services, project-based services, and routine consultations projects. Each category is approved subject to a specific budget or quarterly dollar amount. In addition, the Audit Committee may also pre-approve particular services on a case-by-case basis. For each proposed service, the independent registered public accounting firm is required to provide detailed back-up documentation at
28
the time of approval. The Audit Committee has delegated certain pre-approval authority to its Chairperson. The Chairperson must report any decisions to the Audit Committee at its next scheduled meeting. All services provided by Ernst & Young during 2022 and 2023 were pre-approved.
PART IV
Item 15. Exhibits, Financial Statement Schedules.
1. Financial Statements and Schedules
The followingOur consolidated financial statements are submittedand notes thereto, and schedules, required to be filed in Part II, Item 8 of this annual report:
2. Financial Statement Schedules
All financial statement schedules have been omitted because the required information is eitherour Annual Report on Form 10-K are included in the financial statements or the notes thereto or is not applicable.original Form 10-K filing.
3. Exhibits
The exhibits listed on the accompanying Exhibit Index are filed or incorporated by reference as part of this report.
Exhibit No. | Description |
31.3* | Certification of Chief Executive Officer, pursuant to Section 302 of the Sarbanes-Oxley Act of 2002 |
31.4* | Certification of Chief Financial Officer, pursuant to Section 302 of the Sarbanes-Oxley Act of 2002 |
104 | Cover page Interactive Data File – the cover page interactive data file does not appear in the Interactive Data File because the XBRL tags are embedded within the Inline XBRL document (included in Exhibit 101). |
*Filed herewith |
29
SIGNATURES
Pursuant to the requirements of Section 13 or 15(d) of the Securities Exchange Act of 1934, as amended, the registrant has duly caused this report to be signed on its behalf by the undersigned thereunto duly authorized on February 20, 2013.authorized.
LL FLOORING HOLDINGS, INC. | |||
| |||
|
| ||
By: | /s/ Charles E. Tyson | ||
Charles E. Tyson | |||
Chief Executive Officer | |||
Pursuant to the requirements of the Securities and Exchange Act of 1934, this report has been signed below by the following persons on behalf of the registrant and in the capacities indicated on February 20, 2013.
|
| |
| (Principal Executive Officer) | |
| ||
By: | /s/ Robert L. Madore | |
Robert L. Madore | ||
Chief Financial Officer | ||
(Principal Financial | ||
| ||
| ||
| ||
| ||
| ||
| ||
| ||
EXHIBIT INDEX
|
| |
|
| |
Date: April 26, 2024
62
30