SECURITIES AND EXCHANGE COMMISSION
|
| x |
| ý | ANNUAL REPORT PURSUANT TO SECTION 13 OR 15(d) OF THE SECURITIES EXCHANGE ACT OF 1934. | |
For the fiscal year ended December 29, 2012
OR
| | For the fiscal year ended December 26, 2015 |
| OR |
| ¨ | TRANSITION REPORT PURSUANT TO SECTION 13 OR 15(d) OF THE SECURITIES EXCHANGE ACT OF 1934. |
| | For the transition period from to |
For the transition period fromto
Commission File Number 001-07882
ADVANCED MICRO DEVICES, INC.
(Exact name of registrant as specified in its charter)
|
| |
| Delaware | | 94-1692300 |
(State or other jurisdiction of incorporation or organization) | | (I.R.S. Employer Identification No.) |
| |
| One AMD Place, Sunnyvale, California | | 94088 |
| (Address of principal executive offices) | | (Zip Code) |
(Registrant’s telephone number, including area code)
Securities registered pursuant to Section 12(b) of the Act:
|
| |
(Title of each class) | | (Name of each exchange on which registered) |
Common Stock per share $0.01 par value per share | | New YorkThe NASDAQ Stock ExchangeMarket LLC |
Securities registered pursuant to Section 12(g) of the Act:
Indicate by check mark if the registrant is a well-known seasoned issuer, as defined in Rule 405 of the Securities Act. Yes xý No ¨ Indicate by check mark if the registrant is not required to file reports pursuant to Section 13 or Section 15(d) of the Exchange Act. Yes ¨ No xý Indicate by check mark whether the registrant (1) has filed all reports required to be filed by Section 13 or 15(d) of the Securities Exchange Act of 1934 during the preceding 12 months (or for such shorter period that the registrant was required to file such reports), and (2) has been subject to such filing requirements for the past 90 days. Yes xý No ¨ Indicate by check mark whether the registrant has submitted electronically and posted on its corporate web site, if any, every Interactive Data File required to be submitted and posted pursuant to Rule 405 of Regulation S-T during the preceding 12 months (or for such shorter period that the registrant was required to submit and post such files): Yes xý No ¨ Indicate by check mark if disclosure of delinquent filers pursuant to Item 405 of Regulation S-K is not contained herein, and will not be contained, to the best of registrant’s knowledge, in definitive proxy or information statements incorporated by reference in Part III of this Form 10-K or any amendment to this Form 10-K. x¨ Indicate by check mark whether the registrant is a large accelerated filer, an accelerated filer, a non-accelerated filer or a smaller reporting company. See definition of “large accelerated filer,” “accelerated filer” and “smaller reporting company” in Rule 12b-2 of the Exchange Act (check one):
|
| | | |
Large accelerated filerx | ý | Accelerated filer | ¨ |
| |
Non-accelerated filer | ¨(Do (Do not check if a smaller reporting company)
| | Smaller reporting company | ¨ |
Indicate by check mark whether the registrant is a shell company (as defined by Rule 12b-2 of the Exchange Act). Yes ¨ No xý As of June
30, 2012,27, 2015, the aggregate market value of the registrant’s common stock held by non-affiliates of the registrant was approximately
$3.4$1.6 billion based on the reported closing sale price of
$5.73$2.47 per share as reported on
the New YorkThe NASDAQ Stock
ExchangeMarket (NASDAQ) on June
29, 2012,26, 2015, which was the last business day of the registrant’s most recently completed second fiscal quarter.
Indicate the number of shares outstanding of each of the registrant’s classes of common stock, as of the latest practicable date:
714,077,254793,248,190 shares of common stock, $0.01 par value per share, as of February
15, 2013.12, 2016.
DOCUMENTS INCORPORATED BY REFERENCE
Portions of the
Proxy Statementregistrant’s proxy statement for the
2016 Annual Meeting of Stockholders
which we expect will be held on or about May 16, 2013 (2013(2016 Proxy Statement) are incorporated into Part III hereof.
The 2016 Proxy Statement will be filed with the U.S. Securities and Exchange Commission within 120 days after the registrant’s fiscal year ended December 26, 2015.
Advanced Micro Devices, Inc.
For The Fiscal Year Ended December 29, 201226, 2015
ITEM 1.BUSINESS
Cautionary Statement Regarding Forward-Looking Statements
The statements in this report include forward-looking statements.statements within the meaning of the Private Securities Litigation Reform Act of 1995. These forward-looking statements are based on current expectations and beliefs and involve numerous risks and uncertainties that could cause actual results to differ materially from expectations. These forward-looking statements speak only as of the date hereof or as of the dates indicated in the statements and should not be relied upon as predictions of future events, as we cannot assure you that the events or circumstances reflected in these statements will be achieved or will occur. You can identify forward-looking statements by the use of forward-looking terminology including “believes,” “expects,” “may,” “will,” “should,” “seeks,” “intends,” “plans,” “pro forma,” “estimates,” or “anticipates”“anticipates,” or the negative of these words and phrases, or other variations of these words and phrases or comparable terminology. The forward-looking statements relate to, among other things: demand for ourAMD’s products; the growth, change and competitive landscape of the markets in which we participate; ourAMD participates; future restructuring activities; the nature and extent of AMD’s future payments to GLOBALFOUNDRIES Inc. (GF) and the materiality of these payments; the materiality of AMD’s future purchases from GF; sales patterns of AMD’s semi-custom System-on-Chip (SoC) products; AMD’s expected completion of its restructuring plan announced in October 2015 (the 2015 Restructuring Plan) and the anticipated cash payments and savings from the 2015 Restructuring Plan; statements regarding the proposed joint ventures (the JVs) between AMD and Nantong Fujitsu Microelectronics, Co., Ltd., including the JVs’ expected future performance (including expected results of operations and financial guidance); benefits from the proposed JVs; the JVs’ future financial condition, operating results, strategy and plans; statements about regulatory and other approvals; the closing date for the proposed transaction; AMD's expected future filing of patent applications in both the United States and abroad on significant inventions; AMD's expectation that based on the information presently known to management, the securities class action and the shareholder derivative suit will not have a material adverse effect on its financial condition, cash flows or results of operations; the expected completion of AMD's exit from its dense server business; the level of international sales as compared to total sales; that AMD does not expect to reduce its unrecognized tax benefits in the next 12 months;that other unrecognized tax benefits will not materially change in the next 12 months; that AMD’s cash and cash equivalents and marketable securities balances, the savings from its restructuring plans and the secured revolving line of credit (Secured Revolving Line of Credit) will be sufficient to fund AMD’s operations including capital expenditures over the next 12 months; AMD’s ability to obtain sufficient external financing on favorable terms, or at all; the nature and extent of our future payments to GLOBALFOUNDRIES Inc. (GF) under the wafer supply agreement (WSA) and the materiality of these payments; our ability to negotiate future amendments to the WSA; PC market conditions; our restructuring plan implemented in the fourth quarter of 2012, including, cash expenditures, and operational savings; the level of international sales as compared to total sales; our ability to sell our auction rate securities within the next twelve months; that our first ARM technology-based AMD Opteron™ processor for servers is targeted for production in 2014; that our cash, cash equivalents and marketable securities and available external financing will be sufficient to fund our operations including capital expenditures over the next twelve months; ourits dependence on a small number of customers; ourcustomers for a substantial part of its revenue; its hedging strategy; its expenditures related to environmental compliance and conflict minerals disclosure requirements; and AMD does not expect to pay dividends in the timing of the implementation of certain ENERGYSTAR specifications. Material factors and assumptions that were applied in making these forward-looking statements include, without limitation, the following: the expected rate of market growth and demand for our products and technologies (and the mix thereof); GF’s manufacturing yields and wafer volumes; our expected market share; our expected product costs and average selling price; our overall competitive position and the competitiveness of our current and future products; our ability to introduce new products, consistent with our current roadmap; our ability to make additional investment in research and development and that such opportunities will be available; the expected demand for computers; and the state of credit markets and macroeconomic conditions.future. Material factors that could cause actual results to differ materially from current expectations include, without limitation, the following: that Intel Corporation’s pricing, marketingdominance of the microprocessor market and rebating programs, product bundling, standard setting, new product introductions or other activitiesits aggressive business practices may negatively impact our plans; that we will require additional fundinglimit AMD’s ability to compete effectively; AMD relies on GF to manufacture all of its microprocessor and mayAPU products and a certain portion of its GPU products, with limited exceptions.If GF is not able to satisfy AMD’s manufacturing requirements, its business could be adversely impacted; AMD relies on third parties to manufacture its products, and if they are unable to raise sufficient capital on favorable terms, or at all; that customers stop buying our products or materially reduce their operations or demand for our products; that we may be unable to develop, launch and ramp new products and technologies in the volumes that are required by the market at mature yields on a timely basis; that our third party foundry suppliers will be unable to transition our products to advanced manufacturing process technologies in a timely and effective way or to manufacture our productsdo so on a timely basis in sufficient quantities and using competitive process technologies;technologies, AMD’s business could be materially adversely affected; failure to achieve expected manufacturing yields for AMD’s products could negatively impact its financial results; the success of AMD’s business is dependent upon its ability to introduce products on a timely basis with features and performance levels that we willprovide value to its customers while supporting and coinciding with significant industry transitions; if AMD cannot generate sufficient revenue and operating cash flow or obtain external financing, it may face a cash shortfall and be unable to obtain sufficient manufacturing capacity or components to meet demand for our products or will not fully utilize our projected manufacturing capacity needs at GFs microprocessor manufacturing facilities; that our requirements for wafers will be less than the fixed numbermake all of wafers that we agreed to purchase from GF or GF encounters problems that significantly reduce the number of functional die we receive from each wafer; that we are unable to successfully implement our long-term business strategy; that we inaccurately estimate the quantity or type of products that our customers will want in the future or will ultimately end up purchasing, resulting in excess or obsolete inventory; that we are unable to manage the risks related to the use of our third-party distributors and add-in-board (AIB) partners or offer the appropriate incentives to focus them on the sale of our products; that we may be unable to maintain the level of investmentits planned investments in research and development or other strategic investments; the loss of a significant customer may have a material adverse effect on AMD; global economic uncertainty may adversely impact AMD’s business and operating results; AMD may not be able to generate sufficient cash to service its debt obligations or meet its working capital requirements; AMD has a substantial amount of indebtedness which could adversely affect its financial position and prevent it from implementing its strategy or fulfilling its contractual obligations; the agreements governing AMD’s notes and the Secured Revolving Line of Credit impose restrictions on AMD that may adversely affect its ability to operate its business; the completion and impact of the 2015 Restructuring Plan, its transformation initiatives and any future restructuring actions could adversely affect it; the markets in which AMD’s products are sold are highly competitive; uncertainties involving the ordering and shipment of AMD’s products could materially adversely affect it; AMD’s receipt of revenue from its semi-custom SoC products is required to remain competitive; that there may be unexpected variations in market growthdependent upon its technology being designed into third-party products and the success of those products; the demand for ourAMD’s products depends in part on the market conditions in the industries into which they are sold. Fluctuations in demand for AMD’s products or a market decline in any of these industries could have a material adverse effect on its results of operations; AMD’s ability to design and technologiesintroduce new products in lighta timely manner is dependent upon third-party intellectual property; AMD depends on third-party companies for the design, manufacture and supply of motherboards and other computer platform components to support its business; if AMD loses Microsoft Corporation’s support for its products or other software vend
ors do not design and develop software to run on AMD’s products, its ability to sell its products could be materially adversely affected; AMD’s reliance on third-party distributors and AIB partners subjects it to certain risks; AMD’s inability to continue to attract and retain qualified personnel may hinder its product development programs; in the product mixevent of a change of control, AMD may not be able to repurchase its outstanding debt as required by the applicable indentures and its Secured Revolving Line of Credit, which would result in a default under the indentures and its Secured Revolving Line of Credit; the semiconductor industry is highly cyclical and has experienced severe downturns that wehave materially adversely affected, and may have available at any particular time; that globalcontinue to materially adversely affectits business in the future; acquisitions, divestitures and/or joint ventures could disrupt its business, harm its financial condition and operating results or dilute, or adversely affect the price of its common stock; AMD’s business is dependent upon the proper functioning of its internal business processes and information systems and modification or interruption of such systems may disrupt its business, processes and internal controls; data breaches and cyber-attacks could compromise AMD’s intellectual property or other sensitive information, be costly to remediate and cause significant damage to its business and economic conditions willreputation; AMD’s operating results are subject to quarterly and seasonal sales patterns; if essential equipment, materials or manufacturing processes are not improveavailable to manufacture its products, AMD could be materially adversely affected; if AMD’s products are not compatible with some or will worsen; that PC market conditions do not improve or will worsen; thatall industry-standard software and hardware, it could be materially adversely affected; costs related to defective products could have a material adverse effect on AMD; if AMD fails to maintain the efficiency of its supply chain as it responds to changes in customer demand for computers willits products, its business could be lower than currently expected;materially adversely affected; AMD outsources to third parties certain supply-chain logistics functions, including portions of its product distribution, transportation management and information technology support services; AMD may incur future impairments of goodwill; AMD’s worldwide operations are subject to political, legal and economic risks and natural disasters, which could have a material adverse effect on it; worldwide political conditions may adversely affect demand for AMD’s products; unfavorable currency exchange rate fluctuations could adversely affect AMD; AMD’s inability to effectively control the sales of its products on the gray market could have a material adverse effect on it; if AMD cannot adequately protect its technology or other intellectual property in the United States and abroad, through patents, copyrights, trade secrets, trademarks and other measures, it may lose a competitive advantage and incur significant expenses; AMD may not be able to successfully monetize its intellectual property; AMD is a party to litigation and may become a party to other claims or litigation that could cause it to incur substantial costs or pay substantial damages or prohibit it from selling its products; AMD’s business is subject to potential tax liabilities; a variety of political or economic instability, domestically or internationally, on our sales or supply chain.environmental laws that AMD is subject to could result in additional costs and liabilities; and higher health care costs and labor costs could adversely affect AMD’s business.
For a discussion of the factors that could cause actual results to differ materially from the forward-looking statements, see “Part I, Item
1A—Risk1A-Risk Factors” and the “Financial Condition” section set forth in “Part II, Item
7—Management’s7-Management’s Discussion and Analysis of Financial Condition and Results of Operations,” or MD&A, beginning on page
4135 below and such other risks and uncertainties as set forth below in this report or detailed in our other Securities and Exchange Commission (SEC) reports and filings. We assume no obligation to update forward-looking statements.
We are a global semiconductor company with facilities aroundprimarily offering:
x86 microprocessors, as a standalone central processing unit (CPU) or as incorporated into an accelerated processing unit (APU), chipsets, and discrete graphics processing units (GPUs) for the
world. Within the global semiconductor industry, we offer primarily: | (i) | x86 microprocessors, as standalone devices or as incorporated as an accelerated processing unit (APU), for the commercial and consumer markets, embedded microprocessors for commercial, commercial client and consumer markets and chipsets for desktop and mobile devices, including mobile personal computers, or PCs, and tablets, professional workstations and servers; and |
| (ii) | graphics, video and multimedia products for desktop and mobile devices, including mobile PCs and tablets, home media PCs and professional workstations, servers and technology for game consoles. |
consumer, commercial and professional graphics markets; and
server and embedded CPUs, GPUs and APUs, and semi-custom System-on-Chip (SoC) products and technology for game consoles.
For financial information about geographic areas and for segment information with respect to revenues and operating results, refer to the information set forth in Note 12 of our consolidated financial statements, beginning on page
10182 below.
We use a 52 or 53 week fiscal year ending on the last Saturday in December. The years ended December 26, 2015, December 27, 2014 and December 28, 2013 each included 52 weeks. References in this report to 2015, 2014 and 2013 refer to the fiscal year unless explicitly stated otherwise.
Additional Information
We were
Advanced Micro Devices, Inc. (AMD) was incorporated under the laws of Delaware on May 1, 1969 and became a publicly held company in 1972.
Since 1979 ourOur common stock
has beenis currently listed on
the New YorkThe NASDAQ Stock
ExchangeMarket (NASDAQ) under the symbol
“AMD.”“AMD”. Our mailing address and executive offices are located at One AMD Place, Sunnyvale, California 94088, and our telephone number is (408) 749-4000. References in this
reportAnnual Report on Form 10-K to “AMD,” “we,” “us,” “management,”
“our,”“our” or the “Company” mean Advanced Micro Devices, Inc. and our consolidated subsidiaries.
AMD, the AMD Arrow logo, ATI, the ATI logo, AMD Athlon, AMD Opteron, AMD Phenom, AMD Sempron, AMD Turion, FirePro, FireStream, CrossFire, Radeon, Geode, SeaMicro and combinations thereof are trademarks of Advanced Micro Devices, Inc. Microsoft, Windows, Xbox360 and DirectXXbox One are registered trademarks of Microsoft Corporation in the United States and/or other jurisdictions. HyperTransportPlayStation is a licensedregistered trademark of the HyperTransport Technology Consortium. Sony Computer Entertainment, Inc. Wii and Wii U are registered trademarks of Nintendo of America, Inc. ARM is a registered trademark of ARM Limited (or its subsidiaries).
Other names are for informational purposes only and are used to identify companies and products and may be trademarks of their respective owners.
Website
Web Site Access to
Company ReportsOur SEC Filings and Corporate Governance Documents
We post onOn the Investor Relations pages of our Web site,www.amd.comhttp://ir.amd.com, a linkwe post links to our filings with the SEC, our Principles of Corporate Governance, our Code of Ethics for our Executive Officersexecutive officers and all other senior finance executives, our “WorldwideWorldwide Standards of Business Conduct,” which applies to our Board of Directors and all of our employees, and the charters of the Audit and Finance, Compensation and Leadership Resources, Nominating and Corporate Governance and Innovation and Technology committees of our Board of Directors. Our filings with the SEC are posted as soon as reasonably practical after they are electronically filed with, or furnished to, the SEC. You can also obtain copies of these documents by writing to us at: Corporate Secretary, AMD, 7171 Southwest Parkway, M/S 100,B100.2, Austin, Texas 78735, or emailing us at:Corporate.Secretary@amd.com. All of these documents and filings are available free of charge.If we make substantive amendments to our Code of Ethics or grant any waiver, including any implicit waiver, to our principal executive officer, principal financial officer, principal accounting officer,
or controller or persons performing similar functions, we intend to disclose the nature of such amendment or waiver on our Web
site or in a Current Report on Form 8-K in accordance with applicable rules and regulations.Please note thatsite.
The information contained on our Web site is not incorporated by reference in, or considered to be a part of, this report.
We are a global semiconductor company. Semiconductors are components used in a variety of electronic products and systems. An integrated circuit or IC,(IC) is a semiconductor device that consists of many interconnected transistors on a single chip. Since the invention of the transistor in 1948, improvements in IC process and design technologies have led to the development of smaller, more complex and more reliable ICs at a lower cost per function. In order to satisfy the demand for faster, smallercost-per-function.
Computing and
lower-cost ICs, semiconductor companies have continually developed improvements in manufacturing and process technology and design. ICs are increasingly being manufactured using smaller geometries on larger silicon wafers. Use of smaller process geometries can result in products that are higher performing, use less power and cost less to manufacture on a per unit basis.Computing Solutions
Graphics
The x86 Microprocessor
Marketand Chipset Markets
Central Processing Unit (CPU). A microprocessor is an IC that serves as the central processing unit, or CPU of a computer. It generally consists of hundreds of millions or billions of transistors that process data and control other devices in the system, acting as the brain“brain” of the computer. The performance of a microprocessor is a critical factor impacting the performance of a computercomputing and numerous other electronic systems.entertainment platforms, such as desktop PCs, notebooks, tablets and workstations. The principal indicators ofelements used to measure CPU performance are work-per-cycle or(or how many instructions are executed per cycle,cycle), clock speed representing(representing the rate at which a CPUsCPU’s internal logic operates, measured in units of gigahertz, or billions of cycles per second,second) and power consumption. Other factors impacting microprocessor performance include the number and type of cores in a microprocessor, the bit rating of the microprocessor, memory size and data access speed.
Developments in
circuitIC design and manufacturing process technologies have resulted in significant advances in microprocessor performance.
Currently, microprocessors are designed to process 32 bits or 64 bits of information at one time. The bit rating of a microprocessor generally denotes the largest size of numerical data that a microprocessor can handle. Microprocessors with 64-bit processing capabilities enable systems to have greater performance by allowing software applications and operating systems to access more memory.Moreover, asAs businesses and consumers require greater performance from their computer systems due to the growth of digital data and increasingly sophisticated software applications, semiconductor companies are designing and developing multi-core microprocessors, where multiple processor cores are placed on a single die or in a single processor. Multi-core microprocessors offer enhanced overall system performance and efficiency because computing tasks can be spread across two or more processing cores, each of which can execute a task at full speed. Multiple processor cores packaged togetherMulti-core microprocessors can increase performance of a computer system without greatly increasing the total amount of power consumed and the total amount of heat emitted. This type of “symmetrical multiprocessing” is effective in multi-tasking environments where multiple cores can enable operating systems to prioritize and manage tasks from multiple software applications simultaneously and also for “multi-threaded” software applications where multiple cores can process different parts of the software program, or “threads,” simultaneously thereby enhancing performance of the application. Businesses and consumers also require computer systems with improved power management technology, which allowshelps them to reduce the power consumption of their computer systems, thereby reducing theenable smaller and more portable form factors, and lower total cost of ownership.
Accelerated Processing Unit (APU) and System-on-Chip (SoC)While general purpose computer architectures based on the x86 architecture are sufficient for many customers, we. Consumers increasingly demand computing devices with improved end-user experience, system performance and energy efficiency. Consumers also continue to demand thinner and lighter mobile devices, with better performance and longer battery life. We believe that ana computing architecture that optimizes the use of its components can provide these improvements.
An APU is a processing unit that integrates a CPU and graphics processing unit,a GPU onto one chip (or one piece of silicon), along with, in some cases, other special-purpose components. This integration enhances system performance by “offloading” selected tasks
to the best-suited component (i.e., the CPU or GPU, for a given workload can provide a substantial improvement in user experience, performance and energy efficiency. As the volumeGPU) to optimize component use, increasing the speed of digital media increases, we believe end users can benefit from an accelerated computing architecture. An accelerated computing architecture enables “offloading” of selected tasks, thereby optimizing the use of multiple computational units such asdata flow between the CPU and GPU depending onthrough shared memory and allowing the GPU to function as both a graphics engine and an application or workload. For example, serial workloads are better suited for CPUs, while highly parallel tasks may be better performed by a GPU. Our AMD Accelerated Processing Unit, or APU, combines ouraccelerator. Having the CPU and GPU ontoon the same chip also typically improves energy efficiency by, for example, eliminating connections between discrete chips.
A SoC is a type of IC with a CPU, GPU and other components, such as a memory controller and peripheral management, comprising a complete computing system on a single piecechip. By combining all of silicon.these elements as a SoC, system performance and energy efficiency is improved, similar to an APU.
Heterogeneous System Architecture (HSA) describes an industry standard that is an overarching design for having combinations of CPU and GPU processor cores operate as a unified, integrated engine that shares system responsibilities and resources. We are a founding member of the HSA Foundation, a non-profit organization established to define and promote this open standards-based approach to heterogeneous computing. Heterogeneous computing allows for the elevation of the GPU to the same level of the CPU for memory access, queuing and execution - a true “compute core”. This capability allows software programmers to develop applications to more fully utilize the capabilities of the graphics compute core.
Graphics Processing Unit (GPU). A GPU is a programmable logic chip that renders images, animations and video and is also increasingly being used to handle general computing tasks. GPUs are located in plug-in cards, as a discrete processor or in a chipset on the motherboard, or in the same chip as the CPU. GPUs perform parallel operations on data to render images for the screen and are essential to presenting computer generated images on the screen, decoding and rendering animations and video. The more sophisticated the GPU, the higher the resolution and the faster and smoother the motion. GPUs on stand-alone cards or discrete GPUs on the motherboard typically include their own memory, while GPUs in the chipset or CPU chip share main memory with the CPU.
In addition to graphics processing, the parallel operation of GPUs are used on multiple sets of data, increasingly used in vector processor for non-graphics applications that require repetitive computations such as supercomputing, deep neural networks, and various embedded applications.
Chipset. A chipset is a generic term referring to a collection of system level components that manage data flow among a microprocessor or microprocessors, memory and peripherals (such as CD ROM drives, DVD drives and USB peripherals). Chipsets perform essential logic functions, balance a system’s performance and provide system control and power management functions. Some chipsets have graphics capabilities by including an integrated graphics processor (IGP) within the chipset. A chipset with an IGP is known as an IGP chipset. IGP chipsets can offer a lower cost, reduced power alternative to a discrete GPU, and are often also used in smaller form factors. Systems that are powered by an APU or by a CPU and discrete GPU combination often do not have a chipset and instead use an AMD Controller Hub chip to perform the functions of a chipset. As a result, we believe that high performance computing workloads, workloads that are visual in natureeither an APU and even traditional applications such as photoAMD Controller Hub chip combination or a SoC, which already includes a chipset, will eventually replace the market for IGP chipsets.
Our x86 Microprocessor and
video editing or other multi-media applications can benefit from our accelerated computing architecture.MicroprocessorChipset Products
We currently design, develop and sell microprocessor products for servers, desktop PCs and mobile devices, including mobile PCs and tablets.
Our microprocessors
and chipsets are incorporated into computing platforms,
that also include GPUs and core software to enable and advance the computing components. A platform iswhich are a collection of technologies that are designed to work together to provide a more complete computing
solution.solution and to enable and advance the computing components. We believe that integrated, balanced
computing platforms consisting of microprocessors, chipsets and GPUs
(either as discrete GPUs or integrated into an APU or SoC) that work together at the system level bring end users improved system stability, increased performance and enhanced power efficiency.
Furthermore, by combining all of these elements onto a single piece of silicon as an APU, we believe system performance and power efficiency is further improved. In addition,
to the enhancements at the end-user level, we believe our customers also benefit from an all-AMD platform
(consisting of an APU or CPU, a discrete GPU and a chipset or an AMD Fusion Controller Hub chip), as we are able to
optimize interoperability, provide
them withour customers a single point of contact for the key platform components and enable them to bring the platforms to market faster in a variety of client and server system form factors.
Our CPUs and APUs are manufactured primarily using 45-nanometer (nm), 40nm, 32nm or 28nm process technology.
We currently base our microprocessors and chipsets on the x86 instruction set architecture and AMD’s Direct Connect Architecture, which connects an on-chip memory controller and input/output
or I/O,(I/O) channels directly to one or more microprocessor cores. We typically integrate two or more processor cores onto a single die, and each core has its own dedicated cache, which is memory that is located on the semiconductor die, permitting
quickerquick access to frequently used data and instructions. Some of our microprocessors have additional levels of cache such as L2, or
second levelsecond-level cache, and L3, or
third levelthird-level cache, to enable faster data access and higher performance.
Energy efficiency and power consumption continue to be key design principles for our products.
We focus on continually improving the energy efficiency of our products through our design principles and innovations in power management technology, or “performance-per-watt.”technology. To that end, we offer CPUs, GPUs, APUs, SoCs and chipsets with features that we have designed to reduce system level energy consumption, with multiple low power states whichthat are designed to utilize lower clock speeds and voltages thatto reduce processor power consumption during both active and
idle times. We design our CPUs and APUsThe use of intelligent, dynamic power management is designed to create lower energy use by allowing compute applications to be compatible with operating system software such ascompleted quickly and efficiently, enabling a return to the Microsoftultra-low power idle state.
Desktop. Our APUs for desktop PCs consist primarily of the AMD A-Series and AMD E-Series APUs. We also offer AMD FX CPUs for the enthusiast market. The latest generation of our AMD FX CPUs is based on the “Piledriver” x86 multi-core architecture. Our AMD FX CPUs are designed for multitasking, high resolution gaming and HD media processing and come in eight-, six- and quad-core versions. In May 2015, we introduced the AMD A-Series A10-7870K APU, a refresh to the existing line of processors, formerly codenamed “Kaveri”, designed to support best-in-class experiences for eSports and online gaming. In July 2015, we introduced the AMD A-Series A8-7670K APU, designed to support Windows® Windows 10, mainstream workloads and online gaming.
Notebook and 2-in-1s. In response to consumer demand, we continue to invest in designing and developing high performing and low power APUs for notebook PC platforms. Our APUs for notebook PCs consist primarily of AMD A-Series APUs and AMD E-Series APUs. These APUs combine discrete-level AMD Radeon™ graphics, and multi-core CPU processors on a single chip and are designed to optimize performance and energy efficiency. In May 2015, we introduced the AMD 7000 Series APUs, formerly codenamed “Carrizo-L”, designed to prolong battery life and enable uninterrupted video streaming in mainstream notebooks. In June 2015, we announced our 6®th family Generation A-Series Processor, formerly codenamed “Carrizo”, the world’s first high-performance APU in a SoC design. Leveraging AMD “Excavator” cores and the third generation of AMD’s Graphics Core Next (GCN) architecture, the processor is designed for mainstream notebooks.
Chipsets. Our portfolio of chipset products includes models with and without integrated graphics features for desktop and notebook PCs and servers, as well as AMD Controller Hub-based chipsets for our APUs. We offer AMD 9-Series chipsets for the Socket AM3/3+ platforms serving desktop PCs, and AMD A-Series Control Hubs for the Socket FM2/2+ and Socket FP4 platforms for desktop, all-in-one and notebook PCs. We also offer AMD 785E, 780E, 780M, SR5690, SB600, SB710, SB850 and M690T chipsets and AMD A-Series Controller Hubs for our embedded products.
Commercial. We offer enterprise-class solutions sold as AMD PRO for the commercial client market. AMD PRO solutions are designed to provide commercial-grade quality, platform longevity and extended image stability, and also include security and manageability features for enterprise. In September 2015, we launched the latest AMD PRO mobile and desktop processors, formerly codenamed "Carrizo PRO" and "Godavari PRO", based on our 6th Generation A-Series Processor technology.
Graphics Market
The semiconductor graphics market addresses the need for improved visual processing in various computing devices. Many consumers value a rich visual experience to enable a more compelling and immersive experience, and, for these consumers, the PC has evolved from a traditional data processing and communications device to an entertainment platform. As a result, visual realism and graphical display capabilities are key product differentiation elements among computing devices. This has led to increasing creation and use of processing-intensive multimedia content for computing devices, including playing games, capturing multimedia content, viewing online videos, photo editing and managing digital content. In turn, these trends have contributed to higher consumer demand for performance graphics solutions and to manufacturers designing computing devices with these capabilities.
Our APUs deliver visual processing functionality for value and mainstream PCs by integrating a CPU and a GPU on a single chip, while discrete GPUs (which are also known as dGPUs) offer high performance graphics processing across AMD platforms. AMD Accelerated Parallel Processing or GPGPU (General Purpose GPU) refers to a set of advanced hardware and software technologies that enable discrete AMD GPUs, working in concert with the CPU, to accelerate computational tasks beyond traditional CPU processing by utilizing the vast number of discrete GPU cores while working with the CPU to process information cooperatively. In addition, computing devices with HSA features run computationally-intensive tasks more efficiently, which we believe provides a superior application experience to the end user. Moreover, heterogeneous computing allows for the elevation of the GPU to the same level as the CPU for memory access, queuing and execution.
Our Graphics Products
Graphics is a fundamental component of almost everything we create and can be found in an APU, GPU, SoC or a combination of a GPU with one of the other foregoing products working in tandem. Our customers generally use our graphics solutions to increase the speed of rendering images and to help improve image resolution and color definition. We develop our graphics products for use in various computing devices and entertainment platforms, including desktop PCs, notebook PCs, 2-in-1s and professional workstations. With each of our graphics products, we have available drivers and supporting
software packages that enable the effective use of these products under a variety of operating systems and applications. In addition, our recent generation graphics products have Linux® driver support.
Discrete Desktop and Notebook Graphics. Our discrete GPUs for desktop and notebook PCs enable next generation APIs like DirectX® 12 and Vulkan™, NetWare®, Solarissupport new displays using Freesync™ technology, and UNIX.are uniquely positioned to drive the next visual revolution of virtual reality (VR) in PC platforms. Our products include AMD Radeon™ R5, R7 and R9 series graphics. In June 2015, we introduced the new AMD Radeon™ R9 Fury X and R9 Fury graphics, the AMD Radeon R7 300 and R9 300 series graphics as well as the AMD Radeon M300 series graphics to reinforce our graphics leadership in both power efficiency for notebooks and best-in class performance for desktops. In August 2015, we introduced the AMD Radeon™ R9 Nano, featuring on-chip High-Bandwidth Memory (HBM) for 4K gaming performance. Professional Graphics.Our AMD FirePro™ family of APUs representsprofessional graphics products consists of 3D and 2D multi-view graphics cards and GPUs that we designed for integration in mobile and desktop workstations, as well as commercial PCs. We designed our AMD FirePro 3D graphics cards for demanding applications, such as those found in the computer aided design (CAD) and digital content creation (DCC) markets, with drivers specifically tuned for maximum performance, stability and reliability across a wide range of software packages. We designed our AMD FirePro 2D graphics cards with dual- and quad-display outputs for financial and corporate environments.
We also provide the AMD FirePro S-Series GPU products for the server market, where we target high performance computing (HPC) primarily focused on Deep Neutral Networks (DNN), Geosciences, Biosciences, Academic and Government workloads, and virtual desktop infrastructure (VDI) use cases primarily focused on workstation-class virtualization, desktop remoting and content streaming workloads. In July 2015, we announced our new approach to processor design and software development, delivering serial, parallel and visual compute capabilitiesAMD FirePro™ S9170 server GPU, designed for high definition (HD) video, 3Dperformance compute (HPC) environments. In December 2015, we launched the AMD FirePro W4300 graphics card designed for Computer-Aided Design (CAD) for both small and data-intensive workloads in the APU. APUs combine high-performance serialfull-size workstations.
Enterprise, Embedded and parallel processing cores with other special-purpose hardware accelerators. We design our APUs for improved visual computing, security, performance-per-wattSemi-Custom
The Enterprise, Embedded and
smaller device form factors. Having the CPU and GPU on the same chip reduces the system power and bill-of-materials, speeds the flow of data between the CPU and GPU through shared memory and allows the GPU to function as both a graphic engine and an application accelerator in high efficient compute platforms.Building on the integration of our CPU and GPU onto a single piece of silicon, we are focused on evolving our accelerated computing architecture in such a manner so that software programmers see a single multi-purpose processing unit. Heterogeneous Systems Architecture (HSA) describes our overarching design for having combinations of CPU and GPU processor cores operate as a unified engine that we intend to be both higher performance and lower power than our previous architectures.
Semi-Custom Markets
Server. A server is a computer system that performs services for connected clientscustomers as part of a client-server architecture. ServersMany servers are designed to run an application or applications often for extended periods of time with minimal human direction.intervention. Examples of servers include web servers, e-mail servers and print servers. These servers can run a variety of applications, including business intelligence, enterprise resource planning, customer relationship management and advanced scientific or engineering models to solve advanced computational problems in disciplines ranging from financial modeling to weather forecasting to oil and gas exploration. Servers are also used in cloud computing, which is a computing model where data, applications and services are delivered over the internet or an intranet.Our microprocessors for traditional server platforms consist of our AMD Opteron™ 6000, 4000 and 3000 series processors. We also offer high-density server platforms consisting of AMD’s SeaMicro SM10000™ and SM15000™ server chassis, as well as AMD’s SeaMicro Freedom™ Fabric Storage series of storage systems.
In March 2012, we acquired SeaMicro, Inc., an energy-efficient, high-bandwidth microserver company to accelerate our strategy to deliver server technology and provide end users serving Cloud-centric Today’s data centers with highly-differentiated AMD-based solutions. Our fabric technology, AMD SeaMicro Freedom supercompute fabric, links together hundredsrequire new technologies and configuration models to meet the demand driven by the staggering amount of card-sized CPUsdata that needs to create a large arraybe stored, accessed and managed. Servers must be efficient, scalable and adaptable to meet the compute characteristics of independent but linked CPUs. Work is distributed over these CPUs through hardwarenew and software based load-balancing technology that directs traffic across the fabric such that each CPU is in its most efficient zone of performance. We designed this fabric to reduce power consumption while providing lower latency, lower cost and higher bandwidth.
In March 2012, we launched the AMD Opteron 3200 Series server processor. This entry-level server processor is designed for dedicated web hosting providers who are seeking enterprise-class servers at lower price points. In September 2012, we announced AMD’s SeaMicro SM15000 server chassis, which extends fabric-based computing across racks and aisles of the data center to connect directly to large data storage systems. In November 2012, we launched the AMD Opteron 6300 Series processor based on “Piledriver,” our next-generation high performance x86 multi-core architecture. We designed the AMD Opteron 6300 Series processor to balance performance, scalability and cost effectiveness to help IT organizations lower total cost of ownership. In December 2012, we launched the AMD Opteron 4300 and 3300 Series server processor, which is also based on our next-generation “Piledriver” core architecture. These processors are designed for cloud providers, web hosts and small- and medium-sized businesses to help them address space and power constraints.
changing workloads.
Mobile Devices. Consumers continue to demand thinner and lighter mobile platforms with better entertainment performance and longer battery life. In response to this demand, we continue to invest in designing and developing higher performing and low power mobile platforms. Our APUs for mobile PC platforms consist of our performance, mainstream AMD A-Series APU, the AMD E-Series APU for everyday performance, the AMD C-Series APU for HD internet experiences in small form factors, and the AMD Z-Series APU for Windows-based tablets. Our APUs for mobile platforms combine discrete-level graphics, dedicated HD video processing and multi-core CPU processors on a single die for maximum performance and power efficiency in the smallest space. In May 2012, we introduced our second generation AMD A-Series APU for mainstream and ultrathin mobile PC platforms. In June 2012, we introduced our next generation AMD E-Series APU for mobile platforms, which meets basic performance needs at accessible price points. In October 2012, we announced the AMD Z-60 APU, codenamed “Hondo,” our lowest powered APU designed for the performance tablet and small form factor PC market.EmbeddedOur CPUs for mobile PC platforms also consist of the AMD Phenom. ™ II Mobile Processor, AMD Turion™ X2 Mobile Processor, AMD Turion II Mobile Processor, AMD Turion II Ultra Mobile Processor, AMD Athlon™ II processor, and the Mobile AMD Sempron™ processor.
Desktop. Our APUs for desktop PC platforms consist primarily of the AMD A Series APU and the AMD E-Series APU. We designed the desktop AMD A-Series APU for mainstream desktop platforms, and it is available primarily in quad- and dual-core versions with a variety of discrete-level graphics configurations. We designed the desktop AMD E-Series APUs for essential desktop tasks, and it is available in dual-core versions with a variety of graphics configurations. In May 2012, we launched our next generation AMD A-Series APU for desktop PCs, small form-factors and home theater PCs. In June 2012, we introduced our next generation AMD E-Series APU for desktop PCs. Our second generation AMD E-Series and AMD A-Series APUs have increased x86, graphics and multi-media capabilities. In October 2012, we introduced the second generation desktop AMD FX processors based on the “Piledriver” x86 multi-core architecture, which come in eight-, six- and quad-core versions. We designed the AMD FX processors for multitasking, high resolution gaming, and HD media processing. Also in October 2012, we introduced our latest quad- and dual-core AMD A-Series APUs for mainstream desktop platforms, codenamed “Trinity” with the “Piledriver” x86 multi-core architecture.
Our CPUs for desktop PC platforms also consist of the following: AMD FX processors based on the “Bulldozer” and “Piledriver” x86 multi-core architecture, which are available in quad- and dual-core technology, AMD Athlon II processors, which are available in quad-, triple- and dual- core versions, and AMD Sempron processors, which are available in limited quantities and in select regions.
Embedded Processor Products
Our embedded products address customercomputing needs in PC-adjacent markets. Typically, our embedded products are used in applications that require high to moderate levels of performance where key features include low cost, mobility, low powermarkets, such as industrial control and small form factor. High performance graphics are increasingly important in many embedded systems. Customers of our embedded products include vendors in industrial controls,automation, digital signage, point of sale/point-of-sale/self-service kiosks, medical imaging, set-top box and casino gaming machines as well as enterprise class telecommunications, networking, security, storage systems and thin-clients, orthinclients (which are computers that serve as an access device on a network.
network). Typically, our embedded products are used in applications that require high to moderate levels of performance, where key features may includemobility, relatively low power, small form factor, and 24x7 operations. High-performance graphics areincreasingly important in many embedded systems. Support for Linux®, Windows® and other operating systems as well as for increasingly sophisticated applications are also critical for some customers. Other requirements may include meeting rigid specifications for industrial temperatures, shock, vibration and reliability. The embedded market has moved from developing proprietary, custom designs to leveraging the industry-standard x86 instruction set architecturearchitectures and processors as a way to help reduce costs and speed time to market. Customer requirements for these systems include: very low power for small enclosures and 24x7 operation, support for Linux, Windows and other operating systems, and high-performance for increasingly sophisticated applications. Other requirements include advanced specifications for industrial temperatures, shock and vibration, and reliability.
Our embedded platforms include options from the AMD Opteron, AMD Athlon and AMD Sempron processor families; the AMD Embedded G-Series, which is the embedded version ofSemi-Custom. We have leveraged our APUs; the AMD Radeon™ graphics processor family; and numerous AMD chipsets. These products are part of the AMD Longevity Program, which provides for an availability period of up to five years in some cases in order to support lengthy development and qualification cycles and long-term life of the system in the market.In May 2012, we launched the AMD Embedded R-Series APU designed for mid- to high-end graphics-intensive applications such as digital signage, casino gaming, point-of-sale systems and kiosks, as well as parallel-processing-intensive applications spanning medical imaging and security/surveillance. The AMD Embedded R-Series APU combines the new “Piledriver” architecture, with discrete class AMD Radeon™ HD 7000 series graphics that support Microsoft® DirectX® 11 (DirectX 11).
Chipset Market and Products
A chipset is the set of components that manages data flow between a processor (or processors), memory and peripherals (such as the keyboard, mouse, monitor, hard drive and CD or DVD drive). Chipsets perform essential logic functions and balance the performance of the system and aid in removing bottlenecks. Chipsets often
include graphics, audio, video and other capabilities. All desktop and mobile PCs as well as servers have a chipset. In many PCs, the chipset includes a graphics processing unit (GPU). A GPU within the chipset solution is commonly known as an integrated graphics processor (IGP), and such a chipset may be called an IGP chipset. In a system without an integrated graphics processor, a discrete GPU is usually required. By not necessitating a discrete GPU, IGP chipsets offer a lower cost solution and reduced power consumption and enable smaller system form factors. With our APU architecture, the GPU is included in the APU and the AMD Controller Hub chip performs the input and output functions of the chipset. We believe that the combination of an APU and the AMD Controller Hub will replace our market for IGP chipsets.
Our portfolio of chipset products includes chipsets with and without IGPs for desktop PCs and servers, and AMD Controller Hub-based chipsets for our APUs. We offer AMD A50-Series, A60-Series and A70-Series chipsets for our mobile PC platforms. As well, we offer AMD 9-Series, 8-Series, 7-Series Discrete and AMD 7-Series Integrated chipsets for desktop PCs.
Graphics
Graphics Market
A graphics solution can be in the form of either an APU, a GPU, an IGP, or a combination of a GPU with one of the other foregoing products working in tandem. The semiconductor graphics market addresses the need for visual or parallel processing in various computing and entertainment platforms such as desktop PCs, mobile PCs and workstations
APUs and IGPs deliver discrete GPU level functionality for value and mainstream PCs while discrete GPUs are specifically architected for high performance graphics processing. A dedicated GPU and CPU work in tandem to increase overall speed and performance of the system. Users of these graphics products value a rich visual experience, particularly in the high-end enthusiast market where consumers often seek out the fastest and highest performing visual processing products to enable the most compelling and immersive experiences. Moreover, for many consumers, the PC is evolving from a traditional data processing and communications device to an entertainment platform. Visual realism and graphical display capabilities are key elements of product differentiation among various product platforms. This has led to the increasing creation and use of processing intensive multimedia content for PCs and to manufacturers designing PCs for playing games, displaying photos and capturing TV and other multimedia content, viewing online videos, photo editing and managing digital content. In turn, the trend has contributed to the development of higher performance graphics solutions.
Graphics Products
Our customers generally usecore IP, including our graphics solutions to increase the speed of rendering images and to improve image resolution and color definition. We develop our products for use in desktop and mobile PCs, professional workstations, servers and gaming consoles. With each of our graphics products, we provide drivers and supporting software packages that enable the effective use of these products under a variety of operating systems and applications. In addition, our recent generation graphics products have Linux® driver support.
Heavy computational workloads have traditionally been processed on a CPU, but we believe that the industry is shifting to a new computing paradigm that increasingly relies more on the GPU or a combination of GPU and CPU. AMD Accelerated Parallel Processing or GPGPU (General Purpose GPU) refers to a set of advanced hardware and software technologies that enable AMD GPUs, working in concert with the computer system’s CPUs, to accelerate applications beyond traditional graphics and video processing by allowing the CPUs and GPUs to process information cooperatively. Heterogeneous computing, which refers to computer systems that use more than one kind of processor, enables PCs and servers to run computationally-intensive tasks more efficiently, which we believe provides a superior application experience to the end user.
Discrete Desktop Graphics. We believe that discrete graphic solutions will continue to be popular across desktop PC configurations and platforms designed for gaming, multimedia, photo and video editing as well as other graphic-intensive applications. Our discrete GPUs for desktop PCs include the AMD Radeon HD 8000 series, AMD Radeon 7000 series, AMD Radeon HD 6000 series, ATI Radeon HD 5000 series, ATI Radeon HD 4000 series and ATI Radeon HD 3000 series. In 2012, we introduced a number of new GPUs based on 28nm process technology and our Graphics Core Next, or GCN, architecture. GCN architecture is our first design specifically engineered for general computing, enabling a GPU to handle workloads and programming languages traditionally exclusive to the CPU. In February 2012, we launched the AMD Radeon HD 7770 GHz Edition, AMD Radeon HD 7750 and AMD Radeon HD 7700 GPUs. In March 2012, we introduced the AMD Radeon HD 7870 GHz Edition and AMD Radeon HD 7850 GPUs. The AMD Radeon HD 7870 GHz Edition features AMD PowerTune technology and AMD ZeroCore Power technology. AMD ZeroCore Power technology powers down a GPU when the PC is in a long idle state and applications are not using background GPU resources. In June 2012, we launched the AMD Radeon™ HD 7970 GHz Edition GPU featuring next generation AMD Eyefinity technology, AMD Power Tune with Boost and AMD App Acceleration. AMD PowerTune technology manages GPU power consumption in response to GPU load conditions and allows for the GPU to run at higher clock speeds than otherwise possible. AMD PowerTune with Boost further increases the clock speed of a GPU. AMD App Acceleration is a set of technologies designed to improve video quality and enhance application performance. AMD Eyefinity technology allows for up to six independent and simultaneous monitors to be connected to one GPU.
Discrete Mobile Graphics. When selecting a graphics solution, key considerations for mobile PC manufacturers are graphics performance, visual experience, power efficiency, dedicated memory support and ease of design integration. Our discrete GPUs for mobile PCs include the following: AMD Radeon HD 8000M series, AMD Radeon 7000M series, AMD Radeon HD 6000M series, ATI Mobility Radeon HD 5000 series and ATI Mobility Radeon HD 4000 series. In April 2012, we launched AMD Radeon HD 7900M, HD 7800M and HD 7700M series GPUs. These new graphics processors are all based on 28nm process technology and our GCN architecture. In addition, the AMD Radeon HD 7000M series GPUs have AMD Enduro™ Technology, which is a power solution that automatically switches between integrated graphics and the AMD Radeon discrete GPU, depending on the system or application requirements, to help maximize battery life.
Professional Graphics. Our AMD FirePro™ family of professional graphics products consist of 3D and 2D multi-view graphics cards and GPUs that we designed for integration in mobile and desktop workstations, as well as business PCs. We designed our AMD FirePro 3D graphics cards for demanding applications such as those found in the computer aided design (CAD) and digital content creation (DCC) markets, with drivers specifically tuned for maximum performance, stability and reliability across a wide range of software packages. We designed our AMD FirePro 2D graphics cards with dual and quad display outputs for financial and corporate environments.
We also provide graphics products for the server market where we leverage our graphics expertise and align our offerings to provide the stability, video quality and bus architectures desired by our customers. Through our ATI CrossFire Pro™, we enable CAD and DCC professionals to connect two identical AMD FirePro 3D graphics cards with a flex cable connection that can enhance performance of geometry-limited applications.
In February 2012, we introduced the AMD FirePro V3900, an entry-level professional graphics card that features AMD Eyefinity technology. In August 2012, we announced AMD FirePro S9000 and S7000 server graphics cards for the high-end workstation market. In addition, we launched the next generation of AMD FirePro workstation products, W5000, W7000, W8000 and W9000 GPUs designed to balance compute and 3-D workloads efficiently for CAD and engineering and for media and entertainment professionals. We also launched AMD FirePro A300 APU for entry-level and mainstream desktop workstations for users who require a high-performance computing platform to power their professional applications. In November 2012, we introduced AMD FirePro S10000 server graphics card designed for high-performance computing workloads and graphic intensive applications.
FireStream Processors. We designed our AMD FireStream™ series of products to utilize the parallel stream processing power of the GPU for heavy floating-point computations and to meet the requirements of various industries, such as the high-performance computing and the scientific and financial sectors.
Game Consoles. Semiconductor graphics suppliers have leveraged their core visual and graphics processing technologies developed for the PC market by providing graphicand server markets, to develop semi-custom solutions to game console manufacturers.for customers who want differentiation in their products. In this market, semiconductor graphics suppliers work alongside game consolesystem designers and manufacturers to enhance the visualperformance and overall user experience for userssemi-custom customers. AMD has used this type of sophisticated video games.collaborative development approach with today’s leading game console manufacturers, and can also address customer needs in many other markets beyond game consoles, leveraging our existing IP to create a variety of products tailored to a specific customer’s needs, ranging from complex fully-customized SoCs to more modest adaptations and integrations of existing CPU, APU or GPU products.
Our Enterprise, Embedded and Semi-Custom Products
Server Processors. Our microprocessors for server platforms currently include the AMD Opteron™ X-Series, AMD Opteron™ 6300 Series processors, and AMD Opteron™ A-Series processors. In January 2016, we launched the AMD Opteron™ A1100 SoC, our first 64-bit ARM® based product, designed to accelerate time-to-market deployment of ARM-based systems for the datacenter and improve enterprise-class ecosystem support for 64-bit ARM in key markets.
Embedded Processors. Our embedded processors are increasingly driving intelligence into new areas of our lives, like interactive digital signage, casino gaming, and medical imaging devices. These products are designed to support greater connectivity and productivity, and we believe they are a strongdriver for the “internet of things” and “surround computing” areas in the computing industry. Our processor products for embedded platforms include AMD Embedded R-Series APU and CPUs, AMD Embedded G-Series SoC platform and AMD Embedded Radeon™ GPUs. In September 2015, we announced multiple new discrete AMD Embedded Radeon graphics cards, the AMD Embedded Radeon™ E8950MXM Module, the Embedded Radeon™ E8870 Series and E6465 Series, suitable for multiple form factors. The suite of products is specifically designed to advance the visual and parallel processing capabilities of embedded applications. In October 2015, we announced new AMD Embedded R-Series SOC processors designed for a broad variety of embedded applications. The processors incorporate the newest AMD 64-bit x86 CPU core (“Excavator”), plus third-generation Graphics Core Next GPU architecture, and power management to minimize energy consumption.
Dense Server Systems. As part of our strategy to simplify and sharpen our investment focus, we decided in the first quarter of 2015 to exit the dense server systems business, formerly SeaMicro. AMD continues to provide warranty and extended support to the existing installed base of SeaMicro dense server systems, but is no longer selling dense server systems or offering additional extended support.
Semi-Custom. Our semi-custom products are tailored, high-performance, customer-specific solutions based on AMD’s CPU, GPU and multi-media technologies. We leveragework closely together with our customers to define solutions to precisely match the requirements of the device or application. Historically we have leveraged our core visualgraphics processing technology into the game console market by licensing customized GPUs for graphicsour graphic technology in videogamegame consoles such as the Microsoft® Xbox 360™,360™ and Nintendo Wii and Wii U from Nintendo.U. More recently, we developed the semi-custom SoC products that power the Sony Playstation® 4 and Microsoft® Xbox One™ game consoles.
We sell our products through our direct sales force and through independent distributors and sales representatives in both domestic and international
markets pursuant to non-exclusive agreements.markets. Our sales arrangements generally operate on the basis of product forecasts provided by the particular customer, but do not typically include any commitment or requirement for minimum product purchases. We primarily use purchase orders, sales order acknowledgments and contractual agreements as evidence of our sales arrangements. Our agreements typically contain standard terms and conditions covering matters such as payment terms, warranties and indemnities for issues specific to our products.
We generally warrant that our products sold to our customers will conform to our approved specifications and be free from defects in material and workmanship under normal use and service for one year. Subject to certain exceptions, we also offer a three-year limited warranty to end users for
only those CPU and AMD A-Series APU products
that arepurchased as individually packaged products, commonly referred to as “processors in a box”
, and for PC workstation products. We have also offered extended limited warranties to certain customers of “tray” microprocessor products and/or workstation graphics products who have written agreements with us and target their computer systems at the commercial and/or embedded markets.
We market and sell our
latest products under the AMD trademark. Our desktop PC product brands for microprocessors are AMD A-Series, AMD E-Series, AMD
FX,FX™ CPU, AMD
AthlonAthlon™ CPU and APU, AMD Sempron™ APU and CPU and AMD
Sempron.Pro A-Series APU. Our
mobile PC brandsnotebook and 2-in-1s for microprocessors are AMD A-Series,
A, AMD E-Series, AMD C-Series, AMD Z-Series, AMD
Phenom,FX™ APU, AMD Phenom™, AMD Athlon
CPU and APU, AMD
TurionTurion™ and AMD
Sempron.Sempron APU and CPU. Our server brand for microprocessors is AMD
Opteron. We sell micro-server systems products under the SeaMicro brand, including SM10000 and SM15000 series for fabric compute systems, and Freedom Fabric Storage series for storage systems.Opteron™. We also sell low-power versions of our AMD Opteron, AMD Athlon
and AMD Sempron,
as well as AMD Geode™, AMD R-Series and
AMD Embedded A-SeriesG-Series processors as embedded processor solutions. Our product brand for the consumer graphics market is AMD
Radeon.Radeon, and AMD Embedded Radeon is our product brand for the embedded graphics market. Our product brand for professional graphics products is AMD
FirePro.FirePro™. We also market and sell our chipsets under the AMD trademark.
We launch or update new platforms for consumers in the desktop and mobile markets under our VISION Technology from AMD brand. We designed VISION Technology to simplify the buying process for consumers by more clearly connecting our brand to the level of activities that consumers want to perform on the PC. VISION Technology contains multiple levels of increasingly rich PC system capabilities to address the diverse needs of today’s PC users. VISION Technology initially consisted of four levels of PC system capabilities: VISION, VISION Premium, VISION Ultimate and VISION Black. Our VISION Technology brand for our low-power APU products, consists of VISION E1 and VISION E2 for our entry level PCs. Our VISION Technology brand for performance series APUs consisting of four levels of PC system capabilities: VISION A4, VISION A6, VISION A8, and VISION FX. These VISION tiers are for 2011 and later systems powered by our APUs and provide increasingly higher PC capabilities. An additional tier, VISION A10, was introduced in September 2012. VISION E1, E2, and A4 based desktops and notebooks are targeted at PC users who require basic digital media consumption such as watching DVDs, photo viewing, casual gaming, listening to music, and
Internet browsing. VISION A6, A8 and A10 based desktops and notebooks are designed to allow a greater computing performance for digital consumption and creation. These activities include watching HD movies, photo editing, DirectX 11 gaming, multi-tasking, and video editing. VISION FX desktops are based on the AMD FX processor and an AMD Radeon HD 6000, HD 7000 or HD 8000 series graphics card. We designed these VISION FX systems to enable the highest capabilities sought by enthusiasts and are only available on desktop PCs. There is also VISION Pro Technology, which is designed for business users and extends the approach of VISION Technology to commercial PC platforms.
We market our products through our direct marketing and co-marketing programs. In addition, we have cooperative advertising and marketing programs with customers and third parties, including market development programs, pursuant to which we may provide product information, training, marketing materials and funds. Under our co-marketing development
programs, eligible customers can use market development funds as
partial reimbursement for advertisements and marketing programs related to our products and
third partythird-party systems integrating our products, subject to meeting defined criteria.
Original Equipment Manufacturers, or OEMs, may qualify for market development funds based on purchases of eligible products.Our microprocessor customers consist primarily of
OEMs,original equipment manufacturers (OEMs), original design manufacturers
or ODMs,(ODMs), system builders and independent distributors in both domestic and international markets. ODMs provide design and/or manufacturing services to branded and unbranded private label resellers, OEMs and system builders. Our graphics
productsproduct customers include the foregoing as well as
AIBs, or add-in-board
manufacturers.manufacturers (AIBs).
Customers of our chipset products consist primarily of PC and server OEMs, often through ODMs or other contract manufacturers, who build the OEM motherboards, as well as desktop and server motherboard manufacturers who incorporate chipsets into their channel motherboards.
Our sales and marketing teams
We work closely with our customers to define product features, performance and timing of new products so that the products we are developing meet our customers’ needs. We also employ application engineers to assist our customers in designing, testing and qualifying system designs that incorporate our
products in order to assist in optimizing product compatibility.products. We believe that our commitment to customer service and design support improves our customers’ time-to-market and fosters relationships that encourage customers to use the next generation of our products.
We work closely with our customers to create differentiated products that leverage our CPU, GPU and APU technology. Customers of our semi-custom products pay us non-recurring engineering fees for design and development services and a purchase price for the resulting semi-custom products.
Collectively, our top five customers accounted for approximately 68% of our net revenue during the year ended 2015. In 2015, Microsoft Corporation and Sony Corporation each accounted for more than 10% of our consolidated net revenues. Sales to Microsoft and Sony consisted primarily of products from our Enterprise, Embedded and Semi-Custom segment. Five customers accounted for approximately 53% of the net revenue attributable to our Computing and Graphics segment. In addition, five customers, including Sony and Microsoft, accounted for approximately 95% of the net revenue attributable to our Enterprise, Embedded and Semi-Custom segment. A loss of any of these customers would have a material adverse effect on our business.
Original Equipment Manufacturers
We focus on three types of
OEMs:OEM customers: multi-nationals, selected regional accounts and target market customers. Large multi-nationals and regional accounts are our core OEM customers. Our OEM customers include numerous foreign and domestic manufacturers of servers and workstations,
desktopdesktops, notebooks, PC motherboards and
mobile PCs, and PC motherboards.In 2012, Hewlett-Packard Company accounted for more than 10% of our consolidated net revenues. Sales to Hewlett-Packard consisted primarily of products from our Computing Solutions segment. Five customers, including Hewlett-Packard, accounted for approximately 59% of the net revenue attributable to our Computing Solutions segment. In addition, five customers accounted for approximately 48% of the net revenue attributable to our Graphics segment. A loss of any of these customers could have a material adverse effect on our business.
game consoles.
Our authorized
channel distributors resell to sub-distributors and mid-sized and smaller OEMs and ODMs. Typically, distributors handle a wide variety of products,
includingand may include those that compete with our products. Distributors typically maintain an inventory of our products. In most instances, our agreements with distributors
protect their inventory of our products against price reductions and provide return rights with respect to any product that we have removed from our price book that is not more than twelve12 months older than the manufacturing code date. In addition, some agreements with our distributors may contain standard stock rotation provisions permitting limited levels of product returns.
AIB
Add-in-Board (AIB) Manufacturers and System Integrators
We strive to establish and broaden our relationships with AIB manufacturers.
We offer component-level graphics and chipset products to AIB manufacturers who in turn build and sell board-level products using our technology to system integrators
or SIs,(SIs), and
at retail.to retail buyers. Our agreements with AIBs protect their inventory of our products against price reductions. We also sell directly to our SI customers. SIs typically sell from positions of regional or product-based strength in the market. They usually operate on short design cycles and can respond quickly with new technologies. SIs often use discrete graphics solutions as a means to differentiate their products and add value to their customers.
Generally, the IC industry is intensely competitive. Products typically compete on timely product introductions, product quality (including enabling state-of-the art visual experiences), power consumption (including battery life), reliability, processor clock speed, performance, size (or form factor), cost, selling price, cost, adherence to industry standards (and the creation of open industry standards), level of integration, software and hardware compatibility and stability, brand recognition timely product introductions and
availability. Technological advances in the industry
can result in frequent product introductions, regular price reductions
and short product life cycles
for some products, and increased product capabilities that may result in significant performance improvements. Our ability to compete depends on our ability to develop, introduce and sell new products or enhanced versions of existing products on a timely basis and at competitive prices,
while reducing ourwith competitive costs.
Competition in the Microprocessor
and Chipset Market
Intel Corporation has
dominatedbeen the market
share leader for microprocessors for many years. Intel’s market share, margins and significant financial resources enable it to market its products aggressively, to target our customers and our channel partners with special incentives and to
disciplineinfluence customers who do business with us. These aggressive activities have in the past and are likely in the future to result in lower unit sales and a lower average selling price for
many of our products and adversely affect our margins and profitability.
Intel exerts substantial influence over computer manufacturers and their channels of distribution through various brand and other marketing programs. As a result of Intel’s
dominant position in the microprocessor market, Intel has been able to control x86 microprocessor and computer system standards and benchmarks and to dictate the type of products the microprocessor market requires of us. Intel also dominates the computer system platform, which includes core logic chipsets, graphics chips, motherboards and other components necessary to assemble a computer system.
Original Equipment Manufacturers (OEMs),OEMs that purchase microprocessors for computer systems are highly dependent on Intel,
which can make them less innovative on their own and, to a large extent,
arecan become distributors of Intel technology. Additionally, Intel is able to drive de facto standards
and specifications for x86 microprocessors that could cause us and other companies to have delayed access to such standards.
As long as Intel remains in this dominant position, we may be materially adversely affected by Intel’s:
business practices, including rebating and allocation strategies and pricing actions which may limit our market share and margins;
product mix and introduction schedules;
product bundling, marketing and merchandising strategies;
exclusivity payments to its current and potential customers and channel partners that require or result in exclusive product arrangements;
de facto control over industry standards, and heavy influence on PC manufacturers and other PC industry participants, including motherboard, memory, chipset and basic input/output system, or BIOS, suppliers and software companies as well as the graphics interface for Intel platforms; and
marketing and advertising expenditures in support of positioning the Intel brand over the brand of its OEM customers.
Intel has substantially greater financial resources than we do and accordingly spends substantially greater amounts on marketing and research and development than we do. We expect Intel to maintain its
dominantmarket position and to continue to invest heavily in marketing, research and development, new manufacturing facilities and other technology companies. To the extent Intel manufactures a significantly larger portion of its microprocessor products using more advanced process technologies, or introduces competitive new products into the market before we do, we may be more vulnerable to Intel’s aggressive marketing and pricing strategies for microprocessor products.
For example, Intel also leverages its dominance in the microprocessor markethas introduced microprocessors for low-cost notebooks, similar to sell its integrated graphics chipsets. Intel manufactures and sells integrated graphics chipsets bundled with their microprocessors and is a dominant competitor with respect to this portion of our business. products that we offer for low-cost notebooks.
Intel could also take actions that place our discrete GPUs at a competitive disadvantage, including giving one or more of our competitors in the graphics market, such as Nvidia Corporation, preferential access to its proprietary graphics interface or other useful information.
As long as Intel remains in this dominant position, we may be materially adversely affected by Intel’s:
business practices, including rebating and allocation strategies and pricing actions, designed to limit our market share and margins;
product mix and introduction schedules;
product bundling, marketing and merchandising strategies;
exclusivity payments to its current and potential customers and channel partners;
control over industry standards, PC manufacturers and other PC industry participants, including motherboard, memory, chipset and basic input/output system, or BIOS, suppliers and software companies as well as the graphics interface for Intel platforms; and
marketing and advertising expenditures in support of positioning the Intel brand over the brand of its OEM customers.
Intel’s dominant position in the microprocessor market and integrated graphics chipset market, its introduction of competitive new products, its existing relationships with top-tier OEMs and its aggressive marketing and pricing strategies could result in lower unit sales and a lower average selling price for our products, which could have a material adverse effect on us.
Other competitors include
a variety of companies providing or developing ARM-based designs
asat relatively low cost and low power processors for the computing market including
netbooks, tablets and
thin clientthin-client form factors, as well as dense servers, set-top boxes and gaming consoles. ARM Holdings designs and licenses its ARM architecture
to third parties, including us, and offers supporting software and services. Our ability to compete with companies who use ARM-based solutions depends on our ability to
timely design
and bring to market energy-efficient, high-performing products at an attractive price point.
In addition, Nvidia builds custom CPU cores based on ARM architecture to support tablets and small form factor PCs, servers, workstations and super computers.Competition in the Chipset Market
In the chipset market, our competitors include suppliers of integrated graphicsIGP chipsets. PC manufacturers use integratedIGP chipsets because they typically cost less than traditional discrete GPUs while offering acceptable graphics performance for most mainstream
PC users.
Intel also leverages its dominance in the microprocessor market to sell its IGP chipsets. Intel manufactures and sells
integrated graphicsIGP chipsets bundled with their microprocessors and is
a dominantour main competitor in this market.
Competition in the Graphics
MarketMarkets
In the graphics market, our competitors include suppliers of discrete graphics, embedded graphics processors and
IGPs.IGP chipsets. Intel manufactures and sells embedded graphics processors and IGP chipsets, and is a dominant competitor with respect to this portion of our business.
The continued improvement of the quality of Intel’s integrated graphics, along with higher Higher unit shipments of our APUs and Intel’s integrated graphics may drive computer manufacturers to reduce the number of systems they build paired with discrete graphics components, particularly for mobile PCs,notebooks, because they may offer satisfactory graphics performance for most mainstream PC users, at a lower cost. Intel could take actions that place our discrete GPUs and integratedIGP chipsets at a competitive disadvantage such as giving one or more of our competitors in the graphics market, such as Nvidia Corporation, preferential access to its proprietary graphics interface or other useful information.
Other than Intel, our
Our principal competitor in the graphics market is Nvidia. AMD and Nvidia are the two principal players offering discrete graphics solutions. Other competitors include a number of smaller companies, which may have greater flexibility to address specific market needs, but less financial resources to do so, especially as we believe that the growing complexity of
visualgraphics processors and the associated research and development costs represent an increasingly higher barrier to entry in this market.
In the semi-custom game console category,products, where graphics performance is critical, we compete primarily against Nvidia. Other competitors include Intel, ARMNvidia, and Imagination.
also compete against Imagination Technology Group.
We focus our research and development activities on improving
product performance and enhancing product design.
OneOur main area of focus is on delivering the next generation of
products with greater system level integration of the CPU and GPU
IP, and designing that IP into our SoCs for our next generation of products,with, in each case, improved system performance and performance-per-watt characteristics. For example, we are focusing on improving the battery life of our microprocessors and APU products for
mobile PCsnotebooks and the power efficiency of our microprocessors for servers. We are also focusing on delivering a range of
low powerlow-power integrated platforms to serve key markets, including commercial clients, mobile computing and gaming and media
computing, as well as developing a Heterogeneous System Architecture, which is designed for software developers to easily program APUs by combining scalar processing on the CPU with parallel processing on the GPU, all while providing high bandwidth access to memory at low power.computing. We believe that these
integrated platforms will bring customers
better time-to-market and increased performance and energy efficiency. We also work with industry leaders on process technology, software and other functional intellectual property and we work with others in the industry
public foundations, universities and industry consortia to conduct early stage research and development.
Our research and development expenses for
2012, 20112015, 2014 and
20102013 were approximately
$1.4$0.9 billion,
$1.5$1.1 billion and
$1.4$1.2 billion, respectively. For more information, see
Part“Part II, Item
7-“Management’s7-Management’s Discussion and Analysis of Financial Condition and Results of Operations,”
or MD&A.below.
We conduct product and system research and development activities for our products in the United States with additional design and development engineering teams located in
China, Canada, India,
China, Singapore, Taiwan
United Kingdom, Israel and
Japan.Israel.
Manufacturing Arrangements and Assembly and Test Facilities
Third-Party Wafer Foundry Facilities
GLOBALFOUNDRIES Inc. On March 2, 2009, together with Advanced Technology Investment Company LLC (ATIC) and West Coast Hitech L.P., (WCH), acting through its general partner, West Coast Hitech G.P., Ltd., we formed GLOBALFOUNDRIES, Inc. (GF),entered into a manufacturing joint venture that manufactures semiconductor products and provides certain foundry services to us.Wafer Supply Agreement. A Wafer Supply Agreement (WSA) with GLOBALFOUNDRIES Inc. (GF). The WSA governs the terms by which we purchase products manufactured by GF.GF, a related party to us. Pursuant to the WSA, we are required to purchase all of our microprocessor and APU product requirements, and a certain portion of our GPU product requirements from GF with limited exceptions.
On April 2, 2011, we entered into a first amendment to the WSA. The primary effect of the amendment was to change the pricing methodology applicable to wafers delivered in 2011 for our microprocessors, including APU products. The amendment also modified our existing commitments regarding the production of certain GPU and chipset products at GF. Pursuant to the amendment, GF committed to provide us with, and we committed to purchase, a fixed number of 45nm and 32nm wafers per quarter in 2011. We paid GF a fixed price for 45nm wafers delivered in 2011. Our price for 32nm wafers varied based on the wafer volumes and manufacturing yield of such wafers and was based on good die. In addition, we also agreed to pay an additional quarterly amount to
GF during 2012 totaling up to $430 million if GF met specified conditions related to the continued availability of 32nm capacity as of the beginning of 2012. As part of the second amendment described below, GF agreed to waive these quarterly payments, and therefore we are no longer required to pay them.
On March 4, 2012, we entered into a second amendment to the WSA. The primary effect of this second amendment was to modify certain pricing and other terms of For more information about the WSA, applicable to wafers for our microprocessorsee “Part II, Item 7-Management’s Discussion and APU products to be delivered by GF to us during 2012. Pursuant to the second amendment, GF committed to provide us with,Analysis of Financial Condition and we committed to purchase, a fixed numberResults of production wafers in 2012. We paid GF fixed prices for production wafers delivered in 2012. The second amendment also granted us certain rights to contract with another wafer foundry supplier with respect to specified 28nm products for a specified period of time. In consideration for these rights, we agreed to pay GF $425 million and transfer to GF all of the capital stock of GF that we owned. Pursuant to the second amendment, $150 million of the $425 million was paid on March 5, 2012, $50 million was paid on June 29, 2012, $50 million was paid on October 1, 2012, and the remaining $175 million was paid by December 31, 2012. In addition, as security for the final two payments, we issued a $225 million promissory note to GF.
On December 6, 2012, we entered into a third amendment to the WSA. Pursuant to the third amendment we modified our wafer purchase commitments for the fourth quarter of 2012 under the second amendment to the WSA. In addition, we agreed to certain pricing and other terms of the WSA applicable to wafers for our microprocessor and APU products to be delivered by GF to us during 2013 and through December 31, 2013. Pursuant to the third amendment, we committed to purchase a fixed number of production wafers at negotiated prices in the fourth quarter of 2012 and through December 31, 2013. GF agreed to waive a portion of our wafer purchase commitments for the fourth quarter of 2012. In consideration for this waiver, we agreed to pay GF a fee of $320 million. The cash impact of this $320 million fee will be spread over several quarters, with $80 million paid by December 28, 2012 and $40 million payable by April 1, 2013. For the remainder of the fee, on the same date we entered into the third amendment, we issued a $200 million promissory note to GF that matures on December 31, 2013. As part of the third amendment, we committed to purchase wafers from GF for approximately $250 million during the first quarter of 2014. We expect to negotiate the remainder of our 2014 purchase commitments from GF in 2013.
The WSA terminates no later than March 2, 2024. GF has agreed to use commercially reasonable efforts to assist us to transition the supply of products to another provider, and to continue to fulfill purchase orders for up to two years following the termination or expiration of the WSA. During the transition period, pricing for microprocessor products will remain as set forth in the WSA, but our purchase commitments to GF will no longer apply.
GF currently manufactures our microprocessors on 300 millimeter wafers using primarily 45nm and 32nm process technology.
Operations-GLOBALFOUNDRIES,” below.
Taiwan Semiconductor Manufacturing Company. We also have foundry arrangements with Taiwan Semiconductor Manufacturing Company (TSMC) for the production of wafers for certain graphics processors and chipsets, embedded processors, and APU products.We are in production in TSMC’s 300 millimeter and 200 millimeter fabrication facilities in technologies ranging from 65nm to 28nm. Smaller process geometries can lead to gains in performance, lower power consumption and lower per unit manufacturing costs. We continue to have our products manufactured on more advanced process technology because using more advanced process technology can contribute to lower product manufacturing costs and improve a product’s performance and power efficiency.
Other Third-Party Manufacturers.Manufacturers. We outsource board-level graphics product manufacturing to third-party manufacturers.
Assembly, Test, Mark and Packaging Facilities
We own and operate two assembly, test, mark and packaging
facilities.facilities which are subject of the transaction noted below. Some wafers for our
microprocessor, graphics processor and embedded processor products are delivered from third-party foundries to our assembly, test, mark and packaging facilities. Our assembly, test, mark and packaging facilities are described in the chart set forth below:
| | | |
| | |
| Facility Location | | Approximate
Manufacturing
Area Square
Footage | | | Activity |
Penang, Malaysia | | | 206,000 | | 150,000 | Assembly, Test, Mark & Packaging |
Suzhou, China | | | 100,000 | | 115,000 | Assembly, Test, Mark & Packaging |
The remaining wafers for our
graphics products are delivered from
third partythird-party foundries to our test, assembly and packaging partners located in the Asia-Pacific region who package and test
theour final semiconductor products.
On October 15, 2015, we entered into an Equity Interest Purchase Agreement (the Equity Interest Purchase Agreement) with Nantong Fujitsu Microelectronics Co., Ltd., a Chinese joint stock company (JV Party), under which we will sell to JV Party a majority of the equity interests in AMD Technologies (China) Co. Ltd., a wholly-foreign owned enterprise incorporated as a limited liability company (the Chinese Target Company), and Advanced Micro Devices Export Sdn. Bhd., a Malaysian limited liability company (the Malaysian Target Company and, together with the Chinese Target Company, the Target Companies), thereby forming two joint ventures (collectively, the JVs) with JV Party in a transaction valued at approximately $436 million (the Transaction). The JV Party will acquire 85% of the equity interests in each JV for approximately $371 million and we estimate we will receive approximately $320 million cash, net of taxes and other customary expenses. After closing, JV Party’s affiliates will own 85% of the equity interests in each JV while certain of our subsidiaries will own the remaining 15%. The Transaction will result in the JVs providing assembly, testing, marking, packing and packaging services (ATMP) to us. We plan to account for our investment in the JVs under the equity method of accounting.The Transaction is expected to close in the first half of 2016, pending successful completion of regulatory and other approvals.
Intellectual Property and Licensing
We rely on contracts and intellectual property rights to protect our products and technologies from unauthorized third-party copying and use. Intellectual property rights include copyrights, patents, patent applications, trademarks, trade secrets and maskwork rights. As of December 29, 2012,26, 2015, we had approximately 4,7004,965 patents in the United States and approximately 1,600895 patent applications pending in the United States.In certain cases, we have filed corresponding applications in foreign jurisdictions. Including United States and foreign matters, we have approximately 10,330 patent matters worldwide consisting of approximately 7,370 issued patents and 2,935 patent applications pending. We expect to file future patent applications in both the United States and abroad on significant inventions, as we deem appropriate. We do not believe that any individual patent, or the expiration thereof,of any patent, is or would be material to our business. As is typical in the semiconductor industry, we have numerous cross-licensing and technology exchange agreements with other companies under which we both transfer and receive technology and intellectual property rights. One such agreement is the
cross-licensecross license agreement that we entered into with Intel on November 11,
2009, in connection with the settlement of our litigation.2009. Under the cross license agreement,
Intel haswe granted to
us and our subsidiaries, and we have granted Intel and
its subsidiaries,Intel granted to us, non-exclusive, royalty-free licenses to all
of each other’s patents that
are either owned or controlled bywere first filed no later than November 11, 2014 and each party can exploit these patents anywhere in the
parties at any time that have a first effective filing date or priority date prior to the five-year anniversary of the effective date of the cross license agreement, referred to as the “Capture Period,” to make, have made, use, sell, offer to sell, importworld for making and
otherwise dispose ofselling certain semiconductor- and electronic-related
products anywhere in the world.products. Under the cross license agreement, Intel has rights to make semiconductor products for third parties, but the
third partythird-party product designs are not licensed as a result of such manufacture. We have rights to perform assembly and testing for third parties but not rights to make semiconductor products for third parties. The term of the cross license agreement continues until the expiration of the last to expire of the licensed patents, unless earlier terminated. A party can terminate the cross license agreement or the rights and licenses of the other party if the other party materially breaches the cross license agreement and does not correct the noticed material breach within 60 days. Upon such termination, the terminated party’s license rights terminate but the terminating party’s license rights continue, subject to that party’s continued compliance with the terms of the cross license agreement. The cross license agreement
and the Capture Period will automatically terminate if a party undergoes a change of control (as defined in the cross license agreement)
, and both parties’ licenses will terminate. Upon the bankruptcy of a party, that party may assume, but may not assign, the cross license agreement, and in the event that the cross license agreement cannot be assumed, the cross license agreement and the licenses granted will terminate.
We also have a patent cross license agreement with GF pursuant to which each party granted to the other a non-exclusive license under patents filed by a party (or are otherwise acquired by a party) within a certain number of years following the effective date of the agreement. In 2009, under the agreements with GF, we
assigned approximately 3,000 patents and approximately 1,000 patent applications to GF. GF owns its allocation of patents and applications subject to pre-existing rights, licenses or immunities granted to third parties relating to such patents and applications. The patents and patent applications to be owned by each party after the division were licensed to the other party pursuant to the agreement.
In addition, we entered into a Non-Patent Intellectual Property and Technology Transfer Agreement with GF pursuant to which we assigned to GF all of our right, title and interest in technology and non-patent intellectual property rights used exclusively in the manufacture, sorting and/or intermediate testing of semiconductor products. We retained technology and non-patent intellectual property rights used exclusively in the design and/or post-fabrication delivery testing of semiconductors. Technology and non-patent intellectual property rights used both in the manufacture, sorting and/or intermediate testing of semiconductor products and in the design and/or post-fabrication delivery testing of semiconductor products are owned jointly by us and GF.
Backlog
We sell standard lines of products.
Sales are made primarily pursuant to purchase orders for current delivery or agreements covering purchases over a period of time. Some of these orders or agreements may be revised or
cancelledcanceled without penalty. Generally, in light of current industry practice, we do not believe that such orders or agreements provide meaningful backlog figures or are necessarily indicative of actual sales for any succeeding period.
Seasonality
Our operating results tend to vary seasonally. For example, historically, first quarter PC product sales are generally lower than fourth quarter sales. In addition, with respect to our semi-custom SoC products for game consoles, we expect sales patterns to follow the seasonal trends of a consumer business with sales in the first half of the year being lower than sales in the second half of the year.
As of December
29, 2012,26, 2015, we had approximately
10,3409,100 employees.
Environmental Regulations
Many aspects of our business
Our operations and
products are regulated by domesticproperties have in the past been and
internationalcontinue to be subject to various United States and foreign environmental laws and
regulations. These regulations,
include limitations onincluding those relating to materials used in our products and manufacturing processes, discharge of pollutants
to air, water, and soil; remediation requirements; product chemical content limitations; manufacturing chemical use and handling restrictions; pollution control requirements; waste minimization considerations; and requirements with respect tointo the environment, the treatment, transport, storage and disposal of solid and hazardous
wastes.wastes and remediation of contamination. These laws and regulations require us to obtain permits for our operations, including the discharge of air pollutants and wastewater. Although our management systems are designed to maintain compliance, we cannot assure you that we have been or will be at all times in complete compliance with such laws, regulations and permits. If we
violate or fail to comply with any of
the applicable environmental regulations we may be subject tothem, a range of consequences could result, including fines, suspension of production, alteration of
our manufacturing processes, import/export restrictions, sales limitations,
and/or criminal and civil
liabilities. Existingliabilities or
future regulationsother sanctions. We could
requirealso be held liable for any and all consequences arising out of exposure to hazardous materials used, stored, released, disposed of by us
to procure expensive pollution abatement or
remediation equipment; to modify product designs;located at, under or
to incuremanating from our facilities or other
expenses to comply with environmental
regulations. Any failure to adequately control the use, disposal or
storage, or discharge of hazardous substances could expose us to future liabilities that could have a material adverse effect on our business. We believe we are in material compliance with applicable environmental requirements and do not expect those requirements to result in material expenditures in the foreseeable future.Environmental laws are complex, change frequently and have tended to become more stringent over time. For example, the European Union (EU) and China are two among a growing number of jurisdictions that have enacted restrictions on the use of lead and other materials in electronic products. Other countries have also implemented similar restrictions. These regulations affect semiconductor devices and packaging. As regulations restricting materials in electronic products continue to increase around the world, there is a risk that the cost, quality and manufacturing yields of products that are subject to these restrictions, may be less favorable compared to products that are not subject to such restrictions, or that the transition to compliant products may produce sudden changes in demand, which may result in excess inventory.
In August 2012, the SEC adopted its final rule to implement Section 1502 of the Dodd-Frank Wall Street Reform and Consumer Protection Act regarding disclosure and reporting requirements for companies who use
“conflict” minerals mined from the Democratic Republic of Congo and adjoining countries in their products, whether or not these products are manufactured by third parties. As there are many sources of these materials, these new requirements are unlikely to affect the sourcing of minerals used in the manufacture of semiconductor devices but will add additional costs associated with complying with the disclosure requirements, such as costs related to determining the source of any conflict minerals used in our products, auditing the process and reporting to our customers and the US government. Also, since our supply chain is complex, we may face reputational challenges if we are unable to sufficiently verify the origins of the subject minerals. Moreover, we may encounter challenges to satisfy those customers who require that all of the components of our products are certified as conflict free and if we cannot satisfy these customers, they may choose a competitor’s products.
A number of jurisdictions including the EU, Australia and China are developing or finalizing market entry or public procurement requirements for computers and servers based on ENERGY STAR specification as well as additional energy consumption limits. Some of these regulations are expected to be approved and implemented in 2013. If such regulations do not contain recommended modifications as proposed by AMD or industry associations, there is the potential for certain of our microprocessor, chipset and GPU products, as incorporated in desktop and mobile PCs, workstations, servers and other information and communications technology products being excluded from some of these markets which could materially adversely affect us.
natural resource damage. While we have budgeted for foreseeable associated expenditures, we cannot assure you that future environmental legal requirements will not become more stringent or costly in the future. Therefore, we cannot assure you that our costs of complying with current and future environmental and health and safety laws, and our liabilities arising from past and future releases of, or exposure to, hazardous substances will not have a material adverse effect on us. See
Environmental laws are complex, change frequently and have tended to become more stringent over time. For example, the European Union (EU) and China are two among a growing number of jurisdictions that have enacted restrictions on the use of lead and other materials in electronic products. These regulations affect semiconductor devices and packaging. As regulations restricting materials in electronic products continue to increase around the world, there is a risk that the cost, quality and manufacturing yields of products that are subject to these restrictions, may be less favorable compared to products that are not subject to such restrictions, or that the transition to compliant products may not meet customer roadmaps, or produce sudden changes in demand, which may result in excess inventory. A number of jurisdictions including the EU, Australia and China are developing or have finalized market entry or public procurement regulations for computers and servers based on ENERGY STAR specifications as well as additional energy consumption limits. There is the potential for certain of our products being excluded from some of these markets which could materially adversely affect us.
Certain environmental laws, including the U.S. Comprehensive, Environmental Response, Compensation and Liability Act of 1980, or the Superfund Act, impose strict or, under certain circumstances, joint and several liability on current and previous owners or operators of real property for the cost of removal or remediation of hazardous substances and impose liability for damages to natural resources. These laws often impose liability even if the owner or operator did not know of, or was not responsible for, the release of such hazardous substances. These environmental laws also “Item 3- Legal Proceedings—Environmental Matters,assess liability on persons who arrange for hazardous substances to be sent to disposal or treatment facilities when such facilities are found to be contaminated. Such persons can be responsible for cleanup costs even if they never owned or operated the contaminated facility. We have been named as a responsible party at three Superfund sites in Sunnyvale, California. Although we have not yet been, we could be named a potentially responsible party at other Superfund or contaminated sites in the future. In addition, contamination that has not yet been identified could exist at our other facilities.
Under the Dodd-Frank Wall Street Reform and Consumer Protection Act of 2010, the Securities and Exchange Commission (“SEC”) adopted disclosure and reporting requirements for companies that use “conflict” minerals originating from the Democratic Republic of Congo or adjoining countries. We continue to incur additional costs associated with complying with these requirements, such as costs related to developing internal controls for the due diligence process,
determining the source of any conflict minerals used in our products, auditing the process and reporting to our customers and the SEC. Also, since our supply chain is complex, we may face reputational challenges if we are unable to sufficiently verify the origins of the subject minerals. Moreover, we are likely to encounter challenges to satisfy those customers who require that all of the components of our products are certified as “conflict free.”
below.If we cannot satisfy these customers, they may choose a competitor’s products.
ITEM 1A. RISK FACTORS
The risks and uncertainties described below are not the only ones we face. If any of the following risks actually occurs, our business, financial condition or results of operations could be materially adversely affected. In addition, you should consider the interrelationship and compounding effects of two or more risks occurring simultaneously.
Intel Corporation’s dominance of the microprocessor market and its aggressive business practices may limit our ability to compete effectively.
Intel Corporation has
dominatedbeen the market
share leader for microprocessors for many years. Intel’s market share, margins and significant financial resources enable it to market its products aggressively, to target our customers and our channel partners with special incentives and to
disciplineinfluence customers who do business with us. These aggressive activities have in the past and are likely in the future to result in lower unit sales and a lower average selling price for
many of our products and adversely affect our margins and profitability.
Intel exerts substantial influence over computer manufacturers and their channels of distribution through various brand and other marketing programs. As a result of Intel’s
dominant position in the microprocessor market, Intel has been able to control x86 microprocessor and computer system standards and benchmarks and to dictate the type of products the microprocessor market requires of us. Intel also dominates the computer system platform, which includes core logic chipsets, graphics chips, motherboards and other components necessary to assemble a computer system.
Original Equipment Manufacturers (OEMs),OEMs that purchase microprocessors for computer systems are highly dependent on Intel, less innovative on their own and, to a large extent, are distributors of Intel technology. Additionally, Intel is able to drive de facto standards
and specifications for x86 microprocessors that could cause us and other companies to have delayed access to such standards.
As long as Intel remains in this dominant position, we may be materially adversely affected by Intel’s:
business practices, including rebating and allocation strategies and pricing actions, designed to limit our market share and margins;
product mix and introduction schedules;
product bundling, marketing and merchandising strategies;
exclusivity payments to its current and potential customers and channel partners;
de facto control over industry standards, and heavy influence on PC manufacturers and other PC industry participants, including motherboard, memory, chipset and basic input/output system, or BIOS, suppliers and software companies as well as the graphics interface for Intel platforms; and
marketing and advertising expenditures in support of positioning the Intel brand over the brand of its original equipment manufacturer OEM customers.
Intel has substantially greater financial resources than we do and accordingly spends substantially greater amounts on marketing and research and development than we do. We expect Intel to maintain its
dominantmarket position and to continue to invest heavily in marketing, research and development, new manufacturing facilities and other technology companies. To the extent Intel manufactures a significantly larger portion of its microprocessor products using more advanced process technologies, or introduces competitive new products into the market before we do, we may be more vulnerable to Intel’s aggressive marketing and pricing strategies for microprocessor products.
For example, Intel also leverages its dominance in the microprocessor markethas introduced microprocessors for low-cost notebooks, similar to sell its integrated graphics chipsets. Intel manufactures and sells integrated graphics chipsets bundled with their microprocessors and is a dominant competitor with respect to this portion of our business. products that we offer for low-cost notebooks.
Intel could also take actions that place our discrete GPUs at a competitive disadvantage, including giving one or more of our competitors in the graphics market, such as Nvidia Corporation, preferential access to its proprietary graphics interface or other useful information.
As long as Intel remains in this dominant position, we may be materially adversely affected by Intel’s:
business practices, including rebating and allocation strategies and pricing actions, designed to limit our market share and margins;
product mix and introduction schedules;
product bundling, marketing and merchandising strategies;
exclusivity payments to its current and potential customers and channel partners;
control over industry standards, PC manufacturers and other PC industry participants, including motherboard, memory, chipset and basic input/output system, or BIOS, suppliers and software companies as well as the graphics interface for Intel platforms; and
marketing and advertising expenditures in support of positioning the Intel brand over the brand of its OEM customers.
Intel’s dominant position in the microprocessor market and integrated graphics chipset market, its introduction of competitive new products, its existing relationships with top-tier OEMs and its aggressive marketing and pricing strategies could result in lower unit sales and a lower average selling price for our products, which could have a material adverse effect on us.
The successWe rely on GF to manufacture all of our microprocessor and APU products and a certain portion of our GPU products, with limited exceptions.If GF is not able to satisfy our manufacturing requirements, our business could be adversely impacted.
The WSA governs the terms by which we purchase products manufactured by GF. Pursuant to the WSA, we are required to purchase all of our microprocessor and APU product requirements, and a certain portion of our GPU product requirements, from GF with limited exceptions. If GF is
dependent uponunable to achieve anticipated manufacturing yields, remain competitive using or implementing advanced leading-edge process technologies needed to manufacture future generations of our
ability to introduceproducts, manufacture our products on a timely basis
with features and performance levels that provide value toat competitive prices or meet our
customers while supporting and coinciding with significant industry transitions.Our success depends to a significant extent on the development, qualification, implementation and acceptance of newcapacity requirements, then we may experience delays in product designs and improvements that provide value to our customers. Our ability to develop, qualify and distribute new products and related technologies to meet evolving industry requirements, at prices acceptable to our customers and on a timely basis are significant factors in determining our competitiveness in our target markets. For example, form factors have increasingly shifted from desktop PCs to mobile PCs, and tablets have been one of the fastest growing form factors. Also, ARM-based processors are being used in mobile and embedded electronics products as relatively low cost and small microprocessors and also in form factors such as laptops, tablets and smartphones. Historically, a significant portion of our Computing Solutions revenue has been related to desktop PCs. Currently, approximately 85% of our business is focused on the legacy PC portions of the market, projected to have slowing growth over the next several years. To the extent consumers adopt new form factors and have different requirements than those consumers in the PC market, PC sales could be negatively impacted, which could negatively impact our business. If we fail to or are delayed in developing, qualifying or shipping newlaunches, supply shortages for certain products or technologies that provide value to our customersincreased costs and address these new trends, we may lose competitive positioning, which could cause us to lose market share and require us to discount the selling prices of our products. Although we make substantial investments in research and development, we cannot be certain that we will be able to develop, obtain or successfully implement new products and technologies on a timely basis.
Delays in developing, qualifying or shipping new products can also cause us to miss our customers’ product design windows. If our customers do not include our products in the initial design of their computer systems, they will typically not use our products in their systems until at least the next design configuration. The process of being qualified for inclusion in a customer’s system can be lengthy and could cause us to further miss a cycle in the demand of end-users, which also could result in a loss of market share and harm our business.
Moreover, market demand requires that products incorporate new features and performance standards on an industry-wide basis. Over the life of a specific product, the average selling price undergoes regular price reductions. The introduction of new products and enhancements to existing products is necessary to maintain an overall corporate average selling price. If we are unable to introduce new products with sufficient increases in average selling price or increased unit sales volumes capable of offsetting the reductions in the average selling price of existing products, our business could be materially adversely affected.
Global economic uncertainty
Additionally, if our requirements are less than the number of wafers that we committed to purchase, we could have excess inventory or higher inventory unit costs, both of which may adversely impact our
businessgross margin and
operating results.Uncertain global economic conditions haveour results of operations.
We are currently in the pastprocess of negotiating a sixth amendment to the WSA, and may in thewe expect that our future adversely impact our business. Uncertainty in the worldwide economic environment may negatively impact consumer confidence and spending causing our customerspurchases from GF will continue to postpone purchases. For example, our revenue in the second half of 2012 was adversely affected, in part, by the overall weakness in the global economy and weak consumer demand for end-user PC products, which impacted sales. Webe material. If we do not expect PC market conditions to improve during the first halfsuccessfully conclude our negotiations, it could have a material adverse impact on our gross margin and our results of 2013.operations.
In addition,
during challenging economic times, our currentGF has relied on Mubadala Technology Investments LLC (Mubadala Tech) for its funding needs. If Mubadala Tech fails to adequately fund GF on a timely basis, or
potential future customers may experience cash flow problems and as a result may modify, delay or cancel plans to purchase our products. Additionally, if our customers are not successful in generating sufficient revenue or are unable to secure financing, they may not be able to pay, or may delay payment of, accounts receivable that they owe us. Any inability of our current or potential future customers to pay us for our products may adversely affect our earnings and cash flow. Moreover,our key suppliers may reduce their output or become insolvent, thereby adversely impacting ourat all, GF’s ability to manufacture our products. In addition, uncertain economic conditions may make it more difficultproducts for us to raise funds through borrowings or private or public sales of debt or equity securities.
If we cannot generate sufficient revenues and operating cash flow or obtain external financing, we may face a cash shortfall and be unable to make all of our planned investments in research and development or other strategic investments.
Our ability to fund research and development expenditures depends on generating sufficient cash flow from operations and the availability of external financing, if necessary. Our research and development expenditures, together with ongoing operating expenses, will be a substantial drain on our cash flow and may decrease our cash balances. If new competitors, technological advances by existing competitors or other competitive factors require us to invest significantly greater resources than anticipated in our research and development efforts, our operating expenses would increase. If we are required to invest significantly greater resources than anticipated in research and development efforts without an increase in revenue, our operating results could decline.
We believe that the challenging macroeconomic conditions that we experienced in the second half of 2012 will continue during the first half of 2013. We regularly assess markets for external financing opportunities, including debt and equity financing. Additional debt or equity financing may not be available when needed or, if available, may not be available on satisfactory terms. The health of the credit markets may adversely impact our ability to obtain financing when needed. In addition, any downgrades from credit rating agencies such as Moody’s or Standard & Poor’s may adversely impact our ability to obtain external financing or the terms of such financing. Credit agency downgrades may also impact relationships with our suppliers, who may limit our credit lines. For example, in the first quarter of 2013 Moody’s lowered our corporate family rating to B2 from B1, and the ratings on our senior unsecured notes to B2 from B1. Furthermore, in the first quarter of 2013, Standard & Poor lowered our corporate credit and senior unsecured rating from B to BB. Our inability to obtain needed financing or to generate sufficient cash from operations may require us to abandon projects or curtail planned investments in research and development or other strategic initiatives. If we curtail planned investments in research and development or abandon projects, our products may fail to remain competitive and our business would be materially adversely affected.
If we are unable to successfully implement our cost cutting efforts, our business could be materially adversely affected.
In the fourth quarter of 2012, we implemented a restructuring plan designed to improve our cost structure and to strengthen our competitiveness in core growth areas. The plan primarily involves a workforce reduction of approximately 14% as well as asset impairments and facility consolidations. We expect the restructuring action will result in operational savings, primarily in operating expenses, of approximately $190 million in 2013. We cannot assure you that we will be able to achieve the level of operational savings that we expect. If our headcount reductions are not effectively managed, we may experience unanticipated effects from these reductions causing harm to our business and customer relationships. In addition, we are currently evaluating further facility consolidations, and depending on the outcome of such evaluation, we may incur additional restructuring charges, which may be material.
affected.
We rely on third parties to manufacture our products, and if they are unable to do so on a timely basis in sufficient quantities and using competitive technologies, our business could be materially adversely affected.
We rely on
third partythird-party wafer foundries to fabricate the silicon wafers for all of our products. We also rely on
third party providersthird-party manufacturers to assemble, test, mark and pack certain of our products. It is important to have reliable relationships with all of these
third partythird-party manufacturing suppliers to ensure adequate product supply to respond to customer demand.
We cannot
assure youguarantee that these manufacturers or our other
third partythird-party manufacturing suppliers will be able to meet our near-term or long-term manufacturing requirements.
For example, during the fourth quarter of 2011, we experienced reduced supply of 45nm products from GF because of a manufacturing disruption that reducedthe number of 45nm wafers available for production. If we experience future supply constraints from our third partythird-party manufacturing suppliers, we may be required to allocate the affected products amongst our customers, which could have a material adverse effect on our relationships with these customers and on our financial condition. In addition, if we are unable to meet customer demand due to fluctuating or late supply from our manufacturing suppliers, it could result in lost sales and have a material adverse effect on our business.
We do not have long-term commitment contracts with some of our
third partythird-party manufacturing suppliers. We obtain some of these manufacturing services on a purchase order basis and these manufacturers are not required to provide us with any specified minimum quantity of product beyond the quantities in an existing purchase order. Accordingly, we depend on these suppliers to allocate to us a portion of their manufacturing capacity sufficient to meet our needs, to produce products of acceptable quality and at acceptable manufacturing yields and to deliver those products to us on a timely basis and at acceptable prices. The manufacturers we use also fabricate wafers and assemble, test and package products for other companies, including certain of our competitors. They could choose to prioritize capacity for other
users,customers, increase the prices that they charge us on short notice or reduce or eliminate deliveries to us, which could have a material adverse effect on our business.
Other risks associated with our dependence on third-party manufacturers include limited control over delivery schedules and quality assurance, lack of capacity in periods of excess demand, misappropriation of our intellectual property, dependence on several small undercapitalized subcontractors and limited ability to manage inventory and parts. Moreover, if any of our
third party manufacturing suppliersthird-party manufacturers suffer any damage to facilities, lose benefits under material agreements, experience power outages, lack sufficient capacity to manufacture our products, encounter financial difficulties, are unable to secure necessary raw materials from their suppliers or suffer any other disruption or reduction in efficiency, we may encounter supply delays or disruptions. If we are unable to secure sufficient or reliable supplies of products, our ability to meet customer demand may be adversely affected and this could materially affect our business.
If we transition the production of some of our products to new manufacturers, we may experience delayed product introductions, lower yields or poorer performance of our products. If we experience problems with product quality or are unable to secure sufficient capacity from a particular
third party manufacturing supplier,third-party manufacturer, or if we for other reasons cease utilizing one of those suppliers, we may be unable to secure an alternative supply for any specific product in a short time frame. We could experience significant delays in the shipment of our products if we are required to find alternative
third party manufacturing suppliers,third-party manufacturers, which could have a material adverse effect on our business.
We rely on GF to manufacture most of our microprocessor and APU products. If GF is not able to satisfy our manufacturing requirements, our business could be adversely impacted.
The WSA governs the terms by which we purchase products manufactured by GF. Pursuant to the WSA, we are required to purchase all of our microprocessor and APU product requirements from GF with limited exceptions. If GF is unable to achieve anticipated manufacturing yields, remain competitive using advanced process technologies, manufacture our products on a timely basis, or meet our capacity requirements, then we may experience delays in product launches or supply shortages for certain products and our business could be materially adversely affected. For example, during the third quarter of 2011, GF experienced yield and other manufacturing difficulties related to 32nm wafer fabrication, resulting in lower than expected supply of 32nm products to us. Also in the third quarter of 2011, we experienced supply constraints for our 45nm microprocessor products from GF due to complexities related to the use of common tools across both 32nm and 45nm technology nodes and because we made the decision to shift volume away from products manufactured using the 45nm technology node in order to obtain additional 32nm products. Because we were supply constrained with respect to 32nm and 45nm wafers, our revenues and gross margin in the third quarter of 2011 were adversely impacted. Also, during the fourth quarter of 2011, we experienced reduced supply of 45nm product from GF because of a manufacturing disruption that reduced the number of 45nm wafers available for production.
On December 6, 2012, we entered into a third amendment to the WSA with GF. Pursuant to the third amendment, we modified our wafer purchase commitments for the fourth quarter of 2012 under the second amendment to the WSA. In addition, we agreed to certain pricing and other terms of the WSA applicable to wafers for our microprocessor and APU products to be delivered by GF to us during 2013 and through December 31, 2013. Pursuant to the third amendment, we committed to purchase a fixed number of production wafers at negotiated prices in the fourth quarter of 2012 and through December 31, 2013. If GF encounters any problems that significantly reduce the number of functional die we receive from each wafer, then under our fixed wafer price arrangement, this will have the effect of increasing our per-unit cost for our products and could also reduce the number of products available for sale to our customers, which may have an adverse impact on our results of operations. In addition, if our requirements are less than the fixed number of wafers that we agreed to purchase, we could have excess inventory or higher inventory unit costs, both of which will adversely impact our gross margin and our results of operations.
In addition, GF relies on Advanced Technology Investment Company (ATIC) for its funding needs. If ATIC fails to adequately fund GF on a timely basis, or at all, GF’s ability to manufacture products for us would be materially adversely affected.
Failure to achieve expected manufacturing yields for our products could negatively impact our financial results.
Semiconductor manufacturing yields are a result of both product design and process technology, which is typically proprietary to the manufacturer, and low yields can result from design failures, process technology failures or a combination of both. Our third-party foundries,
including GF, are responsible for the process technologies used to fabricate silicon wafers. If our third-party foundries experience manufacturing inefficiencies or encounter disruptions, errors or difficulties during production, we may fail to achieve acceptable yields or experience product delivery delays. We cannot be certain that our third-party foundries will be able to develop, obtain or successfully implement leading-edge process technologies needed to manufacture future generations of our products profitably or on a timely basis or that our competitors will not develop new technologies, products or processes earlier. Moreover, during periods when foundries are implementing new process technologies, their manufacturing facilities may not be fully productive. A substantial delay in the technology transitions to smaller process technologies could have a material adverse effect on us, particularly if our competitors transition to more cost effective technologies before us. Any decrease in manufacturing yields could result in an increase in per unit costs, which would adversely impact our gross margin and/or force us to allocate our reduced product supply amongst our customers, which could harm our relationships
and reputation with our customers
and reputation and materially adversely affect our business.
We may not be able to successfully implement our long-term business strategy.
We are implementing a long-term business strategy to refocus
The success of our business is dependent upon our ability to introduce products on a timely basis with features and performance levels that provide value to our customers while supporting and coinciding with significant industry transitions.
Our success depends to a significant extent on the development, qualification, implementation and acceptance of new product designs and improvements that provide value to our customers. Our ability to develop, qualify and distribute, and have manufactured, new products and related technologies to meet evolving industry requirements, at prices acceptable to our customers and on a timely basis are significant factors in determining our competitiveness in our target markets. For example, a large portion of our Computing and Graphics revenue is focused on consumer desktop PC and notebook segments, which have experienced and continue to experience a decline driven by, among other factors, the adoption of smaller form factors, increased competition and changes in replacement cycles. As consumers adopt new form factors, have new product feature preferences or have different requirements than those consumers in the PC market, PC sales could be negatively impacted, which could adversely impact our business. Our product roadmap includes a new x86 processor core codenamed “Zen” to help drive our re-entry into high-performance and server computing. We cannot assure you that our efforts to execute our product roadmap and address markets beyond our core PC market to the faster growing low power or dense server, embedded, and ultraportable and ultra-low-power markets. Currently, approximately 85% of our business is focused on the legacy PC portions of the market, projected to have slowing growth over the next several years. The goal of our long-term strategy is to drive 40% to 50% of our portfolio to faster growth markets in the long term. Despite our efforts, we may not be able to implement our strategy in a timely manner to exploit potential market opportunities or meet competitive challenges. Moreover, our business strategy is dependent on creating products that anticipate customer requirements and emerging industry trends. There can be no assurances that our new strategic direction will result in innovative products and technologies that provide value to our customers. In addition,If we fail to or are delayed in developing, qualifying or shipping new products or technologies that provide value to our customers and address these new trends or if we fail to predict which new form factors consumers will adopt and adjust our business accordingly, we may lose competitive positioning, which could cause us to lose market share and require us to discount the selling prices of our products. Although we make substantial investments in research and development, we cannot be entering markets where current and new competitors may be able to adapt more quickly to customer requirements and emerging technologies. We cannot assure youcertain that we will be able to competedevelop, obtain or successfully against currentimplement new products and technologies on a timely basis.
Delays in developing, qualifying or shipping new products can also cause us to miss our customers’ product design windows or, in some cases, breach contractual obligations or cause us to pay penalties. If our customers do not include our products in the initial design of their computer systems or products, they will typically not use our products in their systems or products until at least the next design configuration. The process of being qualified for inclusion in a customer’s system or product can be lengthy and could cause us to further miss a cycle in the demand of end-users, which also could result in a loss of market share and harm our business.
In addition, market demand requires that products incorporate new features and performance standards on an industry-wide basis. Over the life of a specific product, the sale price is typically reduced over time. The introduction of new products and enhancements to existing products is necessary to maintain the overall corporate average selling price. If we are unable to introduce new products with sufficiently high sale prices or to increase unit sales volumes capable of offsetting the reductions in the sale prices of existing products over time, our business could be materially adversely affected.
If we cannot generate sufficient revenue and operating cash flow or obtain external financing, we may face a cash shortfall and be unable to make all of our planned investments in research and development or other strategic investments.
Our ability to fund research and development expenditures depends on generating sufficient revenue and cash flow from operations and the availability of external financing, if necessary. Our research and development expenditures, together with ongoing operating expenses, will be a substantial drain on our cash flow and may decrease our cash balances. If new competitors, who may have stronger positionstechnological advances by existing competitors or other competitive factors require us to invest significantly greater resources than anticipated in these new markets. We may face delays or disruptionsour research and development efforts, our operating expenses would increase. If we are required to invest significantly greater resources than anticipated in research and development efforts without an increase in revenue, our operating results could decline.
We regularly assess markets for external financing opportunities, including debt and equity financing. Additional debt or weequity financing may not be requiredavailable when needed or, if available, may not be available on satisfactory terms. The health of the credit markets may adversely impact our ability to significantly invest greater resourcesobtain financing when needed. Any downgrades from credit rating agencies such as Moody’s or Standard & Poor’s may adversely impact our ability to obtain external financing or the terms of such financing. In July 2015, Moody’s lowered our corporate credit rating to Caa1 from B3 and our senior unsecured debt rating to Caa2 from Caa1. Furthermore, in October 2015, Standard & Poor’s lowered our corporate credit rating to CCC+ from B- and our senior unsecured debt rating to CCC from B-.
Credit agency downgrades or concerns regarding our credit worthiness may impact relationships with our suppliers, who may limit our credit lines. Our inability to obtain needed financing or to generate sufficient cash from operations may require us to abandon projects or curtail planned investments in research and development
than anticipated.In the fourth quarter of 2012, we implemented a restructuring plan designed to improve our cost structure and to strengthen our competitiveness in core growth areas. The plan primarily involves a workforce reduction of approximately 14% as well as asset impairments and facility consolidations.or other strategic initiatives. If we docurtail planned investments in research and development or abandon projects, our products may fail to remain competitive and our business would be materially adversely affected.
The loss of a significant customer may have a material adverse effect on us.
Collectively, our top five customers accounted for approximately 68% of our net revenue during the year ended 2015. On a segment basis, in 2015, five customers accounted for approximately 53% of the net revenue of our Computing and Graphics segment and five customers accounted for approximately 95% of the net revenue of our Enterprise, Embedded and Semi-Custom segment. We expect that a small number of customers will continue to account for a substantial part of revenue of our businesses in the future. If one of our key customers decides to stop buying our products, or if one of these customers materially reduces or reorganizes its operations or its demand for our products, our business would be materially adversely affected.
Global economic uncertainty may adversely impact our business and operating results.
Uncertain global economic conditions have in the past and may in the future adversely impact our business, including, without limitation, a slowdown in the Chinese economy, one of the largest global markets for desktop and notebook PCs. Uncertainty in the worldwide economic environment may negatively impact consumer confidence and spending causing our customers to postpone purchases. In addition, during challenging economic times, our current or potential future customers may experience cash flow problems and as a result may modify, delay or cancel plans to purchase our products. Additionally, if our customers are not
manage these headcount reductions effectively,successful in generating sufficient revenue or are unable to secure financing, they may not be able to pay, or may delay payment of, accounts receivable that they owe us. The risk related to our customers’ potentially defaulting on or delaying payments to us is increased because we expect that a small number of customers will continue to account for a substantial part of our revenue. Any inability of our current or potential future customers to pay us for our products may adversely affect our earnings and cash flow. Moreover, our key suppliers may reduce their output or become insolvent, thereby adversely impacting our ability to
implementmanufacture our
new business strategy could be adversely impacted.We have a substantial amount of indebtedness which could adversely affect our financial position and prevent us from implementing our strategy or fulfilling our contractual obligations.
Our debt and capital lease obligations as of December 29, 2012 were $2.0 billion, which reflects the debt discount adjustment on our 6.00% Convertible Senior Notes due 2015 (6.00% Notes) and our 8.125% Senior Notes due 2017 (8.125% Notes).
Our substantial indebtedness may:
products. In addition, uncertain economic conditions may make it more difficult for us to satisfy our financial obligations, including making scheduled principal and interest payments;
limit our ability to borrow additionalraise funds for working capital, capital expenditures, acquisitions and general corporate and other purposes;
limit our ability to use our cash flowthrough borrowings or obtain additional financing for future working capital, capital expenditures, acquisitionsprivate or other general corporate purposes;
require us to use a substantial portionpublic sales of our cash flow from operations to make debt service payments;
or equity securities.place us at a competitive disadvantage compared to our less leveraged competitors; and
increase our vulnerability to the impact of adverse economic and industry conditions.
We may not be able to generate sufficient cash to service our debt obligations.
obligations or meet our working capital requirements.
Our ability to make payments on and to refinance our debt will depend on our financial and operating performance, which may fluctuate significantly from quarter to quarter, and is subject to prevailing economic conditions and financial, business and other factors, many of which are beyond our control. We cannot assure you that we will be able to generate
sufficient cash flow or that we will be able to borrow funds,
including under our secured revolving line of credit for a principal amount up to $500 million (our Secured Revolving Line of Credit), in amounts sufficient to enable us to service our debt or to meet our working capital requirements. If we are not able to generate sufficient cash flow from operations or to borrow sufficient funds to service our debt, we may be required to sell assets or equity, reduce expenditures, refinance all or a portion of our existing debt or obtain additional financing. We cannot assure you that we will be able to refinance our debt, sell assets or equity,
borrow funds under our Secured Revolving Line of Credit or borrow more funds on terms acceptable to us, if at all.
We have a substantial amount of indebtedness which could adversely affect our financial position and prevent us from implementing our strategy or fulfilling our contractual obligations.
Our total debt instrumentsas of December 26, 2015 was $2.26 billion. Our substantial indebtedness may:
make it difficult for us to satisfy our financial obligations, including making scheduled principal and interest payments;
limit our ability to borrow additional funds for working capital, capital expenditures, acquisitions and general corporate and other purposes;
limit our ability to use our cash flow or obtain additional financing for future working capital, capital expenditures, acquisitions or other general corporate purposes;
require us to use a substantial portion of our cash flow from operations to make debt service payments;
place us at a competitive disadvantage compared to our competitors with relatively less debt; and
increase our vulnerability to the impact of adverse economic and industry conditions.
We enter into interest rate swap agreements from time to time to manage our exposure to interest rate risk. These swap agreements involve risks, such as the risk that counterparties may fail to honor their obligations under these arrangements, the risk that these arrangements may not be effective in reducing our exposure to changes in interest rates and the risk that our exposure to interest rates may increase if interest rates increase.
The agreements governing our notes and our Secured Revolving Line of Credit impose restrictions on us that may adversely affect our ability to operate our business.
The indentures governing our
8.125% Notes, 7.75% Senior Notes due 2020 (7.75% Notes)
and, 7.50% Senior Notes due 2022 (7.50%
Notes), 7.00% Senior Notes due 2024 (7.00% Notes) and 6.75% Senior Notes due 2019 (6.75% Notes) contain various covenants which limit our ability
to:to, among other things:incur additional indebtedness;
pay dividends and make other restricted payments;
make certain investments, including investments in our unrestricted subsidiaries;
create or permit certain liens;
create or permit restrictions on the ability of certain restricted subsidiaries to pay dividends or make other distributions to us;
use the proceeds from sales of assets;
enter into certain types of transactions with affiliates; and
consolidate or merge or sell our assets as an entirety or substantially as an entirety.
Our Secured Revolving Line of Credit also contains various covenants which limit our ability to, among other things, make certain investments, merge or consolidate with other entities and permit certain subsidiaries from incurring indebtedness. In addition, further restrictions apply when certain payment conditions (the Payment Conditions) are not satisfied with respect to specified transactions, events or payments. The Payment Conditions include that (i) no default or event of default exists and (ii) at all times during the 45 consecutive days immediately prior to such transaction, event or payment and on a pro forma basis after giving effect to such transaction, event or payment and any incurrence or repayment of indebtedness in connection therewith, the Loan Parties’ Excess Cash Availability (as defined in the First Amended and Restated Loan Agreement) available cash is greater than the greater of 20% of the total commitment amount and $100 million. If Payment Conditions are not satisfied under certain circumstances, we will become subject to various additional covenants which limit our ability to, among other things:
create any liens upon any of the Loan Parties’ property (other than customary permitted liens and liens on up to $1.5 billion of secured credit facilities debt (which amount includes our Secured Revolving Line of Credit));
declare or make cash distributions;
create any encumbrance on the ability of a subsidiary to make any upstream payments;
make asset dispositions other than certain ordinary course dispositions and certain supply chain finance arrangements;
make certain loans, make payments with respect to subordinated debt or certain borrowed money prior to its due date; and
become party to certain agreements restricting the Loan Parties’ ability to enter into any non-arm’s-length transaction with an affiliate.
The agreements governing our
borrowing arrangementsnotes and our Secured Revolving Line of Credit contain cross-default provisions whereby a default under one agreement would likely result in cross defaults under agreements covering other borrowings. For example, the occurrence of a default with respect to any indebtedness or any failure to repay debt when due in an amount in excess of $50 million would cause a cross default under the indentures governing our 7.75% Notes,
8.125% Notes, 7.50% Notes,
7.00% Notes and
6.00% Notes.6.75% Notes, as well as under our Secured Revolving Line of Credit. The occurrence of a default under any of these borrowing arrangements would permit the applicable note holders
or the lenders under our Secured Revolving Line of Credit to declare all amounts outstanding under those borrowing arrangements to be immediately due and payable. If the note holders or the trustee under the indentures governing our 7.75% Notes,
8.125% Notes, 7.50% Notes,
7.00% Notes, 6.75% Notes or
6.00% Notesthe lenders under our Secured Revolving Line of Credit accelerate the repayment of borrowings, we cannot assure you that we will have sufficient assets to repay those borrowings.
The completion and impact of the 2015 Restructuring Plan, our transformation initiatives and any future restructuring actions could adversely affect us.
In the third quarter of 2015, we implemented a restructuring plan (2015 Restructuring Plan) focused on our ongoing efforts to simplify our business and better align resources around our priorities and business outlook. The 2015 Restructuring Plan provides for a workforce reduction of approximately 5% and includes organizational actions such as outsourcing certain IT services and application development. The 2015 Restructuring Plan also anticipates a charge for the consolidation of certain real estate facilities. We expect the 2015 Restructuring Plan to be largely completed by the end of the third quarter of 2016. These restructuring actions and any future restructuring actions could have an adverse impact on our business as a result of decreases in employee morale and the failure to meet operational targets due to the loss of employees. We cannot be sure that we will realize operational savings or any other anticipated benefits from the 2015 Restructuring Plan or any future restructuring actions. Any operating savings are subject to assumptions, estimates and significant economic, competitive and other uncertainties, some of which are beyond our control. If these estimates and assumptions are incorrect, if we experience delays or if other unforeseen events occur, our business and financial results could be adversely affected.
Any transformation initiatives or future restructuring actions we undertake may fail to achieve the anticipated results and may materially adversely affect our business and financial results.
The markets in which our products are sold are highly competitive.
The markets in which our products are sold are very competitive and delivering the latest and best products to market on a timely basis is critical to achieving revenue growth. We believe that the main factors that determine our product competitiveness are timely product introductions, product quality (including enabling
state of the artstate-of-the-art visual experience), power consumption (including battery life), reliability,
selling price,processor clock speed,
performance, size (or form factor),
selling price, cost, adherence to industry standards (and the creation of open industry standards),
level of integration, software and hardware compatibility and stability,
brand recognition and
brand awareness.availability.
We expect that competition will continue to be intense due to rapid technological changes, frequent product introductions by our competitors or new competitors of products that may provide better performanceperformance/experience or may include additional features that render our products uncompetitive anduncompetitive. We may also face aggressive pricing by competitors, especially during challenging economic times. For instance, with the introduction of our APU products and other competing solutions, we believe that demand for additional discrete graphic cards may decrease in the future due to both the improvement of the quality of Intel’s integrated graphics and the graphics performance of our APUs. Using a more advanced process technology can contribute to lower product manufacturing costs and improve a product’s performance and power efficiency. If competitors introduce competitive new products into the market before us, our business could be adversely affected. Some competitors may have greater access or rights to companion technologies, including interface, processor and memory technical information. Competitive pressuresWith the introduction of our APU products and other competing solutions with integrated graphics, we believe that demand for additional discrete graphics chips and cards may decrease in the future due to improvements in the quality and performance of integrated graphics. In addition, our competitors have significant marketing and sales resources which could adversely impactincrease the competitive environment in such a declining market, leading to lower prices and margins. If competitors introduce competitive new products into the market before us, demand for our products could be adversely impacted and our business could be adversely affected.
In addition, we are entering markets with current and new competitors who may be able to adapt more quickly to customer requirements and emerging technologies. We cannot assure you that we will be able to compete successfully against current or new competitors who may have stronger positions in these new markets or superior ability to anticipate customer requirements and emerging industry trends. We may face delays or disruptions in research and development efforts, or we may be required to significantly invest greater resources in research and development than anticipated.
Uncertainties involving the ordering and shipment of our products could materially adversely affect us.
We typically sell our products pursuant to individual purchase orders. We generally do not have long-term supply arrangements with our customers or minimum purchase requirements except that orders generally must be for standard pack quantities. Generally, our customers may cancel orders for standard products more than 30 days prior to shipment without incurring significant fees. We base our inventory levels in part on customers’ estimates of demand for their products, which may not accurately predict the quantity or type of our products that our customers will want in the future or ultimately end up purchasing. Our ability to forecast demand is even further complicated when our products are sold indirectly through downstream channel distributors and customers, as our forecasts for demand are then based on estimates provided by multiple parties throughout the downstream channel.
PC and consumer markets are characterized by short product lifecycles, which can lead to rapid obsolescence and price erosion. In addition, our customers may change their inventory practices on short notice for any reason. We may build inventories during periods of anticipated growth, and the cancellation or deferral of product orders or overproduction due to failure of anticipated orders to materialize, could result in excess or obsolete inventory, which could harmresult in write-downs of inventory and an adverse effect on gross margins.
Factors that may result in excess or obsolete inventory, which could result in write-downs of the value of our inventory, a reduction in the average selling price or a reduction in our gross margin include:
a sudden or significant decrease in demand for our products;
a production or design defect in our products;
a higher incidence of inventory obsolescence because of rapidly changing technology and customer requirements;
a failure to accurately estimate customer demand for our products, including for our older products as our new products are introduced; or
our competitors taking aggressive pricing actions.
For example, in the third quarter of 2015, we recorded an inventory write-down of $65 million consisting primarily of older generation APUs, which adversely impacted our operating results. Since market conditions are uncertain, these and other factors could materially adversely affect our business.
Our receipt of revenue from our semi-custom SoC products is dependent upon our technology being designed into third-party products and the success of those products.
The revenue that we receive from our semi-custom SoC products is in the form of non-recurring engineering fees charged to third parties for design and development services and revenue received in connection with sales of our semi-custom SoC products to these third parties. As a result, our ability to generate revenue from our semi-custom products depends on our ability to secure customers for our semi-custom design pipeline, our customers’ desire to pursue the project, and our semi-custom SoC products being incorporated into those customer’s products. Any revenue from sales of our semi-custom SoC products is directly related to sales of the third-party’s products and reflective of their success in the market. Moreover, we have no control over the marketing efforts of these third parties, and we cannot make any assurances that sales of their products will be successful in current or future years. Consequently, the semi-custom SoC product revenue expected by us may not be fully realized and our operating results may be adversely affected.
The demand for our products depends in part on the market conditions in the industries
and geographies into which they are sold. Fluctuations in demand for our products or a market decline in any of these industries
or geographies wouldcould have a material adverse effect on our results of operations.
Our business is dependent upon the market for desktop and mobile PCs and servers. Form factors have increasingly shifted from desktop PCs to mobile PCs, with tablets being one of the fastest growing form factors. Historically, a significant portion of our Computing Solutions revenue has been related to desktop PCs. Currently, approximately 85% of our business is focused on the legacy PC portions of the market, projected to have slowing growth over the next several years.
Industry-wide fluctuations in the computer marketplace have materially adversely affected us in the past and may materially adversely affect us in the future. For example,A large portion of our Computing and Graphics revenue is focused on the consumer desktop PC and notebook segments, which have experienced and continue to experience a decline driven by, among other factors, the adoption of smaller form factors, increased competition and changes in the second halfreplacement cycles. The success of 2012 was adversely affected, in part, by the overall weakness in the global economyour semi-custom SoC products is dependent on securing customers for our semi-custom design pipeline and weak consumer demand for end-user PC products, which impacted sales. We do not expect PC market conditions, to improve duringincluding the first halfsuccess of 2013.the Sony PlayStation
®4 and Microsoft Xbox One game console systems worldwide. Our ability to design and introduce new products in a timely manner is dependent upon third-party intellectual property.
In the design and development of new products and product enhancements, we rely on third-party intellectual property such as software development tools and hardware testing tools. Furthermore, certain product
features may rely on intellectual property acquired from third parties. The design requirements necessary to meet consumer demand for more features and greater functionality from semiconductor products may exceed the capabilities of the third-party intellectual property or development tools available to us. If the third-party intellectual property that we use becomes unavailable, is not available in the time frame or price point needed for our new products or fails to produce designs that meet customer demands, our business could be materially adversely affected.
We depend on third-party companies for the design, manufacture and supply of motherboards,
BIOS software and other computer platform components to support our
microprocessor and graphics businesses.business.
We depend on third-party companies for the design, manufacture and supply of motherboards,
software (e.g. BIOS,
softwareoperating systems) and other components that our customers utilize to support our microprocessor,
GPU and
GPUAPU offerings. We also rely on
our add-in-board partners (AIBs)AIBs to support our GPU
business.and APU products. In addition, our microprocessors are not designed to function with motherboards and chipsets designed to work with Intel microprocessors. If the designers, manufacturers, AIBs and suppliers of motherboards,
software and other components decrease their support for our product offerings, our business could be materially adversely affected.
If we lose Microsoft Corporation’s support for our products or other software vendors do not design and develop software to run on our products, our ability to sell our products could be materially adversely affected.
Our ability to innovate beyond the x86 instruction set controlled by Intel depends partially on Microsoft designing and developing its operating systems to run on or support our
x86-based microprocessor products. With respect to our graphics products, we depend in part on Microsoft to design and develop its operating system to run on or support our graphics products. Similarly, the success of our products in the market, such as our APU products, is dependent on independent software providers designing and developing software to run on our products. If Microsoft does not continue to design and develop its operating systems so that they work with our x86 instruction sets or does not continue to develop and maintain their operating systems to support our graphics products, independent software providers may forego designing their software applications to take advantage of our innovations and customers may not purchase PCs with our products. In addition, some software drivers sold with our products are certified by Microsoft. If Microsoft did not certify a driver, or if we otherwise fail to retain the support of Microsoft or other software vendors, our ability to market our products would be materially adversely affected.
The loss of
Our reliance on third-party distributors and AIB partners subjects us to certain risks.
We market and sell our products directly and through third-party distributors and AIB partners pursuant to agreements that can generally be terminated for convenience by either party upon prior notice to the other party. These agreements are non-exclusive and permit both our distributors and AIBs to offer our competitors’ products. We are dependent on our distributors and AIBs to supplement our direct marketing and sales efforts. If any significant distributor or AIB or a
significant customer may have a material adverse effect on us.Collectively, our top five customers accounted for approximately 51%substantial number of our net revenue in 2012. On a segment basis, during 2012, five customers accounted for approximately 59% of the net revenue of our Computing Solutions segment and five customers accounted for approximately 48% of the net revenue of our Graphics segment. We expect that a small number of customers will continue to account for a substantial part of revenues of our microprocessor and graphics businesses in the future. If one of our top microprocessordistributors or graphics business customersAIBs terminated their relationship with us, decided to stop buyingmarket our competitors’ products over our products or if onedecided not to market our products at all, our ability to bring our products to market would be impacted and we would be materially adversely affected. If we are unable to manage the risks related to the use of these customers wereour third-party distributors and AIB partners or offer appropriate incentives to materially reduce its operations or its demand forfocus them on the sale of our products, our business wouldcould be materially adversely affected
affected.
Additionally, distributors and AIBs typically maintain an inventory of our products. In most instances, our agreements with distributors protect their inventory of our products against price reductions, as well as provide return rights for any product that we have removed from our price book and that is not more than 12 months older than the manufacturing code date. Some agreements with our distributors also contain standard stock rotation provisions permitting limited levels of product returns. Our agreements with AIBs protect their inventory of our products against price reductions. We defer the gross margins on our sales to distributors and AIBs, resulting from both our deferral of revenue and related product costs, until the applicable products are re-sold by the distributors or the AIBs. However, in the event of a significant decline in the price of our products, the price protection rights we offer would materially adversely affect us because our revenue and corresponding gross margin would decline.
Our inability
to continue to attract and retain qualified personnel may hinder our
business.product development programs.
Much of our future success depends upon the continued service of numerous qualified engineering, marketing, sales and executive personnel.
In the fourth quarter of 2012, we implemented a restructuring plan that includes a workforce reduction of approximately 14%. If we
do not manage this headcount reduction effectively, we mayare not able to
continue to attract, train and retain qualified personnel
or attract qualified personnel in the future necessary for our
operations,business, the progress of our product development programs could be hindered, and we could be materially adversely affected. To help attract, retain and motivate qualified personnel, we use share-based incentive awards such as employee stock options and non-vested share units (restricted stock units). If the value of such stock awards does not appreciate as measured by the performance of the price of our common stock, or if our share-based compensation otherwise ceases to be viewed as a valuable benefit, our ability to attract, retain and motivate personnel could be weakened, which could
materiallyharm our results of operations. In addition, our current and any future restructuring plans may adversely
affectimpact our
business.ability to attract and retain key employees.
In the event of a change of control, we may not be able to repurchase our outstanding debt as required by the applicable indentures
and our Secured Revolving Line of Credit, which would result in a default under the
indentures.indentures and our Secured Revolving Line of Credit.
Upon a change of control, we will be required to offer to repurchase all of
theour 7.75% Notes,
8.125%7.50% Notes, 7.00% Notes and
7.50%6.75% Notes then outstanding at 101% of the principal amount thereof, plus accrued and unpaid interest, if
any, up to, but excluding, the repurchase date. Moreover, the indenture governing our 6.00% Notes also requires us to offer to repurchase these securities upon certainIn addition, a change of control events.would be an event of default under our Secured Revolving Line of Credit. As of December 29, 2012, the aggregate26, 2015, $230 million was outstanding principal amountunder our Secured Revolving Line of theCredit and $2.03 billion was outstanding 8.125% Notes, 7.75% Notes, 7.50% Notes and 6.00% Notes was $2.0 billion.under our notes. Future debt agreements may contain similar provisions. We may not have the financial resources to repurchase our indebtedness.
outstanding notes and prepay all of our outstanding obligations under our Secured Revolving Line of Credit.
The semiconductor industry is highly cyclical and has experienced severe downturns that have materially adversely affected, and may
in the futurecontinue to materially adversely affect, our
business.business in the future.
The semiconductor industry is highly cyclical and has experienced significant downturns, often in conjunction with constant and rapid technological change, wide fluctuations in supply and demand, continuous new product introductions, price erosion and declines in general economic conditions. We have incurred substantial losses in recent downturns, due to:
substantial declines in average selling prices;
the cyclical nature of supply/supply and demand imbalances in the semiconductor industry;
a decline in demand for end-user products (such as PCs) that incorporate our products; and
excess inventory levelslevels.
Industry-wide fluctuations in the channels of distribution, including thosecomputer marketplace have materially adversely affected us in the past and may materially adversely affect us in the future. For example, form factor devices continue to shift from desktop PCs and notebooks to smaller form factor devices. A large portion of our customers.Computing and Graphics revenue is focused on consumer desktop PC and notebook segments, which have experienced and continue to experience a decline driven by, among other factors, the adoption of smaller form factors, increased competition and changes in replacement cycles.
Global economic uncertainty and weakness have also impacted the semiconductor market as consumers and businesses have deferred purchases, which negatively impacted demand for our products. Our financial performance has been, and may in the future be, negatively affected by these downturns.
For example, our revenue in the second half of 2012 was adversely affected, in part, by the overall weakness in the global economy and weak consumer demand for end-user PC products, which impacted sales. We do not expect PC market conditions to improve during the first half of 2013.The growth of our business is also dependent on continued demand for our products from high-growth
adjacent emerging global markets. Our ability to be successful in such markets depends in part on our ability to establish adequate local infrastructure, as well as our ability to cultivate and maintain local relationships in these markets. If demand from these markets is below our expectations, sales of our products may decrease, which would have a material adverse effect on us.
Acquisitions, divestitures and/or joint ventures could disrupt our business, harm our financial condition and operating results or dilute, or adversely affect the price of, our common stock.
Our success will depend, in part, on our ability to expand our product offerings and grow our business in response to changing technologies, customer demands and competitive pressures. In some circumstances, we may pursue growth through the acquisition of complementary businesses, solutions or technologies or through divestitures or joint ventures rather than through internal development. The identification of suitable acquisition or joint venture candidates can be difficult, time-consuming and costly, and we may not be able to successfully complete identified acquisitions or joint ventures. Moreover, if such acquisitions or joint ventures require us to seek additional debt or equity financing, we may not be able to obtain such financing on terms favorable to us or at all. Even if we successfully complete an acquisition or a joint venture, we may not be able to assimilate and integrate effectively or efficiently the acquired business, technologies, solutions, assets, personnel or operations, particularly if key personnel of the acquired company decide not to work for us. Acquisitions and joint ventures may also involve the entry into geographic or business markets in which we have little or no prior experience. Consequently, we may not achieve anticipated benefits of the acquisitions or joint ventures which could harm our operating results. In addition, to complete an acquisition, we may issue equity securities, which would dilute our stockholders’ ownership and could adversely affect the price of our common stock, as well as incur debt, assume contingent liabilities or have amortization expenses and write-downs of acquired assets, which could adversely affect our results of operations. Acquisitions and joint ventures may also reduce our cash available for operations and other uses, which could harm our business. We may not achieve the objectives and expectations with respect to future operations, products and services.
In October, 2015, we entered into an Equity Interest Purchase Agreement (the Equity Interest Purchase Agreement) with Nantong Fujitsu Microelectronics Co., Ltd., a Chinese joint stock company (JV Party), under which we will sell to JV Party a majority of the equity interests in AMD Technologies (China) Co. Ltd., a wholly-foreign owned enterprise incorporated as a limited liability company (the Chinese Target Company), and Advanced Micro Devices Export Sdn. Bhd., a Malaysian limited liability company (the Malaysian Target Company and, together with the Chinese Target Company, the Target Companies), thereby forming two joint ventures (collectively, the JVs) with JV Party in a transaction valued at approximately $436 million (the Transaction). The JV Party will acquire 85% of the equity interests in each JV for approximately $371 million and we estimate we will receive approximately $320 million cash, net of taxes and other customary expenses. After closing, JV Party’s affiliates will own 85% of the equity interests in each JV while certain of our subsidiaries will own the remaining 15%. The Transaction will result in the JVs providing assembly, testing, marking, packing and packaging services (ATMP) to us. The Transaction is expected to close in the first half of 2016 and is expected to simplify our business model while strengthening our balance sheet. The Transaction requires numerous international regulatory approvals in order to close. It is possible that we may not receive the approvals necessary to close the Transaction in a timely manner or the approvals may result in additional unanticipated costs.
The long duration between entering into a definitive agreement and the proposed closing in the first half of 2016 could result in loss of employee morale and result in loss of key employees affecting the success of the JVs. While we expect the Transaction to be cost neutral with reduced capital expenditures, the Transaction could potentially increase our cost for ATMP services with little to no measurable reduction in our capital expenditures. Additionally, we may not realize the expected benefits from the Transaction including the JVs’ expected future performance and financial projections and the JV’s expected future results of operations and financial condition. The majority of ATMP services will be provided by the JVs and there is no guarantee that the JVs will be able to adequately fulfill our ATMP requirements as we transition operations to the JV Party, nor is there any guarantee that the JVs will be able to fulfill our long-term ATMP requirements. If we are unable to meet customer demand due to fluctuating or late supply from the JVs, it could result in lost sales and have a material adverse effect on our business.
Our business is dependent upon the proper functioning of our internal business processes and information systems and modification or interruption of such systems may disrupt our business, processes and internal controls.
We rely upon a number of internal business processes and information systems to support key business functions, and the efficient operation of these processes and systems is critical to our business. Our business processes and information systems need to be sufficiently scalable to support the growth of our business and may require modifications or upgrades that expose us to a number of operational risks. As such, our information systems will continually evolve and adapt in order to meet our business needs. These changes may be costly and disruptive to our operations and could impose substantial demands on management time.
These changes may also require changes in our information systems, modification of internal control procedures and significant training of employees and third-party resources. We continuously work on simplifying our information systems and applications through consolidation and standardization efforts. There can be no assurance that our business and operations will not experience any disruption in connection with this transition. Our information technology systems, and those of third-party information technology providers or business partners, may also be vulnerable to damage or disruption caused by circumstances beyond our control including catastrophic events, power anomalies or outages, natural disasters, viruses or malware, cyber-attacks, data breaches and computer system or network failures, exposing us to significant cost, reputational harm and disruption or damage to our business.
In addition, as our IT environment continues to evolve, we are embracing new ways of communicating and sharing data internally and externally with customers and partners using methods such as mobility and the cloud that can promote business efficiency. However, these practices can also result in a more distributed IT environment, making it more difficult for us to maintain visibility and control over internal and external users, and meet scalability and administrative requirements. If our security controls cannot keep pace with the speed of these changes, or if we are not able to meet regulatory and compliance requirements, our business would be materially adversely affected.
Data breaches and cyber-attacks could compromise our intellectual property or other sensitive information, be costly to remediate and cause significant damage to our business and reputation.
In the ordinary course of our business, we maintain sensitive data on our networks, including our intellectual property and proprietary or confidential business information relating to our business and that of our customers and business partners. The secure maintenance of this information is critical to our business and reputation. We believe that companies have been increasingly subject to a wide variety of security incidents, cyber-attacks, hacking and phishing attacks, and other attempts to gain unauthorized access. These threats can come from a variety of sources, all ranging in sophistication from an individual hacker to a state-sponsored attack. Cyber threats may be generic, or they may be custom-crafted against our information systems. Over the past year, cyber-attacks have become more prevalent and much harder to detect and defend against. Our network and storage applications may be subject to unauthorized access by hackers or breached due to operator error, malfeasance or other system disruptions. It is often difficult to anticipate or immediately detect such incidents and the damage caused by such incidents. These data breaches and any unauthorized access or disclosure of our information or intellectual property could compromise our intellectual property and expose sensitive business information. Cyber-attacks could also cause us to incur significant remediation costs, result in product development delays, disrupt key business operations and divert attention of management and key information technology resources. These incidents could also subject us to liability, expose us to significant expense and cause significant harm to our reputation and business. In addition, we could be subject to potential claims for damages resulting from loss of data from alleged vulnerabilities in the security of our processors. We also maintain confidential and personally identifiable information about our workers. The integrity and protection of our worker data is critical to our business and our workers have a high expectation that we will adequately protect their personal information. We anticipate an increase in costs related to:
implementing new data security procedures, including costs related to upgrading computer and network security;
training workers to maintain and monitor our security measures;
remediating any data security breach and addressing the related litigation; and
mitigating reputational harm.
We often partner with third-party providers for certain worker services and we may provide certain limited worker information to such third parties based on the scope of the services provided to us. However, if these third parties fail to adopt or adhere to adequate data security practices, or in the event of a breach of their networks, our workers’ data may be improperly accessed, used or disclosed. A breach of data privacy is likely to cause significant disruption of our business operations. Failure to adequately maintain and update our security systems could materially adversely affect our operations and our ability to maintain worker confidence. Failure to prevent unauthorized access to electronic and other confidential information and data breaches could materially adversely affect our financial condition, our competitive position and operating results.
Our operating results are subject to quarterly and seasonal sales patterns.
A substantial portion of our quarterly sales have historically been made in the last month of the quarter. This uneven sales pattern makes prediction of
revenuesrevenue for each financial period difficult and increases the risk of unanticipated variations in quarterly results and financial condition. In addition, our operating results tend to vary seasonally. For example, historically,
demand in the retail sector of thefirst quarter PC
market is often stronger during theproduct sales are generally lower than fourth quarter
assales. In addition, with respect to our semi-custom SoC products for game consoles, we expect sales patterns to follow the seasonal trends of a
result of the winter holiday season and weakerconsumer business with sales in the first
quarter. Europeanhalf of the year being lower than sales
have also been historically weaker duringin the
summer months.second half of the year. Many of the factors that create and affect
quarterly and seasonal trends are beyond our control.
If essential equipment,
materials or
materialsmanufacturing processes are not available to manufacture our products, we could be materially adversely affected.
We purchase equipment and materials for our internal back-end manufacturing operations from a number of suppliers and our operations depend upon obtaining deliveries of adequate supplies of equipment and materials on a timely basis. Our
third party manufacturingthird-party suppliers also depend on the same timely delivery of adequate quantities of equipment and materials in the manufacture of our products.
In addition, as many of our products increase in technical complexity, we rely on our third-party suppliers to update their processes in order to continue meeting our back-end manufacturing needs. Certain equipment and materials that are used in the manufacture of our products are available only from a limited number of
suppliers.suppliers, or in some cases, a sole supplier. We also depend on a limited number of suppliers to provide the majority of certain types of integrated circuit packages for
our microprocessors, including our APU products. Similarly, certain non-proprietary materials or components such as memory, printed circuit boards (PCBs), interposers, substrates and capacitors used in the manufacture of our graphics products are currently available from only a limited number of sources. Because some of the equipment and materials that we and our third partythird-party manufacturing suppliers purchase are complex, it is sometimes difficult to substitute one supplier for another.
From time to time, suppliers may extend lead times, limit supply or increase prices due to capacity constraints or other factors. Also, some of these materials and components may be subject to rapid changes in price and availability. Interruption of supply or increased demand in the industry could cause shortages and price increases in various essential materials. Dependence on a sole supplier or a limited number of suppliers exacerbates these risks. If we are unable to procure certain of these materials for our back-end manufacturing operations, or our third-party foundries or manufacturing suppliers are unable to procure materials for manufacturing our products, our business would be materially adversely affected.
Our issuance to West Coast Hitech L.P. (WCH) of warrants to purchase 35,000,000 shares of our common stock, if and when exercised by WCH, will dilute the ownership interests of our existing stockholders, and the conversion of the remainder of our 6.00% Notes may dilute the ownership interest of our existing stockholders.
The warrants issued to WCH became exercisable in July 2009. Any issuance by us of additional shares to WCH upon exercise of the warrants will dilute the ownership interests of our existing stockholders. Any sales in the public market by WCH of any shares owned by WCH could adversely affect prevailing market prices of our common stock, and the anticipated exercise by WCH of the warrants could depress the price of our common stock.
Moreover, the conversion of our remaining 6.00% Notes may dilute the ownership interests of our existing stockholders. The conversion of the 6.00% Notes could have a dilutive effect on our earnings per share to the extent that the price of our common stock exceeds the conversion price of the 6.00% Notes. Any sales in the public market of our common stock issuable upon conversion of the 6.00% Notes could adversely affect prevailing market prices of our common stock. In addition, the conversion of the 6.00% Notes into cash and shares of our common stock could depress the price of our common stock.
If our products are not compatible with some or all industry-standard software and hardware, we could be materially adversely affected.
Our products may not be fully compatible with some or all industry-standard software and hardware. Further, we may be unsuccessful in correcting any such compatibility problems in a timely manner. If our customers are unable to achieve compatibility with software or hardware,
after our products are shipped in volume, we could be materially adversely affected. In addition, the mere announcement of an incompatibility problem relating to our products could have a material adverse effect on our business.
Costs related to defective products could have a material adverse effect on us.
Products as complex as those we offer may contain defects or failures when first introduced or when new versions or enhancements to existing products are released. We cannot assure you that, despite our testing procedures, errors will not be found in new products or releases after commencement of commercial shipments in the future, which could result in loss of or delay in market acceptance of our products, material recall and replacement costs, delay in recognition or loss of
revenues,revenue, writing down the inventory of defective products, the diversion of the attention of our engineering personnel from product development efforts, defending against litigation related to defective products or related property damage or personal injury and damage to our reputation in the industry and could adversely affect our relationships with our customers. In addition, we may have difficulty identifying the end customers of the defective products in the field. As a result, we could incur substantial costs to implement modifications to correct defects. Any of these problems could materially adversely affect our business.
We could be subject to potential product liability claims if one of our products causes, or merely appears to have caused, an injury. Claims may be made by consumers or others selling our products, and we may be subject to claims against us even if an alleged injury is due to the actions of others. A product liability claim, recall or other claim with respect to uninsured liabilities or for amounts in excess of insured liabilities could have a material adverse effect on our business.
Our receipt of royalty revenues is dependent upon our technology being designed into third-party products and the success of those products.
Our graphics technology is used in game consoles. The revenues that we receive from these products generally are in the form of non-recurring engineering fees charged for design and development services as well as royalties paid to us by these third parties. Our royalty revenues are directly related to the sales of these products and reflective of their success in the market. If these third parties do not include our graphics technology in future generations of their game consoles, our revenues from royalties would decline significantly. Moreover, we have no control over the marketing efforts of these third parties and we cannot make any assurances that sales of those products will achieve expected levels in the current or future fiscal years. Consequently, the revenues from royalties expected by us from these products may not be fully realized, and our operating results may be adversely affected.
If we fail to maintain the efficiency of our supply chain as we respond to changes in customer demand for our products, our business could be materially adversely affected.
Our ability to meet customer demand for our products depends, in part, on our ability to deliver the products our customers want on a timely basis. Accordingly, we rely on our supply chain for the manufacturing, distribution and fulfillment of our products. As we continue to grow our business,
expand to high-growth adjacent markets, acquire new customers and strengthen relationships with existing customers, the efficiency of our supply chain will become increasingly important because many of our customers tend to have specific requirements for particular products, and specific time-frames in which they require delivery of these products. If we are unable to consistently deliver the right products to our customers on a timely basis in the right locations, our customers may reduce the quantities they order from us, which could have a material adverse effect on our business.
We outsource to third parties certain supply-chain logistics functions, including portions of our product distribution, transportation management and information technology support services.
We rely on third-party providers to operate our regional product distribution centers and to manage the transportation of our work-in-process and finished products among our facilities,
to our manufacturing suppliers and to our customers. In addition, we rely on third parties to provide certain information technology services to us, including
helpdeskhelp desk support, desktop application services, business and software support applications, server and storage administration, data center operations, database administration and voice, video and remote access. We cannot guarantee that these providers will fulfill their respective responsibilities in a timely manner in accordance with the contract terms, in which case our internal operations and the distribution of our products to our customers could be materially adversely affected. Also, we cannot guarantee that our contracts with these third-party providers will be renewed, in which case we would have to transition these functions in-house or secure new providers, which could have a material adverse effect on our business if the transition is not executed appropriately.
We may be subjectincur future impairments of goodwill.
We perform our annual goodwill impairment analysis as of the first day of the fourth quarter of each year. Subsequent to
disruptions, failuresour annual goodwill impairment analysis, we monitor for any events or
cyber-attackschanges in circumstances, such as significant adverse changes in business climate or operating results, changes in management’s business strategy, an inability to successfully introduce new products in the marketplace, an inability to successfully achieve internal forecasts or significant declines in our
information technology systems and network infrastructures that could have a material adverse effect on us.We maintain and rely extensively on information technology systems and network infrastructures for the effective operationstock price, which may represent an indicator of our business. We also hold large amountsimpairment. The occurrence of data in various data center facilities around the world about us, our customers, suppliers, partners and other third parties, which our business depends upon. A disruption, infiltration or failure of our information technology systems or any of our data centers as a result of
software or hardware malfunctions, computer viruses, cyber-attacks, employee theft or misuse, power disruptions, natural disasters or accidents could cause breaches of data security and loss of critical data, which in turn could materially adversely affect our business. Our security procedures, such as virus protection software and our business continuity planning, such as our disaster recovery policies and back-up systems,these events may not be adequate or implemented properly to fully address the adverse effect of such events, which could adversely impact our operations. We could be subject to litigation and our reputation and brand could be harmed if our information technology systems are compromised and sensitive or confidential information about our customers, suppliers, partners and other third parties is lost or misappropriated. In addition, our business could be adversely affected to the extent we do not make the appropriate level of investment in our technology systems as our technology systems become out-of-date or obsolete and are not able to deliver the type of data integrity and reporting we need to run our business. Furthermore, when we implement new systems and or upgrade existing systems, we could be faced with temporary or prolonged disruptions that could adversely affect our business. Also, implementing new systems or upgrading our existing systems could be very costly.
Uncertainties involving the ordering and shipment of our products could materially adversely affect us.
We typically sell our products pursuant to individual purchase orders. We generally do not have long-term supply arrangements with our customers or minimum purchase requirements except that orders generally must be for standard pack quantities. Generally, our customers may cancel orders more than 30 days prior to shipment without incurring significant fees. We base our inventory levels in part on customers’ estimates of demand for their products, which may not accurately predict the quantity or type of our products that our customers will want in the future or ultimately end up purchasing. Our ability to forecast demand is even further complicated when we sell indirectly through distributors, as our forecasts for demand are then based on estimates provided by multiple parties.
PC and consumer markets are characterized by short product lifecycles, which can lead to rapid obsolescence and price erosion. In addition, our customers may change their inventory practices on short notice for any reason. We may build inventories during periods of anticipated growth, and the cancellation or deferral of product orders or overproduction due to failure of anticipated orders to materialize, could result in excess or obsolete inventory, which could result in write-downs of inventory and an adverse effect on gross margins. Factors that may result in excess or obsolete inventory, which could result in write-downs of the value of our inventory, a reduction in the average selling price, and/or a reduction in our gross margin include:
a sudden and significant decrease in demand for our products;
a higher incidence of inventory obsolescence because of rapidly changing technology and customer requirements;
a failure to accurately estimate customer demand for our older products as our new products are introduced; or
our competitors taking aggressive pricing actions.
For example, gross margin in the third quarter of 2012 was adversely impacted by, among other things, an inventory write-down of $100 million. The inventory write-down was the result of lower anticipated future demand for certain products and mainly comprised of our Llano products. Because market conditions are uncertain, these and other factors could materially adversely affect our business.
Our reliance on third-party distributors and add-in-board partners subjects us to certain risks.
We market and sell our products directly and through third-party distributors and AIB partners pursuant to agreements that can generally be terminated for convenience by either party upon prior notice to the other party. These agreements are non-exclusive and permit both our distributors and AIBs to offer our competitors’ products. We are dependent on our distributors and AIBs to supplement our direct marketing and sales efforts. If
any significant distributor or AIB or a substantial number of our distributors or AIBs terminated their relationship with us, decided to market our competitors’ products over our products, or decided not to market our products at all, our ability to bring our products to market would be impacted and we would be materially adversely affected. If we are unable to manage the risks related to the use of our third party distributors and AIB partners or offer the appropriate incentives to focus them on the sale of our products, our business could be materially adversely affected. For example, our revenue in the second quarter of 2012 was adversely affected by lower than expected desktop processor unit sales to our distributor customers, particularly in China and Europe.
Additionally, distributors and AIBs typically maintain an inventory of our products. In most instances, our agreements with distributors protect their inventory of our products against price reductions, as well as provide return rights for any product that we have removed from our price book and that is not more than twelve months older than the manufacturing code date. Some agreements with our distributors also contain standard stock rotation provisions permitting limited levels of product returns. Our agreements with AIBs protect their inventory of our products against price reductions. We defer the gross margins on our sales to distributors and AIBs, resulting from both our deferral of revenue and related product costs, until the applicable products are re-sold by the distributors or the AIBs. However, in the event of a significant decline in the price of our products, the price protection rights we offer would materially adversely affect us because our revenue and corresponding gross margin would decline.
Acquisitions could disrupt our business, harm our financial condition and operating results or dilute, or adversely affect the price of, our common stock.
Our success will depend, in part, on our ability to expand our product offerings and grow our business in response to changing technologies, customer demands and competitive pressures. In some circumstances, we may pursue growth through the acquisition of complementary businesses, solutions or technologies rather than through internal development, including, for example, our acquisition in March 2012 of SeaMicro. The identification of suitable acquisition candidates can be difficult, time-consuming and costly, and we may not be able to successfully complete identified acquisitions. Moreover, if such acquisitions require us to seek additional debt or equity financing, we may not be able to obtain such financing on terms favorable to us or at all. Even if we successfully complete an acquisition, we may not be able to assimilate and integrate effectively the acquired business, technologies, solutions, assets, personnel or operations, particularly if key personnel of the acquired company decide not to work for us. Acquisitions may also involve the entry into geographic or business markets in which we have little or no prior experience. Consequently, we may not achieve anticipated benefits of the acquisitions which could harm our operating results. In addition, to complete an acquisition, we may issue equity securities, which would dilute our stockholders’ ownership and could adversely affect the price of our common stock, as well as incur debt, assume contingent liabilities or have amortization expenses and write-downs of acquired assets, which could adversely affect our results of operations. Acquisitions may also reduce our cash available for operations and other uses, which could harm our business.
record future goodwill impairment charges.
Our worldwide operations are subject to political, legal and economic risks and natural disasters, which could have a material adverse effect on us.
We maintain operations around the world, including in the United States, Canada, Europe and Asia. We rely on
third partythird-party wafer foundries in Europe and Asia. Nearly all product assembly and final testing of our products is performed at manufacturing facilities, operated by us as well as
third partythird-party manufacturing facilities, in China, Malaysia and Taiwan. We also have international sales operations. International sales, as a percent of net revenue, were
92%75% in
2012.2015. We expect that international sales will continue to be a significant portion of total sales in the foreseeable future.
The political, legal and economic risks associated with our operations in foreign countries include, without limitation:
changes in a specific country’s or region’s political or economic conditions;
changes in tax laws, trade protection measures and import or export licensing requirements;
difficulties in protecting our intellectual property;
difficulties in managing staffing and exposure to different employment practices and labor laws;
changes in foreign currency exchange rates;
restrictions on transfers of funds and other assets of our subsidiaries between jurisdictions;
changes in freight and interest rates;
disruption in air transportation between the United States and our overseas facilities;
loss or modification of exemptions for taxes and tariffs; and
compliance with U.S. laws and regulations related to international operations, including export control and economic sanctions laws and regulations and the Foreign Corrupt Practices Act.
In addition, our worldwide operations (or those of our business partners) could be subject to natural disasters such as earthquakes, tsunamis, flooding, typhoons and volcanic eruptions that disrupt manufacturing or other operations. For example, our Sunnyvale operations are located near major earthquake fault lines in California. Any conflict or uncertainty in the countries in which we operate, including public health
issues (for example, an outbreak of a contagious disease such as Avian Influenza, measles or
Ebola), safety
issues, natural disasters, fire, disruptions of service from utilities, nuclear power plant accidents or general economic or political factors, could have a material adverse effect on our business. Any of the above risks, should they occur, could result in an increase in the cost of components, production delays, general business interruptions, delays from difficulties in obtaining export licenses for certain technology, tariffs and other barriers and restrictions,
potentially longer payment cycles,
potentially increased taxes, restrictions on the repatriation of funds and the burdens of complying with a variety of foreign laws, any of which could ultimately have a material adverse effect on our business.
Worldwide political conditions may adversely affect demand for our products.
Worldwide political conditions may create uncertainties that could adversely affect our business. The United States has been and may continue to be involved in armed conflicts that could have a further impact on our sales and our supply chain. The consequences of armed conflict, political instability or civil or military unrest are unpredictable, and we may not be able to foresee events that could have a material adverse effect on us. Terrorist attacks or other hostile acts may negatively affect our operations, or adversely affect demand for our products, and such attacks or related armed conflicts may impact our physical facilities or those of our suppliers or customers. Furthermore, these attacks or hostile acts may make travel and the transportation of our products more difficult and more expensive, which could materially adversely affect us. Any of these events could cause consumer spending to decrease or result in increased volatility in the United States economy and worldwide financial markets.
Unfavorable currency exchange rate fluctuations could
continue to adversely affect us.
We have costs, assets and liabilities that are denominated in foreign
currencies, primarily the Canadian dollar.currencies. As a consequence, movements in exchange rates could cause our foreign currency denominated expenses to increase as a percentage of revenue, affecting our profitability and cash flows. Whenever we believe appropriate, we hedge a portion of our short-term foreign currency exposure to protect against fluctuations in currency exchange rates. We determine our total foreign currency exposure using projections of long-term expenditures for items such as payroll. We cannot assure you that these activities will be effective in reducing foreign exchange rate exposure. Failure to do so could have an adverse effect on our business, financial condition, results of operations and cash flow. In addition, the majority of our product sales are denominated in U.S. dollars. Fluctuations in the exchange rate between the U.S. dollar and the local currency can cause increases or decreases in the cost of our products in the local currency of such customers. An appreciation of the U.S. dollar relative to the local currency could reduce sales of our products.
Our inability to effectively control the sales of our products on the gray market could have a material adverse effect on us.
We market and sell our products directly to OEMs and through authorized third-party distributors. From time to time, our products are diverted from our authorized distribution channels and are sold on the “gray market.” Gray market products result in shadow inventory that is not visible to us, thus making it difficult to forecast demand accurately. Also, when gray market products enter the market, we and our distribution channels compete with these heavily discounted gray market products, which adversely affects demand for our products and negatively impact our margins. In addition, our inability to control gray market activities could result in customer satisfaction issues because any time products are purchased outside our authorized distribution channels there is a risk that our customers are buying counterfeit or substandard products, including products that may have been altered, mishandled or damaged, or are used products represented as new.
If we cannot adequately protect our technology or other intellectual property in the United States and abroad, through patents, copyrights, trade secrets, trademarks and other measures, we may lose a competitive advantage and incur significant expenses.
We rely on a combination of protections provided by contracts, including confidentiality and nondisclosure agreements, copyrights, patents, trademarks and common law rights, such as trade secrets, to protect our intellectual property. However, we cannot assure you that we will be able to adequately protect our technology or other intellectual property from third-party infringement or from misappropriation in the United States and abroad. Any patent licensed by us or issued to us could be challenged, invalidated or circumvented or rights granted there under may not provide a competitive advantage to us.
Furthermore, patent applications that we file may not result in issuance of a patent or, if a patent is issued, the patent may not be issued in a form that is advantageous to us. Despite our efforts to protect our intellectual property rights, others may
independently develop similar products, duplicate our products or design around our patents and other rights. In addition, it is difficult to monitor compliance with, and enforce, our intellectual property on a worldwide basis in a cost-effective manner. In jurisdictions where foreign laws provide less intellectual property protection than afforded in the United States and abroad, our technology or other intellectual property may be compromised, and our business would be materially adversely affected.
We are party to litigation and may become a party to other claims or litigation that could cause us to incur substantial costs or pay substantial damages or prohibit us from selling our products.
From time to time, we are a defendant or plaintiff in various legal actions.
We also sellFor example, on January 15, 2014, March 20, 2014, April 27, 2015 and September 29, 2015, complaints were filed against us seeking damages for alleged securities law violations which are described in Note 16 of our consolidated financial statements. Our products
toare purchased by and/or used by consumers, which could increase our exposure to consumer actions such as product liability
claims and consumer class action claims. On occasion, we receive claims that individuals were allegedly exposed to substances used in our former semiconductor wafer manufacturing facilities and that this alleged exposure caused harm. Litigation can involve complex factual and legal questions, and its outcome is uncertain. Any claim that is successfully asserted against us,
including the claims filed against us on January 15, 2014, March 20, 2014, April 27, 2015 and September 29, 2015, may result in the payment of damages that could be material to our business.
With respect to intellectual property litigation, from time to time, we have been notified
of, or third parties may bring or have brought, actions against us and/or against our customers based on allegations that we are infringing
orthe intellectual property rights of others, contributing to
or inducing the infringement of the intellectual property rights
of others, improperly claiming ownership of intellectual property or otherwise improperly using the intellectual property of others. If any such claims are asserted, we may seek to obtain a license under the third parties’ intellectual property rights. We cannot assure you that we will be able to obtain all of the necessary licenses on satisfactory terms, if at all.
In the event that we do not obtain a license, theseThese parties may file lawsuits against us or our customers seeking damages (potentially up to and including treble damages) or an injunction against the sale of products that incorporate allegedly infringed intellectual property or against the operation of our business as presently conducted, which could result in our having to stop the sale of some of our products or to increase the costs of selling some of our products or which could damage our reputation. The award of damages, including material royalty payments, or
other types of damages, or the entry of an injunction against the manufacture and sale of some or all of our products could have a material adverse effect
on us. We could decide, in the alternative, to redesign our products or to resort to litigation to challenge such claims. Such challenges could be extremely expensive and time-consuming regardless of their merit, could cause delays in product release or shipment and/or could have a material adverse effect on us. We cannot assure you that litigation related to our intellectual property rights or the intellectual property rights of others can always be avoided or successfully concluded.
Even if we were to prevail, any litigation could be costly and time-consuming and would divert the attention of our management and key personnel from our business operations, which could have a material adverse effect on us.
Failures
Our business is subject to potential tax liabilities.
We are subject to income taxes in the
global credit markets have impactedUnited States, Canada and
may continue to impactother foreign jurisdictions. Significant judgment is required in determining our worldwide provision for income taxes. In the
liquidityordinary course of our
auction rate securities.Asbusiness, there are many transactions and calculations where the ultimate tax determination is uncertain. Although we believe our tax estimates are reasonable, we cannot assure you that the final determination of December 29, 2012, the par valueany tax audits and litigation will not be materially different from that which is reflected in historical income tax provisions and accruals. Should additional taxes be assessed as a result of allan audit, assessment or litigation, there could be a material adverse effect on our auction rate securities, or ARS, was $37 million with an estimated fair value of $28 million. As of December 29, 2012, our investments in ARS included estimated fair values of approximately $13 million of student loan ARScash, income tax provision and $15 million of municipal and corporate ARS. The uncertaintiesnet income in the credit markets have affected all of our ARS and auctionsperiod or periods for these securities have failed to settle on their respective settlement dates since February 2008. The auctions failed because there was insufficient demand for these securities. A failed auction does not represent a default by the issuer of the ARS. For each unsuccessful auction, the interest ratewhich that determination is reset based on a formula set forth in each security, which is generally higher than the current market unless subject to an interest rate cap. When auctions for these securities fail, the investments may not be readily convertible to cash until a future auction of these investments is successful, a buyer is found outside of the auction process, the issuers of the ARS establish a different form of financing to replace these securities or redeem them, or final payment is due according to contractual maturities (currently, ranging from 2030 to 2050 for our ARS). Although we have had redemptions since the failed auctions began, the liquidity of these investments continues to be adversely impacted.
If market illiquidity worsens, we may be required to record additional impairment charges with respect to these investments in the future, which could adversely impact our results of operations.
The conflict minerals-related provisions of the Dodd-Frank Wall Street Reform and Consumer Protection Act as well as amade.
A variety of environmental laws that we are subject to could result in additional costs and liabilities.
Our operations and properties have in the past
been and continue to be subject to various United States and foreign environmental laws and regulations, including those relating to materials used in our products and manufacturing processes, discharge of pollutants into the environment, the treatment, transport, storage and disposal of solid and hazardous wastes and remediation of contamination. These laws and regulations require us to obtain permits for our operations, including the discharge of air pollutants and wastewater. Although our management systems are designed to maintain compliance, we cannot assure you that we have been or will be at all times in complete compliance with such laws, regulations and permits. If we violate or fail to comply with any of them, a range of consequences could result, including fines, suspension of production, alteration of manufacturing processes, import/export restrictions, sales limitations, criminal and civil liabilities or other sanctions. We could also be held liable for any and all consequences arising out of exposure to hazardous materials used, stored, released, disposed of by us or located at, under or emanating from our facilities or other environmental or natural resource damage.
While we have budgeted for foreseeable associated expenditures, we cannot assure you that future environmental legal requirements will not become more stringent or costly in the future. Therefore, we cannot assure you that our costs of complying with current and future
environmental and health and safety laws, and our liabilities arising from past and future releases of, or exposure to, hazardous substances will not have a material adverse effect on us.
Environmental laws are complex, change frequently and have tended to become more stringent over time. For example, the European Union (EU) and China are two among a growing number of jurisdictions that have enacted restrictions on the use of lead and other materials in electronic products. These regulations affect semiconductor devices and packaging. As regulations restricting materials in electronic products continue to increase around the world, there is a risk that the cost, quality and manufacturing yields of products that are subject to these restrictions, may be less favorable compared to products that are not subject to such restrictions, or that the transition to compliant products may not meet customer roadmaps, or produce sudden changes in demand, which may result in excess inventory. A number of jurisdictions including the EU, Australia and China are developing or have finalized market entry or public procurement regulations for computers and servers based on ENERGY STAR specifications as well as additional energy consumption limits. There is the potential for certain of our products being excluded from some of these markets which could materially adversely affect us.
Certain environmental laws, including the U.S. Comprehensive, Environmental Response, Compensation and Liability Act of 1980, or the Superfund Act, impose strict or, under certain circumstances, joint and several liability on current and previous owners or operators of real property for the cost of removal or remediation of hazardous substances and impose liability for damages to natural resources. These laws often impose liability even if the owner or operator did not know of, or was not responsible for, the release of such hazardous substances. These environmental laws also assess liability on persons who arrange for hazardous substances to be
sent to disposal or treatment facilities when such facilities are found to be contaminated. Such persons can be responsible for cleanup costs even if they never owned or operated the contaminated facility. We have been named as a responsible party at three Superfund sites in Sunnyvale, California. Although we have not yet been, we could be named a potentially responsible party at other Superfund or contaminated sites in the future. In addition, contamination that has not yet been identified could exist at our other facilities.
Environmental laws are complex, change frequently and have tended to become more stringent over time. For example, the European Union (EU) and China are two among a growing number of jurisdictions that have enacted restrictions on the use of lead and other materials in electronic products. Other countries have also implemented similar restrictions. These regulations affect semiconductor devices and packaging. As regulations restricting materials in electronic products continue to increase around the world, there is a risk that the cost, quality and manufacturing yields of products that are subject to these restrictions, may be less favorable compared to products that are not subject to such restrictions, or that the transition to compliant products may produce sudden changes in demand, which may result in excess inventory.
In August 2012, the SEC adopted its final rule to implement Section 1502 of
Under the Dodd-Frank Wall Street Reform and Consumer Protection Act regardingof 2010, the Securities and Exchange Commission (“SEC”) adopted disclosure and reporting requirements for companies whothat use “conflict” minerals minedoriginating from the Democratic Republic of Congo andor adjoining countries in their products, whether or not these products are manufactured by third parties. As there are many sources of these materials, these new requirements are unlikelycountries. We continue to affect the sourcing of minerals used in the manufacture of semiconductor devices but will addincur additional costs associated with complying with the disclosurethese requirements, such as costs related to developing internal controls for the due diligence process, determining the source of any conflict minerals used in our products, auditing the process and reporting to our customers and the US government.SEC. Also, since our supply chain is complex, we may face reputational challenges if we are unable to sufficiently verify the origins of the subject minerals. Moreover, we mayare likely to encounter challenges to satisfy those customers who require that all of the components of our products are certified as conflict free, and if“conflict free.” If we cannot satisfy these customers, they may choose a competitor’s products. Our first “conflict” minerals report covering
Higher health care costs and labor costs could adversely affect our business.
With the
calendar year from January 1, 2013passage in 2010 of the U.S. Patient Protection and Affordable Care Act (the ACA), we are required to
December 31, 2013 is dueprovide affordable coverage, as defined in the ACA, to
the SEC on May 31, 2014.A number of jurisdictions including the EU, Australia and China are developingall employees, or finalizing market entry or public procurement requirements for computers and serversotherwise be subject to a payment per employee based on ENERGY STAR specification as well as additional energy consumption limits. We expect that some of these regulations will be approved and implemented in 2013. If such regulations do not contain recommended modifications as proposed by AMD or industry associations, there is the potential for certain of our microprocessor, chipset and GPU products, as incorporated in desktop and mobile PCs, workstations, servers and other information and communications technology products being excluded from some of these markets which could materially adversely affect us.
While we have budgeted for foreseeable associated expenditures, we cannot assure you that future environmental legal requirements will not become more stringent or costlyaffordability criteria in the future. Therefore, we cannot assure you that ourACA. Additionally, some states and localities have passed state and local laws mandating the provision of certain levels of health benefits by some employers. Increased health care and insurance costs of complying with current and future environmental and health and safety laws, and our liabilities arising from past and future releases of, or exposure to, hazardous substances will notcould have a material adverse effect on us.
Our business is subjectour business. In addition, changes in federal or state workplace regulations could adversely affect our ability to potential tax liabilities.
We are subject to income taxes in the United States, Canada and other foreign jurisdictions. Significant judgment is required in determiningmeet our worldwide provision for income taxes. In the ordinary course of our business, there are many transactions and calculations where the ultimate tax determination is uncertain. Although we believe our tax estimates are reasonable, we cannot assure you that the final determination of any tax audits and litigation will not be materially different from that which is reflected in historical income tax provisions and accruals. Should additional taxes be assessed as a result of an audit or litigation, there could be a material adverse effect on our cash, income tax provision and net income in the period or periods for which that determination is made.
financial targets.
| |
| ITEM 1B. | UNRESOLVED STAFF COMMENTS |
At December
29, 2012,26, 2015, we owned
principal research and development, engineering
and manufacturing
warehousefacilities located in China and manufacturing and administrative facilities located in
the United States, Canada, China, Singapore and Malaysia. These facilities totaled approximately
2.4 million766,000 square
feet.Our main facility with respect to our graphicsfeet and chipset products is located in Markham, Ontario, Canada. This facility consists ofinclude approximately 240,000265,000 square feet of officeassembly, test, mark and research and development space. We occupy two other facilities in Markham, Ontario that comprise over 215,000 square feet, including approximately 65,000 square-feet of manufacturing and warehouse space. We also currently own and operate two microprocessor assembly and test facilities comprising an aggregate of 310,000 square feet.packaging facilities. Our current microprocessor assembly and test facilities are located in Malaysia and China and are described in further detail in the section entitled “Assembly, Test, Mark and Packaging Facilities,” above.
In some cases, we lease
all or a portion of the land on which our facilities are located. We lease approximately
215,000 square feet of land in Singapore for our engineering facilities and 422,000425,000 square feet of land in Suzhou, China for our microprocessor assembly and test facilities.
As of December
29, 2012,26, 2015, we also leased approximately
2.12.23 million square feet of space for
research and development, engineering,
manufacturing,administrative and warehouse
and administrative use, including
our headquarters in Sunnyvale, California, our principal administrative facilities in Austin, Texas, our main facility with respect to graphics and chipset products located in Markham, Ontario, Canada and a number of smaller regional sales offices located in commercial centers near customers, principally in the United States, Latin America, Europe and Asia. These leases expire at varying dates through
2022.We also have approximately 20,000 square feet2028, although some of building space that is currently vacant. We continue to havethese leases include optional renewals. The lease obligations with respect to this space that expire at various dates through 2014. We are actively marketing this space for sublease.
our headquarters in Sunnyvale, California expires in December 2018, and provides for two successive 10-year optional renewals. The lease for our principal administrative facilities in Austin, Texas expires in March 2025, and provides for one 10-year optional renewal. The lease for our facilities in Markham, Ontario, Canada expires in February 2028, and provides for one 5-year optional renewal.
We currently do not anticipate difficulty in either retaining occupancy of any of our facilities through lease renewals prior to expiration or through month-to-month occupancy, or replacing them with equivalent facilities.
We also have approximately 117,000 square feet of building space that is currently vacant. We continue to have lease obligations with respect to portions of this space that expire at various dates through 2018. We are actively marketing portions of our vacant lease space for sublease.
We believe that our existing facilities are suitable and adequate for our present purposes, and that, except as discussed above, the productive capacity of such facilities is substantially being utilized or we have plans to utilize it.
Securities Class Action
On January 15, 2014, a class action lawsuit captioned Hatamian v. AMD, et al., C.A. No. 3:14-cv-00226 (the “Hatamian Lawsuit”) was filed against us in the United States District Court for the Northern District of California. The complaint purports to assert claims against AMD and certain individual officers for alleged violations of Section 10(b) of the Securities Exchange Act of 1934, as amended (the Exchange Act), and Rule 10b-5 of the Exchange Act. The plaintiffs seek to represent a proposed class of all persons who purchased or otherwise acquired our common stock during the period from April 4, 2011 through October 18, 2012. The complaint seeks damages allegedly caused by alleged materially misleading statements and/or material omissions by us and the individual officers regarding our 32nm technology and “Llano” product, which statements and omissions, the plaintiffs claim, allegedly operated to artificially inflate the price paid for our common stock during the period. The complaint seeks unspecified compensatory damages, attorneys’ fees and costs. On July 7, 2014, we filed a motion to dismiss plaintiffs’ claims. On March 31, 2015, the Court denied the motion to dismiss. On May 14, 2015, we filed our answer to plaintiffs’ corrected amended complaint. The discovery process is ongoing. On September 4, 2015, plaintiffs filed their motion for class certification. A court-ordered mediation held in January 2016 did not result in a settlement of the lawsuit.
Based upon information presently known to management, we believe that the potential liability, if any, will not have a material adverse effect on our financial condition, cash flows or results of operations.
Shareholder Derivative Lawsuit
On March 20, 2014, a purported shareholder derivative lawsuit captioned Wessels v. Read, et al., Case No. 1:14-cv-262486 (“Wessels”) was filed against us (as a nominal defendant only) and certain of our directors and officers in the Santa Clara County Superior Court of the State of California. The complaint purports to assert claims against us and certain individual directors and officers for breach of fiduciary duty, waste of corporate assets and unjust enrichment. The complaint seeks damages allegedly caused by alleged materially misleading statements and/or material omissions by us and the individual directors and officers regarding our 32nm technology and “Llano” product, which statements and omissions, the plaintiffs claim, allegedly operated to artificially inflate the price paid for our common stock during the period. On April 27, 2015, a similar purported shareholder derivative lawsuit captioned Christopher Hamilton and David Hamilton v. Barnes, et al., Case No. 5:15-cv-01890 (“Hamilton”) was filed against us (as a nominal defendant only) and certain of our directors and officers in the United States District Court for the Northern District of California. The case was transferred to the judge handling the Hatamian Lawsuit and is now Case No. 4:15-cv-01890. On September 29, 2015, a similar purported shareholder derivative lawsuit captioned Jake Ha v Caldwell, et al., Case No. 3:15-cv-04485 (“Ha”) was filed against us (as a nominal defendant only) and certain of our directors and officers in the United States District Court for the Northern District of California. The lawsuit also seeks a court order voiding the shareholder vote on AMD’s 2015 proxy. The case was transferred to the judge handling the Hatamian Lawsuit and is now Case No. 4:15-cv-04485. The Wessels, Hamilton and Ha shareholder derivative lawsuits are currently stayed.
Based upon information presently known to management, we believe that the potential liability, if any, will not have a material adverse effect on our financial condition, cash flows or results of operations.
We are named as a responsible party on Superfund clean-up orders for three sites in Sunnyvale, California that are on the National Priorities List. Since 1981, we have discovered hazardous material releases to the groundwater from former underground tanks and proceeded to investigate and conduct remediation at these three sites. The chemicals released into the groundwater were commonly used in the semiconductor industry in the United States in the wafer fabrication process prior to 1979.
In 1991,
the Companywe received Final Site Clean-up Requirements Orders from the California Regional Water Quality Control Board relating to the three sites. We have entered into settlement agreements with other responsible parties on two of the orders. During the term of such agreements, other parties have agreed to assume most of the foreseeable costs as well as the primary role in conducting remediation activities under the orders. We remain responsible for additional costs beyond the scope of the agreements as well as all remaining costs in the event that the other parties do not fulfill their obligations under the settlement agreements.
To address anticipated future remediation costs under the orders, we have computed and recorded an estimated environmental liability of approximately
$5.1$4 million and have not recorded any potential insurance recoveries in determining the estimated costs of the cleanup.
Costs could also increase as a result of additional test and remediation obligations imposed by the Environmental Protection Agency or California Regional Water Quality Control Board. The progress of future remediation efforts cannot be predicted with certainty and these costs may change. We believe that the potential liability, if any, in excess of amounts already accrued, will not have a material adverse effect on our financial condition, cash flows or results of operations.
We are a defendant or plaintiff in various actions that arose in the normal course of business. With respect to these matters, based on our current knowledge, we believe that the amount or range of reasonably possible loss, if any, will not, either individually or in the aggregate, have a material adverse effect on our
business, consolidated financial
position,condition, cash flows
andor results of operations.
| |
| ITEM 4. | MINE SAFETY DISCLOSURES |
| |
| ITEM 5. | MARKET FOR REGISTRANT’S COMMON EQUITY, RELATED STOCKHOLDER MATTERS AND ISSUER PURCHASES OF EQUITY SECURITIES |
Our common stock (symbol “AMD”) is listed on The NASDAQ Stock Market (NASDAQ) under the New York Stock Exchange.symbol “AMD”. On February 15, 2013,12, 2016, there were 7,0826,263 registered holders of our common stock, and the closing price of our common stock was $2.71$1.83 per share as reported at New York Stock Exchange. on NASDAQ.
The following table sets forth on a per share basis the high and low intra-day sales prices on
NASDAQ and the New York Stock Exchange for our common stock for the periods indicated:
| | | | | | | | |
| | | High | | | Low | |
Year ended December 29, 2012 | | | | | | | | |
First quarter | | $ | 8.35 | | | $ | 5.35 | |
Second quarter | | $ | 8.21 | | | $ | 5.32 | |
Third quarter | | $ | 5.98 | | | $ | 3.22 | |
Fourth quarter | | $ | 3.41 | | | $ | 1.81 | |
| | |
| | | High | | | Low | |
Year ended December 31, 2011 | | | | | | | | |
First quarter | | $ | 9.58 | | | $ | 7.34 | |
Second quarter | | $ | 9.17 | | | $ | 6.72 | |
Third quarter | | $ | 7.87 | | | $ | 5.07 | |
Fourth quarter | | $ | 6.05 | | | $ | 4.31 | |
|
| | | | | | | |
| | High | | Low |
| Fiscal Year 2015 Quarters Ended: | | | |
| March 28, 2015 | $ | 3.37 |
| | $ | 2.14 |
|
| June 27, 2015 | $ | 2.94 |
| | $ | 2.20 |
|
| September 26, 2015 | $ | 2.63 |
| | $ | 1.61 |
|
| December 26, 2015 | $ | 3.00 |
| | $ | 1.65 |
|
| | High | | Low |
| Fiscal Year 2014 Quarters Ended: | | | |
| March 29, 2014 | $ | 4.60 |
| | $ | 3.29 |
|
| June 28, 2014 | $ | 4.50 |
| | $ | 3.65 |
|
| September 27, 2014 | $ | 4.80 |
| | $ | 3.60 |
|
| December 27, 2014 | $ | 3.66 |
| | $ | 2.35 |
|
Currently, we do not have any plans to pay dividends on our common stock. Under the terms of our
Indentureindentures for
the 8.125%our 6.75% Notes,
our Indenture for the7.00% Notes, 7.75% Notes and
our Indenture for the 7.50% Notes, we are prohibited from paying cash dividends if the aggregate amount of dividends and other restricted payments made by us since entering into each
Indentureindenture would exceed the sum of specified financial measures including fifty percent of consolidated net income as that term is defined in the
Indentures.indentures. We are prohibited from paying cash dividends on our common stock when certain payment conditions (Payment Conditions) are not satisfied. The Payment Conditions include that (i) no default or event of default exists and (ii) at all times during the 45 consecutive days immediately prior to such transaction, event or payment and on a pro forma basis after giving effect to such transaction, event or payment and any incurrence or repayment of indebtedness in connection therewith, the Loan Parties’ excess available cash is greater than the greater of 20% of the total commitment amount and $100 million.
For information about our equity compensation plans, see Part III, Item
12,11, below.
Comparison of Five-Year Cumulative Total Returns
Advanced Micro Devices, S&P 500
Indexand 400 Indicies and S&P 500
and 400 Semiconductor
IndexIndicies
The following graph shows a five-year comparison of cumulative total return on our common stock, the S&P 500
Indexand 400 Indicies and the S&P 500
and 400 Semiconductor
IndexIndicies from December
29, 200723, 2010 through December
29, 2012.26, 2015. The past performance of our common stock is no indication of future performance.
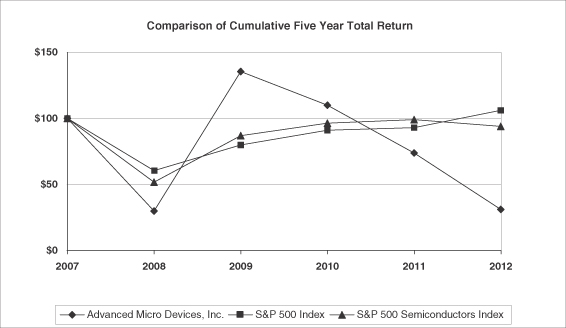
| | | | | | | | | | | | | | | | | | | | | | | | |
| Company / Index | | Base
Period
12/28/2007 | | | Years
Ending
12/27/2008 | | | 12/26/2009 | | | 12/25/2010 | | | 12/31/2011 | | | 12/29/2012 | |
Advanced Micro Devices, Inc. | | | 100 | | | | 29.78 | | | | 135.38 | | | | 109.84 | | | | 73.77 | | | | 31.15 | |
S&P 500 Index | | | 100 | | | | 60.46 | | | | 79.93 | | | | 90.98 | | | | 92.97 | | | | 106.05 | |
S&P 500 Semiconductors Index | | | 100 | | | | 51.72 | | | | 86.81 | | | | 96.25 | | | | 98.93 | | | | 93.80 | |
|
| | | | | | | | | | | |
| | Base Period | Years Ending |
| Company / Index | 12/23/2010 | 12/31/2011 |
| 12/29/2012 |
| 12/28/2013 |
| 12/27/2014 |
| 12/26/2015 |
|
| Advanced Micro Devices, Inc. | 100 | 67.16 |
| 28.36 |
| 47.01 |
| 32.96 |
| 36.32 |
|
| S&P 400 Index | 100 | 97.92 |
| 113.61 |
| 153.35 |
| 170.87 |
| 167.46 |
|
| S&P 400 Semiconductors Index | 100 | 64.18 |
| 64.78 |
| 85.36 |
| 120.47 |
| 128.31 |
|
| S&P 500 Index | 100 | 102.18 |
| 116.56 |
| 156.34 |
| 180.97 |
| 182.36 |
|
| S&P 500 Semiconductors Index | 100 | 102.79 |
| 97.45 |
| 133.56 |
| 186.12 |
| 186.99 |
|
| |
| ITEM 6. | SELECTED FINANCIAL DATA |
Five Years Ended December 29, 201226, 2015 (In millions except per share amounts)
| | | | | | | | | | | | | | | | | | | | |
| | | 2012(1) | | | 2011(1) | | | 2010(1) | | | 2009(1) | | | 2008(1) | |
Net revenue | | $ | 5,422 | | | $ | 6,568 | | | $ | 6,494 | | | $ | 5,403 | | | $ | 5,808 | |
Income (loss) from continuing operations(2)(3)(4)(5)(6) | | | (1,183 | ) | | | 495 | | | | 471 | | | | 296 | | | | (2,412 | ) |
Loss from discontinued operations, net of tax(7) | | | — | | | | (4 | ) | | | — | | | | (3 | ) | | | (684 | ) |
Net income (loss) attributable to AMD common stockholders | | $ | (1,183 | ) | | $ | 491 | | | $ | 471 | | | $ | 304 | | | $ | (3,129 | ) |
Net income (loss) attributable to AMD common stockholders per common share | | | | | | | | | | | | | | | | | | | | |
Basic | | | | | | | | | | | | | | | | | | | | |
Continuing operations | | $ | (1.60 | ) | | $ | 0.68 | | | $ | 0.66 | | | $ | 0.46 | | | $ | (4.03 | ) |
Discontinued operations | | | — | | | | (0.01 | ) | | | — | | | | — | | | | (1.12 | ) |
| | | | | | | | | | | | | | | | | | | | | |
Basic net income (loss) attributable to AMD common stockholders per common share | | $ | (1.60 | ) | | $ | 0.68 | | | $ | 0.66 | | | $ | 0.46 | | | $ | (5.15 | ) |
Diluted | | | | | | | | | | | | | | | | | | | | |
Continuing operations | | $ | (1.60 | ) | | $ | 0.67 | | | $ | 0.64 | | | $ | 0.45 | | | $ | (4.03 | ) |
Discontinued operations | | | — | | | | (0.01 | ) | | | — | | | | — | | | | (1.12 | ) |
| | | | | | | | | | | | | | | | | | | | | |
Diluted net income (loss) attributable to AMD common stockholders per common share | | $ | (1.60 | ) | | $ | 0.66 | | | $ | 0.64 | | | $ | 0.45 | | | $ | (5.15 | ) |
Shares used in per share calculation | | | | | | | | | | | | | | | | | | | | |
Basic | | | 741 | | | | 727 | | | | 711 | | | | 673 | | | | 607 | |
Diluted | | | 741 | | | | 742 | | | | 733 | | | | 678 | | | | 607 | |
Long-term debt, capital lease obligations, less current portion, and other long term liabilities(8) | | $ | 2,065 | | | $ | 1,590 | | | $ | 2,270 | | | $ | 4,947 | | | $ | 5,059 | |
Total assets(9) | | $ | 4,000 | | | $ | 4,954 | | | $ | 4,964 | | | $ | 9,078 | | | $ | 7,672 | |
| | | | | | | | | | | | | | | | | | | | | |
|
| | | | | | | | | | | | | | | | | | | |
| | 2015(1) | | 2014(1) | | 2013(1) | | 2012(1) | | 2011(1) |
| Net revenue | $ | 3,991 |
| | $ | 5,506 |
| | $ | 5,299 |
| | $ | 5,422 |
| | $ | 6,568 |
|
Income (loss) from continuing operations(2)(3)(4)(5)(6)(7) | (660 | ) | | (403 | ) | | (83 | ) | | (1,183 | ) | | 495 |
|
Loss from discontinued operations, net of tax(8) | — |
| | — |
| | — |
| | — |
| | (4 | ) |
| Net income (loss) attributable to AMD common stockholders | $ | (660 | ) | | $ | (403 | ) | | $ | (83 | ) | | $ | (1,183 | ) | | $ | 491 |
|
| Net income (loss) attributable to AMD common stockholders per common share | | | | | | | | | |
| Basic | | | | | | | | | |
| Continuing operations | $ | (0.84 | ) | | $ | (0.53 | ) | | $ | (0.11 | ) | | $ | (1.60 | ) | | $ | 0.68 |
|
| Discontinued operations | — |
| | — |
| | — |
| | — |
| | (0.01 | ) |
| Basic net income (loss) attributable to AMD common stockholders per common share | $ | (0.84 | ) | | $ | (0.53 | ) | | $ | (0.11 | ) | | $ | (1.60 | ) | | $ | 0.68 |
|
| Diluted | | | | | | | | | |
| Continuing operations | $ | (0.84 | ) | | $ | (0.53 | ) | | $ | (0.11 | ) | | $ | (1.60 | ) | | $ | 0.67 |
|
| Discontinued operations | — |
| | — |
| | — |
| | — |
| | (0.01 | ) |
| Diluted net income (loss) attributable to AMD common stockholders per common share | $ | (0.84 | ) | | $ | (0.53 | ) | | $ | (0.11 | ) | | $ | (1.60 | ) | | $ | 0.66 |
|
| Shares used in per share calculation | | | | | | | | | |
| Basic | 783 |
| | 768 |
| | 754 |
| | 741 |
| | 727 |
|
| Diluted | 783 |
| | 768 |
| | 754 |
| | 741 |
| | 742 |
|
Long-term debt and other long term liabilities(9) | $ | 2,118 |
| | $ | 2,140 |
| | $ | 2,175 |
| | $ | 2,065 |
| | $ | 1,590 |
|
| Total assets | $ | 3,109 |
| | $ | 3,767 |
| | $ | 4,337 |
| | $ | 4,000 |
| | $ | 4,954 |
|
| |
(1) | 2012, 2010, 20092015, 2014, 2013 and 20082012 consisted of 52 weeks, whereas 2011 consisted of 53 weeks.
|
| |
(2) | In 2008,2013, we entered into licenses and settlements regarding patent-related matters. Pursuant to these licenses and settlements, we received in aggregate, $48 million, net, which we recorded pre-tax goodwill impairment charges of $1,089 million. within net legal settlements in 2013. |
| |
(3) | In 2009, we entered into a comprehensive settlement agreement with Intel. Pursuant to the settlement agreement, Intel paid us $1,250 million and we recorded a $1,242 million gain, net of certain expenses in 2009. In 2010, we entered into a settlement agreement with Samsung. Pursuant to the settlement agreement, Samsung agreed to pay us $283 million, net of withholding taxes. We recorded this amount as a gain in 2010.
|
(4) | During 2010, we deconsolidated GF and began to account for our ownership interest in GF under the equity method of accounting. We recorded a non-cash gain of $325 million on deconsolidation of GF and a loss of $462 million for our share of GF’s operating results in 2010. During 2011, we changed the method of accounting for our investment in GF from the equity method to the cost method of accounting. As a result of the change, we recognized a non-cash gain of approximately $492 million, net of certain transaction related charges. During the fourth quarter ofIn 2011, we recorded a non-cash impairment charge of approximately $209 million related to our investment in GF.
|
| |
(5)(4)
| During the first quarter of 2012, we entered into a second amendment to ourthe WSA with GFGF. The primary effect of this amendment was to modify certain pricing and other terms of the WSA applicable to wafers for our microprocessor and APU products, to be delivered by GF to us during 2012. As a result of the amendment, we recorded a $703 million charge during the first quarter of 2012. During the fourth quarter of 2012, we entered into a third amendment to the WSAWSA. Pursuant to modifythe third amendment, we modified our wafer purchase commitments for the fourth quarter of 2012 undermade pursuant to the second amendment to the WSA and, inWSA. In addition, we agreed to certain pricing and other terms of the WSA applicable to wafers for our microprocessor and APU products, to be delivered by GF to us duringfrom the fourth quarter of 2012 and through December 31, 2013. InPursuant to the third amendment, GF agreed to waive a portion of our |
| production wafer purchase commitments for the fourth quarter of 2012. In consideration offor this waiver, we agreed to pay GF a fee of $320 million, which resulted in a $273 million lower of cost or market charge recorded in the fourth quarter of 2012. |
| |
(6)(5)
| In 2015, 2014, 2012 2011 and 2008,2011, we implemented restructuring plans and incurred net restructuring charges of $100$53 million, $58 million, $6 million, $100 million and $90$100 million in 2015, 2014, 2013, 2012 and 2011, respectively, which primarily includedconsisted of severance and related employee benefits. |
| |
(6) | In 2015, we exited the dense server systems business, formerly SeaMicro resulting to a charge of $76 million in restructuring and other special charges, net. In 2014, we incurred other special charges of $13 million primarily related to the departure of our former CEO. In 2013, we sold and leased back buildings in various locations and land in Austin, Texas, for which we recorded a net charge of $24 million in other special charges. |
| |
(7) | In 2014, we recorded a goodwill impairment charge of $233 million related to our Computing and Graphics segment. Also in 2014, we recorded a $58 million lower of cost or market inventory adjustment related to our second generation APU products. |
| |
(8) | In 2008, we sold our Digital Television business to Broadcom Corporation for $141.5 million and classified it as discontinued operations. In 2011, we recorded a charge of $4 million in connection with a payment to Broadcom related to this asset sale. |
| |
(8)(9)
| Total long-term debt capital leaseand other long term liabilities increased by $110 million from 2012 to 2013, primarily due to obligations less currentassociated with the license of $157 million of new technology and software, partially offset by the repurchase of $50 million in principal amount of our 6.00% Notes (which is a portion of our outstanding 6.00% Notes). Total long-term debt and other long term liabilities increased by $475 million from 2011 to 2012, primarily due to an issuance of $500 million principal amount of our 7.50% Senior Notes due 2022. Total long-term debt, capital lease obligations, less current portion, and other long term liabilities decreased by $680 million from 2010 to 2011, primarily due to the repurchase of $200 million principal amountNotes. See Note 10 of our 6.00% Convertible Senior Notes due 2015 in 2011 and reclassification of the $485 million principal amount outstanding of our 5.75% Convertible Senior Notes due 2012 to the current portion of long-term debt. Total long-term debt, capital lease obligations, less current portion, and other long term liabilities decreased by $2,677 million from 2009 to 2010, primarily due to the deconsolidation of GF and the repurchase of $1,016 million principal amount of our 6.00% Notes in 2010. consolidated financial statements for additional information. |
(9) | Total assets decreased by $4,114 million from 2009 to 2010, primarily due to the deconsolidation of GF. Total assets increased by $1,406 million from 2008 to 2009, primarily due to higher cash, cash equivalents and marketable securities due to the cash received, including GF’s cash, which we consolidated in connection with the consummation of the GF manufacturing joint venture transaction.
|
| |
| ITEM 7. | MANAGEMENT’S DISCUSSION AND ANALYSIS OF FINANCIAL CONDITION AND RESULTS OF OPERATIONS |
The following discussion should be read in conjunction with the consolidated financial statements as of December
29, 201226, 2015 and December
31, 201127, 2014 and for each of the three years in the period ended December
29, 201226, 2015 and related notes, which are included in this
Annual Report on Form 10-K as well as with the other sections of this
Annual Report on Form 10-K, including “Part I, Item 1: Business,” “Part II, Item 6: Selected Financial
Data,”Data” and “Part II, Item 8: Financial Statements and Supplementary Data.”
We are a global semiconductor company
with facilities around the world. Within the global semiconductor industry, we offer primarily:primarily offering: | |
| (i) | x86 microprocessors, as a standalone devicescentral processing unit (CPU) or as incorporated asinto an APU,accelerated processing unit (APU), chipsets, and discrete graphics processing units (GPUs) for the consumer, commercial and consumer markets, embedded microprocessors for commercial, commercial client and consumer markets and chipsets for desktop and mobile devices, including mobile PCs and tablets, professional workstations and servers;graphics markets; and |
| |
| (ii) | graphics, videoserver and multimediaembedded CPUs, GPUs and APUs, and semi-custom System-on-Chip (SoC) products for desktop and mobile devices, including mobile PCs and tablets, home media PCs and professional workstations, servers and technology for game consoles. |
In this MD&A, we will describe the results of operations and the financial condition for
Advanced Micro Devices, Inc.us and our consolidated subsidiaries, including a discussion of our results of operations for
20122015 compared to
20112014 and
20112014 compared to
2010,2013, an analysis of changes in our financial condition and a discussion of our contractual obligations and off balance sheet arrangements.
References in this Item 7 and in Item 8, “Financial Statements and Supplementary Data,” to “us,” “our,” or “AMD” include the operating results of AMD and our consolidated subsidiaries.
We faced a challenging
yearbusiness environment in 2015. The impact of global macro-economic conditions, especially the volatility in the Greater China region contributed to a decrease in demand for our
industry and for AMD. The significant macroeconomic issues and unprecedented level and pace of change occurring across the industry magnified the challenges inproducts. Additionally, competitive pressures contributed to an overall challenging year. We also experienced reduced demand from our
business and negatively impacted our 2012 financial results. In the second half of 2012, in particular, broader macroeconomic issues and changing PC dynamics impacted demand for end-user PC products. Weakness in the global economy, a reluctance on the part of OEMs to build inventoryOriginal Equipment Manufacturers (“OEM”) customers in advance of
Microsoft’s Windows 8™the launch
and the increasing popularity of
tablets as a consumer device of choice contributed to the challenging business environment. As a result, we faced a difficult selling environment, which adversely affected our 2012 financial performance.Microsoft Windows® 10. Net revenue for 20122015 was $5.4approximately $4.0 billion, a decrease of 17%28% compared to 20112014 net revenue of $6.6$5.5 billion. The decrease in net revenue from 2014 was due to a 42% decrease in Computing and Graphics segment revenue and an 8% decrease in Enterprise, Embedded and Semi-Custom segment revenue. Computing and Graphics segment revenue declined year-over-year primarily due to lower client processor sales. Enterprise, Embedded and Semi-Custom segment revenue declined year-over-year primarily due to lower server and embedded revenue and lower game console royalties, partially offset by higher semi-custom SoC sales. Gross margin, as a percentage of net revenue for 20122015, was 23%27% compared to 45%33% in 2011.2014. Gross margin in 2012 included the following charges, which resulted in a negative impact of 22% in 2012: a $273 million Lower Cost or Market (LCM) charge, a $703 million charge related to a limited waiver of exclusivity from GF and a $5 million charge related to a legal settlement. Gross margin in 2011 included a $24 million charge recorded in connection with a payment to GF, primarily related to certain GF manufacturing assets, and a $5 million charge related to a legal settlement. Absent the effects of these events, which we believe are not indicative of our ongoing operating performance, our gross margin would have been 41% in 2012 compared to 45% in 2011. Gross margin in 20122015 was adversely impacted by an inventory write-down of $100$65 million, duringwhich was primarily the result of lower anticipated demand for older-generation APUs and a technology node transition charge of $33 million. The impact of the write-down accounted for approximately two gross margin percentage points and the technology node transition charge accounted for approximately one gross margin percentage point. Gross margin in 2015 was also adversely impacted by a lower proportion of revenue from Computing and Graphics segment due to lower sales which has a higher average gross margin than our Enterprise, Embedded and Semi-Custom segment and due to lower game console royalties. Gross margin in 2014 included a $58 million lower of cost or market inventory adjustment, which accounted for one gross margin percentage point, and a $27 million benefit from technology licensing revenue, which accounted for less than one gross margin percentage point. Operating loss for 2015 was $481 million compared to an operating loss of $155 million in 2014. The decline in operating performance in 2015 compared to 2014 was primarily due to a decrease in net revenue and in gross margin as described above.
Despite the challenging business environment, we made important changes to our business. During 2015, we continued to focus on introducing a more diverse product portfolio. As part of our long-term strategy to deliver great products, we introduced a number of new products in 2015 including, our 6th Generation AMD A-Series mobile processors (formerly codenamed “Carrizo”) in a SoC design and introduced a desktop A-series processor, the AMD A10-7870K APU. We also introduced the A8-7670K APU designed to support Windows® 10, mainstream workloads and online gaming. With respect to our graphics products, we introduced the new AMD Radeon™ R9 Fury X and R9 Fury graphics, the AMD Radeon R7 300 and R9 300 series graphics as well as the AMD Radeon M300 series graphics to reinforce our graphics leadership in both power efficiency for notebooks and best-in class performance for desktops. We also expanded our AMD FirePro™ server GPU family by introducing the AMD FirePro S9170, designed for high performance compute (HPC) environments. The AMD FirePro S9170 is based on second-generation AMD Graphics Core Next (GCN) GPU architecture and a unified scalable GPU optimized for graphics and compute. We announced the AMD FirePro W4300 graphics card designed for Computer-Aided Design (CAD) for both small and full-size workstations. We also launched the AMD Radeon R9 Nano, a small-form-factor mini-ITX enthusiast graphics card designed to deliver energy efficiency and performance for ultra-high resolutions, improved virtual reality experiences and smoother gameplay. With respect
to our embedded products, we introduced the AMD Embedded R-Series SOC processor designed for digital signage, retail signage, medical imaging, electronic gaming, media storage and communications and networking.
During 2015, we continued to focus on reducing our expenses. Our operating expenses in 2015 decreased to $1.56 billion, from $1.99 billion in 2014. Our operating expenses in 2014 included a goodwill impairment charge of $233 million. We also took steps to simplify our business and better align resources around our priorities and business outlook. In the third quarter of
2012 as a result of lower than anticipated future demand for certain products as well as lower average selling price for microprocessor products due to the challenging macroeconomic conditions described above. Our operating loss for 2012 was $1.06 billion compared to operating income of $368 million in 2011. Our net loss for 2012 was $1.18 billion compared to net income of $491 million for 2011. Cash, cash equivalents and marketable securities, including long-term marketable securities, as of December 29, 2012 were $1.2 billion compared to $1.9 billion at December 31, 2011.As part of our strategy to respond to the macroeconomic issues and the changes occurring in our industry, during 2012,2015, we made key strategic investments to align our business to a changing computing landscape and to position ourselves to take advantage of new opportunities in adjacent high-growth markets. In March 2012, we acquired SeaMicro, Inc. (SeaMicro), an energy-efficient, high-bandwidth micro-server company, to accelerate our strategy to deliver differentiated micro-server solutions to cloud data centers. In June 2012, we, along with ARM, Imagination Technologies, Media Tek, Qualcomm, Samsung and Texas Instruments established the Heterogeneous System Architecture (HSA) Foundation, a non-profit consortium established to define and promote an open standards-based approach to heterogeneous computing. In October 2012, we announced that we will design 64-bit ARM® technology-based processors in addition to our x86 processors for multiple markets, starting with cloud and data center servers. We expect our first ARM technology-based processor will be a highly-integrated, 64-bit multicore system-on-a-chip optimized for the dense, energy-efficient servers. The first ARM technology-based AMD Opteron processor for servers is targeted for production in 2014 and is expected to integrate our AMD SeaMicro Freedom supercompute fabric.
In addition, in the fourth quarter of 2012, we announcedimplemented a restructuring plan to improve our cost structure and enhance our competitiveness in core growth areas. This restructuring plan primarily involves(2015 Restructuring Plan). The 2015 Restructuring Plan provides for a workforce reduction of our global workforceapproximately 5% and includes organizational actions such as outsourcing certain IT services and application development. The 2015 Restructuring Plan also anticipates a charge for the consolidation of certain real estate facilities. We realized operational savings, primarily in operating expenses, of approximately 14% as well as asset impairments and facility consolidations.$8 million in 2015. We expect the restructuring action will2015 Restructuring Plan to result in operational savings, primarily in operating expenses, of approximately $190$48 million in 2013.
Further, to better align with today’s PC market dynamics,2016.
On October 15, 2015, we entered into an Equity Interest Purchase Agreement (the Equity Interest Purchase Agreement) with Nantong Fujitsu Microelectronics Co., Ltd., a third amendmentChinese joint stock company (JV Party), under which we will sell to JV Party a majority of the WSAequity interests in AMD Technologies (China) Co. Ltd., a wholly-foreign owned enterprise incorporated as a limited liability company (the Chinese Target Company), and Advanced Micro Devices Export Sdn. Bhd., a Malaysian limited liability company (the Malaysian Target Company and, together with GF. Pursuantthe Chinese Target Company, the Target Companies), thereby forming two joint ventures (collectively, the JVs) with JV Party in a transaction valued at approximately $436 million (the Transaction). The JV Party will acquire 85% of the equity interests in each JV for approximately $371 million and we estimate we will receive approximately $320 million cash, net of taxes and other customary expenses. After closing, JV Party’s affiliates will own 85% of the equity interests in each JV while certain of our subsidiaries will own the remaining 15%. The Transaction will result in the JVs providing assembly, testing, marking, packing and packaging services (ATMP) to us. We plan to account for our investment in the third amendment, we modified our wafer purchase commitments for the fourth quarter of 2012JVs under the second amendmentequity method of accounting.
Our cash, cash equivalents and marketable securities as of December 26, 2015 were $785 million compared to
the WSA. In addition, we agreed$1.0 billion as of December 27, 2014. Total debt as of December 26, 2015 was $2.26 billion, compared to
certain pricing and other terms applicable to wafers for our microprocessor and APU products to be delivered by GF to us during 2013 and through$2.2 billion as of December
31, 2013. Pursuant to the third amendment, we committed to purchase a fixed number of production wafers at negotiated prices in the fourth quarter of 2012 and through December 31, 2013. GF agreed to waive a portion of our wafer purchase commitments for the fourth quarter of 2012. In consideration of this waiver, we agreed to pay GF a fee of $320 million. As a result, we recorded a $273 million LCM charge in the fourth quarter of 2012. The cash impact of this $320 million fee will be spread over several quarters, with $80 million that was paid by December 28, 2012 and $40 million payable by April 1, 2013. For the remainder of the fee, on the same date we entered into the third amendment, we issued a $200 million promissory note to GF that matures on December 31, 2013. Under the third amendment to the WSA, we committed to purchase from GF wafers for approximately $1.15 billion in 2013 and $250 million during the first quarter of27, 2014.
We expect to negotiate the remainder of our 2014 purchase commitments from GF in 2013.Despite the challenging macroeconomic environment, we continued to focus on executing our engineering milestones. We launched our next AMD A-Series APU, codenamed “Trinity,” and our next generation AMD E-Series APU, codenamed “Brazos 2.0.” We also announced our AMD Z-60 APU, codenamed “Hondo,” our lowest powered APU designed for the performance tablet and small form factor PC market. We launched our AMD Opteron™ 3200, 4300 and 3300 Series server processor platforms based on our next-generation “Piledriver” core architecture. We announced AMD’s SeaMicro SM15000 server chassis, which extends fabric-based computing across racks and aisles of the data center to connect directly to large data storage systems. With respect to our graphics products, we launched our AMD Radeon™ HD 7950 graphics processor, and our AMD Radeon HD 7700 and 7800 series graphics processors, all based on 28nm process technology and designed for enthusiast desktop gamers.
Formation and Accounting
in 2009On March 2, 2009, we consummated the transactions contemplated by the Master Transaction Agreement among us, Advanced Technology Investment Company LLC
(ATIC),(currently known as Mubadala Technology Investments LLC (Mubadala Tech) and West Coast Hitech L.P. (WCH), pursuant to which we formed GF.
Based onIn connection with the
structureconsummation of the
transactiontransactions contemplated by the Master Transaction Agreement, AMD, Mubadala Tech and
the guidanceGF entered into a Wafer Supply Agreement (the WSA), a Funding Agreement (the Funding Agreement) and a Shareholders’ Agreement (the Shareholders’ Agreement) on
accounting forinterests in variable interest entities, duringMarch 2, 2009.
At GF’s formation on March 2, 2009 and through December 26, 2009, GF was deemed a variable-interest entity, and we were deemed to be theGF’s primary beneficiary. Therefore,Accordingly, we consolidated GF under applicable accounting rules. As a result of certain GF governance changes, we deconsolidated GF and accounted for our GF ownership under the accountsequity method of accounting as of December 27, 2009. Following the deconsolidation, GF became our related party.
In the first quarter of 2011, as a result of a contribution to GF by an affiliate of Mubadala Tech and certain GF governance changes noted above, our ownership in GF was diluted, and we concluded that we no longer had the ability to exercise significant influence over GF. Accordingly, we changed our accounting for our investment in GF from the equity method to the cost method of accounting and recognized a dilution gain in investee of approximately $492 million. In the fourth quarter of 2011, we identified indicators of impairment in GF that were deemed other than temporary. We performed a valuation analysis and recorded a non-cash impairment charge of $209 million. The carrying value of our remaining investment in GF after the impairment charge was $278 million as of December 31, 2011.
On March 4, 2012, as partial consideration for certain rights received under a second amendment to the WSA, we transferred to GF all of the remaining capital stock of GF
fromthat we owned. In addition, as of March
2, 2009 through December 26, 2009.At4, 2012, the Closing, AMD, ATIC and GF also entered into a Shareholders’ Agreement (the Shareholders’ Agreement), a Funding Agreement (the Funding Agreement),was terminated, and a Wafer Supply Agreement (the WSA).
Shareholders’ Agreement. The Shareholders’ Agreement set forth the rights and obligations of AMD and ATIC as shareholders of GF. The initial GF board of directors (GF Board) consisted of eight directors, and AMD and ATIC each designated four directors. Wewe were no longer a party to the Shareholders’ AgreementAgreement. As a result of these transactions, we no longer owned any GF capital stock as of March 4, 2012.
Funding Agreement. The Funding Agreement provided for the funding
GF continues to be a related party of
GFus because Mubadala Development Company PJSC (Mubadala) and
governed the termsMubadala Tech are affiliated with WCH, our largest stockholder. WCH and
conditions under which ATIC was obligated to provide such funding. We were no longer a party to the Funding Agreement asMubadala Tech are wholly-owned subsidiaries of
March 4, 2012.Mubadala.
Wafer Supply Agreement.Agreement
The WSA governs the terms by which we purchase products manufactured by GF. Pursuant to the WSA,
during 2010, we
purchased substantiallyare required to purchase all of our microprocessor
unit (MPU)and APU product requirements, and a certain portion of our GPU product requirements from
GF. During 2010, we paid GF
for wafers on a cost-plus basis.with limited exceptions. If we acquire a third-party business that manufactures
MPUmicroprocessor and APU products, we will have up to two years to transition the manufacture of such
MPUmicroprocessor and APU products to GF.
The WSA terminates no later than March 2, 2024. GF has agreed to use commercially reasonable efforts to assist us to transition the supply of products to another provider and to continue to fulfill purchase orders for up to two years following the termination or expiration of the WSA. During the transition period, pricing for microprocessor
and APU products will remain as set forth in the WSA, but our purchase commitments to GF will no longer apply.
This agreement has been subsequently modified, as disclosed below.Governance Changes, Funding and Accounting in 2010Deconsolidation of GF
On December 18, 2009, ATIC International Investment Company (ATIC II) acquired Chartered Semiconductor Manufacturing Ltd. (Chartered). On December 28, 2009, with our consent, ATIC II, Chartered and GF entered into a Management and Operating Agreement (MOA), which provided for the joint management and operation of GF and Chartered, thereby allowing GF and Chartered to share costs, take advantage of operating synergies and market wafer fabrications services on a collective basis. In order to allow for the signing of the MOA on December 28, 2009, prior to obtaining any regulatory approvals, we agreed to irrevocably waive rights under the Shareholders Agreement with respect to certain matters that require unanimous GF Board approval. Additionally, if any such matters came before the GF Board, we agreed that our designated GF directors will vote in the same manner as the majority of ATIC-designated GF Board members voting on any such matters. As a result of waiving such approval rights, as of December 28, 2009, for financial reporting purposes we no longer shared control with ATIC over GF.
In June 2009, the FASB issued an amendment to improve financial reporting by enterprises involved with variable interest entities. Based on the results of our evaluation and in light of the governance changes whereby we believed we only had protective rights relative to the operations of GF, we concluded that the other investor in GF, ATIC, was the party who had the power to direct the activities of GF that most significantly impact GF’s performance and was, therefore, the primary beneficiary of GF. Accordingly, effective as of December 27, 2009, we deconsolidated GF, and during 2010 we accounted for our ownership interest in GF under the equity method of accounting. For purposes of our application of the equity method of accounting during 2010, we recorded our share of GF’s results excluding the results of Chartered because GF did not have an equity ownership interest in Chartered. The terms of the Funding Agreement and the WSA described above were not affected by the deconsolidation of GF. Following the deconsolidation, GF became our related party.
Funding of GF
During 2010, ATIC contributed $930 million of cash to GF. We did not participate in the funding. These contributions resulted in an aggregate gain on our ownership interest of $232 million, which we recorded as part of the equity in net loss of investee line item on our consolidated statement of operations.
Contribution Agreement, Funding and Accounting in 2011
GLOBALFOUNDRIES Singapore Pte. Ltd. (GFS, formerly Chartered) Contribution in 2011
On December 27, 2010, pursuant to the Contribution Agreement, ATIC International Investment Company LLC, an affiliate of ATIC, contributed all of the outstanding Ordinary Shares of GFS to GF. As the result of dilution of our ownership in GF, during the first quarter of 2011 and the year ended December 31, 2011, we recognized a non-cash gain of approximately $492 million, net of certain transaction related charges, in Equity income (loss) and dilution gain in investee, net.
Following the GFS contribution and governance changes described above, we assessed our ability to exercise significant influence over GF and considered factors such as our representation on GF’s board of directors, participation in GF’s policy-making processes, material intra-entity transactions, interchange of managerial personnel, technological dependency, and the extent of our ownership in relation to ownership by the other shareholders. Based on the results of our assessment, we concluded that we no longer had the ability to exercise significant influence over GF. Accordingly, as of the first quarter of 2011, we changed our method of accounting for our ownership interest in GF from the equity method to the cost method of accounting.
Under the cost method of accounting, we no longer recognized any share of GF’s net income or loss in our consolidated statement of operations. In addition, we reviewed the carrying value of our investment in GF for impairment at each reporting period. Impairment indicators, among other factors, include significant deterioration in GF’s earnings performance or business prospects, significant changes in the market conditions in which GF operates, and GF’s ability to continue as a going concern.
Impairment of Investment in GF
During the fourth quarter of 2011, we identified indicators of impairment, including revised financial projections which we received from GF. The fair value of our GF investment was determined by a valuation analysis of GF’s Class A Preferred Shares, utilizing the revised financial projections. We concluded the decline in fair value was other than temporary. As a result of the valuation analysis, we recorded a non-cash impairment charge of approximately $209 million, based on the difference between the carrying value and the fair value of the investment as of December 31, 2011. As of December 31, 2011, our investment balance in GF after impairment was $278 million.
Amended Wafer Supply Agreement
On April 2, 2011, we entered into a first amendment to the WSA. The primary effect of the first amendment was to change the pricing methodology applicable to wafers delivered in 2011 for our microprocessors, including APU products. The first amendment also modified our existing commitments regarding the production of certain GPU and chipset products at GF. Pursuant to the first amendment, GF committed to provide us with, and we committed to purchase, a fixed number of 45nm and 32nm wafers per quarter in 2011. We paid GF a fixed price for 45nm wafers delivered in 2011. Our price for 32nm wafers varied based on the wafer volumes and manufacturing yield of such wafers and was based on good die. In addition, we also agreed to pay an additional quarterly amount to GF during 2012 totaling up to $430 million if GF met specified conditions related to the continued availability of 32nm capacity as of the beginning of 2012. As part of the second amendment described below, GF agreed to waive these quarterly payments, and therefore we are no longer required to pay them.
Amendments to Wafer Supply Agreement and Accounting in 2012
Second Amendment to Wafer Supply Agreement
On March 4, 2012, we entered into a second amendment to the WSA with GF. The primary effect of this second amendment was to modify certain pricing and other terms of the WSA applicable to wafers for our microprocessor and APU products to be delivered by GF to us during 2012. Pursuant to the second amendment, GF committed to provide us with, and we committed to purchase, a fixed number of production wafers in 2012. We paid GF fixed prices for production wafers delivered in 2012.
The second amendment also granted us certain rights to contract with another wafer foundry supplier with respect to specified 28 nm products for a specified period of time. In consideration for these rights, we agreed to pay GF $425 million and transfer to GF all of the capital stock of GF that we owned. As a result of us receiving these rights in the first quarter of 2012, we recorded a charge related to this limited waiver of exclusivity from GF of $703 million consisting of the $425 million cash payment and a $278 million non-cash charge representing the carrying and fair value of the capital stock that we transferred to GF. Pursuant to the second amendment, $150 million of the $425 million was paid on March 5, 2012, $50 million was paid on June 29, 2012 and $50 million was paid on October 1, 2012 with the remaining $175 million paid by December 31, 2012. In addition, as security for the final two payments, we issued a $225 million promissory note to GF.
As a result of the transfer of our shares of GF capital stock, we no longer owned any GF capital stock. Also, we are no longer entitled to designate a director to GF’s board, and our designated director resigned effective as of the date of the second amendment. As of March 4, 2012, we were no longer a party to either the Shareholders’ Agreement or the Funding Agreement.
Third Amendment to Wafer Supply Agreement
. On December 6, 2012, we entered into a third amendment to the WSA with GF.WSA. Pursuant to the third amendment, we modified our wafer purchase commitments for the fourth quarter of 2012 undermade pursuant to the second amendment to the WSA. In addition, we agreed to certain pricing and other terms of the WSA applicable to wafers for our microprocessor and APU products, to be delivered by GF to us during 2013 andfrom the fourth quarter of 2012 through December 31, 2013. Pursuant to the third amendment, we committed to purchase a fixed number of production wafers at negotiated prices in the fourth quarter of 2012 and through December 31, 2013. GF agreed to waive a portion of our wafer purchase commitments for the fourth quarter of 2012. In consideration offor this waiver, we agreed to pay GF a fee of $320 million. As a result, we recorded an LCMa lower of cost or market charge of $273 million for the write-down of inventory to its market value in the fourth quarter of 2012. The cash impact of this $320 million fee will be spreadwas paid over several quarters, with $80 million paid byon December 28, 2012, and $40 million bypaid on April 1, 2013. For the remainder of the fee, we issued a2013 and $200 million promissory note to GF that maturespaid on December 31, 2013.
GF continues
Fourth Amendment to Wafer Supply Agreement. On March 30, 2014, we entered into a fourth amendment to the WSA. The primary effect of the fourth amendment was to establish volume purchase commitments and fixed pricing for the 2014 calendar year as well as to modify certain other terms of the WSA applicable to wafers for some of our microprocessor, graphics processor and semi-custom game console products to be delivered by GF to us during the 2014 calendar year.
Fifth Amendment to Wafer Supply Agreement. On April 16, 2015, we entered into a related partyfifth amendment to the WSA. The primary effect of AMD. Our expenses relatedthe fifth amendment was to GF’sestablish volume purchase commitments and fixed pricing for the 2015 calendar year as well as to modify certain other terms of the WSA applicable to wafers for some of our microprocessor unit, graphics processor unit and semi-custom products to be delivered by GF to us during the 2015 calendar year.
As of December 26, 2015, certain wafer manufacturingdeliveries under the fifth amendment to the WSA have been delayed until fiscal 2016. As of December 26, 2015, purchase obligations for fiscal 2016 were $1.2 billion, $904approximately $248 million, of which approximately $185 million, consisting of wafers and $1.2 billion in 2012, 2011 and 2010. Our expenses related to GF’s research and development activities, were $49received by December 31, 2015.
We generally negotiate our purchase commitments with GF on an annual basis and as such we cannot meaningfully quantify or estimate our future purchase obligations to GF. We are currently in the process of negotiating a sixth amendment to the WSA, and we expect that our future purchases from GF will continue to be material.
Our total purchases from GF related to wafer manufacturing and research and development activities were approximately $0.9 billion for 2015 and approximately $1 billion for each 2014 and 2013, respectively.
Equity Interest Purchase Agreement
On October 15, 2015, we entered into an Equity Interest Purchase Agreement (the Equity Interest Purchase Agreement) with Nantong Fujitsu Microelectronics Co., Ltd., a Chinese joint stock company (JV Party), under which we will sell to JV Party a majority of the equity interests in AMD Technologies (China) Co. Ltd., a wholly-foreign owned enterprise incorporated as a limited liability company (the Chinese Target Company), and Advanced Micro Devices Export Sdn. Bhd., a Malaysian limited liability company (the Malaysian Target Company and, together with the Chinese Target Company, the Target Companies), thereby forming two joint ventures (collectively, the JVs) with JV Party in a transaction valued at approximately $436 million (the Transaction). The JV Party will acquire 85% of the equity interests in each JV for approximately $371 million and we estimate we will receive approximately $320 million cash, net of taxes and other customary expenses. After closing, JV Party’s affiliates will own 85% of the equity interests in each JV while certain of our subsidiaries will own the remaining 15%. The Transaction will result in the JVs providing assembly, testing, marking, packing and packaging services (ATMP) to us. We plan to account for our investment in the JVs under the equity method of accounting.
The Equity Interest Purchase Agreement also has related agreements including: (i) with respect to the Malaysian Target Company, a Shareholders’ Agreement, and with respect to the Chinese Target Company, a Joint Venture Contract governing the joint venture relationships from and after the Closing, (ii) an IP License Agreement, (iii) a Manufacturing Services Agreement, (iv) a Transition Services Agreement, and (v) a Trademark License Agreement.
The transaction is expected to close in the first half of 2016, pending all regulatory and other approvals.
As a result of the decision to form the above JVs, the balance sheet as of December 26, 2015, reflects held-for-sale accounting of the ATMP assets and liabilities which requires reclassification of such financial amounts to current assets and current liabilities. We reclassified $183 million to other current assets and $79 million
to other current liabilities. Asset balances reclassified into other current assets primarily consist of property, plant, and
$114equipment of $110 million,
for 2012, 2011goodwill of $42 million and
2010.inventory of $15 million. Liability balances reclassified into other current liabilities primarily consist of accounts payable of $70 million. The balances included in the final gain/(loss) calculation, at closing, are likely to be different due to normal operational activities occurring through the closing date.
Critical Accounting Estimates
Our discussion and analysis of our financial condition and results of operations are based upon our consolidated financial statements, which have been prepared in accordance with
GAAP.U.S. generally accepted accounting principles (U.S. GAAP). The preparation of our financial statements requires us to make estimates and judgments that affect the reported amounts in our consolidated financial statements. We evaluate our estimates on an on-going basis, including those related to our revenue, inventories,
assetgoodwill impairments and income taxes. We base our estimates on historical experience and on various other assumptions that we believe to be reasonable under the circumstances, the results of which form the basis for making judgments about the carrying values of assets and liabilities. Although actual results have historically been reasonably consistent with management’s expectations, the actual results may differ from these estimates or our estimates may be affected by different assumptions or conditions.
Management believes the following critical accounting estimates are the most significant to the presentation of our financial statements and require the most difficult, subjective and complex judgments.
Revenue Allowances. We record a provision for estimated sales returns and allowances on product sales for estimated future price reductions and other customer incentives in the same period that the related revenues are recorded. We base these estimates on actual historical sales returns, historical allowances, historical price reductions, market activity and other known or anticipated trends and factors. These estimates are subject to management’s judgment and actual provisions could be different from our estimates and current provisions, resulting in future adjustments to our revenuesrevenue and operating results. Inventory Valuation. At each balance sheet date, we evaluate our ending inventories for excess quantities and obsolescence.obsolescence based on projected sales outlook. This evaluation includes analysis of historical sales levels by product and projections of future demand. These projections assist us in determining the carrying value of our inventory. In addition, we write off inventories that are consideredwe consider obsolete. We adjust the remaining specific inventory balances to approximate the lower of our standard manufacturing cost or market value. Among other factors, management considers forecasted demand in relation to the inventory on hand, competitiveness of product offerings, market conditions and product life cycles when determining obsolescence and market value. If, in any period, we anticipate future demand or market conditions to be less favorable than our previous estimates, additional inventory write-downs may be required and would be reflected in cost of sales in the period the revision is made. This would have a negative impact on our gross margin in that period. If in any period we are able to sell inventories that were not valued or that had been written offdown in a previous period, related revenues would be recorded without any offsetting charge to cost of sales, resulting in a net benefit to our gross margin in that period. Goodwill. Goodwill represents the excess of the purchase price over the fair value of net tangible and identifiable intangible assets acquired. Goodwill is not amortized, but rather is tested for impairment at least annually, or more frequently if there are indicators of impairment present.
We perform thean annual goodwill impairment analysis as of the first day of the fourth quarter of each fiscal year. We evaluate whether goodwill has been impaired at the reporting unit level by first determining whether the estimated fair value of the reporting unit is less than its carrying value and, if so, by determining whether the implied fair value of goodwill within the reporting unit is less than the carrying value. The implied fair value of a reporting unit is determined through the application of one or more valuation models common to our industry, including the income, market and cost approaches. While market valuation data for comparable companies is gathered and analyzed, we believe that there has not been sufficient comparability between the peer groups and the specific reporting units to allow for the derivation of reliable indications of value using a market approach. Therefore, we have ultimately employed the income approach which requires estimates of present value of estimated future cash flows. Cash flow projections are based on management’s estimates of revenue growth rates and operating resultsmargins, taking into consideration industry and cash flows of each of the reporting units, discounted using estimated discount rates.market condition. The key assumptions we have used to determine the fair value of our reporting units includes projected cash flows for the next 10 years and discount rates ranging from 15%13% to 30%. Discount rates are35% from 2013 to 2015. The discount rate used is based on ourthe weighted-average cost of capital adjusted for the risksrelevant risk associated with operations.business-specific characteristics and the
uncertainty related to the reporting unit’s ability to execute on the projected cash flows. A variance in the discount rate could have a significant impact on the amount of the goodwill impairment charge recorded, if any.
Estimating the fair value of a reporting unit is judgmental in nature and involves the use of significant estimates and assumptions. These estimates and assumptions include revenue growth rates and operating margins used to calculate projected future cash flows, risk-adjusted discount rates, future economic and market conditions and the determination of appropriate comparable publicly-traded companies. In addition, we make certain judgments and assumptions in allocating shared assets and liabilities to individual reporting units to determine the carrying amount of each reporting unit.
Based on the results of our annual analysis of goodwill in
2012 and 2011,2015, each reporting unit’s
fair values exceeded their carrying values, indicating that there was no goodwill impairment.For the annual goodwill impairment analysis in 2012, each reporting unit’s estimated fair value exceeded its carrying value, ranging from approximately 6%17% to approximately 170%196%. The estimated fair value of our Computing Solutionsand Graphics reporting unit exceeded its carrying value by approximately 6%. Total goodwill relating to our Computing Solutions reporting unit was $230 million as of December 29, 2012. The reasons forhad the smalllowest excess of fair value over carrying value at 17%, however there is no goodwill within this reporting unit. In estimating the fair value of our reporting units, we took into consideration the challenging industry and market trends that existed as of September 27, 2015, the date of the annual goodwill impairment test for each respective reporting unit.
Based on the results of our annual goodwill impairment analysis in 2014, we determined that the carrying value of the Computing Solutionsand Graphics reporting unit are primarily dueexceeded its estimated fair value and accordingly an impairment charge of $233 million was recorded, which represented the entire goodwill balance within this reporting unit. The remaining two reporting units’ estimated fair values exceeded their carrying value, ranging from approximately 156% to approximately 209%. In estimating the recent global economic downturn,fair value of our reporting units, we took into consideration the changeschallenging industry and market trends that existed as of September 28, 2014, the date of the annual goodwill impairment test for each respective reporting unit.
Based on the results of our annual analysis of goodwill in our industry, specifically related to the decline in PC sales, and the decline in our market capitalization. 2013, each reporting unit’s fair value exceeded its carrying value, indicating that there was no goodwill impairment.
Estimates of fair value for all
ofor our reporting units can be affected by a
variety of external and internal factors. Potential events or circumstancescircumstance that could reasonably be expected to negatively affect the key assumptions we used in estimating the fair value of our Computing Solutions reporting unitunits include adverse changes in our industry, increased competition, an inability to successfully introduce new products in the marketplace or to achieve internal forecasts, and furthera decline in our stock price. If the estimated fair value of our Computing Solutions reporting unitunits declines due to any of these factors, we may be required to record future goodwill impairment charges.
impairment.
Income Taxes. In determining taxable income for financial statement reporting purposes, we must make certain estimates and judgments. These estimates and judgments are applied in the calculation of certain tax liabilities and in the determination of the recoverability of deferred tax assets, which arise from temporary differences between the recognition of assets and liabilities for tax and financial statement reporting purposes. We must assess the likelihood that we will be able to recover our deferred tax assets. If recovery is not likely, we must increase our charge to income tax expense, in the form of a valuation allowance, for the deferred tax assets that we estimate will not ultimately be recoverable. We consider past performance, future expected taxable income and prudent and feasible tax planning strategies in determining the need for a valuation allowance.
In addition, the calculation of our tax liabilities involves dealing with uncertainties in the application of complex tax rules and the potential for future adjustment of our uncertain tax positions by the Internal Revenue Service or other taxing
jurisdiction.authority. If our estimates of these taxes are greater or less than actual results, an additional tax benefit or charge will result. We recognize
potential accruedthe interest and penalties related to unrecognized tax benefits as interest expense and income tax
expense.expense, respectively.
Management, including the Chief Operating Decision Maker, who is our Chief Executive Officer, reviews and assesses our operating performance using segment net revenue and operating income (loss) before interest, other income (expense), net and income taxes. These performance measures include the allocation of expenses to the operating segments based on management’s judgment.
We use In connection with our continued strategic transformation, effective July 1, 2014, we realigned our organizational structure. As a result of this organizational change, we have the following two reportable operating segments:
the Computing Solutions segment, which includes microprocessors, as standalone devices or as incorporated as an APU, chipsets and embedded processors; and
the Graphics segment, which primarily includes graphics, video and multimedia products developed for use in desktop and notebook computers, including home media PCs,processors and chipsets, discrete GPUs and professional workstationsgraphics; and servers as well as revenue received in connection with
the developmentEnterprise, Embedded and sale of game console systems that incorporate our graphics technology.Semi-Custom segment, which primarily includes server and embedded processors, semi-custom SoC products, engineering services and royalties.
In addition to these reportable segments, we have an All Other category, which is not a reportable segment. This category primarily includes certain expenses and credits that wereare not allocated to any of the operatingreportable segments because management does
not consider these expenses and credits in evaluating the performance of the
operatingreportable segments. Also included in this category are amortization of acquired intangible assets,
employee stock-based compensation expense, restructuring
and other special charges,
net, technology node transition charge, workforce rebalancing severance charges, goodwill impairment charge, significant or unusual lower of cost or market inventory adjustments and a
charge related tonet gain from licenses and settlement agreements regarding patent-related matters. We also reported the
limited waiverresults of
exclusivity from GF.former businesses in the All Other category because the operating results were not material.
We intend the discussion of our financial condition and results of operations that follows to provide information that will assist you in understanding our financial statements, the changes in certain key items in those financial statements from year to year, the primary factors that resulted in those changes and how certain accounting principles, policies and estimates affect our financial statements.
We use a 52 or 53 week fiscal year ending
on the last Saturday in December. The years ended December
29, 2012,26, 2015, December
31, 201127, 2014 and December
25, 201028, 2013 each included 52
weeks, 53 weeks and 52 weeks.
The extra week in 2011 did not have a material impact on our results of operations. References in this report to
2012, 20112015, 2014 and
20102013 refer to the fiscal year unless explicitly stated otherwise.
The following table provides a summary of net revenue and operating income (loss) by segment and income (loss)
from continuing operations before income taxes for
2012, 20112015, 2014 and
2010. | | | | | | | | | | | | |
| | | 2012 | | | 2011 | | | 2010 | |
| | | (In millions) | |
Net revenue: | | | | | | | | | | | | |
Computing Solutions | | $ | 4,005 | | | $ | 5,002 | | | $ | 4,817 | |
Graphics | | | 1,417 | | | | 1,565 | | | | 1,663 | |
All Other | | | — | | | | 1 | | | | 14 | |
Total net revenue | | $ | 5,422 | | | $ | 6,568 | | | $ | 6,494 | |
Operating income (loss): | | | | | | | | | | | | |
Computing Solutions | | $ | (231 | ) | | $ | 556 | | | $ | 529 | |
Graphics | | | 105 | | | | 51 | | | | 149 | |
All Other | | | (930 | ) | | | (239 | ) | | | 170 | |
Total operating income (loss) | | $ | (1,056 | ) | | $ | 368 | | | $ | 848 | |
Interest income | | | 8 | | | | 10 | | | | 11 | |
Interest expense | | | (175 | ) | | | (180 | ) | | | (199 | ) |
Other income (expense), net | | | 6 | | | | (199 | ) | | | 311 | |
Equity income (loss) and dilution gain in investee, net | | | — | | | | 492 | | | | (462 | ) |
Income (loss) from continuing operations before income taxes | | $ | (1,217 | ) | | $ | 491 | | | $ | 509 | |
2013. The results prior to July 1, 2014 have been recast to reflect our new reportable segments.
|
| | | | | | | | | | | |
| | 2015 | | 2014 | | 2013 |
| | (In millions) |
| Net revenue: | | | | | |
| Computing and Graphics | $ | 1,805 |
| | $ | 3,132 |
| | $ | 3,720 |
|
| Enterprise, Embedded and Semi-Custom | 2,186 |
| | 2,374 |
| | 1,577 |
|
| All Other | — |
| | — |
| | 2 |
|
| Total net revenue | $ | 3,991 |
| | $ | 5,506 |
| | $ | 5,299 |
|
| Operating income (loss): | | | | | |
| Computing and Graphics | $ | (502 | ) | | $ | (76 | ) | | $ | (101 | ) |
| Enterprise, Embedded and Semi-Custom | 215 |
| | 399 |
| | 295 |
|
| All Other | (194 | ) | | (478 | ) | | (91 | ) |
| Total operating income (loss) | $ | (481 | ) | | $ | (155 | ) | | $ | 103 |
|
| Interest expense | (160 | ) | | (177 | ) | | (177 | ) |
| Other income expense, net | (5 | ) | | (66 | ) | | — |
|
| Loss before income taxes | $ | (646 | ) | | $ | (398 | ) | | $ | (74 | ) |
Computing
Solutionsand Graphics
Computing Solutionsand Graphics net revenue of $4.0$1.8 billion in 20122015 decreased by 20%42% compared to $5.0$3.1 billion in 20112014 as a result of a 14%44% decrease in unit shipments, andpartially offset by a 7% decrease3% increase in average selling price. Unit shipments of all categories ofour Computing and Graphics products decreased. The decrease in unit shipments of all categories of products was due to lower demand caused by challenging global macro economic conditions, especially in the Greater China region, in addition to increased competitive pressures and reduced demand from our OEM customers in advance of the Microsoft Windows® 10 operating system. The increase in average selling price was primarily attributable to an increase in average selling price of our notebook GPU products and AIB products due to a favorable shift in our product mix, partially offset by a decrease in average selling price of our microprocessors for desktop PCsnotebook microprocessor products and servers. Unit shipmentschipset products.
Computing and
average selling price of our microprocessors for desktop PCs decreased due to challenging market conditions and the increasing popularity of tablets as a consumer device of choice, which resulted in decreased demand for our products. Unit shipments and average selling price of our microprocessors for servers decreased primarily due to challenging market conditions.Computing SolutionsGraphics net revenue of $5.0$3.1 billion in 2011 increased 4%2014 decreased by 16% compared to net revenue of $4.8$3.7 billion in 2010, primarily2013 as a result of a 16% increase27% decrease in unit shipments, partially offset by an 11% decreasea 15% increase in average selling price. The increasedecrease in unit shipments was primarily attributable to an increase in unit shipments of our microprocessors, including APU products for mobile devices, as well as our chipset products. Unit shipments of our microprocessors, including APU products for mobile devices increased due to strong demand for our Brazos and Llano-based APU platforms. However, the increase in unit shipments in 2011 was limited by supply constraints with respect to certain microprocessor products manufactured using the 32nm technology node. Chipset unit shipments increased primarily due to an increase in overalllower unit shipments of our microprocessor products for desktop and notebook PCs and chipsets due to challenging consumer PC market conditions and our chipsets being integrated into our APU products. The decreaseincrease in overall average selling price was primarily attributable to a decreasean increase in the average selling price of our microprocessors for serversmicroprocessor products due to a shift in ourimproved product mix and competitive market conditions as well as sales of our Brazos APU platforms, which have a lower average selling price than our other processor products.
microprocessor products for desktop and notebook PCs.
Computing Solutionsand Graphics operating loss was $231$502 million in 20122015 compared to operating income of $556$76 million in 2011.2014. The decline in operating results was primarily due to the decrease in net revenue referenced above, partially offset by a $136$696 million decrease in marketing, general and administrative expenses,cost of sales, a $45$120 million decrease in research and development expenses and a $29an $84 million decrease in cost of sales.marketing, general and administrative expenses. Cost of sales decreased primarily due to lower unit shipments in 2015 compared to 2014, partially offset by the $273 million LCM charge related to the fee for GF’s waiver of a portion of our obligations and an inventory write-down of $100$52 million during the third quarter of 2012 as a result of lower than anticipated future demand for certain products, mainly first generation A-Seriesprimarily older-generation APU products, codenamed “Llano”. Marketing,products.
Operating loss in 2014 included a $19 million benefit from technology licensing revenue. Research and development expenses and marketing, general and administrative
expenses and research and development expenses decreased for the reasons set forth under “Expenses,” below.
Computing
Solutionsand Graphics operating
incomeloss was
$556$76 million in
20112014 compared to
$529an operating loss of $101 million in
2010. The improvement in operating results was primarily due to the increase in net revenue referenced above, partially offset by a $70 million increase in cost of sales, a $45 million increase in research and development expenses and a $42 million increase in marketing, general and administrative expenses. Cost of sales increased primarily due to higher microprocessor and chipsets unit shipments and the absence of a one-time benefit related to the deconsolidation of GF in 2010. Research and development expenses and marketing, general and administrative expenses increased for the reasons set forth under “Expenses,” below.Graphics
Graphics net revenue of $1.4 billion in 2012 decreased by 9% compared to net revenue of $1.6 billion in 2011. The decrease was primarily due to a 16% decrease in net revenue from sales of GPU products, partially offset by an increase in net revenue received in connection with the development and sale of game console systems that incorporate our graphics technology. Net revenue from sales of GPU products decreased due to lower unit shipments, partially offset by increased average selling price. GPU unit shipments decreased due to challenging market conditions. GPU average selling price increased primarily due to improved product mix.
Graphics net revenue of $1.6 billion in 2011 decreased by 6% compared to net revenue of $1.7 billion in 2010. The decrease was due primarily to a 6% decrease in net revenue from sales of GPU products. Net revenue from sales of GPU products decreased primarily due to a decrease in both GPU unit shipments and average selling price. The decrease in GPU unit shipments was primarily due to lower customer demand, which we believe was due in part to the disruption in the supply of hard disk drives caused by the flooding in Thailand at the beginning of 2011. GPU average selling price decreased due to a shift in our product mix to lower-end GPU products.
Graphics operating income was $105 million in 2012 compared to $51 million in 2011.2013. The improvement in operating results was primarily due to a $101$323 million decrease in cost of sales, a $60$201 million decrease in research and development expenses and a $41an $89 million decrease in marketing, general and administrative expenses, partially offset by the decrease in net revenue referenced above. Cost of sales decreased primarily due to lower GPUunit shipments in 2014 compared to 2013. Operating loss in 2014 included a $19 million benefit from technology licensing revenue. In addition, operating loss in 2013 included a $57 million benefit from sales of inventory that had been previously reserved in the third quarter of 2012, as compared to a similar $8 million benefit in 2014. Research and correspondingly lower manufacturing costs. Marketing,development expenses and marketing, general and administrative expenses and research and development expenses decreased for the reasons set forth under “Expenses”“Expenses,” below.
Graphics
Enterprise, Embedded and Semi-Custom
Enterprise, Embedded and Semi-Custom net revenue of $2.2 billion in 2015 decreased by 8% compared to net revenue of $2.4 billion in 2014. The decrease was primarily due to a decrease in net revenue received in connection with lower unit shipments of our server and embedded products due primarily to increased competitive pressures, as well as due to the decrease in net revenue from certain royalty arrangements and a decrease in non-recurring engineering (NRE) revenue. The decrease in net revenue was partially offset by an increase in net revenue received in connection with higher unit shipments of our semi-custom SoC products.
Enterprise, Embedded and Semi-Custom net revenue of $2.4 billion in 2014 increased by 51% compared to net revenue of $1.6 billion in 2013. The increase was primarily due to an increase in net revenue received in connection with higher unit shipments of our semi-custom SoC products, which we began shipping in the second quarter of 2013.
Enterprise, Embedded and Semi-Custom operating income was $51$215 million in 20112015 compared to $149$399 million in 2010.2014. The decline in operating results was primarily due to the decrease in net revenue referenced above and a $20$16 million increase in research and development expenses, partially offset by a $19 million decrease in marketing, general and administrative expenses and a $2 million decrease in cost of sales. The decrease in cost of sales was primarily due to a decrease in unit shipments of our server and embedded products in 2015 compared to 2014, largely offset by a technology node transition charge of $33 million and an inventory write-down of $13 million. Marketing, general and administrative expenses decreased and research and development expenses increased for the reasons set forth under “Expenses” below.
Enterprise, Embedded and Semi-Custom operating income was $399 million in 2014 compared to $295 million in 2013. The improvement in operating results was primarily due to the increase in net revenue referenced above, partially offset by a $614 million increase in cost of sales, a $64 million increase in research and development expenses and a $15 million increase in marketing, general and administrative
expenses, partially offset by a $25 million decreaseexpenses. The increase in cost of
sales. Marketing,sales was primarily due to an increase in unit shipments of our semi-custom SoC products in 2014 compared to 2013. In addition, operating income in 2014 included an $8 million benefit from technology license revenue. Research and development expenses and marketing, general and administrative expenses increased for the reasons set forth under
“Expenses,”“Expenses” below.
Cost of sales decreased primarily due to lower GPU shipments and correspondingly lower manufacturing costs.
All Other revenue
waspertains to results from former businesses, which were immaterial in
20122015, 2014 and
2011 and $14 million in 2010. All Other revenue declined because as of 2009, we no longer developed new Handheld products. We decided to exit the Handheld business after selling certain graphics and multimedia technology assets and intellectual property to Qualcomm in the first quarter of 2009.2013.
All Other operating loss of
$930$194 million in
20122015 primarily included
a $703restructuring and other special charges, net of $129 million
charge related to the limited waiver of exclusivity from GF, $100 million of net restructuring charges,and stock-based compensation expense of
$97$63 million. Restructuring and other special charges, net of $129 million
and $14included $76 million related to
amortization of acquired intangible assets.our decision to exit from the dense server systems business, $37 million related to our 2015 Restructuring Plan and $16 million related to our 2014 Restructuring Plan.
All Other operating loss of
$239$478 million in
20112014 included
$98a goodwill impairment charge of $233 million,
of net restructuring charges, $90 million of stock-based compensation expense
$29of $81 million, net restructuring and other special charges of $71 million, lower of cost or market inventory adjustment of $58 million, $14 million related to workforce rebalancing severance charges, $14 million related to amortization of acquired intangible assets and
a $24$7 million
charge recorded in connection with a payment to GF primarily related to
certain GF manufacturing assets that did not benefit us.other expenses.
All Other operating
incomeloss of
$170$91 million in
20102013 included
$283stock-based compensation expense of $91 million,
net restructuring and other special charges of
income from the settlement$30 million and $18 million related to amortization of
our litigation with Samsung inacquired intangible assets. During the fourth quarter of
2010, a $302013, we entered into licenses and settlements regarding patent-related matters, for which we received in aggregate $48 million
one-time benefit recognized in
the first quarter of 2010 relatednet cash, which we recorded as an offset to
the deconsolidation of GF, and $14 million of net revenue, partially offset by $87 million of stock-based compensation expense and $61 million related to the amortization of acquired intangible assets.operating expenses.
Comparison of Gross Margin, Expenses, Interest Income, Interest Expense, Other Income (Expense), Net
and Income Taxes
and Equity Income (Loss) and Dilution Gain in Investee, NetThe following is a summary of certain consolidated statement of operations data for 2012, 20112015, 2014 and 2010. | | | | | | | | | | | | |
| | | 2012 | | | 2011 | | | 2010 | |
| | | (In millions, except for percentages) | |
Cost of sales | | $ | 4,187 | | | $ | 3,628 | | | $ | 3,533 | |
Gross margin | | | 1,235 | | | | 2,940 | | | | 2,961 | |
Gross margin percentage | | | 23 | % | | | 45 | % | | | 46 | % |
Research and development | | | 1,354 | | | | 1,453 | | | | 1,405 | |
Marketing, general and administrative | | | 823 | | | | 992 | | | | 934 | |
Legal settlement | | | — | | | | — | | | | (283 | ) |
Amortization of acquired intangible assets | | | 14 | | | | 29 | | | | 61 | |
Restructuring charges (reversals), net | | | 100 | | | | 98 | | | | (4 | ) |
Interest income | | | 8 | | | | 10 | | | | 11 | |
Interest expense | | | (175 | ) | | | (180 | ) | | | (199 | ) |
Other income (expense), net | | | 6 | | | | (199 | ) | | | 311 | |
Provision (benefit) for income taxes | | | (34 | ) | | | (4 | ) | | | 38 | |
Equity income (loss) and dilution gain in investee, net | | $ | — | | | $ | 492 | | | $ | (462 | ) |
|
| | | | | | | | | | | |
| | 2015 | | 2014 | | 2013 |
| | (In millions, except for percentages) |
| Cost of sales | $ | 2,911 |
| | $ | 3,667 |
| | $ | 3,321 |
|
| Gross margin | 1,080 |
| | 1,839 |
| | 1,978 |
|
| Gross margin percentage | 27 | % | | 33 | % | | 37 | % |
| Research and development | 947 |
| | 1,072 |
| | 1,201 |
|
| Marketing, general and administrative | 482 |
| | 604 |
| | 674 |
|
| Amortization of acquired intangible assets | 3 |
| | 14 |
| | 18 |
|
| Restructuring and other special charges, net | 129 |
| | 71 |
| | 30 |
|
| Goodwill impairment charge | — |
| | 233 |
| | — |
|
| Legal settlements, net | — |
| | — |
| | (48 | ) |
| Interest expense | (160 | ) | | (177 | ) | | (177 | ) |
| Other expense, net | (5 | ) | | (66 | ) | | — |
|
| Provision (benefit) for income taxes | $ | 14 |
| | $ | 5 |
| | $ | 9 |
|
Gross margin as a percentage of net revenue was
23%27% in
20122015 compared to
45%33% in
2011.2014. Gross margin in
2012 included2015 was adversely impacted by an inventory write-down of $65 million, which was primarily the result of lower anticipated demand for older-generation APUs and a
$703 million charge related to the limited waiver of exclusivity from GF, a LCMtechnology node transition charge of
$273 million$33 million. The impact of the write-down accounted for approximately two gross margin percentage points and
a $5 millionthe technology node transition charge
recorded to cost of sales related to a legal settlement.accounted for approximately one gross margin percentage point. Gross margin in
2011 included a $24 million charge recorded in connection with a payment to GF primarily related to certain GF manufacturing assets and a charge of approximately $5 million recorded to cost of sales related to a legal settlement. Absent the effects of the charges as described above, which we believe are not indicative of our ongoing operating performance, our gross margin would have been 41% in 2012 compared to 45% in 2011. Gross margin in 20122015 was also adversely impacted by
the $100a lower proportion of revenue from Computing and Graphics segment due to lower sales which has a higher average gross margin than our Enterprise, Embedded and Semi-Custom segment and also by lower game console royalties. Gross margin in 2014 included a $58 million
lower of cost or market inventory
write-down in the third quarter of 2012 referenced above as well as lower average selling priceadjustment, which accounted for
microprocessor products.one gross margin percentage point, and a $27 million benefit from technology licensing revenue, which accounted for less than one gross margin percentage point.
Gross margin as a percentage of net revenue was
45%33% in
20112014 compared to
46%37% in
2010.2013. Gross margin in
20112014 included a
$24$58 million
charge recorded in connection with a payment to GFlower of cost or market inventory adjustment, which accounted for
certain GF manufacturing assetsone gross margin percentage point, and a
charge of approximately $5$27 million
related to a legal settlement.benefit from technology licensing revenue, which accounted for less than one gross margin percentage point. Gross margin in
20102013 included a
$69$57 million benefit
related tofrom sales of inventory that was previously reserved in the
deconsolidationthird quarter of
GF. Absent the effects of these events,2012, which
we believe arenot indicative of our ongoing operating performance, ouraccounted for one gross margin would have been 45%percentage point as compared to $8 million in each of 2011 and 2010.2014 which had a less than one percentage point impact. Gross margin as adjusted for the factors described above, remained flat in 2011 compared to 2010. During 2011, unit shipments2014 was adversely impacted by lower average gross margins in our Enterprise, Embedded and Semi-Custom segment driven by increased sales of our low-cost,lower margin accretive Brazos APU platforms increased compared to 2010. However, this improvement in gross margin was offset by an unfavorable mix in supply of microprocessor products manufactured using the 32nm technology node and a decline in average selling price of our microprocessor products for servers.
semi-custom SoC products.
Research and Development Expenses
Research and development expenses of $1.4 billion$947 million in 2012,2015 decreased by $99$125 million, or 7%12%, compared to $1.5$1.1 billion in 2011.2014. The decrease was primarily due to a $60 million decrease in research and development expenses attributable to our Graphics segment and a $45$120 million decrease in research and development expenses attributable to our Computing Solutionsand Graphics segment and a $21 million decrease in the All Other category primarily related to a $9 million workforce rebalancing severance charge recorded in 2014 and an $8 million decrease in stock-based compensation expenses. The decrease was partially offset by a $6$16 million increase in stock-based compensation expense recorded in the All Other category.research and development expenses attributable to our Enterprise, Embedded and Semi-Custom segment. Research and development expenses attributable to our Computing and Graphics segment decreased asprimarily due to a result of a $36$116 million decrease in product engineering and design costs and a $16$4 million decrease in other employee compensation and benefit expenseexpenses. Research and development expenses attributable to our Enterprise, Embedded and Semi-Custom segment increased primarily due to a $9$17 million increase in product engineering and design costs.
Research and development expenses of $1.1 billion in 2014 decreased by $129 million, or 11%, compared to $1.2 billion in 2013. The decrease
in manufacturing process technology expenses. Thewas primarily due to a $201 million decrease in research and development expenses attributable to our Computing
Solutionsand Graphics segment,
was primarily due topartially offset by a
$26 million decrease in other employee compensation and benefit expense, an $11 million decrease in manufacturing process technology expenses related to GF for our future products and a $9 million decrease in product engineering and design costs.Research and development expenses of $1.5 billion in 2011, increased by $48 million, or 3%, compared to $1.4 billion in 2010. The increase was primarily due to a $45$64 million increase in research and development expenses attributable to our Enterprise, Embedded and Semi-Custom segment and a $9 million increase in the All Other category related to a workforce rebalancing severance charge recorded in the first quarter of 2014. Research and development expenses attributable to our Computing Solutionsand Graphics segment asdecreased primarily due to a result of$171 million decrease in product engineering and design costs, a $79$22 million decrease in other employee compensation and benefit expenses and a $10 million decrease in manufacturing process technology expenses. Research and development expenses attributable to our Enterprise, Embedded and Semi-Custom segment,
where we expect to continue to increase our investment, increased primarily due to a $59 million increase in product engineering and design costs
for our future products, partially offset byand a
$27$3 million
decreaseincrease in other employee compensation and benefit
expense and a $7 million decrease in manufacturing process technology expenses related to GF for our future products.expenses.
Marketing, General and Administrative Expenses
Marketing, general and administrative expenses of $823$482 million in 20122015 decreased by $169$122 million, or 17%20%, compared to $992$604 million in 2011, reflecting the effect of the 2011 restructuring plan and our efforts to reduce operating expenses.2014. The decrease was primarily due to a $136an $84 million decrease in marketing, general and administrative expenses attributable to our Computing Solutionsand Graphics segment, and a $41$19 million decrease in marketing, general and administrative expenses attributable to our GraphicsEnterprise, Embedded and Semi-Custom segment partially offset byand a $6$19 million increase in corporate general and administrative expenses attributable to our acquisition of SeaMicro, which we recordeddecrease in the All Other category.category primarily related to a $5 million workforce rebalancing severance charge recorded in 2014 and a $10 million decrease in stock-based compensation expenses. Marketing, general and administrative expenses attributable to our Computing Solutionsand Graphics segment decreased primarily due to an $111a $62 million decrease in sales and marketing activitiesexpenses and a $22 million decrease in other general and administrative expenses. Marketing, general and administrative expenses attributable to our Enterprise, Embedded and Semi-Custom segment decreased primarily due to a $5 million decrease in sales and marketing expenses and a $14 million decrease in other general and administrative expenses.
Marketing, general and administrative expenses of $604 million in 2014 decreased by $70 million, or 10%, compared to $674 million in 2013. The
decrease was primarily due to an $89 million decrease in marketing, general and administrative expenses attributable to our
Computing and Graphics segment,
waspartially offset by a
result of a $24 million decrease in other general and administrative expenses and a $16 million decrease in sales and marketing activities.Marketing, general and administrative expenses of $992 million in 2011, increased by $58 million, or 6%, compared to $934 million in 2010. The increase was primarily due to a $42$15 million increase in marketing, general and administrative expenses attributable to our Computing SolutionsEnterprise, Embedded and Semi-Custom segment and a $20$5 million increase in marketing, general and administrative expenses attributablethe All Other category related to our Graphics segment. The increasea workforce rebalancing severance charge recorded in marketing,the first quarter of 2014. Marketing, general and administrative expenses attributable to our Computing Solutionsand Graphics segment wasdecreased primarily due to a $41$61 million decrease in sales and marketing expenses and a $25 million decrease in other general and administrative expenses. Marketing, general and administrative expenses attributable to our Enterprise, Embedded and Semi-Custom segment increased primarily due to an $8 million increase in sales and marketing activities resulting from an increase in regional marketing programs and labor expenses and a $14$5 million increase in other general and administrative expenses, partially offset by a $12 million decreaseexpenses.
Legal Settlements
As of December 26, 2015, the Italian tax authorities had concluded their audit of our subsidiaries’ activities in
other employee compensation and benefit expense. The increase in marketing, general and administrative expenses in our Graphics segment was primarily dueItaly for the years 2003 through 2013. We have agreed to a
$22settlement of $11 million
increase in
salestaxes and
marketing activities resulting from an increasepenalties, which was reflected in
regional marketing programsfull in the 2015 tax provision and
labor expenses.Legal Settlements
Samsung Settlement
In$2 million in interest.
During the fourth quarter of
2010,2013, we entered into
a Patent Licenselicenses and
Settlement Agreement with Samsungsettlement agreements regarding patent-related matters for which we received in aggregate $48 million in net cash, which we recorded as an offset to
end all outstanding legal disputes related to pending patent litigation between us and Samsung. Pursuant to this agreement, all claims between the parties were dismissed with prejudice and Samsung agreed to pay us $283 million less any withholding taxes. We received the first payment of $119 million (which represents $143 million less withholding taxes) in December 2010. The remaining amount of $117 million (which represents $140 million less withholding taxes) was paid in two equal installments in May 2011 and in November 2011. In addition, pursuant to the settlement agreement, Samsung granted us, and we granted to Samsung, non-exclusive, royalty-free licenses to all patents and patent applications for ten years after the effective date of the Agreement to make, have made, use, sell, offer to sell, import and otherwise dispose of certain semiconductor- and electronic-related products anywhere in the world.This settlement encompassed all patent litigation and disputes between the parties.operating expenses. At the time we entered into the Agreement,agreements, we did not have any future obligations that we were required to perform in order to earn thisthe settlement payment.payments. Accordingly, we recognized the entire settlement amount in our operating results for the fourth quarter of 2010.
2013.
Amortization of Acquired Intangible Assets
Amortization of acquired intangible assets was
$3 million in 2015, $14 million in
2012, $292014 and $18 million in
2011 and $61 million in 2010.2013. The decrease from
20112014 to
20122015 was due to the
reduced amortization base amountimpairment of
the acquired intangible assets
offset byas a result of our exit from the
acquisitiondense server systems business in the first quarter of
SeaMicro intangible assets in 2012.2015. The decrease from
20102013 to
20112014 was due to the reduced amortization base amount of acquired intangible
assets.assets of ATI.
Restructuring and Other Special Charges, Net
Effects of Restructuring Plans
2015 Restructuring Plan
In the third quarter of 2015, we implemented a restructuring plan (2015 Restructuring Plan) focused on our ongoing efforts to simplify our business and better align resources around our priorities and business outlook. The 2015 Restructuring Plan involves a reduction of global headcount by approximately 5% and includes organizational actions such as outsourcing certain IT services and application development. During 2015, we recorded a $37 million restructuring charge, which consisted of approximately $27 million of severance and benefit costs, approximately $1 million of facilities related consolidation charges and approximately $9 million of intangible asset related charges associated with the impairment of certain software licenses that have ongoing payment obligations. The 2015 Restructuring Plan resulted in total cash payments of $14 million in 2015. We expect the 2015 Restructuring Plan will likely result in total cash payments of approximately $14 million in 2016. We expect actions associated with the 2015 Restructuring Plan to be substantially completed by the end of the third quarter of 2016.
The following table provides a summary of the restructuring activities during 2015 and the related liabilities recorded in “Other current liabilities” and “Other long-term liabilities” on our consolidated balance sheets as of December 26, 2015:
|
| | | | | | | | | | | |
| | Severance
and related
benefits | | Other exit
related
costs | | Total |
| | (In millions) |
| Balance as of June 27, 2015 | $ | — |
| | $ | — |
| | $ | — |
|
| Charges (reversals), net | 27 |
| | 10 |
| | 37 |
|
| Cash payments | (13 | ) | | (1 | ) | | (14 | ) |
| Non-cash charges | — |
| | (9 | ) | | (9 | ) |
| Balance as of December 26, 2015 | $ | 14 |
| | $ | — |
| | $ | 14 |
|
2014 Restructuring Plan
In the fourth quarter of 2014, we implemented a restructuring plan (2014 Restructuring Plan) designed to improve operating efficiencies. The 2014 Restructuring Plan involved a reduction of global headcount by approximately 6% and an alignment of our real estate footprint with our reduced headcount. We recorded a $57 million restructuring charge in the fourth quarter of 2014, which consisted of $44 million for severance and costs related to the continuation of certain employee benefits, $6 million for contract or program termination costs, $1 million for facilities related costs and $6 million for asset impairments, a non-cash charge. During 2015, we recorded a $16 million restructuring charge, which consisted of $5 million non-cash charge related to asset impairments, $2 million for severance and related benefits and $9 million for facilities related costs. The 2014 Restructuring Plan was substantially completed by the end of the third quarter of 2015.
The following table provides a summary of the restructuring activities during 2015 and the related liabilities recorded in “Other current liabilities” and “Other long-term liabilities” on our consolidated balance sheets as of December 26, 2015:
|
| | | | | | | | | | | |
| | Severance and related benefits | | Other exit related costs | | Total |
| | (In millions) |
| Balance as of December 27, 2014 | $ | 26 |
| | $ | 13 |
| | $ | 39 |
|
| Charges (reversals), net | 2 |
| | 14 |
| | 16 |
|
| Cash payments | (23 | ) | | (7 | ) | | (30 | ) |
| Non-cash charges | — |
| | (5 | ) | | (5 | ) |
| Balance as of December 26, 2015 | $ | 5 |
| | $ | 15 |
| | $ | 20 |
|
In the fourth quarter of 2012, we implemented a restructuring plan designed to improve our cost structure and to strengthen our competitiveness in core growth areas. The plan primarily
involvesinvolved a workforce reduction of approximately 14% as well as asset impairments and facility consolidations. We recorded restructuring expense in the fourth quarter of 2012 of approximately $90
million. Substantially allmillion, which was primarily comprised of
the restructuring expense is related toemployee severance.
Of the total restructuring expense, approximately $46 million related to cash payments in the fourth quarter of 2012, with the remaining $41 million related to anticipated cash payments in 2013. The non-cash portion of the restructuring expense included approximately $4 million of asset impairments.
We planIn 2014 and 2013, we incurred costs of $3 million and $11 million, respectively, related to
substantially complete the planfacility consolidation and site closures, which were partially offset by the
endrelease of
the first quarteremployee-related severance costs of
2013. We are currently evaluating further facility consolidations,$2 million and
depending on the outcome of such evaluation, we may incur additional$5 million, respectively. The 2012 restructuring
charges, which may be material.2011 Restructuring Plan
In the fourth quarter of 2011, we initiated a restructuring plan to strengthen our competitive positioning, implement a more competitive cost structure and conduct a workforce rebalancing to better address faster growing market segments. The plan included a workforce reduction of approximately 13% and contract and program terminations. We recorded a $100 million restructuring charge in the fourth quarter of 2011 and an additional $8 million restructuring charge in 2012, which consisted of $62 million for severance and costs related to the continuation of certain employee benefits, $46 million for contract or program termination costs and $1 million for asset impairments. The plan was substantially completed as of the end of the third quarter of 2013.
Dense Server Systems Business Exit
As a part of our strategy to simplify and sharpen our investment focus, we exited the dense server systems business, formerly SeaMicro, in the first quarter of
2012.The following table provides2015. As a summaryresult, we recorded a charge of the activity$76 million in “Restructuring and other special charges, net” on our consolidated statements of operations during 2015. This charge consisted of an impairment charge of $62 million related to the 2012acquired intangible assets. We concluded that the carrying value of the acquired intangible assets associated with our dense server systems business was fully impaired as we did not have plans to utilize the related freedom fabric technology in any of our future products nor did we have any plans at that time to monetize the associated intellectual property. In addition, the exit charge consisted of a $7 million non-cash charge related to asset impairments, $4 million of severance and 2011 restructuring plans related benefits
and
$3 million for contract or program termination costs. We expect to complete this exit activity by the
remaining related liabilities recorded in “Other current liabilities” on our consolidated balance sheet asend of
December 29, 2012: | | | | | | | | | | | | |
| | | Severance
and related
benefits | | | Other exit
Related
Costs | | | Total | |
| | | (In millions) | |
Balance at December 25, 2010 | | $ | — | | | $ | — | | | $ | — | |
Charges | | | 54 | | | | 46 | | | | 100 | |
Cash payments | | | (32 | ) | | | — | | | | (32 | ) |
Non-cash charges | | | — | | | | (1 | ) | | | (1 | ) |
Balance at December 31, 2011 | | | 22 | | | | 45 | | | | 67 | |
Charges | | | 95 | | | | 5 | | | | 100 | |
Cash payments | | | (76 | ) | | | (29 | ) | | | (105 | ) |
Non-cash charges | | | — | | | | (4 | ) | | | (4 | ) |
Balance at December 29, 2012 | | $ | 41 | | | $ | 17 | | | $ | 58 | |
2008 Restructuring Plan
the first quarter of 2016.
Executive Officer Separation
In the fourth quarter of 2008,2014, we initiatedrecorded other special charges of $13 million. The amount primarily included $10 million due to the departure of our former CEO, of which $5 million was related to cash and $5 million was related to stock-based compensation expense. The amount is recorded under “Restructuring and other special charges, net” on the consolidated statements of operations.
Sale and Leaseback Transactions
In September 2013, we sold a
restructuring plan to reduce our cost structure, which was substantially completedlight industrial building in
2009. In 2011, we reversed approximately $2Singapore and leased back a portion of the original space. We received net cash proceeds of $46 million
of costs associatedin connection with the
2008 restructuring plan becausesale, which resulted in a $17 million gain that we recorded in the
actual restoration costs for vacated facilities were lower than previously estimated. In 2010, we reversed approximately $4 millionthird quarter of
costs associated with the 2008 restructuring plan because the actual severance and costs related to the continuation of certain employee benefits were lower than previously estimated.The following table provides a summary of each major type of cost associated with the 2012, 2011 and 2008 restructuring plans for the periods presented:
| | | | | | | | | | | | |
| | | 2012 | | | 2011 | | | 2010 | |
| | | (In millions) | |
Severance and benefits | | $ | 95 | | | $ | 54 | | | $ | (4 | ) |
Contract or program terminations | | | — | | | | 45 | | | | — | |
Asset impairments | | | 4 | | | | 1 | | | | — | |
Facility consolidations and closures | | | 1 | | | | (2 | ) | | | — | |
Total | | $ | 100 | | | $ | 98 | | | $ | (4 | ) |
Interest Income
Interest income was $8 million in 2012 compared to $10 million in 2011. The decrease was primarily due to a decrease in cash, cash equivalents and marketable securities2013 and a decreasedeferred gain of $14 million as of September 28, 2013 that is being amortized over the initial operating lease term. The initial operating lease term expires in September 2023 and provides for options to extend the weighted-average interest rate during 2012.
Interest incomeoperating lease for 4 years at the end of the initial lease term, and for an additional 3.5 years thereafter.
In September 2013, we also sold an office building in Austin, Texas. We received net cash proceeds of $10 million in 2011 was relatively flat asconnection with the sale and recorded a $5 million gain in the third quarter of 2013.
In March 2013, we sold and leased back certain land and office buildings in Austin, Texas. We received net cash proceeds of $164 million in connection with the sale and recorded a $52 million charge in the first quarter of 2013. The operating lease expires in March 2025 and provides for one 10-year optional renewal.
In March 2013, we also sold an office building in Markham, Ontario, Canada and leased back a portion of the original space through June 2013. We received net cash proceeds of $13 million in connection with the sale and recorded a $6 million gain in the first quarter of 2013.
The net charge of $24 million recognized in 2013 related to the real estate transactions described above is recorded in the “Restructuring and other special charges, net” line item on the consolidated statements of operations.
Interest Expense
Interest expense of $160 million in 2015 decreased by $17 million compared to
$11$177 million in
2010. The weighted-average interest rate decreased in 2011 compared to 2010. However, the impact of this was offset by an increase in average cash, cash equivalents and marketable securities balance during 2011.Interest Expense
Interest expense was $175 million in 2012 compared to $180 million in 2011 and $199 million in 2010. Interest expense decreased2014, primarily due to the net reductiontiming of issuances of new debt and repurchases of other debt in the principal amount2014.
Interest expense of
our outstanding debt.$177 million in 2014 was flat compared to $177 million in 2013.
Other
Income (Expense),Expense, Net
Other
income,expense, net, in
20122015 was
$6$5 million compared to
$199$66 million of other expense, net, in
20112014 and
$311$0 million of other
income,expense, net, in
2010.2013.
In 2012,2015, we recognized $6$5 million of other income,expense, net, primarily due to a loss from foreign currency exchange rate fluctuations.
In 2014, we recognized $66 million of other income recorded in the third quarter of 2012,expense, net, primarily due to a $61 million loss from debt repurchases and a $7 million loss from foreign currency exchange rate fluctuations, partially offset by $3 million interest income.
In 2013, we recognized $0 million of other expense, net, primarily due to a
$5$2 million loss from foreign currency exchange rate fluctuations and a
$4$2 million
other-than-temporary impairment charge related to onerealized loss on sale of our auction rate securities (ARS)
investments.In 2011, we recognized an impairment charge on our investment in GF of approximately $209 million and a $6 million loss related to our repurchase of $200 million aggregate principal amount of our 6.00% Convertible Senior Notes due 2015 (6.00% Notes), partiallyinvestments, offset by $8$5 million gain on foreign currency exchange rate fluctuations.
In 2010, we recognized a non-cash gain related to the deconsolidation of GF of approximately $325 million, a $17 million gain from the sale of our marketable securities and an $8 million gain related to an earn-out payment that we received in connection with the acquisition of a company that we had invested in, partially offset by a $24 million loss related to our repurchase of $1,016 million principal amount of our 6.00% Notes and $14 million loss due to foreign currency exchange rate fluctuations.
interest income.
We recorded an income tax
benefit of $34 million and $4 million in 2012 and 2011 and an income tax provision
of $38 million in 2010.The income tax benefit in 2012 was primarily due to a tax benefit of $36 million relating to the SeaMicro acquisition, a $1 million tax benefit for the tax effects of items credited directly to other comprehensive income, a $2 million tax benefit for Canadian co-op tax credits and a $9 million tax benefit associated with the successful negotiation of a tax holiday in a foreign jurisdiction net of $14 million, of foreign taxes$5 million and $9 million in profitable locations.
The income tax benefit in 2011 was primarily due to tax benefits of $4 million from the monetization of U.S.2015, 2014 and Canadian tax credits, a $4 million reversal of unrecognized tax benefits in foreign jurisdictions, primarily due to a favorable audit resolution in a foreign jurisdiction, net of $4 million of foreign taxes in profitable locations.
2013, respectively.
The income tax provision in 20102015 was primarily due to withholding taxes paid to the Korean tax authorities in connection with the payment we received from Samsung in December 2010 pursuant to the Patent License and Settlement Agreement as well as$16 million of foreign taxes in profitable locations, offset by $2 million of tax benefits includingfor Canadian tax credits and the monetization of certain U.S. researchtax credits.
The income tax provision in 2014 was primarily due to $7 million of foreign taxes in profitable locations, offset by $2 million of tax benefits for Canadian tax credits and development credits, an alternative minimumthe monetization of certain U.S. tax refund on net operating loss carrybackcredits.
The income tax provision in the United States2013 was primarily due to $9 million of foreign taxes in profitable locations and $3 million
related to the reversal of
unrecognizedpreviously recognized tax benefits
in foreign jurisdictions.associated with other comprehensive income, offset by $3 million of tax benefits for Canadian tax credits and the monetization of certain U.S. tax credits.
As of December
29, 2012,26, 2015, substantially all of our U.S. and foreign deferred tax assets, net of deferred tax liabilities, continued to be subject to a valuation allowance. The realization of these assets is dependent on substantial future taxable income which, at December
29, 2012,26, 2015, in management’s estimate, is not more likely than not to be achieved.
On January 2, 2013
As of December 26, 2015, the
American Taxpayer Relief ActItalian tax authorities had concluded their audit of
2012 (Act)our subsidiaries’ activities in Italy for the years 2003 through 2013. We have agreed to a settlement of $11 million in taxes and penalties, which was
passed into law. The Act included a retroactive extension of the U.S. research credit for 2012. Since the effects of tax law changes are recognizedreflected in full in the
first period which includes the date of enactment, the Act had no impact on our 2012 tax provision. The impact on our 20132015 tax provision,
will be immaterial due to the valuation allowance.Equity Income (Loss) and Dilution Gain$2 million in Investee, Net
From December 27, 2009 to December 25, 2010, the period during which we applied the equity method of accounting for our ownership interest in GF, our equity in net loss of investee primarily consisted of our proportionate share of GF’s losses for the period based on our ownership percentage of GF’s Class A Preferred Shares, our portion of the non-cash accretion on GF’s Class B Preferred Shares, the elimination of intercompany profit, reflecting the mark-up on inventory that remained on our consolidated balance sheet at the end of the period, the amortization of basis differences identified from the purchase price allocation process, based on the fair value of GF upon deconsolidation, and, to the extent applicable, the gain or loss on dilution of our ownership interest as a result of the capital contributions into GF by ATIC.
interest.
Stock-Based Compensation Expense
Stock-based
We allocated stock-based compensation expense related to employee stock options, restricted stock and restricted stock units for the years ended December
29, 2012,26, 2015, December
31, 201127, 2014 and December
25, 2010 was allocated28, 2013 in our consolidated statements of operations as follows:
| | | | | | | | | | | | |
| | | 2012 | | | 2011 | | | 2010 | |
| | | (In millions) | |
Cost of sales | | $ | 8 | | | $ | 6 | | | $ | 4 | |
Research and development | | | 52 | | | | 46 | | | | 46 | |
Marketing, general and administrative | | | 37 | | | | 38 | | | | 37 | |
Total stock-based compensation expense, net of tax of $0 | | $ | 97 | | | $ | 90 | | | $ | 87 | |
|
| | | | | | | | | | | |
| | 2015 | | 2014 | | 2013 |
| | (In millions) |
| Cost of sales | $ | 3 |
| | $ | 3 |
| | $ | 5 |
|
| Research and development | 36 |
| | 44 |
| | 48 |
|
| Marketing, general and administrative | 24 |
| | 34 |
| | 38 |
|
| Total stock-based compensation expense, net of tax of $0 | $ | 63 |
| | $ | 81 |
| | $ | 91 |
|
During
2012, 20112015, 2014 and
2010,2013, we did not realize any excess tax benefits related to stock-based compensation and therefore we did not record any
relatedeffects relating to financing cash flows.
Stock-based compensation expense of $97$63 million in 2012 increased2015 decreased by $7$18 million as compared to $90$81 million in 2011.2014. The increasedecrease was primarily due to a lower weighted average grant date fair value and the additionaleffect of the 2015 and 2014 Restructuring Plans.
Stock-based compensation expense of $81 million in 2014 decreased by $10 million as compared to $91 million in 2013. The decrease was primarily due to lower expense related to
the equity grants made in connection with our acquisition of SeaMicro and an increase in the number of employee stock options and restricted stock
units that we granted
partially offset by the absence of a charge related to the acceleration of vesting of all unvested equity incentivein connection with our SeaMicro acquisition as most awards
held by our former Chief Executive Officer in the first quarter of 2011became fully vested during 2014 and lower stock compensation expense as a result of
his resignation from AMD, effective January 10, 2011 and a lower weighted-average estimated grant date fair value in 2012 as compared to 2011.Stock-based compensation expenses of $90 million in 2011 increased $3 million compared to $87 million in 2010. This increase was primarily due to the acceleration of vesting of all unvested equity awards held by our former Chief Executive Officer in the first quarter of 2011 as a result of his resignation from AMD, effective January 10, 2011, and an increase in the number of employee stock options and restricted stock units that we granted in 2011 compared to 2010, partially offset by a lower weighted-average estimated grant date fair value in 2011 as compared to 2010.
2014 Restructuring Plan.
As of December
29, 2012,26, 2015, we had
$44$11 million of total unrecognized compensation expense, net of estimated forfeitures, related to stock options that will be recognized over
thea weighted-average period of
2.202.30 years. Also, as of December
29, 2012,26, 2015, we had
$97$88 million of total unrecognized compensation expense, net of estimated forfeitures, related to restricted stock and restricted stock units
including performance-based restricted stock units that will be recognized over
thea weighted-average period of
1.971.99 years.
International sales as a percentage of net revenue were
92%75% in
2012, 93%2015, 81% in
2011,2014 and
88%85% in
2010.2013. The decrease in international sales as a percentage of net revenue in 2015 compared 2014 was primarily driven by a decrease in sales in China. The decrease in international sales as a percentage of net revenue in 2014 compared to 2013 was primarily driven by an increase in net revenue from domestic sales of our semi-custom SoC products. We expect that international sales will continue to be a significant portion of total sales in the foreseeable future. Substantially all of our sales transactions were denominated in U.S. dollars.
Liquidity
LiquidityOur cash and cash equivalents and marketable securities consisted of money market funds and commercial paper. As of December 29, 2012,26, 2015, our cash, cash equivalents and marketable securities of $1.0 billion decreased by $763$785 million were lower compared to cash, cash equivalents and marketable securities of $1.8$1.0 billion as of December 31, 2011.27, 2014.The decrease was primarily due to lower sales and the timing of related collections and the timing of accounts payable payments made. During 2012,2015, we made net cash paymentsused $96 million for purchases of $281 million to acquire SeaMicro, $250 million related to the limited waiver of exclusively from GF, $105 million related to restructuring activitiesproperty, plant and $80 million related to GF’s waiver of a portion of our wafer purchase commitments for the fourth quarter of 2012.equipment. The percentage of our cash and cash equivalents and marketable securities held in the United Statesdomestically was 94%88% as of December 29, 2012.
During 2012, we invested an additional $32 million in long-term marketable securities, which we intend to hold for more than one year26, 2015 and do not intend to use in current operations. Our long-term marketable securities are invested in corporate bonds and money market funds that have maximum stated maturities of 2 years. As89% as of December 29, 2012, the fair value of these long-term marketable securities was $181 million. All of the long-term marketable securities were held in the United States.
As of December 29, 2012, our27, 2014.
Our debt and capital lease obligations
as of December 26, 2015 were
$2.04$2.3 billion
as compared to $2.2 billion as of December 27, 2014. During 2015, we received $100 million net proceeds from our Secured Revolving Line of Credit, of which
reflects a debt discount adjustment of $60$42 million
on our 6.00% Notes and 8.125% Senior Notes due 2017 (8.125% Notes). Inwas used to repay the
third quarter of 2012, we repaid in full the outstanding principal and accrued interest on our 5.75% Convertible Senior Notes due 2012 (5.75% Notes), of approximately $499 million, and issued $500 millionremaining aggregate principal amount of
7.50% Senior Notes due 2022 (7.50% Notes).For 2012, our net cash used in operating activities was $338 million and our non-GAAP adjusted free cash flow was negative $471 million. Adjusted free cash flow is a non-GAAP measure, which we calculated in 2012 by taking GAAP net cash used in operating activities of $338 million for 2012 and subtracting capital expenditures, which were $133 million for 2012. For 2011, net cash provided by operating activities was $382 million and our non-GAAP adjusted free cash flow was $528 million. For 2011, we calculated non-GAAP adjusted free cash flow by taking GAAP net cash provided by operating activities of $382 million for 2011 and adding $396 million, which represented payments made by certain of our distributor customers during 2011 to IBM Credit LLC and certain of its subsidiaries (collectively, the IBM Parties) pursuant to our former accounts receivable financing arrangement, which we describe in further detail below. Then we adjusted the resulting amount of $778 million by subtracting capital expenditures, which were $250 million for 2011. Compared to our non-GAAP adjusted free cash flow of $528 million for 2011, the decrease in our non-GAAP adjusted free cash flow for 2012 was primarily due to the fact that we did not generate cash flow from operating activities in 2012; instead we used $338 million of net cash for operating activities. The decrease was partially offset by a $117 million decrease in capital expenditures.
6.00% Notes.
We
had various supplier agreements with the IBM Parties pursuant to which we sold invoices of selected distributor customers. Under this financing arrangement, we did not recognize revenue until our distributors sold our products to their customers. Under GAAP, we classified funds received from the IBM Parties as debt on the balance sheet. Moreover, for cash flow purposes, we classified these funds as cash flows from financing activities. When a distributor paid the applicable IBM Party, we reduced the distributor’s accounts receivable and the corresponding debt resulted in a non-cash accounting entry. Because we did not receive the cash from the distributor to reduce the accounts receivable, the distributor’s payment was not reflected in our cash flows from operating activities.Generally, under GAAP, the reduction in accounts receivable is assumed to be a source of operating cash flow. Therefore, we believe that treating the payments from our distributor customers to the IBM Parties as if we actually received the cash from the distributor and then used that cash to pay down the debt to the IBM Parties was more reflective of the economic substance of the financing arrangement with the IBM Parties. We terminated our financing arrangement with the IBM Parties in February 2011. Commencing in the third quarter of 2011, we no longer make the adjustment for distributors’ payments to the IBM Parties to our GAAP net cash provided by (used in) operating activities when calculating our non-GAAP adjusted free cash flow.
We calculate and communicate adjusted free cash flow because our management believes it is important for investors to understand the nature of these cash flows. Our calculation of adjusted free cash flow may or may not be consistent with the calculation of this measure by other companies in the same industry. Investors should not view adjusted free cash flow as an alternative to GAAP liquidity measures of cash flows from operating or financing activities.
We believe that the challenging macroeconomic conditions that we experienced in the second half of 2012 will continue during the first half of 2013. In light of the macroeconomic environment, in the fourth quarter of 2012, we implemented a restructuring plan to reduce our operating expenses and better position us competitively. With our restructuring and available external financing, we believe our cash and cash equivalents balance along with the savings from our restructuring plans and marketable securities balanceour Secured Revolving Line of Credit will be sufficient to fund operations, including capital expenditures, over the next twelve12 months.
We believe that in the event we decide to obtain external funding, we willmay be able to access the capital markets on terms and in amounts adequate to meet our objectives. However, given the possibility of changes in market conditions or other occurrences, we cannot be certain that such funding will be available on terms favorable to us or at all.
Over the longer term, should additional funding be required, such as to meet payment obligations of our long-term debt when due, we may need to raise the required funds through borrowings or public or private sales of debt or equity securities, which may be issued from time to time under an effective registration statement, through the issuance of securities in a transaction exempt from registration under the Securities Act of 1933,
as amended, or a combination of one or more of the foregoing.
We cannot assure you that macroeconomicUncertain global economic conditions
will improve,have in the past adversely impacted, and
they could worsen.may in the future adversely impact, our business. If market conditions
do not improve or deteriorate, we may be limited in our ability to access the capital markets to meet liquidity needs on favorable terms or at all, which could adversely affect our liquidity and financial condition, including our ability to refinance maturing liabilities.
Auction Rate Securities
As a result of the uncertainties in the credit markets, all of our auction rate securities (ARS) were negatively affected, and since February 2008, auctions for these securities failed to settle on their respective settlement dates. However, there have been no defaults, and we have received all interest payments as they became due.
During 2012, we did not realize any gain or loss on sales of available-for-sale securities of approximately $6 million, and we recorded an other-than-temporary impairment charge of $4 million during the fourth quarter.
As of December 29, 2012, the par value of our ARS was $37 million, with an estimated fair value of $28 million. Total ARS, at fair value, represented 3% of our total investment portfolio as of December 29, 2012.
Based on the recent tender and redemption activities and the fact that the secondary market for these securities has become more liquid, with pricing generally similar to our carrying value, we classified these securities as marketable securities as of December 29, 2012. We have the intent and believe we have the ability to sell these securities within the next 12 months. During the first quarter to date, we sold $13 million of our ARS for an insignificant loss.
Net cash used in operating activities was
$338$226 million in
2012. A net loss of $1,1832015 compared to $98 million
was adjusted for non-cash charges consisting primarily of a $278 million charge related to the limited waiver of exclusivity from GF, $260 million of depreciation and amortization expense, $97 million of stock-based compensation expense and $23 million of non-cash interest expense related to our 6.00% Notes and 8.125% Notes. These charges were partially offset by a benefit of $40 million for deferred income taxes.in 2014. The
net changesincrease in cash used in operating
assets as ofDecember 29, 2012 compared to December 31, 2011 included a decrease in accounts receivable of $290 million and an increase in inventories of $83 million, which wereactivities was primarily due to lower cash collections during 2015 compared 2014 driven by lower sales during 2012. During 2012, our payablecompared to GF, which included all amounts that we owe to GF, increased by $277 million. The increase was due to cash obligations of $240 million related to the third amendment to the WSA and $175 million related to the limited waiver of exclusivity from GF, offset by a decrease of $138 million in the amount of billings related to wafer purchases. Accounts payable, accrued liabilities and other decreased by $232 million primarily due to a $94 million decrease in accrued liabilities, a $92 million decrease in accounts payable and other current liabilities, a $23 million decrease in other liabilities, a $15 million decrease in deferred income on shipments to distributors and a $6 million decrease in accrued compensation and benefits.
Net cash provided by operating activities was $382 million in 2011. Net income of $491 million was adjusted for non-cash charges consisting primarily of $317 million of depreciation and amortization expense, a $209 million impairment charge on our investment in GF, $90 million of stock based compensation expense, and $21 million of non-cash interest expense related to our 6.00% Notes and our 8.125% Notes. These charges were2014, partially offset by recognition of a non-cash gain of $492 million due to the dilution of our equity interest in GF. The net changes inlower other operating assets at December 31, 2011 compared to December 25, 2010 included an increase in accounts receivable of $347 million, which included the non-cash impact of our previous financing arrangements with the IBM Parties. During 2011, the IBM Parties collected approximately $396 million from our distributor customers pursuant to these arrangements. Without considering the collection by the IBM Parties of the accounts receivables that we sold to them, our accounts receivable decreased $49 million. This decrease was primarily due to timing of sales and collections during 2011. There was also a decrease in prepaid expenses and other assetslabor cost as a result of $115 million primarily due torestructuring actions and the receiptabsence of the final settlement$200 million cash payment from Samsungmade in the first quarter of $117 million.
2014 related to GF’s waiver of a portion of our obligations for wafer purchase commitments.
Net cash used in operating activities was
$412$98 million in
2010. Net income of $471 million was adjusted for non-cash charges consisting primarily of a $462 million loss from the application of the equity method of accounting for our investment in GF, $383 million of depreciation and amortization expense, $87 million of stock-based compensation expense, $30 million of interest expense related2014 compared to
our 6.00% Notes and our 8.125% Notes and a $24 million net loss related to our repurchase of an aggregate of $1,016 million principal amount of our 6.00% Notes for $1,011$148 million in
cash. These charges were partially offset by a non-cash gain of $325 million related to the deconsolidation of GF, amortization of foreign grants of $16 million and a net gain of $17 million from the sale of marketable securities.2013. The
net changesdecrease in cash used in operating
assets at December 25, 2010 compared to December 26, 2009 included an increase in accounts receivable of $1,138 million, which included the non-cash impact of our financing arrangement with the IBM Parties. During 2010, the IBM Parties collected approximately $915 million from our distributor customers pursuant to these arrangements. Without considering the collection by the IBM Parties of the accounts receivables that we sold to them, our accounts receivable increased $223 million. This increaseactivities was primarily due to
higher cash collections during 2014 compared 2013 driven by slightly higher sales compared to 2013, partially offset by the
introduction and sale of new products towards the end of 2010 and the timing of the related collections. Excluding the effects of the deconsolidation of GF, there was also a decrease in accounts payable, accrued liabilities and other of $184$113 million
primarily due to the timing of payments. Accounts payableprepayments to GF
increased by $55 million due toin the
timingfourth quarter of
payments during 2010.2014.
Net cash used inprovided by investing activities was $19$147 million in 2012. We had2015, which consisted of a net cash inflow of $404$235 million from purchase,purchases, sales and maturities of available for sale and maturity of available-for-sale securities, partially offset by a net cash outflow of $281$88 million related to the acquisitionfor purchases and sales of SeaMicro,property, plant and equipment.
Net cash used in investing activities was $12 million in 2014, which consisted of a cash outflow of
$133$95 million for purchases of property, plant and equipment,
and a cash outflow of $9 million related to other investing activities.Net cash used in investing activities was $113 million in 2011. We had a net cash outflow of $234 million for the purchase and sale of property, plant and equipment, and payments of $17 million for professional services related to the contribution of GFS to GF. The net cash outflows were partially offset by a net cash inflow of $140$83 million from purchase,purchases, sales and maturities of available for sale and maturity of available-for-sale securities.
Net cash
used inprovided by investing activities was
$1,123$455 million in
2010. The cash flow effect of the deconsolidation of GF was an outflow of $904 million, which2013 and primarily consisted of
GF’s cashnet proceeds of $301 million from the purchase, sales and
cash equivalents. In addition, we had amaturities of available-for-sale securities and net
cash outflowproceeds of
$147$154 million
forfrom sales and purchases of property, plant and
equipment and of $160 million for purchases of available-for-sale securities. The net cash outflows were partially offset by a net cash inflow of $69 million from the sale of trading securities.equipment.
Net cash provided by financing activities was $37$59 million in 20122015, primarily due to net proceeds from borrowings pursuant to our Secured Revolving Line of Credit of $100 million, of which $42 million was used to repay the issuanceremaining aggregate principal amount of our 6.00% Notes during the second quarter of 2015. In addition, during 2015, we received $5 million from the exercise of employee stock options.
Net cash provided by financing activities was $46 million in 2014, primarily due to net proceeds from borrowings pursuant to our 6.75% Notes of $589 million, our 7.00% Notes of $491 million and our Secured Revolving Line of Credit of $75 million, partially offset by $518 million in payments to repurchase a portion of our 6.00% Notes, $522 million in payments to repurchase our 8.125% Notes, $48 million in payments to repurchase a portion of our 7.75% Notes, $24 million in payments to repurchase a portion of our 7.50% Notes of $491and $3 million $23in payments for capital lease obligations. During 2014, we also received $4 million from the exercise of employee stock options.
Net cash provided by financing activities was $13 million in 2013, primarily due to net proceeds of $55 million from borrowings pursuant to our Secured Revolving Line of Credit, $3 million from the issuance of common stock under our stock-based compensation plan and $10 million from other financing activities, including net proceeds from U.S. government grants for research and development activities and foreign grants from the Canadian government for research and development activities related to our AMD APU
products and from the Malaysian and Chinese governments for our local microprocessor assembly, test and packaging facilities and $14 million from the issuance of common stock under our stock-based compensation plan,products. The cash inflows were partially offset by
our repaymentthe repurchase of
outstanding principal and accrued interest on our 5.75% Notes and repayment of capital lease obligations of $489 million.Net cash used in financing activities was $6$50 million in 2011 as a result of payments of $202 million to repurchase $200 million aggregate principal amount of our 6.00% Notes. This amount was partially offset by $170 millionNotes (which is a portion of proceeds from our former financing arrangement with the IBM Parties, $20outstanding 6.00% Notes) in open market transactions and $5 million in proceeds from foreign grants from the Canadian governmentpayments for researchcapital lease obligations.
During 2015, 2014 and
development activities related to our AMD APU products and from the Malaysian and Chinese governments for our local microprocessor assembly, test and packaging facilities, and $18 million from the issuance of common stock under our stock-based compensation plan.Net cash provided by financing activities was $484 million in 2010 primarily as a result of proceeds of $988 million from our former financing arrangement with the IBM Parties, $490 million from the sale and issuance of $500 million aggregate principal amount of the 7.75% Notes, $19 million in proceeds from foreign grants from the Canadian government for research and development activities related to our Fusion products and from the Malaysian and Chinese governments for our local microprocessor assembly, test and packaging facilities and $15 million from the issuance of common stock under our stock-based compensation plan. These amounts were partially offset by payments of $1,011 million to repurchase $1,016 million aggregate principal amount of our 6.00% Notes.
During 2012, 2011 and 2010,2013, we did not realize any excess tax benefit related to stock-based compensation. Therefore, we did not record any relatedeffects relating to financing cash flows for these periods.
The following table summarizes our consolidated principal contractual cash obligations, as of December
29, 2012,26, 2015, and is supplemented by the discussion following the table:
| | | | | | | | | | | | | | | | | | | | | | | | | | | | |
| | | Payment due by period | |
| (In millions) | | Total | | | 2013 | | | 2014 | | | 2015 | | | 2016 | | | 2017 | | | 2018
and thereafter | |
6.00% Convertible Senior Notes due 2015(1) | | $ | 580 | | | $ | — | | | $ | — | | | $ | 580 | | | $ | — | | | $ | — | | | $ | — | |
8.125% Senior Notes due 2017(1) | | | 500 | | | | — | | | | — | | | | — | | | | — | | | | 500 | | | | — | |
7.75% Senior Notes due 2020 | | | 500 | | | | — | | | | — | | | | — | | | | — | | | | — | | | | 500 | |
7.50% Senior Notes due 2022 | | | 500 | | | | | | | | | | | | | | | | | | | | | | | | 500 | |
Other long-term liabilities | | | 13 | | | | — | | | | 12 | | | | — | | | | — | | | | — | | | | 1 | |
Aggregate interest obligation(2) | | | 937 | | | | 152 | | | | 152 | | | | 128 | | | | 117 | | | | 115 | | | | 273 | |
Capital lease obligations(3) | | | 25 | | | | 6 | | | | 6 | | | | 6 | | | | 6 | | | | 1 | | | | — | |
Operating leases | | | 160 | | | | 37 | | | | 34 | | | | 28 | | | | 21 | | | | 18 | | | | 22 | |
Purchase obligations(4) | | | 299 | | | | 266 | | | | 21 | | | | 12 | | | | — | | | | — | | | | — | |
Obligations to GF(5) | | | 1,815 | | | | 1,565 | | | | 250 | | | | — | | | | — | | | | — | | | | — | |
Total contractual obligations | | $ | 5,329 | | | $ | 2,026 | | | $ | 475 | | | $ | 754 | | | $ | 144 | | | $ | 634 | | | $ | 1,296 | |
|
| | | | | | | | | | | | | | | | | | | | | | | | | | | |
| Payment due by period |
| (In millions) | Total | | 2016 | | 2017 | | 2018 | | 2019 | | 2020 | | 2021
and
thereafter |
| 6.75% Notes | $ | 600 |
| | $ | — |
| | $ | — |
| | $ | — |
| | $ | 600 |
| | $ | — |
| | $ | — |
|
| 7.75% Notes | 450 |
| | — |
| | — |
| | — |
| | — |
| | 450 |
| | — |
|
| 7.50% Notes | 475 |
| | — |
| | — |
| | — |
| | — |
| | — |
| | 475 |
|
| 7.00% Notes | 500 |
| | — |
| | — |
| | — |
| | — |
| | — |
| | 500 |
|
| Secured Revolving Line of Credit | 230 |
| | 230 |
| | — |
| | — |
| | — |
| | — |
| | — |
|
| Other long-term liabilities | 42 |
| | — |
| | 35 |
| | 5 |
| | — |
| | — |
| | 2 |
|
Aggregate interest obligation(1) | 889 |
| | 148 |
| | 148 |
| | 148 |
| | 128 |
| | 106 |
| | 211 |
|
| Operating leases | 306 |
| | 51 |
| | 50 |
| | 45 |
| | 28 |
| | 26 |
| | 106 |
|
Purchase obligations(2) | 319 |
| | 254 |
| | 7 |
| | 32 |
| | 26 |
| | — |
| | — |
|
Obligations to GF(3) | 248 |
| | 248 |
| | — |
| | — |
| | — |
| | — |
| | — |
|
Total contractual obligations(4) | $ | 4,059 |
| | $ | 931 |
| | $ | 240 |
| | $ | 230 |
| | $ | 782 |
| | $ | 582 |
| | $ | 1,294 |
|
| |
(1) | Represents aggregate principal amount of the notes, without the effect of associated discounts.
|
(2) | Represents estimated aggregate interest obligations for our outstanding debt obligations that are payable in cash, excluding capital lease obligations. Also excludes non-cash amortization of debt discounts on the 8.125% Notes and the 6.00% Notes. issuance costs. |
| |
(3)(2)
| Includes principal and imputed interest.
|
(4) | We have purchase obligations for goods and services where payments are based, in part, on the volume or type of services we acquire. In those cases, we only included the minimum volume of purchase obligations in the table above. Purchase orders for goods and services that are cancelable upon notice and without significant penalties are not included in the amounts above. In addition, we have included in the table above obligations for software technology and licenses where payments are fixed and non-cancelable. |
| |
(5)(3)
| Includes our purchase obligations to GF for wafer manufacturing and research and development activities and reflects the impact of wafer receipts under the fifth amendment to the WSA delayed into fiscal 2016. As of December 26, 2015, purchase obligations for fiscal 2016 were approximately $248 million, of which approximately $185 million, consisting of wafers and research and development activities, were received by December 31, 2015. We generally negotiate our purchase commitments with GF on an annual basis and as such we cannot meaningfully quantify or estimate our future purchase obligations to GF. We are currently in the process of negotiating a sixth amendment to the WSA, and we expect that our future purchases from GF will continue to be material. |
| |
(4)This | Total amount includes all ourexcludes contractual obligations to GF.already recorded on our consolidated balance sheets except for debt obligations and other long-term liabilities. |
6.00% Convertible Senior Notes due 2015
On April 27, 2007, we issued $2.2 billion aggregate principal amount of our 6.00% Notes. TheIn 2015, we paid off the remaining $42 million in aggregate principal amount of our 6.00% Notes in cash. As of December 26, 2015, we did not have any 6.00% Notes outstanding.
6.75% Senior Notes Due 2019
On February 26, 2014, we issued $600 million of our 6.75% Notes. Our 6.75% Notes are our general unsecured senior obligations. Interest is payable on
MayMarch 1 and
NovemberSeptember 1 of each year beginning
NovemberSeptember 1,
20072014 until the maturity date of
MayMarch 1,
2015. The terms of the 6.00% Notes are governed by an indenture (the 6.00% Indenture) dated April 27, 2007, by and between us and Wells Fargo Bank, National Association, as Trustee.As of December 29, 2012, the outstanding aggregate principal amount of our 6.00% Notes was $580 million and the remaining carrying value was approximately $555 million, net of debt discount of $25 million.
See Note 10 of “Notes to Consolidated Financial Statements,” below, for additional information regarding the 6.00% Notes.
8.125% Senior Notes Due 2017
On November 30, 2009, we issued $500 million of the 8.125% Notes at a discount of 10.204%. The 8.125% Notes are our general unsecured senior obligations. Interest is payable on June 15 and December 15 of each year beginning June 15, 2010 until the maturity date of December 15, 2017. The discount of $51 million is recorded as contra debt and is amortized to interest expense over the life of the 8.125% Notes using the effective interest method. The 8.125%2019. Our 6.75% Notes are governed by the terms of an indenture (the 8.125%6.75% Indenture) dated November 30, 2009February 26, 2014 between us and Wells Fargo Bank, National Association,N.A., as Trustee.
From December 15, 2013,trustee.
At any time before March 1, 2019, we may redeem
some or all of our 6.75% Notes at a price equal to 100% of the
8.125% Notes for cash at the following specified pricesprincipal amount, plus accrued and unpaid
interest: | | | | |
Period | | Price as
Percentage of
Principal Amount | |
Beginning on December 15, 2013 through December 14, 2014
| | | 104.063 | % |
Beginning on December 15, 2014 through December 14, 2015
| | | 102.031 | % |
On December 15, 2015 and thereafter
| | | 100.000 | % |
interest and a “make whole” premium (as set forth in the 6.75% Indenture).
As of December
29, 2012,26, 2015, the outstanding aggregate principal amount of our
8.125%6.75% Notes was
$500 million and the remaining carrying value was approximately $464 million, net of debt discount of $36$600 million.
See Note 10 of “Notes to Consolidated Financial Statements” below, for additional information regarding
the 8.125%our 6.75% Notes.
7.75% Senior Notes Due 2020
On August 4, 2010, we issued $500 million of
theour 7.75% Notes.
TheOur 7.75% Notes are our general unsecured senior obligations. Interest is payable on February 1 and August 1 of each year beginning February 1, 2011 until the maturity date of August 1, 2020.
TheOur 7.75% Notes are governed by the terms of an indenture
(the 7.75% Indenture) dated August 4, 2010 between us and Wells Fargo Bank,
National Association,N.A., as
Trustee.trustee.
From August 1, 2015, we may redeem
theour 7.75% Notes for cash at the following specified prices plus accrued and unpaid interest:
| |
| | |
| Period | | Price as
Percentage of
Principal Amount | |
Beginning on August 1, 2015 through July 31, 2016 | | | 103.875 | % |
Beginning on August 1, 2016 through July 31, 2017 | | | 102.583 | % |
Beginning on August 1, 2017 through July 31, 2018 | | | 101.292 | % |
On August 1, 2018 and thereafter | | | 100.000 | % |
As of December
29, 2012,26, 2015, the outstanding aggregate principal amount of our 7.75% Notes was
$500$450 million.
See Note 10 of “Notes to Consolidated Financial
Statements,”Statements” below, for additional information regarding
theour 7.75% Notes.
7.50% Senior Notes Due 2022
On August 15, 2012, we issued $500 million of
our 7.50%
Senior Notes due 2022. TheNotes. Our 7.50% Notes are our general unsecured senior obligations. Interest is payable on February 15 and August 15 of each year beginning February 15, 2013 until the maturity date of August 15, 2022. The 7.50% Notes are governed by the terms of an indenture
(the 7.50% Indenture) dated August 15, 2012 between us and Wells Fargo Bank,
National Association,N.A., as
Trustee.trustee.
Prior to August 15, 2022, we may redeem some or all of our 7.50% Notes at a price equal to 100% of the principal amount, plus accrued and unpaid interest and a “make whole” premium (as set forth in the 7.50% Indenture).
As of December
29, 2012,26, 2015, the outstanding aggregate principal amount of our 7.50% Notes was
$500$475 million.
See Note 10 of “Notes to Consolidated Financial Statements” below, for additional information regarding
theour 7.50% Notes.
7.00% Senior Notes Due 2024
On June 16, 2014, we issued $500 million of 7.00% Notes. The 7.00% Notes are our general unsecured senior obligations. Interest is payable on January 1 and July 1 of each year beginning January 1, 2015 until the maturity date of July 1, 2024. The 7.00% Notes are governed by the terms of an indenture (the 7.00% Indenture) dated June 16, 2014 between us and Wells Fargo Bank, N.A., as trustee.
At any time before July 1, 2017, we may redeem up to 35% of the aggregate principal amount of the 7.00% Notes within 90 days of the closing of an equity offering with the net proceeds thereof at a redemption price equal to 107.000% of the principal amount thereof, together with accrued and unpaid interest to but excluding the date of redemption. Prior to July 1, 2019, we may redeem some or all of the 7.00% Notes at a price equal to 100% of the principal amount, plus accrued and unpaid interest and a “make whole” premium (as set forth in the 7.00% Indenture).
Starting July 1, 2019, we may redeem our 7.00% Notes for cash at the following specified prices plus accrued and unpaid interest:
|
| |
Period | Price as Percentage of Principal Amount |
| Beginning on July 1, 2019 through June 30, 2020 | 103.500% |
| Beginning on July 1, 2020 through June 30, 2021 | 102.333% |
| Beginning on July 1, 2021 through June 30, 2022 | 101.167% |
| On July 1, 2022 and thereafter | 100.000% |
As of December 26, 2015, the outstanding aggregate principal amount of our 7.00% Notes was $500 million.
See Note 10 of “Notes to Consolidated Financial Statements” below, for additional information regarding our 7.00% Notes.
Potential Repurchase of Outstanding Notes
We may elect to purchase or otherwise retire
the balance of the 6.00% Notes, 8.125%our 6.75% Notes, 7.75% Notes,
7.50% Notes and
7.50%7.00% Notes with cash, stock or other assets from time to time in open market or privately negotiated transactions, either directly or through intermediaries, or by tender offer when we believe the market conditions are favorable to do so.
Secured Revolving Line of Credit
Loan and Security Agreement
We and our subsidiary, AMD International Sales & Service, Ltd. (together, the Borrowers), entered into a loan and security agreement on November 12, 2013, as amended on December 11, 2014 (the Loan Agreement) for our Secured Revolving Line of Credit for a principal amount of up to $500 million, with up to $75 million available for issuance of letters of credit, with a group of lenders and Bank of America, N.A., acting as agent for the lenders (the Agent). Our Secured Revolving Line of Credit had a maturity date of November 12, 2018. Borrowings under our Secured Revolving Line of Credit were limited to up to 85% of eligible account receivable minus certain reserves and may be used for general corporate purposes, including working capital needs.
Amended and Restated Loan and Security Agreement
On April 14, 2015, the Borrowers and ATI Technologies ULC (together with the Borrowers, the Loan Parties), amended and restated the Loan Agreement (the Amended and Restated Loan Agreement) by and among the Loan Parties, the financial institutions party thereto from time to time as lenders (the Lenders) and the Agent.
The Amended and Restated Loan Agreement provides for a Secured Revolving Line of Credit for a principal amount of up to $500 million with up to $75 million available for issuance of letters of credit, which remained unchanged from the Loan Agreement. Borrowings under the Secured Revolving Line of Credit are limited to up to 85% of eligible accounts receivable (90% for certain qualified eligible accounts receivable), minus specified reserves. The size of the commitments under the Secured Revolving Line of Credit may be increased by up to an aggregate amount of $200 million.
The Secured Revolving Line of Credit matures on April 14, 2020 and is secured by a first priority security interest in the Loan Parties’ accounts receivable, inventory, deposit accounts maintained with the Agent and other specified assets, including books and records.
The Borrowers may elect a per annum interest rate equal to (a) the London Interbank Offered Rate (LIBOR) plus the applicable margin set forth in the applicable chart below (the “Applicable Margin”) as determined by the average availability under the Secured Revolving Line of Credit and the fixed charge coverage ratio for the most recently ended four-fiscal quarter period; or (b) (i) the greatest of (x) the Agent’s prime rate, (y) the federal funds rate, as published by the Federal Reserve Bank of New York plus 0.50%, and (z) LIBOR for a one-month period plus 1.00%, plus (ii) the Applicable Margin.
Applicable Margin, if average availability is equal to or greater than 66.66% of the total commitment amount and the fixed charge coverage ratio for the most recently ended four-fiscal quarter period is greater than or equal to 1.25 to 1.00, is 0.25% for Base Rate Revolver Loans and 1.25% for LIBOR Revolver Loans. Otherwise, Applicable Margin is determined in accordance with the below table:
|
| | | | | | |
| Level | | Average Availability for Last Fiscal Month | | Base Rate Revolver Loans: Applicable Margin | | LIBOR Revolver Loans: Applicable Margin |
| I | | greater than or equal to 66.66% of the Revolver Commitment | | 0.5% | | 1.5% |
| II | | greater than or equal to 33.33% of the Revolver Commitment, less than 66.66% | | 0.75% | | 1.75% |
| III | | less than 33.33% of the Revolver Commitment | | 1% | | 2% |
The Secured Revolving Line of Credit may be optionally prepaid or terminated, and unutilized commitments may be reduced at any time, in each case without premium or penalty. In connection with the Secured Revolving Line of Credit, the Borrowers will pay an unused line fee equal to 0.375% per annum, payable monthly on the unused amount of the commitments under the Secured Revolving Line of Credit. The unused line fee decreases to 0.25% per annum when 35% or more of the Secured Revolving Line of Credit is utilized. The Borrowers will pay (i) a monthly fee on all letters of credit outstanding under the Secured Revolving Line of Credit equal to the applicable LIBOR margin and (ii) a fronting fee to the Agent equal to 0.125% of all such letters of
credit, payable monthly in arrears.
The Amended and Restated Loan Agreement contains covenants that place certain restrictions on the Loan Parties’ ability to, among other things, allow certain of the Company’s subsidiaries that manufacture or process inventory for the Loan Parties to borrow secured debt or unsecured debt beyond a certain amount, amend or modify certain terms of any debt of $50 million or more or subordinated debt, create or suffer to exist any liens upon accounts or inventory, sell or transfer any of Loan Parties’ accounts or inventory other than certain ordinary-course transfers and certain supply chain finance arrangements, make certain changes to any Loan Party’s name or form or state of organization without notifying the Agent, liquidate, dissolve, merge, amalgamate, combine or consolidate, or become a party to certain agreements restricting the Loan Parties’ ability to incur or repay debt, grant liens, make distributions, or modify loan agreements.
Further restrictions apply when certain payment conditions (the Payment Conditions) are not satisfied with respect to specified transactions, events or payments. The Payment Conditions include that (i) no default or event of default exists and (ii) at all times during the 45 consecutive days immediately prior to such transaction, event or payment and on a pro forma basis after giving effect to such transaction, event or payment and any incurrence or repayment of indebtedness in connection therewith, the Loan Parties’ Excess Cash Availability (as defined in the Amended and Restated Loan Agreement) is greater than the greater of 20% of the total commitment amount and $100 million. Such restrictions limit the Loan Parties’ ability to, among other things, create any liens upon any of the Loan Parties’ property other than customary permitted liens and liens on up to $1.5 billion of secured credit facilities debt (which amount includes the Secured Revolving Line of Credit), declare or make cash distributions, create any encumbrance on the ability of a subsidiary to make any upstream payments, make asset dispositions other than certain ordinary course dispositions and certain supply chain finance arrangements, make certain loans, make payments with respect to subordinated debt or certain borrowed money prior to its due date or become a party to certain agreements restricting the Loan Parties’ ability to enter into any non arm’s-length transaction with an affiliate.
The Loan Parties are required to repurchase, redeem, defease, repay, create a segregated account for the repayment of, or request Agent to reserve a sufficient available amount under the Secured Revolving Line of Credit for the repayment of, all debt for borrowed money exceeding $50 million, by no later than 60 days prior to its maturity date (not including the Secured Revolving Line of Credit). Any reserved funds for this purpose would not be included in domestic cash calculations.
In addition, if at any time the Loan Parties’ Excess Cash Availability is less than the greater of 15% of the total commitment amount and $75 million, the Loan Parties must maintain a minimum fixed charge coverage ratio of 1.00 to 1.00 until (i) no event of default exists and (ii) the Loan Parties’ Excess Cash Availability is greater than the greater of 15% of the total commitment amount and $75 million for 45 consecutive days.
The events of default under the Amended and Restated Loan Agreement include, among other things, payment defaults, the inaccuracy of representations or warranties, defaults in the performance of affirmative and negative covenants, bankruptcy and insolvency related defaults, a cross-default related to indebtedness in an aggregate amount in excess of $50 million, judgments entered against a Loan Party in an amount that exceeds cumulatively $50 million, certain ERISA events and events related to Canadian defined benefits plans and a change of control. When a Payment Condition has not been satisfied, additional events of default include, among other things, a loss, theft damage or destruction with respect to any collateral if the amount not covered by insurance exceeds $50 million.
First Amendment to Amendment and Restated Loan and Security Agreement
On June 10, 2015, the Loan Parties entered into a First Amendment to the Amended and Restated Loan and Security Agreement (the “First Amendment”) by and among the Loan Parties, the Lenders and the Agent, which modifies the Amended and Restated Loan Agreement. Amendments to the Amended and Restated Loan Agreement effected by the First Amendment include the addition of exceptions to the liens and asset sale covenants to permit the Loan Parties to enter into certain supply chain finance arrangements, as well as the addition of certain definitions related thereto.
At December 26, 2015 and December 27, 2014, the Secured Revolving Line of Credit had an outstanding loan balance of $230 million and $130 million, respectively, at an interest rate of 4.00% and 4.25%, respectively. At December 26, 2015, the Secured Revolving Line of Credit also had $16 million related to outstanding Letters of Credit, and up to $87 million available for future borrowings. We report our intra-period changes in our revolving credit balance on a net basis in our consolidated statement of cash flows as we intend the period of the borrowings to be brief, repaying borrowed amounts within 90 days. As of December 26, 2015, we were in compliance with all required covenants stated in the Loan Agreement.
The agreements governing our 6.00% Notes, 8.125%the 6.75% Notes, 7.75% Notes, and 7.50% Notes, 7.00% Notes and the Secured Revolving Line of Credit contain cross-default provisions whereby a default under one agreement would likely result in cross defaults under agreements covering other borrowings. The occurrence of a default under any of these borrowing arrangements would permit the
applicable note holders
or the lenders under the Secured Revolving Line of Credit to declare all amounts outstanding under those borrowing arrangements to be immediately due and payable.
Other Long-Term Liabilities
Other long-term liabilities in the contractual obligations table above include primarily $9consisted of $40 million of payments due under certain software and technology licenses that will be paid through 2014. 2018.
Other long-term liabilities in the contractual obligations table above exclude amounts recorded on our consolidated balance sheet that do not require us to make cash payments, which, as of December
29, 2012,26, 2015, primarily consisted of
$13$18 million of deferred gains resulting from
certain real estate transactions that occurred in Sunnyvale, California in 1998, in Markham, Ontario, Canada in 2015 and 2008 and in Singapore in 2013. Accruals related to facility consolidation and site closure costs under our restructuring plans of $7 million, deferred rent related to our facilities in Sunnyvale, California of $6 million and operating lease accruals of $5 million are excluded from other long-term liabilities in the
sale and leaseback of certain of our facilities.contractual obligations table above as they are included in the operating leases obligations. Also excluded from other long-term liabilities in the contractual obligations table above
was $2are $4 million of environmental reserves and $4 million of non-current unrecognized tax benefits, which
are included in the caption “Other long-term liabilities” on our consolidated balance sheet at December 29, 2012. This amount represents arepresent potential cash
paymentpayments that could be payable by us upon
settlementsettlements with
a taxing authority.the related authorities. We have not included
this amountthese amounts in the contractual obligations table above because we cannot make
a reasonably reliable
estimateestimates regarding the timing of
any settlementthe settlements with the
taxing authority,related authorities, if any.
Capital Lease Obligations
As of December 29, 2012, we had aggregate outstanding
We terminated our capital lease obligations
of $23 million forand entered into a non-cancelable operating lease agreement related to one of our facilities in
Markham, Ontario, Canada
which is payable in monthly installments through 2017.during 2015. As of December 26, 2015, we did not have any capital lease obligations outstanding.
We lease certain of our facilities, and in some
jurisdictions. Wejurisdictions, we lease the land on which these facilities are built under non-cancelable lease agreements that expire at various dates through
2022.2028. We lease certain manufacturing and office equipment for terms ranging from
1one to
5five years. Total future non-cancelable lease obligations as of December
29, 201226, 2015 were
$160 million.$306 million, including approximately $251 million of future lease payments and estimated operating costs related to real estate transactions that occurred in Austin, Texas, Sunnyvale, California, Markham, Canada and Singapore.
Our purchase obligations primarily include our obligations to purchase wafers and substrates from third parties, excluding our wafer purchase commitments to GF under the WSA. As of December
29, 2012,26, 2015, total non-cancelable purchase obligations were
$299$319 million.
Obligations to GF
representsrepresent all
of our
contractual obligationsexpected cash payments to GF
includingbased on wafer receipts and research and development activities. As of December 26, 2015, purchase obligations for fiscal 2016 were approximately
$1.15 billion$248 million, of
our wafer purchase commitments for 2013which amount wafers and
$250research and development activities of approximately $185 million
forwere received by December 31, 2015. We are currently in the
first quarterprocess of
2014 and other payables under the WSA as described below.Under the secondnegotiating a sixth amendment to the WSA and we expect that our future purchases from GF granted us certain rightswill continue to contract with another wafer foundry supplier with respect to specified products for a specified period. In consideration for these rights, we agreed to pay GF $425 million and transfer to GF all of the capital stock of GF that we owned, directly or
indirectly. Of the $425 million, we paid $250 million as of December 29, 2012. The remaining payment of $175 million was paid on December 31, 2012. As security for a portion of the payment, we issued a $225 million promissory note to GF. be material.
Off-Balance Sheet Arrangements
As of December
29, 2012, the outstanding balance under this promissory note was $175 million. We paid all the amounts due for the partial waiver of exclusivity. Accordingly, this promissory note is26, 2015, we had no
longer outstanding.Under the third amendment to the WSA, GF agreed to waive a portion of our wafer purchase commitments for the fourth quarter of 2012. In consideration of this waiver, we agreed to pay GF a fee of $320 million. Of the $320 million fee, we paid $80 million as of December 29, 2012. The remaining payments are $40 million by April 1, 2013 and $200 million by December 31, 2013. As security for the final payment, we issued a $200 million promissory note to GF. As of December 29, 2012, the outstanding balance under this promissory note was $200 million.
off-balance sheet arrangements.
| |
| ITEM 7A. | QUANTITATIVE AND QUALITATIVE DISCLOSURE ABOUT MARKET RISK |
Interest Rate Risk. Our exposure to market risk for changes in interest rates relates primarily to our investment portfolio and long-term debt. We usually invest our cash in investments with short maturities or with frequent interest reset terms. Accordingly, our interest income fluctuates with short-term market conditions. As of December 29, 2012,26, 2015, our investment portfolio consisted primarily of time deposits, money market funds, commercial paper, ARS, and corporate bonds. With the exception of our ARS, thesepaper. These investments were highly liquid. Due to the relatively short, weighted-average maturity of our investment portfolio and the current low interest rate environment, our exposure to interest rate risk is minimal. As of December
29, 2012, all26, 2015, the majority of our outstanding debt had fixed interest rates. Consequently, our exposure to market risk for changes in interest rates on reported interest expense and corresponding cash flows is minimal.
We will continue to monitor our exposure to interest rate risk.
Default Risk. We mitigate default risk in our investment portfolio by investing in only high credit quality securities and by constantly positioning our portfolio to respond to a significant reduction in a credit rating of any investment issuer or guarantor. Our portfolio includes investments in debt and marketable equity securities with active secondary or resale markets to ensure portfolio liquidity. We are averse to principal loss and strive to preserve our invested funds by limiting default risk and market risk. We actively monitor market conditions and developments specific to the securities and security classes in which we invest. We believe that we take a conservative approach to investing our funds in that we invest only in highly-rated debt securities with relatively short maturities and do not invest in securities we believe involve a higher degree of risk. As of December
29, 2012,26, 2015, substantially all of our investments in debt securities were A rated by at least one of the rating agencies. While we believe we take prudent measures to mitigate investment related risks, such risks cannot be fully eliminated as there are circumstances outside of our control.
As a result
There were no sales of
the uncertainties in the credit markets, all of our ARS were negatively affected and auctions for theseavailable-for-sale securities
failed to settle on their respective settlement dates since February 2008. As of December 29, 2012, the par value of our ARS was $37 million, with an estimated fair value of $28 million. See “Part II, Item 7—Management’s Discussion and Analysis of Financial Condition and Results of Operations” in this report for further information.during 2015.
The following table presents the cost basis, fair value and related weighted-average interest rates by year of maturity for our investment portfolio and debt obligations as of December
29, 2012: | | | | | | | | | | | | | | | | | | | | | | | | | | | | | | | | |
| | | 2013 | | | 2014 | | | 2015 | | | 2016 | | | 2017 | | | 2018 and
thereafter | | | Total | | | 2012
Fair Value | |
| | | (In millions, except for percentages) | |
Investment Portfolio | | | | | | | | | | | | | | | | | | | | | | | | | | | | | | | | |
Cash equivalents: | | | | | | | | | | | | | | | | | | | | | | | | | | | | | | | | |
Fixed rate amounts | | $ | 75 | | | $ | — | | | $ | — | | | $ | — | | | $ | — | | | $ | — | | | $ | 75 | | | $ | 75 | |
Weighted-average rate | | | 0.30 | % | | | — | | | | — | | | | — | | | | — | | | | — | | | | 0.30 | % | | | | |
Variable rate amounts | | $ | 402 | | | $ | — | | | $ | — | | | $ | — | | | $ | — | | | $ | — | | | $ | 402 | | | $ | 402 | |
Weighted-average rate | | | 0.15 | % | | | — | | | | — | | | | — | | | | — | | | | — | | | | 0.15 | % | | | | |
Marketable securities | | | | | | | | | | | | | | | | | | | | | | | | | | | | | | | | |
Fixed rate amounts | | $ | 424 | | | $ | — | | | $ | — | | | $ | — | | | $ | — | | | $ | — | | | $ | 424 | | | $ | 424 | |
Weighted-average rate | | | 0.53 | % | | | — | | | | — | | | | — | | | | — | | | | — | | | | 0.53 | % | | | | |
Variable rate amounts | | $ | — | | | $ | — | | | $ | — | | | $ | — | | | $ | — | | | $ | 37 | | | $ | 37 | | | $ | 28 | |
Weighted-average rate | | | — | | | | — | | | | — | | | | — | | | | — | | | | 1.71 | % | | | 1.71 | % | | | | |
Long-term investments: | | | | | | | | | | | | | | | | | | | | | | | | | | | | | | | | |
Fixed rate amounts | | $ | 144 | | | $ | 24 | | | $ | — | | | $ | — | | | $ | — | | | $ | — | | | $ | 168 | | | $ | 168 | |
Weighted-average rate | | | 1.03 | % | | | 0.47 | % | | | — | | | | — | | | | — | | | | — | | | | 0.95 | % | | | | |
Variable rate amounts | | $ | 23 | | | $ | — | | | $ | — | | | $ | — | | | $ | — | | | $ | — | | | $ | 23 | | | $ | 23 | |
Weighted-average rate | | | 0.12 | % | | | — | | | | — | | | | — | | | | — | | | | — | | | | 0.12 | % | | | | |
Total Investment Portfolio | | $ | 1,068 | | | $ | 24 | | | $ | — | | | $ | — | | | $ | — | | | $ | 37 | | | $ | 1,129 | | | $ | 1,120 | |
Debt Obligations | | | | | | | | | | | | | | | | | | | | | | | | | | | | | | | | |
Fixed rate amounts | | $ | — | | | $ | — | | | $ | 555 | | | $ | — | | | $ | 464 | | | $ | 1,000 | | | $ | 2,019 | | | $ | 1,837 | |
Weighted-average effective interest rate | | | — | | | | — | | | | 8.00 | % | | | — | | | | 10.00 | % | | | 7.63 | % | | | 8.27 | % | | | 9.09 | % |
Total Debt Obligations | | $ | — | | | $ | — | | | $ | 555 | | | $ | — | | | $ | 464 | | | $ | 1,000 | | | $ | 2,019 | | | $ | 1,837 | |
26, 2015:
|
| | | | | | | | | | | | | | | | | | | | | | | | | | | | | | | |
| | 2016 | | 2017 | | 2018 | | 2019 | | 2020 | | 2021 and thereafter | | Total | | 2015
Fair Value |
| | (In millions, except for percentages) |
| Investment Portfolio | | | | | | | | | | | | | | | |
| Cash equivalents: | | | | | | | | | | | | | | | |
| Fixed rate amounts | $ | 376 |
| | $ | — |
| | $ | — |
| | $ | — |
| | $ | — |
| | $ | — |
| | $ | 376 |
| | $ | 376 |
|
| Weighted-average rate | 0.27 | % | | — |
| | — |
| | — |
| | — |
| | — |
| | 0.27 | % | | 0.27 | % |
| Total Investment Portfolio | $ | 376 |
| | $ | — |
| | $ | — |
| | $ | — |
| | $ | — |
| | $ | — |
| | $ | 376 |
| | $ | 376 |
|
| Debt Obligations | | | | | | | | | | | | | | | |
| Fixed rate amounts | $ | — |
| | $ | — |
| | $ | — |
| | $ | 600 |
| | $ | 450 |
| | $ | 975 |
| | $ | 2,025 |
| | $ | 1,372 |
|
| Weighted-average effective interest rate | — | % | | — | % | | — | % | | 6.75 | % | | 7.75 | % | | 7.24 | % | | 6.88 | % | | 10.64 | % |
| Variable rate amounts | $ | 230 |
| | $ | — |
| | $ | — |
| | $ | — |
| | $ | — |
| | $ | — |
| | $ | 230 |
| | $ | 230 |
|
| Weighted-average effective interest rate | 4.00 | % | | — | % | | — | % | | — | % | | — | % | | — | % | | — | % | | 4.00 | % |
| Total Debt Obligations | $ | 230 |
| | $ | — |
| | $ | — |
| | $ | 600 |
| | $ | 450 |
| | $ | 975 |
| | $ | 2,255 |
| | $ | 1,602 |
|
Foreign Exchange Risk. As a result of our foreign operations, we incur costs and we carry assets and liabilities that are denominated in foreign currencies, primarily the Canadian dollar, while sales of products are primarily denominated in U.S. dollars. We maintain a foreign currency hedging strategy, which uses derivative financial instruments to mitigate the risks associated with changes in foreign currency exchange rates. This strategy takes into consideration all of our exposures. We do not use derivative financial instruments for trading or speculative purposes.
In applying our strategy, from time to time, we use foreign currency forward contracts to hedge certain forecasted expenses denominated in foreign
currencies, primarily the Canadian dollar.currencies. We designate these contracts as cash flow hedges of forecasted expenses, to the extent eligible under the accounting rules, and evaluate hedge effectiveness prospectively and retrospectively. As such, the effective portion of the gain or loss on these contracts is reported as a component of accumulated other comprehensive income (loss) and reclassified to earnings in the same line item as the associated forecasted transaction and in the same period during which the hedged transaction affects earnings. Any ineffective portion is immediately recorded in earnings.
During the first quarter of 2011, we reassessed our hedging needs related to our Euro foreign exchange contracts and liquidated our Euro currency forward contracts. As a result, during 2011, we recorded a gain of $6 million in other income (expense), net, in our consolidated statement of operations. We may economically hedge any material Euro exposure by entering into Euro currency forward contracts we identify in the future.
We also use, from time to time, foreign currency forward contracts to economically hedge recognized foreign currency exposures on the balance sheets of various
subsidiaries, primarily those denominated in Canadian dollars.subsidiaries. We do not designate these forward contracts as hedging instruments. Accordingly, the gain or loss associated with these contracts is immediately recorded in earnings.
The following table provides information about our foreign currency forward contracts as of December
29, 201226, 2015 and December
31, 2011.27, 2014. All of our foreign currency forward contracts mature within 12 months.
| | | | | | | | | | | | | | | | | | | | | | | | |
| | | December 29, 2012 | | | December 31, 2011 | |
| | | Notional
Amount | | | Average
Contract
Rate | | | Estimated
Fair Value
Gain (Loss) | | | Notional
Amount | | | Average
Contract
Rate | | | Estimated
Fair Value
Gain (Loss) | |
| | | (In millions except contract rates) | |
Foreign currency forward contracts: | | | | | | | | | | | | | | | | | | | | | | | | |
Canadian Dollar | | $ | 142 | | | | 0.9993 | | | $ | — | | | $ | 141 | | | | 1.0067 | | | $ | (2 | ) |
Euro | | | — | | | | — | | | | — | | | | — | | | | — | | | | — | |
Total | | $ | 142 | | | | | | | $ | — | | | $ | 141 | | | | | | | $ | (2 | ) |
|
| | | | | | | | | | | | | | | | | | | | | |
| December 26, 2015 | | December 27, 2014 |
| Notional Amount | | Average Contract Rate | | Estimated Fair Value Gain (Loss) | | Notional Amount | | Average Contract Rate | | Estimated Fair Value Gain (Loss) |
| | (In millions except contract rates) |
| Foreign currency forward contracts: | | | | | | | | | | | |
| Canadian Dollar | $ | 77 |
| | 1.2941 |
| | $ | (4.9 | ) | | $ | 143 |
| | 1.1264 |
| | $ | (5.0 | ) |
| Malaysian Ringgit | 17 |
| | 4.0581 |
| | (1.1 | ) | | 42 |
| | 3.5482 |
| | — |
|
| Indian Rupee | 25 |
| | 68.856 |
| | 0.2 |
| | 35 |
| | 64.1608 |
| | (1.1 | ) |
| Singapore Dollar | 24 |
| | 1.4033 |
| | (0.1 | ) | | 33 |
| | 1.313 |
| | (0.4 | ) |
| Taiwan Dollar | 13 |
| | 31.868 |
| | (0.4 | ) | | 23 |
| | 31.1284 |
| | (0.4 | ) |
| Chinese Renminbi | — |
| | — |
| | — |
| | 22 |
| | 6.1906 |
| | 0.1 |
|
| Total | $ | 156 |
| | | | $ | (6.3 | ) | | $ | 298 |
| | | | $ | (6.8 | ) |
In addition, we use fixed-to-floating interest rate swaps to manage a portion of our exposure to interest rate risk by converting fixed rate interest payments of a portion of our 6.75% Notes to floating rate interest payments based on LIBOR. The notional amount of the interest rate swap we entered into was $250 million as of December 26, 2015. The interest rate swaps are designated as a fair value hedge. All changes in fair value of the swaps are recorded on our consolidated balance sheets with no net impact to our consolidated statements of operations.
| |
| ITEM 8. | FINANCIAL STATEMENTS AND SUPPLEMENTARY DATA |
Advanced Micro Devices, Inc.
Consolidated Statements of Operations
| | | | | | | | | | | | |
| | | Year Ended | |
| | | December 29,
2012 | | | December 31,
2011 | | | December 25,
2010 | |
| | | (In millions, except per share amounts) | |
Net revenue | | $ | 5,422 | | | $ | 6,568 | | | $ | 6,494 | |
Cost of sales | | | 4,187 | | | | 3,628 | | | | 3,533 | |
Gross margin | | | 1,235 | | | | 2,940 | | | | 2,961 | |
Research and development | | | 1,354 | | | | 1,453 | | | | 1,405 | |
Marketing, general and administrative | | | 823 | | | | 992 | | | | 934 | |
Legal settlement | | | — | | | | — | | | | (283 | ) |
Amortization of acquired intangible assets | | | 14 | | | | 29 | | | | 61 | |
Restructuring charges (reversals), net | | | 100 | | | | 98 | | | | (4 | ) |
Operating income (loss) | | | (1,056 | ) | | | 368 | | | | 848 | |
Interest income | | | 8 | | | | 10 | | | | 11 | |
Interest expense | | | (175 | ) | | | (180 | ) | | | (199 | ) |
Other income (expense), net | | | 6 | | | | (199 | ) | | | 311 | |
Income (loss) before equity income (loss) and dilution gain in investees and income taxes | | | (1,217 | ) | | | (1 | ) | | | 971 | |
Provision (benefit) for income taxes | | | (34 | ) | | | (4 | ) | | | 38 | |
Equity income (loss) and dilution gain in investee, net | | | — | | | | 492 | | | | (462 | ) |
Income (loss) from continuing operations | | | (1,183 | ) | | | 495 | | | | 471 | |
Loss from discontinued operations, net of tax | | | — | | | | (4 | ) | | | — | |
Net income (loss) | | $ | (1,183 | ) | | $ | 491 | | | $ | 471 | |
Net income (loss) per common share | | | | | | | | | | | | |
Basic | | | | | | | | | | | | |
Continuing operations | | $ | (1.60 | ) | | $ | 0.68 | | | $ | 0.66 | |
Discontinued operations | | | — | | | | (0.01 | ) | | | — | |
Basic net income (loss) per common share | | $ | (1.60 | ) | | $ | 0.68 | | | $ | 0.66 | |
Diluted | | | | | | | | | | | | |
Continuing operations | | $ | (1.60 | ) | | $ | 0.67 | | | $ | 0.64 | |
Discontinued operations | | | — | | | | (0.01 | ) | | | — | |
Diluted net income per common share | | $ | (1.60 | ) | | $ | 0.66 | | | $ | 0.64 | |
Shares used in per share calculation | | | | | | | | | | | | |
Basic | | | 741 | | | | 727 | | | | 711 | |
Diluted | | | 741 | | | | 742 | | | | 733 | |
|
| | | | | | | | | | | |
| Year Ended |
| December 26,
2015 | | December 27,
2014 | | December 28,
2013 |
| | (In millions, except per share amounts) |
| Net revenue | $ | 3,991 |
| | $ | 5,506 |
| | $ | 5,299 |
|
| Cost of sales | 2,911 |
| | 3,667 |
| | 3,321 |
|
| Gross margin | 1,080 |
| | 1,839 |
| | 1,978 |
|
| Research and development | 947 |
| | 1,072 |
| | 1,201 |
|
| Marketing, general and administrative | 482 |
| | 604 |
| | 674 |
|
| Amortization of acquired intangible assets | 3 |
| | 14 |
| | 18 |
|
| Restructuring and other special charges, net | 129 |
| | 71 |
| | 30 |
|
| Goodwill impairment charge | — |
| | 233 |
| | — |
|
| Legal settlements, net | — |
| | — |
| | (48 | ) |
| Operating income (loss) | (481 | ) | | (155 | ) | | 103 |
|
| Interest expense | (160 | ) | | (177 | ) | | (177 | ) |
| Other expense, net | (5 | ) | | (66 | ) | | — |
|
| Loss before income taxes | (646 | ) | | (398 | ) | | (74 | ) |
| Provision for income taxes | 14 |
| | 5 |
| | 9 |
|
| Net loss | $ | (660 | ) | | $ | (403 | ) | | $ | (83 | ) |
| Net loss per share | | | | | |
| Basic | $ | (0.84 | ) | | $ | (0.53 | ) | | $ | (0.11 | ) |
| Diluted | $ | (0.84 | ) | | $ | (0.53 | ) | | $ | (0.11 | ) |
| Shares used in per share calculation | | | | | |
| Basic | 783 |
| | 768 |
| | 754 |
|
| Diluted | 783 |
| | 768 |
| | 754 |
|
See accompanying notes to consolidated financial statements.
Advanced Micro Devices, Inc.
Consolidated Statements of Comprehensive
Income (Loss) | | | | | | | | | | | | |
| | | Year Ended | |
| | | December 29,
2012 | | | December 31,
2011 | | | December 25,
2010 | |
| | | (In millions) | |
Net income (loss) | | $ | (1,183 | ) | | $ | 491 | | | $ | 471 | |
Other comprehensive income (loss): | | | | | | | | | | | | |
Unrealized gains (losses) on available-for-sale securities: | | | | | | | | | | | | |
Unrealized gains (losses) arising during period, net of tax effect of zero | | | 1 | | | | 5 | | | | 2 | |
Less: reclassification adjustment for (gains) losses included in net income (loss), net of tax effect of zero | | | — | | | | (4 | ) | | | (17 | ) |
| | | | 1 | | | | 1 | | | | (15 | ) |
Unrealized gains (losses) on cash flow hedges: | | | | | | | | | | | | |
Unrealized gains (losses) arising during period, net of tax effect of $1, $0 and $0 | | | 1 | | | | (5 | ) | | | 9 | |
Less: reclassification adjustment for (gains) losses included in net income (loss), net of tax effect of zero | | | — | | | | (3 | ) | | | (5 | ) |
| | | | 1 | | | | (8 | ) | | | 4 | |
Cumulative translation adjustments related to GLOBALFOUNDRIES | | | — | | | | 1 | | | | (142 | ) |
Total other comprehensive income (loss) | | | 2 | | | | (6 | ) | | | (153 | ) |
Total comprehensive income (loss) | | $ | (1,181 | ) | | $ | 485 | | | $ | 318 | |
Loss
|
| | | | | | | | | | | |
| Year Ended |
| | December 26,
2015 | | December 27,
2014 | | December 28,
2013 |
| | (In millions) |
| Net loss | $ | (660 | ) | | $ | (403 | ) | | $ | (83 | ) |
| Other comprehensive income (loss): | | | | | |
| Unrealized gains (losses) on available-for-sale securities: | | | | | |
| Unrealized gains (losses) arising during period, net of tax effect of $0 | (2 | ) | | — |
| | (1 | ) |
| Reclassification adjustment for (gains) losses realized and included in net loss, net of tax effect of $0 | — |
| | — |
| | 2 |
|
| Total change in unrealized gains (losses) on available-for-sale securities, net of tax | (2 | ) | | — |
| | 1 |
|
| Unrealized gains (losses) on cash flow hedges: | | | | | |
| Unrealized gains (losses) arising during period, net of tax effect of $0 | (22 | ) | | (9 | ) | | (6 | ) |
| Reclassification adjustment for (gains) losses realized and included in net loss, net of tax effect of $0, $0 and $3 | 21 |
| | 6 |
| | 6 |
|
| Total change in unrealized gains (losses) on cash flow hedges, net of tax | (1 | ) | | (3 | ) | | — |
|
| Total other comprehensive income (loss) | (3 | ) | | (3 | ) | | 1 |
|
| Total comprehensive loss | $ | (663 | ) | | $ | (406 | ) | | $ | (82 | ) |
See accompanying notes to consolidated financial statements.
Advanced Micro Devices, Inc.
Consolidated Balance Sheets
| | | | | | | | |
| | | December 29,
2012 | | | December 31,
2011 | |
| | | (In millions, except par value
amounts) | |
| ASSETS | | | | | | | | |
Current assets: | | | | | | | | |
Cash and cash equivalents | | $ | 549 | | | $ | 869 | |
Marketable securities | | | 453 | | | | 896 | |
Total cash and cash equivalents and marketable securities | | | 1,002 | | | | 1,765 | |
Accounts receivable, net | | | 630 | | | | 919 | |
Inventories, net | | | 562 | | | | 476 | |
Prepaid expenses and other current assets | | | 71 | | | | 69 | |
Total current assets | | | 2,265 | | | | 3,229 | |
Long-term marketable securities | | | 181 | | | | 149 | |
Property, plant and equipment, net | | | 658 | | | | 726 | |
Investment in GLOBALFOUNDRIES | | | — | | | | 278 | |
Acquisition related intangible assets, net | | | 96 | | | | 8 | |
Goodwill | | | 553 | | | | 323 | |
Other assets | | | 247 | | | | 241 | |
Total assets | | $ | 4,000 | | | $ | 4,954 | |
| LIABILITIES AND STOCKHOLDERS’ EQUITY | | | | | | | | |
Current liabilities: | | | | | | | | |
Accounts payable | | $ | 278 | | | $ | 363 | |
Payable to GLOBALFOUNDRIES | | | 454 | | | | 177 | |
Accrued liabilities | | | 489 | | | | 550 | |
Deferred income on shipments to distributors | | | 108 | | | | 123 | |
Current portion of long-term debt and capital lease obligations | | | 5 | | | | 489 | |
Other current liabilities | | | 63 | | | | 72 | |
Total current liabilities | | | 1,397 | | | | 1,774 | |
Long-term debt and capital lease obligations, less current portion | | | 2,037 | | | | 1,527 | |
Other long-term liabilities | | | 28 | | | | 63 | |
Commitments and contingencies (see Notes 15 and 16) | | | | | | | | |
Stockholders’ equity: | | | | | | | | |
Capital stock: | | | | | | | | |
Common stock, par value $0.01; 1,500 shares authorized on December 29, 2012 and December 31, 2011; shares issued: 722 shares on December 29, 2012 and 706 on December 31, 2011; shares outstanding: 713 shares on December 29, 2012 and 698 shares on December 31, 2011 | | | 7 | | | | 7 | |
Additional paid-in capital | | | 6,803 | | | | 6,672 | |
Treasury stock, at cost (9 shares on December 29, 2012 and December 31, 2011) | | | (109 | ) | | | (107 | ) |
Accumulated deficit | | | (6,160 | ) | | | (4,977 | ) |
Accumulated other comprehensive loss | | | (3 | ) | | | (5 | ) |
Total stockholders’ equity | | | 538 | | | | 1,590 | |
Total liabilities and stockholders’ equity | | $ | 4,000 | | | $ | 4,954 | |
|
| | | | | | | |
| | December 26,
2015 | | December 27,
2014 |
| | (In millions, except par value amounts) |
| ASSETS | | | |
| Current assets: | | | |
| Cash and cash equivalents | $ | 785 |
| | $ | 805 |
|
| Marketable securities | — |
| | 235 |
|
| Accounts receivable, net | 533 |
| | 818 |
|
| Inventories, net | 678 |
| | 685 |
|
| Prepayments and other - GLOBALFOUNDRIES | 33 |
| | 113 |
|
| Prepaid expenses | 43 |
| | 32 |
|
| Other current assets | 248 |
| | 48 |
|
| Total current assets | 2,320 |
| | 2,736 |
|
| Property, plant and equipment, net | 188 |
| | 302 |
|
| Acquisition related intangible assets, net | — |
| | 65 |
|
| Goodwill | 278 |
| | 320 |
|
| Other assets | 323 |
| | 344 |
|
| Total assets | $ | 3,109 |
| | $ | 3,767 |
|
| LIABILITIES AND STOCKHOLDERS’ EQUITY (DEFICIT) | | | |
| Current liabilities: | | | |
| Short-term debt | $ | 230 |
| | $ | 177 |
|
| Accounts payable | 279 |
| | 415 |
|
| Payable to GLOBALFOUNDRIES | 245 |
| | 218 |
|
| Accrued liabilities | 472 |
| | 518 |
|
| Other current liabilities | 124 |
| | 40 |
|
| Deferred income on shipments to distributors | 53 |
| | 72 |
|
| Total current liabilities | 1,403 |
| | 1,440 |
|
| Long-term debt | 2,032 |
| | 2,035 |
|
| Other long-term liabilities | 86 |
| | 105 |
|
| Commitments and contingencies (see Notes 15 and 16) |
| |
|
| Stockholders’ equity: | | | |
| Capital stock: | | | |
| Common stock, par value $0.01; 1,500 shares authorized on December 26, 2015 and December 27, 2014; shares issued: 806 shares on December 26, 2015 and 788 shares on December 27, 2014; shares outstanding: 792 shares on December 26, 2015 and 776 shares on December 27, 2014 | 8 |
| | 8 |
|
| Additional paid-in capital | 7,017 |
| | 6,949 |
|
| Treasury stock, at cost (14 shares on December 26, 2015 and 12 shares on December 27, 2014 ) | (123 | ) | | (119 | ) |
| Accumulated deficit | (7,306 | ) | | (6,646 | ) |
| Accumulated other comprehensive loss | (8 | ) | | (5 | ) |
| Total stockholders’ equity (deficit) | (412 | ) | | 187 |
|
| Total liabilities and stockholders’ equity (deficit) | $ | 3,109 |
| | $ | 3,767 |
|
See accompanying notes to consolidated financial statements.
Advanced Micro Devices, Inc.
Consolidated Statements of Stockholders’ Equity
(Deficit)
Three Years Ended December 29, 201226, 2015 (In millions)
| | | | | | | | | | | | | | | | | | | | | | | | | | | | |
| | | Number
of
shares | | | Common
Stock | | | Additional
paid-in
capital | | | Treasury
stock | | | Accumulated
deficit | | | Accumulated
other
comprehensive
income (loss) | | | Total
stockholders’
equity | |
December 26, 2009 | | | 671 | | | $ | 7 | | | $ | 6,524 | | | $ | (98 | ) | | $ | (5,939 | ) | | $ | 154 | | | | 648 | |
Net income | | | — | | | | — | | | | — | | | | — | | | | 471 | | | | — | | | | 471 | |
Other comprehensive loss | | | — | | | | — | | | | — | | | | — | | | | — | | | | (153 | ) | | | (153 | ) |
Common stock issued under stock-based compensation plan | | | 5 | | | | — | | | | 15 | | | | (4 | ) | | | — | | | | — | | | | 11 | |
Stock-based compensation | | | — | | | | — | | | | 87 | | | | — | | | | — | | | | — | | | | 87 | |
Common stock and warrants issued, net of issuance cost | | | 7 | | | | — | | | | — | | | | — | | | | — | | | | — | | | | — | |
Adjustment to equity component of the 6.00% Notes resulting from debt buyback | | | — | | | | — | | | | (57 | ) | | | — | | | | — | | | | — | | | | (57 | ) |
Other | | | — | | | | — | | | | 6 | | | | — | | | | — | | | | — | | | | 6 | |
December 25, 2010 | | | 683 | | | | 7 | | | | 6,575 | | | | (102 | ) | | | (5,468 | ) | | | 1 | | | | 1,013 | |
Net income | | | — | | | | — | | | | — | | | | — | | | | 491 | | | | — | | | | 491 | |
Other comprehensive loss | | | — | | | | — | | | | — | | | | — | | | | — | | | | (6 | ) | | | (6 | ) |
Common stock issued under stock-based compensation plan | | | 15 | | | | — | | | | 18 | | | | (5 | ) | | | — | | | | — | | | | 13 | |
Stock-based compensation | | | — | | | | — | | | | 90 | | | | — | | | | — | | | | — | | | | 90 | |
Adjustment to equity component of the 6.00% Notes resulting from debt buyback | | | — | | | | — | | | | (9 | ) | | | — | | | | — | | | | — | | | | (9 | ) |
Other | | | — | | | | — | | | | (2 | ) | | | — | | | | — | | | | — | | | | (2 | ) |
December 31, 2011 | | | 698 | | | | 7 | | | | 6,672 | | | | (107 | ) | | | (4,977 | ) | | | (5 | ) | | | 1,590 | |
Net loss | | | — | | | | — | | | | — | | | | — | | | | (1,183 | ) | | | — | | | | (1,183 | ) |
Other comprehensive income | | | — | | | | — | | | | — | | | | — | | | | — | | | | 2 | | | | 2 | |
Common stock issued under stock-based compensation plan | | | 15 | | | | — | | | | 15 | | | | (2 | ) | | | — | | | | — | | | | 13 | |
Stock-based compensation | | | — | | | | — | | | | 97 | | | | — | | | | — | | | | — | | | | 97 | |
Assumption of stock awards in connection with acquisition | | | — | | | | — | | | | 19 | | | | — | | | | — | | | | — | | | | 19 | |
December 29, 2012 | | | 713 | | | $ | 7 | | | $ | 6,803 | | | $ | (109 | ) | | $ | (6,160 | ) | | $ | (3 | ) | | $ | 538 | |
|
| | | | | | | | | | | | | | | | | | | | | | | | | | |
| | Number of shares | | Common Stock | | Additional paid-in capital | | Treasury stock | | Accumulated deficit | | Accumulated other comprehensive income (loss) | | Total stockholders’ equity (deficit) |
| December 29, 2012 | 713 |
| | $ | 7 |
| | $ | 6,803 |
| | $ | (109 | ) | | $ | (6,160 | ) | | $ | (3 | ) | | $ | 538 |
|
| Net loss | — |
| | — |
| | — |
| | — |
| | (83 | ) | | — |
| | (83 | ) |
| Other comprehensive income, net | — |
| | — |
| | — |
| | — |
| | — |
| | 1 |
| | 1 |
|
| Common stock issued under stock-based compensation plans, net of tax withholding | 12 |
| | — |
| | 3 |
| | (3 | ) | | — |
| | — |
| | — |
|
| Stock-based compensation | — |
| | — |
| | 91 |
| | — |
| | — |
| | — |
| | 91 |
|
| Adjustment to equity component of the 6.00% Notes resulting from debt buyback | — |
| | — |
| | (3 | ) | | — |
| | — |
| | — |
| | (3 | ) |
| December 28, 2013 | 725 |
| | 7 |
| | 6,894 |
| | (112 | ) | | (6,243 | ) | | (2 | ) | | 544 |
|
| Net loss | — |
| | — |
| | — |
| | — |
| | (403 | ) | | — |
| | (403 | ) |
| Other comprehensive loss, net | — |
| | — |
| | — |
| | — |
| | — |
| | (3 | ) | | (3 | ) |
| Common stock issued under stock-based compensation plans, net of tax withholding | 16 |
| | — |
| | 4 |
| | (6 | ) | | — |
| | — |
| | (2 | ) |
| Common stock issued by exercise of warrants | 35 |
| | 1 |
| | — |
| | (1 | ) | | — |
| | — |
| | — |
|
| Stock-based compensation | — |
| | — |
| | 81 |
| | — |
| | — |
| | — |
| | 81 |
|
| Stock-based compensation related to restructuring and other special charges | — |
| | — |
| | 5 |
| | — |
| | — |
| | — |
| | 5 |
|
| Adjustment to equity component of the 6.00% Notes resulting from debt buyback | — |
| | — |
| | (35 | ) | | — |
| | — |
| | — |
| | (35 | ) |
| December 27, 2014 | 776 |
| | 8 |
| | 6,949 |
| | (119 | ) | | (6,646 | ) | | (5 | ) | | 187 |
|
| Net loss | — |
| | — |
| | — |
| | — |
| | (660 | ) | | — |
| | (660 | ) |
| Other comprehensive loss, net | — |
| | — |
| | — |
| | — |
| | — |
| | (3 | ) | | (3 | ) |
| Common stock issued under stock-based compensation plans, net of tax withholding | 16 |
| | — |
| | 5 |
| | (4 | ) | | — |
| | — |
| | 1 |
|
| Stock-based compensation | — |
| | — |
| | 63 |
| | — |
| | — |
| | — |
| | 63 |
|
| December 26, 2015 | 792 |
| | $ | 8 |
| | $ | 7,017 |
| | $ | (123 | ) | | $ | (7,306 | ) | | $ | (8 | ) | | $ | (412 | ) |
See accompanying notes to consolidated financial statements.
Advanced Micro Devices, Inc.
Consolidated Statements of Cash Flows | | | | | | | | | | | | |
| | | Year Ended | |
| | | December 29,
2012 | | | December 31,
2011 | | | December 25,
2010 | |
| | | (In millions) | |
Cash flows from operating activities: | | | | | | | | | | | | |
Net income (loss) | | $ | (1,183 | ) | | $ | 491 | | | $ | 471 | |
Adjustments to reconcile net income (loss) to net cash provided by
(used in) operating activities: | | | | | | | | | | | | |
Non-cash portion of the limited waiver of exclusivity from GLOBALFOUNDRIES | | | 278 | | | | — | | | | — | |
Equity in net (gain) loss and dilution gain in investee | | | — | | | | (492 | ) | | | 462 | |
Gain on deconsolidation of GLOBALFOUNDRIES | | | — | | | | — | | | | (325 | ) |
Impairment related to the GLOBALFOUNDRIES investment | | | — | | | | 209 | | | | — | |
Depreciation and amortization | | | 260 | | | | 317 | | | | 383 | |
Deferred income taxes | | | (40 | ) | | | (6 | ) | | | (5 | ) |
Stock-based compensation | | | 97 | | | | 90 | | | | 87 | |
Non-cash interest expense | | | 23 | | | | 21 | | | | 30 | |
Net gain on sale of marketable securities | | | — | | | | (4 | ) | | | (17 | ) |
Net loss on debt redemption | | | — | | | | 6 | | | | 24 | |
Other | | | 7 | | | | 2 | | | | (27 | ) |
Changes in operating assets and liabilities: | | | | | | | | | | | | |
Accounts receivable | | | 290 | | | | (347 | ) | | | (1,138 | ) |
Inventories | | | (83 | ) | | | 157 | | | | (144 | ) |
Prepaid expenses and other current assets | | | (20 | ) | | | 115 | | | | (97 | ) |
Other assets | | | (12 | ) | | | (1 | ) | | | 11 | |
Accounts payables, accrued liabilities and other | | | (232 | ) | | | (148 | ) | | | (182 | ) |
Payable to GLOBALFOUNDRIES | | | 277 | | | | (28 | ) | | | 55 | |
Net cash provided by (used in) operating activities | | | (338 | ) | | | 382 | | | | (412 | ) |
Cash flows from investing activities: | | | | | | | | | | | | |
Acquisition of SeaMicro, Inc., net of cash acquired | | | (281 | ) | | | — | | | | — | |
Purchases of available-for-sale securities | | | (944 | ) | | | (1,586 | ) | | | (1,800 | ) |
Purchases of property, plant and equipment | | | (133 | ) | | | (250 | ) | | | (148 | ) |
Cash decrease due to deconsolidation of GLOBALFOUNDRIES | | | — | | | | — | | | | (904 | ) |
Proceeds from sale and maturity of available-for-sale securities | | | 1,348 | | | | 1,726 | | | | 1,640 | |
Proceeds from sale and maturity of trading securities | | | — | | | | — | | | | 69 | |
Proceeds from sale of property, plant and equipment | | | — | | | | 16 | | | | 1 | |
Other | | | (9 | ) | | | (19 | ) | | | 19 | |
Net cash used in investing activities | | | (19 | ) | | | (113 | ) | | | (1,123 | ) |
Cash flows from financing activities: | | | | | | | | | | | | |
Proceeds from borrowings, net of issuance cost | | | 491 | | | | 170 | | | | 1,520 | |
Proceeds from issuance of common stock | | | 14 | | | | 18 | | | | 15 | |
Net proceeds from foreign grants and allowances | | | 23 | | | | 20 | | | | 19 | |
Repayments of debt and capital lease obligations | | | (489 | ) | | | (209 | ) | | | (1,074 | ) |
Other | | | (2 | ) | | | (5 | ) | | | 4 | |
Net cash provided by (used in) financing activities | | | 37 | | | | (6 | ) | | | 484 | |
Net increase (decrease) in cash and cash equivalents | | | (320 | ) | | | 263 | | | | (1,051 | ) |
Cash and cash equivalents at beginning of year | | | 869 | | | | 606 | | | | 1,657 | |
Cash and cash equivalents at end of year | | $ | 549 | | | $ | 869 | | | $ | 606 | |
Supplemental disclosures of cash flow information: | | | | | | | | | | | | |
Cash paid during the year for: | | | | | | | | | | | | |
Interest | | $ | 142 | | | $ | 152 | | | $ | 164 | |
Income taxes | | $ | 9 | | | $ | 9 | | | $ | 12 | |
|
| | | | | | | | | | | |
| Year Ended |
| December 26,
2015 | | December 27,
2014 | | December 28,
2013 |
| | (In millions) |
| Cash flows from operating activities: | | | | | |
| Net loss | $ | (660 | ) | | $ | (403 | ) | | $ | (83 | ) |
| Adjustments to reconcile net loss to net cash used in operating activities: | | | | | |
| Depreciation and amortization | 167 |
| | 203 |
| | 236 |
|
| Net loss on disposal of property, plant and equipment | — |
| | — |
| | 31 |
|
| Stock-based compensation expense | 63 |
| | 81 |
| | 91 |
|
| Non-cash interest expense | 11 |
| | 17 |
| | 25 |
|
| Goodwill impairment charge | — |
| | 233 |
| | — |
|
| Restructuring and other special charges, net | 83 |
| | 14 |
| | — |
|
| Net loss on debt redemptions | — |
| | 61 |
| | 1 |
|
| Other | (3 | ) | | (13 | ) | | (1 | ) |
| Changes in operating assets and liabilities: | | | | | |
| Accounts receivable | 280 |
| | 7 |
| | (200 | ) |
| Inventories | (11 | ) | | 199 |
| | (322 | ) |
| Prepayments and other - GLOBALFOUNDRIES | 84 |
| | (113 | ) | | — |
|
| Prepaid expenses and other assets | (111 | ) | | (7 | ) | | (103 | ) |
| Accounts payables, accrued liabilities and other | (156 | ) | | (231 | ) | | 266 |
|
| Payable to GLOBALFOUNDRIES | 27 |
| | (146 | ) | | (89 | ) |
| Net cash used in operating activities | (226 | ) | | (98 | ) | | (148 | ) |
| Cash flows from investing activities: | | | | | |
| Purchases of available-for-sale securities | (227 | ) | | (790 | ) | | (1,043 | ) |
| Purchases of property, plant and equipment | (96 | ) | | (95 | ) | | (84 | ) |
| Proceeds from sales and maturities of available-for-sale securities | 462 |
| | 873 |
| | 1,344 |
|
| Proceeds from sale of property, plant and equipment | 8 |
| | — |
| | 238 |
|
| Net cash provided by (used in) investing activities | 147 |
| | (12 | ) | | 455 |
|
| Cash flows from financing activities: | | | | | |
| Proceeds from borrowings, net | 100 |
| | 1,155 |
| | 55 |
|
| Proceeds from issuance of common stock | 5 |
| | 4 |
| | 3 |
|
| Repayments of long-term debt and capital lease obligations | (44 | ) | | (1,115 | ) | | (55 | ) |
| Other | (2 | ) | | 2 |
| | 10 |
|
| Net cash provided by financing activities | 59 |
| | 46 |
| | 13 |
|
| Net increase (decrease) in cash and cash equivalents | (20 | ) | | (64 | ) | | 320 |
|
| Cash and cash equivalents at beginning of year | 805 |
| | 869 |
| | 549 |
|
| Cash and cash equivalents at end of year | $ | 785 |
| | $ | 805 |
| | $ | 869 |
|
| Supplemental disclosures of cash flow information: | | | | | |
| Cash paid during the year for: | | | | | |
| Interest | $ | 149 |
| | $ | 138 |
| | $ | 152 |
|
| Income taxes | $ | 3 |
| | $ | 7 |
| | $ | 9 |
|
Advanced Micro Devices, Inc.
Notes to Consolidated Financial Statements
December 29, 2012,26, 2015, December 31, 201127, 2014 and December 25, 201028, 2013 NOTE 1: | Nature of Operations |
NOTE 1: Nature of Operations
Advanced Micro Devices, Inc.
(the Company or AMD) is a global semiconductor
company with facilities throughout the world.company. References herein to
AMD or the
“Company” means AMDCompany mean Advanced Micro Devices, Inc. and its
consolidated subsidiaries. The Company
provides:primarily offers: | |
| (i) | x86 microprocessors, as a standalone devicescentral processing unit (CPU) or as incorporated asinto an accelerated processing unit (APU), chipsets, and discrete graphics processing units (GPUs) for the consumer, commercial and consumer markets, embedded microprocessors for commercial, commercial client and consumer markets and chipsets for desktop and mobile devices, including mobile PCs and tablets, professional workstations and servers;graphics markets; and |
| |
| (ii) | graphics, videoserver and multimediaembedded CPUs, GPUs and APUs, and semi-custom System-on-Chip (SoC) products for desktop and mobile devices, including mobile PCs and tablets, home media PCs and professional workstations, servers and technology for game consoles. |
NOTE 2: Summary of Significant Accounting Policies NOTE 2:
| Summary of Significant Accounting Policies |
Fiscal Year. The Company uses a 52 or 53 week fiscal year ending on the last Saturday in December. Fiscal 2012, 20112015, 2014 and 20102013 ended December 29, 2012,26, 2015, December 31, 201127, 2014 and December 25, 2010, respectively. Fiscal 2012, 2011 and 201028, 2013, respectively, each consisted of 52 53 and 52 weeks, respectively.weeks.
Principles of Consolidation. The consolidated financial statements include the Company’s accounts and those of its wholly-owned subsidiaries. Upon consolidation, all significant intercompany accounts and transactions are eliminated. Use of Estimates. The preparation of consolidated financial statements in conformity with U.S. generally accepted accounting principles (GAAP)(U.S. GAAP) requires management to make estimates and assumptions that affect the reported amounts of assets and liabilities and disclosure of commitments and contingencies at the date of the financial statements and the reported amounts of revenues and expenses during the reporting periods. Actual results are likely to differ from those estimates, and such differences may be material to the financial statements. Areas where management uses subjective judgment include, but are not limited to, revenue allowances, inventory valuation, valuation and impairment of goodwill, valuation of investments in marketable securities, and deferred income taxes.taxes and restructuring charges. Revenue Recognition. The Company recognizes revenue from products sold directly to customers, including original equipment manufacturers (OEMs), when persuasive evidence of an arrangement exists, the price is fixed or determinable, delivery has occurred and collectibilitycollectability is reasonably assured. Estimates of product returns, allowances and future price reductions, based on actual historical experience and other known or anticipated trends and factors, are recorded at the time revenue is recognized. The Company sells to distributors under terms allowing the majority of distributors certain rights of return and price protection on unsold merchandise held by them. The distributor agreements, which may be cancelled by either party upon specified notice, generally contain a provision for the return of those of the Company’s products that the Company has removed from its price book and that are not more than twelve12 months older than the manufacturing code date. In addition, some agreements with distributors may contain standard stock rotation provisions permitting limited levels of product returns. Therefore, the Company is unable to estimate the product returns and pricing when the product is sold to the distributors. Accordingly, the Company defers the gross margin resulting from the deferral of both revenue and related product costs from sales to distributors with agreements that have the aforementioned terms until the merchandise is resold by the distributors and reports such deferred amounts as “Deferred income on shipments to distributors” on its consolidated balance sheet. Products are sold to distributors at standard published prices that are contained in price books that are broadly provided to the Company’s variousdistributors. Distributors are then required to pay for these products within the Company’s standard commercialcontractual terms, which are typically net 3060 days. The Company records allowances for price protection given to distributors and customer rebates in the period of distributor re-sale. The Company determines these allowances based on specific contractual terms with its distributors. Price reductions generally do not result in sales prices that are less than the Company’s product cost. Deferred income on shipments to distributors is revalued at the end of each period based on the change in inventory units at distributors, latest published prices and latest product costs.
The Company records estimated reductions to revenue under distributor and customer incentive programs, including certain cooperative advertising and marketing promotions and volume based incentives and special pricing arrangements, at the time the related revenues are recognized. For transactions where the Company reimburses a customer for a portion of the customer’s cost to perform specific product advertising or marketing and promotional activities, such amounts are recorded as a reduction of revenue unless they qualify for expense recognition. Shipping and handling costs associated with product sales are included in cost of sales.
Deferred revenue and related product costs were as follows: | | | | | | | | |
| | | December 29,
2012 | | | December 31,
2011 | |
| | | (In millions) | |
Deferred revenue | | $ | 189 | | | $ | 202 | |
Deferred cost of sales | | | (81 | ) | | | (79 | ) |
Deferred income on shipments to distributors | | $ | 108 | | | $ | 123 | |
|
| | | | | | | |
| | December 26,
2015 | | December 27,
2014 |
| | (In millions) |
| Deferred revenue | $ | 94 |
| | $ | 130 |
|
| Deferred cost of sales | (41 | ) | | (58 | ) |
| Deferred income on shipments to distributors | $ | 53 |
| | $ | 72 |
|
Inventories. Inventories are stated at standard cost adjusted to approximate the lower of actual cost (first-in, first-out method) or market. InventoriesThe Company adjusts inventory carrying value for estimated obsolescence equal to the difference between the cost of inventory and the estimated market value based upon assumptions about future demand and market conditions. The Company fully reserves for inventories and noncancelable purchase orders for inventory deemed obsolete. The Company performs periodic reviews of inventory items to identify excess inventories on hand in excessby comparing on-hand balances to anticipated usage using recent historical activity as well as anticipated or forecasted demand. If estimates of forecastedcustomer demand are not valued. Obsolete inventories are written off.diminish further or market conditions become less favorable than those projected by the Company, additional inventory adjustments may be required.
Goodwill. Goodwill represents the excess of the purchase price over the fair value of net tangible and identifiable intangible assets acquired. GoodwillIn accordance with Accounting Standards Codification (ASC) 350, “Goodwill and Other Intangible Assets,” goodwill is not amortized, but rather is tested for impairment at least annually or more frequently if there are indicators of impairment present. The Company performs its annual goodwill impairment analysis as of the first day of the fourth quarter of each fiscal year.year and, if certain events or circumstances indicate that an impairment loss may have been incurred, on an interim basis. The Company evaluates whetheranalysis of potential impairment of goodwill has been impaired atrequires a two-step process. The first step of the impairment test is to compare the fair value of each reporting unit level by first determining whetherto its carrying value. If step one indicates that impairment potentially exists, the second step is performed to measure the amount of impairment, if any. Goodwill impairment exists when the estimated fair value of the reporting unitgoodwill is less than its carrying value and, if so, by determining whether the implied fair value of goodwill within the reporting unit is less than the carrying value. The implied fair value of goodwill is determined through the application of one or more valuation models common to the Company’s industry, including the income, market and cost approaches. Commitments and Contingencies. From time to time the Company is a defendant or plaintiff in various legal actions that arise in the normal course of business. The Company is also a party to environmental matters, including local, regional, state and federal government clean-up activities at or near locations where the Company currently or has in the past conducted business. The Company is required to assess the likelihood of any adverse judgments or outcomes to these matters as well as potential ranges of reasonably possible losses. A determination of the amount of reserves required for these commitments and contingencies, if any, that would be charged to earnings, includes assessing the probability of adverse outcomes and estimating the amount of potential losses. The required reserves, if any, may change in the future due to new developments in each matter or changes in circumstances such as a change in settlement strategy. Changes in required reserves could increase or decrease the Company’s earnings in the period the changes are made. (See Notes 15 and 16). Restructuring Charges. Restructuring charges are primarily comprised of severance costs, contract and program termination costs, asset impairments and costs of facility consolidation and closure. Restructuring charges are recorded upon approval of a formal management plan and are included in the operating results of the period in which suchplan is approved and the expense becomes estimable. To estimate restructuring charges, management utilizes assumptions of the number of employees that would be involuntarily terminated and of future costs to operate and eventually vacate duplicate facilities. Estimated restructuring expenses may change as management executesSeverance and other employee separation costs are accrued when it is probable that benefits will be paid and the approved plan.
amount is reasonably estimable. The rates used in determining severance accruals are based on the Company’s policies and practices and negotiated settlements.
Cash Equivalents. Cash equivalents consist of financial instruments that are readily convertible into cash and have original maturities of three months or less at the time of purchase. Investments in Certain Debt and Equity Securities. The Company classifies its investments in debt and marketable equity securities at the date of acquisition as available-for-sale. Available-for-sale securities are reported at fair value with the related unrealized gains and losses included, net of tax, in accumulated other comprehensive income (loss),loss, a component of stockholders’ equity. Realized gains and losses and declines in the value of available-for-sale securities determined to be other than temporary are included in other income (expense), net. The cost of securities sold is determined based on the specific identification method. The Company classifies investments in debt securities with maturities of more than three months at the time of purchase as marketable securities on its consolidated balance
sheets.sheet. Classification of these securities as current is based on the Company’s intent and belief in its ability to sell these securities and use the proceeds from sale in operations within 12 months.
Derivative Financial Instruments. The Company maintains a foreign currency hedging strategy which uses derivative financial instruments to mitigate the risks associated with changes in foreign currency exchange rates. This strategy takes into
consideration all of the Company’s consolidated exposures. The Company does not use derivative financial instruments for trading or speculative purposes.
In applying its strategy, the Company used foreign currency forward contracts to hedge certain forecasted expenses denominated in foreign
currencies, primarily the Canadian dollar.currencies. The Company designated these contracts as cash flow hedges of forecasted expenses, to the extent eligible under the accounting rules, and evaluates hedge effectiveness prospectively and retrospectively. As such, the effective portion of the gain or loss on these contracts is reported as a component of accumulated other comprehensive
income (loss)loss and reclassified to earnings in the same line item as the associated forecasted transaction and in the same period during which the hedged transaction affects earnings. Any ineffective portion is immediately recorded in earnings.
The Company also uses, from time to time, foreign currency forward contracts to economically hedge recognized foreign currency exposures on the balance sheets of various
subsidiaries, primarily those denominated in Canadian dollars.subsidiaries. The Company does not designate these forward contracts as hedging instruments. Accordingly, the gain or loss associated with these contracts is immediately recorded in earnings.
Property, Plant and Equipment. Property, plant and equipment are stated at cost. Depreciation and amortization are provided on a straight-line basis over the estimated useful lives of the assets for financial reporting purposes. Estimated useful lives for financial reporting purposes are as follows: equipment, two to six years; buildings and building improvements, up to 3940 years; and leasehold improvements, measured by the shorter of the remaining terms of the leases or the estimated useful economic lives of the improvements. Assets Held for Sale. Assets held for sale represents components that meet accounting requirements to be classified as held for sale and presented as single asset and liability amounts in the Company’s financial statements at lower of carrying value or fair value, less cost to sell. The determination of fair value involves significant judgments and assumptions. In determining the fair value less cost to sell, the Company considered factors including, among others, the nature of the sales transaction, the composition of assets and/or businesses in the disposal group, current sales prices for comparable assets and/or businesses and negotiations with third party purchaser(s).
As of December 26, 2015, the Company’s assets held for sale included in other current assets and liabilities related to assets held for sale included in other current liabilities amounted to $183 million and $79 million, respectively. See Note 4 “Equity Interest Purchase Agreement” below, for additional information.
Product Warranties. The Company generally warrants that its products sold to its customers will conform to the Company’s approved specifications and be free from defects in material and workmanship under normal use and service for one year. Subject to certain exceptions, the Company also offers a three-year limited warranty to end users for only those CPUcentral processing unit (CPU) and AMD A-Series APUaccelerated processing unit (APU) products that are commonly referred to as “processors in a box” and hasfor certain server CPU products. The Company also offered extended limited warranties to certain customers of “tray” microprocessor products and/or workstationprofessional graphics products who have written agreements with the Company and target their computer systems at the commercial and/or embedded markets.The Company accrues warranty costs at the time of sale of warranted products.
Foreign Currency Translation/Transactions. The functional currency of all of the Company’s foreign subsidiaries is the U.S. dollar. Assets and liabilities denominated in non-U.S. dollars have been remeasured into U.S. dollars at current exchange rates for monetary assets and liabilities and historical exchange rates for non-monetary assets and liabilities. Non-U.S. dollar denominated transactions have been remeasured at average exchange rates in effect during each period, except for those cost of sales and expense transactions related to non-monetary balance sheet amounts, which have been remeasured at historical exchange rates. The gains or losses from foreign currency remeasurement are included in earnings. Foreign Subsidies. The Company received investment grants in connection with the construction and operation of certain facilities in Asia. Generally, such grants are subject to forfeiture in declining amounts over the life of the agreement if the Company does not maintain certain levels of employment or meet other conditions specified in the relevant grant documents. Accordingly, amounts granted are initially recorded as a receivable until cash proceeds are received. In the period the grant receivable is recorded, a current and long-term liability is also recorded which is subsequently amortized as a reduction to cost of sales. The Company also received
an investment grantgrants relating to certain research and development projects. These research and development funds are
generally recorded as a reduction of research and development expenses when all conditions and requirements set forth in the underlying grant agreement are met.
Marketing, Communications and Advertising Expenses. Marketing, communications and advertising expenses for 2012, 20112015, 2014 and 20102013 were approximately $287$154 million, $397$194 million and $380$210 million, respectively. Cooperative advertising funding obligations under customer incentive programs are accrued and the costs are recorded upon agreement with customers and vendor partners. Cooperative advertising expenses are recorded as marketing, general and administrative expense to the extent the cash
paid does not exceed the
estimated fair value of the advertising benefit received. Any excess of cash paid over the
estimated fair value of the advertising benefit received is recorded as a reduction of revenue.
Net Income (Loss)Loss Per Share. Basic net income (loss)loss per share is computed based on the weighted-average number of shares outstanding and 35 million shares issuable upon exercise of the warrants issued by the Company to West Coast Hitech L.P. (WCH), in connection with the initial GFGLOBALFOUNDRIES, Inc. (GF) transaction in 2009. On March 7, 2014, the Company issued 34,906,166 shares of common stock pursuant to the cashless exercise in full by WCH of its warrant to purchase up to 35,000,000 shares of the Company’s common stock at an exercise price of $0.01 per share. As a result, the warrant is no longer outstanding. The warrants became exercisableissuance of the common stock did not have any effect on July 24, 2009.basic and dilutive earnings per share amounts because the full 35,000,000 shares of common stock issuable to WCH had already been included in the denominator for calculating basic and dilutive earnings per share for all periods presented. Diluted net income per share is computed based on the weighted-average number of shares outstanding plus any potentially dilutive shares outstanding. Potentially dilutive shares include stock options, restricted stock,
awardsrestricted stock units and shares issuable upon the conversion of convertible debt.
The following table sets forth the components of basic and diluted
income (loss)loss per share:
| | | | | | | | | | | | |
| | | 2012 | | | 2011 | | | 2010 | |
| | | (In millions, except per share amounts) | |
Numerator—Net income (loss): | | | | | | | | | | | | |
Numerator for basic and diluted income (loss) from continuing operations | | $ | (1,183 | ) | | $ | 495 | | | $ | 471 | |
Numerator for basic and diluted income (loss) from discontinued operations | | | — | | | | (4 | ) | | | — | |
Numerator for basic and diluted net income (loss) | | $ | (1,183 | ) | | $ | 491 | | | $ | 471 | �� |
Denominator—Weighted-average shares: | | | | | | | | | | | | |
Denominator for basic net income (loss) per share | | | 741 | | | | 727 | | | | 711 | |
Effect of potentially dilutive shares: | | | | | | | | | | | | |
Employee stock options and restricted stock awards | | | — | | | | 15 | | | | 22 | |
Denominator for diluted net income (loss) per share | | | 741 | | | | 742 | | | | 733 | |
Net income (loss) per share: | | | | | | | | | | | | |
Basic | | | | | | | | | | | | |
Continuing operations | | $ | (1.60 | ) | | $ | 0.68 | | | $ | 0.66 | |
Discontinued operations | | | — | | | | (0.01 | ) | | | — | |
Basic net income (loss) per share | | $ | (1.60 | ) | | $ | 0.68 | | | $ | 0.66 | |
Diluted | | | | | | | | | | | | |
Continuing operations | | $ | (1.60 | ) | | $ | 0.67 | | | $ | 0.64 | |
Discontinued operations | | | — | | | | (0.01 | ) | | | — | |
Diluted net income (loss) per share | | $ | (1.60 | ) | | $ | 0.66 | | | $ | 0.64 | |
|
| | | | | | | | | | | |
| | 2015 | | 2014 | | 2013 |
| | (In millions, except per share amounts) |
| Numerator—Net loss: | | | | | |
| Numerator for basic and diluted net loss per share | $ | (660 | ) | | $ | (403 | ) | | $ | (83 | ) |
| Denominator—Weighted-average shares: | | | | | |
| Denominator for basic and diluted net loss per share | 783 |
| | 768 |
| | 754 |
|
| Net loss per share: | | | | | |
| Basic | $ | (0.84 | ) | | $ | (0.53 | ) | | $ | (0.11 | ) |
| Diluted | $ | (0.84 | ) | | $ | (0.53 | ) | | $ | (0.11 | ) |
Potential shares
(i) from outstanding stock options,
restricted stock and restricted stock
awardsunits totaling approximately
4552 million,
3348 million and
17 million, and (ii) issuable under the Company’s 5.75% Convertible Senior Notes due 2012 (5.75% Notes) totaling 15 million, 24 million and 2459 million for
2012 , 20112015, 2014 and
2010,2013, respectively, were not included in the net
income (loss)loss per share calculations as their inclusion would have been anti-dilutive.
Accumulated Other Comprehensive Income (Loss).Loss. Unrealized holding gains or losses on the Company’s available-for-sale securities and unrealized holding gains and losses on derivative financial instruments qualifying as cash flow hedges changes in minimum pension liabilities, and foreign currency translation adjustments are included in other comprehensive income (loss).loss.Accumulated
The table below summarizes the changes in accumulated other comprehensive loss
was comprised of $3 million and $5 million net unrealized holding losses on cash flow hedges, net of taxes of $0, as ofby component for the years ended December
29, 201226, 2015 and December
31, 2011, respectively.27, 2014:
|
| | | | | | | | | | | | | | | | | | | | | | |
| | December 26,
2015 | | December 27,
2014 |
| | Unrealized gains (losses) on available-for-sale securities | | Unrealized gains (losses) on cash flow hedges | | Total | | Unrealized gains (losses) on available-for-sale securities | Unrealized gains (losses) on cash flow hedges | | Total |
| | (In millions) |
| Beginning balance | $ | 1 |
| | $ | (6 | ) | | $ | (5 | ) | | $ | 1 |
| $ | (3 | ) | | $ | (2 | ) |
| Unrealized gains (losses) arising during the period, net of tax effects | (2 | ) | | (22 | ) | | (24 | ) | | — |
| (9 | ) | | (9 | ) |
| Reclassification adjustment for (gains) losses realized and included in net loss, net of tax effects | — |
| | 21 |
| | 21 |
| | — |
| 6 |
| | 6 |
|
| Total other comprehensive income (loss) | (2 | ) | | (1 | ) | | (3 | ) | | — |
| (3 | ) | | (3 | ) |
| Ending balance | $ | (1 | ) | | $ | (7 | ) | | $ | (8 | ) | | $ | 1 |
| $ | (6 | ) | | $ | (5 | ) |
Stock-Based Compensation. The Company estimates stock-based compensation cost for stock options at the grant date based on the award’soption’s fair-value as calculated by the lattice-binomial option-pricing model. For restricted stock awards,and restricted stock units, including performance-based restricted stock units (PRSUs), fair value is based on the closing price of the Company’s common
stock on the grant date. The
Company estimates the grant-date fair value of stock options, restricted stock and restricted stock units that involve a market condition using a Monte Carlo simulation model. Compensation expense is recognized
over the vesting period of the applicable award using the
single option method which is ratable on a straight-line
basis over the requisite service period.method.
The application of the lattice-binomial option-pricing model requires the use of extensive actual employee exercise behavior data and the use of a number of complex assumptions including expected volatility of the Company’s common stock, risk-free interest rate and expected dividends. Significant changes in any of these assumptions could materially affect the fair value of stock options granted in the future.
Forfeiture rates are estimated at the time of grant and revised, if necessary, in subsequent periods if actual forfeitures differ from those estimates in order to derive the Company’s best estimate of awards ultimately expected to vest.
Recently Issued Accounting Standards
Income Tax.In November 2015, the Financial Accounting Standards Board (FASB) issued Accounting Standards Update (ASU) 2015-17, Balance Sheet Classification of Deferred Taxes, which simplifies the presentation of deferred income taxes by requiring that all deferred tax assets and liabilities to be classified as non-current on the consolidated balance sheet. ASU 2015-17 will be effective in the first quarter of 2017, with early adoption permitted. ASU 2015-17 may be adopted either prospectively or retrospectively. The Company is currently evaluating the impact of its pending adoption of ASU 2015-17 on its consolidated financial statements.
Inventory.In July 2015, the FASB issued ASU 2015-11, Simplifying the Measurement of Inventory, which simplifies the measurement of inventory by requiring certain inventory to be measured at the lower of cost or net realizable value. ASU 2015-11 will be effective in the first quarter of 2017, with early adoption permitted. The Company is currently evaluating the impact of its pending adoption of ASU 2015-11 on its consolidated financial statements.
Interest—Imputation of Interest. In April 2015, the FASB issued ASU 2015-03, Simplifying the Presentation of Debt Issuance Costs,which requires an entity to present such costs in the balance sheet as a direct deduction from the related debt liability rather than as an asset. Amortization of the costs will continue to be reported as interest expense. ASU 2015-03 will be effective for annual reporting periods beginning after December 15, 2015 and interim periods within fiscal years beginning after December 15, 2016, with early adoption permitted. The new guidance will be applied retrospectively to each prior period presented. The Company plans to adopt ASU 2015-03 in the first quarter of 2016, at which time the Company will reclassify approximately $30 million of debt issuance costs associated with the Company’s long-term debt from other non-current assets to long-term debt. A reclassification will also be applied retrospectively to each prior period presented.
Disclosure of Going Concern Uncertainties. In August 2014, the FASB issued ASU 2014-15, Disclosure of Uncertainties about an Entity’s Ability to Continue as a Going Concern (ASU 2014-15), which provides guidance on management’s responsibility in evaluating whether there is substantial doubt about a company’s ability to continue as a going concern and to provide related footnote disclosures. ASU 2014-15 will be effective in the fourth quarter of 2016, with early adoption permitted. The Company is currently evaluating the impact of its pending adoption of ASU 2014-15 on its consolidated financial statements.
Share-Based Payments with Performance Targets. In June 2014, the FASB issued ASU 2014-12, Accounting for Share-Based Payments When the Terms of an Award Provide That a Performance Target Could Be Achieved after the Requisite Service Period, which requires that a performance target be treated as a performance condition if it affects vesting and could be achieved after the requisite service period is rendered. ASU 2014-12 will be effective in the first quarter of 2016, with early adoption permitted. The Company may use either of two methods: (i) prospective application to all awards granted or modified after the effective date or (ii) retrospective application to all awards with performance targets that are outstanding as of the beginning of the earliest annual period presented in the financial statements and to all new or modified awards thereafter, with the cumulative effect of applying ASU 2014-12 as an adjustment to the opening retained earnings balance as of the beginning of the earliest annual period presented in the financial statements. The Company evaluated the impact of its pending adoption of ASU 2014-12 on its consolidated financial statements and has not yet determined which method it will apply. The adoption of this standard will not materially impact the Company’s consolidated financial statements.
Revenue Recognition. In May 2014, the FASB issued ASU 2014-09, Revenue from Contracts with Customers (Topic 606), which creates a single source of revenue guidance under U.S. GAAP for all companies in all industries. The core principle of ASU 2014-09 is that revenue should be recognized in a manner that depicts the transfer of promised goods or services to customers in an amount that reflects the consideration to which the entity expects to be entitled in exchange for those goods or services. ASU 2014-09 defines a five-step process in order to achieve this core principle, which may require the use of judgment and estimates. ASU 2014-09 also requires expanded qualitative and quantitative disclosures relating to the nature, amount, timing and uncertainty of revenue and cash flows arising from contracts with customers, including significant judgments and estimates used. In July 2015, FASB announced a decision to defer the effective date for this ASU. ASU 2014-09 will be effective for the Company in the first
quarter of 2018 with early adoption permitted (for annual reporting periods beginning after December 15, 2016). The Company may adopt ASU 2014-09 either by using a full retrospective approach for all periods presented in the period of adoption or a modified retrospective approach. The Company is currently evaluating the impact of its pending adoption of ASU 2014-09 on its consolidated financial statements and has not yet determined which approach it will apply.
NOTE 3: GLOBALFOUNDRIES
Formation and Accounting
in 2009On March 2, 2009, the Company consummated the transactions contemplated by the Master Transaction Agreement among the Company, Advanced Technology Investment Company LLC (ATIC),(currently known as Mubadala Technology Investments LLC (Mubadala Tech)) and WCH,West Coast Hitech L.P. (WCH), pursuant to which the Company formed GLOBALFOUNDRIES Inc. (GF). Based onIn connection with the structureconsummation of the transactiontransactions contemplated by the Master Transaction Agreement, the Company, Mubadala Tech and the guidanceGF entered into a Wafer Supply Agreement (the WSA), a Funding Agreement (the Funding Agreement) and a Shareholders’ Agreement (the Shareholders’ Agreement) on accounting for interests in variable interest entities, duringMarch 2, 2009.
At GF’s formation on March 2, 2009 and through December 26, 2009, GF was deemed a variable-interest entity, and the Company was deemed to be theGF’s primary beneficiary. Therefore,Accordingly, the Company consolidated GF under applicable accounting rules. As a result of certain GF governance changes, the accountsCompany deconsolidated GF and accounted for its GF ownership under the equity method of accounting as of December 27, 2009. Following the deconsolidation, GF became the Company’s related party.
In the first quarter of 2011, as a result of a contribution to GF by an affiliate of Mubadala Tech and certain GF governance changes noted above, the Company’s ownership in GF was diluted, and the Company concluded that it no longer had the ability to exercise significant influence over GF. Accordingly, the Company changed the accounting for the investment in GF from the equity method to the cost method of accounting and recognized a dilution gain in investee of approximately $492 million. In the fourth quarter of 2011, the Company identified indicators of impairment in GF that were deemed other than temporary. The Company performed a valuation analysis and recorded a non-cash impairment charge of $209 million. The carrying value of the Company’s remaining investment in GF after the impairment charge was $278 million as of December 31, 2011.
On March 4, 2012, as partial consideration for certain rights received under a second amendment to the WSA, the Company transferred to GF all of the remaining capital stock of GF fromthat the Company owned. In addition, as of March 2, 2009 through December 26, 2009.At4, 2012, the Closing, AMD, ATIC and GF also entered into a Shareholders’ Agreement (the Shareholders’ Agreement), a Funding Agreement (the Funding Agreement),was terminated, and a Wafer Supply Agreement (the WSA).
Shareholders’ Agreement. The Shareholders’ Agreement set forth the rights and obligations of AMD and ATIC as shareholders of GF. The initial GF board of directors (GF Board) consisted of eight directors, and AMD and ATIC each designated four directors. The Company was no longer a party to the Shareholders’ AgreementAgreement. As a result of these transactions, the Company no longer owned any GF capital stock as of March 4, 2012.
Funding Agreement. The Funding Agreement provided for
GF continues to be a related party of the
fundingCompany because Mubadala Development Company PJSC (Mubadala) and Mubadala Tech are affiliated with WCH, the Company’s largest stockholder. WCH and Mubadala Tech are wholly-owned subsidiaries of
GF and governed the terms and conditions under which ATIC was obligated to provide such funding. The Company was no longer a party to the Funding Agreement as of March 4, 2012.Mubadala.
Wafer Supply Agreement.Agreement
The WSA governs the terms by which the Company purchases products manufactured by GF. Pursuant to the WSA,
during 2010, the Company
purchased substantiallyis required to purchase all of its microprocessor
unit (MPU)and APU product requirements and a certain portion of its GPU product requirements from
GF. During 2010, the Company paid GF
for wafers on a cost-plus basis.with limited exceptions. If the Company acquires a
third-partythird party business that manufactures
MPUmicroprocessor and APU products, the Company will have up to two years to transition the manufacture of such
MPUmicroprocessor and APU products to GF.
The WSA terminates no later than March 2, 2024. GF has agreed to use commercially reasonable efforts to assist the Company to transition the supply of products to another provider and to continue to fulfill purchase orders for up to two years following the termination or expiration of the WSA. During the transition period, pricing for microprocessor
and APU products will remain as set forth in the WSA, but the Company’s purchase commitments to GF will no longer apply.
The agreement has been subsequently modified, as described below.Governance Changes, Funding and Accounting in 2010Deconsolidation of GF
On December 18, 2009, ATIC International Investment Company (ATIC II) acquired Chartered Semiconductor Manufacturing Ltd. (Chartered). On December 28, 2009, with the Company’s consent, ATIC II, Chartered and GF entered into a Management and Operating Agreement (MOA), which provided for the joint management and operation of GF and Chartered, thereby allowing GF and Chartered to share costs, take advantage of operating synergies and market wafer fabrications services on a collective basis. In order to allow for the signing of the MOA on December 28, 2009, prior to obtaining any regulatory approvals, the Company agreed to irrevocably waive rights under the Shareholders Agreement with respect to certain matters that require unanimous GF Board approval. Additionally, if any such matters came before the GF Board, the Company agreed that its designated GF directors will vote in the same manner as the majority of ATIC-designated GF Board members voting on any such matters. As a result of waiving such approval rights, as of December 28, 2009, for financial reporting purposes the Company no longer shared control with ATIC over GF.
In June 2009, the FASB issued an amendment to improve financial reporting by enterprises involved with variable interest entities. Based on the results of the Company’s evaluation and in light of the governance changes whereby the Company believed it only had protective rights relative to the operations of GF, the Company concluded that the other investor in GF, ATIC, was the party who had the power to direct the activities
of GF that most significantly impact GF’s performance and was, therefore, the primary beneficiary of GF. Accordingly, effective as of December 27, 2009, the Company deconsolidated GF, and during 2010 accounted for its ownership interest in GF under the equity method of accounting. For purposes of the Company’s application of the equity method of accounting during 2010, the Company recorded its share of GF’s results excluding the results of Chartered because GF did not have an equity ownership interest in Chartered. The terms of the Funding Agreement and the WSA described above were not affected by the deconsolidation of GF. Following the deconsolidation, GF became the Company’s related party.
Funding of GF
During 2010, ATIC contributed $930 million of cash to GF. The Company did not participate in the funding. These contributions resulted in an aggregate gain on the Company’s ownership interest of $232 million which the Company recorded as part of the equity in net loss of investee line item on its consolidated statement of operations.
Contribution Agreement, Funding and Accounting in 2011
GLOBALFOUNDRIES Singapore Pte. Ltd. (GFS, formerly Chartered) Contribution in 2011
On December 27, 2010, pursuant to the Contribution Agreement, ATIC International Investment Company LLC, an affiliate of ATIC, contributed all of the outstanding Ordinary Shares of GFS to GF. As the result of dilution of the Company’s ownership in GF, during the first quarter of 2011 and the year ended December 31, 2011, the Company recognized a non-cash gain of approximately $492 million, net of certain transaction related charges, in Equity income (loss) and dilution gain in investee, net.
Following the GFS contribution and governance changes described above, the Company assessed its ability to exercise significant influence over GF and considered factors such as the Company’s representation on GF’s board of directors, participation in GF’s policy-making processes, material intra-entity transactions, interchange of managerial personnel, technological dependency, and the extent of the Company’s ownership in relation to ownership by the other shareholders. Based on the results of its assessment, the Company concluded that it no longer had the ability to exercise significant influence over GF. Accordingly, as of the first quarter of 2011, the Company changed its method of accounting for its ownership interest in GF from the equity method to the cost method of accounting.
Under the cost method of accounting, the Company no longer recognized any share of GF’s net income or loss in its consolidated statement of operations. In addition, the Company reviewed the carrying value of its investment in GF for impairment at each reporting period. Impairment indicators, among other factors, include significant deterioration in GF’s earnings performance or business prospects, significant changes in the market conditions in which GF operates, and GF’s ability to continue as a going concern.
Impairment of investment in GF
During the fourth quarter of 2011, the Company identified indicators of impairment, including revised financial projections which the Company received from GF. The fair value of its GF investment was determined by a valuation analysis of GF’s Class A Preferred Shares, utilizing the revised financial projections. The Company concluded the decline in fair value was other than temporary. As a result of the valuation analysis, the Company recorded a non-cash impairment charge of approximately $209 million, based on the difference between the carrying value and the fair value of the investment as of December 31, 2011. As of December 31, 2011, the Company’s investment balance in GF after impairment was $278 million.
Amended Wafer Supply Agreement
On April 2, 2011, the Company entered into a first amendment to the WSA. The primary effect of the first amendment was to change the pricing methodology applicable to wafers delivered in 2011 for the Company’s
microprocessors, including APU products. The first amendment also modified the Company’s existing commitments regarding the production of certain GPU and chipset products at GF. Pursuant to the first amendment, GF committed to provide the Company with, and the Company committed to purchase, a fixed number of 45nm and 32nm wafers per quarter in 2011. The Company paid GF a fixed price for 45nm wafers delivered in 2011. The Company’s price for 32nm wafers varied based on the wafer volumes and manufacturing yield of such wafers and was based on good die. In addition, the Company also agreed to pay an additional quarterly amount to GF during 2012 totaling up to $430 million if GF met specified conditions related to the continued availability of 32nm capacity as of the beginning of 2012. As part of the second amendment described below, GF agreed to waive these quarterly payments, and therefore the Company is no longer required to pay them.
Amendments to Wafer Supply Agreement and Accounting in 2012
Second Amendment to Wafer Supply Agreement
On March 4, 2012, the Company entered into a second amendment to the WSA with GF. The primary effect of this second amendment was to modify certain pricing and other terms of the WSA applicable to wafers for the Company’s microprocessor and APU products to be delivered by GF to the Company during 2012. Pursuant to the second amendment, GF committed to provide the Company with, and the Company committed to purchase, a fixed number of production wafers in 2012. The Company paid GF fixed prices for production wafers delivered in 2012.
The second amendment also granted the Company certain rights to contract with another wafer foundry supplier with respect to specified 28nm products for a specified period of time. In consideration for these rights, the Company agreed to pay GF $425 million and transfer to GF all of the capital stock of GF that it owned. As a result of the Company receiving these rights in the first quarter of 2012, the Company recorded a charge related to this limited waiver of exclusivity from GF of $703 million consisting of the $425 million cash payment and a $278 million non-cash charge representing the carrying and fair value of the capital stock that the Company transferred to GF. Pursuant to the second amendment, $150 million of the $425 million was paid on March 5, 2012, $50 million was paid on June 29, 2012 and $50 million was paid on October 1, 2012 with the remaining $175 million paid by December 31, 2012. In addition, as security for the final two payments, the Company issued a $225 million promissory note to GF.
As a result of the transfer of the Company’s shares of GF capital stock, the Company no longer owned any GF capital stock. Also, the Company is no longer entitled to designate a director to GF’s board, and its designated director resigned effective as of the date of the second amendment. As of March 4, 2012, the Company was no longer a party to either the Shareholders’ Agreement or the Funding Agreement.
Third Amendment to Wafer Supply Agreement
. On December 6, 2012, the Company entered into a third amendment to the WSA with GF.WSA. Pursuant to the third amendment, the Company modified its wafer purchase commitments for the fourth quarter of 2012 undermade pursuant to the second amendment to the WSA. In addition, the Company agreed to certain pricing and other terms of the WSA applicable to wafers for the Companyits microprocessor and APU products to be delivered by GF to the Company during 2013 andfrom the fourth quarter of 2012 through December 31, 2013. Pursuant to the third amendment, the Company committed to purchase a fixed number of production wafers at negotiated prices in the fourth quarter of 2012 and through December 31, 2013.GFGF agreed to waive a portion of the Company’s wafer purchase commitments for the fourth quarter of 2012. In consideration offor this waiver, the Company agreed to pay GF a fee of $320 million. As a result, the Company recorded a “lowerlower of cost or market” or LCM charge of $273 million for the write-down of inventory to its market value in the fourth quarter of 2012. The cash impact of this $320 million fee will be spreadwas paid over several quarters, with $80 million paid byon December 28, 2012, and $40 million bypaid on April 1, 2013. For the remainder of the fee, the Company issued a2013 and $200 million promissory note to GF that maturespaid on December 31, 2013.
GF continues
Fourth Amendment to Wafer Supply Agreement. On March 30, 2014, the Company entered into a fourth amendment to the WSA. The primary effect of the fourth amendment was to establish volume purchase commitments and fixed pricing for the 2014 calendar year as well as to modify certain other terms of the WSA applicable to wafers for some of the Company’s microprocessor unit, graphics processor unit and semi-custom game console products to be delivered by GF to the Company during the 2014 calendar year.
Fifth Amendment to Wafer Supply Agreement. On April 16, 2015, the Company entered into a related partyfifth amendment to the WSA. The primary effect of AMD. Thethe fifth amendment was to establish volume purchase commitments and fixed pricing for the 2015 calendar year as well as to modify certain other terms of the WSA applicable to wafers for some of the Company’s expenses relatedmicroprocessor unit, graphics processor unit and semi-custom products to GF’sbe delivered by GF to the Company during the 2015 calendar year.
As of December 26, 2015, certain wafer manufacturingdeliveries under the fifth amendment to the WSA have been delayed until fiscal 2016. As of December 26, 2015, purchase obligations for fiscal 2016 were $1.2 billion, $904approximately $248 million, of which approximately $185 million, consisting of wafers and $1.2 billion in 2012, 2011 and 2010. The Company’s expenses related to GF’s research and development activities, were $49received by December 31, 2015.
The Company generally negotiates its purchase commitments with GF on an annual basis and as such the Company cannot meaningfully quantify or estimate its future purchase obligations to GF. The Company is currently in the process of negotiating a sixth amendment to the WSA, and it expects that its future purchases from GF will continue to be material.
The Company’s total purchases from GF related to wafer manufacturing and research and development activities were $0.9 billion for 2015 and $1 billion for each 2014 and 2013, respectively.
NOTE 4: Equity Interest Purchase Agreement
On October 15, 2015, the Company entered into an Equity Interest Purchase Agreement (the Equity Interest Purchase Agreement) with Nantong Fujitsu Microelectronics Co., Ltd., a Chinese joint stock company (JV Party), under which the Company will sell to JV Party a majority of the equity interests in AMD Technologies (China) Co. Ltd., a wholly-foreign owned enterprise incorporated as a limited liability company (the Chinese Target Company), and Advanced Micro Devices Export Sdn. Bhd., a Malaysian limited liability company (the Malaysian Target Company and, together with the Chinese Target Company, the Target Companies), thereby forming two joint ventures (collectively, the JVs) with JV Party in a transaction valued at approximately $436 million (the Transaction). The JV Party will acquire 85% of the equity interests in each JV for approximately $371 million and the Company estimates it will receive approximately $320 million cash, net of taxes and other customary expenses. After closing, JV Party’s affiliates will own 85% of the equity interests in each JV while certain of the Company’s subsidiaries will own the remaining 15%. The Transaction will result in the JVs providing assembly, testing, marking, packing and packaging services (ATMP) to the Company. The Company plans to account for its investment in the JVs under the equity method of accounting.
The Equity Interest Purchase Agreement also has related agreements including: (i) with respect to the Malaysian Target Company, a Shareholders’ Agreement, and with respect to the Chinese Target Company, a Joint Venture Contract governing the joint venture relationships from and after the Closing, (ii) an IP License Agreement, (iii) a Manufacturing Services Agreement, (iv) a Transition Services Agreement, and (v) a Trademark License Agreement.
The transaction is expected to close in the first half of 2016, pending all regulatory and other approvals.
As a result of the decision to form the above JVs, the balance sheet as of December 26, 2015 reflects held-for-sale accounting of the ATMP assets and liabilities which requires reclassification of such financial amounts to current assets and current liabilities. The Company reclassified $183 million to other current assets and $79 million
to other current liabilities. Asset balances reclassified into other current assets primarily consist of property, plant, and
$114equipment of $110 million,
for 2012, 2011goodwill allocation of $42 million and
2010.On March 23, 2012, AMD acquired SeaMicro, Inc. (SeaMicro), a privately held company that produces energy-efficient, high-bandwidth microservers. Through the acquisitioninventory of SeaMicro, AMD plans to accelerate its strategy to deliver disruptive server technology to its original equipment manufacturers (OEM) customers serving Cloud-centric data centers.
The total consideration paid to acquire SeaMicro was $312 million, not including cash acquired$15 million. Liability balances reclassified into other current liabilities primarily consist of $19 million. In addition, AMD incurred $6 million in transaction costs, which were included in marketing, general and administrative expenses on AMD’s consolidated statementaccounts payable of operations. AMD paid $293 million in cash to the holders of all outstanding shares of SeaMicro capital stock. As part of the acquisition, AMD assumed all outstanding vested and unvested SeaMicro stock options and unvested restricted stock held by continuing SeaMicro employees as of March 23, 2012. The assumed options were exchanged for approximately 1,652,000 vested and 4,792,000 unvested AMD stock options. The assumed restricted stock was exchanged for approximately 322,000 AMD restricted shares. The stock options and restricted shares continue to have the same terms and conditions as under SeaMicro’s option plan. The fair value attributable to pre-combination employee service as of the March 23, 2012 closing for the stock options and restricted shares assumed, which was part of the consideration paid to acquire SeaMicro, was $19$70 million. The fair value for the stock options assumed was determined using a binomial option-pricing valuation model.
The total cash consideration of $293 million included $29 million deposited into an escrow account as security for any breaches by SeaMicro of representations, warranties and covenants under the acquisition agreement. The escrow funds, less amounts of any valid indemnification claims, if any, will be disbursed by the escrow agent to the former stockholders of SeaMicro in March 2013.
The acquisition was accounted for using the purchase method of accounting in accordance with Accounting Standard Codification (ASC) 805, Business Combinations. Accordingly, the total consideration was assigned to the tangible and identified intangible assets acquired and liabilities assumed based on their estimated fair values as of the acquisition date. Fair values were determined by AMD’s management based on information available at the date of acquisition. After the closing of the acquisition, the results of operations of SeaMicro arebalances included in the Computing Solutions segment in AMD’s consolidated financial statements.
The assets acquired and liabilities assumed based onfinal gain/(loss) calculation, at closing, are likely to be different due to normal operational activities occurring through the estimated fair value of SeaMicro were as follows:
| | | | | | | | |
| | | March 23,
2012 | | | Estimated useful lives | |
| | | (In millions) | | | | |
Purchase consideration | | | | | | | | |
Cash | | $ | 293 | | | | | |
Vested portion of the replacement grants | | | 19 | | | | | |
Total purchase consideration | | $ | 312 | | | | | |
Tangible assets acquired | | $ | 24 | | | | | |
Identified intangible assets acquired | | | | | | | | |
Developed technology | | | 86 | | | | 8 years | |
In-process research and development | | | 11 | | | | | |
Customer relationships | | | 4 | | | | 4 years | |
Trade name | | | 1 | | | | 4 years | |
Total assets acquired | | | 126 | | | | | |
Liabilities assumed | | | 8 | | | | | |
Deferred tax liabilities | | | 36 | | | | | |
Total liabilities assumed | | | 44 | | | | | |
Goodwill | | $ | 230 | | | | | |
The developed technology of SeaMicro relates to SeaMicro’s SM10000 server offerings, which is built around a parallel array of independent ultra-low power processors, and it serves to integrate computation, switching, server management, and load balancing. In addition to developed technology, SeaMicro had in-process research and development projects, which were incomplete at the time of the acquisition. The value of developed technology and in-process research and development was determined based on the present value of estimated expected cash flows attributable to the technology. The customer relationships related to the ability to sell existing, in-process and future versions of the technology to SeaMicro’s existing customers and were valued based on incremental cash flows generated from the existing customer base. The trade name related to the SeaMicro brand names. The goodwill was primarily attributed to premiums paid for synergies between AMD and SeaMicro and the assembled workforce and is not deductible for tax purposes. The acquired developed technology, customer relationships and trade name are amortized on a straight-line basis over their estimated useful lives. The acquired in-process research and development and goodwill associated with the acquisition are categorized as indefinite-lived intangible assets and subject to impairment review. Capitalized acquired in-process research and development costs will remain capitalized until such time as the projects are complete, at which point they will be amortized, or they will be written off when it is probable the projects will not be completed. As of December 29, 2012, approximately $5 million of in-process research and development projects were completed and classified as developed technology, and the Company started to amortize these projects on a straight-line basis over their estimated useful lives.
The unaudited pro forma financial information in the table below summarizes the combined results of operations of AMD and SeaMicro during 2012 and 2011 as though the acquisition had occurred as of the beginning of the comparable prior annual reporting period. The pro forma financial information also includes certain adjustments such as amortization expense from acquired intangible assets, inventory adjustment to fair value, share-based compensation expense related to unvested stock options and restricted stock assumed, acquisition-related costs and the income tax impact of the pro forma adjustments. The pro forma financial information presented below does not include any anticipated synergies or other expected benefits of the acquisition. It is presented for informational purposes only and not indicative of the results of operations that would have been achieved if the acquisition had taken place at the beginning of the periods presented.
| | | | | | | | |
| | | Year Ended | |
| | | December 29,
2012 | | | December 31,
2011 | |
| | | (In millions, except per share amounts) | |
Net revenue | | $ | 5,424 | | | $ | 6,572 | |
Net income (loss) | | $ | (1,232 | ) | | $ | 485 | |
Diluted earnings (loss) per share | | $ | (1.66 | ) | | $ | 0.65 | |
NOTE 5: | Supplemental Balance Sheet Information |
Accounts receivable
| | | | | | | | |
| | | December 29,
2012 | | | December 31,
2011 | |
| | | (In millions) | |
Accounts receivable | | $ | 632 | | | $ | 921 | |
Allowance for doubtful accounts | | | (2 | ) | | | (2 | ) |
Total accounts receivable, net | | $ | 630 | | | $ | 919 | |
NOTE 5: Supplemental Balance Sheet Information
Inventories
| | | | | | | | |
| | | December 29,
2012 | | | December 31,
2011 | |
| | | (In millions) | |
Raw materials | | $ | 29 | | | $ | 25 | |
Work in process | | | 357 | | | | 295 | |
Finished goods | | | 176 | | | | 156 | |
Total inventories, net | | $ | 562 | | | $ | 476 | |
|
| | | | | | | |
| | December 26,
2015 | | December 27,
2014 |
| | (In millions) |
| Raw materials | $ | 16 |
| | $ | 40 |
|
| Work in process | 482 |
| | 431 |
|
| Finished goods | 180 |
| | 214 |
|
| Total inventories, net | $ | 678 |
| | $ | 685 |
|
Other current assets
|
| | | | | | | |
| | December 26,
2015 | | December 27,
2014 |
| | (In millions) |
| Assets held-for-sale | $ | 183 |
| | $ | — |
|
| Other current assets | 65 |
| | 48 |
|
| Total other current assets | $ | 248 |
| | $ | 48 |
|
Property, plant and equipment
| | | | | | | | |
| | | December 29,
2012 | | | December 31,
2011 | |
| | | (In millions) | |
Land and land improvements | | $ | 31 | | | $ | 31 | |
Buildings and leasehold improvements | | | 591 | | | | 544 | |
Equipment | | | 1,585 | | | | 1,507 | |
Construction in progress | | | 11 | | | | 114 | |
| | | 2,218 | | | | 2,196 | |
Accumulated depreciation and amortization | | | (1,560 | ) | | | (1,470 | ) |
Total property, plant and equipment, net | | $ | 658 | | | $ | 726 | |
|
| | | | | | | |
| | December 26,
2015 | | December 27,
2014 |
| | (In millions) |
| Land and land improvements | $ | 1 |
| | $ | 4 |
|
| Buildings and leasehold improvements | 145 |
| | 246 |
|
| Equipment | 821 |
| | 1,416 |
|
| Construction in progress | 17 |
| | 14 |
|
| Property, plant and equipment, gross | 984 |
| | 1,680 |
|
| Accumulated depreciation and amortization | (796 | ) | | (1,378 | ) |
| Total property, plant and equipment, net | $ | 188 |
| | $ | 302 |
|
Depreciation expense for 2012, 20112015, 2014 and 20102013 was $179$94 million $217, $115 million and $256$139 million, respectively.
Other assets
|
| | | | | | | |
| | December 26,
2015 | | December 27,
2014 |
| | (In millions) |
| Software and technology licenses | $ | 189 |
| | $ | 219 |
|
| Other | 134 |
| | 125 |
|
| Total other assets | $ | 323 |
| | $ | 344 |
|
Accrued liabilities
|
| | | | | | | |
| | December 26,
2015 | | December 27,
2014 |
| | (In millions) |
| Accrued compensation and benefits | $ | 95 |
| | $ | 139 |
|
| Marketing programs and advertising expenses | 109 |
| | 141 |
|
| Software technology and licenses payable | 50 |
| | 39 |
|
| Other accrued and current liabilities | 218 |
| | 199 |
|
| Total accrued liabilities | $ | 472 |
| | $ | 518 |
|
Other current liabilities | | | | | | | | |
| | | December 29,
2012 | | | December 31,
2011 | |
| | | (In millions) | |
Accrued compensation and benefits | | $ | 158 | | | $ | 161 | |
Marketing programs and advertising expenses | | | 160 | | | | 223 | |
Software technology and licenses payable | | | 18 | | | | 20 | |
Other | | | 153 | | | | 146 | |
Total accrued liabilities | | $ | 489 | | | $ | 550 | |
|
| | | | | | | |
| | December 26,
2015 | | December 27,
2014 |
| | (In millions) |
| Liabilities related to assets held-for-sale | $ | 79 |
| | $ | — |
|
| Other current liabilities | 45 |
| | 40 |
|
| Total other current liabilities | $ | 124 |
| | $ | 40 |
|
NOTE 6: | Goodwill and Acquired Intangible Assets |
NOTE 6: Goodwill
and Acquired Intangible Assets
Goodwill
The
changes in the carrying amounts of goodwill as of December
29, 201226, 2015 and December
31, 201127, 2014 were as follows:
| | | | | | | | | | | | | | | | |
| | | Computing
Solutions | | | Graphics | | | All Other | | | Total | |
| | | (In millions) | |
Initial goodwill due to ATI acquisition | | $ | 161 | | | $ | 1,288 | | | $ | 745 | | | $ | 2,194 | |
Accumulated impairment losses | | | (161 | ) | | | (965 | ) | | | (745 | ) | | | (1,871 | ) |
Balance as of December 31, 2011 | | | — | | | | 323 | | | | — | | | | 323 | |
Addition due to SeaMicro acquisition | | | 230 | | | | — | | | | — | | | | 230 | |
Balance as of December 29, 2012 | | $ | 230 | | | $ | 323 | | | $ | — | | | $ | 553 | |
|
| | | | | | | | | | | | | | | |
| | Computing and Graphics | | Enterprise, Embedded and Semi-Custom | | All Other | | Total |
| | (In millions) |
| Initial goodwill due to ATI acquisition | $ | 1,194 |
| | $ | 255 |
| | $ | 745 |
| | $ | 2,194 |
|
| Initial goodwill due to SeaMicro acquisition | 165 |
| | 65 |
| | — |
| | 230 |
|
| | 1,359 |
| | 320 |
| | 745 |
| | 2,424 |
|
| Accumulated impairment losses | (1,126 | ) | | — |
| | (745 | ) | | (1,871 | ) |
| Balance as of December 28, 2013 | 233 |
| | 320 |
| | — |
| | 553 |
|
| Impairment charges | (233 | ) | | — |
| | — |
| | (233 | ) |
| Balance as of December 27, 2014 | — |
| | 320 |
| | — |
| | 320 |
|
| Assets held-for-sale | — |
| | (42 | ) | | — |
| | (42 | ) |
| Balance as of December 26, 2015 | — |
| | 278 |
| | — |
| | 278 |
|
| Accumulated impairment losses | $ | (1,359 | ) | | $ | — |
| | $ | (745 | ) | | $ | (2,104 | ) |
As a result of the decision to form the JVs with Nantong Fujitsu Microelectronics Co., Ltd., the balance sheet as of December 26, 2015 reflects held-for-sale accounting of the ATMP assets and liabilities which requires reclassification of such financial amounts to current assets and current liabilities. Asset balances reclassified into other current assets included goodwill of $42 million.
In the third quarter of 2014, the Company’s realignment of its organizational structure, effective July 1, 2014, caused a change in the composition of the Company’s reportable segments and reporting units. This represented a change in circumstance requiring the reassignment of the goodwill to the new reporting units using a relative fair value approach and an interim goodwill impairment analysis before and after the Company’s reorganization. The Company completed this goodwill impairment analysis during the third quarter of 2014. For purposes of this analysis, the Company’s estimates of fair value were based on the income approach, which estimates the fair value of the Company’s reporting units based on future discounted cash flows. The Company determined that each reporting unit’s estimated fair value exceeded its carrying value, indicating that there was no goodwill impairment.
During the fourth quarter of 2014, the Company conducted its annual impairment test of goodwill. In step one of the impairment test, the Company compared the fair value of each of the reporting units to its carrying value. The Company determined that the carrying value of the Computing and Graphics reporting unit exceeded its fair value, indicating potential goodwill impairment existed based on a combination of factors such as a decline in stock price.Therefore, the Company performed the second step of the impairment test, in which the fair value of the reporting unit is allocated to all of the assets and liabilities of the reporting unit on a fair value basis, including any unrecognized intangible assets, with any excess representing the implied fair value of goodwill. The fair value was determined using an income approach, which estimates the present value of future cash flows based on management’s forecast of revenue growth rates and operating margins. Based on this analysis, the implied fair value of the goodwill of the Computing and Graphics reporting unit was zero. The Company concluded that the carrying amount of goodwill asassigned to the Computing and Graphics segment exceeded the implied fair values and recorded an impairment charge of December 29, 2012, December 31, 2011$233 million, which is included in “Goodwill impairment charge” on the Company’s consolidated statement of operations.
The Company determined that the estimated fair value exceeded the carrying value of the remaining two reporting units, indicating that there was no goodwill impairment with respect to these reporting units. In connection with completing the goodwill
impairment analysis, the Company reviewed its long-lived tangible and
December 25, 2010 was $553 million, $323 millionintangible assets within the Computing and
$323 million, respectively.Graphics reporting unit under ASC 360, “Accounting for the Impairment or Disposal of Long-Lived Assets.” The Company determined that the forecasted undiscounted cash flows related to these assets or asset groups were in excess of their carrying values, and therefore these assets were not impaired.
In the fourth quarters of
2012, 20112015 and
2010,2013, the Company conducted its annual impairment tests of goodwill. Based on the results of the Company’s analysis of goodwill, each reporting unit’s fair value exceeded its carrying value, indicating that there was no goodwill impairment in
any of the periods.2015 and 2013.
Acquisition-related intangible assets
As a part of the Company’s strategy to simplify and sharpen its investment focus, the Company decided to exit the dense server systems business, formerly SeaMicro, in the first quarter of 2015. As a result, the Company recorded a charge of $76 million in “Restructuring and other special charges, net” on the Company’s consolidated statements of operations during 2015. This charge consisted of an impairment charge of $62 million related to the acquired intangible assets. The Company concluded that the carrying value of the acquired intangible assets associated with its dense server systems business was fully impaired as the Company did not have plans to utilize the related freedom fabric technology in any of its future products nor did it have any plans at that time to monetize the associated intellectual property.
The balances of acquisition-related intangible assets as of December 29, 2012,26, 2015 and December 27, 2014 were as follows: | | | | | | | | | | | | | | | | | | | | | | | | |
| | | Developed
technology | | | In-process
research
and
development | | | Game
console
royalty
agreements | | | Customer
relationships | | | Trademark
and trade
name | | | Total | |
Intangible assets, net as of December 25, 2010 | | $ | — | | | $ | — | | | $ | 25 | | | $ | 1 | | | $ | 11 | | | $ | 37 | |
Amortization expense | | | — | | | | — | | | | (25 | ) | | | (1 | ) | | | (3 | ) | | | (29 | ) |
Intangible assets, net as of December 31, 2011 | | | — | | | | — | | | | — | | | | — | | | | 8 | | | | 8 | |
Addition due to SeaMicro acquisition | | | 86 | | | | 11 | | | | — | | | | 4 | | | | 1 | | | | 102 | |
Completion of in-process research and development | | | 5 | | | | (5 | ) | | | — | | | | — | | | | — | | | | — | |
Amortization expense | | | (9 | ) | | | — | | | | — | | | | (1 | ) | | | (4 | ) | | | (14 | ) |
Intangible assets, net as of December 29, 2012 | | $ | 82 | | | $ | 6 | | | $ | — | | | $ | 3 | | | $ | 5 | | | $ | 96 | |
Accumulated
|
| | | | | | | | | | | | | | | | | | | | | | | | | | | | | | |
| | | December 26, 2015 | | December 27, 2014 |
| | | Gross | | Impairment charges | | Accumulated Amortization | | Net | | Weighted-average amortization period | | Gross | | Accumulated Amortization | | Net |
| | | (In millions, except years) |
| Developed technology | | $ | 258 |
| | $ | (54 | ) | | $ | (204 | ) | | $ | — |
| | 5.15 years | | $ | 258 |
| | $ | (201 | ) | | $ | 57 |
|
| In-process research and development | | 6 |
| | (6 | ) | | — |
| | — |
| | N/A | | 6 |
| | — |
| | 6 |
|
| Customer relationships | | 168 |
| | (1 | ) | | (167 | ) | | — |
| | 1.25 years | | 168 |
| | (167 | ) | | 1 |
|
| Trademark and trade name | | 37 |
| | (1 | ) | | (36 | ) | | — |
| | 1.25 years | | 37 |
| | (36 | ) | | 1 |
|
| Total | | $ | 469 |
| | $ | (62 | ) | | $ | (407 | ) | | $ | — |
| | 4.56 years | | $ | 469 |
| | $ | (404 | ) | | $ | 65 |
|
The following table summarizes amortization
of acquired intangible assets as of December 29, 2012 was approximately $554 million.As of December 29, 2012, the Company’s future amortization expenses related toexpense associated with acquisition-related intangible assets were as follows:
| | | | |
| Year | | (In millions) | |
2013 | | $ | 17 | |
2014 | | | 14 | |
2015 | | | 13 | |
2016 | | | 11 | |
2017 | | | 11 | |
2018 and thereafter | | | 24 | |
Total intangible assets subject to amortization | | $ | 90 | |
In-process research and development | | $ | 6 | |
Total intangible assets, net | | $ | 96 | |
assets:
|
| | | | | | | | | | | | |
| | | 2015 | | 2014 | | 2013 |
| | | (In millions) |
| Developed technology | | $ | 3 |
| | $ | 13 |
| | $ | 13 |
|
| Customer relationships | | — |
| | 1 |
| | 1 |
|
| Trademark and trade name | | — |
| | — |
| | 4 |
|
| Total | | $ | 3 |
| | $ | 14 |
| | $ | 18 |
|
NOTE 7: Financial Instruments
Cash, Cash Equivalents and Marketable Securities
Cash and financial instruments measured and recorded at fair value on a recurring basis as of December 26, 2015 and December 27, 2014 are summarized below:
|
| | | | | | | | |
| | | Total Fair Value | | Cash and Cash Equivalents |
| | | (In millions) |
| December 26, 2015 | | | | |
| Cash | | $ | 409 |
| | $ | 409 |
|
Level 2(2) (3) | | | | |
| Commercial paper | | 376 |
| | 376 |
|
| Total level 2 | | 376 |
| | 376 |
|
| Total | | $ | 785 |
| | $ | 785 |
|
|
| | | | | | | | | | | | |
| | | Total Fair Value | | Cash and Cash Equivalents | | Short-Term Marketable Securities |
| | (In millions) |
| December 27, 2014 | | | | | | |
| Cash | | $ | 391 |
| | $ | 391 |
| | $ | — |
|
Level 1(1) (2) | | | | | | |
| Money market funds | | 4 |
| | 4 |
| | — |
|
| Total level 1 | | 4 |
| | 4 |
| | — |
|
Level 2(2) (3) | | | | | | |
| Commercial paper | | 618 |
| | 410 |
| | 208 |
|
| Corporate bonds | | 27 |
| | — |
| | 27 |
|
| Total level 2 | | 645 |
| | 410 |
| | 235 |
|
| Total | | $ | 1,040 |
| | $ | 805 |
| | $ | 235 |
|
NOTE 7: | |
Financial Instruments(1)
| The Company’s Level 1 assets are valued using quoted prices for identical instruments in active markets. |
| |
(2) | The Company did not have any transfers between Level 1 and Level 2 of the fair value hierarchy during 2015 and 2014. |
| |
(3) | The Company’s Level 2 short-term investments are valued using broker reports that utilize quoted market prices for identical or comparable instruments. Brokers gather observable inputs for all of the Company’s fixed income securities from a variety of industry data providers and other third-party sources. |
Available-for-sale securities held by the Company as of December
29, 201226, 2015 consisted of commercial paper and
as of December
31, 2011 were as follows: | | | | | | | | |
| | | December 29,
2012 | | | December 31,
2011 | |
| | | (In millions) | |
Fair Value | | | | | | | | |
Classified as cash equivalents: | | | | | | | | |
Money market funds | | $ | 402 | | | $ | 738 | |
Commercial paper | | | 75 | | | | 1 | |
Total classified as cash equivalents | | $ | 477 | | | $ | 739 | |
Classified as current marketable securities: | | | | | | | | |
Commercial paper | | $ | 324 | | | $ | 698 | |
Time deposits | | | 100 | | | | 160 | |
Auction rate securities | | | 28 | | | | 38 | |
Marketable equity securities | | | 1 | | | | — | |
Total classified as current marketable securities | | $ | 453 | | | $ | 896 | |
Classified as long-term marketable securities: | | | | | | | | |
Money market funds | | $ | 13 | | | $ | 9 | |
Corporate bonds | | | 168 | | | | 140 | |
Total classified as long-term marketable securities | | $ | 181 | | | $ | 149 | |
Classified as other assets: | | | | | | | | |
Money market funds | | $ | 10 | | | $ | 10 | |
Mutual funds | | | 14 | | | | — | |
Total classified as other assets | | $ | 24 | | | $ | 10 | |
27, 2014 also consisted of money market funds and corporate bonds. The amortized cost of available-for-sale securities approximates the fair value for theall periods presented.
At
In addition to those amounts presented above, as of December
29, 201226, 2015 and December
31, 2011,27, 2014, the Company had approximately
$1 million and $10 million,
respectively, of available-for-sale investments in money market funds, used as collateral for leased buildings and
letterletters of credit deposits, which were included in
otherOther assets on the Company’s consolidated balance sheets.
These money market funds are classified within Level 1 because they are valued using quoted prices for identical instruments in active markets. Their amortized costs are the same as the fair value for all periods presented. The Company is restricted from accessing these deposits.
At
Also in addition to those amounts presented above, at December
29, 2012,26, 2015 and December 27, 2014, the Company had approximately
$14$15 million
and $16 million, respectively, of available-for-sale investments in mutual funds held in a Rabbi trust established for the Company’s deferred compensation plan, which were
also included in
other assets“Other assets” on the Company’s consolidated balance sheets.
The Company is restricted from accessing these investments.The Company did not realize any gain or loss on sales of available-for-sale securities of approximately $6 million during 2012. The Company recorded an other-than-temporary impairment charge of approximately $4 million on one its ARS holdings during 2012.
The Company realized a gain of approximately $4 million on sales of available-for-sale securities of approximately $29 million during 2011. The gain includes approximately $2 million in other income (expense), net from redemption of auction rate securities (ARS) called at par for $21 million with a net carrying amount of $19 million during 2011.
The carrying value of the Company’s remaining ARS holdings as of December 29, 2012 was $28 million (par value $37 million). The Company has the intent and believes it has the ability to sell these securities within the next 12 months.
During 2012 and 2011, the Company invested $32 million and $149 million, respectively, in long-term marketable securities, which the Company intends to hold greater than one year, and does not intend to use in current operations.
All contractual maturities of the Company’s available-for-sale marketable debt securities at December 29, 2012 were within one year except those for ARS and certain long-term marketable securities. The Company’s ARS have stated maturities ranging from January 2030 to December 2050. The Company’s long-term marketable securities include corporate bonds and money market funds. The corporate bonds have maximum stated maturities of 2 years, and the Company intends to invest the money market funds into corporate bonds with maturities of greater than a year. Actual maturities may differ from contractual maturities because issuers may have the right to call or prepay obligations without call or prepayment penalties.
Fair Value Measurements
Financial instruments measured and recorded at fair value on a recurring basis are summarized below:
| | | | | | | | | | | | | | | | |
| | | Fair value measurement at reporting dates using | |
| | | Total | | | Quoted Prices
in Active
Markets for
Identical Assets
(Level 1) | | | Significant
Other
Observable
Inputs
(Level 2) | | | Significant
Unobservable
Inputs (Level 3) | |
| | | (In millions) | |
December 29, 2012 | | | | | | | | | | | | | | | | |
Assets | | | | | | | | | | | | | | | | |
Classified as cash equivalents: | | | | | | | | | | | | | | | | |
Money market funds | | $ | 402 | | | $ | 402 | | | $ | — | | | $ | — | |
Commercial paper | | | 75 | | | | — | | | | 75 | | | | — | |
Total classified as cash equivalents | | $ | 477 | | | $ | 402 | | | $ | 75 | | | $ | — | |
Classified as marketable securities: | | | | | | | | | | | | | | | | |
Commercial paper | | $ | 324 | | | $ | — | | | $ | 324 | | | $ | — | |
Time deposits | | | 100 | | | | — | | | | 100 | | | | — | |
Auction rate securities | | | 28 | | | | — | | | | — | | | | 28 | |
Marketable equity security | | | 1 | | | | 1 | | | | — | | | | — | |
Total classified as marketable securities | | $ | 453 | | | $ | 1 | | | $ | 424 | | | $ | 28 | |
Classified as long-term marketable securities: | | | | | | | | | | | | | | | | |
Money market funds | | $ | 13 | | | $ | 13 | | | $ | — | | | $ | — | |
Corporate bonds | | | 168 | | | | — | | | | 168 | | | | — | |
Total classified as long-term marketable securities | | $ | 181 | | | $ | 13 | | | $ | 168 | | | $ | — | |
Classified as other assets: | | | | | | | | | | | | | | | | |
Money market funds | | $ | 10 | | | $ | 10 | | | $ | — | | | $ | — | |
Mutual funds | | | 14 | | | | 14 | | | | — | | | | — | |
Total classified as other assets | | $ | 24 | | | $ | 24 | | | $ | — | | | $ | — | |
Total assets measured at fair value | | $ | 1,135 | | | $ | 440 | | | $ | 667 | | | $ | 28 | |
December 31, 2011 | | | | | | | | | | | | | | | | |
Assets | | | | | | | | | | | | | | | | |
Classified as cash equivalents: | | | | | | | | | | | | | | | | |
Money market funds | | $ | 738 | | | $ | 738 | | | $ | — | | | $ | — | |
Commercial paper | | | 1 | | | | — | | | | 1 | | | | — | |
Total classified as cash equivalents | | $ | 739 | | | $ | 738 | | | $ | 1 | | | $ | — | |
Classified as marketable securities: | | | | | | | | | | | | | | | | |
Commercial paper | | $ | 698 | | | $ | — | | | $ | 698 | | | $ | — | |
Time deposits | | | 160 | | | | — | | | | 160 | | | | — | |
Auction rate securities | | | 38 | | | | — | | | | — | | | | 38 | |
Total classified as marketable securities | | $ | 896 | | | $ | — | | | $ | 858 | | | $ | 38 | |
Classified as long-term marketable securities: | | | | | | | | | | | | | | | | |
Money market funds | | $ | 9 | | | $ | 9 | | | $ | — | | | $ | — | |
Corporate bonds | | | 140 | | | | — | | | | 140 | | | | — | |
Total classified as long-term marketable securities | | $ | 149 | | | $ | 9 | | | $ | 140 | | | $ | — | |
Classified as other assets: | | | | | | | | | | | | | | | | |
Money market funds | | $ | 10 | | | $ | 10 | | | $ | — | | | $ | — | |
Total classified as other assets | | $ | 10 | | | $ | 10 | | | $ | — | | | $ | — | |
Total assets measured at fair value | | $ | 1,794 | | | $ | 757 | | | $ | 999 | | | $ | 38 | |
Liabilities | | | | | | | | | | | | | | | | |
Classified as accrued liabilities: | | | | | | | | | | | | | | | | |
Foreign currency derivative contracts | | $ | (2 | ) | | $ | — | | | $ | (2 | ) | | $ | — | |
Total liabilities measured at fair value | | $ | (2 | ) | | $ | — | | | $ | (2 | ) | | $ | — | |
With the exception of its long-term debt, the Company carries its financial instruments at fair value. Investments in money market,These mutual funds commercial paper, time deposits, marketable equity securities, corporate bonds and foreign currency derivative contracts are classified within Level 1 or Level 2. This is because such financial instruments are valued primarily using quoted market prices or alternative pricing sources and models utilizing market observable inputs, as provided to the Company by its brokers. The Company’s Level 1 assetsthey are valued using quoted prices for identical instruments in active markets. The Company’s Level 2 short-term investments are valued using broker reports that utilize quoted market prices for identical or comparable instruments. Brokers gather observable inputs for all of the Company’s fixed income securities from a variety of industry data providers and other third-party sources. The Company’s Level 2 long-term investments are valued using broker reports that utilize a third party professional pricing service who gathers information from multiple market sources and integrates relevant credit information, observed market movements and sector news into their pricing evaluation. The Company validates, on a sample basis, the derived prices provided by the brokers by comparing their assessment of the fair values of the Level 2 long term investments against the fair values of the portfolio balances of another third-party professional’s pricing services, other than that utilized by the brokers, who use a similar technique as the brokers to derive pricing as described above. The Company’s foreign currency derivative contracts are classified within Level 2 because the valuation inputs are based on quoted prices and market observable data of similar instruments in active markets, such as currency spot and forward rates.
The Company did not have any transfers between Level 1 and Level 2 ofTheir amortized cost approximates the fair value hierarchy.
for all periods presented. The ARS investments are classified within Level 3 because they are valued using a discounted cash flow model. Some of the inputs to this model are unobservable in the market and are significant.
The continuing uncertainties in the credit markets have affected all of the Company’s ARS investments and auctions forCompany is restricted from accessing these securities have failed to settle on their respective settlement dates since February 2008. As a result, reliable Level 1 or Level 2 pricing is not available for these ARS. In light of these developments, the Company performs its own discounted cash flow analysis to value these ARS. As of December 29, 2012 and December 31, 2011, the Company’s significant inputs and assumptions used in the discounted cash flow model to determine the fair value of its ARS, include interest rate, liquidity and credit discounts and the estimated life of the ARS investments. As of December 29, 2012, these Level 3 ARS accounted for approximately 3 percent of the Company’s total cash, cash equivalents and marketable securities.
The roll-forward of the ARS measured at fair value on a recurring basis using significant unobservable inputs (Level 3) is as follows:
| | | | | | | | |
| | | December 29,
2012 | | | December 31,
2011 | |
| | | (In millions) | |
Beginning balance | | $ | 38 | | | $ | 57 | |
Redemption at par | | | (6 | ) | | | (21 | ) |
Gain (loss) included in net income (loss) | | | — | | | | 2 | |
Change in fair value included in net income (loss) | | | (4 | ) | | | — | |
Change in fair value included in other comprehensive income (loss) | | | — | | | | — | |
Ending balance | | $ | 28 | | | $ | 38 | |
The Company’s significant inputs and assumptions used in the discounted cash flow model to determine the fair value of its ARS are listed below:
| | | | | | | | |
| | | December 29,
2012 | | | December 31,
2011 | |
Discount rate for periodic interest payments | | | 0.84 | % | | | 1.13 | % |
Discount rate for principal repayments | | | 1.31 | % | | | 1.93 | % |
Liquidity discount | | | 0.90 | % | | | 0.90 | % |
Credit discount | | | 2.00% to 12.00 | % | | | 2.00 | % |
Estimated period | | | 17 to 20 years | | | | 17 years | |
Significant increases (decreases) in the significant inputs and assumptions above in isolation would result in a significantly lower (higher) fair value measurement. There is no interrelationship between changes in the inputs.
Financial Instruments Not Recorded at Fair Value on a Recurring Basis. The Company carries its financial instruments at fair value with the exception of its debt. Financial instruments that are not recorded at fair value are measured at fair value on a quarterly basis for disclosure purposes. The carrying amounts and estimated fair values of financial instruments not recorded at fair value are as follows: | | | | | | | | | | | | | | | | |
| | | December 29, 2012 | | | December 31, 2011 | |
| | | Carrying
amount | | | Estimated
Fair Value | | | Carrying
amount | | | Estimated
Fair Value | |
| | | (In millions) | |
Short-term debt (excluding capital leases) | | $ | — | | | $ | — | | | $ | 485 | | | $ | 490 | |
Long-term debt (excluding capital leases) | | $ | 2,019 | | | $ | 1,837 | | | $ | 1,505 | | | $ | 1,619 | |
|
| | | | | | | | | | | | | | | |
| | December 26, 2015 | | December 27, 2014 |
| | Carrying Amount | | Estimated Fair Value | | Carrying Amount | | Estimated Fair Value |
| | (In millions) |
| Short-term debt (excluding capital leases) | $ | 230 |
| | $ | 230 |
| | $ | 172 |
| | $ | 173 |
|
| Long-term debt (excluding capital leases) | $ | 2,025 |
| | $ | 1,372 |
| | $ | 2,025 |
| | $ | 1,858 |
|
The Company’s short-term and long-term debt are classified within Level 2. The fair value of the
Company’s short-term and long-term debt
Level 2 financial instruments, was estimated based on the quoted market prices for the same or similar issues or on the current rates offered to the Company for debt of the same remaining maturities. The fair value of the Company’s accounts receivable, accounts payable and other short-term obligations approximate their carrying value based on existing payment terms.
Hedging Transactions and Derivative Financial Instruments
Cash Flow Hedges
The following table shows the amount of gain (loss) included in accumulated other comprehensive income (loss), the amount of gain (loss) reclassified from accumulated other comprehensive income (loss) and included in earnings related to the foreign currency forward contracts designated as cash flow hedges and the amount of gain (loss) included in other income (expense), net, related to contracts not designated as hedging instruments, which was allocated in the consolidated statements of operations: |
| | | | | | | |
| | 2015 | | 2014 |
| | (In millions) |
Foreign Currency Forward Contracts - gains (losses) | | | |
| Contracts designated as cash flow hedging instruments | | | |
| Other comprehensive income (loss) | $ | (1 | ) | | $ | (3 | ) |
| Cost of sales | (4 | ) | | — |
|
| Research and development | (10 | ) | | (3 | ) |
| Marketing, general and administrative | (7 | ) | | (3 | ) |
| Contracts not designated as hedging instruments | | | |
| Other income (expense), net | $ | (3 | ) | | $ | (3 | ) |
The Company’s foreign currency derivative contracts are classified within Level 2 because the valuation inputs are based on quoted prices and market observable data of similar instruments in active markets, such as currency spot and forward rates.
The following table shows the fair value amounts included in Other current assets should the foreign currency forward contracts be in a gain position or included in Other current liabilities should these contracts be in a loss position. As of December 26, 2015, the Company’s outstanding contracts were in a net loss position of $6 million. These amounts were recorded in the Company’s consolidated balance sheets as follows:
|
| | | | | | | | |
| | | December 26,
2015 | | December 27,
2014 |
| | | (In millions) |
Foreign Currency Forward Contracts - gains (losses) | | | | |
| Contracts designated as cash flow hedging instruments | | $ | (6 | ) | | $ | (6 | ) |
| Contracts not designated as hedging instruments | | $ | — |
| | $ | (1 | ) |
For the foreign currency contracts designated as cash flow hedges, the ineffective portions of the hedging relationship and the amounts excluded from the assessment of hedge effectiveness were immaterial.
As of December 26, 2015 and December 27, 2014, the notional values of the Company’s outstanding foreign currency forward contracts were $156 million and $298 million, respectively. All the contracts mature within 12 months, and, upon maturity, the amounts recorded in accumulated other comprehensive income (loss) are expected to be reclassified into earnings. The Company hedges its exposure to the variability in future cash flows for forecasted transactions over a maximum of 12 months.
Fair Value Hedges
In the third quarter of 2014, the Company entered into fixed-to-floating interest rate swaps on a notional amount of $250 million to hedge a portion of the Company’s 6.75% Senior Notes due 2019 (6.75% Notes). The purpose of these swaps is to manage
a portion of the Company’s exposure to interest rate risk by converting fixed rate interest payments to floating rate interest payments. The swaps effectively converted a portion of the fixed interest payments payable on the 6.75% Notes into variable interest payments based on LIBOR. The interest rate swaps are designated as a fair value hedge. Because the specific terms and notional amount of the swaps are intended to match the portion of the 6.75% Notes being hedged, it is assumed to be a highly effective hedge. Accordingly, changes in the fair value of the interest rate swaps are exactly offset by changes in the fair value of the 6.75% Notes. All changes in fair value of the swaps are recorded on the Company’s consolidated balance sheets with no net impact to the Company’s consolidated statements of operations.
The Company’s fair value hedge derivative contracts are classified within Level 2 because the valuation inputs are based on quoted prices and market observable data of similar instruments in active markets.
The following table shows the fair value amounts included in Other assets should the fair value hedge derivative contracts be in a gain position or included in Other long-term liabilities should these contracts be in a loss position. These amounts were recorded in the Company’s consolidated balance sheets as follows:
|
| | | | | | | | |
| | | December 26,
2015 | | December 27,
2014 |
| | | (In millions) |
Interest Rate Swap Contracts - gains (losses) | | | | |
| Contracts designated as fair value hedging instruments | | $ | 7 |
| | $ | 3 |
|
NOTE 8: | Concentrations of Credit and Operation Risk |
NOTE 8: Concentrations of Credit and Operation Risk
Financial instruments that potentially subject the Company to concentrations of credit risk consist primarily of investments in debt securities, trade receivables and derivative financial instruments used in hedging activities.
The Company places its investments with high credit quality financial institutions and, by policy, limits the amount of credit exposure with any one financial institution. The Company invests in time deposits and certificates of deposit from banks having combined capital, surplus and undistributed profits of not less than $200 million. At the time an investment is made, investments in commercial paper
and money market auction rate securities of industrial firms and financial institutions are rated A1, P1 or better.
InvestmentsThe Company invests in tax-exempt securities, including municipal notes and
bonds, and corporate bonds that are rated A, A2 or better and
investments in repurchase agreements,
musteach of which have securities of the type and quality listed above as collateral.
The Company believes that concentrations of credit risk with respect to trade receivables are limited because a large number of geographically diverse customers make up the Company’s customer base, thus
spreadingdiluting the trade credit risk. Accounts receivable from the Company’s top three customers accounted for approximately
22%20%, 16% and
14%10% of the total consolidated accounts receivable balance as of December
29, 201226, 2015 and
15%28%,
15%17% and
14%15% of the total consolidated accounts receivable balance as of December
31, 2011.27, 2014. However, the Company does not believe the receivable balance from these customers represents a significant credit risk based on past collection
experience.experience, and review of their current credit quality. The Company manages its exposure to customer credit risk through credit limits, credit lines,
ongoing monitoring procedures and credit approvals. Furthermore, the Company
performs in-depth credit evaluations of all new customers and, at intervals, for existing customers. From this, the Company may require letters of credit, bank or corporate guarantees or advance payments, if deemed necessary.
The Company’s existing derivative financial instruments are with
four large international financial institutions of investment grade credit rating. The Company does not believe that there is significant risk of nonperformance by these counterparties because the Company monitors their credit rating on an ongoing basis. By using derivative instruments, the Company is subject to credit and market risk. If a counterparty fails to fulfill its performance obligations under a derivative contract, the Company’s credit risk will equal the fair value of the derivative instrument. Generally, when the fair value of a derivative contract is positive, the counterparty owes the Company, thus creating a receivable risk for the Company. Based upon certain factors, including a review of the credit default swap rates for the Company’s counterparties, the Company determined its counterparty credit risk to be immaterial. At December
29, 2012,26, 2015, the
counterparties’Company’s obligations under the contracts exceeded the
Company’scounterparties’ obligations by
a minimal amount.$6 million.
The Company is dependent on certain equipment and materials from a limited number of suppliers and relies on a limited number of foreign companies to supply the majority of certain types of integrated circuit packages for its internal back-end manufacturing operations. Similarly, certain non-proprietary materials or components such as memory, PCBs, substrates and capacitors used in the manufacture of the Company’s graphics products are currently available from only a limited number of sources. Interruption of supply or increased demand in the industry could cause shortages and price increases in various essential materials. If the Company or its
third partythird-party manufacturing suppliers are unable to procure certain of these materials, or its foundries are unable to procure materials for manufacturing its products, its business would be materially adversely affected.
NOTE 9: Income Taxes
The provision (benefit) for income taxes consists of:
| | | | | | | | | | | | |
| | | 2012 | | | 2011 | | | 2010 | |
| | | (In millions) | |
Current: | | | | | | | | | | | | |
U.S. Federal | | $ | — | | | $ | (3 | ) | | $ | (4 | ) |
U.S. State and Local | | | — | | | | 1 | | | | — | |
Foreign National and Local | | | 6 | | | | 4 | | | | 47 | |
Total | | $ | 6 | | | $ | 2 | | | $ | 43 | |
Deferred: | | | | | | | | | | | | |
U.S. Federal | | | (37 | ) | | | — | | | | — | |
Foreign National and Local | | | (3 | ) | | | (6 | ) | | | (5 | ) |
Total | | $ | (40 | ) | | $ | (6 | ) | | $ | (5 | ) |
Provision (benefit) for income taxes | | $ | (34 | ) | | $ | (4 | ) | | $ | 38 | |
Income (loss)
|
| | | | | | | | | | | |
| | 2015 | | 2014 | | 2013 |
| | (In millions) |
| Current: | | | | | |
| U.S. Federal | $ | (1 | ) | | $ | (1 | ) | | $ | (2 | ) |
| U.S. State and Local | — |
| | — |
| | — |
|
| Foreign National and Local | 16 |
| | 6 |
| | 10 |
|
| Total | 15 |
| | 5 |
| | 8 |
|
| Deferred: | | | | | |
| U.S. Federal | — |
| | — |
| | 3 |
|
| Foreign National and Local | (1 | ) | | — |
| | (2 | ) |
| Total | (1 | ) | | — |
| | 1 |
|
| Provision for income taxes | $ | 14 |
| | $ | 5 |
| | $ | 9 |
|
Loss before income taxes consists of the following:
| | | | | | | | | | | | |
| | | 2012 | | | 2011 | | | 2010 | |
| | | (In millions) | |
U.S. | | $ | (1,242 | ) | | $ | 318 | | | $ | 987 | |
Foreign | | | 25 | | | | 173 | | | | (478 | ) |
Total pre-tax income (loss) | | $ | (1,217 | ) | | $ | 491 | | | $ | 509 | |
|
| | | | | | | | | | | |
| | 2015 | | 2014 | | 2013 |
| | (In millions) |
| U.S. | $ | (1,100 | ) | | $ | (621 | ) | | $ | (397 | ) |
| Foreign | 454 |
| | 223 |
| | 323 |
|
| Total pre-tax loss | $ | (646 | ) | | $ | (398 | ) | | $ | (74 | ) |
Deferred income taxes reflect the net tax effects of tax carryovers and temporary differences between the carrying amounts of assets and liabilities for financial reporting purposes and the balances for income tax purposes. Significant components of the Company’s deferred tax assets and liabilities as of December
29, 201226, 2015 and December
31, 201127, 2014 are as follows:
| | | | | | | | |
| | | December 29,
2012 | | | December 31,
2011 | |
| | | (In millions) | |
Deferred tax assets: | | | | | | | | |
Net operating loss carryovers | | $ | 1,455 | | | $ | 991 | |
Deferred distributor income | | | 55 | | | | 63 | |
Inventory valuation | | | 53 | | | | 25 | |
Accrued expenses not currently deductible | | | 118 | | | | 111 | |
Acquired intangibles | | | 385 | | | | 427 | |
Tax deductible goodwill | | | 323 | | | | 375 | |
Federal and state tax credit carryovers | | | 395 | | | | 358 | |
Foreign capitalized research and development costs | | | 36 | | | | 85 | |
Foreign research and development ITC credits | | | 316 | | | | 272 | |
Discount of convertible notes | | | 40 | | | | 59 | |
Other | | | 291 | | | | 275 | |
Total deferred tax assets | | | 3,467 | | | | 3,041 | |
Less: valuation allowance | | | (3,401 | ) | | | (2,978 | ) |
| | | | 66 | | | | 63 | |
Deferred tax liabilities: | | | | | | | | |
Capitalized interest | | | — | | | | (1 | ) |
Acquired intangibles | | | (33 | ) | | | — | |
Investments | | | — | | | | (31 | ) |
Other | | | (16 | ) | | | (17 | ) |
Total deferred tax liabilities | | | (49 | ) | | | (49 | ) |
Net deferred tax assets | | $ | 17 | | | $ | 14 | |
|
| | | | | | | |
| | December 26,
2015 | | December 27,
2014 |
| | (In millions) |
| Deferred tax assets: | | | |
| Net operating loss carryovers | $ | 2,342 |
| | $ | 1,978 |
|
| Deferred distributor income | 20 |
| | 28 |
|
| Inventory valuation | 39 |
| | 22 |
|
| Accrued expenses not currently deductible | 74 |
| | 107 |
|
| Acquired intangibles | 257 |
| | 248 |
|
| Tax deductible goodwill | 192 |
| | 295 |
|
| Federal and state tax credit carryovers | 400 |
| | 391 |
|
| Foreign capitalized research and development costs | 60 |
| | 41 |
|
| Foreign research and development ITC credits | 231 |
| | 282 |
|
| Discount of convertible notes | 1 |
| | 11 |
|
| Other | 119 |
| | 167 |
|
| Total deferred tax assets | 3,735 |
| | 3,570 |
|
| Less: valuation allowance | (3,669 | ) | | (3,495 | ) |
| Total deferred tax assets, net of valuation allowance | 66 |
| | 75 |
|
| Deferred tax liabilities: | | | |
| Undistributed foreign earnings | (33 | ) | | (37 | ) |
| Other | (23 | ) | | (19 | ) |
| Total deferred tax liabilities | (56 | ) | | (56 | ) |
| Net deferred tax assets | $ | 10 |
| | $ | 19 |
|
The breakdown between current and
long-termnon-current deferred tax assets and deferred tax liabilities as of December
29, 201226, 2015 and December
31, 201127, 2014 is as follows:
| | | | | | | | |
| | | December 29,
2012 | | | December 31,
2011 | |
| | | (In millions) | |
Current deferred tax assets | | $ | 1 | | | $ | 1 | |
Non-current deferred tax assets | | | 16 | | | | 13 | |
Net deferred tax assets | | $ | 17 | | | $ | 14 | |
|
| | | | | | | |
| | December 26,
2015 | | December 27,
2014 |
| | (In millions) |
| Current deferred tax assets | $ | 8 |
| | $ | 2 |
|
| Non-current deferred tax assets | 48 |
| | 33 |
|
| Current deferred tax liabilities | (46 | ) | | (16 | ) |
| Net deferred tax assets | $ | 10 |
| | $ | 19 |
|
Current deferred tax assets and current deferred tax liabilities are included in captions
“Prepaid expenses and other“Other current assets” and “Accrued
Liabilities,” respectively, on the consolidated balance sheet. Non-current deferred tax assets and non-current deferred tax liabilities are included in captions “Other assets” and “Other long-term liabilities,” respectively, on the consolidated balance
sheet.sheets. Non-current deferred tax assets are included in the caption “Other assets” on the consolidated balance sheets.
As of December
29, 2012,26, 2015, substantially all of the Company’s U.S. and foreign deferred tax assets, net of deferred tax liabilities, continued to be subject to a valuation allowance. The realization of these assets is dependent on substantial future taxable income which, at December
29, 2012,26, 2015, in management’s estimate, is not more likely than not to be achieved. In
2012,2015, the net valuation allowance increased by
$423$174 million primarily for
increases in deferred tax assets related to the net operating losses generated from pre-tax book losses in the U.S. In 2014, the net of the benefit relating to the SeaMicro acquisition. Purchase accountingvaluation allowance increased by $120 million primarily for the SeaMicro acquisition required the establishment of aincreases in deferred tax liabilityassets related to net operating losses generated from pre-tax book losses in the book tax basis differences of identifiable intangible assets that increased goodwill. The deferred tax liability created an additional source of U.S. future taxable income which resulted in a release of a portion of the Company’s U.S. valuation allowance. In 2011,2013, the net valuation allowance decreased by $245$26 million primarily for decreases in deferred tax assets related to the utilization of net operating losses due to pre-tax book income and a change in the book to tax basis in investments. In 2010, the net valuation allowance decreased by $56 million primarily for decreases in deferred tax assets related to the utilization of net operating losses due to pre-tax book income and the utilization of foreign research and development credits to offset prior period audit adjustments, net of an increase in U.S. deferred tax assets, primarily for foreign tax credits arising from withholding taxes.
Canada.
As of December
29, 201226, 2015 and December
31, 2011,27, 2014, the Company had
$192$118 million and
$202$127 million, respectively, of deferred tax assets subject to a valuation allowance that related to excess stock option deductions, which are not presented in the deferred tax asset balances.
As of December 29, 2012 and December 31, 2011, $10 million of deferred tax assets subject to valuation allowance related to a deductible discount for tax only associated with the Company’s 6.00% Convertible Senior Notes due 2015 (the 6.00% Notes). The tax benefit from these deductions will increase capital in excess of par when realized.The following is a summary of the various tax attribute carryforwards the Company had as of December
29, 2012.26, 2015. The amounts presented below include amounts related to excess stock option deductions, as discussed above.
| | | | | | | | | | |
| Carryforward | | Federal | | | State /
Provincial | | | Expiration |
| | | (In millions) | | | |
US-net operating loss carryovers | | $ | 3,907 | | | $ | 251 | | | 2013 to 2032 |
US-credit carryovers | | $ | 478 | | | $ | 177 | | | 2018 to 2031 |
Canada-net operating loss carryovers | | $ | 347 | | | $ | 347 | | | 2025 to 2028 |
Canada-credit carryovers | | $ | 404 | | | $ | 24 | | | 2012 to 2032 |
Canada-R&D pools | | $ | 135 | | | $ | 135 | | | no expiration |
Barbados-net operating loss carryovers | | $ | 299 | | | | N/A | | | 2013 to 2017 |
Other foreign net operating loss carryovers | | $ | 12 | | | | N/A | | | various |
|
| | | | | | | | | |
| Carryforward | Federal | | State / Provincial | | Expiration |
| | (In millions) | | |
| U.S.-net operating loss carryovers | $ | 6,478 |
| | $ | 335 |
| | 2016 to 2035 |
| U.S.-credit carryovers | $ | 401 |
| | $ | 204 |
| | 2016 to 2035 |
| Canada-net operating loss carryovers | $ | 173 |
| | $ | 173 |
| | 2027 to 2028 |
| Canada-credit carryovers | $ | 302 |
| | $ | 32 |
| | 2021 to 2035 |
| Canada-R&D pools | $ | 225 |
| | $ | 225 |
| | no expiration |
| Barbados-net operating loss carryovers | $ | 143 |
| | N/A |
| | 2016 to 2017 |
| Other foreign net operating loss carryovers | $ | 19 |
| | N/A |
| | various |
Utilization of
$123$12 million of the Company’s U.S. federal net operating loss carryforwards are subject to annual limitations as a result of the
SeaMicro acquisition and prior purchase transactions.ATI Technologies ULC (ATI) acquisition.
The table below displays reconciliation between statutory federal income taxes and the total provision (benefit) for income taxes.
| | | | | | | | |
| | | Tax | | | Rate | |
| | | (In millions except for percentages) | |
2012 | | | | | | | | |
Statutory federal income tax expense | | $ | (426 | ) | | | 35.0 | % |
State taxes, net of federal benefit | | | 1 | | | | (0.1 | )% |
Foreign income at other than U.S. rates | | | (13 | ) | | | 1.1 | % |
US valuation allowance generated | | | 406 | | | | (33.4 | )% |
Credit monetization | | | (2 | ) | | | 0.2 | % |
| | | $ | (34 | ) | | | 2.8 | % |
2011 | | | | | | | | |
Statutory federal income tax expense | | $ | 172 | | | | 35.0 | % |
State taxes, net of federal benefit | | | 1 | | | | 0.2 | % |
Foreign income at other than U.S. rates | | | (2 | ) | | | (0.4 | )% |
US valuation allowance utilized | | | (171 | ) | | | (34.8 | )% |
Credit monetization | | | (4 | ) | | | (0.8 | )% |
| | | $ | (4 | ) | | | (0.8 | )% |
2010 | | | | | | | | |
Statutory federal income tax expense | | $ | 178 | | | | 35.0 | % |
State taxes, net of federal benefit | | | 1 | | | | 0.2 | % |
Foreign income at other than U.S. rates | | | (24 | ) | | | (4.7 | )% |
Foreign losses not benefited | | | 51 | | | | 10.0 | % |
US valuation allowance utilized | | | (164 | ) | | | (32.3 | )% |
Alternative minimum tax | | | (2 | ) | | | (0.4 | )% |
Credit monetization | | | (2 | ) | | | (0.4 | )% |
| | | $ | 38 | | | | 7.4 | % |
|
| | | | | | | | | | | |
| | 2015 | | 2014 | | 2013 |
| | (In millions) |
| Statutory federal income tax benefit at 35% rate | $ | (226 | ) | | $ | (139 | ) | | $ | (26 | ) |
| State taxes, net of federal benefit | 1 |
| | 1 |
| | 1 |
|
| Foreign (income) expense at other than U.S. rates | 9 |
| | 1 |
| | 15 |
|
| U.S. valuation allowance generated | 232 |
| | 144 |
| | 22 |
|
| Credit monetization | (2 | ) | | (2 | ) | | (3 | ) |
| Provision for income taxes | $ | 14 |
| | $ | 5 |
| | $ | 9 |
|
The Company has made no provision for U.S. income taxes on approximately
$386$307 million of cumulative undistributed earnings of certain foreign subsidiaries through December
29, 201226, 2015 because it is the Company’s intention to
permanentlyindefinitely reinvest such earnings. If such earnings were distributed, the Company would incur additional income taxes of approximately
$137$107 million (after an adjustment for foreign tax credits). These additional income taxes may not result in income tax expense or a cash payment to the Internal Revenue Service, but may result in the utilization of deferred tax assets that are currently subject to a valuation allowance.
The Company partially recognized undistributed earnings within certain subsidiaries in China of $56 million through December 26, 2015 because the announcement in October 2015 of an agreement to sell 85% of the ownership interest in the subsidiary operating a factory in Suzhou causes the Company to modify its judgment that associated undistributed earnings of that subsidiary’s holding company in China will remain indefinitely reinvested. A future distribution of these earnings will give rise to an associated future withholding tax of $6 million. This is recognized as an income tax expense within the 2015 income tax provision. The same event results in the Chinese holding company recognizing the future benefit of tax losses available to offset taxable gains when the deal closes. The future benefit of those losses is $7 million and is a reduction in the 2015 income tax provision. The net effect of this event in the 2015 income tax provision is a reduction of $1 million.
The Company’s operations in Malaysia currently operate under
a tax
holidays,holiday, which will expire in
2013. These2018. This tax
holidaysholiday may be extended if specific conditions are met. The net impact of the tax
holidays was toholiday did not decrease the Company’s net loss
by $11 million in
2012, less than $.02 per share, diluted.2015 because the Company’s operations in Malaysia operated at a net loss. The net impact of
the tax holidays
increaseddecreased the Company’s net
incomeloss by
$9 million and $7$2 million in
2011 and 2010, respectively,2014, less than $.01 per share, diluted,
and decreased the Company’s net loss by $1 million in
each year.2013, less than $.01 per share, diluted.
A reconciliation of the gross unrecognized tax benefits is as follows:
| | | | | | | | | | | | |
| | | 2012 | | | 2011 | | | 2010 | |
| | | (In millions) | |
Balance at beginning of year | | $ | 69 | | | $ | 42 | | | $ | 166 | |
Increases for tax positions taken in prior years | | | 3 | | | | 28 | | | | — | |
Decreases for tax positions taken in prior years | | | (4 | ) | | | (4 | ) | | | (8 | ) |
Increases for tax positions taken in the current year | | | 3 | | | | 8 | | | | 7 | |
Decreases for settlements with taxing authorities | | | (15 | ) | | | (5 | ) | | | (119 | ) |
Decreases for lapsing of the statute of limitations | | | — | | | | — | | | | (4 | ) |
Balance at end of year | | $ | 56 | | | $ | 69 | | | $ | 42 | |
|
| | | | | | | | | | | |
| | 2015 | | 2014 | | 2013 |
| | (In millions) |
| Balance at beginning of year | $ | 28 |
| | $ | 52 |
| | $ | 56 |
|
| Increases for tax positions taken in prior years | 11 |
| | 1 |
| | 1 |
|
| Decreases for tax positions taken in prior years | (1 | ) | | — |
| | (2 | ) |
| Increases for tax positions taken in the current year | 2 |
| | 2 |
| | 4 |
|
| Decreases for settlements with taxing authorities | (2 | ) | | (27 | ) | | (7 | ) |
| Balance at end of year | $ | 38 |
| | $ | 28 |
| | $ | 52 |
|
The amount of unrecognized tax benefits that would impact the effective tax rate was $2 million, $4 million, $3 million and $8$3 million as of December 29, 2012,26, 2015, December 31, 201127, 2014 and December 25, 2010,28, 2013, respectively. The Company had no or immaterial amounts of accrued interest related to unrecognized tax benefits of $2 million as of December 29, 2012 and December 31, 2011 and $10 million as of December 25, 2010. The Company had no accrued penalties related to unrecognized tax benefits as of December 29, 2012 26, 2015, December 27, 2014 and December 31, 2011 and $1 million of accrued penalties as of December 25, 2010.28, 2013. The Company recognizes potentialthe accrued interest and penalties to unrecognized tax benefits as interest expense and income tax expense, respectively.The Company had no charge related to interest expense or penalty expense in its consolidated statement of operations in 2012. The Company recorded a reduction of interest expense of $2 million and a decrease of $1 million of penalty expense in its consolidated statement of operations in 2011. The Company recorded a reduction of interest expense of $6 million and a decrease of $4 million of penalty expense in its consolidated statement of operations in 2010.
During the 12 months beginning December
30, 2012,27, 2015, the Company does not expect to reduce its unrecognized tax benefits. The Company does not believe it is reasonably possible that other unrecognized tax benefits will materially change in the next 12 months. However, the resolutions and/or closure of open audits are highly uncertain.
As of December 25, 2010,27, 2014, the Canada Revenue Agency, or CRA, had completed its audit of ATI for the years 20002005 through 20042010 and issued its final Notice of Assessment. The CRA is currently auditing international transactionsAssessment, which the Company has reviewed and agreed to. As of December 26, 2015, the Italian tax authorities had concluded their audit of the Company’s subsidiaries’ activities in Italy for the years 20052003 through 2010. During the second quarter of 2010 the U.S. Internal Revenue Service completed its audit of the U.S. Federal income tax returns for the years ending 2004 through 2006 inclusive. As of December 31, 2011 the German tax authorities completed their audit of AMD’s former German subsidiaries for the tax years 2001 through 2004.2013. The Company was notified that the German tax authorities will begin an audithas agreed to a settlement of $11 million in 2013. AMDtaxes and penalties and $2 million in interest. The Company and its subsidiaries have several foreign, foreign provincial, and U.S. state audits in process at any one point in time. The Company has
provided for uncertain tax positions that require a liability under the adopted method to account for uncertainty in income taxes. The Company has not recognized any current or long-term deferred tax assets under a valuation allowance as a result of the application of uncertainty in income taxes in ASC 740 for unrecognized tax benefits as of December 29, 2012.26, 2015.
NOTE 10: Debt and Other Obligations
Long-term
Total Debt
and Capital Lease Obligations The Company’s
long-termtotal debt
and capital lease obligations as of December
29, 201226, 2015 and December
31, 201127, 2014 consisted of:
| | | | | | | | |
| | | December 29,
2012 | | | December 31,
2011 | |
| | | (In millions) | |
5.75% Convertible Senior Notes due 2012 | | $ | — | | | $ | 485 | |
6.00% Convertible Senior Notes due 2015, net of discount | | | 555 | | | | 546 | |
8.125% Senior Notes due 2017, net of discount | | | 464 | | | | 459 | |
7.75% Senior Notes due 2020 | | | 500 | | | | 500 | |
7.50% Senior Notes due 2022 | | | 500 | | | | — | |
Capital lease obligations | | | 23 | | | | 26 | |
| | | 2,042 | | | | 2,016 | |
Less: current portion | | | 5 | | | | 489 | |
Long-term debt and capital lease obligations, less current portion | | $ | 2,037 | | | $ | 1,527 | |
5.75% Convertible Senior Notes due 2012
On August 14, 2007, the Company issued $1.5 billion aggregate principal amount of the 5.75% Convertible Senior Notes due 2012 (the 5.75% Notes). The 5.75% Notes were general unsecured senior obligations. Interest was payable in arrears on February 15 and August 15 of each year beginning February 15, 2008 until the maturity date of August 15, 2012. The terms of the 5.75% Notes were governed by an Indenture (the 5.75% Indenture), dated as of August 14, 2007, by and between the Company and Wells Fargo Bank, National Association, as Trustee. In 2009, the Company repurchased $1,015 million in aggregate principal amount of the Company’s outstanding 5.75% Notes for $1,002 million in cash.
The 5.75% Notes were convertible, in whole or in part, at any time prior to the close of business on the business day immediately preceding the maturity date of the 5.75% Notes, into shares of the Company’s common stock based on an initial conversion rate of 49.661 shares of common stock per $1,000 principal amount of the 5.75% Notes, which is equivalent to an initial conversion price of approximately $20.13 per share. This initial conversion price represents a premium of 50% relative to the last reported sale price of the Company’s common stock on August 8, 2007 (the trading date preceding the date of pricing of the 5.75% Notes) of $13.42 per share. This initial conversion rate will be adjusted for certain anti-dilution events. In addition, the conversion rate would be increased in the case of corporate events that constitute a fundamental change (as defined in the 5.75% Indenture) of AMD under certain circumstances. Holders of the 5.75% Notes might require the Company to repurchase the 5.75% Notes for cash equal to 100% of the principal amount to be repurchased plus accrued and unpaid interest upon the occurrence of a fundamental change (as defined in the 5.75% Indenture) or a termination of trading (as defined in the 5.75% Indenture). Additionally, an event of default (as defined in the 5.75% Indenture) might result in the acceleration of the maturity of the 5.75% Notes.
On August 15, 2012, the Company used $499 million of its existing cash balances to repay in full all of the outstanding principal and accrued interest on the 5.75% Notes, which, in accordance with the terms of the underlying indenture, became due on August 15, 2012.
|
| | | | | | | |
| | December 26,
2015 | | December 27,
2014 |
| | (In millions) |
| 6.00% Notes, net of discount | $ | — |
| | $ | 42 |
|
| 6.75% Notes | 600 |
| | 600 |
|
| 6.75% Notes, interest rate swap | 7 |
| | 3 |
|
| 7.75% Notes | 450 |
| | 450 |
|
| 7.50% Notes | 475 |
| | 475 |
|
| 7.00% Notes | 500 |
| | 500 |
|
| Secured Revolving Line of Credit | 230 |
| | 130 |
|
| Capital lease obligations | — |
| | 12 |
|
| Total debt | 2,262 |
| | 2,212 |
|
| Less: current portion | 230 |
| | 177 |
|
| Total debt, less current portion | $ | 2,032 |
| | $ | 2,035 |
|
6.00% Convertible Senior Notes due 2015
On April 27, 2007, the Company issued $2.2 billion aggregate principal amount of the 6.00% Convertible Senior Notes
due 2015 (the 6.00%(6.00% Notes).
The 6.00% Notes are general unsecured senior obligations. Interest ispayable on May 1 and November 1 of each year beginning November 1, 2007 until the maturity date of May 1, 2015. The terms of the 6.00% Notes are governed by an Indenture (the 6.00% Indenture) dated April 27, 2007, by and betweenIn 2015, the Company and Wells Fargo Bank, National Association, as Trustee.
In 2011,paid off the Company repurchased $200remaining $42 million in aggregate principal amount of its 6.00% Notes in open market transactions for $202 million. Prior to 2011, the Company repurchased $1.4 billion in aggregate principal amount of the 6.00% Notes for $1.2 billion.cash. As of December 29, 2012,26, 2015, the outstanding aggregate principal amount of theCompany did not have any 6.00% Notes was $580 million and the remaining carrying value was approximately $555 million, net of debt discount of $25 million.
In the first quarter of 2009, the Company adopted the new guidance for accounting for convertible debt that may be fully or partially settled in cash upon conversion and modified its accounting for its 6.00% Notes. To retrospectively apply this new guidance, the proceeds from the issuance of the Company’s 6.00% Notes were allocated between a liability (issued at a discount) and equity in a manner that reflects interest expense at the market interest rate for similar nonconvertible debt as of the original issuance date of the 6.00% Notes. The debt discount is being accreted from issuance through April 2015, the period the 6.00% Notes are expected to be outstanding, with the accretion recorded as additional non-cash interest expense. The equity component is included in the paid-in-capital portion of stockholders’ equity on the Company’s consolidated balance sheet. The initial value of the equity component ($259 million), which reflects the equity conversion feature of the 6.00% Notes, is equal to the initial debt discount.
For the repurchase of its 6.00% Notes during 2011, the Company allocated $9 million of the $200 million aggregate cash payment to the equity component and reduced the carrying amount of the debt by $191 million.
Information related to equity and debt components:
| | | | | | | | |
| | | December 29,
2012 | | | December 31,
2011 | |
| | | (In millions) | |
Carrying amount of the equity component | | $ | 162 | | | $ | 162 | |
Principal amount of the 6.00% Notes | | | 580 | | | | 580 | |
Unamortized discount(1) | | | (25 | ) | | | (34 | ) |
Net carrying amount | | $ | 555 | | | $ | 546 | |
(1) | As of December 29, 2012, the remaining period over which the unamortized discount will be amortized is 28 months.
|
Information related to interest rates and expense:
| | | | | | | | | | | | |
| | | 2012 | | | 2011 | | | 2010 | |
| | | (In millions, except percentages) | |
Effective interest rate | | | 8 | % | | | 8 | % | | | 8 | % |
Interest cost related to contractual interest coupon | | $ | 44 | | | $ | 45 | | | $ | 93 | |
Interest cost related to amortization of the discount | | $ | 9 | | | $ | 11 | | | $ | 20 | |
Upon the occurrence of certain events described in the 6.00% Indenture, the 6.00% Notes will be convertible into cash up to the principal amount, and if applicable, into shares of the Company’s common stock issuable upon conversion of the 6.00% Notes in respect of any conversion value above the principal amount, based on an initial conversion rate of 35.6125 shares of common stock per $1,000 principal amount of 6.00% Notes, which is equivalent to an initial conversion price of $28.08 per share. This initial conversion price represents a premium of 100% relative to the last reported sale price of the Company’s common stock on April 23, 2007 (the trading date preceding the date of pricing of the 6.00% Notes) of $14.04 per share. The conversion rate will be adjusted for certain anti-dilution events. In addition, the conversion rate will be increased
in the case of corporate events that constitute a fundamental change (as defined in the 6.00% Indenture) under certain circumstances. Holders of the 6.00% Notes may require the Company to repurchase the 6.00% Notes for cash equal to 100% of the principal amount to be repurchased plus accrued and unpaid interest upon the occurrence of a fundamental change or a termination of trading (as defined in the 6.00% Indenture). Additionally, an event of default (as defined in the 6.00% Indenture) may result in the acceleration of the maturity of the 6.00% Notes.
The 6.00% Notes rank equally with the Company’s existing and future senior debt and are senior to all of the Company’s future subordinated debt. The 6.00% Notes rank junior to all of the Company’s future senior secured debt to the extent of the collateral securing such debt and are structurally subordinated to all existing and future debt and liabilities of the Company’s subsidiaries.
The Company may elect to purchase or otherwise retire the balance of the 6.00% Notes with cash, stock or other assets from time to time in open market or privately negotiated transactions, either directly or through intermediaries, or by tender offer when it believes the market conditions are favorable to do so.
8.125%outstanding.
6.75% Senior Notes Due
20172019
On
November 30, 2009,February 26, 2014, the Company issued
$500$600 million of
the 8.125% Senior Notes Due 2017 (the 8.125% Notes) at a discount of 10.204%.its 6.75% Notes. The
8.125%6.75% Notes are general unsecured senior
obligations.obligations of the Company. Interest is payable on
June 15March 1 and
December 15September 1 of each year beginning
June 15, 2010September 1, 2014 until the maturity date of
December 15, 2017.March 1, 2019. The
discount of $51 million is recorded as contra debt and will be amortized to interest expense over the life of the 8.125% Notes using the effective interest method. The 8.125%6.75% Notes are governed by the terms of an indenture (the
8.125%6.75% Indenture) dated
November 30, 2009February 26, 2014 between the Company and Wells Fargo Bank,
National Association,N.A., as
Trustee.trustee.
As of December
29, 2012,26, 2015, the outstanding aggregate principal amount of the
Company’s 8.125%6.75% Notes was
$500 million and the remaining carrying value was approximately $464 million, net of debt discount of $36$600 million.
At anytime (which may be more than once)any time before December 15, 2012, the Company may redeem up to 35% of the aggregate principal amount of the 8.125% Notes within 90 days of the closing of an equity offering with the net proceeds thereof at a redemption price of not greater than 108.125% of the principal amount thereof, together with accrued and unpaid interest to but excluding the date of redemption. Prior to December 15, 2013,March 1, 2019, the Company may redeem some or all of the 8.125%6.75% Notes at a price equal to 100% of the principal amount, plus accrued and unpaid interest and a “make whole” premium (as definedset forth in the 8.125%6.75% Indenture). Thereafter, the Company may redeem all or part of the 8.125% Notes at any time at specified redemption prices, plus accrued and unpaid interest. Holders have the right to require the Company to repurchase all or a portion of the
Company’s 8.125%6.75% Notes in the event that the Company undergoes a change of control, as defined in the
indenture governing the 8.125% Notes,6.75% Indenture, at a
repurchase price of 101% of the principal amount plus accrued and unpaid interest. Additionally, an event of default (as defined in the
8.125%6.75% Indenture) may result in the acceleration of the maturity of the
8.125%6.75% Notes.
The
8.125%6.75% Indenture contains certain covenants that limit, among other things, the Company’s ability and the ability of its subsidiaries,
from:to:incurringincur additional indebtedness, except specified permitted debt;
payingpay dividends and makingmake other restricted payments;
makingmake certain investments if an event of a default exists, or if specified financial conditions are not satisfied;
creatingcreate or permittingpermit certain liens;
create or permittingpermit restrictions on the ability of its subsidiaries to pay dividends or make other distributions to the Company;
usinguse the proceeds from sales of assets;
enteringenter into certain types of transactions with affiliates; and
consolidating, merging
consolidate, merge or selling the Company’ssell its assets as an entirety or substantially as an entirety.
The 8.125% Notes rank equally with the Company’s existing and future senior debt and are senior to all of the Company’s future subordinated debt. The 8.125% Notes rank junior to all of the Company’s future senior secured debt to the extent of the collateral securing such debt and are structurally subordinated to all existing and future debt and liabilities of the Company’s subsidiaries.
The Company may elect to purchase or otherwise retire the 8.125% Notes with cash, stock or other assets from time to time in open market or private negotiated transactions, either directly or through intermediaries, or by tender offer, when it believes the market conditions are favorable to do so.
7.75% Senior Notes Due 2020
On August 4, 2010, the Company issued $500 million of
its 7.75% Senior Notes Due 2020 (7.75% Notes). The 7.75% Notes are general unsecured senior obligations of the Company. Interest is payable on February 1 and August 1 of each year beginning February 1, 2011 until the maturity date of August 1, 2020. The 7.75% Notes are governed by the terms of an indenture (the 7.75% Indenture) dated August 4, 2010 between the Company and Wells Fargo Bank,
National Association,N.A., as
Trustee.trustee.
During 2014, the Company repurchased $50 million in aggregate principal amount of its 7.75% Notes in open market transactions for $49 million, which included payment of accrued and unpaid interest of $1 million. The Company recorded a total gain of $2 million in connection with the foregoing repurchase of the 7.75% Notes. As of December
29, 2012,26, 2015, the outstanding aggregate principal amount of the
Company’s 7.75% Notes was
$500$450 million.
At any time (which may be more than once) before August 1, 2013, the Company can redeem up to 35% of the aggregate principal amount of the 7.75% Notes within 90 days of the closing of an equity offering with the net proceeds thereof at a redemption price not greater than 107.75% of the principal amount thereof, together with accrued and unpaid interest to but excluding the date of redemption. Prior to August 1, 2015, the Company may redeem some or all of the 7.75% Notes at a price equal to 100% of the principal amount, plus accrued and unpaid interest and a “make whole” premium (as defined in the 7.75% Indenture).
From August 1, 2015, the Company may redeem the 7.75% Notes at specified redemption prices, plus accrued and unpaid interest. |
| | |
| Period | Price as Percentage of Principal Amount |
| Beginning on August 1, 2015 through July 31, 2016 | 103.875 | % |
| Beginning on August 1, 2016 through July 31, 2017 | 102.583 | % |
| Beginning on August 1, 2017 through July 31, 2018 | 101.292 | % |
| On August 1, 2018 and thereafter | 100.000 | % |
Holders have the right to require the Company to repurchase all or a portion of
itsthe 7.75% Notes in the event that the Company undergoes a change of control, as defined in the 7.75% Indenture, at a repurchase price of 101% of the principal amount plus accrued and unpaid interest. Additionally, an event of default (as defined in the 7.75% Indenture) may result in the acceleration of the maturity of the 7.75% Notes.
The 7.75% Indenture contains certain covenants that limit, among other things, the Company’s ability and the ability of its subsidiaries, from:
incurring additional indebtedness, except specified permitted debt;
paying dividends and making other restricted payments;
making certain investments if an event of a default exists, or if specified financial conditions are not satisfied;
creating or permitting certain liens;
creating or permitting restrictions on the ability of its subsidiaries to pay dividends or make other distributions to the Company;
using the proceeds from sales of assets;
entering into certain types of transactions with affiliates; and
consolidating, merging or selling its assets as an entirety or substantially as an entirety.
The 7.75% Notes rank equally with the Company’s existing and future senior debt and are senior to all of the Company’s future subordinated debt. The 7.75% Notes rank junior to all of the Company’s future senior secured debt to the extent of the collateral securing such debt and are structurally subordinated to all existing and future debt and liabilities of the Company’s subsidiaries.
The Company may elect to purchase or otherwise retire the 7.75% Notes with cash, stock or other assets from time to time in open market or private negotiated transactions, either directly or through intermediaries, or by tender offer, when the Company believes the market conditions are favorable to do so.
7.50% Senior Notes Due 2022
On August 15, 2012, the Company issued $500 million of
its 7.50% Senior Notes due 2022 (7.50% Notes). The 7.50% Notes are general unsecured senior obligations of the Company. Interest is payable on February 15 and August 15 of each year beginning February 15, 2013 until the maturity date of August 15, 2022. The 7.50% Notes are governed by the terms of an indenture (the 7.50% Indenture) dated August 15, 2012 between the Company and Wells Fargo Bank,
National Association,N.A., as
Trustee.At any time (which may be more than once) before August 15,trustee.
During 2014, the Company repurchased $25 million in aggregate principal amount of its 7.50% Notes in open market transactions for $24 million. The payment of accrued and unpaid interest included in the purchase price was immaterial. The Company incurred a total gain of $1 million in connection with the foregoing repurchase of the 7.50% Notes. As of December 26, 2015, the Company can redeem up to 35% of theoutstanding aggregate principal amount of the 7.50% Notes within 90 days of the closing of an equity offering with the net proceeds thereof at a redemption price not greater than 107.5% of the principal amount thereof, together with accrued and unpaid interest to but excluding the date of redemption.was $475 million. Prior to August 15, 2022, the Company may redeem some or all of the 7.50% Notes at a price equal to 100% of the principal amount, plus accrued and unpaid interest and a “make whole” premium (as defined in the 7.50% Indenture). Holders have the right to require the Company to repurchase all or a portion of
itsthe 7.50% Notes in the event that the Company undergoes a change of control, as defined in the 7.50% Indenture, at a repurchase price of 101% of the principal amount plus accrued and unpaid interest. Additionally, an event of default (as defined in the 7.50% Indenture) may result in the acceleration of the maturity of the 7.50% Notes.
The 7.50% Indenture contains certain covenants that limit, among other things, the Company’s ability and the ability of its subsidiaries, to:
•incur additional indebtedness, except specified permitted debt;
•pay dividends and make other restricted payments;
•make certain investments if an event of a default exists, or if specified financial conditions are not satisfied;
•create or permit certain liens;
create or permit restrictions on the ability of its subsidiaries to pay dividends or make other distributions to the Company;
•use the proceeds from sales of assets;
•enter into certain types of transactions with affiliates; and
•consolidate, merge or sell its assets as entirety or substantially as an entirety.
7.00% Senior Notes Due 2024
On June 16, 2014, the Company issued $500 million of its7.00% Senior Notes due 2024 (7.00% Notes). The 7.00% Notes are general unsecured senior obligations of the Company. Interest is payable on January 1 and July 1 of each year beginning January 1, 2015 until the maturity date of July 1, 2024. The 7.00% Notes are governed by the terms of an indenture (the 7.00% Indenture) dated June 16, 2014 between the Company and Wells Fargo Bank, N.A., as trustee.
As of December 26, 2015, the outstanding aggregate principal amount of the 7.00% Notes was $500 million.
At any time before July 1, 2017, the Company may redeem up to 35% of the aggregate principal amount of the 7.00% Notes within 90 days of the closing of an equity offering with the net proceeds thereof at a redemption price equal to 107.000% of the principal amount thereof, together with accrued and unpaid interest to but excluding the date of redemption. Prior to July 1, 2019, the Company may redeem some or all of the 7.00% Notes at a price equal to 100% of the principal amount, plus accrued and unpaid interest and a “make whole” premium (as set forth in the 7.00% Indenture).
Starting July 1, 2019, the Company may redeem the 7.00% Notes for cash at the following specified prices plus accrued and unpaid interest:
|
| | |
| Period | Price as
Percentage of
Principal Amount |
| Beginning on July 1, 2019 through June 30, 2020 | 103.500 | % |
| Beginning on July 1, 2020 through June 30, 2021 | 102.333 | % |
| Beginning on July 1, 2021 through June 30, 2022 | 101.167 | % |
| On July 1, 2022 and thereafter | 100.000 | % |
Holders have the right to require the Company to repurchase all or a portion of the 7.00% Notes in the event that the Company undergoes a change of control, as defined in the 7.00% Indenture, at a repurchase price of 101% of the principal amount plus accrued and unpaid interest. Additionally, an event of default (as defined in the 7.00% Indenture) may result in the acceleration of the maturity of the 7.00% Notes.
The 7.00% Indenture contains certain covenants that limit, among other things, the Company’s ability and the ability of its subsidiaries, to:
incur additional indebtedness, except specified permitted debt;
pay dividends and make other restricted payments;
make certain investments if an event of a default exists, or if specified financial conditions are not satisfied;
create or permit certain liens;
create or permit restrictions on the ability of its subsidiaries to pay dividends or make other distributions to the Company;
use the proceeds from sales of assets;
enter into certain types of transactions with affiliates; and
consolidate, merge or sell its assets as entirety or substantially as an entirety.
The 6.75% Notes, 7.75% Notes, 7.50%
Notes and 7.00% Notes rank equally with the Company’s existing and future senior debt and are senior to all of the Company’s future subordinated debt. The
6.75% Notes, 7.75% Notes, 7.50%
Notes and 7.00% Notes rank junior to all of the Company’s future senior
secured debt to the extent of the collateral securing such debt and are structurally subordinated to all existing and future debt and liabilities of the Company’s subsidiaries.
Potential Repurchase of Outstanding Notes
The Company may elect to purchase or otherwise retire the
6.75% Notes, 7.75% Notes, 7.50%
Notes and 7.00% Notes with cash, stock or other assets from time to time in open market or
privateprivately negotiated transactions, either directly or through intermediaries, or by tender offer when the Company believes the market conditions are favorable to do so.
Secured Revolving Line of Credit
Loan and Security Agreement
The Company and its subsidiary, AMD International Sales & Service, Ltd. (together, the Borrowers), entered into a loan and security agreement on November 12, 2013, as amended on December 11, 2014 (the Loan Agreement), for a secured revolving line of credit for a principal amount of up to $500 million (the Secured Revolving Line of Credit), with up to $75 million available for issuance of letters of credit, with a group of lenders and Bank of America, N.A., acting as agent for the lenders (the Agent). The Secured Revolving Line of Credit had a maturity date of November 12, 2018. Borrowings under the Secured Revolving Line of Credit were limited to up to 85% of eligible account receivable minus certain reserves. The borrowings of the Secured Revolving Line of Credit may be used for general corporate purposes, including working capital needs.
Amended and Restated Loan and Security Agreement
On April 14, 2015, the Borrowers and ATI Technologies ULC (together with the Borrowers, the Loan Parties) amended and restated the Loan Agreement (the Amended and Restated Loan Agreement) by and among the Loan Parties, the financial institutions party thereto from time to time as lenders (the Lenders) and the Agent.
The Amended and Restated Loan Agreement provides for a Secured Revolving Line of Credit for a principal amount of up to $500 million with up to$75 million available for issuance of letters of credit, which remained unchanged from the Loan Agreement. Borrowings under the Secured Revolving Line of Credit are limited to up to 85% of eligible accounts receivable (90% for certain qualified eligible accounts receivable), minus specified reserves. The size of the commitments under the Secured Revolving Line of Credit may be increased by up to an aggregate amount of $200 million.
The Secured Revolving Line of Credit matures on April 14, 2020 and is secured by a first priority security interest in the Loan Parties’ accounts receivable, inventory, deposit accounts maintained with the Agent and other specified assets, including books and records.
The Borrowers may elect a per annum interest rate equal to (a) the London Interbank Offered Rate (LIBOR) plus the applicable margin set forth in the chart below (the Applicable Margin) as determined by the average availability under the Secured Revolving Line of Credit and the fixed charge coverage ratio for the most recently ended four-fiscal-quarter period; or (b) (i) the greatest of (x) the Agent’s prime rate, (y) the federal funds rate, as published by the Federal Reserve Bank of New York plus 0.50%, and (z) LIBOR for a one-month period plus 1.00%, plus (ii) the Applicable Margin.
Applicable Margin, if average availability is equal to or greater than 66.66% of the total commitment amount and the fixed charge coverage ratio for the most recently ended four-fiscal quarter period is greater than or equal to 1.25 to 1.00, is 0.25% for Base Rate Revolver Loans and 1.25% for LIBOR Revolver Loans. Otherwise, Applicable Margin is determined in accordance with the below table:
|
| | | | | | |
| Level | | Average Availability for Last Fiscal Month | | Base Rate Revolver Loans: Applicable Margin | | LIBOR Revolver Loans: Applicable Margin |
| I | | greater than or equal to 66.66% of the Revolver Commitment | | 0.5% | | 1.5% |
| II | | greater than or equal to 33.33% of the Revolver Commitment, less than 66.66% | | 0.75% | | 1.75% |
| III | | less than 33.33% of the Revolver Commitment | | 1% | | 2% |
The Secured Revolving Line of Credit may be optionally prepaid or terminated, and unutilized commitments may be reduced at any time, in each case without premium or penalty. In connection with the Secured Revolving Line of Credit, the Borrowers will pay an unused line fee equal to 0.375% per annum, payable monthly on the unused amount of the commitments under the Secured Revolving Line of Credit. The unused line fee decreases to 0.25% per annum when 35% or more of the Secured Revolving Line of Credit is utilized. The Borrowers will pay (i) a monthly fee on all letters of credit outstanding under the Secured Revolving Line of Credit equal to the applicable LIBOR margin and (ii) a fronting fee to the Agent equal to 0.125% of all such letters of credit, payable monthly in arrears.
The Amended and Restated Loan Agreement contains covenants that place certain restrictions on the Loan Parties’ ability to, among other things, allow certain of the Company’s subsidiaries that manufacture or process inventory for the Loan Parties to borrow secured debt or unsecured debt beyond a certain amount, amend or modify certain terms of any debt of $50 million or more or subordinated debt, create or suffer to exist any liens upon accounts or inventory, sell or transfer any of Loan Parties’ accounts or inventory other than certain ordinary-course transfers and certain supply chain finance arrangements, make certain changes to any Loan Party’s name or form or state of organization without notifying the Agent, liquidate, dissolve, merge, amalgamate, combine or consolidate, or become a party to certain agreements restricting the Loan Parties’ ability to incur or repay debt, grant liens, make distributions, or modify loan agreements.
Further restrictions apply when certain payment conditions (the Payment Conditions) are not satisfied with respect to specified transactions, events or payments. The Payment Conditions include that (i) no default or event of default exists and (ii) at all times during the 45 consecutive days immediately prior to such transaction, event or payment and on a pro forma basis after giving effect to such transaction, event or payment and any incurrence or repayment of indebtedness in connection therewith, the Loan Parties’ Excess Cash Availability (as defined in the Amended and Restated Loan Agreement) is greater than the greater of 20% of the total commitment amount and $100 million. Such restrictions limit the Loan Parties’ ability to, among other things, create any liens upon any of the Loan Parties’ property other than customary permitted liens and liens on up to $1.5 billion of secured credit facilities debt (which amount includes the Secured Revolving Line of Credit), declare or make cash distributions, create any encumbrance on the ability of a subsidiary to make any upstream payments, make asset dispositions other than certain ordinary course dispositions and certain supply chain finance arrangements, make certain loans, make payments with respect to subordinated debt or certain borrowed money prior to its due date or become a party to certain agreements restricting the Loan Parties’ ability to enter into any non arm’s-length transaction with an affiliate.
The Loan Parties are required to repurchase, redeem, defease, repay, create a segregated account for the repayment of, or request Agent to reserve a sufficient available amount under the Secured Revolving Line of Credit for the repayment of, all debt for borrowed money exceeding $50 million, by no later than 60 days prior to its maturity date (not including the Secured Revolving Line of Credit). Any reserved funds for this purpose would not be included in domestic cash calculations.
In addition, if at any time the Loan Parties’ Excess Cash Availability is less than the greater of 15% of the total commitment amount and $75 million, the Loan Parties must maintain a minimum fixed charge coverage ratio of 1.00 to 1.00 until (i) no event of default exists and (ii) the Loan Parties’ Excess Cash Availability is greater than the greater of 15% of the total commitment amount and $75 million for 45 consecutive days.
The events of default under the Amended and Restated Loan Agreement include, among other things, payment defaults, the inaccuracy of representations or warranties, defaults in the performance of affirmative and negative covenants, bankruptcy and insolvency related defaults, a cross-default related to indebtedness in an aggregate amount in excess of $50 million, judgments entered against a Loan Party in an amount that exceeds cumulatively $50 million, certain ERISA events and events related to Canadian defined benefits plans and a change of control. When a Payment Condition has not been satisfied, additional events of default include, among other things, a loss, theft damage or destruction with respect to any collateral if the amount not covered by insurance exceeds $50 million.
First Amendment to Amendment and Restated Loan and Security Agreement
On June 10, 2015, the Loan Parties entered into a First Amendment to the Amended and Restated Loan and Security Agreement (the “First Amendment”) by and among the Loan Parties, the Lenders and the Agent, which modifies the Amended and Restated Loan Agreement. Amendments to the Amended and Restated Loan Agreement effected by the First Amendment include the addition of exceptions to the liens and asset sale covenants to permit the Loan Parties to enter into certain supply chain finance arrangements, as well as the addition of certain definitions related thereto.
At December 26, 2015 and December 27, 2014, the Secured Revolving Line of Credit had an outstanding loan balance of $230 million and $130 million, respectively, at an interest rate of 4.00% and4.25%, respectively. At December 26, 2015, the Secured Revolving Line of Credit also had $16 million related to outstanding Letters of Credit, and up to $87 million available for future borrowings. The Company reports its intra-period changes in its revolving credit balance on a net basis in its consolidated statement of cash flows as the Company intends the period of the borrowings to be brief, repaying borrowed amounts within 90 days. As of December 26, 2015, the Company was in compliance with all required covenants stated in the Loan Agreement.
The agreements governing
its 6.00% Notes, 8.125%the 6.75% Notes, 7.75% Notes,
and 7.50% Notes,
7.00% Notes and the Secured Revolving Line of Credit contain cross-default provisions whereby a default under one agreement would likely result in cross defaults under agreements covering other borrowings. The occurrence of a default under any of these borrowing arrangements would permit the applicable note holders
or the lenders under the Secured Revolving Line of Credit to declare all amounts outstanding under those borrowing arrangements to be immediately due and payable.
Capital Lease Obligations
As of December 29, 2012, the
The Company
had aggregate outstandingterminated its capital lease obligations
of $23 million forand entered into a non-cancelable operating lease agreement related to one of its facilities in
Markham, Ontario, Canada
which is payable in monthly installments through 2017.The gross amount of assets recorded under capital leases totaled approximately $23 million asduring 2015. As of December 29, 2012 and December 31, 2011, and is included in26, 2015, the related property, plant and equipment category. Amortization of assets recorded underCompany did not have any capital leases is included in depreciation expense. Accumulated amortization of these leased assets was approximately $14 million and $12 million as of December 29, 2012 and December 31, 2011, respectively.
lease obligations outstanding.
Future Payments on
Long TermTotal Debt
and Capital Lease ObligationsAs of December
29, 2012,26, 2015, the Company’s future
long term debt
and capital lease payment obligations were as follows:
| | | | | | | | |
| | | Long Term
Debt
(Principal
only) | | | Capital
Leases | |
| | | (In millions) | |
2013 | | $ | — | | | $ | 6 | |
2014 | | | — | | | | 6 | |
2015 | | | 580 | | | | 6 | |
2016 | | | — | | | | 6 | |
2017 | | | 500 | | | | 1 | |
2018 and thereafter | | | 1,000 | | | | — | |
Total | | | 2,080 | | | | 25 | |
Less: imputed interest | | | — | | | | 2 | |
Total | | $ | 2,080 | | | $ | 23 | |
NOTE 11: | Other Income (Expense), Net |
|
| | | | | | | |
| | Long Term Debt (Principal only) | | Short Term Debt (Principal only) |
| | (In millions) |
| 2016 | $ | — |
| | $ | 230 |
|
| 2017 | — |
| | — |
|
| 2018 | — |
| | — |
|
| 2019 | 600 |
| | — |
|
| 2020 | 450 |
| | — |
|
| 2021 and thereafter | 975 |
| | — |
|
| Total | $ | 2,025 |
| | $ | 230 |
|
NOTE 11: Other Expense, Net
The following table summarizes the components of other income (expense), net:
| | | | | | | | | | | | |
| | | 2012 | | | 2011 | | | 2010 | |
| | | (In millions) | |
Gain upon deconsolidation of GF | | $ | — | | | $ | — | | | $ | 325 | |
GF investment impairment charge | | | — | | | | (209 | ) | | | — | |
Impairment charge on marketable securities | | | (4 | ) | | | — | | | | — | |
Net gain (loss) on debt repurchase | | | — | | | | (6 | ) | | | (24 | ) |
Other | | | 10 | | | | 16 | | | | 10 | |
Other income (expense), net | | $ | 6 | | | $ | (199 | ) | | $ | 311 | |
|
| | | | | | | | | | | |
| | 2015 | | 2014 | | 2013 |
| | (In millions) |
| Net loss on debt redemptions | $ | — |
| | $ | (61 | ) | | $ | (1 | ) |
| Other | (5 | ) | | (5 | ) | | 1 |
|
| Other expense, net | $ | (5 | ) | | $ | (66 | ) | | $ | — |
|
NOTE 12: | Segment Reporting |
NOTE 12: Segment Reporting
Management, including the Chief Operating Decision Maker, who is the Company’s Chief Executive Officer, reviews and assesses operating performance using segment net revenues and operating income (loss) before interest, other income (expense), net and income taxes. These performance measures include the allocation of expenses to the operating segments based on management’s judgment.
The In connection with the Company’s continued strategic transformation, effective July 1, 2014, the Company usesrealigned its organizational structure. As a result of this organizational change, the Company has the following two reportable operating segments:
•the Computing Solutions segment, which includes microprocessors, as standalone devices or as incorporated as an APU, chipsets and embedded processors; and
the Graphics segment, which primarily includes graphics, video and multimedia products developed for use in desktop and notebook computers, including home media PCs,processors
and chipsets, discrete graphics processing units (GPUs) and professional workstationsgraphics; and servers as well as revenue received in connection with
•the developmentEnterprise, Embedded and sale of game console systems that incorporate the Company’s graphics technology.Semi-Custom segment, which primarily includes server and
embedded processors, semi-custom System-on-Chip (SoC) products, engineering services
and royalties.
In addition to these reportable segments, the Company has an All Other category, which is not a reportable segment. This category
primarily includes certain expenses and credits that are not allocated to any of the
operatingreportable segments because management does not consider these expenses and credits in evaluating the performance of the
operatingreportable segments. Also included in this category are
amortizationamortizations of acquired intangible assets,
employee stock-based compensation expense, restructuring
and other special charges,
net, technology node transition charge, workforce rebalancing severance charges, goodwill impairment charge, significant or unusual lower of cost or market inventory adjustments and a
charge related tonet gain from licenses and settlement agreements regarding patent-related matters. The Company also reported the
limited waiverresults of
exclusivity from GF.former businesses in the All Other category because the operating results were not material.
The following table provides a summary of net revenue and operating income (loss) by segment and income (loss)
from continuing operations before income taxes for
2012, 20112015, 2014 and
2010. | | | | | | | | | | | | |
| | | 2012 | | | 2011 | | | 2010 | |
| | | (In millions) | |
Net revenue: | | | | | | | | | | | | |
Computing Solutions | | $ | 4,005 | | | $ | 5,002 | | | $ | 4,817 | |
Graphics | | | 1,417 | | | | 1,565 | | | | 1,663 | |
All Other | | | — | | | | 1 | | | | 14 | |
Total net revenue | | $ | 5,422 | | | $ | 6,568 | | | $ | 6,494 | |
Operating income (loss): | | | | | | | | | | | | |
Computing Solutions | | $ | (231 | ) | | $ | 556 | | | $ | 529 | |
Graphics | | | 105 | | | | 51 | | | | 149 | |
All Other | | | (930 | ) | | | (239 | ) | | | 170 | |
Total operating income (loss) | | $ | (1,056 | ) | | $ | 368 | | | $ | 848 | |
Interest income | | | 8 | | | | 10 | | | | 11 | |
Interest expense | | | (175 | ) | | | (180 | ) | | | (199 | ) |
Other income (expense), net | | | 6 | | | | (199 | ) | | | 311 | |
Equity income (loss) and dilution gain in investee, net | | | — | | | | 492 | | | | (462 | ) |
Income (loss) from continuing operations before income taxes | | $ | (1,217 | ) | | $ | 491 | | | $ | 509 | |
2013. The results prior to July 1, 2014 have been recast to reflect the Company’s new reportable segments.
|
| | | | | | | | | | | |
| | 2015 | | 2014 | | 2013 |
| | (In millions) |
| Net revenue: | | | | | |
| Computing and Graphics | $ | 1,805 |
| | $ | 3,132 |
| | $ | 3,720 |
|
| Enterprise, Embedded and Semi-Custom | 2,186 |
| | 2,374 |
| | 1,577 |
|
| All Other | — |
| | — |
| | 2 |
|
| Total net revenue | $ | 3,991 |
| | $ | 5,506 |
| | $ | 5,299 |
|
| Operating income (loss): | | | | | |
| Computing and Graphics | $ | (502 | ) | | $ | (76 | ) | | $ | (101 | ) |
| Enterprise, Embedded and Semi-Custom | 215 |
| | 399 |
| | 295 |
|
| All Other | (194 | ) | | (478 | ) | | (91 | ) |
| Total operating income (loss) | $ | (481 | ) | | $ | (155 | ) | | $ | 103 |
|
| Interest expense | (160 | ) | | (177 | ) | | (177 | ) |
| Other expense, net | (5 | ) | | (66 | ) | | — |
|
| Loss before income taxes | $ | (646 | ) | | $ | (398 | ) | | $ | (74 | ) |
The Company does not discretely allocate assets to its operating segments, nor does management evaluate operating segments using discrete asset information.
The Company’s operations outside the United States include research and development
activities, back end manufacturingactivities; assembly, test, mark and packaging activities; and sales, marketing and administrative activities. The Company conducts product and system research and development activities for its products in
the United States, with additional design and development engineering teams located in China, Canada, India,
Greater China, Singapore, Taiwan,
United Kingdom, Israel and
Japan.Israel. The Company’s
back end manufacturing subsidiariesassembly, test, mark and packaging facilities are located in Malaysia and
Greater China.
ItsThe Company’s material sales and marketing
entitiesoffices are located in the United States,
Latin America, Europe
Greater China, Singapore and
Japan.Asia.
The following table summarizes sales to external customers by
country: | | | | | | | | | | | | |
| | | 2012 | | | 2011 | | | 2010 | |
| | | (In millions) | |
United States | | $ | 407 | | | $ | 456 | | | $ | 747 | |
Europe | | | 469 | | | | 779 | | | | 985 | |
Greater China | | | 3,131 | | | | 3,493 | | | | 3,006 | |
Singapore | | | 856 | | | | 1,056 | | | | 875 | |
Japan | | | 305 | | | | 445 | | | | 561 | |
Other countries | | | 254 | | | | 339 | | | | 320 | |
Total sales to external customers | | $ | 5,422 | | | $ | 6,568 | | | $ | 6,494 | |
country, which is based on the billing location of the customer:
|
| | | | | | | | | | | |
| | 2015 | | 2014 | | 2013 |
| | (In millions) |
| United States | $ | 984 |
| | $ | 1,030 |
| | $ | 801 |
|
| Europe | 168 |
| | 325 |
| | 460 |
|
| China | 1,145 |
| | 2,324 |
| | 2,519 |
|
| Singapore | 356 |
| | 371 |
| | 610 |
|
| Japan | 1,254 |
| | 1,324 |
| | 710 |
|
| Other countries | 84 |
| | 132 |
| | 199 |
|
| Total sales to external customers | $ | 3,991 |
| | $ | 5,506 |
| | $ | 5,299 |
|
The Company had
one customertwo customers that accounted for more than 10% of the Company’s consolidated
revenue.net revenue in 2015. The Company had three customers that accounted for more than 10% of the Company’s consolidated net revenue in 2014 and 2013. Net sales to
this customerthese customers were approximately
22%31% and 18% of consolidated net revenue in
2012, 20112015, 23%, 13% and
2010,13% of consolidated net revenue in 2014 and
were primarily attributable17%, 11% and 10% of consolidated net revenue in 2013. The majority of the revenue from these customers was related to
products from the
Computing Solutions segment in each of these years.Enterprise, Embedded and Semi-Custom segment.
The following table summarizes long-lived assets by geographic areas:
| | | | | | | | |
| | | December 29,
2012 | | | December 31,
2011 | |
| | | (In millions) | |
United States | | $ | 417 | | | $ | 455 | |
Malaysia | | | 66 | | | | 70 | |
Greater China | | | 59 | | | | 60 | |
Singapore | | | 37 | | | | 56 | |
Other countries | | | 79 | | | | 85 | |
Total long-lived assets | | $ | 658 | | | $ | 726 | |
|
| | | | | | | |
| | 2015 | | 2014 |
| | (In millions) |
| United States | $ | 123 |
| | $ | 149 |
|
| Malaysia | 11 |
| | 57 |
|
| China | 5 |
| | 45 |
|
| Singapore | 25 |
| | 17 |
|
| Other countries | 24 |
| | 34 |
|
| Total long-lived assets | $ | 188 |
| | $ | 302 |
|
NOTE 13: | Stock-Based Incentive Compensation Plans |
NOTE 13: Stock-Based Incentive Compensation Plans
The Company’s stock-based incentive programs are intended to attract, retain and motivate highly qualified employees. On April 29, 2004, the Company’s stockholders approved the 2004 Equity Incentive Plan (the 2004 Plan).
TheAs of December 26, 2015, the Company also has stock options outstanding under
previous equity compensation plans that were in effect before April 29, 2004, as well as equity compensation plans that the Company assumed as part of its
acquisition of ATI and SeaMicro.SeaMicro acquisition. Shares reserved for future grants under the Company’s prior equity compensation plans were consolidated into the 2004 Plan; none of the reserved shares under the
ATI or SeaMicro
plansplan were consolidated into the 2004 Plan. As of December
29, 201226, 2015, the Company had
approximately 16.111.4 million shares of common stock that were available for future grants and
6483 million shares reserved for issuance upon the exercise of outstanding stock options or the vesting of unvested restricted stock
awards.and restricted stock units.
Under the 2004 Plan, stock options generally vest and become exercisable over a three- to four-year period from the date of grant and expire within ten years after the grant date. Unvested shares that are reacquired by the Company from outstanding equity awards become available for grant and may be reissued as new awards.
Under the 2004 Plan, the Company can grant fair market value awards or full value awards. Fair market value awards are awards granted at or above the fair market value of the Company’s common stock on the date of grant. Full value awards are awards granted at less than the fair market value of the Company’s common stock on the date of grant. Awards can consist of (i) stock options and stock appreciation rights granted at the fair market value of the Company’s common stock on the date of grant and (ii) restricted stock or restricted stock units, as full value awards.
FollowingThe following is a description of the material terms of the awards that may be granted under the 2004 Plan.
Stock Options. A stock option is the right to purchase shares of the Company’s common stock at a fixed exercise price for a fixed period of time. Under the 2004 Plan, nonstatutory and incentive stock options may be granted. The exercise price of the shares subject to each nonstatutory stock option and incentive stock option cannot be less than 100% of the fair market value of the Company’s common stock on the date of the grant. The exercise price of each option granted under the 2004 Plan must be paid in full at the time of the exercise. Stock Appreciation Rights. Awards of stock appreciation rights may be granted pursuant to the 2004 Plan. Stock appreciation rights may be granted to employees and consultants. No stock appreciation right may be granted at less than fair market value of the Company’s common stock on the date of grant or have a term of over ten years from the date of grant. Upon exercising a stock appreciation right, the holder of such right is entitled to receive payment from the Company in an amount determined by multiplying
(i) the difference between the closing price of a share of the Company’s common stock on the date of exercise and the exercise price by (ii) the number of shares with respect to which the stock appreciation right is exercised. The Company’s obligation arising upon the exercise of a stock appreciation right may be paid in shares or in cash, or any combination thereof.
Restricted Stock. Restricted stock awards can be granted to any employee, director or consultant. The purchase price for an award of restricted stock is $0.00 per share.
Restricted Stock Units. Restricted stock based on continued service may fully vest with no minimum time requirements. Restricted stock that is performance based generally may not fully vest for at least one year from the date of grant.Restricted Stock Units. Restricted stock units (RSUs) are awards that can be granted to any employee, director or consultant and that obligate the Company to issue a specific number of shares of the Company’s common stock in the future if the vesting terms and conditions are satisfied. The purchase price for the shares is $0.00 per share.
Performance-based Restricted stock unitsStock Units. Performance-based Restricted Stock Units (PRSUs) can be granted to certain of the Company’s senior executives. The performance metrics can be financial performance, non-financial performance and/or market condition. Each PRSU award reflects a target number of shares (Target Shares) that may be issued to an award recipient before adjusting based on continued servicethe Company’s financial performance, non-financial performance and/or market conditions. The actual number of shares that a grant recipient receives at the end of the period may fully vest with no minimum time requirements. Restrictedrange from 0% to 250% of the Target Shares granted, depending upon the degree of achievement of the performance target designated by each individual award.
Stock options, stock
units that are performance basedappreciation rights, restricted stock, RSUs and PRSUs granted after April 29, 2015, generally
domay not vest
for at leastin less than one year
fromfollowing the date of grant.
Market-based Restricted Stock Units and Stock Options. During 2012, the Company granted restricted stock units with both a market condition and a service condition (market-based restricted stock units) to the Company’s executive officers. The market-based condition for these awards requires that AMD common stock maintains a weighted-average closing price during the three-year vesting period of equal to or greater than $10.00 per share over any 30-day period. Provided the market-based condition is satisfied and the respective executive officer remains an employee of the Company, the grants will vest in three equal annual installments on the applicable vesting date.
During 2011, the Company granted market-based restricted stock units and stock options to the Company’s President and Chief Executive Officer, whom the Company hired in August 2011. The market-based condition for these awards requires that AMD common stock maintains a weighted-average closing price during the three-year vesting period of equal to or greater than $11.00 per share over any 30-day period. Provided the market-based condition is satisfied and the Company’s President and CEO remains an employee of the Company, the grants will vest in three equal annual installments on the applicable vesting date.
The Company estimated the fair value of market-based restricted stock units and stock options using a Monte Carlo simulation model on the date of grant. As of December 29, 2012, there were 1,756,000 market-based restricted stock units and 739,000 market-based stock options outstanding with a grant date fair value of $7.1 million and $2.0 million, respectively.
Valuation and Expense Information
Stock-based compensation expense related to employee stock options, restricted stock and restricted stock units was allocated in the consolidated statements of operations as follows:
| | | | | | | | | | | | |
| | | 2012 | | | 2011 | | | 2010 | |
| | | (In millions) | |
Cost of sales | | $ | 8 | | | $ | 6 | | | $ | 4 | |
Research and development | | | 52 | | | | 46 | | | | 46 | |
Marketing, general, and administrative | | | 37 | | | | 38 | | | | 37 | |
Total stock-based compensation expense, net of tax of $0 | | $ | 97 | | | $ | 90 | | | $ | 87 | |
|
| | | | | | | | | | | |
| | 2015 | | 2014 | | 2013 |
| | (In millions) |
| Cost of sales | $ | 3 |
| | $ | 3 |
| | $ | 5 |
|
| Research and development | 36 |
| | 44 |
| | 48 |
|
| Marketing, general, and administrative | 24 |
| | 34 |
| | 38 |
|
| Total stock-based compensation expense, net of tax of $0 | $ | 63 |
| | $ | 81 |
| | $ | 91 |
|
During
2012, 20112015, 2014 and
2010,2013, the Company did not realize any excess tax benefits related to stock-based compensation and therefore the Company did not record any
relatedeffects relating to financing cash flows. The Company did not capitalize stock-based compensation cost as part of the cost of an asset because the cost was immaterial.
Stock Options. The Company uses the lattice-binomial model in determining the fair value of the employee stock options. The weighted-average estimated fair value of employee stock options granted for the years ended December
29, 2012,26, 2015, December
31, 201127, 2014 and December
25, 201028, 2013 was
$2.12, $2.85$1.02, $1.46 and
$3.20$1.52 per share, respectively, using the following weighted-average assumptions:
| | | | | | | | | | | | |
| | | 2012 | | | 2011 | | | 2010 | |
Expected volatility | | | 56.24 | % | | | 54.82 | % | | | 55.97 | % |
Risk-free interest rate | | | 0.52 | % | | | 1.60 | % | | | 1.34 | % |
Expected dividends | | | — | | | | — | | | | — | |
Expected life (in years) | | | 3.79 | | | | 3.75 | | | | 3.71 | |
|
| | | | | | | | |
| | 2015 | | 2014 | | 2013 |
| Expected volatility | 60.14 | % | | 53.36 | % | | 59.03 | % |
| Risk-free interest rate | 1.29 | % | | 1.15 | % | | 0.79 | % |
| Expected dividends | — | % | | — | % | | — | % |
| Expected life (in years) | 3.91 |
| | 3.86 |
| | 3.83 |
|
The Company used a combination of the historical volatility of its common stock and the implied volatility for publicly traded options on the Company’s common stock as the expected volatility assumption required by the lattice-binomial model. The risk-free interest rate assumption is based upon observed interest rates commensurate with the term of the Company’s employee stock options. The expected dividend yield is zero as the Company does not expect to pay dividends in the future. The expected term of employee stock options represents the weighted-average period the stock options are expected to remain outstanding and is a derived output of the lattice-binomial model.
The following table summarizes stock option activity, including market-based stock options, and related information:
| | | | | | | | | | | | | | | | | | | | | | | | |
| | | 2012 | | | 2011 | | | 2010 | |
| | | Number
of Shares | | | Weighted-
Average
Exercise
Price | | | Number
of Shares | | | Weighted-
Average
Exercise
Price | | | Number
of Shares | | | Weighted-
Average
Exercise
Price | |
| | | (In millions, except share price) | |
Stock options: | | | | | | | | | | | | | | | | | | | | | | | | |
Outstanding at beginning of year | | | 34 | | | $ | 7.36 | | | | 37 | | | $ | 7.77 | | | | 42 | | | $ | 8.65 | |
Granted | | | 17 | | | $ | 3.41 | | | | 8 | | | $ | 7.16 | | | | 5 | | | $ | 7.77 | |
Canceled | | | (8 | ) | | $ | 11.26 | | | | (6 | ) | | $ | 12.54 | | | | (6 | ) | | $ | 16.92 | |
Exercised | | | (5 | ) | | $ | 2.71 | | | | (5 | ) | | $ | 3.82 | | | | (4 | ) | | $ | 3.35 | |
Outstanding at end of year | | | 38 | | | $ | 5.51 | | | | 34 | | | $ | 7.36 | | | | 37 | | | $ | 7.77 | |
Exercisable at end of year | | | 22 | | | $ | 6.14 | | | | 25 | | | $ | 7.48 | | | | 28 | | | $ | 8.24 | |
Included in the table above are approximately 1,652,000 vested and 4,792,000 unvested stock options issued upon the acquisition of SeaMicro (See Note 4). The estimated fair value of the unvested stock options was $6.60 per share.
|
| | | | | | | | | | | | | | | | | | | | |
| 2015 | | 2014 | | 2013 |
| Number of Shares | | Weighted- Average Exercise Price | | Number of Shares | | Weighted- Average Exercise Price | | Number of Shares | | Weighted- Average Exercise Price |
| | (In millions, except share price) |
| Stock options: | | | | | | | | | | | |
| Outstanding at beginning of year | 36 |
| | $ | 4.78 |
| | 35 |
| | $ | 5.08 |
| | 38 |
| | $ | 5.51 |
|
| Granted | 8 |
| | $ | 2.12 |
| | 8 |
| | $ | 3.73 |
| | 6 |
| | $ | 3.63 |
|
| Canceled | (9 | ) | | $ | 4.91 |
| | (4 | ) | | $ | 7.64 |
| | (6 | ) | | $ | 7.73 |
|
| Exercised | (3 | ) | | $ | 1.61 |
| | (3 | ) | | $ | 1.47 |
| | (3 | ) | | $ | 1.56 |
|
| Outstanding at end of year | 32 |
| | $ | 4.44 |
| | 36 |
| | $ | 4.78 |
| | 35 |
| | $ | 5.08 |
|
| Exercisable at end of year | 21 |
| | $ | 5.34 |
| | 23 |
| | $ | 5.28 |
| | 22 |
| | $ | 5.62 |
|
As of December
29, 2012,26, 2015, the weighted-average remaining contractual life of outstanding stock options was
4.463.38 years and their aggregate intrinsic value was
$9$6 million. As of December
29, 2012,26, 2015, the weighted-average remaining contractual life of exercisable stock options was
2.891.96 years and their aggregate intrinsic value was
$3$1 million. The total intrinsic value of stock options exercised for
2012, 20112015, 2014 and
20102013 was
$18$2 million,
$21$7 million and
$22$5 million, respectively.
As of December 26, 2015, the Company had $11 million of total unrecognized compensation expense, net of estimated forfeitures, related to stock options that will be recognized over the weighted-average period of 2.30 years.
Restricted Stock and Restricted Stock Units. RSUs. Restricted stock and restricted stock unitsRSUs vest in accordance with the terms and conditions established by the Compensation and Leadership Resources Committee of the Board of Directors, and are based either on continued service or continued service and performance. The cost of restricted stock and restricted stock unitsRSUs is determined using the fair value of the Company’s common stock on the date of the grant, and the compensation expense is recognized over the service period. The summary of the changes in restricted stock and
restricted stock unitsRSUs outstanding, including the
market-based restricted stock units,PRSUs, during
2012, 20112015, 2014 and
20102013 is presented below:
| | | | | | | | | | | | | | | | | | | | | | | | |
| | | 2012 | | | 2011 | | | 2010 | |
| | | Number
of Shares | | | Weighted-
Average
Fair
Value | | | Number
of Shares | | | Weighted-
Average
Fair
Value | | | Number
of Shares | | | Weighted-
Average
Fair
Value | |
| | | (In millions except share price) | |
Unvested balance at beginning of period | | | 24 | | | $ | 7.07 | | | | 24 | | | $ | 6.50 | | | | 22 | | | $ | 5.32 | |
Granted | | | 17 | | | $ | 5.43 | | | | 14 | | | $ | 7.34 | | | | 12 | | | $ | 8.54 | |
Forfeited | | | (5 | ) | | $ | 6.84 | | | | (4 | ) | | $ | 6.66 | | | | (2 | ) | | $ | 6.13 | |
Vested | | | (11 | ) | | $ | 6.05 | | | | (10 | ) | | $ | 6.25 | | | | (8 | ) | | $ | 6.41 | |
Unvested balance at end of period | | | 25 | | | $ | 6.41 | | | | 24 | | | $ | 7.07 | | | | 24 | | | $ | 6.50 | |
|
| | | | | | | | | | | | | | | | | | | | |
| 2015 | | 2014 | | 2013 |
| Number of Shares | | Weighted- Average Fair Value | | Number of Shares | | Weighted- Average Fair Value | | Number of Shares | | Weighted- Average Fair Value |
| | (In millions except share price) |
| Unvested balance at beginning of period | 43 |
| | $ | 4.05 |
| | 40 |
| | $ | 4.52 |
| | 25 |
| | $ | 6.41 |
|
| Granted | 38 |
| | $ | 2.03 |
| | 23 |
| | $ | 3.89 |
| | 28 |
| | $ | 3.81 |
|
| Forfeited | (15 | ) | | $ | 3.71 |
| | (5 | ) | | $ | 4.48 |
| | (3 | ) | | $ | 5.76 |
|
| Vested | (15 | ) | | $ | 4.13 |
| | (15 | ) | | $ | 4.90 |
| | (10 | ) | | $ | 6.93 |
|
| Unvested balance at end of period | 51 |
| | $ | 2.61 |
| | 43 |
| | $ | 4.05 |
| | 40 |
| | $ | 4.52 |
|
Included in the table above are approximately
322,0000.3 million shares of restricted stock granted upon the acquisition of SeaMicro
(See Note 4).in 2012. The weighted-average estimated fair value of the restricted stock was $4.03.
The total fair value of restricted stock and
restricted stock unitsRSUs vested during
2012, 20112015, 2014 and
20102013 was
$33 million, $60 million
$74 million and
$61$36 million, respectively. Compensation expense recognized for the restricted stock and
restricted stock unitsRSUs for
2012, 20112015, 2014 and
20102013 was approximately
$77$57 million,
$73$65 million and
$61$68 million, respectively.
As of December
29, 2012,26, 2015, the Company had
$44 million of total unrecognized compensation expense, net of estimated forfeitures, related to stock options that will be recognized over the weighted-average period of 2.20 years.As of December 29, 2012, the Company had $97$88 million of total unrecognized compensation expense, net of estimated forfeitures, related to restricted stock and restricted stock unitsRSUs that will be recognized over the weighted-average period of 1.971.99 years.
PRSUs. The Company estimated the fair value for the PRSUs with a market condition using Monte Carlo simulation model on the date of grant. During 2015, the Company granted 5.2 million PRSUs to certain of the Company’s senior executives, of which 3.9 million PRSUs included a market condition. During 2014, the Company granted 5.2 million PRSUs to certain of the Company’s certain senior executives, of which 4.1 million PRSUs included a market condition.
The summary of the changes in the PRSUs during 2015, 2014 and 2013 is presented below.
|
| | | | | | | | |
| 2015 | | 2014 | | 2013 |
| | (Shares in millions) |
| Unvested shares at beginning of period | 9 |
| | 5 |
| | 2 |
|
| Granted | 5 |
| | 5 |
| | 3 |
|
| Forfeited | (7 | ) | | (1 | ) | | — |
|
| Vested | — |
| | — |
| | — |
|
| Unvested shares at end of period | 7 |
| | 9 |
| | 5 |
|
NOTE 14: | Other Employee Benefit Plans |
Retirement Savings Plan.NOTE 14: Other Employee Benefit Plans
The Company has a retirement savings plan, commonly known as a 401(k) plan, that allows participating employees in the United States to contribute up to 100% of their pre-tax salary subject to Internal Revenue Service limits. The Company matched 75% of employees’ contributions up to 6% of their compensation, to a maximum
per employee match of
$11,250, $11,025$11,925, $11,700 and
$11,025$11,475 for
2012, 20112015, 2014 and
2010, respectively, which is 4.5% (75% of the 6%) of the Internal Revenue Service compensation limit.2013, respectively. The Company’s contributions to the 401(k) plan
for 2015, 2014 and 2013 were approximately
$22$16 million,
in 2012, $20$18 million
in 2011 and
$9$19 million,
in 2010.In 2009, as part of its cost cutting efforts, the Company temporarily suspended the matching contributions for its 401(k) plan, effective February 2, 2009. In January 2010, the Company announced the partial reinstatement of the Section 401(k) plan matching contributions for 2010. At the end of 2010, the Company looked back at all employee contributions and made a one-time match equivalent to half of the full-year amount. This Company match was one-half of 75% of contributions through December 31, 2010, up to the first 6% of pay deferred.
respectively.
NOTE 15: | Commitments and Guarantees |
NOTE 15: Commitments and Guarantees
As of December 29, 2012,26, 2015, the Company’s future non-cancelable operating lease commitments, including those for facilities vacated in connection with restructuring activities, were as follows: | | | | |
| Year | | Operating
leases | |
| | | (In millions) | |
2013 | | $ | 37 | |
2014 | | | 34 | |
2015 | | | 28 | |
2016 | | | 21 | |
2017 | | | 18 | |
2018 and thereafter | | | 22 | |
Total non-cancelable operating lease commitments | | $ | 160 | |
|
| | | |
| Year | Operating leases |
| | (In millions) |
| 2016 | $ | 51 |
|
| 2017 | 50 |
|
| 2018 | 45 |
|
| 2019 | 28 |
|
| 2020 | 26 |
|
| 2021 and thereafter | 106 |
|
| Total non-cancelable operating lease commitments | $ | 306 |
|
The Company leases certain of its facilities, and in some jurisdictions, the Company leases the land on which these facilities are built, under non-cancelable lease agreements that expire at various dates through
2022.2028. The Company also leases certain manufacturing and office equipment for terms ranging from
1one to
5five years. Rent expense
for 2015, 2014 and 2013 was
approximately $49$47 million,
$48$59 million and
$44$64 million,
in 2012, 2011 and 2010.respectively.
In December 1998, the Company arranged for the sale of its marketing, general and administrative facility in Sunnyvale, California and leased it back for a period of 20 years. The Company recorded a deferred gain of $37 million on the sale and is amortizing it over the life of the lease. The lease expires in December 2018. At the beginning of the fourth lease year and every three years thereafter, the rent is adjusted by 200% of the cumulative increase in the consumer price index over the prior three-year period, up to a maximum of 6.9%.
In September 2013, the Company sold a light industrial building in Singapore and leased back a portion of the original space. The Company recorded a deferred gain of $14 million on the sale and is amortizing over the initial lease term. The initial operating lease term expires in September 2023 and provides for options to extend the lease for 4 years at the end of the initial lease term, and for an additional 3.5 years thereafter.
Certain other operating leases contain provisions for escalating lease payments subject to changes in the consumer price index. Total future lease obligations as of December
29, 2012,26, 2015 were
approximately $160$306 million.
Purchase
and Other Contractual Obligations
The Company’s purchase obligations primarily include the Company’s obligations to purchase wafers and substrates from third parties. As of December 29, 2012,26, 2015, total non-cancelable purchase obligations, excluding the Company’s wafer purchase commitments to GF under the WSA, were $299$319 million.
The Company also had other contractual obligations, included in “Other long-term liabilities” on its consolidated balance sheet, which consists of $40 million
for 2013.of payments due under certain software and technology licenses that will be paid through 2018.
Future unconditional purchase obligations as of December 26, 2015 were as follows:
|
| | | |
| Year | Unconditional purchase obligations |
| | (In millions) |
| 2016 | $ | 254 |
|
| 2017 | 42 |
|
| 2018 | 37 |
|
| 2019 | 26 |
|
| 2020 | — |
|
| 2021 and thereafter | — |
|
| Total unconditional purchase commitments | $ | 359 |
|
Obligations to GF
The Company’s obligations
Obligations to GF
represent all of the Company’s expected cash payments to GF based on wafer receipts and research and development activities. As of December 26, 2015, purchase obligations for
wafer purchases arefiscal 2016 were approximately
$1.15 billion for 2013$248 million, of which amount wafers and
$250research and development activities of approximately $185 million
for the first quarter of 2014.were received by December 31, 2015.
Warranties and Indemnities
The Company generally warrants that its products sold to its customers will conform to the Company’s approved specifications and be free from defects in material and workmanship under normal use and service for one year. Subject to certain exceptions, the Company also offers a three-year limited warranty to end users for only those CPU and AMD
A-Series APU products that are commonly referred to as “processors in a box” and
hasfor certain server CPU products. The Company also offered extended limited warranties to certain customers of “tray” microprocessor products and/or
workstationprofessional graphics products who have written agreements with the Company and target their computer systems at the commercial and/or embedded markets.
Changes in the Company’s estimated liability for product warranty during the years ended December
29, 201226, 2015 and December
31, 201127, 2014 are as follows:
| | | | | | | | |
| | | December 29,
2012 | | | December 31,
2011 | |
| | | (In millions) | |
Beginning balance | | $ | 20 | | | $ | 19 | |
New warranties issued during the period | | | 28 | | | | 35 | |
Settlements during the period | | | (30 | ) | | | (36 | ) |
Changes in liability for pre-existing warranties during the period, including expirations | | | (2 | ) | | | 2 | |
Ending balance | | $ | 16 | | | $ | 20 | |
|
| | | | | | | |
| | December 26,
2015 | | December 27,
2014 |
| | (In millions) |
| Beginning balance | $ | 19 |
| | $ | 17 |
|
| New warranties issued during the period | 28 |
| | 32 |
|
| Settlements during the period | (26 | ) | | (39 | ) |
| Changes in liability for pre-existing warranties during the period, including expirations | (6 | ) | | 9 |
|
| Ending balance | $ | 15 |
| | $ | 19 |
|
In addition to product warranties, the Company, from time to time in its normal course of business, indemnifies other parties, with whom it enters into contractual relationships, including customers, lessors and parties to other transactions with the Company, with respect to certain matters. In these limited matters, the Company has agreed to hold certain third parties harmless against specific types of claims or losses, such as those arising from a breach of representations or covenants, third-party claims that the Company’s products when used for their intended purpose(s) and under specific conditions infringe the intellectual property rights of a third party, or other specified claims made against the indemnified party. It is not possible to determine the maximum potential amount of liability under these indemnification obligations due to the unique facts and circumstances that are likely to be involved in each particular claim and indemnification provision. Historically, payments made by the Company under these obligations have not been material.
NOTE 16: Contingencies
Securities Class Action
On January 15, 2014, a class action lawsuit captioned Hatamian v. AMD, et al., C.A. No. 3:14-cv-00226 (the “Hatamian Lawsuit”) was filed against the Company in the United States District Court for the Northern District of California. The complaint purports to assert claims against the Company and certain individual officers for alleged violations of Section 10(b) of the Securities Exchange Act of 1934, as amended (the Exchange Act), and Rule 10b-5 of the Exchange Act. The plaintiffs seek to represent a proposed class of all persons who purchased or otherwise acquired our common stock during the period April 4, 2011 through October 18, 2012. The complaint seeks damages allegedly caused by alleged materially misleading statements and/or material omissions by the Company and the individual officers regarding its 32nm technology and “Llano” product, which statements and omissions, the plaintiffs claim, allegedly operated to artificially inflate the price paid for the Company’s common stock during the period. The complaint seeks unspecified compensatory damages, attorneys’ fees and costs. On July 7, 2014, the Company filed a motion to dismiss plaintiffs’ claims. On March 31, 2015, the Court denied the motion to dismiss. On May 14, 2015, the Company filed its answer to plaintiffs’ corrected amended complaint. The discovery process is ongoing. On September 4, 2015, plaintiffs filed their motion for class certification. A court-ordered mediation held in January 2016 did not result in a settlement of the lawsuit.
Based upon information presently known to management, the Company believes that the potential liability, if any, will not have a material adverse effect on its financial condition, cash flows or results of operations.
Shareholder Derivative Lawsuit
On March 20, 2014, a purported shareholder derivative lawsuit captioned Wessels v. Read, et al., Case No. 1:14-cv-262486 (“Wessels”) was filed against the Company (as a nominal defendant only) and certain of the Company’s directors and officers in the Santa Clara County Superior Court of the State of California. The complaint purports to assert claims against the Company and certain individual directors and officers for breach of fiduciary duty, waste of corporate assets and unjust enrichment. The complaint seeks damages allegedly caused by alleged materially misleading statements and/or material omissions by the Company and the individual directors and officers regarding its 32nm technology and “Llano” product, which statements and omissions, the plaintiffs claim, allegedly operated to artificially inflate the price paid for the Company’s common stock during the period. On April 27, 2015, a similar purported shareholder derivative lawsuit captioned Christopher Hamilton and David Hamilton v. Barnes, et al., Case No. 5:15-cv-01890 (“Hamilton”) was filed against the Company (as a nominal defendant only) and certain of the Company’s directors and officers in the United States District Court for the Northern District of California. The case was transferred to the judge handling the Hatamian Lawsuit and is now Case No. 4:15-cv-01890. On September 29, 2015, a similar purported shareholder derivative lawsuit captioned Jake Ha v Caldwell, et al., Case No. 3:15-cv-04485 (“Ha”) was filed against the Company (as a nominal defendant only) and certain of its directors and officers in the United States District Court for the Northern District of California. The lawsuit also seeks a court order voiding the shareholder vote on AMD’s 2015 proxy. The case was transferred to the judge handling the Hatamian Lawsuit and is now Case No. 4:15-cv-04485. The Wessels, Hamilton and Ha shareholder derivative lawsuits are currently stayed.
Based upon information presently known to management, the Company believes that the potential liability, if any, will not have a material adverse effect on its financial condition, cash flows or results of operations.
The Company is named as a responsible party on Superfund clean-up orders for three sites in Sunnyvale, California that are on the National Priorities List. Since 1981, the Company has discovered hazardous material releases to the groundwater from former underground tanks and proceeded to investigate and conduct remediation at these three sites. The chemicals released into the groundwater were commonly used in the semiconductor industry in the United States in the wafer fabrication process prior to 1979.
In 1991, the Company received Final Site Clean-up Requirements Orders from the California Regional Water Quality Control Board relating to the three sites. The Company has entered into settlement agreements with other responsible parties on two of the orders. During the term of such agreements, other parties have agreed to assume most of the foreseeable costs as well as the primary role in conducting remediation activities under the orders. The Company remains responsible for additional costs beyond the scope of the agreements as well as all remaining costs in the event that the other parties do not fulfill their obligations under the settlement agreements.
To address anticipated future remediation costs under the orders, the Company has computed and recorded an estimated environmental liability of approximately
$5.1$4 million and has not recorded any potential insurance recoveries in determining the estimated costs of the cleanup. The progress of future remediation efforts cannot be predicted with certainty and these costs may change. The Company believes that any amount in addition to what has already been accrued would not be material.
The Company is a defendant or plaintiff in various actions that arose in the normal course of business. With respect to these matters, based on the management’s current knowledge, the Company believes that the amount or range of reasonably possible loss, if any, will not, either individually or in the aggregate, have a material adverse effect on the Company’s
business, consolidated financial position, results of operations, or cash flows.
NOTE 17: Restructuring and Other Special Charges, Net
2015 Restructuring Plan
In the third quarter of 2015, the Company implemented a restructuring plan (2015 Restructuring Plan) focused on its ongoing efforts to simplify its business and better align resources around its priorities and business outlook. The 2015 Restructuring Plan involves a reduction of global headcount by approximately 5% and includes organizational actions such as outsourcing certain IT services and application development. During 2015, the Company recorded a $37 million restructuring charge, which consisted of approximately $27 million of severance and benefit costs, approximately $1 million of facilities related consolidation charges and approximately $9 million of intangible asset related charges associated with the impairment of certain software licenses that have ongoing payment obligations. The 2015 Restructuring Plan resulted in total cash payments of $14 million in 2015. The Company expects the 2015 Restructuring Plan will likely result in total cash payments of approximately $14 million in 2016. The Company expects actions associated with the 2015 Restructuring Plan to be substantially completed by the end the third quarter of 2016.
The following table provides a summary of the restructuring activities during 2015 and the related liabilities recorded in Other current liabilities and Other long-term liabilities on the Company’s consolidated balance sheets as of December 26, 2015: |
| | | | | | | | | | | |
| | Severance
and related
benefits | | Other exit
related
costs | | Total |
| | (In millions) |
| Balance as of June 27, 2015 | $ | — |
| | $ | — |
| | $ | — |
|
| Charges (reversals), net | 27 |
| | 10 |
| | 37 |
|
| Cash payments | (13 | ) | | (1 | ) | | (14 | ) |
| Non-cash charges | — |
| | (9 | ) | | (9 | ) |
| Balance as of December 26, 2015 | $ | 14 |
| | $ | — |
| | $ | 14 |
|
2014 Restructuring Plan
In the fourth quarter of 2014, the Company implemented a restructuring plan (2014 Restructuring Plan) designed to improve operating efficiencies. The 2014 Restructuring Plan involved a reduction of global headcount by approximately 6% and an alignment of its real estate footprint with its reduced headcount. The Company recorded a $57 million restructuring charge in the fourth quarter of 2014, which consisted of $44 million for severance and costs related to the continuation of certain employee benefits, $6 million for contract or program termination costs, $1 million for facilities related costs and $6 million for asset impairments, a non-cash charge. During 2015, the Company recorded a $16 million restructuring charge, which consisted of $5 million non-cash charge related to asset impairments, $2 million for severance and related benefits and $9 million for facilities related costs. The 2014 Restructuring Plan was substantially completed by the end of the third quarter of 2015.
The following table provides a summary of the restructuring activities during 2015 and the related liabilities recorded in Other current liabilities and Other long-term liabilities on the Company’s consolidated balance sheets as of December 26, 2015:
|
| | | | | | | | | | | |
| | Severance and related benefits | | Other exit related costs | | Total |
| | (In millions) |
| Balance as of December 27, 2014 | $ | 26 |
| | $ | 13 |
| | $ | 39 |
|
| Charges (reversals), net | 2 |
| | 14 |
| | 16 |
|
| Cash payments | (23 | ) | | (7 | ) | | (30 | ) |
| Non-cash charges | — |
| | (5 | ) | | (5 | ) |
| Balance as of December 26, 2015 | $ | 5 |
| | $ | 15 |
| | $ | 20 |
|
In the fourth quarter of 2012, the Company implemented a restructuring plan designed to improve the Company’s cost structure and to strengthen its competitiveness in core growth areas. The plan primarily
involvesinvolved a workforce reduction of approximately 14% as well as asset impairments and facility consolidations. The Company recorded restructuring expense in the fourth quarter of 2012 of approximately $90
million. Substantially allmillion which was primarily comprised of
the restructuring expense is related toemployee severance.
Of the total restructuring expense, approximately $46 million related to cash payments in the fourth fiscal quarter of 2012, with the remaining $41 million related to anticipated cash payments in 2013. The non-cash portion of the restructuring expense included approximately $4 million of asset impairments.
2011 Restructuring Plan
In the fourth quarter of 2011,2014 and 2013, the Company initiated a restructuring plan to strengthen its competitive positioning, implement a more competitive cost structureincurred costs of $3 million and conduct a workforce rebalancing to better address faster growing market segments. The plan included a reduction of the Company’s global workforce by 13% and contract and program terminations. The Company recorded a $100$11 million, restructuring charge in the fourth quarter of 2011, which consisted of $54 million for severance and costsrespectively, related to facility consolidation and site closures, which were partially offset by the continuationrelease of certain employee benefits, $45severance costs of $2 million for contract or program termination costs and $1$5 million, for asset impairments. Inrespectively. The 2012 the Company recorded an additional $8 million for severance and costs related to the continuation of certain employee benefits. Therestructuring plan was substantially completed as of the end of the third quarter of 2013.
Dense Server Systems Business Exit
As a part of the Company’s strategy to simplify and sharpen its investment focus, the Company exited the dense server systems business, formerly SeaMicro, in the first quarter of
2012.The following table provides2015. As a summaryresult, the Company recorded a charge of the activity related to the 2012$76 million in “Restructuring and 2011 restructuring plans and the related liabilities recorded in “Other current liabilities”other special charges, net” on the Company’s consolidated balance sheets remainingstatements of operations during 2015. This charge consisted of an impairment charge of $62 million related to the acquired intangible assets. The Company concluded that the carrying value of the acquired intangible assets associated with its dense server systems business was fully impaired as the Company did not have plans to utilize the related freedom fabric technology in any of December 29, 2012:
| | | | | | | | | | | | |
| | | Severance
and related
benefits | | | Other exit
related
costs | | | Total | |
| | | (In millions) | |
Balance at December 25, 2010 | | $ | — | | | $ | — | | | $ | — | |
Charges | | | 54 | | | | 46 | | | | 100 | |
Cash payments | | | (32 | ) | | | — | | | | (32 | ) |
Non-cash charges | | | — | | | | (1 | ) | | | (1 | ) |
Balance at December 31, 2011 | | | 22 | | | | 45 | | | | 67 | |
Charges | | | 95 | | | | 5 | | | | 100 | |
Cash payments | | | (76 | ) | | | (29 | ) | | | (105 | ) |
Non-cash charges | | | — | | | | (4 | ) | | | (4 | ) |
Balance at December 29, 2012 | | $ | 41 | | | $ | 17 | | | $ | 58 | |
2008 Restructuring Plan
its future products nor did it have any plans at that time to monetize the associated intellectual property. In addition, the exit charge consisted of a $7 million non-cash charge related to asset impairments, $4 million of severance and related benefits and $3 million for contract or program termination costs. The Company expects to complete this exit activity by the end of the first quarter of 2016.
Executive Officer Separation
In the fourth quarter of 2008,2014, the Company initiatedrecorded other special charges of $13 million. The amount primarily included $10 million due to the departure of the Company’s former CEO, of which $5 million was related to cash and $5 million was related to stock-based compensation expense. The amount is recorded under “Restructuring and other special charges, net” on the consolidated statements of operations.
Sale and Leaseback Transactions
In September 2013, the Company sold a restructuring plan to reduce its cost structure,light industrial building in Singapore and leased back a portion of the original space. The Company received net proceeds of $46 million in connection with the sale, which was substantially completedresulted in 2009. Ina $17 million gain that the fourthCompany recorded in the third quarter of 2011,2013 and a $14 million deferred gain as of September 28, 2013 that is being amortized over the initial operating lease term. The initial operating lease term expires in September 2023 and provides for options to extend the operating lease for 4 years at the end of the initial lease term, and for an additional 3.5 years thereafter.
In September 2013, the Company reversed approximately $2also sold an office building in Austin, Texas. The Company received net cash proceeds of $10 million of costs associatedin connection with the 2008 restructuring plan becausesale and recorded a $5 million gain in the actual restoration costs for vacated facilities were lower than previously estimated. third quarter of 2013.
In 2010,March 2013, the Company reversed approximately $4sold and leased back land and office buildings in Austin, Texas. The Company received net cash proceeds of $164 million of costs associatedin connection with the 2008 restructuring plan because severancesale and costsrecorded a $52 million charge in the first quarter of 2013. The operating lease expires in March 2025 and provides for one 10-year optional renewal.
In March 2013, the Company also sold an office building in Markham, Ontario, Canada, and leased back a portion of the original space through June 2013. The Company received net cash proceeds of $13 million in connection with the sale and recorded a $6 million gain in the first quarter of 2013.
The net charge of $24 million in 2013 related to the
continuation of certain employee benefits were lower than previously estimated.The following table provides a summary of each major type of cost associated with the 2012, 2011 and 2008 restructuring plans through December 29, 2012:
| | | | | | | | | | | | |
| | | 2012 | | | 2011 | | | 2010 | |
| | | (In millions) | |
Severance and benefits | | $ | 95 | | | $ | 54 | | | $ | (4 | ) |
Contract or program terminations | | | — | | | | 45 | | | | — | |
Asset impairments | | | 4 | | | | 1 | | | | — | |
Facility consolidations and closures | | | 1 | | | | (2 | ) | | | — | |
Total | | $ | 100 | | | $ | 98 | | | $ | (4 | ) |
NOTE 18: | Hedging Transactions and Derivative Financial Instruments |
The following table shows the amount of gain (loss) included in accumulated other comprehensive income (loss), the amount of gain (loss) reclassified from accumulated other comprehensive income (loss) and included in earnings related to the foreign currency forward contracts designated as cash flow hedges and the amount of gain (loss) included in other income (expense), net related to contracts not designated as hedging instruments, which was allocated in the consolidated statement of operations as follows:
| | | | | | | | |
| | | 2012 | | | 2011 | |
| | | (In millions) | |
| | |
Foreign Currency Forward Contracts | | | | | | | | |
| | |
Contracts designated as cash flow hedging instruments | | | | | | | | |
| | |
Other comprehensive income (loss) | | $ | 2 | | | $ | (8 | ) |
| | |
Research and development | | | — | | | | 2 | |
| | |
Marketing, general and administrative | | | — | | | | 1 | |
| | |
Contracts not designated as hedging instruments | | | | | | | | |
| | |
Other income, net | | $ | 1 | | | $ | 5 | |
The following table shows the fair value amounts included in prepaid expenses and other current assets should the foreign currency forward contracts be in a gain position or included in accrued liabilities should these contracts be in a loss position. These amounts werereal estate transactions described above is recorded in the “Restructuring and other special charges, net” on the consolidated balance sheet as follows:
| | | | | | | | |
| | | December 29,
2012 | | | December 31,
2011 | |
| | | (In millions) | |
Foreign Currency Forward Contracts | | | | | | | | |
Contracts designated as cash flow hedging instruments | | $ | — | | | $ | (2 | ) |
Contracts not designated as hedging instruments | | $ | — | | | $ | — | |
For the foreign currency contracts designated as cash flow hedges, the ineffective portionsstatements of the hedging relationship and the amounts excluded from the assessment of hedge effectiveness were immaterial.
As of December 29, 2012 and December 31, 2011, the notional value of the Company’s outstanding foreign currency forward contracts was $142 million and $141 million, respectively. All the contracts mature within 12 months, and upon maturity the amounts recorded in accumulated other comprehensive income (loss) are expected to be reclassified into earnings. The Company hedges its exposure to the variability in future cash flows for forecasted transactions over a maximum of 12 months. As of December 29, 2012, the Company’s outstanding contracts were in a minimal net gain position. The Company is required to post collateral should the derivative contracts be in a net loss position exceeding certain thresholds. As of December 29, 2012, the Company was not required to post any collateral.
operations.
Report of Independent Registered Public Accounting Firm
The Board of Directors and Stockholders of
Advanced Micro Devices, Inc.
We have audited the accompanying consolidated balance sheets of Advanced Micro Devices, Inc. as of December
29, 201226, 2015 and December
31, 2011,27, 2014, and the related consolidated statements of operations, comprehensive
income (loss),loss, stockholders’ equity
(deficit), and cash flows for each of the three years in the period ended December
29, 2012.26, 2015. Our audits also included the financial statement schedule listed in the Index at Item
15(1)15 (1). These financial statements and schedule are the responsibility of the Company’s management. Our responsibility is to express an opinion on these financial statements and schedule based on our audits.
We conducted our audits in accordance with the standards of the Public Company Accounting Oversight Board (United States). Those standards require that we plan and perform the audit to obtain reasonable assurance about whether the financial statements are free of material misstatement. An audit includes examining, on a test basis, evidence supporting the amounts and disclosures in the financial statements. An audit also includes assessing the accounting principles used and significant estimates made by management, as well as evaluating the overall financial statement presentation. We believe that our audits provide a reasonable basis for our opinion.
In our opinion, the financial statements referred to above present fairly, in all material respects, the consolidated financial position of Advanced Micro Devices, Inc. at December
29, 201226, 2015 and December
31, 2011,27, 2014, and the consolidated results of its operations and its cash flows for each of the three years in the period ended December
29, 2012,26, 2015, in conformity with U.S. generally accepted accounting principles. Also, in our opinion, the related financial statement schedule, when considered in relation to the basic financial statements taken as a whole, presents fairly in all material respects, the information set forth therein.
We also have audited, in accordance with the standards of the Public Company Accounting Oversight Board (United States), Advanced Micro Devices, Inc.’s internal control over financial reporting as of December
29, 2012,26, 2015, based on criteria established in Internal Control-Integrated Framework issued by the Committee of Sponsoring Organizations of the Treadway Commission
(2013 framework) and our report dated February
21, 201318, 2016 expressed an unqualified opinion thereon.
.
/s/ Ernst & Young LLP
San Jose,
February
21, 201318, 2016
Report of Independent Registered Public Accounting Firm
The Board of Directors and Stockholders of
Advanced Micro Devices, Inc.
We have audited Advanced Micro Devices, Inc.’s internal control over financial reporting as of December
29, 2012,26, 2015, based on criteria established in Internal Control-Integrated Framework issued by the Committee of Sponsoring Organizations of the Treadway Commission
(2013 framework) (the COSO criteria). Advanced Micro Devices, Inc.’s management is responsible for maintaining effective internal control over financial reporting, and for its assessment of the effectiveness of internal control over financial reporting included in the accompanying Management’s Report on Internal Controls over Financial Reporting. Our responsibility is to express an opinion on the company’s internal control over financial reporting based on our audit.
We conducted our audit in accordance with the standards of the Public Company Accounting Oversight Board (United States). Those standards require that we plan and perform the audit to obtain reasonable assurance about whether effective internal control over financial reporting was maintained in all material respects. Our audit included obtaining an understanding of internal control over financial reporting, assessing the risk that a material weakness exists, testing and evaluating the design and operating effectiveness of internal control based on the assessed risk, and performing such other procedures as we considered necessary in the circumstances. We believe that our audit provides a reasonable basis for our opinion.
A company’s internal control over financial reporting is a process designed to provide reasonable assurance regarding the reliability of financial reporting and the preparation of financial statements for external purposes in accordance with generally accepted accounting principles. A company’s internal control over financial reporting includes those policies and procedures that (1) pertain to the maintenance of records that, in reasonable detail, accurately and fairly reflect the transactions and dispositions of the assets of the company; (2) provide reasonable assurance that transactions are recorded as necessary to permit preparation of financial statements in accordance with generally accepted accounting principles, and that receipts and expenditures of the company are being made only in accordance with authorizations of management and directors of the company; and (3) provide reasonable assurance regarding prevention or timely detection of unauthorized acquisition, use, or disposition of the company’s assets that could have a material effect on the financial statements.
Because of its inherent limitations, internal control over financial reporting may not prevent or detect misstatements. Also, projections of any evaluation of effectiveness to future periods are subject to the risk that controls may become inadequate because of changes in conditions, or that the degree of compliance with the policies or procedures may deteriorate.
In our opinion, Advanced Micro Devices, Inc. maintained, in all material respects, effective internal control over financial reporting as of December
29, 201226, 2015 based on the COSO criteria.
We also have audited, in accordance with the standards of the Public Company Accounting Oversight Board (United States), the consolidated balance sheets of Advanced Micro Devices, Inc. as of December
29, 201226, 2015 and December
31, 201127, 2014, and the related consolidated statements of operations, comprehensive
income (loss),loss, stockholders’ equity
(deficit), and cash flows for each of the three years in the period ended December
29, 2012,26, 2015 and schedule of Advanced Micro Devices, Inc., and our report dated February
21, 201318, 2016 expressed an unqualified opinion thereon.
/s/ Ernst & Young LLP
San Jose,
February
21, 201318, 2016
Supplementary Financial Information
(unaudited)
The Company uses a 52 or 53 week fiscal year ending on the last Saturday in December. All quarters of 20122015 and 2011 except the first quarter of 20112014 consisted of 13 weeks; the first quarter of 2011 consisted of 14 weeks. | | | | | | | | | | | | | | | | | | | | | | | | | | | | | | | | |
| | | (In millions, except per share amounts) | |
| | | 2012 | | | 2011 | |
| | | Dec. 29 | | | Sep. 29 | | | Jun. 30 | | | Mar. 31 | | | Dec. 31 | | | Oct. 1 | | | Jul. 2 | | | Apr. 2 | |
Net revenue | | $ | 1,155 | | | $ | 1,269 | | | $ | 1,413 | | | $ | 1,585 | | | $ | 1,691 | | | $ | 1,690 | | | $ | 1,574 | | | $ | 1,613 | |
Cost of sales(1) | | | 977 | | | | 877 | | | | 775 | | | | 1,558 | | | | 918 | | | | 934 | | | | 854 | | | | 922 | |
Gross margin | | | 178 | | | | 392 | | | | 638 | | | | 27 | | | | 773 | | | | 756 | | | | 720 | | | | 691 | |
Research and development | | | 313 | | | | 328 | | | | 345 | | | | 368 | | | | 358 | | | | 361 | | | | 367 | | | | 367 | |
Marketing, general and administrative | | | 193 | | | | 188 | | | | 212 | | | | 230 | | | | 243 | | | | 249 | | | | 239 | | | | 261 | |
Amortization of acquired intangible assets | | | 4 | | | | 4 | | | | 4 | | | | 1 | | | | 3 | | | | 8 | | | | 9 | | | | 9 | |
Restructuring charges, net(2) | | | 90 | | | | 3 | | | | — | | | | 8 | | | | 98 | | | | — | | | | — | | | | — | |
Operating income | | | (422 | ) | | | (131 | ) | | | 77 | | | | (580 | ) | | | 71 | | | | 138 | | | | 105 | | | | 54 | |
Interest income | | | 2 | | | | 2 | | | | 2 | | | | 2 | | | | 2 | | | | 3 | | | | 2 | | | | 3 | |
Interest expense | | | (45 | ) | | | (44 | ) | | | (43 | ) | | | (43 | ) | | | (43 | ) | | | (42 | ) | | | (47 | ) | | | (48 | ) |
Other income (expense), net | | | (4 | ) | | | 16 | | | | (5 | ) | | | (1 | ) | | | (207 | )(3) | | | (7 | ) | | | 4 | | | | 11 | |
Income before equity income (loss) and dilution gain in investee and income taxes | | | (469 | ) | | | (157 | ) | | | 31 | | | | (622 | ) | | | (177 | ) | | | 92 | | | | 64 | | | | 20 | |
Provision (benefit) for income taxes | | | 4 | | | | — | | | | (6 | ) | | | (32 | )(4) | | | (4 | ) | | | (5 | ) | | | 3 | | | | 2 | |
Equity income (loss) and dilution gain in investee, net(5) | | | — | | | | — | | | | — | | | | — | | | | — | | | | — | | | | — | | | | 492 | |
Net income (loss) from continuing operations | | | (473 | ) | | | (157 | ) | | | 37 | | | | (590 | ) | | | (173 | ) | | | 97 | | | | 61 | | | | 510 | |
Loss from discontinued operations, net of tax | | | — | | | | — | | | | — | | | | — | | | | (4 | ) | | | — | | | | — | | | | — | |
Net income (loss) | | | (473 | ) | | | (157 | ) | | | 37 | | | | (590 | ) | | | (177 | ) | | | 97 | | | | 61 | | | | 510 | |
Net income (loss) per share | | | | | | | | | | | | | | | | | | | | | | | | | | | | | | | | |
Basic | | | | | | | | | | | | | | | | | | | | | | | | | | | | | | | | |
Continuing operations | | $ | (0.63 | ) | | $ | (0.21 | ) | | $ | 0.05 | | | $ | (0.80 | ) | | $ | (0.24 | ) | | $ | 0.13 | | | $ | 0.08 | | | $ | 0.71 | |
Discontinued operations | | | — | | | | — | | | | — | | | | — | | | | (0.01 | ) | | | — | | | | — | | | | — | |
Basic net income (loss) per share | | $ | (0.63 | ) | | $ | (0.21 | ) | | $ | 0.05 | | | $ | (0.80 | ) | | $ | (0.24 | ) | | $ | 0.13 | | | $ | 0.08 | | | $ | 0.71 | |
Diluted | | | | | | | | | | | | | | | | | | | | | | | | | | | | | | | | |
Continuing operations | | $ | (0.63 | ) | | $ | (0.21 | ) | | $ | 0.05 | | | $ | (0.80 | ) | | $ | (0.24 | ) | | $ | 0.13 | | | $ | 0.08 | | | $ | 0.68 | |
Discontinued operations | | | — | | | | — | | | | — | | | | — | | | | (0.01 | ) | | | — | | | | — | | | | — | |
Diluted net income (loss) per share | | $ | (0.63 | ) | | $ | (0.21 | ) | | $ | 0.05 | | | $ | (0.80 | ) | | $ | (0.24 | ) | | $ | 0.13 | | | $ | 0.08 | | | $ | 0.68 | |
Shares used in per share calculation | | | | | | | | | | | | | | | | | | | | | | | | | | | | | | | | |
Basic | | | 747 | | | | 745 | | | | 739 | | | | 734 | | | | 732 | | | | 729 | | | | 724 | | | | 720 | |
Diluted | | | 747 | | | | 745 | | | | 755 | | | | 734 | | | | 732 | | | | 741 | | | | 743 | | | | 764 | |
|
| | | | | | | | | | | | | | | | | | | | | | | | | | | | | | | |
| | (In millions, except per share amounts) |
| 2015 | | 2014 |
| Dec. 26 | | Sep. 26 | | Jun. 27 | | Mar. 28 | | Dec. 27 | | Sep. 27 | | Jun. 28 | | Mar. 29 |
| Net revenue | $ | 958 |
| | $ | 1,061 |
| | $ | 942 |
| | $ | 1,030 |
| | $ | 1,239 |
| | $ | 1,429 |
| | $ | 1,441 |
| | $ | 1,397 |
|
Cost of sales (1) | 675 |
| | 822 |
| | 710 |
| | 704 |
| | 879 |
| | 935 |
| | 943 |
| | 910 |
|
| Gross margin | 283 |
| | 239 |
| | 232 |
| | 326 |
| | 360 |
| | 494 |
| | 498 |
| | 487 |
|
| Research and development | 229 |
| | 241 |
| | 235 |
| | 242 |
| | 238 |
| | 278 |
| | 277 |
| | 279 |
|
| Marketing, general and administrative | 109 |
| | 108 |
| | 134 |
| | 131 |
| | 144 |
| | 150 |
| | 154 |
| | 156 |
|
| Amortization of acquired intangible assets | — |
| | — |
| | — |
| | 3 |
| | 4 |
| | 3 |
| | 4 |
| | 3 |
|
Restructuring and other special charges (gains), net (2) | (6 | ) | | 48 |
| | — |
| | 87 |
| | 71 |
| | — |
| | — |
| | — |
|
Goodwill impairment charge(3) | — |
| | — |
| | — |
| | — |
| | 233 |
| | — |
| | — |
| | — |
|
| Operating income (loss) | (49 | ) | | (158 | ) | | (137 | ) | | (137 | ) | | (330 | ) | | 63 |
| | 63 |
| | 49 |
|
| Interest expense | (41 | ) | | (39 | ) | | (40 | ) | | (40 | ) | | (41 | ) | | (43 | ) | | (46 | ) | | (47 | ) |
| Other income (expense), net | (2 | ) | | — |
| | (3 | ) | | — |
| | 4 |
| | (1 | ) | | (49 | ) | | (20 | ) |
| Income (loss) before income taxes | (92 | ) | | (197 | ) | | (180 | ) | | (177 | ) | | (367 | ) | | 19 |
| | (32 | ) | | (18 | ) |
| Provision (benefit) for income taxes | 10 |
| | — |
| | 1 |
| | 3 |
| | (3 | ) | | 2 |
| | 4 |
| | 2 |
|
| Net income (loss) | $ | (102 | ) | | $ | (197 | ) | | $ | (181 | ) | | $ | (180 | ) | | $ | (364 | ) | | $ | 17 |
| | $ | (36 | ) | | $ | (20 | ) |
| Net income (loss) per share | | | | | | | | | | | | | | | |
| Basic | $ | (0.13 | ) | | $ | (0.25 | ) | | $ | (0.23 | ) | | $ | (0.23 | ) | | $ | (0.47 | ) | | $ | 0.02 |
| | $ | (0.05 | ) | | $ | (0.03 | ) |
| Diluted | $ | (0.13 | ) | | $ | (0.25 | ) | | $ | (0.23 | ) | | $ | (0.23 | ) | | $ | (0.47 | ) | | $ | 0.02 |
| | $ | (0.05 | ) | | $ | (0.03 | ) |
| Shares used in per share calculation | | | | | | | | | | | | | | | |
| Basic | 791 |
| | 785 |
| | 778 |
| | 777 |
| | 776 |
| | 770 |
| | 764 |
| | 761 |
|
| Diluted | 791 |
| | 785 |
| | 778 |
| | 777 |
| | 776 |
| | 785 |
| | 764 |
| | 761 |
|
| |
(1) | During 2015, the Company recorded a technology node transition charge of $33 million in the second quarter and an inventory write-down of $65 million in the third quarter. During the fourth quarter of 2014, the Company recorded a lower of cost or market charge of $58 million related to our second-generation APU products. |
| |
(2) | Under the 2014 restructuring plan, the Company recorded restructuring and other special charges, net of $71 million, $12 million and $6 million in fourth quarter of 2014, first quarter of 2015, respectively, and third quarter of 2015, and a restructuring charge reversal of $2 million in fourth quarter of 2015. During the first quarter of 2012,2015, the Company exited the dense server systems business and recorded restructuring and other special charges, net of $75 million in first quarter of 2015 and $1 million in third quarter of 2015. Under the 2015 restructuring plan, the Company recorded a charge related to the limited waiverrestructuring and other special charges, net of exclusivity from GF of $703 million. During the$41 million in third quarter of 2012, the Company recorded2015 and a $100restructuring charge reversal of $4 million inventory write-down due to weaker than expected demand for certain products. in fourth quarter of 2015. |
| |
(3) | During the fourth quarter of 2012,2014, the Company recorded a lower cost or market charge of $273 million related to GF’s waiver of a portion of our wafer purchase commitments for the fourth quarter of 2012. |
(2) | During the fourth quarters of 2012 and 2011, the Company implemented restructuring plans and incurred net restructuring charges of $90 million and $100 million, which primarily included severance and related employee benefits.
|
(3) | During the fourth quarter of 2011, the Company recorded a non-cashgoodwill impairment charge of approximately $209 million related to its investment in GF.
|
(4) | During the first quarter of 2012, the Company recorded an income tax provision benefit of $32$233 million relating to the SeaMicro acquisition.
its Computing and Graphics segment. |
(5) | As of the beginning of 2011, the Company changed the method of accounting for its investment GF from the equity method to the cost method of accounting. As a result of the change, the Company recognized a non-cash gain of approximately $492 million in the first quarter of 2011, net of certain transaction related charges.
|
| |
| ITEM 9. | CHANGES IN AND DISAGREEMENTS WITH ACCOUNTANTS ON ACCOUNTING AND FINANCIAL DISCLOSURE |
| |
| ITEM 9A. | CONTROLS AND PROCEDURES |
Disclosure Controls and Procedures
We maintain disclosure controls and procedures that are designed with the objective of providing reasonable assurance that information required to be disclosed in our reports filed under the Exchange Act, such as this Annual Report on Form 10-K is recorded, processed, summarized and reported within the time periods specified in the SEC’s rules and forms, and that such information is accumulated and communicated to our management, including our Chief Executive Officer and Chief Financial Officer, as appropriate, to allow timely decisions regarding required disclosure. In designing and evaluating our disclosure controls and procedures, our management recognizes that any controls and procedures, no matter how well designed and operated, can provide only reasonable assurance of achieving the desired control objectives, and our management is required to apply its judgment in evaluating the cost-benefit relationship of possible controls and procedures.
As of December
29, 2012,26, 2015, the end of the period covered by this report, we carried out an evaluation, under the supervision and with the participation of our management, including our Chief Executive Officer and Chief Financial Officer, of the effectiveness of the design and operation of our disclosure controls and procedures pursuant to Exchange Act Rules 13a-15(e) and 15d-15(e). This type of evaluation is performed on a quarterly basis so that conclusions of management, including our Chief Executive Officer and Chief Financial Officer, concerning the effectiveness of the disclosure controls can be reported in our periodic reports on Form 10-Q and Form 10-K. The overall goals of these evaluation activities are to monitor our disclosure controls and to modify them as necessary. We intend to maintain the disclosure controls as dynamic systems that we adjust as circumstances merit. Based on the foregoing, our Chief Executive Officer and Chief Financial Officer concluded that our disclosure controls and procedures were effective at the reasonable assurance level as of the end of the period covered by this report.
Management’s Report on Internal Control over Financial Reporting
Internal control over financial reporting refers to the process designed by, or under the supervision of, our Chief Executive Officer and Chief Financial Officer, and effected by our Board of Directors, management and other personnel, to provide reasonable assurance regarding the reliability of financial reporting and the preparation of financial statements for external purposes in accordance with U.S. generally accepted accounting principles, and includes those policies and procedures that:
(1) Pertain to the maintenance of records that in reasonable detail accurately and fairly reflect the transactions and dispositions of the assets of the Company;
(2) Provide reasonable assurance that transactions are recorded as necessary to permit preparation of financial statements in accordance with U.S. generally accepted accounting principles, and that receipts and expenditures of the Company are being made only in accordance with authorizations of management and directors of the Company; and
(3) Provide reasonable assurance regarding prevention or timely detection of unauthorized acquisition, use or disposition of the Company’s assets that could have a material effect on the financial statements.
Internal control over financial reporting cannot provide absolute assurance of achieving financial reporting objectives because of its inherent limitations. Internal control over financial reporting is a process that involves human diligence and compliance and is subject to lapses in judgment and breakdowns resulting from human
failures. Internal control over financial reporting also can be circumvented by collusion or improper management override. Because of such limitations, there is a risk that material misstatements may not be prevented or detected on a timely basis by internal control over financial reporting. However, these inherent limitations are known features of the financial reporting process. Therefore, it is possible to design into the process safeguards to reduce, though not eliminate, this risk. Management is responsible for establishing and maintaining adequate internal control over financial reporting for the Company.
Management has used the
2013 framework set forth in the report entitled “Internal Control—Integrated Framework” published by the Committee of Sponsoring Organizations of the Treadway Commission to evaluate the effectiveness of the Company’s internal control over financial reporting. Management has concluded that the Company’s internal control over financial reporting was effective as of December
29, 201226, 2015 at the reasonable assurance level. Our independent registered public accounting firm, Ernst & Young LLP, has issued an attestation report on the Company’s internal control over financial reporting as of December
29, 2012,26, 2015, which is included in Part II, Item 8, above.
Changes in Internal Control over Financial Reporting
There has been no change in our internal controls over financial reporting during our most recently completed fiscal quarter that has materially affected, or is reasonably likely to materially affect, our internal controls over financial reporting.
| |
| ITEM 9B. | OTHER INFORMATION |
| |
| ITEM 10. | DIRECTORS, EXECUTIVE OFFICERS AND CORPORATE GOVERNANCE |
The information under the captions “Item 1—Election of
Directors,” “Item 1—ConsiderationDirectors” (including “Consideration of Stockholder Nominees for
Director,”Director”), “Corporate Governance,” “Meetings and Committees of the Board of Directors,” “Executive Officers” and “Section 16(a) Beneficial Ownership Reporting Compliance” in our
2013proxy statement for our 2016 annual meeting of stockholders (our 2016 Proxy
StatementStatement) is incorporated herein by reference. There were no material changes to the procedures by which stockholders may recommend nominees to our board of directors. See also,
Part“Part 1, Item
1 “Website1-Web Site Access to Company Reports and Corporate Governance Documents,” above.
| |
| ITEM 11. | EXECUTIVE COMPENSATION |
The information under the captions “Directors’ Compensation and
Benefits,” “2012Benefits” (including “2015 Non-Employee Director
Compensation,”Compensation”), “Compensation Discussion
&and Analysis,
” “Compensation Committee Report,” “Compensation Policies and Practices,” “Executive Compensation” (including
2012“2015 Summary Compensation Table,
2012” “2015 Nonqualified Deferred Compensation,
Outstanding” “Outstanding Equity Awards at
20122015 Fiscal Year-End,
Grants” “Grants of Plan-Based Awards in
20122015” and
Option“Option Exercises and Stock Vested in
2012),2015”) and
“Change“Severance and Change in Control Arrangements” in our
20132016 Proxy Statement is incorporated herein by reference.
| |
| ITEM 12. | SECURITY OWNERSHIP OF CERTAIN BENEFICIAL OWNERS AND MANAGEMENT AND RELATED STOCKHOLDER MATTERS |
The information under the captions “Principal Stockholders,” “Security Ownership of Directors and Executive Officers” and “Equity Compensation Plan Information” in our
20132016 Proxy Statement is incorporated herein by reference.
| |
| ITEM 13. | CERTAIN RELATIONSHIPS AND RELATED TRANSACTIONS AND DIRECTOR INDEPENDENCE |
The information under the captions “Corporate Governance—Independence of
Directors,”Directors” and “Certain Relationships and Related Transactions” in our
20132016 Proxy Statement is incorporated herein by reference.
| |
| ITEM 14. | PRINCIPAL ACCOUNTING FEES AND SERVICES |
The information under the captions “Item 2—Ratification of Appointment of Independent Registered Public Accounting Firm—Independent Registered Public Accounting Firm’s Fees” in our
20132016 Proxy Statement is incorporated herein by reference.
With the exception of the information specifically incorporated by reference in Part III of this Annual Report on Form 10-K from our
20132016 Proxy Statement, our
20132016 Proxy Statement
shallwill not be deemed to be filed as part of this report. Without limiting the foregoing, the information under the captions “Compensation Committee Report” and “Audit Committee Report” in our
20132016 Proxy Statement is not incorporated by reference in this Annual Report on Form 10-K.
| |
| ITEM 15. | EXHIBITS, FINANCIAL STATEMENT SCHEDULES |
1. Financial Statements
The financial statements of AMD are set forth in Item 8 of this
reportAnnual Report on Form 10-K.
Other than Schedule II, all other schedules have been omitted because the required information is not present or is not present in amounts sufficient to require submission of the schedules or because the information required is included in the Consolidated Financial Statements or
Notes thereto.related notes.
2. Exhibits
The exhibits listed in the accompanying Index to Exhibits are filed as part of, or incorporated by reference into, this Annual Report on Form 10-K. The following is a list of such Exhibits:
|
| | | | | |
| �� | Exhibit
Number | Description of Exhibits |
|
| | Description of Exhibits |
| |
**2.1 | | Asset Purchase Agreement by and among Broadcom Corporation, Broadcom International Limited, and Advanced Micro Devices, Inc., dated August 25, 2008 filed as Exhibit 2.1 to AMD’s Quarterly Report on Form 10-Q for the period ended September 27, 2008, is hereby incorporated by reference. |
| 3.1 | |
**2.2 | | Amendment No. 1 to Asset Purchase Agreement by and among Broadcom Corporation, Broadcom International Limited, and Advanced Micro Devices, Inc., dated October 27, 2008 filed as Exhibit 2.2 to AMD’s Quarterly Report on Form 10-Q for the period ended September 27, 2008, is hereby incorporated by reference. |
| |
3.1
| | Amended and Restated Certificate of Incorporation of Advanced Micro Devices, Inc., dated May 8, 2007, filed as Exhibit 3.1 to AMD’s Quarterly Report on Form 10-Q for the period ended March 31, 2007, is hereby incorporated by reference. |
| | | | |
| | | 3.2 |
| | Advanced Micro Devices, Inc. Amended and Restated Bylaws, as amended on July 30, 2009, filed as Exhibit 3.1 to AMD’s Current Report on Form 8-K dated July 30, 2009, are hereby incorporated by reference. |
| | | | |
| | | 4.1 |
| | AMD hereby agrees to file on request of the SEC a copy of all instruments not otherwise filed with respect to AMD’s long-term debt or any of its subsidiaries for which the total amount of securities authorized under such instruments does not exceed 10 percent of the total assets of AMD and its subsidiaries on a consolidated basis. |
| | | | |
| | 4.2 |
| | Indenture governing 6.00% Convertible Senior Notes due 2015, dated April 27, 2007including the Form of 6.00% Senior Note due 2015, between Advanced Micro Devices, Inc. and Wells Fargo Bank, N.A., dated April 27, 2007, filed as Exhibit 4.1 to AMD’s Current Report on Form 8-K dated April 24, 2007, is hereby incorporated by reference. |
| | | | |
4.2 | | Form of 6.00% Senior Note due 2015, filed as Exhibit 4.1 to AMD’s Form 8-K dated April 24, 2007, is hereby incorporated by reference. |
| 4.3 | |
4.3
| | Indenture Includinggoverning 7.75% Senior Notes due 2020, including the Form of 8.125%7.75% Note, dated November 30, 2009 between Advanced Micro Devices, Inc. and Wells Fargo Bank, National AssociationN.A., dated August 4, 2010, filed as Exhibit 4.1 to AMD’s Current Report on Form 8-K dated December 1, 2009,August 4, 2010, is hereby incorporated by reference. |
| | | | |
| | | 4.4 |
| | Indenture governing 7.75%7.50% Senior Notes due 2020, Including2022, including the Form of 7.75%7.50% Note, dated August 4, 2010 between Advanced Micro Devices, Inc. and Wells Fargo Bank, N.A., dated as of August 15, 2012, filed as Exhibit 4.1 to AMD’s Form 8-K dated August 4, 2010, is hereby incorporated by reference. |
| |
4.5 | | Indenture governing 7.50% Senior Notes due 2022, Including the Form of 7.50% Note dated as of August 15, 2012 between Advanced Micro Devices, Inc. and Wells Fargo Bank, N.A filed as Exhibit 4.1 to AMD’sCurrent Report on Form 8-K dated August 15, 2012, is hereby incorporated by reference. |
| | | | |
*10.1 | | Forms4.5 |
| | Indenture governing the 6.75% Senior Notes due 2019, including the form of Stock Option Agreements,the 6.75% Note, between Advanced Micro Devices, Inc. and Wells Fargo, N.A., as Trustee, dated February 26, 2014, filed as Exhibit 10.84.1 to AMD’s AnnualCurrent Report on Form 10-K for the fiscal year ended December 29, 1991, are hereby incorporated by reference. |
| | |
Exhibit
Number | | Description of Exhibits |
| |
*10.2 | | Forms of Restricted Stock Agreements, filed as Exhibit 10.11 to AMD’s Annual Report on Form 10-K for the fiscal year ended December 29, 1991, are8-K dated February 26, 2014 is hereby incorporated by reference. |
| | | | |
| | 4.6 |
| | Indenture governing 7.00% Senior Notes due 2024, including the Form of 7.00% Senior Note due 2024, between Advanced Micro Devices, Inc. and Wells Fargo Bank, N.A., dated June 16, 2014, filed as Exhibit 4.1 to AMD’s Current Report on Form 8-K dated June 16, 2014, is hereby incorporated by reference. |
| | | | |
| | 4.7 |
| | First Supplemental Indenture by and among Advanced Micro Devices, Inc. and Wells Fargo Bank N.A., dated June 20,2014, filed as Exhibit 4.1 to AMD’s Current Report on Form 8-K dated June 23, 2014, is hereby incorporated by reference. |
| | | | |
|
| | | | |
*10.3 | 4.8 |
| | Outside Director Equity Compensation Policy, adopted March 22, 2006, amendedAmendment to Indenture governing 6.75% Senior Notes due 2019, between Advanced Micro Devices, Inc. and restated as of May 3, 2007, November 1, 2007, February 12, 2009 and October 20, 2011Wells Fargo Bank, N.A., dated June 16, 2014, filed as Exhibit 10.24.1 to AMD’s Quarterly Report on Form 10-Q for the fiscal quarter ended March 31, 2012,September 27, 2014, is hereby incorporated by reference. |
| | | |
*10.4 | *10.1 |
| | AMD 1996 Stock Incentive Plan, as amended, filed as Exhibit 10.58 to AMD’s Quarterly Report on Form 10-Q for the period ended June 29, 2003, is hereby incorporated by reference. |
| | | |
| *10.2 |
| | 1998 Stock Incentive Plan, as amended, filed as Exhibit 10.32 to AMD’s Quarterly Report on Form 10-Q for the fiscal quarter ended June 29, 2003, is hereby incorporated by reference. |
| | | |
| *10.3 |
| | 2000 Stock Incentive Plan, as amended, filed as Exhibit 10.12 to AMD’s Quarterly Report on Form 10-Q for the fiscal quarter ended June 29, 2003, is hereby incorporated by reference |
| | | |
| *10.4 |
| | 2004 Equity Incentive Plan, as amended and restated, filed as Exhibit 10.1 to AMD’s Registration Statement on Form S-8 filed with the SEC on May 15, 2014, is hereby incorporated by reference |
| | |
| *10.5 |
| | 2011 Executive Incentive Plan, filed as Exhibit 10.2 to AMD’s Quarterly Report on Form 10-Q for the period ended April 2, 2011, is hereby incorporated by reference. |
| | | |
*10.5 | *10.6 |
| | 1995 Stock Plan of NexGen, Inc., as amended, filed as Exhibit 10.37 to AMD’s Quarterly Report on Form 10-Q for the fiscal quarter ended June 30, 1996, is hereby incorporated by reference. |
| | | |
| *10.7 |
| | ATI Technologies Inc. Share Option Plan, as amended effective January 25, 2005, filed as Exhibit 99.3 to AMD’s Registration Statement on Form S-8 filed with the SEC on October 30, 2006, is hereby incorporated by reference. |
| | | |
| *10.8 |
| | SeaMicro, Inc. Amended and Restated 2007 Equity Incentive Plan, filed as Exhibit 10.1 on AMD’s Registration Statement on Form S-8, filed with the SEC on March 23, 2012, is hereby incorporated by reference. |
| | | |
| *10.9 |
| | AMD’s U.S. Stock Option Program for options grantedOptions Granted after April 25, 2000, filed as Exhibit 10.14 to AMD’s Annual Report on Form 10-K for the fiscal year ended December 31, 2000, is hereby incorporated by reference. |
| | | |
*10.6 | *10.10 |
| | Advanced Micro Devices, Inc. 2011 ExecutiveAMD’s Stock Option Program for Employees Outside the U.S. for Options Granted after April 25, 2000, filed as Exhibit 10.24 to AMD’s Annual Report on Form 10-K for the fiscal year ended December 31, 2000, is hereby incorporated by reference. |
| | | |
| *10.11 |
| | AMD’s U.S. Stock Option Program for Options Granted after April 24, 2001, filed as Exhibit 10.23(a) to AMD’s Annual Report on Form 10-K for the fiscal year ended December 30, 2001, is hereby incorporated by reference. |
| | | |
| *10.12 |
| | Form of Stock Option Agreement (U.S.) under the 2004 Equity Incentive Plan, approvedfiled as Exhibit 10.1 to AMD’s Quarterly Report on Form 10-Q for the period ended June 27, 2009, is hereby incorporated by reference. |
| | | |
| *10.13 |
| | Form of Stock Option Agreement (Non-U.S.) under the Board of Directors on February 3, 2011, approved by the Stockholders on May 3, 2011,2004 Equity Incentive Plan, filed as Exhibit 10.2 to AMD’s Quarterly Report on Form 10-Q for the period ended April 2, 2011,June 27, 2009, is hereby incorporated by reference. |
| | | |
| *10.14 |
| | Form of Stock Option Agreement (U.S. Senior Vice Presidents and Above) under the 2004 Equity Incentive Plan, filed as Exhibit 10.2 to AMD’s Quarterly Report on Form 10-Q for the period ended June 26, 2010, is hereby incorporated by reference. |
| | | |
| *10.15 |
| | Form of Stock Option Agreement (Non-U.S. Senior Vice Presidents and Above) under the 2004 Equity Incentive Plan, filed as Exhibit 10.2 to AMD’s Quarterly Report on Form 10-Q for the period ended June 26, 2010, is hereby incorporated by reference. |
| | | |
| *10.16 |
| | Form of Restricted Stock Unit Agreement (U.S.) under the 2004 Equity Incentive Plan, filed as Exhibit 10.4 to AMD’s Quarterly Report on Form 10-Q for the period ended October 1, 2006, is hereby incorporated by reference. |
| | | |
| *10.17 |
| | Form of Restricted Stock Unit Agreement (Non-U.S.) under the 2004 Equity Incentive Plan, filed as Exhibit 10.3 to AMD’s Quarterly Report on Form 10-Q for the period ended June 27, 2009, is hereby incorporated by reference. |
|
| | | | |
*10.7 | | | |
| *10.18 |
| | Form of Restricted Stock Unit Agreement (U.S. Senior Vice Presidents and Above) under the 2004 Equity Plan, filed as Exhibit 10.4 to AMD’s Quarterly Report on Form 10-Q for the period ended June 26, 2010, is hereby incorporated by reference. |
| | | |
| *10.19 |
| | Form of Restricted Stock Unit Agreement (Non-U.S. Senior Vice Presidents and Above) under the 2004 Equity Plan, filed as Exhibit 10.4 to AMD’s Quarterly Report on Form 10-Q for the period ended June 26, 2010, is hereby incorporated by reference. |
| | | |
| *10.20 |
| | Form of Performance-Based Restricted Stock Unit Agreement (U.S. Senior Vice Presidents and Above) under the 2004 Equity Incentive Plan, filed as Exhibit 10.4 to AMD’s Quarterly Report on Form 10-Q for the period ended June 26, 2010, is hereby incorporated by reference. |
| | | |
| *10.21 |
| | Outside Director Equity Compensation Policy, amended and restated as of May 8, 2014, filed as Exhibit 10.1 to AMD’s Quarterly Report on Form 10-Q for the fiscal quarter ended June 28, 2014, is hereby incorporated by reference. |
| | | |
| *10.22 |
| | AMD Executive Severance Plan and Summary Plan Description for Senior Vice Presidents, effective June 1, 2013, filed as Exhibit 10.1 to AMD’s Current Report on Form 8-K dated June 7, 2013, is hereby incorporated by reference. |
| | | |
| *10.23 |
| | Guidelines for Business Aircraft Usage And Commercial Travel By Personal Guests, revised as of May 16, 2013, filed as Exhibit 10.1 to AMD’s Quarterly Report on Form 10-Q for the period ended June 29, 2013, is hereby incorporated by reference. |
| | | |
| *10.24 |
| | AMD Deferred Income Account Plan, as amended and restated, effective January 1, 2008, filed as Exhibit 10.18 to AMD’s Annual Report on Form 10-K for the fiscal year ended December 29, 2007, is hereby incorporated by reference. |
| | | |
| *10.25 |
| | Amendment No. 1 to the AMD Deferred Income Account Plan, as amended and restated, effective July 1, 2012, filed as Exhibit 10.16(a) to AMD’s Annual Report on Form 10-K for the period ended December 29, 2012, is hereby incorporated by reference. |
| | | |
| *10.26 |
| | Form of Indemnity Agreement, between Advanced Micro Devices, Inc. and its officers and directors, filed as Exhibit 10.1 to AMD’s Current Report on Form 8-K dated October 6, 2008, is hereby incorporated by reference. |
| | | |
| *10.27 |
| | Form of Management Continuity Agreement, as amended and restated, filed as Exhibit 10.13(b) to AMD’s Annual Report on Form 10-K for the fiscal year ended December 29, 2007, is hereby incorporated by reference. |
| | | |
*10.8 | *10.28 |
| | Form of Change in Control Agreement, filed as Exhibit 10.11 to AMD’s Annual Report on Form 10-K for the fiscal year ended December 26, 2009, is hereby incorporated by reference. |
| | | |
*10.9 | | AMD’s Stock Option Program for Employees Outside the U.S. for options granted after April 25, 2000, filed as Exhibit 10.24 to AMD’s Annual Report on Form 10-K for the fiscal year ended December 31, 2000, is hereby incorporated by reference. |
| |
*10.10 | | AMD’s U.S. Stock Option Program for options granted after April 24, 2001, filed as Exhibit 10.23(a) to AMD’s Annual Report on Form 10-K for the fiscal year ended December 30, 2001, is hereby incorporated by reference. |
| |
*10.11 | | Fourth Amended and Restated Advanced Micro Devices, Inc. 2004 Equity Incentive Plan is hereby incorporated by reference from Definitive Proxy Statement on Schedule 14A filed with the SEC on March 15, 2012. |
| |
*10.12 | | Form of Stock Option Agreement U.S. 2004 Equity Incentive Plan Stock Option Grant Notice filed as Exhibit 10.1 to AMD’s Quarterly Report on Form 10-Q for the period ended June 27, 2009, is hereby incorporated by reference. |
| |
*10.13 | | Form of Stock Option Agreement Non-U.S. Stock Option Award Advanced Micro Devices, Inc. 2004 Equity Incentive Plan filed as Exhibit 10.2 to AMD’s Quarterly Report on Form 10-Q for the period ended June 27, 2009, is hereby incorporated by reference. |
| |
*10.14 | | Form of Restricted Stock Unit Agreement Non-U.S. Restricted Stock Unit Award Advanced Micro Devices, Inc. 2004 Equity Incentive Plan filed as Exhibit 10.3 to AMD’s Quarterly Report on Form 10-Q for the period ended June 27, 2009, is hereby incorporated by reference. |
| |
*10.15 | | Form of Terms and Conditions For Participants Located in the U.S. Restricted Stock Unit Award (2004 Equity Incentive Plan) filed as Exhibit 10.4 to AMD’s Quarterly Report on Form 10-Q for the period ended October 1, 2006, is hereby incorporated by reference. |
| |
*10.16 | | Advanced Micro Devices, Inc. Deferred Income Account Plan, amended and restated, effective as of January 1, 2008 filed as Exhibit 10.18 to AMD’s Annual Report on Form 10-K for the fiscal year ended December 29, 2007 is hereby incorporated by reference. |
| | |
Exhibit
Number | | Description of Exhibits |
| |
*10.16(a) | | Amendment No. 1 to the Advanced Micro Devices, Inc. Deferred Income Account Plan, as amended and restated. |
| |
*10.17 | | Form of Stock Option Agreement for AMD’s US Senior Vice Presidents and Above filed as Exhibit 10.1 to AMD’s Quarterly Report on Form 10-Q for the period ended June 26, 2010, is hereby incorporated by reference. |
| |
*10.18 | | Form of Stock Option Agreement for AMD’s Non-US Senior Vice Presidents and Above filed as Exhibit 10.2 to AMD’s Quarterly Report on Form 10-Q for the period ended June 26, 2010, is hereby incorporated by reference. |
| |
*10.19 | | Form of Restricted Stock Unit Agreement for AMD’s US Senior VPs and Above filed as Exhibit 10.3 to AMD’s Quarterly Report on Form 10-Q for the period ended June 26, 2010, is hereby incorporated by reference. |
| |
*10.20 | | Form of Restricted Stock Unit Agreement for AMD’s Non-US Senior VPs and Above filed as Exhibit 10.4 to AMD’s Quarterly Report on Form 10-Q for the period ended June 26, 2010, is hereby incorporated by reference. |
| |
10.21 | | Lease Agreement, dated as of December 22, 1998, between AMD and Delaware Chip LLC, filed as Exhibit 10.27 to AMD’s Annual Report on Form 10-K for the fiscal year ended December 27, 1998 is hereby incorporated by reference. |
| |
*10.22 | | AMD 1996 Stock Incentive Plan, as amended, filed as Exhibit 10.58 to AMD’s Quarterly Report on Form 10-Q for the period ended June 29, 2003, is hereby incorporated by reference. |
| |
*10.23 | | AMD 1998 Stock Incentive Plan, as amended, filed as Exhibit 10.32 to AMD’s Quarterly Report on Form 10-Q for the fiscal quarter ended June 29, 2003, is hereby incorporated by reference. |
| |
*10.24 | | Form of Indemnity Agreement by and between Advanced Micro Devices, Inc., and its officers and directors filed as Exhibit 10.1 to AMD’s Current Report on Form 8-K dated October 6, 2008, is hereby incorporated by reference. |
| |
*10.25 | | 1995 Option Stock Plan of NexGen, Inc., as amended, filed as Exhibit 10.37 to AMD’s Quarterly Report on Form 10-Q for the fiscal quarter ended June 30, 1996, is hereby incorporated by reference. |
| |
**10.26 | | Amended and Restated Non-Competition Agreement by and among Advanced Micro Devices, Inc., AMD Investments, Inc., Fujitsu Limited, and Spansion Inc. dated as of December 21, 2005 filed as Exhibit 10.8 to AMD’s Current Report on Form 8-K dated December 15, 2005, is hereby incorporated by reference. |
| |
*10.27 | | ATI Technologies Inc. Share Option Plan, as amended effective as of January 25, 2005 filed as Exhibit 99.3 to AMD’s Registration Statement on Form S-8 (333-138291) filed on October 30, 2006 is hereby incorporated by reference. |
| |
10.28 | | Stock Purchase Agreement between West Coast Hitech L.P., and Advanced Micro Devices, Inc. dated as of November 15, 2007 filed as Exhibit 10.1 to AMD’s Current Report on Form 8-K dated November 15, 2007, is hereby incorporated by reference. |
| |
| *10.29 | | Master Transaction Agreement by and among Advanced Micro Devices, Inc., Advanced Technology Investment Company LLC and West Coast Hitech L.P. dated October 6, 2008 filed as Exhibit 10.1 to AMD’s Current Report on Form 8-K dated October 16, 2008, is hereby incorporated by reference. |
| |
10.29(a) | | Amendment to Master Transaction Agreement dated December 5, 2008 among Advanced Micro Devices, Inc., Advanced Technology Investment Company LLC and West Coast Hitech L.P. filed as Exhibit 10.1 to AMD’s Current Report on Form 8-K dated December 5, 2008, is hereby incorporated by reference. |
| | |
Exhibit
Number | | Description of Exhibits |
| |
**10.30 | | Intellectual Property Cross-License Agreement by and between Advanced Micro Devices, Inc., and Broadcom Corporation filed as Exhibit 10.2 to AMD’s Quarterly Report on Form 10-Q for the period ended September 27, 2008, is hereby incorporated by reference. |
| |
**10.31 | | IP Core License Agreement by and between Advanced Micro Devices, Inc., and Broadcom Corporation filed as Exhibit 10.3 to AMD’s Quarterly Report on Form 10-Q for the period ended September 27, 2008, is hereby incorporated by reference. |
| |
10.32 | | Shareholders’ Agreement dated March 2, 2009 by and among Advanced Micro Devices, Inc., Advanced Technology Investment Company LLC, and The Foundry Company filed as Exhibit 10.3 to AMD’s Current Report on Form 8-K dated March 5, 2009, is hereby incorporated by reference. |
| |
10.32(a) | | Amended and Restated Shareholders’ Agreement by and among Advanced Micro Devices, Inc., Advanced Technology Investment Company LLC, ATIC International Investment Company LLC and GLOBALFOUNDRIES Inc. dated December 27, 2010 filed as Exhibit 10.44(a) to AMD’s Annual Report on Form 10-K for the fiscal year ended December 25, 2010, is hereby incorporated by reference. |
| |
10.33 | | Funding Agreement dated March 2, 2009 by and among Advanced Micro Devices, Inc., Advanced Technology Investment Company LLC, and The Foundry Company filed as Exhibit 10.4 to AMD’s Current Report on Form 8-K dated March 5, 2009, is hereby incorporated by reference. |
| |
10.33(a) | | Amended and Restated Funding Agreement by and among Advanced Micro Devices, Inc., Advanced Technology Investment Company LLC and GLOBALFOUNDRIES Inc. dated December 27, 2010 filed as Exhibit 10.45(a) to AMD’s Annual Report on Form 10-K for the fiscal year ended December 25, 2010 is hereby incorporated by reference. |
| |
**10.34 | | Wafer Supply Agreement dated March 2, 2009 by and among Advanced Micro Devices, Inc., The Foundry Company and AMD Fab Technologies US Inc., filed as Exhibit 10.5 to AMD’s Current Report on Form 8-K dated March 5, 2009, is hereby incorporated by reference. |
| |
**10.34(a) | | Wafer Supply Agreement Amendment No. 1 by and among Advanced Micro Devices, Inc., GLOBALFOUNDRIES Inc., GLOBALFOUNDRIES U.S. INC., and GLOBALFOUNDRIES SINGAPORE PTE. LTD. dated as of March 29, 2011 filed as Exhibit 10.1 to AMD’s Quarterly Report on Form 10-Q/A for the period ended April 2, 2011, is hereby incorporated by reference. |
| |
**10.34(b) | | Wafer Supply Agreement Amendment No. 2 dated March 4, 2012 filed as Exhibit 10.1 to AMD’s Quarterly Report on Form 10-Q for the period ended March 31, 2012, is hereby incorporated by reference. |
| |
***10.34(c) | | Wafer Supply Agreement Amendment No. 3 dated December 6, 2012. |
| |
*10.35 | | Offer Letter—Thomas Seifert dated August 31, 2009 filed as Exhibit 10.1 to AMD’s Current Report on Form 8-K dated October 8, 2009, is hereby incorporated by reference. |
| |
*10.36 | | Relocation Expenses Agreement—Thomas Seifert dated August 31, 2009 by and between Advanced Micro Devices, Inc. and Thomas Seifert filed as Exhibit 10.2 to AMD’s Current Report on Form 8-K dated October 8, 2009, is hereby incorporated by reference. |
| |
*10.37 | | Sign-On Bonus Agreement—Thomas Seifert dated August 31, 2009 by and between Advanced Micro Devices, Inc. and Thomas Seifert filed as Exhibit 10.3 to AMD’s Current Report on Form 8-K dated October 8, 2009, is hereby incorporated by reference. |
| |
*10.38 | | Offer Letter (including form Change in Control Agreement)—Emilio Ghilardi dated December 18, 2008 filed as Exhibit 10.62 to AMD’s Annual Report on Form 10-K for the fiscal year ended December 26, 2009 is hereby incorporated by reference. |
| | |
Exhibit
Number | | Description of Exhibits |
| |
*10.39 | | Sign-On Bonus Agreement dated January 14, 2009 by and between Advanced Micro Devices, Inc. and Emilio Ghilardi filed as Exhibit 10.63 to AMD’s Annual Report on Form 10-K for the fiscal year ended December 26, 2009 is hereby incorporated by reference. |
| |
*10.40 | | Executive Resignation Agreement and General Release between Advanced Micro Devices, Inc., and its subsidiaries, joint ventures or other affiliates (collectively, “AMD”) and Emilio Ghilardi filed as Exhibit 10.1 to AMD’s Current Report on Form 8-K/A dated April 30, 2012, is hereby incorporated by reference. |
| |
10.41 | | Settlement Agreement dated November 17, 2009 between Advanced Micro Devices, Inc. and Intel Corporation filed as Exhibit 10.1 to AMD’s Current Report on Form 8-K dated November 17, 2009, is hereby incorporated by reference. |
| |
***10.42 | | Patent Cross License Agreement dated November 11, 2009 between Advanced Micro Devices, Inc. and Intel Corporation filed as Exhibit 10.2 to AMD’s Current Report on Form 8-K dated November 17, 2009, is hereby incorporated by reference. |
| |
10.43 | | Letter Agreement between Advanced Micro Devices, Inc., GLOBALFOUNDRIES, Inc., Advanced Technology Investment Company and West Coast Hitech L.P., filed as Exhibit 10.1 to AMD’s Quarterly Report on Form 10-Q for the period ended March 27, 2010, is hereby incorporated by reference. |
| |
10.44 | | Letter Agreement between Advanced Micro Devices, Inc., GLOBALFOUNDRIES, Inc. Advanced Technology Investment Company and West Coast Hitech L.P., filed as Exhibit 10.1 to AMD’s Quarterly Report on Form 10-Q for the period ended September 25, 2010, is hereby incorporated by reference. |
| |
*10.45 | | Employment Agreement by and between Rory P. Read and Advanced Micro Devices, Inc. effective as of August 25, 2011 filed as Exhibit 10.1 to AMD’s Current Report on Form 8-K dated August 25, 2011, is hereby incorporated by reference. |
| |
*10.46 | | Relocation Expenses Agreement by and between Advanced Micro Devices, Inc. and Rory P. Read dated September 8, 2011 filed as Exhibit 10.1 to AMD’s Quarterly Report on Form 10-Q for the period ended October 1, 2011, is hereby incorporated by reference. |
| |
*10.47 | | Sign-On Restricted Stock Unit Grant Notice by and between Advanced Micro Devices, Inc. and Rory P. Read dated August 25, 2011 filed as Exhibit 10.2 to AMD’s Quarterly Report on Form 10-Q for the period ended October 1, 2011, is hereby incorporated by reference. |
| |
*10.48 | | Sign-On Performance Restricted Stock Unit Grant Notice by and between Advanced Micro Devices, Inc. and Rory P. Read dated August 25, 2011 filed as Exhibit 10.3 to AMD’s Quarterly Report on Form 10-Q for the period ended October 1, 2011, is hereby incorporated by reference. |
| |
*10.49 | | Special Sign-On Restricted Stock Unit Grant Notice by and between Advanced Micro Devices, Inc. and Rory P. Read dated August 25, 2011 filed as Exhibit 10.4 to AMD’s Quarterly Report on Form 10-Q for the period ended October 1, 2011, is hereby incorporated by reference. |
| |
*10.50 | | Sign-On Stock Option Grant Notice by and between Advanced Micro Devices, Inc. and Rory P. Read dated August 25, 2011 filed as Exhibit 10.5 to AMD’s Quarterly Report on Form 10-Q for the period ended October 1, 2011, is hereby incorporated by reference. |
| |
*10.51 | | Sign-On Performance Stock Option Grant Notice by and between Advanced Micro Devices, Inc. and Rory P. Read dated August 25, 2011 filed as Exhibit 10.6 to AMD’s Quarterly Report on Form 10-Q for the period ended October 1, 2011, is hereby incorporated by reference. |
| | |
Exhibit
Number | | Description of Exhibits |
| |
*10.52 | | Sign-On Bonus Agreement—Mark D. Papermaster dated October 7, 2011 by and between Advanced Micro Devices, Inc. and Mark D. Papermaster filed as Exhibit 10.62 to AMD’s Annual Report on Form 10-K for the period ended December 31, 2011, is hereby incorporated by reference. |
| |
*10.53 | | Offer Letter—Mark D. Papermaster dated October 7, 2011 filed as Exhibit 10.63 to AMD’s Annual Report on Form 10-K for the period ended December 31, 2011, is hereby incorporated by reference. |
| |
*10.54 | | Sign-On Bonus Agreement—Dr. Lisa Su dated December 14, 2011 by and between Advanced Micro Devices, Inc. and Dr. Lisa Su filed as Exhibit 10.64 to AMD’s Annual Report on Form 10-K for the period ended December 31, 2011, is hereby incorporated by reference. |
| |
*10.55 | | Offer Letter—Dr. Lisa Su dated December 14, 2011 filed as Exhibit 10.65 to AMD’s Annual Report on Form 10-K for the period ended December 31, 2011, is hereby incorporated by reference. |
| |
*10.56 | | SeaMicro, Inc. Amended and Restated 2007 Equity Incentive Plan filed as Exhibit 10.1 on AMD’s Form S-8 dated March 23, 2012 is hereby incorporated by reference. |
| |
10.57 | | Registration Rights Agreement dated August 15, 2012 by and among Advanced Micro Devices, Inc. and J.P. Morgan Securities LLC, filed as Exhibit 10.1 to AMD’s Current Report on Form 8-K dated August 15, 2012, is hereby incorporated by reference. |
| |
*10.58 | | Senior Vice President, Chief Sales Officer – Summary Of Terms dated August 6, 2012, filed as Exhibit 10.1 to AMD’s Quarterly Report on Form 10-Q for the period ended September 29, 2012, is hereby incorporated by reference. |
| |
*10.59 | | Special Retention Bonus Award to John Byrne dated October 25, 2011, filed as Exhibit 10.2 to AMD’s Quarterly Report on Form 10-Q for the period ended September 29, 2012, is hereby incorporated by reference. |
| |
*10.60 | | Amended and Restated Management Continuity Agreement, between Advanced Micro Devices, Inc. and Devinder Kumar, filed as Exhibit 10.3 to AMD’s Quarterly Report on Form 10-Q for the period ended September 29, 2012, is hereby incorporated by reference. |
| | | |
| *10.30 |
| | Executive Resignation Agreement and General Release, between Advanced Micro Devices, Inc., its subsidiaries, joint ventures or other affiliates and Emilio Ghilardi, filed as Exhibit 10.1 to AMD’s Current Report on Form 8-K/A dated April 30, 2012, is hereby incorporated by reference. |
| | | |
| *10.31 |
| | Employment Agreement, between Rory P. Read and Advanced Micro Devices, Inc., effective August 25, 2011, filed as Exhibit 10.1 to AMD’s Current Report on Form 8-K dated August 25, 2011, is hereby incorporated by reference. |
| | | |
| *10.32 |
| | Relocation Expenses Agreement, between Advanced Micro Devices, Inc. and Rory P. Read, dated September 8, 2011, filed as Exhibit 10.1 to AMD’s Quarterly Report on Form 10-Q for the period ended October 1, 2011, is hereby incorporated by reference. |
| | | |
| *10.33 |
| | Sign-On Restricted Stock Unit Grant Notice, between Advanced Micro Devices, Inc. and Rory P. Read, dated August 25, 2011, filed as Exhibit 10.2 to AMD’s Quarterly Report on Form 10-Q for the period ended October 1, 2011, is hereby incorporated by reference. |
| | | |
| *10.34 |
| | Sign-On Performance Restricted Stock Unit Grant Notice, between Advanced Micro Devices, Inc. and Rory P. Read, dated August 25, 2011, filed as Exhibit 10.3 to AMD’s Quarterly Report on Form 10-Q for the period ended October 1, 2011, is hereby incorporated by reference. |
| | | |
|
| | | | |
| | *10.35 |
| | Special Sign-On Restricted Stock Unit Grant Notice, between Advanced Micro Devices, Inc. and Rory P. Read, dated August 25, 2011, filed as Exhibit 10.4 to AMD’s Quarterly Report on Form 10-Q for the period ended October 1, 2011, is hereby incorporated by reference. |
| | | |
| *10.36 |
| | Sign-On Stock Option Grant Notice, between Advanced Micro Devices, Inc. and Rory P. Read, dated August 25, 2011, filed as Exhibit 10.5 to AMD’s Quarterly Report on Form 10-Q for the period ended October 1, 2011, is hereby incorporated by reference. |
| | | |
| *10.37 |
| | Sign-On Performance Stock Option Grant Notice, between Advanced Micro Devices, Inc. and Rory P. Read, dated August 25, 2011 filed, as Exhibit 10.6 to AMD’s Quarterly Report on Form 10-Q for the period ended October 1, 2011, is hereby incorporated by reference. |
| | | |
| *10.38 |
| | Sign-On Bonus Agreement, between Advanced Micro Devices, Inc. and Mark D. Papermaster, dated October 7, 2011, filed as Exhibit 10.62 to AMD’s Annual Report on Form 10-K for the period ended December 31, 2011, is hereby incorporated by reference. |
| | | |
| *10.39 |
| | Offer Letter, between Advanced Micro Devices, Inc. and Mark D. Papermaster, dated October 7, 2011, filed as Exhibit 10.63 to AMD’s Annual Report on Form 10-K for the period ended December 31, 2011, is hereby incorporated by reference. |
| | | |
| *10.40 |
| | Sign-On Bonus Agreement, between Advanced Micro Devices, Inc. and Dr. Lisa Su, dated December 14, 2011, filed as Exhibit 10.64 to AMD’s Annual Report on Form 10-K for the period ended December 31, 2011, is hereby incorporated by reference. |
| | | |
| *10.41 |
| | Offer Letter, between Advanced Micro Devices, Inc. and Dr. Lisa Su, dated December 14, 2011, filed as Exhibit 10.65 to AMD’s Annual Report on Form 10-K for the period ended December 31, 2011, is hereby incorporated by reference. |
| | | |
| *10.42 |
| | Summary of Terms for John Byrne, Senior Vice President, Chief Sales Officer, dated August 6, 2012, filed as Exhibit 10.1 to AMD’s Quarterly Report on Form 10-Q for the period ended September 29, 2012, is hereby incorporated by reference. |
| | | |
| *10.43 |
| | Special Retention Bonus Award to John Byrne, dated October 25, 2011, filed as Exhibit 10.2 to AMD’s Quarterly Report on Form 10-Q for the period ended September 29, 2012, is hereby incorporated by reference. |
| | | |
| 10.44 |
| | Stock Purchase Agreement, between West Coast Hitech L.P. and Advanced Micro Devices, Inc., dated as of November 15, 2007, filed as Exhibit 10.1 to AMD’s Current Report on Form 8-K dated November 15, 2007, is hereby incorporated by reference. |
| | | |
| 10.45 |
| | Master Transaction Agreement, among Advanced Micro Devices, Inc., Advanced Technology Investment Company LLC and West Coast Hitech L.P., dated October 6, 2008, filed as Exhibit 10.1 to AMD’s Current Report on Form 8-K dated October 16, 2008, is hereby incorporated by reference. |
| | | |
| 10.46 |
| | Amendment to Master Transaction Agreement, among Advanced Micro Devices, Inc., Advanced Technology Investment Company LLC and West Coast Hitech L.P., dated December 5, 2008, filed as Exhibit 10.1 to AMD’s Current Report on Form 8-K dated December 5, 2008, is hereby incorporated by reference. |
| | | |
| **10.47 |
| | Wafer Supply Agreement, among Advanced Micro Devices, Inc., The Foundry Company and AMD Fab Technologies US, Inc., dated March 2, 2009, filed as Exhibit 10.5 to AMD’s Current Report on Form 8-K dated March 5, 2009, is hereby incorporated by reference. |
| | | |
| **10.48 |
| | Wafer Supply Agreement Amendment No. 1, among Advanced Micro Devices, Inc., GLOBALFOUNDRIES Inc., GLOBALFOUNDRIES U.S. Inc. and GLOBALFOUNDRIES Singapore. Pte. Ltd., dated March 29, 2011, filed as Exhibit 10.1 to AMD’s Quarterly Report on Form 10-Q/A for the period ended April 2, 2011, is hereby incorporated by reference. |
| | | |
| **10.49 |
| | Wafer Supply Agreement Amendment No. 2, among Advanced Micro Devices, Inc., GLOBALFOUNDRIES Inc., GLOBALFOUNDRIES U.S. Inc., Advanced Technology Investment Company LLC and ATIC International Investment Company LLC, dated March 4, 2012, filed as Exhibit 10.1 to AMD’s Quarterly Report on Form 10-Q for the period ended March 31, 2012, is hereby incorporated by reference. |
| | | |
|
| | | | |
| **10.50 |
| | Wafer Supply Agreement Amendment No. 3, among Advanced Micro Devices, Inc., GlOBALFOUNDRIES Inc. and GLOBALFOUNDRIES U.S. Inc., dated December 6, 2012, filed as Exhibit 10.34(c) to AMD’s Annual Report on Form 10-K for the period ended December 29, 2012, is hereby incorporated by reference. |
| | | |
| 10.51 |
| | Settlement Agreement, between Advanced Micro Devices, Inc. and Intel Corporation, dated November 17, 2009, filed as Exhibit 10.1 to AMD’s Current Report on Form 8-K dated November 17, 2009, is hereby incorporated by reference. |
| | | |
| **10.52 |
| | Patent Cross License Agreement, between Advanced Micro Devices, Inc. and Intel Corporation filed, dated November 11, 2009, as Exhibit 10.2 to AMD’s Current Report on Form 8-K dated November 17, 2009, is hereby incorporated by reference. |
| | | |
| 10.53 |
| | Loan and Security Agreement, among Advanced Micro Devices, Inc., AMD International Sales & Service, Ltd., the financial institutions party thereto from time to time as lenders and Bank of America, N.A., dated November 12, 2013, filed as Exhibit 1.01 to AMD’s Current Report on Form 8-K dated November 12, 2013, is hereby incorporated by reference. |
| | | |
| 10.54 |
| | Lease Agreement, between AMD and Delaware Chip LLC, dated December 22, 1998, filed as Exhibit 10.27 to AMD’s Annual Report on Form 10-K for the fiscal year ended December 27, 1998, is hereby incorporated by reference. |
| | | |
| 10.55 |
| | Agreement of Purchase and Sale, between Advanced Micro Devices, Inc. and 7171 Southwest Parkway Holdings, LP, effective March 11, 2013, filed as Exhibit 10.1 to AMD’s Quarterly Report on Form 10-Q for the period ended March 30, 2013, is hereby incorporated by reference. |
| | | |
| 10.56 |
| | Sublease Agreement, between Lantana HP, LTD and Advanced Micro Devices, Inc., dated March 26, 2013, filed as Exhibit 10.2 to AMD’s Quarterly Report on Form 10-Q for the period ended March 30, 2013, is hereby incorporated by reference. |
| | | |
| 10.57 |
| | Master Landlord’s Consent to Sublease, between 7171 Southwest Parkway Holdings, L.P., Lantana HP, Ltd. and Advanced Micro Devices, Inc., dated March 26, 2013, filed as Exhibit 10.3 to AMD’s Quarterly Report on Form 10-Q for the period ended March 30, 2013, is hereby incorporated by reference. |
| | | |
| 10.58 |
| | Lease Agreement, between 7171 Southwest Parkway Holdings, L.P. and Lantana HP, Ltd., dated March 26, 2013, filed as Exhibit 10.4 to AMD’s Quarterly Report on Form 10-Q for the period ended March 30, 2013, is hereby incorporated by reference. |
| | | |
| **10.59 |
| | Wafer Supply Agreement Amendment No. 4, among Advanced Micro Devices, Inc., GLOBALFOUNDRIES Inc. and GLOBALFOUNDRIES U.S. Inc., dated March 30, 2014, filed as Exhibit 10.1 to AMD’s Quarterly Report on Form 10-Q/A for the fiscal quarter ended March 29, 2014, is hereby incorporated by reference. |
| | | |
| *10.60 |
| | Transition, Separation Agreement and Release by and between Rory P. Read and Advanced Micro Devices, Inc. effective October 8, 2014, filed as Exhibit 10.1 to AMD’s Current Report on Form 8-K/A dated October 14, 2014, is hereby incorporated by reference. |
| | | |
| *10.61 |
| | Employment Agreement by and between Lisa T. Su and Advanced Micro Devices, Inc. effective October 8, 2014, filed as Exhibit 10.2 to AMD’s Current Report on Form 8-K/A dated October 14, 2014, is hereby incorporated by reference. |
| | | |
| *10.62 |
| | Form of Stock Option Agreement for Senior Vice Presidents and Above under the 2004 Equity Incentive Plan, filed as Exhibit 4.1 to AMD’s Quarterly Report on Form 10-Q for the fiscal quarter ended September 27, 2014, is hereby incorporated by reference. |
| | | |
| *10.63 |
| | Form of Restricted Stock Unit Agreement for Senior Vice Presidents and Above under the 2004 Equity Incentive Plan, filed as Exhibit 4.1 to AMD’s Quarterly Report on Form 10-Q for the fiscal quarter ended September 27, 2014, is hereby incorporated by reference. |
| | | |
| *10.64 |
| | Form of Performance-Based Restricted Stock Unit Agreement for Senior Vice Presidents and Above under the 2004 Equity Incentive Plan, filed as Exhibit 4.1 to AMD’s Quarterly Report on Form 10-Q for the fiscal quarter ended September 27, 2014, is hereby incorporated by reference. |
| | | |
|
| | | | |
| 10.65 |
| | First Amendment to Loan and Security Agreement, dated as of December 11, 2014, by and among Advanced Micro Devices, Inc., AMD International Sales & Service, Ltd., the financial institutions party thereto as lenders and Bank of America, N.A., filed as Exhibit 10.1 to AMD’s Current Report on Form 8-K dated December 17, 2014, is hereby incorporated by reference. |
| | | |
| *10.66 |
| | Offer Letter, between Advanced Micro Devices, Inc. and Forrest E. Norrod, dated October 20, 2014, filed as Exhibit 10.66 to AMD’s Annual Report on Form 10-K for the fiscal year ended December 27, 2014, is hereby incorporated by reference. |
| | | |
| *10.67 |
| | Sign-On Bonus Agreement, between Advanced Micro Devices, Inc. and Forrest E. Norrod, dated October 20, 2014 to AMD’s Annual Report on Form 10-K for the fiscal year ended December 27, 2014, is hereby incorporated by reference. |
| | | |
| *10.68 |
| | Advanced Micro Devices, Inc. Executive Severance Plan and Summary Plan Description for Senior Vice Presidents effective December 31, 2014, filed as Exhibit 10.68 to AMD’s Annual Report on Form 10-K for the fiscal year ended December 27, 2014, is hereby incorporated by reference. |
| | | |
| 10.69 |
| | Amended and Restated Loan and Security Agreement dated as of April 14, 2015, among Advanced Micro Devices, Inc., AMD International Sales & Service, Ltd., ATI Technologies ULC, and Bank of America, N.A., filed as Exhibit 10.1 to AMD’s Current Report on Form 8-K dated April 15, 2015, is hereby incorporated by reference. |
| | | |
| 10.70 |
| | First Amendment to Amended and Restated Loan and Security Agreement dated as of June 10, 2015, among Advanced Micro Devices, Inc., AMD International Sales & Service, Ltd., ATI Technologies ULC, and Bank of America, N.A., filed as Exhibit 10.2 to AMD’s Quarterly Report on Form 10-Q for the fiscal quarter ended June 27, 2015, is hereby incorporated by reference. |
| | | |
| *10.71 |
| | Offer Letter between Advanced Micro Devices, Inc. and Jim R. Anderson, dated April 17, 2015, filed as Exhibit 10.3 to AMD’s Quarterly Report on Form 10-Q for the fiscal quarter ended June 27, 2015, is hereby incorporated by reference. |
| | | |
| *10.72 |
| | Sign-on Bonus Letter between Advanced Micro Devices, Inc. and Jim R. Anderson, dated May 27, 2015, filed as Exhibit 10.4 to AMD’s Quarterly Report on Form 10-Q for the fiscal quarter ended June 27, 2015, is hereby incorporated by reference. |
| | | |
| *10.73 |
| | Form of Stock Option Agreement for Senior Vice Presidents and Above under the 2004 Equity Incentive Plan, filed as Exhibit 10.1 to AMD’s Quarterly Report on Form 10-Q for the fiscal quarter ended September 26, 2015, is hereby incorporated by reference. |
| | | |
| *10.74 |
| | Form of Restricted Stock Unit Agreement for Senior Vice Presidents and Above under the 2004 Equity Incentive Plan, filed as Exhibit 10.2 to AMD’s Quarterly Report on Form 10-Q for the fiscal quarter ended September 26, 2015, is hereby incorporated by reference. |
| *10.75 |
| | Form of Performance-Based Restricted Stock Unit Agreement for Senior Vice Presidents and Above under the 2004 Equity Incentive Plan, filed as Exhibit 10.3 to AMD’s Quarterly Report on Form 10-Q for the fiscal quarter ended September 26, 2015, is hereby incorporated by reference. |
| | | |
| 10.76 |
| | Equity Interest Purchase Agreement by and between Advanced Micro Devices, Inc. and Nantong Fujitsu Microelectronics Co., Ltd. dated as of October 15, 2015, filed as Exhibit 10.1 to AMD’s Current Report on Form 8-K dated October 15, 2015, is hereby incorporated by reference. |
| | | |
| **10.77 |
| | Wafer Supply Agreement Amendment No. 5, among Advanced Micro Devices, Inc., GLOBALFOUNDRIES Inc. and GLOBALFOUNDRIES U.S. Inc., dated as of April 16, 2015, filed as Exhibit 10.1 to AMD’s Quarterly Report on Form 10-Q/A for the fiscal quarter ended June 27, 2015, is hereby incorporated by reference. |
| | | |
| *10.78 |
| | Form of Stock Option Agreement for Senior Vice Presidents and Above under the 2004 Equity Incentive Plan. |
| | | |
| *10.79 |
| | Form of Restricted Stock Unit Agreement for Senior Vice Presidents and Above under the 2004 Equity Plan. |
| | | |
| *10.80 |
| | Form of Performance-Based Restricted Stock Unit Agreement for Senior Vice Presidents and Above under the 2004 Equity Incentive Plan. |
| | | |
| 21 |
| | List of AMD subsidiaries. |
| | | |
|
23 | | Consent of Independent Registered Public Accounting Firm.
|
| |
| | 23 |
| | Consent of Ernst & Young LLP, independent registered public accounting firm for Advanced Micro Devices, Inc. |
| | | |
| 24 |
| | Power of Attorney. |
| | | |
| | 31.1 |
| | Certification of the Chief Executive Officer pursuant to Section 302 of the Sarbanes-Oxley Act of 2002. |
| | | |
| | 31.2 |
| | Certification of the Chief Financial Officer pursuant to Section 302 of the Sarbanes-Oxley Act of 2002. |
| | | |
| | 32.1 |
| | Certification of the Principal Executive Officer pursuant to Section 906 of the Sarbanes-Oxley Act of 2002. |
| | | |
| | 32.2 |
| | Certification of the Principal Financial Officer pursuant to Section 906 of the Sarbanes-Oxley Act of 2002. |
| | | |
99.1 | 101.INS | Annual CEO Certification (Section 303A.12(a)) |
| |
101.INS
| | XBRL Instance Document |
| | | |
| | 101.SCH |
| | XBRL Taxonomy Extension Schema Document |
| | |
Exhibit
Number | | Description of Exhibits |
| |
| | 101.CAL |
| | XBRL Taxonomy Extension Calculation Linkbase Document |
| | | |
| | 101.DEF |
| | XBRL Taxonomy Extension Definition Linkbase Document |
| | | |
| | 101.LAB |
| | XBRL Taxonomy Extension Label Linkbase Document |
| | | |
| | 101.PRE |
| | XBRL Taxonomy Extension Presentation Linkbase Document |
* | Management contracts and compensatory plans or arrangements. |
** | Portions of this Exhibit have been omitted pursuant to a request for confidential treatment, which has been granted. These portions have been filed separately with the Securities and Exchange Commission. |
*** | Portions of this Exhibit have been omitted pursuant to a request for confidential treatment. These portions have been filed separately with the Securities and Exchange Commission. |
_____________________
* Management contracts and compensatory plans or arrangements.
** Portions of this exhibit have been omitted pursuant to a request for confidential treatment, which has been granted. These portions have been filed separately with the SEC.
AMD will furnish a copy of any exhibit on request and payment of AMD’s reasonable expenses of furnishing such exhibit.
Pursuant to the requirements of Section 13 or 15(d) of the Securities Exchange Act of 1934, the registrant has duly caused this report to be signed on its behalf by the undersigned, thereunto duly authorized.
| | | | |
February 21, 2013 | | ADVANCED MICRO DEVICES, INC. |
| | |
| February 18, 2016 | ADVANCED MICRO DEVICES, INC. |
| | |
| | By: | | /S/ DEVINDER KUMAR s/ Devinder Kumar |
| | Devinder Kumar |
| | Devinder Kumar |
| | | | Senior Vice President, and Chief Financial Officer, and Treasurer |
Pursuant to the requirements of the Securities Exchange Act of 1934, this report has been signed below by the following persons, on behalf of the registrant and in the capacities and on the dates indicated.
|
| | | | |
Signature | | Title | | Date |
| | |
/s/ RORY P. READ
Rory P. Read
| | |
/s/ LISA T. SU | | President and Chief Executive Officer (Principal (Principal Executive Officer), Director | | February 21, 201318, 2016 |
| | |
/s/ DEVINDER KUMAR
Devinder Kumar
Lisa T. Su | | |
| | |
/s/ DEVINDER KUMAR | | Senior Vice President, and Chief Financial Officer (Principaland Treasurer (Principal Financial and Accounting Officer) | | February 21, 201318, 2016
|
| Devinder Kumar | | |
| | |
| * W. Michael Barnes
| | Director | | February 21, 201318, 2016
|
| | |
*
John E. Caldwell | | |
| | |
| * | | Director | | February 21, 201318, 2016
|
| | |
*
Henry WK Chow | | Director |
| | February 21, 2013 |
| | |
* Bruce L. Claflin
| | Chairman of the Board | | February 21, 201318, 2016 |
| Bruce L. Claflin | | |
| | |
| * Craig A. Conway
| | Director | | February 18, 2016
|
| Nora Denzel | | |
| | |
| * | | Director | | February 21, 201318, 2016 |
| Nicolas M. Donofrio | | |
| | |
| * Nicholas M. Donofrio
| | Director | | February 21, 201318, 2016 |
| Martin L. Edelman | | |
| | |
| * H. Paulett Eberhart
| | Director | | February 21, 201318, 2016 |
| Michael Inglis | | |
| | | | |
| * John R. Harding
| | Director | | February 21, 201318, 2016
|
| John R. Harding | | |
| | | | |
| * Waleed Muhairi
| | Director | | February 21, 2013 |
| | | | 18, 2016
|
Signature
Joseph Householder | | Title
|
| | Date
|
| | |
* Robert B. Palmer
| | Director | | February 21, 201318, 2016
|
| | |
*
Ahmed Yahia | | Director |
| | February 21, 2013 | | |
|
| |
| *By: | | /s/ DEVINDER KUMAR DEVINDER KUMAR |
| | | (Devinder Kumar, Attorney-in-Fact)Attorney-in-Fact |
ADVANCED MICRO DEVICES, INC.
VALUATION AND QUALIFYING ACCOUNTS
December 25, 2010, 26, 2015, December 31, 201127, 2014 and December 29, 201228, 2013 (In millions)
| | | | | | | | | | | | | | | | |
| | | Balance
Beginning
of Period | | | Additions
Charged
(Reductions
Credited)
To Operations | | | Deductions(1) | | | Balance
End of
Period | |
Allowance for doubtful accounts: | | | | | | | | | | | | | | | | |
Years ended: | | | | | | | | | | | | | | | | |
December 25, 2010 | | $ | 7 | | | $ | — | | | $ | (3 | ) | | $ | 4 | |
December 31, 2011 | | $ | 4 | | | $ | (1 | ) | | $ | (1 | ) | | $ | 2 | |
December 29, 2012 | | $ | 2 | | | $ | — | | | $ | — | | | $ | 2 | |
|
| | | | | | | | | | | | | | | | |
| | | Balance Beginning of Period | | Additions Charged (Reductions Credited) To Operations | | Deductions(1) | | Balance End of Period |
| Allowance for doubtful accounts: | | | | | | | | |
| Years ended: | | | | | | | | |
| December 28, 2013 | | $ | 2 |
| | $ | (2 | ) | | $ | — |
| | $ | — |
|
| December 27, 2014 | | $ | — |
| | $ | — |
| | $ | — |
| | $ | — |
|
| December 26, 2015 | | $ | — |
| | $ | — |
| | $ | — |
| | $ | — |
|
(1) | |
| (1) | Accounts written off |
127