• | improve our penetration of our existing markets by efficiently deploying marketing expenditures to attract new paid memberships and by retaining our existing paid memberships in these markets; |
• | maintain high levels of member engagement and the quality and integrity of our members’ reviews of local service providers; |
• | increase the number and variety of local service providers reviewed by our members and convince highly-rated local service providers to advertise with us; |
maintain high levels of member engagement and the quality and integrity of our members’ reviews of local service providers;
• | retain service providers that currently advertise with us and convince them to increase their advertising spending with us; |
increase the number and variety of local service providers reviewed by our members and convince highly-rated local service providers to advertise with us;
• | continue to develop and diversify our product offerings for local service providers; |
retain service providers that currently advertise with us and convince them to increase their advertising spending with us;
• | recruit, integrate and retain skilled and experienced sales personnel who can demonstrate our value proposition to service providers; |
continue to develop and diversify our product offerings for local service providers;
• | provide our members and local service providers with superior user experiences; |
recruit, integrate and retain skilled and experienced sales personnel who can demonstrate our value proposition to service providers;
• | react to changes in technology and challenges from existing and new competitors; and |
provide our members and local service providers with superior user experiences;
• | increase awareness of our brand. |
react to changes in technology and challenges from existing and new competitors; and
increase awareness of our brand.
We cannot assure you that our paid membership base or our service provider participation will continue to grow or will not decline as a result of increased competition and the maturation of our business. If our growth rates were to decline significantly or become negative, it could adversely affect our financial condition and results of operations. You should not rely on our historical rate of revenue growth as an indication of our future performance.
The Company’s inability to implement its strategic plan and growth initiatives may have an adverse impact on future results.
The Company’s ability to succeed in its strategic plan and growth initiatives could require significant capital investment and management attention, which may result in the diversion of these resources from the core business and other business issues and opportunities. Additionally, any new initiative is subject to certain risks, including customer acceptance, competition, product differentiation, challenges to economies of scale in merchandise sourcing and the ability to attract and retain qualified management and other personnel. There can be no assurance that the Company will be able to develop and successfully implement its strategic plan and growth initiatives to a point where they will become profitable or generate positive cash flow. If the Company cannot successfully execute its strategic plan and growth initiatives, the Company’s financial condition and results of operations may be adversely impacted.
Our future growth depends in part on our ability to effectively develop and sell additional products, services and features.
We invest in the development of new products, services and features with the expectation that we will be able to effectively offer them to consumers and local service providers. For example, we have introduced two e-commerce offerings, Angie’s List Big Deal and Storefront, which give our members the option to receive email alerts or search through service provider offerings on our website for deals. We plan to continue to develop additional advertising products for qualified local service providers. In addition, we may acquire vertical offerings that address additional “high cost of failure” segments of the market for local services.
Our future growth depends in part on our ability to sell these products and services, as well as additional features and enhancements to our existing offerings. As our new offerings evolve, we have adapted our sales and marketing strategies for them, and changes in these strategies may delay or prevent growth in these parts of our business. For example, we continue to refine our service provider eligibility criteria, pricing and our vendor credit and customer refund policies for our e-commerce offerings, which may cause our revenue from these offerings to fluctuate from period to period in the future. Further, many of our current and potential service provider advertisers have modest advertising budgets. Accordingly, we cannot assure you that the successful introduction of new products or services will not adversely affect sales of our current products and services or that those service providers that currently advertise with us will increase their aggregate spending as a result of the introduction of new products and services. If our efforts to effectively develop and sell additional products, services and features are not successful, our business may suffer.
12
We invest in features, functionality and customer support designed to drive traffic and increase engagement with members and service providers; however, these investments may not lead to increased revenue.
Our future growth and profitability will depend in large part on the effectiveness and efficiency of our efforts to convert consumers and local service providers who visit Angie’s List into paid memberships and participating service providers, respectively. We have made and will continue to make substantial investments in features and functionality for our website that are designed to drive online traffic and user engagement and in customer support for local service providers who do not advertise with us. These activities do not directly generate revenue, and we cannot assure you that we will reap any rewards from these investments. If the expenses that we incur in connection with these activities do not result in sufficient growth in paid members and participating service providers to offset their cost, our business, financial condition and results of operations will be adversely affected.
Our operating results may fluctuate, which makes our results difficult to predict and could cause our results to fall short of expectations.
Our revenue and operating results vary significantly from quarter to quarter and year to year because of a variety of factors, many of which are outside our control. As a result, comparing our operating results on a period to period basis may not be meaningful. In addition to other risk factors discussed in this “Risk Factors” section, factors that may contribute to the variability of our quarterly and annual results include:
our ability to retain our current paid memberships and build our paid membership base;
• | our ability to retain our current paid memberships and build our paid membership base; |
our ability to retain our service providers that currently advertise with us, and convince them to increase their advertising spending with us;
• | our ability to retain our service providers that currently advertise with us and convince them to increase their advertising spending with us; |
our revenue mix and any changes we make to our membership fees or other sources of revenue;
• | our revenue mix and any changes we make to our membership fees or other sources of revenue; |
our marketing costs or selling expenses;
• | our marketing costs or selling expenses; |
our ability to effectively manage our growth;
• | our ability to effectively manage our growth; |
the effects of increased competition in our business;
• | the effects of increased competition in our business; |
our ability to keep pace with changes in technology and our competitors;
• | our ability to keep pace with changes in technology and our competitors; |
• | costs associated with defending any litigation or enforcing our intellectual property rights; |
• | the impact of economic conditions in the United States on our revenue and expenses; and |
• | changes in government regulation affecting our business. |
From time to time we change the compensation plans for our intellectual property rights;
the impact of economic conditionssales personnel. For example, in the United States on our revenue and expenses; and
changes in government regulation affecting our business.
In the fourth quarter of 2012, we commenced the transitiontransitioned to a new compensation plan for our sales forcepersonnel responsible for new advertising originations whereby we have begunoriginations. Any future changes to pay commissions as cash is collected from our service providers rather than upfront at booking, as we have done historically. During this transition period, we expect to see higher selling expense as a percent of revenue in the near-term. In addition, the transitionsuch compensation plans could disrupt our sales forcepersonnel, adversely affecting sales and adversely affect new advertising sales, reducing our revenue. We cannot guarantee that we will accurately forecast the impact of the transitionfuture changes to such compensation plans on our operating results.
Seasonal variations in the behavior of our members and service providers also may cause fluctuations in our financial results. For example, we expect to experience some effects of seasonal trends in member and service provider behavior due to decreased demand for home improvement services in winter months. In addition, advertising expenditures by local service providers tend to be discretionary in nature and may be sporadic, reflecting overall economic conditions, the economic prospects of specific local service providers or industries, budgeting constraints and buying patterns and a variety of other factors, many of which are outside our control. We also expect revenue contributions from our e-commerce offerings to fluctuate from period to period as the offerings evolve and due to seasonality. While we believe seasonal trends have affected and will continue to affect our quarterly results, our trajectory of rapid growth may have overshadowed these effects to date. We believe that our business will be subject to seasonality in the future, which may result in fluctuations in our financial results.
13
Our revenue may be negatively affected if we are required to pay sales tax or other transaction taxes on all or a portion of our past and future sales in jurisdictions where we are currently not collecting and reporting tax.
We currently only pay sales or other transaction taxes in certain jurisdictions in which we do business. We do not separately collect sales or other transaction taxes. A successful assertion by any state, local jurisdiction or country in which we do not pay such taxes that we should be paying sales or other transaction taxes on the sale of our products or services, or the imposition of new laws requiring the payment of sales or other transaction taxes on the sale of our products or services, could result in substantial tax liabilities related to past sales, create increased administrative burdens or costs, discourage consumers and service providers from purchasing products or services from us, decrease our ability to compete or otherwise substantially harm our business and results of operations.
We depend on key personnel to operate our business, and if we are unable to retain, attract and integrate qualified personnel, our ability to develop and successfully grow our business could be harmed.
We believe that our future success depends in part upon the continued service of key members of our management team as well as our ability to attract and retain highly skilled and experienced sales, technical and other personnel. Our co-founders, William S. Oesterle and Angie Hicks, are critical to our overall management as well as the development of our culture and strategic direction. In particular, the reputation, popularity and talent of Ms. Hicks is an important factor in public perceptions of Angie’s List, and the loss of her services or any repeated or sustained shifts in public perceptions of her could adversely affect our business.
In addition, qualified individuals are in high demand in the Internet sector, and we may incur significant costs to attract them. Competition for these personnel is intense, and we may not be successful in attracting and retaining qualified personnel. Many of the companies with which we compete for experienced personnel have greater resources than us. In addition, in making employment decisions, particularly in the technology sector, job candidates often consider the value of the stock options they are to receive in connection with their employment.If we are unable to attract and retain our executive officers and key employees, we may not be able to achieve our strategic objectives, and our business could be harmed.
We have historically relied primarily on cash, rather than equity, compensation for the majority of our workforce. As such, we may have difficulty competing on a national scale for candidates focused on equity incentives. If we are unable to attract and retain executive officers and key personnel to our headquarters in Indianapolis, Indiana or integrate recently hired executive officers and key personnel, our business, operating results and financial condition could be harmed.
If we cannot maintain our corporate culture as we grow, we could lose the innovation, teamwork and focus that contribute crucially to our business.
We believe that a critical component of our success has been our corporate culture, which we believe fosters innovation, encourages teamwork, cultivates creativity and promotes focus on execution. We have invested substantial time, energy and resources in building a highly collaborative team that works together effectively in an environment designed to promote openness, honesty, mutual respect and the pursuit of common goals. As we continue to develop the infrastructure of a public company and continue to grow, we may find it difficult to maintain these valuable aspects of our corporate culture. Any failure to preserve our culture could negatively impact our future success, including our ability to attract and retain personnel, encourage innovation and teamwork and effectively focus on and pursue our corporate objectives.
We may require additional capital to pursue our business objectives and respond to business opportunities, challenges or unforeseen circumstances. If capital is not available to us, our business, operating results and financial condition may be harmed.
We may require additional capital to operate or expand our business. In addition, some of the strategic initiatives we have in early stages of development may require substantial additional capital resources before they begin to generate revenue. Additional funds may not be available when we need them, on terms that are
14
acceptable to us, or at all. For example, the loan and security agreement governing our term loan and revolving credit facility contains various restrictive covenants, including restrictions on our ability to dispose of assets, make acquisitions or investments, incur debt or liens, make distributions to our stockholders or enter into certain types of related party transactions, and any debt financing secured by us in the future could involve further restrictive covenants, which may make it more difficult for us to obtain additional capital and pursue business opportunities. If we raise additional funds through the issuance of equity or convertible securities, the percentage ownership of holders of our common stock could be significantly diluted,and these newly issued securities may have rights, preferences or privileges senior to those of holders of our common stock. Furthermore, volatility in the credit or equity markets may have an adverse effect on our ability to obtain debt or equity financing or the cost of such financing. If we do not have funds available to enhance our solutions, maintain the competitiveness of our technology and pursue business opportunities, we may not be able to service our existing members, acquire new members or attract or retain participating service providers, which could have an adverse effect on our business, operating results and financial condition.
If we fail to maintain proper and effective internal controls, our ability to produce accurate financial statements on a timely basis could be impaired, which would adversely affect our business and our stock price.
Ensuring that we have adequate internal financial and accounting controls and procedures in place to produce accurate financial statements on a timely basis is a costly and time-consuming effort that needs to be reevaluated frequently. We have in the past discovered, and may in the future discover, areas of our internal financial and accounting controls and procedures that need improvement.
Our management is responsible for establishing and maintaining adequate internal control over financial reporting to provide reasonable assurance regarding the reliability of our financial reporting and the preparation of financial statements for external purposes in accordance with U.S. general acceptedgenerallyaccepted accounting principles. Our management does not expect that our internal control over financial reporting will prevent or detect all errors and all fraud. A control system, no matter how well designed and operated, can provide only reasonable, not absolute, assurance that the control system’s objectives will be met. Because ofDue to the inherent limitations in all control systems, no evaluation of controls can provide absolute assurance that misstatements due to error or fraud will not occur or that all control issues and instances of fraud, if any, within our company will have beenbe detected.
Because we recognize membership revenue over the term of the membership and recognize service provider revenue ratably over the relevant contract period, downturns or upturns in membership or in service provider advertising may not be immediately reflected in our operating results.
We recognize membership revenue ratably over the term of a paid subscription and recognize service provider revenue ratably over the time period during which the advertisements are run. Because approximately 91%94% of our members subscribed on an annual or multi-year basis as of December 31, 2012,2013, a large portion of our membership revenue for each quarter reflects deferred revenue from memberships purchased in previous quarters. Similarly, because our service provider contracts run for an average term of more than one year, a large portion of our service provider revenue each quarter reflects purchasing decisions made in prior periods. Therefore, an increase or decrease in new or renewed memberships or new or renewed service provider contracts in any one quarter will not necessarily be fully reflected in our revenue for that quarter but will affect our revenue in future quarters. Accordingly, the effect of significant downturns or upturns in membership or advertising sales may not fully impact our results of operations until future periods.
We may suffer liability as a result of the ratings or reviews posted on our website.
Our terms of use specifically require members and non-members submitting reviews to represent that their ratings and reviews are based on their actual first-hand experiences and are accurate, truthful and complete in all respects and that they have the right and authority to grant us a license to publish their reviews. However, we do not have the ability to verify the accuracy of these representations on a case-by-case basis. There is a risk that a
15
review may be considered defamatory or otherwise offensive, objectionable or illegal under applicable law. Therefore, there is a risk that publication on our website of our ratings and reviews may give rise to a suit against us for defamation, civil rights infringement, negligence, copyright or trademark infringement, invasion of privacy, personal injury, product liability, breach of contract, unfair competition, discrimination, antitrust or other legal claims. From time to time, we are involved in claims and lawsuits based on the contents of the ratings and reviews posted on our website, including claims of defamation. To date, we have not suffered a material loss due to a claim of defamation. We expect that we will be subject to similar claims in the future, which may result in costly and time-consuming litigation, liability for money damages andor injury to our reputation.
If we fail to generate or maintain expected high quality reviews and reports from our members, we will be unable to provide members with the information they seek, which could negatively impact our membership retention and growth.
Our business depends on our ability to provide our members with the information they seek, which is directly dependent on the quality and quantity of the reviews and reports provided by our members. For example, we may be unable to offer our members adequate information on local service providers if our members do not contribute content that is helpful or relevant to the service category in a particular market. We may be unable to provide members with the information they seek if our members are unwilling to contribute reviews and reports because of concerns they will be sued or harassed by service providers they review, instances of which have occurred in the past and may occur again in the future. In addition, we may not be able to provide members with the information they seek if the information on our site is not updated. We do not remove older reviews, and members may view these reviews as less relevant, helpful or reliable. If our site does not provide current information about local service providers or members perceive reviews on our site as less relevant, our brand and business could suffer.
Membership growth is impacted by traffic to our website from search engines like such asGoogle, Bing and Yahoo!, some of which offer products and services that compete directly with our services. If our website fails to rank prominently in unpaid search results, traffic to our site could decline,and our business would be adversely impacted.
A portion of our website traffic comes from non-paid search results that appear on search engines such as Google and bing.Bing. For example, in fourth quarter of 2012, 2013,member sales from search engine optimization (“SEO”) efforts grew 185% year-over-year in the fourth quarter.57% as compared to 2012. While SEO has a much lower cost per acquisition compared to outbound channels like advertisingsuch asadvertising and has helped reduce our overall cost per member acquisition, our ability to maintain high organic search rankings is not within our control. As such, our competitors’ SEO efforts may result in their websites receiving a higher search result page ranking than ours. Separately, Internet search engines could revise their methodologies in a way that could adversely affect our search result rankings. For example, Google makes changes to its algorithm(s) every year, any one of which could potentially impact our rankings,which we are dependent upon to drive traffic and ultimately sales to our site. Our website has experienced fluctuations in search result rankings in the past, and we anticipate similar fluctuations in the future. Any reduction in the number of Internet users directed to our website through search engines could harm our business.
If local service providers rated on our website do not meet the expectations of our members, or engage in unethical or illegal conduct, we may suffer reputational harm, liability or adverse effects on our profitability and liquidity as a result.
Our business depends on our reputation for quality and integrity, which may be harmed by actions taken by local service providers that are outside our control. Because Given thatour members use our service to gather information about projects that carry a high risk of failure, and have the opportunity to purchase these services at a discounted rate through our Big Deal and Storefront offerings, if they are performed incompetently or if service providers fail to perform prepaid services, our reputation could be undermined. We cannot be certain that highly-rated local service providers will perform to the satisfaction of our members or that services purchased in advance through
16
our Big Deal or Storefront offerings will be performed to the satisfaction of our members or at all. In addition, unethical or illegal conduct by local service providers rated on our website could damage our reputation or expose us to liability arising from claims made by or on behalf of those harmed by such conduct.
We pay service providers in advance for all Big Deals and Storefront offerings purchased by members. Under this payment model, service providers are paid regardless of whether the Big Deal is redeemed or the Storefront services are performed. Subject to certain limitations, our members may request a refund from us on their e-commerce transactions. BecauseAs we do not have control over service providers and the quality of the services they deliver, we develop estimates for refund claims. Our actual level of refund claims could prove to be greater than the level of refund claims we estimate, particularly as our revenue from e-commerce offerings grows and we develop additional e-commerce products, services and features. Moreover, our members may make requests for refunds with respect to which we are unable to recover reimbursement from our service providers. An increase in our refund rates, or our inability to recover from our service providers, could adversely affect our profitability and liquidity.
Many people utilize smartphones and other mobile devices, as well as tablets, to access information about local service providers. If we are not successful in developing products through the use of these technologies,or our products are not widely adopted, our business could be adversely affected.
The number of people who seek information about local service providers through mobile devices, including smartphones and tablets, has increased significantly in the past few years. If our members are unable to access our ratings and reviews of service providers on their mobile devices, or if we otherwise fail to develop and maintain effective mobile advertising and e-commerce products and services or if our mobile products and services are not widely adopted by our members, our business may suffer. Additionally, as new mobile devices and platforms are released, it is difficult to forecast the problems that may arise, and we may need to devote significant resources to the development, support and maintenance of these products. Finally, if we experience problems with continued integration of our mobile application,applications, or mobile app,apps, into mobile devices, or weifwe have issues with providers of mobile operating systems or mobile application download stores, such as Apple, Inc. or Google, or if we facedface increased costs to distribute our mobile app,apps, our business could suffer.
Failure to comply with federal and state laws and regulations relating to privacy and security of personal information, including personal health information, could result in liability to us, damage our reputation and harm our business.
A variety of federal and state laws and regulations govern the collection, use, retention, sharing and security of personal information. We collect and utilize demographic and other information from and about our members as they interact with our service. We also may collect information from our members when they provide ratings and reviews of local service providers, participate in polls or contests or sign up to receive email newsletters. Further, we use tracking technologies, including “cookies,” to help us manage and track our members’ interactions with our service and deliver relevant advertising. Claims or allegations that we have violated laws and regulations related to privacy and data security could in the future result in negative publicity and a loss of confidence in us by our members and our participating service providers and may subject us to fines by credit card companies and the loss of our ability to accept credit and debit card payments. In addition, we have posted privacy policies and practices concerning the collection, use and disclosure of member data on our websites and mobile applications. Several Internet companies have incurred penalties for failing to abide by the representations made in their privacy policies and practices.
In rating and reviewing health care or wellness providers, our members may post personal health information about themselves or others, and the health care or wellness providers reviewed by members may submit responses that contain private or confidential health information about reviewing members or others. While we strive to comply with applicable privacy and security laws and regulations regarding personal health information, as well as our own posted privacy policies, any failure or perceived failure to comply may result in proceedings or actions against us by government entities or others or could cause us to lose members and participating service providers, which could adversely affect our business.
17
We have incurred, and will continue to incur, expenses to comply with privacy and security standards and protocols for personal information, including personal health information, imposed by law, regulation, self-regulatory bodies, industry standards and contractual obligations. However, such laws and regulations are evolving and subject to potentially differing interpretations, and federal and state legislative and regulatory bodies may expand current or enact new laws or regulations regarding privacy matters. We are unable to predict what additional legislation or regulation in the area of privacy of personal information could be enacted or its effect on our operations and business.
If our security measures are breached and unauthorized access is obtained to our members’ or service providers’data, our service may be perceived as not being secure,and members and service providers may curtail or terminate their use of our service.
In the ordinary course of business, we collect and store sensitive data, including intellectual property, our proprietary business information and that of our members and service providers and personally identifiable information of our members, service providers and employees in our data centers and networks. The secure processing, maintenance and transmission of this information is critical to our operations and business strategy. Our service involves the storage and transmission of our members’ and service providers’ proprietary information, such as credit card and bank account numbers, and security breaches could expose us to a risk of loss of this information, litigation and possible liability. Our payment services may be susceptible to credit card and other payment fraud schemes, including unauthorized use of credit cards, debit cards or bank account information, identity theft or merchant fraud.
If our security measures are breached as a result of third-party action, employee error, malfeasance or otherwise, and as a result, someone obtains unauthorized access to our members’ data, our reputation may be damaged, our business may suffer and we could incur significant liability. Because techniquesAstechniques used to obtain unauthorized access or to sabotage systems change frequently and generally are not recognized until launched against a target, we may be unable to anticipate these techniques or implement adequate preventative measures. If an actual or perceived breach of our security occurs, the public perception of the effectiveness of our security measures could be harmed,and we could lose members and service providers, which could adversely affect our business.
We are subject to a number of risks related to intentional business disruptions, cyber-attacks and piracy.
Despite a number of precautionary measures already in place and significant ongoing investments to protect against security risks, data protection breaches, cyber-attacks and other intentional disruptions of our products and offerings, we expect to be an ongoing target of attacks specifically designed to impede the performance of our products and offerings and harm our reputation as a company. Similarly, experienced third parties may attempt to penetrate our network security or the security of our website and misappropriate proprietary information or cause interruptions of our services. As the techniques used by such third parties to access or sabotage networks change frequently and may not be recognized until launched against a target, we may be unable to anticipate these techniques. The theft or unauthorized use or publication of our trade secrets and other confidential business information as a result of such an event could adversely affect our competitive position, reputation, brand and future sales of our products, and our customers may assert claims against us related to resulting losses of confidential or proprietary information. Our business could be subject to significant disruption, and we could suffer monetary and other losses and reputational harm, in the event of such incidents and claims.
We are subject to a number of risks related to accepting credit card and debit card payments.
We accept payments from our members primarily through credit and debit card transactions. For credit and debit card payments, we pay interchange and other fees, which may increase over time. An increase in those fees would require us to either increase the prices we charge for our service, which could cause us to lose members and membership revenue, or suffer an increase in our operating expenses, either of which could adversely affect our operating results.
If we or any of our processing vendors have problemsexperienceproblems with our billing software, or if the billing software malfunctions, it could have an adverse effect onadversely affect our member satisfaction and could cause one or more of the major credit card companies to disallow our continued use of their payment products. In addition, if our billing software fails to work properly and, as a result, we do not automatically charge our members’ credit cards on a timely basis or at all, we could lose membership revenue, which could harm our operating results.
We are also subject to payment card association operating rules, certification requirements and rules governing electronic funds transfers, including the Payment Card Industry Data Security Standard, or PCI DSS, a security standard with which companies that collect, store or transmit certain data regarding credit and debit cards, credit and debit card holders and credit and debit card transactions are required to comply. Our failure to comply fully with the PCI DSS may violate payment card association operating rules, federal and state laws and regulations and the terms of our contracts with payment processors and merchant banks. Such failure to comply fully also may subject us to fines, penalties, damages and civil liability and may result in the loss of our ability to accept credit and debit card payments. In addition, there is no guarantee that PCI DSS compliance will prevent illegal or improper use of our payment systems or the theft, loss or misuse of data pertaining to credit and debit cards, credit and debit card holders and credit and debit card transactions.
18
If we fail to adequately control fraudulent credit card transactions, we may face civil liability, diminished public perception of our security measures and significantly higher credit card-related costs, each of which could adversely affect our business, financial condition and results of operations.
If we are unable to maintain our chargeback rate at acceptable levels, our credit card fees for chargeback transactions or our fees for many or all categories of credit and debit card transactions, credit card companies and debit card issuers may increase our fees or terminate their relationship with us. Any increases in our credit card and debit card fees could adversely affect our results of operations, particularly if we elect not to raise our rates for our service to offset the increase. The termination of our ability to process payments on any major credit or debit card would significantly impair our ability to operate our business.
As we develop and sell new products, services and features, we may be subject to additional and unexpected regulations, which could increase our costs or otherwise harm our business.
As we develop and sell products and services that address new segments of the market for local services and expand our advertising services, we may become subject to additional laws and regulations, which could create unexpected liabilities for us, cause us to incur additional costs or restrict our operations. For example, our Angie’s List Health & Wellness offerings may become subject to complex federal and state health care laws and regulations, the application of which to specific products and services is unclear. Many existing health care laws and regulations, when enacted, did not anticipate the online health and wellness information and advertising products and services that we provide; nevertheless, they may be applied to our products and services.
We have e-commerce offerings, such as Angie’s List Big Deal and Storefront, which allow our members to purchase services or products from our service providers. Transactions between members and local service providers in connection with these offerings may be subject to regulation, in whole or in part, by federal, state and local authorities.
In addition, the application of certain laws and regulations to some of our promotions are uncertain. These include laws and regulations such as the Credit Card Accountability Responsibility and Disclosure Act of 2009, or the CARD Act, and unclaimed and abandoned property laws. If these promotions were subject to the CARD Act or any similar state or foreign law or regulation, we may be required to record liabilities with respect to unredeemed promotions,and we may be subject to additional fines and penalties.
From time to time, we may be notified of additional laws and regulations which governmental organizations or others may claim should be applicable to our business. Our failure to accurately anticipate the application of these laws and regulations, or other failure to comply, could create liability for us, result in adverse publicity or cause us to alter our business practices, which could cause our revenue to decrease, our costs to increase or our business otherwise to beotherwisebe harmed.
Our business depends on our ability to maintain and scale the network infrastructure necessary to operate our websites and applications.
Our members access reviews and other information through our websites and applications. Our reputation and ability to acquire, retain and serve our members and service providers are dependent upon the reliable performance of our websites and applications and the underlying network infrastructure. As our membership base and the amount of information shared on our websites and applications continue to grow, we will need an increasing amount of network capacity and computing power. We have made, and expect to continue to make, substantial investments in data centers, equipment and related network infrastructure to handle the traffic on our websites and the data submitted to us by our members. The operation of these systems is expensive and complex and could result in operational failures. In the event that our membership base or the amount of traffic on our websites and applications grows more quickly than anticipated, we may be required to incur significant additional costs. If we do not maintain or expand our network infrastructure successfully, or if we experience
19
operational failures, our reputation could be harmed,and we could lose current and potential members and participating service providers, which could harm our operating results and financial condition.
We may not be able to successfully prevent other companies, including copycat websites, from misappropriating our data in the future.
From time to time, third parties have attempted to misappropriate our member-generated ratings and reviews and other data regarding our service providers through website scraping, search robots or other means. We have deployed several technologies designed to detect and prevent such efforts. However, we may not be able to successfully detect and prevent all such efforts in a timely manner or assure that no misuse of our data occurs.
In addition, third parties operating “copycat” websites have attempted to misappropriate data from our network and to imitate our brand or the functionality of our website. When we have become aware of such efforts by other companies, we have employed technological or legal measures in an attempt to halt their operations. However, we may not be able to detect all such efforts in a timely manner, or at all, and even if we could, the technological and legal measures available to us may be insufficient to stop their operations. In some cases, particularly in the case of companies operating outside of the United States, our available remedies may not be adequate to protect us against the damage to our business caused by such websites. Regardless of whether we can successfully enforce our rights against the operation of these websites, any measures that we may take could require us to expend significant financial or other resources and have a significantly adverse effect on our brand.
Failure to adequately protect our intellectual property could substantially harm our business and operating results.
We rely on a combination of intellectual property rights, including trade secrets, copyrights and trademarks, as well as contractual restrictions, to safeguard our intellectual property. We do not have any patents or pending patent applications. Despite our efforts to protect our proprietary rights, unauthorized parties may attempt to copy our digital content, aspects of our solutions for members and service providers, our technology, software, branding and functionality, or obtain and use information that we consider proprietary. Moreover, policing our proprietary rights is difficult and may not always be effective. As we expand internationally, we may need to enforce our rights under the laws of countries that do not protect proprietary rights to as great an extent as do the laws of the United States.
Our digital content is not protected by any registered copyrights or other registered intellectual property. Rather, our digital content is protected by statutory and common law rights, user agreements that limit access to and use of our data and by technological measures. Compliance with use restrictions is difficult to monitor, and our proprietary rights in our digital content databases may be more difficult to enforce than other forms of intellectual property rights.
As of December 31, 2012,2013, we have registered 2324 trademarks in the United States, including “Angie’s List,” oneand two registered trademarks in Canada, as well as four pending trademark applicationapplications in the United States and one registered trademark and one pending trademark application in Canada.States. Some of our trade names may not be eligible to receive trademark protection. Trademark protection may also not be available, or sought by us, in every country in which our service may become available online. Competitors may adopt service names similar to ours or purchase our trademarks and confusingly similar terms as keywords in Internet search engine advertising programs, thereby impeding our ability to build brand identity and possibly confusing consumers and local service providers. Moreover, there could be potential trade name or trademark infringement claims brought by owners of other registered trademarks or trademarks that incorporate marks similar to our trademarks. In addition, in the past, some local service providers have used our trademarks inappropriately or without our permission, including our “Super Service Award,” which is available only to local service providers that have maintained superior service ratings. We have taken in the past and may in the future take action, including initiating litigation, to protect our intellectual property rights and the integrity of our brand, but these efforts may prove costly, ineffective or both.
20
We currently hold the “Angie’s List” Internet domain name and various other related domain names. Domain names generally are regulated by Internet regulatory bodies. If we lose the ability to use a domain name in the United States or any other country, we would be forced to incur significant additional expense to market our solutions, including the development of a new brand and the creation of new promotional materials, which could substantially harm our business and operating results. The regulation of domain names in the United States and in foreign countries is subject to change. Regulatory bodies could establish additional top-level domains, appoint additional domain name registrars or modify the requirements for holding domain names. As a result, we may not be able to acquire or maintain the domain names that utilize the “Angie’s List” name in all of the countries in which we currently intend to conduct business.
In order to protect our trade secrets and other confidential information, we rely in part on confidentiality agreements with our personnel, consultants and third parties with whom we have relationships. These agreements may not effectively prevent disclosure of trade secrets and other confidential information and may not provide an adequate remedy in the event of misappropriation of trade secrets or any unauthorized disclosure of trade secrets and other confidential information. In addition, others may independently discover trade secrets and confidential information, and in such cases, we could not assert any trade secret rights against such parties. Costly and time-consuming litigation could be necessary to enforce and determine the scope of our trade secret rights and related confidentiality and nondisclosure provisions, and failure to obtain or maintain trade secret protection, or our competitors being able to obtain our trade secrets or to independently develop technology similar to ours or competing technologies, could adversely affect our competitive business position.
Litigation or proceedings before the U.S. Patent and Trademark Office or other governmental authorities and administrative bodies in the United States and abroad may be necessary in the future to enforce our intellectual property rights, to protect our domain names and to determine the validity and scope of the proprietary rights of others. Our efforts to enforce or protect our proprietary rights may be ineffective, could result in substantial costs and diversion of resources and could substantially harm our operating results.
Assertions by third parties of infringement or other violation by us of their intellectual property rights could result in significant costs and substantially harm our business and operating results.
Internet, technology and media companies are frequently subject to litigation based on allegations of infringement, misappropriation or other violations of intellectual property rights. Some Internet, technology and media companies, including some of our competitors, own large numbers of patents, copyrights, trademarks and trade secrets, which they may use to assert claims against us. Third parties may in the future assert that we have infringed, misappropriated or otherwise violated their intellectual property rights, and as we face increasing competition, the possibility of intellectual property rights claims against us grows. We cannot assure you that we are not infringing or violating any third-party intellectual property rights.
We cannot predict whether assertions of third-party intellectual property rights or any infringement or misappropriation claims arising from such assertions will substantially harm our business and operating results. If we are forced to defend against any infringement or misappropriation claims, whether they are with or without merit, are settled out of court or are determined in our favor, we may be required to expend significant time and financial resources on the defense of such claims. Furthermore, an adverse outcome of a dispute may require us to pay damages, potentially including treble damages and attorneys’ fees, if we are found to have willfully infringed a party’s patent or copyright rights;rights, cease making, licensing or using solutions that are alleged to infringe or misappropriate the intellectual property of others;others, expend additional development resources to redesign our solutions;solutions, enter into potentially unfavorable royalty or license agreements in order to obtain the right to use necessary technologies, content or materials;materials and to indemnify our partners and other third parties. Royalty or licensing agreements, if required or desirable, may be unavailable on terms acceptable to us, or at all, and may require significant royalty payments and other expenditures. Any of these events could seriously harm our business, operating results and financial condition. In addition, any lawsuits regarding intellectual property rights, regardless of their success, could be expensive to resolve and would divert the time and attention of our management and technical personnel.
21
Some of our services and technologies may use “open source” software, which may restrict how we use or distribute our services or require that we release the source code of certain services subject to those licenses.
Some of our services and technologies may incorporate software licensed under so-called “open source” licenses, including, but not limited to, the GNU General Public License and the GNU Lesser General Public License. Such open source licenses typically require that source code subject to the license be made available to the public and that any modifications or derivative works to open source software continue to be licensed under open source licenses. These open source licenses typically mandate that proprietary software, when combined in specific ways with open source software, becomes subject to the open source license. If we combine our proprietary software with open source software, we could be required to release the source code of our proprietary software.
We take steps to ensure that our proprietary software is not combined with, nor incorporates, open source software in ways that would require our proprietary software to be subject to an open source license. However, few courts have interpreted open source licenses, and the manner in which these licenses may be interpreted and enforced is therefore subject to some uncertainty. Additionally, we rely on multiple software programmers to design our proprietary technologies, and although we take steps to prevent our programmers from including open source software in the technologies and software code that they design, write and modify, we do not exercise complete control over the development efforts of our programmers, and we cannot be certain that our programmers have not incorporated open source software into our proprietary products and technologies or that they will not do so in the future. In the event that portions of our proprietary technology are determined to be subject to an open source license, we could be required to publicly release the affected portions of our source code, re-engineer all or a portion of our technologies or otherwise be limited in the licensing of our technologies, each of which could reduce or eliminate the value of our services and technologies and materially and adversely affect our business, results of operations and prospects.
We rely on third parties to provide software and related services necessary for the operation of our business.
We incorporate and include third-party software into and with our product and service offerings and expect to continue to do so. The operation of our product and service offerings could be impaired if errors occur in the third-party software that we use. It may be more difficult for us to correct any defects in third-party software becauseas the development and maintenance of the software is not within our control. Accordingly, our business could be adversely affected in the event of any errors in this software. We cannot assure you that any third-party licensors will continue to make their software available to us on acceptable terms, or at all, or to invest the appropriate levels of resources in their software to maintain and enhance its capabilities or to remain in business. Any impairment in our relationships with these third-party licensors could have an adverse effect on our business, results of operations, cash flow and financial condition. These third-party in-licenses may expose us to increased risk, including risks associated with the assimilation of new technology sufficient to offset associated acquisition and maintenance costs. The inability to obtain any of these licenses could result in delays in development of solutions until equivalent technology can be identified and integrated. Any such delays in services could cause our business, operating results and financial condition to suffer.
We are involved in litigation matters that are expensive and time consuming, and, if resolved adversely, could harm our business, financial condition or results of operations.
We are involved in lawsuits, including a putative class action lawsuit brought by members and stockholder class action lawsuits, and we anticipate that we will continue to be a target for lawsuits in the future. Any negative outcome from such lawsuits could result in payment of substantial monetary damages or fines or undesirable changes to our products, services or business practices, and accordingly,our business, financial condition or results of operations could be materially and adversely affected. Although the results of such lawsuits and claims cannot be predicted with certainty, we currently believe that the final outcome of those matters that we currently face will not have a material adverse effect on our business, financial condition, results of operations or cash flows, except as otherwise recorded within the consolidated financial statements.However, there can be no assurance that a favorable final outcome will be obtained in all our cases, and regardless of the outcome, any lawsuit can have an adverse impact on us because of defense and settlement costs, diversion of management resources and other factors. Any lawsuit to which we are a party may result in an onerous or unfavorable judgment that may not be reversed upon appeal or in payments of substantial damages or fines, or we may decide to settle lawsuits on similarly unfavorable terms, which could adversely affect our business, financial conditions or results of operations.
Covenants in the loan and security agreement governing our term loan and revolving credit facility may restrict our operations, and if we do not effectively manage our business to comply with these covenants, our financial condition could be adversely affected.
The loan and security agreement governing our term loan and revolving credit facility contains various restrictive covenants, including restrictions on our ability to dispose of assets, make acquisitions or investments, incur debt or liens, make distributions to our stockholders or enter into certain types of related party transactions. We are also required to maintain certain financial covenants. Our ability to meet these restrictive covenants can be affected by events beyond our control, and we may be unable to do so. In addition, our failure to maintain effective internal controls to measure compliance with our financial covenants could affect our ability to take corrective actions on a timely basis and could result in our being in breach of these covenants. Our loan and
22
security agreement provides that our breach or failure to satisfy certain covenants constitutes an event of default. Upon the occurrence of an event of default, which includes a material adverse change, our lenders could elect to declare all amounts outstanding under one or more of our debt agreements to be immediately due and payable. If we are unable to repay those amounts, our financial condition could be adversely affected.
Because we generate substantially all of our revenue in the United States, a decline in aggregate demand for local services in the United States could cause our revenue to decline.
Substantially all of our revenue is from members and participating service providers in the United States. Consequently, a decline in consumer demand for local services, particularly in the home improvement and health and wellness segments, or for consumer ratings and reviews could have a disproportionately greater impact on our revenue than if our geographic mix of revenue was less concentrated. In addition, becauseas expenditures by service providers generally tend to reflect overall economic conditions, to the extent that economic growth in the United States remains slow, reductions in advertising by local service providers could have a serious impact on our service provider revenue and negatively impact our business.
If use of the Internet does not continue to increase, our growth prospects will be harmed.
Our future success is substantially dependent upon the continued use of the Internet as an effective medium of business and communication by consumers. Internet use may not continue to develop at historical rates, and consumers may not continue to use the Internet to research and hire local service providers. In addition, the Internet may not be accepted as a viable resource for a number of reasons, including:
actual or perceived lack of security of information or privacy protection;
• | actual or perceived lack of security of information or privacy protection; |
possible disruptions, computer viruses or other damage to Internet servers or to users’ computers; and
• | possible disruptions, computer viruses or other damage to Internet servers or to users’ computers; and |
• | excessive governmental regulation. |
excessive governmental regulation.
Our success will depend, in large part, upon third parties maintaining the Internet infrastructure to provide a reliable network backbone with the speed, data capacity, security and hardware necessary for reliable Internet access and services. Our growth prospects are also significantly dependent upon the availability and adoption of broadband Internet access and other high-speed Internet connectivity technologies.
We face many risks associated with our long-term plan to expand our operations outside of the United States.
Expanding our operations into international markets is an element of our long-term strategy. However, offering our products and services outside of the United States involves numerous risks and challenges. Most importantly, acquiring paid memberships in foreign countries and convincing foreign service providers to advertise with us would require substantial investment by us in local advertising and marketing, and there can be no assurance that we would succeed or achieve any return on this investment. In addition, international expansion would expose us to other risks such as:
the need to modify our technology and sell our products and services in non-English speaking countries;
• | the need to modify our technology and sell our products and services in non-English speaking countries; |
the need to localize our products and services to the preferences and customs of foreign consumers and local service providers;
• | the need to localize our products and services to the preferences and customs of foreign consumers and local service providers; |
difficulties in managing operations due to language barriers, distance, staffing, cultural differences and business infrastructure constraints;
• | difficulties in managing operations due to language barriers, distance, staffing, cultural differences and business infrastructure constraints; |
our lack of experience in marketing, and encouraging viral marketing, in foreign countries;
• | our lack of experience in marketing, and encouraging viral marketing, in foreign countries; |
23
application of foreign laws and regulations to us, including more stringent consumer and data protection laws;
• | application of foreign laws and regulations to us, including more stringent consumer and data protection laws; |
fluctuations in currency exchange rates;
• | fluctuations in currency exchange rates; |
risk of member or local service provider fraud;
• | risk of member or local service provider fraud; |
reduced or ineffective protection of our intellectual property rights in some countries; and
• | reduced or ineffective protection of our intellectual property rights in some countries; and |
• | potential adverse tax consequences associated with foreign operations and revenue. |
potential adverse tax consequences associated with foreign operations and revenue.
As a result of these obstacles, we may find it impossible or prohibitively expensive to enter foreign markets, or entry into foreign markets could be delayed, which could harm our business, operating results and financial condition.
We may acquire other companies or technologies, which could divert our management’s attention, result in additional dilution to our stockholders and otherwise disrupt our operations and harm our operating results.
Our success will depend, in part, on our ability to expand our product and service offerings and grow our business in response to changing technologies, member and service provider demands and competitive pressures. In some circumstances, we may determine to do so through the acquisition of complementary businesses or technologies rather than through internal development. We have limited experience acquiring other businesses and technologies. The pursuit of potential acquisitions may divert the attention of management and cause us to incur various expenses in identifying, investigating and pursuing suitable acquisitions, whether or not they are consummated. Furthermore, even if we successfully acquire additional businesses or technologies, we may not be able to integrate the acquired personnel, operations and technologies successfully or effectively manage the combined business following the acquisition. We also may not achieve the anticipated benefits from the acquired business or technology. In addition, we may unknowingly inherit liabilities from future acquisitions that arise after the acquisition and are not adequately covered by indemnities. Acquisitions could also result in dilutive issuances of equity securities or the incurrence of debt, which could adversely affect our operating results. If an acquired business or technology fails to meet our expectations, our operating results, business and financial condition may suffer.
Our ability to use our net operating loss carryforwards and certain other tax attributes may be limited.
At December 31, 2012 2013,we had federal net operating loss carryforwards of approximately $105.3 million and state net operating loss carryforwards of approximately $119.3$130.9 million. Under Sections 382 and 383 of the Internal Revenue Code of 1986, as amended, or the Code, if a corporation undergoes an “ownership change,” the corporation’s ability to use its pre-change net operating loss carryforwards and other pre-change tax attributes, such as research tax credits, to offset its post-change income and taxes may be limited. In general, an “ownership change” generally occurs if there is a cumulative change in our ownership by “5-percent shareholders” that exceeds 50 percentage points over a rolling three-year period. Similar rules may apply under state tax laws. We may have experienced an ownership change in the past and may experience ownership changes in the future as a result of future transactions in our stock, some of which may be outside our control. As a result, if we earn net taxable income, our ability to use our pre-change net operating loss carryforwards, or other pre-change tax attributes, to offset United States federal and state taxable income and taxes may be subject to limitations.
Our business is subject to the risks of tornadoes, floods, fires, earthquakes and other natural catastrophic events and to interruption by man-made problems such as computer viruses or terrorism.
Our systems and operations are vulnerable to damage or interruption from tornadoes, floods, fires, power losses, telecommunications failures, terrorist attacks, acts of war, human errors, break-ins or similar events. For example, a significant natural disaster, such as a tornado, fire or flood, could have a material adverse impact on our business, operating results and financial condition, and our insurance coverage may be insufficient to
24
compensate us for such losses that may occur. A portion of our technology team is located in the San Francisco Bay Area, a region known for seismic activity. In addition, acts of terrorism could cause disruptions in our business or the economy as a whole. Our servers may also be vulnerable to computer viruses, break-ins and similar disruptions from unauthorized tampering with our computer systems, which could lead to interruptions, delays, loss of critical data or the unauthorized disclosure of confidential customer data. We currently have limited disaster recovery capability, and our business interruption insurance may be insufficient to compensate us for losses that may occur. As we rely heavily on our servers, computer and communications systems and the Internet to conduct our business and provide high quality service to our members and service providers, such disruptions could negatively impact our ability to run our business, which could have an adverse effect on our operating results and financial condition.
Risks Related to Owning Our Common Stock
Our stock price may be volatile, and the value of an investment in our common stock may decline.
The trading price of our common stock has been, and is likely to continue to be volatile, and could decline substantially within a short period of time. For example, since shares of our common stock were sold in our initial public offering in November 2011 at a price of $13.00 per share, our trading price has ranged from $8.94 to $19.82.$28.32. The trading price of our common stock may be subject to wide fluctuations in response to various factors, some of which are beyond our control. In addition to the factors discussed in this “Risk Factors” section, these factors include:
our operating performance and the operating performance of similar companies;
• | our operating performance and the operating performance of similar companies; |
the overall performance of the equity markets;
• | the overall performance of the equity markets; |
the number of shares of our common stock publicly owned and available for trading;
• | the number of shares of our common stock publicly owned and available for trading; |
threatened or actual litigation;
• | threatened or actual litigation; |
changes in laws or regulations relating to our solutions;
• | changes in laws or regulations relating to our solutions; |
any major change in our board of directors or management;
• | any major change in our board of directors or management; |
publication of research reports about us or our industry or changes in recommendations or withdrawal of research coverage by securities analysts;
• | publication of research reports about us or our industry, changes in securities analysts’ projections or recommendations, withdrawal of research coverage, or our failure to meet analysts’ projections; |
large volumes of sales of shares of our common stock by existing stockholders; and
• | large volumes of sales of shares of our common stock by existing stockholders; and |
• | general political and economic conditions. |
general political and economic conditions.
In addition, the stock market has experienced extreme price and volume fluctuations that often have been unrelated or disproportionate to the operating performance of listed companies. Securities class action litigation has often been instituted against companies following periods of volatility in the overall market and in the market price of a company’s securities. This litigation, if institutedWe are currently the subject of multiple stockholder class action lawsuits. These lawsuits, and any future stockholder class action lawsuits initiated against us, could result in very substantial costs, divert our management’s attention and resources and harm our business, operating results and financial condition.
Future sales of our common stock by stockholders could depress the market price of our common stock.
As of December 31, 2012,2013, holders of approximately 16,478,94515,069,628 shares, or 29%26%, of our common stock vested stock options and options which vest within 60 days and their transferees have rights, subject to some conditions, to require us to file registration statements covering the sale of their shares or to include their shares in registration statements that we may file for ourselves or other stockholders. In addition, in November 2011, and March 2012 and October 2013, we filed registration statements on Form S-8 under the Securities Act to register an aggregate of 6,784,82710,830,475 shares of our common stock for issuance under our amended and restated omnibus incentive plan. This plan also provides for automatic increases in the shares
25
reserved for issuance under the plan. These shares may be sold in the public market upon issuance and,once vested, any restrictions providedareprovided under the terms of the applicable plan or award agreement. If these additional shares are sold, or if it is perceived that they will be sold, in the public market, the trading price of our common stock could decline.
We have incurred and will continue to incur increased costs as a result of becoming a reporting company.
We have faced and will continue to face increased legal, accounting, administrative and other costs as a result of becoming a reporting company. In additionWe are subject to Section 404 discussed above,the reporting requirements of the Securities Exchange Act of 1934, as amended, and related SEC rules implemented byand regulations, the SECDodd-Frank Act, the listing requirements of the NASDAQ Global Market and the Public Company Accounting Oversight Board have required changes in the corporate governance practices of public companies. We expectother applicable securities rules and regulations. Compliance with these rules and regulations to increasehas increased our legal and financial compliance costs and likely will continue to make legal, accounting and administrative activities more time-consuming and costly. For example, we expect to add independent directors and adopt policies regarding internal controls and disclosure controls and procedures. We are also incurring substantially higher costs to obtain directors’ and officers’ insurance than in prior periods.we did as a private company. In addition, as we gain experience with the costs associated with being a reporting company, we may identify and incur additional overhead costs.
If securities or industry analysts publish inaccurate or unfavorable research about our business, cease coverage of our company or make projections that exceed our actual results, our stock price and trading volume could decline.
The trading market for our common stock will be influenced by the research and reports that securities or industry analysts publish about us or our business. If one or more of the analysts who cover us downgrades our stock or publishes inaccurate or unfavorable research about our business, our stock price would likely decline. If one or more of these analysts ceases coverage of our company or fails to publish reports on us regularly, demand for our stock could decrease, which might cause our stock price and trading volume to decline.
Furthermore, such analysts publish their own projections regarding our actual results. These projections may vary widely from one another and may not accurately predict the results we actually achieve. Our stock price may decline if we fail to meet securities and analysts’ projections.
Concentration of ownership among our officers and directors and their affiliates may limit the influence of new investors on corporate decisions.
Our officers, directors and their affiliated funds beneficially own or control, directly or indirectly, approximately 29%27% of the outstanding shares of common stock. As a result, if some of these persons or entities act together, they will have significant influence over the outcome of matters submitted to our stockholders for approval, including the election of directors and approval of significant corporate transactions, such as a merger or other sale of our company or its assets. This concentration of ownership could limit the ability of other stockholders to influence corporate matters and may have the effect of delaying or preventing an acquisition or cause the market price of our stock to decline. Some of these persons or entities may have interests different from yours.
Certain provisions in our charter documents and Delaware law could discourage takeover attempts and lead to management entrenchment.
Our amended and restated certificate of incorporation and amended and restated bylaws contain provisions that could have the effect of delaying or preventing changes in control or changes in our management without the consent of our board of directors, including, among other things:
• | a classified board of directors with three year staggered terms, which could delay the ability of stockholders to replace a majority of our board of directors; |
• | no cumulative voting in the election of directors, which limits the ability of minority stockholders to elect director candidates; |
• | the ability of our board of directors to issue shares of preferred stock and to determine the price and other terms of those shares, including preferences and voting rights, without stockholder approval, which could be used to significantly dilute the ownership of a hostile acquiror; |
no cumulative voting in the election of directors, which limits the ability of minority stockholders to elect director candidates;
• | the exclusive right of our board of directors to elect a director to fill a vacancy created by the expansion of our board of directors or the resignation, death or removal of a director, which prevents stockholders from being able to fill vacancies on our board of directors; |
26
the ability of our board of directors to issue shares of preferred stock and to determine the price and other terms of those shares, including preferences and voting rights, without stockholder approval, which could be used to significantly dilute the ownership of a hostile acquiror;
• | a prohibition on stockholder action by written consent, which forces stockholder action to be taken at an annual or special meeting of our stockholders; |
the exclusive right of our board of directors to elect a director to fill a vacancy created by the expansion of our board of directors or the resignation, death or removal of a director, which prevents stockholders from being able to fill vacancies on our board of directors;
• | the requirement that a special meeting of stockholders may be called only by a majority vote of our Board of Directors, the Chairman of our Board of Directors, our Chief Executive Officer, our President or our Secretary, which could delay the ability of our stockholders to force consideration of a proposal or to take action, including the removal of directors; |
a prohibition on stockholder action by written consent, which forces stockholder action to be taken at an annual or special meeting of our stockholders;
• | the requirement for the affirmative vote of holders of at least 66 2/3% of the voting power of all of the then-outstanding shares of the voting stock, voting together as a single class, to amend the provisions of our amended and restated certificate of incorporation relating to the issuance of preferred stock and management of our business or our amended and restated bylaws, which may inhibit the ability of an acquiror to amend our amended and restated certificate of incorporation or amended and restated bylaws to facilitate a hostile acquisition; |
the requirement that a special meeting of stockholders may be called only by a majority vote of our Board of Directors, the Chairman of our Board of Directors, our Chief Executive Officer, our President or our Secretary, which could delay the ability of our stockholders to force consideration of a proposal or to take action, including the removal of directors;
• | the ability of our board of directors, by majority vote, to amend our amended and restated bylaws, which may allow our board of directors to take additional actions to prevent a hostile acquisition and inhibit the ability of an acquiror to amend our amended and restated bylaws to facilitate a hostile acquisition; and |
the requirement for the affirmative vote of holders of at least 66 2/3% of the voting power of all of the then-outstanding shares of the voting stock, voting together as a single class, to amend the provisions of our amended and restated certificate of incorporation relating to the issuance of preferred stock and management of our business or our amended and restated bylaws, which may inhibit the ability of an acquiror to amend our amended and restated certificate of incorporation or amended and restated bylaws to facilitate a hostile acquisition;
• | advance notice procedures with which stockholders must comply to nominate candidates to our board of directors or to propose matters to be acted upon at a stockholders’ meeting, which may discourage or deter a potential acquiror from conducting a solicitation of proxies to elect the acquiror’s own slate of directors or otherwise attempting to obtain control of us. |
the ability of our board of directors, by majority vote, to amend our amended and restated bylaws, which may allow our board of directors to take additional actions to prevent a hostile acquisition and inhibit the ability of an acquiror to amend our amended and restated bylaws to facilitate a hostile acquisition; and
advance notice procedures with which stockholders must comply to nominate candidates to our board of directors or to propose matters to be acted upon at a stockholders’ meeting, which may discourage or deter a potential acquiror from conducting a solicitation of proxies to elect the acquiror’s own slate of directors or otherwise attempting to obtain control of us.
We are also subject to certain anti-takeover provisions under the General Corporation Law of the State of Delaware, or the DGCL. Under Section 203 of the DGCL, a corporation may not, in general, engage in a business combination with any holder of 15% or more of its capital stock unless the holder has held the stock for three years or (i) our board of directors approves the transaction prior to the stockholder acquiring the 15% ownership position, (ii) upon consummation of the transaction that resulted in the stockholder acquiring the 15% ownership position, the stockholder owns at least 85% of the outstanding voting stock (excluding shares owned by directors or officers and shares owned by certain employee stock plans) or (iii) the transaction is approved by the board of directors and by the stockholders at an annual or special meeting by a vote of 66 2/3% of the outstanding voting stock (excluding shares held or controlled by the interested stockholder). These provisions in our amended and restated certificate of incorporation and amended and restated bylaws and under Delaware law could discourage potential takeover attempts.
We do not intend to pay dividends for the foreseeable future.
We never have declared or paid any cash dividends on our capital stock and do not intend to pay any cash dividends in the foreseeable future. In addition, our debt agreements restrict our ability to make distributions to our stockholders. We anticipate that we will retain any future earnings for use in the development of our business and for general corporate purposes. Any determination to pay dividends in the future will be at the discretion of our board of directors.
None.
27None.
We own approximately 100,000120,000 square feet of office space at our headquarters in Indianapolis, Indiana, which we purchased in 2012. In addition, we lease 20,000approximately 70,000 square feet of office space in Indianapolis, Indiana, Denver, Colorado and Palo Alto, California, pursuant to leases expiring in 2014.2014 and 2015. We believe our current facilities will be adequate or that additional space will be available to us on commercially reasonable terms for the foreseeable future.
Information pertaining to legal proceedings can be found in “Item 8. Financial Statements and Supplementary Data—NoteData —Note 9. Commitments and Contingencies” of this Annual Report on Form 10-K, and is incorporated by reference herein.
ITEM 4. MINE SAFETY DISCLOSURES
Not applicable.
PART II
28
ITEM 5. MARKET FOR REGISTRANT’S COMMON EQUITY, RELATED STOCKHOLDER MATTERS AND ISSUER PURCHASES OF EQUITY SECURITIESPART II
Our common stock has been listed on the Nasdaq Global Market under the symbol “ANGI” since our initial public offering on November 17, 2011. Prior to this time, there was no public market for our common stock. The following table shows the high and low sale prices per share of our common stock as reported on the Nasdaq Global Market for the periods indicated:
2013 | ||||||||
High | Low | |||||||
First Quarter | $ | 20.17 | $ | 11.14 | ||||
Second Quarter | $ | 27.66 | $ | 18.15 | ||||
Third Quarter | $ | 28.32 | $ | 19.05 | ||||
Fourth Quarter | $ | 22.62 | $ | 11.88 | ||||
2012 | ||||||||
High | Low | |||||||
First Quarter | $ | 19.82 | $ | 12.81 | ||||
Second Quarter | $ | 18.78 | $ | 11.77 | ||||
Third Quarter | $ | 16.06 | $ | 8.94 | ||||
Fourth Quarter | $ | 12.08 | $ | 8.95 | ||||
| 2011 | ||||||||
| High | Low | |||||||
Fourth Quarter | $ | 18.75 | $ | 10.77 | ||||
As of February 14, 2013,13, 2014, we had approximately 1,0503,200 holders of record of our common stock. The number of beneficial stockholders is substantially greater than the number of holders of record because a large portion of our common stock is held through brokerage firms.
We have never declared or paid, and do not anticipate declaring or paying, any cash dividends on our common stock. Any future determination as to the declaration and payment of dividends, if any, will be at the discretion of our board of directors and will depend on then existing conditions, including our financial condition, operating results, contractual restrictions, capital requirements, business prospects and other factors our board of directors may deem relevant.
For equity compensation plan information refer to Item 12 in Part III of this Annual Report on Form 10-K.
Performance Graph
This performance graph shall not be deemed “filed” with the Securities and Exchange Commission for purposes of Section 18 of the Exchange Act, or otherwise subject to the liabilities under that Section, and shall not be deemed to be incorporated by reference into any filing of Angie’s List, Inc. under the Securities Act, except as shall be expressly set forth by specific reference in such filing.
29
The following graph shows a comparison from November 17, 2011 (the date our common stock commenced trading on the Nasdaq Global Market) through December 31, 20122013 of cumulative total return for our common stock, the Nasdaq Composite Index and the RDG Internet Composite Index. Such returns are based on historical results and are not intended to suggest future performance. Data for the Nasdaq Composite Index and the RDG Internet Composite Index assume reinvestment of dividends.

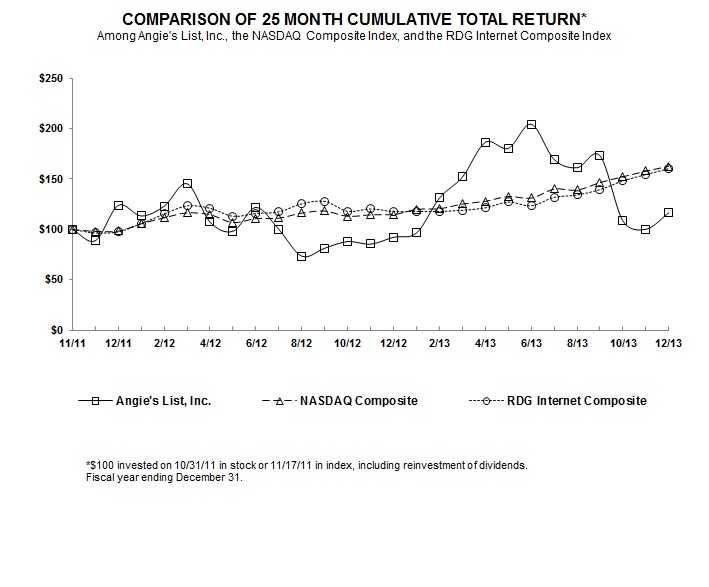
| 11/11 | 11/11 | 12/11 | 1/12 | 2/12 | 3/12 | 4/12 | 5/12 | 6/12 | 7/12 | 8/12 | 9/12 | 10/12 | 11/12 | 12/12 | 11/11 | 11/11 | 12/11 | 3/12 | 6/12 | 9/12 | 12/12 | 3/13 | 6/13 | 9/13 | 12/13 | |||||||||||||||||||||||||||||||||||||||||||||||||||||||||||||||||||||||||||||||
Angie’s List, Inc. | 100.00 | 88.88 | 123.85 | 113.38 | 123.08 | 145.31 | 107.31 | 98.23 | 121.85 | 100.00 | 73.54 | 81.38 | 88.00 | 85.46 | 92.23 | 100.00 | 88.88 | 123.85 | 145.31 | 121.85 | 81.38 | 92.23 | 152.00 | 204.31 | 173.00 | 116.54 | ||||||||||||||||||||||||||||||||||||||||||||||||||||||||||||||||||||||||||||||
NASDAQ Composite | 100.00 | 98.59 | 98.88 | 104.22 | 108.89 | 112.93 | 111.90 | 104.90 | 109.79 | 110.31 | 114.16 | 115.53 | 110.85 | 111.12 | 111.06 | 100.00 | 98.59 | 98.88 | 112.93 | 109.79 | 115.53 | 111.06 | 125.24 | 131.16 | 146.57 | 162.74 | ||||||||||||||||||||||||||||||||||||||||||||||||||||||||||||||||||||||||||||||
RDG Internet Composite | 100.00 | 96.54 | 97.63 | 105.55 | 115.20 | 123.61 | 122.17 | 115.35 | 117.15 | 117.26 | 124.67 | 127.66 | 118.25 | 118.78 | 116.03 | 100.00 | 96.54 | 97.63 | 123.61 | 117.15 | 127.66 | 116.03 | 119.03 | 123.52 | 139.64 | 160.39 | ||||||||||||||||||||||||||||||||||||||||||||||||||||||||||||||||||||||||||||||
Use of Proceeds
On November 17, 2011, our registration statement on Form S-1 (File No. 333-176503) was declared effective for our initial public offering. There have been no changes regarding the use of proceeds from our initial public offering from the disclosure in our Annual Report on Form 10-K for the fiscal year ended December 31, 2012.
30
The following selected consolidated financial and other data regarding our business should be read in conjunction with, and are qualified by reference to, “Management’s Discussion and Analysis of Financial Condition and Results of Operations” and our consolidated financial statements and related notes included elsewhere in this report. Our historical results are not necessarily indicative of results to be expected in any future period.
| Years Ended December 31, | ||||||||||||||||||||
| 2012 | 2011 | 2010 | 2009 | 2008 | ||||||||||||||||
Revenue | ||||||||||||||||||||
Membership | $ | 47,717 | $ | 33,815 | $ | 25,149 | $ | 20,434 | $ | 15,935 | ||||||||||
Service provider | 108,082 | 56,228 | 33,890 | 25,166 | 17,929 | |||||||||||||||
|
|
|
|
|
|
|
|
|
| |||||||||||
Total revenue | 155,799 | 90,043 | 59,039 | 45,600 | 33,864 | |||||||||||||||
Operating expenses | ||||||||||||||||||||
Operations and support | 27,081 | 16,417 | 12,464 | 11,654 | 12,164 | |||||||||||||||
Selling | 58,596 | 33,815 | 16,892 | 12,671 | 10,098 | |||||||||||||||
Marketing | 80,230 | 56,122 | 30,237 | 16,114 | 14,941 | |||||||||||||||
Technology(1) | 16,870 | 9,109 | 6,270 | 5,062 | 4,610 | |||||||||||||||
General and administrative(1) | 24,055 | 18,740 | 16,302 | 8,699 | 8,773 | |||||||||||||||
|
|
|
|
|
|
|
|
|
| |||||||||||
Operating loss | (51,033 | ) | (44,160 | ) | (23,126 | ) | (8,600 | ) | (16,722 | ) | ||||||||||
Interest expense | 1,856 | 3,004 | 3,966 | 3,381 | 3,126 | |||||||||||||||
Loss on debt extinguishment | — | 1,830 | — | — | 469 | |||||||||||||||
Loss before income taxes | (52,889 | ) | (48,994 | ) | (27,092 | ) | (11,981 | ) | (20,317 | ) | ||||||||||
Income tax expense | 5 | 43 | 154 | — | — | |||||||||||||||
|
|
|
|
|
|
|
|
|
| |||||||||||
Net loss | $ | (52,894 | ) | $ | (49,037 | ) | $ | (27,246 | ) | $ | (11,981 | ) | $ | (20,317 | ) | |||||
|
|
|
|
|
|
|
|
|
| |||||||||||
Net loss per common share—basic and diluted | $ | (0.92 | ) | $ | (1.60 | ) | $ | (0.99 | ) | $ | (0.45 | ) | $ | (0.75 | ) | |||||
|
|
|
|
|
|
|
|
|
| |||||||||||
Weighted average number of common shares outstanding— basic and diluted(2) | 57,485,589 | 30,655,532 | 27,603,927 | 26,666,918 | 26,935,785 | |||||||||||||||
|
|
|
|
|
|
|
|
|
| |||||||||||
(1) Includes non-cash stock-based compensation as follows: |
| |||||||||||||||||||
Technology | $ | 762 | $ | 786 | $ | 496 | $ | — | $ | — | ||||||||||
General and administrative | 2,181 | 3,056 | 6,203 | 76 | 77 | |||||||||||||||
|
|
|
|
|
|
|
|
|
| |||||||||||
| $ | 2,943 | $ | 3,842 | $ | 6,699 | $ | 76 | $ | 77 | |||||||||||
|
|
|
|
|
|
|
|
|
| |||||||||||
(2) The weighted average number of common shares for all periods prior to April 30, 2010 is based on member units assuming conversion to common stock at the applicable rates effective upon reorganization as a corporation on April 30, 2010. |
| |||||||||||||||||||
| Years Ended December 31, | ||||||||||||||||||||
| 2012 | 2011 | 2010 | 2009 | 2008 | ||||||||||||||||
Other Data (unaudited): | ||||||||||||||||||||
Total paid memberships (end of period)(1) | 1,787,394 | 1,074,757 | 602,882 | 411,727 | 333,489 | |||||||||||||||
Gross paid memberships added (in period)(2) | 1,092,935 | 716,350 | 355,580 | 219,140 | 193,011 | |||||||||||||||
Marketing cost per paid membership acquisition (in period)(3) | $ | 73 | $ | 78 | $ | 85 | $ | 74 | $ | 77 | ||||||||||
First-year membership renewal rate (in period)(4) | 75 | % | 75 | % | 70 | % | 67 | % | 62 | % | ||||||||||
Average membership renewal rate (in period)(4) | 78 | % | 78 | % | 75 | % | 73 | % | 70 | % | ||||||||||
Participating service providers (end of period)(5) | 35,952 | 24,095 | 15,060 | 10,415 | 7,960 | |||||||||||||||
Total service provider contract value (end of period, in thousands)(6) | $ | 132,646 | $ | 73,609 | $ | 43,050 | $ | 30,849 | $ | 22,489 | ||||||||||
31
Years Ended December 31, | ||||||||||||||||||||
2013 | 2012 | 2011 | 2010 | 2009 | ||||||||||||||||
Revenue | ||||||||||||||||||||
Membership | $ | 65,307 | $ | 47,717 | $ | 33,815 | $ | 25,149 | $ | 20,434 | ||||||||||
Service provider | 180,335 | 108,082 | 56,228 | 33,890 | 25,166 | |||||||||||||||
Total revenue | 245,642 | 155,799 | 90,043 | 59,039 | 45,600 | |||||||||||||||
Operating expenses | ||||||||||||||||||||
Operations and support(1) | 40,072 | 27,081 | 16,417 | 12,464 | 11,654 | |||||||||||||||
Selling(1) | 90,143 | 58,596 | 33,815 | 16,892 | 12,671 | |||||||||||||||
Marketing | 87,483 | 80,230 | 56,122 | 30,237 | 16,114 | |||||||||||||||
Technology(1) | 26,197 | 16,870 | 9,109 | 6,270 | 5,062 | |||||||||||||||
General and administrative(1) | 32,828 | 24,055 | 18,740 | 16,302 | 8,699 | |||||||||||||||
Operating loss | (31,081 | ) | (51,033 | ) | (44,160 | ) | (23,126 | ) | (8,600 | ) | ||||||||||
Interest expense | 1,868 | 1,856 | 3,004 | 3,966 | 3,381 | |||||||||||||||
Loss on debt extinguishment | — | — | 1,830 | — | — | |||||||||||||||
Loss before income taxes | (32,949 | ) | (52,889 | ) | (48,994 | ) | (27,092 | ) | (11,981 | ) | ||||||||||
Income tax expense | 40 | 5 | 43 | 154 | — | |||||||||||||||
Net loss | $ | (32,989 | ) | $ | (52,894 | ) | $ | (49,037 | ) | $ | (27,246 | ) | $ | (11,981 | ) | |||||
Net loss per common share—basic and diluted | $ | (0.57 | ) | $ | (0.92 | ) | $ | (1.60 | ) | $ | (0.99 | ) | $ | (0.45 | ) | |||||
Weighted average number of common shares outstanding— basic and diluted(2) | 58,230,927 | 57,485,589 | 30,655,532 | 27,603,927 | 26,666,918 | |||||||||||||||
(1) Includes non-cash stock-based compensation as follows: | ||||||||||||||||||||
Operations and support | $ | 64 | $ | — | $ | — | $ | — | $ | — | ||||||||||
Selling | 147 | — | — | — | — | |||||||||||||||
Technology | 17 | 762 | 786 | 496 | — | |||||||||||||||
General and administrative | 3,836 | 2,181 | 3,056 | 6,203 | 76 | |||||||||||||||
| $ | 4,064 | $ | 2,943 | $ | 3,842 | $ | 6,699 | $ | 76 | |||||||||||
(2) | The weighted average number of common shares for all periods prior to April 30, 2010 is based on member units assuming conversion to common stock at the applicable rates effective upon reorganization as a corporation on April 30, 2010. |
Years Ended December 31, | ||||||||||||||||||||
2013 | 2012 | 2011 | 2010 | 2009 | ||||||||||||||||
Other Data (unaudited): | ||||||||||||||||||||
Total paid memberships (end of period)(1) | 2,484,059 | 1,787,394 | 1,074,757 | 602,882 | 411,727 | |||||||||||||||
Gross paid memberships added (in period)(2) | 1,218,258 | 1,092,935 | 716,350 | 355,580 | 219,140 | |||||||||||||||
Marketing cost per paid membership acquisition (in period)(3) | $ | 72 | $ | 73 | $ | 78 | $ | 85 | $ | 74 | ||||||||||
First-year membership renewal rate (in period)(4) | 74 | % | 75 | % | 75 | % | 70 | % | 67 | % | ||||||||||
Average membership renewal rate (in period)(4) | 78 | % | 78 | % | 78 | % | 75 | % | 73 | % | ||||||||||
Participating service providers (end of period)(5) | 46,329 | 35,952 | 24,095 | 15,060 | 10,415 | |||||||||||||||
Total service provider contract value (end of period, in thousands)(6) | $ | 194,137 | $ | 132,646 | $ | 73,609 | $ | 43,050 | $ | 30,849 | ||||||||||
(1) | Reflects the number of paid memberships at the end of each period presented. Total paid memberships also includes a de minimis number of complimentary memberships in our paid markets for all periods presented. The number of memberships lost during the periods presented were 521,593, 380,298, 244,475, 164,425, and 140,902 |
(2) | Reflects the total number of new paid memberships added in a reporting period. |
(3) | Reflects marketing expense divided by gross paid memberships added in a reporting period. |
(4) | First-year membership renewal rate reflects the percentage of paid memberships expiring in the reporting period after the first year of membership that are renewed, and average membership renewal rate reflects the percentage of all paid memberships expiring in the reporting period that are renewed. Renewal rates exclude monthly memberships. |
(5) | Reflects the total number of service providers under contract for advertising at the end of the period. |
(6) | Reflects the total contract value of active service provider contracts at the end of the period. Contract value is the total payment obligation, including amounts already recognized in revenue, of a service provider to us over the stated term of the contract. |
| As of December 31, | ||||||||||||||||||||||||||||||||||||||||
| 2012 | 2011 | 2010 | 2009 | 2008 | As of December 31, | |||||||||||||||||||||||||||||||||||
| (Unaudited) | 2013 | 2012 | 2011 | 2010 | 2009 | |||||||||||||||||||||||||||||||||||
Balance Sheet Data: | ||||||||||||||||||||||||||||||||||||||||
Cash and cash equivalents | $ | 42,638 | $ | 88,607 | $ | 9,209 | $ | 2,016 | $ | 7,786 | $ | 34,803 | $ | 42,638 | $ | 88,607 | $ | 9,209 | $ | 2,016 | ||||||||||||||||||||
Short-term investments | 10,460 | — | — | — | — | 21,055 | 10,460 | — | — | — | ||||||||||||||||||||||||||||||
Working capital | 9,411 | 58,085 | (18,378 | ) | (15,331 | ) | (3,924 | ) | (21,672 | ) | 9,411 | 58,085 | (18,378 | ) | (15,331 | ) | ||||||||||||||||||||||||
Total assets | 96,229 | 111,398 | 22,601 | 12,299 | 18,737 | 105,643 | 96,229 | 111,398 | 22,601 | 12,299 | ||||||||||||||||||||||||||||||
Total deferred revenue | 55,331 | 34,786 | 23,261 | 18,024 | 14,380 | 80,438 | 55,331 | 34,786 | 23,261 | 18,024 | ||||||||||||||||||||||||||||||
Long-term debt, including accrued interest | 14,869 | 14,820 | 16,463 | 22,503 | 22,987 | 14,918 | 14,869 | 14,820 | 16,463 | 22,503 | ||||||||||||||||||||||||||||||
Common stock and additional paid-in capital | 248,392 | 236,015 | 85,486 | — | — | 257,572 | 248,392 | 236,015 | 85,486 | — | ||||||||||||||||||||||||||||||
Stockholders’ and members’ equity (deficit) | 5,319 | 45,836 | (33,757 | ) | (36,268 | ) | (24,677 | ) | ||||||||||||||||||||||||||||||||
Stockholders’ equity (deficit) | (18,490 | ) | 5,319 | 45,836 | (33,757 | ) | (36,268 | ) | ||||||||||||||||||||||||||||||||
ITEM 7. MANAGEMENT’S DISCUSSION AND ANALYSIS OF FINANCIAL CONDITION AND RESULTS OF OPERATIONS
32
You should read the following discussion and analysis of our financial condition and results of operations in conjunction with our consolidated financial statements and the notes thereto included elsewhere in this report. The following discussion contains forward-looking statements that reflect our plans, estimates and beliefs. Our actual results could differ materially from those discussed in the forward-looking statements. Factors that could cause or contribute to these differences include those discussed below and elsewhere in this report, particularly in the “Risk Factors” section.
Overview
We operate a consumer-driven service for our members to research, hire, rate, review, and reviewpurchase local professionalsservices for critical needs, such as home, health care and automotive services. Our ratings and reviews, which are available only to our members, help our members find the best provider for their local service needs. We had more than 1.7approximately 2.5 million paid memberships as of December 31, 2012.2013. We allow local service providers who are highly rated by our members to advertise discounts and other promotions to our members.
We generate revenue from both our members and our service providers. We derive membership revenue from subscription fees and, in certain cases, non-refundable initiation fees for monthly, annual and multi-year memberships. These fees typically are charged in advance. Subscription fees are recognized ratably over the subscription period,and initiation fees are recognized ratably over the expected life of the membership. As of December 31, 2012,2013, approximately 91%94% of our total membership base had purchased annual or multi-year memberships. These subscription fees represent a significant source of working capital and provide a relatively predictable revenue stream.
We derive service provider revenue principally from term-based sales of advertising to local service providers. Our members grade local service providers on an “A” to “F” scale, and we invite local service providers with an average grade of “B” or better and at least two reviews submitted in the last three years to advertise to our members through any or all of our website, email promotions, monthly magazine and call center. As of December 31, 2012 2013,approximately 332,000452,000 local service providers rated by our members were eligible to offer discounts and other promotions to our members based on these criteria. Service provider contracts can be prepaid or invoiced monthly at the option of the service provider and carry an early termination penalty. We recognize service provider revenue ratably over the period in which an advertising campaign is run. We are expanding our service provider sales forcepersonnel to drive increased service provider revenue. Our high service provider renewal rates, both in number of service providers renewing and as a percentage of initial contract value renewed, have provided us with a relatively predictable revenue stream.
In addition to traditional advertising on our website and publications, our e-commerce solutions offer our members the opportunity to purchase services through us from service providers rated highly on our website. These offerings are available through both email promotions and through postings on our website. When the member purchases the service, the transaction is processed through Angie’s List. The member then can work directly with the service provider to schedule the service. These e-commerce offerings provide our members a discount and an easier way to fulfill their service needs.
To establish a new market, we begin by offering free memberships and actively soliciting members’ reviews of local service providers. As the number of members and the number of reviews of service providers grow, we begin charging membership fees and offering advertising opportunities to eligible local service providers. Historically, we have begun to convert most markets to paid membership status within 24 months after launch.
Increasing new paid memberships is oura key growth strategy. Increased penetration in a market results in more member reviews of local service providers, which increases the value of our service to consumers and
33
drives further membership growth in that market. Increased penetration in a market also drives increased advertising sales to service providers and supports higher advertising rates as the pool of members actively seeking to hire service providers grows. However, our ability to increase advertising rates tends to lag increased penetration of our markets due to our inability to increase rates under existing service provider contracts prior to renewal. Our primary strategy for new member acquisition is national offline and online advertising. We expect marketing expense to increase in future periods as we continue to advertise to acquire new paid memberships.
As described further in the “Market Cohort Analysis” below, we believe that our estimated penetration rate and average revenue per market will increase as markets mature, and over the long term, we believe that these increased revenues will more than offset our operating expenses. In addition, our advertising spending which is our single largest operating expense, is related tofocused on the acquisition of new members, rather than the maintenance of existing members. Because ourGiven thatour advertising contracts are typically are short-term, we can rapidly adjust marketing expense and thus decrease total operating expenses to reduce cash used in operations or generate cash and profits from operations should we begin to experience adverse trends in marketing cost per paid membership acquisition or wish to optimize for profitability at the expense of rapid growth. We believe that our high membership renewal rates and “word of mouth” referrals from existing members, combined with effective purchasing of lower volumes of advertising and increasing utilization of search engine optimization, or SEO, would enable us to maintain and potentially grow the size of our paid membership base at a lower level of overall advertising spending.
From our inception in 1995 through 2000, we operated primarily as a call center service in mid-sized markets such as Indianapolis, Charlotte, Cleveland and Tampa. In February 2001, we launched our website, www.AngiesList.com, in all 10 of our then-established markets, and almost immediately www.AngiesList.com became our primary service platform. In 2006, we set out to expand our operations to cover all major U.S. metropolitan markets and establish a national footprint, and today Angie’s List is operating in 219 paid membership markets across the country.
Recent Developments
Follow-on offering
On August 2, 2013, we acquired substantially all of stock
In May 2012, we completedthe assets of SmartHabitat, Inc. (“BrightNest”) for a secondary public offeringpurchase price of 8,629,797 shares$2.7 million. The purchase price consists of our common stock, which included 703,235 shares$2.2 million in cash paid at closing and an additional $0.5 million that is payable on the one-year anniversary of common stock soldthe closing, subject to certain performance criteria of BrightNest employees hired by us on the acquisition date. The acquisition of the BrightNest assets adds a user-friendly front end and 7,926,562 sharespersonalized member experience with expanded content offerings and enhanced technologies. Revenues and expenses related to BrightNest, which were not material for the period ended December 31, 2013, are included in the consolidated results of common stock sold by the selling stockholders (inclusive of 189,374 shares of common stockoperations from the partial exercisedate of the over-allotment option granted to the underwriters). The price to the public of the shares sold in the offering was $13.00. Proceeds to us were approximately $8.7 million, net of underwriting discounts and commissions. Proceeds to the selling stockholders were approximately $98.2 million, net of underwriting discounts and commissions. We did not receive any proceeds from the sale of shares by the selling stockholders. Total underwriting discounts and commissions were $5.3 million. We incurred fees resulting from the transaction of approximately $0.8 million, of which $0.1 million is included in additional paid–in-capital and $0.7 million is included in general and administrative expenses.
Technology developments
In order to improve our product offerings and grow our technology platforms, we established a technology presence in Palo Alto, California in 2012. With the addition of these new technology engineers in Palo Alto, along with other technology hires, we are working to improve our website functionality and product offerings for our members and service providers and the efficiency of member acquisition in our overall operations.
Selling expense developments
In the fourth quarter of 2012, we commenced the transition to a new compensation plan for our sales force responsible for new advertising originations whereby we have begun to pay commissions as cash is collected
34
from our service providers rather than upfront at booking, as we have done historically. This change, once fully implemented during 2013, is expected to reduce growth in our prepaid expenses and therefore have a positive impact on our operating cash flows, as it will allow us to grow newly originated service provider revenue on a primarily self-funded basis. To minimize the disruption to our sales force, we are transitioning to the new compensation plan gradually over a nine-month period. The new compensation plan also implemented a base salary, plus commission structure in lieu of our historical “commission only” structure for our sales force. Because the base portion of compensation will be earned and recognized within the same period as it is paid, irrespective of revenue recognition, we expect to see higher selling expense as a percent of revenue in the near-term as we make this transition and the legacy “commission only” contracts run off.
Market Cohort Analysis
To analyze our progress in executing our expansion plan, we compile certain financial and operating data regarding markets we have entered,grouped by the years in which the markets transitioned to paid membership status. The table below summarizes this data for 20122013 by the following cohorts. The pre-2003 cohort includes our ten most established markets, where we initially built out our business model. The markets in this cohort include several mid-sized urban markets in the midwest as well as Chicago and Boston. The 2003 through 2007 cohort includes the first major subset of markets, including many of our largest potential markets, that we targeted in our national expansion strategy. The markets in these older cohorts generally have begun to achieveachieved penetration rates that allow us to transition beyond introductory membership and advertising rates. The 2008-2010 and post-2010 cohorts include markets that have most recently converted to paid status and that still have predominantly introductory membership and advertising rates. The markets in these cohorts generally are smaller markets that we entered to fill out our national presence.
Cohort | # of Markets | Avg. Revenue/ Market(1) | Membership Revenue/Paid Membership(2) | Service Provider Revenue/Paid Membership(3) | Avg. Marketing Expense/ Market(4) | Total Paid Memberships(5) | Estimated Penetration Rate(6) | Annual Membership Growth Rate(7) | # of | Avg. | Membership | Service | Avg. Marketing | Total Paid | Estimated | Annual | ||||||||||||||||||||||||||||||||||||||||||||||||
Pre-2003 | 10 | $ | 4,689,796 | $ | 43.08 | $ | 111.48 | $ | 1,241,670 | 358,180 | 8.5 | % | 44 | % | 10 | $ | 6,329,201 | $ | 39.16 | $ | 113.65 | $ | 1,317,075 | 470,206 | 11.5 | % | 31 | % | ||||||||||||||||||||||||||||||||||||
2003-2007 | 35 | 2,716,037 | 37.59 | 85.12 | 1,292,726 | 973,101 | 6.3 | % | 69 | % | 35 | 4,385,040 | 34.39 | 97.74 | 1,384,373 | 1,350,130 | 9.0 | % | 39 | % | ||||||||||||||||||||||||||||||||||||||||||||
2008-2010 | 103 | 125,483 | 15.86 | 23.66 | 182,286 | 414,710 | 6.5 | % | 73 | % | 103 | 253,976 | 16.84 | 36.08 | 193,802 | 574,024 | 9.3 | % | 38 | % | ||||||||||||||||||||||||||||||||||||||||||||
Post 2010 | 71 | 10,606 | 12.92 | 16.05 | 52,555 | 41,403 | 3.3 | % | n/a | 105 | 24,119 | 12.46 | 26.17 | 56,170 | 89,699 | 4.9 | % | n/a | ||||||||||||||||||||||||||||||||||||||||||||||
|
| |||||||||||||||||||||||||||||||||||||||||||||||||||||||||||||||
Total | 219 | 1,787,394 | 253 | 2,484,059 | ||||||||||||||||||||||||||||||||||||||||||||||||||||||||||||
(1) | Average revenue per market is calculated by dividing the revenue recognized for the markets in a given cohort by the number of markets in the cohort at year end. |
(2) | Membership revenue per paid membership is calculated as our membership revenue in the cohort divided by the average number of paid memberships in the cohort. We calculate this average per market to facilitate comparisons among cohorts, but it is not intended to represent typical characteristics of actual markets within the cohort. |
(3) | Service provider revenue per paid membership is calculated as service provider revenue in the cohort divided by the average number of paid memberships in the cohort. We calculate this average per market to facilitate comparisons among cohorts, but it is not intended to represent typical characteristics of actual markets within the cohort. |
(4) | Average marketing expense per market is calculated first by allocating marketing expense to each cohort based on the percentage of our total target demographic for all markets in such cohort, as determined by third-party data, and then dividing the allocated cohort marketing expense by the number of markets in the cohort at year end. We calculate this average per market to facilitate comparisons among cohorts, but it is not intended to represent typical characteristics of actual markets within the cohort. According to a January |
35
(5) | Includes total paid memberships as of December 31, |
(6) | Estimated penetration rate is calculated by dividing the number of paid memberships in a given cohort as of December 31, |
(7) | Annual membership growth rate is the rate of increase in the total number of paid memberships in the cohort between December 31, |
Our average revenue per market and total revenue per paid membership have generally increaseincreased with the maturity and corresponding increased penetration of our markets. However,markets in prior periods. In the future, we may experience decliningexpect total revenue per paid membership overall or in some market cohorts. A decline reflects a lag into fluctuate from period to period, reflecting the timing of our ability to leverage increased penetration in a market into increasedadjust advertising rates asgiven our average advertising contract term in effect as of December 31, 2012 was more than 12 monthsterms and we are only ablemembership pricing innovations designed to increase rates for a given participating service provider upon contract renewal. In addition, the decline reflects rapiddrive increased penetration. For example:
● | Our average advertising contract term is typically more than one year, and we are only able to increase rates for a given participating service provider upon contract renewal. As such, there is a lag in our ability to leverage increased penetration in a market into increased advertising rates; |
● | In 80 of our markets, we offer members the opportunity to purchase only those segments of Angie’s List that are most relevant to them, which includes the original Angie’s List (covering 396 categories, including home, lawn, car and pets), Angie’s List Health & Wellness or Angie’s List Classic Cars. These segments continue to be offered in all other markets as a single bundle. We anticipate unbundling our offerings in more of our markets as market penetration increases and the number and categories of local service providers reviewed by members in such markets grow. We believe this pricing model enables us to offer a better value proposition to our members and preserve cross-selling opportunities as members’ needs evolve, although we also expect that this strategy may result in lower average membership fees per paid membership overall; |
● | Increasingly we are seeing members opt for annual memberships, and as such, the percentage of our membership base on monthly memberships has declined. While we believe annual memberships are more beneficial to members and promote high renewal rates, these memberships generate lower proceeds than monthly memberships taken on an annualized basis; and |
● | In certain markets we have elected to retain lower membership pricing than we have historically used to drive deeper penetration. |
Our most important growth strategy remains driving increased membership growth, which creates the network effects of a more valuable service for consumers and a more attractive commercial platform for service providers. We intend to continue to evaluate and adopt innovative pricing and packaging strategies, such as deeply reduced membership pricing, to deliver compelling value to our members and thereby support membership growth and retention. Although these overall dynamics have caused and may continue to cause membership revenue per paid membership to decline sequentially in less penetrated markets wheresome of our cohorts, we believe that the increase in our membership base is critical for continuing to produce the overall growth in average membership andrevenue per market, service provider revenue per paid member is lower than in more penetrated markets. We also have adopted a dynamic pricing model in 68 of our mature markets to offer members the opportunity to purchase only those segments of Angie’s List that are most relevant to them. These segments continue to be offered in all other markets as a single bundle. We anticipate unbundling our offerings in more of our markets as market penetration increasesmembership and the number and categories of local service providers reviewed by members in such markets grow. We believe this pricing model will enable us to offer a better value proposition to our members and preserve cross-selling opportunities as members’ needs evolve. Although we expect that this strategy may result in lower average membership feestotal revenue per paid membership overall,across all cohorts that we believe the new members generated by this pricing model should ultimately produce increased service provider revenue per paid membership.have experienced.
As a market matures, our penetration rate typically increases. Historically, while the absolute number of paid members may grow faster in large markets, our small and medium markets have often achieved greater penetration over a shorter time period than our larger markets. We believe that a principal reason for our lower penetration rates in large markets is the manner in which we market Angie’s List to our target demographic in such markets. We have chosen to spend 100%the majority of our marketing dollars on national advertising. We believe that this advertising strategy provides us the most cost effective and efficient manner of acquiring new paid memberships. However, advertising nationally means we deliver the same volume of advertising regardless of the size of the market. Since each market differs in terms of the number of advertising outlets available, the impact of our spending on national advertising varies across markets. In our experience, smaller markets typically have fewer advertising outlets than larger markets. We believe the same volume of advertising in a smaller market is more effective in building brand awareness and generating new memberships than in larger markets. We expect to continue to see lower relative penetration rates in our larger markets for these reasons.
At least annually, we receive updated demographic data As several of these larger markets are in the total addressable market and in the markets in which we offer paid memberships. In periods where there is a significant increase in the demographic base in a particular2003-2007 cohort, over time our penetration rate in this cohort may remain steady or fall. From 2011 to 2012, the total addressable demographic in the United States increased from approximately 29 million to 31 million households, and our total addressable demographic in the markets in which we offer paid memberships increased from approximately 25 million to 27 million households.lag other cohorts.
Key Operating Metrics
In addition to the line items in our financial statements, we regularly review a number of other operating metrics related to our membership and service provider bases to evaluate our business, determine the allocation of resources and make decisions regarding business strategies. We believe information on these metrics is useful
36
for investors and analysts to understand the underlying trends in our business. The following table summarizes our key operating metrics, which are unaudited, for the years ended December 31, 2013, 2012 2011 and 2010:2011:
| Years Ended December 31, | Years Ended December 31, | |||||||||||||||||||||||
| 2012 | 2011 | 2010 | 2013 | 2012 | 2011 | |||||||||||||||||||
Total paid memberships (end of period) | 1,787,394 | 1,074,757 | 602,882 | 2,484,059 | 1,787,394 | 1,074,757 | ||||||||||||||||||
Gross paid memberships added (in period) | 1,092,935 | 716,350 | 355,580 | 1,218,258 | 1,092,935 | 716,350 | ||||||||||||||||||
Marketing cost per paid membership acquisition (in period) | $ | 73 | $ | 78 | $ | 85 | $ | 72 | $ | 73 | $ | 78 | ||||||||||||
First-year membership renewal rate (in period) | 75 | % | 75 | % | 70 | % | 74 | % | 75 | % | 75 | % | ||||||||||||
Average membership renewal rate (in period) | 78 | % | 78 | % | 75 | % | 78 | % | 78 | % | 78 | % | ||||||||||||
Participating service providers (end of period) | 35,952 | 24,095 | 15,060 | 46,329 | 35,952 | 24,095 | ||||||||||||||||||
Total service provider contract value (end of period, in thousands) | $ | 132,646 | $ | 73,609 | $ | 43,050 | $ | 194,137 | $ | 132,646 | $ | 73,609 | ||||||||||||
Total paid memberships.Total paid memberships reflects the number of paid memberships at the end of each period presented. Total paid memberships also includes a de minimis number of complimentary memberships in our paid markets for all periods presented. We generally expect that there will be one membership per household and, as such, each membership may actually represent multiple individual consumers.
Gross paid memberships added. Gross paid memberships added reflects the total number of new paid memberships added in a reporting period. Gross paid memberships added increased substantially in each period presented, which we believe has been driven by our increasing investment in national advertising and, to a lesser extent, by “word of mouth” referrals from our existing members.
Marketing cost per paid membership acquisition. We calculate marketing cost per paid membership acquisition in a reporting period as marketing expense divided by gross paid memberships added in that period. BecauseAs we advertise in national media, some of our marketing expense also increases the number of unpaid memberships. On a comparative basis, marketing cost per paid membership acquisition can reflect our success in generating new paid memberships through our SEO efforts and “word of mouth” referrals and experimentation and adjustments to our marketing expense to focus on more effective advertising outlets for membership acquisition. We typically have higher marketing expense in the second and third quarters of the year in order to attract consumers during the periods when we have found they are most actively seeking Angie’s List services. Our marketing expense is normally reduced in the fourth quarter, reflecting reduced consumer activity in the service sector and higher advertising rates generally due to holiday promotional activity.
Membership renewal rates. First-year membership renewal rate reflects the percentage of paid memberships expiring in the reporting period after the first year of membership that are renewed. Average membership renewal rate reflects the percentage of all paid memberships expiring in the reporting period that are renewed. Renewal rates do not include monthly memberships, which comprised approximately 9%6% of our total membership base as of December 31, 2012.2013. Given the correlation between increased penetration and higher total revenue per paid membership, we view first-year membership renewal rate and average membership renewal rate as key indicators of expected operating results in future periods.
Participating service providers. We include in participating service providers the total number of service providers under contract for advertising at the end of the period.
Total service provider contract value. We calculate service provider contract value as the total contract value of active service provider contracts at the end of the period. Contract value is the total payment obligation of a service provider to us, including amounts already recognized in revenue, over the stated term of the contract.
In addition, we also track contract value backlog as a key metric. Contract value backlog consists of the portion of service provider contract value at the stated date which has not yet been recognized as revenue. At December 31, 20122013 and 2011,2012, our contract value backlog was $121.4 million and $82.1 million, and $46.2 million, respectively.
37
Basis of Presentation and Recent Trends
Revenue
Membership revenue. Our members sign up for monthly, annual or multi-year subscriptions to our service. Membership revenue includes subscription fees and, in certain cases, non-refundable initiation fees charged to new members. We charge the full price of membership at the commencement of the subscription period and at each renewal date (whether monthly, annual or multi-year), unless the member chooses not to renew the membership before the renewal date. Our members prepay their membership fees at the commencement of the subscription period. We record prepaid membership fees as deferred revenue and recognize the fees as revenue over the subscription period. We charge a non-refundable initiation fee in connection with monthly memberships and the lowest cost annual memberships in less penetrated markets. We recognizeFor the year ended December 31, 2013, we recognized revenue from non-refundable initiation fees over the expected life of the membership, which we currently estimateestimated to be 1215 months for monthly memberships and 6876 months for annual and multi-year memberships, based on our historical experience.
Service provider revenue. Local service providers generally pay for advertisements in advance on a monthly or annual basis. Our average advertising contract term in effect as of December 31, 20122013 was more than twelve months. The vast majority of our service provider contracts cover a period of twelve months. This term allows us to have a predictable revenue stream while providing us an opportunity to adjust advertising rates at the renewal period as our membership penetration of a given market increases.
We recognize revenue from the sale of website and call center advertising ratably over the time period in which the advertisements run. We recognize revenue from the sale of advertising placement in theAngie’s ListMagazine in the month the advertisement is published and distributed. As our penetration of a given market increases, we are typically able to charge higher rates for advertising because service providers are able to reach a larger base of potential customers. However, becauseas we only increase advertising rates at the time of contract renewal, increases in service provider revenue in a given market may trail increases in market penetration.
Our e-commerce offerings primarily consist of Big Deal and Storefront, which allow our members to purchase services or products from our service providers through us. We receive a portion of the offer price at the time of the purchase, recognizing the revenue net of the total transaction. Revenue is recognized in the period the offer is sold to members and is included in service provider revenue. While we are not the merchant of record with respect to our members for these transactions, we do offer members refunds in certain circumstances. Revenue from e-commerce transactions is recorded net of a reserve for estimated refunds.
Operating expenses
Operations and support.Operations and support expense consists primarily of costs associated with publishing theAngie’s List Magazine, operating our call center and providing support to our members and service providers, including wages and other employee benefits, credit card processing fees for member enrollment and other service provider transactions on our website, report transcription and data entry and amortization of the cost of acquired data. Operations and support expense does not include the cost of maintaining our website, which is included in technology expense. With the growth of our membership base, we expanded our call center staff to maintain high levels of customer service and encourage high renewal rates. We also use third-party marketing research firms to enable our members to submit reviews by telephone to enrich the content available to our members and expand the number of service providers eligible to advertise with us. We expect our operations and support expense to increase in absolute dollars in the future as we continue to grow our membership and scale our operations.
Selling. Selling expense consists primarily of commissions, wages and other employee benefits for personnel focused on selling and renewing advertising to eligible service providers.providers and e-commerce deals. We pay substantially higher commissions to our service provider sales forcepersonnel for contracts with first-time participating service providers than we pay for renewals. Our e-commerce sales personnel earn commissions based on the net revenue received from the sale of Big Deal and Storefront offerings. Selling expense also includes the cost of service provider marketing
38
efforts, facilities related to sales personnel, supplies and sales forcepersonnel training, as well as personnel-related costs for account management. Because selling expense primarily consists of commissions, we generally expect it to fluctuate with service provider revenue over time.revenue.
During the fourth quarter of 2012, we commenced the transition to a new compensation plan for our sales force responsible for new advertising originations whereby sales personnel are paid a base salary plus commission rather than “commission only.” We have begun to pay these commissions as cash is collected from our service providers rather than upfront at booking as we have done historically. We are transitioning to the new compensation plan gradually over the next several quarters. Because the base portion of compensation will be earned and recognized within the same period as it is paid, irrespective of revenue recognition, we expect to see higher selling expense as a percent of revenue in the near-term as we make this transition and the legacy “commission only” contracts run off.
Under our old compensation plan for our sales force responsible for new advertising originations, we paid sales personnel a minimum draw and, to the extent the draw exceeded commissions earned, we expensed the excess draw as salary in the period in which it was paid. As a result, we sometimes recognized higher selling expense as a percentage of revenue, particularly in periods of rapid expansion of our sales force. When fully implemented, our new compensation plan will eliminate the practice of paying draws against commissions.
Marketing. Marketing expense consists of national television, radio and print, as well as online advertising for the purpose of acquiring new paid memberships. BecauseAs the vast majority of our advertising spending is related to our growth strategy, and our advertising contracts are typically are short-term, we can rapidly adjust marketing expense. We intend to continue to invest substantial amounts in acquiring new paid memberships.
Technology. Technology expense consists primarily of personnel-related costs, including wages, employee benefits,including stock-based compensation, and expenditures for professional services and facilities, all of which are related to maintenance of our website and product development. Our technology expense has increased during the periods presented primarily as a result of the addition of technology personnel and enhancement of our technology platform. We expect technology expense to continue to increase in absolute dollars in future periods to support the growth in our members, service providers and personnel.
General and administrative. General and administrative expense consists primarily of personnel-related costs, including wages, benefits,including stock-based compensation,and expenditures for executive, legal, finance, human resources, marketing and corporate communications personnel, product management, as well as professional fees, facilities expense, insurance premiums, acquisition costs, amortization of certain intangibles, depreciation of building and improvements and other corporate expenses. We expect general and administrative expenses to continue to increase in absolute dollars in future periods as we support our growing organization.
Conversion to Corporation and Additional Stock-based Compensation
In April 2010, we converted from an Indiana limited liability company to a Delaware corporation. In connection with this conversion, unexercised options and unvested restricted membership units in the limited liability company held by certain of our personnel were cancelled. In the fourth quarter of 2010, we granted stock options and issued restricted stock in the Delaware corporation to certain of our personnel as a subsequent acknowledgement of interests in the limited liability company that had been cancelled in connection with the conversion.
39
Results of Operations
The following tables set forth our results of operations for the periods presented in absolute dollars and as a percentage of our revenue for those periods. The period-to-period comparison of financial results is not necessarily indicative of future results.
| Years Ended December 31, | Years Ended December 31, | |||||||||||||||||||||||
| 2012 | 2011 | 2010 | 2013 | 2012 | 2011 | |||||||||||||||||||
Revenue | ||||||||||||||||||||||||
Membership | $ | 47,717 | $ | 33,815 | $ | 25,149 | $ | 65,307 | $ | 47,717 | $ | 33,815 | ||||||||||||
Service provider | 108,082 | 56,228 | 33,890 | 180,335 | 108,082 | 56,228 | ||||||||||||||||||
|
|
| ||||||||||||||||||||||
Total revenue | 155,799 | 90,043 | 59,039 | 245,642 | 155,799 | 90,043 | ||||||||||||||||||
Operating expenses | ||||||||||||||||||||||||
Operations and support | 27,081 | 16,417 | 12,464 | |||||||||||||||||||||
Selling | 58,596 | 33,815 | 16,892 | |||||||||||||||||||||
Operations and support(1) | 40,072 | 27,081 | 16,417 | |||||||||||||||||||||
Selling(1) | 90,143 | 58,596 | 33,815 | |||||||||||||||||||||
Marketing | 80,230 | 56,122 | 30,237 | 87,483 | 80,230 | 56,122 | ||||||||||||||||||
Technology(1) | 16,870 | 9,109 | 6,270 | 26,197 | 16,870 | 9,109 | ||||||||||||||||||
General and administrative(1) | 24,055 | 18,740 | 16,302 | 32,828 | 24,055 | 18,740 | ||||||||||||||||||
|
|
| ||||||||||||||||||||||
Operating loss | (51,033 | ) | (44,160 | ) | (23,126 | ) | (31,081 | ) | (51,033 | ) | (44,160 | ) | ||||||||||||
Interest expense | 1,856 | 3,004 | 3,966 | 1,868 | 1,856 | 3,004 | ||||||||||||||||||
Loss on debt extinguishment | — | 1,830 | — | — | — | 1,830 | ||||||||||||||||||
|
|
| ||||||||||||||||||||||
Loss before income taxes | $ | (52,889 | ) | $ | (48,994 | ) | $ | (27,092 | ) | $ | (32,949 | ) | $ | (52,889 | ) | $ | (48,994 | ) | ||||||
Income tax expense | 5 | 43 | 154 | 40 | 5 | 43 | ||||||||||||||||||
|
|
| ||||||||||||||||||||||
Net loss | $ | (52,894 | ) | $ | (49,037 | ) | $ | (27,246 | ) | $ | (32,989 | ) | $ | (52,894 | ) | $ | (49,037 | ) | ||||||
|
|
| ||||||||||||||||||||||
(1) | Includes non-cash stock-based compensation as follows: |
Operations and support | $ | 64 | $ | — | $ | — | ||||||||||||||||||
Selling | 147 | — | — | |||||||||||||||||||||
Technology | $ | 762 | $ | 786 | $ | 496 | 17 | 762 | 786 | |||||||||||||||
General and administrative | 2,181 | 3,056 | 6,203 | 3,836 | 2,181 | 3,056 | ||||||||||||||||||
|
|
| $ | 4,064 | $ | 2,943 | $ | 3,842 | ||||||||||||||||
| $ | 2,943 | $ | 3,842 | $ | 6,699 | |||||||||||||||||||
|
|
| ||||||||||||||||||||||
The following table sets forth operating data of the Company as a percentage of total revenue for the years indicated below.
| Years Ended December 31, | ||||||||||||
| 2012 | 2011 | 2010 | ||||||||||
Revenue | ||||||||||||
Membership | 31 | % | 38 | % | 43 | % | ||||||
Service provider | 69 | 62 | 57 | |||||||||
|
|
|
|
|
| |||||||
Total revenue | 100 | % | 100 | % | 100 | % | ||||||
Operating expenses | ||||||||||||
Operations and support | 17 | 18 | 21 | |||||||||
Selling | 38 | 38 | 29 | |||||||||
Marketing | 52 | 62 | 51 | |||||||||
Technology | 11 | 10 | 10 | |||||||||
General and administrative | 15 | 21 | 28 | |||||||||
|
|
|
|
|
| |||||||
Operating loss | (33 | ) | (49 | ) | (39 | ) | ||||||
Interest expense | 1 | 3 | 7 | |||||||||
Loss on debt extinguishment | — | 2 | — | |||||||||
|
|
|
|
|
| |||||||
Loss before income taxes | (34 | ) | (54 | ) | (46 | ) | ||||||
Income tax expense | — | — | — | |||||||||
|
|
|
|
|
| |||||||
Net loss | (34%) | (54%) | (46%) | |||||||||
|
|
|
|
|
| |||||||
Years Ended December 31, | ||||||||||||
2013 | 2012 | 2011 | ||||||||||
Revenue | ||||||||||||
Membership | 27 | % | 31 | % | 38 | % | ||||||
Service provider | 73 | 69 | 62 | |||||||||
Total revenue | 100 | % | 100 | % | 100 | % | ||||||
Operating expenses | ||||||||||||
Operations and support | 16 | 17 | 18 | |||||||||
Selling | 37 | 38 | 38 | |||||||||
Marketing | 36 | 52 | 62 | |||||||||
Technology | 11 | 11 | 10 | |||||||||
General and administrative | 13 | 15 | 21 | |||||||||
Operating loss | (13 | ) | (33 | ) | (49 | ) | ||||||
Interest expense | 1 | 1 | 3 | |||||||||
Loss on debt extinguishment | — | — | 2 | |||||||||
Loss before income taxes | (14 | ) | (34 | ) | (54 | ) | ||||||
Income tax expense | — | — | — | |||||||||
Net loss | (14% | ) | (34% | ) | (54% | ) | ||||||
40
Comparison of the years ended December 31, 2013, 2012 2011 and 2010
Revenue2011
| Years Ended December 31, | ||||||||||||||||||||
| 2012 | 2011 | 2010 | 2012 over 2011 | 2011 over 2010 | ||||||||||||||||
| (dollars in thousands) | ||||||||||||||||||||
Revenue | ||||||||||||||||||||
Membership | $ | 47,717 | $ | 33,815 | $ | 25,149 | 41 | % | 34 | % | ||||||||||
Service provider | 108,082 | 56,228 | 33,890 | 92 | % | 66 | % | |||||||||||||
|
|
|
|
|
|
|
|
|
| |||||||||||
Total revenue | $ | 155,799 | $ | 90,043 | $ | 59,039 | 73 | % | 53 | % | ||||||||||
|
|
|
|
|
|
|
|
|
| |||||||||||
Percentage of revenue by type | ||||||||||||||||||||
Membership | 31 | % | 38 | % | 43 | % | ||||||||||||||
Service provider | 69 | % | 62 | % | 57 | % | ||||||||||||||
|
|
|
|
|
| |||||||||||||||
Total revenue | 100 | % | 100 | % | 100 | % | ||||||||||||||
|
|
|
|
|
| |||||||||||||||
Total paid memberships (end of period) | 1,787,394 | 1,074,757 | 602,882 | 66 | % | 78 | % | |||||||||||||
Gross paid memberships added (in period) | 1,092,935 | 716,350 | 355,580 | 53 | % | 101 | % | |||||||||||||
Participating service providers (end of period) | 35,952 | 24,095 | 15,060 | 49 | % | 60 | % | |||||||||||||
Revenue
Years Ended December 31, | ||||||||||||||||||||
2013 | 2012 | 2011 | 2013 over 2012 | 2012 over 2011 | ||||||||||||||||
(dollars in thousands) | ||||||||||||||||||||
Revenue | ||||||||||||||||||||
Membership | $ | 65,307 | $ | 47,717 | $ | 33,815 | 37 | % | 41 | % | ||||||||||
Service provider | 180,335 | 108,082 | 56,228 | 67 | % | 92 | % | |||||||||||||
Total revenue | $ | 245,642 | $ | 155,799 | $ | 90,043 | 58 | % | 73 | % | ||||||||||
Percentage of revenue by type | ||||||||||||||||||||
Membership | 27 | % | 31 | % | 38 | % | ||||||||||||||
Service provider | 73 | % | 69 | % | 62 | % | ||||||||||||||
Total revenue | 100 | % | 100 | % | 100 | % | ||||||||||||||
Total paid memberships (end of period) | 2,484,059 | 1,787,394 | 1,074,757 | 39 | % | 66 | % | |||||||||||||
Gross paid memberships added (in period) | 1,218,258 | 1,092,935 | 716,350 | 11 | % | 53 | % | |||||||||||||
Participating service providers (end of period) | 46,329 | 35,952 | 24,095 | 29 | % | 49 | % | |||||||||||||
2013 compared to 2012. Total revenue increased $89.8 million for 2013 as compared to 2012.
Membership revenue increased $17.6 million,primarily due to a 39% increase in the total number of paid memberships, partially offset by an 8% decrease in average membership revenue per paid membership in 2013. The decrease in average membership revenue per paid membership primarily resulted from growth in paid memberships in less penetrated markets where average membership fees per paid membership are lower. This decline also reflected the effect of allowing members in our more penetrated markets to purchase only those segments of Angie’s List that are most relevant to them at a lower membership rate than applicable for the full service. As of December 31, 2013, there were 80 markets in which we offered members the opportunity to purchase individual segments. We offer only bundled memberships to members in less penetrated markets. In addition, in 2013 we reduced prices in certain markets which also yielded a decline in revenue per average paid membership. The decrease in membership revenue per paid membership also resulted from an increase from 91% to 94% in total paid memberships constituting annual and multi-year memberships. Consumers pay more per month for a monthly membership than for an annual membership. Therefore, in periods in which our percentage of memberships shifts to more annual and multi-year memberships, our membership revenue per paid membership decreases.
Service provider revenue increased $72.3 million to 73% of total revenue,primarily as a result of a 29% increase in the number of local service providers participating in our advertising programs and a 22% increase in revenue per average participating service provider. Service provider revenue primarily consists of revenue from advertising contracts with service providers. As our penetration of a given market increases, we are typically able to charge higher rates for advertising because service providers are able to reach a larger base of potential customers. However, as we only increase advertising rates at the time of contract renewal, increases in service provider revenue in a given market may trail increases in market penetration. We also include our e-commerce revenue of $22.1 million and $14.5 millionin 2013 and 2012, respectively, in service provider revenue. Our e-commerce revenue is generated by our Angie’s List Big Deal and Storefront offerings. We expect the revenue contribution from these offerings to fluctuate from period to period as the offerings evolve and due to seasonality.
2012 compared to 2011. Total revenue increased $65.8 million for 2012 as compared to 2011.
Membership revenue increased $13.9 million primarily due to a 66% increase in the total number of paid memberships, partially offset by a 17% decrease in membership revenue per average paid membership in 2012. The decrease in membership revenue per average paid membership resulted primarily from growth in paid memberships in less penetrated markets where average membership fees per paid membership are lower. This decline also reflected the effect of allowing members in our more penetrated markets to purchase only those segments of Angie’s List that are most relevant to them at a lower subscription feemembership rate than applicable for the full service. As of December 31, 2012 there were 68 markets in which we offered members the opportunity to purchase individual segments. We offer only bundled memberships to members in less penetrated markets. The decrease in membership revenue per average paid membership in 2012 is also resulted from an increase from 88% to 91%the result of total paid memberships constituting annual and multi-year memberships. Consumers pay less per month for annual and multi-year memberships than for monthly memberships. Therefore, in periods in which our percentage of paid memberships shiftsa shift to more annual and multi-year memberships our membership revenue per averageas a percentage of total paid membership may decrease.memberships.
Service provider revenue increased $51.9 million to 69% of total revenue primarily as a result of a 49% increase in the number of local service providers participating in our advertising programs and an increase in revenue per average participating service provider. Service provider revenue primarily consists of revenue from advertising contracts with service providers. As our penetration of a given market increases, we are typically able to charge higher rates for advertising because service providers are able to reach a larger base of potential customers. However, because we only increase advertising rates at the time of contract renewal, increases in service provider revenue in a given market may trail increases in market penetration. We also included our e-commerce revenue of $14.5 million and $6.7 million in service provider revenue in 2012 and 2011, respectively. Our e-commerce revenue is generated by our Angie’s List Big Deal and Storefront offerings. While we are encouraged by the early results of these offerings, we expect the revenue contribution from these offerings to fluctuate from period to period as they evolve.
2011 compared to 2010. Membership revenue increased $8.7 million primarily due to a 78% increase in the total number of paid memberships, partially offset by a 19% decrease in membership revenue per average paid membership in 2011. This decrease in membership revenue per average paid membership resulted from growth in paid memberships in less penetrated markets where membership fees are lower. This decline also reflects the
41Operations and support
Years Ended December 31, | ||||||||||||||||||||
2013 | 2012 | 2011 | 2013 over 2012 | 2012 over 2011 | ||||||||||||||||
(dollars in thousands) | ||||||||||||||||||||
Operations and support | $ | 40,072 | $ | 27,081 | $ | 16,417 | 48 | % | 65 | % | ||||||||||
Percentage of revenue | 16 | % | 17 | % | 18 | % | ||||||||||||||
effect
2013 compared to 2012.Operations and support expense increased $13.0 million for 2013 compared to 2012. This increase was due in part to a $5.3 million increase in operations and support personnel-related costs as we increased our headcount to service our growing member and service provider base. Additionally, there was a $2.0 million increase in credit card processing fees year over year due to the increased volume of allowing membersmembership enrollment and service provider transactions. We also incurred a $3.7 million increase in publication-related costs associated with the increased circulation of our more penetrated markets to purchase only those segments of monthlyAngie’s List that are most relevantMagazine due to them.the continued expansion of our membership base. We offer only bundled membershipsexpect operations and support expense to memberscontinue to increase in less penetrated markets. The decrease inabsolute dollars as we grow our membership revenue per average paid membership in 2011 is also the result of a shift to more annual membershipsand service provider base. Operations and support expense as a percentage of total paid memberships.
Service provider revenue increased $22.3 milliondecreased to 62% of revenue primarily16% from 17% as a result of a 60% increase in the number of local service providers participating in our advertising programs. An increase in revenue per average participatingand our realization of economies of scale as we service provider revenue also contributed to the increase inour members and service provider revenue.
Operations and supportproviders.
| Years Ended December 31, | 2012 over 2011 | 2011 over 2010 | ||||||||||||||||||
| 2012 | 2011 | 2010 | ||||||||||||||||||
| (dollars in thousands) | ||||||||||||||||||||
Operations and support | $ | 27,081 | $ | 16,417 | $ | 12,464 | 65 | % | 32 | % | ||||||||||
Percentage of revenue | 17 | % | 18 | % | 21 | % | ||||||||||||||
2012 compared to 2011. Operations and support expense increased $10.7 million for 2012 compared to 2011. This increase was due in part to a $4.4 million increase in call center costs as compared to the prior year period as we increased our headcount to service our growing member and service provider base. There was a $2.2 million increase in credit card processing fees due to the increased volume of membership enrollment and service provider transactions. We also incurred a $2.1 million increase in costs associated with the collection of member reviews of service providers as we continued to increase the content on our website. Publication-related costs increased by $1.3 million due to a 68% increase in circulation of our monthlyAngie’s List Magazine which is consistent with the growth of our membership base. We expect operations and support expense to continue to increase in absolute dollars as we grow our membership and service provider base. Operations and support expense as a percentage of revenue decreased to 17% from 18% as a result of the increase in revenue and our realization of economies of scale as we service our members and service providers.
2011
Selling
Years Ended December 31, | ||||||||||||||||||||
2013 | 2012 | 2011 | 2013 over 2012 | 2012 over 2011 | ||||||||||||||||
(dollars in thousands) | ||||||||||||||||||||
Selling | $ | 90,143 | $ | 58,596 | $ | 33,815 | 54 | % | 73 | % | ||||||||||
Percentage of revenue | 37 | % | 38 | % | 38 | % | ||||||||||||||
2013 compared to 20102012.. Operations and support Selling expense increased $4.0$31.5 million for 20112013 compared to 2010.2012. This increase wasis largely due in part to a $1.3 millionan increase in credit card processing feesservice provider revenue, which increased 67% over the prior year. Additionally, we increased the number of sales personnel and management responsible for member enrollmentoriginating new advertising contracts and othere-commerce transactions by 39% to 773. We also increased the number of sales personnel and management responsible for contract renewals by 38% to 192 from December 31, 2012.
Selling expense as a percentage of revenue decreased to 37% in connection with our membership growth. In addition, costs associated with the collection of member reviews of service providers increased by $0.8 million2013 from 38% in 2012, primarily as we continue to increase the content on our website. As a result of the recent growth of our membership, we increased headcount in our call center during the year from 47 to 80, increasing call center costs by $0.9 million as compared to the prior year. Publication-related costs increased by $1.0 million duetransition to a 56% increase in circulationnew compensation structure for our sales personnel. Additionally, as selling expense primarily consists of our monthly publication.
Sellingcommissions, we expect it to fluctuate with service provider revenue and the composition of that revenue over time.
| Years Ended December 31, | 2012 over 2011 | 2011 over 2010 | ||||||||||||||||||
| 2012 | 2011 | 2010 | ||||||||||||||||||
| (dollars in thousands) | ||||||||||||||||||||
Selling | $ | 58,596 | $ | 33,815 | $ | 16,892 | 73 | % | 100 | % | ||||||||||
Percentage of revenue | 38 | % | 38 | % | 29 | % | ||||||||||||||
2012 compared to 2011. Selling expense increased $24.8 million for 2012 compared to 2011. This increase is due to an increase in service provider revenue. Service provider revenue increased 92% over the prior year. We increased the number of our sales personnel and management responsible for originating new advertising contracts and e-commerce transactions by 60% to 558. Additionally, the number of our sales personnel and management responsible for contract renewals increased by 117% to 139 from December 31, 2011.
Selling expense as a percentage of revenue remained consistent for 2012 as compared to 2011. As selling
Marketing
Years Ended December 31, | ||||||||||||||||||||
2013 | 2012 | 2011 | 2013 over 2012 | 2012 over 2011 | ||||||||||||||||
(dollars in thousands) | ||||||||||||||||||||
Marketing | $ | 87,483 | $ | 80,230 | $ | 56,122 | 9 | % | 43 | % | ||||||||||
Percentage of revenue | 36 | % | 52 | % | 62 | % | ||||||||||||||
Gross paid memberships added in the period | 1,218,258 | 1,092,935 | 716,350 | |||||||||||||||||
Marketing cost per paid membership acquisition | $ | 72 | $ | 73 | $ | 78 | ||||||||||||||
2013 compared to 2012. Marketing expense increased $7.3 million for 2013 compared to 2012, primarily consisted of commissions, we expect it to fluctuate with service provider revenue and the composition of that revenue over time. In addition, we are transitioningdue to a planned increase in national advertising spending for 2013 to acquire new compensation plan for our sales
42
personnel responsible for originating new service provider contracts which is expected to have an unfavorable impact on sellingMarketing expense during the transition period.
2011 compared to 2010. Selling expense increased $16.9 million for 2011 compared to 2010. This increase was due in part toas a 71% increase in new advertising contract origination value. We incur greater effective commission rates on new advertising contracts as compared to renewals. In addition, the numberpercentage of our sales personnel and management originating new advertising contracts increased 131% to 349 from 151revenue decreased from the prior year end.
Theperiod due to total revenue increasing at a greater rate than marketing expense increased in absolute dollars. Even with the current year increase in sellingmarketing expense, includes $1.3 millionour marketing cost per paid membership acquisition decreased from $73 to $72 as a result of drawsimproved brand awareness, successful SEO efforts, improved effectiveness in excesspurchasing advertising and the “word of commissions earned as new sales hiresmouth” benefits of increased penetration. Consistent with the seasonality that focus on contract originations generally do not produce as much revenue as more experienced sales personnel. We also increasedcharacterizes our business, our marketing expense and marketing cost per paid membership acquisition typically peak in the number of our sales personnelsecond and management responsible for contract renewals by 45% to 64 from 44 asthird quarters of the prior year end.
Marketingyear. We expect marketing expense to decrease as a percentage of revenue in 2014.
| Years Ended December 31, | 2012 over 2011 | 2011 over 2010 | ||||||||||||||||||
| 2012 | 2011 | 2010 | ||||||||||||||||||
| (dollars in thousands) | ||||||||||||||||||||
Marketing | $ | 80,230 | $ | 56,122 | $ | 30,237 | 43 | % | 86 | % | ||||||||||
Percentage of revenue | 52 | % | 62 | % | 51 | % | ||||||||||||||
Gross paid memberships added in the period | 1,092,935 | 716,350 | 355,580 | |||||||||||||||||
Marketing cost per paid membership acquisition | $ | 73 | $ | 78 | $ | 85 | ||||||||||||||
2012 compared to 2011. Marketing expense increased $24.1 million for 2012 compared to 2011, primarily due to a planned increase in national advertising spending for 2012 to acquire new members.
Marketing expense as a percentage of revenue decreased from the prior year period due to total revenue increasing at a greater rate than marketing expense increased in absolute dollars. Even with the current year increase in marketing expense, our marketing cost per paid membership acquisition decreased from $78 to $73 as a result of improved brand awareness, successful web search efforts, improved effectiveness in purchasing advertising and the “word of mouth” benefits of increased penetration. Consistent with the seasonality that characterizes our business, our marketing expense and marketing cost per paid membership acquisition typically peak in the second and third quarters of the year.
Technology
Years Ended December 31, | ||||||||||||||||||||
2013 | 2012 | 2011 | 2013 over 2012 | 2012 over 2011 | ||||||||||||||||
(dollars in thousands) | ||||||||||||||||||||
Technology | $ | 26,197 | $ | 16,870 | $ | 9,109 | 55 | % | 85 | % | ||||||||||
Percentage of revenue | 11 | % | 11 | % | 10 | % | ||||||||||||||
Non-cash stock-based compensation | $ | 17 | $ | 762 | $ | 786 | ||||||||||||||
2013 compared to 2012.Technology expense increased $9.3 million for 2013 compared to 2012. The increase in technology expense was primarily attributable to a $5.1 million increase in personnel-related costs and a $2.9 million increase in technology-related outside consulting and professional fees as well as costs incurred to continue to develop our technology platform and service our growing base of members and service providers. This was offset by a decrease in non-cash stock based compensation related to forfeitures occurring in the current year.
Technology expense as a percentage of revenue remained consistent compared with the prior year. We expect marketingtechnology expense to increase in absolute dollars in 2013, but decrease as a percentage of revenue.
2011 compared to 2010. Marketing expense increased $25.9 million for 2011 compared to 2010, primarily due to an increase in national advertising. We expect our marketing expense to continue to be primarily focused on national television spending. We attribute our decrease in cost per paid membership acquisition to improved effectiveness of purchasing of marketing, presentation of new marketing creative and additional “word of mouth” benefits as we increase penetration.
Marketing expense as a percentage of revenue increased dueas we continue to develop our strategy of increasing investment in national advertising to drive membership growth.technology and product offerings.
Technology
| Years Ended December 31, | 2012 over 2011 | 2011 over 2010 | ||||||||||||||||||
| 2012 | 2011 | 2010 | ||||||||||||||||||
| (dollars in thousands) | ||||||||||||||||||||
Technology | $ | 16,870 | $ | 9,109 | $ | 6,270 | 85 | % | 45 | % | ||||||||||
Percentage of revenue | 11 | % | 10 | % | 10 | % | ||||||||||||||
Non-cash stock-based compensation | $ | 762 | $ | 786 | $ | 496 | ||||||||||||||
43
2012 compared to 2011. Technology expense increased $7.8 million for 2012 compared to 2011. The increase in technology expense was primarily attributable to a $3.9 million increase in personnel-related costs as we continued to develop our technology platform, including expanding our mobile offerings and establishing a technology presence in Palo Alto, California. We also incurred additional technology costs related to servicing our growing base of members and service providers.
For these reasons technology expense increased as a percentage of revenue compared with the prior year.
2011General and administrative
Years Ended December 31, | ||||||||||||||||||||
2013 | 2012 | 2011 | 2013 over 2012 | 2012 over 2011 | ||||||||||||||||
(dollars in thousands) | ||||||||||||||||||||
General and administrative | $ | 32,828 | $ | 24,055 | $ | 18,740 | 36 | % | 28 | % | ||||||||||
Percentage of revenue | 13 | % | 15 | % | 21 | % | ||||||||||||||
Non-cash stock-based compensation | $ | 3,836 | $ | 2,181 | $ | 3,056 | ||||||||||||||
2013 compared to 20102012. TechnologyGeneral and administrative expense increased $2.8$8.8 million for 20112013 compared to 2010.2012. The absolute dollarincrease is partially explained by a $4.0 million charge recorded during the fourth quarter of 2013 reflecting the expected settlement of pending litigation for which we have entered into a settlement agreement that is subject to court approval. Additionally, there was an approximately $1.8 million year over year increase in technologybad debt expense was primarily attributablerelated to uncollectible receivables as well as a $1.2 million increase in personnel-related costs and a $0.3$1.7 million increase in non-cash stock-based compensation in connection with the accelerated vesting of restricted stock that occurred on our initial public offering.due to additional grants during 2013. The remaining increaseportion of the fluctuation in technologygeneral and administrative expense is attributable to increases in headquarters staff and outside consulting and professional fees and other public company costs. These increases were partially offset by non-recurring costs incurred of $0.7 million for fees related to costs incurred to continue to develop our technology platform and service our growing basethe follow-on sale of members and service providers.
common stock in May 2012 that were not present in the current year. General and administrative expense as a percentage of revenue decreased primarily due to the increase in revenue and our realization of economies of scale.
| Years Ended December 31, | 2012 over 2011 | 2011 over 2010 | ||||||||||||||||||
| 2012 | 2011 | 2010 | ||||||||||||||||||
| (dollars in thousands) | ||||||||||||||||||||
General and administrative | $ | 24,055 | $ | 18,740 | $ | 16,302 | 28 | % | 15 | % | ||||||||||
Percentage of revenue | 15 | % | 21 | % | 28 | % | ||||||||||||||
Non-cash stock-based compensation | $ | 2,181 | $ | 3,056 | $ | 6,203 | ||||||||||||||
2012 compared to 2011. General and administrative expense increased $5.3 million for 2012 compared to 2011. Personnel-related costs increased $2.1 million primarily as a result of an increase in our headquarters staff, and we incurred an additional $1.2 million in outside consulting and professional services fees to support our growing public company. We also incurred $0.7 million for non-recurring fees related to the follow-on sale of common stock in May 2012. Non-cash stock-based compensation expense decreased by $0.9 million primarily due to restricted grants that immediately vested as a result of our initial public offering in 2011.
2011
Interest expense
2013 compared to 20102012. General and administrativeInterest expense increased $2.4was approximately $1.9 million for 2011 compared to 2010. Personnel-related costs increased $1.9 million primarilyboth 2013 and 2012 as a result of an increase in our headquarters staff to support our growing organization. We also incurred an additional $1.7 million in our outside consulting and professional services fees to support our growing organization and in connection with our initial public offering. Non-cash stock-based compensation expense decreased by $3.1 million principally due to the recognition of stock-based compensation expense related to grants of stock options and issuances of restricted stock to general and administrative personnel following our conversion from a limited liability company to a corporation in 2010, which was not repeated in 2011.debt balances remained constant.
General and administrative expense as a percentage of revenue decreased as a percentage of revenue primarily as a result of the decrease in non-cash stock-based compensation expense in both 2012 and 2011.
Interest expense
2012 compared to 2011. Interest expense decreased $1.1 million for 2012 compared to 2011, as the result of a decrease in average debt outstanding in 2012 as well as lower interest rates associated with the refinancing of our primary debt obligations during 2011.
2011 compared to 2010. Interest expense decreased $1.0 million for 2011 compared to 2010, as the result of a decrease in average debt outstanding in 2011 as well as lower interest rates associated with the refinancing of our primary debt obligations during 2011.
44
Loss on debt extinguishment
Loss on debt extinguishment in 2011 was due to the refinancing of our primary debt obligations,which resulted in pre-payment penalties and write-offs of debt discounts and unamortized loan fees. We did not incur any loss on debt extinguishment in 20122013 or 2010.2012.
Liquidity and Capital Resources
General
At December 31, 2012,2013, we had $42.6$34.8 million in cash and cash equivalents and $10.5$21.1 million in short-investments.short-term investments. Cash and cash equivalents consists of cash inbank deposit accounts and money market funds with contractual maturities of three months or less, which, at times, may exceed federally insured limits. Short-term investments consistedconsist of certificates of deposit and corporate bonds with maturities greater than 90 days but less than one year. To date, the carrying value of these investments approximate their fair values.values, and we have incurred no loss in these accounts.
We have financed our operations primarily through private and public sales of equity and, to a lesser extent, from borrowings. Our principal sources of operating cash flows are receipts for membership fees and service provider advertising.transactions. We continue to invest aggressively to grow our business. Over the past three years, our largest uses of cash in operating activities have been for national advertising campaigns to expand our membership base and commissions paid to service provider sales personnel as our service provider revenue has increased.
Our cash flows from operating activities are influenced by certain timing differences. Membership fees from our members are generally collected at the beginning of the membership period and are a part of our working capital although the associated revenue is recognized over the term of the subscription period. During the periods presented,Additionally, from time to time we paid cashamend our commission plans for sales personnel,and changes to our sales personnel for commissions earned on newly originated service provider contracts when the contracts were signed but generally collected cash from the service providers over the term of the contracts. We have begun to pay commissions as cash is collected from our service providers rather than upfront at booking as we have done historically. This change, once fully implemented, is expected to reduce the growth in our prepaid expenses, and thereforethese plans can have a positive or negative impact on our operating cash flowsprepaid commissions depending on the structure of the commission plan in future periods.place.
We believe that our existing cash and cash equivalents and short-term investments will be sufficient to fund our operations for at least the next 12 months. From time to time, we may explore additional financing sources to develop or enhance our services, to fund expansion, to respond to competitive pressures, to acquire or to invest in complementary products, businesses or technologies, or to lower our cost of capital, which could include equity, equity-linked and debt financing. We cannot assure you that any additional financing will be available to us on acceptable terms, if at all.
Summary cash flow information for the years ended December 31, 2013, 2012 2011 and 20102011 is set forth below.
Years Ended December 31, | ||||||||||||||||||||||||
| Years Ended December 31, | 2013 | 2012 | 2011 | |||||||||||||||||||||
| 2012 | 2011 | 2010 | ||||||||||||||||||||||
Net cash used in operating activities | $ | (33,397 | ) | $ | (33,135 | ) | $ | (11,079 | ) | |||||||||||||||
Net cash provided by (used in) operating activities | $ | 8,906 | $ | (33,397 | ) | $ | (33,135 | ) | ||||||||||||||||
Net cash used in investing activities | (22,006 | ) | (4,276 | ) | (1,568 | ) | (21,857 | ) | (22,006 | ) | (4,276 | ) | ||||||||||||
Net cash provided by financing activities | 9,434 | 116,809 | 19,840 | 5,116 | 9,434 | 116,809 | ||||||||||||||||||
Net Cash Used inProvided By (Used in) Operating Activities
We have experienced negative operating cash flows in previous years principally due to our aggressive investment in sales personnel and national advertising campaigns for the purpose of acquiring new members. Our operating cash flows will continue to be affected principally by the extent to which we continue to pursue our growth strategy, including investing in
45
national advertising, changes in price per average paid membership, the expansion of our sales forcepersonnel to originate service provider contracts, investing in technology personnel and equipment, and other increases in headcount to grow our business. Our largest source of operating cash flows is cash collections from our members and service providers.
Cash provided by operating activities for 2013 of $8.9 million was generated despite a net loss of $33.0 million. Our cash provided by operating activities was attributable to a deferred revenue increase of $25.1 million as a result of an increase in both the number of our paid memberships and in the number of service providers participating in our advertising programs, a $6.6 million net increase in accounts payable and accrued liabilities primarily related to increases in accrued compensation, the impact of a $4.0 million current period legal accrual and the expected timing of payment of these balances, and a decrease in prepaid expenses of $6.2 million primarily attributable to our change in compensation structure for our sales personnel responsible for new advertising originations. In addition, our net loss included approximately $11.4 million of non-cash expenses, which included $4.1 million of stock-based compensation expense, $4.1 million of depreciation and amortization, $2.7 million of bad debt expense and $0.5 million attributable to the amortization of debt discount and deferred financing fees. Uses of cash included a $7.3 million increase in accounts receivable attributable to an increase in service provider billings.
Our use of cash in operating activities for 2012 was primarily attributable to our net loss of $52.9 million, reflecting continued investments in our national advertising campaigns, an increase in our sales personnel, as well as other headcount increases and other expenses to grow our business. This net loss was adjusted forincluded $8.0 million of non-cash expenses, which included $2.9 million of stock-based compensation expense, $2.8 million of depreciation and amortization, $2.0 million of bad debt expense, and $0.3 million of amortization of debt discount and deferred financing fees. Additional uses of cash included an $8.0 million increase in prepaid expenses primarily as a result of the timing of payment of commissions to our sales personnel and a $5.8 million increase in accounts receivable associated with the growth in service provider revenue. These uses of cash in operating activities were offset in part by a $4.8 million increase in accounts payable and accrued liabilities, primarily attributable to increases in accrued marketing expenses and accrued but unpaid commissions, and increases in deferred revenue of $20.5 million, as a result of an increase both in the number of our paid memberships and in the number of service providers participating in our advertising programs.
Our use of cash in operating activities for 2011 was primarily attributable to our net loss of $49.0 million, reflecting continued investments in our national advertising campaigns, an increase in our sales personnel, as well as other headcount increases and other expenses to grow our business. This net loss was adjusted forincluded $8.6 million of non-cash expenses, which included $3.8 million of stock-based compensation expense, $1.7 million of depreciation and amortization, $0.6 million of accrued interest on debt maturity, $0.8 million of bad debt expense and $0.6 million attributable to the amortization of debt discount and deferred financing fees. Non-cash expenses also included a $1.1 million write-off attributable to our debt refinancing during 2011. Additional uses of cash included a $6.1 million increase in prepaid expenses primarily as a result of the timing of payment of commissions to our sales personnel and the cash payment of accrued interest of $2.7 million. These uses of cash in operating activities were offset in part by a $6.6 million increase in accounts payable and accrued liabilities primarily attributable to increases in accrued marketing expenses and accrued but unpaid commissions, and increases in deferred revenue of $11.5 million as a result of an increase both in the number of our paid memberships and in the number of service providers participating in our advertising programs.
Our use of cash in operating activities for 2010 was primarily attributable to our net loss of $27.2 million, reflecting our continued significant investments in our national advertising campaigns, headcount and other expenses to grow our business. This net loss was adjusted for $10.5 million of non-cash expenses that included $6.7 million in stock-based compensation expense, $1.8 million of amortization of debt discount, deferred financing fees, and accrued interest, $0.5 million of bad debt expense and $1.4 million of depreciation and amortization. Additional uses of cash included a $1.7 million increase in prepaid expenses and other current assets primarily as a result of the timing of payment of commissions to our sales personnel on service provider contracts. These uses of cash were offset in part by cash generated from a $5.2 million increase in deferred revenue attributable to increased memberships and service provider advertising, and a $3.2 million increase in accounts payable and accrued liabilities primarily related to marketing expense that had not yet been paid.
Net Cash Used in Investing Activities
Net
Our use of cash used in investing activities has primarily relatedin 2013 was attributable to the purchase, net of sales, of $10.8 million in investments in ourcorporate bonds, commercial paper and certificates of deposit with maturities between ninety days and one year, $8.1 million for facilities and information technology equipment to support our growth,hardware and software, $2.2 million for the purchase of BrightNest assets in external costsAugust 2013 and $0.8 million for data acquisition to acquire consumer reports on service providers.
Our use of cash in investing activities in 2012 was attributable to the purchase of $10.5 million in investments in corporate bonds and certificates of deposits with maturities between ninety days and one year, the purchase of our headquarters facility including land and buildings for $6.8 million, including the costs and fees to acquire the properties, $2.9 million in office improvements and information technology investments, and $2.0 million for data acquisition.
46
Our use of cash in investing activities in 2011 was attributable to $2.9 million in information technology investments to further improve our hardware and software for members, service providers and our growing employee base, $1.2 million for data acquisition and $0.2 million in other expenditures on property and equipment.
Our use of cash in investing activities in 2010 was primarily attributable to $0.8 million in purchases of third-party data to improve the content of our website and $0.5 million in information technology investments to continue to maintain our website.
Net Cash Provided by Financing Activities
Net cash provided by financing activities for 2013 consisted solely of proceeds from the exercise of employee stock options.
Net cash provided by financing activities for 2012 included proceeds of $8.6 million from our follow-on offering of common stock, net of underwriting discounts and expenses and additional offering-related expenses. Additionally, we obtained proceeds of $0.8 million as a result of the exercise of stock options.
Net cash provided by financing activities for 2011 included proceeds of $88.6 million from our initial public offering of common stock and simultaneous sale of stock to one of our directors, net of underwriting discounts and expenses and additional offering-related expenses the sale of preferred stock of $57.9 million, and the issuance of $15.0 million of new long-term debt. These proceeds were offset in part by stock repurchases of $21.9 million, and both scheduled and early debt extinguishment payments aggregating $21.8 million. We also incurred $0.9 million of financing costs related to the issuance of new debt obligations during the current period.
Net cash provided by financing activities for 2010 included proceeds from sale of preferred stock of $23.9 million, offset in part by $2.0 million of scheduled repayments of debt obligations and $1.8 million in repurchases of common shares.
Debt Obligations
On August 31, 2011, we entered into a loan and security agreement that provides for a $15.0 million term loan and a $15.0 million revolving credit facility. A portion of the revolving credit facility is available for letters of credit and corporate credit cards. The term loan bears interest at a per annum rate equal to the greater of (i) the current cash interest rate of LIBOR plus 10% or (ii) 10.5%, and requires monthly interest-only payments until maturity in August 2015. The revolving credit facility requires monthly interest-only payments on advances, which bear interest at a per annum rate equal to LIBOR plus 5%. In addition, when less than 50% of the revolving credit facility is drawn, we are required to pay a non-usage charge of 0.50% per annum of the average unused portion of the revolving credit facility. The term loan provides for penalties for early prepayment. The term loan and revolving credit facility provide for additional interest upon an event of default and are secured by substantially all of our assets. In connection with entering into the loan and security agreement, we issued a warrant to purchase 88,240 shares of common stock to one of the lenders. The fair value of this warrant was recorded as a discount to the term loan, with the amount of the discount being amortized as interest expense through the loan’s maturity. As of December 31, 2012,2013, we had $15.0$14.9 million in outstanding borrowings under the term loan and available credit of $15.0 million under the revolving credit facility.
The loan and security agreement contains various restrictive covenants, including restrictions on our ability to dispose of assets, make acquisitions or investments, incur debt or liens, make distributions to our stockholders or enter into certain types of related party transactions. We also are required to comply with certain financial covenants, including a minimum asset coverage ratio, and non-financial covenants. Upon an event of default, which includes a material adverse change, the lenders may accelerate amounts outstanding, terminate the agreement and foreclose on all collateral. We were in compliance with all financial and non-financial covenants at December 31, 2012.2013.
Off-Balance Sheet Arrangements
We do not engage in any off-balance sheet activities. We do not have any off-balance sheet interest in variable interest entities, which include special purpose entities and other structured finance entities.
47
Contractual Obligations
We enter into long-term contractual obligations and commitments in the normal course of business, primarily debt obligations and non-cancellable operating leases. Our contractual cash obligations at December 31, 20122013 are set forth below.
| Total | Less than 1 Year | 1-3 Years | 3-5 Years | More than 5 Years | Total | Less than | 1-3 Years | 3-5 Years | More than | |||||||||||||||||||||||||||||||
Long-term debt obligations, including accrued interest | $ | 19,400 | $ | 1,650 | $ | 17,750 | $ | — | $ | — | $ | 17,750 | $ | 1,650 | $ | 16,100 | $ | — | $ | — | ||||||||||||||||||||
Operating lease obligations | 627 | 444 | 183 | — | — | 787 | 663 | 124 | — | — | ||||||||||||||||||||||||||||||
|
|
|
|
| ||||||||||||||||||||||||||||||||||||
Total contractual obligations | $ | 20,027 | $ | 2,094 | $ | 17,933 | $ | — | $ | — | $ | 18,537 | $ | 2,313 | $ | 16,224 | $ | — | $ | — | ||||||||||||||||||||
|
|
|
|
| ||||||||||||||||||||||||||||||||||||
Critical Accounting Policies and Estimates
Our financial statements are prepared in accordance with generally accepted accounting principles in the United States, or U.S. GAAP. The preparation of these financial statements requires us to make estimates and assumptions that affect the reported amounts of assets, liabilities, revenue, expenses and related disclosures. We evaluate our estimates and assumptions on an ongoing basis. Our estimates are based on historical experience and various other assumptions that we believe to be reasonable under the circumstances. Our actual results could differ from these estimates.
We believe the following critical accounting policies involve significant areas of management’s judgment and estimates in the preparation of our consolidated financial statements.
Membership Revenue Recognition
We recognize revenue when all of the following conditions are met: there is persuasive evidence of an arrangement;arrangement, the service has been provided to the customer;customer, the collection of the fees is reasonably assured and the amount of fees to be paid by the customer is fixed or determinable. Our revenue includes membership revenue, which includes non-refundable initiation fees and membership fees for monthly, annual and multi-year memberships, and service provider revenue, which includes revenue from service provider advertising.
We recognize revenue from membership fees on a straight-line basis during the contractual period over which the service is delivered. We amortize revenue from the initiation fees of members over the average membership life on a straight-line basis. The estimated membership lives of monthly members and annual members for 2013 are 1215 months and 6876 months, respectively, based on historical experience. Estimates made by us may differ from actual customer lives. These differences may impact initiation fee revenue, depending on whether the estimated customer life decreases or increases. A change in the estimated customer life by one year in either direction would have a minimal impact to total revenue.
Stock-Based Compensation
We measure stock-based compensation expense for personnel at the grant date fair value of the award and recognize expense on a straight-line basis over the vesting period. Determining the fair value of an award requires judgment.
We estimate the fair value of stock-based payment awards using the Black-Scholes option-pricing model. The determination of the fair value of a stock-based award on the date of grant using the Black-Scholes option-pricing model is affected by our stock price on the date of grant as well as assumptions regarding a number of complex and subjective variables. These variables include our expected stock price volatility over the expected term of the award, actual and projected employee stock option exercise behaviors, the risk-free interest rate for the expected term of the award and expected dividends. The value of the portion of the award that is ultimately expected to vest is recognized as an expense in our statements of operations.
48
The following table summarizes the weighted averageweighted-average grant date fair value and the weighted-average assumptions relating to our stock options granted during 20122013 and 2011:2012:
| 2012 | 2011 | 2013 | 2012 | |||||||||||||
Dividend yield | 0 | % | 0 | % | 0 | % | 0 | % | ||||||||
Volatility | 60 | % | 50 | % | 57 | % | 60 | % | ||||||||
Risk-free interest rate | 0.71 | % | 1.26 | % | 1.02 | % | 0.71 | % | ||||||||
Expected term, in years | 4.4 | 4.7 | 4.9 | 4.4 | ||||||||||||
| Weighted-average estimated fair value of options granted during the year | $ | 9.38 | $ | 6.04 | ||||||||||||
We use an expected dividend rate of zero based on the fact that we currently have no history or expectation of paying cash dividends on our capital stock. BecauseAs our common stock had never been publicly traded prior to November 17, 2011, we estimated the expected volatility of our awards from the historical volatility of selected public companies within the internet and media industry with comparable characteristics to us, including similarity in size, lines of business, market capitalization, revenue and financial leverage as well as the expected volatility of our publicly traded common shares. The risk-free interest rate is based on the implied yield currently available on U.S. Treasury issues with terms approximately equal to the expected life of the option. We estimated our expected term based on our historical experience. A 10% change in our stock-based compensation would impact net income by $0.4 million and is immaterial.
Recent Accounting Pronouncements
For detailed information regarding recently issued accounting pronouncements and the expected impact on our financial statements, see Note 1, “Summary of Significant Accounting Policies” in the accompanying Notes to Consolidated Financial Statements included in Item 8 of this Form 10-K.
ITEM 7A. QUANTITATIVE AND QUALITATIVE DISCLOSURESABOUT MARKET RISK
Interest Rate Fluctuations
We had cash and cash equivalents of $42.6$34.8 million at December 31, 2012,2013, which was held in bank deposit accounts and money market funds for working capital purposes. In addition,we had short-term investments of $10.5$21.1 million in certificates of deposit and corporate bonds which are being heldwith maturities greater than 90 days but less than one year. The Company has the ability and intent to hold these investments to maturity. Declines in interest rates may reduce future investment income on these deposits. We do not enter into investments for trading or speculative purposes. We are paid interest on our deposits at variable rates and receive interest payments on held to maturity investments at fixed rates.
We do not believe that a hypothetical 10% increase or decrease in interest rates as of December 31, 20122013 would have had a material impact on our investment income.
In August 2011, we entered into a loan and security agreement that provides for a $15.0 million term loan and a $15.0 million revolving credit facility. The term loan bears interest at a per annum rate equal to the greater of (i) the current cash interest rate of LIBOR plus 10% or (ii) 10.5%, and requires monthly interest-only payments until maturity in August 2015. The revolving credit facility requires monthly interest-only payments on advances, which bear interest at a per annum rate equal to LIBOR plus 5%. As of December 31, 2012,2013, we had $15.0$14.9 million in outstanding borrowings under the term loan and available credit of $15.0 million under the revolving credit facility. We do not believe an immediate 10% increase in interest rates would have a material effect on interest expense, and therefore,we do not expect our operating results or cash flows to be materially affected to any degree by a sudden change in market interest rates.
ITEM 8. FINANCIAL STATEMENTS AND SUPPLEMENTARY DATA
49
INDEX TO CONSOLIDATED FINANCIAL STATEMENTS
Angie’s List, Inc.
Consolidated Financial Statements
Years Ended December 31, 2013, 2012 2011 and 20102011
Contents
49 | ||||
Consolidated Financial Statements | ||||
50 | ||||
51 | ||||
Consolidated Statements of Stockholders’ | 52 | |||
53 | ||||
54 | ||||
50
Report of Independent Registered Public Accounting Firm
The Board of Directors and Stockholders of Angie’s List, Inc.
We have audited the accompanying consolidated balance sheets of Angie’s List, Inc. as of December 31, 20122013 and 2011,2012, and the related consolidated statements of operations, stockholders’ and members’ equity (deficit) and cash flows for each of the three years in the period ended December 31, 2012.2013. These financial statements are the responsibility of the Company’s management. Our responsibility is to express an opinion on these financial statements based on our audits.
We conducted our audits in accordance with the standards of the Public Company Accounting Oversight Board (United States). Those standards require that we plan and perform the audit to obtain reasonable assurance about whether the financial statements are free of material misstatement. An audit includes examining, on a test basis, evidence supporting the amounts and disclosures in the financial statements. An audit also includes assessing the accounting principles used and significant estimates made by management, as well as evaluating the overall financial statement presentation. We believe that our audits provide a reasonable basis for our opinion.
In our opinion, the financial statements referred to above present fairly, in all material respects, the consolidated financial position of Angie’s List, Inc. at December 31, 20122013 and 2011,2012, and the consolidated results of its operations and its cash flows for each of the three years in the period ended December 31, 2012,2013, in conformity with U.S. generally accepted accounting principles.
We also have audited, in accordance with the standards of the Public Company Accounting Oversight Board (United States), Angie’s List, Inc.’s internal control over financial reporting as of December 31, 2012,2013, based on criteria established in Internal Control-Integrated Framework issued by the Committee of Sponsoring Organizations of the Treadway Commission (“1992 framework”) and our report dated February 25, 201328, 2014 expressed an unqualified opinion thereon.
/s/ Ernst & Young LLP
Indianapolis, Indiana
February 25, 2013
51
Angie’s List, Inc.
(in thousands, except share data)
| December 31, | December 31, | |||||||||||||||
| 2012 | 2011 | 2013 | 2012 | |||||||||||||
Assets | ||||||||||||||||
Cash and cash equivalents | $ | 42,638 | $ | 88,607 | $ | 34,803 | $ | 42,638 | ||||||||
Restricted cash | 50 | 300 | 50 | 50 | ||||||||||||
Short-term investments | 10,460 | — | 21,055 | 10,460 | ||||||||||||
Accounts receivable, net of allowance for doubtful accounts of $922 and $535 at December 31, 2012 and 2011 | 7,787 | 3,937 | ||||||||||||||
Accounts receivable, net of allowance for doubtful accounts of $1,107 and $922 at December 31, 2013 and 2012 | 12,385 | 7,787 | ||||||||||||||
Prepaid expenses and other current assets | 19,810 | 11,835 | 13,651 | 19,810 | ||||||||||||
|
| |||||||||||||||
Total current assets | 80,745 | 104,679 | 81,944 | 80,745 | ||||||||||||
Property and equipment, net | 12,079 | 3,883 | 18,657 | 12,079 | ||||||||||||
Goodwill | 415 | 415 | 1,145 | 415 | ||||||||||||
Amortizable intangible assets, net | 2,356 | 1,555 | 3,500 | 2,356 | ||||||||||||
Deferred financing fees, net | 634 | 866 | 397 | 634 | ||||||||||||
|
| |||||||||||||||
Total assets | $ | 96,229 | $ | 111,398 | $ | 105,643 | $ | 96,229 | ||||||||
|
| |||||||||||||||
Liabilities and stockholders’ equity | ||||||||||||||||
Liabilities and stockholders’ equity (deficit) | ||||||||||||||||
Accounts payable | $ | 6,489 | $ | 5,266 | $ | 6,838 | $ | 6,489 | ||||||||
Accrued liabilities | 14,058 | 10,532 | 21,770 | 14,058 | ||||||||||||
Deferred membership revenue | 27,627 | 17,153 | 35,560 | 27,627 | ||||||||||||
Deferred advertising revenue | 23,160 | 13,643 | 39,448 | 23,160 | ||||||||||||
|
| |||||||||||||||
Total current liabilities | 71,334 | 46,594 | 103,616 | 71,334 | ||||||||||||
Long-term debt, including accrued interest | 14,869 | 14,820 | 14,918 | 14,869 | ||||||||||||
Deferred membership revenue, noncurrent | 4,330 | 3,751 | 4,909 | 4,330 | ||||||||||||
Deferred advertising revenue, noncurrent | 214 | 239 | 521 | 214 | ||||||||||||
Deferred income taxes | 163 | 158 | 169 | 163 | ||||||||||||
|
| |||||||||||||||
Total liabilities | 90,910 | 65,562 | 124,133 | 90,910 | ||||||||||||
Commitments and contingencies (Note 9) | ||||||||||||||||
Stockholders’ equity: | ||||||||||||||||
Preferred stock, $0.001 par value: 10,000,000 shares authorized, no shares issued or outstanding at December 31, 2012 and December 31, 2011 | — | — | ||||||||||||||
Common stock, $0.001 par value: 300,000,000 shares authorized, 66,425,988 and 65,491,897 shares issued and 57,867,276 and 56,933,185 shares outstanding at December 31, 2012 and December 31, 2011, respectively | 66 | 65 | ||||||||||||||
Stockholders’ equity (deficit) | ||||||||||||||||
Preferred stock, $0.001 par value: 10,000,000 shares authorized, no shares issued or outstanding at December 31, 2013 and December 31, 2012 | — | — | ||||||||||||||
Common stock, $0.001 par value: 300,000,000 shares authorized, 67,014,757 and 66,425,988 shares issued and 58,456,045 and 57,867,276 shares outstanding at December 31, 2013 and December 31, 2012, respectively | 67 | 66 | ||||||||||||||
Additional paid-in-capital | 248,326 | 235,950 | 257,505 | 248,326 | ||||||||||||
Treasury stock, at cost: 8,558,712 shares of common stock at December 31, 2012 and December 31, 2011 | (23,719 | ) | (23,719 | ) | ||||||||||||
Treasury stock, at cost: 8,558,712 shares of common stock at December 31, 2013 and December 31, 2012 | (23,719 | ) | (23,719 | ) | ||||||||||||
Accumulated deficit | (219,354 | ) | (166,460 | ) | (252,343 | ) | (219,354 | ) | ||||||||
|
| |||||||||||||||
Total stockholders’ equity | 5,319 | 45,836 | ||||||||||||||
|
| |||||||||||||||
Total liabilities and stockholders’ equity | $ | 96,229 | $ | 111,398 | ||||||||||||
|
| |||||||||||||||
Total stockholders’ equity (deficit) | (18,490 | ) | 5,319 | |||||||||||||
Total liabilities and stockholders’ equity (deficit) | $ | 105,643 | $ | 96,229 | ||||||||||||
See accompanying notes.
52
Angie’s List, Inc.
Consolidated Statements of Operations
(in thousands, except share and per share data)
| Year Ended December 31, | Year Ended December 31, | |||||||||||||||||||||||
| 2012 | 2011 | 2010 | 2013 | 2012 | 2011 | |||||||||||||||||||
Revenue | ||||||||||||||||||||||||
Membership | $ | 47,717 | $ | 33,815 | $ | 25,149 | $ | 65,307 | $ | 47,717 | $ | 33,815 | ||||||||||||
Service provider | 108,082 | 56,228 | 33,890 | 180,335 | 108,082 | 56,228 | ||||||||||||||||||
|
|
| ||||||||||||||||||||||
Total revenue | 155,799 | 90,043 | 59,039 | 245,642 | 155,799 | 90,043 | ||||||||||||||||||
Operating expenses | ||||||||||||||||||||||||
Operations and support | 27,081 | 16,417 | 12,464 | 40,072 | 27,081 | 16,417 | ||||||||||||||||||
Selling | 58,596 | 33,815 | 16,892 | 90,143 | 58,596 | 33,815 | ||||||||||||||||||
Marketing | 80,230 | 56,122 | 30,237 | 87,483 | 80,230 | 56,122 | ||||||||||||||||||
Technology | 16,870 | 9,109 | 6,270 | 26,197 | 16,870 | 9,109 | ||||||||||||||||||
General and administrative | 24,055 | 18,740 | 16,302 | 32,828 | 24,055 | 18,740 | ||||||||||||||||||
|
|
| ||||||||||||||||||||||
Operating loss | (51,033 | ) | (44,160 | ) | (23,126 | ) | (31,081 | ) | (51,033 | ) | (44,160 | ) | ||||||||||||
Interest expense, net | 1,856 | 3,004 | 3,966 | 1,868 | 1,856 | 3,004 | ||||||||||||||||||
Loss on debt extinguishment | — | 1,830 | — | — | — | 1,830 | ||||||||||||||||||
|
|
| ||||||||||||||||||||||
Loss before income taxes | (52,889 | ) | (48,994 | ) | (27,092 | ) | (32,949 | ) | (52,889 | ) | (48,994 | ) | ||||||||||||
Income tax expense | 5 | 43 | 154 | 40 | 5 | 43 | ||||||||||||||||||
|
|
| ||||||||||||||||||||||
Net loss | $ | (52,894 | ) | $ | (49,037 | ) | $ | (27,246 | ) | $ | (32,989 | ) | $ | (52,894 | ) | $ | (49,037 | ) | ||||||
|
|
| ||||||||||||||||||||||
Net loss per common share—basic and diluted | $ | (0.92 | ) | $ | (1.60 | ) | $ | (0.99 | ) | $ | (0.57 | ) | $ | (0.92 | ) | $ | (1.60 | ) | ||||||
Weighted average number of common shares outstanding—basic and diluted | 57,485,589 | 30,655,532 | 27,603,927 | 58,230,927 | 57,485,589 | 30,655,532 | ||||||||||||||||||
See accompanying notes.
53
Angie’s List, Inc.
Consolidated Statements of Stockholders’ and Members’ Equity (Deficit)
(in thousands)
| Member Contributions | Convertible Preferred Stock | Common Stock | Additional Paid- In Capital | Treasury Stock | Accumulated Deficit | Total Equity (Deficit) | ||||||||||||||||||||||||||||||||||||||||||||||
Balance at December 31, 2009 | $ | 53,909 | $ | — | $ | — | $ | — | $ | — | $ | (90,177 | ) | $ | (36,268 | ) | ||||||||||||||||||||||||||||||||||||
Reorganization(Note 1) | (53,942 | ) | 2 | 33 | 53,907 | — | — | — | ||||||||||||||||||||||||||||||||||||||||||||
Net loss | — | — | — | — | — | (27,246 | ) | (27,246 | ) | |||||||||||||||||||||||||||||||||||||||||||
Sale of preferred stock, net of costs | — | — | — | 23,875 | — | — | 23,875 | |||||||||||||||||||||||||||||||||||||||||||||
Distribution to stockholders | (60 | ) | — | — | (36 | ) | — | — | (96 | ) | ||||||||||||||||||||||||||||||||||||||||||
Repurchase of stock | — | — | — | — | (1,822 | ) | — | (1,822 | ) | |||||||||||||||||||||||||||||||||||||||||||
Stock-based compensation | 93 | — | — | 6,633 | — | — | 6,726 | |||||||||||||||||||||||||||||||||||||||||||||
Issuance of warrants | — | — | — | 1,074 | — | — | 1,074 | |||||||||||||||||||||||||||||||||||||||||||||
|
|
|
|
|
|
| Convertible | Common | Additional | Treasury | Accumulated | Total | ||||||||||||||||||||||||||||||||||||||||
Balance at December 31, 2010 | $ | — | $ | 2 | $ | 33 | $ | 85,453 | $ | (1,822 | ) | $ | (117,423 | ) | $ | (33,757 | ) | $ | 2 | $ | 33 | $ | 85,453 | $ | (1,822 | ) | $ | (117,423 | ) | $ | (33,757 | ) | ||||||||||||||||||||
Net loss | — | — | — | — | — | (49,037 | ) | (49,037 | ) | — | — | — | — | (49,037 | ) | (49,037 | ) | |||||||||||||||||||||||||||||||||||
Sale of preferred stock, net of costs | — | 1 | — | 57,922 | — | — | 57,923 | 1 | — | 57,922 | — | — | 57,923 | |||||||||||||||||||||||||||||||||||||||
Preferred stock conversion | — | (3 | ) | 3 | — | — | — | — | (3 | ) | 3 | — | — | — | — | |||||||||||||||||||||||||||||||||||||
Issuance of common stock, net of costs | — | — | 29 | 88,536 | — | — | 88,565 | — | 29 | 88,536 | — | — | 88,565 | |||||||||||||||||||||||||||||||||||||||
Repurchase of stock | — | — | — | — | (21,897 | ) | — | (21,897 | ) | — | — | — | (21,897 | ) | — | (21,897 | ) | |||||||||||||||||||||||||||||||||||
Stock-based compensation | — | — | — | 3,842 | — | — | 3,842 | — | — | 3,842 | — | — | 3,842 | |||||||||||||||||||||||||||||||||||||||
Issuance of warrants | — | — | — | 197 | — | — | 197 | — | — | 197 | — | — | 197 | |||||||||||||||||||||||||||||||||||||||
|
|
|
|
|
|
| ||||||||||||||||||||||||||||||||||||||||||||||
Balance at December 31, 2011 | $ | — | $ | — | $ | 65 | $ | 235,950 | $ | (23,719 | ) | $ | (166,460 | ) | $ | 45,836 | $ | — | $ | 65 | $ | 235,950 | $ | (23,719 | ) | $ | (166,460 | ) | $ | 45,836 | ||||||||||||||||||||||
Net loss | — | — | — | — | — | (52,894 | ) | (52,894 | ) | — | — | — | — | (52,894 | ) | (52,894 | ) | |||||||||||||||||||||||||||||||||||
Issuance of common stock, net of costs | — | — | 1 | 8,626 | — | — | 8,627 | — | 1 | 8,626 | — | — | 8,627 | |||||||||||||||||||||||||||||||||||||||
Stock-based compensation | — | — | — | 2,943 | — | — | 2,943 | — | — | 2,943 | — | — | 2,943 | |||||||||||||||||||||||||||||||||||||||
Exercise of stock options and warrants | — | — | — | 807 | — | — | 807 | — | — | 807 | — | — | 807 | |||||||||||||||||||||||||||||||||||||||
|
|
|
|
|
|
| ||||||||||||||||||||||||||||||||||||||||||||||
Balance at December 31, 2012 | $ | — | $ | — | $ | 66 | $ | 248,326 | $ | (23,719 | ) | $ | (219,354 | ) | $ | 5,319 | $ | — | $ | 66 | $ | 248,326 | $ | (23,719 | ) | $ | (219,354 | ) | $ | 5,319 | ||||||||||||||||||||||
|
|
|
|
|
|
| ||||||||||||||||||||||||||||||||||||||||||||||
Net loss | — | — | — | — | (32,989 | ) | (32,989 | ) | ||||||||||||||||||||||||||||||||||||||||||||
Stock-based compensation | — | — | 4,064 | — | — | 4,064 | ||||||||||||||||||||||||||||||||||||||||||||||
Exercise of stock options | — | 1 | 5,115 | — | — | 5,116 | ||||||||||||||||||||||||||||||||||||||||||||||
Balance at December 31, 2013 | $ | — | $ | 67 | $ | 257,505 | $ | (23,719 | ) | $ | (252,343 | ) | $ | (18,490 | ) | |||||||||||||||||||||||||||||||||||||
See accompanying notes.
54
Angie’s List, Inc.
Consolidated Statements of Cash Flows
(in thousands)
| Year Ended December 31, | Year Ended December 31, | |||||||||||||||||||||||
| 2012 | 2011 | 2010 | 2013 | 2012 | 2011 | |||||||||||||||||||
Operating activities | ||||||||||||||||||||||||
Net loss | $ | (52,894 | ) | $ | (49,037 | ) | $ | (27,246 | ) | $ | (32,989 | ) | $ | (52,894 | ) | $ | (49,037 | ) | ||||||
Adjustments to reconcile net loss to net cash used in operating activities: | ||||||||||||||||||||||||
Depreciation and amortization | 2,753 | 1,660 | 1,378 | 4,069 | 2,753 | 1,660 | ||||||||||||||||||
Deferred income taxes | 5 | 4 | 154 | 6 | 5 | 4 | ||||||||||||||||||
Accrued interest due on debt maturity date | — | 625 | 1,226 | — | — | 625 | ||||||||||||||||||
Amortization of debt discount and deferred financing fees | 312 | 596 | 615 | 527 | 312 | 596 | ||||||||||||||||||
Bad debt expense | 1,955 | 806 | 454 | 2,658 | 1,955 | 806 | ||||||||||||||||||
Noncash compensation expense | 2,943 | 3,842 | 6,699 | 4,064 | 2,943 | 3,842 | ||||||||||||||||||
Noncash loss on debt extinguishment | — | 1,075 | — | — | — | 1,075 | ||||||||||||||||||
Changes in certain assets: | ||||||||||||||||||||||||
Accounts receivable | (5,805 | ) | (2,081 | ) | (1,116 | ) | (7,256 | ) | (5,805 | ) | (2,081 | ) | ||||||||||||
Prepaid expenses and other current assets | (7,975 | ) | (6,068 | ) | (1,688 | ) | 6,159 | (7,975 | ) | (6,068 | ) | |||||||||||||
Changes in certain liabilities: | ||||||||||||||||||||||||
Accounts payable | 1,223 | 2,089 | 718 | (1,151 | ) | 1,223 | 2,089 | |||||||||||||||||
Accrued liabilities | 3,541 | 4,497 | 2,490 | 7,712 | 3,541 | 4,497 | ||||||||||||||||||
Accrued interest on long-term debt | — | (2,668 | ) | — | — | — | (2,668 | ) | ||||||||||||||||
Deferred advertising revenue | 9,492 | 5,433 | 1,859 | 16,595 | 9,492 | 5,433 | ||||||||||||||||||
Deferred membership revenue | 11,053 | 6,092 | 3,378 | 8,512 | 11,053 | 6,092 | ||||||||||||||||||
|
|
| ||||||||||||||||||||||
Net cash used in operating activities | (33,397 | ) | (33,135 | ) | (11,079 | ) | ||||||||||||||||||
Net cash provided by (used in) operating activities | 8,906 | (33,397 | ) | (33,135 | ) | |||||||||||||||||||
Investing activities | ||||||||||||||||||||||||
Restricted cash | 250 | — | (150 | ) | — | 250 | — | |||||||||||||||||
Purchases of short-term investments | (10,491 | ) | — | — | (32,814 | ) | (10,491 | ) | — | |||||||||||||||
Sales of short-term investments | 21,978 | — | — | |||||||||||||||||||||
Acquisition of business | (2,150 | ) | — | — | ||||||||||||||||||||
Property and equipment | (9,730 | ) | (3,085 | ) | (629 | ) | (8,102 | ) | (9,730 | ) | (3,085 | ) | ||||||||||||
Data acquisition costs | (2,035 | ) | (1,191 | ) | (789 | ) | (769 | ) | (2,035 | ) | (1,191 | ) | ||||||||||||
|
|
| ||||||||||||||||||||||
Net cash used in investing activities | (22,006 | ) | (4,276 | ) | (1,568 | ) | (21,857 | ) | (22,006 | ) | (4,276 | ) | ||||||||||||
Financing activities | ||||||||||||||||||||||||
Borrowings under lines of credit | — | 10,000 | — | — | — | 10,000 | ||||||||||||||||||
Payments under lines of credit | — | (10,000 | ) | — | — | — | (10,000 | ) | ||||||||||||||||
Principal payments on long-term debt | — | (21,797 | ) | (2,036 | ) | — | — | (21,797 | ) | |||||||||||||||
Proceeds from long-term debt | — | 15,000 | — | — | — | 15,000 | ||||||||||||||||||
Payments on capital lease obligations | — | (41 | ) | (81 | ) | — | — | (41 | ) | |||||||||||||||
Purchases of treasury stock | — | (21,897 | ) | (1,822 | ) | — | — | (21,897 | ) | |||||||||||||||
Distributions to stockholders | — | — | (96 | ) | ||||||||||||||||||||
Cash paid for financing costs | — | (944 | ) | — | — | — | (944 | ) | ||||||||||||||||
Proceeds from public stock offerings and other, net of fees | 8,627 | 88,565 | — | — | 8,627 | 88,565 | ||||||||||||||||||
Proceeds from exercise of stock options | 807 | — | — | 5,116 | 807 | — | ||||||||||||||||||
Sale of preferred stock, net of fees | — | 57,923 | 23,875 | — | — | 57,923 | ||||||||||||||||||
|
|
| ||||||||||||||||||||||
Net cash provided by financing activities | 9,434 | 116,809 | 19,840 | 5,116 | 9,434 | 116,809 | ||||||||||||||||||
|
|
| ||||||||||||||||||||||
Net increase (decrease) in cash | (45,969 | ) | 79,398 | 7,193 | (7,835 | ) | (45,969 | ) | 79,398 | |||||||||||||||
Cash and cash equivalents, beginning of period | 88,607 | 9,209 | 2,016 | 42,638 | 88,607 | 9,209 | ||||||||||||||||||
|
|
| ||||||||||||||||||||||
Cash and cash equivalents, end of period | $ | 42,638 | $ | 88,607 | $ | 9,209 | $ | 34,803 | $ | 42,638 | $ | 88,607 | ||||||||||||
|
|
| ||||||||||||||||||||||
Supplemental cash flow disclosures | ||||||||||||||||||||||||
Cash paid for interest | $ | 1,680 | $ | 4,899 | $ | 2,057 | $ | 1,602 | $ | 1,680 | $ | 4,899 | ||||||||||||
Cash paid for income taxes | 15 | — | — | — | 15 | — | ||||||||||||||||||
Capital expenditures incurred but not yet paid | 1,000 | — | — | |||||||||||||||||||||
See accompanying notes.
55
Angie’s List, Inc.
Notes to Consolidated Financial Statements
Years Ended December 31, 2013, 2012, 2011, and 20102011
(Dollars in Thousands, except per share data)
1. Summary of Significant Accounting Policies
Nature of Operations and Reorganization
Angie’s List, Inc. (collectively with its wholly owned subsidiaries, the Company) operates a consumer-driven service for its members to research, hire, rate and review local professionals for critical needs, such as home, health care and automotive services. Ratings and reviews, which are available only to the Company’s members, help its members to find the best provider for their local service needs. Membership subscriptions are sold on a monthly, annual and multi-year basis. The consumer rating network “Angie’s List” is maintained and updated based on member feedback. The Company also sells advertising in its monthly publication, on its website and through its call center to service providers that meet certain rating criteria. In addition, the Company’s e-commerce offerings provide its members the opportunity to purchase services directly from the Company from service providers that are rated on its website. The Company’s services are provided in metropolitan areasmarkets located across the continental United States.
Angie’s List, Inc. was formed as a Delaware corporation effective April 23, 2010, for the purpose of reorganizing the structure of Brownstone Publishing, LLC (Brownstone). Effective April 30, 2010, the unit holders of Brownstone contributed all of their units to Angie’s List, Inc. in return for shares of common and preferred stock. Brownstone had certain debt and warrants outstanding which were assumed by Angie’s List, Inc.
Operating segments are defined as components of an enterprise engaging in business activities for which discrete financial information is available and regularly reviewed by the chief operating decision maker in deciding how to allocate resources and in assessing performance. The Company manages its business on the basis of one operating segment.
Principles of Consolidation
The consolidated financial statements include the accounts of the Company and its wholly owned subsidiaries. All significant intercompany accounts and transactions have been eliminated in consolidation.
The Company has evaluated subsequent events through the date these consolidated financial statements were issued.
Estimates
Management uses estimates and assumptions in preparing consolidated financial statements in accordance with accounting principles generally accepted in the United States. Those estimates and assumptions affect the reported amounts of assets and liabilities, the disclosure of contingent assets and liabilities and the reported revenue and expenses. Actual results could vary from the estimates that were used.
Common Stock
On October 31, 2011, the Company effected an eight-for-one split of its common stock by way of a stock dividend. As a result of the stock split, holders of the Company’s common stock received seven additional shares of common stock for every share held on such date, and a proportionate adjustment was made to the applicable conversion prices for each share of the Company’s outstanding convertible preferred stock (see Note 12). All share and per share amounts for all periods presented in these consolidated financial statements and notes thereto
56
have been were adjusted retroactively, where applicable, to reflect this stock split and the adjustment of the convertible preferred stock conversion prices.
In May 2012, the Company completed a secondaryfollow-on public offering of 8,629,797 shares of its common stock, which included 703,235 shares of common stock sold by the Company and 7,926,562 shares of common stock sold by the selling stockholders (inclusive of 189,374 shares of common stock from the partial exercise of the over-allotment option granted to the underwriters). The Company incurred fees resulting from the transaction of approximately $770, of which $81 is included in additional paid-in-capital and $689 is included in general and administrative expenses.
Revenue Recognition and Deferred Revenue
The Company recognizes revenue when all of the following conditions are met: there is persuasive evidence of an arrangement;arrangement, the service has been provided to the customer;customer, the collection of the fees is reasonably assured;assured and the amount of fees to be paid by the customer iscustomeris fixed or determinable.
Membership Revenue
Revenue from the sale of membership subscriptions is recognized ratably over the term of the associated subscription.
At the time a member joins, the Company may receive a one-time nonrefundable enrollment fee. Enrollment fees are deferred and recognized on a straight-line basis over an estimated average membership life of 6876 months for annual or multi-year members and 1215 months for monthly members, which is based on historical membership experience. The Company reviews the estimated average membership life on an annual basis, or more frequently if circumstances change. Changes in member behavior, performance, competition and economic conditions may cause attrition levels to change, which could impact the estimated average membership life.
Service Provider Revenue
Revenue from the sale of advertising in the Company’s publication is recognized in the month in which the Company’s monthly publication is published and distributed. Revenue from the sale of website and call center advertising is recognized ratably over the time period the advertisements run. Revenue from e-commerce vouchers is recognized on a net basis upon delivery ofwhen the voucher has been delivered to the purchaser. While the Company is not the merchant of record with respect to its customers for these transactions, it does offer customers refunds in certain circumstances. Revenue from e-commerce transactions is recorded net of a reserve for estimated refunds. The Company’s e-commerce revenue was $22,062, $14,475, and $6,651 for 2013, 2012, and 2011,respectively.
Deferred Revenue
Deferred revenue includes the unamortized portion of revenue associated with membership and advertising fees for which the Company has received payment in advance of services or advertising to be provided.
Cash and Cash Equivalents
The Company maintains its cash in bank deposit accounts and money market funds with contractual maturities of three months or less, which, at times, may exceed federally insured limits. The Company has not experienced any losses in such accounts.
Restricted Cash
Restricted cash relates to monies held in reserve at institutions pursuant to credit card processing agreements. The restricted cash is not available for operating activities.
57
Short-term investmentsInvestments
Investments with maturities less than one year consist of certificates of deposit (short-term only), and corporate bonds, all of which are designated as held-to-maturity investments and are recorded at amortized cost, adjusted for amortization of premiums to maturity computed under the effective interest method, in the consolidated balance sheets. Such amortization and interest income from held-to-maturity investments is included in interest expense, net in the consolidated statement of operations. For these investments, the Company’s objective is to earn a higher rate of return on funds that are not anticipated to be required to meet liquidity needs in the near term, while maintaining a low level of investment risk with the positive intent and ability to hold these investments to maturity. Short-term investments are reviewed for impairment whenever events or changes in circumstances indicate that the carrying amount of the investment may be impaired. As of December 31, 2012,2013, Angie’s List, Inc. had $10,460$21,055 in short-term investments with no material unrealized gains or losses.
Accounts Receivable
Accounts receivable are stated at the amount billed to service providers, less an estimated allowance for doubtful accounts. The Company performs ongoing credit evaluations and generally requires no collateral from service providers. Management reviews individual accounts as they become past due to determine collectability. The allowance for doubtful accounts is adjusted periodically based on management’s consideration of past due accounts. Individual accounts are charged against the allowance when all reasonable collection efforts have been exhausted.
The changes in the allowance for doubtful accounts during the years ended December 31, 2013, 2012 2011 and 20102011 were as follows:
| Year Ended December 31, | Year Ended December 31, | |||||||||||||||||||||||
| 2012 | 2011 | 2010 | 2013 | 2012 | 2011 | |||||||||||||||||||
Beginning balance | $ | 535 | $ | 241 | $ | 175 | $ | 922 | $ | 535 | $ | 241 | ||||||||||||
Additions, net of recoveries | 1,955 | 806 | 454 | 3,773 | 1,955 | 806 | ||||||||||||||||||
Deductions | (1,568 | ) | (512 | ) | (388 | ) | (3,588 | ) | (1,568 | ) | (512 | ) | ||||||||||||
|
|
| ||||||||||||||||||||||
Ending Balance | $ | 922 | $ | 535 | $ | 241 | $ | 1,107 | $ | 922 | $ | 535 | ||||||||||||
|
|
| ||||||||||||||||||||||
Property and Equipment
Property and equipment are stated at cost and are depreciated over the estimated useful life of each asset. The Company also capitalizes the cost of computer software developed or obtained for internal use. The Company’s estimated lives for property and equipment range from 3 to 25 years. Depreciation is computed using the straight-line method. Repairs and routine maintenance are charged to expense as incurred.
Data Acquisition Costs
Data acquisition costs consist of external costs related to acquiring consumer reports on service providers. These reports are used by the Company to provide its members with feedback on service providers. Amortization is computed using the straight-line method over the period which the information is expected to benefit the Company’s members, which is estimated to be three years. The capitalized costs are included in intangible assets on the consolidated balance sheet,and the amortized expense is reflected within operations and support expenses in the consolidated statements of operations.
Long-Lived Assets
Long-lived assets, including property and equipment and amortizable intangible assets, are reviewed for impairment whenever events or changes in circumstances indicate that the carrying amount of an asset may not be recoverable. Recoverability is measured by comparison of the carrying amount to future net undiscounted
58
cash flows expected to be generated by the related asset. If such assets are considered to be impaired, the impairment to be recognized is measured by the amount by which the carrying amount exceeds the fair market value of the assets. To date, there have been no adjustments to the respective carrying values.
Goodwill
Goodwill is not amortized but is tested for impairment annually during the fourth quarter,on December 31 and more frequently whenever an event occurs or circumstances indicate the carrying amount may be impaired. If the estimated fair value of goodwill is lower than its carrying amount, a goodwill impairment is indicated,and goodwill is written down to its estimated fair value. To date, there has been no impairment of goodwill.
Sales Commissions
Commissions expense from the sale of service provider advertisements is recognized ratably over the term of the associated advertisement. The Company defers the recognition of commission expense until such time as the revenue related to the customer contract for which the commission was paid is recognized. Deferred commissions for each contract are amortized to expense in a manner consistent with how revenue is recognized for such contract, resulting in straight-line recognition of expense over the contractual term. Unamortized commission expense of $17,215,$9,395 and $10,486,$17,215 as of December 31, 20122013 and 2011,2012, respectively, is included in prepaid expenses and other current assets in the accompanying consolidated balance sheets. The decrease in unamortized commissions expense in 2013 is a reflection of the change in the Company’s payment practice for commissions whereby the Company now times the actual commission payment to more closely align with the timing of expense recognition.
Deferred Financing Fees
In August 2011, in connection with its entry into a loan and security agreement, the Company incurred certain costs associated with these financing activities of $944, which are being amortized into interest expense over the term of the credit facility. Deferred financing costs recorded previously in 2009 and 2010 of $328 and $1,074 were recorded as a result of certain financing agreements and were being amortized over the terms of their respective agreements. In connection with the extinguishment of its senior and subordinated loan agreements in August 2011, the Company expensed the unamortized portion of deferred financing fees associated with these loan agreements, which are included in the loss on debt extinguishment. Deferred financing fees, net of accumulated amortization, totaled $634$397 and $866$634 at December 31, 20122013 and 2011,2012, respectively. Amortization expense of $237, $232 and $524 and $533 areis included in interest expense in the consolidated statements of operations for the fiscal years ended December 31, 2013, 2012 and 2011, and 2010, respectively.
Income Taxes
Prior to April 30, 2010, the Company was a limited liability corporation (LLC) and elected to be treated as a partnership for income tax purposes. The Company reorganized and on April 30, 2010, the Company becameis subject to corporate-level federal and state income taxes at prevailing corporate rates. As a result of this conversion, the Companyrates and accounts for income taxes and the related accounts using the liability method in accordance with Financial Accounting Standards Board (FASB) Accounting Standards Codification (ASC) 740,Income Taxes. Under this method, the Company accrues income taxes payable or refundable and recognizes deferred tax assets and liabilities based on differences between the book and tax basis of assets and liabilities. The Company measures deferred tax assets and liabilities using enacted rates in effect for the years in which the differences are expected to reverse and recognizes the effect of a change in enacted rates in the period of enactment. After determining the total amount of deferred tax assets, the Company determines whether it is more likely than not that some portion of the deferred tax assets will not be realized. If the Company determines that a deferred tax asset is not likely to be realized, a valuation allowance will be established against that asset to record it at its expected realizable value.
The Company establishes assets and liabilities for uncertain positions taken or expected to be taken in income tax returns using a more-likely-than-not recognition threshold. The Company includes in income tax expense any interest and penalties related to uncertain tax positions.
59
Marketing Expense
Marketing expense consists of national television, radio and print, as well as online, advertising. The Company expenses all advertising costs as incurred.
Stock-Based Compensation
The Company accounts for stock-based compensation using the fair value recognition provisions of ASC 718,Stock Compensation. For its awards of restricted stock and stock options,the Company recognizes stock-based compensation expense in an amount equal to the fair market value on the grant date of the respective award. The Company recognizes this expense, net of estimated forfeitures, on a straight-line basis over the requisite service period.
The fair value of the stock under the plans was estimated at the date of grant using the Black-Scholes option-pricing model with the following weighted-average assumptions:
Year of Grant | Risk-free | Dividend | Expected | Volatility | ||||||||||||
(In Years) | ||||||||||||||||
2011 | 1.26 | % | 0 | % | 4.7 | 50.0 | % | |||||||||
2012 | 0.71 | % | 0 | % | 4.4 | 60.0 | % | |||||||||
2013 | 1.02 | % | 0 | % | 4.9 | 57.0 | % | |||||||||
Expected volatility is based on historical volatilities for publicly traded common stock of comparable companies over the estimated expected life of the stock options. The expected term represents the period of time the stock options are expected to be outstanding. The risk-free interest rate is based on yields of U.S. Treasury securities with a maturity similar to the estimated expected term of the stock options.
Sales and Use Tax
Sales and use tax expenses are included within operations and support in the consolidated statements of operations. The Company does not separately collect sales and use taxes from its members.
Recent Accounting Pronouncements
In July 2013, the FASB issued Accounting Standards Update No. 2013-11: Income Taxes (Topic 740), Presentation of an Unrecognized Tax Benefit When a Net Operating Loss Carryforward, a Similar Tax Loss, or a Tax Credit Carryforward Exists (a consensus of the FASB Emerging Issues Task Force) (“ASU 2013-11”). An entity is required to present unrecognized tax benefits as a decrease in a net operating loss, similar tax loss or tax credit carryforward if certain criteria are met. The determination of whether a deferred tax asset is available is based on the unrecognized tax benefit and the deferred tax asset that exists at the reporting date and presumes disallowance of the tax position at the reporting date. The guidance will eliminate the diversity in practice in the presentation of unrecognized tax benefits but will not alter the way in which entities assess deferred tax assets for realizability. ASU 2013-11 will be effective for the company in fiscal 2014. The Company is currently assessing the impact to the consolidated financial statements.
2. Net Loss Per Common Share
Basic and diluted net loss per common share is computed by dividing consolidated net loss by the weighted average number of common shares outstanding for the period. The weighted average number ofBasic and diluted net loss per common sharesshare were $(0.57) and $(0.92) for all periods prior to April 30, 2010 is based on member units assuming conversion to common stock at the applicable ratios effective upon reorganization on April 30, 2010.years ended December 31, 2013 and December 31, 2012, respectively.
The following potential dilutive equity securities are not included in the diluted net loss per common share calculation because they would have had an antidilutive effect:
| December 31, 2012 | December 31, 2011 | |||||||
Stock options | 2,820,619 | 2,814,888 | ||||||
Warrants | — | 360,544 | ||||||
December 31, 2013 | December 31, 2012 | |||||||
Stock options | 3,310,764 | 2,820,619 | ||||||
3. Fair Value Measurements
Whenever possible, quoted prices in active markets are used to determine the fair value of our financial instruments. Our financial instruments are not held for trading or other speculative purposes. The estimated fair value of financial instruments has beenwas determined by using available market information and appropriate valuation methodologies. However, considerable judgment is required in interpreting market data to develop the estimates of fair value. Accordingly, the estimates presented herein are not necessarily indicative of the amounts that we could realize in a current market exchange. The use of different market assumptions and/or estimation methodologies may have a material effect on the estimated fair value amounts.
Fair Value Hierarchy
Fair value is based on the price that would be received to sell an asset or paid to transfer a liability in an orderly transaction between market participants at the measurement date. ASC 820,Fair Value Measurement Amendments to Achieve Common Fair Value Measurement and Disclosure Requirements in U.S. Generally Accepted Accounting Principles and International Financial Reporting Standards,defined and established a framework for measuring fair value and expands disclosures about fair value measurements for financial assets and liabilities that are adjusted to fair value on a recurring basis and/or financial assets and liabilities that are measured at fair value on a nonrecurring basis, which have beenwere adjusted to fair value during the period. In accordance with ASC 820, we have categorized our financial assets and liabilities that are adjusted to fair value,
60
based on the priority of the inputs to the valuation technique, following the three-level fair value hierarchy prescribed by ASC 820, as follows:
Level 1: Quoted prices (unadjusted) in active markets that are accessible at the measurement date for assets or liabilities.
Level 2: Observable prices that are based on inputs not quoted on active markets, but corroborated by market data.
Level 3: Unobservable inputs are used when little or no market data is available.
Valuation Techniques
The Company’s cash equivalents are classified within Level 1 on the basis of valuations using quoted market prices. BecauseAs many fixed income securities do not trade daily, fair values are often derived using recent trades of securities with similar features and characteristics. When recent trades are not available, pricing models are used to determine these prices. These models calculate fair values by discounting future cash flows at estimated market interest rates. Such market rates are derived by calculating the appropriate spreads over comparable U.S. Treasury securities, based on the credit quality, industry and structure of the asset. Typical inputs and assumptions to pricing models include, but are not limited to, a combination of benchmark yields, reported trades, issuer spreads, liquidity, benchmark securities, bids, offers, reference data, and industry and economic events. The Company’s fixed income corporate bond investments and certificates of deposit with fixed maturities are valued using recent trades or pricing models and are therefore classified in Level 2.
Recurring Fair Value Measurements
There were no movements between fair value measurement levels of the Company’s cash equivalents and short-term investments during 20122013 and 2011.2012. The following table summarizestables summarize the financial instruments of the companyCompany at fair value based on the fair value hierarchy for each class of instrument as of December 31, 2013 and 2012:
| Fair Value Measurement at December 31, 2012 Using | Fair Value Measurement at December 31, 2013 Using | |||||||||||||||||||||||||||||||
| Carrying Value at December 31, 2012 | Quoted Prices in Active Markets for Identical Assets (Level 1) | Significant Other Observable Inputs (Level 2) | Significant Unobservable Inputs (Level 3) | Carrying | Quoted Prices in | Significant | Significant | |||||||||||||||||||||||||
Cash equivalents: | ||||||||||||||||||||||||||||||||
Money market funds | $ | 1,183 | $ | 1,183 | $ | — | $ | — | $ | 655 | $ | 655 | $ | — | $ | — | ||||||||||||||||
Investments: | ||||||||||||||||||||||||||||||||
Certificates of deposit | 2,640 | 2,639 | 13,750 | 13,734 | ||||||||||||||||||||||||||||
Corporate bonds | 7,820 | 7,816 | 7,305 | 7,303 | ||||||||||||||||||||||||||||
|
|
|
| |||||||||||||||||||||||||||||
Total assets | $ | 11,643 | $ | 1,183 | $ | 10,455 | $ | — | $ | 21,710 | $ | 655 | $ | 21,037 | $ | — | ||||||||||||||||
|
|
|
| |||||||||||||||||||||||||||||
The carrying amount and fair value of cash equivalents of $35,000 was comprised of certificates of deposit with maturity dates less than ninety days as of December 31, 2011.
Fair Value Measurement at December 31, 2012 Using | ||||||||||||||||
Carrying | Quoted Prices in | Significant | Significant | |||||||||||||
Cash equivalents: | ||||||||||||||||
Money market funds | $ | 1,183 | $ | 1,183 | $ | — | $ | — | ||||||||
Investments: | ||||||||||||||||
Certificates of deposit | 2,640 | 2,639 | ||||||||||||||
Corporate bonds | 7,820 | 7,816 | ||||||||||||||
Total assets | $ | 11,643 | $ | 1,183 | $ | 10,455 | $ | — | ||||||||
The carrying amount of the term loan approximates its fair value, using level 2 inputs, because this borrowing bears interest at variable (market) rate at December 31, 20122013 and 2011.2012.
Non-Recurring Fair Value Measurements
The Company has certain assets that are measured at fair value on a non-recurring basis under circumstances and events that include those described in Note 6, Goodwill and Amortizable Intangible Assets, and are adjusted to fair value only when the carrying values are more than the fair values. The categorization of the framework used to price the assets is considered a Level 3 measurement due to the subjective nature of the unobservable inputs used to determine the fair value.
Assets and liabilities acquired in business combinations are recorded at their fair value as of the date of acquisition. Refer to Note 6 for the fair values of assets acquired and liabilities assumed in connection with the acquisition of substantially all the assets of SmartHabitat (“BrightNest”).
The carrying amounts of accounts receivable and accounts payable reported in the consolidated balance sheets approximate fair value.
4. Prepaid Expenses and Other Current Assets
Prepaid expenses and other current assets were comprised of the following:
| December 31, | ||||||||
| 2012 | 2011 | |||||||
Prepaid and deferred commissions | $ | 17,215 | $ | 10,486 | ||||
Other | 2,595 | 1,349 | ||||||
|
|
|
| |||||
Total prepaid expenses and other current assets | $ | 19,810 | $ | 11,835 | ||||
|
|
|
| |||||
December 31, | ||||||||
2013 | 2012 | |||||||
Prepaid and deferred commissions | $ | 9,395 | $ | 17,215 | ||||
Other | 4,256 | 2,595 | ||||||
Total prepaid expenses and other current assets | $ | 13,651 | $ | 19,810 | ||||
61
5. Property and Equipment
Property and equipment was comprised of the following:
| December 31, | December 31, | |||||||||||||||
| 2012 | 2011 | 2013 | 2012 | |||||||||||||
Furniture and equipment | $ | 5,929 | $ | 4,490 | $ | 7,965 | $ | 5,929 | ||||||||
Land | 1,401 | — | 1,464 | 1,401 | ||||||||||||
Buildings and improvements | 6,417 | 917 | 8,711 | 6,417 | ||||||||||||
Software | 1,949 | 1,044 | 5,949 | 1,949 | ||||||||||||
|
| 24,089 | 15,696 | |||||||||||||
| 15,696 | 6,451 | |||||||||||||||
Less accumulated depreciation | (3,617 | ) | (2,568 | ) | (5,432 | ) | (3,617 | ) | ||||||||
|
| $ | 18,657 | $ | 12,079 | |||||||||||
| $ | 12,079 | $ | 3,883 | |||||||||||||
|
| |||||||||||||||
In November 2012,the Company acquired its headquarters facilities from its lessor, a related party, at a cost of $6,785,including costs and fees to acquire the properties. Buildings are being depreciated on a straight-line basis over 25 years.
Depreciation expense for the years ended December 31, 2013, 2012, and 2011, was $1,565, $994 and 2010,$661, respectively. Computer software amortization expense for 2013, 2012 and 2011 was $1,518, $879,$961, $524 and $682,$218, respectively.
6. Goodwill and Amortizable Intangible Assets
The Company has goodwill as well as certain amortizable intangible assets consisting of data acquisition costs. costs, a member list, content and core technology. The goodwill and amortizable intangible asset balances reflect the goodwill, member list, content and core technology acquired during the August 2, 2013 acquisition of substantially all the assets of BrightNest for a purchase price of $2,650, inclusive of $1,920 in acquired intangible assets and goodwill of $730.The purchase price consisted of $2,150 in cash paid at closing and an additional $500 that is payable on the one-year anniversary of the closing, subject to certain performance criteria of BrightNest employees hired by the Company on the acquisition date. The acquisition of the BrightNest assets adds a user-friendly front end and personalized member experience with expanded content offerings and enhanced technologies. Revenues and expenses related to BrightNest, which are not material, are included in the consolidated results of operations from the date of acquisition.
Amortization on the intangible assets is computed using the straight-line method over the estimated lives of the assets, which approximates 36 months.assets. Amortizable intangible assets at December 31, 2013 are as follows:
| December 31, | ||||||||
| 2012 | 2011 | |||||||
Data acquisition costs | $ | 4,017 | $ | 2,572 | ||||
Less accumulated depreciation | (1,661 | ) | (1,017 | ) | ||||
|
|
|
| |||||
Data acquisition costs, net | $ | 2,356 | $ | 1,555 | ||||
|
|
|
| |||||
Weighted—average remaining useful life | 1.6 | 1.7 | ||||||
Cost | Accumulated Amortization | Net | Amortization Period (in years) | |||||||||||||
2013 | ||||||||||||||||
Member List | $ | 1,670 | $ | 122 | $ | 1,548 | 6.0 | |||||||||
Content | 140 | 12 | $ | 128 | 3.0 | |||||||||||
Core technology | 110 | 16 | $ | 94 | 3.0 | |||||||||||
Data acquisition costs | 3,296 | 1,566 | $ | 1,730 | 3.0 | |||||||||||
| $ | 5,216 | $ | 1,716 | $ | 3,500 | |||||||||||
2012 | ||||||||||||||||
Data acquisition costs | $ | 4,017 | $ | 1,661 | $ | 2,356 | 3.0 | |||||||||
| $ | 4,017 | $ | 1,661 | $ | 2,356 | |||||||||||
Amortization expense on amortizable intangible assets for the years ended December 31, 2013, 2012 and 2011, was $1,546, $1,234 and 2010, was $1,234, $781, and $696, respectively. The estimated amortization expense related to amortizable intangible assets at December 31, 2012,2013 for each of the next five years is as follows: $1,241 in 2013, $902$1,520 in 2014, $212$831 in 2015, and none$430 in 2016, or 2017.$278 in 2017 and 2018 and $162 thereafter.
The Company’s recorded goodwill balance at December 31, 2013 and 2012 was $1,145 and $415, respectively. The Company expects the amount recorded as goodwill for the BrightNest acquisition to be fully deductible for tax purposes.
7. Accrued Liabilities
Accrued liabilities were comprised of the following:
| December 31, | ||||||||
| 2012 | 2011 | |||||||
Accrued sales commissions | $ | 4,342 | $ | 3,609 | ||||
Sales and use tax | 2,130 | 1,430 | ||||||
Accrued compensation | 2,246 | 2,293 | ||||||
Uninvoiced accounts payable | 2,372 | 1,646 | ||||||
Other | 2,968 | 1,554 | ||||||
|
|
|
| |||||
Total accrued liabilities | $ | 14,058 | $ | 10,532 | ||||
|
|
|
| |||||
December 31, | ||||||||
2013 | 2012 | |||||||
Accrued sales commissions | $ | 2,570 | $ | 4,342 | ||||
Sales and use tax | 3,158 | 2,130 | ||||||
Accrued compensation | 5,229 | 2,246 | ||||||
Uninvoiced accounts payable | 2,977 | 2,372 | ||||||
Legal accrual | 4,000 | — | ||||||
Other | 3,836 | 2,968 | ||||||
Total accrued liabilities | $ | 21,770 | $ | 14,058 | ||||
62
8. Long-term Debt
Debt was comprised of the following:
| December 31, | December 31, | |||||||||||||||
| 2012 | 2011 | 2013 | 2012 | |||||||||||||
Term loan | $ | 15,000 | $ | 15,000 | $ | 15,000 | $ | 15,000 | ||||||||
Debt discount on term loan | (131 | ) | (180 | ) | (82 | ) | (131 | ) | ||||||||
|
| 14,918 | 14,869 | |||||||||||||
| 14,869 | 14,820 | |||||||||||||||
Less current maturities | — | — | — | — | ||||||||||||
|
| |||||||||||||||
Total long-term debt, including accrued interest | $ | 14,869 | $ | 14,820 | $ | 14,918 | $ | 14,869 | ||||||||
|
| |||||||||||||||
On August 31, 2011, the Company entered into a loan and security agreement that provides for a $15,000 term loan and a $15,000 revolving credit facility. A portion of the revolving credit facility is available for letters of credit and corporate credit cards. The term loan bears interest at a per annum rate equal to the greater of (i) the current cash interest rate of LIBOR plus 10% or (ii) 10.5%, and requires monthly interest-only payments until maturity in August 2015. The revolving credit facility requires monthly interest-only payments on advances, which bear interest at a per annum rate equal to LIBOR plus 5%. In addition, when less than 50% of the revolving credit facility is drawn, the Company is required to pay a non-usage charge of 0.50% per annum of the average unused portion of the credit facility. The term loan provides for penalties for early prepayment. The term loan and revolving credit facility provide for additional interest upon an event of default and are secured by substantially all of the Company’s assets. In connection with entering into the loan and security agreement, the Company issued a convertible warrant to purchase 88,240 shares of common stock to one of the lenders. The fair value of this warrant was recorded as a discount to the term loan, with the amount of the discount being amortized as interest expense through the loan’s maturity. As of December 31, 2012,2013, the Company had $15,000$14,900 in outstanding borrowings under the term loan and available credit of $15,000 under the revolving credit facility.
The loan and security agreement contains various restrictive covenants, including restrictions on the Company’s ability to dispose of assets, make acquisitions or investments, incur debt or liens, make distributions to stockholders or enter into certain types of related party transactions. The Company is also required to comply with certain financial covenants, including a minimum asset coverage ratio, and non-financial covenants. Upon an event of default, which includes a material adverse change, the lenders may accelerate amounts outstanding, terminate the agreement and foreclose on all collateral. The Company was in compliance with all financial and non-financial covenants at December 31, 2012 2013,and management believes the Company will be in compliance through the end of fiscal 2013.2014.
On August 31, 2011, the Company repaid in full the outstanding balance of $14,178 on a note payable, including additional interest of $3,200 ($2,668 of which had been accrued as of August 31, 2011), and prepayment penalties in the amount of $220 under the prior note payable,and terminated the related amended and restated loan and security agreement. On the same date, the Company also paid $6,087 to the holders of the senior subordinated note in satisfaction of the principal, interest and other fees due thereunder. The prepayment penalties, unaccrued additional interest and other fees are included in the loss on debt extinguishment within the consolidated statement of operations for 2011.
9. Commitments and Contingencies
Operating Leases
The Company has long-term noncancellable operating leases for offices and equipment that expire in various years through 2015. These leases require the Company to pay all executory costs (property taxes, maintenance and insurance). Rental payments include minimum rentals.
63
Future minimum lease payments required under long-term noncancellable operating leases at December 31, 2012,2013 were:
| Total | Total | |||||||
Payable in | ||||||||
2013 | $ | 444 | ||||||
2014 | 179 | $ | 663 | |||||
2015 | 4 | 124 | ||||||
2016 | 0 | |||||||
| $ | 787 | ||||||
| $ | 627 | |||||||
| ||||||||
Rental expense for all operating leases totaled $910, $1,381 and $915 in 2013, 2012 and $726, and in 2012, 2011, and 2010, respectively.
Legal Matters
From time to time, the Company has or may become party to litigation incident to the ordinary course of business. The Company assesses the likelihood of any adverse judgments or outcomes with respect to these matters and determines loss contingency assessments on a gross basis after assessing the probability of incurrence of a loss and whether a loss is reasonably estimable. In addition, the Company considers other relevant factors that could impact its ability to reasonably estimate a loss. A determination of the amount of reserves required, if any, for these contingencies is made after analyzing each matter. The Company’s reserves may change in the future due to new developments or changes in strategy in handling these matters. Although the results of litigation and claims cannot be predicted with certainty, the Company currently believes that the final outcome of these matters listed below will not have a material adverse effect on its business, consolidated financial position, results of operations, or cash flows. Regardless of the outcome, litigation can have an adverse impact on the Company because of defense and settlement costs, diversion of management resources, and other factors.
A
Fritzinger v. Angie’s List. On August 14, 2012 a lawsuit seeking class action status Fritzinger v. Angie’s List, was filed against the Company on August 14, 2012 in the U.S. District Court for the Southern District of Indiana.Indiana (the “Court”). The lawsuit alleges claims forof breach of contract deception and unjust enrichment, and requests certification ofalleging that the Company automatically renews membership fees at a class consisting of all current and former Angie’s List members whosehigher rate than customers are led to believe, breaching their membership was renewed between August 14, 2006 and the present.agreements. The plaintiff is seeking unspecifiedseeks compensatory damages and an award of treble damages, attorneys’ fees and costs. The Company and the plaintiff have agreed in principle to settlement terms, which remains subject to Court approval. As of December 31, 2013, the Company has recorded a $4,000 legal accrual related to the settlement. The Company believes this suitamount represents the best estimate of the Company’s ultimate liability with respect to this litigation, and any difference between the amount recorded and the actual final court-approved settlement is not expected to have a material impact on our financial condition or results of operations.
Baron v. Angie’s List, Inc., et al.On December 23, 2013, a class action complaint was filed in the Court, naming the Company and various current and former directors and officers as defendants and alleging that the defendants violated Section 10(b) of the Securities Act of 1934 (the “Exchange Act”) by making material misstatements in and omitting material information from the Company’s public disclosures concerning the Company’s business prospects. The complaint further alleges that the defendants violated Section 20(a) of the Exchange Act by virtue of their positions as control persons. The plaintiff has requested unspecified damages, interest, and costs, as well as ancillary relief. On January 23, 2014, the Court entered a scheduling order pursuant to which, upon appointment as lead plaintiff, the plaintiff has sixty days with which to file a consolidated complaint or stand on the current complaint. Pursuant to that order, the Company’s response to that complaint is due sixty days thereafter.
Bartolone v. Angie’s List, Inc., et al.On January 9, 2014, a class action complaint was filed in the Court, naming the same defendants, asserting the same claims, and asking for the same relief as sought inBaron, described above. On January 29, 2014, the Court entered a scheduling order identical to the order entered inBaron.
BaronandBartoloneare collectively referred to as the “Stockholder Class Action.” The Company believes that the Stockholder Class Action is without merit and intends to vigorously defend itself vigorouslyagainst it.
Korda v. William S. Oesterle, et al.On January 3, 2014, a derivative complaint was filed in this matter.the Court on behalf of the Company, naming the Company’s Board of Directors and various current or former officers as individual defendants and the Company as a nominal defendant. The plaintiff asserts a breach of fiduciary duty claim against the individual defendants based on their alleged knowledge that the Company’s public statements during 2013 concerning the Company’s business prospects were misleading. The plaintiff asserts a breach of fiduciary duty claim against certain individual defendants based on their sales of Angie’s List common stock between December 2012 and December 2013. The plaintiff asks for unspecified amounts in damages, interest, and cost, as well as ancillary relief. The parties are currently seeking to negotiate a stay of the action pending a ruling on the complaint in the StockholderClass Action, described above.
10. Profit-Sharing Plan
The Company sponsors a 401(k) profit-sharing plan (the Plan) covering substantially all of its personnel. The Company’s contributions to the Plan are discretionary. The Company contributed 3% for all eligible personnel, which totaled $1,500, $1,032 and $745 in 2013, 2012 and $562 in 2012, 2011, and 2010, respectively.
11. Stock-Based Compensation
In April 2010, the Company adopted an Omnibus Incentive Plan (the Incentive Plan) in order to provide an incentive to certain executive officers, personnel and directors. The planIncentive Plan was amended and restated effective August 2011,increasing the number of shares issuable to 5,090,496. In March 2012 and October 2013, additional shares of stock were reserved for issuance,bringing the total available shares issuable to 7,937,155.10,830,475. As of December 31, 2012,2013, there were 6,688,3398,992,890 shares of common stock reserved under the Incentive Plan, of which 3,867,7205,682,126 shares remained available for future grants.
Prior to April 30, 2010, the Company had two fixed option plans under which the Company granted options to its personnel to purchase membership units that vested over a period of time. All options outstanding under these plans were fully vested at April 30, 2010.
64
Stock Options
The
Stock options are awarded with an exercise price of stock options granted is generally equal to the fair market value of the underlying stockprice on the grant date.date of grant. The contractual terms for options expire ten years from the grant date and generally vest over a three or four-year period. The fair value of options on the date of grant is amortized on a straight-line basis over the requisite service period.
In connection with the contribution of all member units to the Company on April 30, 2010, all outstanding member unit options were cancelled.
A summary of stock option activity under the plans as of December 31, 20122013 and 2011,2012 and changes during the periods then ended are as follows:
Number of | Weighted- | Weighted | Aggregate | |||||||||||||||||||||||||||||
| Number of Shares | Weighted- Average Price/ Share | Weighted Average Remaining Contractual Term | Aggregate Intrinsic Value | |||||||||||||||||||||||||||||
| (In Years) | ||||||||||||||||||||||||||||||||
Outstanding at December 31, 2010 | 160,000 | $ | 7.63 | 9.75 | $ | 0 | ||||||||||||||||||||||||||
Granted | 2,666,888 | 8.65 | ||||||||||||||||||||||||||||||
Exercised | — | — | ||||||||||||||||||||||||||||||
Cancelled | (12,000 | ) | (7.63 | ) | ||||||||||||||||||||||||||||
| (In Years) | |||||||||||||||||||||||||||||||
Outstanding at December 31, 2011 | 2,814,888 | $ | 8.60 | 9.52 | $ | 21,122 | 2,814,888 | $ | 8.60 | 9.52 | $ | 21,122 | ||||||||||||||||||||
Granted | 352,785 | 12.90 | 352,785 | 12.90 | ||||||||||||||||||||||||||||
Exercised | (96,488 | ) | 8.36 | (96,488 | ) | 8.36 | ||||||||||||||||||||||||||
Cancelled | (250,566 | ) | (9.00 | ) | (250,566 | ) | (9.00 | ) | ||||||||||||||||||||||||
| ||||||||||||||||||||||||||||||||
Outstanding at December 31, 2012 | 2,820,619 | $ | 9.11 | 8.62 | $ | 8,687 | 2,820,619 | $ | 9.11 | 8.62 | $ | 8,687 | ||||||||||||||||||||
Granted | 1,923,206 | 19.46 | ||||||||||||||||||||||||||||||
Exercised | (588,769 | ) | 8.69 | |||||||||||||||||||||||||||||
Cancelled | (844,292 | ) | (11.16 | ) | ||||||||||||||||||||||||||||
Outstanding at December 31, 2013 | 3,310,764 | $ | 14.67 | 8.63 | $ | 9,717 | ||||||||||||||||||||||||||
Number of | Weighted- | Weighted | Aggregate | |||||||||||||||||||||||||||||
| Number of Shares | Weighted- Average Price/ Share | Weighted Average Remaining Contractual Term | Aggregate Intrinsic Value | (In Years) | ||||||||||||||||||||||||||||
| (In Years) | ||||||||||||||||||||||||||||||||
Vested and Exercisable at December 31, 2011 | 211,375 | $ | 8.53 | 9.50 | $ | 1,601 | ||||||||||||||||||||||||||
Unvested at December 31, 2011 | 2,603,513 | 8.62 | 9.53 | |||||||||||||||||||||||||||||
Vested and Exercisable at December 31, 2012 | 863,736 | $ | 8.78 | 8.50 | $ | 2,847 | 863,736 | $ | 8.78 | 8.50 | $ | 2,847 | ||||||||||||||||||||
Unvested at December 31, 2012 | 1,956,883 | 9.25 | 8.61 | 1,956,883 | 9.25 | 8.61 | ||||||||||||||||||||||||||
Vested and Exercisable at December 31, 2013 | 894,813 | $ | 9.38 | 7.61 | $ | 5,358 | ||||||||||||||||||||||||||
Unvested at December 31, 2013 | 2,415,951 | 16.63 | 7.91 | |||||||||||||||||||||||||||||
The fair value of the stock under the plans was estimated at the date of grant using the Black-Scholes option-pricing model with the following weighted-average assumptions:
Year of Grant | Risk-free Interest Rate | Dividend Yield | Expected Term | Volatility Factor | Risk-free | Dividend | Expected | Volatility | ||||||||||||||||||||||||
| (In Years) | (In Years) | |||||||||||||||||||||||||||||||
2010 | 0.62 | % | 0 | % | 4.0 | 37.0 | % | |||||||||||||||||||||||||
2011 | 1.26 | % | 0 | % | 4.7 | 50.0 | % | 1.26 | % | 0 | % | 4.7 | 50.0 | % | ||||||||||||||||||
2012 | 0.71 | % | 0 | % | 4.4 | 60.0 | % | 0.71 | % | 0 | % | 4.4 | 60.0 | % | ||||||||||||||||||
2013 | 1.02 | % | 0 | % | 4.9 | 57.0 | % | |||||||||||||||||||||||||
Expected volatility is based on historical volatilities for publicly traded common stock of comparable companies over the estimated expected life of the stock options. The expected term represents the period of time the stock options are expected to be outstanding. The risk-free interest rate is based on yields of U.S. Treasury securities with a maturity similar to the estimated expected term of the stock options.
The weighted-average grant date fair value of options granted during 2013 and 2012 was $9.38 and 2011 was $6.04 and $3.71 per share, respectively. The total intrinsic value of options exercised during 2013, 2012 and 2011 was $7,376, $297 and 2010 was $297, $0, and $849, respectively. The Company recognized compensation expense of $4,064, $2,943 $1,673, and $849$1,673 in the
65
consolidated statements of operations related to stock and member unit options in 2013, 2012 2011, and 2010,2011, respectively. As of December 31, 2012,2013, total compensation expense related to non-vested options not yet recognized was $5,840 $14,799,which will be recognized over the remaining weighted-average life of the awards, 2.56 years3.22 years.
Restricted Stock
The restricted
Restricted stock granted vests over various periods in accordance with the respective grant agreement. The fair value of restricted stock on the date of grant is amortized on a straight-line basis over the requisite vesting period, with the amount of compensation expense recognized at any date at least equal to the portion of the grant date value of the award that is vested at that date.
A summary of restricted stock (units) activity is as follows:
| Number of Shares (Units) | Weighted- Average Price / Share (Unit) | Average Remaining Life | ||||||||||
| (In Years) | ||||||||||||
Outstanding at December 31, 2010 | 357,816 | $ | 7.63 | 1.02 | ||||||||
Granted | — | |||||||||||
Vested and issued | (357,816 | ) | 7.63 | |||||||||
Cancelled | — | |||||||||||
|
| |||||||||||
Outstanding at December 31, 2011 | — | — | — | |||||||||
|
| |||||||||||
The Company recognized compensation expense of $2,169 in the consolidated statement of operations related to restricted stock in 2011. There was no restricted stock issued or outstanding during 2012.2012 or 2013.
12. Convertible Preferred Stock
On March 15, 2011 and May 17, 2011, the Company issued 757,724 and 90,486 shares of Series D preferred stock for $53,600 and $6,400, respectively.
Each share of preferred stock was convertible, at the option of the holder, to common stock on a one-to-one basis, unless additional common shares had been issued by the Company (exclusive of shares issued to satisfy outstanding options, declared dividends or splits, or certain approved issuances to financial institutions or investors pursuant to a debt financing), at which point a defined conversion formula should be utilized to identify the appropriate conversion ratio. During August 2011, the preferred stockholders agreed via written consent of (1) the holders of at least 70% of the outstanding shares of Series D preferred stock, (2) the holders of at least 80% of the outstanding shares of Series C preferred stock, (3) the holders of at least a supermajority, as defined in the Amended and Restated Certificate of Incorporation, of the holders of the outstanding shares of Series B preferred stock, and (4) the holders of at least a supermajority of the outstanding shares of Series A preferred stock that each share of preferred stock shall be mandatorily converted to common stock immediately prior to the completion of a firm-commitment underwritten initial public offering if the share price is at least $70.74, as adjusted for stock splits and other adjustments. The Series A, B, C, and D convertible preferred stock are not subject to mandatory redemption outside the control of the Company.
On October 31, 2011, the Company effected an eight-for-one split of its common stock by way of a stock dividend declared. As a result of the stock split, holders of the Company’s common stock received seven additional shares of common stock for every share held on such date, and a proportionate adjustment was made to the applicable conversion prices for each share of the Company’s outstanding convertible preferred stock, resulting in a conversion ratio of one-to-eight. As a result of the initial public offering of stock at a price greater than the pre-split adjusted price of $70.74, all preferred shares were converted to common shares on November 17, 2011.
66
13. Treasury Stock
In April 2011, the Company repurchased 1,940,744 shares of common stock for $16,496. Prior to the repurchase, a certain stockholder converted 14,096 shares of Series B and 29,663 shares of Series C preferred shares into common stock. Additionally, in June 2011, the Company repurchased 635,288 shares of common stock for $5,400. In December 2010, the Company repurchased 238,936 shares of common stock for $1,822.
The Company has 8,558,712 shares of its common stock in treasury stock as of December 31, 20122013 and 2011.2012. Of these, the Company’s wholly-owned subsidiary holds 5,743,744 shares of common stock.
14. Income Taxes
Deferred tax assets and liabilities are determined based on the difference between the book and tax basis of assets and liabilities using enacted tax rates to be in effect during the year in which the basis differences reverse.
BecauseAs management believes that it is more likely than not that the Company will not realize the full amount of the net deferred tax assets, the Company has recorded a valuation allowance for the deferred tax assets as of December 31, 2013, 2012 and 2011, and 2010, respectively.
The components of income tax expense are summarized as follows:
| 2012 | 2011 | 2010 | 2013 | 2012 | 2011 | |||||||||||||||||||
Current: | ||||||||||||||||||||||||
U.S. federal | $ | — | $ | — | $ | — | $ | — | $ | — | $ | — | ||||||||||||
State | — | 39 | — | 34 | — | 39 | ||||||||||||||||||
|
|
| 34 | — | 39 | |||||||||||||||||||
| — | 39 | — | ||||||||||||||||||||||
|
|
| ||||||||||||||||||||||
Deferred: | ||||||||||||||||||||||||
U.S. federal | 2 | 7 | 128 | 4 | 2 | 7 | ||||||||||||||||||
State | 3 | (3 | ) | 26 | 2 | 3 | (3 | ) | ||||||||||||||||
|
|
| 6 | 5 | 4 | |||||||||||||||||||
| 5 | 4 | 154 | ||||||||||||||||||||||
|
|
| ||||||||||||||||||||||
Income tax expense | $ | 5 | $ | 43 | $ | 154 | $ | 40 | $ | 5 | $ | 43 | ||||||||||||
|
|
| ||||||||||||||||||||||
The reconciliation of income tax expense computed at the U.S. federal statutory rate to the Company’s effective tax rate for the years ended December 31, 2013, 2012 2011, and 20102011 is as follows:
| 2012 | 2011 | 2010 | 2013 | 2012 | 2011 | |||||||||||||||||||
U.S. federal income tax rate | 34.0 | % | 34.0 | % | 34.0 | % | 34.0 | % | 34.0 | % | 34.0 | % | ||||||||||||
State income taxes, net of federal benefit | 5.7 | 5.6 | 6.8 | 6.4 | 5.7 | 5.6 | ||||||||||||||||||
Valuation allowance | (39.1 | ) | (36.7 | ) | (40.2 | ) | (39.7 | ) | (39.1 | ) | (36.7 | ) | ||||||||||||
Other | (0.6 | ) | (2.8 | ) | — | (0.8 | ) | (0.6 | ) | (2.8 | ) | |||||||||||||
|
|
| ||||||||||||||||||||||
Effective income tax rate | 0.0 | % | 0.1 | % | 0.6 | % | (0.1 | )% | 0.0 | % | 0.1 | % | ||||||||||||
|
|
| ||||||||||||||||||||||
67
Deferred tax assets and liabilities reflect the net tax effects of temporary differences between the carrying amount of assets and liabilities for financial reporting purposes and the amounts used for income tax purposes. Significant components of the Company’s deferred tax assets and liabilities as of December 31, 20122013 and 20112012 are as follows:
| 2012 | 2011 | 2013 | 2012 | |||||||||||||
Deferred tax assets: | ||||||||||||||||
Current: | ||||||||||||||||
Deferred revenue | $ | 22,299 | $ | 13,847 | $ | 32,643 | $ | 22,299 | ||||||||
Non-current: | ||||||||||||||||
Intangibles — other | 12,962 | 14,313 | 12,138 | 12,962 | ||||||||||||
Net operating loss carryforwards | 41,464 | 27,317 | 39,757 | 41,464 | ||||||||||||
Equity compensation | 1,388 | 316 | 1,999 | 1,388 | ||||||||||||
Other | 2,095 | 1,027 | 4,337 | 2,095 | ||||||||||||
|
| |||||||||||||||
Total deferred tax assets | 80,208 | 56,820 | 90,874 | 80,208 | ||||||||||||
Valuation allowance | (73,434 | ) | (52,217 | ) | (87,006 | ) | (73,434 | ) | ||||||||
|
| |||||||||||||||
Total net deferred tax assets | 6,774 | 4,603 | 3,868 | 6,774 | ||||||||||||
Deferred tax liabilities: | ||||||||||||||||
Current: | ||||||||||||||||
Prepaids | (7,010 | ) | (4,227 | ) | (3,923 | ) | (7,010 | ) | ||||||||
Non-current: | ||||||||||||||||
Equity compensation | — | — | ||||||||||||||
Property and equipment | 236 | (376 | ) | 55 | 236 | |||||||||||
Goodwill | (163 | ) | (158 | ) | (169 | ) | (163 | ) | ||||||||
|
| |||||||||||||||
Total deferred tax liabilities | (6,937 | ) | (4,761 | ) | ||||||||||||
|
| |||||||||||||||
Total net deferred tax liabilities | (4,037 | ) | (6,937 | ) | ||||||||||||
Total net deferred tax liability | $ | (163 | ) | $ | (158 | ) | $ | (169 | ) | $ | (163 | ) | ||||
|
| |||||||||||||||
As of December 31, 2012,2013, the Company had net operating loss carryforwards for federal and state income tax purposes of approximately $105,272$105,290 and $119,288,$130,853, respectively. These net operating losses include an unrealized benefit of approximately $0.8 million$5,800 related to share-based compensation that will be recorded in equity when realized. The net operating loss carryforwards will expire in future years,primarily beginning in 2027. The net operating losses may be subject to annual limitations of use under Internal Revenue Code Section 382. The Company files income tax returns in the U.S. federal jurisdiction and in various state jurisdictions. Income tax returns for calendar 20092010 to present are open for examination in the federal jurisdiction and in significant state jurisdictions.
A valuation allowance is provided when it is more likely than not that some portion of the deferred tax asset will not be realized. The Company does not benefit from its deferred tax assets based on the deferred tax liabilities related to goodwill that are not expected to reverse during the carryforward period. BecauseAs this deferred tax liability would not reverse until some future indefinite period when the intangibles are either sold or impaired, any resulting temporary differences cannot be considered a source of future taxable income to support realization of the deferred tax assets.
At December 31, 20122013 and 2011,2012, the Company did not have any material unrecognized income tax benefits recorded in its consolidated balance sheets.
15. Warrants
During 2011, the Company issued warrants to purchase 88,240 shares of common stock in connection with its loan and security agreement. These warrants are exercisable at the fair market value as of the grant date for a
68
period of seven years from the grant date. The grant date fair value of the warrants was $2.23 per share, using the Black-Scholes option-pricing model. On October 17, 2012, the holder of these warrants completed a net issuance exercise in accordance with the terms of their agreement, resulting in the issuance of 14,272 shares of common stock.
During 2010, the Company issued warrants to purchase 272,304 shares of common stock in connection with an amendment to its note payable. On March 7, 2012, the holder of these warrants completed a net issuance exercise in accordance with the terms of their agreement, resulting in the issuance of 120,096 shares of common stock.
A summary of warrant activity is as follows:
| Warrants | Weighted- Average Exercise Price | |||||||||||||||
Outstanding at December 31, 2010 | 272,304 | $ | 8.43 | |||||||||||||
Issued | 88,240 | 8.50 | ||||||||||||||
|
| Warrants | Weighted- | |||||||||||||
Outstanding at December 31, 2011 | 360,544 | $ | 8.45 | 360,544 | $ | 8.45 | ||||||||||
Issued | (360,544 | ) | 8.45 | |||||||||||||
Outstanding at December 31, 2012 | — | $ | — | |||||||||||||
Exercised | (360,544 | ) | 8.45 | |||||||||||||
|
| |||||||||||||||
Outstanding at December 31, 2012 | — | — | ||||||||||||||
|
| |||||||||||||||
Outstanding at December 31, 2013 | — | $ | — | |||||||||||||
Outstanding warrants at December 31, 2011 had a weighted-average remaining contractual life of 5.7 years. There were no outstanding warrants as of December 31, 2012.2012 or 2013.
16. Related-Party Transactions
In November 2012, the Company completed the purchase of its headquarters facilities (the “properties”),which were owned by Henry Amalgamated, LLC, and Henry Amalgamated II, LLC, Indiana limited liability companies (together, “Henry Amalgamated”) for an aggregate purchase price of $6,250, excluding fees and other charges. In connection with its acquisition of the properties, the Company’s leases for its headquarters facilities were terminated.
William S. Oesterle, the Company’s Chief Executive Officer and member of the Company’s board of directors, owns a 70% interest in Henry Amalgamated. BecauseAs the transaction described above constitutes a related party transaction at the direction of the board of directors (the “board”), the audit committee of the Company’s board reviewed and negotiated the Company’s acquisition of the property. With the audit committee’s recommendation and after full board’safull board review, the board approved this transaction. Prior to the acquisition, the Company leased these properties from Henry Amalgamated. In addition to the primary acquisition costs of $6,250, the Company paid $178 to Henry Amalgamated for other charges incurred to prepare the properties for use,of which $150 was capitalized with the purchase of the properties.
Rent expense to Henry Amalgamated was $11, $977 and $856 for 2013, 2012 and $660 for 2012, 2011, and 2010, respectively. The Company did not owe this entityHenry Amalgamated any amounts as of December 31, 20122013 and 2011.
69
17. Quarterly Financial Information (Unaudited)
The table below sets forth selected quarterly financial data for each of the last two fiscal years ($ in thousands, except per share data).
| Fiscal Year Ended December 31, 2012 | Fiscal Year Ended December 31, 2013 | |||||||||||||||||||||||||||||||
| First Quarter | Second Quarter | Third Quarter | Fourth Quarter | First | Second | Third | Fourth | |||||||||||||||||||||||||
| (unaudited) | (unaudited) | (unaudited) | (unaudited) | (unaudited) | (unaudited) | (unaudited) | (unaudited) | |||||||||||||||||||||||||
Total revenue | $ | 31,094 | $ | 36,504 | $ | 42,022 | $ | 46,179 | $ | 52,171 | $ | 59,215 | $ | 65,500 | $ | 68,756 | ||||||||||||||||
Operating income (loss) | (12,994 | ) | (22,930 | ) | (18,020 | ) | 2,911 | (7,469 | ) | (13,855 | ) | (13,028 | ) | 3,271 | ||||||||||||||||||
Net income (loss) | (13,450 | ) | (23,387 | ) | (18,487 | ) | 2,430 | (7,947 | ) | (14,334 | ) | (13,511 | ) | 2,803 | ||||||||||||||||||
Net income (loss) per common share—basic and diluted | $ | (0.24 | ) | $ | (0.41 | ) | $ | (0.32 | ) | $ | 0.04 | $ | (0.14 | ) | $ | (0.25 | ) | $ | (0.23 | ) | $ | 0.05 | ||||||||||
| Fiscal Year Ended December 31, 2011 | ||||||||||||||||||||||||||||||||
| First Quarter | Second Quarter | Third Quarter | Fourth Quarter | |||||||||||||||||||||||||||||
| (unaudited) | (unaudited) | (unaudited) | (unaudited) | |||||||||||||||||||||||||||||
Total revenue | $ | 17,628 | $ | 20,958 | $ | 24,008 | $ | 27,449 | ||||||||||||||||||||||||
Operating loss | (8,701 | ) | (15,288 | ) | (14,827 | ) | (5,344 | ) | ||||||||||||||||||||||||
Net loss | (9,636 | ) | (16,160 | ) | (17,369 | ) | (5,872 | ) | ||||||||||||||||||||||||
Net loss per common share—basic and diluted | $ | (0.34 | ) | $ | (0.60 | ) | $ | (0.66 | ) | $ | (0.14 | ) | ||||||||||||||||||||
Fiscal Year Ended December 31, 2012 | ||||||||||||||||
First | Second | Third | Fourth | |||||||||||||
(unaudited) | (unaudited) | (unaudited) | (unaudited) | |||||||||||||
Total revenue | $ | 31,094 | $ | 36,504 | $ | 42,022 | $ | 46,179 | ||||||||
Operating income (loss) | (12,994 | ) | (22,930 | ) | (18,020 | ) | 2,911 | |||||||||
Net income (loss) | (13,450 | ) | (23,387 | ) | (18,487 | ) | 2,430 | |||||||||
Net income (loss)per common share—basic and diluted | $ | (0.24 | ) | $ | (0.41 | ) | $ | (0.32 | ) | $ | 0.04 | |||||
Information in any one quarterly period should not be considered indicative of annual results due to the effects of seasonality on the Company’s business.
The 2011 information presented abovefourth quarter of 2013 includes a loss on debt extinguishment in the third quarter$4.0 million charge to general and administrative expense reflective of $1,830 related to the refinancingan expected settlement of the Company’s debt obligations and $1,069 of non-cash stock-based compensation expense in the fourth quarter related to the immediate vesting of restricted stock units as a result of the initial public offering of stock. pending litigation.
The fourth quarter of 2012 includes an out of period adjustment related to 2011 and prior to reduce commission expense by $700.
ITEM 9. CHANGES IN AND DISAGREEMENTS WITH ACCOUNTANTS ON ACCOUNTING AND FINANCIAL DISCLOSURE
70
None.
ITEM 9A. CONTROLS AND PROCEDURES
Evaluation of Disclosure Controls and Procedures
We maintain “disclosure controls and procedures,” as such term is defined in Rule 13a-15(e) and Rule 15d-15(e) under the Exchange Act, that are designed to ensure that information required to be disclosed by us in reports that we file or submit under the Exchange Act is recorded, processed, summarized and reported within the time periods specified in SEC rules and forms, and that such information is accumulated and communicated to our management, including our Chief Executive Officer and Chief Financial Officer, as appropriate to allow timely decisions regarding required disclosure. In designing and evaluating our disclosure controls and procedures, management recognizes that disclosure controls and procedures, no matter how well conceived and operated, can provide only reasonable, not absolute, assurance that the objectives of the disclosure controls and procedures are met. Additionally, in designing disclosure controls and procedures, our management necessarily was required to apply its judgment in evaluating the cost-benefit relationship of possible disclosure controls and procedures. Based on their evaluation as of the end of the period covered by this Annual Report on Form 10-K, our Chief Executive Officer and Chief Financial Officer have concluded that, as of such date, our disclosure controls and procedures were effective at the reasonable assurance level.
Management’s Report on Internal Control Over Financial Reporting
Our management is responsible for establishing and maintaining adequate internal control over financial reporting, as such term is defined in Rule 13(a)-15(f) and Rule 15(d)-15(f) of the Exchange Act, to provide reasonable assurance regarding the reliability of the company’s financial reporting and the preparation of financial statements for external purposes in accordance with generally accepted accounting principles.
Management assessed our internal control over financial reporting as of December 31, 2012.2013. Management based its assessment on criteria established in Internal Control—Integrated Framework issued by the Committee of Sponsoring Organizations of the Treadway Commission.Commission (“1992 Framework”). Based on its assessment, our management has concluded that our internal control over financial reporting was effective as of December 31, 2012.2013.
Ernst & Young, LLP, an independent registered public accounting firm, has issued an attestation report on our internal control over financial reporting, which is included in this Annual Report on Form 10-K.
Changes in Internal Control over Financial Reporting
There was no change in our internal control over financial reporting identified in connection with the evaluation required by Rule 13a-15(d) and 15d-15(d) of the Exchange Act that occurred during the three months ended December 31, 20122013 that has materially affected, or is reasonably likely to materially affect, our internal control over financial reporting.
71
Report of Independent Registered Public Accounting Firm
The Board of Directors and Stockholders of Angie’s List, Inc.
We have audited Angie’s List, Inc.’s internal control over financial reporting as of December 31, 20122013 based on criteria established in Internal Control—Integrated Framework issued by the Committee of Sponsoring Organizations of the Treadway Commission (the COSO criteria)(”1992 Framework”). Angie’s List, Inc.’s management is responsible for maintaining effective internal control over financial reporting, and for its assessment of the effectiveness of internal control over financial reporting included in the accompanying Management’s Report on Internal Control over Financial Reporting. Our responsibility is to express an opinion on the company’s internal control over financial reporting based on our audit.
We conducted our audit in accordance with the standards of the Public Company Accounting Oversight Board (United States). Those standards require that we plan and perform the audit to obtain reasonable assurance about whether effective internal control over financial reporting was maintained in all material respects. Our audit included obtaining an understanding of internal control over financial reporting, assessing the risk that a material weakness exists, testing and evaluating the design and operating effectiveness of internal control based on the assessed risk, and performing such other procedures as we considered necessary in the circumstances. We believe that our audit provides a reasonable basis for our opinion.
A company’s internal control over financial reporting is a process designed to provide reasonable assurance regarding the reliability of financial reporting and the preparation of financial statements for external purposes in accordance with generally accepted accounting principles. A company’s internal control over financial reporting includes those policies and procedures that (1) pertain to the maintenance of records that, in reasonable detail, accurately and fairly reflect the transactions and dispositions of the assets of the company; (2) provide reasonable assurance that transactions are recorded as necessary to permit preparation of financial statements in accordance with generally accepted accounting principles, and that receipts and expenditures of the company are being made only in accordance with authorizations of management and directors of the company; and (3) provide reasonable assurance regarding prevention or timely detection of unauthorized acquisition, use, or disposition of the company’s assets that could have a material effect on the financial statements.
Because of its inherent limitations, internal control over financial reporting may not prevent or detect misstatements. Also, projections of any evaluation of effectiveness to future periods are subject to the risk that controls may become inadequate because of changes in conditions, or that the degree of compliance with the policies or procedures may deteriorate.
In our opinion, Angie’s List, Inc. maintained, in all material respects, effective internal control over financial reporting as of December 31, 2012,2013, based on the COSO criteria.
We also have audited, in accordance with the standards of the Public Company Accounting Oversight Board (United States), the consolidated balance sheets of Angie’s List, Inc. as of December 31, 20122013 and 2011,2012, and the related consolidated statements of operations, stockholders’ and members’ equity (deficit) and cash flows for each of the three years in the period ended December 31, 20122013 of Angie’s List, Inc. and our report dated February 25, 201328, 2014 expressed an unqualified opinion thereon.
/s/ Ernst & Young LLP
Indianapolis, Indiana
February 25, 2013
72
None.
ITEM 10. DIRECTORS, EXECUTIVE OFFICERS AND CORPORATE GOVERNANCE
Angie’s List has adopted a code of business conduct and ethics for directors, officers (including Angie’s List’s Chief Executive Officer and Chief Financial Officer) and employees, known as the Code of Business Conduct and Ethics. The Code of Business Conduct and Ethics is available on our “Investor Relations” website atinvestor.angieslist.com in the Corporate Governance section. Stockholders may request a free copy of the Code of Business Conduct and Ethics by sending an email request to investor@angieslist.com.
The other information required by this item will be contained in our definitive proxy statement to be filed with the Securities and Exchange Commission in connection with our 20132014 annual meeting of stockholders (the “Proxy Statement”), which is expected to be filed not later than 120 days after the end of our fiscal year ended December 31, 2012,2013, and is incorporated in this report by reference.
ITEM 11. EXECUTIVE COMPENSATION
Information required by this Item is incorporated by reference to the sections of the Proxy Statement entitled “Executive Compensation,” “Director Compensation,” “Information Regarding the Board of Directors and its Committees—Compensation Committee Interlocks and Insider Participation” and “Compensation Committee Report.”
ITEM 12. SECURITY OWNERSHIP OF CERTAIN BENEFICIAL OWNERS AND MANAGEMENT AND RELATED STOCKHOLDER MATTERS
Information regarding security ownership of certain beneficial owners and management is incorporated by reference to the section of the Proxy Statement entitled “Security Ownership of Certain Beneficial Owners and Management.”
Information regarding our stockholder approved and non-approved equity compensation plans is incorporated by reference to the section of the Proxy Statement entitled “Executive Compensation—Equity Compensation Plan Information.”
ITEM 13. CERTAIN RELATIONSHIPS AND RELATED TRANSACTIONS, AND DIRECTOR INDEPENDENCE
Information required by this Item is incorporated by reference to the sections of the Proxy Statement entitled “Certain Relationships and Related Party Transactions” and “Information Regarding the Board of Directors and its Committees—Independence of the Board of Directors.”
ITEM 14. PRINCIPAL ACCOUNTANT FEES AND SERVICES
Information required by this Item is incorporated by reference to the section of the Proxy Statement entitled “Proposal No. 2 Ratification of Appointment of Independent Registered Public Accounting Firm.”
PART IV
73
ITEM 15. EXHIBITS AND FINANCIAL STATEMENT SCHEDULESPART IV
(a) The following documents are included as part of this Annual Report on Form 10-K.
(1) Index to Financial Statements
(2) Financial Statement Schedule
All other schedules are omitted as the information required is inapplicable or the information is presented in the consolidated financial statements or the related notes.
(3) Exhibits
Exhibits
The documents set forth below are filed herewith or incorporated by reference to the location indicated.
| Incorporated by Reference | ||||||||||||
Exhibit | Exhibit Description | Form | File No. | Exhibit | Filing Date | Filed Herewith | ||||||
| 3.01 | Amended and Restated Certificate of Incorporation | S-1/A | 333-176503 | 3.1 | 10/31/11 | |||||||
| 3.02 | Amended and Restated Bylaws | S-1/A | 333-176503 | 3.2 | 10/31/11 | |||||||
| 4.01 | Fifth Amended and Restated Investor Rights Agreement, by and among Angie’s List, Inc. and the investors listed on Schedule A thereto, dated March 15, 2011, as amended | S-1 | 333-176503 | 4.2 | 08/25/11 | |||||||
| 10.01† | Amended and Restated Omnibus Incentive Plan and form of award agreements under the Amended and Restated Omnibus Incentive Plan | S-1/A | 333-1765033 | 10.1 | 09/29/11 | |||||||
| 10.02 | Lease Agreement, dated February 28, 2009, by and between Brownstone Publishing, LLC and Henry Amalgamated, LLC | S-1 | 333-176503 | 10.2 | 08/25/11 | |||||||
| 10.03 | First Addendum to Lease Agreement, dated May 4, 2010, by and between Brownstone Publishing, LLC and Henry Amalgamated, LLC | S-1 | 333-176503 | 10.3 | 08/25/11 | |||||||
| 10.04 | Second Addendum to Lease Agreement, dated December 1, 2010, by and between Brownstone Publishing, LLC and Henry Amalgamated, LLC | S-1 | 333-176503 | 10.4 | 08/25/11 | |||||||
| 10.05 | Third Addendum to Lease Agreement, dated December 16, 2010, by and between Brownstone Publishing, LLC and Henry Amalgamated, LLC | S-1 | 333-176503 | 10.5 | 08/25/11 | |||||||
| Incorporated by Reference | ||||||||||||||
Exhibit |
| Exhibit Description |
| Form |
| File No. |
| Exhibit |
| Filing |
| Filed | ||
3.01 |
| Amended and Restated Certificate of Incorporation |
| S-1/A |
| 333-176503 |
| 3.1 |
| 10/31/11 |
| |||
3.02 |
| Amended and Restated Bylaws |
| S-1/A |
| 333-176503 |
| 3.2 |
| 10/31/11 |
| |||
4.01 |
| Fifth Amended and Restated Investor Rights Agreement, by and among Angie’s List, Inc. and the investors listed on Schedule A thereto, dated March 15, 2011, as amended |
| S-1 |
| 333-176503 |
| 4.2 |
| 08/25/11 |
| |||
10.01† |
| Amended and Restated Omnibus Incentive Plan and form of award agreements under the Amended and Restated Omnibus Incentive Plan |
| S-8 |
| 333-191884 |
| 99.1 |
| 10/24/13 |
| |||
10.02 |
| Lease Agreement, dated February 28, 2009, by and between Brownstone Publishing, LLC and Henry Amalgamated, LLC |
| S-1 |
| 333-176503 |
| 10.2 |
| 08/25/11 |
| |||
10.03 |
| First Addendum to Lease Agreement, dated May 4, 2010, by and between Brownstone Publishing, LLC and Henry Amalgamated, LLC |
| S-1 |
| 333-176503 |
| 10.3 |
| 08/25/11 |
| |||
10.04 |
| Second Addendum to Lease Agreement, dated December 1, 2010, by and between Brownstone Publishing, LLC and Henry Amalgamated, LLC |
| S-1 |
| 333-176503 |
| 10.4 |
| 08/25/11 |
| |||
10.05 |
| Third Addendum to Lease Agreement, dated December 16, 2010, by and between Brownstone Publishing, LLC and Henry Amalgamated, LLC |
| S-1 |
| 333-176503 |
| 10.5 |
| 08/25/11 |
| |||
10.06 |
| Fourth Addendum to Lease Agreement, dated January 1, 2011, by and between the registrant and Henry Amalgamated, LLC |
| S-1 |
| 333-176503 |
| 10.6 |
| 08/25/11 | ||||
10.07 |
| Fifth Addendum to Lease Agreement, dated June 1, 2011, by and between the registrant and Henry Amalgamated, LLC |
| S-1 |
| 333-176503 |
| 10.7 |
| 08/25/11 | ||||
10.08 |
| Sixth Addendum to Lease Agreement, dated June 1, 2011, by and between the registrant and Henry Amalgamated, LLC |
| S-1 |
| 333-176503 |
| 10.8 |
| 08/25/11 | ||||
10.09 |
| Contingent Addendum to Lease Agreement, dated January 1, 2011 and effective February 1, 2011, by and between the registrant and Henry Amalgamated, LLC |
| S-1 |
| 333-176503 |
| 10.9 |
| 08/25/11 | ||||
10.10 |
| Contingent Addendum to Lease Agreement, dated January 1 2011 and effective March 1, 2011, by and between the registrant and Henry Amalgamated, LLC |
| S-1 |
| 333-176503 |
| 10.10 |
| 08/25/11 | ||||
10.11 |
| Parking Lease, dated February 28, 2009, by and between Brownstone Publishing, LLC and Henry Amalgamated, LLC |
| S-1 |
| 333-176503 |
| 10.11 |
| 08/25/11 | ||||
10.12 |
| Lease, dated November 2, 2007, by and between AL Campus Kids, LLC, and Henry Amalgamated, LLC (124 Herman Street) |
| S-1 |
| 333-176503 |
| 10.12 |
| 08/25/11 | ||||
10.13 |
| Lease, dated November 2, 2007, by and between AL Campus Kids, LLC, and Henry Amalgamated, LLC (118 Herman Street) |
| S-1 |
| 333-176503 |
| 10.13 |
| 08/25/11 | ||||
10.14 † |
| Employment Agreement, dated July 10, 2006, by and between Brownstone Publishing, LLC and Michael D. Rutz |
| S-1 |
| 333-176503 |
| 10.15 |
| 08/25/11 | ||||
10.15† |
| Form of Indemnification Agreement by and between Angie’s List, Inc. and each of its executive officers and its directors not affiliated with an investment fund |
| S-1/A |
| 333-176503 |
| 10.19 |
| 09/29/11 |
| |||
10.16† |
| Form of Indemnification Agreement by and between Angie’s List, Inc. and each of its directors affiliated with an investment fund |
| S-1/A |
| 333-176503 |
| 10.20 |
| 09/29/11 | �� | |||
10.17 |
| Loan and Security Agreement, dated August 31, 2011, by and between ORIX Venture Finance LLC, Bridge Bank National Association and Angie’s List, Inc. |
| S-1/A |
| 333-176503 |
| 10.21 |
| 09/29/11 |
| |||
10.18 |
| Project Agreement by and between Angie’s List, Inc. and the Consolidated City of Indianapolis, dated October 21, 2011 |
| S-1/A |
| 333-176503 |
| 10.22 |
| 11/02/11 |
| |||
10.19 |
| Contingent Addendum to Lease Agreement, dated November 15, 2011 by and between the registrant and Henry Amalgamated LLC |
| 10-K |
| 001-35339 |
| 10.23 |
| 03/15/12 |
| |||
10.20 |
| Contingent Addendum to Lease Agreement, dated December 1, 2011 by and between the registrant and Henry Amalgamated LLC |
| 10-K |
| 001-35339 |
| 10.24 |
| 03/15/12 |
| |||
10.21 |
| Contingent Addendum to Lease Agreement, dated April 10, 2012 by and between the registrant and Henry Amalgamated LLC [934 E Washington Street, Indianapolis, IN 46202] |
| 10-Q |
| 001-35339 |
| 10.1 |
| 08/09/12 |
| |||
10.22 |
| Contingent Addendum to Lease Agreement, dated April 10, 2012 by and between the registrant and Henry Amalgamated LLC [25 Pine Street, Indianapolis, IN 46202] |
| 10-Q |
| 001-35339 |
| 10.2 |
| 08/09/12 |
| |||
10.23 |
| Contingent Addendum to Lease Agreement, dated April 10, 2012 by and between the registrant and Henry Amalgamated LLC [902 E Washington Street, Indianapolis, IN 46202] |
| 10-Q |
| 001-35339 |
| 10.3 |
| 08/09/12 |
| |||
10.24 |
| Contingent Addendum to Lease Agreement, dated July 1, 2012 by and between the registrant and Henry Amalgamated LLC [902, 932 & 934 Suite A, E Washington Street, Indianapolis, IN 46202] |
| 10-Q |
| 001-35339 |
| 10.4 |
| 08/09/12 |
| |||
10.25 |
| Purchase and sale agreement by and among Angie’s List, Inc. and Henry Amalgamated, LLC and Henry Amalgamated II, LLC |
| 8-K |
| 001-35339 |
| 10.1 |
| 11/09/12 |
| |||
10.26† |
| Offer letter with Mark Howell, dated December 20, 2012 |
| 8-K |
| 001-35339 |
| 10.1 |
| 01/17/13 |
| |||
10.27† | Offer letter with Patrick Brady, dated May 14, 2013 | 10-Q | 001-35339 | 10.1 | 07/25/13 | |||||||||
10.28† | Offer Letter Agreement by and between Angie’s List, Inc. and Thomas R. Fox, dated August 20, 2013 | 8-K | 001-35339 | 10.1 | 08/21/13 | |||||||||
21.01 |
| Subsidiaries of the Registrant |
| S-1 |
| 333-176503 |
| 21.1 |
| 08/25/11 |
| |||
23.01 |
| Consent of independent registered public accounting firm |
|
|
|
|
| X | ||||||
24.01 |
| Power of Attorney (included on signature page of this Annual Report on Form 10-K) |
|
|
|
|
| X | ||||||
31.01 |
| Certification of the Principal Executive Officer Pursuant to Section 302 of the Sarbanes-Oxley Act |
|
|
|
|
| X | ||||||
31.02 |
| Certification of the Principal Financial Officer Pursuant to Section 302 of the Sarbanes-Oxley Act |
|
|
|
|
| X | ||||||
32.01 |
| Certification of the Principal Executive Officer Pursuant to Section 906 of the Sarbanes-Oxley Act |
|
|
|
|
| X | ||||||
32.02 |
| Certification of the Principal Financial Officer Pursuant to Section 906 of the Sarbanes-Oxley Act |
|
|
|
|
| X | ||||||
101.INS*(1) | XBRL Instance Document | X | ||||||||||||
101.SCH*(1) | XBRL Taxonomy Extension Schema Document | X | ||||||||||||
101.CAL*(1) | XBRL Taxonomy Extension Calculation Linkbase Document | X | ||||||||||||
101.DEF*(1) | XBRL Taxonomy Extension Definition Linkbase Document | X | ||||||||||||
101.LAB*(1) | XBRL Taxonomy Extension Labels Linkbase Document | X | ||||||||||||
101.PRE*(1) | XBRL Taxonomy Extension Presentation Linkbase Document | X | ||||||||||||
† Indicates management contract or compensatory plan.
74
| Incorporated by Reference | Filed Herewith | |||||||||||
Exhibit | Exhibit Description | Form | File No. | Exhibit | Filing Date | |||||||
| 10.06 | Fourth Addendum to Lease Agreement, dated January 1, 2011, by and between the registrant and Henry Amalgamated, LLC | S-1 | 333-176503 | 10.6 | 08/25/11 | |||||||
| 10.07 | Fifth Addendum to Lease Agreement, dated June 1, 2011, by and between the registrant and Henry Amalgamated, LLC | S-1 | 333-176503 | 10.7 | 08/25/11 | |||||||
| 10.08 | Sixth Addendum to Lease Agreement, dated June 1, 2011, by and between the registrant and Henry Amalgamated, LLC | S-1 | 333-176503 | 10.8 | 08/25/11 | |||||||
| 10.09 | Contingent Addendum to Lease Agreement, dated January 1, 2011 and effective February 1, 2011, by and between the registrant and Henry Amalgamated, LLC | S-1 | 333-176503 | 10.9 | 08/25/11 | |||||||
| 10.10 | Contingent Addendum to Lease Agreement, dated January 1 2011 and effective March 1, 2011, by and between the registrant and Henry Amalgamated, LLC | S-1 | 333-176503 | 10.10 | 08/25/11 | |||||||
| 10.11 | Parking Lease, dated February 28, 2009, by and between Brownstone Publishing, LLC and Henry Amalgamated, LLC | S-1 | 333-176503 | 10.11 | 08/25/11 | |||||||
| 10.12 | Lease, dated November 2, 2007, by and between AL Campus Kids, LLC, and Henry Amalgamated, LLC (124 Herman Street) | S-1 | 333-176503 | 10.12 | 08/25/11 | |||||||
| 10.13 | Lease, dated November 2, 2007, by and between AL Campus Kids, LLC, and Henry Amalgamated, LLC (118 Herman Street) | S-1 | 333-176503 | 10.13 | 08/25/11 | |||||||
| 10.14 † | Offer Letter with Robert R. Millard, dated April 25, 2011 | S-1 | 333-176503 | 10.14 | 08/25/11 | |||||||
| 10.15 † | Employment Agreement, dated July 10, 2006, by and between Brownstone Publishing, LLC and Michael D. Rutz | S-1 | 333-176503 | 10.15 | 08/25/11 | |||||||
| 10.16 † | Offer Letter with Manu Thapar, dated September 16, 2011 | S-1 | 333-176503 | 10.16 | 10/19/11 | |||||||
| 10.17† | Form of Indemnification Agreement by and between Angie’s List, Inc. and each of its executive officers and its directors not affiliated with an investment fund | S-1/A | 333-176503 | 10.19 | 09/29/11 | |||||||
| 10.18† | Form of Indemnification Agreement by and between Angie’s List, Inc. and each of its directors affiliated with an investment fund | S-1/A | 333-176503 | 10.20 | 09/29/11 | |||||||
| 10.19 | Loan and Security Agreement, dated August 31, 2011, by and between ORIX Venture Finance LLC, Bridge Bank National Association and Angie’s List, Inc. | S-1/A | 333-176503 | 10.21 | 09/29/11 | |||||||
| 10.20 | Project Agreement by and between Angie’s List, Inc. and the Consolidated City of Indianapolis, dated October 21, 201 | S-1/A | 333-176503 | 10.22 | 11/02/11 | |||||||
75
| Incorporated by Reference | Filed Herewith | |||||||||||
Exhibit | Exhibit Description | Form | File No. | Exhibit | Filing Date | |||||||
| 10.21 | Contingent Addendum to Lease Agreement, dated November 15, 2011 by and between the registrant and Henry Amalgamated LLC | 10-K | 001-35339 | 10.23 | 03/15/12 | |||||||
| 10.22 | Contingent Addendum to Lease Agreement, dated December 1, 2011 by and between the registrant and Henry Amalgamated LLC | 10-K | 001-35339 | 10.24 | 03/15/12 | |||||||
| 10.23 | Contingent Addendum to Lease Agreement, dated April 10, 2012 by and between the registrant and Henry Amalgamated LLC [934 E Washington Street, Indianapolis, IN 46202] | 10-Q | 001-35339 | 10.1 | 08/09/12 | |||||||
| 10.24 | Contingent Addendum to Lease Agreement, dated April 10, 2012 by and between the registrant and Henry Amalgamated LLC [25 Pine Street, Indianapolis, IN 46202] | 10-Q | 001-35339 | 10.2 | 08/09/12 | |||||||
| 10.25 | Contingent Addendum to Lease Agreement, dated April 10, 2012 by and between the registrant and Henry Amalgamated LLC [902 E Washington Street, Indianapolis, IN 46202] | 10-Q | 001-35339 | 10.3 | 08/09/12 | |||||||
| 10.26 | Contingent Addendum to Lease Agreement, dated July 1, 2012 by and between the registrant and Henry Amalgamated LLC [902, 932 & 934 Suite A, E Washington Street, Indianapolis, IN 46202] | 10-Q | 001-35339 | 10.4 | 08/09/12 | |||||||
| 10.27 | Purchase and sale agreement by and among Angie’s List, Inc. and Henry Amalgamated, LLC and Henry Amalgamated II, LLC | 8-K | 001-35339 | 10.1 | 11/09/12 | |||||||
| 10.28† | Offer letter with Mark Howell, dated December 20, 2012 | 8-K | 001-35339 | 10.1 | 01/17/13 | |||||||
| 21.01 | Subsidiaries of the Registrant | S-1 | 333-176503 | 21.1 | 08/25/11 | |||||||
| 23.01 | Consent of independent registered public accounting firm | X | ||||||||||
| 24.01 | Power of Attorney (included on signature page of this Annual Report on Form 10-K) | X | ||||||||||
| 31.01 | Certification of the Principal Executive Officer Pursuant to Section 302 of the Sarbanes-Oxley Act | X | ||||||||||
| 31.02 | Certification of the Principal Financial Officer Pursuant to Section 302 of the Sarbanes-Oxley Act | X | ||||||||||
| 32.01 | Certification of the Principal Executive Officer Pursuant to Section 906 of the Sarbanes-Oxley Act | X | ||||||||||
| 32.02 | Certification of the Principal Financial Officer Pursuant to Section 906 of the Sarbanes-Oxley Act | X | ||||||||||
76
|
| |||||||||||
| ||||||||||||
| ||||||||||||
| ||||||||||||
| ||||||||||||
| ||||||||||||
| ||||||||||||
77
SIGNATURES
Pursuant to the requirements Section 13 or 15(d) of the Securities Exchange Act of 1934, the Registrant has duly caused this report to be signed on its behalf by the undersigned, thereunto duly authorized on February 25, 2013.28, 2014.
ANGIE’S LIST, INC. | ||
By: | / | |
Name: William S. Oesterle | ||
Title: Chief Executive Officer and Director | ||
POWER OF ATTORNEY
KNOW ALL MEN BY THESE PRESENTS, that each person whose signature appears below hereby constitutes and appoints William S. Oesterle, RobertThomas R. MillardFox and Shannon Shaw and each of them, his or her true and lawful attorneys-in-fact and agents, with full power to act separately and full power of substitution and resubstitution, for him or her and in his or her name, place and stead, in any and all capacities, to sign any and all amendments to this Annual Report on Form 10-K and to file the same, with all exhibits thereto, and all other documents in connection therewith, with the Securities and Exchange Commission, granting unto each said attorney-in-fact and agent full power and authority to do and perform each and every act in person, hereby ratifying and confirming all that said attorneys-in-fact and agents or either of them or his or her or their substitute or substitutes may lawfully do or cause to be done by virtue hereof.
Pursuant to the requirements of the Securities Act of 1934, as amended, this report has been signed by the following persons in the capacities and on the dates indicated.
Signature | Title | Date | ||
/
| Chief Executive Officer and Director (Principal Executive | February 28, 2014 | ||
| William S. Oesterle | Officer) | |||
/
| Chief Financial Officer (Principal Financial and | February 28, 2014 | ||
| Thomas R. Fox | Accounting Officer) | |||
/ | Director | February 28, 2014 | ||
| John W. Biddinger | ||||
/S/ MARK BRITTO | Director | February 28, 2014 | ||
| Mark Britto | ||||
/ | Director | February 28, 2014 | ||
| John H. Chuang | ||||
/S/ STEVEN M. KAPNER | Director | February 28, 2014 | ||
| Steven M. Kapner | ||||
/ | Director | February 28, 2014 | ||
| Keith J. Krach | ||||
Signature | Title | Date | ||
/ | Director | February 28, 2014 | ||
| Roger H. Lee | ||||
/S/ MICHAEL S. MAURER | Director | February 28, 2014 | ||
| Michael S. Maurer | ||||
/S/ SUSAN THRONSON | Director | February 28, 2014 | ||
| Susan Thronson | ||||
/S/ ANGELA R. HICKS BOWMAN | Director | February 28, 2014 | ||
| Angela R. Hicks Bowman | ||||
| ||||
| ||||
EXHIBIT INDEX
| Incorporated by Reference | Filed Herewith | |||||||||||
Exhibit | Exhibit Description | Form | File No. | Exhibit | Filing Date | |||||||
| 3.01 | Amended and Restated Certificate of Incorporation | S-1/A | 333-176503 | 3.1 | 10/31/11 | |||||||
| 3.02 | Amended and Restated Bylaws | S-1/A | 333-176503 | 3.2 | 10/31/11 | |||||||
| 4.01 | Fifth Amended and Restated Investor Rights Agreement, by and among Angie’s List, Inc. and the investors listed on Schedule A thereto, dated March 15, 2011, as amended | S-1 | 333-176503 | 4.2 | 08/25/11 | |||||||
| 10.01† | Amended and Restated Omnibus Incentive Plan and form of award agreements under the Amended and Restated Omnibus Incentive Plan | S-1/A | 333-1765033 | 10.1 | 09/29/11 | |||||||
| 10.02 | Lease Agreement, dated February 28, 2009, by and between Brownstone Publishing, LLC and Henry Amalgamated, LLC | S-1 | 333-176503 | 10.2 | 08/25/11 | |||||||
| 10.03 | First Addendum to Lease Agreement, dated May 4, 2010, by and between Brownstone Publishing, LLC and Henry Amalgamated, LLC | S-1 | 333-176503 | 10.3 | 08/25/11 | |||||||
| 10.04 | Second Addendum to Lease Agreement, dated December 1, 2010, by and between Brownstone Publishing, LLC and Henry Amalgamated, LLC | S-1 | 333-176503 | 10.4 | 08/25/11 | |||||||
| 10.05 | Third Addendum to Lease Agreement, dated December 16, 2010, by and between Brownstone Publishing, LLC and Henry Amalgamated, LLC | S-1 | 333-176503 | 10.5 | 08/25/11 | |||||||
| 10.06 | Fourth Addendum to Lease Agreement, dated January 1, 2011, by and between the registrant and Henry Amalgamated, LLC | S-1 | 333-176503 | 10.6 | 08/25/11 | |||||||
| 10.07 | Fifth Addendum to Lease Agreement, dated June 1, 2011, by and between the registrant and Henry Amalgamated, LLC | S-1 | 333-176503 | 10.7 | 08/25/11 | |||||||
| 10.08 | Sixth Addendum to Lease Agreement, dated June 1, 2011, by and between the registrant and Henry Amalgamated, LLC | S-1 | 333-176503 | 10.8 | 08/25/11 | |||||||
| 10.09 | Contingent Addendum to Lease Agreement, dated January 1, 2011 and effective February 1, 2011, by and between the registrant and Henry Amalgamated, LLC | S-1 | 333-176503 | 10.9 | 08/25/11 | |||||||
| 10.10 | Contingent Addendum to Lease Agreement, dated January 1 2011 and effective March 1, 2011, by and between the registrant and Henry Amalgamated, LLC | S-1 | 333-176503 | 10.10 | 08/25/11 | |||||||
| 10.11 | Parking Lease, dated February 28, 2009, by and between Brownstone Publishing, LLC and Henry Amalgamated, LLC | S-1 | 333-176503 | 10.11 | 08/25/11 | |||||||
| 10.12 | Lease, dated November 2, 2007, by and between AL Campus Kids, LLC, and Henry Amalgamated, LLC (124 Herman Street) | S-1 | 333-176503 | 10.12 | 08/25/11 | |||||||
| Incorporated by Reference | Filed Herewith | |||||||||||
Exhibit | Exhibit Description | Form | File No. | Exhibit | Filing Date | |||||||
| 10.13 | Lease, dated November 2, 2007, by and between AL Campus Kids, LLC, and Henry Amalgamated, LLC (118 Herman Street) | S-1 | 333-176503 | 10.13 | 08/25/11 | |||||||
| 10.14 † | Offer Letter with Robert R. Millard, dated April 25, 2011 | S-1 | 333-176503 | 10.14 | 08/25/11 | |||||||
| 10.15 † | Employment Agreement, dated July 10, 2006, by and between Brownstone Publishing, LLC and Michael D. Rutz | S-1 | 333-176503 | 10.15 | 08/25/11 | |||||||
| 10.16 † | Offer Letter with Manu Thapar, dated September 16, 2011 | S-1 | 333-176503 | 10.16 | 10/19/11 | |||||||
| 10.17† | Form of Indemnification Agreement by and between Angie’s List, Inc. and each of its executive officers and its directors not affiliated with an investment fund | S-1/A | 333-176503 | 10.19 | 09/29/11 | |||||||
| 10.18† | Form of Indemnification Agreement by and between Angie’s List, Inc. and each of its directors affiliated with an investment fund | S-1/A | 333-176503 | 10.20 | 09/29/11 | |||||||
| 10.19 | Loan and Security Agreement, dated August 31, 2011, by and between ORIX Venture Finance LLC, Bridge Bank National Association and Angie’s List, Inc. | S-1/A | 333-176503 | 10.21 | 09/29/11 | |||||||
| 10.20 | Project Agreement by and between Angie’s List, Inc. and the Consolidated City of Indianapolis, dated October 21, 201 | S-1/A | 333-176503 | 10.22 | 11/02/11 | |||||||
| 10.21 | Contingent Addendum to Lease Agreement, dated November 15, 2011 by and between the registrant and Henry Amalgamated LLC | 10-K | 001-35339 | 10.23 | 03/15/12 | |||||||
| 10.22 | Contingent Addendum to Lease Agreement, dated December 1, 2011 by and between the registrant and Henry Amalgamated LLC | 10-K | 001-35339 | 10.24 | 03/15/12 | |||||||
| 10.23 | Contingent Addendum to Lease Agreement, dated April 10, 2012 by and between the registrant and Henry Amalgamated LLC [934 E Washington Street, Indianapolis, IN 46202] | 10-Q | 001-35339 | 10.1 | 08/09/12 | |||||||
| 10.24 | Contingent Addendum to Lease Agreement, dated April 10, 2012 by and between the registrant and Henry Amalgamated LLC [25 Pine Street, Indianapolis, IN 46202] | 10-Q | 001-35339 | 10.2 | 08/09/12 | |||||||
| 10.25 | Contingent Addendum to Lease Agreement, dated April 10, 2012 by and between the registrant and Henry Amalgamated LLC [902 E Washington Street, Indianapolis, IN 46202] | 10-Q | 001-35339 | 10.3 | 08/09/12 | |||||||
| 10.26 | Contingent Addendum to Lease Agreement, dated July 1, 2012 by and between the registrant and Henry Amalgamated LLC [902, 932 & 934 Suite A, E Washington Street, Indianapolis, IN 46202] | 10-Q | 001-35339 | 10.4 | 08/09/12 | |||||||
| Incorporated by Reference | Filed Herewith | |||||||||||
Exhibit | Exhibit Description | Form | File No. | Exhibit | Filing Date | |||||||
| 10.27 | Purchase and sale agreement by and among Angie’s List, Inc. and Henry Amalgamated, LLC and Henry Amalgamated II, LLC | 8-K | 001-35339 | 10.1 | 11/09/12 | |||||||
| 10.28† | Offer letter with Mark Howell, dated December 20, 2012 | 8-K | 001-35339 | 10.1 | 01/17/13 | |||||||
| 21.01 | Subsidiaries of the Registrant | S-1 | 333-176503 | 21.1 | 08/25/11 | |||||||
| 23.01 | Consent of independent registered public accounting firm | X | ||||||||||
| 24.01 | Power of Attorney (included on signature page of this Annual Report on Form 10-K) | X | ||||||||||
| 31.01 | Certification of the Principal Executive Officer Pursuant to Section 302 of the Sarbanes-Oxley Act | X | ||||||||||
| 31.02 | Certification of the Principal Financial Officer Pursuant to Section 302 of the Sarbanes-Oxley Act | X | ||||||||||
| 32.01 | Certification of the Principal Executive Officer Pursuant to Section 906 of the Sarbanes-Oxley Act | X | ||||||||||
| 32.02 | Certification of the Principal Financial Officer Pursuant to Section 906 of the Sarbanes-Oxley Act | X | ||||||||||
| 101.INS*(1) | XBRL Instance Document | X | ||||||||||
| 101.SCH*(1) | XBRL Taxonomy Extension Schema Document | X | ||||||||||
| 101.CAL*(1) | XBRL Taxonomy Extension Calculation Linkbase Document | X | ||||||||||
| 101.DEF*(1) | XBRL Taxonomy Extension Definition Linkbase Document | X | ||||||||||
| 101.LAB*(1) | XBRL Taxonomy Extension Labels Linkbase Document | X | ||||||||||
| 101.PRE*(1) | XBRL Taxonomy Extension Presentation Linkbase Document | X | ||||||||||
| Incorporated by Reference | ||||||||||||||
Exhibit |
| Exhibit Description |
| Form |
| File No. |
| Exhibit |
| Filing |
| Filed | ||
3.01 |
| Amended and Restated Certificate of Incorporation |
| S-1/A |
| 333-176503 |
| 3.1 |
| 10/31/11 |
| |||
3.02 |
| Amended and Restated Bylaws |
| S-1/A |
| 333-176503 |
| 3.2 |
| 10/31/11 |
| |||
4.01 |
| Fifth Amended and Restated Investor Rights Agreement, by and among Angie’s List, Inc. and the investors listed on Schedule A thereto, dated March 15, 2011, as amended |
| S-1 |
| 333-176503 |
| 4.2 |
| 08/25/11 |
| |||
10.01† |
| Amended and Restated Omnibus Incentive Plan and form of award agreements under the Amended and Restated Omnibus Incentive Plan |
| S-8 |
| 333-191884 |
| 99.1 |
| 10/24/13 |
| |||
10.02 |
| Lease Agreement, dated February 28, 2009, by and between Brownstone Publishing, LLC and Henry Amalgamated, LLC |
| S-1 |
| 333-176503 |
| 10.2 |
| 08/25/11 |
| |||
10.03 |
| First Addendum to Lease Agreement, dated May 4, 2010, by and between Brownstone Publishing, LLC and Henry Amalgamated, LLC |
| S-1 |
| 333-176503 |
| 10.3 |
| 08/25/11 |
| |||
10.04 |
| Second Addendum to Lease Agreement, dated December 1, 2010, by and between Brownstone Publishing, LLC and Henry Amalgamated, LLC |
| S-1 |
| 333-176503 |
| 10.4 |
| 08/25/11 |
| |||
10.05 |
| Third Addendum to Lease Agreement, dated December 16, 2010, by and between Brownstone Publishing, LLC and Henry Amalgamated, LLC |
| S-1 |
| 333-176503 |
| 10.5 |
| 08/25/11 |
| |||
10.06 |
| Fourth Addendum to Lease Agreement, dated January 1, 2011, by and between the registrant and Henry Amalgamated, LLC |
| S-1 |
| 333-176503 |
| 10.6 |
| 08/25/11 | ||||
10.07 |
| Fifth Addendum to Lease Agreement, dated June 1, 2011, by and between the registrant and Henry Amalgamated, LLC |
| S-1 |
| 333-176503 |
| 10.7 |
| 08/25/11 | ||||
10.08 |
| Sixth Addendum to Lease Agreement, dated June 1, 2011, by and between the registrant and Henry Amalgamated, LLC |
| S-1 |
| 333-176503 |
| 10.8 |
| 08/25/11 | ||||
10.09 |
| Contingent Addendum to Lease Agreement, dated January 1, 2011 and effective February 1, 2011, by and between the registrant and Henry Amalgamated, LLC |
| S-1 |
| 333-176503 |
| 10.9 |
| 08/25/11 | ||||
10.10 |
| Contingent Addendum to Lease Agreement, dated January 1 2011 and effective March 1, 2011, by and between the registrant and Henry Amalgamated, LLC |
| S-1 |
| 333-176503 |
| 10.10 |
| 08/25/11 | ||||
10.11 |
| Parking Lease, dated February 28, 2009, by and between Brownstone Publishing, LLC and Henry Amalgamated, LLC |
| S-1 |
| 333-176503 |
| 10.11 |
| 08/25/11 | ||||
10.12 |
| Lease, dated November 2, 2007, by and between AL Campus Kids, LLC, and Henry Amalgamated, LLC (124 Herman Street) |
| S-1 |
| 333-176503 |
| 10.12 |
| 08/25/11 | ||||
10.13 |
| Lease, dated November 2, 2007, by and between AL Campus Kids, LLC, and Henry Amalgamated, LLC (118 Herman Street) |
| S-1 |
| 333-176503 |
| 10.13 |
| 08/25/11 | ||||
10.14 † |
| Employment Agreement, dated July 10, 2006, by and between Brownstone Publishing, LLC and Michael D. Rutz |
| S-1 |
| 333-176503 |
| 10.15 |
| 08/25/11 | ||||
10.15† |
| Form of Indemnification Agreement by and between Angie’s List, Inc. and each of its executive officers and its directors not affiliated with an investment fund |
| S-1/A |
| 333-176503 |
| 10.19 |
| 09/29/11 |
| |||
10.16† |
| Form of Indemnification Agreement by and between Angie’s List, Inc. and each of its directors affiliated with an investment fund |
| S-1/A |
| 333-176503 |
| 10.20 |
| 09/29/11 |
| |||
10.17 |
| Loan and Security Agreement, dated August 31, 2011, by and between ORIX Venture Finance LLC, Bridge Bank National Association and Angie’s List, Inc. |
| S-1/A |
| 333-176503 |
| 10.21 |
| 09/29/11 |
| |||
10.18 |
| Project Agreement by and between Angie’s List, Inc. and the Consolidated City of Indianapolis, dated October 21, 2011 |
| S-1/A |
| 333-176503 |
| 10.22 |
| 11/02/11 |
| |||
10.19 |
| Contingent Addendum to Lease Agreement, dated November 15, 2011 by and between the registrant and Henry Amalgamated LLC |
| 10-K |
| 001-35339 |
| 10.23 |
| 03/15/12 |
| |||
10.20 |
| Contingent Addendum to Lease Agreement, dated December 1, 2011 by and between the registrant and Henry Amalgamated LLC |
| 10-K |
| 001-35339 |
| 10.24 |
| 03/15/12 |
| |||
10.21 |
| Contingent Addendum to Lease Agreement, dated April 10, 2012 by and between the registrant and Henry Amalgamated LLC [934 E Washington Street, Indianapolis, IN 46202] |
| 10-Q |
| 001-35339 |
| 10.1 |
| 08/09/12 |
| |||
10.22 |
| Contingent Addendum to Lease Agreement, dated April 10, 2012 by and between the registrant and Henry Amalgamated LLC [25 Pine Street, Indianapolis, IN 46202] |
| 10-Q |
| 001-35339 |
| 10.2 |
| 08/09/12 |
| |||
10.23 |
| Contingent Addendum to Lease Agreement, dated April 10, 2012 by and between the registrant and Henry Amalgamated LLC [902 E Washington Street, Indianapolis, IN 46202] |
| 10-Q |
| 001-35339 |
| 10.3 |
| 08/09/12 |
| |||
10.24 |
| Contingent Addendum to Lease Agreement, dated July 1, 2012 by and between the registrant and Henry Amalgamated LLC [902, 932 & 934 Suite A, E Washington Street, Indianapolis, IN 46202] |
| 10-Q |
| 001-35339 |
| 10.4 |
| 08/09/12 |
| |||
10.25 |
| Purchase and sale agreement by and among Angie’s List, Inc. and Henry Amalgamated, LLC and Henry Amalgamated II, LLC |
| 8-K |
| 001-35339 |
| 10.1 |
| 11/09/12 |
| |||
10.26† |
| Offer letter with Mark Howell, dated December 20, 2012 |
| 8-K |
| 001-35339 |
| 10.1 |
| 01/17/13 |
| |||
10.27† | Offer letter with Patrick Brady, dated May 14, 2013 | 10-Q | 001-35339 | 10.1 | 07/25/13 | |||||||||
10.28† | Offer Letter Agreement by and between Angie’s List, Inc. and Thomas R. Fox, dated August 20, 2013 | 8-K | 001-35339 | 10.1 | 08/21/13 | |||||||||
21.01 |
| Subsidiaries of the Registrant |
| S-1 |
| 333-176503 |
| 21.1 |
| 08/25/11 |
| |||
23.01 |
| Consent of independent registered public accounting firm |
|
|
|
|
| X | ||||||
24.01 |
| Power of Attorney (included on signature page of this Annual Report on Form 10-K) |
|
|
|
|
| X | ||||||
31.01 |
| Certification of the Principal Executive Officer Pursuant to Section 302 of the Sarbanes-Oxley Act |
|
|
|
|
| X | ||||||
31.02 |
| Certification of the Principal Financial Officer Pursuant to Section 302 of the Sarbanes-Oxley Act |
|
|
|
|
| X | ||||||
32.01 |
| Certification of the Principal Executive Officer Pursuant to Section 906 of the Sarbanes-Oxley Act |
|
|
|
|
| X | ||||||
32.02 |
| Certification of the Principal Financial Officer Pursuant to Section 906 of the Sarbanes-Oxley Act |
|
|
|
|
| X | ||||||
101.INS*(1) | XBRL Instance Document | X | ||||||||||||
101.SCH*(1) | XBRL Taxonomy Extension Schema Document | X | ||||||||||||
101.CAL*(1) | XBRL Taxonomy Extension Calculation Linkbase Document | X | ||||||||||||
101.DEF*(1) | XBRL Taxonomy Extension Definition Linkbase Document | X | ||||||||||||
101.LAB*(1) | XBRL Taxonomy Extension Labels Linkbase Document | X | ||||||||||||
101.PRE*(1) | XBRL Taxonomy Extension Presentation Linkbase Document | X | ||||||||||||
† Indicates management contract or compensatory plan.
80