Texas | | | | Texas | | 72-1121985 | (State of incorporation) | | (IRS Employer
Identification Number)72-1121985
| (State or other jurisdiction of incorporation or organization) | | (I.R.S. Employer
Identification Number) | | | Nine Greenway Plaza, Suite 300 Houston, Texas | | 77046-0908 | (Address of principal executive offices) | | (Zip Code) |
(713) 626-8525 (Registrant’s telephone number, including area code) Securities registered pursuant to Section 12(b) of the Act: | | | Title of Each Class | | Name of Each Exchange on Which Registered | Common Stock, par value $0.00001 | | New York Stock Exchange |
Securities registered pursuant to Section 12(g) of the Act: None Indicate by check mark if the registrant is a well-known seasoned issuer, as defined in Rule 405 of the Securities Act. Yes x¨ No ¨þ Indicate by check mark if the registrant is not required to file reports pursuant to Section 13 or Section 15(d) of the Act. Yes ¨ No xþ Indicate by check mark whether the registrant (1) has filed all reports required to be filed by Section 13 or 15(d) of the Securities Exchange Act of 1934 during the preceding 12 months (or for such shorter period that the registrant was required to file such reports), and (2) has been subject to such filing requirements for the past 90 days. Yes xþ No ¨ Indicate by check mark whether the registrant has submitted electronically and posted on its corporate website, if any, every interactive data file required to be submitted and posted pursuant to Rule 405 of Regulation S-T (§ 232.405 of this chapter) during the preceding 12 months (or for such shorter period that the registrant was required to submit and post such files). Yes xþ No ¨ Indicate by check mark if disclosure of delinquent filers pursuant to Item 405 of Regulation S-K (§ 229.405 of this chapter) is not contained herein, and will not be contained, to the best of registrant’s knowledge, in definitive proxy or information statements incorporated by reference in Part III of this Form 10-K or any amendment to this Form 10-K. xþ Indicate by check mark whether the registrant is a large accelerated filer, an accelerated filer, a non-accelerated filer, or a smaller reporting company. See the definitions of “large accelerated filer,” “accelerated filer” and “smaller reporting company” in Rule 12b-2 of the Exchange Act. | | | | | | | | | Large accelerated filerx | | ¨ | | Accelerated filer¨ | | þ | | | | | | | Non-accelerated filer | | ¨ | | | | Smaller reporting company | | ¨ |
Indicate by check mark whether the registrant is a shell company (as defined in Rule 12b-2 of the Act). Yes ¨ No xþ The aggregate market value of the registrant’s common stock held by non-affiliates was approximately $529,519,000$571,144,000 based on the closing sale price of $15.30$16.37 per share as reported by the New York Stock Exchange on June 29, 2012.30, 2014. The number of shares of the registrant’s common stock outstanding on February 25, 2013March 3, 2015 was 75,249,630.75,899,415. DOCUMENTS INCORPORATED BY REFERENCE Portions of the registrant’s Proxy Statement relating to the Annual Meeting of Shareholders, to be filed within 120 days of the end of the fiscal year covered by this report, are incorporated by reference into Part III of this Form 10-K.
W&T OFFSHORE, INC. TABLE OF CONTENTS FORWARD-LOOKING STATEMENTS This Annual Report on Form 10-K contains forward-looking statements within the meaning of the Private Securities Litigation Reform Act of 1995, Section 27A of the Securities Act of 1933 and Section 21E of the Securities Exchange Act of 1934. These forward-looking statements involve risks, uncertainties and assumptions. If the risks or uncertainties materialize or the assumptions prove incorrect, our results may differ materially from those expressed or implied by such forward-looking statements and assumptions. All statements other than statements of historical fact are statements that could be deemed forward-looking statements, such as those statements that address activities, events or developments that we expect, believe or anticipate will or may occur in the future. These statements are based on certain assumptions and analyses made by us in light of our experience and perception of historical trends, current conditions, expected future developments and other factors we believe are appropriate under the circumstances. Known material risks that may affect our financial condition and results of operations are discussed in Item 1A, Risk Factors, and market risks are discussed in Item 7A, Quantitative and Qualitative Disclosures About Market Risk, of this Annual Report on Form 10-K and may be discussed or updated from time to time in subsequent reports filed with the Securities and Exchange Commission (“SEC”). Readers are cautioned not to place undue reliance on forward-looking statements, which speak only as of the date made.hereof. We assume no obligation, nor do we intend, to update these forward-looking statements, unless required by law. Unless the context requires otherwise, references in this Annual Report on Form 10-K to “W&T,” “we,” “us,” “our” and the “Company” refer to W&T Offshore, Inc. and its consolidated subsidiaries. i
PART I Item 1. Business W&T Offshore, Inc. is an independent oil and natural gas producer, active in the exploration, development and acquisition of oil and natural gas properties primarily in the Gulf of Mexico and the Permian Basin in West Texas. W&T Offshore, Inc. is a Texas corporation originally organized as a Nevada corporation in 1988, and successor by merger to W&T Oil Properties, Inc., a Louisiana corporation organized in 1983. Our interest in fields, leases, structures and equipment are primarily owned by the parent company, W&T Offshore, Inc. and our wholly-own subsidiary, W & T Energy VI, LLC, a Delaware limited liability company. The Gulf of Mexico is an area where we have developed significant technical expertise and where high production rates associated with hydrocarbon deposits have historically provided us the best opportunity to achieve a rapid return on our invested capital. We have leveraged our historic experience in the conventional shelf (water depths of less than 500 feet) to develop higher impact capital projects in the Gulf of Mexico in both the deepwater (water depths in excess of 500 feet) and the deep shelf (well depths in excess of 15,000 feet and water depths of less than 500 feet). We have acquired rights to explore and develop new prospects and acquired existing oil and natural gas properties in both the deepwater and the deep shelf, while at the same time continuing our focus on the conventional shelf. During 2011, Over the last several years, we significantly increasedhave shifted our activityfocus more toward the deepwater and to onshore from what was previously a relatively minor presence. In May 2011, we acquired various properties and leasehold interests in four counties in the Permian Basin of West Texas. In the deepwater, we have completed numerous acquisitions and drilled both exploration and development wells. Our deepwater acreage has expanded considerably and currently represents almost half of our offshore acreage on a gross acreage basis.
Our onshore activities have been primarily in the Permian Basin in West Texas, (as described below)where most of our leasehold interests were acquired in a single transaction and separately acquired other leasehold interests2011 acquisition. During 2014, we reassigned most of our interest in another county in the Permian Basin. In East Texas weacreage acquired leasehold interests in 2011 back to the original assignor and currently have been evaluating this area through selective explorationlimited leasehold interest in East Texas and development activities.Louisiana. As of December 31, 2012,2014, we have interests in offshore leases covering approximately 1.21.1 million gross acres (0.8(0.7 million net acres) spanning across the outer continental shelf off the coasts of Louisiana, Texas, Mississippi and Alabama. On a gross acreage basis, the conventional shelf constitutes approximately 52% and deepwater constitutes approximately 48% of our offshore acreage. Onshore, we have leasehold interests in approximately 0.2 million50,000 gross acres (0.2 million(40,000 net acres), substantially all of which are in Texas. Approximately 54%58% of our total net offshore acreage is developed, and approximately 11%62% of our total net onshore acreage is developed. Of the onshore leasehold acreage classified as undeveloped, a substantial portion could expire in 2013 but is expected to be extended by drilling two additional wells in 2013 and can be further extended by additional operations or production in future years. Based on a reserve report prepared by Netherland, Sewell & Associates, Inc. (“NSAI”), our independent petroleum consultant,consultants, our total proved reserves at December 31, 20122014 were 117.5120.0 million barrels of oil equivalent (“MMBoe”) or 705.1720.0 billion cubic feet of gas equivalent (“Bcfe”). Approximately 53%57% of our reserves were classified as proved developed producing, 21%12% as proved developed non-producing and 26%31% as proved undeveloped. Classified by product, our reserves at December 31, 20122014 were 47%52% oil, 13% natural gas liquids (“NGLs”) and 40%35% natural gas. These percentages were determined using the energy-equivalent ratio of six thousand cubic feet (“Mcf”) of natural gas to one barrel (“Bbl”) of crude oil, condensate or NGLs. This energy-equivalent ratio does not assume price equivalency, and the energy-equivalent prices for oil, NGLs and natural gas may differ significantly. Our total proved reserves had an estimated present value of future net revenues discounted at 10% (“PV-10”) of $2.8$2.6 billion. Our PV-10 after considering future cash outflows related to asset retirement obligations (“ARO”) and without deducting future income taxes was $2.5$2.3 billion, and our standardized measure of discounted future cash flows was $1.8$1.7 billion as of December 31, 2012.2014. Neither PV-10 nor PV-10 after ARO is a financial measure defined under generally accepted accounting principles (“GAAP”). For additional information about our proved reserves and a reconciliation of PV-10 and PV-10 after ARO to the standardized measure of discounted future net cash flows, seeProperties – Proved ReservesReserveunder Part I, Item 2 ofin this Form 10-K.10-K. We seek to increase our reserves through acquisitions, exploratory and infill drilling, recompletions and workovers. We have focused on acquiring properties where we can develop an inventory of drilling prospects that will enable us to add reserves, production and cash flow post-acquisition. Our acquisition team continues to work diligentlystrives to find properties that will fit our profile and that we believe will add strategic and financial value to our company. In September 2014, we acquired additional ownership interest in the Mobile Bay blocks 113 and 132 located offshore Alabama (the “Fairway Field”) and the associated Yellowhammer gas processing plant (collectively “Fairway”), which increased our ownership interest from 64.3% to 100%. Internal estimates of additional proved reserves associated with the increased ownership interest in the Fairway Field as of the acquisition date were approximately 4.4 MMBoe (26.4 Bcfe), comprised of approximately 26% NGLs and 74% natural gas, all of which were classified as proved developed. 1
In May 2014, we acquired from Woodside Energy (USA) Inc. (“Woodside”) certain oil and gas leasehold interests in the Gulf of Mexico (the “Woodside Properties”). The Woodside Properties consisted of a 20% non-operated working interest in the producing Neptune field (deepwater Atwater Valley blocks 574, 575 and 618), along with an interest in the Neptune tension-leg platform, associated production facilities and various interests in 24 other deepwater lease blocks. Internal estimates of proved reserves associated with the Woodside Properties as of the acquisition date were approximately 1.6 MMBoe (9.4 Bcfe), comprised of approximately 89% oil, 1% NGLs and 10% natural gas, all of which were classified as proved developed. In November and December 2013, we acquired from Callon Petroleum Operating Company (“Callon”) certain oil and gas leasehold interests in the Gulf of Mexico (the “Callon Properties”). The Callon Properties consist of a 15% working interest in the Medusa field (deepwater Mississippi Canyon blocks 582 and 583), interest in associated production facilities and various interests in other non-operated fields. Internal estimates of proved reserves associated with the Callon Properties as of the acquisition dates were approximately 2.1 MMBoe (12.7 Bcfe), comprised of approximately 67% oil and 33% natural gas, all of which were classified as proved developed. In October 2012, we acquired from Newfield Exploration Company and its subsidiary, Newfield Exploration Gulf Coast LLC (together, “Newfield”), certain oil and gas leasehold interests in the Gulf of Mexico (the “Newfield Properties”). The Newfield Properties consisted of leases covering 78 federal offshore blocks on approximately 416,000 gross acres (268,000 net acres) predominantly in the deepwater. Internal estimates of proved reserves associated with the Newfield Properties as of the acquisition date were approximately 7.0 MMBoe (42.0 Bcfe), comprised of approximately 36% oil, 3% NGLs and 61% natural gas, 36% oil and 3% NGLs, all of which were classified as proved developed. In May 2011, we acquired from Opal Resources LLC and Opal Resources Operating Company LLC (collectively, “Opal”) certain oil and gas leasehold interests in the Permian Basin of West Texas, which we refer to as our “Yellow Rose Properties.” Internal estimates of proved reserves associated with the Yellow Rose Properties as of the acquisition date were approximately 30.1 MMBoe (180.4 Bcfe), comprised of approximately 69% oil, 22% NGLs and 9% natural gas, and approximately 70% of such reserves were classified as proved undeveloped.
In August 2011, we acquired from Shell Offshore Inc. (“Shell”) its 64.3% interest in the Fairway Field along with a like interest in the associated Yellowhammer gas treatment plant (collectively, the “Fairway Properties”). Internal estimates of proved reserves associated with the Fairway Properties as of the acquisition date were 8.9 MMBoe (53.5 Bcfe), comprised of approximately 72% natural gas, 27% NGLs and less than 1% oil, all of which are proved developed producing.
From time to time, as part of our business strategy, we sell various properties. In 2014, we had no significant property sales. In 2013, we sold our non-operated working interests in the Green Canyon 60 field, the Green Canyon 19 field and the West Delta area block 29, all located in the Gulf of Mexico. In 2012, we sold our 40%, non-operated working interest in the South Timbalier 41 field located in the Gulf of Mexico. In 2011 and 2010, there were no property sales of significance. Additional information on these acquisitions and this divestituredivestitures can be found under Properties inProperties under Part I, Item 2,Management’s Discussion and Analysis of Financial Condition and Results of Operationsunder in Part II, Item 7, and inFinancial Statements – and Supplementary Data - Note 2 – Acquisitions and Divestituresunder Part II, Item 8 ofin this Form 10-K. Our exploration efforts have historically have been in areas in reasonably close proximity to known proved reserves, but in 2013, some of our planned exploration projects arewere higher risk deepwater projects with potentially higher returns than our historicalprevious risk/reward profile. Historically, we have financed our drilling capital expenditures with operating cash flow. The investment associated with drilling an offshore well and future development of an offshore project principally depends upon water depth, the depth of the well, the complexity of the geological formations involved and whether the well or project can be connected to existing infrastructure or will require additional investment in infrastructure. Deepwater and deep shelf drilling projects can be substantially more capital intensive than those on the conventional shelf and onshore. Certain risks are inherent in our business specifically and in the oil and natural gas industry and our business,generally, any one of which if it occurs, can negatively impact our rate of return on shareholders’ equity.equity if it occurs. When projects are extremely capital intensive and involve substantial risk, we often seek participants to share the risk. Onshore wells are less capital intensive than offshore wells, but the amount of reserves discovered and developed on a per well basis has historically been less from onshore wells than from offshore wells. We drilledcompleted six, five and four eight and six successful offshore wells (gross) in 2012, 2011 and 2010, respectively33, 40 and drilled 77 and 39 successful onshore wells (gross) in 20122014, 2013 and 2011,2012, respectively. We generally sell our oil, NGLs and natural gas at the wellhead at current market prices or transport our production to “pooling points” where it is sold. We are required to pay gathering and transportation costs with respect to a majority of our products. Our products are marketed several different ways depending upon a number of factors including the availability of purchasers at the wellhead, the availability and cost of pipelines near the well or related production platforms, the availability of third-party processing capacity, market prices, pipeline constraints and operational flexibility. 2
Our totalcurrent capital expenditure budget for 2013 currently2015 is $450.0$200 million, not including any potential acquisitions. This compares to capital expenditures of $630 million and $636 million for 2014 and 2013, respectively. The capital budget includes 63%for 2015 is significantly lower than recent annual expenditures primarily due to the dramatic decline in crude oil prices. The 2015 budget is being allotted as follows: 38% for exploration, and 37%61% for development and these percentages include amountsless than 1% for facilities capital, recompletions, seismic and leaseholdother items. Geographically, the budget includes 63%is split 92% for offshore (11 wells) and 37% for onshore. The budget for offshore includes two deepwater wells and a joint interest arrangement in another deepwater well, of which we are not the operator. The budget8% for onshore, includes 27 wells inwith the Yellow Rose Properties and amounts currently designated for our Terry County and East Texas prospects for completion work and additional wells, which require further evaluation. Thus far in 2013,substantial majority of offshore dedicated to the deepwater. Through February 2015, we have not closed any acquisitions, but we continue to evaluate and bid on opportunities as they arise. We anticipate funding our 20132015 capital budget and any potential acquisitions with cash flow from operating activities, cash on hand and borrowings under our revolving bank credit facility and by accessing thefacility. The capital markets towe have historically accessed are currently constrained, but we believe we could access other capital markets if the extent necessary. Our 2013need arises. Hence, our 2015 capital budget is subjecthas been set with these premises in mind. For the portion of our capital budget related to change asdrilling, our operating policy has been to fund these expenditures with cash flow provided by operations. We continue to monitor commodity prices and may revise our capital budget if conditions warrant. We strive to be as flexible as possible and believe this strategy holds the best promise for value creation and growth and managing the volatility inherent in our business. See Risk Factors under Part I, Item 1A in this Form 10-K for additional information.
Business Strategy We plan to continueOur business strategy is to acquire, explore and develop oil and natural gas reserves on the Outer Continental Shelf (“OCS”), the area of our historical success and technical expertise, which we believe will yieldhas yielded desirable rates of return sufficient to remain competitivecommensurate with our perception of risks. The rapid decline in our industry.oil prices that occurred in the back half of 2014 and continued into the first part of 2015 has created a great deal of uncertainty about future exploration and development. We believe this uncertainty will continue until such time as the costs of goods and services utilized in support of exploration and production become more closely aligned with prevailing commodity prices. We also believe attractive acquisition opportunities will continue to arisebecome available in the Gulf of Mexico as the major integrated oil companies and other large independent oil and gas exploration and production companies continue to divest properties to focus on larger and more capital-intensive projects that better match their long-term strategic goals. Because of ongoing market volatility, and, more specifically, the significant declinereduction in oil and natural gas prices duringoccurring in the past several years,last six months, we also believe thatexpect to find opportunities as other less well-capitalized producers may seek buyers for theirto divest properties both onshore and offshore, which could create opportunities for us.offshore.
We believe a portion of our Gulf of Mexico acreage has exploration potential below currently producing zones, including deep shelf reserves at subsurface depths greater than 15,000 feet. Although the cost to drill deep shelf wells is usually significantly higher than shallower wells, the reserve targets are typically larger, and the use of existing infrastructure, when available, can increase the economic potential of these wells. In addition to pursuing offshore opportunities in the Gulf of Mexico and onshore opportunities in Texas, when market conditions improve, we plan to continue to pursueevaluate other areas that arecould be compatible with our technical expertise and could yield desirable rates of return sufficient to remain competitive incommensurate with our industry. As described above, we have acquired interests in various onshore properties in Texasperception of risks. We may acquire or expand our offshore and anticipate acquiring or expanding our onshore holdings through exploration, development and acquisition activities.activities if attractive opportunities arise. We believe our business approach has contributed to our success and has positioned us to capitalize on new opportunities. Historically, we have limited our annual capital spending for drilling activities to operating cash flow, and we have used capacity under our revolving bank credit facility and the capital markets for acquisitions, development and to balance working capital fluctuations. The capital markets we have historically accessed are currently constrained, but we believe we could access other capital markets if the need arises. Competition The oil and natural gas industry is highly competitive. We currently operate in the Gulf of Mexico and onshore in Texas and compete for the acquisition of oil and natural gas properties primarily on the basis of price for such properties. We compete with numerous entities, including major domestic and foreign oil companies, other independent oil and natural gas concerns and individual producers and operators. Many of these competitors are large, well established companies andthat have financial and other resources substantially greater than ours. Our ability to acquire additional oil and natural gas properties and to discover reserves in the future will depend upon our ability to evaluate and select suitable properties and consummate transactions in a highly competitive environment. For a more thorough discussion of how competition could impact our ability to successfully complete our business strategy, seeRisk Factors in under Part I, Item 1A ofin this Form 10-K. 3
Oil and Natural Gas Marketing and Delivery Commitments We sell our oil, NGLs and natural gas to third-party purchasers.customers. We are not dependent upon, or contractually limited to, any one purchasercustomer or small group of purchasers.customers. However, in 20122014, approximately 35%47% of our sales were to Shell Trading (US) Co. and approximately 16%no other customer comprised greater than 10% of our sales were to ConocoPhillips Companysales. See Financial Statements and Phillips66 Company on a combined basis, which became separate companies during 2012. SeeFinancial StatementsSupplementary Data – Note 1 – Significant Accounting Policies – Concentration of Credit Risk in under Part II, Item 8 ofin this Form 10-K for additional information about our sales to customers. Due to the nature of oil and natural gas markets, and because oil and natural gas are freely traded commodities with numerous purchasers in the Gulf of Mexico and Texas, we do not believe the loss of a single purchasercustomer or a few purchaserscustomers would materially affect our ability to sell our production. We do not have any agreements which obligate us to deliver material quantities to third parties. Regulation General. General.Various aspects of our oil and natural gas operations are subject to extensive and continually changing regulation as legislation affecting the oil and natural gas industry is under constant review for amendment or expansion. Numerous departments and agencies, both federal and state, are authorized by statute to issue, and have issued, rules and regulations binding upon the oil and natural gas industry and its individual members. The Federal Energy Regulatory Commission (“FERC”) regulates the transportation and sale for resale of natural gas in interstate commerce pursuant to the Natural Gas Act of 1938 (“NGA”) and the Natural Gas Policy Act of 1978 (“NGPA”). In 1989, however, Congress enacted the Natural Gas Wellhead Decontrol Act, which removed all remaining price and nonprice controls affecting wellhead sales of natural gas, effective January 1, 1993. While sales by producers of natural gas and all sales of crude oil, condensate and NGLs can currently be made at uncontrolled market prices, Congress could reenact price controls in the future. In addition, the Federal Trade Commission, the FERC and the Commodity Futures Trading Commission (“CFTC”) hold statutory authority to monitor certain segments of the physical and futures energy commodities markets. These agencies have imposed broad regulations prohibiting fraud and manipulation of such markets. With regard to our physical sales of oil or other energy commodities, and any related hedging activities that we undertake, we are required to observe the market-related regulations enforced by these agencies, which hold substantial enforcement authority. Failure to comply with such regulations, as interpreted and enforced, could have a material adverse effect on our business, results of operations and financial condition. Regulation and transportation of natural gas.Our sales of natural gas are affected by the availability, terms and cost of transportation. The price and terms for access to pipeline transportation are subject to extensive regulation. In recent years, the FERC has undertaken various initiatives to increase competition within the natural gas industry. As a result of initiatives like FERC Order No. 636, issued in April 1992, the interstate natural gas transportation and marketing system has been substantially restructured to remove various barriers and practices that historically limited non-pipeline natural gas sellers, including producers, from effectively competing with interstate pipelines for sales to local distribution companies and large industrial and commercial customers. The most significant provisions of Order No. 636 require that interstate pipelines provide firm and interruptible transportation service on an open access basis that is equal for all natural gas supplies. In many instances, the results of Order No. 636 and related initiatives have been to substantially reduce or eliminate the interstate pipelines’ traditional role as wholesalers of natural gas in favor of providing only storage and transportation services. The rates for such storage and transportation services are subject to FERC ratemaking authority, and FERC exercises its authority either by applying cost-of-service principles or granting market based rates. Similarly, the natural gas pipeline industry may also be subject to state regulations which may change from time to time. During the 2007 legislative session, the Texas State Legislature passed H.B. 3273 (“Competition Bill”) and H.B. 1920 (“LUG Bill”). The Competition Bill gives the Railroad Commission of Texas (“RRC”) the ability to use either a cost-of-service method or a market-based method for setting rates for natural gas gathering and intrastate transportation pipelines in formal rate proceedings. It also gives the RRC specific authority to enforce its statutory duty to prevent discrimination in natural gas gathering and transportation, to enforce the requirement that parties participate in an informal complaint process and to punish purchasers, transporters, and gatherers for taking discriminatory actions against shippers and sellers. The Competition Bill also provides producers with the unilateral option to determine whether or not confidentiality provisions are included in a contract to which a producer is a party for the sale, transportation, or gathering of natural gas. The LUG Bill modifies the informal complaint process at the RRC with procedures unique to lost and unaccounted for gas issues. It extends the types of information that can be requested, provides producers with an annual audit right, and provides the RRC with the authority to make determinations and issue orders in specific situations. Both the Competition Bill and the LUG Bill became effective September 1, 2007. The RRC was subject to a sunset condition. Although certain proposals were madereview during 2013 and was authorized to operate for an additional four years. Its next scheduled sunset review is in 2012, no legislation was enacted during 2012. The RRC will be reviewed again in 2013.2017. 4
The Outer Continental Shelf Lands Act (“OCSLA”), which is administered by the Bureau of Ocean Energy Management (“BOEM”) and the FERC, requires that all pipelines operating on or across the OCS provide open access, non-discriminatory transportation service. One of the FERC’s principal goals in carrying out OCSLA’s mandate is to increase transparency in the market to provide producers and shippers working in the OCS with greater assurance of open access service on pipelines located on the OCS and non-discriminatory rates and conditions of service on such pipelines. On June 18, 2008, the BOEM issued a final rule, effective August 18, 2008, that implements a hotline, alternative dispute resolution procedures, and complaint procedures for resolving claims of having been denied open and nondiscriminatory access to pipelines on the OCS. In December 2007, the FERC issued rules (“Order 704”) requiring that any market participant, including a producer such as W&T,us, that engages in wholesale sales or purchases of natural gas that equal or exceed 2.2 million British thermal units (“MMBtus”MMBtu”) during a calendar year must annually report, starting May 1, 2009, such sales and purchases to the FERC. These rules are intended to increase the transparency of the wholesale natural gas markets and to assist the FERC in monitoring such markets and in detecting market manipulation. Additional proposals and proceedings that might affect the natural gas industry are pending before Congress, the FERC, state commissions and the courts. The natural gas industry historically has been very heavily regulated. As a result, there is no assurance that the less stringent regulatory approach recently pursued by the FERC and Congress will continue. While the changes by these federal and state regulators for the most part affect us only indirectly, they are intended to further enhance competition in natural gas markets. We cannot predict what further action the FERC, the BOEM or state regulators will take on these matters; however, we do not believe that any such action taken will affect us differently, in any material way, than other natural gas producers with which we compete. Oil and NGLs transportation rates. Our sales of crude oil, condensate and NGLs are not currently regulated and are transacted at market prices. In a number of instances, however, the ability to transport and sell such products is dependent on pipelines whose rates, terms and conditions of service are subject to FERC jurisdiction under the Interstate Commerce Act. The price we receive from the sale of oil and NGLs is affected by the cost of transporting those products to market. Interstate transportation rates for oil, NGLs and other products are regulated by the FERC. The FERC has established an indexing system for such transportation, which allows such pipelines to take an annual inflation-based rate increase. In other instances, the ability to transport and sell such products is dependent on pipelines whose rates, terms and conditions of service are subject to regulation by state regulatory bodies under state statutes. As it relates to intrastate crude oil, condensate and natural gas liquids pipelines, state regulation is generally less rigorous than the federal regulation of interstate pipelines. State agencies have generally not investigated or challenged existing or proposed rates in the absence of shipper complaints or protests, which are infrequent and are usually resolved informally. We do not believe that the regulatory decisions or activities relating to interstate or intrastate crude oil, condensate or natural gas liquids pipelines will affect us in a way that materially differs from the way they affect other crude oil, condensate and natural gas liquids producers or marketers. Regulation of oil and natural gas exploration and production.Our exploration and production operations are subject to various types of regulation at the federal, state and local levels. Such regulations include requiring permits, bonds and pollution liability insurance for the drilling of wells, regulating the location of wells, the method of drilling, casing, operating, plugging and abandoning wells, and governing the surface use and restoration of properties upon which wells are drilled. Many states also have statutes or regulations addressing conservation of oil and gas resources, including provisions for the unitization or pooling of oil and natural gas properties, the establishment of maximum rates of production from oil and natural gas wells and the regulation of spacing of such wells. Federal leases. Most of our offshore operations are conducted on federal oil and natural gas leases, which are administered by the BOEM pursuant to the OCSLA. These leases are awarded based on competitive bidding and contain relatively standardized terms. These leases require compliance with detailed BOEM, Bureau of Safety and Environmental Enforcement (“BSEE”), and other government agency regulations and orders that are subject to interpretation and change. The BOEM and BSEE have promulgated other regulations governing the plugging and abandonment of wells located offshore and the installation and removal of all production facilities, structures and pipelines. SeeRisk Factors under Part I, Item 1A in this Form 10-K for more information on new regulations and interpretations. 5
To cover the various obligations of lessees on the OCS, the BOEM generally requires that lessees have substantial net worthdemonstrate financial strength and reliability according to regulations or post bonds or other acceptable assurances that such obligations will be satisfied. The significant reductions in oil and natural gas pricing since the middle of 2014 may also adversely impact the BOEM’s financial assurance determinations with respect to the Company. The cost of these bonds or assurances can be substantial, and there is no assurance that they can be obtained in all cases. W&T Offshore, Inc. is currently exempt from supplemental bondingIn August 2014, the BOEM issued an Advanced Notice of Proposed Rulemaking in which the agency indicated that it was considering increasing the financial assurance requirements byfor companies operating in federal waters. If the BOEM. As many BOEM regulations are being reviewed, we may be subjectwere to supplemental bondingincrease its financial assurance requirements in the future.substantially, such action could have a material adverse effect on our business, prospects, results of operations, financial condition, and liquidity. Under some circumstances, the BOEM may require any of our operations on federal leases to be suspended or terminated. Any such suspension or termination could materially adversely affect our financial condition and results of operations. SeeRisk Factors – BP’s Deepwater Horizon explosionIn addition, the BOEM can require supplemental bonding from operators for decommissioning, plugging, and ensuing oil spill couldabandonment liabilities. According to federal regulations, the BOEM will waive its supplemental bonding requirements when a lessee or its guarantor can demonstrate the financial capability and reliability to meet these obligations. We have broad adverse consequences affectingdemonstrated our financial capability and reliability to the satisfaction of the BOEM and the agency does not require that the Parent Company post any supplemental bonds to cover our operations inon the Gulf of Mexico, some of which may be unforeseeableunder Part I, Item 1A in this Form 10-Kfor more information.OCS. TheIn December 2013 and January 2014, we were notified by the Office of Natural Resources Revenue (“ONRR”) administers the collectionof an underpayment of royalties underon certain Federal offshore oil and gas leases that cumulatively approximated $30,000 over several years, which represents 0.0045% of royalty payments paid by us during the termssame period of the OCSLAunderpayment. In March 2014, we received notice from the ONRR of a statutory fine of $2.3 million relative to such underpayment. We believe the fine is excessive and extreme considering the oilcircumstances and natural gas leases issued thereunder. Thein relation to the amount of royalties due is based uponunderpayment. On April 23, 2014, we filed a request for a hearing on the termsrecord and a general denial of the oil and natural gas leasesONRR’s allegations contained in the notice. We intend to contest the fine to the fullest extent possible. The ultimate resolution may result in a waiver of the fine, a reduction of the fine, or payment of the full amount plus interest covering several years. As no amount has been determined as wellmore likely than any other within the range of possible resolutions, no amount has been accrued as of December 31, 2014 per authoritative guidance. However, we cannot state with certainty that our estimate of the regulations promulgated by the ONRR and the BOEM.exposure is accurate concerning this matter.
Hurricanes in the Gulf of Mexico can have a significant impact on oil and gas operations on the OCS. The effects from past hurricanes have included structural damage to fixed production facilities, semi-submersibles and jack-up drilling rigs. The BOEM and the BSEE continue to be concerned about the loss of these facilities and rigs as well as the potential for catastrophic damage to key infrastructure and the resultant pollution from future storms. In an effort to reduce the potential for future damage, the BOEM and the BSEE have periodically issued guidance aimed at improving platform survivability by taking into account environmental and oceanic conditions in the design of platforms and related structures. It is possible that similar, if not more stringent, requirements will be issued by the BOEM andand/or the BSEE for future hurricane seasons. New requirements, if any, could increase our operating costs and/or capital expenditures. Environmental regulations.Regulations General. We are subject to complex and stringent federal, state and local environmental laws. These laws, among other things, govern the issuance of permits to conduct exploration, drilling and producing operations, the amounts and types of materials that may be released into the environment, the discharge and disposal of waste materials, the remediation of contaminated sites and the reclamation and abandonment of wells, sites and facilities. Numerous governmental departments issue rules and regulations to implement and enforce such laws, which are often difficult and costly to comply with and which carry substantial civil and even criminal penalties for failure to comply. Some laws, rules and regulations relating to protection of the environment may, in certain circumstances, impose strict liability for environmental contamination, rendering a person liable for environmental damages and cleanup costs without regard to negligence or fault on the part of such person. Other laws, rules and regulations may restrict the rate of oil and natural gas production below the rate that would otherwise exist or even prohibit exploration and production activities in sensitive areas. In addition, state laws often require various forms of remedial action to prevent and address pollution, such as the closure of inactive oil and gas waste pits and the plugging of abandoned wells. The regulatory burden on the oil and natural gas industry increases our cost of doing business and consequently affects our profitability. The remediation, reclamation and abandonment of wells, platforms and other facilities in the Gulf of Mexico may require us to incur significant costs. These costs are considered a normal, recurring cost of our on-going operations. Our domestic competitors are generally subject to the same laws and regulations. We believe we are in substantial compliance with current applicable environmental laws6
Hazardous Substances and regulations. We believe that compliance with existing requirements will not have a material adverse impact on our operations, but failure to comply could have material consequences. Environmental laws and regulations have been subject to frequent changes over the years, and the imposition of more stringent requirements could have a material adverse effect upon our capital expenditures, earnings or competitive position, including the suspension or cessation of operations in affected areas. As such, there can be no assurance that material cost and liabilities related to compliance with environmental laws and regulations will not be incurred in the future. Wastes.The Comprehensive Environmental Response, Compensation, and Liability Act (“CERCLA”) imposes liability, without regard to fault, on certain classes of persons that are considered to be responsible for the release of a “hazardous substance” into the environment. These persons include the current or former owner or operator of the disposal site or sites where the release occurred and companies that disposed or arranged for the disposal of hazardous substances. Under CERCLA, such persons are subject to joint and several liability for the cost of investigating and cleaning up hazardous substances that have been released into the environment, for damages to natural resources and for the cost of certain health studies. In addition, companies that incur liability frequently also confront third-party claims because it is not uncommon for neighboring landowners and other third parties to file claims for personal injury and property damage allegedly caused by hazardous substances or other pollutants released into the environment from a polluted site. Despite the “petroleum exclusion” of Section 101(14) of CERCLA, which currently encompasses crude oil and natural gas, we may nonetheless handle hazardous substances within the meaning of CERCLA, or similar state statutes, in the course of our ordinary operations and, as a result, may be jointly and severally liable under CERCLA for all or part of the costs required to clean up sites at which these hazardous substances have been released into the environment. In addition, we may have liability for releases of hazardous substances at our properties by prior owners or operators or other third parties. The Federal Solid Waste Disposal Act, as amended by the Resource Conservation and Recovery Act of 1976 (“RCRA”), regulates the generation, transportation, storage, treatment and disposal of hazardous wastes and can require cleanup of hazardous waste disposal sites. RCRA currently excludes drilling fluids, produced waters and certain other wastes associated with the exploration, development or production of oil and natural gas from regulation as “hazardous waste.” Disposal of such non-hazardous oil and natural gas exploration, development and production wastes is usually regulated by state law. Other wastes handled at exploration and production sites or generated in the course of providing well services may not fall within this exclusion. Moreover, stricter standards for waste handling and disposal may be imposed on the oil and natural gas industry in the future. From time to time, legislation is proposed in Congress that would revoke or alter the current exclusion of exploration, development and production wastes from the RCRA definition of “hazardous wastes,” thereby potentially subjecting such wastes to more stringent handling, disposal and cleanup requirements. If such legislation were enacted, it could have a significant impact on our operating costs as well as the oil and natural gas industry in general. The impact of future revisions to environmental laws and regulations cannot be predicted. Additionally, Naturally Occurring Radioactive Materials (“NORM”) may contaminate minerals extraction and processing equipment used in the oil and natural gas industry. The waste resulting from such contamination is regulated by federal and state laws. Standards have been developed for: worker protection; treatment, storage, and disposal of NORM and NORM waste; management of NORM-contaminated waste piles, containers and tanks; and limitations on the relinquishment of NORM contaminated land for unrestricted use under RCRA and state laws. We do not anticipate any material expenditures in connection with our compliance with RCRA and applicable state laws related to NORM waste. Air Emissions. Air emissions from our operations are subject to the Federal Clean Air Act (“CAA”) and comparable state and local requirements. We may be required to incur certain capital expenditures in the future for air pollution control equipment in connection with obtaining and maintaining operating permits and approvals for air emissions. In August 2012,For example, the U.S. Environmental Protection Agency (the “EPA”(“EPA”) adopted new rules that establishhas established air emission controls requirements for oil and natural gas production and natural gas processing operations. Specifically, the EPA established New Source Performance Standards for emissions of sulfur dioxide and volatile organic compounds (“VOCs”) and a separate set of emission standards for hazardous air pollutants frequently associated with oil and natural gas production and processing activities. The EPA rules require the reduction of VOC emissions from oil and natural gas production facilities by mandating the use of “green completions” for hydraulic fracturing, which requires the operator to recover rather than vent any hydrocarbons that come to the surface during completion of the fracturing process. The requirement for flaring of gas not sent to a gathering line became effective October 15, 2012, and all operators are required to use “green completions” drilling equipment beginning January 1, 2015. The rules also establish specific requirements regarding emissions from compressors, dehydrators, storage tanks and other production equipment. In addition, the rules establish new leak detection requirements for natural gas processing plants. These rules may require a number of modifications to our operations including the installation of new equipment. Compliance with such rules could result in significant costs, including increased capital expenditures and operating costs, and could adversely impact our operating results. However, we believe our operations will not be materially adversely affected by any such requirements, and the requirements are not expected to be any more burdensome to us than to other similarly situated companies involved in oil and natural gas exploration and production activities. In December 2009, theClimate Change. The EPA has determined that emissions of carbon dioxide, methane and other “greenhouse gases” present an endangerment to public health and the environment because emissions of such gases are, according to the EPA, contributing to warming of the earth’s atmosphere and other climatic changes. Based on these findings, the EPA has begun adopting and implementing regulations to restrict emissions of greenhouse gases under existing provisions of the CAA. The EPA has adopted two sets of rules regulating greenhouse gas emissions under the CAA, one of which requires a reduction in emissions of greenhouse gases from motor vehicles and the other of which regulates emissions of greenhouse gases fromrequires preconstruction and operating permits for certain large stationary sources, effective January 2, 2011.sources. The EPA has also adopted rules requiringrequires the reporting of greenhouse gas emissions from specified large greenhouse gas emission sources in the United States, such as petroleum refineries, on an annual basis effective in 2011, as well asincluding certain onshore oil and natural gas production facilities, on an annual basis, beginning in 2012 for emissions occurring in 2011.basis. We believe we are in compliance with this new emission reporting requirement as it applies to our operationsoperations.
The7
In addition, the United States Congress has from time to time considered adopting legislation to reduce emissions of greenhouse gases, and almost one-half of the states have already taken legal measures to reduce emissions of greenhouse gases primarily through the planned development of greenhouse gas emission inventories and/or regional greenhouse gas cap and trade programs. Most of these cap and trade programs work by requiring major sources of emissions such as electric power plants, or major producers of fuels, such as refineries and gas processing plants, to acquire and surrender emission allowances. The number of allowances available for purchase is reduced each year in an effort to achieve the overall greenhouse gas emission reduction goal. The adoption of legislation or regulatory programs to reduce emissions of greenhouse gases could require us to incur increased operating costs, such as costs to purchase and operate emissions control systems, to acquire emissions allowances or comply with new regulatory or reporting requirements. Any such legislation or regulatory programs could also increase the cost of consuming, and thereby reduce demand for, the oil, NGLs and natural gas we produce. Consequently, legislation and regulatory programs to reduce emissions of greenhouse gases could have an adverse effect on our business, financial condition and results of operations. Finally, it should be noted that some scientists have concluded that increasing concentrations of greenhouse gases in the Earth’s atmosphere may produce climate changes that have significant physical effects, such as increased frequency and severity of storms, droughts, floods and other climatic events. If any such effects were to occur, they could have an adverse effect on our financial condition and results of operations. Water Discharges. The primary federal law for oil spill liability is the Oil Pollution Act (the “OPA”) which amends and augments oil spill provisions of the Cleanfederal Water Act.Pollution Control Act (the “Clean Water Act”). OPA imposes certain duties and liabilities on “responsible parties” related to the prevention of oil spills and damages resulting from such spills in or threatening United States waters, including the OCS or adjoining shorelines. A liable “responsible party” includes the owner or operator of an onshore facility, vessel or pipeline that is a source of an oil discharge or that poses the substantial threat of discharge or, in the case of offshore facilities, the lessee or permittee of the area in which a discharging facility is located. OPA assigns joint and several, strict liability, without regard to fault, to each liable party for all containment and oil removal costs and a variety of public and private damages including, but not limited to, the costs of responding to a release of oil and natural resource damages and economic damages suffered by persons adversely affected by an oil spill. Although defenses exist to the liability imposed by OPA, they are limited. In addition, in December 2014, the BOEM issued a final rule, effective January 12, 2015, which raises OPA’s damages liability cap from $75 million to $133.65 million. OPA also requires owners and operators of offshore oil production facilities to establish and maintain evidence of financial responsibility to cover costs that could be incurred in responding to an oil spill. OPA currently requires a minimum financial responsibility demonstration of $35 million for companies operating on the OCS, although the Secretary of Interior may increase this amount up to a maximum of $150 million. We are currently required to demonstrate, on an annual basis, that we have ready access to $150 million that can be used to respond to an oil spill from our facilities on the OCS. As a result of the BP Deepwater Horizon incident, legislation has been proposed in Congress to increase the minimum level of financial responsibility to $300 million or more. If OPA is amended to increase the minimum level of financial responsibility to $300 million, we may experience difficulty in providing financial assurances sufficient to comply with this requirement. We cannot predict at this time whether OPA will be amended or whether the level of financial responsibility required for companies operating on the OCS will be increased. In any event, if an oil discharge or substantial threat of discharge were to occur, we may be liable for costs and damages, which costs and liabilities could be material to our results of operations and financial position. SeeManagement’s Discussion The Clean Water Act and Analysiscomparable state laws impose restrictions and strict controls regarding the monitoring and discharge of Financial Conditionpollutants, including produced waters and Resultsother natural gas wastes, into federal and state waters. The discharge of Operations – Liquiditypollutants into regulated waters is prohibited, except in accordance with the terms of a permit issued by the EPA or the state. The EPA has also adopted regulations requiring certain onshore oil and Capital Resources – Hurricane Remediationnatural gas exploration and Insurance Claimsproduction facilities to obtain individual permits or coverage under general permits for storm water discharges. Costs may be associated with the treatment of wastewater or developing and implementing storm water pollution prevention plans, as well as for monitoring and sampling the storm water runoff from certain of our onshore facilities. Obtaining permits has the potential to delay the development of oil and natural gas projects. These same regulatory programs also limit the total volume of water that can be discharged, hence limiting the rate of development, and require us to incur compliance costs. Pursuant to these laws and regulations, we may be required to obtain and maintain approvals or permits for the discharge of wastewater or storm water and are required to develop and implement spill prevention, control and countermeasure plans, also referred to as “SPCC plans,” in Part II, Item 7connection with on-site storage of this Form 10-K for additional information on insurance coverage.significant quantities of oil. We currently maintain all required discharge permits necessary to conduct our operations, and we believe we are in substantial compliance with their terms. 8
Hydraulic Fracturing.Hydraulic fracturing is an important and common practice that is used to stimulate production of oil and natural gas and/or oil from dense subsurface rock formations. The hydraulic fracturing process involves the injection of water, sand or other proppants and chemicals under pressure into the formation to fracture the surrounding rock formation and stimulate production. We commonly use hydraulic fracturing as part of our operations. Hydraulic fracturing typically is regulated by state oil and natural gas commissions, but the EPA has asserted federal regulatory authority pursuant to the Safe Drinking Water Act (“SDWA”(the “SDWA”) over certain hydraulic fracturing activities involving the use of diesel fuel.fuel and issued permitting guidance covering such activities in February 2014. In addition, legislation has been introduced before Congress to provide for federal regulation of hydraulic fracturing under the SDWA and to require disclosure of the chemicals used in the hydraulic fracturing process. At the state level, several states have adopted or are considering legal requirements that could impose more stringent permitting, disclosure and well construction requirements on hydraulic fracturing activities. Effective February 1, 2012,For example, in May 2013, the RRC began requiring all operators to disclose on a public website the chemical ingredientsadopted new rules governing well casing, cementing and other standards for ensuring that hydraulic fracturing operations do not contaminate nearby water volumes used to hydraulically fracture wells in Texas.resources. We follow applicable standard industry practices and legal requirements for groundwater protection in our hydraulic fracturing activities including disclosure requirements. Nonetheless, if new or more stringent federal, state or local legal restrictions relating to the hydraulic fracturing process are adopted in areas where we operate, we could incur potentially significant added costs to comply with such requirements, experience delays or curtailment in the pursuit of exploration, development, or production activities, and perhaps even be precluded from drilling wells that require hydraulic fracturing. In addition, certain governmental reviews are either underway or being proposed that focus on environmental aspects of hydraulic fracturing practices. The White House Council on Environmental Quality is coordinating an administration-wide review of hydraulic fracturing practices and the EPA is performing a study of the potential environmental effects of hydraulic fracturing on drinking water resources. The EPA’s study includes 18 separate research projects addressing topics such as water acquisition, chemical mixing, well injection, flowback and produced water, and wastewater treatment and disposal. The EPA has indicated that it expects to issue its study report in 2014.2015. The EPA is also developing effluent limitations for the treatment and discharge of wastewater resulting from hydraulic fracturing activities and plans to propose these standards by 2014.in 2015. Other governmental agencies, including the U.S. Department of Energy and the U.S. Department of the Interior, are evaluating various other aspects of hydraulic fracturing. These ongoing or proposed studies, depending on their degree of pursuit and any meaningful results obtained, could spur initiatives to further regulate hydraulic fracturing under the federal SDWA or other regulatory mechanisms. Protected and Endangered Species. Executive Order 13158, issued onin May 26, 2000, directs federal agencies to safeguard existing Marine Protected Areas (“MPAs”) in the United States and establish new MPAs. The order requires federal agencies to avoid harm to MPAs to the extent permitted by law and to the maximum extent practicable. It also directs the EPA to propose new regulations under the Clean Water Act to ensure appropriate levels of protection for the marine environment. This order has the potential to adversely affect our operations by restricting areas in which we may carry out future development and exploration projects and/or causing us to incur increased operating expenses. Federal Lease Stipulations include regulations regarding the taking of protected marine species (sea turtles, marine mammals, Gulf sturgeon and other listed marine species). The BSEE also issues numerous regulations under the nomenclature Notice to Lessees (“NTL”) that provide formal guidelines on implementation of OCS regulations and standards. We believe we are in compliance in all material respects with the requirements regarding protection of marine species. Certain flora and fauna that have been officially classified as “threatened” or “endangered” are protected by the Endangered Species Act. This law prohibits any activities that could “take” a protected plant or animal or reduce or degrade its habitat area. If endangered species are located in an area where we wish to conduct seismic surveys, development or abandonment operations, the work could be prohibited or delayed or expensive mitigation could be required. Our oil and natural gas operations includeWe own a production platform in the Gulf of Mexico located in a National Marine Sanctuary. As a result, we are subject to additional federal regulation, including regulations issued by the National Oceanic and Atmospheric Administration. Unique regulations related to operations in a sanctuary include prohibition of drilling activities within certain protected areas, restrictions on the types of water and other substances that may be discharged, required depths of discharge in connection with drilling and production activities and limitations on mooring of vessels. Failure to comply with these laws and regulations may result in the assessment of administrative, civil and criminal penalties, incurrence of investigatory or remedial obligations or the imposition of injunctive relief.
Other statutes that provide protection to animal and plant species and which may apply to our operations include, but are not necessarily limited to, the National Environmental Policy Act, the Coastal Zone Management Act, the Emergency Planning and Community Right-to-Know Act, the Marine Mammal Protection Act, the Marine Protection, Research and Sanctuaries Act, the Fish and Wildlife Coordination Act, the Magnuson-Stevens Fishery Conservation and Management Act, the Migratory Bird Treaty Act and the National Historic Preservation Act. These laws and regulations may require the acquisition of a permit or other authorization before construction or drilling commences and may limit or prohibit construction, drilling and other activities on certain lands lying within wilderness or wetlands. These and other protected areas may require certain mitigation measures to avoid harm to wildlife, and such laws and regulations may impose substantial liabilities for pollution resulting from our operations. The permits required for our various operations are subject to revocation, modification and renewal by issuing authorities. Naturally Occurring Radioactive Materials (“NORM”) may contaminate minerals extraction and processing equipment used in the oil and natural gas industry. The waste resulting from such contamination is regulated by federal and state laws. Standards have been developed for worker protection; treatment, storage and disposal of NORM and NORM waste; management of waste piles, containers and tanks; and limitations on the relinquishment of NORM contaminated land for unrestricted use under RCRA and state laws. We do not anticipate any material expenditures in connection with our compliance with RCRA and applicable state laws related to NORM waste. 9
We maintain liability insurance and well control insurance for all of our operations. In addition, we maintain property and hurricane damage insurance coverage for some, but not all, of our properties, which may cover some, but not all, of the risks described above. Most significantly, the insurance we maintain does not cover the risks described above from gradual pollution events which occur over a sustained period of time. Further, there can be no assurance that such insurance will continue to be available to cover such risks or that such insurance will be available at a cost that would justify its purchase. The occurrence of a significant environmental event not fully insured or indemnified against could have a material adverse effect on our financial condition and results of operations. See Management’s Discussion and Analysis of Financial Condition and Results of Operations – Liquidity and Capital Resources – Hurricane Remediation, Insurance Claims and Insurance Coverage under Part II, Item 7 in this Form 10-K for additional information on insurance coverage. Seasonality For a discussion of seasonal changes that affect our business, seeManagement’s Discussion and Analysis of Financial Condition and Results of Operations – Inflation and Seasonalityunder Part II, Item 7 ofin this Form 10-K. Employees As of December 31, 2012,2014, we employed 337339 people. We are not a party to any collective bargaining agreements and we have not experienced any strikes or work stoppages. We consider our relations with our employees to be good. Additional Information We file Annual Reports on Form 10-K, Quarterly Reports on Form 10-Q, Current Reports on Form 8-K and other reports with the SEC. Our reports filed with the SEC are available free of charge to the general public through our website atwww.wtoffshore.com.These reports are accessible on our website as soon as reasonably practicable after being filed with, or furnished to, the SEC. This Annual Report on Form 10-K and our other filings can also be obtained by contacting: Investor Relations, W&T Offshore, Inc., Nine Greenway Plaza, Suite 300, Houston, Texas 77046 or by calling (713) 297-8024. These reports are also available at the SEC Public Reference Room at 450 Fifth Street, N.W., Washington, D.C. 20549. The public may obtain information on the operation of the Public Reference Room by calling the SEC at 1-800-SEC-0330. The SEC also maintains a website atwww.sec.gov that contains reports, proxy and information statements and other information regarding issuers that file electronically with the SEC. Information on our website is not a part of this Form 10-K. Item 1A. Risk Factors In addition to risks and uncertainties in the ordinary course of business that are common to all businesses, important factors that are specific to us and our industry could materially impact our future performance and results of operations. We have provided below a list of known material risk factors that should be reviewed when considering buying or selling our securities. These are not all the risks we face and other factors currently considered immaterial or unknown to us may impact our future operations. Risks Relating to the Oil and Natural Gas Industry and Our Business A substantialSubstantial or extended declinedeclines in oil, NGLs and natural gas prices may adversely affect our business, financial condition, cash flow, liquidity or results of operations and our ability to meet our capital expenditure obligations and financial commitments and to implement our business strategy.
The price we receive for our oil, NGLs and natural gas production directly affects our revenues, profitability, access to capital and future rate of growth. Oil, NGLs and natural gas are commodities and are subject to wide price fluctuations in response to relatively minor changes in supply and demand. Lower prices for our oil, NGLs and natural gas production may not only decrease our revenues on a per unit basis but may also reduce the amount of oil, NGLs and natural gas that we can produce economically. Historically, the markets for oil, NGLs and natural gas have been volatile and will likely continue to be volatile in the future. The prices we receive for our production and the volume of our production depend on numerous factors beyond our control. These factors include the following: · | changes in global supply and demand for oil, NGLs and natural gas; |
the actions of the Organization of Petroleum Exporting Countries;
· | the actions of the Organization of Petroleum Exporting Countries (“OPEC”); |
· | the price and quantity of imports of foreign oil, NGLs, natural gas and liquefied natural gas; |
· | acts of war, terrorism or political instability in oil producing countries; |
· | political conditions and events, including embargoes, affecting oil-producing activities; |
10
· | the level of global oil and natural gas exploration and production activities; |
· | the level of global oil, NGLs and natural gas inventories; |
· | technological advances affecting energy consumption; |
· | the price and availability of alternative fuels; and |
· | geographic differences in pricing. |
The prices of crude oil, domestic natural gas and liquefied natural gas; actsNGLs have declined substantially since June 2014. The price of war, terrorism or political instabilityWest Texas Intermediate (“WTI”) crude oil has decreased from $107 per barrel in oil producing countries;
political conditions and events, including embargoes, affecting oil-producing activity;
the levelmiddle of globalJune 2014 to as low as $44 per barrel in January 2015. This decrease in prices has impacted all oil and natural gas exploration and production activity; the level of global oil, NGLs and natural gas inventories;
technological advances affecting energy consumption;
the price and availability of alternative fuels; and
geographic differences in pricing.
Lower prices for our oil, NGLs and natural gas production may not only decrease our revenuesproducers to varying degrees depending on a per unit basis but may also reduce the amount of oil, NGLs and natural gas that we can produce economically. For example, the prices of oil and natural gas declined substantially during the second half of 2008 and impacted production volumes.hedging strategies. Natural gas and NGLs prices have been negatively affected by excess natural gas production, high levels of stored natural gas and weather conditions affecting demand. In recent months, Henry Hub spot prices for natural gas have declined to prices lower than $3.00 per Mcf compared to average prices during 2014 in excess of $4.00 per Mcf. There have been significant recent development activities in shale and other resource plays, which have the potential to yield a significant amount of natural gas and NGLs production, as well as natural gas and NGLs produced in connection with increased domestic oil drilling activities. The potential increases in natural gas supplies resulting from the large-scale development of these unconventional resource reserves could continue to have an adverse impact on the price of natural gas and NGLs. An environment of depressedfurther or continued lower oil, NGLs and natural gas prices would materially and adversely affect our future business, financial condition, results of operations, liquidity and/or ability to finance planned capital expenditures.
If oil, NGLs and natural gas prices stay at their current levels or decrease further, we maywill likely be required to write down the carrying values and/or the estimates of total reserves of our oil and natural gas properties. Accounting rules applicable to us require that we periodically review the carrying value of our oil and natural gas properties for possible impairment. Based on specific market factors and circumstances at the time of prospective impairment reviews and the continuing evaluation of development plans, production data, economics and other factors, we maywill likely be required to write down the carrying value of our oil and natural gas properties. A write-down constitutesSuch write-downs constitute a non-cash charge to earnings. Primarily as a resultImpairment of proved properties under our full cost oil and gas accounting method is largely driven by the present values of future net revenues of proved reserves estimated using SEC mandated 12-month unweighted first-day-of-the-month commodity prices. Since oil, gas and NGLs prices did not decline in 2014 until after June 2014, and more prominently in the fourth quarter of 2014, the impact of the significant declinerecent pricing downturns will continue to adversely affect our SEC average pricing as recent and current prices roll into the SEC average prices used in both oil and natural gas prices asevaluating impairment of December 31, 2008,our proved reserves under the full cost accounting “ceiling test”. While we recorded ahave not had any ceiling test impairment at December 31, 2008 of $1.2 billion. Additionally, we recorded a ceiling test impairment at March 31,impairments since 2009, of $218.9 million primarily as a result of asustained current prices or further declinedeclines in natural gas prices as of March 31, 2009. We did not have any impairment write-downs in 2012, 2011 or 2010. Declines infor oil, NGLs and natural gas will likely result in future ceiling test impairments. You should not assume that the $2.6 billion present value of future net revenues, PV-10, from our proved oil and natural gas reserves shown elsewhere in this document is the current market value of our estimated oil and natural gas reserves. (PV-10 is not a financial measure defined under GAAP. For additional information about our proved reserves and a reconciliation of PV-10 to the standardized measure of discounted future net cash flows, see Properties – Proved Reserve under Part I, Item 2 in this Form 10-K.) In accordance with SEC requirements, we base the estimated discounted future net cash flows from our proved reserves on the 12-month unweighted first-day-of-the-month average price for each product and costs in effect on the date of the estimate. Actual future prices afterand costs may differ materially from those used in the present value estimate. For example, the average price used in the standardized measure of discounted cash flows for December 31, 2012 may require us to record additional ceiling test impairments2014 for crude oil was $91.12 per barrel and the average price of WTI crude oil in the future.December 2014 was $59.29 per barrel. No assurance can be given that we will not experience a ceiling test impairmentimpairments in future periods, which could have a material adverse effect on our results of operations in the periodperiods taken. As a result of lower oil, NGLs and natural gas prices, we may also reduce our estimates of the reservesreserve volumes that may be economically recovered, which would reduce the total value of our proved reserves. SeeManagement’s Discussion and Analysis of Financial Condition and Results of Operations – Critical Accounting Policies – Impairment of oil and natural gas propertiesin under Part II, Item 7 andFinancial Statements and Supplementary Data – Note 1 – Significant Accounting Policiesinunder Part II, Item 8 ofin this Form 10-K for additional information on the ceiling test. We may be limited in our ability to maintain proved undeveloped reserves under current SEC guidance. Current SEC guidance requires proved undeveloped reserves may only be classified as such if a development plan has been adopted indicating that they are scheduled to be drilled within five years of the date of booking. This rule may limit our potential to book additional proved undeveloped reserves as we pursue our drilling program. If current low price conditions persist, we also may be compelled to further postpone the drilling of proved undeveloped reserves until prices recover. Further, if we postpone drilling of proved undeveloped reserves beyond this five-year development horizon, we may have to write off reserves previously recognized as proved undeveloped. 11
As of December 31, 2014, approximately 31% of our total proved reserves were undeveloped and approximately 12% of our total proved reserves were developed non-producing. There can be no assurance that all of those reserves will ultimately be developed or produced. Our undeveloped proved reserves and developed non-producing proved reserves require additional expenditures and/or activities to convert these into producing reserves. We cannot provide assurance these expenditures will be made and that activities will be entirely successful in converting these reserves. Additionally, we are not the operator for approximately 17% of our undeveloped proved reserves and approximately 11% of our proved developed non-producing reserves, so we may not be in a position to control the timing of all development activities. Furthermore, there can be no assurance that all of our undeveloped and developed non-producing reserves will ultimately be produced during the time periods we have planned, at the costs we have budgeted, or at all, which could result in the write-off of previously recognized reserves. Relatively short production periods for our Gulf of Mexico properties subject us to high reserve replacement needs and require significant capital expenditures to replace our reserves at a faster rate than companies whose reserves have longer production periods. Our failure to replace those reserves would result in decreasing reserves, production and cash flows over time. Unless we conduct successful development and exploration activities at sufficient levels or acquire properties containing proved reserves, our proved reserves will decline as those reserves are produced. Producing oil and natural gas reserves are generally characterized by declining production rates that vary depending upon reservoir characteristics and other factors. High production rates generally result in recovery of a relatively higher percentage of reserves during the initial few years of production. The majority of our current production is from the Gulf of Mexico. Reserves in the Gulf of Mexico generally decline more rapidly than from reserves in many other producing regions of the United States. Our independent petroleum consultant estimates that 42% of our total proved reserves will be depleted within three years. As a result, our need to replace reserves and production from new investments is relatively greater than that of producers who recover lower percentages of their reserves over a similar time period, such as those producers who have a larger portion of their reserves in areas other than the Gulf of Mexico. We may not be able to develop, find or acquire additional reserves in sufficient quantities to sustain our current production levels or to grow production beyond current levels. In addition, due to the significant time requirements involved with exploration and development activities, particularly for wells in the deepwater or wells not located near existing infrastructure, actual oil and natural gas production from new wells may not occur, if at all, for a considerable period of time following the commencement of any particular project. Significant capital expenditures are required to replace our reserves. If we are not able to replace reserves, we will not be able to sustain production at current levels. Our future success depends largely upon our ability to find, develop or acquire additional oil and natural gas reserves that are economically recoverable. Unless we replace the reserves we produce through successful exploration, development or acquisition activities, our proved reserves and production will decline over time. Our exploration, development and acquisition activities require substantial capital expenditures. Historically, we have funded our capital expenditures and acquisitions with cash on hand, cash provided by operating activities, securities offerings and bank borrowings. The capital markets we have historically accessed are currently constrained, but we believe we could access other capital markets if the need arises. These limitations in the capital markets may affect our ability to grow and changes in our capitalization structure may significantly affect our financial risk profile. Furthermore, we cannot be certain that financing for future capital expenditures will be available if needed, and to the extent required, on acceptable terms. For additional financing risks, see “– Risks Related to Financings.” Future cash flows are subject to a number of variables, such as the level of production from existing wells, the prices of oil, NGLs and natural gas, and our success in developing and producing new reserves. Any reductions in our capital expenditures to stay within internally generated cash flow (which could be adversely affected by declining commodity prices) and cash on hand will make replacing produced reserves more difficult. If our cash flow from operations and cash on hand are not sufficient to fund our capital expenditure budget, we may be limited in our ability to access additional debt, equity or other methods of financing on an economic or timely basis to replace our proved reserves. Lower oil and natural gas prices could negatively impact our ability to borrow. As of December 31, 2014, borrowing availability under our revolving bank credit facility was $750 million, less outstanding borrowings of $447 million and letters of credit of less than $1 million, resulting in net availability of $302 million. Availability is determined semi-annually by our lenders and is based on oil, NGLs and natural gas prices and on our proved reserves. Substantially all of our oil and natural gas properties are pledged as collateral under the Fifth Amended and Restated Credit Agreement (the “Credit Agreement”) governing our revolving bank credit facility. The Credit Agreement limits our ability to incur additional indebtedness based on specified financial covenants, ratios or other criteria. Sustained and/or lower oil, NGLs and natural gas prices in the future could result in a reduction in credit availability and also affect our ability to satisfy these covenants, ratios or other criteria and thus could reduce our ability to incur additional indebtedness and our ability to replace reserves. 12
The Company could payface additional penalties and certain operating activities could be restrictedrequirements if it does not comply with the terms of an agreement with certain government entities.its probation. The United States Attorney’s Office for the Eastern District of Louisiana, along with the Criminal Investigation Division of the EPA conducted a federal grand jury investigation beginning in late 2010 of environmental compliance matters relating to surface discharges and reporting on four of our offshore platforms
in the Gulf of Mexico in 2009. In December 2012, an agreement was reached that resolves these environmental violations and the agreement was approved by the federal district court in January 2013. Under the agreement, the Company onOn January 3, 2013, the Company (i) pled guilty to one felony count under the Clean Water Act for altering monthly produced water discharge samples for the Ewing Banks 910 platform in 2009 and one misdemeanor count under the Clean Water Act for negligently dischargingfailure to report the discharge of a small amount of oil from the same platform in November 2009, and (ii) paid a $0.7 million fine and $0.3 million for community service and (iii) entered into an environmental compliance program subject to a third-party audit. Under the agreement, the Company was placed on a three-year term of probation.probation, which ends on January 3, 2016. The probation terms require that the Company: a)Company commit no further criminalenvironmental law violations, b) pay in full amounts pursuant to the agreement, c) comply with an Environmental Compliance Plan during the probation period and d) take no adverse action against personnel who cooperated in the investigation. The agreement further stipulates that the Government will not seek any further criminal charges against the Company in this matter. Failure to comply with the terms of the agreement could lead to further penaltiesadditional requirements and/or operating restrictions.
The Company is respondingMore stringent regulatory initiatives relating to a qui tam action filed under the Federal False Claims Act which could have a material adverse effect upon us.
On September 21, 2012, we were served with a complaint in aqui tam action filed under the federal False Claims Act by an employee of a Company contractor. The lawsuit,United States ex rel. Comeaux v. W&T Offshore, Inc., et al.; CA No. 10-494, was filed in the United States District Court for the Eastern District of Louisiana, against the Company and three other working interest owners related to claims associated with three of the Company’s operated production platforms. Aqui tam action, also known as a “whistleblower” action, is a lawsuit brought by a private citizen seeking civil penalties or damages against a person or company on behalf of the government for alleged violations of law. If the claims are successful, the person filing the suit may recover a percentage of the damages or penalty from the lawsuit as a reward for exposing a wrongdoing and recovering funds on behalf of the government. The complaint was originally filed in 2010 but kept under confidential seal in order for the federal government to decide if it wished to intervene and take over the prosecution of thequi tam action. The government declined to intervene in this suit and the complaint was unsealed and made public in June 2012, thereby giving the plaintiff the opportunity to pursue the claims on behalf of the government.
The complaint alleges that environmental violations at three of our operated production platforms in the Gulf of Mexico violate the federal offshore lease provisions so that we, among other things, wrongfully retained benefits under the applicable leases. The alleged environmental violations include allegations of discharges of relatively small amounts of oil into the Gulf of Mexico, the failure to report and record such discharges, and falsification of certain produced water samples and related reports required under federal law. The events are alleged to have occurred in 2009. These are largely the same allegations involved in the federal grand jury investigation described above. We have filed a motion to dismiss the claim. The plaintiff dismissed his claims against the three other working interest owners after they filed motions to dismiss. The plaintiff conceded that certain of his claims should be dismissed in his reply to the Company’s motion to dismiss. The motion remains pending before the court.
The Company has been sued by certain landowners alleging damages to their properties.
Since 2009, certain Cameron Parish landowners have filed suits in the 38th Judicial District Court, Cameron Parish, Louisiana against the Company and Tracy W. Krohn as well as several other defendants unrelated to us. In their lawsuits, plaintiffs are alleging that property they own has been contaminated or otherwise damaged by the defendants’ oil and gas exploration and production activities may have an adverse effect on our results of operations, financial position and are seeking compensatory and punitive damages. During 2012, we settled claims with certain landowners and paid $10.0 million. We assessed the remaining claims to be probable and have accrued $1.3 million in our contingent liabilities as of December 31, 2012. However, we cannot state with certainty that our estimates of additional exposure are accurate concerning this matter.
BP’s Deepwater Horizon explosion and ensuing oil spill could have broad adverse consequences affecting our operations in the Gulf of Mexico, some of which may be unforeseeable.liquidity.
In April 2010, there was a fire and explosion aboard the Deepwater Horizon drilling platform operated by BP in the deep water of the Gulf of Mexico. As a result of the explosion and ensuing fire, the rig sank, causing loss of life, and created a major oil spill that produced economic, environmental and natural resource damage in the Gulf Coast region. In response to the explosion and spill, there have been many proposals, and substantial rules adopted, by governmental and private constituencies to address the direct impact of the disaster and to prevent similar disasters in the future. Beginning in May 2010,The federal government, acting through the U.S. Department of the Interior and its implementing agencies that have since evolved into the present day BOEM and BSEE, has issued a series ofvarious rules, NTLs imposing a variety of newand temporary drilling moratoria. These rules and requirements impose or result in added environmental and safety measures upon exploration, development and permitting requirements. They also imposed a six-month moratorium on drilling activities in federal offshore waters that stretched into a much longer moratorium resulting in delays in not only deepwater drilling but also in many other types of activitiesproduction operators in the Gulf of Mexico that continueincluding the following: · | The Environmental NTL, which imposes new and more stringent requirements for documenting the environmental impacts potentially associated with the drilling of a new offshore well and significantly increases oil spill response requirements. |
· | The Compliance and Review NTL, which imposes requirements for operators to secure independent reviews of well design, construction and flow intervention processes, and also requires certifications of compliance from senior corporate officers. |
· | The Drilling Safety Rule, which prescribes tighter cementing and casing practices, imposes standards for the use of drilling fluids to maintain well bore integrity, and stiffens oversight requirements relating to blowout preventers and their components, including shear and pipe rams. |
· | The Workplace Safety Rule requires operators to employ a comprehensive safety and environmental management system (“SEMS”). The purpose of SEMS is to reduce human and organizational errors as root causes of work-related accidents and offshore spills; develop protocols as to who at the facility has the ultimate operational safety and decision-making authority; establish procedures to provide all personnel with “stop work” authority; and, to have their SEMS periodically audited by an independent third party auditor approved by BSEE. |
These new regulatory initiatives may serve to exist currently. In addition toeffectively slow down the pace of drilling restrictions, new safety measures and permitting requirements already issued by the BOEM and BSEE, there have been numerous additional proposed changes in laws, regulations, guidance and policy in response to the Deepwater Horizon explosion and oil spill that could affect our operations and cause us to incur substantial losses or expenditures. Implementation of any one or more of the various proposed responses to the disaster could materially adversely affectproduction operations in the Gulf of Mexico by raisingdue to adjustments in operating costs, increasing insurance premiums, delaying drilling operationsprocedures and increasing regulatory costs, and, further, couldcertification practices as well as increased lead to a wide variety of other unforeseeable consequences that make operations in the Gulf of Mexico more difficult, more time consuming, and more costly. For example, a variety of amendments to the OPA have been proposed in response to the Deepwater Horizon incident. OPA and regulations adopted pursuant to OPA impose a variety of requirements related to the prevention of and response to oil spills into waters of the United States, including the OCS, which includes the Gulf of Mexico where we have substantial offshore operations. OPA subjects operators of offshore leases and owners and operators of oil handling facilities to strict, joint and several liability for all containment and cleanup costs and certain other damages arising from a spill, including, but not limited to, the costs of responding to a release of oil, natural resource damages, and economic damages suffered by persons adversely affected by an oil spill. OPA also requires operators to provide evidence of financial responsibility to cover costs that could be incurred in responding to an oil spill. We are currently required to demonstrate, on an annual basis, that we have ready access to $150 million that can be used to respond to an oil spill from our facilities on the OCS. Legislation has been proposed in Congress to amend OPA to increase the minimum level of financial responsibility to $300 million or more. If the minimum level of financial responsibility is increased further, we may experience difficulty in providing financial assurances sufficient to comply with the revised requirement. We cannot predict at this time whether OPA will be amended or whether the level of financial responsibility required for companies operating on the OCS will be increased further.
Other significant regulatory changes since the Deepwater Horizon event are regulations related to assessing the potential environmental impact of future spills using worse case discharge scenarios on a well-by-well basis, spill response documentation, compliance reviews, operator practices related to safety and implementing a safety and environmental management system. The new regulations and increased review process increases the time it takestimes to obtain exploration and production plan reviews, develop drilling permitsapplications, and increases the cost of operations. As theseapply for and receive new regulations and guidance continue to evolve, the risk to our business may be increased. The permitting process is slower and inconsistent for deep water work, shallow water work and even for plug and abandonment activities. This could lead to increased costs and performing work at less than optimal effectiveness. We have not experienced delays in obtaining permits related to our onshore operations.
Regulatory requirements, NTLs and permitting procedures imposed by the BOEM and BSEE could significantly delay our ability to obtain permits to drill new wells in offshore waters.
Subsequent to the BP Deepwater Horizon incident in the U.S. Gulf of Mexico in April 2010, the BOEM and BSEE issued a series of NTLs imposing new requirements and permitting procedures for new wells to be drilled in federal waters of the OCS.well permits. These new requirements include the following:
The Environmental NTL, which imposes new and more stringent requirements for documenting the environmental impacts potentially associated with the drilling of a new offshore well and significantly increases oil spill response requirements.
The Compliance and Review NTL, which imposes requirements for operators to secure independent reviews of well design, construction and flow intervention processes, and also requires certifications of compliance from senior corporate officers.
The Drilling Safety Rule, which prescribes tighter cementing and casing practices, imposes standards for the use of drilling fluids to maintain well bore integrity, and stiffens oversight requirements relating to blowout preventers and their components, including shear and pipe rams.
The Workplace Safety Rule, which requires operators to employ a comprehensive safety and environmental management system (“SEMS”) in order to reduce human and organizational errors as root causes of work-related accidents and offshore spills and to have their SEMS periodically audited by an independent third party auditor approved by BSEE.
As a result of the issuance of these new NTLs and the new regulatory requirements, the BOEM has been taking longer to review and approve permits for new wells than was common prior to the Deepwater Horizon incident. These NTLs also increase the cost of preparing each permit applicationapplications and will increase the cost of each new well, particularly for wells drilled in deeper watersthe deepwater on the OCS. The delayWe could become subject to fines, penalties or orders requiring us to modify or suspend our operations in granting permitsthe Gulf of Mexico if we fail to comply with these requirements. Moreover, if similar oil spill incidents were to occur in the future in the Gulf of Mexico or elsewhere where we conduct operations, the relevant governmental authorities could also cause someelect to again issue directives to temporarily cease drilling activities. In any event, they may from time to time issue further safety and environmental regulatory initiatives regarding offshore oil and gas exploration and development activities, which any one or more of such events could have a material adverse effect on our leases to lapseproduction activities as a resultwell as our financial position, results of failure to commence drilling or continue production operations.operations and liquidity.
New requirements13
Requirements imposed by the BOEM and BSEE related to the decommissioning, plugging, and abandonment of offshore facilities could significantly impact the cost of operating our business. In addition to the NTLs discussed previously, the BOEM issued NTL No. 2010-G05 dated effective October 15, 2010 that establishes a more stringent regimen for the timely decommissioning of what is known as “idle iron” – wells, platforms and pipelines that are no longer producing or serving exploration or support functions related to an operator’s lease – in the Gulf of Mexico. This NTL sets forth more stringent standards for decommissioning timing requirements by requiring that any well that has not been used during the past five years for exploration or production on active leases and is no longer capable of producing in paying quantities must be permanently plugged or temporarily abandoned within three years. Plugging or abandonment of wells may be delayed by two years if all of the well’s hydrocarbon and sulfur zones are appropriately isolated. Similarly, platforms or other facilities thatwhich are no longer useful for operations must be removed within five years of the cessation of operations.Theoperations. The triggering of these plugging, abandonment and removal activities under what may be viewed as an accelerated schedule in comparison to historical decommissioning efforts which could cause an increase, perhaps materially, in our future plugging, abandonment and removal costs, which may translate into a need to increase our estimate of future ARO required to meet such increased costs. In 2010, we increasedWe have continued to review and revise our estimate of ARO based on our expected acceleration in timing for such obligations as a result of implementing this NTL. In 2012, after receiving further interpretations of the regulations from the BOEM, the scope of the work increased and the determination of final requirements increased the amount of work involved. As a resultestimates each year following BOEM’s issuance of this effort, along with other work scope changes, we increased our estimate of ARO again in 2012.NTL. The increase in decommissioning activity in the Gulf of Mexico expected over the next few years as a result of the NTL may result in increased demand for salvage contractors and equipment, resulting in increased estimates of plugging, abandonment and removal costs and increases in related ARO. To cover the various obligations of lessees on the OCS, the BOEM generally requires that lessees demonstrate financial strength and reliability according to regulations or post bonds or other acceptable assurances that such obligations will be satisfied. In addition, in August 2014, the BOEM issued an Advanced Notice of Proposed Rulemaking in which the agency indicated that it was considering increasing the financial assurance requirements for companies operating in federal waters. If BOEM were to increase its financial assurance requirements substantially, such action could have a material adverse effect on our business, prospects, results of operations, financial condition, and liquidity. The significant reductions in oil and natural gas pricing since the middle of 2014 may also adversely impact the BOEM’s financial assurance determinations with respect to the Company. The cost of these bonds or assurances can be substantial, and there is no assurance that they can be obtained in all cases. Under some circumstances, the BOEM may require any of our operations on federal leases to be suspended or terminated. Any such suspension or termination could materially adversely affect our financial condition and results of operations. In addition, the BOEM can require supplemental bonding from operators for decommissioning, plugging, and abandonment liabilities if financial strength and reliability criteria are not met. Recently proposedProposed rules regulating air emissions from oil and gas operations could cause us to incur increased capital expenditures and operating costs.
In August 2012, theThe EPA has adopted new regulations under the CAA that, among other things, require additional emissions controls for the production of oil, NGLs and natural gas, and NGLs production, including New Source Performance Standards to address emissions of sulfur dioxide and VOCs and a separate set of emission standards to address hazardous air pollutants frequently associated with such production activities. The final regulations require, among other things, the reduction of VOC emissions from natural gas wells through the use of reduced emission completions or “green completions” on all hydraulically fractured wells constructed or refractured after January 1, 2015. For well completion operations occurring at such well sites before January 1, 2015, the final regulations allow operators to capture and direct flowback emissions to completion combustion devices, such as flares, in lieu of performing green completions. These regulations also establish specific new requirements regarding emissions from dehydrators, storage tanks and other production equipment. Compliance with these requirements could significantly increase our costs of development and production.
Lower oil and natural gas prices could negatively impact our ability to borrow.
As of December 31, 2012, available borrowings under our revolving bank credit facility are currently limited to $725.0 million, less outstanding borrowings and letters of credit. Availability is determined semi-annually by our lenders and is based on oil, NGLs and natural gas prices and on our proved reserves. Substantially all of our oil and natural gas properties are pledged as collateral under the credit agreement governing our revolving bank credit facility (the “Credit Agreement”). The Credit Agreement limits our ability to incur additional indebtedness based on specified financial covenants, ratios or other criteria. Lower oil, NGLs and natural gas prices in the future could result in a reduction in credit availability and also affect our ability to satisfy these covenants, ratios or other criteria and thus could reduce our ability to incur additional indebtedness and our ability to replace reserves.
Losses and liabilities from uninsured or underinsured drilling and operating activities could have a material adverse effect on our financial condition and operations. We could be exposed to uninsured losses in the future. The occurrence of a significant accident or other event not covered in whole or in part by our insurance could have a material adverse impact on our financial condition and operations. Our insurance does not protect us against all operational risks. We do not carry business interruption insurance. In May and June 2012,2014, we renewed our insurance policies covering well control, and hurricane damage, at an annual cost of approximately $30.6 million. A retention amount of $5.0 million for well control eventsgeneral liability and $40.5 million per hurricane occurrence must be satisfied by us beforepollution. These policies reduce, but do not totally mitigate, our risk as we are indemnifiedexposed to amounts for losses.retention and co-insurance, limits on coverage and some events that are not insured. These policies expire in May and June 2015. We also have other smaller per-occurrence retention amounts for various other events. In addition, pollution and environmental risks are generally not fully insurable, as gradual seepage and pollution are not covered under our policies. Because third-party drilling contractors are used to drill our wells, we may not realize the full benefit of workmen’s compensation laws in dealing with their employees. For some risks, we may not obtain insurance if we believe the cost of available insurance is excessive relative to the risks presented. See SeeManagement’s Discussion and Analysis of Financial StatementsCondition and Results of Operations – Note 3Liquidity and Capital Resources – Hurricane Remediation, and Insurance Claims and – Note 18 – ContingenciesInsurance Coverageunder Part II, Item 8 of7 in this Form 10-K for additional information on legal issues regarding our insurance coverage. 14
Insurance for well control and hurricane damage may become significantly more expensive for less coverage, and some losses currently covered by insurance may not be covered in the future. Due to insurance claims in recent years associated with hurricanes in the Gulf of Mexico and global catastrophic losses, property damage and well control insurance coverage has become more limited and the cost of such coverage has become both more costly and more volatile. The insurance market may change dramatically in the future due to the major oil spill that occurred in 2010 at BP’s Macondo well in the deepwater Gulf of Mexico. As of December 31, 2012, approximately 91%2014, virtually all of our PV-10 value of proved reserves attributable to our Gulf of Mexico properties is on platforms that are covered under our current insurance policies for named windstorm damage. Our insurers may not continue to offer us the type and level of our current coverage, or our costs may increase substantially as a result of increased premiums and there could be an increased risk of uninsured losses that may have been previously insured. We are also exposed to the possibility that in the future we will be unable to buy insurance at any price or that if we do have claims, the insurance companies will not pay our claims. The occurrence of any or all of these possibilities could have a material adverse effect on our financial condition and results of operations. We are also exposed to the possibility that in the future we will be unable to buy insurance at any price or that if we do have a claim, the insurance companies will not pay our claim. Commodity derivative positions may limit our potential gains. In order to manage our exposure to price risk in the marketing of our oil and natural gas, we may periodically enter into oil and natural gas price commodity derivative positions with respect to a portion of our expected production. While these commodity derivative positions are intended to reduce the effects of volatile oil and natural gas prices, they may also limit future income if oil and natural gas prices were to rise substantially over the price established by such positions. In addition, such transactions may expose us to the risk of financial loss in certain circumstances, including instances in which: · | our production is less than expected; |
· | there is a widening of price differentials between delivery points for our production and the delivery points assumed in the hedge arrangements; or |
· | the counterparties to the derivative contracts fail to perform under the terms of the contracts. |
there is a widening of price differentials between delivery points for our production and the delivery points assumed in the hedge arrangements; or
the counterparties to the derivative contracts fail to perform under the terms of the contracts.
See SeeFinancial Statements –and Supplementary Data– Note 6 – Derivative Financial Instrumentsunder Part II, Item 8 ofin this Form 10-K for additional information on derivative transactions. We may be limited in our ability to maintain proved undeveloped reserves under current SEC guidance.
Current SEC guidance requires proved undeveloped reserves may only be classified as such if a development plan has been adopted indicating that they are scheduled to be drilled within five years of the date of booking. This rule may limit our potential to book additional proved undeveloped reserves as we pursue our drilling program. Further, if we postpone drilling of proved undeveloped reserves beyond this five-year development horizon, we may have to write off reserves previously recognized as proved undeveloped.
As of December 31, 2012, approximately 26% of our total proved reserves were undeveloped and approximately 21% of our total proved reserves were developed non-producing. There can be no assurance that all of those reserves will ultimately be developed or produced.
We are not the operator with respect to approximately 14% of our proved developed non-producing reserves, so we may not be in a position to control the timing of all development activities. Furthermore, there can be no assurance that all of our undeveloped and developed non-producing reserves will ultimately be produced during the time periods we have planned, at the costs we have budgeted, or at all, which could result in the write-off of previously recognized reserves.
If we are not able to replace reserves, we will not be able to sustain production at current levels.
Our future success depends largely upon our ability to find, develop or acquire additional oil and natural gas reserves that are economically recoverable. Unless we replace the reserves we produce through successful exploration, development or acquisition activities, our proved reserves and production will decline over time. By their nature, estimates of undeveloped reserves are less certain. Recovery of undeveloped reserves could require
significant capital expenditures and successful drilling operations. Our future oil and natural gas reserves, production, and therefore our cash flow and net income, are highly dependent on our success in efficiently developing our current reserves and economically finding or acquiring additional recoverable reserves.
Relatively short production periods for our Gulf of Mexico properties subject us to high reserve replacement needs and require significant capital expenditures to replace our reserves at a faster rate than companies whose reserves have longer production periods. Our failure to replace those reserves would result in decreasing reserves, production and cash flows over time.
Unless we conduct successful development and exploration activities at sufficient levels or acquire properties containing proved reserves, our proved reserves will decline as those reserves are produced. Producing oil and natural gas reserves are generally characterized by declining production rates that vary depending upon reservoir characteristics and other factors. High production rates generally result in recovery of a relatively higher percentage of reserves during the initial few years of production. The majority of our current production is from the Gulf of Mexico. Production from reservoirs in the Gulf of Mexico generally decline more rapidly than from reservoirs in many other producing regions of the United States. Our independent petroleum consultant estimates that, on average, 43% of our total proved reserves are depleted within three years. As a result, our need to replace reserves and production from new investments is relatively greater than that of producers who recover lower percentages of their reserves over a similar time period, such as those producers who have a larger portion of their reserves in areas other than the Gulf of Mexico. We may not be able to develop, find or acquire additional reserves in sufficient quantities to sustain our current production levels or to grow production beyond current levels. In addition, due to the significant time requirements involved with exploration and development activities, particularly for wells in the deepwater or wells not located near existing infrastructure, actual oil and natural gas production from new wells may not occur, if at all, for a considerable period of time following the commencement of any particular project.
Significant capital expenditures are required to replace our reserves.
Our exploration, development and acquisition activities require substantial capital expenditures. Historically, we have funded our capital expenditures and acquisitions with cash on hand, cash provided by operating activities, securities offerings and bank borrowings. In order to finance future capital expenditures, we may need to alter or increase our capitalization substantially through the issuance of additional debt or equity securities, bank borrowings, reserve-based loans, joint ventures or other means. These changes in capitalization may significantly affect our financial risk profile.
Future cash flows are subject to a number of variables, such as the level of production from existing wells, the prices of oil, NGLs and natural gas, and our success in developing and producing new reserves. Any reductions in our capital expenditures to stay within internally generated cash flow (which could be adversely affected by declining commodity prices) and cash on hand will make replacing produced reserves more difficult. If our cash flow from operations and cash on hand are not sufficient to fund our capital expenditure budget, we may not be able to access additional debt, equity or other methods of financing on an economic or timely basis to replace our proved reserves.
Competition for oil and natural gas properties and prospects is intense; some of our competitors have larger financial, technical and personnel resources that may give them an advantage in evaluating and obtaining properties and prospects. We operate in a highly competitive environment for reviewing prospects, acquiring properties, marketing oil, NGLs and natural gas and securing trained personnel. Many of our competitors have financial resources that allow them to obtain substantially greater technical expertise and personnel than we have. We actively compete with other companies in our industry when acquiring new leases or oil and natural gas properties. For example, new leases acquired from the BOEM are acquired through a “sealed bid” process and are generally awarded to the highest bidder. Our competitors may be able to evaluate, bid for and purchase a greater number of properties and prospects than our financial or personnel resources permit. Our competitors may also be able to pay more for productive oil and natural gas properties and exploratory prospects than we are able or willing to pay. On the acquisition opportunities made available to us, we compete with other companies in our industry for such properties through a private bidding process, direct negotiations or some combination thereof. Our ability to acquire additional prospects and to find and develop reserves in the future will depend on our ability to evaluate and select suitable properties and to consummate transactions in a highly competitive environment. If we are unable to compete successfully in these areas in the future, our future revenues and growth may be diminished or restricted. The availability of properties for acquisition depends largely on the divesting practices of other oil and natural gas companies, commodity prices, general economic conditions and other factors we cannot control or influence. Additional requirements and limitations recently imposed on us may put us at a competitive disadvantage for acquiring properties. These risks are described above in the risk factor entitled: Requirements imposed by the BOEM and BSEE related to the decommissioning, plugging, and abandonment of offshore facilities could significantly impact the cost of operating our business. 15
We conduct exploration, development and production operations on the deep shelf and in the deepwater of the Gulf of Mexico, which presents unique operating risks. The deep shelf and the deepwater of the Gulf of Mexico are areas that have had less drilling activity due, in part, to their geological complexity, depth and higher cost to drill and ultimately develop. There are additional risks associated with deep shelf and deepwater drilling that could result in substantial cost overruns and/or result in uneconomic projects or wells. Deeper targets are more difficult to interpret with traditional seismic processing. Moreover, drilling costs and the risk of mechanical failure are significantly higher because of the additional depth and adverse conditions, such as high temperature and pressure. For example, the drilling of deepwater wells requires specific types of rigs with significantly higher day rates and limited availability, as compared to the rigs used in shallower water. Deepwater wells have greater mechanical risks because the wellhead equipment is installed on the sea floor. Deepwater development costs can be significantly higher than development costs for wells drilled on the conventional shelf because deepwater drilling requires larger installation equipment, sophisticated sea floor production handling equipment, expensive state-of-the-art platforms and/orand investment in infrastructure. Deep shelf development can also be more expensive than conventional shelf projects because deep shelf development requires more drilling days and higher drilling and service costs due to extreme pressure and temperatures associated with greater depths. Accordingly, we cannot assure you that our oil and natural gas exploration activities in the deep shelf, the deepwater and elsewhere will be commercially successful. Our estimates of future asset retirement obligations may vary significantly from period to period and are especially significant because our operations are concentrated in the Gulf of Mexico. We are required to record a liability for the present value of our ARO to plug and abandon inactive non-producing wells, to remove inactive or damaged platforms, facilities and equipment, and to restore the land or seabed at the end of oil and natural gas production operations. These costs are typically considerably more expensive for offshore operations as compared to most land-based operations due to increased regulatory scrutiny and the logistical issues associated with working in waters of various depths. Estimating future restoration and removal costs in the Gulf of Mexico is especially difficult because most of the removal obligations may be many years in the future, regulatory requirements are subject to change or more restrictive interpretation, and asset removal technologies are constantly evolving, which may result in additional or increased costs. As a result, we may make significant increases or decreases to our estimated ARO in future periods. For example, because we operate in the Gulf of Mexico, platforms, facilities and equipment are subject to damage or destruction as a result of hurricanes. The estimated cost to plug and abandon a well or dismantle a platform can change dramatically if the host platform from which the work was anticipated to be performed is damaged or toppled rather than structurally intact. Accordingly, our estimate of future ARO could differ dramatically from what we may ultimately incur as a result of platform damage. As described above in the risk factor titled “New requirements recently imposed by the BOEM and BSEE related to the decommissioning, plugging, and abandonment of offshore facilities could significantly impact the cost of operating our business,” the BOEM’s NTL 2010-G05 increased our liability for ARO by accelerating the time frame for plugging, abandonment and removal for some of our platforms and the BOEM further increased our liability after issuing regulation interpretations which affected scope and requirements. In addition, the potential increase in decommissioning activity in the Gulf of Mexico over the next several years as a result of the NTL could likely result in increased demand for salvage contractors and equipment, resulting in increased estimates of plugging, abandonment and removal costs and increases in related ARO. We may not be in a position to control the timing of development efforts, associated costs or the rate of production of the reserves from our non-operated properties. As we carry out our drilling program, we may not serve as operator of all planned wells. We have limited ability to exercise influence over the operations of some non-operated properties and their associated costs. Our dependence on the operator and other working interest owners and our limited ability to influence operations and associated costs of properties operated by others could prevent the realization of anticipated results in drilling or acquisition activities. The success and timing of exploration and development activities on properties operated by others depend upon a number of factors that will be largely outside of our control, including: · | the timing and amount of capital expenditures; |
· | the availability of suitable offshore drilling rigs, drilling equipment, support vessels, production and transportation infrastructure and qualified operating personnel; |
· | the operator’s expertise and financial resources; |
· | approval of other participants in drilling wells and such participants’ financial resources; |
· | selection of technology; and |
· | the rate of production of the reserves. |
16
the availability of suitable offshore drilling rigs, drilling equipment, support vessels, production and transportation infrastructure and qualified operating personnel;
the operator’s expertise and financial resources;
approval of other participants in drilling wells and such participants’ financial resources;
selection of technology; and
the rate of production of the reserves.
Our business involves many uncertainties and operating risks that can prevent us from realizing profits and can cause substantial losses. Our development activities may be unsuccessful for many reasons, including adverse weather conditions, (such as hurricanes and tropical storms in the Gulf of Mexico), cost overruns, equipment shortages, geological issues and mechanical difficulties. Moreover, the successful drilling of a natural gas or oil well does not assure us that we will realize a profit on our investment. A variety of factors, both geological and market-related, can cause a well to become uneconomical or only marginally economical. In addition to their costs, unsuccessful wells hinder our efforts to replace reserves. Our oil and natural gas exploration and production activities, including well stimulation and completion activities which include, among other things, hydraulic fracturing, involve a variety of operating risks, including: · | blow-outs and surface cratering; |
· | uncontrollable flows of natural gas, oil and formation water; |
· | natural disasters, such as tropical storms, hurricanes and other adverse weather conditions; |
· | inability to obtain insurance at reasonable rates; |
· | failure to receive payment on insurance claims in a timely manner, or for the full amount claimed; |
· | pipe, cement, subsea well or pipeline failures; |
· | casing collapses or failures; |
· | mechanical difficulties, such as lost or stuck oil field drilling and service tools; |
· | abnormally pressured formations or rock compaction; and |
· | environmental hazards, such as natural gas leaks, oil spills, pipeline ruptures, encountering NORM, and discharges of brine, well stimulation and completion fluids, toxic gases, or other pollutants into the surface and subsurface environment. |
If we experience any of these problems, well bores, platforms, gathering systems and processing facilities could be affected, which could adversely affect our ability to conduct operations. We could also incur substantial losses as a result of: · | damage to and destruction of property, natural resources and equipment; |
· | pollution and other environmental damage; |
· | clean-up responsibilities; |
· | regulatory investigation and penalties; |
· | suspension of our operations; |
· | repairs required to resume operations; and |
Offshore operations are also subject to a variety of operating risks related to the marine environment, such as capsizing, collisions and damage or loss from tropical storms, hurricanes or other adverse weather conditions. These conditions can cause substantial damage to facilities and interrupt production. As a result, we could incur substantial liabilities that could reduce or eliminate funds available for exploration, development and acquisitions or result in the loss of property and equipment. 17
The geographic concentration of our properties in the Gulf of Mexico subjects us to an increased risk of loss of revenues or curtailment of production from factors specifically affecting the Gulf of Mexico. The geographic concentration of our properties along the U.S. Gulf Coast and adjacent waters on and beyond the outer continental shelfOCS means that some or all of our properties could be affected by the same event should the Gulf of Mexico experience: · | severe weather, including tropical storms and hurricanes; |
· | delays or decreases in production, the availability of equipment, facilities or services; |
· | changes in the status of pipelines that we depend on for transportation of our production to the marketplace; |
delays or decreases in the availability of capacity to transport, gather or process production; or
· | delays or decreases in the availability of capacity to transport, gather or process production; and |
· | changes in the regulatory environment. |
Because a majority of our properties could experience the same conditions at the same time, these conditions could have a relatively greater impact on our results of operations than they might have on other operators who have properties over a wider geographic area. For example, in 2009, net production of approximately 8.7 Bcfe was deferred as a result of damage caused primarily by Hurricane Ike and, in 2012,2009 and Hurricane Isaac resulted in thecaused net production deferral of approximately 2.9 Bcfe. Bcfe in 2012.As we increase our onshore operations, we will be subject to different risk factors that could impact loss of revenues or curtailment of production for these geographies. Onshore oil and gas exploration and production operations share similar risk factors to offshore, but also have some different regulations, interpretation of regulations and enforcement by the particular state in which the operations are conducted. Until 2011, our experience has primarily been with offshore operations. We are subject to and must comply with the various state regulations and work effectively with the state agencies, and failure to do so may impact our operations. Federal and state legislation and regulatory initiatives relating to hydraulic fracturing could result in increased costs and additional operating restrictions or delays. Hydraulic fracturing is an important and common practice that is used to stimulate production of hydrocarbons from tight rock formations. We utilize hydraulic fracturing techniques in connection with developing our recently acquired Yellow Rose Propertiesproperties in the Spraberry field and other onshore properties. The process involves the injection of water, sand or other proppants and chemicals under pressure into the rock formation to fracture the surrounding rock and stimulate production. The process is typically regulated by state oil and gas commissions. The EPA, however, recently asserted federal regulatory authority over certain hydraulic fracturing activities involving diesel fuel under the SDWA Underground Injection Control Program.Program and issued permitting guidance covering such activities in February 2015. In addition, the EPA has commenced a broad study of the potential environmental effects of hydraulic fracturing activities, and the agency has indicated that it expects to issue its study report in late 2014.2015. A number of other federal agencies, including the U.S. Department of Energy, Department of Interior, and White House Council on Environmental Quality, are also studying various aspects of hydraulic fracturing. TheseThe results of these studies depending on their results, could spur initiatives to regulate hydraulic fracturing under the SDWA or otherwise. Legislation alsoFrom time to time, legislation has been introduced before Congress to provide for federal regulation of hydraulic fracturing and to require disclosure of the chemicals used in the fracturing process. In addition, some states and local governments have adopted, and other states and local governments are considering adopting, regulations that could impose more stringent permitting, disclosure and well construction requirements on hydraulic fracturing operations, including states in which we operate. For example, effective February 1, 2012,in May 2013, the RRC began requiring all operators to disclose on a public website the chemical ingredientsadopted new rules governing well casing, cementing and other standards for ensuring that hydraulic fracturing operations do not contaminate nearby water volumes used to hydraulically fracture wells in Texas.resources. If new laws or regulations that significantly restrict hydraulic fracturing are adopted, such laws could make it more difficult or costly for us to perform fracturing to stimulate production from tight formations. In addition, if hydraulic fracturing becomes regulated at the federal level as a result of federal legislation or regulatory initiatives by the EPA, our fracturing activities could become subject to additional permitting requirements, and also to associated permitting delays and potential increases in costs. Restrictions on hydraulic fracturing could also reduce the amount of oil and natural gas that we are ultimately able to produce from our reserves. 18
Properties that we acquire may not produce as projected and we may be unable to immediately identify liabilities associated with these properties or obtain protection from sellers against them. Our business strategy includes growing by making acquisitions, which may include acquisitions of exploration and production companies, producing properties and undeveloped leasehold interests. Our acquisition of oil and natural gas properties requires assessments of many factors that are inherently inexact and may be inaccurate, including the following: · | acceptable prices for available properties; |
· | amounts of recoverable reserves; |
· | estimates of future oil, NGLs and natural gas prices; |
· | estimates of future exploratory, development and operating costs; |
· | estimates of the costs and timing of plugging and abandonment; and |
· | estimates of potential environmental and other liabilities. |
Our assessment of the acquired properties will not reveal all existing or potential problems, nor will it permit us to become familiar enough with the properties to fully assess their capabilities and deficiencies. In the course of our due diligence, we have historically not physically inspected every well, platform or pipeline. Even if we had physically inspected each of these, our inspections may not have revealed structural and environmental problems, such as pipeline corrosion, well bore issues or groundwater contamination. We may not be able to obtain contractual indemnities from the seller for liabilities associated with such risks. We may be required to assume the risk of the physical condition of the properties in addition to the risk that the properties may not perform in accordance with our expectations. We may encounter difficulties integrating the operations of newly acquired oil and natural gas properties or businesses. Increasing our reserve base through acquisitions is an important part of our business strategy. We may encounter difficulties integrating the operations of newly acquired oil and natural gas properties or businesses. In particular, we may face significant challenges in consolidating functions and integrating procedures, personnel and operations in an effective manner. The failure to successfully integrate such properties or businesses into our business may adversely affect our business and results of operations. Any acquisition we make may involve numerous risks, including: · | a significant increase in our indebtedness and working capital requirements; |
· | the inability to timely and effectively integrate the operations of recently acquired businesses or assets; |
· | the incurrence of substantial unforeseen environmental and other liabilities arising out of the acquired businesses or assets, including liabilities arising from the operation of the acquired businesses or assets before our acquisition; |
· | our lack of drilling history in the geographic areas in which the acquired business operates; |
· | customer or key employee loss from the acquired business; |
· | increased administration of new personnel; |
· | additional costs due to increased scope and complexity of our operations; and |
· | potential disruption of our ongoing business. |
Additionally, significant acquisitions can change the nature of our operations and business depending upon the character of the acquired properties, which may have substantially different operating and geological characteristics or be in different geographic locations than our existing properties. To the extent that we acquire properties substantially different from the properties in our primary operating region or acquire properties that require different technical expertise, we may not be able to realize the economic benefits of these acquisitions as efficiently as with acquisitions within our primary operating region. We may not be successful in addressing these risks or any other problems encountered in connection with any acquisition we may make. 19
Estimates of our proved reserves depend on many assumptions that may turn out to be inaccurate. Any material inaccuracies in the estimates or underlying assumptions will materially affect the quantities of and present value of future net revenues from our proved reserves. The process of estimating oil and natural gas reserves is complex. It requires interpretations of available technical data and many assumptions, including assumptions relating to economic factors. Any significant inaccuracies in these interpretations or assumptions could materially affect the estimated quantities and the calculation of the present value of our reserves at December 31, 2012.2014. SeeManagement’s Discussion and Analysis of Financial Condition and Results of Operations – Critical Accounting Policies – Oil and natural gas reserve quantities, under Part II,Item 7 for a discussion of the estimates and assumptions about our estimated oil and natural gas reserves information reported inBusiness in under Part I, Item 1, Properties in under Part I, Item 2 andFinancial Statements and Supplementary Data – Note 21 – Supplemental Oil and Gas Disclosuresinunder Part II, Item 8 ofin this Form 10-K.10-K. In order to prepare our year-end reserve estimates, our independent petroleum consultant projected our production rates and timing of development expenditures. Our independent petroleum consultant also analyzed available geological, geophysical, production and engineering data. The extent, quality and reliability of this data can vary and may not be under our control. The process also requires economic assumptions about matters such as oil and natural gas prices, operating expenses, capital expenditures, taxes and availability of funds. Therefore, estimates of oil and natural gas reserves are inherently imprecise. Actual future production, oil and natural gas prices, revenues, taxes, development expenditures, operating expenses and quantities of recoverable oil and natural gas reserves will most likely vary from our estimates. Any significant variance could materially affect the estimated quantities and present value of our reserves. In addition, our independent petroleum consultant may adjust estimates of proved reserves to reflect production history, drilling results, prevailing oil and natural gas prices and other factors, many of which are beyond our control. You should not assume that the present value of future net revenues from our proved oil and natural gas reserves is the current market value of our estimated oil and natural gas reserves. In accordance with SEC requirements, we base the estimated discounted future net cash flows from our proved reserves on the 12-month unweighted first-day-of-the-month average price for each product and costs in effect on the date of the estimate.estimate, which prices are not reflective of the substantially lower prices realized in December 2014 and January 2015. Actual future prices and costs may differ materially from those used in the present value estimate. Prospects that we decide to drill may not yield oil or natural gas in commercial quantities or quantities sufficient to meet our targeted rate of return. A prospect is an area of land in which we own an interest, could acquire an interest or have operating rights, and have what our geoscientists believe, based on available seismic and geological information, to be indications of economic accumulations of oil or natural gas. Our prospects are in various stages of evaluation, ranging from a prospect that is ready to be drilled to a prospect that will require substantial seismic data processing and interpretation. There is no way to predict in advance of drilling and testing whether any particular prospect will yield oil or natural gas in sufficient quantities to recover drilling and completion costs or to be economically viable. The use of seismic data and other technologies and the study of producing fields in the same area will not enable us to know conclusively prior to drilling whether oil or natural gas will be present or, if present, whether oil or natural gas will be present in commercial quantities. We cannot assure you that the analysis we perform using data from other wells, more fully explored prospects and/or producing fields will accurately predict the characteristics and potential reserves associated with our drilling prospects. The recent downturn in oil and natural gas pricing will also significantly impact the projected rates of return of our projects without the assurance of significant reductions in costs of drilling and development. To the extent we drill additional wells in the deepwater and/or on the deep shelf, our drilling activities could become more expensive. In addition, the geological complexity of deepwater, deep shelf and various onshore formations may make it more difficult for us to sustain our historical rates of drilling success. As a result, we can offer no assurance that we will find commercial quantities of oil and natural gas and, therefore, we can offer no assurance that we will achieve positive rates of return on our investments. 20
Market conditions or operational impediments may hinder our access to oil and natural gas markets or delay our production. Market conditions or the unavailability of satisfactory oil and natural gas transportation arrangements may hinder our access to oil and natural gas markets or delay our production. The availability of a ready market for our oil and natural gas production depends on a number of factors, including the demand for and supply of oil and natural gas and the proximity of reserves to pipelines and terminal facilities. Our ability to market our production depends substantially on the availability and capacity of gathering systems, pipelines and processing facilities, which in most cases are owned and operated by third parties. Our failure to obtain such services on acceptable terms could materially harm our business. We may be required to shut in wells because of a reduction in demand for our production or because of inadequacy or unavailability of pipelines or gathering system capacity. If that were to occur, then we would be unable to realize revenue from those wells until arrangements were made to deliver our production to market. We have, in the past, been required to shut in wells when hurricanes have caused or threatened damage to pipelines and gathering stations. For example, in September 2008, as a result of Hurricane Ike, two of our operated platforms and eight non-operated platforms were toppled and a number of platforms, third-party pipelines and processing facilities upon which we depend to deliver our production to the marketplace were damaged. In 2012, under threat of Hurricane Isaac, we shut in most of our offshore production for a period of 10 to 25 days. Similar shut-ins of lower magnitude occurred in 2013. In some cases, our wells are tied back to platforms owned by parties who do not have an economic interest in our wells and we cannot be assured that such parties will continue to process our oil and natural gas. Currently, a portion of our oil and natural gas is processed for sale on platforms owned by parties with no economic interest in our wells and no other processing facilities would be available to process such oil and natural gas without significant investment by us. In addition, third-party platforms could be damaged or destroyed by hurricanes which could reduce or eliminate our ability to market our production. As of December 31, 2012, 102014, 12 fields, accounting for approximately 3.712.8 Bcfe (or 3.6%12%) of our 20122014 production, are tied back to separate, third-party owned platforms. There can be no assurance that the owners of such platforms will continue to process our oil and natural gas production. If any of these platform operators ceases to operate their processing equipment, we may be required to shut in the associated wells, or construct additional facilities.facilities or assume additional liability to re-establish production. If third-party pipelines connected to our facilities become partially or fully unavailable to transport our natural gas or oil, or if the prices charged by these third-party pipelines increase, our revenues or costs could be adversely affected. We depend upon third-party pipelines that provide delivery options from our facilities. Because we do not own or operate these pipelines, their continued operation is not within our control. If any of these third-party pipelines become partially or fully unavailable to transport natural gas and oil, or if the gas quality specification for the natural gas pipelines changes so as to restrict our ability to transport natural gas on those pipelines, our revenues could be adversely affected. For example, a third-party pipeline used by our Main Pass 108 field was shut down between June 2010 and March 2011. We estimate this shutdown caused us to defer production of approximately 4.9 Bcfe during 2010 and 3.7 Bcfe during 2011. In 2012,in 2013, various pipelines were shut down causing production deferral of approximately 1.5 Bcfe with our Matterhorn6.3 Bcfe. Our Mississippi Canyon 506 field being(Wrigley) was the field most significantly affected by these shutdowns.the shutdowns, as it was shut down for all of 2013 and more than half of 2014. Certain third-party pipelines have submitted or have made plans to submit requests to increase the fees they charge us to use these pipelines. These increased fees could adversely impact our revenues or operating costs, either of which would adversely impact our operating profits, cash flows and cash flows.reserves. We are subject to numerous laws and regulations that can adversely affect the cost, manner or feasibility of doing business. Our operations and facilities are subject to extensive federal, state and local laws and regulations relating to the exploration, development, production and transportation of oil and natural gas and operational safety. Future laws or regulations, any adverse change in the interpretation of existing laws and regulations or our failure to comply with such legal requirements may harm our business, results of operations and financial condition. We may be required to make large and unanticipated capital expenditures to comply with governmental regulations, such as: · | lease permit restrictions; |
· | drilling bonds and other financial responsibility requirements, such as plugging and abandonment bonds; |
· | unitization and pooling of properties; |
· | reporting of natural gas sales for resale; and |
21
lease permit restrictions;
drilling bonds and other financial responsibility requirements, such as plugging and abandonment bonds;
unitization and pooling of properties;
reporting of natural gas sales for resale; and
Under these laws and regulations, we could be liable for: · | property and natural resource damages; |
· | well site reclamation costs; and |
· | governmental sanctions, such as fines and penalties. |
property and natural resource damages;
well site reclamation costs; and
governmental sanctions, such as fines and penalties.
Our operations could be significantly delayed or curtailed and our cost of operations could significantly increase as a result of regulatory requirements or restrictions. We are unable to predict the ultimate cost of compliance with these requirements or their effect on our operations. It is also possible that a portion of our oil and natural gas properties could be subject to eminent domain proceedings or other government takings for which we may not be adequately compensated. SeeBusiness – Regulation under Part I, Item 1 ofin this Form 10-K for a more detailed explanation of our regulatory risks. Our operations may incur substantial liabilities to comply with environmental laws and regulations. Our oil and natural gas operations are subject to stringent federal, state and local laws and regulations relating to the release or disposal of materials into the environment or otherwise relating to environmental protection. These laws and regulations: · | require the acquisition of a permit before drilling commences; |
· | restrict the types, quantities and concentration of substances that can be released into the environment in connection with drilling and production activities; |
· | limit or prohibit exploration or drilling activities on certain lands lying within wilderness, wetlands and other protected areas or that may affect certain wildlife, including marine mammals; and |
· | impose substantial liabilities for pollution resulting from our operations. |
Failure to comply with these laws and regulations may result in: · | the assessment of administrative, civil and criminal penalties; |
· | incurrence of investigatory or remedial obligations; and |
· | the imposition of injunctive relief. |
In 2012 and in prior years, we have been subject to investigations with respect to allegations that we did not comply with applicable environmental laws and regulations. In December 2012, we reached an agreement with respect to the previously disclosed federal grand jury investigation related to certain violations of environmental laws and regulations.
Changes in environmental laws and regulations occur frequently, and any changes that result in more stringent or costly waste handling, storage, transport, disposal or cleanup requirements could require us to make significant expenditures to attain and maintain compliance and may otherwise have a material adverse effect on our industry in general and on our own results of operations, competitive position or financial condition. Under these environmental laws and regulations, we could be held strictly liable for the removal or remediation of previously released materials or property contamination, regardless of whether we were responsible for the release or contamination and regardless of whether our operations met previous standards in the industry at the time they were conducted. Our permits require that we report any incidents that cause or could cause environmental damages. SeeBusiness – Regulation, under Part I, Item 1 ofin this Form 10-Kfor10-K for a more detailed description of our environmental risks. Climate change legislation or regulations restricting emissions of greenhouse gases could result in increased operating costs and reduced demand for the oil and natural gas that we produce. In December 2009, theThe EPA has determined that emissions of carbon dioxide, methane and other greenhouse gases present an endangerment to public health and the environment because emissions of such gases are, according to the EPA, contributing to the warming of the earth’s atmosphere and other climatic changes. Based on its findings, the EPA has begun adopting and implementing regulations to restrict emissions of greenhouse gases under existing provisions of the CAA. The EPA has adopted two sets of rules regulating greenhouse gas emissions under the CAA, one of which requires a reduction in emissionsimposes preconstruction and operating permit requirements of greenhouse gases from motor vehicles and the other of which regulates emissions of greenhouse gases from certain large stationary sources, effective January 2, 2011.sources. The EPA also adopted rules requiring the reporting of greenhouse gas emissions from specified large greenhouse gas emission sources in the United States, such as petroleum refineries, on an annual basis, beginning in 2011, as well as certain onshore oil and natural gas production facilities, on an annual basis, beginning in 2012 for emissions occurring in 2011.basis.
22
In addition, the United States Congress has from time to time considered adopting legislation to reduce emissions of greenhouse gases and almost one-half of the states have already taken legal measures to reduce emissions of greenhouse gases primarily through the planned development of greenhouse gas emission inventories and/or regional greenhouse gas cap and trade programs. Most of these cap and trade programs work by requiring major sources of emissions, such as electric power plants, or major producers of fuels, such as refineries and gas processing plants, to acquire and surrender emission allowances. The number of allowances available for purchase is reduced each year in an effort to achieve the overall greenhouse gas emission reduction goal. The adoption of legislation or regulatory programs to reduce emissions of greenhouse gases could require us to incur increased operating costs, such as costs to purchase and operate emissions control systems, to acquire emissions allowances or comply with new regulatory or reporting requirements. Any such legislation or regulatory programs could also increase the cost of consuming, and thereby reduce demand for, the oil and natural gas we produce. Consequently, legislation and regulatory programs to reduce emissions of greenhouse gases could have an adverse effect on our business, financial condition and results of operations. Finally, it should be noted that some scientists have concluded that increasing concentrations of greenhouse gases in the Earth’s atmosphere may produce climate changes that have significant physical effects, such as increased frequency and severity of storms, droughts, and floods and other climatic events. If any such affects were to occur, they could have an adverse effect on our financial condition and results of operations. Please see– Our business involves many uncertainties and operating risks that can prevent us from realizing profits and can cause substantial losses. The enactment of derivatives legislation and regulation could have an adverse effect on our ability to use derivative instruments to reduce the negative effect of commodity price changes, interest rate and other risks associated with our business. OnIn July 21, 2010, new comprehensive financial reform legislation, known as the Dodd-Frank Wall Street Reform and Consumer Protection Act (the “DF Act”), was enacted that establishes federal oversight and regulation of the over-the-counter derivatives market and entities, such as us, that participate in that market. The DF Act requires the CFTC, the SEC and other regulators to promulgate rules and regulations implementing the new legislation. In its rulemaking under the DF Act,Act. Although the CFTC has finalized certain regulations, others remain to be finalized or implemented and it is not possible at this time to predict when this will be accomplished.
In October 2011, the CFTC issued final regulations to set position limits for certain futures and option contracts in the major energy markets and for swaps that are their economic equivalents. Certain bona fide hedging transactions would be exempt from these position limits. The initial position limits rule was vacated by the United States District Court for the District of Colombia in September 2012, although2012. However, in November 2013, the CFTC has statedproposed new rules that it will appealwould place limits on positions in certain core futures and equivalent swaps contracts for or linked to certain physical commodities, subject to exceptions for certain bona fide hedging transactions. As these new position limit rules are not yet final, the District Court’s decision. impact of those provisions on us is uncertain at this time. The CFTC also has finalized other regulations, including critical rulemakings ondesignated certain interest rate swaps and credit default swaps for mandatory clearing and the definition of “swap”, “security-based swap”, “swap dealer” and “major swap participant”. The DF Act and CFTCassociated rules also will require us in connection with certaincovered derivatives activities to comply with clearing and trade-execution requirements (oror take steps to qualify for an exemption to such requirements).requirements. Although the Company expects to qualify for the end-user exception from the mandatory clearing requirements for swaps entered to hedge its commercial risks, the application of the mandatory clearing and trade execution requirements to other market participants, such as swap dealers, may change the cost and availability of the swaps that the Company uses for hedging. In addition, new regulationsfor uncleared swaps, the CFTC or federal banking regulators may require usend-users to comply with margin requirements although these regulations are not finalizedenter into credit support documentation and/or post initial and their applicationvariation margins. Posting of collateral could impact liquidity and reduce cash available to us is uncertain at this time. Other regulations also remain to be finalized, and the CFTC recently has delayed the compliance datesCompany for various regulations already finalized. As a result, it is not possible at this time to predict with certainty the full effects of the DF Act and CFTC rules on us and the timing of such effects. its needs. The DF Act may also require the counterparties to our derivative instruments to spin off some of their derivatives activities to separate entities, which may not be as creditworthy as the current counterparties. The full impact of the DF Act and related regulatory requirements upon the Company’s business will not be known until the regulations are implemented and the market for derivatives contracts has adjusted. The DF Act and regulations could significantly increase the cost of derivative contracts, (including from swap recordkeeping and reporting requirements and through requirements to post collateral, which could adversely affect our available liquidity), materially alter the terms of derivative contracts, reduce the availability of derivatives to protect against risks we encounter, reduce our ability to monetize or restructure our existing derivative contracts, and increase our exposure to less creditworthy counterparties.counterparties or reduce liquidity. If we reduce our use of derivatives as a result of the DF Act and regulations, our results of operations may become more volatile and our cash flows may be less predictable, which could adversely affect our ability to plan for and fund capital expenditures. Finally, the DF Act was intended, in part, to reduce the volatility of oil and natural gas prices, which some legislators attributed to speculative trading in derivatives and commodity instruments related to oil and natural gas. Our revenues could therefore be adversely affected if a consequence of the DF Act is to lower commodity prices. Any of these consequences could have a material adverse effect on our consolidated financial position, results of operations and cash flows. 23
We operateown a production platform in a highly regulated National Marine Sanctuary, which increases our compliance costs and subjects us to risk of significant fines and penalties if we do not maintain rigorous compliance. Our oil and natural gas operations includeWe own a production platform located in a National Marine Sanctuary in the Gulf of Mexico that is subject to special federal laws and regulations. This production platform is not producing and will be plugged, abandoned and remediated according to regulations. Unique regulations related to operations in the Sanctuary include, among other things, prohibition of drilling activities within certain protected areas, restrictions on substances that may be discharged, depths of discharge in connection with drilling and production activities and limitations on mooring of vessels. Failure to comply with these laws and regulations may result in the assessment of administrative, civil and criminal penalties, incurrence of investigatory or remedial obligations or the imposition of injunctive relief, including cessation of production from wells associated with this platform.
Restrictions on our ability to obtain water for our onshore operations may have an adverse effect on our financial condition, results of operations and cash available for distribution. Water is an essential component of shale oil and natural gas production during both the drilling and hydraulic fracturing processes. Historically, operators in the Permian Basin have been able to purchase water from local land owners for use in their operations. According to the Lower Colorado River Authority, during 2011 Texas experienced the lowest inflows of water of any year in recorded history. Severe drought conditions persisted over the past several years in certain parts of Texas and are projected to continue in 2015. As a result, some local water districts have begun restricting the use of water subject to their jurisdiction for hydraulic fracturing to protect local water supply. If we are unable to obtain water to use in our operations from local sources, we may be unable to economically drill for oil and natural gas, which could have an adverse effect on our consolidated financial condition, results of operations, cash flows and reserves. Our operations could be adversely impacted by security breaches, including cyber-security breaches, which could affect our production of oil and natural gas or could affect other parts of our business. We face security exposure, including cyber-security exposure, from unauthorized access to our facilities and computer systems. This exposure includes unauthorized access to sensitive information; malicious damage to our facilities, infrastructure, and computer systems; malicious damage to third-party facilities, infrastructure, and computer systems; safety exposure for our employees and contractors; and disruptions of our operations. Cyber-security exposures in particular are fluid and adaptive, and include malicious software, unauthorized access to confidential data and disruptions to operations that use computers and data systems. Although we utilize various procedures and controls to mitigatereduce these exposures, there can be no assurances that these procedures and controls will be sufficient to prevent such events from occurring. Cyber-security exposures in particular are evolving and include malicious software, unauthorized access to confidential data and disruptions to operations that use computers and data systems. We do not carry business interruption insurance. Any of these security breaches could have a material adverse effect on our consolidated financial position, results of operations and cash flows.
The loss of members of our senior management could adversely affect us. To a large extent, we depend on the services of our senior management. The loss of the services of any of our senior management, including Tracy W. Krohn, our Founder, Chairman and Chief Executive Officer; Jamie L. Vazquez, our President; John D. Gibbons, our Senior Vice President Chief Financial Officer and Chief AccountingFinancial Officer; Thomas P. Murphy, our Senior Vice President and Chief Operations Officer; Stephen L. Schroeder, our Senior Vice President and Chief Technical Officer; and Thomas F. Getten, our Vice President, General Counsel and Corporate Secretary, could have a negative impact on our operations. We do not maintain or plan to obtain for the benefit of the Company any insurance against the loss of any of these individuals. Please readExecutive Officers of the Registrantinunder Part I following Item 3in3 in this Form 10-K for more information regarding our senior management team. The unavailability or high cost of certain types of drilling rigs, equipment, supplies, personnel and oil field services could adversely affect our ability to execute our exploration and development plans on a timely basis and within our budget. The U.S. oil and natural gas industry may experience significant shortages in the availability of certain types of drilling rigs as well as significant increasesor experience drilling rigs with high costs in relation to the costrecent change in price of utilizing drilling rigs.crude oil and natural gas. This could delay or adversely affect our exploration and development operations, which could have a material adverse effect on our business, financial condition or results of operations. If the unavailability or high cost of rigs, equipment, supplies or personnel were particularly severe in the offshore waters of the U.S. Gulf of Mexico or Texas, we could be materially and adversely affected because our operations and properties are concentrated in those areas. 24
Certain U.S. federal income tax deductions currently available with respect to oil and gas exploration and development may be eliminated as a result of future legislation. Legislation has been proposed that would, if enacted into law, make significant changes to U.S. federal income tax laws, including the elimination of certain key U.S. federal income tax preferences currently available to oil and gas exploration and production companies. These changes include, but are not limited to, (i) the repeal of the percentage depletion allowance for oil and gas properties, (ii) the elimination of current deductions for intangible drilling and development costs, (iii) the elimination of the deduction for United States production activities, and (iv) an extension of the amortization period for certain geological and geophysical expenditures. It is unclear whether these or similar changes will be enacted and, if enacted, how soon any such changes could become effective. The passage of this legislation or any other similar changes in U.S. federal income tax law could eliminate or postpone certain tax deductions that are currently available with respect to oil and gas exploration and production, and any such change could have a negative effect on the results of our operations. Counterparty credit risk may negatively impact the conversion of our accounts receivables to cash. Substantially all of our accounts receivable result from oil, NGLs and natural gas sales or joint interest billings to third parties in the energy industry. This concentration of customers and joint interest owners may impact our overall credit risk in that these entities may be similarly affected by any adverse changes in economic or other conditions. In recent years, market conditions resulting in downgrades to credit ratings of energy merchants affected the liquidity of several of our purchasers. Risks Related to Financings Adverse changes in the financial and credit markets could negatively impact our economic growth. In addition, the continuation of the current commodity price environment, or further declines of oil, NGLs and natural gas prices can affect our ability to obtain funding on acceptable terms or under our current credit facility. These impacts may hinder or prevent us from meeting our future capital needs and may restrict or limit our ability to increase reserves of oil and natural gas. ForThe capital markets we have historically accessed are currently constrained, but we believe we could access other capital markets if the need arises. These limitations in the capital markets may affect our ability to grow and limit our ability to replace our reserves of oil and gas.
During 2012 and 2011, world financial markets have beenwere affected from time to time by the instability of the Euro and the uncertainty of some Euro-based countries to repay their debt. In addition, one credit agency downgraded the debt of the U.S. government. These types of events bring uncertainty to the financial markets and may produce volatility and may decrease financing availability. In recent years, access to financing markets was severely limited at various times. In 2008, prices for oil, NGLs and natural gas had decreased precipitously along with the significant instability that existed For example, in the financial markets during this time. In 2009, the global financial markets and economic conditions were severely distressed. There were concerns, both with respect to bank failures and bank liquidity, as to whether our banks would be able to meet their commitments under credit arrangements in place during that time. These concerns led to very few financing transactions being completed.
We can offer no assurance that we would be able to access the capital market on terms and conditions that would be acceptable to us, if the need were to arise. Our revolving bank credit facility is subject to a semi-annual borrowing base determination,re-determination, and available credit could be reduced or eliminated at the sole discretion of the banks within the facility. Our borrowing base may decrease as a result of lower oil or natural gas prices, operating difficulties, declines in reserves, lending requirements or regulations, or the issuance of new indebtedness. We cannot be certain that funding will be available if needed, and to the extent required, on acceptable terms.
If funding is not available as needed, or is available only on unfavorable terms, we may be unable to meet our obligations as they come due and could be required to repay any borrowings in excess of the redetermined borrowing base, or we may be unable to implement our exploratory and development plan, enhance our existing business, complete acquisitions or otherwise take advantage of business opportunities or respond to competitive pressures, any of which could have a material adverse effect on our production, revenues and results of operations. 25
We may not be able to generate enough cash flow to meet our debt obligations. We expect our earnings and cash flow to vary significantly from year to year due to the cyclical nature of our industry. As a result, the amount of debt that we can manage in some periods may not be appropriate for us in other periods. In addition, our future cash flow may become insufficient to meet our debt obligations and commitments. Any insufficiency could negatively impact our business. A range of economic, competitive, business and industry factors will affect our future financial performance, and, as a result, our ability to generate cash flow from operations and to pay off our outstanding indebtedness. Many of these factors, such as oil and natural gas prices, economic and financial conditions in our industry and the global economy or initiatives by our competitors, are beyond our control. If we do not generate enough cash flow from operations to satisfy our current or any future debt obligations, we may have to undertake alternative financing plans, such as: · | refinancing or restructuring our debt; |
reducing or delaying capital investments; or
· | reducing or delaying capital investments; and |
· | seeking to raise additional capital. |
Any alternative financing plans that we undertake, if necessary, may not allow us to meet our debt obligations. Our inability to generate sufficient cash flow to satisfy our debt obligations or to obtain alternative financing could materially and adversely affect our business, financial condition and results of operations. Our debt obligations could have important consequences. For example, they could: · | increase our vulnerability to general adverse economic and industry conditions; |
· | limit our ability to fund future working capital requirements and capital expenditures, to engage in future acquisitions or development activities, or to otherwise realize the value of our assets; |
· | limit our opportunities because of the need to dedicate a substantial portion of our cash flow from operations to payments of interest and principal on our debt obligations or to comply with any restrictive terms of our debt obligations; |
· | limit our flexibility in planning for, or reacting to, changes in our business and the industry in which we operate; |
· | impair our ability to obtain additional financing in the future; and |
· | place us at a competitive disadvantage compared to our competitors that have less debt. |
In addition, if we fail to comply with the covenants or other terms of any agreements governing our debt, our lenders will have the right to accelerate the maturity of that debt and foreclose upon the collateral, if any, securing that debt. Assuming continuing oil and gas prices near levels realized in December 2014 and January 2015, we likely will be out of compliance with certain of our financial ratio maintenance covenants under our Credit Agreement sometime during 2015. We intend to engage the lenders under the Credit Agreement in discussions regarding amending our financial ratio covenants at such time as our borrowing base is next redetermined, but we can provide no assurance that we will be successful in obtaining such an amendment. While we believe we will obtain the appropriate covenant relief, if we are unable to obtain such an amendment from our lenders, we believe that we can find alternative financing, albeit at a higher cost, and we may have to reduce our cash outlays further for capital expenditures and other activities until such time as market conditions recover. Realization of any of these factors could adversely affect our financial condition, results of operations and cash flows. 26
Risks Related to Our Principal Shareholder, Tracy W. Krohn We will be controlled by Tracy W. Krohn as long as he owns a majority of our outstanding common stock, and other shareholders will be unable to affect the outcome of shareholder voting during that time. This control may adversely affect the value of our common stock and inhibit potential changes of control. Tracy W. Krohn owns and controls 39,562,54539,876,501 shares of our common stock, representing approximately 52.6%52.5% of our voting interests as of February 15, 2013.2015. As a result, Mr. Krohn has the ability to control the outcome of matters that require a simple majority of shareholders for approval and other investors, by themselves, will not be able to affect the outcome of virtually any shareholder vote. Mr. Krohn, subject to any duty owed to our minority shareholders under Texas law, is able to control all matters affecting us, including: · | the composition of our board of directors and, through it, any determination with respect to our business direction and policies, including the appointment and removal of officers; |
· | the determination of incentive compensation, which may affect our ability to retain key employees; |
· | any determinations with respect to mergers or other business combinations; |
· | our acquisition or disposition of assets; |
· | our financing decisions and our capital raising activities; |
our payment of dividends on our common stock;
· | our payment of dividends on our common stock, subject to the restrictions in our Credit Agreement and indentures; and |
· | amendments to our amended and restated articles of incorporation or bylaws. |
Mr. Krohn is generally not prohibited from selling a controlling interest in us to a third party. In addition, his concentrated control could discourage others from initiating any potential merger, takeover or other change of control transaction that might be beneficial to our business or stockholders.shareholders. As a result, the market price of our common stock could be adversely affected. Due to Mr. Krohn’s ownership and control, we are exempted from many New York Stock Exchange (“NYSE”) corporate governance rules, and, as a result, our other shareholders may not have the protections set forth in those rules, particularly in the event of conflicts of interest with Mr. Krohn. Mr. Krohn owns a majority of our common stock, and, therefore, we are a “controlled company” within the meaning of the rules of the NYSE. As such, we are not required to comply with certain corporate governance rules of the NYSE that would otherwise apply to us as a listed company on that exchange. These rules are generally intended to increase the likelihood that boards will make decisions in the best interests of shareholders. Should the interests of Mr. Krohn differ from those of other shareholders, the other shareholders will not be afforded the protections of having a majorityall of the other directors on the board who arebeing independent from our principal shareholder. Item 1B. | Unresolved Staff Comments |
Item 1B. Unresolved Staff Comments None. 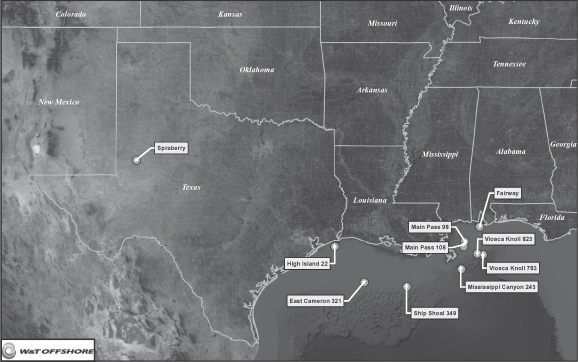
Item 2. Properties Our fields are located in the Gulf of Mexico, Alabama and Texas. The offshore fields are found in water depths ranging from less than 10 feet up to 4,9007,200 feet. The reservoirs in our offshore fields are generally characterized as having high porosity and permeability, which typically results in high production rates. The reservoirs in our onshore fields are generally characterized as having low porosity and permeability and require stimulation and artificial lift to produce. The following describesmap provides the locations of our 10 largest fields as of December 31, 2012,2014, based on quantities of proved reserves on a natural gasan energy equivalent basis. At December 31, 2012,2014, these fields accounted for approximately 82% of our proved reserves. | | | | | | | | | | | | | | | | | | | | | Field Name | | Field
Category | | Operator | | Percent Oil and
NGLs of
Net Reserves
(1) | | | Percent
Natural Gas
of Net Reserves
(1) | | | 2012 Average Daily
Equivalent Sales Rate
(Mcfe/d) (1) | | | | | | | | Gross | | | Net | | Spraberry (Yellow Rose Properties) | | Onshore | | W&T | | | 89 | % | | | 11 | % | | | 18,538 | | | | 15,016 | | Ship Shoal 349 (Mahogany) | | Shelf | | W&T | | | 81 | % | | | 19 | % | | | 26,937 | | | | 22,896 | | Viosca Knoll 783 (Tahoe/SE Tahoe) | | Deepwater | | W&T | | | 27 | % | | | 73 | % | | | 53,053 | | | | 36,076 | | Fairway (Fairway Properties) | | Shelf | | W&T | | | 29 | % | | | 71 | % | | | 49,462 | | | | 27,204 | | Main Pass 108 | | Shelf | | W&T | | | 19 | % | | | 81 | % | | | 27,846 | | | | 21,442 | | Miss. Canyon 243 (Matterhorn) | | Deepwater | | W&T | | | 79 | % | | | 21 | % | | | 23,865 | | | | 23,865 | | Viosca Knoll 823 (Virgo) | | Deepwater | | W&T | | | 36 | % | | | 64 | % | | | 10,055 | | | | 6,938 | | High Island 22 | | Shelf | | W&T | | | 9 | % | | | 91 | % | | | 470 | | | | 390 | | Main Pass 98 | | Shelf | | W&T | | | 21 | % | | | 79 | % | | | 9,431 | | | | 7,828 | | East Cameron 321 | | Shelf | | W&T | | | 91 | % | | | 9 | % | | | 10,370 | | | | 8,089 | |
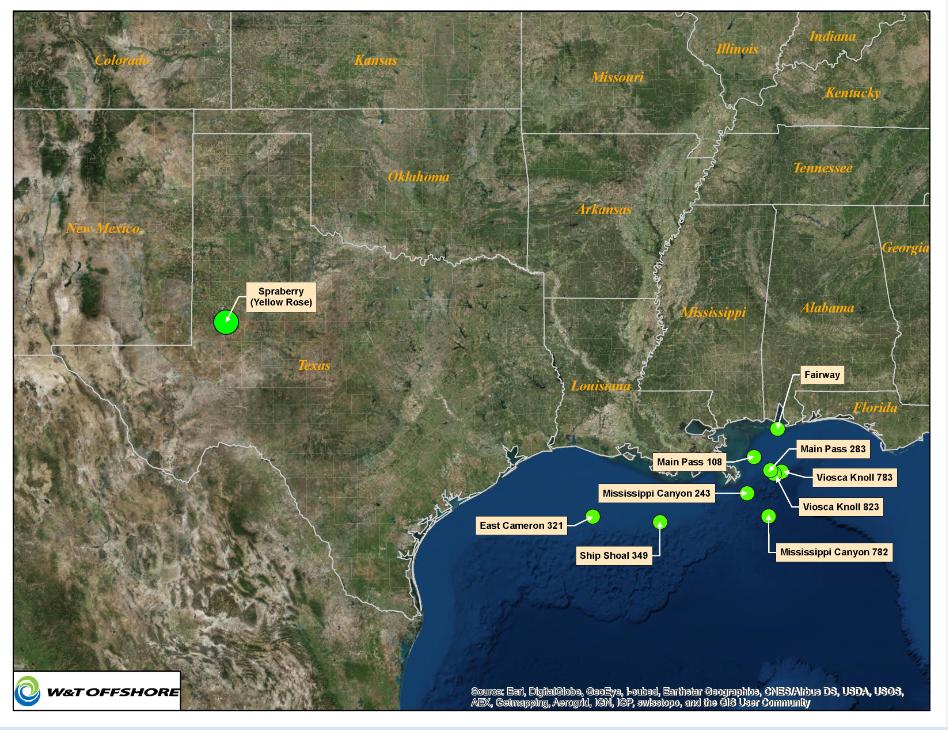
28
The following table provides information for our 10 largest fields in descending order of proved net reserves as of December 31, 2014, based on quantities on an energy equivalent basis. Deepwater refers to acreage in over 500 feet of water. Our interests in several of our offshore fields are owned by our wholly-owned subsidiary, W & T Energy VI, LLC. Unless indicated otherwise, “drilling” in the field descriptions below refers to when the drilling reached target depth, as this measurement usually has a higher correlation to changes in proved reserves compared to using the SEC’s definition for completion. | | | Percent Oil and NGLs of | | | 2014 Average Daily Equivalent Sales Rate (Boe/d) (1) | | | 2014 Average Daily Equivalent Sales Rate (Mcfe/d) (1) | | Field Name | Field Category | | Net Reserves (1) | | | Gross | | | Net | | | Gross | | | Net | | Spraberry (Yellow Rose) | Onshore | | | 89 | % | | | 4,502 | | | | 3,408 | | | | 27,013 | | | | 20,450 | | Ship Shoal 349 (Mahogany) | Shelf | | | 81 | % | | | 8,851 | | | | 7,388 | | | | 53,105 | | | | 44,330 | | Fairway | Shelf | | | 26 | % | | | 5,253 | | | | 4,305 | | | | 31,515 | | | | 25,830 | | Viosca Knoll 783 (Tahoe/SE Tahoe) | Deepwater | | | 26 | % | | | 6,292 | | | | 4,668 | | | | 37,753 | | | | 28,007 | | Miss. Canyon 243 (Matterhorn) | Deepwater | | | 74 | % | | | 4,832 | | | | 4,832 | | | | 28,989 | | | | 28,989 | | Main Pass 108 | Shelf | | | 18 | % | | | 2,862 | | | | 2,356 | | | | 17,173 | | | | 14,133 | | Miss. Canyon 782 (Dantzler) (2) | Deepwater | | | 73 | % | | | — | | | | — | | | | — | | | | — | | Viosca Knoll 823 (Virgo) | Deepwater | | | 39 | % | | | 2,094 | | | | 1,303 | | | | 12,567 | | | | 7,820 | | East Cameron 321 | Shelf | | | 96 | % | | | 1,263 | | | | 931 | | | | 7,580 | | | | 5,583 | | Main Pass 283 | Shelf | | | 40 | % | | | 1,636 | | | | 1,336 | | | | 9,819 | | | | 8,014 | |
(1) | ThousandThe conversions to barrels of oil equivalent and cubic feet equivalent – Mcfe. The amount waswere determined using the energy-equivalentenergy equivalency ratio of six Mcf of natural gas to one Bbl of crude oil, condensate or NGLs.NGLs (totals may not compute due to rounding). The energy-equivalentconversion ratio does not assume price equivalency, and the energy-equivalent pricesprice on an equivalent basis for oil, NGLs and natural gas may differ significantly. |
(2) | There has been no production in this field as of December 31, 2014. |
Volume measurements: Bbl – barrels | Mcf – Thousand cubic feet | Boe/d – barrel of oil equivalent per day | Mcfe/d – Thousand cubic feet of gas equivalent per day |
29
Our Fields On December 31, 20122014, we had two fields of major significance (having(which we define as having year-end proved reserves which compriseof 15% or more of the Company’s total proved reserves, calculated on a natural gasan energy equivalent basis). The Spraberry field (Yellow Rose Properties)Rose) is located in the Permian Basin in West Texas and the Ship Shoal 349 field (Mahogany) is located on the conventional shelf in the Gulf of Mexico. Below is a description of these fields. Spraberry Field (Yellow Rose Properties)Rose). The Spraberry field is located in the Permian Basin in West Texas. W&TWe acquired a 100% working interest in approximately 21,900 net acres in connection with the acquisition of the Yellow Rose Propertiesproperties (the ‘Opal Properties”) from Opal Resources LLC and Opal Resources Operating LLC (collectively, “Opal”) in May 2011 and2011. In separate transactions, we acquired approximately 9,500 net acres earlier in 2011.2011 and approximately 2,200 net acres in 2013. We are the operator for these properties. The Spraberry field was discovered in 1935 and extends over several counties in West Texas comprising about 1.6 million acres. The field is 150 miles long and 75 miles wide, and it has undergone much change and expansion over the years, both aerially and vertically. The correlative interval is now over 3,500 feet thick and includes the Clearfork, Upper Spraberry, Lower Spraberry, Dean, and Wolfcamp formations. These formations are correlative over the area but are lenticular in nature and vary in thickness, porosity, and permeability even over short distances. The general completion technique includes hydraulic fracturing and installation of sucker rod pumps. During 2014, we drilled 38 wells, which included nine horizontal wells. During 2013, we drilled 32 wells, which included five horizontal wells. During 2012, W&Twe drilled 64 additional wells, which included one horizontal well. Cumulative field production through 20122014 is approximately 2.86.4 MMBoe (17.1(38.3 Bcfe) from our wells. In 2013, W&T plans2015, we plan to drill 20 vertical wells and sevenone horizontal wells.well. Total proved reserves associated with our interest in the Spraberry field were 37.3 MMBoe (223.6 Bcfe) at December 31, 2014, 38.2 MMBoe (229.3 Bcfe) at December 31, 2013 and 31.6 MMBoe (189.8 Bcfe) at December 31, 2012 and 28.1 MMBoe (168.5 Bcfe) at December 31, 2011.2012. The following presents historical information about our produced oil, NGLs and natural gas volumes (net to our interests) from the Spraberry field forover the year 2012 and from the acquisition date of May 11, 2011 to December 31, 2011.past three years. | | | | | | | | | | | | Year Ended
December 31,
2012 | | | May 11 -
December 31,
2011 | | Net sales: | | | | | | | | | Oil (MBbls) | | | 751 | | | | 452 | | NGLs (MBbls) | | | 103 | | | | 60 | | Natural gas (MMcf) | | | 376 | | | | 214 | | Total oil equivalent (MBoe) | | | 916 | | | | 548 | | Total natural gas equivalent (MMcfe) | | | 5,496 | | | | 3,289 | | Total oil equivalent (Boe/day) | | | 2,503 | | | | 2,333 | | Total natural gas equivalent (Mcfe/day) | | | 15,016 | | | | 13,997 | | | | | Average realized sales prices: | | | | | | | | | Oil ($/Bbl) | | $ | 88.11 | | | $ | 91.09 | | NGLs ($/Bbl) | | | 36.94 | | | | 51.70 | | Natural gas ($/Mcf) | | | 2.50 | | | | 3.05 | | Oil equivalent ($/Boe) | | | 77.38 | | | | 82.03 | | Natural gas equivalent ($/Mcfe) | | | 12.90 | | | | 13.67 | | | | | Average production costs (1): | | | | | | | | | Oil equivalent ($/Boe) | | $ | 18.92 | | | $ | 13.62 | | Natural gas equivalent ($/Mcfe) | | | 3.15 | | | | 2.27 | |
| Year Ended December 31, | | | 2014 | | | 2013 | | | 2012 | | Net Sales: | | | | | | | | | | | | Oil (MBbls) | | 1,000 | | | | 1,075 | | | | 751 | | NGLs (MBbls) | | 141 | | | | 170 | | | | 103 | | Natural gas (MMcf) | | 614 | | | | 575 | | | | 376 | | Total oil equivalent (MBoe) | | 1,244 | | | | 1,341 | | | | 916 | | Total natural gas equivalents (MMcfe) | | 7,464 | | | | 8,047 | | | | 5,496 | | Average daily equivalent sales (Boe/day) | | 3,408 | | | | 3,674 | | | | 2,503 | | Average daily equivalent sales (Mcfe/day) | | 20,450 | | | | 22,046 | | | | 15,016 | | Average realized sales prices: | | | | | | | | | | | | Oil ($/Bbl) | $ | 85.53 | | | $ | 93.75 | | | $ | 88.11 | | NGLs ($/Bbl) | | 36.84 | | | | 35.86 | | | | 36.94 | | Natural gas ($/Mcf) | | 3.67 | | | | 3.48 | | | | 2.50 | | Oil equivalent ($/Boe) | | 74.77 | | | | 81.21 | | | | 77.38 | | Natural gas equivalent ($/Mcfe) | | 12.46 | | | | 13.54 | | | | 12.90 | | Average production costs (1): | | | | | | | | | | | | Oil equivalent ($/Boe) | $ | 17.66 | | | $ | 17.66 | | | $ | 18.92 | | Natural gas equivalent ($/Mcfe) | | 2.94 | | | | 2.94 | | | | 3.15 | |
(1) | Includes lease operating expenses and gathering and transportation costs. |
| | | Volume measurements: | | | Boe – barrel of oil equivalent | | Mcf – thousand cubic feet | MBbls – thousand barrels for crude oil, condensate or NGLs | | MMcf – million cubic feet | MBoe – thousand barrels of oil equivalent | | MMcfe – million cubic feet equivalent |
30
Ship Shoal 349 Field (Mahogany). Ship Shoal 349 field is located off the coast of Louisiana, approximately 235 miles southeast of New Orleans, in 375 feet of water. The field area covers Ship Shoal blocks 349 and 359, with a single production platform on Ship Shoal block 349. Phillips Petroleum Company discovered the field in 1993. We initially acquired a 25% working interest in the field from BP Amoco in 1999. In 2003, we acquired an additional 34% working interest through a transaction with ConocoPhillips that increased our working interest to approximately 59%, and we became the operator of the field in December 2004. In early 2008, we acquired the remaining working interest from Apache Corporation and we now own a 100% working interest in this field. Cumulative field production through 20122014 is approximately 31.237.3 MMBoe gross (187.0(223.6 Bcfe gross). This field is a sub-salt development with fiveeight productive horizons below salt at depths up to 17,000 feet. As of December 31, 2012, 25 wells have been drilled, 16 of which have been successful. In 2010, we developed a reservoir simulation model to determine the most optimal future development plan.plan (the “2010 Development Plan”). As a result, in 2011, we drilled and completed one development well and one exploration well. In 2012, a thirdtwo additional wells were sidetracked, one well was drilled and completed, as partand another well was drilled to target depth. In 2013, the well reaching target depth in 2012 was completed, one well was drilled and completed and we had one well being drilled. In 2014, the well being drilled in 2013 was completed and we drilled and completed another well. A third well was spud at year end 2014 and, in January 2015, drilling on this well was suspended at an intermediate casing point pending higher crude oil prices. All of an ongoing drilling program and two additionalthe wells were sidetracked.drilled under the 2010 Development Plan have been successful. Total proved reserves associated with our interest in this field were 18.8 MMBoe (112.9 Bcfe) at December 31, 2014, 22.9 MMBoe (137.7 Bcfe) at December 31, 2013 and 22.7 MMBoe (136.3 Bcfe) at December 31, 2012 and 20.3 MMBoe (121.7 Bcfe) at December 31, 2011.2012. The following presents historical information about our produced oil, NGLs and natural gas volumes (net to our interests) from the Ship Shoal 349 field over the past three fiscal years. | | | | | | | | | | | | | | | | Year Ended December 31, | | | | | 2012 | | | 2011 | | | 2010 | | Net sales: | | | | | | | | | | | | | Oil (MBbls) | | | 960 | | | | 445 | | | | 657 | | NGLs (MBbls) | | | 85 | | | | 23 | | | | 38 | | Natural gas (MMcf) | | | 2,108 | | | | 498 | | | | 863 | | Total oil equivalent (MBoe) | | | 1,397 | | | | 551 | | | | 838 | | Total natural gas equivalent (MMcfe) | | | 8,380 | | | | 3,305 | | | | 5,030 | | Total oil equivalent (Boe/day) | | | 3,816 | | | | 1,509 | | | | 2,297 | | Total natural gas equivalent (Mcfe/day) | | | 22,896 | | | | 9,055 | | | | 13,782 | | | | | | Average realized sales prices: | | | | | | | | | | | | | Oil ($/Bbl) | | $ | 102.55 | | | $ | 101.30 | | | $ | 73.20 | | NGLs ($/Bbl) | | | 41.74 | | | | 56.06 | | | | 43.54 | | Natural gas ($/Mcf) | | | 2.78 | | | | 4.20 | | | | 4.88 | | Oil equivalent ($/Boe) | | | 77.24 | | | | 87.97 | | | | 64.33 | | Natural gas equivalent ($/Mcfe) | | | 12.87 | | | | 14.66 | | | | 10.72 | | | | | | Average production costs (1): | | | | | | | | | | | | | Oil equivalent ($/Boe) | | $ | 6.27 | | | $ | 14.30 | | | $ | 13.20 | | Natural gas equivalent ($/Mcfe) | | | 1.05 | | | | 2.38 | | | | 2.20 | |
| Year Ended December 31, | | | 2014 | | | 2013 | | | 2012 | | Net Sales: | | | | | | | | | | | | Oil (MBbls) | | 2,020 | | | | 1,943 | | | | 960 | | NGLs (MBbls) | | 104 | | | | 90 | | | | 85 | | Natural gas (MMcf) | | 3,433 | | | | 3,328 | | | | 2,108 | | Total oil equivalent (MBoe) | | 2,697 | | | | 2,589 | | | | 1,397 | | Total natural gas equivalents (MMcfe) | | 16,181 | | | | 15,533 | | | | 8,380 | | Average daily equivalent sales (Boe/day) | | 7,388 | | | | 7,093 | | | | 3,816 | | Average daily equivalent sales (Mcfe/day) | | 44,330 | | | | 42,556 | | | | 22,896 | | Average realized sales prices: | | | | | | | | | | | | Oil ($/Bbl) | $ | 87.21 | | | $ | 98.69 | | | $ | 102.55 | | NGLs ($/Bbl) | | 46.46 | | | | 43.24 | | | | 41.74 | | Natural gas ($/Mcf) | | 4.40 | | | | 3.72 | | | | 2.78 | | Oil equivalent ($/Boe) | | 72.73 | | | | 80.39 | | | | 77.24 | | Natural gas equivalent ($/Mcfe) | | 12.12 | | | | 13.40 | | | | 12.87 | | Average production costs (1): | | | | | | | | | | | | Oil equivalent ($/Boe) | $ | 4.12 | | | $ | 3.68 | | | $ | 6.27 | | Natural gas equivalent ($/Mcfe) | | 0.69 | | | | 0.61 | | | | 1.05 | |
(1) | Includes lease operating expenses and gathering and transportation costs. |
| | | Volume measurements: | | | Boe – barrel of oil equivalent | | Mcf – thousand cubic feet | MBbls – thousand barrels for crude oil, condensate or NGLs | | MMcf – million cubic feet | MBoe – thousand barrels of oil equivalent | | MMcfe – million cubic feet of gas equivalent |
31
The following is a description of the remainder of our top 10 properties, measured by proved reserves at December 31, 2012, five2014, three of which are located on the conventional shelf and threefive are located in the deepwater. We do not believe that individually any of these properties are of major significance (each has proved reserves which comprise less than 15% of our year-end total proved reserves, calculated on a natural gas equivalent basis). Fairway Field. The Fairway field is comprised of Mobile Bay Area blocks 113 (Alabama State Lease #0531) and 132 (Alabama State Lease #0532) and located in 25 feet of water, approximately 35 miles south of Mobile, Alabama. We acquired our 64.3% working interest, along with operatorship in the Fairway field, from Shell in August 2011 and acquired the remaining working interest of 35.7% in September 2014. The field was discovered in 1985 with Well 113 #1 (now called JA). Development drilling began in 1990 and was completed in 1991 with the addition of four wells, each drilled from separate surface locations. The five producing wells came on line in late 1991. As of December 31, 2014, six wells have been drilled, one of which was a replacement well. Cumulative field production through 2014 is approximately 125.4 MMBoe gross (752.3 Bcfe gross). This field is a Norphlet sand dune trend development with one producing horizon at an approximate depth of 21,300 feet. During December 2014, production from this field, net to our interest, averaged 47 Bbls of oil per day, 1,696 Bbls of NGLs per day and 25.9 MMcf of natural gas per day, for total production of 6,065 Boe per day (36.4 MMcfe per day). Viosca Knoll 783 Field.Field (Viosca Knoll 783 Lease (Tahoe) and Viosca Knoll 784 Lease (SE Tahoe)). The Viosca Knoll 783 field is located off the coast of Louisiana, approximately 140 miles southeast of New Orleans, in 1,500 to 1,700 feet of water. The field area covers Viosca Knoll blocks 783 and 784, with subsea tiebacks to two platforms in Main Pass 252. Shell discovered the Tahoe prospect in 1984 and the SE Tahoe prospect in 1996. We acquired a 70% working interest in the Tahoe lease and a 100% working interest in the SE Tahoe lease from Shell in 2010. We are the operator for these properties. Cumulative field production through 20122014 is approximately 31.296.3 MMBoe gross (187.0(577.6 Bcfe gross). The Tahoe prospect is a supra-salt (above the salt layer) development with two productive horizons at depths ranging to 10,300 feet. The SE Tahoe prospect is also a supra-salt development with one productive horizon at a depth of 9,325 feet. As of December 31, 2012,2014, 16 wells have been drilled at the Tahoe prospect, eight of which have been successful and one successful well has been drilled at the SE Tahoe prospect. During December 2012,2014, production from this field, net to our interest, averaged 336212 Bbls of oil per day, 1,5051,362 Bbls of NGLs per day and 26,240 Mcf18.8 MMcf of natural gas per day, for total production of 6,2154,700 Boe per day (37,288 Mcfe(28.2 MMcfe per day). Fairway Field (Fairway Properties). Fairway is comprised of Mobile Bay Area blocks 113 (Alabama State Lease #0531) and 132 (Alabama State Lease #0532) and located in 25 feet of water, approximately 35 miles south of Mobile, Alabama. We acquired our 64.3% working interest, along with operatorship in the Fairway field, from Shell in August 2011. The field was discovered in 1985 with Well 113 #1 (now called JA). Development drilling began in 1990 and was completed in 1991 with the addition of four wells, each drilled from separate surface locations. The five producing wells came on line in late 1991. As of December 31, 2012, six wells have been drilled, one of which was a replacement well. Cumulative field production through 2012 is approximately 112.5 MMBoe gross (674.9 Bcfe gross). This field is a Norphlet sand dune trend development with one producing horizon at an approximate depth of 21,300 feet. During December 2012, production from this field, net to our interest, averaged 17 Bbls of oil per day, 1,495 Bbls of NGLs per day and 20,779 Mcf of natural gas per day, for total production of 4,975 Boe per day (29,848 Mcfe per day).
Main Pass 108 Field. Main Pass 108 field consists of Main Pass blocks 107, 108 and 109. This field is located off the coast of Louisiana approximately 50 miles east of Venice in 50 feet of water. We acquired our working interests in these blocks, which range from 33% to 100%, in a transaction with Kerr-McGee Oil and Gas Corporation (“Kerr-McGee”). The field produces from a number of low relief, predominantly stratigraphically trapped sands. The productive interval ranges in age from Upper Miocene Big A through Middle Miocene Big Hum. As of December 31, 2012, 43 wells have been drilled in this field, 35 of which were successful. Cumulative field production through 2012 is approximately 41.9 MMBoe gross (251.6 Bcfe gross). One new well reached target depth in 2011 and began production in 2012. In addition, one workover was performed in 2012. During December 2012, production from this field, net to our interest, averaged 329 Bbls of oil per day, 437 Bbls of NGLs per day and 15,246 Mcf of natural gas per day, for total production of 3,306 Boe per day (19,838 Mcfe per day).
Mississippi Canyon 243 Field.Field (Matterhorn). Mississippi Canyon 243 field is located off the coast of Louisiana, approximately 100 miles southeast of New Orleans, in 2,552 feet of water. The field area covers Mississippi Canyon block 243, with a single floating, tension leg production platform on Mississippi Canyon block 243. Société Nationale Elf Aquitaine discovered the field in 2002. We acquired a 100% working interest in the field from Total E&P USA Inc. (“Total E&P”) in 2010. Cumulative field production through 20122014 is approximately 22.031.7 MMBoe gross (131.8(190.4 Bcfe gross). This field is a supra-salt development with 17 productive horizons at depths ranging to 9,850 feet. As of December 31, 2012, 182014, 30 wells have been drilled, eight13 of which have been successful. During 2013, we drilled one well, which began production in 2013, and we drilled another well, that had reached target depth but had not yet been completed. During 2014, the well that had reached target depth in 2013 was completed. During December 2012,2014, production from this field, net to our interest, averaged 2,4541,553 Bbls of oil per day, 282463 Bbls of NGLs per day and 3,932 Mcf12.2 MMcf of natural gas per day, for total production of 3,3914,051 Boe per day (20,347 Mcfe(24.3 MMcfe per day). Main Pass 108 Field. Main Pass 108 field consists of Main Pass blocks 107, 108 and 109. This field is located off the coast of Louisiana approximately 50 miles east of Venice in 50 feet of water. We acquired our working interests in these blocks, which range from 33% to 100%, in a transaction with Kerr-McGee Oil and Gas Corporation and we are the operator for the majority of these properties. The field produces from a number of low relief, predominantly stratigraphically trapped sands. The productive interval ranges in age from Upper Miocene Big A through Middle Miocene Big Hum. As of December 31, 2014, 48 wells have been drilled in this field, 30 of which were successful. Cumulative field production through 2014 is approximately 53.1 MMBoe gross (318.7 Bcfe gross). One new well reached target depth in 2011 and began production in 2012. In addition, one workover was performed in 2012. In 2013, we drilled and completed one well, which began production during 2013. During December 2014, production from this field, net to our interest, averaged 118 Bbls of oil per day, 178 Bbls of NGLs per day and 10.7 MMcf of natural gas per day, for total production of 2,086 Boe per day (12.5 MMcfe per day). Mississippi Canyon 782 Field (Dantzler) Mississippi Canyon 782 field is located off the coast of Louisiana, approximately 160 miles southeast of New Orleans, in 6,600 feet of water. The field area covers Mississippi Canyon block 782 and 738. We have a 20% working interest, which is operated by Noble Energy. We, along with Noble Energy, discovered the field in 2013. This field is currently under development as a subsea tieback to the Thunderhawk Field approximately 12 miles to the northwest. The field is a three-way closure trapped against a salt wall. There are two pay horizons, the upper Miocene U5 and U6 sands. As of December 31, 2014, two wells have been drilled, of which both have been successful and are targeted for first production in the first quarter of 2016. 32
Viosca Knoll 823 Field.Field (Virgo). Viosca Knoll 823 field is located off the coast of Louisiana, approximately 125 miles southeast of New Orleans, in 1,014 feet of water. The field area covers Viosca Knoll block 823 and Viosca Knoll block 822, with a single fixed leg production platform on Viosca Knoll block 823. Total E&P discovered the field in 1997. We acquired a 64% working interest in the field from Total E&P in 2010.2010 and we are the operator for this property. Cumulative field production through 20122014 is approximately 20.021.7 MMBoe gross (120.5(130.4 Bcfe gross). This field is a supra-salt development with 17 productive horizons at depths ranging to 13,335 feet. As of December 31, 2012, 122014, 14 wells have been drilled, 10 of whichhavewhich have been successful. During December 2012,2014, production from this field, net to our interest, averaged 292128 Bbls of oil per day, 187145 Bbls of NGLs per day and 6,182 Mcf5.2 MMcf of natural gas per day, for total production of 1,5101,137 Boe per day (9,060 Mcfe(6.8 MMcfe per day). High Island 22 Field.High Island 22 field consists of High Island blocks 21 and 22. The field is located approximately 10 miles off the Texas coastline in 36 feet of water. Two platforms, the “A” and the “B”, are located on block 22. We acquired a 100% working interest in the field from Kerr-McGee in 2006. The field produces from two major sands, the LH 20 and LH 24. The productive sands are Lower Miocene, Lent Hanseni in age. As of December 31, 2012, 12 wells have been drilled, eight of which have been successful. A recent field study resulted in certain reserves being classified as proved as of December 31, 2012, compared to reserves being classified as unproved in 2011. Cumulative field production through 2012 is approximately 30.0 MMBoe gross (179.9 Bcfe gross). During December 2012, production from this field, net to our interest, averaged one Bbl of oil per day, one Bbl of NGLs per day and 95 Mcf of natural gas per day, for total production of 18 Boe per day (109 Mcfe per day).
Main Pass 98 Field.Main Pass 98 field consists of Main Pass blocks 98 and 180. This field is located off the coast of Louisiana approximately 55 miles east of Venice in 91 feet of water. We acquired our 100% working interest in these blocks from NCX Co LLC in 2009. The field produces from low relief, predominantly stratigraphically trapped sands located between two merging, generally south dipping faults. The productive interval is Middle Miocene Bigenerina Humblei. Cumulative field production through 2012 is approximately 4.1 MMBoe gross (24.7 Bcfe gross). As of December 31, 2012, 11 wells have been drilled, seven of which have been successful. In 2012, no wells were drilled or recompleted and three workovers were performed. During December 2012, production from this field, net to our interest, averaged 106 Bbls of oil per day, 70 Bbls of NGLs per day and 2,171 Mcf of natural gas per day, for total production of 537 Boe per day (3,225 Mcfe per day).
East Cameron 321 Field. 321. East Cameron 321 field is located approximately 97 miles off the Louisiana coastline in 225 feet of water. Two production facilities, the “A” and “B” platforms, are located on the block. This field has multiple sands that are productive in faulted, structural traps. These sands are Pleistocene Ang B in age. As of December 31, 2012, 752014, 76 wells have been drilled 57 of which 58 have been successful. In 2014 we drilled and completed one well. Cumulative field production through 20122014 is approximately 93.694.6 MMBoe gross (561.7 Bcfe gross).(567.3 Bcfe) gross. We own a 100% working interest in the field and are the operator.operator of the field. This field is producing at a restricted rate as a result of a damaged departing gas sales line. During December 2012,January to October 2014, which was prior to the departing gas sales line damage, production from this field, net to our interest, averaged 1,279890 Bbls of oil per day and 2660.2 MMcf of natural gas per day, for total production of 1,324928 Boe per day (7,942 Mcfe(5.6 MMcfe per day). Main Pass 283. Proved Reserves Our estimated proved reserves totaled 117.5Main Pass 283 field consists of Main Pass blocks 284, 279 and 283 and Viosca Knoll Block 734. This field is located off the coast of Louisiana approximately 75 miles east of Venice in 315 feet of water. We acquired our working interests in these blocks in 2003, which range from 50% to 100%, in a transaction with ConocoPhillips. The field produces from a number of low relief, predominantly stratigraphically trapped sands. The productive interval ranges in age from Upper Miocene Big A through Middle Miocene Cristellaria I. Cumulative field production through 2014 is approximately 24.3 MMBoe (705.1 Bcfe) atgross (145.8 Bcfe gross). As of December 31, 2012. The mix by product was 47%2014, 12 wells have been drilled in this field, of which 10 were successful. During December 2014, production from this field, net to our interest, averaged 398 Bbls of oil 13%per day, 195 Bbls of NGLs per day and 40%3.9 MMcf of natural gas determined using the energy-equivalent ratio noted below. per day, for total production of 1,251 Boe per day (7.5 MMcfe per day).
Proved Reserves Our proved reserves were estimated by NSAI, our independent petroleum consultant. Our proved reserves are summarized below. These reserveconsultant and amounts provided in this Annual Report on Form 10-K are consistent with filings we make with other federal agencies. Our proved reserves as of December 31, 2014 are summarized below and the mix by product was 52% oil, 13% NGLs and 35% natural gas determined using the energy-equivalent ratio noted below.
| | | | | | | | | | | | | Total Energy-Equivalent Reserves (2) | | | | | | Classification of Proved Reserves (1) | Oil (MMBbls) | | | NGLs (MMBbls) | | | Natural Gas (Bcf) | | | Oil Equivalent (MMBoe) | | | Natural Gas Equivalent (Bcfe) | | | % of Total Proved | | | PV-10 (3) (In millions) | | Proved developed producing | | 29.8 | | | | 9.2 | | | | 177.7 | | | | 68.7 | | | | 412.2 | | | | 57 | % | | $ | 1,903 | | Proved developed non-producing | | 5.9 | | | | 1.5 | | | | 43.4 | | | | 14.6 | | | | 87.5 | | | | 12 | % | | | 304 | | Total proved developed | | 35.7 | | | | 10.7 | | | | 221.1 | | | | 83.3 | | | | 499.7 | | | | 69 | % | | | 2,207 | | Proved undeveloped | | 26.0 | | | | 5.1 | | | | 33.8 | | | | 36.7 | | | | 220.3 | | | | 31 | % | | | 398 | | Total proved | | 61.7 | | | | 15.8 | | | | 254.9 | | | | 120.0 | | | | 720.0 | | | | 100 | % | | $ | 2,605 | |
| | | | | | | | | | | | | | | | | | | | | | | | | | | | | | | | As of December 31, 2012 | | | | | | | | | | | | | | Total Equivalent
Reserves | | | | | | | | Classification of Proved Reserves (1) | | Oil
(MBbls) | | | NGLs
(MBbls) | | | Natural
Gas
(MMcf) | | | Oil
Equivalent
(MBoe) (2) | | | Natural
Gas
Equivalent
(MMcfe) (2) | | | % of
Total
Proved | | | PV-10 (3)
(In millions) | | Proved developed producing | | | 24,673 | | | | 8,906 | | | | 173,906 | | | | 62,563 | | | | 375,380 | | | | 53 | % | | $ | 1,664 | | Proved developed non-producing | | | 10,663 | | | | 2,051 | | | | 69,535 | | | | 24,303 | | | | 145,819 | | | | 21 | % | | | 777 | | | | | | | | | | | | | | | | | | | | | | | | | | | | | | | Total proved developed | | | 35,336 | | | | 10,957 | | | | 243,441 | | | | 86,866 | | | | 521,199 | | | | 74 | % | | | 2,441 | | Proved undeveloped | | | 19,490 | | | | 4,220 | | | | 41,614 | | | | 30,646 | | | | 183,874 | | | | 26 | % | | | 379 | | | | | | | | | | | | | | | | | | | | | | | | | | | | | | | Total proved | | | 54,826 | | | | 15,177 | | | | 285,055 | | | | 117,512 | | | | 705,073 | | | | 100 | % | | $ | 2,820 | | | | | | | | | | | | | | | | | | | | | | | | | | | | | | |
| | | Volume measurements: | | | MBblsMMBbls – thousandmillion barrels for crude oil, condensate or NGLs
| | MMcfBcf – millionbillion cubic feet | MBoe – thousandmillion barrels of oil equivalent | | MMcfeBcfe – millionbillion cubic feet of gas equivalent |
(1) | In accordance with guidelines established by the SEC, our estimated proved reserves as of December 31, 20122014 were determined to be economically producible under existing economic conditions, which requires the use of the 12-month average commodity price for each product, calculated as the unweighted arithmetic average of the first-day-of-the-month price for the year end December 31, 2012.2014. Prices were adjusted by lease for quality, transportation, fees, energy content and regional price differentials. For oil, the West Texas Intermediate posted price was used in the calculation and, after adjustments, a price of $98.13$91.12 per Bbl was used in computing the amounts above. For NGLs, a ratio was computed for each field of the NGLs realized price compared to the oil realized price. Then, this ratio was applied to the oil price using SEC guidance. The NGLs price of $47.30$34.63 per Bbl was used in computing the amounts above. For natural gas, the average Henry Hub spot price was used in the calculation and the adjusted price of $2.77$4.27 per Mcf was used in computing the amounts above. Such prices were held constant throughout the estimated lives of the reserves. Future production, development costs and ARO are based on year-end costs with no escalations. |
33
(2) | Energy equivalents are determined using the energy-equivalent ratio of six Mcf of natural gas to one Bbl of crude oil, condensate or NGLs (totals may not compute due to rounding). The energy-equivalent ratio does not assume price equivalency, and the energy-equivalent price for oil and NGLs may differ significantly. |
(3) | We refer to PV-10 as the present value of estimated future net revenues of estimated proved reserves as calculated by our independent petroleum consultant using a discount rate of 10%. This amount includes projected revenues, estimated production costs and estimated future development costs and excludes ARO. We have also included PV-10 after ARO below. PV-10 after ARO includes the present value of ARO related to proved reserves using a 10% discount rate and no inflation of current costs. Neither PV-10 nor PV-10 after ARO are financial measures defined under generally accepted accounting principles (“GAAP”);GAAP; therefore, the following table reconciles these amounts to the standardized measure of discounted future net cash flows, which is the most directly comparable GAAP financial measure. Management believes that the non-GAAP financial measures of PV-10 and PV-10 after ARO are relevant and useful for evaluating the relative monetary significance of oil and natural gas properties. PV-10 and PV-10 after ARO are used internally when assessing the potential return on investment related to oil and natural gas properties and in evaluating acquisition opportunities. We believe the use of pre-tax measures is valuable because there are many unique factors that can impact an individual company when estimating the amount of future income taxes to be paid. Management believes that the presentation of PV-10 and PV-10 after ARO provide useful information to investors because they are widely used by professional analysts and sophisticated investors in evaluating oil and natural gas companies. PV-10 and PV-10 after ARO are not measures of financial or operating performance under GAAP, nor are they intended to represent the current market value of our estimated oil and natural gas reserves. PV-10 and PV-10 after ARO should not be considered in isolation or as substitutes for the standardized measure of discounted future net cash flows as defined under GAAP. |
The reconciliation of PV-10 and PV-10 after ARO to the standardized measure of discounted future net cash flows relating to our estimated proved oil and natural gas reserves is as follows (in millions): | As of December 31, 2014 | | Present value of estimated future net revenues (PV-10) | $ | 2,605 | | Present value of estimated ARO, discounted at 10% | | (301 | ) | PV-10 after ARO | | 2,304 | | Future income taxes, discounted at 10% | | (601 | ) | Standardized measure of discounted future net cash flows | $ | 1,703 | |
| | | | | | | | As of
December 31, 2012 | | Present value of estimated future net revenues (PV-10) | | $ | 2,820 | | Present value of estimated ARO, discounted at 10% | | | (328 | ) | | | | | | PV-10 after ARO | | | 2,492 | | Future income taxes, discounted at 10% | | | (646 | ) | | | | | | Standardized measure of discounted future net cash flows | | $ | 1,846 | | | | | | |
Changes in Proved Reserves Our total proved reserves increased to 117.5more than production, resulting in a net increase, and were 120.0 MMBoe (705.1 Bcfe) at December 31, 2012 from 116.92014 compared to 117.7 MMBoe (701.1 Bcfe) at December 31, 2011, primarily as2013. The change between periods is a result of extensions and discoveries of 15.79.7 MMBoe, (94.5 Bcfe) due to our participation in the drillingacquisitions of 25 successful exploratory wells (gross)6.1 MMBoe and increases resulting from well completions and recompletions. Thepositive net revisions of 4.1 MMBoe, partially offset by 17.6 MMBoe of production. Increases for extensions and discoveries were primarily at Mississippi Canyon 782 (Dantzler) related to two wells and the Spraberry field related to 51 wells. Increases from acquisitions were primarily due to acquiring interests in the Yellow RoseWoodside Properties (11.6 MMBoe /69.5 Bcfe),and increasing ownership in the High Island 22 field (2.7 MMBoe/16.2 Bcfe) andFairway field. Revisions were impacted by various fields, with the West Cameron 71 field (1.0 MMBoe/6.1 Bcfe). For the Yellow Rose Properties, the increase to proved reserves was due to 11 exploration wellsprimary changes being completed. In addition, there was a redetermination of reserves related to successful horizontal drilling and drilling using 40 acre spacing in certain areas. For the High Island 22 field, the increase in proved reserves was due to a recent field study that demonstrated that additional reserves could be recovered by drilling a replacement for a well that experienced a mechanical failure. The increaseincreases at the West Cameron 71 field was due to a successful exploration well. Estimated proved reserves also increased fromFairway and Mississippi Canyon 800 fields, partially offset by decreases at the acquisition of Newfield Properties discussed in Item 1,Business, which added 7.0 MMBoe (42.0 Bcfe). Reserves decreased from revisions of previous estimates by 4.6 MMBoe (27.5 Bcfe)Spraberry and by 0.4 MMBoe (2.2 Bcfe) from the sale of one field. Decreases due to production were 17.1 MMBoe (102.8 Bcfe).Ship Shoal 349 (Mahogany) fields. SeeDevelopment of Proved Undeveloped Reserves below for a table reconciling the change in proved undeveloped reserves during 2012.2014. SeeFinancial Statements –and Supplementary Data– Note 21 – Supplemental Oil and Gas Disclosures under Part II, Item 8 in this Form 10-Kfor additional information. Our estimates of proved reserves, PV-10 and standardized measure as of December 31, 2014 are calculated based upon SEC mandated 2014 unweighted average first-day-of-the-month oil and natural gas benchmark prices, which are substantially above prices realized in December 2014 and January 2015. The prices of crude oil, NGLs and natural gas have declined substantially since June 2014. The spot price of WTI crude oil has decreased from $107.00 per barrel in the middle of June 2014 to as low as $44.00 per barrel in January 2015. In recent months, Henry Hub spot prices for natural gas have declined to lower than $3.00 per Mcf compared to average prices during 2014 well in excess of $4.00 per Mcf. Sustained lower prices will result in the prices used in our estimates through year-end 2015 being substantially lower, which, absent significant proved reserve additions, will reduce future estimated proved reserve volumes due to lower economic limits and economic return thresholds for undeveloped reserves, as well as impact our quarterly full cost impairment ceiling tests and volume-dependent depletion cost calculations. 34
Qualifications of Technical Persons and Internal Controls Overover Reserves Estimation Process Our estimated proved reserve information as of December 31, 20122014 included in this Form 10-K was prepared by our independent petroleum consultant,consultants, NSAI, in accordance with generally accepted petroleum engineering and evaluation principles and definitions and guidelines established by the SEC. The scope and results of their procedures are summarized in a letter included as an exhibit to this Form 10-K. The primary technical person at NSAI responsible for overseeing the preparation of the reserves estimates presented herein has B.S. and M.S. degrees in Civil Engineering and has been a Registered Professional Engineer in the State of Texas for 2426 years and a member of the Society of Petroleum Engineers for over 2830 years. He has over 3537 years total experience in the oil and gas industry, with over 2123 years of reservoir engineering experience. His areas of experience are the continental shelf and deepwater Gulf of Mexico, San Juan Basin, onshore and offshore Mexico, offshore Africa, and unconventional gas sources worldwide. NSAI has informed us that he meets or exceeds the education, training, and experience requirements set forth in theStandards Pertaining to the Estimating and Auditing of Oil and Gas Reserves Information promulgated by the Society of Petroleum Engineers and is proficient in the application of industry standard practices to engineering evaluations as well as the application of SEC and other industry definitions and guidelines. We maintain an internal staff of reservoir engineers and geoscience professionals who work closely with our independent petroleum consultant to ensure the integrity, accuracy and timeliness of the data, methods and assumptions used in the preparation of the reserves estimates. Additionally, our senior management reviews any significant changes to our proved reserves on a quarterly basis. Our Reservoir Engineering ManagerDirector has served in that capacity since 2013, as Reservoir Engineering Manager since 2006, after having servedand as a Staff Reservoir Engineer sinceupon joining the Company in 2004. Prior to joining the Company, he served as a Reservoir Engineer at Shell, then VP of Reservoir Engineering at Freeport-McMoRan Oil & Gas and later as Manager Acquisitions Engineering at Matrix Oil & Gas. He received a Bachelor of Science degree in Engineering Science from Iowa State University in 1972. Reserve Technologies Proved reserves are those quantities of oil and natural gas, which, by analysis of geoscience and engineering data, can be estimated with reasonable certainty to be economically producible from a given date forward, from known reservoirs, and under existing economic conditions, operating methods, and government regulations. The term “reasonable certainty” implies a high degree of confidence that the quantities of oil and/or natural gas actually recovered will equal or exceed the estimate. To achieve reasonable certainty, our independent petroleum consultant employed technologies that have been demonstrated to yield results with consistency and repeatability. The technologies and economic data used in the estimation of our proved reserves include, but are not limited to, well logs, geologic maps, seismic data, well test data, production data, historical price and cost information and property ownership interests. The accuracy of the estimates of our reserves is a function of: · | the quality and quantity of available data and the engineering and geological interpretation of that data; |
· | estimates regarding the amount and timing of future operating costs, severance taxes, development costs and workovers, all of which may vary considerably from actual results; |
· | the accuracy of various mandated economic assumptions such as the future prices of oil and natural gas; and |
· | the judgment of the persons preparing the estimates. |
Because these estimates depend on many assumptions, any or all of which may differ substantially from actual results, reserve estimates may be different from the quantities of oil and natural gas that are ultimately recovered. Reporting of Natural Gas and Natural Gas Liquids We produce NGLs as part of the processing of our natural gas. The extraction of NGLs in the processing of natural gas reduces the volume of natural gas available for sale. We report all natural gas production information net of the effect of any reduction in natural gas volumes resulting from the processing of NGLs. We convert Bbl to Mcfe using an energy-equivalent ratio of six Mcf to one Bbl of oil, condensate or NGLs. This energy-equivalent ratio does not assume price equivalency, and the energy-equivalent prices for oil, NGLs and natural gas may differ substantially. 35
Development of Proved Undeveloped Reserves Our proved undeveloped reserves (“PUDs”) were estimated by NSAI, our independent petroleum consultant. Future development costs associated with our PUDs at December 31, 20122014 were estimated at $583.6$865.8 million. OurThe following table presents our PUDs by field as of December 31, 2012 and 2011 are as follows:(in MMBoe):
| As of December 31, | | | 2014 | | | 2013 | | | 2012 | | Ship Shoal 349 (Mahogany) | | 2.1 | | | | 1.3 | | | | 4.8 | | Mississippi Canyon 243 (Matterhorn) | | 1.4 | | | | 1.3 | | | | 2.1 | | Viosca Knoll 823 (Virgo) | | 2.0 | | | | 1.4 | | | | 1.4 | | Spraberry (Yellow Rose) | | 24.9 | | | | 25.7 | | | | 19.6 | | Mississippi Canyon 698 (Big Bend) (1) | | 1.9 | | | | 1.9 | | | | — | | Mississippi Canyon 538/582 (Medusa) | | 0.3 | | | | — | | | | — | | Mississippi Canyon 782 (Dantzler) (1) | | 4.1 | | | | — | | | | — | | High Island 21/22 | | — | | | | — | | | | 2.7 | | Total | | 36.7 | | | | 31.6 | | | | 30.6 | |
| | | | | | | | | | | | | | | | | | | | December 31, 2012 | | | December 31, 2011 | | | | | MMBoe | | | Bcfe | | | MMBoe | | | Bcfe | | Ship Shoal 349 (Mahogany) | | | 4.8 | | | | 29.1 | | | | 16.6 | | | | 99.8 | | Mississippi Canyon 243 | | | 2.1 | | | | 12.3 | | | | 3.1 | | | | 18.8 | | Viosca Knoll 823 | | | 1.4 | | | | 8.6 | | | | 1.4 | | | | 8.2 | | Spraberry (Yellow Rose) | | | 19.6 | | | | 117.7 | | | | 19.4 | | | | 116.1 | | High Island 22 | | | 2.7 | | | | 16.2 | | | | — | | | | — | | | | | | | �� | | | | | | | | | | | | Total | | | 30.6 | | | | 183.9 | | | | 40.5 | | | | 242.9 | | | | | | | | | | | | | | | | | | |
(1) | There has been no production at these fields as of December 31, 2014. |
The following table presents a reconciliation of our PUDs for 2012:(in MMBoe): | | | | | | | | | | | | Year 2012 | | | | | MMBoe | | | Bcfe | | Proved undeveloped reserves – beginning of year | | | 40.5 | | | | 242.9 | | Reductions: | | | | | | | | | Ship Shoal 349 (Mahogany) – three wells drilled, two wells completed, reclassified to proved developed | | | (11.8 | ) | | | (70.8 | ) | Mississippi Canyon 243 – one well completed | | | (1.6 | ) | | | (9.8 | ) | Spraberry (Yellow Rose) – PUD wells reclassified and performance | | | (9.7 | ) | | | (58.0 | ) | Revisions due to pricing | | | (0.2 | ) | | | (0.9 | ) | | | | | | | | | | Subtotal – reductions | | | (23.3 | ) | | | (139.5 | ) | | | | | | | | | | Balance after reductions | | | 17.2 | | | | 103.4 | | | | | | | | | | | | | | Additions: | | | | | | | | | High Island 22 – reclassification from unproved due to study | | | 2.7 | | | | 16.2 | | Spraberry (Yellow Rose) – PUD well additions | | | 10.0 | | | | 59.6 | | Other changes | | | 0.7 | | | | 4.7 | | | | | | | | | | | Subtotal – additions | | | 13.4 | | | | 80.5 | | | | | | | | | | | Proved undeveloped reserves – end of year | | | 30.6 | | | | 183.9 | | | | | | | | | | |
| 2014 | | | 2013 | | | 2012 | | Proved undeveloped reserves, beginning of year | | 31.6 | | | | 30.6 | | | | 40.5 | | Reductions: | | | | | | | | | | | | Ship Shoal 349 (Mahogany) | | — | | | | (4.8 | ) | | | (11.8 | ) | Mississippi Canyon 243 (Matterhorn) | | — | | | | (0.7 | ) | | | (1.6 | ) | Spraberry (Yellow Rose) drilling, completions and technical | | (2.3 | ) | | | (4.6 | ) | | | (9.7 | ) | Spraberry (Yellow Rose) well performance and viability | | (2.4 | ) | | | (1.5 | ) | | | (0.2 | ) | High Island 21/22 | | — | | | | (2.7 | ) | | | — | | Subtotal - reductions | | (4.7 | ) | | | (14.3 | ) | | | (23.3 | ) | Balance after reductions | | 26.9 | | | | 16.3 | | | | 17.2 | | Additions: | | | | | | | | | | | | Ship Shoal 349 (Mahogany) | | 0.8 | | | | 1.3 | | | | — | | Viosca Knoll 823 (Virgo) | | 0.6 | | | | — | | | | — | | Spraberry (Yellow Rose) well additions and other | | 3.9 | | | | 7.9 | | | | 10.0 | | Spraberry (Yellow Rose) 40 acre down-spacing in 2013 | | — | | | | 4.2 | | | | — | | Mississippi Canyon 698 (Big Bend) (2) | | — | | | | 1.9 | | | | — | | Mississippi Canyon 782 (Dantzler) (2) | | 4.1 | | | | — | | | | — | | High Island 21/22 | | — | | | | — | | | | 2.7 | | Other changes | | 0.4 | | | | — | | | | 0.7 | | Subtotal - additions | | 9.8 | | | | 15.3 | | | | 13.4 | | Proved undeveloped reserves, end of year | | 36.7 | | | | 31.6 | | | | 30.6 | |
| | | Volume measurements: | | | MMBoe – million barrels of oil equivalent | | Bcfe – billion cubic feet equivalent |
During 2012, we drilled numerous development wells that converted PUDs to proved developed reserves (“PDs”) and spent $263.6 million on development of PUDs during 2012.
36
Activity in 2012 allowed conversion of approximately 50% of the PUDs existing at December 31, 2011 to proved developed reserves as of December 31, 2012. At our Ship Shoal 349/359 (Mahogany) field, we completed two wells, (SS 359 A5 ST and SS 359 A13). As of December 31, 2012, we were in the process of completing the SS 359 A9 ST well, which moved additional reserves from PUDs to PDs. In 2013, we plan to drill the SS 359 A14 well and A15 well. This drilling program has resulted in the reclassification of a substantial portion of the PUDs to PDs in the Mahogany field. The PUDs at our Mississippi Canyon 243 field and Viosca Knoll 823 fields were obtained through acquisitions in 2010. We completed one well at Mississippi Canyon 243 (MC 243 A4 ST) in 2012 and are currently drilling another development well (MC 243 A2 ST BP1). Development of the Mississippi Canyon 243 field and Viosca Knoll 823 field is expected to continue into 2014. In May 2011, we acquired the Yellow Rose Properties, which contributed to a significant increase in PUDs in 2011. In this field, we completed 27 development wells and nine exploration wells from the acquisition date of May 11, 2011 to December 31, 2011. In 2012, we completed 53 development wells and 11 exploration wells. One of the wells completed was a horizontal well and two other horizontal wells reached target depth in 2012, which proved the concept and allowed additional horizontal PUD locations to be booked. Additionally, wells completed in 2011 and 2012 proved that the concept of down spacing to 40-acres was viable in a portion of the field, allowing the conversion of certain unproven locationsrelated to PUDs in 2012. In 2013, we expect2014:
· | During 2014, we drilled 20 development wells that converted PUDs to proved developed producing reserves (“PDPs”) and spent $149.5 million on development of PUDs. Activity in 2014 allowed reclassification of approximately 15% of the PUDs existing at December 31, 2013. |
· | At our Spraberry field (Yellow Rose), we drilled and completed 20 development wells, which moved PUDs to PDPs. In addition, PUDs were decreased due to certain wells being evaluated as uneconomic due to performance and for technical reasons. PUDs were increased due to exploration drilling activity, both by us and offset operators. Our drilling activity for 2015 is expected to be lower compared to 2014, then increasing in 2016 and beyond as prices recover. |
· | At our Ship Shoal 349 field (Mahogany), we experienced technical difficulties from a cracked casing, which led us to abandon the well. As of December 31, 2014, we were in the process of drilling a new well (the A-18 well) which was expected to convert the undeveloped reserves to PDP’s, but have stacked the rig in the first quarter of 2015 due to substantially reduced oil prices. We plan to commence drilling this well once oil prices recover. |
· | The PUDs at our Mississippi Canyon 782 field (Dantzler) were added as a result of drilling activity in 2013 and completion operations in 2014 to classify reserves as proved undeveloped. This field is not operated by us so we are subject to the decisions of the operator. Current plans are to complete the two wells in this field in 2015 that have been drilled to target depth and to begin production in the first quarter of 2016. |
· | At our Viosca Knoll 823 field (Virgo), we have elected to add a PUD to replace declining reserves in the field. This decision was made due to the magnitude of the reserve potential. We perceived less risk in a sidetrack of an existing well compared to a major workover to produce these reserves. |
Activity related to drill approximately 26PUDs in 2013: · | During 2013, we drilled numerous development wells that converted PUDs to PDPs and spent $270.4 million on development of PUDs. Activity in 2013 allowed reclassification of approximately 47% of the PUDs existing at December 31, 2012. |
· | At our Ship Shoal 349 field (Mahogany), we drilled and completed the SS 359 A14 BP2 well, which resulted in the conversion of all of the PUDs existing at 2012 to PDPs in 2013. The SS 359 A14 BP2 well was the fifth well drilled under our 2010 Development Plan. As of December 31, 2013, we were in the process of drilling our sixth well (SS 359 A015) under this multi-well program. This multi-well program is expected to continue into 2014 and beyond. Also, as a result of our successful drilling program, one new PUD location was added during 2013. |
· | The PUDs at our Mississippi Canyon 243 field (Matterhorn) and our Viosca Knoll 823 field (Virgo) were obtained through acquisitions in 2010. We drilled and completed one development well (MC 243 A2 ST2 BP2) at the Mississippi Canyon 243 field (Matterhorn), which moved PUDs to PDPs. Also, one new PUD location was added during 2013. Development of these two fields is expected to continue into future years. |
· | PUDs at our Spraberry field (Yellow Rose) were obtained primarily through an acquisition in 2011. We drilled and completed 33 development wells, which moved PUDs to PDPs. In addition, PUDs were decreased due to certain wells being evaluated as uneconomical due to performance and for technical reasons. PUDs were increased due to exploration drilling activity, both by us and other companies, and also from additions related to 40 acre down-spacing. Our drilling plans for 2014 include an active drilling program in the Spraberry field (Yellow Rose) and we expect to continue our drilling activity beyond 2014. |
· | In the High Island 21/22 field, we drilled and completed the HI 0021 A1 BP1 well, which initially resulted in the conversion of all the PUDs to PDPs. Subsequently, these PDPs were removed from proved reserves due to well performance. |
· | The additional PUDs at the Mississippi Canyon 698 field (Big Bend) were from our joint interest ownership in the non-operated field and are related to the MC 698 #1 well, which was drilled in 2012. |
37
Activity related to PUDs in 2012: · | During 2012, we drilled numerous development wells that converted PUDs to PDPs and spent $263.6 million on development of PUDs. Activity in 2012 allowed reclassification of approximately 58% of the PUDs existing at December 31, 2011. |
· | At our Ship Shoal 349 field (Mahogany), we completed one well, (SS 359 A5 ST) and two additional wells were side tracked. As of December 31, 2012, we were in the process of completing the SS 359 A9 ST well, which moved additional reserves from PUDs to PDPs. |
· | We completed one well (MC 243 A4 ST) at Mississippi Canyon 243 field (Matterhorn) in 2012. |
· | At our Spraberry field (Yellow Rose), we completed 53 development wells and 11 exploration well, comprised of seven horizontal wells and 20 vertical wells. One of the wells completed was a horizontal well and two other horizontal wells reached target depth in 2012, which proved the concept and allowed additional horizontal PUD locations to be booked. Additionally, wells completed in 2011 and 2012 proved that the concept of down spacing to 40-acres was viable in a portion of the field, allowing the conversion of certain unproven locations to PUDs in 2012. |
· | In the High Island 21/22 field, a field study demonstrated that additional reserves could be recovered by drilling a replacement for a well that had experienced a mechanical failure. This allowed unproved reserves in 2011 to be reclassified as proved reserves in 2012. |
SeeBusiness under Part I, Item 1,Our Fields in Item 2 above andFinancial Statements and Supplementary Data – Note 2 – Acquisitions and Divestituresunder Part II, Item 8 in this Form 10-K for additional information on the Yellow Rose Properties.information. In the High Island 22 field, a recent field study demonstrated that additional reserves could be recovered by drilling a replacement for a well that experienced a mechanical failure. This allowed unproved reserves in 2011 to be reclassified as proved reserves as of December 31, 2012.
We believe that we will be able to develop all but 1.4 MMBoe of the reserves classified as PUDs, or approximately 96%, out of the total of 36.7 MMBoe classified as PUDs at December 31, 20122014, within five years from the date such reserves were initially recorded. The exception is at the Mississippi Canyon 243 field (Matterhorn) where the field is being developed using a single floating tension leg platform requiring an extended sequential development plan. The platform cannot support a rig that would allow additional wells to be drilled, but can support a rig to allow sidetracking of wells. These PUDs were originally recorded in our reserves as of December 31, 2010. The development of the 1.4 MMBoe of PUDs will be delayed until an existing well is depleted and available to sidetrack. Based on the latest reserve report, a well is expected to be drilled to develop the Mississippi Canyon 243 field (Matterhorn) PUDs in 2020. Our capital budget for 20132015 for development is up 6% from our 2012 capital budget, with 37% dedicated to development activities, split 43% offshore and 57% onshore.approximately $120 million. The capital allocated to our development activities will assist us in converting the PUDs to proved developed reserves.PDPs. A recovery in crude oil prices could lead to an increase in development expenditures.
38
Acreage The following summarizes our leasehold at December 31, 2012.2014. Deepwater refers to acreage in over 500 feet of water. | | | | Developed Acreage | | | Undeveloped Acreage | | | Total Acreage | | Developed Acreage | | | Undeveloped Acreage | | | Total Acreage | | | | | Gross | | | Net | | | Gross | | | Net | | | Gross | | | Net | | Gross | | | Net | | | Gross | | | Net | | | Gross | | | Net | | Shelf | | | 586,624 | | | | 356,552 | | | | 124,137 | | | | 124,137 | | | | 710,761 | | | | 480,689 | | | 507,102 | | | | 331,450 | | | | 77,985 | | | | 77,985 | | | | 585,087 | | | | 409,435 | | Deepwater | | | 124,083 | | | | 65,831 | | | | 357,120 | | | | 240,406 | | | | 481,203 | | | | 306,237 | | | 179,331 | | | | 76,434 | | | | 359,746 | | | | 212,603 | | | | 539,077 | | | | 289,037 | | | | | | | | | | | | | | | | | | | | | | Total Offshore | | | 710,707 | | | | 422,383 | | | | 481,257 | | | | 364,543 | | | | 1,191,964 | | | | 786,926 | | | 686,433 | | | | 407,884 | | | | 437,731 | | | | 290,588 | | | | 1,124,164 | | | | 698,472 | | Onshore | | | 24,978 | | | | 20,540 | | | | 196,055 | | | | 163,824 | | | | 221,033 | | | | 184,364 | | | 30,228 | | | | 25,952 | | | | 24,500 | | | | 15,749 | | | | 54,728 | | | | 41,701 | | | | | | | | | | | | | | | | | | | | | | Total | | | 735,685 | | | | 442,923 | | | | 677,312 | | | | 528,367 | | | | 1,412,997 | | | | 971,290 | | | 716,661 | | | | 433,836 | | | | 462,231 | | | | 306,337 | | | | 1,178,892 | | | | 740,173 | | | | | | | | | | | | | | | | | | | | | |
Approximately 54%58% of our total net offshore acreage is developed and approximately 11%62% of our total net onshore acreage is developed. Within the onshore net acreage, the Spraberry field (Yellow Rose) is approximately 90% developed and all the other onshore prospects combined are approximately 17% developed. We have the right to propose future exploration and development projects on the majority of our acreage. For the offshore undeveloped leasehold, 48,68959,498 net acres (20%) of the total 364,543290,588 net undeveloped offshore acres (13%) could expire in 2013, 95,393 net acres (26%) could expire in 2014, 57,166 net acres (16%) could expire in 2015, 31,96835,965 net acres (9%(12%) could expire in 2016, and 131,32779,180 net acres (36%(28%) could expire in 2017, 52,121 net acres (18%) could expire in 2018, and 63,824 net acres (22%) could expire in 2019 and beyond. For the onshore undeveloped leasehold, our rights to approximately 148,31810,612 net acres (67%) of the total 163,82415,749 net undeveloped onshore acres (91%) could expire in 2013, 5,463 net acres (3%) could expire in 2014, 10,038 net acres (6%) could expire in 2015 and five5,088 net acres (33%) could expire thereafter. Ofin 2016. Within the onshore net undeveloped onshore leasehold, there are 138,235acreage, the Spraberry field (Yellow Rose) comprises 2,486 net acres that canand the other onshore prospects comprise the remaining 13,263 acres of the total 15,749 net acres. The expiration of the onshore undeveloped acreage may be extended by drilling two additional wells in 2013 and further extended by additional operationsthrough the purchase of new leasehold rights or production in future years.extension of leasehold rights, but these potential arrangements were not contractual rights as of December 31, 2014. In making decisions regarding drilling and operations activity for 2013,2015 and beyond, we give consideration to undeveloped leasehold that may expire in the near term in order that we might retain the opportunity to extend such acreage. Our net offshore acreage increased 273,645decreased 39,067 net acres (53%(5%) from December 31, 20112013 and our net onshore acreage increased 10,930decreased 141,170 net acres (6%(77%) from December 31, 2011.2013. The increase in our net offshore acreage was primarily attributable to the Newfield Properties acquisition and offshore property interests acquired through purchase from the government. This increase was partially offset due to certain offshore leases that terminated and the sale of our interest at South Timbalier 41. The increasedecrease in our net onshore acreage iswas primarily attributabledue to additional leasehold interests acquiredreassigning acres back to our original assignor at our Star Project in East Texas. Production For the years 2012, 20112014, 2013 and 2010,2012, our net daily production averaged 280.9 MMcfe, 278.2 MMcfe48.3 MBoe, 49.3 MBoe and 238.4 MMcfe,46.8 MBoe, respectively. Production decreased in 2014 from 2013 primarily due to an out of period adjustment of 0.9 MBoe/day recorded in 2013, natural production declines, production deferrals and divestitures, partially offset by acquisitions and new production. Production increased in 20122013 from 20112012 primarily due to acquisitions completed in 2012 and 2011 and increases in the Ship Shoal 349 field attributable to development activities and the out of period adjustment, partially offset by decreases related to storms, pipeline shutdownsnatural production declines and natural reservoir declines. Production increasedproduction deferrals. See Management’s Discussion and Analysis of Financial Condition and Results of Operations – Results of Operations under Part II, Item 7 in 2011 from 2010 primarily due to acquisitions completed in 2011 and 2010 and the resumption of operations in certain fields that had been shut down from June 2010 to March 2011 due to pipeline outages. this Form 10-K for additional information.39
Production History The following presents historical information about our produced oil, NGLs and natural gas volumes from all of our producing fields over the past three fiscal years. | Year Ended December 31, | | | 2014 | | | 2013 | | | 2012 | | Net Sales: | | | | | | | | | | | | Oil (MBbls) | | 7,176 | | | | 7,018 | | | | 6,033 | | NGLs (MBbls) | | 2,112 | | | | 2,091 | | | | 2,129 | | Oil and NGLs (MBbls) | | 9,288 | | | | 9,110 | | | | 8,163 | | Natural gas (MMcf) | | 50,088 | | | | 53,257 | | | | 53,825 | | Total oil equivalent (MBoe) | | 17,636 | | | | 17,986 | | | | 17,133 | | Total natural gas equivalents (MMcfe) | | 105,815 | | | | 107,915 | | | | 102,800 | |
| | | | | | | | | | | | | | | | Year Ended December 31, | | | | 2012 | | | 2011 | | | 2010 | | Net sales: | | | | | | | | | | | | | Oil (MBbls) | | | 6,033 | | | | 6,073 | | | | 5,863 | | NGLs (MBbls) | | | 2,129 | | | | 1,892 | | | | 1,190 | | Natural gas (MMcf) | | | 53,825 | | | | 53,743 | | | | 44,713 | | Total oil equivalent (MBoe) | | | 17,133 | | | | 16,921 | | | | 14,505 | | Total natural gas equivalent (MMcfe) | | | 102,800 | | | | 101,528 | | | | 87,032 | |
| | | Volume measurements: | | | MBbls – thousand barrels for crude oil, condensate or NGLs | | MMcf – million cubic feet | MBoe – thousand barrels of oil equivalent | | MMcfe – million cubic feet equivalent |
Refer to the descriptions of our 10 largest fields reported earlier in this Item 2,Properties, for historical information about our produced volumes from our Spraberry field (Yellow Rose Properties)Rose) and Ship Shoal 349349/359 field (Mahogany) over the past three fiscal years, each of which have proved reserves exceeding 15% of our total proved reserves. Also refer toSelected Financial Data – Historical Reserve and Operating Informationunder Part II, Item 6 ofin this Form 10-K for additional historical operating data, including average realized sale prices and production costs. Productive Wells The following presents our ownership interest at December 31, 20122014 in our productive oil and natural gas wells. A net well represents our fractional working interest of a gross well in which we own less than all of the working interest. Offshore Wells
Offshore Wells | Oil Wells | | | Gas Wells | | | Total Wells | | | Gross | | | Net | | | Gross | | | Net | | | Gross | | | Net | | Operated | | 86 | | | | 75 | | | | 59 | | | | 46 | | | | 145 | | | | 121 | | Non-operated | | 28 | | | | 8 | | | | 35 | | | | 11 | | | | 63 | | | | 19 | | Total offshore wells | | 114 | | | | 83 | | | | 94 | | | | 57 | | | | 208 | | | | 140 | |
| | | | | | | | | | | | | | | | | | | | | | | | | | | | Oil Wells | | | Gas Wells | | | Total Wells | | | | | Gross | | | Net | | | Gross | | | Net | | | Gross | | | Net | | Operated | | | 83 | | | | 72 | | | | 87 | | | | 69 | | | | 170 | | | | 141 | | Non-operated | | | 43 | | | | 18 | | | | 40 | | | | 11 | | | | 83 | | | | 29 | | | | | | | | | | | | | | | | | | | | | | | | | | | | | | 126 | | | | 90 | | | | 127 | | | | 80 | | | | 253 | | | | 170 | | | | | | | | | | | | | | | | | | | | | | | | | | |
Onshore Wells
Onshore Wells | Oil Wells | | | Gas Wells | | | Total Wells | | | Gross | | | Net | | | Gross | | | Net | | | Gross | | | Net | | Operated | | 238 | | | | 237 | | | | 10 | | | | 8 | | | | 248 | | | | 245 | | Non-operated | | 6 | | | | 2 | | | | — | | | | — | | | | 6 | | | | 2 | | Total onshore wells | | 244 | | | | 239 | | | | 10 | | | | 8 | | | | 254 | | | | 247 | |
| | | | | | | | | | | | | | | | | | | | | | | | | | | | Oil Wells | | | Gas Wells | | | Total Wells | | | | | Gross | | | Net | | | Gross | | | Net | | | Gross | | | Net | | Operated | | | 174 | | | | 173 | | | | 2 | | | | 2 | | | | 176 | | | | 175 | | Non-operated | | | 9 | | | | 3 | | | | — | | | | — | | | | 9 | | | | 3 | | | | | | | | | | | | | | | | | | | | | | | | | | | | | | 183 | | | | 176 | | | | 2 | | | | 2 | | | | 185 | | | | 178 | | | | | | | | | | | | | | | | | | | | | | | | | | |
All Productive Wells
Total Productive Wells | Oil Wells (1) | | | Gas Wells (1) | | | Total Wells | | | Gross | | | Net | | | Gross | | | Net | | | Gross | | | Net | | Operated | | 324 | | | | 312 | | | | 69 | | | | 54 | | | | 393 | | | | 366 | | Non-operated | | 34 | | | | 10 | | | | 35 | | | | 11 | | | | 69 | | | | 21 | | Total productive wells | | 358 | | | | 322 | | | | 104 | | | | 65 | | | | 462 | | | | 387 | |
| | | | | | | | | | | | | | | | | | | | | | | | | | | | Oil Wells (1) | | | Gas Wells (1) | | | Total Wells | | | | | Gross | | | Net | | | Gross | | | Net | | | Gross | | | Net | | Operated | | | 257 | | | | 245 | | | | 89 | | | | 71 | | | | 346 | | | | 316 | | Non-operated | | | 52 | | | | 21 | | | | 40 | | | | 11 | | | | 92 | | | | 32 | | | | | | | | | | | | | | | | | | | | | | | | | | | | | | 309 | | | | 266 | | | | 129 | | | | 82 | | | | 438 | | | | 348 | | | | | | | | | | | | | | | | | | | | | | | | | | |
(1) | Includes seven11 gross (5.0(9.0 net) oil wells and eightnine gross (4.9(5.8 net) gas wells with multiple completions. |
Drilling Activity As presented in the tables below, our drilling activity increaseddecreased in 20122014 compared to 2011, and also2013 in our onshore operations. In 2014, we increased in 2011the onshore horizontal drilling activity compared to 2010.2013, which take longer to drill and are more expensive on a per well basis compared to vertical wells. Our onshore drilling activity increased after ouris primarily in the Spraberry field, which was acquired by acquisition of the Yellow Rose Properties in May 2011, andcoupled with additional leasehold interests acquired in both West2011 and East Texas.2013. 40
The tables below are based on the SEC’s criteria of completion or abandonment to determine productive wells drilled. Development Drilling The following table sets forth information relatingrelated to our development wells drilled over the past three years. | | | | Year Ended December 31, | | Year Ended December 31, | | | | 2012 | | | 2011 | | | 2010 | | 2014 | | | 2013 | | | 2012 | | Gross Wells: | | | | | | | | | | | | | | | | | | Productive: | | | | | | | | | | | | | | | | | | Offshore | | | 3 | | | | 5 | | | | 1 | | | 1 | | | | 4 | | | | 3 | | Onshore | | | 53 | | | | 27 | | | | — | | | 20 | | | | 33 | | | | 53 | | Non-productive: | | | | | | | | Non-productive | | | | | | | | | | | | | Offshore | | | — | | | | — | | | | — | | | — | | | | — | | | | — | | Onshore | | | — | | | | — | | | | — | | | — | | | | — | | | | — | | | | | | | | | | | | | | | | 56 | | | | 32 | | | | 1 | | | | | | | | | | | | | | Total development wells - gross | | | 21 | | | | 37 | | | | 56 | | | | | | | | | | | | | | | Net Wells: | | | | | | | | | | | | | | | | | | Productive: | | | | | | | | | | | | | | | | | | Offshore | | | 3.0 | | | | 4.5 | | | | 0.1 | | | 1.0 | | | | 4.0 | | | | 3.0 | | Onshore | | | 52.8 | | | | 27.0 | | | | — | | | 19.3 | | | | 32.9 | | | | 52.8 | | Non-productive: | | | | | | | | Non-productive | | | | | | | | | | | | | Offshore | | | — | | | | — | | | | — | | | — | | | | — | | | | �� | | Onshore | | | — | | | | — | | | | — | | | — | | | | — | | | | — | | | | | | | | | | | | | | | | 55.8 | | | | 31.5 | | | | 0.1 | | | | | | | | | | | | | | Total development wells - net | | | 20.3 | | | | 36.9 | | | | 55.8 | |
Our success rates related to our gross development wells drilled during 2012, 2011 and 2010 werewas 100% in each year. of the last three years.Exploration Drilling The following table sets forth information relatingrelated to our exploration drilling over the past three years. | Year Ended December 31, | | | 2014 | | | 2013 | | | 2012 | | Gross Wells: | | | | | | | | | | | | Productive: | | | | | | | | | | | | Offshore | | 5 | | | | 1 | | | | 1 | | Onshore | | 13 | | | | 7 | | | | 24 | | Non-productive | | | | | | | | | | | | Offshore | | — | | | | 1 | | | | 1 | | Onshore | | — | | | | — | | | | — | | Total exploration wells - gross | | 18 | | | | 9 | | | | 26 | | | | | | | | | | | | | | Net Wells: | | | | | | | | | | | | Productive: | | | | | | | | | | | | Offshore | | 3.4 | | | | 1.0 | | | | 0.3 | | Onshore | | 13.0 | | | | 6.9 | | | | 20.8 | | Non-productive | | | | | | | | | | | | Offshore | | — | | | | 1.0 | | | | 0.4 | | Onshore | | — | | | | — | | | | — | | Total exploration wells - net | | 16.4 | | | | 8.9 | | | | 21.5 | |
| | | | | | | | | | | | | | | | Year Ended December 31, | | | | 2012 | | | 2011 | | | 2010 | | Gross Wells: | | | | | | | | | | | | | Productive: | | | | | | | | | | | | | Offshore | | | 1 | | | | 3 | | | | 5 | | Onshore | | | 24 | | | | 12 | | | | — | | Non-productive: | | | | | | | | | | | | | Offshore | | | 1 | | | | — | | | | 1 | | Onshore | | | — | | | | 1 | | | | 2 | | | | | | | | | | | | | | | | | | 26 | | | | 16 | | | | 8 | | | | | | | | | | | | | | | | | | | Net Wells: | | | | | | | | | | | | | Productive: | | | | | | | | | | | | | Offshore | | | 0.3 | | | | 2.4 | | | | 3.6 | | Onshore | | | 20.8 | | | | 7.6 | | | | — | | Non-productive: | | | | | | | | | | | | | Offshore | | | 0.4 | | | | — | | | | 1.0 | | Onshore | | | — | | | | 0.7 | | | | 0.7 | | | | | | | | | | | | | | | | | | 21.5 | | | | 10.7 | | | | 5.3 | | | | | | | | | | | | | | |
Our success rates related to our gross exploration wells drilled during 2014, 2013 and 2012 2011were 100%, 89% and 2010 were 96%, 94% and 63%, respectively. 41
Recent Drilling Activity The following table sets forth 20132015 drilling activity to February 15, 2013.2015. | | | | January 1, 2013 to February 15, 2013 | | January 1, 2015 to February 15, 2015, | | | | | Development | | | Exploration | | Development | | | Exploration | | Gross Wells: | | | | | | | | | | | | Productive: | | | | | | | | | | | | Offshore | | | — | | | | — | | | — | | | | 1 | | Onshore | | | 8 | | | | 2 | | | 1 | | | | 1 | | Non-productive: | | | | | | Non-productive | | | | | | | | | Offshore | | | — | | | | 1 | | | — | | | | — | | Onshore | | | — | | | | — | | | — | | | | — | | | | | | | | | | | | | 8 | | | | 3 | | | | | | | | | | | Total wells - gross | | | 1 | | | | 2 | | | | | | | | | | | Net Wells: | | | | | | | | | | | | Productive: | | | | | | | | | | | | Offshore | | | — | | | | — | | | — | | | | 0.2 | | Onshore | | | 8.0 | | | | 1.9 | | | 0.3 | | | | 1.0 | | Non-productive: | | | | | | Non-productive | | | | | | | | | Offshore | | | — | | | | 1.0 | | | — | | | | — | | Onshore | | | — | | | | — | | | — | | | | — | | | | | | | | | | | | | 8.0 | | | | 2.9 | | | | | | | | | | | Total wells - net | | | 0.3 | | | | 1.2 | |
As of February 15, 2013,2015, we were in the process of drilling and/or completing on a gross well basis one offshore development well, threefive offshore exploration wells, ninesix onshore exploration wells and twofive onshore development wells. Capital Expenditures The level of our investment in oil and gas properties changes from time to time depending on numerous factors, including the prices of oil, NGLs and natural gas, acquisition opportunities and the results of our exploration and development activities. For 2012, our capital expenditures for oil and natural gas properties and equipment of $684.9 million included $205.6 million for acquisitions, $137.1 million for exploration activities, $310.2 million for development activities and $32.0 million for seismic, capitalized interest and other leasehold costs. SeeManagement’s Discussion and Analysis of Financial Condition and Results of Operations – Liquidity and Capital Resources – Capital Expenditures under Part II, Item 7 in this Form 10-K for capital expenditures information. Item 3. Legal Proceedings Apache Lawsuit. In December 2014, Apache Corporation (“Apache”) filed a lawsuit against W&T Offshore, Inc., alleging that W&T breached the joint operating agreement related to plugging and abandonment costs for three deepwater wells in the Mississippi Canyon area of the Gulf of Mexico. We contend that the costs incurred by Apache are excessive and unreasonable. Apache seeks unspecified actual damages, interest, court costs and attorneys’ fees. See Financial Statements and Supplementary Data - Note 18 – Contingenciesunder Part II, Item 8 in this Form 10-K for information on this matter. Claims against Certain Insurance Underwriters. In June 2014, the United States Fifth Circuit reversed a lower court’s ruling and compelled our insurance underwriters to reimburse costs incurred by us for removal of wreck related to damages we incurred during Hurricane Ike. Several of the underwriters have not paid in accordance with the Fifth Circuit ruling. We filed a lawsuit in September 2014 against certain underwriters for amounts owed, interest, attorney fees and damages. After receiving reimbursements applied against our remaining Energy Package limits, reimbursement from certain underwriters of the Excess Policies of approximately $10 million and adjustments to claims, the estimated potential reimbursement of removal-of-wreck costs is approximately $31 million, plus interest, attorney fees and damages, if any. See Financial Statements and Supplementary Data - Note 18 – Contingenciesunder Part II, Item 8 in this Form 10-K for additional information. Monetary Sanctions by Government Authorities. Federal Grand Jury Investigation.TheDuring 2014, we paid a civil penalty assessment from the BSEE for $30,000 and we also paid the United States Attorney’s OfficeCoast Guard penalties for insignificant discharges (less than 0.0017 barrels in the Eastern Districtaggregate) totaling less than $4,000. In February 2015, the Company received a Notice of Louisiana, along withProposed Civil Penalty Assessment from the Criminal Investigation Division ofBSEE affecting the EPA conducted a federal grand jury investigation beginningCompany’s operated platform A in late 2010 of environmental compliance matters relating to surface discharges and reporting on four of our offshore platformsthe East Cameron 321 field in the Gulf of MexicoMexico. The BSEE proposed civil penalties totaled $990,000, which arose from two Incidents of Noncompliance (“INCs”) issued in 2009. In December 2012, an agreement was reached that resolves2014 during drilling operations. No injuries or spills occurred related to these environmental violationstwo issues and the agreement was approved byCompany is contesting the federal district court in January 2013. Under the agreement, the Company on January 3, 2013 (i) pled guilty to one felony count under the Clean Water Act for altering monthly produced water discharge samples for the Ewing Banks 910 platform in 2009 and one misdemeanor count under the Clean Water Act for negligently discharging a small amount of oil from the same platform in November 2009 and (ii) paid a $0.7 million fine and $0.3 million for community service and (iii) entered into an environmental compliance program subject to a third-party audit. Under the agreement, the Company was placed on a three-year term of probation. The probation terms require that the Company: a) commit no further criminal violations, b) pay in full amounts pursuant to the agreement, c) comply with an Environmental Compliance Plan during the probation period, and d) take no adverse action against personnel who cooperated in the investigation. The agreement further stipulates that the Government will not seek any further criminal charges against the Company in this matter.BSEE proposal. Cameron Parish Louisiana Claim.Since2009, certain Cameron Parish landowners have filed suits in the 38th Judicial District Court, Cameron Parish, Louisiana against the Company and Tracy W. Krohn as well as several other defendants unrelated to us. In their lawsuits, plaintiffs alleged that property they own has been contaminated or otherwise damaged by the defendants’ oil and gas exploration and production activities and they are seeking compensatory and punitive damages. During 2012, we settled claims with certain landowners and paid $10.0 million. We assessed the remaining claims to be probable and have accrued $1.3 million in our contingent liabilities as of December 31, 2012. However, we cannot state with certainty that our estimates of additional exposure are accurate concerning this matter.
Qui Tam Litigation.On September 21, 2012, we were served with a complaint in aqui tam action filed under the federal False Claims Act by an employee of a Company contractor. The lawsuit,United States ex rel. Comeaux v. W&T Offshore, Inc., et al.; CA No. 10-494, was filed in the United States District Court for the Eastern District of Louisiana, against the Company and three other working interest owners related to claims associated with three of the Company’s operated production platforms. Aqui tam action, also known as a “whistleblower” action, is a lawsuit brought by a private citizen seeking civil penalties or damages against a person or company on behalf of the government for alleged violations of law. If the claims are successful, the person filing the suit may recover a percentage of the damages or penalty from the lawsuit as a reward for exposing a wrongdoing and recovering funds on behalf of the government. The complaint was originally filed in 2010 but kept under confidential seal in order for the federal government to decide if it wished to intervene and take over the prosecution of thequi tam action. The government declined to intervene in this suit and the complaint was unsealed and made public in June 2012, thereby giving the plaintiff the opportunity to pursue the claims on behalf of the government.42
The complaint alleges that environmental violations at three of our operated production platforms in the Gulf of Mexico violate the federal offshore lease provisions so that we, among other things, wrongfully retained
benefits under the applicable leases. The alleged environmental violations include allegations of discharges of relatively small amounts of oil into the Gulf of Mexico, the failure to report and record such discharges, and falsification of certain produced water samples and related reports required under federal law. The events are alleged to have occurred in 2009. These are largely the same allegations involved in the federal grand jury investigation described above. We have filed a motion to dismiss the claim. The plaintiff dismissed his claims against the three other working interest owners after they filed motions to dismiss. The plaintiff conceded that certain of his claims should be dismissed in his reply to the Company’s motion to dismiss. The motion remains pending before the court.
The Company intends to vigorously defend the claims made in this lawsuit. At this early stage of the lawsuit, the Company has determined that although the likelihood of an adverse outcome is reasonably possible, the range of potential loss cannot yet be estimated, and accordingly, no accrual has been made.
Insurance Claims. During the fourth quarter of 2012, underwriters of our excess liability policies (Indemnity Insurance Company of North America, New York Marine & General Insurance Company, Navigators Insurance Company; XL Specialty Insurance Company and Liberty Mutual Insurance Co.) filed declaratory judgment actions in the United States District Court for the Southern District of Texas seeking a determination that such policies do not cover removal of wreck and debris claims arising from Hurricane Ike that occurred in 2008. The court consolidated the various suits filed by underwriters. We have not yet filed any claim under such excess policies, but we anticipate that such claims may reach $50.0 million in aggregate. In January 2013, the Company filed a motion for summary judgment seeking the court’s determination that such excess policies do in fact provide coverage for such removal of wreck and debris claims. The motion for summary judgment is pending. If successful, we expect to receive reimbursement for these costs once costs have been incurred and claims submitted. Costs that have been incurred in connection with potential claims have been recorded inOil and natural gas properties and equipment on the Consolidated Balance Sheet. Any recoveries from claims made on these policies related to this issue will be recorded as reductions in this line item.
Proceedings by Government Authorities.During 2012, we received notices of non-compliance from various government authorities that were related to various incidences occurring in 2012 and in prior years. Excluding the $1.0 million in payments described above, cumulative payments of fines during 2012 were less than $0.1 million. There are currently no fines outstanding that have not been paid and management has not been informed of any potential fines relating to recently completed inspections at this time.
Other Litigation.From time to time, we are party to other litigation or legal and administrative proceedings that we consider to be a part of the ordinary course of our business. Except for the matters noted above, we are not involved in any legal proceedings nor are we party to any pending or threatened claims that could, individually or in the aggregate, reasonably be expected to have a material adverse effect on our consolidated financial condition, cash flow or results of operations. Executive Officers of the Registrant The following lists our executive officers: Name | Age (1) | | | | | | | | Name
| | Age (1) | | | Position | Tracy W. Krohn | | 60 | 58 | | | Founder, Chairman, Director and Chief Executive Officer | Jamie L. Vazquez | | 54 | 52 | | | President | John D. Gibbons | | 61 | 59 | | | Senior Vice President and Chief Financial Officer and Chief Accounting Officer | Thomas P. Murphy | | 52 | 50 | | | Senior Vice President and Chief Operations Officer | Stephen L. Schroeder | | 52 | 50 | | | Senior Vice President and Chief Technical Officer | Thomas F. Getten | | 67 | 65 | | | Vice President, General Counsel and Corporate Secretary |
(1) | Ages as of February 23, 2013.2015. |
Tracy W. Krohnhas served as Chief Executive Officer since he founded the Company in 1983 and as Chairman since 2004. He also served as President of the Company until September 2008. During 1996 to 1997, Mr. Krohn was Chairman and Chief Executive Officer of Aviara Energy Corporation. Prior to founding the Company, from 1982 to 1983, Mr. Krohn was a senior engineer with Taylor Energy, and he began his career as a petroleum engineer and offshore drilling supervisor with Mobil Oil Corporation. Jamie L. Vazquez joined the Company in 1998 as Manager of Land and in 2003 she was named Vice President of Land. In September 2008, Ms. Vazquez was appointed President of the Company. Prior to joining the Company, Ms. Vazquez was with CNG Producing Company for 17 years, holding positions of increasing responsibility ending as Manager, Land/Business Development Gulf of Mexico. John D. Gibbons joined the Company in February 2007 as Senior Vice President and Chief Financial Officer. In September 2007, he assumed the additional position of Chief Accounting Officer. Prior to joining the Company, Mr. Gibbons was Senior Vice President and Chief Financial Officer of Westlake Chemical Corporation from March 2006 to February 2007. Prior to joining Westlake, Mr. Gibbons was with Valero Energy Corporation for 23 years, holding positions of increasing responsibility ending as Executive Vice President and Chief Financial Officer. Thomas P. Murphy joined the Company in June 2012 as Senior Vice President and Chief Operations Officer. From 2009 to 2012, Mr. Murphy worked at Woodside Energy USA Inc. as Vice President Engineering and Operations. From 2008 to 2009 he worked for PetroQuest Energy, Inc. as Vice President Engineering. From 2000 to 2008, Mr. Murphy worked for Devon Energy Corporation in a variety of positions, including Gulf of Mexico Deep-Water Development Supervisor, New Business Development Supervisor and culminating in his position as Sr. Exploration Advisor. Stephen L. Schroederjoined the Company in 1998 and served as Production Manager from 1999 until 2005. In 2005, Mr. Schroeder was named Vice President of Production and in July 2006 he was named Senior Vice President and Chief Operating Officer. In June 2012, Mr. Schroeder was named Senior Vice President and Chief Technical Officer. Prior to joining the Company, Mr. Schroeder was with Exxon USA for 12 years holding positions of increasing responsibility, ending with Offshore Division Reservoir Engineer. Thomas F. Gettenjoined the Company in July 2006 as Vice President, General Counsel and Assistant Secretary. In December 2011, Mr. Getten was appointed to the position of Corporate Secretary. Prior to joining the Company, Mr. Getten served as a partner with King, LeBlanc & Bland, P.L.L.C., a New Orleans law firm, since February 2001. From 1996 to December 2000, Mr. Getten served as Vice President, Secretary and General Counsel of Forcenergy Inc until its merger into Forest Oil Corporation. Item 4. | Mine Safety Disclosures |
Item 4. Mine Safety Disclosures Not applicable. PART II
Item 5. | Market for Registrant’s Common Equity, Related Stockholder Matters and Issuer Purchases of Equity Securities |
43
PART II Item 5. Market for Registrant’s Common Equity, Related Stockholder Matters and Issuer Purchases of Equity Securities Our common stock is listed and principally traded on the NYSE under the symbol “WTI.”“WTI”. The following table sets forth the high and low sales price of our common stock as reported on the NYSE. | | | | | High | | | Low | | | | | High | | | Low | | | 2012 | | | | | | 2014: | | | | | | | | | First Quarter | | $ | 26.83 | | | $ | 20.24 | | $ | 17.33 | | | $ | 13.52 | | Second Quarter | | | 21.56 | | | | 13.31 | | | 19.78 | | | | 14.00 | | Third Quarter | | | 21.01 | | | | 14.72 | | | 16.75 | | | | 10.87 | | Fourth Quarter | | | 19.35 | | | | 15.54 | | | 11.32 | | | | 5.34 | | 2011 | | | | | | 2013: | | | | | | | | | First Quarter | | | 26.12 | | | | 17.51 | | | 18.45 | | | | 14.07 | | Second Quarter | | | 28.79 | | | | 21.09 | | | 15.86 | | | | 10.68 | | Third Quarter | | | 29.27 | | | | 13.74 | | | 18.16 | | | | 14.23 | | Fourth Quarter | | | 22.86 | | | | 11.87 | | | 20.43 | | | | 14.77 | |
As of February 25, 2013,March 3, 2015, there were 198199 registered holders of our common stock. Dividends Under the Credit Agreement, we are allowed to pay annual dividends of up to $60.0 million per year if we are not in default. In December 2012, we were granted a one-time waiver which allowed for cash dividends of up to $85.0 million during 2012. In addition, the indenture governing our 8.50% Senior Notes due in 2019 (the “8.50% Senior Notes”) contains restrictions on the payment of dividends unless we meet certain restricted payment tests.payments test. SeeManagement’s Discussion and Analysis of Financial Condition and Results of Operations – Liquidity and Capital Resources under Part II, Item 7 andFinancial Statementsand Supplementary Data – Note 7 – Long-Term Debtunder Part II, Item 8 ofin this Form 10-Kfor10-K for more information regarding our Credit Agreement and the indenture governing the 8.50% Senior Notes. The following reflects the frequency and amounts of all cash dividends declared during the two most recent fiscal years (in thousands, except per share data): | Aggregate Dividends on Common Stock | | | Dividends per Share of Common Stock | | 2014: | | | | | | | | First Quarter | $ | 7,562 | | | $ | 0.10 | | Second Quarter | | 7,566 | | | | 0.10 | | Third Quarter | | 7,566 | | | | 0.10 | | Fourth Quarter | | 7,566 | | | | 0.10 | | 2013: | | | | | | | | First Quarter | | 6,020 | | | | 0.08 | | Second Quarter | | 6,775 | | | | 0.09 | | Third Quarter | | 6,775 | | | | 0.09 | | Fourth Quarter (1) | | 39,276 | | | | 0.52 | |
| | | | | | | | | | | | Aggregate
Dividends on
Common
Stock | | | Dividends per
Share of
Common
Stock | | 2012 | | | | | | | | | First Quarter | | $ | 5,948 | | | $ | 0.08 | | Second Quarter | | | 5,950 | | | | 0.08 | | Third Quarter | | | 5,950 | | | | 0.08 | | Fourth Quarter (1) | | | 64,984 | | | | 0.87 | | 2011 | | | | | | | | | First Quarter | | | 2,979 | | | | 0.04 | | Second Quarter | | | 2,979 | | | | 0.04 | | Third Quarter | | | 2,979 | | | | 0.04 | | Fourth Quarter (2) | | | 49,819 | | | | 0.67 | |
(1) | Includes a regular dividend of $6.0$7.5 million ($0.08 per common share) and two special cash dividends of $34.9 million ($0.47 per common share) and $24.1 million ($0.32 per common share). |
(2) | Includes a regular dividend of $3.0 million ($0.040.10 per common share) and a special cash dividend of $46.9$31.8 million ($0.630.42 per common share). |
WithOur Board of Directors decides on the exception of special cash dividends, we currently expect that comparable cash dividends will continue to be paid individend for the future,Company. Dividends are subject to periodic reviewsreview of the Company’s performance by our board of directorsand the current economic environment and applicable debt agreement restrictions. On February 26, 2013, our boardIn light of directors declared a cash dividendcurrent market conditions, the Board of $0.08 per common share, payable on March 29, 2013Directors has elected to shareholders of record on March 15, 2013.suspend the regular quarterly dividend.
44
Stock Performance Graph The graph below shows the cumulative total shareholder return assuming the investment of $100 in our common stock and the reinvestment of all dividends thereafter. The information contained in the graph below is furnished and not filed, and is not incorporated by reference into any document that incorporates this Annual Report on Form 10-K by reference.  
Our peer group is comprised of Apache Corporation, ATP Oil & Gas Corp., Bill Barrett Corp., Cabot Oil & Gas Corp., Comstock Resources, Inc., Energy XXI (Bermuda) Limited, Forest Oil Corp., McMoRan Exploration Co., Newfield Exploration Co., SM Energy Co., SandRidge Energy, Inc., Stone Energy Corp., and Swift Energy Company. Forest Oil Corp. merged with another company during December 2014. Its shares were included in the peer group since the transaction did not occur until near the end of 2014. Securities Authorized for Issuance Under Equity Compensation Plans The information required by this item is incorporated by reference from our definitive proxy statement to be filed with the SEC within 120 days after the end of our fiscal year covered by this Form 10-K. For descriptions of the plans and additional information, seeFinancial Statements and Supplementary Data – Note 10 –Incentive Compensation Plan and Note 11– Share-Based and Cash-Based Incentive Compensation in under Part II, Item 8 ofin this Form 10-K. Issuer Purchases of Equity Securities For the year 2012,2014, we did not purchase any of our equity securities. The following table sets forth information about restricted stock units delivered by employees during the quarter ended December 31, 20122014 to satisfy tax withholding obligations on the vesting of restricted stock units. Period | | Total Number of Restricted Stock Units Delivered | | | Average Price per Restricted Stock Unit | | | Total Number of Shares Purchased as Part of Publicly Announced Plans or Programs | | Maximum Number (or Approximate Dollar Value) of Shares that May Yet be Purchased Under the Plans or Programs | October 1, 2014 - October 31, 2014 | | N/A | | | N/A | | | N/A | | N/A | November 1, 2014 - November 30, 2014 | | N/A | | | N/A | | | N/A | | N/A | December 1, 2014 - December 31, 2014 | | | 107,173 | | | $ | 5.49 | | | N/A | | N/A |
| | | | | | | | | | | | | | | | | | Period | | Total
Number of
Restricted
Stock Units
Delivered | | | Average
Price per
Restricted
Stock Unit | | | Total Number of
Shares
Purchased as
Part of Publicly
Announced
Plans or
Programs | | | Maximum
Number (or
Approximate
Dollar Value) of
Shares that May
Yet Be
Purchased
Under the Plans
or Programs | | October 1, 2012 – October 31, 2012 | | | N/A | | | | N/A | | | | N/A | | | | N/A | | November 1, 2012 – November 30, 2012 | | | N/A | | | | N/A | | | | N/A | | | | N/A | | December 1, 2012 – December 31, 2012 | | | 319,403 | | | $ | 16.68 | | | | N/A | | | | N/A | |
Item 6. Selected Financial Data Item 6. | Selected Financial Data |
SELECTED HISTORICAL FINANCIAL INFORMATION The selected historical financial information set forth below should be read in conjunction withManagement’s Discussion and Analysis of Financial Condition and Results of Operations in under Part II, Item 7 and withFinancial Statementsinand Supplementary Data under Part II, Item 8 in this Form 10-K.10-K. | | | | | | | | | | | | | | | | | | | | | | | | Year Ended December 31, | | | | | 2012 (1) | | | 2011 (2) | | | 2010 (3) | | | 2009 | | | 2008 | | | | | (Dollars in thousands, except per share data) | | Consolidated Statement of Income (Loss) Information: | | | | | | | | | | | | | | | | | | | | | Revenues: | | | | | | | | | | | | | | | | | | | | | Oil | | $ | 629,548 | | | $ | 643,222 | | | $ | 453,435 | | | $ | 365,411 | | | $ | 622,388 | | NGLs | | | 84,637 | | | | 105,559 | | | | 51,931 | | | | 35,247 | | | | 65,709 | | Natural gas | | | 158,390 | | | | 221,194 | | | | 203,533 | | | | 204,758 | | | | 527,352 | | Other (4) | | | 1,916 | | | | 1,072 | | | | (3,116 | ) | | | 5,580 | | | | 160 | | | | | | | | | | | | | | | | | | | | | | | Total revenues (5) | | | 874,491 | | | | 971,047 | | | | 705,783 | | | | 610,996 | | | | 1,215,609 | | Operating costs and expenses: | | | | | | | | | | | | | | | | | | | | | Lease operating expenses (6) | | | 232,260 | | | | 219,206 | | | | 169,670 | | | | 203,922 | | | | 229,747 | | Production taxes | | | 5,840 | | | | 4,275 | | | | 1,194 | | | | 1,544 | | | | 8,827 | | Gathering and transportation | | | 14,878 | | | | 16,920 | | | | 16,484 | | | | 13,619 | | | | 15,957 | | Depreciation, depletion and amortization | | | 336,177 | | | | 299,015 | | | | 268,415 | | | | 308,076 | | | | 482,464 | | Asset retirement obligation accretion | | | 20,055 | | | | 29,771 | | | | 25,685 | | | | 34,461 | | | | 39,312 | | Impairment of oil and natural gas properties (7) | | | — | | | | — | | | | — | | | | 218,871 | | | | 1,182,758 | | General and administrative expenses | | | 82,017 | | | | 74,296 | | | | 53,290 | | | | 42,990 | | | | 47,225 | | Derivative (gain) loss | | | 13,954 | | | | (1,896 | ) | | | 4,256 | | | | 7,372 | | | | 16,464 | | | | | | | | | | | | | | | | | | | | | | | Total costs and expenses | | | 705,181 | | | | 641,587 | | | | 538,994 | | | | 830,855 | | | | 2,022,754 | | | | | | | | | | | | | | | | | | | | | | | Operating income (loss) | | | 169,310 | | | | 329,460 | | | | 166,789 | | | | (219,859 | ) | | | (807,145 | ) | Interest expense, net of amounts capitalized | | | 49,994 | | | | 42,516 | | | | 37,706 | | | | 40,087 | | | | 34,709 | | Loss on extinguishment of debt (8) | | | — | | | | 22,694 | | | | — | | | | 2,926 | | | | — | | Other income (9) | | | 215 | | | | 84 | | | | 710 | | | | 842 | | | | 13,372 | | | | | | | | | | | | | | | | | | | | | | | Income (loss) before income tax expense (benefit) | | | 119,531 | | | | 264,334 | | | | 129,793 | | | | (262,030 | ) | | | (828,482 | ) | Income tax expense (benefit) | | | 47,547 | | | | 91,517 | | | | 11,901 | | | | (74,111 | ) | | | (269,663 | ) | | | | | | | | | | | | | | | | | | | | | | Net income (loss) | | $ | 71,984 | | | $ | 172,817 | | | $ | 117,892 | | | $ | (187,919 | ) | | $ | (558,819 | ) | | | | | | | | | | | | | | | | | | | | | | Earnings (loss) per common share | | | | | | | | | | | | | | | | | | | | | Basic and diluted | | $ | 0.95 | | | $ | 2.29 | | | $ | 1.58 | | | $ | (2.51 | ) | | $ | (7.36 | ) | Dividends on common stock (10) | | | 82,832 | | | | 58,756 | | | | 59,609 | | | | 9,158 | | | | 27,713 | | Cash dividends per common share (10) | | | 1.11 | | | | 0.79 | | | | 0.80 | | | | 0.12 | | | | 0.36 | | | | | | | | Consolidated Cash Flow Information: | | | | | | | | | | | | | | | | | | | | | Net cash provided by operating activities | | $ | 385,137 | | | $ | 521,478 | | | $ | 464,772 | | | $ | 156,266 | | | $ | 882,496 | | Capital expenditures – oil and natural gas properties | | | 684,863 | | | | 719,026 | | | | 415,653 | | | | 276,134 | | | | 774,879 | |
| | | | | | | | | | | | | | | | | | | | | | | | December 31, | | | | | 2012 | | | 2011 | | | 2010 | | | 2009 | | | 2008 | | | | | (Dollars in thousands) | | Consolidated Balance Sheet Information: | | | | | | | | | | | | | | | | | | | | | Cash and cash equivalents | | $ | 12,245 | | | $ | 4,512 | | | $ | 28,655 | | | $ | 38,187 | | | $ | 357,552 | | Total assets | | | 2,348,987 | | | | 1,868,925 | | | | 1,424,094 | | | | 1,326,833 | | | | 2,056,186 | | Long-term debt | | | 1,087,611 | | | | 717,000 | | | | 450,000 | | | | 450,000 | | | | 653,172 | | Shareholders’ equity | | | 541,187 | | | | 544,574 | | | | 421,743 | | | | 358,950 | | | | 572,227 | |
| Year Ended December 31, | | | 2014(1) | | | 2013(2) | | | 2012(3) | | | 2011(4) | | | 2010(5) | | | (In thousands, except per share data) | | Consolidated Statement of Operations Information: | | | | | | | | | | | | | | | | | | | | Revenues: | | | | | | | | | | | | | | | | | | | | Oil | $ | 652,776 | | | $ | 718,944 | | | $ | 629,548 | | | $ | 643,222 | | | $ | 453,435 | | NGLs | | 72,837 | | | | 73,345 | | | | 84,637 | | | | 105,559 | | | | 51,931 | | Natural gas | | 217,816 | | | | 189,290 | | | | 158,390 | | | | 221,194 | | | | 203,533 | | Other (6) | | 5,279 | | | | 2,509 | | | | 1,916 | | | | 1,072 | | | | (3,116 | ) | Total revenues (7) | | 948,708 | | | | 984,088 | | | | 874,491 | | | | 971,047 | | | | 705,783 | | Operating costs and expenses: | | | | | | | | | | | | | | | | | | | | Lease operating expenses (8) | | 264,751 | | | | 270,839 | | | | 232,260 | | | | 219,206 | | | | 169,670 | | Production taxes | | 7,932 | | | | 7,135 | | | | 5,840 | | | | 4,275 | | | | 1,194 | | Gathering and transportation | | 19,821 | | | | 17,510 | | | | 14,878 | | | | 16,920 | | | | 16,484 | | Depreciation, depletion and amortization | | 490,469 | | | | 430,611 | | | | 336,177 | | | | 299,015 | | | | 268,415 | | Asset retirement obligations accretion | | 20,633 | | | | 20,918 | | | | 20,055 | | | | 29,771 | | | | 25,685 | | General and administrative expenses | | 86,999 | | | | 81,874 | | | | 82,017 | | | | 74,296 | | | | 53,290 | | Derivative (gain) loss | | (3,965 | ) | | | 8,470 | | | | 13,954 | | | | (1,896 | ) | | | 4,256 | | Total costs and expenses | | 886,640 | | | | 837,357 | | | | 705,181 | | | | 641,587 | | | | 538,994 | | Operating income | | 62,068 | | | | 146,731 | | | | 169,310 | | | | 329,460 | | | | 166,789 | | Interest expense, net of amounts capitalized | | 78,396 | | | | 75,581 | | | | 49,994 | | | | 42,516 | | | | 37,706 | | Loss on extinguishment of debt (9) | | — | | | | — | | | | — | | | | 22,694 | | | | — | | Other income, net (10) | | 208 | | | | 8,946 | | | | 215 | | | | 84 | | | | 710 | | Income (loss) before income tax expense (benefit) | | (16,120 | ) | | | 80,096 | | | | 119,531 | | | | 264,334 | | | | 129,793 | | Income tax expense (benefit) | | (4,459 | ) | | | 28,774 | | | | 47,547 | | | | 91,517 | | | | 11,901 | | Net income (loss) | $ | (11,661 | ) | | $ | 51,322 | | | $ | 71,984 | | | $ | 172,817 | | | $ | 117,892 | | Basic and diluted earnings (loss) per common share | $ | (0.16 | ) | | $ | 0.68 | | | $ | 0.95 | | | $ | 2.29 | | | $ | 1.58 | | Dividends on common stock (11) | | 30,260 | | | | 58,846 | | | | 82,832 | | | | 58,756 | | | | 59,609 | | Cash dividends per common share | | 0.40 | | | | 0.78 | | | | 1.11 | | | | 0.79 | | | | 0.80 | | Consolidated Cash Flow Information: | | | | | | | | | | | | | | | | | | | | Net cash providing by operating activities | $ | 511,423 | | | $ | 561,358 | | | $ | 385,137 | | | $ | 521,478 | | | $ | 464,772 | | Capital expenditures - oil and natural gas properties | | 626,612 | | | | 634,378 | | | | 684,863 | | | | 719,026 | | | | 415,653 | |
| December 31, | | | 2014 | | | 2013 | | | 2012 | | | 2011 | | | 2010 | | | (In thousands) | | Consolidated Balance Sheet Information: | | | | | | | | | | | | | | | | | | | | Cash and cash equivalents | $ | 23,666 | | | $ | 15,800 | | | $ | 12,245 | | | $ | 4,512 | | | $ | 28,655 | | Total assets | | 2,709,107 | | | | 2,507,302 | | | | 2,348,987 | | | | 1,868,925 | | | | 1,424,094 | | Long-term debt | | 1,360,057 | | | | 1,205,421 | | | | 1,087,611 | | | | 717,000 | | | | 450,000 | | Shareholders' equity | | 509,308 | | | | 540,610 | | | | 541,187 | | | | 544,574 | | | | 421,743 | |
46
(1) | In the second quarter of 2014, we acquired the Woodside Properties from Woodside and, in the third quarter of 2014, we acquired the remaining working interest in the Fairway Properties that we did not already own. |
(2) | In the fourth quarter of 2013, we acquired the Callon Properties from Callon. |
(3) | In the fourth quarter of 2012, we acquired the Newfield Properties from Newfield. |
(2)(4) | In the second quarter of 2011, we acquired the Yellow RoseOpal Properties from Opal and, in the third quarter of 2011, we acquired the Fairway Properties from Shell. |
(3)(5) | In the second quarter of 2010, we acquired certain properties from Total E&P and, in the fourth quarter of 2010, we acquired certain properties from Shell. |
(4)(6) | Included in other revenues for 2010 is a reduction of $4.7 million due to a disallowance by the ONRR of royalty relief for transportation of deepwater production through our subsea pipeline system that was originally recorded in 2009. We are contesting this ONRR adjustment. |
(5)(7) | Included in total revenues for 2010 is $24.9 million related to the recoupment of royalties paid to the ONRR in prior periods based on price thresholds that were believed to limit the availability of royalty relief on certain properties subject to the OCS Deepwater Relief Act of 1995. |
(6)(8) | Included in lease operating expenses are net charges to expense for hurricane-related repairs netted withnet of insurance reimbursements. For the yearsyear 2010, 2009 and 2008, the impact to lease operating expenses attributable to net hurricane – related–related expenses/reimbursements werewas an $11.7 million decrease, $18.4 million increase and $17.7 million increase, respectively.decrease. There was minimal impact to lease operating expenses in the other years presented. |
(7)(9) | The carrying amount of our oil and natural gas properties was written down by $218.9 million in 2009 and $1.2 billion in 2008 through the application of the full cost ceiling limitation due to lower oil and natural gas prices. No such write downs were required during the other years presented. |
(8) | In 2011, we expensed repurchase premiums, deferred financing costs and other costs totaling $22.0 million related to the repurchase of $450.0 million in aggregate principal amount of our 8.25% Senior Notes due 2014 (the “8.25% Senior Notes”) and expensed $0.7 million of deferred financing costs related to replacement of our revolving bank credit facility. In 2009, we expensed $2.9 million of deferred financing costs related to the early repayment of our previously outstanding term loan facility (“Tranche B”).2014. |
(9)(10) | In 2012,2013, other income consisted primarily of gain from the sale of interestpayments received in conjunction with an airplane. Amounts reported in all other periods presented consisted primarily of interest income.option exercised by a counterparty. |
(10)(11) | The years 2013, 2012, 2011 2010, and 20082010 included special dividends of $31.8 million ($0.42 per share), $59.0 million ($0.79 per share), $46.9 million ($0.63 per share), and $49.2 million ($0.66 per share), and $20.8 million ($0.39 per share), respectively. The year 2009 did not include aNo special dividend.dividends were paid in 2014. |
HISTORICAL RESERVE AND OPERATING INFORMATION The following presents summary information regarding our estimated net proved oil, NGLs and natural gas reserves and our historical operating data for the years shown below. All calculations of estimatedEstimated net proved reserves have been madeare based on the unweighted average of first-day-of-the-month commodity prices over the period January through December of the respective year in accordance with the rules and regulations of the SEC in effect for that time period.guidelines. For additional information regarding our estimated proved reserves, please readBusinessunder Part I, Item 1and1 and Propertiesunder Part I, Item 2 of thethis Form 10-K.10-K. The selected historical operating data set forth below should be read in conjunction withManagement’s Discussion and Analysis of Financial Condition and Results of Operations under Part II, Item 7 and withFinancial Statements and Supplementary Data under Part II, Item 8 in this Form 10-K. | | | | | | | | | | | | | | | | | | | | | | | | December 31, | | | | | 2012 | | | 2011 | | | 2010 | | | 2009 | | | 2008 | | Reserve Data: | | | | | | | | | | | | | | | | | | | | | Estimated net proved reserves (1)(2): | | | | | | | | | | | | | | | | | | | | | Oil (MMBbls) | | | 54.8 | | | | 51.4 | | | | 34.0 | | | | 31.2 | | | | 40.0 | | NGLs (MMBbls) | | | 15.2 | | | | 17.1 | | | | 4.2 | | | | 3.0 | | | | 3.9 | | Natural gas (Bcf) | | | 285.1 | | | | 289.7 | | | | 256.3 | | | | 165.8 | | | | 227.9 | | Total oil equivalent (MMBoe) | | | 117.5 | | | | 116.9 | | | | 80.9 | | | | 61.8 | | | | 81.9 | | Total natural gas equivalent (Bcfe) | | | 705.1 | | | | 701.1 | | | | 485.4 | | | | 371.0 | | | | 491.1 | | | | | | | | Proved developed producing (Bcfe) | | | 375.4 | | | | 325.8 | | | | 236.6 | | | | 162.5 | | | | 148.6 | | Proved developed non-producing (Bcfe) (3) | | | 145.8 | | | | 132.4 | | | | 154.7 | | | | 121.0 | | | | 185.5 | | | | | | | | | | | | | | | | | | | | | | | Total proved developed (Bcfe) | | | 521.2 | | | | 458.2 | | | | 391.3 | | | | 283.5 | | | | 334.1 | | | | | | | | Proved undeveloped (Bcfe) | | | 183.9 | | | | 242.9 | | | | 94.1 | | | | 87.5 | | | | 157.0 | | Total proved developed reserves as % of proved reserves | | | 73.9 | % | | | 65.4 | % | | | 80.6 | % | | | 76.4 | % | | | 68.0 | % | | | | | | | Reserve additions (reductions) (Bcfe): | | | | | | | | | | | | | | | | | | | | | Revisions (4) | | | (27.5 | ) | | | 51.1 | | | | 20.2 | | | | (25.4 | ) | | | (157.5 | ) | Extensions and discoveries | | | 94.5 | | | | 32.0 | | | | 29.2 | | | | 23.4 | | | | 47.2 | | Purchases of minerals in place | | | 42.0 | | | | 234.1 | | | | 152.0 | | | | 0.7 | | | | 60.5 | | Sales of minerals in place | | | (2.2 | ) | | | — | | | | — | | | | (24.0 | ) | | | — | | Production | | | (102.8 | ) | | | (101.5 | ) | | | (87.0 | ) | | | (94.8 | ) | | | (97.9 | ) | | | | | | | | | | | | | | | | | | | | | | Net reserve additions (reductions) | | | 4.0 | | | | 215.7 | | | | 114.4 | | | | (120.1 | ) | | | (147.7 | ) | | | | | | | | | | | | | | | | | | | | | |
| December 31, | | | 2014 | | | 2013 | | | 2012 | | | 2011 | | | 2010 | | Reserve Data: (1) | | | | | | | | | | | | | | | | | | | | Estimated net proved reserves | | | | | | | | | | | | | | | | | | | | Oil (MMBbls) | | 61.7 | | | | 58.5 | | | | 54.8 | | | | 51.4 | | | | 34.0 | | NGLs (MMBbls) | | 15.8 | | | | 15.9 | | | | 15.2 | | | | 17.1 | | | | 4.2 | | Natural Gas (Bcf) | | 254.9 | | | | 259.9 | | | | 285.1 | | | | 289.7 | | | | 256.3 | | Total barrel equivalents (MMBoe) | | 120.0 | | | | 117.7 | | | | 117.5 | | | | 116.9 | | | | 80.9 | | Total natural gas equivalents (Bcfe) | | 720.0 | | | | 705.9 | | | | 705.1 | | | | 701.1 | | | | 485.4 | | Proved developed producing (MMBoe) | | 68.7 | | | | 60.6 | | | | 62.6 | | | | 54.3 | | | | 39.4 | | Proved developed non-producing (MMBoe) (2) | | 14.6 | | | | 25.5 | | | | 24.3 | | | | 22.1 | | | | 25.8 | | Total proved developed (MMBoe) | | 83.3 | | | | 86.1 | | | | 86.9 | | | | 76.4 | | | | 65.2 | | Proved undeveloped (MMBoe) | | 36.7 | | | | 31.6 | | | | 30.6 | | | | 40.5 | | | | 15.7 | | Proved developed reserves as % | | 69.4 | % | | | 73.2 | % | | | 74.0 | % | | | 65.4 | % | | | 80.6 | % | Reserve additions (reductions) (MMBoe): | | | | | | | | | | | | | | | | | | | | Revisions | | 4.1 | | | | (3.9 | ) | | | (4.7 | ) | | | 8.6 | | | | 3.4 | | Extensions and discoveries | | 9.7 | | | | 20.2 | | | | 15.8 | | | | 5.3 | | | | 4.9 | | Purchases of minerals in place | | 6.1 | | | | 2.4 | | | | 7.0 | | | | 39.0 | | | | 25.3 | | Sales of minerals in place | | — | | | | (0.5 | ) | | | (0.4 | ) | | | — | | | | — | | Production | | (17.6 | ) | | | (18.0 | ) | | | (17.1 | ) | | | (16.9 | ) | | | (14.5 | ) | Net reserve additions | | 2.3 | | | | 0.2 | | | | 0.6 | | | | 36.0 | | | | 19.1 | |
(1) | Estimated net proved reserves asThe conversions to barrels of December 31, 2012, 2011, 2010oil equivalent and 2009 are based on the unweighted average of first-day-of-the-month commodity prices over the period January through December of the respective year in accordance with SEC guidelines. Estimated reserves as of December 31, 2008 are based on end-of-period commodity prices in accordance with the previous SEC guidelines in effect on such dates. |
(2) | Energy equivalents arecubic feet equivalent were determined using the energy equivalency ratio of six Mcf of natural gas to one Bbl of crude oil, condensate or NGLs (totals may not compute due to rounding). The energy-equivalentconversion ratio does not assume price equivalency, and the energyprice on an equivalent pricesbasis for oil, NGLs and natural gas may differ significantly.significantly. |
(3)(2) | Approximately 29.6 Bcfe1.4 MMBoe and 1.5 MMBoe of reserves as of December 31, 2013 and 2012, respectively, were shut in at our Mississippi Canyon 506 field (Wrigley) due to a platform and pipeline outage. Approximately 4.9 MMBoe of reserves were shut-inshut in at December 31, 2010 due to two pipeline outages impacting several fields, including our Main Pass 108 field. Approximately 1.7 Bcfe and 53.9 Bcfe of reserves were shut-in at December 31, 2009 and 2008, respectively, because of damage caused by Hurricane Ike in September 2008. |
(4)Volume measurements: | Revisions for 2009 included decreases attributable to the changes in reserve reporting requirements for oil and natural gas companies enacted by the SEC, which became effective for us on December 31, 2009. The revised rules resulted in the removal of 23.2 Bcfe of proved undeveloped reserves associated with two of our fields for which our plan of development was not within five years from when the reserves were initially recorded. |
| | | Volume measurements:MMBbls – million barrels of crude oil, condensate or NGLs | | | Bcf – billion cubic feet | | MMBbls – million barrels for crude oil, condensate or NGLs | Bcfe – billion cubic feet equivalent | | MMBoe – million barrels of oil equivalent | | Bcfe – billion cubic feet of gas equivalent |
| | | | | | | | | | | | | | | | | | | | | | | | Year Ended December 31, | | | | | 2012 | | | 2011 | | | 2010 | | | 2009 | | | 2008 | | Operating Data: | | | | | | | | | | | | | | | | | | | | | Net sales: | | | | | | | | | | | | | | | | | | | | | Oil (MBbls) | | | 6,033 | | | | 6,073 | | | | 5,863 | | | | 6,095 | | | | 5,886 | | NGLs (MBbls) | | | 2,129 | | | | 1,892 | | | | 1,190 | | | | 1,103 | | | | 1,084 | | Oil and NGLs (MBbls) | | | 8,163 | | | | 7,964 | | | | 7,053 | | | | 7,198 | | | | 6,970 | | Natural gas (MMcf) | | | 53,825 | | | | 53,743 | | | | 44,713 | | | | 51,621 | | | | 56,072 | | Total oil equivalent (MBoe) | | | 17,133 | | | | 16,921 | | | | 14,505 | | | | 15,801 | | | | 16,315 | | Total natural gas equivalent (MMcfe) | | | 102,800 | | | | 101,528 | | | | 87,032 | | | | 94,806 | | | | 97,892 | | | | | | | | Average daily equivalent sales (Boe/day) | | | 46,813 | | | | 46,360 | | | | 39,741 | | | | 43,290 | | | | 44,577 | | Average daily equivalent sales (Mcfe/day) | | | 280,875 | | | | 278,158 | | | | 238,445 | | | | 259,741 | | | | 267,465 | | | | | | | | Average realized sales prices (Unhedged): | | | | | | | | | | | | | | | | | | | | | Oil ($/Bbl) | | $ | 104.35 | | | $ | 105.92 | | | $ | 77.33 | | | $ | 59.96 | | | $ | 105.74 | | NGLs ($/Bbl) | | | 39.75 | | | | 55.81 | | | | 43.65 | | | | 31.96 | | | | 60.62 | | Oil and NGLs ($/Bbl) | | | 87.50 | | | | 94.02 | | | | 71.65 | | | | 55.67 | | | | 98.72 | | Natural gas ($/Mcf) | | | 2.94 | | | | 4.12 | | | | 4.55 | | | | 3.97 | | | | 9.40 | | Oil equivalent ($/Boe) | | | 50.93 | | | | 57.32 | | | | 48.87 | | | | 38.32 | | | | 74.50 | | Natural gas equivalent ($/Mcfe) | | | 8.49 | | | | 9.55 | | | | 8.15 | | | | 6.39 | | | | 12.42 | | | | | | | | Average realized sales prices (Hedged) (1): | | | | | | | | | | | | | | | | | | | | | Oil ($/Bbl) | | | 103.08 | | | $ | 104.30 | | | $ | 77.05 | | | $ | 59.96 | | | $ | 100.94 | | NGLs ($/Bbl) | | | 39.75 | | | | 55.81 | | | | 43.65 | | | | 31.96 | | | | 60.62 | | Oil and NGLs ($/Bbl) | | | 86.56 | | | | 92.78 | | | | 71.42 | | | | 55.67 | | | | 94.67 | | Natural gas ($/Mcf) | | | 2.94 | | | | 4.12 | | | | 4.71 | | | | 3.96 | | | | 9.42 | | Oil equivalent ($/Boe) | | | 50.48 | | | | 56.74 | | | | 49.25 | | | | 38.30 | | | | 72.82 | | Natural gas equivalent ($/Mcfe) | | | 8.41 | | | | 9.46 | | | | 8.21 | | | | 6.38 | | | | 12.14 | | | | | | | | Average per Mcfe ($/Mcfe): | | | | | | | | | | | | | | | | | | | | | Lease operating expenses | | $ | 2.26 | | | $ | 2.16 | | | $ | 1.95 | | | $ | 2.15 | | | $ | 2.35 | | Gathering and transportation costs | | | 0.14 | | | | 0.17 | | | | 0.19 | | | | 0.14 | | | | 0.16 | | | | | | | | | | | | | | | | | | | | | | | Production costs | | | 2.40 | | | | 2.33 | | | | 2.14 | | | | 2.29 | | | | 2.51 | | Production taxes | | | 0.06 | | | | 0.04 | | | | 0.01 | | | | 0.02 | | | | 0.09 | | Depreciation, depletion, amortization and accretion | | | 3.47 | | | | 3.24 | | | | 3.38 | | | | 3.61 | | | | 5.33 | | General and administrative expenses | | | 0.80 | | | | 0.73 | | | | 0.61 | | | | 0.45 | | | | 0.48 | | | | | | | | | | | | | | | | | | | | | | | | | $ | 6.73 | | | $ | 6.34 | | | $ | 6.14 | | | $ | 6.37 | | | $ | 8.41 | | | | | | | | | | | | | | | | | | | | | | | Total number of wells drilled (gross): | | | | | | | | | | | | | | | | | | | | | Offshore | | | 5 | | | | 8 | | | | 7 | | | | 13 | | | | 25 | | Onshore | | | 77 | | | | 40 | | | | 2 | | | | — | | | | — | | Total number of productive wells drilled (gross): | | | | | | | | | | | | | | | | | | | | | Offshore | | | 4 | | | | 8 | | | | 6 | | | | 10 | | | | 19 | | Onshore | | | 77 | | | | 39 | | | | — | | | | — | | | | — | |
| Year Ended December 31, | | | 2014 | | | 2013(1) | | | 2012 | | | 2011 | | | 2010 | | Operating: (2) | | | | | | | | | | | | | | | | | | | | Net sales: | | | | | | | | | | | | | | | | | | | | Oil (MBbls) | | 7,176 | | | | 7,018 | | | | 6,033 | | | | 6,073 | | | | 5,863 | | NGLs (MBbls) | | 2,112 | | | | 2,091 | | | | 2,129 | | | | 1,892 | | | | 1,190 | | Oil and NGLs (MBbls) | | 9,288 | | | | 9,110 | | | | 8,163 | | | | 7,964 | | | | 7,053 | | Natural gas (MMcf) | | 50,088 | | | | 53,257 | | | | 53,825 | | | | 53,743 | | | | 44,713 | | Total oil equivalent (MBoe) | | 17,636 | | | | 17,986 | | | | 17,133 | | | | 16,921 | | | | 14,505 | | Total natural gas equivalents (MMcfe) | | 105,815 | | | | 107,915 | | | | 102,800 | | | | 101,528 | | | | 87,032 | | Average daily equivalent sales (Boe/day) | | 48,317 | | | | 49,276 | | | | 46,813 | | | | 46,360 | | | | 39,741 | | Average daily equivalent sales (Mcfe/day) | | 289,904 | | | | 295,657 | | | | 280,875 | | | | 278,158 | | | | 238,445 | | Average realized sales prices: | | | | | | | | | | | | | | | | | | | | Oil ($/Bbl) | $ | 90.96 | | | $ | 102.44 | | | $ | 104.35 | | | $ | 105.92 | | | $ | 77.33 | | NGLs ($/Bbl) | | 34.49 | | | | 35.07 | | | | 39.75 | | | | 55.81 | | | | 43.65 | | Oil and NGLs ($/Bbl) | | 78.13 | | | | 86.97 | | | | 87.50 | | | | 94.02 | | | | 71.65 | | Natural gas ($/Mcf) | | 4.35 | | | | 3.55 | | | | 2.94 | | | | 4.12 | | | | 4.55 | | Oil equivalent ($/Boe) | | 53.49 | | | | 54.58 | | | | 50.93 | | | | 57.32 | | | | 48.87 | | Natural gas equivalent ($/Mcfe) | | 8.92 | | | | 9.10 | | | | 8.49 | | | | 9.55 | | | | 8.15 | | Average per Boe ($/Boe): | | | | | | | | | | | | | | | | | | | | Lease operating expenses | $ | 15.01 | | | $ | 15.06 | | | $ | 13.56 | | | $ | 12.95 | | | $ | 11.70 | | Gathering and transportation | | 1.14 | | | | 0.95 | | | | 0.85 | | | | 1.01 | | | | 1.16 | | Production costs | | 16.15 | | | | 16.01 | | | | 14.41 | | | | 13.96 | | | | 12.86 | | Production taxes | | 0.42 | | | | 0.42 | | | | 0.36 | | | | 0.24 | | | | 0.06 | | DD&A | | 28.98 | | | | 25.10 | | | | 20.79 | | | | 19.43 | | | | 20.28 | | General and administrative expenses | | 4.93 | | | | 4.55 | | | | 4.79 | | | | 4.39 | | | | 3.67 | | | $ | 50.48 | | | $ | 46.08 | | | $ | 40.35 | | | $ | 38.02 | | | $ | 36.87 | | Average per Mcfe ($/Mcfe): | | | | | | | | | | | | | | | | | | | | Lease operating expenses | $ | 2.50 | | | $ | 2.51 | | | $ | 2.26 | | | $ | 2.16 | | | $ | 1.95 | | Gathering and transportation | | 0.19 | | | | 0.16 | | | | 0.14 | | | | 0.17 | | | | 0.19 | | Production costs | | 2.69 | | | | 2.67 | | | | 2.40 | | | | 2.33 | | | | 2.14 | | Production taxes | | 0.07 | | | | 0.07 | | | | 0.06 | | | | 0.04 | | | | 0.01 | | DD&A | | 4.83 | | | | 4.18 | | | | 3.47 | | | | 3.24 | | | | 3.38 | | General and administrative expenses | | 0.82 | | | | 0.76 | | | | 0.80 | | | | 0.73 | | | | 0.61 | | | $ | 8.41 | | | $ | 7.68 | | | $ | 6.73 | | | $ | 6.34 | | | $ | 6.14 | | Wells drilled (gross): | | | | | | | | | | | | | | | | | | | | Offshore | | 6 | | | | 6 | | | | 5 | | | | 8 | | | | 7 | | Onshore | | 33 | | | | 40 | | | | 77 | | | | 40 | | | | 2 | | Productive wells drilled (gross) | | | | | | | | | | | | | | | | | | | | Offshore | | 6 | | | | 5 | | | | 4 | | | | 8 | | | | 6 | | Onshore | | 33 | | | | 40 | | | | 77 | | | | 39 | | | | — | |
49
(1) | DataIn January 2014, we identified that we had been receiving an erroneous MMBtu conversion factor from a third party that had the effect of understating natural gas production at our Viosca Knoll 783 field (Tahoe). The incorrect conversion factor had been used on all natural gas production from the field since we acquired it in 2011. The use of the incorrect conversion factor did not affect revenues, operating cash flows or royalty payments to the federal government but did impact reported natural gas production and the calculation of depletion expense. We performed an analysis of the information, assessing both quantitative and qualitative factors, and determined that the impact on our net income reported for all years presented includesprior annual periods, as well as the effectsimpact to our earnings trend, was not material to 2011 and 2012 results and thus the adjustment was recognized in 2013. The results for 2013 reflect a one-time increase in production of 1.9 Bcf in natural gas (with no corresponding increase in revenues) by using the correct conversion factor for the annual periods of 2011 and 2012. Excluding the cumulative effect of the volumes adjustments related to 2011 and 2012, total production for 2013 would have been 106.0 Bcfe or 290.5 MMcfe per day and our combined average realized gains and losses on commodity derivative contracts, none of which qualified for hedge accounting.sales price would have been $9.26 per Mcfe. |
(2) | The conversions to barrels of oil equivalent and cubic feet equivalent were determined using the energy equivalency ratio of six Mcf of natural gas to one Bbl of crude oil, condensate or NGLs (totals may not compute due to rounding). The conversion ratio does not assume price equivalency, and the price on an equivalent basis for oil, NGLs and natural gas may differ significantly. |
Volume measurements: | | | Volume measurements: | | | Bbl – barrel | | Mcf – thousand cubic feet | Boe – barrel of oil equivalent | | MMcf – million cubic feet | MBbls – thousand barrels for crude oil, condensate or NGLs | | MMcfe – million cubic feet equivalent | MBoe – thousand barrels of oil equivalent | | |
Item 7. | Management’s Discussion and Analysis of Financial Condition and Results of Operations |
DD&A - depreciation, depletion, amortization and accretion
Item 7. Management’s Discussion and Analysis of Financial Condition and Results of Operations The following discussion and analysis should be read in conjunction withFinancial Statements and Supplementary Data under Part II,Item 8 ofin this Form 10-K.10-K. The following discussion includes forward-looking statements that reflect our plans, estimates and beliefs. Our actual results could differ materially from those discussed in these forward-looking statements. Factors that could cause or contribute to such differences include, but are not limited to, those discussed below and elsewhere in this Form 10-K.10-K, particularly in Risk Factors under Part I, Item 1A in this Form 10-K Overview We are an independent oil and natural gas producer focused primarilywith operations offshore in the Gulf of Mexico and onshore in the Permian Basin of West Texas. We have grown through acquisitions, exploration development and acquisitionsdevelopment and currently hold working interests in approximately 7263 offshore fields (69 producing and three capable of producing) in federal and state waters. During 2011, we expanded onshore into West Texaswaters (61 producing and East Texas through an acquisition and acquiring interests in leasehold acreage.two fields capable of producing). We currently have interests in offshore leases coveringunder lease approximately 1.2 million gross acres, (0.8 million net acres) spanning primarily across the outer continental shelf off the coasts of Louisiana, Texas, Mississippi and Alabama and 0.2including approximately 0.6 million gross acres (0.2on the Gulf of Mexico Shelf, approximately 0.5 million net acres)gross acres in the deepwater and approximately 50,000 gross acres onshore, substantially allprimarily in Texas. A substantial majority of our daily production is derived from wells we operate offshore. We operate wells accounting for approximately 84%87% of our average daily production. We own interests in approximately 211203 offshore structures, 144138 of which are located in fields that we operate. Our interest in fields, leases, structures and equipment are primarily owned by the parent company, W&T Offshore, Inc. and our wholly-own subsidiary, W & T Energy VI, LLC. In managing our business, we are concerned primarily with maximizing return on shareholders’ equity. To accomplish this primary goal, we focus on increasing production and reserves at a profit. We strive to grow our reserves and production through acquisitions and our drilling programs. We have focused on acquiring properties where we can develop an inventory of drilling prospects that will enable us to continue to add reserves post-acquisition. In September 2014, we acquired an additional ownership interest in the Fairway Field (Mobile Bay blocks 113 and 132 located offshore Alabama) and the associated Yellowhammer gas processing plant, which increased our ownership interest from 64.3% to 100%. Internal estimates of additional proved reserves associated with the increased ownership interest in the Fairway Field as of the acquisition date were approximately 4.4 MMBoe (26.4 Bcfe), comprised of approximately 26% NGLs and 74% natural gas, all of which were classified as proved developed. Including adjustments from an effective date of July 1, 2014, the adjusted purchase price was $17.4 million and we assumed the additional ARO associated with the increased ownership interest in Fairway, which we have estimated to be $6.1 million. The acquisition was funded from borrowings under our revolving bank credit facility and cash on hand. In May 2014, we acquired from Woodside certain oil and gas leasehold interests in the Gulf of Mexico (the “Woodside Properties”). The Woodside Properties consisted of a 20% non-operated working interest in the producing Neptune field (deepwater Atwater Valley blocks 574, 575 and 618), along with an interest in the Neptune tension-leg platform, associated production facilities and various interests in 24 other deepwater lease blocks. Internal estimates of proved reserves associated with the Woodside Properties as of the acquisition dates were approximately 1.6 MMBoe (9.4 Bcfe), comprised of approximately 89% oil, 1% NGLs and 10% natural gas, all of which were classified as proved developed. Including adjustments from an effective date of November 1, 2013, the adjusted purchase price was $54.8 million and we assumed the ARO associated with the Woodside Properties, which we have estimated to be $11.3 million. The acquisition was funded from borrowings under our revolving bank credit facility and cash on hand. In November and December 2013, we acquired from Callon certain oil and gas leasehold interests in the Gulf of Mexico. The Callon Properties consist of a 15% working interest in the Medusa field (deepwater Mississippi Canyon blocks 582 and 583), interest in associated production facilities and various interests in other non-operated fields. Internal estimates of proved reserves associated with the Callon Properties as of the acquisition dates were approximately 2.1 MMBoe (12.7 Bcfe), comprised of approximately 67% oil and 33% natural gas, all of which were classified as proved developed. Including adjustments from an effective date of July 1, 2013, the adjusted purchase price was $83.0 million and we assumed the ARO associated with the Callon Properties, which we have estimated to be $4.2 million. The acquisition was funded from borrowings under our revolving bank credit facility and cash on hand. 51
In October 2012, we acquired from Newfield certain oil and gas leasehold interests. The propertiesNewfield Properties consisted of leases covering 78 federal offshore blocks on approximately 432,700416,000 gross acres (416,000 gross acres and 268,000(268,000 net acres excluding over-riding interests), comprised of 65 blocksacres) predominantly in the deepwater, six of which are producing, 10 blocks on the conventional shelf, four of which are producing, and an overriding royalty interest in three deepwater blocks, two of which are producing.deepwater. Internal estimates of proved reserves associated with the Newfield Properties as of the acquisition date were approximately 7.0 MMBoe (42.0 Bcfe), comprised of approximately 36% oil, 3% NGLs and 61% natural gas, 36% oil and 3% NGLs, all of which were classified as proved developed. Including adjustments from an effective date of July 1, 2012, the adjusted purchase price was $205.6$205.8 million and we assumed the ARO associated with the Newfield Properties, which we have estimated to be $31.7 million. The acquisition was initially funded from borrowings under our revolving bank credit facility and cash on hand. Subsequently in the same month, the amounts borrowed under our revolving bank credit facility were paid down with funds provided from the issuance of an additional $300.0 million of 8.50% Senior Notes. During 2011, we closed two acquisition transactions. In May 2011, we acquired from Opal approximately 24,500 gross acres (21,900 net acres) of certain oilSee Financial Statements and gas leasehold interests in the Permian Basin of West Texas, which we refer to as our Yellow Rose Properties. Internal estimates of proved reserves associated with the Yellow Rose Properties as of the acquisition date were approximately 30.1 MMBoe (180.4 Bcfe), comprised of approximately 69% oil, 22% NGLs and 9% natural gas, and approximately 70% of which were classified as proved undeveloped. Including adjustments from an effective date of January 1, 2011, the adjusted purchase price was $394.4 million, and we assumed the ARO associated with the Yellow Rose Properties, which we have estimated to be $0.4 million, and recorded a long-term liability of $2.1 million. The acquisition was funded from cash on hand and borrowings under our revolving bank credit facility.
In August 2011, we acquired from Shell its 64.3% interest in the Fairway Field along with a like interest in the associated Yellowhammer gas treatment plant. Internal estimates of proved reserves associated with the Fairway Properties as of the acquisition date were 8.9 MMBoe (53.5 Bcfe), comprised of approximately 72% natural gas, 27% NGLs and less than 1% oil, all of which are proved developed producing. Including adjustments
from an effective date of September 1, 2010, the adjusted purchase price was $42.9 million and we assumed the ARO associated with the Fairway Properties, which we have estimated to be $7.8 million. The acquisition was funded from borrowings under our revolving bank credit facility.
SeeFinancial StatementsSupplementary Data – Note 2 – Acquisitions and Divestitures under Part II, Item 8 ofin this Form 10-K for additional information on acquisitions.
From time to time, as part of our business strategy, we sell various properties that we consider non-core assets. In 2012, we sold our 40%, non-operated working interest in the South Timbalier 41 field located in the Gulf of Mexico for $30.5 million. In connection with this sale, we reversed $4.0 million of ARO. In 2011 and 2010, there were no property sales of significance.
Our financial condition, cash flow and results of operations are significantly affected by the volume of our oil, NGLs and natural gas production and the prices that we receive for such production. Our production volumes for 20122014 were comprised of approximately 35%41% oil and condensate, 12% NGLs and 52%47% natural gas, determined using the energy-equivalent ratio of six Mcf of natural gas to one Bblbarrel of crude oil, condensate or NGLs. The energy-equivalent ratio does not assume price equivalency, and the energy-equivalent prices per Mcfe for oil, NGLs and natural gas may differ significantly. For 2012,2014, our combined total production of oil, NGLs and natural gas was approximately 1.3% higherconsistent with 2013, as we had new production from recently drilled wells and acquisitions, partially offset by various pipeline outages, platform outages and maintenance shut-ins offshore and weather onshore. During 2013, sales volumes also benefited from new wells that were brought on a Mcfe basis than during the same period in 2011. line along with production from acquisitions. The year 2013 was also negatively impacted by various pipeline outages, shut downs for maintenance, Tropical Storm Karen and various operational issues. During 2012, sales volumes were negatively impacted by various pipeline outages, Hurricane Isaac and Tropical Storm DebbieDebbie. Our realized prices received for our crude oil, NGLs and various pipeline outages. Our estimatenatural gas production are affected by not only domestic production activities and political issues, but more importantly, international events, including both geopolitical and economic events. For the first nine months of 2014, WTI and Brent crude oil prices averaged above $100 per barrel. In fact, crude oil prices have averaged over $90 per barrel for WTI and $100 per barrel for Brent for the last four years. This in turn has led to significant cost inflation in the oil and gas services industry. Crude oil prices have fallen dramatically recently from a peak of $107 per barrel for WTI in June 2014 to the low $50s per barrel in December 2014 and the mid $40s per barrel during January 2015. The current market imbalance is predominantly supply driven caused by a number of issues that are described below: The U.S. Energy Information Administration’s (“EIA”) data estimates the worldwide supply of crude oil will outpace consumption in 2014 by approximately 800,000 barrels per day. For 2015 and 2016, EIA forecasts crude oil supply being above consumption by approximately 600,000 and 100,000 barrels per day, respectively, which is expected to keep downward pressure on prices. Worldwide storage capacity exists for the excess oil in the next two years but this is only a temporary solution that has historically led to lower prices. The extreme rapid decrease in crude oil prices appears to be due to supply-side growth. Over the past five years, supply has increased at 1.7% per year, while consumption increased 1.5% per year. Over the five year period, 2014 had the largest market imbalance, with supply increasing 2.3% compared to demand increasing at 1.0%. For 2014, production growth from countries outside of OPEC grew at a record high of 2.0 million barrels per day over 2013, of which the U.S. grew production 1.6 million barrels per day and Canada grew production 0.3 million barrels per day. OPEC production was relatively flat for 2014 compared to 2013. OPEC members have taken no actions to reduce supplies and Saudi Arabia has made statements that it intends to protect its market share regardless of the price of crude oil. Many countries, such as Russia, Iraq, Iran, Venezuela, have economies that are highly (or solely) dependent on oil revenues and do not have significant cash reserves like Saudi Arabia. These countries are not able to reduce production to wait for higher prices in the future; therefore, these types of countries would not have the economic ability to withstand lower production, which would further hurt their economies and continue to pressure crude oil prices. Iran, which has suffered under economic sanctions imposed by the United States and other NATO countries, is ramping up its production further exacerbating the excess crude oil supply situation. While many U. S. producers have reduced capital budgets for 2015 compared to 2014, the U.S. producers have projected constant or increased production of crude oil for 2015. EIA estimates U.S. petroleum and other liquids production for 2014, 2015 and 2016 to be 14.0, 14.8 and 15.4 million barrels per day, respectively, and estimates Canada’s petroleum and other liquids production for 2014, 2015 and 2016 to be 4.4, 4.5 and 4.7 million barrels per day, respectively. The increasing strength in the U.S. dollar relative to other currencies has also had an impact on crude pricing. Because all barrels are traded in U.S. dollars, as the U.S. dollar gains strength, crude prices are lower in U.S. dollars but are more expensive in other currencies. 52
While the expectations of consumption growth have been lowered, consumption did grow in 2014 and is projected to grow over the next two years. World-wide consumption growth of petroleum and other liquid products was estimated by EIA to be 1.0%, 1.1% and 1.1% for 2014, 2015 and 2016, respectively. China and the U.S. are projected to be the leading contributors to world-wide growth for the next two years and Russia is projected to have the largest reduction in consumption in the next two years due to an economic downturn. Based on the above, crude oil supply is expected by many commentators to exceed demand over the next two years. Accordingly, we expect that prices will continue to stay depressed until such time as demand grows to meet supply or depressed prices drive producers to cut back production. In addition to U.S. crude oil production, another factor affecting the price of domestic crude oil is the ability to get production to market. Over the past few years, the infrastructure (both pipeline and rail) to transport crude oil within the United States has seen a major and rapid change. A number of pipelines have been built and completed, reversed flowed, or expanded to move crude oil from Cushing, Oklahoma (a major crude oil storage hub) primarily to the U.S. Gulf Coast but also to the Midwest as well. Transportation capacity has also been added in major producing regions, like the Permian Basin, to move crude oil to the U.S. Gulf Coast rather than to Cushing. Both of these itemsevents have helped relieve the excess crude oil that built up in Cushing, which in turn allowed WTI pricing to increase relative to Brent. Up to the fourth quarter of 2013, WTI traded at a discount to Brent, while our Gulf Coast crude oil production traded at a premium to WTI. The structural changes that have occurred as a result of new pipeline and rail infrastructure are expected to impact U.S. Gulf Coast crude oil pricing going forward. Rail receiving capacity also expanded on 2012 volumesthe East Coast, and to some extent on the U.S. Gulf Coast, with more capacity being announced. The average spread between Brent and WTI was approximately 0.8 MMBoe (4.8 Bcfe).$5.72 per barrel in 2014 compared to $10.52 per barrel in 2013 as a result of the increased domestic production and structural changes outlined above. The Brent-WTI spread declined during 2014 and the average spread for December 2014 was $3.04 per barrel. During 2012,2014, our average realized oil sales price (unhedged)was 11.2% lower than that realized in 2013. Our average realized oil sales price percentage decrease for 2014 was lower than the crude oil benchmark WTI due to the reduction in our offshore crude oil premiums as discussed above. As reported by the EIA, WTI prices averaged $93.17 per barrel for 2014, down from $97.98 per barrel for 2013. Brent prices decreased to $104.35$98.97 per barrel compared to $105.92for 2014 from $108.53 per barrel for 2013. Crude oil prices fell dramatically during the fourth quarter of 2014 and have fallen further thus far in 2011. Two comparable benchmarks are the unweighted2015. In December 2014 and January 2015, WTI average daily posted spot price of West Texas Intermediate (“WTI”) crude oilprices were $59.29 and the unweighted average daily posted spot price of Brent crude oil, which decreased 0.9% and increased 0.3%, respectively, from 2011.$47.22, respectively. WTI is frequently used to value domestically produced crude oil, and the majority of our oil production is priced using the spot price for WTI as a base price, plus a premium depending onthen adjusted for the type and quality of crude oil. Most of our oil production is from our offshore operations and is comprised of various crudes including Heavy Louisiana Sweet, Light Louisiana Sweet, Poseidon and others. Startingother factors. In addition, beginning in the first quarter of 2011 and continuing through the fourth quarter of 2012, these various crudes sold2013 and continuing through 2014, the premiums for the Gulf of Mexico crude oil have declined to virtually be at a significant premium relativeparity with one another as the crude being moved to WTI. During 2012, premiums forthe U.S. Gulf Coast increased and imports continued. Over 85% of our oil is produced from offshore in the Gulf of Mexico and is characterized as Light Louisiana Sweet (“LLS”), Heavy Louisiana Sweet crude(“HLS”), Poseidon and Light Louisiana Sweet crude ranged between $10.00 and $22.00 per barrel.others. For example, the month of December 2012, themonthly average premium for these crudes was between $21.00 and $22.00 per barrel. In comparison, the premium for these crudes was between $4.00 and $30.00 per barrel for 2011. In 2010, the premium was approximately $2.00 to $3.00 per barrel, which is representative of the historical norm. We may continue to experience higher premiums to WTI crudefor LLS, HLS and Poseidon for 2014 were $3.88, $3.52 and a negative $1.20 per barrel, respectively, compared to $11.06, $11.02 and $5.58 per barrel, respectively, for 2013. Permian Basin crudes also have traded at a discount to WTI (at times the discount has been significant) in our future salesmuch of crude oil until such time2014 as supply growth outpaced infrastructure capacity. This bottleneck has been relieved recently with the causative factors, described below, are resolved. We cannot predict with any certainty how long such pricing conditions will last. A possible cause cited by industry publications for the premiums afforded our offshore crudes is an oversupply situation at Cushing, Oklahoma, a primary domestic hub for crude oil priced usingnew pipeline expansions from Longhorn, Bridge Tex and Cactus coming on line and allowing the WTI benchmark. Citing the Cushing crude over supply situation, the owners of the Seaway pipeline reversed the flow of crudeto Permian differentials to revert to more normal levels. Our oil production in June 2012 to flow crude from Cushing to Freeport, Texas. Although this change increased the amount of crude oil available to Gulf Coast refineries, we did not experience a decline in premiums in the second half of 2012. In January 2013, the Seaway pipeline capacity was increased from 150,000 barrels per day to 400,000 barrels per day. The owners have announced plans to construct a parallel pipeline to be completed in the first quarter of 2014, which is expected to increase the capacity to 850,000 barrels per day. Other pipeline projects are underway as well that, when added to the Seaway pipeline capacity, could bring 1.9 million barrels per day of mid-continent crude oil to the Gulf Coast. That capacity is expected to grow to 2.4 million barrels per dayWest Texas incurs discounts for transportation costs incurred by the end of 2014. We believe these actions may substantially reduce the oversupply situation at Cushing,
which may affect the premiums we receive on our offshore oil production. An additional factor that has appeared to affect the premiums for Heavy Louisiana Sweet and Light Louisiana Sweet is the difference between the Brent and WTI crude oil prices, which continue to have a higher spread than historical norms. When the price of Brent crude increases relative to WTI, the value of low-sulfur U.S. crude grades that competepurchaser, with West African crude increases. This trend of higher Brent spreads began in the first quarter of 2011 and continued through December 2012.
Oil prices are affected by world events, such as political unrest in the Middle East, the threat of hostilities, demand changes in various countries and world economic growth. Some commentators believe world economic growth, which is currently being affected by the economies of China, Brazil, India and Russia, may support strong crude oil prices in the long term.
Not-withstanding this long-term view, crude oil prices will likely continue to be volatile. For 2012, WTI crude oil prices ranged from a high of approximately $109.00 per barrel to a low of $78.00 per barrel. The volatility in price was attributed by some commentators to be due in part to the debt crisis in Europe and the belief that economic growth in certain world markets was weakening. The U.S. Energy Information Administration (“EIA”) expectslarger discounts applied where the oil marketis trucked due to loosen in the near term as supply increases are expected to be higher than consumption increases. EIA expects inventories to build in the first halflack of 2013. Supply increases are expected from the United States and other Non-OPEC countries. Consumption increases are expected in China and other countries outside of the Organization for Economic Cooperation and Development. EIA projections do not assume any significant deterioration of the economies of the United States and European Union. EIA projects crude prices for Brent and WTI will be lower in 2013 compared to 2012. Estimates of global oil demand by EIA for 2012 and 2013 were 89.0 and 90.0 million barrels per day, respectively, which would be approximately 1% growth year over year.pipeline access.
Our average realized NGLs sales prices (unhedged) decreased 28.8%1.7% during 2012 compared to 2011. According to industry sources, domestic2014 versus 2013. Two major components of our NGLs, production significantly increasedethane and propane, typically make up over 2011 levels which affected price realizations.70% of an average NGL barrel. During 2012,2014, average prices for domestic ethane increased 2% and average domestic propane two common NGL components, decreased 52% and 31%, respectively,prices increased 4% from 2011 andthe comparable 2013 period. Average price changes for other domestic NGLs ranged from a decrease of 13% to a decrease of 7%, which caused the average realized NGLs sales price to decline. Colder weather was a major factor for the increase of the price of propane during the winter months of 2014; however, propane prices decreased 8%were below prior year levels for the balance of 2014. For December 2014, propane prices fell dramatically and were 48% below the 2014 average. Other market factors and weather influence the price of ethane, as it is not used directly as a heating fuel. However, cold weather drove up the price of natural gas, helping to 12%.increase the price of ethane, which is extracted from natural gas. Once the cold weather passed, ethane prices declined to pre-winter pricing and prices for the balance of 2014 were below the comparable 2013 period. Similar to propane, ethane prices for December 2014 fell dramatically and were 38% below the 2014 average. The decreases in the prices of crude oil and natural gas have affected the prices of NGLs. As long as ethaneU.S. crude oil and propane inventories continue to benatural gas production remain high and NGLs production continues to increase, we could expect prices for these two commodities to be weak. In addition, as long as the price ratio of crude oil to natural gas price ratio remains wide (as measured on a six to one energy equivalency), the production of NGLs production may continue to be high which may putrelative to historical norms and would, in turn, suggest continued downward price pressure on the entire NGLs stream. In addition, manyprice of ethane. Many natural gas processing facilities arehave been and will likely continue re-injecting ethane back into the natural gas stream after processing due to increasinginsufficient ethane supplies. This in turn increasesdemand, which negatively impacts production and natural gas supplies and has helpedprices. 53
According to lead to lowerEIA, prices for natural gas pricing. at Henry Hub (the primary U.S. price benchmark) were 17% higher in 2014 compared to 2013 largely due to above-average storage withdrawals in response to the colder winter weather early in 2014 and higher industrial demand. The amount of heating degree days for the winter of 2014 was 13% higher than that of 2013, which was a primary causal factor for the increased demand. Natural gas prices are more affected by domestic issues (as compared to crude oil prices), such as weather (particularly extreme heat or cold), supply, local demand issues, other fuel competition (coal) and domestic economic conditions, and they have historically been subject to substantial fluctuation. However, with the surplus of natural gas that has plagued the industry since 2012, natural gas prices have been weak and the fluctuations in prices have been limited to the lower end of the price range. That phenomenon is likely to continue according to many commentators. During 2012, the2014, our average realized sales price for ourincreased 22.5% to $4.35 per Mcf from 2013. During December 2014, natural gas production decreased 28.6% from 2011 to $2.94 per Mcf. A comparable bench mark isprices have fallen and the Henry Hub unweighted average daily posted spot price which decreased 31.3%was 20% below the average price for 2014. Although the average price of natural gas increased during 2014 on a percentage basis, it is still weak from the comparable period. Wean overall economic standpoint, and we expect continued weakness in natural gas prices for a number of reasons, including (i) producers continuing to drill in order to secure and to hold large lease positions before expiration, particularly in shale and similar resource plays, (ii) natural gas storage levels building to high levels throughout the injection season, (iii) natural gas continuing to be produced as a by-product in conjunction with the substantial ramp uphigh level of oil drilling (iv) increasing availability of liquefied(as evidenced by the year over year increase in natural gas (v)production despite the decline in the number of rigs drilling for natural gas as explained below), (iii) production efficiency gains arebeing achieved in the shale gas areas resulting from better hydraulic fracturing, horizontal drilling, pad drilling and production techniques and (vi)(iv) re-injecting ethane into the natural gas stream as indicated above, which increases the natural gas supply. Per EIA, natural gas working inventories at the end of the December 2014 were estimated at 3.1 trillion cubic feet, which is 8% above the comparable 2013 period. EIA estimates the Henry Hub natural gas spot price was $4.52 per Mcf in 2014 and forecasts $3.55 and $3.98 per Mcf for 2015 and 2016, respectively. Many research analysts are projecting that natural gas consumption in 2012 increased 4.8% from 2011 to 69.7 billion cubic feet per dayprices will be lower than this forecast by EIA primarily due to gains in electrical power use offsetting declines in residential and commercial consumption and expects 2013 consumption to decline slightly from 2012 levels. The EIA expects production growth to increase slightly in 2013 as the associated gas with crude oil drilling will offset the declines in natural gas drilling. supplies. EIA projects U.S. supply to be higher than consumption for both 2015 and 2016. According to Baker Hughes, the U.S. natural gas rig count was 439 at the beginning of 2013. The natural gas rig count decreased during 2013 to 372 rigs at the end of 2013 and decreased further to 328 at the end of December 2014. The natural gas rig count was at a 21 year low during 2014. As of mid-February, the natural gas rig count decreased to 300. Despite the decline in rigs drilling specifically for natural gas, the U.S. has experienced a year over year increase in natural gas production due to the many factors previously enumerated. Oil wells have increased natural gas production as a by-product, with the number of rigs searching for oil increasing from 1,318 at the beginning of 2013 to 1,378 at the end of 2012 is down approximately 50% compared with2013, and further increasing to 1,482 as of the startend of 2012.December 2014. As of mid-February, the oil rig count decreased to 1,056. In the Gulf of Mexico, there were 48 rigs (29 oil, 19 natural gas) at the beginning of 2013, 59 rigs (39 oil, 20 natural gas) at the end of 2013 and 54 rigs (42 oil and 12 natural gas) as of the end of December 2014. EIA expectsestimates the Henry Hubpercentage of electricity fueled by natural gas to be 27% for 2014, and forecasts the percentage at 28% for both 2015 and 2016, influenced largely by the expected price will average $3.79 per Mcf in 2013of natural gas compared to an estimated $2.86 per Mcf in 2012. Due to the high production and historically high inventory levels, we believe natural gas prices may continue to be weak until such time as crude prices weaken (which will in turn decrease oil drilling activity and decrease the likelihoodexpected price of producing natural gas as a byproduct), economic activity increases dramatically or fuel switching increases. During 2012, U.S. energy producers switched from coal-powered energy to natural gas, estimated by the EIA at approximated 4 Bcfe per day, particularly during the summer cooling season.coal. Industry sources have indicated that a natural gas price above $3.50$4.50 per Mcf for some period of time will probably cause even more power producers to switch back to coal from natural gas, which in effect creates limits to how far natural gas prices canon both the extent of a price rise and the duration of a price increase. This will be the case until such time as demand for natural gas increases from other sources. In 2012, 2011 and 2010, we did not incur an impairment write-down. Should prices declineeither current consumers or new uses are developed to consume this resource. The demand for oil, NGLs and natural gas is expected to continue to increase as the announced petrochemical facilities are constructed and power producers convert to consuming natural gas to reduce emissions to ever tighter emission regulations and standards. Several companies are currently building or are planning to build liquefaction capacity to export liquefied natural gas due to significantly higher natural gas prices in Europe and Asia.
Our current capital expenditure budget for 2015 is $200 million, not including any potential acquisitions. This is down from our 2014 and 2013 actual expenditures of approximately $630 million and $636 million, respectively. The plan for 2015 reflects the future,significantly lower estimated crude oil prices and our attempt to always drill within cash flow from operating activities. We continue to closely monitor current and forecasted prices to assess if changes are needed to our plans. 54
Should the recent price decline in oil continue, it would negatively impact our future oil, NGL and natural gas revenues, earnings and liquidity, would be negatively impacted, and could result incause impairment write-downs of the carrying value of our oil and natural gas properties. This decline couldproperties, reduce proved reserves, create issues with financial ratio compliance, and could result inlead to a reduction of the borrowing base associated with our credit agreement,Credit Agreement, depending on the longevity and severity of such declines. Ifprice weakness. As required by the full cost accounting rules, we performed our ceiling test calculation as of December 31, 2014 using the SEC pricing guidelines, which require using the 12-month average commodity price for each product, calculated as the unweighted arithmetic average of the first-day-of-the-month price adjusted for price differentials. The average price using the SEC required methodology was $91.12 per barrel for crude oil and $4.27 per Mcf for natural gas. (For reference, the prices at the end of the year 2014 for those factorstwo products were $53.45 per barrel for crude oil and $3.23 per Mcf for natural gas, respectively.) Based on the results of the SEC required calculation, we were not required to occur and were significant,record a write-down of the willingnesscarrying value of financial institutions and investors to provide capital to us and others in theour oil and natural gas industryproperties at December 31, 2014. We are required to perform the ceiling test calculation at the end of each quarter. If WTI and Brent prices remain at levels occurring during December 2014 and January 2015, we estimate that we will likely recognize a non-cash ceiling test write-down during 2015, and could have a non-cash ceiling test write-down in more than one quarter of 2015. For the effect of lower commodity prices on liquidity, see Risk Factors - Risks Related to Financing under Part I, Item 1A and in the future could be impacted.Liquidity and Capital Resources section of this Item in this Form 10-K for additional information about our Credit Agreement and financing. For the effect of lower commodity prices on revenues and earnings, see Quantitative and Qualitative Disclosures on Market Risks under Part II, Item 7A in this Form 10-K for additional information. Our operating costs include the expense of operating our wells, platforms and other infrastructure primarily in the Gulf of Mexico and Texas and transporting our production to the pointpoints of sale. Our operating costs are generally comprised of several components, including direct operating costs, repairs and maintenance, gathering and transportation costs, production taxes, insurance premiums, workover costs and ad valorem taxes. Our operating costs depend in part on the type of commodity produced, the level of workover activity and the geographical location of the properties. Revenue Workover costs can vary significantly from year to year depending on the level of activity (either required or desired) and type of equipment used. In those instances where a drilling rig is required as opposed to some other type of intervention vessel or equipment, the costs tend to be much higher and require more time. During the last two years, we performed two offshore workovers each year that required the use of a drilling rig. At our production is highly dependent on pipelines owned by othersSpraberry field (Yellow Rose) operations more workover activity has been performed due to access markets for our products. To the extent that the transportation rate such pipelines charge increases, our revenues from the sales of our products would go down or transportation costs would increase, the result of either would be a reduction in operating income. We have reached agreements with certain gas pipelines that significantly reduce the rates we are charged relative to their most recent filed tariff rates, but still represent an increase from prior rates that will negatively impact our operating income. For other third-party pipelines that handle our product, the potential transportation rate changes and timing are not known at this time. The approval process typically results in approval of fees less than those contained in the filing requests. The combined impact cannot be specifically determined, as the impact is dependent on volumes, the amount of transportation rate change for certain pipeline operators and the timing of such changes. However, we estimate that the combined detrimental impact to operating income in excess of the impact experienced in 2012 for these pipelines’ price changes may be up as much as $10.0 million for 2013.expanded well count.
In recent years, we acquired and built platforms near the outer edge of the continental shelf and operated wells in the deepwater of the Gulf of Mexico. To the extent we continue our deepwater operations, our operating costs will likely increase.increase, especially as we find and produce more crude oil rather than natural gas. While each field can present operating problems that can add to the costs of operating a field, the production costs of a field are generally directly proportional to the number of production platforms built in the field. As technologies have improved, oil and natural gas can be produced from larger acreage areas using a single platform, which may reduce the operating costs associated with future development projects. Our offshore operations are exposed to potential damage from hurricanes and we obtain insurance to reduce, but not totally mitigate, our financial exposure risk. We incurred substantial costs from 2008 through 2012 for hurricane related damage occurring in 2008 and expect to incur costs through 2013 to complete plugging and abandonment work primarily related to three toppled platforms. We received reimbursements from our insurance carrier in each of the last four years and expect to receive additional reimbursements for covered costs incurred in future periods as covered See costs incurred to date have not exceeded policy limits. SeeLiquidity and Capital Resourcesbelow - Hurricane Remediation, Insurance Claims and Insurance Coverage under this Item 7 and Financial Statementsand Supplementary Data – Note 318 – Hurricane Remediation and Insurance ClaimsContingencies under Part II, Item 8 in this Form 10-K for additional information. Applicable environmental regulations require us to remove our platforms after production has ceased, to plug and abandon all wells and to remediate any environmental damage our operations may have caused. The costs associated with our ARO generally increase as we drill wells in deeper parts of the continental shelf and in the deepwater. We generally do not pre-fund our ARO. We estimated the present value of our liability related to our ARO at $384.1$390.6 million as of December 31, 2012.2014. Inherent in the present value calculation of our liability are numerous estimates, assumptions and judgments, including the ultimate settlement amounts, inflation factors, changes to our credit-adjusted risk-free rate, timing of settlement and expenditure, and changes in the legal, regulatory, environmental and political environments. Actual expenditures for ARO could vary significantly from these estimates. In April 2010, there was a fire and explosion aboard Over the Deepwater Horizon drilling platform operated by BPlast several years, we have seen upward revisions in the deep water of the Gulf of Mexico which caused loss of life, caused the rigcosts to sink and created a major oil spill that produced economic, environmental and natural resource damage. Subsequently, the BOEM issued a series of NTLs and otherdo this work partly due to significant changes in the regulatory requirements and partly due to the escalation in the cost of goods and services required to do the work. Lower crude oil prices are expected to lead to lower service costs and a reduction in the estimated liability.
Many changes in laws, regulations, guidance, interpretations and implemented a six-month moratorium on drilling activities which beganpolicy continue to be proposed and issued in May 2010. After the drilling moratorium ended in November 2010, it was not until March 2011 that deep waterour industry. The process for obtaining offshore drilling permits, began to be issued, and even then only sporadically, to continue drilling activities that had commenced prior to the Deepwater Horizon incident. Since March 2011,especially deepwater drilling permits, have been issued, albeit at a slowerhas expanded and much more measured pace than beforelengthened in the Deepwater Horizon event.past few years. The most significant regulatoryregulation changes since the Deepwater Horizon eventin recent years are regulations related to assessing the potential environmental impact of future spills using worse case discharge scenarios on a well-by-well basis,impacts, spill response documentation, compliance reviews, operator practices related to safety and implementing a safety and environmental management system. The new regulations and increased review process increases the time it takes to obtain drilling permits and increases the cost of operations. Also, the regulations have changed related to plugging and abandonment of offshore wells and related infrastructure considerably, driving up both the time and cost to perform the work. As these new regulations and guidance continue to evolve, we cannot estimate the cost and impact to our business at this time. The permitting process is also slow and inconsistentSee Regulation under Part I, Item 1 in this Form 10-K for shallow water work and even for plug and abandonment activities. This could lead to increased costs and performing work at less than optimal effectiveness or even at less than desirable times due to weather. We have not experienced delays in obtaining permits related to our onshore operations.additional information. 55
Results of Operations Year Ended December 31, 20122014 Compared to Year Ended December 31, 20112013 RevenuesRevenues. Total revenues decreased $96.6$35.4 million, or 9.9%3.6%, to $874.5$948.7 million in 20122014 compared to 2011.2013. Oil revenues decreased $13.7$66.2 million, or 9.2%, NGLs revenues decreased $20.9$0.5 million, or 0.7%, natural gas revenues decreased $62.8increased $28.5 million, or 15.1%, and other revenues increased $0.9$2.8 million. The oil revenue decrease was attributable to a 1.5%an 11.2% Bbl decrease in the average realized sales price (unhedged) to $104.35$90.96 per Bbl from $102.44 in 2012 from $105.92 per Bbl2013, partially offset by a 2.3% increase in 2011, with sales volumes decreasing slightly.volumes. The NGLs revenue decrease was attributable to a 28.8%1.7% decrease in the average realized sales price (unhedged) to $39.75$34.49 per Bbl in 20122014 from $55.81$35.07 per Bbl in 2011,2013, partially offset by an increase of 12.5%1.0% in sales volumes. The natural gas revenue decreaseincrease was attributable to a 28.6% decrease22.5% increase in the average realized natural gas sales price (unhedged) to $4.35 per Mcf from $3.55 per Mcf for 2013, partially offset by a decrease in sales volumes by 6.0%. We experienced increases in production from the A-5 well at Mississippi Canyon 243 (Matterhorn), the A-14 well at Ship Shoal 349 (Mahogany), the return to production of Mississippi Canyon 506 (Wrigley), increases at Fairway due to acquiring the remaining working interest in the field as well as productive well work in the field, new production from both Medusa and Neptune fields, and acquisitions consummated during 2014. Production was negatively impacted for all commodities from natural production declines, production deferrals affecting various fields and the divestitures of certain fields in 2013. The production deferrals were attributable to third-party pipeline outages, platform maintenance, and various operational issues. We estimate production deferrals were 2.6 MMBoe during 2014. Specifically, production at Mississippi Canyon 506 (Wrigley) was deferred as a result of maintenance at the host platform and comprised approximately 17% of the deferred production. The Wrigley field resumed production during 2014. In addition, production from selected wells at Ship Shoal 349 (Mahogany) was deferred due to closure of a pipeline, a rig move and well work and weather was a contributing factor in the first quarter of 2014 for production declines at West Texas and at selected offshore fields.The balance of the deferred production occurred at multiple locations. During 2013, estimated production deferrals were 2.2 MMBoe. Revenues from oil and liquids as a percent of our total revenues were 76.5% for 2014 compared to 80.5% for 2013. NGLs realized sales prices as a percent of oil realized prices increased to 37.9% for 2014 compared to 34.2% for 2013. Lease operating expenses. Lease operating expenses, which include base lease operating expenses, insurance, workovers, maintenance on our facilities, and hurricane remediation costs net of insurance claims, decreased $6.1 million to $264.8 million in 2014 compared to 2013. On a per Boe basis, lease operating expenses decreased to $15.01 per Boe during 2014 compared to $15.06 per Boe during 2013. On a component basis, workover expense decreased $13.2 million, facilities maintenance expense decreased $4.6 million and insurance premiums decreased $3.3 million, partially offset by increases in base lease operating expenses of $15.4 million. The decrease in workover costs was primarily due to workovers at Main Pass 69 and Ship Shoal (Mahogany) occurring in 2013, which were partially offset by workovers at High Island 111 and High Island 129 occurring in 2014 and increased workover costs at Spraberry (Yellow Rose). The decrease in facilities maintenance expense was primarily due to the shutdown for scheduled maintenance at our Yellowhammer plant occurring in 2013. Base lease operating expenses were higher primarily due to new fields acquired in 2014 and 2013, a decrease in fees charged out to a third party at Mississippi Canyon 243 and increases related to new wells at Ship Shoal 349 (Mahogany) and Spraberry (Yellow Rose). Production taxes. Production taxes increased to $7.9 million during 2014 compared to $7.1 million in 2013 primarily related to increased production in the state waters of Alabama at our Fairway field, which was impacted by our increase in ownership effective in September 2014 and increases in overall production at the field. Partially offsetting were decreases in production and sales at our onshore operations. Currently, production taxes are not a large component of our operating costs. Most of our production is from federal waters where there are no production taxes while onshore operations are subject to production taxes. Gathering and transportation costs. Gathering and transportation costs increased to $19.8 million in 2014 compared to $17.5 million in 2013 primarily due to escalation in third-party transportation fees. Depreciation, depletion, amortization and accretion. DD&A, including accretion for ARO, increased to $28.98 per Boe for 2014 from $25.10 per Boe for 2013. On a nominal basis, DD&A increased to $511.1 million for 2014 from $451.5 million in 2013. DD&A on a per Boe and nominal basis increased in part due to increases in the full cost pool from capital expenditures and estimated future development costs. Our focus on expanding deepwater exploration and development necessarily increases costs prior to increasing proved reserves, leading to an increase in the rate. General and administrative expenses (“G&A”). G&A increased to $87.0 million for 2014 from $81.9 million for 2013 primarily due to increases in salaries, share-based compensation, contract labor costs and reductions in charge-outs to third-parties, partially offset by lower cash-based incentive compensation. G&A on a per BOE basis was $4.93 Boe for 2014 compared to $4.55 per Boe for 2013. See Financial Statements and Supplementary Data – Note 11 – Share-Based and Cash-Based Incentive Compensation under Part II, Item 8 in this Form 10-K for additional information. 56
Derivative (gain)/loss. For 2014 and 2013, our derivative positions resulted in a net gain of $4.0 million and a net loss $8.5 million, respectively, and related to the change in the fair value of our then open crude oil commodity derivatives positions as a result of changes in crude oil prices. During 2014, all open positions expired and closed. For 2013, the contracts related to production anticipated in both 2013 and 2014 and reflect changes in the fair value for all open contracts recorded currently and for closed contracts. Financial Statements and Supplementary Data – Note 6 – Derivative Financial Instruments under Part II, Item 8 in this Form 10-K for additional information. Interest expense. Interest expense incurred increased to $86.9 million for 2014 from $85.6 million for 2013 primarily due to higher balances on our revolving bank credit facility. The aggregate principal amount of our 8.50% Senior Notes outstanding was $900.0 million during both years. During 2014 and 2013, $8.5 million and $10.1 million, respectively, of interest were capitalized to unevaluated oil and natural gas properties. The decrease is primarily attributable to reclassifying a portion of our unevaluated properties to the full cost pool during 2014 and during the fourth quarter of 2013. See Financial Statements and Supplementary Data – Note 7 – Long-Term Debt under Part II, Item 8 in this Form 10-K for additional information. Other income, net. For 2014, other income was $0.2 million. For 2013, other income was $8.9 million and consisted primarily of funds received in conjunction with a payment to us for an option exercised by a counterparty. Income tax expense (benefit). Income tax benefit was $4.5 million for 2014 compared to income tax expense of $28.8 million for 2013 due to a pre-tax loss in 2014 compared to pre-tax income in 2013. Our effective tax rate for the year 2014 is distorted due to a small pre-tax loss; consequently, our permanent differences have a larger impact on our effective tax rate. Our effective tax rate for 2013 was 35.9% and differed from the federal statutory rate of 35.0% primarily as a result of state income taxes. Year Ended December 31, 2013 Compared to Year Ended December 31, 2012 Revenues. Total revenues increased $109.6 million, or 12.5%, to $984.1 million in 2013 compared to 2012. Oil revenues increased $89.4 million, or 14.2%, NGLs revenues decreased $11.3 million, or 13.3%, natural gas revenues increased $30.9 million, or 19.5%, and other revenues increased $0.6 million. The oil revenue increase was attributable to a 16.3% increase in sales volumes, partially offset by a $1.91 per Bbl decrease in the average realized sales price to $102.44 per Bbl. The NGLs revenue decrease was attributable to a 11.8% decrease in the average realized sales price to $35.07 per Bbl in 2013 from $39.75 per Bbl in 2012 and a slight decrease of 1.8% in sales volumes. The natural gas revenue increase was attributable to a 20.7% increase in the average realized natural gas sales price to $3.55 per Mcf from $2.94 per Mcf from $4.12 per Mcf for 2011,2012, with sales volumes increasing slightly. The sales volumesdecreasing slightly by 1.1%. Production for all commodities werewas positively impacted by production increases at Ship Shoal 349 and the onshore properties in West Texas. In addition, production was positively impacted by the Newfield Properties acquired in the fourth quarter 2012, the Callon Properties acquired in the fourth quarter of 2013 and the volume adjustments described above in the Overview section. Production was negatively impacted by Hurricane Isaac, Tropical Storm Debbie, various pipeline outages, andfor all commodities from natural production declines and from production deferrals affecting various fields. The production deferrals were positively impacted by acquisitionsattributable to third-party pipeline outages, platform maintenance, Tropical Storm Karen and successful explorationvarious operational issues. We estimate production deferrals were 2.2 MMBoe during 2013 for all these issues. Specifically, production at Mississippi Canyon 506 (Wrigley) continues to be deferred as a result of maintenance at Shell’s Cognac platform and development efforts.related pipelines. Also, production was deferred at our Fairway field due to well and maintenance issues and a turnaround at our Yellowhammer plant. During 2012, we also experienced production deferrals primarily due to Hurricane Isaac and various pipeline outages, but not near the same magnitude as in 2013. Revenues from oil and liquids as a percent of our total revenues were 80.5% for 2013 compared to 81.7% for 2012. NGLs realized sales prices as a percent of oil realized prices decreased to 34.2% for 2013 compared to 38.1% for 2012. Lease operating expenses.Lease operating expenses, which include base lease operating expenses, insurance, workovers, maintenance on our facilities, and hurricane remediation costs net of insurance claims, increased $13.1$38.6 million to $232.3$270.8 million in 20122013 compared to 2011.2012. On a per McfeBOE basis, lease operating expenses increased to $2.26$15.06 per McfeBoe during 20122013 compared to $2.16$13.56 per McfeBoe during 2011.2012. On a component basis, baseworkover expense increased $25.0 million primarily as a result of rig workovers on wells at our Ship Shoal 349/359 field and our Main Pass 69 field. Base lease operating expenses workover costs,increased $14.5 million primarily as a result of the acquisition of the Newfield Properties, expanded onshore operations and ad valorem tax refunds received in 2012, partially offset by increased processing fees charged to third-parties. Facilities maintenance expense increased $5.1 million primarily attributable to a shutdown for scheduled maintenance at our Yellowhammer plant. Partially offsetting these increases were decreases in insurance premiums of $4.6 million and hurricane remediation costs net of insurance claims increased $7.4 million, $6.8 million, $2.9 million and $0.9 million, respectively. As a partial offset, facility expenses decreased $4.9of $1.5 million. The increase in base lease operating expenses is primarily attributable to acquisitions in 2012 and 2011. Workover cost increases were primarily attributable to increases for our onshore operations, which had approximately four months of expenses in 2011. The increase in insurance premiums is attributable to increases effective with the June 1, 2011 renewal, which included an expansion in coverage and led to higher expenses in the first half of 2012. The decrease in facilities expense is primarily attributable to work performed in 2011 on the tendon tension monitoring system and mechanical repairs at our Matterhorn platform, the pipeline repairs at our Ship Shoal 300 field to remove paraffin and inspection fees at our Main Pass 252 platforms. These projects were only partially offset by other projects in 2012. Production taxes.taxes. Production taxes increased to $7.1 million during 2013 compared to $5.8 million duringin 2012 compared to $4.3 million in 2011 primarily due to the Yellow Rose Properties and the Fairway Properties’ operationsonshore production and are currently not a large component of our operating costs. Most of our production is from federal waters where there are no production taxes while onshore operations are subject to production taxes. 57
Gathering and transportation costs.Gathering and transportation costs decreasedincreased to $17.5 million in 2013 compared to $14.9 million in 2012 from $16.9 million in 2011primarily due to a higher percentage of onshore volumes, whereescalation in third-party transportation fees are lower.fees. Depreciation, depletion, amortization and accretion (“DD&A”).accretion. DD&A, including accretion for ARO, increased to $3.47$25.10 per McfeBoe for 20122013 from $3.24$20.79 per McfeBoe for 2011.2012. On a nominal basis, DD&A increased to $451.5 million for 2013 from $356.2 million for 2012 from $328.8 million in 2011. The increase in2012. DD&A on a per McfeBoe basis and nominal basis wasincreased primarily due in part toto: increasing estimates of future development costs; moving costs capitalized to the full cost pool from both the unevaluated pool and from increases inpool; increasing our ARO estimates without a corresponding increase in proved reserves; and incurring higher than expected development costs related to proved reserves. The acquisitions of the Newfield Properties and the Callon Properties also attributed to the increase in DD&A per Boe. In addition we incurred significant development capital throughoutto the year that did not lead to an increase in proved reserves. Finally, mostDD&A per Boe, the nominal increase was affected by the increase in production volumes described above in Revenues, which include the cumulative effect of our reserve additions for 2012 occurred latethe volumes adjustments, as described above in the year.Overview section. General and administrative expenses (“G&A”).expenses. G&A increaseddecreased slightly to $81.9 million for 2013 from $82.0 million for 2012 from $74.3 million for 2011. Included in 2012 is $13.9 million that relates to the settlement of environmental claims made by certain landowners in Cameron Parish, Louisiana, the settlement with the Department of Justice of an environmental enforcement claim and associated legal costs. These costs exceeded similar amounts incurred in 2011 by $9.5 million. In addition, the overhead that we bill out to our joint interest parties was higher in the 2012 period by $1.9 million primarily due to a full year oflower litigation and settlement cost, mostly offset by increases in consulting services related to drilling operations, at our Fairway Propertieshigher professional services, supplemental bonding fees and increased drilling activities. The 2011 period included higher payments for transition services associated with the acquisitions completed in that year. Onincentive compensation expense. G&A on a per McfeBoe basis G&A was $0.80$4.55 per McfeBoe for 2012,2013 compared to $0.73$4.79 per McfeBoe for 2011.2012. SeeFinancial Statements and Supplementary Data – Note 11 – Share-Based and Cash-Based Incentive Compensationunder Part II, Item 8 ofin this Form 10-K for additional information.information. Derivative (gain) loss.loss. For 2013 and 2012, our derivative positions resulted in net losses of $8.5 million and 2011, we recognized a loss of $14.0 million, respectively, and a gain of $1.9 million, respectively, relatedrelate to the change in the fair value of our crude oil commodity derivatives as a result of changes in crude oil prices relative to the prices at the beginning of the period.prices. Although the contracts relate to production for both the current year and future years,next year, changes in the fair value for all open contracts are recorded currently. For 2012, the loss was comprised of a $7.7 million realized lossSee Financial Statements and a $6.3 million unrealized loss. For 2011, the gain was comprised of a $9.9 million realized loss and an $11.8 million unrealized gain. SeeFinancial StatementsSupplementary Data – Note 6 – Derivative Financial Instruments under Part II, Item 8 ofin this Form 10-K for additional information. Interest expense.Interest expense incurred increased to $85.6 million for 2013 from $63.3 million for 2012 from $52.4 million for 2011 with the increase primarily attributable to the issuance of Senior Notes.2012. The averageaggregate principal amount of our Senior Notes outstanding increased due to our June 2011 issuance of $600.0 million of our 8.50% Senior Notes outstanding was $900.0 million during 2013 compared to $600.0 million outstanding from January to September 2012 and repurchase$900.0 million from October 2012 to December 2012 due to the issuance of $450.0 million of our 8.25% Senior Notes. In addition, we issued an additional $300.0 million of 8.50% Senior Notes in October 2012.Notes. During 2013 and 2012, $10.1 million and 2011, interest of $13.3 million, and $9.9 million, respectively, of interest were capitalized to unevaluated oil and natural gas properties. The increasedecrease is primarily attributable to reclassifying unevaluated properties to the acquisitionfull cost pool during the fourth quarter of the Yellow Rose Properties in 2011.2012. SeeFinancial Statements and Supplementary Data – Note 7 – Long-Term Debtunder Part II, Item 8 ofin this Form 10-K for additional information. Other income, netLoss on extinguishment. For 2013, other income was $8.9 million and consisted primarily of debt. Infunds received in conjunction with a payment to us for an option exercised by a counterparty. For 2012, no loss on extinguishment of debtother income was incurred. For 2011, loss on extinguishment of debt was $22.7$0.2 million. In 2011, we expensed repurchase premiums, deferred financing costs and other costs totaling $22.0 million related to the repurchase of $450.0 million in aggregate principal amount of our 8.25% Senior Notes due 2014 and expensed $0.7 million of deferred financing costs related to replacement of our revolving bank credit facility. SeeFinancial Statements – Note 7 – Long-Term Debt under Part II, Item 8 of this Form 10-K for additional information. Income tax expense.Income tax expense decreased to $28.8 million for 2013 compared to $47.5 million for 2012 compareddue to $91.5 millionlower pre-tax income and a lower effective tax rate. Our effective tax rate for 2011.2013 was 35.9% and differed from the federal statutory rate of 35.0% primarily as a result of state income taxes. Our effective tax rate for 2012 was 39.8% and differed from the federal statutory rate of 35% primarily as a result of the recapture of deductions for qualified domestic production activities under Section 199 of the Internal Revenue Code (“IRC”) as a function of loss carrybacks to prior years and the impact of state income taxes. Our effective tax rate for 2011 was 34.6% and differed from the federal statutory rate of 35% primarily as a result of the deduction for qualified domestic production activities under Section 199 of the IRC. Year Ended December 31, 2011 Compared to Year Ended December 31, 2010
Revenues. Total revenues increased $265.3 million, or 37.6%, to $971.0 million in 2011 compared to 2010. Oil revenues increased $189.8 million, NGLs revenues increased $53.6 million, natural gas revenues increased $17.7 million and other revenues increased $4.2 million. The oil revenue increase was attributable to a 37.0% increase in the average realized sales price (unhedged) to $105.92 per Bbl in 2011 from $77.33 per Bbl in 2010, combined with an increase of 3.4% in sales volumes. The NGLs revenue increase was attributable to a 27.9% increase in the average realized sales price (unhedged) to $55.81 per Bbl in 2011 from $43.65 per Bbl in 2010, combined with an increase of 58.3% in sales volumes. The sales volume increase for oil and NGLs is primarily attributable to increases associated with properties acquired in 2011 and 2010. The natural gas revenue increase resulted from a 20.1% increase in sales volumes, partially offset by a 9.5% decrease in the average realized natural gas sales price (unhedged) to $4.12 per Mcf compared to $4.55 per Mcf for 2010. The sales volume increase for natural gas is primarily attributable to increases associated with our acquisition activities, the Main Pass 108 fields resuming production and successful exploration efforts. Other revenue changed primarily due to a disallowance of $4.7 million by the ONRR in 2010 of royalty relief for transportation of deepwater production through our subsea pipeline system.We are contesting this ONRR adjustment. For additional information, see Financial Statements – Note 19 – Contingenciesunder Part II, Item 8 of this Form 10-K.
Lease operating expenses. Lease operating expenses, which include base lease operating expenses, insurance, workovers, maintenance on our facilities, and hurricane remediation costs net of insurance claims, increased $49.5 million to $219.2 million in 2011 compared to 2010. On a per Mcfe basis, lease operating expenses increased to $2.16 per Mcfe during 2011 compared to $1.95 per Mcfe during 2010. On a component basis, base lease operating expenses, facility expenses, hurricane remediation costs net of insurance claims, and workover costs increased $20.7 million, $14.1 million, $11.7 million and $3.6 million, respectively. As a partial offset, insurance premiums decreased $0.6 million. The increase in base lease operating expenses is primarily attributable to expenses associated with the properties acquired in 2011 and 2010, higher costs at our various non-operated properties and increased processing fees associated with our Daniel Boone field production. The increase in facility expenses is primarily attributable to work performed on the tendon tension monitoring system and mechanical repairs at our Matterhorn platform, the pipeline repairs at our Ship Shoal 300 field to remove paraffin and inspection fees at our Main Pass 252 platforms. Hurricane remediation costs net of insurance claims increased primarily due to higher reimbursements received in 2010. Workover costs increased due to work performed at our Yellow Rose Properties and expenses at the Main Pass 108 field, partially offset by projects in 2010 that did not occur in 2011. The decrease in insurance premiums resulted primarily from lower premiums on our insurance policies covering well control and hurricane damage that cover the policy period June 1, 2010 to
June 1, 2011. Our premiums increased effective with the June 1, 2011 renewal attributable to a substantial improvement in coverage. For additional information, seeLiquidity and Capital Resources – Hurricane Remediation and Insurance Claims.
Production taxes. Production taxes increased to $4.3 million during 2011 compared to $1.2 million in 2010 primarily due to the Yellow Rose Properties and the Fairway Properties’ operations and are currently not a large component of our operating costs. Most of our production is from federal waters where there are no production taxes while onshore operations are subject to production taxes.
Gathering and transportation costs.Gathering and transportation costs were basically flat for 2011 compared to the prior year.
Depreciation, depletion, amortization and accretion. DD&A, including accretion for ARO, decreased to $3.24 per Mcfe for 2011 from $3.38 per Mcfe for 2010. On a nominal basis, DD&A increased to $328.8 million for 2011 from $294.1 million in 2010. The decrease in DD&A on a per Mcfe basis was primarily due to increases in proved reserves while DD&A on a nominal basis increased due to higher production volumes.
General and administrative expenses. G&A increased to $74.3 million for 2011 from $53.3 million for 2010 due to a number of factors including higher incentive compensation as a result of improved financial and operational performance, costs related to expanded onshore and offshore activities, acquisitions, surety premiums, transition services fees paid to the sellers of the acquired properties, and litigation related costs. Also, we earned administration fees in 2010 related to an asset disposition, and no such fees were earned in 2011. On a per Mcfe basis, G&A was $0.73 per Mcfe for 2011, compared to $0.61 per Mcfe for 2010. SeeFinancial Statements – Note 11 – Share-Based and Cash-Based Incentive Compensationunder Part II, Item 8 of this Form 10-K for additional information.
Derivative (gain) loss. For 2011 and 2010, we recognized a gain of $1.9 million and a loss of $4.3 million, respectively, related primarily to the change in the fair value of our crude oil commodity derivatives as a result of changes in crude oil prices relative to the prices at the beginning of the period. Although the contracts relate to production for both the current and future years, changes in the fair value for all open contracts are recorded currently. For 2011, the gain was comprised of a $9.9 million realized loss and an $11.8 million unrealized gain. For 2010, the loss was comprised of a $0.8 million realized gain and a $5.1 million unrealized gain. Included in 2010 was a derivative loss of $0.3 million related to our interest rate swap. SeeFinancial Statements – Note 6 – Derivative Financial Instrumentsunder Part II, Item 8 of this Form 10-K for additional information.
Interest expense. Interest expense incurred increased to $52.4 million for 2011 from $43.1 million for 2010, with the increase primarily attributable to our Senior Notes. The average amount of our Senior Notes outstanding increased due to our June 2011 issuance of $600.0 million of our 8.50% Senior Notes and repurchase of $450.0 million of our 8.25% Senior Notes. During 2011 and 2010, $9.9 million and $5.4 million, respectively, of interest were capitalized to unevaluated oil and natural gas properties which increased due to the Yellow Rose Properties acquisition. SeeFinancial Statements – Note 7 – Long-Term Debtunder Part II, Item 8 of this Form 10-K for additional information.
Loss on extinguishment of debt. For 2011, loss on extinguishment of debt was $22.7 million. In 2011, we expensed repurchase premiums, deferred financing costs and other costs totaling $22.0 million related to the repurchase of $450.0 million in aggregate principal amount of our 8.25% Senior Notes due 2014 and expensed $0.7 million of deferred financing costs related to replacement of our revolving bank credit facility. In 2010, no loss on extinguishment of debt was incurred. SeeFinancial Statements – Note 7 – Long-Term Debt under Part II, Item 8 of this Form 10-K for additional information.
Income tax expense. Income tax expense increased to $91.5 million for 2011 compared to $11.9 million for 2010. Our effective tax rate for 2011 was 34.6% and differed from the federal statutory rate of 35% primarily as a result of the deduction for qualified domestic production activities under Section 199 of the IRC. Our effective
tax rate for 2010 was 9.2% and primarily reflects a reduction in our valuation allowance against our deferred tax assets and the utilization of the deduction attributable to qualified domestic production activities under Section 199 of the IRC. Taxable income in 2010 allowed us to reverse all of our previously recorded valuation allowance.
Liquidity and Capital Resources
Our primary liquidity needs are to fund capital expenditures and strategic property acquisitions to allow us to growreplace our oil and natural gas reserves, repay outstanding borrowings and make related interest payments and pay dividends. We have funded such activities with cash on hand, net cash provided by operating activities, sales of property, securities offerings and bank borrowings. These sources of liquidity have historically been sufficient to fund our ongoing cash requirements. Cash flow and working capital.Net cash provided by operating activities for 20122014 was $385.1$511.4 million, compared to $521.5$561.4 million for 2011.2013. Cash flows from operating activities, before changes in working capital and ARO settlements, were $500.8 million in 2014, a decrease of $46.0 million compared to 2013. The decrease ischange in cash flows excluding working capital and ARO settlements was primarily attributabledue to lower realized prices for natural gas and NGLs, higher payments related to ARO and increases in joint interest receivables. Partially offsetting the decrease were lower payments related to income taxes of $16.1 million in 2012 compared to $35.7 million in 2011, and higher production volumes.revenues. Our combined average realized sales price per Mcfe (hedged) during 2012 was 11.1%Boe decreased 2.0%, with lower than the comparable 2011 period, while ouraverage realized sales prices of oil being partially offset by higher average realized natural gas sales prices. Our combined production of oil, NGLs and natural gas on a natural gas equivalentBoe basis during 20122014 decreased 1.9% from 2013. 58
The changes in working capital and ARO settlements led to a net reduction of $4.0 million in net cash provided by operating activities between 2014 and 2013. The reduction was 1.3%primarily caused by large income tax refunds received in 2013 due to carryback of tax-based net operating losses and higher receivable collections received in 2013. At the beginning of 2013, receivable balances were higher than 2011.historical trends and led to higher collections in 2013. For 2014, receivable balances were lower due to lower average realized sales oil prices, but not as large a decrease as experienced in 2013. Partially offsetting were reductions of escrowed deposits related to ARO arrangements. Escrowed deposits are included within Prepaid and Other Assets on the Condensed Consolidated Statements of Cash Flows. Net cash used in investing activities during 20122014 and 20112013 was $657.4$630.0 million and $722.7$614.8 million, respectively, which primarily represents our investments in both offshore and onshore oil and natural gas properties. Cash usedThe increase is primarily due to proceeds from properties sales and other items of $21.0 million received in investing activities2013 and no similar transactions occurred in 2014. Partially offsetting were decreases in acquisition expenditures, as we paid $72.2 million related to the increased ownership in Fairway and for 2012 includes the acquisition of the NewfieldWoodside Properties for $205.6 million. Cash used in investing activities for 2011 includes2014 (two separate transactions) compared to $82.4 million related to the acquisitionsacquisition of the Yellow RoseCallon Properties for $394.4 million and the Fairway Properties for $42.9 million. In addition, investments in other oil and natural gas properties and equipment were $479.3 million in 2012 compared to $281.8 million in 2011, with the increase primarily related to drilling activities onshore and in deepwater offshore areas.2013. Net cash provided by financing activities was $280.0$126.4 million during 2012. Funds were2014. The net cash provided through the issuance of an additional $300.0 million of 8.50% Senior Notes at a premium of 106%during 2014 was primarily attributable to par, which after netting debt issuance costs, provided $312.0 million. In addition, $53.0 million was provided through net borrowings on our revolving bank credit facility. Funds used were primarily attributable to the paymentfacility of dividends of $82.8$157.0 million, which includes two special dividends totaling $59.0was partially offset by dividend payments of $30.3 million. Net cash provided by financing activities was $177.1$57.0 million during 2011. Funds were2013. The net cash provided throughduring 2013 was primarily attributable to net borrowings on theour revolving bank credit facility of $117.0$120.0 million, and issuancewhich was partially used for dividend payments of $600.0$58.8 million of 8.50% Senior Notes and partially offset by the repurchase of $450.0 million of the 8.25% Senior Notes and repurchase premium and debt issuance costs of $32.3$3.9 million. In addition, dividend payments were $58.8 million in 2011, which included a special dividend of $46.9 million. SeeFinancial Statements – Note 7 – Long-Term Debt under Part II, Item 8 of this Form 10-K for additional information on the Senior Note transactions. At December 31, 2012,2014, we had a cash balance of $12.2$23.7 million and $554.4$302.4 million of undrawn capacity available under the revolving bank credit facility, which had a borrowing base of $725.0$750.0 million as of December 31, 2012.2014. Credit agreement and long-term debt.At December 31, 2012, $170.02014, $447.0 million was outstanding under our revolving bank credit facility compared to $117.0$290.0 million at December 31, 2011.2013. At December 31, 20122014 and 2011,2013, $900.0 million and $600.0 million principal amount respectively, of our 8.50% Senior Notes were outstanding. We believe that cash provided by operations and borrowings available under our revolving bank credit facility and other external sources of liquidity should beis sufficient to fund our ongoing cash requirements. See Capital Expenditures below. On May 7, 2012,November 8, 2013, we executedentered into the First Amendment to the Fourth Amended and Restated Credit Agreement (the “First Amendment”), which among other things, increasedprovides a revolving bank credit facility of up to $1.2 billion. Letters of credit may be issued up to $300.0 million, provided availability under the numberrevolving bank credit facility exists. This is a secured facility that is collateralized by our oil and natural gas properties. The Credit Agreement terminates on November 8, 2018 and replaced the Prior Credit Agreement. Availability under the Credit Agreement is subject to a semi-annual borrowing base re-determination set at the discretion of participatingour lenders, and added a provision permitting the Company and the lenders may each request one additional re-determination per year. The amount of the borrowing base is calculated by our lenders based on their evaluation of our proved reserves and their own internal criteria. See Risk Factors – Lower oil and natural gas prices could negatively impact our ability to maintain security interestborrow under Part I, Item 1A in favorthis Form 10-K. Any determination by our lenders to change our borrowing base, as a result of any derivative counterparties that cease to be lendersthe current commodity price environment or otherwise, will result in a similar change in the availability under the Company’sour revolving bank credit facility. On October 12, 2012, we executed the Second Amendment to the Fourth Amended and Restated Credit Agreement (the “Second Amendment”), which, among other things, allowed for the issuance of additional senior unsecured indebtedness with an automatically and simultaneously reduction inDuring 2014, the borrowing base by $0.25 for every $1.00was re-determined and set at $750.0 million. Borrowings under the Credit Agreement bear interest at the applicable London Interbank Offered Rate (“LIBOR”) plus a margin that varies from 1.75% to 2.75% depending on the level of unsecured indebtedness incurred above $600.0 million aggregate principal amounttotal borrowings under the Credit Agreement, or an alternative base rate equal to the greater of our existing notes until such time as(a) Prime Rate, (b) Federal Funds Rate plus 0.5%, and (c) LIBOR plus 1.0%, plus applicable margin ranging from 0.75% to 1.75%. The unused portion of the borrowing base has been determined or otherwise adjusted. All other terms of the Credit Agreement remain substantially the same prioris subject to the First and Second Amendment including the termination date of May 5, 2015, interest rate spreads and covenants. Fees relateda commitment fee ranging from 0.375% to the First and Second Amendments were approximately $2.5 million, which are being amortized over the remaining term of the Credit Agreement.0.5%.
Effective on November 7, 2012, our borrowing base was increased to $725.0 million and the number of lenders increased. We currently have 20 lenders within the revolving bank credit facility, with commitments ranging from $20.0 million to $56.0$58.0 million for the current borrowing base. While we have not experienced, nor do we anticipate, any difficulties in obtaining funding from any of these lenders at this time, any lack of or delay in funding by members of our banking group could negatively impact our liquidity position.
Availability under our revolving bank credit facility is subject to a semi-annual redetermination of our borrowing base that occurs in the spring and fall of each year and is calculated by our lenders based on their evaluation of our proved reserves and their own internal criteria. Any determination by our lenders to change our borrowing base will result in a similar change in the size of our revolving bank credit facility. Borrowings under the revolving bank credit facility bear interest at the applicable London Interbank Offered Rate or LIBOR, plus applicable margins ranging from 2.00% to 2.75%, or an alternate base rate equal to the greatest of (a) the Prime Rate, (b) the Federal Funds Effective Rate plus 0.5%, and (c) LIBOR plus 1%, plus applicable margins ranging from 1.00% to 1.75%. The unused portion of the borrowing base is subject to a commitment fee of 0.50%.
The Credit Agreement contains covenants that limit, among other things, the payment of cash dividends in excess of $60.0 million per year, common stock repurchases and Senior Note repurchases in excess of $100.0 million in the aggregate, borrowings other than from the revolving bank credit facility, sales of assets, loans to others, investments, merger activity, hedging contracts, liens and certain other transactions without the prior consent of the lenders.year. In December 2012, we were granted a one-time waiver which allowed for cash dividends of up to $85.0 million during 2012. The Credit Agreement contains various financial covenants calculated as of the last day of each fiscal quarter, including a minimum current ratio and a maximum leverage ratio, as defined in the Credit Agreement.agreements. We were in compliance with all applicable covenants of the Credit Agreement as of December 31, 2012.2014. Assuming continuing oil and gas prices near levels realized in December 2014 and January 2015, we likely will be out of compliance with certain of our financial ratio maintenance covenants under our Credit Agreement sometime during 2015. We intend to engage the lenders under the Credit Agreement in discussions regarding amending our financial ratio covenants at such time as our borrowing base is next redetermined, but we can provide no assurance that we will be successful in obtaining such an amendment. While we believe we will obtain the appropriate covenant relief, if we are unable to obtain such an amendment from our lenders, we believe that we can find alternative financing and we may have to reduce our cash outlays further for capital expenditures and other activities until such time as market conditions recover. Realization of any of these factors could adversely affect our financial condition, results of operations and cash flows. 59
During 2012,2014, the outstanding borrowings on the revolving bank credit facility reached a high of $330.0$447.0 million, which was also the outstanding balance at December 31, 2014, primarily to fund the acquisition of the Newfield Properties. These borrowings were reduced to $170.0 million as of December 31, 2012.acquisitions, our various deepwater development efforts and our ongoing onshore operations. Letters of credit outstanding as of December 31, 20122014 were $0.6 million. On October 24, 2012, we issued an additional $300.0 million of 8.50% Senior Notes at a premium of 106% par value with an interest rate of 8.50% and maturity date of June 15, 2019, which have identical terms to the Senior Notes issued in June 2011. The proceeds were used to pay down amounts outstanding on the revolving bank credit facility. The 8.50% Senior Notes mature on June 15, 2019 and interest is payable semi-annually in arrears on June 15 and December 15 of each year. SeeFinancial Statements and Supplementary Data – Note 7 – Long-Term Debt under Part II, Item 8 ofin this Form 10-K for additional information about our Credit Agreement and long-term debt. We were in compliance with all applicable covenants related to the 8.50% Senior Notes as of December 31, 2012.2014.
In January 2012, holders of the $600.0 million 8.50% Senior Notes issued in June 2011 exchanged their Senior Notes for registered notes with the same terms. In February 2013, holders of the $300.0 million 8.50% Senior Notes issued in October 2012 exchanged their Senior Notes for registered notes with the same terms.
Derivative financial instruments. From time to time, we use various derivative instruments to manage a portion of our exposure to commodity price risk from sales of oil and natural gas and interest rate risk from floating interest rates on our revolving bank credit facility. As of December 31, 2012, our2014, we did not have any outstanding derivative instruments consisted of commodity swap oil contracts relating to approximately 1.3 MMBblsopen derivatives. See Financial Statements and 0.7 MMBbls of our anticipated oil production for 2013 and 2104, respectively. During January and February of 2013, we have entered into additional derivative contracts for oil related to our anticipated 2013 and 2014 production. SeeFinancial StatementsSupplementary Data – Note 6 – Derivative Financial Instrumentsunder Part II, Item 8 ofin this Form 10-K for additional information about our derivatives. Hurricane Remediationremediation, insurance claims and Insurance Claimsinsurance coverage. During the third quarter of 2008, Hurricane Ike caused substantial property damage and we continue to incur costs and submit claims to our insurance underwriters related to repairing such damage. Our insurance policies in effect onSubstantially all the occurrence date of Hurricane Ike had a retention requirement of $10.0 million per occurrence, which has been satisfied, and coverage policy limits of $150.0 million for property damage due to named windstorms (excluding damage at certain facilities) and $250.0 million for, among other things, removal of wreckage if mandated by any governmental authority. Through December 31, 2012, we have received cash from our insurance carrier related to Hurricane Ike claims totaling $142.2 million and have no insurance receivables recorded as of December 31, 2012 for claims that have been submitted and approved for payment. As of December 31, 2012, we have recorded in ARO an estimate of $6.6 million for additional costs to be incurred related to Hurricane Ike and we have estimated that this work will be completed by the end of 2013. We expect to receive reimbursement for a portion of these costs once costs are incurred and claims submitted. In addition, we have incurred removal of wreck costs related to Hurricane Ike but some of our insurance carriers are disputing whether such costs are covered costs; therefore, we cannot estimate the amount of reimbursement to be received at this time. Should necessary expenditures exceed our insurance coverage for damages incurred as a result of Hurricane Ike, or claims are denied or there are significant delays in recovering further claims for other reasons, we expect that our available cash on hand, cash flow from operations and the availability under our revolving bank credit facility will be sufficient to meet these future cash needs.
During the fourth quarter of 2012, underwriters of W&T’s excess liability policies (Indemnity Insurance Company of North America, New York Marine & General Insurance Company, Navigators Insurance Company; XL Specialty Insurance Company and Liberty Mutual Insurance Co.) filed declaratory judgment actions in the United States District Court for the Southern District of Texas seeking a determination that such policies do not cover removal of wreck and debris claims arising from Hurricane Ike that occurred in 2008. The court consolidated the various suits filed by underwriters. W&T has not yet filed any claim under such excess policies, but W&T anticipates that such claims may reach $50.0 million in aggregate. In January 2013, the Company filed a motion for summary judgment seeking the court’s determination that such excess policies do in fact provide coverage for such removal of wreck and debris claims. The motion for summary judgment is pending. If successful, we expect to receive reimbursement for these costs once costs have been incurred and we submitted claims submitted. We haveunder our insurance policies effective at that time, of which $161.2 million has been collected through December 31, 2014. In June 2014, the United States Fifth Circuit reversed a lower court’s ruling and compelled our insurance underwriters to reimburse costs incurred $45.6 million to date and expect to incur an additional $5.0 million in costs related toby us for removal of wreck associated with platforms damaged byrelated to damages we incurred during Hurricane Ike. Removal-of-wreckSeveral of the underwriters have not paid in accordance with the Fifth Circuit ruling. We filed a lawsuit in September 2014 against certain underwriters for amounts owed, interest, attorney fees and damages. After receiving reimbursements applied against our remaining Energy Package limits, reimbursement from certain underwriters of the Excess Policies of approximately $10 million and adjustments to claims, the estimated potential reimbursement of removal-of-wreck costs are recorded inOilis approximately $31 million, plus interest, attorney fees and natural gas propertiesdamages, if any. Given the Fifth Circuit’s ruling, we expect to be reimbursed and equipment on the Consolidated Balance Sheet. Any recoveries from claims made oncompensated for all these policies related to this issue will be recorded as reductions in this line item, which will reduce our DD&A ratecosts, interest, fees and replenish our cash expenditures.damages. See
For a discussion of our hurricane remediation costs related to lease operating expenses incurred during 2012, 2011 and 2010, refer toFinancial Statements and Supplementary Data - Note 18 – Note 3 – Hurricane Remediation and Insurance ClaimsContingencies under Part II, Item 8 ofin this Form 10-K. We expect that the majority of insurance reimbursements subsequent to December 31, 2012 will be attributable to plugging and abandonment activities. Insurance reimbursements related to plugging and abandonment activities are recorded as reductions toOil and natural gas propertieson the Consolidated Balance Sheet, which would affect future DD&A expense. for additional information.
We currently carry threemultiple layers of insurance coverage forin our Energy Package covering our operating activities, in the Gulfwith higher limits of Mexico.coverage for higher valued properties and wells. The current policy limits for well control range from $30.0 million to $500.0 million depending on the risk profile and hurricane damage (defined as contractual requirements. We have $75.0 million of named windstorm (hurricane and tropical storm) coverage for certain of our offshore properties and wells and an additional $75.0 million for certain properties and wells at our higher value fields. We have $50.0 million of named windstorm coverage for our lower value offshore properties for the cost of removal in our policies) are up to $100.0 millionexcess of scheduled ARO amounts. The well control, named windstorm and $140.0 million, respectively, and the policies arephysical damage coverage is effective until June 1, 2013. We carry an additional $100.0 million of well control coverage effective until June 1, 2013 on certain wells at our Mahogany, Matterhorn, Virgo, Main Pass 107/108, Tahoe and SE Tahoe fields.2015. A per-occurrence retention amount of $5.0$30.0 million for well controlnamed windstorm events and $40.5 million per hurricane occurrence must be satisfied by us before our insurers will indemnify us for losses and we are indemnifiedco-insure 15% of our named windstorm coverage. We also have other smaller per-occurrence retention amounts for losses. Pollutionvarious other events. Coverage for pollution causing a negative environmental impact is characterized as a covered component of each ofprovided under the well control and hurricanenamed windstorm sections of the policy. We estimate that asAll of December 31, 2012, approximately 91% of the estimated future net revenues discounted at 10% (PV-10) attributable to our Gulf of Mexico properties are on platforms thatwith estimated future net revenues are covered under our current insurance policies for named windstorm damage. The percentage of our PV-10 value fields that are covered are less than last year due to the acquisition of the Newfield Properties. Since we closed on the Newfield Properties near the end of named windstorm seasonrisk exposure varies per property and much of the property value is in subsea wells, we elected not to purchase named windstorm insurance on the assets. There are certain other properties we have deemed as non-coreexposure for applicable retentions, co-insurance amounts and do not cover for named windstorm damage.coverage limits.
Our general and excess liability policy ispolicies are effective until May 1, 20132015 and providesprovide for $250.0$300.0 million of liability coverage for bodily injury and property damage liability, including coverage for liability claims resulting from seepage, pollution or contamination. We have a builder’s risk and separate liability policy for certain non-operated properties for platforms and drilling operations under construction, which has coverage net to our interest of $137 million and $50 million, respectively, with retentions ranging from $0.1 to $0.3 million for different events and is effective until the estimated completion date of December 31, 2015. With respect to the Oil Spill Financial Responsibility requirement under the OceanOil Pollution Act of 1990, we are required to evidence $150.0 million of financial responsibility to the BSEE. We qualify to self-insure for $35.0$54.0 million of this amount and the remaining $115.0$96.0 million is covered by insurance. Although we were able to renew our Energy Package and our general and excess liability policies in the second quarter of 2014 and have not been informed otherwise, in the future, our insurers may not continue to offer this type and level of coverage to us, or our costs may increase substantially as a result of increased premiums and there could be an increased risk of uninsured losses that may have been previously insured, all of which could have a material adverse effect on our financial condition and results of operations. We are also exposed to the possibility that in the future we will be unable to buy insurance at any price or that if we do have claims, the insurers will not pay our claims. However, we are not aware of any financial issues related to any of our insurance underwriters that would affect their ability to pay claims. We do not carry business interruption insurance. 60
The premiums for the above policies including brokerage fees were $30.6$25.6 million for the May/June 20122014 policy renewals compared to $32.3$24.1 million for the expiring policies. The decreaseincrease in our premiums effective with the June 1, 20122014 renewal was primarily attributable to the addition of the builder’s risk policy and partially offset by lower premiums due to an improved insurance market, likely due to less windstorm activity. We do not carry business interruption insurance.market. Capital expenditures.The level of our investment in oil and natural gas properties changes from time to time depending on numerous factors, including the prices of oil and natural gas, acquisition opportunities, and the results of our exploration and development activities. The following table presents our capital expenditures for acquisitions, exploration, development and other leasehold costs: | | Year Ended December 31, | | | | 2014 | | | 2013 | | | 2012 | | | | (In thousands) | | Acquisition of additional interest in Fairway | | $ | 17,407 | | | $ | — | | | $ | — | | Acquisition of Woodside Properties | | | 54,827 | | | | — | | | | — | | Acquisition of Callon Properties | | | 576 | | | | 82,424 | | | | — | | Acquisition of Newfield Properties | | | — | | | | 238 | | | | 205,550 | | Exploration (1) | | | 179,196 | | | | 198,740 | | | | 137,055 | | Development (1) | | | 346,388 | | | | 308,327 | | | | 310,205 | | Seismic, capitalized interest, other leasehold costs | | | 28,218 | | | | 44,649 | | | | 32,053 | | Acquisitions and investments in oil and gas property/equipment | | $ | 626,612 | | | $ | 634,378 | | | $ | 684,863 | |
| | | | | | | | | | | | | | | | Year Ended December 31, | | | | | 2012 | | | 2011 | | | 2010 | | | | | (in thousands) | | Acquisition of Newfield Properties | | $ | 205,550 | | | $ | — | | | $ | — | | Acquisition of Yellow Rose Properties | | | — | | | | 394,377 | | | | — | | Acquisition of Fairway Properties | | | — | | | | 42,870 | | | | — | | Acquisition of (adjustments to) Tahoe Properties | | | — | | | | (5,700 | ) | | | 121,933 | | Acquisition of properties from Total E&P | | | — | | | | — | | | | 115,012 | | Exploration (1) | | | 137,055 | | | | 77,606 | | | | 60,164 | | Development (1) | | | 310,205 | | | | 179,705 | | | | 77,230 | | Seismic, capitalized interest, other leasehold costs | | | 32,053 | | | | 30,168 | | | | 41,314 | | | | | | | | | | | | | | | Acquisitions and investments in oil and gas property/equipment | | $ | 684,863 | | | $ | 719,026 | | | $ | 415,653 | | | | | | | | | | | | | | |
(1) | Reported geographically in the subsequent table. |
The following table presents our exploration and development capital expenditures geographically: | | Year Ended December 31, | | | | 2014 | | | 2013 | | | 2012 | | | | (In thousands) | | Conventional shelf | | $ | 131,215 | | | $ | 143,151 | | | $ | 104,401 | | Deepwater | | | 216,539 | | | | 143,745 | | | | 65,856 | | Deep shelf | | | 23,615 | | | | 61,953 | | | | 11,961 | | Onshore | | | 154,215 | | | | 158,218 | | | | 265,042 | | Exploration and development capital expenditures | | $ | 525,584 | | | $ | 507,067 | | | $ | 447,260 | |
| | | | | | | | | | | | | | | | Year Ended December 31, | | | | | 2012 | | | 2011 | | | 2010 | | | | | (in thousands) | | Conventional shelf | | $ | 104,401 | | | $ | 132,680 | | | $ | 115,503 | | Deepwater | | | 65,856 | | | | 4,826 | | | | 9,358 | | Deep shelf | | | 11,961 | | | | 5,833 | | | | 3,382 | | Onshore | | | 265,042 | | | | 113,972 | | | | 9,151 | | | | | | | | | | | | | | | Exploration and development capital expenditures | | $ | 447,260 | | | $ | 257,311 | | | $ | 137,394 | | | | | | | | | | | | | | |
The following table sets forth our drilling activity on a gross basis. | | | | | | | | | | | | | Completed | | | Non-commercial | | | | | Completed | | | Non-commercial | | 2014 | | | 2013 | | | 2012 | | | 2014 | | | 2013 | | | 2012 | | | | | 2012 | | | 2011 | | | 2010 | | | 2012 | | | 2011 | | | 2010 | | | Offshore – gross wells drilled: | | | | | | | | | | | | | | Offshore - gross wells drills: | | | | | | | | | | | | | | | | | | | | | | | | | Conventional shelf | | | 3 | | | | 7 | | | | 6 | | | | 1 | | | | — | | | | 1 | | | 3 | | | | 4 | | | | 3 | | | | — | | | | 1 | | | | 1 | | Deepwater | | | 3 | | | | 1 | | | | 1 | | | | — | | | | — | | | | — | | Deep shelf | | | 1 | | | | 1 | | | | — | | | | — | | | | — | | | | — | | | — | | | | — | | | | — | | | | — | | | | — | | | | — | | | Wells operated by W&T | | | 3 | | | | 7 | | | | 3 | | | | n/a | | | | n/a | | | | n/a | | | 4 | | | | 5 | | | | 3 | | | n/a | | | n/a | | | n/a | | | Onshore: | | | | | | | | | | | | | | | | | | | | | | | | | | | | | | | | | | | | Gross wells drilled | | | 77 | | | | 39 | | | | — | | | | — | | | | 1 | | | | 2 | | | 33 | | | | 40 | | | | 77 | | | | — | | | | — | | | | — | | | Wells operated by W&T | | | 73 | | | | 33 | | | | — | | | | n/a | | | | n/a | | | | n/a | | | 32 | | | | 40 | | | | 73 | | | n/a | | | n/a | | | n/a | |
As of December 31, 2012,2014, we were in the process of drilling and/or completing ninefive offshore exploration wells, six onshore development wells in Texas sixand seven onshore exploration wells in Texas, two offshore exploration wells and one offshore development well.Texas. See SeeProperties – Drilling–Drilling Activityunder Part I, Item 2 of this Form 10-K for a breakdown of exploration and development wells and additional drilling activity information. See SeeProperties – Development–Development of Proved Undeveloped Reservesunder Part I, Item 2 of this Form 10-K for a discussion on activity related to proved undeveloped reserves. In 2012, weWe acquired 11the following leases from the BOEM for $2.5 million. In 2011, we did not participate in bidding for any Gulf of Mexico leases on the OCS. Due to the government mandated moratorium that began in April 2010, Gulf of Mexico lease sales conducted by the U.S. government through the BOEM were suspended until December 2011. Leases acquired from the BOEM in the March 2010 lease sale totaledBOEM: five leases ($2.4 million), two leases ($0.5 million) and 11 leases ($2.5 million) for $8.7 million.the years 2014, 2013 and 2012, respectively.
61
From time to time, we sell various oil and gas properties for a variety of reasons including, change of focus, perception of value and to reduce debt, among other reasons. In 2014, there were no property sales of significance. In 2013, we sold our working interests in the Green Canyon 60 field, the Green Canyon 19 field, the West Delta area block 29 and, combined with various other transactions and adjustments, produced net cash receipts of $10.2 million and reduced ARO by $19.6 million. Also in 2013, we received $9.1 million in conjunction with a payment to us for an option exercised by a counterparty. In 2012, we sold our 40% non-operated working interest in the South Timbalier 41 field located in the Gulf of Mexico for $30.5 million and reduced ARO by $4.0 million. In 2011See Financial Statements and 2010, there were no property sales of significance.Supplementary Data – Note 2 – Acquisitions and Divestitures under Part II, Item 8 in this Form 10-K for additional information on divestitures. Our totalcurrent capital expenditure budget for 2013 currently2015 is $450.0$200 million, not including any potential acquisitions. The 2015 budget includes 63%is being allotted as follows: 38% for exploration, and 37%61% for development and these percentages include amountsless than 1% for facilities capital, recompletions, seismic and leaseholdother items. Geographically, the budget includes 63%is split 92% for offshore (11 wells) and 37% for onshore. The budget for offshore includes two deepwater wells and a joint interest arrangement in another deepwater well, of which we are not the operator. The budget8% for onshore, includes 27 wells inwith the Yellow Rose Propertiessubstantial majority of offshore dedicated to the deepwater. Through February 2015, we have not closed any acquisitions, but we continue to evaluate and amounts currently designatedbid on opportunities as they arise. We anticipate funding our 2015 capital budget, any potential acquisitions and other expenditures with cash flow from operating activities, cash on hand and borrowings under our revolving bank credit facility. For the portion of our capital budget related to drilling, our operating policy has been to fund these expenditures with cash flow provided by operations. See below for our Terry County and East Texas prospects for completion work and additional wells, which require further evaluation.information on capital markets. Our 20132015 capital budget is subject to change as conditions warrant and wewarrant. We strive to be as flexible as possible. possible and believe this strategy holds the best promise for value creation, growth and managing the volatility inherent in our business.Income taxes. During 2014, we did not make any income tax payments and received $3.0 million of refunds. The refund was attributable to 2013 estimated federal tax payments. During 2013, we made income tax payments of $3.0 million and received $59.1 million of refunds. The refunds were primarily attributable to tax loss carrybacks to 2010 and 2011, and refunds of 2012 estimated federal tax payments. During 2012, we made income tax payments of $16.1 million and received refunds of $0.5 million. As of December 31, 2014, $9.5 million of the refunds received in 2013 have been accounted for as unrecognized tax benefits. We intendhave $516.4 million of Federal net operating loss carryforwards (tax basis) available to continueoffset future taxable income in 2015 and forward. We also have $12.1 million of alternative minimum tax credit carryforwards (tax basis) available to pursue acquisitionsbe utilized in 2015 and joint venture opportunities duringforward. Dividends. In 2014, we paid $30.3 million in dividends. In 2013, should we identify attractive opportunities. We are actively evaluating opportunitiespaid $58.8 million in dividends, which included a special dividend totaling $31.8 million and expect to complement our drilling and development projects with acquisitions providing acceptable ratesregular dividends of return. We anticipate funding our 2013 capital budget and acquisitions with internally generated cash flow, cash on hand, borrowings under our revolving loan facility, and accessing the capital markets to the extent necessary. Dividends.$27.0 million. In 2012, we paid $82.8 million in dividends, which included two special dividends totaling $59.0 million and regular dividends of $23.8 million. In 2011, we paid $58.8 million in dividends, which included a special dividend of $46.9 million and regular dividends of $11.9 million. In 2010, we paid $59.6 million in dividends, which included a special dividend of $49.2 million and regular dividends of $10.4 million. Future special dividends cannot be predicted andDividends are subject to approvalperiodic review of the board of directors, which will consider theCompany’s performance of the Company, its financial condition, future investment opportunities and other factors as our majority shareholder and the boardcurrent economic environment and applicable debt agreement restrictions. In light of directors deems appropriate.current market conditions, the Board of Directors has elected to suspend the regular quarterly dividend.
Capital Marketsmarkets and Impact on Liquidity. During 2012 and 2011, we accessed the capital markets for our 8.50% Senior Notes and renewed our revolving bank credit facility arrangement in 2011 as described above. In 2012 and 2011, the U.S. financial markets were not adversely affected by the events in the international markets, including the financial crisis that has threatened the various countries in the Euro zone. Such crisis had an impact on European banks that had exposure to these countries which could ultimately impact borrowers in the United States. Currently, the Euro zone financial markets appear to have stabilized, but the underlying cause of certain countries’ high debt levels may take years to reduce their risk profile. The longer-term outlook could be impacted from these or other international events.liquidity. At this time, we do not have current plans to obtain additional financing in 2013,2015, but this situation could change depending on a number of factors, such as acquisition opportunities and prices of oil and natural gas. A fairly recent example of scarce financing availability occurred in 2009 when The capital markets we have historically accessed are currently constrained, but we believe we could access other capital markets if the globalneed arises. Additionally, we may be restricted on accessing certain capital markets due to terms within our Credit Agreement and Senior Note Indenture if certain covenants, primarily certain financial ratios, are not achieved on a current and pro forma basis as defined within the agreements. We have assessed our financial condition, the current capital markets and economic conditions were severely distressed. There were concernsoptions given different scenarios of bank failurescommodity prices and believe we will have adequate liquidity to fund our operations through December 31, 2015; however, we cannot predict how an extended period of low commodity prices will affect our operations and liquidity concerns whether our banks would be able to meet their commitments under credit arrangements in place during that time. In addition, prices for oil and natural gas had decreased from 2008. These conditions contributed to fewer financing transactions being completed.levels.
Asset retirement obligations. Each year (or(and often more often if conditions warrant)frequently) we review and to the extent necessary, revise our ARO estimates. Our ARO at December 31, 20122014 and 20112013 were $384.1$390.6 million and $393.9$354.4 million, respectively. In 2012,2014 and 2013, we revised our estimateestimates to account for the increased cost to comply with new and revised regulations including an increase in work scope and interpretation of work scope. SeeFinancial Statements and Supplementary Data – Note 5 – Asset Retirement Obligationsunder Part II, Item 8 ofin this 10-Kfor10-K for additional information regarding our estimation of our ARO. 62
Contractual obligations. The following table summarizes our significant contractual obligations by maturity as of December 31, 2012.2014. At December 31, 2012,2014, we did not have any capital leases. | | | | | | | | | | | | | | | | | | | | | | | | Payments Due by Period at December 31, 2012 | | | | Total | | | Less Than
One Year | | | One to
Three Years | | | Three to
Five Years | | | More Than
Five Years | | | | (Dollars in millions) | | Long-term debt – principal | | $ | 1,070.0 | | | $ | — | | | $ | 170.0 | | | $ | — | | | $ | 900.0 | | Long-term debt – interest (1) | | | 512.6 | | | | 84.4 | | | | 163.8 | | | | 153.0 | | | | 111.4 | | Drilling rigs | | | 36.5 | | | | 36.5 | | | | — | | | | — | | | | — | | Operating leases | | | 13.1 | | | | 1.2 | | | | 2.6 | | | | 2.6 | | | | 6.7 | | Asset retirement obligations | | | 384.1 | | | | 92.6 | | | | 97.9 | | | | 48.3 | | | | 145.3 | | Derivatives (2) | | | 9.4 | | | | 9.4 | | | | — | | | | — | | | | — | | Other liabilities (3) | | | 5.5 | | | | — | | | | 5.5 | | | | — | | | | — | | | | | | | | | | | | | | | | | | | | | | | | | $ | 2,031.2 | | | $ | 224.1 | | | $ | 439.8 | | | $ | 203.9 | | | $ | 1,163.4 | | | | | | | | | | | | | | | | | | | | | | |
| Payments Due by Period as of December 31, 2014 | | | Total | | | Less than One Year | | | One to Three Years | | | Three to Five Years | | | More Than Five Years | | Long-term debt - principal | $ | 1,347.0 | | | $ | — | | | $ | — | | | $ | 1,347.0 | | | $ | — | | Long-term debt - interest (1) | | 390.6 | | | | 89.4 | | | | 178.8 | | | | 122.4 | | | | — | | Drilling rigs | | 12.6 | | | | 12.6 | | | | — | | | | — | | | | — | | Operating leases | | 13.9 | | | | 1.5 | | | | 3.2 | | | | 3.5 | | | | 5.7 | | Asset retirement obligations (2) | | 390.6 | | | | 36.0 | | | | 179.4 | | | | 19.0 | | | | 156.2 | | Other liabilities and commitments (3) | | 61.7 | | | | 7.9 | | | | 15.7 | | | | 9.7 | | | | 28.4 | | Total | $ | 2,216.4 | | | $ | 147.4 | | | $ | 377.1 | | | $ | 1,501.6 | | | $ | 190.3 | |
(1) | Interest on long-term debt is comprised of: (a) interest on our 8.50% Senior Notes, which bear interest at a fixed rate of 8.50% and (b) interest on our revolving bank credit facility, which has a variable interest rate, estimated using the borrowings outstanding as of December 31, 2012,2014, an annual interest rate of 3.0%2.6%, which was the interest rate as of December 31, 2012,2014, and the commitment fee of 0.5%0.375% on the unused balance as of December 31, 2012.2014. Interest was calculated through the stated maturity date of the related debt. |
(2) | TheARO in the above table is presented on a discounted basis, consistent with the amounts forreported on the derivative contracts reported above are the unrealized fair values liabilityConsolidated Balance as of December 31, 2012. Actual payments at2014. All other amounts in the settlement date could vary significantly from these amounts.above table are presented on an undiscounted basis. |
(3) | We have excluded security requirements pursuantOther liabilities and commitments primarily consist of estimated fees for obtaining bonds related to the Purchaseobligations under certain purchase and Sale agreement with Total E&Psale agreements and supplemental bonding for the ARO on certain properties as we plan to utilize bonds, not cash, to fulfill the requirements. Further, if cash were to be deposited in escrow, the funds would be returned when the plugging and abandonment work hason behalf of the BOEM. The amounts are based on current market rates and conditions for these types of bonds and are subject to change. Excluded are potential increases in bond requirements which have not yet been completed. A similar rationale was applieddetermined. Also excluded are obligations under joint interest arrangements related to exclude the potential additional security requirements pursuantcommitments that have not yet been incurred. In these instances, we are obligated to pay, according to our interest ownership, a portion of exploration and development costs, operating costs and potentially could be offset by our interest in future revenue from these non-operated properties. These joint interest obligations for future commitments cannot be determined due to the Purchasevariability of factors involved. See Financial Statements and Sale agreement with Shell. SeeFinancial StatementsSupplementary Data – Note 16 – Commitmentsunder Part II, Item 8 ofin this 10-Kfor10-K for additional information. |
Inflation and Seasonality InflationInflation. For 2012,2014, our realized prices (unhedged) for oil decreased 1.5%11.2%, NGLs decreased 28.8%1.7% and natural gas decreased 28.6%increased 22.5% from 2011.2013. These are discussed in theOverview section above. Costs measured on a $/McfeBoe basis increased by 6.2%9.5% in 20122014 compared to 2011.2013. The cost per McfeBoe is impacted by factors other than cost changes, such as work activity including workovers, production levels and insurance reimbursements. Historically, costs for goods and services have moved directionally with the price of oil, NGLs and natural gas, as these commodities affect the demand for these goods and services. In recent years, other factors have influenced the cost of goods and services. For example, in 2009, some offshore third-party contractors were in high demand associated with remediation work related to Hurricane Ike which increased the price for these types of contractors. In 2010, pricesDemand for offshore third-party contractors were relatively stable as drilling activity was curtailed due tocan be affected by hurricanes, oil spills and changes in regulations which are outside of the moratorium, but boat prices and other services escalated due to contract work for BP in connection with the cleanup effortinfluences from the oil spill at the Macondo well.commodity price changes. Other costs, such as insurance premiums, have fluctuated with changes in hurricane activity, the oil spill at the BP Macondo wellspills and other factors besides production volumes. More recently,Also, many commodity prices, including oil, copper, steel and other types of metals, have fluctuated wildly with various world events. Some of this fluctuation is due to strongchanges in economic activity in certain parts of the world, while other changes appear to be driven by political events around the world, the weakchanges in the value of the US dollar (both up and down) and other foreign currencies. Also,In addition, inflation in our industry is impacted as a result of record federal deficits and expectations that large deficits will continue. SeasonalitySeasonality. Generally, the demand for and price of natural gas increases during the winter months and decreases during the summer months. However, these seasonal fluctuations are somewhat reduced because during the summer, pipeline companies, utilities, local distribution companies and industrial users purchase and place into storage facilities a portion of their anticipated winter requirements of natural gas. In addition, the demand for oil is higher in the winter months, but does not fluctuate as much as natural gas. Seasonal weather changes affect our operations. Tropical storms and hurricanes occur in the Gulf of Mexico during the summer and fall, which require us to evacuate personnel and shut-inshut in production until the storm subsides. Also, periodic storms during the winter often impede our ability to safely load, unload and transport personnel and equipment, which delays the installation of production facilities, thereby delaying production and sales of our oil and natural gas. 63
Critical Accounting Policies This discussion of financial condition and results of operations is based upon the information reported in our consolidated financial statements, which have been prepared in accordance with GAAP in the United States. The preparation of our financial statements requires us to make informed judgments and estimates that affect the reported amounts of assets, liabilities, revenues and expenses, as well as the disclosure of contingent assets and liabilities at the date of our financial statements. We base our estimates on historical experience and other sources that we believe to be reasonable at the time. Changes in the facts and circumstances or the discovery of new information may result in revised estimates and actual results may vary from our estimates. Our significant accounting policies are detailed inFinancial Statements and Supplementary Data – Note 1 – Significant Accounting Policiesunder Part II, Item 8 in this Form 10-K.10-K. We have outlined below certain accounting policies that are of particular importance to the presentation of our financial position and results of operations and require the application of significant judgment or estimates by our management. Revenue recognition. recognition. We recognize oil and natural gas revenues based on the quantities of our production sold to purchasers under short-term contracts (less than 12 months) at market prices when delivery has occurred, title has transferred and collectability is reasonably assured. We use the sales method of accounting for oil and natural gas revenues from properties with joint ownership. Under this method, we record oil and natural gas revenues based upon physical deliveries to our customers, which can be different from our net revenue ownership interest in field production. These differences create imbalances that we recognize as a liability only when the estimated remaining recoverable reserves of a property will not be sufficient to enable the under-produced party to recoup its entitled share through production. If oil and natural gas prices decrease, we may need to increase this liability. Also, disputes may arise as to volume measurements and allocation of production components between parties. These disputes could cause us to increase our liability for such potential exposure. We do not record receivables for those properties in which the Company has taken less than its ownership share of production which could cause us to delay recognition of amounts due us. Full-cost accounting.We account for our investments in oil and natural gas properties using the full-cost method of accounting. Under this method, all costs associated with the acquisition, exploration, development and abandonment of oil and gas properties are capitalized. Capitalization of geological and geophysical costs, certain employee costs and G&A expenses related to these activities is permitted. We amortize our investment in oil and natural gas properties, capitalized ARO and future development costs (including ARO of wells to be drilled) through DD&A, using the units-of-production method. The units-of-production method uses reserve information in its calculations. The cost of unproved properties related to acquisitions are excluded from the amortization base until it is determined that proved reserves exist or until such time that impairment has occurred. We capitalize interest on unproved properties that are excluded from the amortization base. The costs of drilling non-commercial exploratory wells are included in the amortization base immediately upon determination that such wells are non-commercial. Under the full-cost method, sales of oil and natural gas properties are accounted for as adjustments to capitalized costs with no gain or loss recognized unless an adjustment would significantly alter the relationship between capitalized costs and the value of proved reserves. Our financial position and results of operations may have been significantly different had we used the successful-efforts method of accounting for our oil and natural gas investments. GAAP allows successful-efforts accounting as an alternative method to full-cost accounting. The primary difference between the two methods is in the treatment of exploration costs, including geological and geophysical costs, and in the resulting computation of DD&A. Under the full-cost method, which we follow, exploratory costs are capitalized, while under successful-efforts, the cost associated with unsuccessful exploration activities and all geological and geophysical costs are expensed. In following the full-cost method, we calculate DD&A based on a single pool for all of our oil and natural gas properties, while the successful-efforts method utilizes cost centers represented by individual properties, fields or reserves. Typically, the application of the full-cost method of accounting for oil and natural gas properties results in higher capitalized costs and higher DD&A rates, compared to similar companies applying the successful efforts method of accounting. DD&A can be affected by several factors other than production. The rate computation includes estimates of reserves which requires significant judgments and is subject to change at each assessment. The determination of when proved reserves exist for our unproved properties requires judgment, which can affect our DD&A rate. Also, estimates of our ARO and estimates of future development costs require significant judgment. Actual results may be significantly different from these estimates, which would affect the timing of when these expenses would be recognized in DD&A. SeeOil and natural gas reserve quantitiesandAsset retirement obligationsbelow for more information. 64
Impairment of oil and natural gas properties.Under the full cost method of accounting, we are required to periodically perform a “ceiling test,” which determines a limit on the book value of our oil and natural gas properties. Any write downs occurring as a result of the ceiling test impairment are not recoverable or reversible in future periods. We did not have a ceiling test impairment in 2012, 2011 or 2010, but we did haveany ceiling test impairments in 20092014 or the previous four years. If WTI and Brent prices remain at levels occurring during December 2014 and January 2015, we estimate that we will likely recognize a non-cash ceiling test write-down during 2015, and could have a non-cash ceiling test write-down in more than one quarter of 2015. For the effect of lower commodity prices on liquidity, see Risk Factors - Risks Related to Financing under Part I, Item 1A and in 2008 as a resultthe Liquidity and Capital Resources section of this Item in this Form 10-K for additional information about our Credit Agreement and financing. For the significant declineeffect of lower commodity prices on revenues and earnings, see Quantitative and Qualitative Disclosures on Market Risks under Part II, Item 7A in both oil and natural gas prices that began in the second half of 2008. Declines in oil and natural gas prices after December 31, 2012 may require us to recordthis Form 10-K for additional ceiling test impairments in the future.information. Oil and natural gas reserve quantities.Reserve quantities and the related estimates of future net cash flows affect our periodic calculations of DD&A and impairment assessment of our oil and natural gas properties. We make changes to DD&A rates and impairment calculations in the same period that changes to our reserve estimates are made. Our proved reserve information as of December 31, 20122014 included in this Form 10-K was estimated by our independent petroleum consultant, NSAI, in accordance with generally accepted petroleum engineering and evaluation principles and definitions and guidelines established by the SEC. The accuracy of our reserve estimates is a function of: · | the quality and quantity of available data and the engineering and geological interpretation of that data; |
· | estimates regarding the amount and timing of future operating costs, severance taxes, development costs and workovers, all of which may vary considerably from actual results; |
· | the accuracy of various mandated economic assumptions such as the future prices of oil and natural gas; and |
· | the judgment of the persons preparing the estimates. |
Because these estimates depend on many assumptions, any or all of which may differ substantially from actual results, reserve estimates may be different from the quantities of oil and natural gas that are ultimately recovered. Insurance receivables.We recognize insurance receivables with respect to capital, repair and plugging and abandonment costs as a result of hurricane damage when we deem those to be probable of collection, which arises when our insurance underwriters’ adjuster reviews and approves such costs for payment by the underwriters. Actual collections may be significantly different than these estimates and revisions could impact our lease operating expense, our oil and natural gas property balance and our DD&A rates.
Asset retirement obligations. We have significant obligations to plug and abandon all well bores, remove our platforms, pipelines, facilities and equipment and restore the land or seabed at the end of oil and natural gas production operations. These obligations are primarily associated with plugging and abandoning wells, removing pipelines, removing and disposing of offshore platforms and site cleanup. Estimating the future restoration and removal cost is difficult and requires us to make estimates and judgments because the removal obligations may be many years in the future and contracts and regulations often have vague descriptions of what constitutes removal. Asset removal technologies and costs are constantly changing, as are regulatory, political, environmental, safety and public relations considerations, which can substantially affect our estimates of these future costs from period to period. Pursuant to theAsset Retirement and Environmental Obligations topic of the Financial Accounting Standards Board (“FASB”) Accounting Standards Codification (the “Codification”),GAAP, we are required to record a separate liability for the discounted present value of our ARO, with an offsetting increase to the related oil and natural gas properties on our balance sheet. Inherent in the present value calculation of our liability are numerous estimates and judgments, including the ultimate settlement amounts, inflation factors, changes to our credit-adjusted risk-free rate, timing of settlement and changes in the legal, regulatory, environmental and political environments. Revisions to these estimates impact the value of our abandonment liability, our oil and natural gas property balance and our DD&A rates. Fair value measurements. We measure the fair value of our derivative financial instruments by applying the income approach and using inputs that are derived principally from observable market data. Changes in the underlying commodity prices of the derivatives impact the unrealized and realized gain or loss recognized. We do not apply hedge accounting to these derivatives,our derivatives; therefore, the change in fair value for all outstanding derivatives, which include derivatives that are hedges againstentered into in anticipation of future production, are reflected currently in our statementstatements of income.operations. This can create timing differences between when the production is recognized and when the gain or loss on the derivative is recognized in the income statement.
65
Income taxes.We provide for income taxes in accordance with theIncome Taxestopic of the Codification,GAAP, which requires the use of the liability method of computing deferred income taxes, whereby deferred income taxes are recognized for the future tax consequences of the differences between the tax basis of assets and liabilities and the carrying amount in our financial statements required by GAAP.statements. Deferred tax assets and liabilities are measured using enacted tax rates expected to apply to taxable income in the years in which those temporary differences are expected to be recovered or settled. Because our tax returns are filed after the financial statements are prepared, estimates are required in recording tax assets and liabilities. We record adjustments to reflect actual taxes paid in the period we complete our tax returns. In assessing the need for a valuation allowance on our deferred tax assets, we consider whether it is more likely than not that some portion or all of them will not be realized. We recognize uncertain tax positions in our financial statements when it is more likely than not that we will sustain the benefit taken or expected to be taken. When applicable, we recognize interest and penalties related to uncertain tax positions in income tax expense. The final settlement of these tax positions may occur several years after the tax return is filed and may result in significant adjustments depending on the outcome of these settlements. Share-based compensation.In accordance with theCompensation – Stock Compensation topic of the Codification,GAAP, we recognize compensation cost for share-based payments to employees and non-employee directors over the period during which the recipient is required to provide service in exchange for the award, based on the fair value of the equity instrument on the date of the grant. We estimate forfeitures during the service period and make adjustments depending on actual experience. These adjustments can create timing differences on when expense is recognized. Item 7A. Accounting PoliciesQuantitative and PronouncementsQualitative Disclosures About Market Risk Item 7A. | Quantitative and Qualitative Disclosures About Market Risk |
We are exposed to market risks arising from fluctuating prices of crude oil, NGLs, natural gas and interest rates as discussed below. We have utilized derivative contracts to reduce the risk of fluctuations in commodity prices and expect to use these instruments in the future. We are currently a party todid not have any open derivative contracts for oil.as of December 31, 2014. Commodity price risk.Our revenues, profitability and future rate of growth substantially depend upon market prices for oil, NGLs and natural gas, which fluctuate widely. Oil, NGLs and natural gas price declines and volatility could adversely affect our revenues, net cash provided by operating activities and profitability. For example, assuming a 10% decline in our average realized oil, NGLs and natural gas sales prices in 2012,2014 and assuming no other items had changed, our incomeloss before income taxestax would have decreasedincreased by approximately 71%$94 million in 2012.2014. If costs and expenses of operating our properties had increased by 10% in 2012,2014, our incomeloss before income taxestax would have decreasedincreased by 21%approximately $29 million in 2012.2014. As of December 31, 2012,2014, we haddid not have any open derivative contracts for oil with a notional quantity of 2.0 MMBbls and various termination dates in 2013 and 2014.contracts. We do not designate our commodity derivative contracts as hedging instruments. While theseprevious derivative contracts arewere intended to reduce the effects of volatile oil prices, they may also limit futurehave limited income from favorable price movements. For additional details about our derivative contracts, refer toFinancial Statements and Supplementary Data – Note 6 – Derivative Financial Instrumentsunder Part II, Item 8 ofin this Form 10-K.10-K. Interest rate risk.As of December 31, 2012,2014, we had $170.0$447.0 million outstanding on our revolving bank credit facility and during 20122014 we had amounts outstanding that ranged from zero$242.0 million to $330.0$447.0 million. The revolving bank credit facility has a variable interest rate which is primarily impacted by the rates for the LIBOR and the margin ranges from 2.0%1.75% to 2.75% depending on the amount outstanding. In 2012,2014, if interest rates would have been 100 basis points higher (an additional 1%); our interest expense would have been approximately $1.0$3.3 million higher. We did not have any derivative contracts related to interest rates as of December 31, 2012.2014. Item 8. | Financial Statements and Supplementary Data |
66
Item 8. Financial Statements and Supplementary Data W&T OFFSHORE, INC. AND SUBSIDIARIES INDEX TO CONSOLIDATED FINANCIAL STATEMENTS | | | | | | | Page | | Management’s Report on Internal Control over Financial Reporting | | | 76 | 68 | Report of Independent Registered Public Accounting Firm | | | 77 | 69 | Report of Independent Registered Public Accounting Firm | | | 78 | 70 | | | Consolidated Financial Statements: | | | | | Consolidated Balance Sheets as of December 31, 20122014 and 20112013 | | | 79 | 71 | Consolidated Statements of IncomeOperations for the years ended December 31, 2012, 20112014, 2013 and 20102012 | | | 80 | 72 | Consolidated Statements of Changes in Shareholders’ Equity for the years ended December 31, 2012, 20112014, 2013 and 20102012 | | | 81 | 73 | Consolidated Statements of Cash Flows for the years ended December 31, 2012, 20112014, 2013 and 20102012 | | | 82 | 74 | Notes to Consolidated Financial Statements | | | 83 | 75 |
67
MANAGEMENT’S REPORT ON INTERNAL CONTROL OVER FINANCIAL REPORTING Our management is responsible for establishing and maintaining adequate internal control over financial reporting, as such term is defined in Exchange Act Rules 13a-15(f) and 15d-15(f). Our internal control over financial reporting is a process designed to provide reasonable assurance regarding the reliability of financial reporting and the preparation of consolidated financial statements for external purposes in accordance with accounting principles generally accepted in the United States (GAAP). Our internal control over financial reporting includes those policies and procedures that (i) pertain to the maintenance of records that, in reasonable detail, accurately and fairly reflect the transactions and dispositions of our assets; (ii) provide reasonable assurance that transactions are recorded as necessary to permit preparation of financial statements in accordance with GAAP, and that our receipts and expenditures are being made only in accordance with authorizations of management and our directors; and (iii) provide reasonable assurance regarding prevention or timely detection of unauthorized acquisition, use or disposition of our assets that could have a material effect on the consolidated financial statements. Because of its inherent limitations, internal control over financial reporting may not prevent or detect misstatements. Also, projections of any evaluation of effectiveness to future periods are subject to the risk that controls may become inadequate because of changes in conditions, or that the degree of compliance with the policies or procedures may deteriorate. Accordingly, even effective internal control over financial reporting can only provide reasonable assurance of achieving their control objectives. Under the supervision and with the participation of our management, including our principal executive officer and principal financial officer, we conducted an evaluation of the effectiveness of our internal control over financial reporting based on the framework inInternal Control – Integrated Framework issued by the Committee of Sponsoring Organizations of the Treadway Commission.Commission (2013 framework). Based on our evaluation, management concluded that our internal control over financial reporting was effective as of December 31, 20122014 in providing reasonable assurance regarding the reliability of financial reporting and the preparation of financial statements for external purposes in accordance with generally accepted accounting principles. The effectiveness of our internal control over financial reporting as of December 31, 20122014 has been audited by Ernst & Young LLP, an independent registered public accounting firm, as stated in their report, which is included herein.
68
REPORT OF INDEPENDENT REGISTERED PUBLIC ACCOUNTING FIRM The Board of Directors and Shareholders of W&T Offshore, Inc. and Subsidiaries We have audited W&T Offshore, Inc. and subsidiaries’ internal control over financial reporting as of December 31, 2012,2014, based on criteria established in the Internal Control –- Integrated Framework issued by the Committee of Sponsoring Organizations of the Treadway Commission (2013 framework) (the COSO criteria)“COSO criteria”). W&T Offshore, Inc. and subsidiaries’ management is responsible for maintaining effective internal control over financial reporting, and for its assessment of the effectiveness of internal control over financial reporting included in the accompanying Management’s Report on Internal Control Over Financial Reporting. Our responsibility is to express an opinion on the company’s internal control over financial reporting based on our audit. We conducted our audit in accordance with the standards of the Public Company Accounting Oversight Board (United States). Those standards require that we plan and perform the audit to obtain reasonable assurance about whether effective internal control over financial reporting was maintained in all material respects. Our audit included obtaining an understanding of internal control over financial reporting, assessing the risk that a material weakness exists, testing and evaluating the design and operating effectiveness of internal control based on the assessed risk, and performing such other procedures as we considered necessary in the circumstances. We believe that our audit provides a reasonable basis for our opinion. A company’s internal control over financial reporting is a process designed to provide reasonable assurance regarding the reliability of financial reporting and the preparation of financial statements for external purposes in accordance with generally accepted accounting principles. A company’s internal control over financial reporting includes those policies and procedures that (1) pertain to the maintenance of records that, in reasonable detail, accurately and fairly reflect the transactions and dispositions of the assets of the company; (2) provide reasonable assurance that transactions are recorded as necessary to permit preparation of financial statements in accordance with generally accepted accounting principles, and that receipts and expenditures of the company are being made only in accordance with authorizations of management and directors of the company; and (3) provide reasonable assurance regarding prevention or timely detection of unauthorized acquisition, use, or disposition of the company’s assets that could have a material effect on the financial statements. Because of its inherent limitations, internal control over financial reporting may not prevent or detect misstatements. Also, projections of any evaluation of effectiveness to future periods are subject to the risk that controls may become inadequate because of changes in conditions, or that the degree of compliance with the policies or procedures may deteriorate. In our opinion, W&T Offshore, Inc. and subsidiaries maintained, in all material respects, effective internal control over financial reporting as of December 31, 2012,2014, based on the COSO criteria. We also have audited, in accordance with the standards of the Public Company Accounting Oversight Board (United States), the consolidated balance sheets of W&T Offshore, Inc. and subsidiaries as of December 31, 20122014 and 2011,2013, and the related consolidated statements of income, changes inoperations, shareholders’ equity, and cash flows for each of the three years in the period ended December 31, 2012 of W&T Offshore, Inc. and subsidiaries2014 and our report dated February 27, 2013March 6, 2015 expressed an unqualified opinion thereon. /s/ ERNST & YOUNG
Houston, Texas February 27, 2013
March 6, 2015
69
REPORT OF INDEPENDENT REGISTERED PUBLIC ACCOUNTING FIRM The Board of Directors and Shareholders of W&T Offshore, Inc. and Subsidiaries We have audited the accompanying consolidated balance sheets of W&T Offshore, Inc. and subsidiaries as of December 31, 20122014 and 2011,2013, and the related consolidated statements of income,operations, changes in shareholders’shareholders' equity and cash flows for each of the three years in the period ended December 31, 2012.2014. These financial statements are the responsibility of the Company’sCompany's management. Our responsibility is to express an opinion on these financial statements based on our audits. We conducted our audits in accordance with the standards of the Public Company Accounting Oversight Board (United States). Those standards require that we plan and perform the audit to obtain reasonable assurance about whether the financial statements are free of material misstatement. An audit includes examining, on a test basis, evidence supporting the amounts and disclosures in the financial statements. An audit also includes assessing the accounting principles used and significant estimates made by management, as well as evaluating the overall financial statement presentation. We believe that our audits provide a reasonable basis for our opinion. In our opinion, the financial statements referred to above present fairly, in all material respects, the consolidated financial position of W&T Offshore, Inc. and subsidiaries at December 31, 20122014 and 2011,2013, and the consolidated results of their operations and their cash flows for each of the three years in the period ended December 31, 2012,2014, in conformity with U.S. generally accepted accounting principles. We also have audited, in accordance with the standards of the Public Company Accounting Oversight Board (United States), W&T Offshore, Inc. and subsidiaries’ internal control over financial reporting as of December 31, 2012,2014, based on criteria established in the Internal Control –- Integrated Framework issued by the Committee of Sponsoring Organizations of the Treadway Commission (2013 framework) and our report dated February 27, 2013,March 6, 2015 expressed an unqualified opinion thereon. /s/ ERNST & YOUNG
Houston, Texas February 27, 2013
March 6, 2015
70
W&T OFFSHORE, INC. AND SUBSIDIARIES CONSOLIDATED BALANCE SHEETS (In thousands, except share data) | December 31, | | | 2014 | | | 2013 | | Assets | | | | | | | | Current assets: | | | | | | | | Cash and cash equivalents | $ | 23,666 | | | $ | 15,800 | | Receivables: | | | | | | | | Oil and natural gas sales | | 67,242 | | | | 96,752 | | Joint interest and other | | 43,645 | | | | 31,104 | | Total receivables | | 110,887 | | | | 127,856 | | Deferred income taxes | | 11,662 | | | | 584 | | Prepaid expenses and other assets | | 36,347 | | | | 29,362 | | Total current assets | | 182,562 | | | | 173,602 | | Property and equipment - at cost: | | | | | | | | Oil and natural gas properties and equipment (full cost method, of which $109,824 at December 31, 2014 and $116,612 at December 31, 2013 were excluded from amortization) | | 8,045,666 | | | | 7,339,097 | | Furniture, fixtures and other | | 23,269 | | | | 21,431 | | Total property and equipment | | 8,068,935 | | | | 7,360,528 | | Less accumulated depreciation, depletion and amortization | | 5,575,078 | | | | 5,084,704 | | Net property and equipment | | 2,493,857 | | | | 2,275,824 | | Restricted deposits for asset retirement obligations | | 15,444 | | | | 37,421 | | Other assets | | 17,244 | | | | 20,455 | | Total assets | $ | 2,709,107 | | | $ | 2,507,302 | | Liabilities and Shareholders' Equity | | | | | | | | Current liabilities: | | | | | | | | Accounts payable | $ | 194,109 | | | $ | 145,212 | | Undistributed oil and natural gas proceeds | | 37,009 | | | | 42,107 | | Asset retirement obligations | | 36,003 | | | | 77,785 | | Accrued liabilities | | 17,377 | | | | 28,000 | | Total current liabilities | | 284,498 | | | | 293,104 | | Long-term debt, less current maturities | | 1,360,057 | | | | 1,205,421 | | Asset retirement obligations, less current portion | | 354,565 | | | | 276,637 | | Deferred income taxes | | 186,988 | | | | 178,142 | | Other liabilities | | 13,691 | | | | 13,388 | | Commitments and contingencies | | — | | | | — | | Shareholders' equity: | | | | | | | | Preferred stock, $0.00001 par value; 20,000,000 shares authorized; 0 issued at December 31, 2014 and 2013 | | — | | | | — | | Common stock, $0.00001 par value; 118,330,000 shares authorized; 78,768,588 issued and 75,899,415 outstanding at December 31, 2014; 78,460,872 issued and 75,591,699 outstanding at December 31, 2013 | | 1 | | | | 1 | | Additional paid-in capital | | 414,580 | | | | 403,564 | | Retained earnings | | 118,894 | | | | 161,212 | | Treasury stock, at cost | | (24,167 | ) | | | (24,167 | ) | Total shareholders' equity | | 509,308 | | | | 540,610 | | Total liabilities and shareholders' equity | $ | 2,709,107 | | | $ | 2,507,302 | |
| | | | | | | | | | | | December 31, | | | | | 2012 | | | 2011 | | | | | (In thousands, except share data) | | | Assets | | | | | | | | | Current assets: | | | | | | | | | Cash and cash equivalents | | $ | 12,245 | | | $ | 4,512 | | Receivables: | | | | | | | | | Oil and natural gas sales | | | 97,733 | | | | 98,550 | | Joint interest and other | | | 56,439 | | | | 25,804 | | Income tax receivable | | | 47,884 | | | | — | | | | | | | | | | | Total receivables | | | 202,056 | | | | 124,354 | | Deferred income taxes | | | 267 | | | | 2,007 | | Prepaid expenses and other assets | | | 25,555 | | | | 30,315 | | | | | | | | | | | Total current assets | | | 240,123 | | | | 161,188 | | Property and equipment – at cost: | | | | | | | | | Oil and natural gas properties and equipment (full cost method, of which $123,503 at December 31, 2012 and $154,516 at December 31, 2011 were excluded from amortization) | | | 6,694,510 | | | | 5,959,016 | | Furniture, fixtures and other | | | 21,786 | | | | 19,500 | | | | | | | | | | | Total property and equipment | | | 6,716,296 | | | | 5,978,516 | | Less accumulated depreciation, depletion and amortization | | | 4,655,841 | | | | 4,320,410 | | | | | | | | | | | Net property and equipment | | | 2,060,455 | | | | 1,658,106 | | Restricted deposits for asset retirement obligations | | | 28,466 | | | | 33,462 | | Other assets | | | 19,943 | | | | 16,169 | | | | | | | | | | | Total assets | | $ | 2,348,987 | | | $ | 1,868,925 | | | | | | | | | | | | Liabilities and Shareholders’ Equity | | | | | | | | | Current liabilities: | | | | | | | | | Accounts payable | | $ | 123,885 | | | $ | 75,871 | | Undistributed oil and natural gas proceeds | | | 37,073 | | | | 33,732 | | Asset retirement obligations | | | 92,630 | | | | 138,185 | | Accrued liabilities | | | 20,755 | | | | 29,705 | | Income taxes payable | | | 266 | | | | 10,392 | | | | | | | | | | | Total current liabilities | | | 274,609 | | | | 287,885 | | Long-term debt, less current maturities | | | 1,087,611 | | | | 717,000 | | Asset retirement obligations, less current portion | | | 291,423 | | | | 255,695 | | Deferred income taxes | | | 145,249 | | | | 58,881 | | Other liabilities | | | 8,908 | | | | 4,890 | | Commitments and contingencies | | | — | | | | — | | Shareholders’ equity: | | | | | | | | | Preferred stock, $0.00001 par value, 20,000,000 shares authorized and 0 issued at December 31, 2012 and $0.00001 par value, 2,000,000 shares authorized and 0 issued at December 31, 2011 | | | — | | | | — | | Common stock, $0.00001 par value; 118,330,000 shares authorized; 78,118,803 issued and 75,249,630 outstanding at December 31, 2012; 77,220,706 issued and 74,351,533 outstanding at December 31, 2011; | | | 1 | | | | 1 | | Additional paid-in capital | | | 396,186 | | | | 386,920 | | Retained earnings | | | 169,167 | | | | 181,820 | | Treasury stock, at cost | | | (24,167 | ) | | | (24,167 | ) | | | | | | | | | | Total shareholders’ equity | | | 541,187 | | | | 544,574 | | | | | | | | | | | Total liabilities and shareholders’ equity | | $ | 2,348,987 | | | $ | 1,868,925 | | | | | | | | | | |
See accompanying notes.
71
W&T OFFSHORE, INC. AND SUBSIDIARIES CONSOLIDATED STATEMENTS OF INCOMEOPERATIONS | | | | Year Ended December 31, | | Year Ended December 31, | | | | 2012 | | 2011 | | 2010 | | 2014 | | | 2013 | | | 2012 | | | | (In thousands, except per share data) | | (In thousands except per share data) | | Revenues | | $ | 874,491 | | | $ | 971,047 | | | $ | 705,783 | | $ | 948,708 | | | $ | 984,088 | | | $ | 874,491 | | | | | | | | | | | | | Operating costs and expenses: | | | | | | | | | | | | | | | | | | Lease operating expenses | | | 232,260 | | | | 219,206 | | | | 169,670 | | | 264,751 | | | | 270,839 | | | | 232,260 | | Production taxes | | | 5,840 | | | | 4,275 | | | | 1,194 | | | 7,932 | | | | 7,135 | | | | 5,840 | | Gathering and transportation | | | 14,878 | | | | 16,920 | | | | 16,484 | | | 19,821 | | | | 17,510 | | | | 14,878 | | Depreciation, depletion and amortization | | | 336,177 | | | | 299,015 | | | | 268,415 | | | 490,469 | | | | 430,611 | | | | 336,177 | | Asset retirement obligation accretion | | | 20,055 | | | | 29,771 | | | | 25,685 | | | Asset retirement obligations accretion | | | 20,633 | | | | 20,918 | | | | 20,055 | | General and administrative expenses | | | 82,017 | | | | 74,296 | | | | 53,290 | | | 86,999 | | | | 81,874 | | | | 82,017 | | Derivative (gain) loss | | | 13,954 | | | | (1,896 | ) | | | 4,256 | | | (3,965 | ) | | | 8,470 | | | | 13,954 | | | | | | | | | | | | | Total costs and expenses | | | 705,181 | | | | 641,587 | | | | 538,994 | | | 886,640 | | | | 837,357 | | | | 705,181 | | | | | | | | | | | | | Operating income | | | 169,310 | | | | 329,460 | | | | 166,789 | | | 62,068 | | | | 146,731 | | | | 169,310 | | Interest expense: | | | | | | | | | | | | | | | | | | Incurred | | | 63,268 | | | | 52,393 | | | | 43,101 | | | 86,922 | | | | 85,639 | | | | 63,268 | | Capitalized | | | (13,274 | ) | | | (9,877 | ) | | | (5,395 | ) | | (8,526 | ) | | | (10,058 | ) | | | (13,274 | ) | Loss on extinguishment of debt | | | — | | | | 22,694 | | | | — | | | Other income | | | 215 | | | | 84 | | | | 710 | | | | | | | | | | | | | | Income before income tax expense | | | 119,531 | | | | 264,334 | | | | 129,793 | | | Income tax expense | | | 47,547 | | | | 91,517 | | | | 11,901 | | | | | | | | | | | | | | Net income | | $ | 71,984 | | | $ | 172,817 | | | $ | 117,892 | | | | | | | | | | | | | | Basic and diluted earnings per common share | | $ | 0.95 | | | $ | 2.29 | | | $ | 1.58 | | | Weighted average common shares outstanding | | | 74,354 | | | | 74,033 | | | | 73,685 | | | Other income, net | | | 208 | | | | 8,946 | | | | 215 | | Income (loss) before income tax expense (benefit) | | | (16,120 | ) | | | 80,096 | | | | 119,531 | | Income tax expense (benefit) | | | (4,459 | ) | | | 28,774 | | | | 47,547 | | Net income (loss) | | $ | (11,661 | ) | | $ | 51,322 | | | $ | 71,984 | | Basic and diluted earnings (loss) per common share | | $ | (0.16 | ) | | $ | 0.68 | | | $ | 0.95 | |
See accompanying notes.
72
W&T OFFSHORE, INC. AND SUBSIDIARIES CONSOLIDATED STATEMENTS OF CHANGES IN SHAREHOLDERS’ EQUITY | | | | | | | | | | | | | | | Common Stock | | | Additional | | | | | | | | | | | | | | | Total | | | | | Common Stock
Outstanding | | | Additional
Paid-In
Capital | | | Retained
Earnings | | | Treasury Stock | | Total
Shareholders’
Equity | | Outstanding | | | Paid-In | | | Retained | | | Treasury Stock | | | Shareholders’ | | | | Shares | | Value | | | | Shares | | | Value | | Shares | | | Value | | | Capital | | | Earnings | | | Shares | | | Value | | | Equity | | | | (In thousands) | | | Balances at December 31, 2009 | | | 74,711 | | | $ | 1 | | | $ | 373,050 | | | $ | 10,066 | | | | 2,869 | | | $ | (24,167 | ) | | $ | 358,950 | | | Cash dividends: | | | | | | | | | | | | | | | | Common stock regular ($0.14 per share) | | | — | | | | — | | | | — | | | | (10,446 | ) | | | — | | | | — | | | | (10,446 | ) | | Common stock special ($0.66 per share) | | | — | | | | — | | | | — | | | | (49,132 | ) | | | — | | | | — | | | | (49,132 | ) | | Share-based compensation | | | — | | | | — | | | | 5,533 | | | | — | | | | — | | | | — | | | | 5,533 | | | Restricted stock issued, net of forfeitures | | | (95 | ) | | | — | | | | 1,357 | | | | — | | | | — | | | | — | | | | 1,357 | | | Shares surrendered for payroll taxes | | | (142 | ) | | | — | | | | (2,411 | ) | | | — | | | | — | | | | — | | | | (2,411 | ) | | Net income | | | — | | | | — | | | | — | | | | 117,892 | | | | — | | | | — | | | | 117,892 | | | | | | | | | | | | | | | | | | | | | | | | | | Balances at December 31, 2010 | | | 74,474 | | | $ | 1 | | | $ | 377,529 | | | $ | 68,380 | | | | 2,869 | | | $ | (24,167 | ) | | $ | 421,743 | | | Cash dividends: | | | | | | | | | | | | | | | | Common stock regular ($0.16 per share) | | | — | | | | — | | | | — | | | | (11,913 | ) | | | — | | | | — | | | | (11,913 | ) | | Common stock special ($0.63 per share) | | | — | | | | — | | | | — | | | | (46,842 | ) | | | — | | | | — | | | | (46,842 | ) | | Share-based compensation | | | — | | | | — | | | | 9,710 | | | | — | | | | — | | | | — | | | | 9,710 | | | Restricted stock issued, net of forfeitures | | | (13 | ) | | | — | | | | — | | | | — | | | | — | | | | — | | | | — | | | Shares surrendered for payroll taxes | | | (109 | ) | | | — | | | | (2,073 | ) | | | — | | | | — | | | | — | | | | (2,073 | ) | | Other | | | — | | | | — | | | | 1,754 | | | | (622 | ) | | | — | | | | — | | | | 1,132 | | | Net income | | | — | | | | — | | | | — | | | | 172,817 | | | | — | | | | — | | | | 172,817 | | | | | | | | | | | | | | | | | | | | | | | | | (In thousands) | | Balances at December 31, 2011 | | | 74,352 | | | $ | 1 | | | $ | 386,920 | | | $ | 181,820 | | | | 2,869 | | | $ | (24,167 | ) | | $ | 544,574 | | | 74,352 | | | $ | 1 | | | $ | 386,920 | | | $ | 181,820 | | | | 2,869 | | | $ | (24,167 | ) | | $ | 544,574 | | Cash dividends: | | | | | | | | | | | | | | | | | | | | | | | | | | | | | | | | | | | | | | | | | | Common stock regular ($0.32 per share) | | | — | | | | — | | | | — | | | | (23,798 | ) | | | — | | | | — | | | | (23,798 | ) | | — | | | | — | | | | — | | | | (23,798 | ) | | | — | | | | — | | | | (23,798 | ) | Common stock special ($0.79 per share) | | | — | | | | — | | | | — | | | | (59,034 | ) | | | — | | | | — | | | | (59,034 | ) | | — | | | | — | | | | — | | | | (59,034 | ) | | | — | | | | — | | | | (59,034 | ) | Share-based compensation | | | — | | | | — | | | | 12,398 | | | | — | | | | — | | | | — | | | | 12,398 | | | — | | | | — | | | | 12,398 | | | | — | | | | — | | | | — | | | | 12,398 | | Stock issued, net of forfeitures | | | 898 | | | | — | | | | — | | | | — | | | | — | | | | — | | | | — | | | 898 | | | | — | | | | — | | | | — | | | | — | | | | — | | | | — | | RSUs surrendered for payroll taxes | | | — | | | | — | | | | (5,329 | ) | | | — | | | | — | | | | — | | | | (5,329 | ) | | — | | | | — | | | | (5,329 | ) | | | | | | | | | | | | | | | (5,329 | ) | Other | | | — | | | | — | | | | 2,197 | | | | (1,805 | ) | | | — | | | | — | | | | 392 | | | — | | | | — | | | | 2,197 | | | | (1,805 | ) | | | — | | | | — | | | | 392 | | Net income | | | — | | | | — | | | | — | | | | 71,984 | | | | — | | | | — | | | | 71,984 | | | — | | | | — | | | | — | | | | 71,984 | | | | — | | | | — | | | | 71,984 | | | | | | | | | | | | | | | | | | | | | | | | | Balances at December 31, 2012 | | | 75,250 | | | $ | 1 | | | $ | 396,186 | | | $ | 169,167 | | | | 2,869 | | | $ | (24,167 | ) | | $ | 541,187 | | | 75,250 | | | | 1 | | | | 396,186 | | | | 169,167 | | | | 2,869 | | | | (24,167 | ) | | | 541,187 | | | | | | | | | | | | | | | | | | | | | | | | | Cash dividends: | | | | | | | | | | | | | | | | | | | | | | | | | | | | | Common stock regular ($0.36 per share) | | | — | | | | — | | | | — | | | | (27,098 | ) | | | — | | | | — | | | | (27,098 | ) | Common stock special ($0.42 per share) | | | — | | | | — | | | | — | | | | (31,748 | ) | | | — | | | | — | | | | (31,748 | ) | Share-based compensation | | | — | | | | — | | | | 11,525 | | | | — | | | | — | | | | — | | | | 11,525 | | Stock issued, net of forfeitures | | | 342 | | | | — | | | | — | | | | — | | | | — | | | | — | | | | — | | RSUs surrendered for payroll taxes | | | — | | | | — | | | | (2,370 | ) | | | — | | | | — | | | | — | | | | (2,370 | ) | Other | | | — | | | | — | | | | (1,777 | ) | | | (431 | ) | | | — | | | | — | | | | (2,208 | ) | Net income | | | — | | | | — | | | | — | | | | 51,322 | | | | — | | | | — | | | | 51,322 | | Balances at December 31, 2013 | | | 75,592 | | | | 1 | | | | 403,564 | | | | 161,212 | | | | 2,869 | | | | (24,167 | ) | | | 540,610 | | Cash dividends: | | | | | | | | | | | | | | | | | | | | | | | | | | | | | Common stock regular ($0.40 per share) | | | — | | | | — | | | | — | | | | (30,260 | ) | | | — | | | | — | | | | (30,260 | ) | Share-based compensation | | | — | | | | — | | | | 14,744 | | | | — | | | | — | | | | — | | | | 14,744 | | Stock issued, net of forfeitures | | | 307 | | | | — | | | | — | | | | — | | | | — | | | | — | | | | — | | RSUs surrendered for payroll taxes | | | | | | | | | | | (848 | ) | | | — | | | | — | | | | — | | | | (848 | ) | Other | | | — | | | | — | | | | (2,880 | ) | | | (397 | ) | | | — | | | | — | | | | (3,277 | ) | Net income | | | — | | | | — | | | | — | | | | (11,661 | ) | | | — | | | | — | | | | (11,661 | ) | Balances at December 31, 2014 | | | 75,899 | | | $ | 1 | | | $ | 414,580 | | | $ | 118,894 | | | | 2,869 | | | $ | (24,167 | ) | | $ | 509,308 | |
See accompanying notes.
73
W&T Offshore, Inc. and Subsidiaries CONSOLIDATED STATEMENTS OF CASH FLOWS | Year Ended December 31, | | | 2014 | | | 2013 | | | 2012 | | | (In thousands) | | Operating activities: | | | | | | | | | | | | Net income (loss) | $ | (11,661 | ) | | $ | 51,322 | | | $ | 71,984 | | Adjustments to reconcile net income (loss) to net cash provided by operating activities: | | | | | | | | | | | | Depreciation, depletion, amortization and accretion | | 511,102 | | | | 451,529 | | | | 356,232 | | Amortization of debt issuance costs and premium | | 701 | | | | 1,645 | | | | 2,575 | | Share-based compensation | | 14,744 | | | | 11,525 | | | | 12,398 | | Derivative (gain) loss | | (3,965 | ) | | | 8,470 | | | | 13,954 | | Cash payments on derivative settlements, net | | (5,318 | ) | | | (8,589 | ) | | | (7,664 | ) | Deferred income taxes | | (4,760 | ) | | | 30,920 | | | | 88,109 | | Changes in operating assets and liabilities: | | | | | | | | | | | | Oil and natural gas receivables | | 29,510 | | | | 980 | | | | 818 | | Joint interest and other receivables | | (4,255 | ) | | | 34,257 | | | | (28,823 | ) | Income taxes | | 3,143 | | | | 44,328 | | | | (58,011 | ) | Prepaid expenses and other assets | | 15,012 | | | | (10,044 | ) | | | 7,440 | | Asset retirement obligation settlements | | (74,313 | ) | | | (81,543 | ) | | | (112,827 | ) | Accounts payable, accrued liabilities and other | | 41,483 | | | | 26,558 | | | | 38,952 | | Net cash provided by operating activities | | 511,423 | | | | 561,358 | | | | 385,137 | | Investing activities: | | | | | | | | | | | | Acquisition of property interest in oil and natural gas properties | | (72,234 | ) | | | (82,424 | ) | | | (205,550 | ) | Investment in oil and natural gas properties and equipment | | (554,378 | ) | | | (551,954 | ) | | | (479,313 | ) | Proceeds from sales of assets and other, net | | — | | | | 21,008 | | | | 30,453 | | Purchases of furniture, fixtures and other | | (3,340 | ) | | | (1,435 | ) | | | (3,031 | ) | Net cash used in investing activities | | (629,952 | ) | | | (614,805 | ) | | | (657,441 | ) | Financing activities: | | | | | | | | | | | | Issuance of 8.50% Senior Notes | | — | | | | — | | | | 318,000 | | Borrowings of long-term debt - revolving bank credit facility | | 556,000 | | | | 563,000 | | | | 732,000 | | Repayments of long-term debt - revolving bank credit facility | | (399,000 | ) | | | (443,000 | ) | | | (679,000 | ) | Debt issuance costs | | — | | | | (3,892 | ) | | | (8,510 | ) | Dividends to shareholders | | (30,260 | ) | | | (58,846 | ) | | | (82,832 | ) | Other | | (345 | ) | | | (260 | ) | | | 379 | | Net cash provided by financing activities | | 126,395 | | | | 57,002 | | | | 280,037 | | Increase in cash and cash equivalents | | 7,866 | | | | 3,555 | | | | 7,733 | | Cash and cash equivalents, beginning of period | | 15,800 | | | | 12,245 | | | | 4,512 | | Cash and cash equivalents, end of period | $ | 23,666 | | | $ | 15,800 | | | $ | 12,245 | |
See accompanying notes.
W&T OFFSHORE, INC. AND SUBSIDIARIES CONSOLIDATED STATEMENTS OF CASH FLOWS
| | | | | | | | | | | | | | | | Year Ended December 31, | | | | | 2012 | | | 2011 | | | 2010 | | | | | (In thousands) | | Operating activities: | | | | | | | | | | | | | Net income | | $ | 71,984 | | | $ | 172,817 | | | $ | 117,892 | | Adjustments to reconcile net income to net cash provided by operating activities: | | | | | | | | | | | | | Depreciation, depletion, amortization and accretion | | | 356,232 | | | | 328,786 | | | | 294,100 | | Amortization of debt issuance costs and premium | | | 2,575 | | | | 2,010 | | | | 1,338 | | Loss on extinguishment of debt | | | — | | | | 22,694 | | | | — | | Share-based compensation | | | 12,398 | | | | 9,710 | | | | 5,533 | | Derivative (gain) loss | | | 13,954 | | | | (1,896 | ) | | | 4,256 | | Cash payments on derivative settlements | | | (7,664 | ) | | | (9,873 | ) | | | 874 | | Deferred income taxes | | | 88,109 | | | | 61,835 | | | | (8,266 | ) | Changes in operating assets and liabilities: | | | | | | | | | | | | | Oil and natural gas receivables | | | 818 | | | | (18,639 | ) | | | (24,933 | ) | Joint interest and other receivables | | | (31,399 | ) | | | 375 | | | | 25,897 | | Insurance receivables | | | 2,576 | | | | 20,771 | | | | 54,873 | | Income taxes | | | (58,011 | ) | | | (7,124 | ) | | | 104,067 | | Prepaid expenses and other assets | | | 7,440 | | | | (7,809 | ) | | | 4,536 | | Asset retirement obligations | | | (112,827 | ) | | | (59,958 | ) | | | (87,166 | ) | Accounts payable and accrued liabilities | | | 38,026 | | | | 7,881 | | | | (31,885 | ) | Other liabilities | | | 926 | | | | (102 | ) | | | 3,656 | | | | | | | | | | | | | | | Net cash provided by operating activities | | | 385,137 | | | | 521,478 | | | | 464,772 | | | | | | | | | | | | | | | Investing activities: | | | | | | | | | | | | | Acquisition of property interest in oil and natural gas properties | | | (205,550 | ) | | | (437,247 | ) | | | (236,944 | ) | Investment in oil and natural gas properties and equipment | | | (479,313 | ) | | | (281,779 | ) | | | (178,709 | ) | Proceeds from sales of oil and natural gas properties and equipment | | | 30,453 | | | | 15 | | | | 1,420 | | Purchases of furniture, fixtures and other, net | | | (3,031 | ) | | | (3,660 | ) | | | (760 | ) | | | | | | | | | | | | | | Net cash used in investing activities | | | (657,441 | ) | | | (722,671 | ) | | | (414,993 | ) | | | | | | | | | | | | | | Financing activities: | | | | | | | | | | | | | Issuance of 8.50% Senior Notes | | | 318,000 | | | | 600,000 | | | | — | | Repurchase of 8.25% Senior Notes | | | — | | | | (450,000 | ) | | | — | | Borrowings of long-term debt – revolving bank credit facility | | | 732,000 | | | | 623,000 | | | | 627,500 | | Repayments of long-term debt – revolving bank credit facility | | | (679,000 | ) | | | (506,000 | ) | | | (627,500 | ) | Repurchase premium and debt issuance costs | | | (8,510 | ) | | | (32,288 | ) | | | — | | Dividends to shareholders | | | (82,832 | ) | | | (58,756 | ) | | | (59,609 | ) | Other | | | 379 | | | | 1,094 | | | | 298 | | | | | | | | | | | | | | | Net cash provided by (used in) financing activities | | | 280,037 | | | | 177,050 | | | | (59,311 | ) | | | | | | | | | | | | | | Increase (decrease) in cash and cash equivalents | | | 7,733 | | | | (24,143 | ) | | | (9,532 | ) | Cash and cash equivalents, beginning of period | | | 4,512 | | | | 28,655 | | | | 38,187 | | | | | | | | | | | | | | | Cash and cash equivalents, end of period | | $ | 12,245 | | | $ | 4,512 | | | $ | 28,655 | | | | | | | | | | | | | | |
See accompanying notes.
W&T OFFSHORE, INC. AND SUBSIDIARIES
NOTES TO CONSOLIDATED FINANCIAL STATEMENTS 1. Significant Accounting Policies Operations W&T Offshore, Inc. and subsidiaries, referred to herein as “W&T”&T,” “we,”, “us,” “our,” or the “Company,”“Company”, is an independent oil and natural gas producer focused primarily in the Gulf of Mexico and more recently, onshore Texas. The Company is active in the exploration, development and acquisition of oil and natural gas properties. Our interest in fields, leases, structures and equipment are primarily owned by the parent company, W&T Offshore, Inc. (on a stand-alone basis, the “Parent Company”) and our wholly-own subsidiary, W & T Energy VI, LLC (“Energy VI”). Basis of Presentation Our consolidated financial statements include the accounts of W&T Offshore, Inc. and its majority ownedmajority-owned subsidiaries. All significant intercompany transactions and amounts have been eliminated for all years presented. Reclassifications Certain reclassifications have been made to prior periods’ financial statements to conform to the current presentation. Insurancepresentation as follows: Income tax – receivables as of December 31, 2011 of $0.7 million were was combined withJoint interest and other – receivables on the Consolidated Balance Sheets. Loss on extinguishment of debt was combined with Other income, net on the Consolidated Statements of Operations. Insurance proceeds was combined with the changes in Joint interest and other receivables and changes in Other – operating assets and liabilities was combined with the changes in Accounts payable, accrued liabilities and otheron the Consolidated Balance Sheets.Statements of Cash Flows. Use of Estimates The preparation of financial statements in conformity with accounting principles generally accepted in the United States (“GAAP”) requires management to make estimates and assumptions that affect the reported amounts of assets and liabilities and disclosure of contingent assets and liabilities at the date of the financial statements, the reported amounts of revenues and expenses during the reporting periods and the reported amounts of proved oil and natural gas reserves. Actual results could differ from those estimates. Fiscal YearRecent Events
Our fiscal year endsThe price we receive for our oil, natural gas liquids (“NGLs”) and natural gas production directly affects our revenues, profitability, cash flows, liquidity, access to capital and future rate of growth. The prices of these commodities began falling in June 2014 and were significantly lower in January and February of 2015 compared to the last few years.
We have taken several steps to mitigate the effects of these lower prices including: (i) significantly reducing the 2015 capital budget from the previous year; (ii) suspending our drilling and completion activities at several locations; (iii) suspending the regular quarterly common stock dividend and (iv) implementing numerous cost reduction projects to reduce our operating costs. Assuming continuing oil and gas prices are near levels realized in December 2014 and January 2015, we likely will be out of compliance with certain of our financial ratio maintenance covenants under our Credit Agreement sometime during 2015. We intend to engage the lenders under the Credit Agreement in discussions regarding amending our financial ratio covenants at such time as our borrowing base is redetermined in April 2015, but we can provide no assurance that we will be successful in obtaining such an amendment. While we believe we will obtain the appropriate covenant relief, if we are unable to obtain such an amendment from our lenders, we believe that we can find alternative financing, and we may have to reduce our cash outlays further for capital expenditures and other activities until such time as market conditions recover. We have assessed our financial condition, the current capital markets and options given different scenarios of commodity prices and believe we will have adequate liquidity to fund our operations through December 31, 2015; however, we cannot predict how an extended period of low commodity prices will affect our operations and liquidity levels. 75
W&T OFFSHORE, INC. AND SUBSIDIARIES NOTES TO CONSOLIDATED FINANCIAL STATEMENTS (Continued) Adjustment Related to Additional Volumes In January 2014, we identified that we had been receiving an erroneous million British thermal unit (“MMBtu”) conversion factor from a third party that had the effect of understating natural gas production at our Viosca Knoll 783 field (Tahoe). The incorrect conversion factor had been used on December 31.all natural gas production from the field since we acquired it in 2011. The effect of using this incorrect conversion factor did not affect revenues, operating cash flows or royalty payments to the federal government but did impact reported natural gas production and the calculation of depletion expense. We performed an analysis of the information, assessing both quantitative and qualitative factors, and determined that the impact on our net income reported for prior annual periods, as well as the impact to our earnings trend, was not material to 2011 and 2012 results, thus the adjustment was recognized in 2013. The 2013 period reflects a one-time increase in natural gas production volumes of 1.9 billion cubic feet (“Bcf”) (with no corresponding increase in revenue) for the annual periods of 2011 and 2012, which increased depreciation, depletion, amortization and accretion (“DD&A”) by $5.0 million and decreased net income by $3.2 million. Cash Equivalents We consider all highly liquid investments purchased with original or remaining maturities of three months or less at the date of purchase to be cash equivalents. Revenue Recognition We recognize oil and natural gas revenues based on the quantities of our production sold to purchasers under short-term contracts (less than 12 months) at market prices when delivery has occurred, title has transferred and collectability is reasonably assured. We use the sales method of accounting for oil and natural gas revenues from properties with joint ownership. Under this method, we record oil and natural gas revenues based upon physical deliveries to our customers, which can be different from our net revenue ownership interest in field production. These differences create imbalances that we recognize as a liability only when the estimated remaining recoverable reserves of a property will not be sufficient to enable the under-produced party to recoup its entitled share through production. We do not record receivables for those properties in which the Company has taken less than its ownership share of production. At both December 31, 20122014 and 2011, $6.02013, $6.4 million and $6.5 million, respectively, werewas included in current liabilities related to natural gas imbalances. W&T OFFSHORE, INC. AND SUBSIDIARIES
NOTES TO CONSOLIDATED FINANCIAL STATEMENTS (Continued)
Concentration of Credit Risk Our customers are primarily large integrated oil and natural gas companies and large financial institutions. Our production is sold utilizing month-to-month contracts that are based on bid prices. We also have receivables from joint interest owners on properties we operate and we may have the ability to withhold future revenue disbursements to recover amounts due us. We attempt to minimize our credit risk exposure to purchasers of our oil and natural gas, joint interest owners, derivative counterparties and other third-party entities through formal credit policies, monitoring procedures, and letters of credit or guaranties when considered necessary. We historically have not had any significant problems collecting our receivables except in rare circumstances. Accordingly, we do not maintain an allowance for doubtful accounts.accounts of any material amounts. The following identifies customers from whom we derived 10% or more of receipts from sales of oil, NGLs and natural gas. | Year Ended December 31, | | | 2014 | | | 2013 | | | 2012 | | Customer | | | | | | | | | | | | Shell Trading (US) Co. | | 47 | % | | | 48 | % | | | 35 | % | ConocoPhillips (1) | ** | | | ** | | | | 16 | % |
| | | | | | | | | | | | | | | | Year Ended December 31, | | | | 2012 | | | 2011 | | | 2010 | | Customer | | | | | | | | | | | | | Shell Trading (US) Co. | | | 35 | % | | | 36 | % | | | 40 | % | ConocoPhillips (1) | | | 16 | % | | | 16 | % | | | 17 | % | J.P. Morgan Ventures Energy Corp. | | | * | * | | | 10 | % | | | * | * |
(1) | ConocoPhillips split into two separate companies during 2012 and individually were approximately 8% each. |
We believe that the loss of any of the customers above would not result in a material adverse effect on our ability to market future oil and natural gas production as replacement customers could be obtained in a relatively short period of time on terms, conditions and pricing substantially similar to those currently existing. 76
W&T OFFSHORE, INC. AND SUBSIDIARIES NOTES TO CONSOLIDATED FINANCIAL STATEMENTS (Continued) Insurance receivablesReceivables We recognize insurance receivables with respect to capital, repair and plugging and abandonment costs as a result of hurricane damage when we deem those to be probable of collection, which arises when our insurance underwriters’ adjuster reviews and approves such costs for payment by the underwriters. Claims that have been processed in this manner have customarily been paid on a timely basis. See Note 18 for information related to unpaid claims by certain underwriters. Properties and Equipment We use the full-cost method of accounting for oil and natural gas properties and equipment. Under this method, all costs associated with the acquisition, exploration, development and abandonment of oil and natural gas properties are capitalized. Acquisition costs include costs incurred to purchase, lease or otherwise acquire property.properties. Exploration costs include costs of drilling exploratory wells and external geological and geophysical costs, which mainly consist of seismic costs. Development costs include the cost of drilling development wells and costs of completions, platforms, facilities and pipelines. Costs associated with production, certain geological and geophysical costs and general and administrative costs are expensed in the period incurred. Oil and natural gas properties and equipment include costs of unproved properties. The cost of unproved properties related to significant acquisitions are excluded from the amortization base until it is determined that proved reserves can be assigned to such properties or until such time as the Company has made an evaluation that impairment has occurred. The costs of drilling exploratory dry holes are included in the amortization base immediately upon determination that such wells are non-commercial. W&T OFFSHORE, INC. AND SUBSIDIARIES
NOTES TO CONSOLIDATED FINANCIAL STATEMENTS (Continued)
We capitalize interest on expenditures made in connection with the exploration and developmentamount of unproved properties that are excluded from the amortization base. Interest is capitalized only for the period that exploration and development activities are in progress and allprogress. Capitalization of interest ceases when the property is moved into the amortization base. All capitalized interest is recorded withinOil and natural gas property and equipment on the Consolidated Balance Sheet.Sheets. Oil and natural gas properties included in the amortization base are amortized using the units-of-production method based on production and estimates of proved reserve quantities. In addition to costs associated with evaluated properties and capitalized asset retirement obligations (“ARO”), the amortization base includes estimated future development costs to be incurred in developing proved reserves as well as estimated plugging and abandonment costs, net of salvage value, related to developing proved reserves. These additionalFuture development costs related to developing proved reserves are not recorded as liabilities on the balance sheet.sheet, but are part of the calculation of depletion expense. Sales of proved and unproved oil and natural gas properties, whether or not being amortized currently, are accounted for as adjustments of capitalized costs with no gain or loss recognized unless such adjustments would significantly alter the relationship between capitalized costs and proved reserves of oil and natural gas. Under the full cost method of accounting, we are required to periodically perform a “ceiling test,” which determines a limit on the book value of our oil and natural gas properties. If the net capitalized cost of oil and natural gas properties (including capitalized ARO), net of related deferred income taxes, exceeds the ceiling test limit, the excess is charged to expense on a pre-tax basis and separately disclosed. Any such write downs are not recoverable or reversible in future periods. The ceiling test limit is comprised of: (i) the present value of estimated future net revenues from proved reserves, less estimated future development costs, discounted at 10%,; (ii) plus the cost of unproved oil and natural gas properties not being amortized,amortized; (iii) plus the lower of cost or estimated fair value of unproved oil and natural gas properties included in the amortization base, net ofbase; and (iv) less related tax effects, the excess is charged to expense and reflected as additional accumulated depreciation, depletion and amortization. Any such write downs are not recoverable or reversible in future periods.effects. Estimated future net revenues used in the ceiling test as of December 31, 2012, 2011 and 2010for each year are based on the unweighted average of first-day-of-the-month commodity prices over the period January through December for that yearyear. All prices are adjusted by field for quality, transportation fees, energy content and exclude future cash outflows related to capitalized ARO and include future development costs and ARO related to wells to be drilled.regional price differentials. 77
W&T OFFSHORE, INC. AND SUBSIDIARIES NOTES TO CONSOLIDATED FINANCIAL STATEMENTS (Continued) Declines in the unweighted rolling average of first-day-of-the-month commodity prices in oil and natural gas prices after December 31, 20122014 may require us to record additional ceiling-test impairments in the future. We did not have any write-downs related to ceiling-test impairments during 2012, 20112014, 2013 and 2010,2012, respectively. Furniture, fixtures and non-oil and natural gas property and equipment are depreciated using the straight-line method based on the estimated useful lives of the respective assets, generally ranging from five to seven years. Leasehold improvements are amortized over the shorter of their economic lives or the lease term. Repairs and maintenance costs are expensed in the period incurred. Asset Retirement Obligations Pursuant to theAsset Retirement and Environmental Obligations topic of the Financial Accounting Standards Board (“FASB”) Accounting Standards Codification (the “Codification”),GAAP, we are required to record a separate liability for the present value of our ARO, with an offsetting increase to the related oil and natural gas properties on our balance sheet. We have significant obligations to plug and abandon well bores, remove our platforms, pipelines, facilities and equipment and restore the land or seabed at the end of oil and natural gas production operations. These obligations are primarily associated with plugging and abandoning wells, removing pipelines, removing and disposing of offshore platforms and site cleanup. Estimating the future restoration and removal cost is difficult and requires us to make estimates and judgments because the removal obligations may be many years in the future and contracts and regulations often have vague descriptions of what constitutes W&T OFFSHORE, INC. AND SUBSIDIARIES
NOTES TO CONSOLIDATED FINANCIAL STATEMENTS (Continued)
removal. Asset removal technologies and costs are constantly changing, as are regulatory, political, environmental, safety and public relations considerations, which can substantially affect our estimates of these future costs from period to period. For additional information, refer to Note 5. Oil and Natural Gas Reserve Information Pursuant toExtractive Activities – Oil and Gas topic of the Codification, GAAP, we use the unweighted average of first-day-of-the-month commodity prices over the preceding 12-month period when estimating quantities of proved reserves. Similarly, the prices used to calculate the standardized measure of discounted future cash flows and prices used in the ceiling test for impairment are the 12-month average commodity prices. Another provision of the guidance is a general requirement that, subject to limited exceptions, proved undeveloped reserves may only be classified as such if a development plan has been adopted indicating that they are scheduled to be drilled within five years. Refer to Note 21 for additional information about our proved reserves. Derivative Financial Instruments Our market risk exposure relates primarily to commodity prices and interest rates. From time to time, we use various derivative instruments to manage our exposure to commodity price risk from sales of oil and natural gas and interest rate risk from floating interest rates on our credit facility. Our derivative instruments currently consist of commodity swap and option contracts for oil. We do not enter into derivative instruments for speculative trading purposes. We account for derivative contracts inIn accordance with theDerivatives and Hedging topic of the Codification, which requires eachGAAP, a derivative to beis recorded on the balance sheet as an asset or a liability at its fair value. Changes in a derivative’s fair value are required to be recognized currently in earnings unless specific hedge accounting and documentation criteria are met at the time the derivative contract is entered into. We have elected not to designate our commodity derivatives as hedging instruments, therefore all changes in fair value are recognized in earnings.
Fair Value of Financial Instruments We include fair value information in the notes to our consolidated financial statements when the fair value of our financial instruments is different from the book value or it is required by applicable guidance. We believe that the book value of our cash and cash equivalents, receivables, accounts payable and accrued liabilities materially approximates fair value due to the short-term nature and the terms of these instruments. We believe that the book value of our restricted deposits approximates fair value as deposits are in cash or short-term investments. We believe the carrying amount of debt under our revolving bank credit facility approximates fair value because the interest rates are variable and reflective of market rates. 78
W&T OFFSHORE, INC. AND SUBSIDIARIES NOTES TO CONSOLIDATED FINANCIAL STATEMENTS (Continued) Fair Value of Acquisitions Acquisitions are recorded on the closing date of the transaction at their fair value, which wasis determined by applying the market and income approaches using Level 3 inputs. The Level 3 inputs were:are: (i) analysis of comparable transactions obtained from various third-parties, (ii) estimates of ultimate recoveries of reserves, and (iii) estimates of discounted cash flows based on estimated reserve quantities, reserve categories, timing of production, costs to produce and develop reserves, future prices, ARO and discount rates. The estimates and assumptions wereare determined by management and third-parties. The fair value is based on subjective estimates and assumptions, which are inherently imprecise, and the actual realized values couldcan vary significantly from these estimates.estimates that are made. No goodwill was recorded for the acquisitions completed in 2012, 20112014, 2013 or 2010.2012. W&T OFFSHORE, INC. AND SUBSIDIARIES
NOTES TO CONSOLIDATED FINANCIAL STATEMENTS (Continued)
Income Taxes We use the liability method of accounting for income taxes in accordance with the Income Taxes topic of the Codification. Under this method, deferred tax assets and liabilities are determined by applying tax rates in effect at the end of a reporting period to the cumulative temporary differences between the tax bases of assets and liabilities and their reported amounts in the financial statements. In assessing the need for a valuation allowance on our deferred tax assets, we consider whether it is more likely than not that some portion or all of them will not be realized. We recognize uncertain tax positions in our financial statements when it is more likely than not that we will sustain the benefit taken or expected to be taken. When applicable, we recognize interest and penalties related to uncertain tax positions in income tax expense. Debt Issuance Costs Debt issuance costs associated with our revolving loan facility are amortized using the straight-line method over the scheduled maturity of the debt. Debt issuance costs associated with all other debt are deferred and amortized over the scheduled maturity of the debt utilizing the effective interest method. Premiums Received on Debt Issuance Premiums are recorded in long-term liabilities and are amortized over the term of the related debt using the effective interest method. Share-Based Compensation In accordance with theCompensation – Stock Compensation topic of the Codification,GAAP, compensation cost for share-based payments to employees and non-employee directors is based on the fair value of the equity instrument on the date of grant and is recognized over the period during which the recipient is required to provide service in exchange for the award. The fair value for equity instruments subject to only time or to Company performance measures was determined using the closing price of the Company’s sharecommon stock at the date of grant. The fair value of equity instruments subject to market-based performance measurements was determined using a Monte Carlo simulation probabilistic model. We recognize share-based compensation expense on a straight line basis over the period during which the recipient is required to provide service in exchange for the award. Estimates are made for forfeitures during the vesting period, resulting in the recognition of compensation cost only for those awards that are estimated to vest and estimated forfeitures are adjusted to actual forfeitures when the equity instrument vests. See Note 11 for more information. Earnings Per Share In accordance with theEarnings Per Share topic of the Codification,GAAP, unvested share-based payment awards that contain nonforfeitable rights to dividends or dividend equivalents (whether paid or unpaid) are participating securities and are included in the computation of earnings per share under the two-class method. For additional information, refer to Note 14. Recent Accounting DevelopmentsOther Income, Net
In December 2010,For 2013, the FASB issued certain amendments toamount reported consisted primarily of $9.2 million received in conjunction with a payment for an option exercised by a counterparty. Partially offsetting theBusiness Combinationstopic proceeds were related third-party expenses of $0.1 million. The net amount was included in net cash flows from investing activities within the Codification. The amendments specify that if a public entity presents comparative financialline, Proceeds from sales of assets and other, net in the consolidated statements the entity should disclose revenue and earnings of the combined entity as though the business combination that occurred during the current year had occurred as of the beginning of the comparable prior annual period. In addition, the supplemental pro forma disclosures related to pro forma adjustments were expanded. The amendments were effective for our fiscal year ended December 31, 2011. Early adoption was permitted and we elected to apply thecash flows.
79
W&T OFFSHORE, INC. AND SUBSIDIARIES NOTES TO CONSOLIDATED FINANCIAL STATEMENTS (Continued) amendments
Recent Accounting Developments In May 2014, the Financial Accounting Standards Board (“FASB”) issued Accounting Standards Update No. 2014-09 (“ASU 2014-09”), Summary and Amendments That Create Revenue from Contracts and Customers (Topic 606). ASU 2014-09 amends and replaces current revenue recognition requirements, including most industry-specific guidance. The revised guidance establishes a five step approach to be utilized in determining when, and if, revenue should be recognized. ASU 2014-09 is effective for annual and interim periods beginning after December 15, 2016. Upon application, an entity may elect one of two methods, either restatement of prior periods presented or recording a cumulative adjustment in the initial period of application. We have not determined the effect ASU 2014-09 will have on the recognition of our revenue, if any, nor have we determined the method we will utilize upon adoption, which would be in the first quarter of 2017. In August 2014, the FASB issued Accounting Standards Update No. 2014-15 (“ASU 2014-15”), Disclosure of Uncertainties about an Entity’s Ability to Continue as a Going Concern (Subtopic 205-40). The guidance addresses management’s responsibility to evaluate whether there is substantial doubt about an entity’s ability to continue as a going concern and to provide related footnote disclosures. ASU 2014-15 is effective for the year 2010. These amendments only change disclosure requirementsannual period ending after December 15, 2016, and for annual and interim periods thereafter. We do not accounting practices; therefore,expect the adoption of these amendments did notrevised guidance to materially affect our evaluation as to being a going concern, or have any impactan effect on our financial position,statements or related disclosures. 2. Acquisitions and Divestitures 2014 Acquisitions Fairway On September 15, 2014, the Parent Company entered into an asset purchase agreement with a third party to increase its ownership interest from 64.3% to 100% in the Mobile Bay blocks 113 and 132 located offshore Alabama (the “Fairway Field”) and the associated Yellowhammer gas processing plant (collectively, “Fairway”). The Fairway Field is located in the state waters of Alabama and the Yellowhammer gas processing plant is located in the state of Alabama. The effective date of the transaction was July 1, 2014. The transaction included customary adjustments for the effective date, certain closing adjustments and our assumption of the related ARO. The purchase price was finalized during the fourth quarter of 2014. The acquisition was funded from borrowings under our revolving bank credit facility and cash on hand. The following table presents the preliminary purchase price allocation, including estimated adjustments, for the increased ownership interest in Fairway (in thousands): Cash consideration: | | | | Evaluated properties including equipment | $ | 17,407 | | Non-cash consideration: | | | | Asset retirement obligations - non-current | | 6,124 | | Total consideration | $ | 23,531 | |
The acquisition was recorded at fair value, which was determined using both the market and income approaches, and Level 3 inputs were used to determine fair value. See Note 1 for a description of the Level 3 inputs. No goodwill was recorded in connection with the acquisition of this additional working interest in Fairway. Woodside Properties On May 20, 2014, Energy VI entered into a purchase and sale agreement to acquire certain oil and natural gas property interests from Woodside Energy (USA) Inc. (“Woodside”). The properties acquired from Woodside (the “Woodside Properties”) consisted of a 20% non-operated working interest in the producing Neptune field (deepwater Atwater Valley blocks 574, 575 and 618), along with an interest in the Neptune tension-leg platform, associated production facilities and various interests in 24 other deepwater lease blocks. All of the Woodside Properties are located in the Gulf of Mexico. The effective date of the transaction was November 1, 2013. The transaction included customary adjustments for the effective date, certain closing adjustments and our assumption of the related ARO. The acquisition was funded from borrowings under our revolving bank credit facility and cash on hand. 80
W&T OFFSHORE, INC. AND SUBSIDIARIES NOTES TO CONSOLIDATED FINANCIAL STATEMENTS (Continued) The following table presents the purchase price allocation, including estimated adjustments, for the acquisition of the Woodside Properties (in thousands): Cash consideration: | | | | Evaluated properties including equipment | $ | 52,167 | | Unevaluated properties | | 2,660 | | Sub-total cash consideration | | 54,827 | | Non-cash consideration: | | | | Asset retirement obligations - current | | 782 | | Asset retirement obligations - non-current | | 10,543 | | Sub-total non-cash consideration | | 11,325 | | Total consideration | $ | 66,152 | |
The acquisition was recorded at fair value, which was determined using both the market and income approaches, and Level 3 inputs were used to determine fair value. See Note 1 for a description of the Level 3 inputs. No goodwill was recorded in connection with the Woodside Properties acquisition. 2014 Acquisitions — Revenues, Net Income and Pro Forma Financial Information - Unaudited The increase in working interest ownership for Fairway was not included in our consolidated results until the property transfer date, which occurred in September 2014 and the incremental revenue and operating expenses were immaterial for 2014. Unaudited pro forma information is not presented as the pro forma information is not materially different from the reported results for 2014 and 2013. The Woodside Properties were not included in our consolidated results until the property transfer date, which occurred on May 20 2014. For the period of May 20, 2014 to December 31, 2014, the Woodside Properties accounted for $28.4 million of revenues, $5.5 million of direct operating expenses, $11.0 million of DD&A and $4.2 million of income taxes, resulting in $7.7 million of net income. The net income attributable to the Woodside Properties does not reflect certain expenses, such as general and administrative expenses (“G&A”) and interest expense; therefore, this information is not intended to report results as if these operations were managed on a stand-alone basis. In addition, the Woodside Properties are not recorded in a separate entity for tax purposes; therefore, income tax was estimated using the federal statutory tax rate. In accordance with the applicable accounting guidance, the unaudited pro forma financial information was computed as if the acquisition of the Woodside Properties had been completed on January 1, 2013. The financial information was derived from W&T’s audited historical consolidated financial statements for annual periods, W&T’s unaudited historical condensed consolidated financial statements for interim periods, and the Woodside Properties’ unaudited historical financial statements for the annual and interim periods. The pro forma adjustments were based on estimates by management and information believed to be directly related to the purchase of the Woodside Properties. The pro forma financial information is not necessarily indicative of the results of operations had the purchase occurred on January 1, 2013. Had we owned the Woodside Properties during the periods indicated, the results may have been substantially different. For example, we may have operated the assets differently than Woodside; the realized sales prices for oil, natural gas liquids (“NGLs”) and natural gas may have been different; and the costs of operating the Woodside Properties may have been different. The following table presents a summary of our pro forma financial information (in thousands, except earnings per share): | | (unaudited) | | | | Year Ended December 31, | | | | 2014 | | | 2013 | | Revenue | | $ | 971,595 | | | $ | 1,047,037 | | Net income (loss) | | | (5,495 | ) | | | 71,432 | | Basic and diluted earnings (loss) per common share | | | (0.08 | ) | | | 0.94 | |
81
W&T OFFSHORE, INC. AND SUBSIDIARIES NOTES TO CONSOLIDATED FINANCIAL STATEMENTS (Continued) For the pro forma financial information, certain information was derived from our financial records, Woodside’s financial records and certain information was estimated. The following table presents incremental items included in the pro forma information reported above for the Woodside Properties (in thousands): | | (unaudited) | | | | Year Ended December 31, | | | | 2014 (a) | | | 2013 | | Revenues (b) | | $ | 22,887 | | | $ | 62,949 | | Direct operating expenses (b) | | | 4,417 | | | | 9,583 | | DD&A (c) | | | 8,374 | | | | 20,476 | | G&A (d) | | | 300 | | | | 800 | | Interest expense (e) | | | 329 | | | | 987 | | Capitalized interest (f) | | | (19 | ) | | | 164 | | Income tax expense (g) | | | 3,320 | | | | 10,829 | |
The sources of information and significant assumptions are described below: (a) | The adjustments for 2014 are for the period from January 1, 2014 to May 20, 2014. |
(b) | Revenues and direct operating expenses for the Woodside Properties were derived from the historical financial records of Woodside. |
(c) | DD&A was estimated using the full-cost method and determined as the incremental DD&A expense due to adding the Woodside Properties’ costs, reserves and production into our full cost pool in order to compute such amounts. The purchase price allocated to unevaluated properties for oil and natural gas interests was excluded from the DD&A expense estimation. ARO was estimated by W&T management. |
(d) | Estimated insurance costs related to the Woodside Properties. |
(e) | The acquisition was assumed to be funded entirely with borrowed funds. Interest expense was computed using assumed borrowings of $54.8 million, which equates to the cash component of the acquisition purchase price, and an interest rate of 1.8%, which equates to the rates applied to incremental borrowings on the revolving bank credit facility. |
(f) | The change to capitalized interest was computed for the addition to the pool of unevaluated properties and the capitalization interest rate was adjusted for the assumed borrowings. The negative amount represents a decrease to net expenses. |
(g) | Income tax expense was computed using the 35% federal statutory rate. |
The pro forma adjustments do not include adjustments related to any other acquisitions or divestitures. 2013 Acquisition On October 17, 2013, W&T Offshore, Inc. entered into a purchase and sale agreement to acquire certain oil and natural gas property interests from Callon Petroleum Operating Company (“Callon”). Pursuant to the purchase and sale agreement, transfers of certain properties that had no preferential rights were consummated on November 5, 2013 and transfers of certain properties subject to preferential rights, of which third-parties declined to exercise their preferential rights, were consummated on December 4, 2013. The properties acquired from Callon (the “Callon Properties”) consist of a 15% working interest in the Medusa field (deepwater Mississippi Canyon blocks 582 and 583), interest in associated production facilities and various interests in other non-operated fields. All of the Callon Properties are located in the Gulf of Mexico. The effective date of the transaction was July 1, 2013. The transaction included customary adjustments for the effective date, certain closing adjustments and we assumed the related ARO. An upward net purchase price adjustment of $0.6 million was recorded during 2014. The acquisition was funded from borrowings under our revolving bank credit facility and cash flows.on hand. 2. Acquisitions82
W&T OFFSHORE, INC. AND SUBSIDIARIES NOTES TO CONSOLIDATED FINANCIAL STATEMENTS (Continued) The following table presents the purchase price allocation, including estimated adjustments, for the acquisition of the Callon Properties (in thousands): Cash consideration: | | | | Evaluated properties including equipment | $ | 73,752 | | Unevaluated properties | | 9,248 | | Sub-total cash consideration | | 83,000 | | Non-cash consideration: | | | | Asset retirement obligations - current | | 90 | | Asset retirement obligations - non-current | | 4,143 | | Sub-total non-cash consideration | | 4,233 | | Total consideration | $ | 87,233 | |
The acquisition was recorded at fair value, which was determined using both the market and Divestituresincome approaches, and Level 3 inputs were used to determine fair value. See Note 1 for a description of the Level 3 inputs. No goodwill was recorded in connection with the acquisition of the Callon Properties. 2013 Acquisition — Revenues, Net Income and Pro Forma Financial Information — Unaudited The Callon Properties were not included in our consolidated results until the respective property transfer dates, which occurred during the fourth quarter of 2013. In 2014, the Callon Properties accounted for $32.5 million of revenue, $6.6 million of direct operating expenses, $16.4 million of DD&A and $3.3 million of income taxes, resulting in $6.2 million of net income. In the fourth quarter of 2013, the Callon Properties accounted for $5.8 million of revenues, $1.3 million of direct operating expenses, $2.4 million of DD&A and $0.7 million of income taxes, resulting in $1.4 million of net income. The net income attributable to these properties does not reflect certain expenses, such as G&A and interest expense; therefore, this information is not intended to report results as if these operations were managed on a stand-alone basis. In addition, the Callon Properties are not recorded in a separate entity for tax purposes; therefore, income tax was estimated using the federal statutory tax rate. The unaudited pro forma financial information presented below was computed as if the acquisition of the Callon Properties had been completed on January 1, 2012. The financial information was derived from W&T’s audited historical consolidated financial statements, the Callon Properties’ audited historical financial statement, and the Callon Properties’ unaudited historical financial statement for the periods presented. The pro forma adjustments were based on estimates by management and information believed to be directly related to the purchase of the Callon Properties. The pro forma financial information is not necessarily indicative of the results of operations had the purchase occurred on January 1, 2012. If the transaction had been in effect for the periods indicated, the results may have been substantially different. For example, we may have operated the assets differently than Callon; the realized sales prices for oil, NGLs and natural gas may have been different; and the costs of operating the Callon Properties may have been different. The following table presents a summary of our pro forma financial information (in thousands except earnings per share): | (unaudited) | | | Year Ended December 31, | | | 2013 | | | 2012 | | Revenue | $ | 1,018,118 | | | $ | 923,050 | | Net income | | 59,015 | | | | 85,310 | | Basic and diluted earnings per common share | | 0.78 | | | | 1.12 | |
83
W&T OFFSHORE, INC. AND SUBSIDIARIES NOTES TO CONSOLIDATED FINANCIAL STATEMENTS (Continued) For the pro forma financial information, certain information was derived from financial records and certain information was estimated. The following table presents incremental items included in the pro forma information reported above for the Callon Properties (in thousands): | (unaudited) | | | Year Ended December 31, | | | 2013 (a) | | | 2012 | | Revenues (b) | $ | 34,030 | | | $ | 48,559 | | Direct operating expenses (b) | | 6,405 | | | | 8,525 | | DD&A (c) | | 14,931 | | | | 17,578 | | G&A (d) | | (361 | ) | | | — | | Interest expense (e) | | 1,383 | | | | 1,660 | | Capitalized interest (f) | | (164 | ) | | | 295 | | Income tax expense (g) | | 4,143 | | | | 7,175 | |
The sources of information and significant assumptions are described below: (a) | The adjustments for 2013 are for the period from January 1, 2013 to the respective property transfer date, all of which occurred in the fourth quarter of 2013. |
(b) | Revenues and direct operating expenses for the Callon Properties were derived from the historical financial records of Callon. |
(c) | DD&A was estimated using the full-cost method and determined as the incremental DD&A expense due to adding the Callon Properties’ costs, reserves and production into our currently existing full cost pool in order to compute such amounts. The purchase price allocated to unevaluated properties for oil and natural gas interests was excluded from the DD&A expense estimation. ARO was estimated by W&T management. |
(d) | G&A adjustments related to incremental transaction expenses, which were assumed to be funded from cash on hand, and were adjusted from the 2013 results. |
(e) | The acquisition was assumed to be funded entirely with borrowed funds. Interest expense was computed using assumed borrowings of $83.0 million, which equates to the cash component of the transaction, and an interest rate of 2.0%, which equates to the rates applied to incremental borrowings on the revolving bank credit facility. |
(f) | The change to capitalized interest was computed for the addition to the pool of unevaluated properties and the capitalization interest rate was adjusted for the assumed borrowings. A positive amount represents an increase to net expenses and a negative amount represents a decrease to net expenses. |
(g) | Income tax expense was computed using the 35% federal statutory rate. |
The pro forma adjustments do not include adjustments related to any other acquisitions or divestitures. 2013 Divestitures On July 11, 2013, we sold our non-operated working interest in two offshore fields located in the Gulf of Mexico; the Green Canyon 60 field and the Green Canyon 19 field. The effective date was October 1, 2011 and we retained the deep rights in both fields. Due to the length of time from the effective date, we paid $4.3 million to sell the properties as revenues exceeded operating expenses and the purchase price for the period between the effective date and the close date. In connection with the sale, we reversed $15.6 million of our ARO. On September 26, 2013, we sold our working interests in the West Delta area block 29 with an effective date of January 1, 2013. The property is located in the Gulf of Mexico. Including adjustments for the effective date, the net proceeds were $14.7 million, which includes a $1.7 million post-effective-date repayment that occurred during 2014. The transaction was structured as a like-kind exchange under the Internal Revenue Service Code (“IRC”) Section 1031 and other applicable regulations, with funds held by a qualified intermediary until replacement purchases are made. Replacement purchases were made in 2013, which were within the replacement periods as defined under the IRC. In connection with this sale, we reversed $3.9 million of ARO. 84
W&T OFFSHORE, INC. AND SUBSIDIARIES NOTES TO CONSOLIDATED FINANCIAL STATEMENTS (Continued) 2012 Acquisitions On October 5, 2012, we acquired from Newfield Exploration Company and its subsidiary, Newfield Exploration Gulf Coast LLC (together, “Newfield”) certain oil and gas leasehold interests in the Gulf of Mexico (the “Newfield Properties”). The adjusted purchase price was $205.6 million, which was subject to certain adjustments, including adjustments from an effective date of July 1, 2012 until the closing date, and the assumption of future ARO. The purchase price may be subject to further adjustments. The properties consistedNewfield Properties consist of leases covering 78 offshore blocks on approximately 416,000 gross acres (268,000 net acres) (excluding overriding royalty interests), comprised of 65 blockspredominantly in the deepwater, sixdeepwater. The effective date was July 1, 2012. The transaction included customary adjustments for the effective date, certain closing adjustments and we assumed the related ARO. The consideration and the purchase price allocation are set forth in the table below. The purchase price was finalized during 2013. A net purchase price increase of which are producing, 10 blocks on the conventional shelf, four of which are producing, and an overriding royalty interest in three deepwater blocks, two of which are producing.$0.2 million was recorded during 2013. The acquisition was initially funded from borrowings under our revolving bank credit facility and cash on hand. Subsequently in the same month, the amounts borrowed under our revolving bank credit facility were paid down with funds provided from the issuance of $300.0 million of 8.50% Senior Notes (seelong-term debt in October 2012. See Note 7).7 for information on long-term debt. The following table presents the preliminary purchase price allocation, including estimated adjustments, for the acquisition of the Newfield Properties (in thousands): Cash consideration: | | | | Evaluated properties including equipment | $ | 192,723 | | Unevaluated properties | | 13,065 | | Sub-total cash consideration | | 205,788 | | Non-cash consideration: | | | | Asset retirement obligations – current | | 7,250 | | Asset retirement obligations - non-current | | 24,414 | | Sub-total non-cash consideration | | 31,664 | | Total consideration | $ | 237,452 | |
| | | | | Oil and natural gas properties and equipment | | $ | 237,214 | | Asset retirement obligations – current | | | (7,250 | ) | Asset retirement obligations – non-current | | | (24,414 | ) | | | | | | Total cash paid | | $ | 205,550 | | | | | | |
Expenses associated with acquisition activities and transition activities related to the acquisition of the Newfield Properties for the year ended December 31, 2012 were $0.6 million and are included in general and administrative expenses (“G&A”). The acquisition was recorded at fair value, which was determined using both the market and income approaches, and Level 3 inputs were used to determine fair value. See Note 1 for a description of the Level 3 inputs. No goodwill was recorded for the Newfield Properties.
2012 Acquisitions — Revenue, Net Income and Pro Forma Financial Information –— Unaudited The Newfield Properties were not included in our consolidated results until the closing date of October 5, 2012. ForIn 2014, the periodNewfield Properties accounted for $121.1 million of October 5, 2012 to December 31,revenue, $23.5 million of direct operating expenses, $60.5 million of DD&A and $13.0 million of income taxes, resulting in $24.1 million of net income. In 2013, the Newfield Properties accounted for $127.1 million of revenue, $26.7 million of direct operating expenses, $57.6 million of DD&A and $15.0 million of income taxes, resulting in $27.8 million of net income. In the fourth quarter of 2012, the Newfield Properties accounted for $29.6 million of revenue, $5.4 million of direct operating expenses, $11.9 million of depreciation, depletion, amortization and accretion (“DD&A”)&A and $4.3 million of income taxes, resulting in $8.0 million of net income. The net income attributable to these properties does not reflect certain expenses, such as G&A expense and interest expense; therefore, this information is not intended to report results as if these operations were managed on a stand-alone basis. In addition, the Newfield Properties are not recorded in a separate entity for tax purposes; therefore, income tax was estimated using the federal statutory tax rate. TheConsistent with the computation of pro forma financial information presented in Item 8, Financial Statements and Supplementary Data, in the Annual Report on Form 10-K for the year end December 31, 2012, the unaudited pro forma financial information was computed as if the acquisition of the Newfield Properties had been completed on January 1, 2011. The financial information was derived from W&T’s audited historical consolidated financial statements, the Newfield Properties’ audited historical financial statementsstatement for 2011 and the Newfield Properties’ unaudited historical financial statementstatements for the 2012 interim period.
W&T OFFSHORE, INC. AND SUBSIDIARIES
NOTES TO CONSOLIDATED FINANCIAL STATEMENTS (Continued)
The pro forma adjustments were based on estimates by management and information believed to be directly related to the purchase of the Newfield Properties. The pro forma financial information is not necessarily indicative of the results of operations had the purchase occurred on January 1, 2011. If the transaction had been in effect for the periods indicated, the results may have been substantially different. For example, we may have operated the assets differently than Newfield. RealizedNewfield; the realized sales prices for oil, NGLs and natural gas may have been differentdifferent; and the costs of operating the Newfield Properties may have been different. 85
W&T OFFSHORE, INC. AND SUBSIDIARIES NOTES TO CONSOLIDATED FINANCIAL STATEMENTS (Continued) The following table presents a summary of our pro forma financial information (in thousands except earnings per share): | | (unaudited) | | | | Year Ended December 31, 2012 | | Revenue | | $ | 980,196 | | Net income | | | 77,036 | | Basic and diluted earnings per common share | | | 1.01 | |
| | | | | | | | | | | | (unaudited) | | | | | Year Ended December 31, | | | | | 2012 | | | 2011 | | Revenue | | $ | 980,196 | | | $ | 1,187,808 | | Net income | | | 77,059 | | | | 220,875 | | Basic and diluted earnings per common share | | | 1.01 | | | | 2.92 | |
For the pro forma financial information, certain information was derived from financial records and certain information was estimated. The following table presents incremental items included in the pro forma information reported above for the Newfield Properties (in thousands): | | (unaudited) | | | | Year Ended December 31, 2012 (a) | | Revenues (b) | | $ | 105,705 | | Direct operating expenses (b) | | | 33,186 | | Insurance costs (c) | | | 475 | | DD&A (d) | | | 53,408 | | G&A (e) | | | (553 | ) | Interest expense (f) | | | 12,060 | | Capitalized interest (g) | | | (643 | ) | Income tax expense (h) | | | 2,720 | |
The sources of information and significant assumptions are described below: (a) | (a)The adjustments are for the period from January 1, 2012 to October 5, 2012. |
(b) | Revenues and direct operating expenses for the Newfield Properties were derived from the historical financial records of Newfield. Incremental revenue adjustments were $105.7 million and $216.8 million for 2012 and 2011, respectively. Incremental operating costs were $33.2 million and $24.6 million for 2012 and 2011, respectively. |
(c) | (b) | Incremental costs for insurance were estimated at $0.6 million annually, which werefrom the incremental costs to add the Newfield Properties to W&T’s insurance programs. The direct operating costs for the Newfield Properties described above excluded insurance costs. |
(d) | (c) | DD&A was estimated using the full-cost method and determined as the incremental DD&A expense due to adding the Newfield Properties’ costs, reserves and production into our currently existing full cost pool in order to compute such amounts. The purchase price allocation included $13.1 million that was allocated to the pool of unevaluated properties for oil and natural gas interests. Accordingly, nointerests was excluded from the DD&A expense was estimated for the unevaluated properties.estimation. ARO werewas estimated by W&T management. Incremental DD&A was estimated at $53.4 million and $102.7 million for 2012 and 2011, respectively. |
(e) | (d) | IncrementalG&A adjustments related to incremental transaction expenses, related to the acquisition were $0.6 million andwhich were assumed to be funded from cash on hand.hand, and were adjusted from 2012 results. |
(f) | (e) | The acquisition was assumed to be funded entirely with borrowed funds. Interest expense was computed using assumed borrowings of $205.6$205.8 million, which equates to the cash component of the transaction, and an interest rate of 7.7%, which equates to the effective yield on net proceeds for the additional senior notes issued shortly after the acquisition closed. Incremental interest expense was estimate at $12.0 million and $15.8 million for 2012 and 2011, respectively. |
(g) | (f) | Incremental capitalized interest was computed for the addition to the pool of unevaluated properties and the capitalization interest rate was adjusted for the assumed borrowings. Incremental capitalized interest was estimate at $0.6 million and $0.9 million for 2012 and 2011, respectively.The negative amount represents a decrease to net expenses. |
(h) | (g) | Income tax expense was computed using the 35% federal statutory rate. Incremental income tax expense was estimated at $2.7 million and $25.9 million for 2012 and 2011, respectively. |
The pro forma adjustments do not included adjustments related to any other acquisitions or divestitures. | (h) | The 2011 period does not include any pro forma adjustments related to the 2011 acquisitions as described below. |
86
W&T OFFSHORE, INC. AND SUBSIDIARIES NOTES TO CONSOLIDATED FINANCIAL STATEMENTS (Continued) 2011 Acquisitions
On May 11, 2011, we acquired from Opal Resources LLC and Opal Resources Operating Company LLC (collectively, “Opal”) certain oil and gas leasehold interests (the “Yellow Rose Properties”). The adjusted purchase price was $394.4 million, which was subject to certain adjustments, including adjustments from an effective date of January 1, 2011 until the closing date, and we assumed the future ARO and a certain long-term liability. The properties consisted of approximately 24,500 gross acres (21,900 net acres) of oil and gas leasehold interests in the West Texas Permian Basin. The acquisition was funded from cash on hand and borrowings under our revolving bank credit facility.
The following table presents the purchase price allocation for the acquisition of the Yellow Rose Properties (in thousands):
| | | | | Oil and natural gas properties and equipment | | $ | 396,902 | | Asset retirement obligations – non-current | | | (382 | ) | Long-term liability | | | (2,143 | ) | | | | | | Total cash paid | | $ | 394,377 | | | | | | |
On August 10, 2011, we acquired from Shell Offshore Inc. (“Shell”) certain oil and gas leasehold and property interests (the “Fairway Properties”). The adjusted purchase price was $42.9 million, which was subject to certain adjustments, including adjustments from an effective date of September 1, 2010 until the closing date, and we assumed the future ARO. The properties consisted of Shell’s 64.3% interest in the Fairway Field along with a like interest in the associated Yellowhammer gas treatment plant. The acquisition was funded from borrowings under our revolving bank credit facility.
The following table presents the purchase price allocation for the acquisition of the Fairway Properties (in thousands):
| | | | | Oil and natural gas properties and equipment | | $ | 50,682 | | Asset retirement obligations – non-current | | | (7,812 | ) | | | | | | Total cash paid | | $ | 42,870 | | | | | | |
Expenses associated with acquisition activities and transition activities related to the Yellow Rose Properties and Fairway Properties for the year 2011 were $1.6 million and are included in G&A. The acquisitions were recorded at fair value, which was determined using both the market and income approaches and Level 3 inputs were used to determine fair value. See Note 1 for a description of the Level 3 inputs.
Revenue, Net Income and Pro Forma Financial Information – Unaudited
The Yellow Rose Properties and the Fairway Properties were not included in our consolidated results until their respective close dates. For the period of May 11, 2011 to December 31, 2011 for the Yellow Rose Properties and the period of August 10, 2011 to December 31, 2011 for the Fairway Properties, these two acquisitions accounted for $64.0 million of revenue, $25.5 million of direct operating expenses, $20.5 million of DD&A and $6.3 million of income taxes, resulting in $11.7 million of net income. The net income attributable to these properties does not reflect certain expenses, such as G&A and interest expense; therefore, this information is not intended to report results as if these operations were managed on a stand-alone basis. In addition, the Yellow Rose Properties and the Fairway Properties were not recorded in a separate entity for tax purposes; therefore, income tax was estimated using the federal statutory tax rate.
W&T OFFSHORE, INC. AND SUBSIDIARIES
NOTES TO CONSOLIDATED FINANCIAL STATEMENTS (Continued)
The unaudited pro forma financial information was computed as if these two acquisitions had been completed on January 1, 2010. The historical financial information is derived from W&T’s audited historical consolidated financial statements, the Yellow Rose Properties’ audited historical financial statement for 2010, the Fairway Properties’ unaudited historical statement for 2010 and the unaudited historical statement of the sellers for the 2011 interim periods.
The pro forma adjustments were based on estimates by management and information believed to be directly related to the purchase of the Yellow Rose Properties and the Fairway Properties. The pro forma financial information is not necessarily indicative of the results of operations had the respective purchases occurred on January 1, 2010. If the transactions had been in effect for the periods indicated, the results may have been substantially different. For example, we may have operated the assets differently than the sellers. Realized sales prices for oil, NGLs and natural gas may have been different and costs of operating the properties may have been different. The following table presents a summary of our pro forma financial information (in thousands except earnings per share):
| | | | | | | | | | | | (unaudited)
Year Ended December 31, | | | | | 2011 | | | 2010 | | Revenue | | $ | 1,023,430 | | | $ | 784,964 | | Net income | | | 180,779 | | | | 113,783 | | Basic and diluted earnings per common share | | | 2.39 | | | | 1.52 | |
For the pro forma financial information, certain information was derived from financial records and certain information was estimated. The sources of information and significant assumptions are described below:
| (a) | Revenues and direct operating expenses for the Yellow Rose Properties and the Fairway Properties were derived from the historical records of the sellers up to the respective closing dates. Incremental revenue adjustments were $52.4 million and $79.2 million for 2011 and 2010, respectively. Incremental operating costs were $16.4 million and $25.3 million for 2011 and 2010, respectively. |
| (b) | DD&A was estimated using the full-cost method and determined as the incremental DD&A expense due to adding the Yellow Rose Properties and Fairway Properties’ costs, reserves and production into our currently existing full cost pool in order to compute such amounts. The purchase price allocation included $81.2 million that was allocated to the pool of unevaluated properties for oil and gas interests. Accordingly, no DD&A expense was estimated for the unevaluated properties. ARO were estimated by W&T management. Incremental DD&A was estimated at $21.9 million and $50.4 million for 2011 and 2010, respectively. |
| (c) | Incremental transaction expenses related to the acquisitions completed during 2011 were $1.6 million and were assumed to be funded from cash on hand. These were adjusted from 2011 results. |
| (d) | The acquisitions were assumed to be funded with borrowed funds and that borrow capacity would have been available on the revolving bank credit facility due to the increase in reserves. Interest expense was computed using interest rates that were in effect during the applicable time period and we assumed that six-month London Interbank Offered Rate (“LIBOR”) borrowings were made as allowed under the revolving bank credit facility. The assumed interest rates ranged from 3.1% to 3.5%. A reduction in the revolving bank credit facility commitment fee related to the assumed borrowings was netted against the computed incremental interest expense. Incremental interest expense was estimate at $4.6 million and $12.9 million for 2011 and 2010, respectively. |
W&T OFFSHORE, INC. AND SUBSIDIARIES
NOTES TO CONSOLIDATED FINANCIAL STATEMENTS (Continued)
| (e) | Incremental capitalized interest was computed for the addition to the pool of unevaluated properties and the capitalization interest rate was adjusted for the assumed borrowings. Incremental capitalized interest was estimate at $1.1 million and $3.0 million for 2011 and 2010, respectively. |
| (f) | Income tax expense was computed using the 35% federal statutory rate. Incremental income tax expense was estimated at $4.3 million for 2011 and an income tax benefit was estimated at $2.2 million for 2010. |
| (g) | The 2011 period does not included any pro forma adjustments related to the 2012 acquisition described above. The 2010 period does not include any pro forma adjustments related to the 2010 acquisitions as described below. |
2010 Acquisitions
On April 30, 2010, we acquired from Total E&P USA (“Total E&P”) certain oil and gas leasehold interest (the “Total Properties”). The acquisition was made through our wholly-owned subsidiary, W&T Energy VI, LLC (“Energy VI”). The adjusted purchase price was $115.0 million, which was subject to certain adjustments, including adjustments from an effective date of January 1, 2010 until the closing date, and we assumed the future ARO. The properties acquired were Total E&P’s interest, including production platforms and facilities, in three federal offshore lease blocks located in the Gulf of Mexico. The properties included a 100% working interest in the Matterhorn field (Mississippi Canyon block 243) and a 64% working interest in the Virgo field (Viosca Knoll blocks 822 and 823). The acquisition was funded with cash on hand. In accordance with the Purchase and Sale Agreement, Energy VI obtained unsecured surety bonds in favor of the Bureau of Ocean Energy Management (the “BOEM”) to secure the ARO with respect to these assets. The Purchase and Sale Agreement provides for annual increases in the required security for the ARO. To help satisfy the annual increases, Energy VI has agreed to make periodic payments from production of the acquired properties to an escrow agent. As long as the required security amount then in effect is met, the payments will be promptly released to us by the escrow agent. As of December 31, 2012 we were in compliance with the required security amount.
The following table presents the purchase price allocation for the acquisition of the Total Properties (in thousands):
| | | | | Oil and natural gas properties and equipment | | $ | 121,301 | | Asset retirement obligations – non-current | | | (6,289 | ) | | | | | | Total cash paid | | $ | 115,012 | | | | | | |
On November 4, 2010, through Energy VI, we acquired from Shell certain oil and gas leasehold interest (the “Tahoe Properties”). The adjusted purchase price was $116.2 million, subject to certain adjustments, including adjustments from an effective date of September 1, 2010, and we assumed the future ARO. The properties acquired were Shell’s interest, including production platforms and facilities, in three federal offshore lease blocks located in the Gulf of Mexico. The properties included a 70% working interest in the Tahoe field (Viosca Knoll 783), 100% working interest in the Southeast Tahoe field (Viosca Knoll 784) and a 6.25% of 8/8ths overriding royalty interest in the Droshky field (Green Canyon 244). The acquisition was funded with cash on hand. In accordance with the Purchase and Sale Agreement, Energy VI obtained unsecured surety bonds to secure the ARO with respect to these assets.
W&T OFFSHORE, INC. AND SUBSIDIARIES
NOTES TO CONSOLIDATED FINANCIAL STATEMENTS (Continued)
The following table presents the purchase price allocation for the acquisition of the Tahoe Properties (in thousands):
| | | | | Oil and natural gas properties and equipment | | $ | 134,189 | | Asset retirement obligations – non-current | | | (17,956 | ) | | | | | | Total cash paid | | $ | 116,233 | | | | | | |
Expenses associated with acquisition activities and transition activities related to the Total Properties and Tahoe Properties for the year 2010 were $0.5 million and are included in G&A. The acquisitions were recorded at fair value, which was determined using both the market and income approaches and Level 3 inputs were used to determine fair value. See Note 1 for a description of the Level 3 inputs.
Revenue, Net Income and Pro Forma Financial Information – Unaudited
The Total Properties and the Tahoe Properties were not included in our consolidated results until their respective close dates. For the period of April 30, 2010 to December 31, 2010 for the Total Properties and the period of November 4, 2010 to December 31, 2010 for the Tahoe Properties, these two acquisitions accounted for $97.2 million of revenue, $19.9 million of direct operating expenses, $27.9 million of DD&A and $17.3 million of income taxes, resulting in $32.1 million of net income. The net income attributable to these properties does not reflect certain expenses, such as G&A and interest expense; therefore, this information is not intended to report results as if these operations were managed on a stand-alone basis.
The unaudited pro forma financial information was computed as if these two acquisitions had been completed on January 1, 2009. The historical financial information is derived from W&T’s audited historical consolidated financial statements and the unaudited historical statements of the sellers.
The pro forma adjustments were based on estimates by management and information believed to be directly related to the purchase of the Total Properties and the Tahoe Properties. The pro forma financial information is not necessarily indicative of the results of operations had the respective purchases occurred on January 1, 2009. If the transactions had been in effect for the periods indicated, the results may have been substantially different. For example, we may have operated the assets differently than the sellers. Realized sales prices for oil, NGLs and natural gas sales prices may have been different and costs of operating the properties may have been different. The following table presents a summary of our pro forma financial information (in thousands except earnings per share):
| | | | | | | | (unaudited)
Year Ended
December 31, 2010 | | Revenue | | $ | 818,230 | | Net income | | | 148,359 | | Basic and diluted earnings per common share | | | 1.99 | |
For the pro forma financial information, certain information was derived from financial records and certain information was estimated. The sources of information and significant assumptions are described below:
| (a) | Revenues and direct operating expenses for the Total Properties and the Tahoe Properties were derived from the historical records of the sellers for the period of January 1, 2010 to the respective closing dates. Incremental revenues and operating expenses for 2010 were $112.4 million and $25.3 million, respectively. |
W&T OFFSHORE, INC. AND SUBSIDIARIES
NOTES TO CONSOLIDATED FINANCIAL STATEMENTS (Continued)
| (b) | DD&A was estimated using the full-cost method and determined as the incremental DD&A expense due to adding the Total Properties and the Tahoe Properties’ costs, reserves and production into our currently existing full cost pool in order to compute such amounts. ARO and related accretion were estimated by W&T management. Incremental DD&A was estimated at $39.6 million. |
| (c) | Incremental transaction expenses related to the acquisitions completed during 2010 were $0.5 million and were assumed to be funded from cash on hand. These were adjusted from 2010 results. |
| (d) | Reductions in interest income were computed related to cash paid for the acquisitions as cash on hand was sufficient to fund the acquisitions as of January 1, 2009. Average interest rates earned on short-term investments for the respective years were used in determining the adjustment. Decrease in interest income was estimated at $1.1 million. |
| (e) | An incremental income tax rate of 35% was used in the calculations for the estimated incremental earnings before taxes. Incremental income taxes were estimated at $16.4 million. |
| (f) | The 2010 period does not included any pro forma adjustments related to the 2011 acquisitions described above. |
2012 DivestituresDivestiture
On May 15, 2012, we sold our 40%, non-operated working interest in the South Timbalier 41 field located in the Gulf of Mexico for $30.5 million, net, with an effective date of April 1, 2012. The transaction was structured as a like-kind exchange under the Internal Revenue Service Code (“IRC”)IRC Section 1031 and other applicable regulations, with funds held by a qualified intermediary until replacement purchases could be executed. Replacement purchases were consummated during 2012.2012, which were within the replacement periods as defined under the IRC. In connection with this sale, we reversed $4.0 million of ARO. 3. Hurricane Remediation and Insurance Claims During the third quarter of 2008, Hurricane Ike and,caused substantial damage to a much lesser extent, Hurricane Gustav caused property damage and disruptions tocertain of our exploration and production activities.properties. Our insurance policies in effect on the occurrence datesdate of HurricanesHurricane Ike and Gustav had a retention requirement of $10.0 million per occurrence, to bewhich has been satisfied, by us before we could be indemnified for losses. In the fourth quarter of 2008, we satisfied our $10.0 million retention requirement for Hurricane Ike in connection with two platforms that were toppled and were deemed total losses. Our insurance coverage policy limits at the time of Hurricane Ike were $150.0 million for property damage due to named windstorms (excluding damage at certain damage incurred at our facilities of marginal significance)facilities) and $250.0 million for, among other things, removal of wreckage if mandated by any governmental authority. The damage For 2014, 2013 and 2012, we incurred as a resulthave received insurance proceeds of Hurricane Gustav was below our retention amount. Below is a summary of remediation costs$12.2 million, $6.7 million and $2.9 million, respectively. These amounts approved for payments related to Hurricanes Ike and Gustav that were included in lease operating expense (in thousands), with bracketed amounts representing credits to expense: | | | | | | | | | | | | | | | | Year Ended December 31, | | | | | 2012 | | | 2011 | | | 2010 | | Incurred and reversals of accruals | | $ | 1,022 | | | $ | 132 | | | $ | (1,380 | ) | Plus amounts returned to insurers | | | — | | | | 1,241 | | | | — | | Less amounts approved for payment by insurers | | | (146 | ) | | | (1,334 | ) | | | (10,350 | ) | | | | | | | | | | | | | | Included in lease operating expenses | | $ | 876 | | | $ | 39 | | | $ | (11,730 | ) | | | | | | | | | | | | | |
W&T OFFSHORE, INC. AND SUBSIDIARIES
NOTES TO CONSOLIDATED FINANCIAL STATEMENTS (Continued)
We recognize insurance receivables with respect to capital, repair and plugging and abandonment costs as a result of hurricane damage when we deem those to be probable of collection, which arises when our insurance underwriters’ adjuster reviews and approves such costs for payment by the underwriters. Claims that have been processed in this manner have customarily been paid on a timely basis. Incurred expenses included revisions of previous estimates. Amounts in 2011 include return of reimbursements that were previously received by us related to prepayments based on preliminary estimates. In 2010, incurred expenses were a credit due to revisions of previous estimates. See Note 5 for additional information about the impact of hurricane related items on our asset retirement obligations. See Note 18 for information regarding legal actions taken by certain insurers and the Company.
Below is a reconciliation of our insurance receivables (in thousands):
| | | | | Balance, December 31, 2011 | | $ | 715 | | Costs approved under our insurance policies, net | | | 2,221 | | Payments received, net | | | (2,936 | ) | | | | | | Balance, December 31, 2012 | | $ | — | | | | | | |
At December 31, 2011, substantially all of the amounts in insurance receivables relate to the plugging and abandonment of wells and dismantlement of facilities damaged by Hurricane Ike. Insurance receivables are included within Net cash provided by operating activitiesinJoint interest the Consolidated Statement of Cash Flows and other receivablesare primarily recorded as reductions in Oil and natural gas properties and equipment on the Consolidated Balance Sheets.Sheets, with minor amounts recorded as reductions in Lease operating expense
in the Consolidated Statements of Operations. From the third quarter of 2008 through December 31, 2012,2014, we have received $142.2$161.2 million cumulative from our insurance carrierunderwriters related to Hurricane Ike. To the extent that additional remediation cost or plug and abandonment costs are incurred that are not covered by insurance, we expect that our available cash and cash equivalents, cash flow from operationsSee Note 18 for information regarding legal actions involving certain insurers and the availability under our revolving bank credit facility will be sufficientCompany concerning claims related to meet necessary expenditures that may exceed our insurance coverage for damages incurred as a result of Hurricane Ike.Ike damages. 4. Restricted Deposits Restricted deposits as of December 31, 20122014 and 20112013 consisted of funds escrowed for the future plugging and abandonment of certain oil and natural gas properties. Pursuant to the Purchase and Sale Agreement with Total E&P USA Inc. (“Total E&P”), security for future plugging and abandonment of certain oil and natural gas properties is required either through bonds or payments to an escrow account or a combination.combination thereof. Monthly payments are made to an escrow account and these funds are returned to us once verification is made as to fulfillingthat the security amount requirements.requirements have been met. We were in compliance with the security requirements as of December 31, 2012.2014. See Note 16 for potential future security requirements. 5. Asset Retirement Obligations Pursuant to theAsset Retirement and Environmental Obligations topic of the Codification,GAAP, an asset retirement obligation associated with the retirement of a tangible long-lived asset is required to be recognized as a liability in the period in which a legal obligation is incurred and becomes determinable, with an offsetting increase in the carrying amount of the associated asset. The cost of the tangible asset, including the initially recognized ARO, is depleted such that the cost of the ARO is recognized over the useful life of the asset. The fair value of the ARO is measured using expected cash outflows associated with the ARO, discounted at our credit-adjusted risk-free rate when the liability is initially recorded. Accretion expense is recognized over time as the discounted liability is accreted to its expected settlement value. 87
W&T OFFSHORE, INC. AND SUBSIDIARIES NOTES TO CONSOLIDATED FINANCIAL STATEMENTS (Continued) The following is a reconciliation of our ARO liability (in thousands).: | 2014 | | | 2013 | | Asset retirement obligations, beginning of period | $ | 354,422 | | | $ | 384,053 | | Liabilities settled | | (74,313 | ) | | | (81,543 | ) | Accretion of discount | | 20,633 | | | | 20,918 | | Disposition of properties | | — | | | | (19,564 | ) | Liabilities assumed through acquisition | | 21,820 | | | | 4,233 | | Liabilities incurred | | 3,258 | | | | 1,745 | | Revisions of estimated liabilities | | 64,748 | | | | 44,580 | | Asset retirement obligations, end of period | | 390,568 | | | | 354,422 | | Less current portion | | 36,003 | | | | 77,785 | | Long-term | $ | 354,565 | | | $ | 276,637 | |
| | | | | | | | | | | | 2012 | | | 2011 | | Asset retirement obligations, beginning of period | | $ | 393,880 | | | $ | 391,316 | | Liabilities settled | | | (112,827 | ) | | | (59,958 | ) | Accretion of discount | | | 20,055 | | | | 29,771 | | Disposition of properties | | | (3,993 | ) | | | — | | Liabilities assumed through acquisition | | | 31,664 | | | | 8,194 | | Liabilities incurred | | | 1,815 | | | | 565 | | Revisions of estimated liabilities due to Hurricane Ike | | | (20,616 | ) | | | 4,744 | | Revisions of estimated liabilities – all other | | | 74,075 | | | | 19,248 | | | | | | | | | | | Asset retirement obligations, end of period | | | 384,053 | | | | 393,880 | | Less current portion | | | 92,630 | | | | 138,185 | | | | | | | | | | | Long-term | | $ | 291,423 | | | $ | 255,695 | | | | | | | | | | |
Each year (or more often if conditions warrant)During 2014, we review and, to the extent necessary, reviseincreased our ARO estimates. During 2012, we reduced ouron an overall basis primarily due to revisions, acquisitions and accretion of discount. Revisions increased ARO by $112.8 million for the plug and abandonment work performed during the year (including reductions of $29.6 million to plug and abandon wells and facilities damaged by Hurricane Ike). The acquisition of the Newfield Properties caused an increase of $31.7 million. Revisions made related to Hurricane Ike wereon a net decrease of $20.6 million, which wasbasis primarily attributable to the designation of a reef in placeto: a) increases at one of the hurricane damaged platforms. Other revisions increased ARO by $74.1 million and were attributable to: a)certain non-operated properties, b) regulation interpretations issued by the Bureau of Safety and Environmental Enforcement (which(“BSEE”), which increased the amount of work involved),involved, c) revisions to third-party contractor estimated prices for certain work on wells and structures, d) revisions accelerating the timing of planned work for certain wells and e) revisions for certain wells that are taking longer to complete the plugging and abandonment work than previously estimated due to operational issues. Increases related to acquisitions include the increase in our ownership interest at Fairway, the acquisition of the Woodside Properties and other minor acquisitions. Partially offsetting these were decreases for the plug and abandonment work performed during the year and the disposition of certain properties.
During 2013, we reduced our ARO on an overall basis primarily due to the plug and abandonment work performed during the year. In addition, the disposition of certain properties, as described in Note 2, reduced our ARO. The acquisition of the Callon Properties and drilling activity caused ARO to increase. Revisions that increased ARO on a net basis primarily attributable to: a) regulation interpretations issued by the BSEE, which increased the amount of work involved, b) revisions to third-party contractor estimateestimated prices for certain work on wells and structures, c) revisions accelerating the timing of planned work for certain wells and d) revisions for certain wells that are takingtook longer to complete the plugging and abandoningabandonment work than previously estimated due to operational issues. In addition, increases were made for certain locations affected by Hurricane Ike and increases in estimates were made for certain non-operated properties. During 2011, we reduced our ARO by $60.0 million for the plug and abandonment work performed during the year (including $23.0 million to plug and abandon wells and facilities damaged by Hurricane Ike). Offsetting this decrease were the acquisitions of properties, including the Yellow Rose Properties and the Fairway Properties, which increased our obligations by $8.2 million. In addition, revisions were made related to Hurricane Ike, which increased the liability by $4.7 million. Other estimates were increased by $19.2 million primarily attributable to changes in estimates for certain non-operated properties and accelerating the expected timing of performing some of the work.
6. Derivative Financial Instruments Our market risk exposure relates primarily to commodity prices and interest rates. From time to time, we use various derivative instruments to manage our exposure to commodity price risk from sales of our oil and natural gas and interest rate risk from floating interest rates on our revolving bank credit facility. Our derivative instruments currently consist of crude oil swap and option contracts. All of the derivative counterparties are also lenders or affiliates of lenders participating in our revolving bank credit facility. We are exposed to credit loss in the event of nonperformance by the derivative counterparties; however, we do not currently anticipate that anyeach of our derivative counterparties will be unableable to fulfill their contractual obligations. Additional collateral is not required by us due to the derivative counterparties’ collateral rights as lenders and we do not require collateral from our derivative counterparties. Our In accordance with GAAP, we record each derivative contract on the balance sheet as an asset or a liability at its fair value. We have elected not to designate our commodity derivative contracts as hedging instruments; therefore, all changes in the fair value of derivative contracts are recognized currently in earnings. The cash flows of all of our commodity derivative contracts are included in Net cash provided by operating activities on the Consolidated Statements of Cash Flows. For information about fair value measurements, refer to Note 8. 88
W&T OFFSHORE, INC. AND SUBSIDIARIES NOTES TO CONSOLIDATED FINANCIAL STATEMENTS (Continued) Commodity Derivatives As of December 31, 2014, we did not have any open commodity contracts. During the years ended December 31, 2014, 2013 and 2012, we entered into derivative contracts and these contracts consisted entirely of crude oil swap contracts. While these contracts were intended to reduce the effects of price volatility, they may have limited income from favorable price movements. The crude oil swap contracts were comprised of a portion based on Brent crude oil prices, a portion based on West Texas Intermediate (“WTI”) crude oil prices and a portion based on Light Louisiana Sweet (“LLS”) crude oil prices. The Brent based swap contracts were priced off the Brent crude oil price quoted on the Intercontinental Exchange, known as ICE. The WTI based swap contracts were priced off the New York Mercantile Exchange, known as NYMEX. The LLS based swap contracts were priced from data provided by Argus, an independent media organization. Although our Gulf of Mexico crude oil price is based off the WTI crude oil price plus a premium, the realized prices received for our Gulf of Mexico crude oil, up until October 2013, had been closer to the Brent crude oil price because of competition with foreign supplied crude oil, which was based off the Brent crude oil price. Therefore, a portion of the swap oil contracts were priced off the Brent crude oil price to mitigate a portion of the price risk associated with our Gulf of Mexico crude oil production. The following balance sheet line items included amounts related to the estimated fair value of our open derivative contracts as indicated in the following table (in thousands): | December 31, | | | 2014 | | | 2013 | | Prepaid and other assets | $ | — | | | $ | 141 | | Accrued liabilities | | — | | | | 9,423 | |
Changes in the fair value of our commodity derivative contracts are recognized currently in earnings and were as follows (in thousands): | Year Ended December 31, | | | 2014 | | | 2013 | | | 2012 | | Derivative (gain) loss: | $ | (3,965 | ) | | $ | 8,470 | | | $ | 13,954 | |
Cash payments on derivative settlements, net, are included within Net cash provided by operating activities on the Consolidated Statements of Cash Flows and were as follows (in thousands): | Year Ended December 31, | | | 2014 | | | 2013 | | | 2012 | | Cash payments on derivative settlements, net | $ | 5,318 | | | $ | 8,589 | | | $ | 7,664 | |
Offsetting Commodity Derivatives During 2014, 2013 and 2012, all of our derivative agreements allowallowed for netting of derivative gains and losses upon settlement. In general, the terms of the agreements provided for offsetting of amounts payable or receivable between us and the counterparty, at the election of both parties, for transactions that occur on the same date and in the same currency. If an event of default were to occur causing an acceleration of payment under our revolving bank credit facility, that event may also trigger an acceleration of settlement of our derivative instruments. If we were required to settle all of our open derivative instruments, we would have been able to net payments and receipts per counterparty pursuant to the derivative agreements. Although our derivative agreements allow for netting, which would allow for recording assets and liabilities per counterparty on a net basis, we have historically accounted for our derivative contracts on a gross basis per contract as either an asset or liability. 89
W&T OFFSHORE, INC. AND SUBSIDIARIES NOTES TO CONSOLIDATED FINANCIAL STATEMENTS (Continued) For information about
There were no open derivative contracts as of December 31, 2014. The following table provides a reconciliation of the gross assets and liabilities reflected in the balance sheet and the potential effects of master netting agreements on the fair value measurements, refer to Note 8. Commodity Derivatives. We have entered into commodity option contracts to manage a portion of our exposure to commodity price risk from sales of oil through December 2014. While these contracts are intended to reduce the effects of price volatility, they may also limit future income from favorable price movements. During 2012 and 2011, our commodityopen derivative contracts consisted entirelyas of crude oil contracts. During 2010, our commodity derivative contracts consisted of oil and natural gas contracts. The swaps are priced off the Brent crude oil price quoted on the IntercontinentalExchange, known as ICE. Although our Gulf of Mexico crude oil is based off the WTI crude oil price plus a premium, the realized prices received for the types of crude oil have been closer to the Brent crude oil price because of competition with foreign supplied crude oil, which is based off the Brent crude oil price. Therefore, we entered into swap oil contracts priced off the Brent crude oil price to mitigate a portion of the price risk associated with our Gulf of Mexico crude oil production.December 31, 2013 (in thousands):
| December 31, 2013 | | | Derivative | | | Derivative | | | Assets | | | Liabilities | | Gross amounts presented in the balance sheet | $ | 141 | | | $ | 9,423 | | Amounts not offset in the balance sheet | | (141 | ) | | | (141 | ) | Net Amounts | $ | — | | | $ | 9,282 | |
7. Long-Term Debt As of December 31, 2012, our open commodity derivative contracts were as follows: | | | | | | | | | | | | | | | | Swaps – Oil (ICE) | | | Termination Period | | Notional
Quantity (Bbls) | | | Weighted
Average
Contract Price | | | Fair Value
Liability
(in thousands) | | | 2013: | | 1st quarter | | | 351,000 | | | $ | 101.97 | | | $ | 2,566 | | | | 2nd quarter | | | 336,700 | | | | 101.97 | | | | 1,843 | | | | 3rd quarter | | | 312,800 | | | | 101.98 | | | | 1,205 | | | | 4th quarter | | | 294,400 | | | | 101.98 | | | | 741 | | | 2014: | | 1st quarter | | | 180,000 | | | | 97.38 | | | | 1,085 | | | | 2nd quarter | | | 172,900 | | | | 97.38 | | | | 863 | | | | 3rd quarter | | | 165,600 | | | | 97.38 | | | | 647 | | | | 4th quarter | | | 156,400 | | | | 97.37 | | | | 451 | | | | | | | | | | | | | | | | | | | | | | 1,969,800 | | | $ | 100.40 | | | $ | 9,401 | | | | | | | | | | | | | | | | |
The following balance sheet line items included amounts related to the estimated fair value of our open derivative contracts as indicated in the following table (in thousands):
| | | | | | | | | | | | December 31, | | | | | 2012 | | | 2011 | | Prepaid and other assets | | $ | — | | | $ | 2,341 | | Other assets | | | — | | | | 1,746 | | Accrued liabilities | | | 6,355 | | | | 7,199 | | Other liabilities | | | 3,046 | | | | — | |
Changes in the fair value of our commodity derivative contracts are recognized currently in earnings2014 and were as follows (in thousands):
| | | | | | | | | | | | | | | | Year Ended December 31, | | | | | 2012 | | | 2011 | | | 2010 | | Derivative (gain) loss: | | | | | | | | | | | | | Realized | | $ | 7,665 | | | $ | 9,873 | | | $ | (5,539 | ) | Unrealized | | | 6,289 | | | | (11,769 | ) | | | 9,511 | | | | | | | | | | | | | | | Total | | $ | 13,954 | | | $ | (1,896 | ) | | $ | 3,972 | | | | | | | | | | | | | | |
W&T OFFSHORE, INC. AND SUBSIDIARIES
NOTES TO CONSOLIDATED FINANCIAL STATEMENTS (Continued)
Interest Rate Swap
Changes in the fair value of our interest derivative contract are recognized currently in earnings. Our interest rate swap contract with a fixed interest rate of 5.21% expired in August 2010. During 2010, we recognized an unrealized gain of $4.4 million and a realized loss of $4.7 million for this contract.
7. Long-Term Debt
As of December 31, 2012 and 20112013, our long-term debt was as follows (in thousands):
| | | | | | | | | | | | December 31, | | | | | 2012 | | | 2011 | | 8.50% Senior Notes, due June 2019 | | $ | 900,000 | | | $ | 600,000 | | Debt premiums, net of amortization | | | 17,611 | | | | — | | Revolving bank credit facility due May 2015 | | | 170,000 | | | | 117,000 | | | | | | | | | | | Total long-term debt (1) | | | 1,087,611 | | | | 717,000 | | Current maturities of long-term debt | | | — | | | | — | | | | | | | | | | | Long-term debt, less current maturities | | $ | 1,087,611 | | | $ | 717,000 | | | | | | | | | | |
| December 31, | | | 2014 | | | 2013 | | 8.50% Senior Notes | $ | 900,000 | | | $ | 900,000 | | Debt premiums, net of amortization | | 13,057 | | | | 15,421 | | Revolving bank credit facility | | 447,000 | | | | 290,000 | | Total long-term debt | | 1,360,057 | | | | 1,205,421 | | Current maturities of long-term debt | | — | | | | — | | Long term debt, less current maturities | $ | 1,360,057 | | | $ | 1,205,421 | |
(1) | (1) | Aggregate annual maturities of long-term debt as of December 31, 20122014 are as follows (in millions): 2013 – $0.0; 2014 – $0.0; 2015 – $170.0; 2016 – $0.0; thereafter – $900.0.2015–$0.0; 2016–$0.0; 2017–$0.0; 2018–$447.0; thereafter–$900.0. |
Senior Notes On October 24, 2012, we issued $300.0 million of Senior Notes at a premium of 106% par value with an interest rate of 8.50% (7.73%(7.7% effective interest rate) and maturity date of June 15, 2019, which have identical terms to the Senior Notes issued in June 2011 (collectively, the “8.50% Senior Notes”). The net proceeds after fees and expenses were approximately $312.0 million. The funds were used to repay all of our outstanding indebtedness under our revolving bank credit facility, a portion of which was incurred to partially fund our acquisition of the Newfield Properties described in Note 2, and for general corporate purposes. In February 2013, holders of the 8.50% Senior Notes issued in October 2012 exchanged their 8.50% Senior Notes for registered notes with the same terms. On June 10, 2011, we issued $600.0 million of Senior Notes at par with an interest rate of 8.50% and maturity date of June 15, 2019. The net proceeds after fees and expenses were approximately $593.5 million. In January 2012, holders of the Senior Notes issued in June 2011 exchanged their Senior Notes for registered notes with the same terms. In June and July of 2011, we used a portion of the net proceeds from the June 2011 issuance of the 8.50% Senior Notes to repurchase all of our 8.25% Senior Notes due 2014 (the “8.25% Senior Notes”), which had a principal amount of $450.0 million. Costs of $22.0 million related to repurchasing the 8.25% Senior Notes, which included repurchase premiums and the unamortized debt issuance costs, are included in the statement of income within the line item classification,Loss on extinguishment of debt.
Interest on the 8.50% Senior Notes is payable semi-annually in arrears on June 15 and December 15 of each year and all of the 8.50% Senior Notes are subject to the same indenture. The 8.50% Senior Notes are unsecured and are fully and unconditionally guaranteed by certain of our subsidiaries. At December 31, 20122014 and 2011,2013, the outstanding balance of our 8.50% Senior Notes was $900.0 million and $600.0, respectively, and was classified W&T OFFSHORE, INC. AND SUBSIDIARIES
NOTES TO CONSOLIDATED FINANCIAL STATEMENTS (Continued)
at their carrying value as long-term debt. The estimated annual effective interest rate on the 8.50% Senior Notes is 8.6%8.4% for 20122014, which includes amortization of debt issuance costs and premiums. At December 31, 20122014 and 2011,2013, the estimated fair value of the 8.50% Senior Notes was approximately $963.0$594.0 million and $612.0$962.5 million, respectively. We and our restricted subsidiaries are subject to certain covenants under the indenture governing the 8.50% Senior Notes, which limit our and our restricted subsidiaries’ ability to, among other things, make investments, incur additional indebtedness or issue preferred stock, sell assets, consolidate, merge or transfer all or substantially all of our assets, engage in transactions with affiliates, pay dividends or make other distributions on capital stock or subordinated indebtedness and create unrestricted subsidiaries. We were in compliance with all applicable covenants of the indenture governing the 8.50% Senior Notes as of December 31, 2012.2014. 90
W&T OFFSHORE, INC. AND SUBSIDIARIES NOTES TO CONSOLIDATED FINANCIAL STATEMENTS (Continued) Credit Agreement On May 5, 2011,November 8, 2013, we entered into the FourthFifth Amended and Restated Credit Agreement (the “Credit Agreement”), which provides a revolving bank credit facility with an initial borrowing base of $525.0 million. In November 2012, the borrowing base was re-determined by our lenders and increasedup to $725.0 million. This is a secured facility that is collateralized by our oil and natural gas properties. The Credit Agreement terminates on May 5, 2015 and replaced the prior Third Amended and Restated Credit Agreement (the “Prior Credit Agreement”).$1.2 billion. Availability under the Credit Agreement is subject to a semi-annual borrowing base determination set at the discretion of our lenders.lenders, and the Company and the lenders may each request one additional determination per year. The borrowing base as of December 31, 2014 was $750.0 million. The amount of the borrowing base is calculated by our lenders based on their evaluation of our proved reserves and their own internal criteria. Any determination by our lenders to change our borrowing base will result in a similar change in the availability under our revolving bank credit facility. Letters of credit may be issued in amounts up to $300.0 million, provided availability under the revolving bank credit facility exists. The revolving bank credit facility is secured and is collateralized by our oil and natural gas properties. The Credit Agreement terminates on November 8, 2018 and replaced the prior Fourth Amended and Restated Credit Agreement (the “Prior Credit Agreement”). The Credit Agreement contains covenants that limit, among other things, the payment ofour ability to: (i) pay cash dividends in excess of up to $60.0 million per year,year; (ii) repurchase our common stock repurchases and Senior Note repurchasesor outstanding senior notes in excess of up to $100.0 million borrowings other than fromin the revolving bank credit facility, salesaggregate, provided that such limitation will not apply to the repurchase of assets,our existing senior notes in an aggregate principal amount equal to the aggregate principal amount of any new issuance of notes; (iii) sell our assets; (iv) make certain loans to others, investments, merger activity,or investments; (v) merge or consolidate; (vi) eliminate certain hedging contracts liensor enter into certain hedging contacts in excess of 75% of projected oil and gas production on a monthly basis; (vii) enter into certain liens; and (viii) enter into certain other transactions, without the prior consent of the lenders. In December 2012, we were granted a one-time waiver which allowed for cash dividends of up to $85.0 million during 2012. Letters of credit may be issued for up to $90.0 million, provided availability under the revolving bank credit facility exists. We are permitted to issue additional unsecured indebtedness above our current level of $900.0 million as long as no event of default occurs, we are in compliance with the financial covenants after giving pro forma effect to the additional unsecured indebtedness, and such additional unsecured indebtedness matures after the maturity date of the Credit Agreement and is not subject to various financialrestrictive covenants calculated as of the last day of each fiscal quarter including a minimum current ratio and a maximum leverage ratio as such ratios are definedmaterially more onerous than those provided for in the Credit Agreement. We wereIf we issue additional unsecured indebtedness in compliance with all applicable covenantsexcess of the Credit Agreement ascurrent $900.0 million in aggregate principal amount, the borrowing base then in effect will be reduced by $0.25 for each dollar of December 31, 2012.such excess until the borrowing base is redetermined by our lenders. Borrowings under the revolving bank credit facility bear interest at the applicable LIBORLondon Interbank Offered Rate (“LIBOR”) plus a margin that varies from 2.00%1.75% to 2.75% depending on the level of total borrowings under the Credit Agreement, or an alternative base rate equal to the applicable margin ranging from 1.00% to 1.75% plus the highestgreater of the (a) Prime Rate, (b) Federal Funds Rate plus 0.50%0.5%, and (c) LIBOR plus 1.0%, plus applicable margin ranging from 0.75% to 1.75%. The unused portion of the borrowing base is subject to a commitment fee of 0.50%ranging from 0.375% to 0.5%. The estimated annual effective interest rate was 5.0%2.9% for 20122014 for borrowings under the Credit Agreement. The estimated annual effective interest rate includes amortization of debt issuance costs and excludes commitment fees and other costs. On May 7, 2012, we executedThe Credit Agreement contains various customary covenants, customary events of default and certain financial tests, as of the First Amendmentend of each quarter, including a maximum consolidated leverage ratio, as defined in the Credit Agreement, of 3.5 to 1.0, and a minimum current ratio, as defined in the Credit Agreement, of 1.0 to 1.0. The customary events of default include: (i) nonpayment of principal when due or nonpayment of interest or other amounts within three business days of when due; (ii) bankruptcy or insolvency with respect to the Fourth Amended and Restated Credit Agreement which, among other things, increased the numberCompany or any of participating lenders and added a provision permitting the Company to maintain security interests in favor of any derivative counterparties that cease to be lendersits subsidiaries guaranteeing borrowings under the Company’s revolving bank credit facility. On October 12, 2012, we executed the Second Amendment to the Fourth Amended and Restated Credit Agreement, which, among other things, allowed for the issuancefacility; or (iii) a change of additional Senior Notes above the $600.0 million level and provided for a reductioncontrol. We were in the borrowing base of
W&T OFFSHORE, INC. AND SUBSIDIARIES
NOTES TO CONSOLIDATED FINANCIAL STATEMENTS (Continued)
25% of every $1.00 of Senior Notes above $600.0 million until such time as the borrowing base is re-determined. The borrowing base was re-determined subsequent to this amendment. All other termscompliance with all applicable covenants of the Credit Agreement remain substantially the same prioras of December 31, 2014.
As it applies to the Amendment. Unamortized debt issuance costs, we applied accounting guidance under the FASB codification 470-50-40-21 that relates to line-of-credit arrangements. The Credit Agreement had an initial borrowing base equal to the borrowing base under the Prior Credit Agreement. One of $0.7 millionthe 20 banks in the syndication under the Prior Credit Agreement was replaced with a different bank under the Credit Agreement and the other 19 banks were unchanged. Accordingly, we apportioned the unamortized debt issuance cost related to the Prior Credit Agreement were written off in 2011 and are includedexpensed the portion related to the bank whose debt was extinguished and did not participate in the statementCredit Agreement. The remaining unamortized debt issuance costs related to the Prior Credit Agreement was combined with the debt issuance costs related to the Credit Agreement and is being amortized over the term of income within the Credit Agreement on a straight line item classification,Loss on extinguishment of debt.basis.
At December 31, 2012,2014, we had $170.0$447.0 million in borrowings and $0.6 million in letters of credit outstanding under the revolving bank credit facility. At December 31, 2011,2013, we had $117.0$290.0 million in borrowings and $0.4 million in letters of credit outstanding under the revolving bank credit facility. For information about fair value measurements, refer to Note 8. 91
W&T OFFSHORE, INC. AND SUBSIDIARIES NOTES TO CONSOLIDATED FINANCIAL STATEMENTS (Continued) 8. Fair Value Measurements Under theFair Value Measurements and Disclosures topic of the Codification,GAAP, fair value is defined as the price that would be received to sell an asset or paid to transfer a liability in an orderly transaction between market participants at the measurement date. The fair value of an asset should reflect its highest and best use by market participants, whether using an in-use or an in-exchange valuation premise. The fair value of a liability should reflect the risk of nonperformance, which includes, among other things, the Company’s credit risk. Valuation techniques are generally classified into three categories: the market approach; the income approach; and the cost approach. The selection and application of one or more of these techniques requires significant judgment and is primarily dependent upon the characteristics of the asset or liability, the principal (or most advantageous) market in which participants would transact for the asset or liability and the quality and availability of inputs. Inputs to valuation techniques are classified as either observable or unobservable within the following hierarchy: · | Level 1 – quoted prices in active markets for identical assets or liabilities. |
· | Level 2 – inputs other than quoted prices that are observable for an asset or liability. These include: quoted prices for similar assets or liabilities in active markets; quoted prices for identical or similar assets or liabilities in markets that are not active; inputs other than quoted prices that are observable for the asset or liability; and inputs that are derived principally from or corroborated by observable market data by correlation or other means (market-corroborated inputs). |
· | Level 3 – unobservable inputs that reflect the Company’s own expectations about the assumptions that market participants would use in measuring the fair value of an asset or liability. |
The following table presents the fair value of our derivative financial instruments, our 8.50% Senior Notes and our revolving bank credit facility (in thousands).: | | | | | | | | | | | | | | | | | | | | | | | | | | | December 31, | | | | | | | | 2012 | | | 2011 | | | | | Hierarchy | | | Assets | | | Liabilities | | | Assets | | | Liabilities | | Derivatives | | | Level 2 | | | $ | — | | | $ | 9,401 | | | $ | 4,087 | | | $ | 7,199 | | 8.50% Senior Notes | | | Level 2 | | | | — | | | | 963,000 | | | | — | | | | 612,000 | | Revolving bank credit facility | | | Level 2 | | | | — | | | | 170,000 | | | | — | | | | 117,000 | |
W&T OFFSHORE, INC. AND SUBSIDIARIES
NOTES TO CONSOLIDATED FINANCIAL STATEMENTS (Continued)
| | | December 31, 2014 | | | December 31, 2013 | | | Hierarchy | | Assets | | | Liabilities | | | Assets | | | Liabilities | | Derivatives | Level 2 | | $ | — | | | $ | — | | | $ | 141 | | | $ | 9,423 | | 8.50% Senior Notes | Level 2 | | | — | | | | 594,000 | | | | — | | | | 962,460 | | Revolving bank credit facility | Level 2 | | | — | | | | 447,000 | | | | — | | | | 290,000 | |
Derivatives are reported in the statement of financial position at fair value. The 8.50% Senior Notes are reported in the statement of financial position at their carrying value, which was $900.0 million and $600.0 million at December 31, 2012 and 2011, respectively. The revolving bank credit facility debt is reported in the statement of financial position at its carrying value, which was $170.0 million and $117.0 million at December 31, 2012 and 2011, respectively.
We measure the fair value of our derivative financial instruments by applying the income approach, and using models with inputs that are classified within Level 2 of the valuation hierarchy. The inputs used for the fair value measurement of our derivative financial instruments fair value measurement are the exercise price, the expiration date, the settlement date, notional quantities, the implied volatility, the discount curve with spreads and published commodity futures prices. The fair value of our 8.50% Senior Notes is based on quoted prices and the market is not an active market; therefore, the fair value is classified within Level 2. The carrying amount of debt under our revolving bank credit facility approximates fair value because the interest rates are variable and reflective of market rates. Derivatives are reported in the statement of financial position at fair value. The 8.50% Senior Notes are reported in the statement of financial position at their carrying value, which was $900.0 million at December 31, 2014 and 2013. The revolving bank credit facility debt is reported in the statement of financial position at its carrying value, which was $447.0 million and $290.0 million at December 31, 2014 and 2013, respectively. For additional information about our derivative financial instruments refer to Note 6 and for additional information on our 8.50% Senior Notes and revolving bank credit facility refer to Note 7.
92
W&T OFFSHORE, INC. AND SUBSIDIARIES NOTES TO CONSOLIDATED FINANCIAL STATEMENTS (Continued) 9. Equity Structure and Transactions As of December 31, 20122014 and 2011,2013, the Company was authorized to issue 20 million shares and two million shares, respectively, of preferred stock with a par value of $0.00001 per share; however, no preferred shares have been issued or were outstanding as of the respective dates. During 2012, 20112014, 2013 and 2010,2012, we paid regular cash dividends of $0.32, $0.16$0.40, $0.36 and $0.14$0.32 common share per year, respectively. In December 2013, we paid a special dividend of $0.42 per share or $31.8 million. In December 2012, we paid two special dividends totaling $0.79 per share or $59.0 million. Dividends are subject to periodic review of the Company’s performance and the current economic environment and applicable debt agreement restrictions. In December, 2011, we paid a special dividendlight of $0.63 per share or $46.9 million. In December, 2010, we paid a special dividendcurrent market conditions, the Board of $0.66 per share or $49.2 million. On February 26, 2013, our board of directors declared a cash dividend of $0.08 per common share, payable on March 29, 2013Directors has elected to shareholders of record on March 15, 2013.suspend the regular quarterly dividend. 10. Incentive Compensation Plan and Directors Compensation Plan Incentive Compensation Plan In 2010, the W&T Offshore, Inc. Amended and Restated Incentive Compensation Plan (the “Plan”) was approved by our shareholders and amendments to the Plan were approved by our shareholders in 2013. The Plan covers the Company’s eligible employees and consultants. The Plan amended and restated the Company’s previous Long-term Incentive Compensation Plan (the “Previous Plan”). In addition to other cash and equity-basedshare-based compensation awards, the Plan is designed to grant awards that qualify as performance-based compensation within the meaning of section 162(m) of the IRC. The Plan grants the Compensation Committee of the Board of Directors administrative authority over all participants, and grants the President and Chief Executive Officer with authority over the administration of awards granted to participants that are not subject to section 16 of the Exchange Act (as applicable, the “Committee”). Pursuant to the terms of the Plan, the Committee establishes the performance criteria and may use a single measure or combination of business measures as described in the Plan. Also, individual goals may be established by the Committee. Performance awards may be granted in the form of stock options, stock appreciation rights, restricted stock, restricted stock units, bonus stock, dividend equivalents, or other awards related to stock, and awards may be paid in cash, stock, or any combination of cash and stock, as determined by the Committee. The performance awards granted under the Plan can be measured over a performance period of up to 10 years and annual incentive awards (a type of performance award) will be paid within 90 days following the applicable year end. W&T OFFSHORE, INC. AND SUBSIDIARIES
NOTES TO CONSOLIDATED FINANCIAL STATEMENTS (Continued)
Share-based Awards: Restricted Stock Units For 2014, 2013 and 2012, performance awards under the Plan were granted in the form of restricted stock units (“RSUs”) and cash awards.. As defined by the Plan, RSUs are rights to receive stock, cash or a combination thereof at the end of a specified vesting period, subject to certain terms and conditions as determined by the Committee. RSUs are a long-term compensation component of the Plan, which are granted to only certain employees, and are subject to adjustments at the end of the applicable performance period using a predefined scale based on the Company achieving certain predetermined performance criteria. For 2012, 70%Vesting occurs upon completion of the RSUs award was conditioned on achieving earnings per share targets for 2012, 10%specified vesting period applicable to each grant. Subsequent to the determination of the performance achievement and prior to vesting, the RSUs awardearn dividend equivalents at the same rate as dividends paid on our common stock. RSUs are subject to forfeiture until vested and cannot be sold, transferred or disposed of during the restricted period. During 2014, RSUs granted were subject to adjustments based on achievement of a combination of performance criteria, which is comprised of: (i) net income before income tax expense, net interest expense, depreciation, depletion, amortization, accretion and certain other items (“Adjusted EBITDA”) for 2014 and (ii) Adjusted EBITDA as a percent of total revenue (“Adjusted EBITDA Margin”) for 2014. Adjustments range from 0% to 100% dependent upon actual results compared against pre-defined performance levels. For 2014, the Company was conditioned on achievingabove target for Adjusted EBITDA and was slightly below target for Adjusted EBITDA Margin. During 2013, RSUs granted were subject to a combination of performance criteria, which was comprised of: (i) Adjusted EBITDA for 2013; (ii) Adjusted EBITDA Margin for 2013; and (iii) the Company’s total shareholder return (“TSR”) targets for 2012, 10% of the RSUs award was conditioned on achievingranking against peer companies’ TSR targets for 2013, 2014 and 10% of the RSUs award was conditioned on achieving TSR targets for the period January 1, 20142015 to October 31, 2014 (collectively, the “2012 RSUs”).2015. TSR is determined based upon the change in the entity’s stock price plus dividends for the applicable performance period. TheAdjustments range from 0% to 150% for portions subject to Adjusted EBITDA and Adjusted EBITDA Margin measurements and adjustments range from 0% to 200% for the portion subject to TSR targets aremeasurement. For 2013, the rankingCompany exceeded the target for Adjusted EBITDA and was approximately at target for 2013 Adjusted EBITDA Margin. For 2014 and 2013, the Company was below target for the TSR rankings for each period. In addition, RSUs were granted during 2013 which were not subject to performance criteria and were less than 3% of total grants. 93
W&T OFFSHORE, INC. AND SUBSIDIARIES NOTES TO CONSOLIDATED FINANCIAL STATEMENTS (Continued) During 2012, RSUs granted were subject to a combination of performance criteria, which was comprised of: (i) earnings per share (“EPS”) for 2012; and (ii) the Company’s TSR comparedranking against peer companies’ TSR for 2012, 2013 and January 1, 2014 to the TSR of 19 peer companies. The 2012 RSUs related to the earnings per share targets have an issuance scaleOctober 31, 2014. Adjustments range from 0% to 100%. The 2012 RSUs related for the portion subject to TSR targets have an issuance scaleEPS measurement and adjustments range from 0% to 150%. Vesting for the portion subject to TSR measurement. Pursuant to the Plan, discretionary authority was exercised for certain non-executive employees, which reduced the forfeitures that would have occurred through application of the pre-defined performance measurement. All RSUs granted to date are subject to employment-based criteria in addition to performance criteria. Vesting occurs in December of the third year after the grant. For example, the RSUs granted during 2012 RSUs occurs(after adjustment for performance) vested in December 2014 to eligible employees. Cash-based Awards For 2014, 2013 and 2012, cash-based awards were granted under the Plan to substantially all eligible employees. The cash-based awards, which are a short-term component of the Plan, were determined based on December 15, 2014.multiple performance measures, such as Adjusted EBITDA, reserve and production growth, cost containment and individual performance measures. With respect to the 2014 cash-based awards, some of the performance criteria targets were achieved and were combined with estimates of personal performance measurements to record potential payments. With respect to the 2013 cash-based awards, most of the performance criteria targets were achieved and were combined with the individual’s performance to determine the cash-based award. With respect to the 2012 cash-based awards, some of the performance criteria targets were achieved and were combined with the individual’s performance to determine the cash-based award. In addition, pursuant to the Plan, discretionary authority was exercised for certain non-executive employees, which increased cash-based award amounts in 2012. Eligible employees are paid their cash-based awards within 75 days following year end. Share-based Awards: Common Stock The 2014 annual incentive plan award for the Chief Executive Officer (“CEO”) was settled in shares of common stock based on a pre-determined price of $14.66 per share, subject to pre-defined performance measures and approval of the Compensation Committee. As the number of shares could not be determined until the full-year 2014 results were determined and approved by the Committee, the CEO’s 2014 award was accounted for as a liability award during 2014 and adjusted to fair value using the Company’s closing price at the end of each reporting period. The grant was made in the first quarter of 2015 once the number of shares could be determined and approved by the Committee. The 2013 annual incentive plan award for the CEO was settled in shares of common stock based using the price of the stock immediately preceding the day the award was settled and the grant was made in the first quarter of 2014. Adjustments were made to both grants to satisfy withholding tax requirements. The performance measures for the CEO’s awards were the same as the cash-based-awards performance measures established for the other eligible Company employees for 2014 and 2013, respectively. Directors Compensation Plan Share-Based Awards Under the Directors Compensation Plan, shares of restricted stock (“Restricted Shares”) were issued in 2014, 2013 and 2012 to the Company’s non-employee directors as a component of their compensation arrangement. Vesting occurs upon completion of the specified vesting period and one-third of each grant vests each year over a three-year period. The holders of Restricted Shares generally have the same rights as a shareholder of the Company with respect to such shares, including the right to vote and receive dividends or other distributions paid with respect to the shares. Restricted Shares are subject to forfeiture until vested and cannot be sold, transferred or otherwise disposed of during the restriction period. For additional information concerning share-based awards and cash-based awards, including expense recognition, see Note 11. 11. Share-Based and Cash-Based Incentive Compensation As allowed by the Plan, in 2014, 2013 and 2012, the Company granted RSUs to certain of its employees. In 2014, 2013 and 2012, restricted stock was granted to the Company’s non-employee directors under the Directors Compensation Plan. In addition to share-based compensation, the Company granted cash-based incentive awards to substantially all eligible employees in 2014, 2013 and 2012. 94
W&T OFFSHORE, INC. AND SUBSIDIARIES NOTES TO CONSOLIDATED FINANCIAL STATEMENTS (Continued) On May 7, 2013, after receiving shareholder approval, 4,000,000 shares of common stock were added to the amount available for issuance under the Plan. As of December 31, 2014, there were 4,790,082 shares of common stock available for issuance in satisfaction of awards under the Plan and 500,564 shares of common stock available for issuance in satisfaction of awards under the Directors Compensation Plan. The shares available for both plans are reduced when restricted stock is granted. RSUs reduce the shares available in the Plan only when RSUs are settled in shares of common stock, net of withholding tax. Although the Company has the option to settle RSUs in stock or cash at vesting, only common stock has been used to settle vested RSUs to date. Restricted Stock Under the Directors Compensation Plan, shares of restricted stock (“Restricted Shares”) were issued in 2014, 2013 and 2012 to the Company’s non-employee directors. See Note 10 for additional information concerning Restricted Shares. A summary of activity related to Restricted Shares is as follows: | 2014 | | | 2013 | | | 2012 | | | Restricted Shares | | | Weighted Average Grant Date Fair Value Per Share | | | Restricted Shares | | | Weighted Average Grant Date Fair Value Per Share | | | Restricted Shares | | | Weighted Average Grant Date Fair Value Per Share | | Nonvested, beginning of period | | 43,840 | | | $ | 15.96 | | | | 43,687 | | | $ | 18.69 | | | | 51,870 | | | $ | 15.81 | | Granted | | 18,815 | | | | 18.60 | | | | 27,450 | | | | 12.75 | | | | 21,954 | | | | 19.13 | | Vested | | (19,445 | ) | | | 18.00 | | | | (27,297 | ) | | | 17.09 | | | | (27,475 | ) | | | 13.59 | | Forfeited | | — | | | | — | | | | — | | | | — | | | | (2,662 | ) | | | 18.78 | | Nonvested, end of period | | 43,210 | | | $ | 16.20 | | | | 43,840 | | | $ | 15.96 | | | | 43,687 | | | $ | 18.69 | |
Subject to the satisfaction of service conditions, the Restricted Shares outstanding as of December 31, 2014 are expected to vest as follows: | Restricted Shares | | 2015 | | 21,520 | | 2016 | | 15,420 | | 2017 | | 6,270 | | Total | | 43,210 | |
Restricted stock fair value at grant date and vested date: The grant date fair value of restricted stock granted during 2014, 2013 and 2012 was $0.3 million, $0.3 million and $0.4 million, respectively, based on the Company’s closing price on the date of grant for the 2012 RSUs was determined separately for the component related to the earnings per share targets and the component related to TSR targets.grant. The fair value of the componentrestricted stock that vested during 2014, 2013 and 2012 was $0.3 million, $0.4 million and $0.5 million, respectively, based on the Company’s closing price on the date of vesting. Restricted Stock Units During 2014, 2013 and 2012, the Company granted RSUs to certain employees, with nearly all grants being contingent upon meeting specified performance requirements. The grants are subject to adjustments at the end of the applicable performance period using a predefined scale based on the Company achieving certain predetermined performance criteria. See Note 10 for additional information concerning RSUs. The fair value of the RSUs granted in 2014 was determined using the Company’s closing price on the grant dates as the performance measures were all company-specific performance measures comprised of Adjusted EBITDA and Adjusted EBITDA Margin. 95
W&T OFFSHORE, INC. AND SUBSIDIARIES NOTES TO CONSOLIDATED FINANCIAL STATEMENTS (Continued) The fair value of the RSUs granted in 2013 was determined separately for each component. For the components related to earnings per share targetsthe company-specific performance measures (Adjusted EBITDA and Adjusted EBITDA Margin), the fair value was determined using the Company’s closing price on the grant date. The fair value forcomponents related to Adjusted EBITDA and Adjusted EBITDA Margin comprised 40% and 30%, respectively, of the amount granted. For the component related to TSR targetsranking, the fair value was determined using a Monte Carlo simulation probabilistic model. The component related to TSR ranking totaled 30% of the amount granted, with 10% for each of the three-year performance periods. The inputs used in the model for the Company and the peer companies were: average closing stock prices during January 2013; risk-free interest rates using the LIBOR ranging from 0.27% to 0.91% over the service period; expected volatilities ranging from 30% to 63%; expected dividend yields ranging from 0.0% to 3.1%; and correlation factors ranging from a negative 84% to a positive 95%. The expected volatilities, expected dividends and correlation factors were developed using historical data. For the RSUs granted in 2013 that were not subject to performance measures, the fair value was determined using the closing price on the date of grant. The fair value of the RSUs granted in 2012 was determined separately for the two components. For the component related to the company-specific performance measure, which was comprised of only EPS, the fair value was determined using the Company’s closing price on the grant date. The component related to EPS comprised 70% of the amount granted. For the component related to TSR ranking, the fair value was determined by using a Monte Carlo simulation probabilistic model. The component related to TSR ranking totaled 30% of the amount granted, with 10% for each of the three-year performance periods. The inputs used in the probabilistic model for the Company and the peer companies were: average closing stock prices during January 2012; risk-free interest rates using the LIBOR ranging from 0.15% to 0.72% over the service period; expected volatilities ranging from 33% to 74%; expected dividend yields ranging from 0.0% to 2.5%; and correlation factors ranging from (67%)a negative 67% to a positive 94%. The expected volatilities, expected dividends and correlation factors were developed using historical data. For 2012, some of the RSUs that were granted to employees were forfeited as the Company did not meet certain predefined performance measures including earnings per share and TSR targets. Pursuant to the Plan, discretionary authority was exercised for certain non-executive employees, which reduced the forfeitures that would have occurred through application of the predefined performance measurement. Vesting eligibility for the TSR component of RSUs for the 2013 and 2014 periods will be determined at the end of the respective performance periods. With the exception of the 2012 RSU components that relate to TSR for the 2013 and 2014 performance periods, the remaining 2012 RSUs not forfeited will be eligible for vesting in December 2014, subject to meeting certain employment criteria. The cash-based awards, which are a short-term component of the Plan, were determined based on multiple performance measures, such as earnings per share, reserve and production growth, cost containment and individual performance measures. With respect to the 2012 cash-based awards, some of the performance criteria targets were achieved and were combined with estimates of personal performance measurements to determine potential payments. In addition, pursuant to the Plan, discretionary authority was exercised for certain non-executive employees, which increased cash-based award amounts. Employees will be paid their cash-based awards within 75 days following year end 2012.
For 2011, performance awards under the Plan were granted in the form of RSUs and cash awards. The sole business performance criteria established for the 2011 RSU awards (the “2011 RSUs”) was an earnings per share target. The Company exceeded the top-tier target; therefore 100% of the 2011 RSUs awards will be eligible for vesting on December 15, 2013. The fair value of the 2011 RSUs was estimated by using the Company’s closing price on the grant date. The cash-based awards, which are a short-term component of the Plan, were determined based on multiple performance measures, such as earnings per share, reserve and production growth, cost containment and individual performance measures. With respect to the 2011 cash-based awards, most of the performance criteria targets were achieved and were combined with the individual’s performance to determine the cash-based award paid.
W&T OFFSHORE, INC. AND SUBSIDIARIES
NOTES TO CONSOLIDATED FINANCIAL STATEMENTS (Continued)
For 2010, performance awards under the Plan were granted in the form of RSUs and cash awards. The sole business performance criteria established for the 2010 RSU awards (the “2010 RSUs”) was an earnings per share target. The Company exceeded the top-tier target; therefore 100% of the 2010 RSUs awards were eligible for vesting on December 15, 2012. The fair value of the 2010 RSUs was estimated by using the Company’s closing price on the grant date. The cash based awards were determined based on multiple performance measures. With respect to the 2010 cash-based awards, most of the performance criteria targets were achieved and were combined with the individual’s performance to determine the cash-based award paid.
For information concerning grants awarded and amounts recognized in lease operating expense and G&A, see Note 11.
11. Share-Based and Cash-Based Incentive Compensation
As allowed by the Plan, in 2012, 2011 and 2010, the Company granted RSUs to certain of its employees. In 2012 and in prior years, restricted stock was granted to the Company’s non-employee directors under the Directors Compensation Plan. In addition to share-based compensation, the Company granted its employees cash-based incentive awards in 2012, 2011 and 2010.
At December 31, 2012, there were 1,393,602 shares of common stock available for award under the Plan and 546,829 shares of common stock available for award under the Directors Compensation Plan.
Restricted Stock
Under the Company’s share-based payment plans, restricted shares were issued in 2012, 2011 and 2010 primarily to the Company’s non-employee directors. Restricted shares are subject to forfeiture until vested and cannot be sold, transferred or otherwise disposed of during the restriction period. The holders of restricted shares generally have the same rights as a shareholder of the Company with respect to such shares, including the right to vote and receive dividends or other distributions paid with respect to the shares. The fair value of restricted stock was estimated by using the Company’s closing price on the grant date.
A summary of share activity related to restricted stock is as follows: | | | | | | | | | | | | | | | | | | | | | | | | | | | | 2012 | | | 2011 | | | 2010 | | | | | Restricted
Shares | | | Weighted
Average
Grant Date
Price
Per Share | | | Restricted
Shares | | | Weighted
Average
Grant Date
Price
Per Share | | | Restricted
Shares | | | Weighted
Average
Grant Date
Price
Per Share | | Nonvested, beginning of period | | | 51,870 | | | $ | 15.81 | | | | 470,392 | | | $ | 7.42 | | | | 1,050,506 | | | $ | 8.48 | | Granted | | | 21,954 | | | | 19.13 | | | | 20,433 | | | | 25.45 | | | | 35,000 | | | | 10.00 | | Vested | | | (27,475 | ) | | | 13.59 | | | | (404,422 | ) | | | 7.31 | | | | (485,934 | ) | | | 9.69 | | Forfeited | | | (2,662 | ) | | | 18.78 | | | | (34,533 | ) | | | 6.83 | | | | (129,180 | ) | | | 8.15 | | | | | | | | | | | | | | | | | | | | | | | | | | | Nonvested, end of period | | | 43,687 | | | | 18.69 | | | | 51,870 | | | | 15.81 | | | | 470,392 | | | | 7.42 | | | | | | | | | | | | | | | | | | | | | | | | | | |
Subject to the satisfaction of service conditions, the restricted shares outstanding as of December 31, 2012 will vest as follows:
| | | | | | | | Shares | | 2013 | | | 24,019 | | 2014 | | | 12,354 | | 2015 | | | 7,314 | | | | | | | Total | | | 43,687 | | | | | | |
W&T OFFSHORE, INC. AND SUBSIDIARIES
NOTES TO CONSOLIDATED FINANCIAL STATEMENTS (Continued)
Restricted stock fair value at grant date and vested date: The grant date fair value of restricted stock granted during 2012, 2011 and 2010 was $0.4 million, $0.5 million and $0.4 million, respectively. The fair value of the restricted stock that vested during 2012, 2011 and 2010 was $0.5 million, $7.9 million and $8.1 million, respectively, based on the closing prices on the dates of vesting.
Restricted Stock Units
During 2012, 2011 and 2010, the Company awarded to certain employees RSUs that were 100% contingent upon meeting specified performance requirements. The specific performance requirements were partially achieved in 2012 and were fully achieved in 2011 and 2010. Vesting occurs upon completion of the specified vesting period applicable to each award. Subsequent to the determination of the performance achievement and prior to vesting, the RSUs awards earn dividend equivalents at the same rate as dividends paid on our common stock. RSUs awarded are subject to forfeiture until vested and cannot be sold, transferred or disposed of during the restricted period. The methodology and assumptions used to estimate fair value for RSUs grants are described in Note 10.
A summary of share activity related to RSUs is as follows:
| | | | 2012 | | | 2011 | | | 2010 | | 2014 | | | 2013 | | | 2012 | | | | | RSUs | | Weighted
Average
Grant Date
Price
Per Share | | | RSUs | | Weighted
Average
Grant Date
Price
Per Share | | | RSUs | | Weighted
Average
Grant Date
Price
Per Share | | Restricted Stock Units | | | Weighted Average Grant Date Fair Value Per Share | | | Restricted Stock Units | | | Weighted Average Grant Date Fair Value Per Share | | | Restricted Stock Units | | | Weighted Average Grant Date Fair Value Per Share | | Nonvested, beginning of period | | | 1,732,703 | | | $ | 14.67 | | | | 1,266,617 | | | $ | 9.36 | | | | — | | | $ | — | | | 1,331,753 | | | $ | 14.96 | | | | 969,820 | | | $ | 22.70 | | | | 1,732,703 | | | $ | 14.67 | | Granted | | | 764,654 | | | | 18.64 | | | | 534,375 | | | | 26.93 | | | | 1,280,501 | | | | 9.36 | | | 1,195,388 | | | | 16.84 | | | | 969,919 | | | | 13.23 | | | | 764,654 | | | | 18.64 | | Vested | | | (1,198,208 | ) | | | 9.36 | | | | — | | | | — | | | | — | | | | — | | | (354,692 | ) | | | 18.59 | | | | (468,925 | ) | | | 26.93 | | | | (1,198,208 | ) | | | 9.36 | | Forfeited (1) | | | (329,329 | ) | | | 19.56 | | | | (68,289 | ) | | | 12.03 | | | | (13,884 | ) | | | 9.36 | | | | | | | | | | | | | | | | | | | | Forfeited | | | (195,114 | ) | | | 16.53 | | | | (139,061 | ) | | | 16.50 | | | | (329,329 | ) | | | 19.56 | | Nonvested, end of period | | | 969,820 | | | | 22.70 | | | | 1,732,703 | | | | 14.67 | | | | 1,266,617 | | | | 9.36 | | | 1,977,335 | | | $ | 15.29 | | | | 1,331,753 | | | $ | 14.96 | | | | 969,820 | | | $ | 22.70 | | | | | | | | | | | | | | | | | | |
(1) | Includes RSUs forfeited due to adjustment for performance related to earnings per share targets and TSR targets. |
Subject to the satisfaction of service conditions, the RSUs outstanding as of December 31, 2012 will2014 are eligible to vest as follows:in the year indicated in the table below: | | | | | | | | Shares | | 2013 | | | 475,689 | | 2014 | | | 494,131 | | | | | | | Total | | | 969,820 | | | | | | |
| Restricted Stock Units | | 2015 - subject to service requirements | | 759,234 | | 2015 - subject to service and other requirements (1) | | 90,105 | | 2016 - subject to service requirements | | 1,127,996 | | Total | | 1,977,335 | |
(1) | In addition to service requirements, these RSUs are also subject to TSR performance requirements not yet measureable, with awards ranging from 0% to 200% of amounts granted. |
RSUs fair value at grant datedate: During 2014, 2013 and vested date: During 2012, 2011 and 2010, the grant date fair value of RSUs granted was $20.1 million, $12.8 million and $14.3 million, $14.4 million and $12.0 million, respectively. RSUs fair value at vested date: The fair value of the RSUs that vested during 2014, 2013 and 2012 was $2.0 million, $7.2 million and $20.0 million, respectively, based on the openingCompany’s closing price on the first day of trading after the vesting date, as vesting occurred on a weekend.date. 96
W&T OFFSHORE, INC. AND SUBSIDIARIES NOTES TO CONSOLIDATED FINANCIAL STATEMENTS (Continued)
Common Stock A grant and issuance of 42,547 shares of common stock was made in March 2014 to the CEO pursuant to the terms of his 2013 annual incentive compensation award. The number of shares was determined after deductions for withholding and payroll taxes and the shares were valued at the Company’s closing price as of the date of grant. The grant and issuance of shares of common stock pursuant to the terms of the CEO’s 2014 annual incentive compensation award will be made during the first quarter of 2015. See Note 10 for additional information concerning the CEO annual incentive compensation award. Share-Based Compensation A summary of compensation expense under share-based payment arrangements and the related tax benefit is as follows (in thousands): | | | | Year Ended December 31, | | Year Ended December 31, | | | | | 2012 | | | 2011 | | | 2010 | | 2014 | | | 2013 | | | 2012 | | Share-based compensation expense from: | | | | | | | | | | | | | | | | | | Restricted stock | | $ | 399 | | | $ | 2,377 | | | $ | 3,469 | | $ | 369 | | | $ | 397 | | | $ | 399 | | Restricted stock units | | | 11,999 | | | | 7,333 | | | | 2,064 | | | 13,150 | | | | 11,128 | | | | 11,999 | | | | | | | | | | | | | Common shares | | | 1,225 | | | | — | | | | — | | Total | | $ | 12,398 | | | $ | 9,710 | | | $ | 5,533 | | $ | 14,744 | | | $ | 11,525 | | | $ | 12,398 | | | | | | | | | | | | | Share-based compensation tax benefit: | | | | | | | | | | | | | | | | | | Tax benefit computed at the statutory rate | | $ | 4,339 | | | $ | 3,399 | | | $ | 1,937 | | $ | 5,160 | | | $ | 4,034 | | | $ | 4,339 | | | | | | | | | | | | |
As of December 31, 2012,2014, unrecognized share-based compensation expense related to our issued restricted sharesawards of Restricted Shares, RSUs and RSUscommon stock was $0.5 million, $16.5 million and $11.4$0.1 million, respectively. Unrecognized compensation expense will be recognized through April 20152017 for restricted shares, November 2016 for RSUs and November 2014February 2015 for RSUs.common stock. Cash-based Incentive Compensation As defined by the Plan, annual incentive awards payable in cash may be granted to eligible employees. These awards are performance-based awards consisting of one or more business criteria or individual performance criteria and a targeted level or levels of performance with respect to each of such criteria. Generally, the performance period is the calendar year and determination and payment is made in cash in the first quarter of the following year. Share-Based Compensation and Cash-Based Incentive Compensation Expense A summary of incentive compensation expense is as follows (in thousands): | | | | | | | Year Ended December 31, | | | | | Year Ended December 31, | | 2014 | | | 2013 | | | 2012 | | | | | 2012 | | | 2011 | | | 2010 | | | Share-based compensation expense included in: | | | | | | | | Lease operating expense | | $ | — | | | $ | 466 | | | $ | 748 | | | General and administrative | | | 12,398 | | | | 9,244 | | | | 4,785 | | | | | | | | | | | | | | Total charged to operating income | | | 12,398 | | | | 9,710 | | | | 5,533 | | | | | | | | | | | | | | Share-based compensation included in: | | | | | | | | | | | | | General and administrative (1) | | $ | 14,744 | | | $ | 11,525 | | | $ | 12,398 | | Cash-based incentive compensation included in: | | | | | | | | | | | | | | | | | | Lease operating expense | | | 3,787 | | | | 3,700 | | | | 2,067 | | | 3,285 | | | | 3,482 | | | | 3,787 | | General and administrative | | | 6,558 | | | | 12,213 | | | | 8,539 | | | | | | | | | | | | | | General and administrative (1) | | | 6,950 | | | | 8,817 | | | | 6,558 | | Total charged to operating income | | | 10,345 | | | | 15,913 | | | | 10,606 | | $ | 24,979 | | | $ | 23,824 | | | $ | 22,743 | | | | | | | | | | | | | Total incentive compensation charged to operating income | | $ | 22,743 | | | $ | 25,623 | | | $ | 16,139 | | | | | | | | | | | | | |
(1) | Reclassified $0.7 million from cash-based incentive compensation expense to share-based compensation expense in 2014 related to the CEO’s 2013 award. |
97
W&T OFFSHORE, INC. AND SUBSIDIARIES NOTES TO CONSOLIDATED FINANCIAL STATEMENTS (Continued) 12. Employee Benefit Plan We maintain a defined contribution benefit plan in compliance with Section 401(k) of the IRC (the “401(k) Plan”), which covers those employees who meet the 401(k) Plan’s eligibility requirements. During 2012, 20112014, 2013 and 2010,2012, the Company’s matching contribution was 100% of each participant’s contribution up to a W&T OFFSHORE, INC. AND SUBSIDIARIES
NOTES TO CONSOLIDATED FINANCIAL STATEMENTS (Continued)
maximum of 6% for 20122014, 2013 and 5% for prior years2012 of the participant’s eligible compensation, subject to limitations imposed by the Internal Revenue Service (“IRS”)IRC. The 401(k) Plan provides 100% vesting in Company match contributions on a pro rata basis over five years of service (20% per year). Our expenses relating to the 401(k) Plan were $2.4 million, $2.1 million $1.8 million and $1.4$2.1 million for the years2014, 2013 and 2012, 2011 and 2010, respectively. 13. Income Taxes Income Tax Expense (Benefit) Components of income tax expense (benefit) were as follows (in thousands): | | | | Year Ended December 31, | | Year Ended December 31, | | | | | 2012 | | 2011 | | | 2010 | | 2014 | | | 2013 | | | 2012 | | Current | | $ | (40,562 | ) | | $ | 29,682 | | | $ | 20,167 | | $ | 301 | | | $ | (2,146 | ) | | $ | (40,562 | ) | Deferred | | | 88,109 | | | | 61,835 | | | | (8,266 | ) | | (4,760 | ) | | | 30,920 | | | | 88,109 | | | | | | | | | | | | $ | (4,459 | ) | | $ | 28,774 | | | $ | 47,547 | | | | $ | 47,547 | | | $ | 91,517 | | | $ | 11,901 | | | | | | | | | | | | | |
Effective Tax Rate Reconciliation The reconciliation of income taxes computed at the U.S. federal statutory tax rate to our income tax expense (benefit) is as follows (in thousands): | | | | | | | | | | | | | | | | | | | | | | | | | | | | Year Ended December 31, | | | | | 2012 | | | 2011 | | | 2010 | | Income tax expense at the federal statutory rate | | $ | 41,836 | | | | 35.0 | % | | $ | 92,517 | | | | 35.0 | % | | $ | 45,427 | | | | 35.0 | % | Valuation allowance | | | — | | | | — | | | | — | | | | — | | | | (31,985 | ) | | | (24.6 | ) | Domestic production activities adjustment | | | 4,256 | | | | 3.5 | | | | (1,823 | ) | | | (0.7 | ) | | | (2,623 | ) | | | (2.0 | ) | State income taxes | | | 750 | | | | 0.6 | | | | 603 | | | | 0.2 | | | | 32 | | | | — | | Other | | | 705 | | | | 0.7 | | | | 220 | | | | 0.1 | | | | 1,050 | | | | 0.8 | | | | | | | | | | | | | | | | | | | | | | | | | | | | | $ | 47,547 | | | | 39.8 | % | | $ | 91,517 | | | | 34.6 | % | | $ | 11,901 | | | | 9.2 | % | | | | | | | | | | | | | | | | | | | | | | | | | |
| Year Ended December 31, | | | 2014 | | | 2013 | | | 2012 | | Income tax expense (benefit) at the federal statutory rate | $ | (5,642 | ) | | | 35.0 | % | | $ | 28,033 | | | | 35.0 | % | | $ | 41,836 | | | | 35.0 | % | Qualified domestic production activities | | — | | | | — | | | | — | | | | — | | | | 4,256 | | | | 3.5 | | State income taxes | | 263 | | | | (1.6 | ) | | | 343 | | | | 0.4 | | | | 750 | | | | 0.7 | | Other | | 920 | | | | (5.7 | ) | | | 398 | | | | 0.5 | | | | 705 | | | | 0.6 | | | $ | (4,459 | ) | | | 27.7 | % | | $ | 28,774 | | | | 35.9 | % | | $ | 47,547 | | | | 39.8 | % |
Our effective tax rate for the year 2014 is distorted due to a small pre-tax loss; consequently, our permanent differences have a larger impact on our effective tax rate. Our effective tax rate for the year 2013 differed from the federal statutory rate primarily as a result of state income taxes. Our effective tax rate for the year 2012 differed from the federal statutory rate primarily as a result of the recapture of deductions for qualified domestic production activities under Section 199 of the IRC as a function of loss carrybacks to prior years and the impact of state income taxes. Our effective tax rate for the year 2011 differed from the federal statutory rate primarily as a result of the utilization of the deduction attributable to qualified domestic production activities under Section 199 of the IRC. Our effective tax rate for the year 2010 differed from the federal statutory rate primarily as a result of a reduction in our valuation allowance against our deferred tax assets and the Section 199 deduction described above. Taxable income in 2010 allowed us to reverse all of the previously recorded valuation allowance. 98
W&T OFFSHORE, INC. AND SUBSIDIARIES NOTES TO CONSOLIDATED FINANCIAL STATEMENTS (Continued)
Deferred Tax Assets and Liabilities Deferred income taxes reflect the net tax effects of temporary differences between the carrying amounts of assets and liabilities for financial reporting purposes and the amounts used for income tax purposes. Significant components of our deferred tax assets and liabilities were as follows (in thousands): | | | | December 31, | | December 31, | | | | | 2012 | | 2011 | | 2014 | | | 2013 | | Deferred tax liabilities: | | | | | | | | | | | | Property and equipment | | $ | 186,599 | | | $ | 63,328 | | $ | 518,566 | | | $ | 422,805 | | Other | | | 4,822 | | | | 4,707 | | | 5,019 | | | | 3,602 | | | | | | | | | | Total deferred tax liabilities | | | 191,421 | | | | 68,035 | | | 523,585 | | | | 426,407 | | | | | | | | | | Deferred tax assets: | | | | | | | | | | | | Minimum tax credit | | | 22,314 | | | | — | | | Alternative minimum tax credit | | | 20,486 | | | | 20,486 | | Asset retirement obligations | | | 137,597 | | | | 124,863 | | Federal net operating losses | | | 12,389 | | | | — | | | 180,024 | | | | 91,472 | | State net operating losses | | | 5,057 | | | | 4,626 | | | 5,008 | | | | 5,028 | | Derivatives | | | 3,312 | | | | 1,096 | | | — | | | | 3,270 | | Valuation allowance (state) | | | (4,674 | ) | | | (4,626 | ) | | (4,255 | ) | | | (4,490 | ) | Accrued cash-based bonus | | | 2,455 | | | | 5,390 | | | 3,559 | | | | 3,873 | | Stock-based compensation | | | 4,256 | | | | 3,971 | | | 5,042 | | | | 3,703 | | Other | | | 1,330 | | | | 704 | | | 798 | | | | 643 | | | | | | | | | | Total deferred tax assets | | | 46,439 | | | | 11,161 | | | 348,259 | | | | 248,848 | | | | | | | | | | Net deferred tax liabilities | | $ | 144,982 | | | $ | 56,874 | | $ | 175,326 | | | $ | 177,559 | | | | | | | | | |
During 2014, we made did not make any payments for federal and state income taxes and we received refunds of $3.0 million. During 2013, we made payments primarily for federal and state income taxes of approximately $3.0 million. During 2013, we received refunds of $59.1 million, of which $9.5 million have been accounted for as unrecognized tax benefits. The refunds were primarily attributable to tax loss carrybacks to 2010 and 2011, and refunds of estimated tax payments. During 2012, we made payments primarily for federal and state income taxes of approximately $16.1 million. Wemillion and we received refunds related to prior years of $0.5 million. During 2011, we made payments primarily for federal and state income taxes of approximately $35.7 million. We received refunds related to prior years of $0.4 million. During 2010, we received refunds of federal income taxes paid in prior years totaling $99.8 million, consisting primarily of carrybacks of net operating losses generated in 2009 and 2008 and made payments of $12.0 million for federal and state income taxes.
At December 31, 2012,2014, we did not have a federal income tax receivable. At December 31, 2013, we had a federal income tax receivable of $47.9$3.1 million. This amount is comprised principally of a net operating loss carryback from 2012refunds related to 2010 of $29.1 million and a net operating loss carryback from 2012 to 2011 of $13.8 million. Additionally, federal estimated tax payments were deposited in 2012 of $5.0 million.taxes paid during 2013. Net Operating Loss and Tax Credit Carryovers The table below presents the details of our net operating loss and tax credit carryovers as of December 31, 20122014 (in thousands): | | | | Amount | | | Expiration Year | Amount | | | Expiration Year | Federal net operating loss | | $ | 35,399 | | | 2032 | $ | 516,393 | | | 2032-2034 | State net operating losses | | | 95,780 | | | 2017-2027 | | 99,656 | | | 2021-2029 | Minimum tax credit | | | 22,314 | | | Indefinite | | Alternative minimum tax credit | | | 12,091 | | | Indefinite | General business credit | | | 406 | | | 2027-2028 | | 406 | | | 2027-2028 |
The federal net operating loss and alternative minimum tax credit amounts presented in the table, Deferred Tax Assets and Liabilities, reflect adjustments for unrecognized excess tax benefits and uncertain tax positions, as applicable, to the amounts presented above. 99
W&T OFFSHORE, INC. AND SUBSIDIARIES NOTES TO CONSOLIDATED FINANCIAL STATEMENTS (Continued)
Valuation Allowance As of December 31, 20122014 and December 31, 2011,2013, we had a valuation allowance related to Louisiana state net operating losses. The realization of these assets depends on recognition of sufficient future taxable income in specific tax jurisdictions during periods in which those temporary differences or net operating losses are deductible. In assessing the need for a valuation allowance on our deferred tax assets, we consider whether it is more likely than not that some portion or all of them will not be realized. As part of our assessment, we consider future reversals of existing taxable temporary differences. Uncertain Tax Positions The table below sets forth the reconciliation of the beginning and ending balances of the total amount of unrecognized tax benefits. There are no unrecognized benefits that would impact the effective tax rate if recognized. While amounts could change in the next 12 months, we do not anticipate it having a material impact on our financial statements. We recognize interest and penalties related to uncertain tax positions in income tax expense. As of December 31, 2012, we had zero accrued interest related to uncertain tax positions. During 2011, we recognized $0.3 million of income tax benefit for the reversal of accrued interest and penalties. Balances and changes in the uncertain tax positions are as follows (in thousands): | | | | | | | | | | | | December 31, | | | | | 2012 | | | 2011 | | Balance at beginning of period | | | — | | | $ | 3,558 | | (Decreases) related to prior-year tax positions | | | — | | | | (3,558 | ) | | | | | | | | | | Balance at end of period | | | — | | | $ | — | | | | | | | | | | |
| December 31, | | | 2014 | | | 2013 | | Balance, beginning of period | $ | 9,482 | | | $ | — | | Increases related to carryback positions | | — | | | | 9,482 | | Balance, end of period | $ | 9,482 | | | $ | 9,482 | |
We recognize interest and penalties related to uncertain tax positions in income tax expense. For 2014, 2013 and 2012, the amounts recognized in income tax expense were immaterial. Years open to examination The tax years from 20092010 through 20122014 remain open to examination by the tax jurisdictions to which we are subject. 14. Earnings Per Share In accordance with theEarnings Per Share topic of the Codification,GAAP, the Company’s unvested share-based payment awards that contain nonforfeitable rights to dividends or dividend equivalents (whether paid or unpaid) are deemed participating securities and are included in the computation of earnings per share under the two-class method. The following table presents the calculation of basic and diluted earnings per common share (in thousands, except per share amounts): | | | | | | | | | | | | | | | | Year Ended December 31, | | | | | 2012 | | | 2011 | | | 2010 | | Net income | | $ | 71,984 | | | $ | 172,817 | | | $ | 117,892 | | Less portion allocated to nonvested shares | | | 983 | | | | 3,211 | | | | 1,178 | | | | | | | | | | | | | | | Net income allocated to common shares | | $ | 71,001 | | | $ | 169,606 | | | $ | 116,714 | | | | | | | | | | | | | | | Weighted average common shares outstanding | | | 74,354 | | | | 74,033 | | | | 73,685 | | | | | | | | | | | | | | | Basic and diluted earnings per common share | | $ | 0.95 | | | $ | 2.29 | | | $ | 1.58 | | | | | | Shares excluded due to being anti-dilutive | | | 1,923 | | | | 1,873 | | | | 1,540 | |
| Year Ended December 31, | | | 2014 | | | 2013 | | | 2012 | | Net income (loss) | $ | (11,661 | ) | | $ | 51,322 | | | $ | 71,984 | | Less portion allocated to nonvested shares | | 269 | | | | 303 | | | | 983 | | Net income (loss) allocated to common shares | $ | (11,930 | ) | | $ | 51,019 | | | $ | 71,001 | | Weighted average common shares outstanding | | 75,609 | | | | 75,239 | | | | 74,354 | | Basic and diluted earnings (loss) per common share | $ | (0.16 | ) | | $ | 0.68 | | | $ | 0.95 | | Shares excluded due to being anti-dilutive (weighted-average) | | 29 | | | | — | | | | 1,923 | |
100
W&T OFFSHORE, INC. AND SUBSIDIARIES NOTES TO CONSOLIDATED FINANCIAL STATEMENTS (Continued) 15. Supplemental Cash Flow Information The following reflects our supplemental cash flow information (in thousands): | | | | | | | | | | | | | | | | Year Ended December 31, | | | | | 2012 | | | 2011 | | | 2010 | | Cash paid for interest, net of interest capitalized of $13,274 in 2012, $9,877 in 2011 and $5,395 in 2010 | | $ | 46,247 | | | $ | 39,772 | | | $ | 36,362 | | Cash paid for income taxes | | | 16,056 | | | | 35,655 | | | | 12,000 | | Cash refunds received for income taxes | | | 479 | | | | 379 | | | | 99,828 | | Cash paid for share-based compensation (1) | | | 1,531 | | | | 1,062 | | | | 452 | | Cash tax benefit related to share-based compensation (2) | | | 5,962 | | | | 3,125 | | | | 6,871 | |
| Year Ended December 31, | | | 2014 | | | 2013 | | | 2012 | | Cash paid for interest, net of interest capitalized of $8,526 in 2014, $10,058 in 2013 and $13,274 in 2012 | $ | 77,607 | | | $ | 73,909 | | | $ | 46,247 | | Cash paid for income taxes | | — | | | | 3,000 | | | | 16,056 | | Cash refunds received for income taxes | | 3,000 | | | | 59,126 | | | | 479 | | Cash paid for share-based compensation (1) | | 431 | | | | 466 | | | | 1,531 | | Cash tax benefit related to share-based compensation (2) | | — | | | | — | | | | 5,962 | |
(1) | The cash paid for share-based compensation is for dividends on unvested restricted stock and for dividend equivalents paid on RSUs. No cash was received from employees or directors related to share-based compensation and no cash was used to settle any equity instruments granted under share-baseshare-based compensation arrangements. |
(2) | The cash tax benefit for share-based compensation is attributable to tax deductions for vested restricted shares, vested RSUs, dividends paid on unvested restricted stock and dividend equivalents paid on RSUs. Tax refunds were received in 2010For 2014 and 2013, no cash tax benefit was realized as the Company had a tax loss for that includedyear and all carrybacks of net operating losses for the years 2009 and 2008 to prior years, therefore the tax cash benefits from share-based compensation in those years was determined to be received in 2010. In addition, refunds related to the carryback of 2008 net operating loss to prior years were also received in 2009. As refunds could not be specifically determined as to which related to share-based compensation, it was assumed these cash flows were received in 2010 as most refunds were received in that year.had previously been utilized. |
16. Commitments We have operating lease agreements for office space and office equipment. The lease for the majority of our office space terminates in December 2022. Minimum future lease payments due under noncancelable operating leases with terms in excess of one year as of December 31, 20122014 are as follows (in millions): 2013 – $1.2; 2014 – $1.3; 2015 – $1.3; thereafter – $9.3. follows: 2015–$1.5 million; 2016–$1.6 million; 2017–$1.6 million; 2018–$1.7 million thereafter–$7.5 million. Total rent expense was approximately $3.2 million, $2.6 million and $1.7 million $1.9 millionduring 2014, 2013 and $2.0 million during 2012, 2011 and 2010, respectively. Pursuant to the Purchase and Sale Agreement with Total E&P, we are required to fulfill security requirements related to ARO for certain properties through bonds or making payments to an escrow account or a combination. As of December 31, 2012,2014, we were in compliance with the security amount requirement of $46.0$64.0 million. Additional security requirements are $9.0 million in 2013, $9.0 million in 2014, $9.0 million in 2015, $6.0 million in 2016, $4.0 million in 2017, $5.0 million in 2018 and $24.0$15.0 million in the 20172019 to 2023 time period to a total security requirement of $103.0 million by 2023. Pursuant to the Purchase and Sale agreement with Shell Offshore Inc. (“Shell”) related to ARO for certain properties, we have bonds that are subject to re-appraisal in the 2015. The current security requirement of $74.0 million could be increased up to $94.0 million depending on certain conditions and circumstances. We have bonding requirements related to properties owned by our subsidiary, W & T Energy VI, LLC, which require bonds in compliance with requirements set by the Bureau of Ocean Energy Management (“BOEM”). These bonds are required as long as W & T Energy VI, LLC owns the properties, including completion of plugging and abandonment activities. Total expenses related to bonds, inclusive of the bonds in connection with Total E&P and Shell described above, were $4.1 million, $5.0 million and $2.9 million during 2014, 2013 and 2012, respectively. The amount of future commitments is dependent on rates charged in the market place and when asset retirements are completed. Estimated future expenses related to bonds were based on current market prices and estimates of the timing of asset retirements, of which some wells and structures are estimated to extend to 2030. Future costs are estimated as follows: 2015–$5.8 million; 2016–$5.8 million; 2017–$5.4 million; 2018–$5.2 million; thereafter–$32.9 million. Pursuant to an agreement with the Helix Well Containment Group, we are required to make payments to have access to certain equipment to respond to a subsea spill should a spill occur at a property we operate. As of December 31, 2014, future payments due are $2.1 million in 2015 and $2.1 million in 2016. These payments may increase or decrease depending on whether the number of companies participating in the consortium changes. We have no drilling rig commitments with a term that exceeded one year as of December 31, 20122014 and our drilling rig commitments meet the criteria of an operating lease. Future payments of all drilling rig commitments as of December 31, 20122014 were $36.5 million in 2013 and none beyond 2013.$12.6 million. 101
W&T OFFSHORE, INC. AND SUBSIDIARIES NOTES TO CONSOLIDATED FINANCIAL STATEMENTS (Continued) 17. Related Parties During 2012, 20112014, 2013 and 2010,2012, there were certain transactions between us and other companies our majority shareholder either controlled or in which he had an ownership interest in.interest. In addition, there were transactions with a company that employs the spouse of our majority shareholder. Our majority shareholder owns a certainan aircraft that the Company used and reimbursed him for such use and for his use. Airplane services were charged to us at rates that were either equal to or below rates charged by non-related, third-party companies. Airplane services transactions were approximately $1.0$0.9 million, $1.1$1.2 million and $0.9$1.0 million for the years 2012, 20112014, 2013 and 2010,2012, respectively. Our majority shareholder has ownership interests in certain wells operated by us (such ownership interests pre-date our initial public offering). Revenues are disbursed and expenses are collected in accordance with ownership interest. Proportionate insurance premiums were paid to us and proportionate collections of insurance reimbursements attributable to damage on certain wells were disbursed. W&T hired the services of a directional drilling services company, in which our majority shareholder owns a minority ownership interest and serves on its board of directors, and W&T paid $0.2 million, $0.2 million and $0.7 million for drilling related services during 2012.2014, 2013 and 2012, respectively. A company that provides marine transportation and logistics services to W&T employs the spouse of our majority shareholder. The spouse received commissions partially based on services rendered to W&T which totaled less than $0.1$0.2 million per year for 20122014, 2013 and 2011.2012. All these transactions were determined to be priced at competitive rates and were reviewed by the Audit Committee for compliance with our policies and procedures. 18. Contingencies Federal Grand Jury Investigation.The United States Attorney’s OfficeNotification by ONRR of Fine for the Eastern District of Louisiana, along with the Criminal Investigation Division of the U.S. Environmental Protection Agency (the “EPA”) conducted a federal grand jury investigation beginning in late 2010 of environmental compliance matters relating to surface discharges and reporting on four of our offshore platforms in the Gulf of Mexico in 2009. Non-compliance
In December 2012, an agreement was reached that resolves these environmental violations2013 and the agreement was approvedJanuary 2014, we were notified by the federal district court in January 2013. Under the agreement, the CompanyOffice of Natural Resources Revenue (“ONRR”) of an underpayment of royalties on January 3, 2013 (i) pled guilty to one felony count under the Clean Water Act for altering monthly produced water discharge samples for the Ewing Banks 910 platform in 2009 and one misdemeanor count under the Clean Water Act for negligently discharging a small amount of oil from the same platform in November 2009 and (ii) paid a $0.7 million fine and $0.3 million for community service and (iii) entered into an environmental compliance program subject to a third-party audit. Under the agreement, the Company was placed on a three-year term of probation. The probation terms require that the Company: a) commit no further criminal violations, b) pay in full amounts pursuant to the agreement, c) comply with an Environmental Compliance Plan during the probation period, and d) take no adverse action against personnel who cooperated in the investigation. The agreement further stipulates that the Government will not seek any further criminal charges against the Company in this matter. Cameron Parish Louisiana Claim.Since 2009, certain Cameron Parish landowners have filed suits in the 38th Judicial District Court, Cameron Parish, Louisiana against the Company and Tracy W. Krohn as well as several other defendants unrelated to us. In their lawsuits, plaintiffs alleged that property they own has been contaminated or otherwise damaged by the defendants’Federal offshore oil and gas explorationleases that cumulatively approximated $30,000 over several years, which represents 0.0045% of royalty payments paid by us during the same period of the underpayment. In March 2014, we received notice from the ONRR of a statutory fine of $2.3 million relative to such underpayment. We believe the fine is excessive and production activitiesextreme considering the circumstances and they are seeking compensatoryin relation to the amount of underpayment. On April 23, 2014, we filed a request for a hearing on the record and punitive damages. During 2012, we settled claims with certain landowners and paid $10.0 million.a general denial of the ONRR’s allegations contained in the notice. We assessedintend to contest the remaining claimsfine to be probable and havethe fullest extent possible. The ultimate resolution may result in a waiver of the fine, a reduction of the fine, or payment of the full amount plus interest covering several years. As no amount has been determined as more likely than any other within the range of possible resolutions, no amount has been accrued $1.3 million in our contingent liabilities as of December 31, 2012.2014 per authoritative guidance. However, we cannot state with certainty that our estimatesestimate of additionalthe exposure areis accurate concerning this matter.
Apache Lawsuit Qui Tam Litigation.On September 21, 2012,December 15, 2014, Apache Corporation (“Apache”) filed a lawsuit against W&T Offshore, Inc., alleging that W&T breached the Company was served with a complaintjoint operating agreement (“JOA”) related to deepwater wells in aqui tam action filed under the federal False Claims Act by an employeeMississippi Canyon area of a Company contractor. Thethe Gulf of Mexico. That lawsuit,United States ex rel. Comeaux styled Apache Corporation v. W&T Offshore, Inc., et al.; CA No. 10-494, was filedis currently pending in the United States District Court for the Southern District of Texas. Apache contends that W&T has failed to pay its proportional share of the costs associated with plugging and abandoning three wells that are subject to the JOA. We contend that the costs incurred by Apache are excessive and unreasonable. Apache seeks an award of unspecified actual damages, interest, court costs, and attorneys’ fees. In February 2015, we made a payment to Apache for our net share of the amounts that we believe are reasonable to plug and abandon the three wells, all of which was originally recorded as an asset retirement obligation and was accrued on our balance sheet as of December 31, 2014. Our estimate of the potential exposure ranges from zero to $32 million related to this matter.
102
W&T OFFSHORE, INC. AND SUBSIDIARIES NOTES TO CONSOLIDATED FINANCIAL STATEMENTS (Continued) Eastern District of Louisiana, against the Company and three other working interest owners related to claims associated with three of the Company’s operated production platforms. Aqui tam action, also known as a “whistleblower” action, is a lawsuit brought by a private citizen seeking civil penalties or damages against a person or company on behalf of the government for alleged violations of law. If the claims are successful, the person filing the suit may recover a percentage of the damages or penalty from the lawsuit as a reward for exposing a wrongdoing and recovering funds on behalf of the government. The complaint was originally filed in 2010 but kept under confidential seal in order for the federal government to decide if it wished to intervene and take over the prosecution of thequi tam action. The government declined to intervene in this suit and the complaint was unsealed and made public in June 2012, thereby giving the plaintiff the opportunity to pursue the claims on behalf of the government.
The complaint alleges that environmental violations at three of the Company’s operated production platforms in the Gulf of Mexico violate the federal offshore lease provisions so that the Company, among other things, wrongfully retained benefits under the applicable leases. The alleged environmental violations include allegations of discharges of relatively small amounts of oil into the Gulf of Mexico, the failure to report and record such discharges, and falsification of certain produced water samples and related reports required under federal law. The events are alleged to have occurred in 2009. These are largely the same allegations involved in the federal grand jury investigation described above. We have filed a motion to dismiss the claim. The plaintiff dismissed his claims against the three other working interest owners after they filed motions to dismiss. The plaintiff conceded that certain of his claims should be dismissed in his reply to the Company’s motion to dismiss. The motion remains pending before the court.Insurance Claims
The Company intends to vigorously defend the claims made in this lawsuit. At this early stage of the lawsuit, the Company has determined that although the likelihood of an adverse outcome is reasonably possible, the range of potential loss cannot yet be estimated, and accordingly, no accrual has been made.
Insurance Claims.During the fourth quarter of 2012, underwriters of W&T’s excess liability policies (“Excess Policies”) (Indemnity Insurance Company of North America, New York Marine & General Insurance Company, Navigators Insurance Company;Company, XL Specialty Insurance Company, National Liability & Fire Insurance Company (“Starr Marine”) and Liberty Mutual Insurance Co.) filed declaratory judgment actions in the United States District Court for the Southern District of Texas (the “District Court”) seeking a determination that such policiesour Excess Policies do not cover removal of wreckremoval-of-wreck and debris claims arising from Hurricane Ike that occurred in 2008.except to the extent we have first exhausted the limits of our Energy Package (defined as certain insurance policies relating to our oil and gas properties which includes named windstorm coverage) with only removal-of-wreck and debris claims. The court consolidated the various suits filed by the underwriters. W&T has not yet filed any claim under such excess policies, but W&T anticipates that such claims may reach $50.0 million in aggregate. In January 2013, the Companywe filed a motion for summary judgment seeking the court’s determination that such excessExcess Policies do not require us to exhaust the limits of our Energy Package policies do in fact provide coverage for such removal of wreckwith only removal-of-wreck and debris claims. The motion for summary judgment is pending. If successful, we expectIn July 2013, the District Court ruled in favor of the underwriters, adopting their position that the Excess Policies cover removal-of-wreck and debris claims only to receive reimbursement for these costs once coststhe extent the limits of our Energy Package policies have been incurredexhausted with removal-of-wreck and claims submitted. Costsdebris claims. We appealed the decision in the United States Court of Appeals for the Fifth Circuit (the “Fifth Circuit”) and, in June 2014, the Fifth Circuit reversed the District Court’s ruling and ruled in our favor. The underwriters filed three separate briefs requesting a rehearing or a certification to the Texas Supreme Court, all of which the Court denied. A brief was subsequently filed by one underwriter requesting a rehearing to the District Court of the Fifth Circuit’s decision, which the District Court denied. Claims of approximately $43 million were filed, of which approximately $1 million was paid under the Energy Package and of which approximately $1 million was paid under our Comprehensive General Liability policy. One of the underwriters, Liberty Mutual Insurance Co., has paid their portion of the first excess liability policy (approximately $5 million), including interest, although the commencement date of the interest calculation is under discussion. The other underwriters have not paid in accordance with the Fifth Circuit ruling, and we filed a lawsuit in September 2014 against these underwriters for amounts owed, interest, attorney fees and damages. Subsequent to the filing of that have been incurredlawsuit, Starr Marine has paid their portion ($5 million) of the first excess liability policy without interest. The revised estimate of potential reimbursement is approximately $31 million, plus interest, attorney fees and damages, if any. Removal-of-wreck costs are recorded in connection with potential claims have been recorded inOil and natural gas properties and equipment on the Consolidated Balance Sheet. AnySheets and recoveries from claims made on these policies related to this issueExcess Policies will be recorded as reductions in this line item.item, which will reduce our future DD&A rate.
Royalties.Royalties
In 2009, the Company recognized $5.3 million in allowable reductions of cash payments for royalties owed to the Office of Natural Resources Revenue (the “ONRR”)ONRR for transportation of their deepwater production through our subsea pipeline systems. In 2010, the ONRR audited the calculations and support related to this usage fee, and in the third quarter of 2010, we were notified that the ONRR had disallowed approximately $4.7 million of the reductions taken. We recorded a reduction to other revenue of $4.7 million in the third quarter of 2010 to reflect this disallowance; however, we disagree with the position taken by the ONRR. We filed an appeal with the ONRR, which was denied in May 2014. On June 17, 2014, we filed an appeal with the Board of Land Appeals (the “BLA”) under the Department of the Interior. W&T’s brief was filed in November 2014 and we are pursuing our claimexpect the briefing before BLA to resolvebe completed in the matter.first half of 2015. Other Claims.Claims We are a party to various pending or threatened claims and complaints seeking damages or other remedies concerning our commercial operations and other matters in the ordinary course of our business. In W&T OFFSHORE, INC. AND SUBSIDIARIES
NOTES TO CONSOLIDATED FINANCIAL STATEMENTS (Continued)
addition, claims or contingencies may arise related to matters occurring prior to our acquisition of properties or related to matters occurring subsequent to our sale of properties. In certain cases, we have indemnified the sellers of properties we have acquired, and in other cases, we have indemnified the buyers of properties we have sold. We are also subject to federal and state administrative proceedings conducted in the ordinary course of business. Although we can give no assurance about the outcome of pending legal and federal or state administrative proceedings and the effect such an outcome may have on us, management believes that any ultimate liability resulting from the outcome of such proceedings, to the extent not otherwise provided for or covered by insurance, will not have a material adverse effect on our consolidated financial position, results of operations or liquidity. Contingent Liability Recorded.Recorded We recognized expenses related to accrued and settled claims, complaints and fines of $9.3$0.4 million, $1.7$0.5 million and $0.7$9.3 million for the years 2012, 20112014, 2013 and 2010,2012, respectively. These expenses are reported inGeneralwithin Operating costs and administrative expenses on the statementstatements of incomeoperations and reflect the items noted above and other various claims, complaints and complaints.fines. As of December 31, 20122014 and 2011,2013, we have recorded a liability of $1.3$0.1 million and $2.0$0.2 million, respectively, which is included inAccrued liabilities on the balance sheet,Consolidated Balance Sheets, for the loss contingencies matters that include the events described above and other minor environmental and litigation matters which we are addressing in the normal course of business. 103
W&T OFFSHORE, INC. AND SUBSIDIARIES NOTES TO CONSOLIDATED FINANCIAL STATEMENTS (Continued) 19. Selected Quarterly Financial Data – Data—UNAUDITED Unaudited quarterly financial data are as follows (in thousands, except per share amounts): | | | | | | | | | | | | | | | | | | | | 1st
Quarter | | | 2nd
Quarter | | | 3rd
Quarter | | | 4th
Quarter | | Year Ended December 31, 2012 | | | | | | | | | | | | | | | | | Revenues | | $ | 235,886 | | | $ | 215,513 | | | $ | 185,946 | | | $ | 237,146 | | Operating income | | | 15,913 | | | | 99,100 | | | | 7,560 | | | | 46,737 | | Net income (loss) | | | 3,218 | | | | 53,567 | | | | (1,471 | ) | | | 16,670 | | Basic and diluted earnings (loss) per common share (1) | | | 0.04 | | | | 0.70 | | | | (0.02 | ) | | | 0.21 | | Year Ended December 31, 2011 | | | | | | | | | | | | | | | | | Revenues | | $ | 210,855 | | | $ | 252,922 | | | $ | 245,371 | | | $ | 261,899 | | Operating income | | | 37,548 | | | | 115,643 | | | | 95,333 | | | | 80,936 | | Net income | | | 18,649 | | | | 55,175 | | | | 52,928 | | | | 46,065 | | Basic and diluted earnings per common share (1) | | | 0.25 | | | | 0.73 | | | | 0.70 | | | | 0.61 | |
| 1st Quarter | | | 2nd Quarter | | | 3rd Quarter | | | 4th Quarter | | Year Ended December 31, 2014 | | | | | | | | | | | | | | | | Revenues | $ | 254,516 | | | $ | 262,994 | | | $ | 234,521 | | | $ | 196,677 | | Operating income (loss) | | 37,225 | | | | 34,403 | | | | 20,983 | | | | (30,543 | ) | Net income (loss) | | 11,189 | | | | 9,837 | | | | 684 | | | | (33,371 | ) | Basic and diluted earnings (loss) per common share (1) | | 0.15 | | | | 0.13 | | | | 0.01 | | | | (0.44 | ) | Year Ended December 31, 2013 (2) | | | | | | | | | | | | | | | | Revenues | $ | 259,222 | | | $ | 235,383 | | | $ | 244,555 | | | $ | 244,928 | | Operating income | | 60,321 | | | | 53,823 | | | | 31,965 | | | | 622 | | Net income (loss) | | 26,618 | | | | 22,396 | | | | 14,194 | | | | (11,886 | ) | Basic and diluted earnings (loss) per common share (1) | | 0.35 | | | | 0.29 | | | | 0.19 | | | | (0.16 | ) |
(1) | The sum of the individual quarterly earnings per share may not agree with year-to-date earnings per share because each quarterly calculation is based on the income for that quarter and the weighted average number of shares outstanding during that quarter. |
(2) | In January 2014, we identified that we had been receiving an erroneous million British thermal unit (“MMBtu”) conversion factor from a third party that had the effect of understating natural gas production at our Viosca Knoll 783 field (Tahoe). The incorrect conversion factor had been used on all natural gas production from the field since we acquired it in 2011. The use of the incorrect conversion factor did not affect revenues, operating cash flows or royalty payments to the federal government but did impact reported natural gas production and the calculation of depletion expense. We performed an analysis of the information, assessing both quantitative and qualitative factors, and determined that the impact on our net income reported for prior annual periods, as well as the impact to our earnings trend, was not material to 2011 and 2012 results, thus the adjustment was recognized in the fourth quarter of 2013. |
| The fourth quarter of 2013 reflects a one-time increase in natural gas production volumes of 2.6 Bcf (with no corresponding increase in revenue) by using the correct conversion factor for the annual periods of 2011 and 2012, and the first three quarters of 2013, which increased DD&A by $7.1 million and decreased net income by $4.6 million. |
104
W&T OFFSHORE, INC. AND SUBSIDIARIES NOTES TO CONSOLIDATED FINANCIAL STATEMENTS (Continued) 20. Supplemental Guarantor Information Our payment obligations under the Company’s outstanding8.50% Senior Notes and the Credit Agreement (see Note 7) are fully and unconditionally guaranteed by certain of our wholly-owned100%-owned subsidiaries, W & T Energy VI, which includes the operations of the acquisitions closed in 2010 as described in Note 2,LLC and W&T & T Energy VII, LLC which does not have any active operations (together, the “Guarantor Subsidiaries”). W & T Energy VII, LLC does not currently have any active operations or contain any assets. Guarantees of the 8.50% Senior Notes will be released under certain circumstances, including: (1) in connection with any sale or other disposition of all or substantially all of the assets of a Guarantor Subsidiary (including by way of merger or consolidation) to a person that is not (either before or after giving W&T OFFSHORE, INC. AND SUBSIDIARIES
NOTES TO CONSOLIDATED FINANCIAL STATEMENTS (Continued)
effect to such transaction) the Company or a Restricted Subsidiary (as such term is defined in the indenture governing the Senior Notes) of the Company, if the sale or other disposition does not violate the “Asset Sales” provisions of the indenture;
(2) in connection with any sale or other disposition of the capital stock of such Guarantor Subsidiary to a person that is not (either before or after giving effect to such transaction) the Company or a Restricted Subsidiary of the Company, if the sale or other disposition does not violate the “Asset Sales” provisions of the indenture and the Guarantor Subsidiary ceases to be a subsidiary of the Company as a result of such sales or disposition;
(3) if such Guarantor Subsidiary is a Restricted Subsidiary and the Company designates such Guarantor Subsidiary as an Unrestricted Subsidiary in accordance with the applicable provisions of the indenture;
(4) upon Legal Defeasance or Covenant Defeasance (as such terms are defined in the indenture) or upon satisfaction and discharge of the indenture;
(5) upon the liquidation or dissolution of such Guarantor Subsidiary, provided no event of default has occurred and is continuing; or
(6) at such time as such Guarantor Subsidiary is no longer required to be a Guarantor Subsidiary of the Senior Notes as described in the indenture, provided no event of default has occurred and is continuing.
W&T OFFSHORE, INC. AND SUBSIDIARIES
NOTES TO CONSOLIDATED FINANCIAL STATEMENTS (Continued)
| in connection with any sale or other disposition of all or substantially all of the assets of a Guarantor Subsidiary (including by way of merger or consolidation) to a person that is not (either before or after giving effect to such transaction) the Company or a Restricted Subsidiary (as such term is defined in the indenture governing the 8.50% Senior Notes) of the Company, if the sale or other disposition does not violate the “Asset Sales” provisions of the indenture; |
(2) | in connection with any sale or other disposition of the capital stock of such Guarantor Subsidiary to a person that is not (either before or after giving effect to such transaction) the Company or a Restricted Subsidiary of the Company, if the sale or other disposition does not violate the “Asset Sales” provisions of the indenture and the Guarantor Subsidiary ceases to be a subsidiary of the Company as a result of such sales or disposition; |
(3) | if such Guarantor Subsidiary is a Restricted Subsidiary and the Company designates such Guarantor Subsidiary as an Unrestricted Subsidiary in accordance with the applicable provisions of the indenture; |
(4) | upon Legal Defeasance or Covenant Defeasance (as such terms are defined in the indenture) or upon satisfaction and discharge of the indenture; |
(5) | upon the liquidation or dissolution of such Guarantor Subsidiary, provided no event of default has occurred and is continuing; or |
(6) | at such time as such Guarantor Subsidiary is no longer required to be a Guarantor Subsidiary of the 8.50% Senior Notes as described in the indenture, provided no event of default has occurred and is continuing. |
The following condensed consolidating financial information presents the financial condition, results of operations and cash flows of W&T Offshore, Inc. (the “Parent Company”)the Parent Company and the Guarantor Subsidiaries, together with consolidating adjustments necessary to present the Company’s results on a consolidated basis. Transfers of property, including related ARO and deferred income tax liabilities, were made from the Parent Company to the Guarantor Subsidiaries to assist the Parent Company to continue to qualify for a waiver of certain supplemental bonding requirements from the BOEM. As these transfers were transactions between entities under common control, the prior period financial information has been retrospectively adjusted for comparability purposes, as prescribed under authoritative guidance. The condensed consolidating financial information for current and prior periods was adjusted as if all transfers occurred at the beginning of the period presented. None of the above adjustments had any effect on the consolidated results for the current or prior periods presented. 105
W&T OFFSHORE, INC. AND SUBSIDIARIES NOTES TO CONSOLIDATED FINANCIAL STATEMENTS (Continued) Condensed Consolidating Balance Sheet as of December 31, 20122014 | | | | | | | | | | | | | | Consolidated | | | | | | | | | | | Parent | | | Guarantor | | | | | | | W&T | | | | | Parent
Company | | Guarantor
Subsidiaries | | Eliminations | | Consolidated
W&T
Offshore, Inc. | | Company | | | Subsidiaries | | | Eliminations | | | Offshore, Inc. | | | | | (In thousands) | | (In thousands) | | | Assets | | | | | | | | | | | | | | | | | | | | | | | | Current assets: | | | | | | | | | | | | | | | | | | | | | | | | Cash and cash equivalents | | $ | 12,245 | | | $ | — | | | $ | — | | | $ | 12,245 | | $ | 23,666 | | | $ | — | | | $ | — | | | $ | 23,666 | | Receivables: | | | | | | | | | | | | | | | | | | | | | | | | Oil and natural gas sales | | | 80,729 | | | | 17,004 | | | | — | | | | 97,733 | | | 41,820 | | | | 25,422 | | | | — | | | | 67,242 | | Joint interest and other | | | 56,439 | | | | — | | | | — | | | | 56,439 | | | 142,885 | | | | — | | | | (99,240 | ) | | | 43,645 | | Income taxes | | | 163,750 | | | | — | | | | (115,866 | ) | | | 47,884 | | | | | | | | | | | | | | | | | Total receivables | | | 300,918 | | | | 17,004 | | | | (115,866 | ) | | | 202,056 | | | 184,705 | | | | 25,422 | | | | (99,240 | ) | | | 110,887 | | Deferred income taxes | | | 267 | | | | — | | | | — | | | | 267 | | | 9,797 | | | | 1,865 | | | | — | | | | 11,662 | | Prepaid expenses and other assets | | | 25,555 | | | | — | | | | — | | | | 25,555 | | | 28,728 | | | | 7,619 | | | | — | | | | 36,347 | | | | | | | | | | | | | | | | Total current assets | | | 338,985 | | | | 17,004 | | | | (115,866 | ) | | | 240,123 | | | 246,896 | | | | 34,906 | | | | (99,240 | ) | | | 182,562 | | Property and equipment – at cost: | | | | | | | | | | | | | | | | | | | | | | | | Oil and natural gas properties and equipment | | | 6,356,529 | | | | 337,981 | | | | — | | | | 6,694,510 | | | 6,038,915 | | | | 2,006,751 | | | | — | | | | 8,045,666 | | Furniture, fixtures and other | | | 21,786 | | | | — | | | | — | | | | 21,786 | | | 23,269 | | | | — | | | | — | | | | 23,269 | | | | | | | | | | | | | | | | Total property and equipment | | | 6,378,315 | | | | 337,981 | | | | — | | | | 6,716,296 | | | 6,062,184 | | | | 2,006,751 | | | | — | | | | 8,068,935 | | Less accumulated depreciation, depletion and amortization | | | 4,461,886 | | | | 193,955 | | | | — | | | | 4,655,841 | | | 4,442,899 | | | | 1,132,179 | | | | — | | | | 5,575,078 | | | | | | | | | | | | | | | | Net property and equipment | | | 1,916,429 | | | | 144,026 | | | | — | | | | 2,060,455 | | | 1,619,285 | | | | 874,572 | | | | — | | | | 2,493,857 | | Restricted deposits for asset retirement obligations | | | 28,466 | | | | — | | | | — | | | | 28,466 | | | 15,444 | | | | — | | | | — | | | | 15,444 | | Deferred income taxes | | | — | | | | 13,509 | | | | (13,509 | ) | | | — | | | Other assets | | | 442,540 | | | | 393,499 | | | | (816,096 | ) | | | 19,943 | | | 974,049 | | | | 349,912 | | | | (1,306,717 | ) | | | 17,244 | | | | | | | | | | | | | | | | Total assets | | $ | 2,726,420 | | | $ | 568,038 | | | $ | (945,471 | ) | | $ | 2,348,987 | | $ | 2,855,674 | | | $ | 1,259,390 | | | $ | (1,405,957 | ) | | $ | 2,709,107 | | | | | | | | | | | | | | | | | Liabilities and Shareholders’ Equity | | | | | | | | | | | | | | | | | | | | | | | | Current liabilities: | | | | | | | | | | | | | | | | | | | | | | | | Accounts payable | | $ | 123,792 | | | $ | 93 | | | $ | — | | | $ | 123,885 | | $ | 188,654 | | | $ | 5,455 | | | $ | — | | | $ | 194,109 | | Undistributed oil and natural gas proceeds | | | 36,791 | | | | 282 | | | | — | | | | 37,073 | | | 36,130 | | | | 879 | | | | — | | | | 37,009 | | Asset retirement obligations | | | 92,595 | | | | — | | | | 35 | | | | 92,630 | | | 30,711 | | | | 5,292 | | | | — | | | | 36,003 | | Accrued liabilities | | | 20,755 | | | | — | | | | — | | | | 20,755 | | | 17,437 | | | | 99,180 | | | | (99,240 | ) | | | 17,377 | | Income taxes | | | — | | | | 116,132 | | | | (115,866 | ) | | | 266 | | | | | | | | | | | | | | | | | Total current liabilities | | | 273,933 | | | | 116,507 | | | | (115,831 | ) | | | 274,609 | | | 272,932 | | | | 110,806 | | | | (99,240 | ) | | | 284,498 | | Long-term debt | | | 1,087,611 | | | | — | | | | — | | | | 1,087,611 | | | Long-term debt, less current maturities | | | 1,360,057 | | | | — | | | | — | | | | 1,360,057 | | Asset retirement obligations, less current portion | | | 262,524 | | | | 28,934 | | | | (35 | ) | | | 291,423 | | | 235,876 | | | | 118,689 | | | | — | | | | 354,565 | | Deferred income taxes | | | 158,758 | | | | — | | | | (13,509 | ) | | | 145,249 | | | 59,616 | | | | 127,372 | | | | — | | | | 186,988 | | Other liabilities | | | 402,407 | | | | — | | | | (393,499 | ) | | | 8,908 | | | 417,885 | | | | — | | | | (404,194 | ) | | | 13,691 | | Commitments and contingencies | | | | | | | | | | Shareholders’ equity: | | | | | | | | | | | | | | | | | | | | | | | | Common stock | | | 1 | | | | — | | | | — | | | | 1 | | | 1 | | | | — | | | | — | | | | 1 | | Additional paid-in capital | | | 396,186 | | | | 231,759 | | | | (231,759 | ) | | | 396,186 | | | 414,580 | | | | 703,440 | | | | (703,440 | ) | | | 414,580 | | Retained earnings | | | 169,167 | | | | 190,838 | | | | (190,838 | ) | | | 169,167 | | | 118,894 | | | | 199,083 | | | | (199,083 | ) | | | 118,894 | | Treasury stock, at cost | | | (24,167 | ) | | | — | | | | — | | | | (24,167 | ) | | (24,167 | ) | | | — | | | | — | | | | (24,167 | ) | | | | | | | | | | | | | | | Total shareholders’ equity | | | 541,187 | | | | 422,597 | | | | (422,597 | ) | | | 541,187 | | | 509,308 | | | | 902,523 | | | | (902,523 | ) | | | 509,308 | | | | | | | | | | | | | | | | Total liabilities and shareholders’ equity | | $ | 2,726,420 | | | $ | 568,038 | | | $ | (945,471 | ) | | $ | 2,348,987 | | $ | 2,855,674 | | | $ | 1,259,390 | | | $ | (1,405,957 | ) | | $ | 2,709,107 | | | | | | | | | | | | | | | |
106
W&T OFFSHORE, INC. AND SUBSIDIARIES NOTES TO CONSOLIDATED FINANCIAL STATEMENTS (Continued) Condensed Consolidating Balance Sheet as of December 31, 20112013 | | | | | | | | | | | | | | Consolidated | | | | | | | | | | | Parent | | | Guarantor | | | | | | | W&T | | | | | Parent
Company | | Guarantor
Subsidiaries | | Eliminations | | Consolidated
W&T
Offshore, Inc. | | Company | | | Subsidiaries | | | Eliminations | | | Offshore, Inc. | | | | | (In thousands) | | (In thousands) | | | Assets | | | | | | | | | | | | | | | | | | | | | | | | Current assets: | | | | | | | | | | | | | | | | | | | | | | | | Cash and cash equivalents | | $ | 4,512 | | | $ | — | | | $ | — | | | $ | 4,512 | | $ | 15,800 | | | $ | — | | | $ | — | | | $ | 15,800 | | Receivables: | | | | | | | | | | | | | | | | | | | | | | | | Oil and natural gas sales | | | 78,131 | | | | 20,419 | | | | — | | | | 98,550 | | | 61,373 | | | | 35,379 | | | | — | | | | 96,752 | | Joint interest and other | | | 25,089 | | | | — | | | | — | | | | 25,089 | | | 123,595 | | | | — | | | | (92,491 | ) | | | 31,104 | | Insurance | | | 715 | | | | — | | | | — | | | | 715 | | | Income taxes | | | 74,183 | | | | — | | | | (74,183 | ) | | | — | | | | | | | | | | | | | | | | | Total receivables | | | 178,118 | | | | 20,419 | | | | (74,183 | ) | | | 124,354 | | | 184,968 | | | | 35,379 | | | | (92,491 | ) | | | 127,856 | | Deferred income taxes | | | 2,007 | | | | — | | | | — | | | | 2,007 | | | 584 | | | | - | | | | — | | | | 584 | | Prepaid expenses and other assets | | | 30,315 | | | | — | | | | — | | | | 30,315 | �� | | 23,090 | | | | 6,272 | | | | — | | | | 29,362 | | | | | | | | | | | | | | | | Total current assets | | | 214,952 | | | | 20,419 | | | | (74,183 | ) | | | 161,188 | | | 224,442 | | | | 41,651 | | | | (92,491 | ) | | | 173,602 | | Property and equipment – at cost: | | | | | | | | | | | | | | | | | | | | | | | | Oil and natural gas properties and equipment | | | 5,689,535 | | | | 269,481 | | | | — | | | | 5,959,016 | | | 5,667,389 | | | | 1,671,708 | | | | — | | | | 7,339,097 | | Furniture, fixtures and other | | | 19,500 | | | | — | | | | — | | | | 19,500 | | | 21,431 | | | | — | | | | — | | | | 21,431 | | | | | | | | | | | | | | | | Total property and equipment | | | 5,709,035 | | | | 269,481 | | | | — | | | | 5,978,516 | | | 5,688,820 | | | | 1,671,708 | | | | — | | | | 7,360,528 | | Less accumulated depreciation, depletion and amortization | | | 4,208,825 | | | | 111,585 | | | | — | | | | 4,320,410 | | | 4,166,359 | | | | 918,345 | | | | — | | | | 5,084,704 | | | | | | | | | | | | | | | | Net property and equipment | | | 1,500,210 | | | | 157,896 | | | | — | | | | 1,658,106 | | | 1,522,461 | | | | 753,363 | | | | — | | | | 2,275,824 | | Restricted deposits for asset retirement obligations | | | 33,462 | | | | — | | | | — | | | | 33,462 | | | 37,421 | | | | — | | | | — | | | | 37,421 | | Deferred income taxes | | | — | | | | 17,637 | | | | (17,637 | ) | | | — | | | Other assets | | | 372,572 | | | | 275,181 | | | | (631,584 | ) | | | 16,169 | | | 951,203 | | | | 479,820 | | | | (1,410,568 | ) | | | 20,455 | | | | | | | | | | | | | | | | Total assets | | $ | 2,121,196 | | | $ | 471,133 | | | $ | (723,404 | ) | | $ | 1,868,925 | | $ | 2,735,527 | | | $ | 1,274,834 | | | $ | (1,503,059 | ) | | $ | 2,507,302 | | | | | | | | | | | | | | | | | Liabilities and Shareholders’ Equity | | | | | | | | | | | | | | | | | | | | | | | | Current liabilities: | | | | | | | | | | | | | | | | | | | | | | | | Accounts payable | | $ | 73,333 | | | $ | 2,538 | | | $ | — | | | $ | 75,871 | | $ | 144,492 | | | $ | 720 | | | $ | — | | | $ | 145,212 | | Undistributed oil and natural gas proceeds | | | 33,391 | | | | 341 | | | | — | | | | 33,732 | | | 41,735 | | | | 372 | | | | — | | | | 42,107 | | Asset retirement obligations | | | 138,185 | | | | — | | | | — | | | | 138,185 | | | 65,329 | | | | 12,456 | | | | — | | | | 77,785 | | Accrued liabilities | | | 29,705 | | | | — | | | | — | | | | 29,705 | | | 28,000 | | | | 92,491 | | | | (92,491 | ) | | | 28,000 | | Income taxes | | | — | | | | 84,575 | | | | (74,183 | ) | | | 10,392 | | | | | | | | | | | | | | | | | Total current liabilities | | | 274,614 | | | | 87,454 | | | | (74,183 | ) | | | 287,885 | | | 279,556 | | | | 106,039 | | | | (92,491 | ) | | | 293,104 | | Long-term debt | | | 717,000 | | | | — | | | | — | | | | 717,000 | | | Long-term debt, less current maturities | | | 1,205,421 | | | | — | | | | — | | | | 1,205,421 | | Asset retirement obligations, less current portion | | | 228,419 | | | | 27,276 | | | | — | | | | 255,695 | | | 189,507 | | | | 87,130 | | | | — | | | | 276,637 | | Deferred income taxes | | | 76,518 | | | | — | | | | (17,637 | ) | | | 58,881 | | | 79,424 | | | | 98,718 | | | | — | | | | 178,142 | | Other liabilities | | | 280,071 | | | | — | | | | (275,181 | ) | | | 4,890 | | | 441,009 | | | | — | | | | (427,621 | ) | | | 13,388 | | Commitments and contingencies | | | | | | | | | | Shareholders’ equity: | | | | | | | | | | | | | | | | | | | | | | | | Common stock | | | 1 | | | | — | | | | — | | | | 1 | | | 1 | | | | — | | | | — | | | | 1 | | Additional paid-in capital | | | 386,920 | | | | 231,759 | | | | (231,759 | ) | | | 386,920 | | | 403,564 | | | | 784,104 | | | | (784,104 | ) | | | 403,564 | | Retained earnings | | | 181,820 | | | | 124,644 | | | | (124,644 | ) | | | 181,820 | | | 161,212 | | | | 198,843 | | | | (198,843 | ) | | | 161,212 | | Treasury stock, at cost | | | (24,167 | ) | | | — | �� | | | — | | | | (24,167 | ) | | (24,167 | ) | | | — | | | | — | | | | (24,167 | ) | | | | | | | | | | | | | | | Total shareholders’ equity | | | 544,574 | | | | 356,403 | | | | (356,403 | ) | | | 544,574 | | | 540,610 | | | | 982,947 | | | | (982,947 | ) | | | 540,610 | | | | | | | | | | | | | | | | Total liabilities and shareholders’ equity | | $ | 2,121,196 | | | $ | 471,133 | | | $ | (723,404 | ) | | $ | 1,868,925 | | $ | 2,735,527 | | | $ | 1,274,834 | | | $ | (1,503,059 | ) | | $ | 2,507,302 | | | | | | | | | | | | | | | |
107
W&T OFFSHORE, INC. AND SUBSIDIARIES NOTES TO CONSOLIDATED FINANCIAL STATEMENTS (Continued) Condensed Consolidating Statement of IncomeOperations for the Twelve MonthsYear Ended December 31, 20122014 | | | | | | | | | | | | | | Consolidated | | | | | | | | | | | Parent | | | Guarantor | | | | | | | W&T | | | | | Parent
Company | | Guarantor
Subsidiaries | | | Eliminations | | Consolidated
W&T
Offshore, Inc. | | Company | | | Subsidiaries | | | Eliminations | | | Offshore, Inc. | | | | | (In thousands) | | (In thousands) | | Revenues | | $ | 659,203 | | | $ | 215,288 | | | $ | — | | | $ | 874,491 | | $ | 592,460 | | | $ | 356,248 | | | $ | — | | | $ | 948,708 | | | | | | | | | | | | | | | | Operating costs and expenses: | | | | | | | | | | | | | | | | | | | | | | | | Lease operating expenses | | | 209,581 | | | | 22,679 | | | | — | | | | 232,260 | | | 179,344 | | | | 85,407 | | | | — | | | | 264,751 | | Production taxes | | | 5,840 | | | | — | | | | — | | | | 5,840 | | | 7,932 | | | | — | | | | — | | | | 7,932 | | Gathering and transportation | | | 11,703 | | | | 3,175 | | | | — | | | | 14,878 | | | 11,712 | | | | 8,109 | | | | — | | | | 19,821 | | Depreciation, depletion and amortization | | | 253,807 | | | | 82,370 | | | | — | | | | 336,177 | | | Asset retirement obligation accretion | | | 17,463 | | | | 2,592 | | | | — | | | | 20,055 | | | Depreciation, depletion, amortization and accretion | | | 276,636 | | | | 213,833 | | | | — | | | | 490,469 | | Asset retirement obligations accretion | | | 10,981 | | | | 9,652 | | | | — | | | | 20,633 | | General and administrative expenses | | | 79,424 | | | | 2,593 | | | | — | | | | 82,017 | | | 48,084 | | | | 38,915 | | | | — | | | | 86,999 | | Derivative loss | | | 13,954 | | | | — | | | | — | | | | 13,954 | | | | | | | | | | | | | | | | | Derivative gain | | | (3,965 | ) | | | — | | | | — | | | | (3,965 | ) | Total costs and expenses | | | 591,772 | | | | 113,409 | | | | — | | | | 705,181 | | | 530,724 | | | | 355,916 | | | | — | | | | 886,640 | | | | | | | | | | | | | | | | Operating income | | | 67,431 | | | | 101,879 | | | | — | | | | 169,310 | | | 61,736 | | | | 332 | | | | — | | | | 62,068 | | Earnings of affiliates | | | 66,195 | | | | — | | | | (66,195 | ) | | | — | | | 240 | | | | — | | | | (240 | ) | | | — | | Interest expense: | | | | | | | | | | | | | | | | | | | | | | | | Incurred | | | 63,268 | | | | — | | | | — | | | | 63,268 | | | 84,460 | | | | 2,462 | | | | — | | | | 86,922 | | Capitalized | | | (13,274 | ) | | | — | | | | — | | | | (13,274 | ) | | (6,064 | ) | | | (2,462 | ) | | | — | | | | (8,526 | ) | Other income | | | 215 | | | | — | | | | — | | | | 215 | | | | | | | | | | | | | | | | | Income before income tax expense | | | 83,847 | | | | 101,879 | | | | (66,195 | ) | | | 119,531 | | | Income tax expense | | | 11,863 | | | | 35,684 | | | | — | | | | 47,547 | | | | | | | | | | | | | | | | | Net income | | $ | 71,984 | | | $ | 66,195 | | | $ | (66,195 | ) | | $ | 71,984 | | | | | | | | | | | | | | | | | Other income, net | | | 208 | | | | — | | | | — | | | | 208 | | Income (loss) before income tax expense (benefit) | | | (16,212 | ) | | | 332 | | | | (240 | ) | | | (16,120 | ) | Income tax expense (benefit) | | | (4,551 | ) | | | 92 | | | | — | | | | (4,459 | ) | Net income (loss) | | $ | (11,661 | ) | | $ | 240 | | | $ | (240 | ) | | $ | (11,661 | ) |
108
W&T OFFSHORE, INC. AND SUBSIDIARIES NOTES TO CONSOLIDATED FINANCIAL STATEMENTS (Continued) Condensed Consolidating Statement of IncomeOperations for the Twelve MonthsYear Ended December 31, 20112013 | | | | | | | | | | | | | | Consolidated | | | | | | | | | | | Parent | | | Guarantor | | | | | | | W&T | | | | | Parent
Company | | Guarantor
Subsidiaries | | | Eliminations | | Consolidated
W&T
Offshore, Inc. | | Company | | | Subsidiaries | | | Eliminations | | | Offshore, Inc. | | | | | (In thousands) | | (In thousands) | | Revenues | | $ | 697,899 | | | $ | 273,148 | | | $ | — | | | $ | 971,047 | | $ | 631,267 | | | $ | 352,821 | | | $ | — | | | $ | 984,088 | | | | | | | | | | | | | | | | Operating costs and expenses: | | | | | | | | | | | | | | | | | | | | | | | | Lease operating expenses | | | 182,165 | | | | 37,041 | | | | — | | | | 219,206 | | | 202,096 | | | | 68,743 | | | | — | | | | 270,839 | | Production taxes | | | 4,275 | | | | — | | | | — | | | | 4,275 | | | 7,135 | | | | — | | | | — | | | | 7,135 | | Gathering and transportation | | | 12,676 | | | | 4,244 | | | | — | | | | 16,920 | | | 9,248 | | | | 8,262 | | | | — | | | | 17,510 | | Depreciation, depletion and amortization | | | 214,740 | | | | 84,275 | | | | — | | | | 299,015 | | | Asset retirement obligation accretion | | | 26,947 | | | | 2,824 | | | | — | | | | 29,771 | | | Depreciation, depletion, amortization and accretion | | | 236,600 | | | | 194,011 | | | | — | | | | 430,611 | | Asset retirement obligations accretion | | | 14,218 | | | | 6,700 | | | | | | | | 20,918 | | General and administrative expenses | | | 71,714 | | | | 2,582 | | | | — | | | | 74,296 | | | 44,040 | | | | 37,834 | | | | — | | | | 81,874 | | Derivative gain | | | (1,896 | ) | | | — | | | | — | | | | (1,896 | ) | | | | | | | | | | | | | | | | Derivative loss | | | 8,470 | | | | — | | | | — | | | | 8,470 | | Total costs and expenses | | | 510,621 | | | | 130,966 | | | | — | | | | 641,587 | | | 521,807 | | | | 315,550 | | | | — | | | | 837,357 | | | | | | | | | | | | | | | | Operating income | | | 187,278 | | | | 142,182 | | | | — | | | | 329,460 | | | 109,460 | | | | 37,271 | | | | — | | | | 146,731 | | Earnings of affiliates | | | 92,533 | | | | — | | | | (92,533 | ) | | | — | | | 24,400 | | | | — | | | | (24,400 | ) | | | — | | Interest expense: | | | | | | | | | | | | | | | | | | | | | | | | Incurred | | | 52,393 | | | | — | | | | — | | | | 52,393 | | | 82,570 | | | | 3,069 | | | | — | | | | 85,639 | | Capitalized | | | (9,877 | ) | | | — | | | | — | | | | (9,877 | ) | | (6,989 | ) | | | (3,069 | ) | | | — | | | | (10,058 | ) | Loss on extinguishment of debt | | | 22,694 | | | | — | | | | — | | | | 22,694 | | | Other income | | | 84 | | | | — | | | | — | | | | 84 | | | | | | | | | | | | | | | | | Other income, net | | | 8,946 | | | | — | | | | — | | | | 8,946 | | Income before income tax expense | | | 214,685 | | | | 142,182 | | | | (92,533 | ) | | | 264,334 | | | 67,225 | | | | 37,271 | | | | (24,400 | ) | | | 80,096 | | Income tax expense | | | 41,868 | | | | 49,649 | | | | — | | | | 91,517 | | | 15,903 | | | | 12,871 | | | | — | | | | 28,774 | | | | | | | | | | | | | | | | Net income | | $ | 172,817 | | | $ | 92,533 | | | $ | (92,533 | ) | | $ | 172,817 | | $ | 51,322 | | | $ | 24,400 | | | $ | (24,400 | ) | | $ | 51,322 | | | | | | | | | | | | | | | |
109
W&T OFFSHORE, INC. AND SUBSIDIARIES NOTES TO CONSOLIDATED FINANCIAL STATEMENTS (Continued) Condensed Consolidating Statement of IncomeOperations for the Twelve MonthsYear Ended December 31, 20102012 | | | | | | | | | | | | | | Consolidated | | | | | | | | | | | Parent | | | Guarantor | | | | | | | W&T | | | | | Parent
Company | | Guarantor
Subsidiaries (1) | | | Eliminations | | Consolidated
W&T
Offshore, Inc. | | Company | | | Subsidiaries | | | Eliminations | | | Offshore, Inc. | | | | | (In thousands) | | (In thousands) | | Revenues | | $ | 608,600 | | | $ | 97,183 | | | $ | — | | | $ | 705,783 | | $ | 539,958 | | | $ | 334,533 | | | $ | — | | | $ | 874,491 | | | | | | | | | | | | | | | | Operating costs and expenses: | | | | | | | | | | | | | | | | | | | | | | | | Lease operating expenses | | | 152,534 | | | | 17,136 | | | | — | | | | 169,670 | | | 168,033 | | | | 64,227 | | | | — | | | | 232,260 | | Production taxes | | | 1,194 | | | | — | | | | — | | | | 1,194 | | | 5,840 | | | | — | | | | — | | | | 5,840 | | Gathering and transportation | | | 15,338 | | | | 1,146 | | | | — | | | | 16,484 | | | 10,197 | | | | 4,681 | | | | — | | | | 14,878 | | Depreciation, depletion and amortization | | | 241,105 | | | | 27,310 | | | | — | | | | 268,415 | | | Asset retirement obligation accretion | | | 25,122 | | | | 563 | | | | — | | | | 25,685 | | | Depreciation, depletion, amortization and accretion | | | 187,039 | | | | 149,138 | | | | — | | | | 336,177 | | Asset retirement obligations accretion | | | 14,979 | | | | 5,076 | | | | | | | | 20,055 | | General and administrative expenses | | | 51,662 | | | | 1,628 | | | | — | | | | 53,290 | | | 45,260 | | | | 36,757 | | | | — | | | | 82,017 | | Derivative loss | | | 4,256 | | | | — | | | | — | | | | 4,256 | | | 13,954 | | | | — | | | | — | | | | 13,954 | | | | | | | | | | | | | | | | Total costs and expenses | | | 491,211 | | | | 47,783 | | | | — | | | | 538,994 | | | 445,302 | | | | 259,879 | | | | — | | | | 705,181 | | | | | | | | | | | | | | | | Operating income | | | 117,389 | | | | 49,400 | | | | — | | | | 166,789 | | | 94,656 | | | | 74,654 | | | | — | | | | 169,310 | | Earnings of affiliates | | | 32,110 | | | | — | | | | (32,110 | ) | | | — | | | 49,799 | | | | — | | | | (49,799 | ) | | | — | | Interest expense: | | | | | | | | | | | | | | | | | | | | | | | | Incurred | | | 43,101 | | | | — | | | | — | | | | 43,101 | | | 60,778 | | | | 2,490 | | | | — | | | | 63,268 | | Capitalized | | | (5,395 | ) | | | — | | | | — | | | | (5,395 | ) | | (10,784 | ) | | | (2,490 | ) | | | — | | | | (13,274 | ) | Other income | | | 710 | | | | — | | | | — | | | | 710 | | | | | | | | | | | | | | | | | Income before income tax expense (benefit) | | | 112,503 | | | | 49,400 | | | | (32,110 | ) | | | 129,793 | | | Income tax expense (benefit) | | | (5,389 | ) | | | 17,290 | | | | — | | | | 11,901 | | | | | | | | | | | | | | | | | Other income, net | | | 215 | | | | — | | | | — | | | | 215 | | Income before income tax expense | | | 94,676 | | | | 74,654 | | | | (49,799 | ) | | | 119,531 | | Income tax expense | | | 22,692 | | | | 24,855 | | | | — | | | | 47,547 | | Net income | | $ | 117,892 | | | $ | 32,110 | | | $ | (32,110 | ) | | $ | 117,892 | | $ | 71,984 | | | $ | 49,799 | | | $ | (49,799 | ) | | $ | 71,984 | | | | | | | | | | | | | | | |
(1) | Began operations on May 1, 2010. |
110
W&T OFFSHORE, INC. AND SUBSIDIARIES NOTES TO CONSOLIDATED FINANCIAL STATEMENTS (Continued) Condensed Consolidating Statement of Cash Flows for the Twelve MonthsYear Ended December 31, 20122014 | | | | | | | | | | | | | | Consolidated | | | | | | | | | | | Parent | | | Guarantor | | | | | | | W&T | | | | | Parent
Company | | Guarantor
Subsidiaries | | Eliminations | | Consolidated
W&T
Offshore, Inc. | | Company | | | Subsidiaries | | | Eliminations | | | Offshore, Inc. | | | | | (In thousands) | | (In thousands) | | Operating activities: | | | | | | | | | | | | | | | | | | | | | | | | Net income | | $ | 71,984 | | | $ | 66,195 | | | $ | (66,195 | ) | | $ | 71,984 | | | Adjustments to reconcile net income to net cash provided by operating activities: | | | | | | | | | | Net income (loss) | | $ | (11,661 | ) | | $ | 240 | | | $ | (240 | ) | | $ | (11,661 | ) | Adjustments to reconcile net income (loss) to net cash provided by operating activities: | | | | | | | | | | | | | | | | | Depreciation, depletion, amortization and accretion | | | 271,270 | | | | 84,962 | | | | — | | | | 356,232 | | | 287,617 | | | | 223,485 | | | | — | | | | 511,102 | | Amortization of debt issuance costs and premium | | | 2,575 | | | | — | | | | — | | | | 2,575 | | | 701 | | | | — | | | | — | | | | 701 | | Share-based compensation | | | 12,398 | | | | — | | | | — | | | | 12,398 | | | 14,744 | | | | — | | | | — | | | | 14,744 | | Derivative loss | | | 13,954 | | | | — | | | | — | | | | 13,954 | | | Cash payments on derivative settlements | | | (7,664 | ) | | | — | | | | — | | | | (7,664 | ) | | Derivative gain | | | (3,965 | ) | | | — | | | | — | | | | (3,965 | ) | Cash payments on derivative settlements, net | | | (5,318 | ) | | | — | | | | — | | | | (5,318 | ) | Deferred income taxes | | | 83,981 | | | | 4,128 | | | | — | | | | 88,109 | | | (32,456 | ) | | | 27,696 | | | | — | | | | (4,760 | ) | Earnings of affiliates | | | (66,195 | ) | | | — | | | | 66,195 | | | | — | | | (240 | ) | | | — | | | | 240 | | | | — | | Changes in operating assets and liabilities: | | | | | | | | | | | | | | | | | | | | | | | | Oil and natural gas receivables | | | (2,597 | ) | | | 3,415 | | | | — | | | | 818 | | | 19,553 | | | | 9,957 | | | | — | | | | 29,510 | | Joint interest and other receivables | | | (31,399 | ) | | | — | | | | — | | | | (31,399 | ) | | (4,255 | ) | | | — | | | | — | | | | (4,255 | ) | Insurance receivables | | | 2,576 | | | | — | | | | — | | | | 2,576 | | | Income taxes | | | (89,568 | ) | | | 31,557 | | | | — | | | | (58,011 | ) | | 30,747 | | | | (27,604 | ) | | | — | | | | 3,143 | | Prepaid expenses and other assets | | | 7,442 | | | | (118,320 | ) | | | 118,318 | | | | 7,440 | | | 25,555 | | | | 12,882 | | | | (23,425 | ) | | | 15,012 | | Asset retirement obligations | | | (112,199 | ) | | | (628 | ) | | | — | | | | (112,827 | ) | | Accounts payable and accrued liabilities | | | 40,530 | | | | (2,504 | ) | | | — | | | | 38,026 | | | Other liabilities | | | 119,244 | | | | — | | | | (118,318 | ) | | | 926 | | | | | | | | | | | | | | | | | Asset retirement obligation settlements | | | (57,253 | ) | | | (17,060 | ) | | | — | | | | (74,313 | ) | Accounts payable, accrued liabilities and other | | | 12,816 | | | | 5,242 | | | | 23,425 | | | | 41,483 | | Net cash provided by operating activities | | | 316,332 | | | | 68,805 | | | | — | | | | 385,137 | | | 276,585 | | | | 234,838 | | | | — | | | | 511,423 | | | | | | | | | | | | | | | | Investing activities: | | | | | | | | | | | | | | | | | | | | | | | | Acquisition of property interest in oil and natural gas properties | | | (205,550 | ) | | | — | | | | — | | | | (205,550 | ) | | (17,407 | ) | | | (54,827 | ) | | | — | | | | (72,234 | ) | Investment in oil and natural gas properties and equipment | | | (410,508 | ) | | | (68,805 | ) | | | — | | | | (479,313 | ) | | (312,044 | ) | | | (242,334 | ) | | | — | | | | (554,378 | ) | Proceeds from sales of oil and natural gas properties and equipment | | | 30,453 | | | | — | | | | — | | | | 30,453 | | | Purchases of furniture, fixtures, misc. sales and other | | | (3,031 | ) | | | — | | | | — | | | | (3,031 | ) | | | | | | | | | | | | | | | | Investment in subsidiary | | | (62,323 | ) | | | — | | | | 62,323 | | | | — | | Purchases of furniture, fixtures and other | | | (3,340 | ) | | | — | | | | — | | | | (3,340 | ) | Net cash used in investing activities | | | (588,636 | ) | | | (68,805 | ) | | | — | | | | (657,441 | ) | | (395,114 | ) | | | (297,161 | ) | | | 62,323 | | | | (629,952 | ) | | | | | | | | | | | | | | | Financing activities: | | | | | | | | | | | | | | | | | | | | | | | | Issuance of 8.50% Senior Notes | | | 318,000 | | | | — | | | | — | | | | 318,000 | | | Borrowings of long-term debt – revolving bank credit facility | | | 732,000 | | | | — | | | | — | | | | 732,000 | | | 556,000 | | | | — | | | | — | | | | 556,000 | | Repayments of long-term debt – revolving bank credit facility | | | (679,000 | ) | | | — | | | | — | | | | (679,000 | ) | | (399,000 | ) | | | — | | | | — | | | | (399,000 | ) | Debt issuance costs | | | (8,510 | ) | | | — | | | | — | | | | (8,510 | ) | | Dividends to shareholders | | | (82,832 | ) | | | — | | | | — | | | | (82,832 | ) | | (30,260 | ) | | | — | | | | — | | | | (30,260 | ) | Other | | | 379 | | | | — | | | | — | | | | 379 | | | (345 | ) | | | — | | | | — | | | | (345 | ) | | | | | | | | | | | | | | | Net cash provided by financing activities | | | 280,037 | | | | — | | | | — | | | | 280,037 | | | | | | | | | | | | | | | | | Investment from parent | | | — | | | | 62,323 | | | | (62,323 | ) | | | — | | Net cash provided in financing activities | | | 126,395 | | | | 62,323 | | | | (62,323 | ) | | | 126,395 | | Increase in cash and cash equivalents | | | 7,733 | | | | — | | | | — | | | | 7,733 | | | 7,866 | | | | — | | | | — | | | | 7,866 | | Cash and cash equivalents, beginning of period | | | 4,512 | | | | — | | | | — | | | | 4,512 | | | 15,800 | | | | — | | | | — | | | | 15,800 | | | | | | | | | | | | | | | | Cash and cash equivalents, end of period | | $ | 12,245 | | | $ | — | | | $ | — | | | $ | 12,245 | | $ | 23,666 | | | $ | — | | | $ | — | | | $ | 23,666 | | | | | | | | | | | | | | | |
111
W&T OFFSHORE, INC. AND SUBSIDIARIES NOTES TO CONSOLIDATED FINANCIAL STATEMENTS (Continued) Condensed Consolidating Statement of Cash Flows for the Twelve MonthsYear Ended December 31, 20112013 | | | | | | | | | | | | | | Consolidated | | | | | | | | | | | Parent | | | Guarantor | | | | | | | W&T | | | | | Parent
Company | | Guarantor
Subsidiaries | | Eliminations | | Consolidated
W&T
Offshore, Inc. | | Company | | | Subsidiaries | | | Eliminations | | | Offshore, Inc. | | | | | (In thousands) | | (In thousands) | | Operating activities: | | | | | | | | | | | | | | | | | | | | | | | | Net income | | $ | 172,817 | | | $ | 92,533 | | | $ | (92,533 | ) | | $ | 172,817 | | $ | 51,322 | | | $ | 24,400 | | | $ | (24,400 | ) | | $ | 51,322 | | Adjustments to reconcile net income to net cash provided by operating activities: | | | | | | | | | | | | | | | | | | | | | | | | Depreciation, depletion, amortization and accretion | | | 241,687 | | | | 87,099 | | | | — | | | | 328,786 | | | 250,818 | | | | 200,711 | | | | — | | | | 451,529 | | Amortization of debt issuance costs | | | 2,010 | | | | — | | | | — | | | | 2,010 | | | Loss on extinguishment of debt | | | 22,694 | | | | — | | | | — | | | | 22,694 | | | Amortization of debt issuance costs and premium | | | 1,645 | | | | — | | | | — | | | | 1,645 | | Share-based compensation | | | 9,710 | | | | — | | | | — | | | | 9,710 | | | 11,525 | | | | — | | | | — | | | | 11,525 | | Derivative gain | | | (1,896 | ) | | | — | | | | — | | | | (1,896 | ) | | Derivative loss | | | 8,470 | | | | — | | | | — | | | | 8,470 | | Cash payments on derivative settlements | | | (9,873 | ) | | | — | | | | — | | | | (9,873 | ) | | (8,589 | ) | | | — | | | | — | | | | (8,589 | ) | Deferred income taxes | | | 76,717 | | | | (14,882 | ) | | | — | | | | 61,835 | | | 7,564 | | | | 23,356 | | | | — | | | | 30,920 | | Earnings of affiliates | | | (92,533 | ) | | | — | | | | 92,533 | | | | — | | | (24,400 | ) | | | — | | | | 24,400 | | | | — | | Changes in operating assets and liabilities: | | | | | | | | | | | | | | | | | | | | | | | | Oil and natural gas receivables | | | (27,709 | ) | | | 9,070 | | | | — | | | | (18,639 | ) | | 6,182 | | | | (5,202 | ) | | | — | | | | 980 | | Joint interest and other receivables | | | 375 | | | | — | | | | — | | | | 375 | | | 34,257 | | | | — | | | | — | | | | 34,257 | | Insurance receivables | | | 20,771 | | | | — | | | | — | | | | 20,771 | | | Income taxes | | | (71,655 | ) | | | 64,531 | | | | — | | | | (7,124 | ) | | 54,813 | | | | (10,485 | ) | | | — | | | | 44,328 | | Prepaid expenses and other assets | | | (8,003 | ) | | | (228,020 | ) | | | 228,214 | | | | (7,809 | ) | | (25,329 | ) | | | (18,835 | ) | | | 34,120 | | | | (10,044 | ) | Asset retirement obligations | | | (59,958 | ) | | | — | | | | — | | | | (59,958 | ) | | (65,438 | ) | | | (16,105 | ) | | | — | | | | (81,543 | ) | Accounts payable and accrued liabilities | | | 8,589 | | | | (514 | ) | | | (194 | ) | | | 7,881 | | | Other liabilities | | | 227,918 | | | | — | | | | (228,020 | ) | | | (102 | ) | | | | | | | | | | | | | | | | Accounts payable, accrued liabilities and other | | | 59,961 | | | | 717 | | | | (34,120 | ) | | | 26,558 | | Net cash provided by operating activities | | | 511,661 | | | | 9,817 | | | | | | 521,478 | | | 362,801 | | | | 198,557 | | | | — | | | | 561,358 | | | | | | | | | | | | | | | | Investing activities: | | | | | | | | | | | | | | | | | | | | | | | | Acquisition of property interest in oil and natural gas properties | | | (437,247 | ) | | | — | | | | — | | | | (437,247 | ) | | — | | | | (82,424 | ) | | | — | | | | (82,424 | ) | Investment in oil and natural gas properties and equipment | | | (277,147 | ) | | | (4,632 | ) | | | — | | | | (281,779 | ) | | (349,804 | ) | | | (202,150 | ) | | | — | | | | (551,954 | ) | Investment in subsidiary | | | 5,185 | | | | — | | | | (5,185 | ) | | | — | | | (86,017 | ) | | | — | | | | 86,017 | | | | — | | Purchases of furniture, fixtures, misc. sales and other | | | (3,645 | ) | | | — | | | | — | | | | (3,645 | ) | | | | | | | | | | | | | | | | Proceeds from sales of assets and other, net | | | 21,008 | | | | — | | | | — | | | | 21,008 | | Purchases of furniture, fixtures and other | | | (1,435 | ) | | | — | | | | — | | | | (1,435 | ) | Net cash used in investing activities | | | (712,854 | ) | | | (4,632 | ) | | | (5,185 | ) | | | (722,671 | ) | | (416,248 | ) | | | (284,574 | ) | | | 86,017 | | | | (614,805 | ) | | | | | | | | | | | | | | | Financing activities: | | | | | | | | | | | | | | | | | | | | | | | | Issuance of 8.50% Senior Notes | | | 600,000 | | | | — | | | | — | | | | 600,000 | | | Repurchase of 8.25% Senior Notes | | | (450,000 | ) | | | — | | | | — | | | | (450,000 | ) | | Borrowings of long-term debt – revolving bank credit facility | | | 623,000 | | | | — | | | | — | | | | 623,000 | | | 563,000 | | | | — | | | | — | | | | 563,000 | | Repayments of long-term debt – revolving bank credit facility | | | (506,000 | ) | | | — | | | | — | | | | (506,000 | ) | | (443,000 | ) | | | — | | | | — | | | | (443,000 | ) | Repurchase premium and debt issuance costs | | | (32,288 | ) | | | — | | | | — | | | | (32,288 | ) | | Debt issuance costs | | | (3,892 | ) | | | — | | | | — | | | | (3,892 | ) | Dividends to shareholders | | | (58,756 | ) | | | — | | | | — | | | | (58,756 | ) | | (58,846 | ) | | | — | | | | — | | | | (58,846 | ) | Investment from parent | | | — | | | | 86,017 | | | | (86,017 | ) | | | — | | Other | | | 1,094 | | | | — | | | | — | | | | 1,094 | | | (260 | ) | | | — | | | | — | | | | (260 | ) | Investment from parent | | | — | | | | (5,185 | ) | | | 5,185 | | | | — | | | | | | | | | | | | | | | | | Net cash provided by (used in) financing activities | | | 177,050 | | | | (5,185 | ) | | | 5,185 | | | | 177,050 | | | | | | | | | | | | | | | | | Decrease in cash and cash equivalents | | | (24,143 | ) | | | — | | | | — | | | | (24,143 | ) | | Net cash used in financing activities | | | 57,002 | | | | 86,017 | | | | (86,017 | ) | | | 57,002 | | Increase in cash and cash equivalents | | | 3,555 | | | | — | | | | — | | | | 3,555 | | Cash and cash equivalents, beginning of period | | | 28,655 | | | | — | | | | — | | | | 28,655 | | | 12,245 | | | | — | | | | — | | | | 12,245 | | | | | | | | | | | | | | | | Cash and cash equivalents, end of period | | $ | 4,512 | | | $ | — | | | $ | — | | | $ | 4,512 | | $ | 15,800 | | | $ | — | | | $ | — | | | $ | 15,800 | | | | | | | | | | | | | | | |
112
W&T OFFSHORE, INC. AND SUBSIDIARIES NOTES TO CONSOLIDATED FINANCIAL STATEMENTS (Continued) Condensed Consolidating Statement of Cash Flows for the Twelve MonthsYear Ended December 31, 20102012 | | | | | | | | | | | | | | Consolidated | | | | | | | | | | | Parent | | | Guarantor | | | | | | | W&T | | | | | Parent
Company | | Guarantor
Subsidiaries (1) | | Eliminations | | Consolidated
W&T
Offshore, Inc. | | Company | | | Subsidiaries | | | Eliminations | | | Offshore, Inc. | | | | | (In thousands) | | (In thousands) | | Operating activities: | | | | | | | | | | | | | | | | | | | | | | | | Net income | | $ | 117,892 | | | $ | 32,110 | | | $ | (32,110 | ) | | $ | 117,892 | | $ | 71,984 | | | $ | 49,799 | | | $ | (49,799 | ) | | $ | 71,984 | | Adjustments to reconcile net income to net cash provided by operating activities: | | | | | | | | | | | | | | | | | | | | | | | | Depreciation, depletion, amortization and accretion | | | 266,227 | | | | 27,873 | | | | — | | | | 294,100 | | | 202,018 | | | | 154,214 | | | | — | | | | 356,232 | | Amortization of debt issuance costs | | | 1,338 | | | | — | | | | — | | | | 1,338 | | | Amortization of debt issuance costs and premium | | | 2,575 | | | | — | | | | — | | | | 2,575 | | Share-based compensation | | | 5,533 | | | | — | | | | — | | | | 5,533 | | | 12,398 | | | | — | | | | — | | | | 12,398 | | Derivative loss | | | 4,256 | | | | — | | | | — | | | | 4,256 | | | 13,954 | | | | — | | | | — | | | | 13,954 | | Cash payments on derivative settlements | | | 874 | | | | — | | | | — | | | | 874 | | | (7,664 | ) | | | — | | | | — | | | | (7,664 | ) | Deferred income taxes | | | (5,511 | ) | | | (2,755 | ) | | | — | | | | (8,266 | ) | | 81,653 | | | | 6,456 | | | | — | | | | 88,109 | | Earnings of affiliates | | | (32,110 | ) | | | — | | | | 32,110 | | | | — | | | (49,799 | ) | | | — | | | | 49,799 | | | | — | | Changes in operating assets and liabilities: | | | | | | | | | | | | | | | | | | | | | | | | Oil and natural gas receivables | | | 4,556 | | | | (29,489 | ) | | | — | | | | (24,933 | ) | | (3,783 | ) | | | 4,601 | | | | — | | | | 818 | | Joint interest and other receivables | | | 25,897 | | | | — | | | | — | | | | 25,897 | | | (28,823 | ) | | | — | | | | — | | | | (28,823 | ) | Insurance receivables | | | 54,873 | | | | — | | | | — | | | | 54,873 | | | Income taxes | | | 84,023 | | | | 20,044 | | | | — | | | | 104,067 | | | (76,411 | ) | | | 18,400 | | | | — | | | | (58,011 | ) | Prepaid expenses and other assets | | | 4,536 | | | | (47,160 | ) | | | 47,160 | | | | 4,536 | | | 9,017 | | | | (119,895 | ) | | | 118,318 | | | | 7,440 | | Asset retirement obligations | | | (87,166 | ) | | | — | | | | — | | | | (87,166 | ) | | (105,773 | ) | | | (7,054 | ) | | | — | | | | (112,827 | ) | Accounts payable and accrued liabilities | | | (35,278 | ) | | | 3,393 | | | | — | | | | (31,885 | ) | | Other liabilities | | | 50,816 | | | | — | | | | (47,160 | ) | | | 3,656 | | | | | | | | | | | | | | | | | Accounts payable, accrued liabilities and other | | | 159,774 | | | | (2,504 | ) | | | (118,318 | ) | | | 38,952 | | Net cash provided by operating activities | | | 460,756 | | | | 4,016 | | | | — | | | | 464,772 | | | 281,120 | | | | 104,017 | | | | — | | | | 385,137 | | | | | | | | | | | | | | | | Investing activities: | | | | | | | | | | | | | | | | | | | | | | | | Acquisition of property interest in oil and natural gas properties | | | — | | | | (236,944 | ) | | | — | | | | (236,944 | ) | | (151,429 | ) | | | (54,121 | ) | | | — | | | | (205,550 | ) | Investment in oil and natural gas properties and equipment | | | (174,693 | ) | | | (4,016 | ) | | | — | | | | (178,709 | ) | | (375,296 | ) | | | (104,017 | ) | | | — | | | | (479,313 | ) | Proceeds from sales of oil and natural gas properties and equipment | | | 1,420 | | | | — | | | | — | | | | 1,420 | | | Investment in subsidiary | | | (236,944 | ) | | | — | | | | 236,944 | | | | — | | | (54,121 | ) | | | — | | | | 54,121 | | | | — | | Proceeds from sales of assets and other, net | | | 30,453 | | | | — | | | | — | | | | 30,453 | | Purchases of furniture, fixtures and other | | | (760 | ) | | | — | | | | — | | | | (760 | ) | | (3,031 | ) | | | — | | | | — | | | | (3,031 | ) | | | | | | | | | | | | | | | Net cash used in investing activities | | | (410,977 | ) | | | (240,960 | ) | | | 236,944 | | | | (414,993 | ) | | (553,424 | ) | | | (158,138 | ) | | | 54,121 | | | | (657,441 | ) | | | | | | | | | | | | | | | Financing activities: | | | | | | | | | | | | | | | | | | | | | | | | Borrowings of revolving bank credit facility | | | 627,500 | | | | — | | | | — | | | | 627,500 | | | Repayments of revolving bank credit facility | | | (627,500 | ) | | | — | | | | — | | | | (627,500 | ) | | Issuance of 8.50% Senior Notes | | | 318,000 | | | | — | | | | — | | | | 318,000 | | Borrowings of long-term debt – revolving bank credit facility | | | 732,000 | | | | — | | | | — | | | | 732,000 | | Repayments of long-term debt – revolving bank credit facility | | | (679,000 | ) | | | — | | | | — | | | | (679,000 | ) | Debt issuance costs | | | (8,510 | ) | | | — | | | | — | | | | (8,510 | ) | Dividends to shareholders | | | (59,609 | ) | | | — | | | | — | | | | (59,609 | ) | | (82,832 | ) | | | — | | | | — | | | | (82,832 | ) | Investment from parent | | | — | | | | 54,121 | | | | (54,121 | ) | | | — | | Other | | | 298 | | | | — | | | | — | | | | 298 | | | 379 | | | | — | | | | — | | | | 379 | | Investment from parent | | | — | | | | 236,944 | | | | (236,944 | ) | | | — | | | | | | | | | | | | | | | | | Net cash provided by (used in) financing activities | | | (59,311 | ) | | | 236,944 | | | | (236,944 | ) | | | (59,311 | ) | | | | | | | | | | | | | | | | Decrease in cash and cash equivalents | | | (9,532 | ) | | | — | | | | — | | | | (9,532 | ) | | Net cash used in financing activities | | | 280,037 | | | | 54,121 | | | | (54,121 | ) | | | 280,037 | | Increase in cash and cash equivalents | | | 7,733 | | | | — | | | | — | | | | 7,733 | | Cash and cash equivalents, beginning of period | | | 38,187 | | | | — | | | | — | | | | 38,187 | | | 4,512 | | | | — | | | | — | | | | 4,512 | | | | | | | | | | | | | | | | Cash and cash equivalents, end of period | | $ | 28,655 | | | $ | — | | | $ | — | | | $ | 28,655 | | $ | 12,245 | | | $ | — | | | $ | — | | | $ | 12,245 | | | | | | | | | | | | | | | |
(1) | Began operations on May 1, 2010. |
113
W&T OFFSHORE, INC. AND SUBSIDIARIES NOTES TO CONSOLIDATED FINANCIAL STATEMENTS (Continued) 21. Supplemental Oil and Gas Disclosures – Disclosures—UNAUDITED Geographic Area of Operation All of our proved reserves are located within the United States, with a majority of those reserves located in the Gulf of Mexico and a minority located in Texas. Therefore, the following disclosures about our costs incurred, results of operations and proved reserves are on a total-company basis. Capitalized Costs Net capitalized costs related to our oil, NGLs and natural gas producing activities are as follows (in millions): | | | | December 31, | | December 31, | | | | | 2012 | | 2011 | | 2010 | | 2014 | | | 2013 | | | 2012 | | Net capitalized cost: | | | | | | | | | | | | | | | | | | Proved oil and natural gas properties and equipment | | $ | 6,551.5 | | | $ | 5,775.4 | | | $ | 5,130.9 | | $ | 7,924.2 | | | $ | 7,207.1 | | | $ | 6,551.5 | | Unproved oil and natural gas properties and equipment | | | 143.0 | | | | 183.6 | | | | 94.7 | | | 121.5 | | | | 132.0 | | | | 143.0 | | Accumulated depreciation, depletion and amortization related to oil, NGLs and natural gas activities | | | (4,640.8 | ) | | | (4,307.1 | ) | | | (4,009.9 | ) | | (5,557.6 | ) | | | (5,069.2 | ) | | | (4,640.8 | ) | | | | | | | | | | | | Net capitalized costs related to producing activities | | $ | 2,053.7 | | | $ | 1,651.9 | | | $ | 1,215.7 | | $ | 2,488.1 | | | $ | 2,269.9 | | | $ | 2,053.7 | | | | | | | | | | | | |
Costs Not Subject To Amortization Costs not subject to amortization relate to unproved properties which are excluded from amortizable capital costs until it is determined that proved reserves can be assigned to such properties or until such time as the Company has made an evaluation that impairment has occurred. Subject to industry conditions, evaluation of most of these properties is expected to be completed within one to five years. The following table provides a summary of costs that are not being amortized as of December 31, 2012,2014, by the year in which the costs were incurred (in millions): | | | | Total | | | 2012 | | | 2011 | | | 2010 | | | Prior to
2010 | | Total | | | 2014 | | | 2013 | | | 2012 | | | Prior to 2012 | | Costs excluded by year incurred: | | | | | | | | | | | | | | | | | | | | | | | | | | | | | | Acquisition costs | | $ | 99.8 | | | $ | 13.1 | | | $ | 67.4 | | | $ | — | | | $ | 19.3 | | $ | 75.5 | | | $ | 2.6 | | | $ | 5.7 | | | $ | 7.0 | | | $ | 60.2 | | Capitalized interest not subject to amortization | | | 23.7 | | | | 9.1 | | | | 6.1 | | | | 2.1 | | | | 6.4 | | | 34.3 | | | | 7.5 | | | | 7.3 | | | | 6.4 | | | | 13.1 | | | | | | | | | | | | | | | | | | | Total costs not subject to amortization | | $ | 123.5 | | | $ | 22.2 | | | $ | 73.5 | | | $ | 2.1 | | | $ | 25.7 | | $ | 109.8 | | | $ | 10.1 | | | $ | 13.0 | | | $ | 13.4 | | | $ | 73.3 | | | | | | | | | | | | | | | | | | |
114
W&T OFFSHORE, INC. AND SUBSIDIARIES NOTES TO CONSOLIDATED FINANCIAL STATEMENTS (Continued)
Costs Incurred In Oil and Gas Property Acquisition, Exploration and Development Activities The following costs were incurred in oil and gas acquisition, exploration, and development activities (in millions): | | | | | | | | | | | | | | | | Year Ended December 31, | | | | | 2012 | | | 2011 | | | 2010 | | Costs incurred (1): | | | | | | | | | | | | | Proved property acquisitions | | $ | 239.8 | | | $ | 369.9 | | | $ | 277.3 | | Exploration (2) (3) | | | 151.3 | | | | 92.7 | | | | 70.8 | | Development | | | 363.7 | | | | 203.7 | | | | 158.3 | | Unproved property acquisitions (4) | | | 26.5 | | | | 95.1 | | | | 19.7 | | | | | | | | | | | | | | | Total costs incurred in oil and gas property acquisition, exploration and development activities | | $ | 781.3 | | | $ | 761.4 | | | $ | 526.1 | | | | | | | | | | | | | | |
| December 31, | | | 2014 | | | 2013 | | | 2012 | | Costs incurred: (1) | | | | | | | | | | | | Proved properties acquisitions | $ | 111.5 | | | $ | 96.9 | | | $ | 239.8 | | Exploration (2) (3) | | 411.1 | | | | 215.3 | | | | 151.3 | | Development | | 198.7 | | | | 352.9 | | | | 363.7 | | Unproved properties acquisitions (4) | | 3.1 | | | | 26.3 | | | | 26.5 | | Total costs incurred in oil and gas property acquisition, exploration and development activities | $ | 724.4 | | | $ | 691.4 | | | $ | 781.3 | |
(1) | Includes net additions (reductions) to ourfrom capitalized ARO of $88.0 million, $50.6 million and $86.9 million $32.8 millionduring 2014, 2013 and $106.1 million during 2012, 2011 and 2010, respectively, associated with acquisitions, liabilities incurred and revisions of estimates. Refer to Note 5. |
(2) | Includes seismic costs of $6.2$9.0 million, $8.0$8.9 million and $5.8$6.2 million incurred during 2014, 2013 and 2012, 2011 and 2010, respectively. |
(3) | Includes geological and geophysical costs charged to expense of $7.3 million, $5.9 million and $6.2 million $6.8 millionduring 2014, 2013 and $4.3 million during 2012, 2011 and 2010, respectively. |
(4) | The amounts for 2012, 2011 and 2010unproved property acquisitions include capitalized interest associated with unproved properties classified as unproved at December 31, 2012, 2011 and 2010, respectively.acquired during the period. |
Depreciation, depletion, amortization and accretion expense The following table presents our depreciation, depletion, amortization and accretion expense per million cubic feetbarrel equivalent (“Mcfe”Boe”) of products sold. | Year Ended December 31, | | | 2014 | | | 2013 | | | 2012 | | Depreciation, depletion, amortization and accretion per Boe | $ | 28.98 | | | $ | 25.10 | | | $ | 20.79 | |
| | | | | | | | | | | | | | | | Year Ended December 31, | | | | | 2012 | | | 2011 | | | 2010 | | Depreciation, depletion, amortization and accretion per Mcfe | | $ | 3.47 | | | $ | 3.24 | | | $ | 3.38 | |
Oil and Natural Gas Reserve Information There are numerous uncertainties in estimating quantities of proved reserves and in providing the future rates of production and timing of development expenditures. The following reserve information represent estimates only and are inherently imprecise and may be subject to substantial revisions as additional information such as reservoir performance, additional drilling, technological advancements and other factors become available. Decreases in the prices of oil, NGLs and natural gas could have an adverse effect on the carrying value of our proved reserves, reserve volumes and our revenues, profitability and cash flow. We are not the operator with respect to approximately 14%11% of our proved developed non-producing reserves, so we may not be in a position to control the timing of all development activities. W&T OFFSHORE, INC. AND SUBSIDIARIES
NOTES TO CONSOLIDATED FINANCIAL STATEMENTS (Continued)
The following sets forth estimated quantities of our net proved, proved developed and proved undeveloped oil, NGLs and natural gas reserves. All of the reserves are located in the Unites States and the majority of the reserves arewith 69% located in the Gulf of Mexico.Mexico and the remainder located in the West Texas Permian Basin. These reserve estimates exclude insignificant royalties and interests owned by the Company due to the unavailability of such information. In addition to other criteria, estimated reserves are assessed for economically viability based on the unweighted average of first-day-of-the-month commodity prices over the period January through December for the year in accordance with definitions and guidelines set forth by the SEC and the FASB. The prices used do not purport, nor should it be interpreted, to present the current market prices related to our estimated oil and natural gas reserves. Actual future prices and costs may differ materially from those used in determining our proved reserves for the periods presented. The prices used are presented in the section below entitled “Standardized Measure of Discounted Future Net Cash Flows”. | | | | | | | | | | | | | | | | | | | | | | | | | | | | | | | | | Total Equivalent Reserves | | | | | Oil
(MMBbls) (1) | | | NGLs
(MMBbls) (1) | | | Natural Gas
(Bcf) (1) | | | Oil
Equivalent
(MMBoe) (2) | | | Natural Gas
Equivalent
(Bcfe) (2) | | Proved reserves as of December 31, 2009 | | | 31.2 | | | | 3.0 | | | | 165.8 | | | | 61.8 | | | | 371.0 | | Revisions of previous estimates (3) | | | (0.2 | ) | | | 1.2 | | | | 14.6 | | | | 3.4 | | | | 20.2 | | Extensions and discoveries (4) | | | 1.2 | | | | 0.5 | | | | 19.1 | | | | 4.9 | | | | 29.2 | | Purchase of minerals in place (5) | | | 7.7 | | | | 0.7 | | | | 101.5 | | | | 25.3 | | | | 152.0 | | Production | | | (5.9 | ) | | | (1.2 | ) | | | (44.7 | ) | | | (14.5 | ) | | | (87.0 | ) | | | | | | | | | | | | | | | | | | | | | | Proved reserves as of December 31, 2010 | | | 34.0 | | | | 4.2 | | | | 256.3 | | | | 80.9 | | | | 485.4 | | Revisions of previous estimates (6) | | | 0.8 | | | | 5.5 | | | | 13.5 | | | | 8.6 | | | | 51.1 | | Extensions and discoveries (7) | | | 2.0 | | | | 0.4 | | | | 17.7 | | | | 5.3 | | | | 32.0 | | Purchase of minerals in place (8) | | | 20.7 | | | | 8.9 | | | | 55.9 | | | | 39.0 | | | | 234.1 | | Production | | | (6.1 | ) | | | (1.9 | ) | | | (53.7 | ) | | | (16.9 | ) | | | (101.5 | ) | | | | | | | | | | | | | | | | | | | | | | Proved reserves as of December 31, 2011 | | | 51.4 | | | | 17.1 | | | | 289.7 | | | | 116.9 | | | | 701.1 | | Revisions of previous estimates (9) | | | (1.1 | ) | | | (2.6 | ) | | | (4.8 | ) | | | (4.6 | ) | | | (27.5 | ) | Extensions and discoveries (10) | | | 8.2 | | | | 2.6 | | | | 29.6 | | | | 15.7 | | | | 94.5 | | Purchase of minerals in place (11) | | | 2.5 | | | | 0.2 | | | | 25.5 | | | | 7.0 | | | | 42.0 | | Sales of reserves (12) | | | (0.2 | ) | | | — | | | | (1.1 | ) | | | (0.4 | ) | | | (2.2 | ) | Production | | | (6.0 | ) | | | (2.1 | ) | | | (53.8 | ) | | | (17.1 | ) | | | (102.8 | ) | | | | | | | | | | | | | | | | | | | | | | Proved reserves as of December 31, 2012 | | | 54.8 | | | | 15.2 | | | | 285.1 | | | | 117.5 | | | | 705.1 | | | | | | | | | | | | | | | | | | | | | | | Year-end proved developed reserves: | | | | | | | | | | | | | | | | | | | | | 2012 | | | 35.3 | | | | 11.0 | | | | 243.5 | | | | 86.9 | | | | 521.2 | | 2011 | | | 23.4 | | | | 11.0 | | | | 251.4 | | | | 76.4 | | | | 458.2 | | 2010 | | | 23.6 | | | | 3.4 | | | | 229.1 | | | | 65.2 | | | | 391.3 | | | | | | | | Year-end proved undeveloped reserves: | | | | | | | | | | | | | | | | | | | | | 2012 | | | 19.5 | | | | 4.2 | | | | 41.6 | | | | 30.6 | | | | 183.9 | | 2011 | | | 28.0 | | | | 6.1 | | | | 38.3 | | | | 40.5 | | | | 242.9 | | 2010 | | | 10.4 | | | | 0.8 | | | | 27.2 | | | | 15.7 | | | | 94.1 | |
115
W&T OFFSHORE, INC. AND SUBSIDIARIES NOTES TO CONSOLIDATED FINANCIAL STATEMENTS (Continued) | | | | | | | | | | | | | Total Energy Equivalent Reserves (1) | | | Oil (MMBbls) | | | NGLs (MMBbls) | | | Natural Gas (Bcf) | | | Oil Equivalent (MMBoe) | | | Natural Gas Equivalent (Bcfe) | | Proved reserves as of Dec. 31, 2011 | | 51.4 | | | | 17.1 | | | | 289.7 | | | | 116.9 | | | | 701.1 | | Revisions of previous estimates (2) | | (1.1 | ) | | | (2.6 | ) | | | (4.8 | ) | | | (4.6 | ) | | | (27.5 | ) | Extensions and discoveries (3) | | 8.2 | | | | 2.6 | | | | 29.6 | | | | 15.7 | | | | 94.5 | | Purchase of minerals in place (4) | | 2.5 | | | | 0.2 | | | | 25.5 | | | | 7.0 | | | | 42.0 | | Sales of reserves (5) | | (0.2 | ) | | | — | | | | (1.1 | ) | | | (0.4 | ) | | | (2.2 | ) | Production | | (6.0 | ) | | | (2.1 | ) | | | (53.8 | ) | | | (17.1 | ) | | | (102.8 | ) | Proved reserves as of Dec. 31, 2012 | | 54.8 | | | | 15.2 | | | | 285.1 | | | | 117.5 | | | | 705.1 | | Revisions of previous estimates (6) | | (4.3 | ) | | | 0.2 | | | | 2.1 | | | | (3.8 | ) | | | (22.8 | ) | Extensions and discoveries (7) | | 13.9 | | | | 2.6 | | | | 22.0 | | | | 20.2 | | | | 121.0 | | Purchase of minerals in place (8) | | 1.5 | | | | — | | | | 4.4 | | | | 2.3 | | | | 13.7 | | Sales of reserves (9) | | (0.4 | ) | | | — | | | | (0.4 | ) | | | (0.5 | ) | | | (3.2 | ) | Production | | (7.0 | ) | | | (2.1 | ) | | | (53.3 | ) | | | (18.0 | ) | | | (107.9 | ) | Proved reserves as of Dec. 31, 2013 | | 58.5 | | | | 15.9 | | | | 259.9 | | | | 117.7 | | | | 705.9 | | Revisions of previous estimates (10) | | 1.6 | | | | 0.1 | | | | 14.3 | | | | 4.1 | | | | 25.3 | | Extensions and discoveries (11) | | 7.3 | | | | 0.7 | | | | 10.1 | | | | 9.7 | | | | 58.1 | | Purchase of minerals in place (12) | | 1.5 | | | | 1.2 | | | | 20.7 | | | | 6.1 | | | | 36.5 | | Production | | (7.2 | ) | | | (2.1 | ) | | | (50.1 | ) | | | (17.6 | ) | | | (105.8 | ) | Proved reserves as of Dec. 31, 2014 | | 61.7 | | | | 15.8 | | | | 254.9 | | | | 120.0 | | | | 720.0 | | | | | | | | | | | | | | | | | | | | | | Year-end proved developed reserves: | | | | | | | | | | | | | | | | | | | | 2014 | | 35.7 | | | | 10.7 | | | | 221.1 | | | | 83.3 | | | | 499.7 | | 2013 | | 36.2 | | | | 11.1 | | | | 232.7 | | | | 86.1 | | | | 516.1 | | 2012 | | 35.3 | | | | 11.0 | | | | 243.5 | | | | 86.9 | | | | 521.2 | | | | | | | | | | | | | | | | | | | | | | Year-end proved undeveloped reserves: | | | | | | | | | | | | | | | | | | | | 2014 (13) | | 26.0 | | | | 5.1 | | | | 33.8 | | | | 36.7 | | | | 220.3 | | 2013 | | 22.3 | | | | 4.8 | | | | 27.2 | | | | 31.6 | | | | 189.8 | | 2012 | | 19.5 | | | | 4.2 | | | | 41.6 | | | | 30.6 | | | | 183.9 | |
(1)Volume measurements: | Estimated reserves as | | Bbl – barrel | | Mcf – thousand cubic feet | MMBbls – million barrels for crude oil, condensate or NGLs | | Bcf – billion cubic feet | MMBoe – million barrels of December 31, 2012, 2011, 2010 and 2009 are based on the unweighted averageoil equivalent | | Bcfe – billion cubic feet of first-day-of-the-month commodity prices over the period January through December for those years in accordance with current definitions and guidelines set forth by the SEC and the FASB.gas equivalent |
116
W&T OFFSHORE, INC. AND SUBSIDIARIES NOTES TO CONSOLIDATED FINANCIAL STATEMENTS (Continued) (2)(1) | The conversion to barrels of oil equivalent and cubic feet equivalent were determined using the energy-equivalent ratio of six Mcf of natural gas to one Bbl of crude oil, condensate or NGLs (totals may not compute due to rounding). The energy-equivalent ratio does not assume price equivalency, and the energy-equivalent prices for oil, NGLs and natural gas may differ significantly. |
(3)(2) | Includes revisions due to price of 17.5 Bcfe. |
(4) | Includes discoveries of 21.9 Bcfe primarily in the Main Pass 108, Main Pass 98 and Main Pass 283 fields and extensions of 7.2 Bcfe primarily in the Main Pass 283 field. |
(5) | Primarily due to the acquisition of the Total Properties and the Tahoe Properties. |
W&T OFFSHORE, INC. AND SUBSIDIARIES
NOTES TO CONSOLIDATED FINANCIAL STATEMENTS (Continued)
(6) | Includes revision of 6.3 Bcfe due to an increase in average prices; 16.5 Bcfe for a change in NGLs marketing arrangements; 11.3 Bcfe increase due to additional compression at our Tahoe field that increases production and ultimate recoveries; and 10.6 Bcfe at our Fairway field for revisions to reserve estimates from the acquisition date to year end. |
(7) | Includes discoveries of 13.9 Bcfe at our Main Pass 98 field and 8.0 Bcfe at our Ship Shoal 349/359 field and extensions of 3.7 Bcfe at our Main Pass 108 field. |
(8) | Primarily due to the acquisition of the Yellow Rose Properties and the Fairway Properties. |
(9) | Includes downward revisions due to price of 8.0 Bcfe1.3 MMBoe and negative performance revisions of 17.9 Bcfe3.0 MMBoe at our Yellow Rose Properties.Spraberry field. |
(10)(3) | Includes extensions and discoveries of 69.5 Bcfe11.6 MMBoe at our Yellow Rose PropertiesSpraberry field and extensions and discoveries of 16.2 Bcfe2.7 MMBoe at our High Island 21/22 field. |
(11)(4) | Due to the acquisition of the Newfield Properties. |
(12)(5) | Due to the sale of our interest in the South Timbalier 41 field. |
Volume measurements:
(6) | Includes upward revision due to price of 1.9 MMBoe; negative revisions of 4.9 MMBoe at our Spraberry field for performance and technical changes, 2.3 MMBoe at our High Island 21/22 field for performance, 1.3 MMBoe at our Ship Shoal 349/359 field for performance; and positive performance revisions of 0.7 MMBoe at our Main Pass 98 field, 0.7 MMBoe at our South Timbalier 314, 0.6 MMBoe at our Main Pass 108 field and 0.5 MMBoe our South Timbalier 176 field. |
(7) | Includes extensions and discoveries of 12.6 MMBoe at our Spraberry field, 4.2 MMBoe at our Ship Shoal 349 field and 1.9 MMBoe at our Mississippi Canyon 698 field. |
Mcf – thousand cubic feet(8) | Primarily due to the acquisition of the Callon Properties. |
(9) | Bbl – barrelPrimarily due to the sales of our non-working interests in the Green Canyon 60 field, the Green Canyon 19 field and the West Delta area block 29. |
Bcf – billion cubic feet(10) | Includes upwards revisions due to price of 0.3 MMBoe; positive revisions of 2.4 MMBoe at our Fairway field, 1.2 MMBoe at our Mississippi Canyon 800 field and 6.4 MMBoe at various fields; and negative revisions of 3.9 MMBoe at our Spraberry field and 2.4 MMBoe at various other fields. |
(11) | MMBbls – million barrels for crude oil, condensateIncludes extensions and discoveries of 4.1 MMBoe at our Spraberry field and 4.1 MMBoe at our Mississippi Canyon 782 field. |
(12) | Primarily due to acquiring additional ownership in the Fairway field and acquisition of the Woodside Properties. |
(13) | We believe that we will be able to develop all but 1.4 MMBoe of the reserves classified as proved undeveloped (“PUDs”), or NGLs | Bcfe – billion cubic feet equivalent | | approximately 96%, out of the total of 36.7 MMBoe – million barrelsclassified as PUDs at December 31, 2014, within five years from the date such reserves were initially recorded. The exception is at the Mississippi Canyon 243 field (Matterhorn) where the field is being developed using a single floating tension leg platform requiring an extended sequential development plan. The platform cannot support a rig that would allow additional wells to be drilled, but can support a rig to allow sidetracking of oil equivalentwells. These PUDs were originally recorded in our reserves as of December 31, 2010. The development of the 1.4 MMBoe of PUDs will be delayed until an existing well is depleted and available to sidetrack. Based on the latest reserve report, a well is expected to be drilled to develop the Mississippi Canyon 243 field (Matterhorn) PUDs in 2020. |
Standardized Measure of Discounted Future Net Cash Flows The following presents the standardized measure of discounted future net cash flows related to our proved oil and natural gas reserves together with changes therein, as defined by the FASB.therein. Future cash inflows represent expected revenues from production of period-end quantities of proved reserves based on the unweighted average of first-day-of-the-month commodity prices for December 31, 2012, 2011, 2010 and 2009.the periods presented. All prices are adjusted by leasefield for quality, transportation fees, energy content and regional price differentials. Due to the lack of a benchmark price for NGLs, a ratio is computed for each field of the NGLs realized price compared to the oil realized price. Then, this ratio is applied to the oil price using FASB/SEC guidance. The average commodity prices weighted by field production related to the proved reserves are as follows: | | | | | | | | | | | | | | | | | | | | December 31, | | | | | 2012 | | | 2011 | | | 2010 | | | 2009 | | Oil – per barrel | | $ | 98.13 | | | $ | 97.36 | | | $ | 76.28 | | | $ | 55.87 | | NGLs – per barrel | | | 47.30 | | | | 51.30 | | | | 44.92 | | | | 33.36 | | Natural gas – per Mcf | | | 2.77 | | | | 4.11 | | | | 4.57 | | | | 3.80 | |
| December 31, | | | 2014 | | | 2013 | | | 2012 | | | 2011 | | Oil - per barrel | $ | 91.12 | | | $ | 99.65 | | | $ | 98.13 | | | $ | 97.36 | | NGLs per barrel | | 34.63 | | | | 35.21 | | | | 47.30 | | | | 51.30 | | Natural gas - per Mcf | | 4.27 | | | | 3.80 | | | | 2.77 | | | | 4.11 | |
117
W&T OFFSHORE, INC. AND SUBSIDIARIES NOTES TO CONSOLIDATED FINANCIAL STATEMENTS (Continued) Future production, development costs and ARO are based on costs in effect at the end of each of the respective years with no escalations. Estimated future net cash flows, net of future income taxes, have been discounted to their present values based on a 10% annual discount rate. W&T OFFSHORE, INC. AND SUBSIDIARIES
NOTES TO CONSOLIDATED FINANCIAL STATEMENTS (Continued)
The standardized measure of discounted future net cash flows does not purport, nor should it be interpreted, to present the fair market value of our oil and natural gas reserves. These estimates reflect proved reserves only and ignore, among other things, future changes in prices and costs, revenues that could result from probable reserves which could become proved reserves in 20132014 or later years and the risks inherent in reserve estimates. The standardized measure of discounted future net cash flows relating to our proved oil and natural gas reserves is as follows (in thousands)millions): | | | | Year Ended December 31, | | Year Ended December 31, | | | | | 2012 | | 2011 | | 2010 | | 2014 | | | 2013 | | | 2012 | | Standardized Measure of Discounted Future Net Cash Flows | | | | | | | | | | | | | | | | | | Future cash inflows | | $ | 6,888,431 | | | $ | 7,077,206 | | | $ | 3,953,655 | | $ | 7,258.5 | | | $ | 7,376.7 | | | $ | 6,888.4 | | Future costs: | | | | | | | | | | | | | | | | | | Production | | | (1,858,282 | ) | | | (1,862,488 | ) | | | (1,011,552 | ) | | (2,224.5 | ) | | | (2,142.8 | ) | | | (1,858.3 | ) | Development | | | (655,406 | ) | | | (543,017 | ) | | | (243,570 | ) | | (922.0 | ) | | | (1,001.4 | ) | | | (655.4 | ) | Dismantlement and abandonment | | | (508,051 | ) | | | (513,620 | ) | | | (520,490 | ) | | (475.4 | ) | | | (441.6 | ) | | | (508.0 | ) | Income taxes | | | (1,002,127 | ) | | | (1,126,573 | ) | | | (495,696 | ) | | (948.4 | ) | | | (986.9 | ) | | | (1,002.1 | ) | | | | | | | | | | | | Future net cash inflows before 10% discount | | | 2,864,565 | | | | 3,031,508 | | | | 1,682,347 | | | 2,688.2 | | | | 2,804.0 | | | | 2,864.6 | | 10% annual discount factor | | | (1,018,188 | ) | | | (1,025,131 | ) | | | (503,275 | ) | | (985.4 | ) | | | (1,129.4 | ) | | | (1,018.2 | ) | | | | | | | | | | | | | | $ | 1,846,377 | | | $ | 2,006,377 | | | $ | 1,179,072 | | | | | | | | | | | | | | Total | | $ | 1,702.8 | | | $ | 1,674.6 | | | $ | 1,846.4 | |
| | | | | | | | | | | | | | | | Year Ended December 31, | | | | | 2012 | | | 2011 | | | 2010 | | Changes in Standardized Measure | | | | | | | | | | | | | Standardized measure, beginning of year | | $ | 2,006,377 | | | $ | 1,179,072 | | | $ | 660,396 | | Increases (decreases): | | | | | | | | | | | | | Sales and transfers of oil and gas produced, net of production costs | | | (620,437 | ) | | | (729,574 | ) | | | (521,551 | ) | Net changes in price, net of future production costs | | | (224,260 | ) | | | 634,174 | | | | 367,575 | | Extensions and discoveries, net of future production and development costs | | | 181,870 | | | | 219,924 | | | | 143,612 | | Changes in estimated future development costs | | | (103,320 | ) | | | (4,572 | ) | | | (59,124 | ) | Previously estimated development costs incurred | | | 332,939 | | | | 173,911 | | | | 97,188 | | Revisions of quantity estimates | | | (128,075 | ) | | | 204,988 | | | | 94,735 | | Accretion of discount | | | 231,144 | | | | 135,791 | | | | 68,862 | | Net change in income taxes | | | 99,684 | | | | (398,204 | ) | | | (221,226 | ) | Purchases of reserves in-place | | | 270,168 | | | | 483,286 | | | | 624,302 | | Sales of reserves in-place | | | (16,105 | ) | | | — | | | | — | | Changes in production rates due to timing and other | | | (183,608 | ) | | | 107,581 | | | | (75,697 | ) | | | | | | | | | | | | | | Net increase (decrease) in standardized measure | | | (160,000 | ) | | | 827,305 | | | | 518,676 | | | | | | | | | | | | | | | Standardized measure, end of year | | $ | 1,846,377 | | | $ | 2,006,377 | | | $ | 1,179,072 | | | | | | | | | | | | | | |
Item 9. | Changes in and Disagreements With Accountants on Accounting and Financial Disclosure |
| Year Ended December 31, | | | 2014 | | | 2013 | | | 2012 | | Changes in Standardized Measure | | | | | | | | | | | | Standardized measure, beginning of year | $ | 1,674.6 | | | $ | 1,846.4 | | | $ | 2,006.4 | | Increases (decreases): | | | | | | | | | | | | Sales and transfers of oil and gas produced, net of production costs | | (650.9 | ) | | | (686.1 | ) | | | (620.4 | ) | Net changes in price, net of future production costs | | (278.6 | ) | | | (65.2 | ) | | | (224.3 | ) | Extensions and discoveries, net of future production and development costs | | 309.6 | | | | 393.8 | | | | 181.9 | | Changes in estimated future development costs | | (56.4 | ) | | | (91.1 | ) | | | (103.3 | ) | Previously estimated development costs incurred | | 263.1 | | | | 262.1 | | | | 332.9 | | Revisions of quantity estimates | | 118.6 | | | | (91.6 | ) | | | (128.1 | ) | Accretion of discount | | 180.6 | | | | 202.2 | | | | 231.1 | | Net change in income taxes | | (11.4 | ) | | | 56.6 | | | | 99.7 | | Purchases of reserves in-place | | 86.7 | | | | 79.6 | | | | 270.2 | | Sales of reserves in-place | | — | | | | (53.1 | ) | | | (16.1 | ) | Changes in production rates due to timing and other | | 66.9 | | | | (179.0 | ) | | | (183.6 | ) | Net increase (decrease) in standardized measure | | 28.2 | | | | (171.8 | ) | | | (160.0 | ) | Standardized measure, end of year | $ | 1,702.8 | | | $ | 1,674.6 | | | $ | 1,846.4 | |
Item 9. Changes in and Disagreements With Accountants on Accounting and Financial Disclosure None. Item 9A. | Controls and Procedures |
Item 9A. Controls and Procedures Disclosure Controls and Procedures We have established disclosure controls and procedures designed to ensure that material information required to be disclosed in our reports filed or submitted under the Securities Exchange Act of 1934 is recorded, processed, summarized and reported within the time periods specified by the SECSEC’s rules and forms and that any material information relating to us is accumulated and communicated to our management, including our Chief Executive Officer and Chief Financial Officer, as appropriate to allow timely decisions regarding required disclosures. In designing and evaluating our disclosure controls and procedures, our management recognizes that controls and procedures, no matter how well designed and operated, can provide only reasonable assurance of achieving desired control objectives. In reaching a reasonable level of assurance, our management necessarily was required to apply its judgment in evaluating the cost-benefit relationship of possible controls and procedures. As required by Exchange Act Rule 13a-15(b), we performed an evaluation, under the supervision and with the participation of our management, including our Chief Executive Officer and Chief Financial Officer, of the effectiveness of the design and operation of our disclosure controls and procedures (as defined in Exchange Act Rules 13a-15(e) and 15d-15(e)) as of the end of the period covered by this report. Based on that evaluation, our Chief Executive Officer and Chief Financial Officer have each concluded that as of December 31, 20122014 our disclosure controls and procedures are effective to ensure that information we are required to disclose in reports filed or submitted under the Securities Exchange Act of 1934 is recorded, processed, summarized and reported within the time periods specified in the Securities and Exchange Commission’s rules and forms, and that our controls and procedures are designed to ensure that information required to be disclosed by us in such reports is accumulated and communicated to our management, including our Chief Executive Officer and Chief Financial Officer, as appropriate to allow timely decisions regarding required disclosure. Management’s Annual Report on Internal Control Over Financial Reporting Our management’s assessment of the effectiveness of our internal control over financial reporting as of December 31, 2012,2014, is set forth in “Management’s Report on Internal Control over Financial Reporting” included inunder Part II, Item 8 ofin this Form 10-K. Attestation Report of the Registered Public Accounting Firm The effectiveness of our internal control over financial reporting as of December 31, 2012,2014, has been audited by Ernst & Young LLP, an independent registered public accounting firm, as stated in their report, which is included inunder Part II, Item 8 ofin this Form 10-K. Changes in Internal Control Over Financial Reporting There have been no changes in our internal control over financial reporting that occurred during the quarterly period ended December 31, 20122014 that have materially affected, or are reasonably likely to materially affect, our internal control over financial reporting. Item 9B. | Other Information |
Item 9B. Other Information None. PART III
Item 10. | Directors, Executive Officers and Corporate Governance |
PART III Item 10. Directors, Executive Officers and Corporate Governance The information required by this item is incorporated by reference from our definitive proxy statement to be filed with the SEC within 120 days after the end of our fiscal year covered by this Form 10-K and to the information set forth following Item 3 of this report. Item 11. | Executive Compensation |
Item 11. Executive Compensation The information required by this item is incorporated by reference from our definitive proxy statement to be filed with the SEC within 120 days after the end of our fiscal year covered by this Form 10-K. Item 12. | Security Ownership of Certain Beneficial Owners and Management and Related Stockholder Matters |
Item 12. Security Ownership of Certain Beneficial Owners and Management and Related Stockholder Matters The information required by this item is incorporated by reference from our definitive proxy statement to be filed with the SEC within 120 days after the end of our fiscal year covered by this Form 10-K. Item 13. | Certain Relationships and Related Transactions, and Director Independence |
Item 13. Certain Relationships and Related Transactions, and Director Independence The information required by this item is incorporated by reference from our definitive proxy statement to be filed with the SEC within 120 days after the end of our fiscal year covered by this Form 10-K. Item 14. | Principal Accountant Fees and Services |
Item 14. Principal Accountant Fees and Services The information required by this item is incorporated by reference from our definitive proxy statement to be filed with the SEC within 120 days after the end of our fiscal year covered by this Form 10-K. PART IV
PART IV Item 15. Exhibits and Financial Statement Schedules (a) Documents filed as a part of this report: Item 15.1. | Exhibits and Financial Statement Schedules |
| (a) | Documents filed as a part of this report: |
| 1. | Financial Statements. See “Index to Consolidated Financial Statements” in Part II, Item 8 of this Form 10-K. |
All schedules are omitted because they are not applicable, not required or the required information is included in the consolidated financial statements or related notes. Exhibit
Number | Description | | | Exhibit
Number2.1
| | Description
| | | 2.1 | | Purchase and Sale Agreement, effective January 1, 2010, between Total E&P USA Inc. and W&T Offshore, Inc. (Incorporated by reference to Exhibit 2.1 to the Company’s Current Report on Form 8-K, filed on May 3, 2010 (File No. 001-32414)) | | | 2.2 | | Asset Purchase Agreement, dated November 3, 2010, between Shell Offshore, Inc., as Seller, and W&T Offshore, Inc. and W&T Energy VI, LLC, as Purchasers. (Incorporated by reference to Exhibit 2.1 to the Company’s Current Report on Form 8-K, filed November 9, 2010 (File No. 001-32414)) | | | 2.3 | | Purchase and Sale Agreement, dated April 25, 2011, between Opal Resources, LLC, Opal Resources Operating Company LLC, as Sellers, and W&T Offshore, Inc. (Incorporated by reference to Exhibit 2.1 of the Company’s Current Report on Form 8-K, filed May 13, 2011 (File No. 001-32414)) | | | 2.4 | | Purchase and Sale Agreement, dated September 17, 2012, between Newfield Exploration Company, Newfield Exploration Gulf Coast LLC, as Sellers, and W&T Offshore, Inc. (Incorporated by reference to Exhibit 2.1 of the Company’s Current Report on Form 8-K, filed October 12, 2012 (File No. 001-32414)) | 2.2 | | 2.5 | | First Amendment to Purchase and Sale Agreement, dated October 5, 2012, between Newfield Exploration Company, Newfield Exploration Gulf Coast LLC, as Sellers, and W&T Offshore, Inc. (Incorporated by reference to Exhibit 2.2 of the Company’s Current Report on Form 8-K, filed October 12, 2012 (File No. 001-32414)) | 2.3 | | Purchase and Sale Agreement, dated as of October 17, 2013, by and among Callon Petroleum Operating Company, as Seller, and W&T Offshore, Inc., as Buyer (Incorporated by reference to Exhibit 2.1 of the Company’s Current Report on Form 8-K, filed November 7, 2013 (File No. 001-32414)) | 3.1 | | Amended and Restated Articles of Incorporation of W&T Offshore, Inc. (Incorporated by reference to Exhibit 3.1 of the Company’s Current Report on Form 8-K, filed February 24, 2006 (File No. 001-32414)) | 3.2 | | 3.2 | | Amended and Restated Bylaws of W&T Offshore, Inc. (Incorporated by reference to Exhibit 3.2 of the Company’s Registration Statement on Form S-1, filed May 3, 2004 (File No. 333-115103)) | 3.3 | | 3.3 | | Certificate of Amendment to the Amended and Restated Articles of Incorporation of W&T Offshore, Inc. (Incorporated by reference to Exhibit 3.3 of the Company’s Quarterly Report on Form 10-Q, filed July 31, 2012 (File No. 001-32414)) | 4.1 | | 4.1 | | Specimen Common Stock Certificate. (Incorporated by reference to Exhibit 4.1 of the Company’s Registration Statement on Form S-1, filed May 3, 2004 (File No. 333-115103)) | 4.2 | | 4.2 | | Indenture, dated as of June 10, 2011, by and among W&T Offshore, Inc., the Guarantors named therein and Wells Fargo Bank, National Association, as trustee. (Incorporated by reference to Exhibit 4.1 of the Company’s Current Report on Form 8-K, filed June 15, 2011 (File No. 001-32414)) | 4.3 | | 4.3 | | First Supplemental Indenture, dated as of June 10, 2011, by and among W&T Offshore, Inc., the Guarantors named therein and Wells Fargo Bank, National Association, as trustee. (Incorporated by reference to Exhibit 4.1 of the Company’s Current Report on Form 8-K, filed June 15, 2011 (File No. 001-32414)) |
| | | Exhibit
Number4.4
| | Description
| | | 4.4 | | Form of 8.50% Senior Notes due 2019. (Incorporated by reference to Exhibit 4.3 of the Company’s Current Report on Form 8-K, filed June 15, 2011 (File No. 001-32414)) | 10.1* | | 4.5 | | Registration Rights Agreement, dated October 24, 2012, by and among W&T Offshore, Inc., the Guarantors named therein and Morgan Stanley & Co. LLC, as representative of the Initial Purchasers. (Incorporated by reference to Exhibit 4.1 of the Company’s Current Report on Form 8-K, filed October 25, 2012 (File No. 001-32414)) | | | 10.1* | | 2004 Directors Compensation Plan of W&T Offshore, Inc. (Incorporated by reference to Exhibit 10.11 of the Company’s Registration Statement on Form S-1, filed May 3, 2004 (File No. 333-115103)) | 10.2* | | 10.2* | | Indemnification and Hold Harmless Agreement by and between W&T Offshore, Inc. and Stephen L. Schroeder, dated July 5, 2006. (Incorporated by reference to Exhibit 10.2 of the Company’s Current Report on Form 8-K, filed July 12, 2006 (File No. 001-32414)) | 10.3* | | 10.3* | | Indemnification and Hold Harmless Agreement by and between W&T Offshore, Inc. and John D. Gibbons, dated as of February 26, 2007. (Incorporated by reference to Exhibit 10.2 of the Company’s Current Report on Form 8-K, filed February 26, 2007 (File No. 001-32414)) |
Exhibit
Number | | Description | 10.4* | | 10.4* | | Indemnification and Hold Harmless Agreement, dated September 24, 2008, by and between W&T Offshore, Inc. and Jamie L. Vazquez. (Incorporated by reference to Exhibit 10.4 of the Company’s Current Report on Form 8-K, filed September 26, 2008 (File No. 001-32414)) | 10.5* | | 10.5* | | W&T Offshore, Inc. Amended and Restated Incentive Compensation Plan. (Incorporated by reference from Appendix A to the Company’s Definitive Proxy Statement on Schedule 14A, filed April 2, 2010 (File No. 001-32414)) | 10.6* | | First Amendment to W&T Offshore, Inc. Amended and Restated Incentive Compensation Plan. (Incorporated by reference to Appendix A to the Company’s Definitive Proxy Statement on Schedule 14A filed April 3, 2013) | 10.6*10.7* | | Second Amendment to W&T Offshore, Inc. Amended and Restated Incentive Compensation Plan. (Incorporated by reference to Appendix B to the Company’s Definitive Proxy Statement on Schedule 14A filed April 3, 2013) | 10.8* | | Form of Employment Agreement for Executive Officers other than the Chief Executive Officer. (Incorporated by reference to Exhibit 10.1 of the Company’s Current Report on Form 8-K, filed August 6, 2010 (File No. 001-32414)) | 10.9* | | 10.7* | | Form of the Executive Annual Incentive Award Agreement for Fiscal Year 2010. (Incorporated by reference to Exhibit 10.5 to the Company’s Quarterly Report on Form 10-Q for the quarter ended September 30, 2010 (File No. 001-32414)) | | | 10.8* | | Form of the Executive Restricted Stock Unit Agreement. (Incorporated by reference to Exhibit 10.1 to the Company’s Quarterly Report on Form 10-Q for the quarter ended September 30, 2010 (File No. 001-32414)) | | | 10.9* | | Employment Agreement between W&T Offshore, Inc. and Tracy W. Krohn dated as of November 1, 2010. (Incorporated by reference to Exhibit 10.1 of the Company’s Current Report on Form 8-K, filed on November 5, 2010 (File No. 001-32414)) | | | 10.10* | | Form of Employment Agreement by and between W&T Offshore, Inc. and Jesus G. Melendrez. (Incorporated by reference to Exhibit 10.1 of the Company’s Current Report on Form 8-K, filed January 19, 2011 (File No. 001-32414)) | | | 10.11* | | Indemnification and Hold Harmless Agreement by and between W&T Offshore, Inc. and Jesus G. Melendrez, dated as of January 17, 2010. (Incorporated by reference to Exhibit 10.2 of the Company’s Current Report on Form 8-K, filed January 19, 2011 (File No. 001-32414)) | | | 10.12 | | Fourth Amended and Restated Credit Agreement, dated May 5, 2011, by and among W&T Offshore, Inc., Toronto Dominion (Texas) LLC, as agent and the various agents and lenders party thereto. (Incorporated by reference to Exhibit 10.1 of the Company’s Current Report on Form 8-K, filed May 6, 2011(File No. 001-32414)) |
| | | Exhibit
Number10.10*
| | Description
| | | 10.13* | | Form of the Executive Annual Incentive Award Agreement for Fiscal Year 2011. (Incorporated by reference to Exhibit 10.2 to the Company’s Quarterly Report on Form 10-Q for the quarter ended September 30, 2011 (File No. 001-32414)) | | | 10.14* | | Form of Indemnification and Hold Harmless Agreement between W&T Offshore, Inc. and each of its directors. (Incorporated by reference to Exhibit 10.1 to the Company’s Annual Report on Form 10-K for the year ended December 31, 2011 (File No. 001-32414)) | 10.11* | | 10.15 | | First Amendment to the Fourth Amended and Restated Credit Agreement, dated May 7, 2012, by and among W&T Offshore, Inc., Toronto Dominion (Texas) LLC, as agent and the various agents and lenders party thereto. (Incorporated by reference to Exhibit 10.1 of the Company’s Current Report on Form 8-K, filed May 10, 2012 (File No. 001-32414)) | | | 10.16* | | Form of Executive Restricted Stock Unit Agreement as of April 26, 2012. (Incorporated by reference to Exhibit 10.2 of the Company’s Quarterly Report on Form 10-Q, filed July 31, 2012 (File No. 001-32414)) | | | 10.17* | | Form of Employment Agreement by and between W&T Offshore, Inc. and Thomas P. MurphyMurphy. (Incorporated by reference to Exhibit 10.1 to the Company’s Current Report on Form 8-K, filed August 6, 2010 (File No. 001-32414)) | 10.12* | | 10.18* | | Indemnification and Hold Harmless Agreement by and between W&T Offshore, Inc. and Thomas P. Murphy, dated as of June 19, 2012. (Incorporated by reference to Exhibit 10.2 of the Company’s Current Report on Form 8-K, filed June 22, 2012 (File No. 001-32414)) | 10.13* | | Form of 2013 Executive Annual Incentive Award Agreement. (Incorporated by reference to Exhibit 10.3 of the Company’s Quarterly Report on Form 10-Q, filed August 8, 2013 (File No. 001-32414)) | 10.1910.14* | | Second AmendmentForm of 2013 Executive Restricted Stock Unit Agreement. (Incorporated by reference to Exhibit 10.4 of the FourthCompany’s Quarterly Report on Form 10-Q, filed August 8, 2013 (File No. 001-32414)) | 10.15* | | Form of 2013 Executive Time Based Restricted Stock Unit Agreement. (Incorporated by reference to Exhibit 10.5 of the Company’s Quarterly Report on Form 10-Q, filed August 8, 2013 (File No. 001-32414)) | 10.16* | | Tracy W. Krohn Executive Annual Incentive Award Agreement for Fiscal 2013. (Incorporated by reference to Exhibit 10.6 of the Company’s Quarterly Report on Form 10-Q, filed August 8, 2013 (File No. 001-32414)) | 10.17 | | Fifth Amended and Restated Credit Agreement, dated effective as of October 12, 2012,November 8, 2013, by and among W&T Offshore, Inc., Toronto Dominion (Texas) LLC, as agent and the various agents and lenders party thereto. (Incorporated by reference to Exhibit 10.1 of the Company’s Current Report on Form 8-K, filed October 17, 2012November 13, 2013 (File No. 001-32414)) | 10.18* | | Form of Executive Annual Incentive Agreement for Fiscal 2014. (Incorporated by reference to Exhibit 10.1 of the Company’s Quarterly Report on Form 10-Q, filed May 8, 2014 (File No. 001-32414)) | 10.19* | | Form of 2014 Executive Restricted Stock Unit Agreement. (Incorporated by reference to Exhibit 10.2 of the Company’s Quarterly Report on Form 10-Q, filed May 8, 2014 (File No. 001-32414)) | 10.20* | | Tracy W. Krohn Executive Annual Incentive Agreement for Fiscal 2014. (Incorporated by reference to Exhibit 10.3 of the Company’s Quarterly Report on Form 10-Q, filed May 8, 2014 (File No. 001-32414)) | 12.1** | | Ratio of Earnings to Fixed Charges |
Exhibit
Number | | Description | 14.1 | | 14.1 | | W&T Offshore, Inc. Code of Business Conduct and Ethics (as amended). (Incorporated by reference to Exhibit 14.1 of the Company’s Current Report on Form 8-K, filed November 17, 2005) | 21.1** | | 21.1** | | Subsidiaries of the Registrant. | 23.1** | | 23.1** | | Consent of Ernst & Young LLP, Independent Registered Public Accounting Firm. | 23.2** | | 23.2** | | Consent of Netherland, Sewell & Associates, Inc., Independent Petroleum Engineers and Geologists. | 31.1** | | 31.1** | | Rule 13a-14(a)/15d-14(a) Certification of Chief Executive Officer. | 31.2** | | 31.2** | | Rule 13a-14(a)/15d-14(a) Certification of Chief Financial Officer. | 32.1** | | 32.1** | | Certification of Chief Executive Officer and Chief Financial Officer of W&T Offshore, Inc. pursuant to 18 U.S.C. § 1350. | 99.1** | | 99.1** | | Report of Netherland, Sewell & Associates, Inc., Independent Petroleum Engineers and Geologists. | 101.INS** | | 101.INS** | | XBRL Instance Document. | 101.SCH** | | 101.SCH** | | XBRL Schema Document. | 101.CAL** | | 101.CAL** | | XBRL Calculation Linkbase Document |
| | | Exhibit
Number101.DEF**
| | Description
| | | 101.DEF** | | XBRL Definition Linkbase Document. | 101.LAB** | | 101.LAB** | | XBRL Label Linkbase Document. | 101.PRE** | | 101.PRE** | | XBRL Presentation Linkbase Document. |
* | Management Contract or Compensatory Plan or Arrangement. |
** | Filed or furnished herewith. |
GLOSSARY OF OIL AND NATURAL GAS TERMS The following are abbreviations and definitions of terms commonly used in the oil and natural gas industry that are used in this report. AcquisitionsAcquisitions. Refers to acquisitions, mergers or exercise of preferential rights of purchase. BblBbl. One stock tank barrel or 42 U.S. gallons liquid volume. BcfBcf. Billion cubic feet. BcfeBcfe. One billion cubic feet equivalent, determined using an energy-equivalent ratio of six Mcf of natural gas to one Bbl of crude oil, condensate or natural gas liquids. BoeBoe. Barrel of oil equivalent. Boe/d. Barrel of oil equivalent per day. BOEM. Bureau of Ocean Energy Management. The agency is responsible for managing development of the nation’s offshore resources in an environmentally and economically responsible way. Previously, this function was managed by the Bureau of Ocean Energy Management, Regulation and Enforcement. BOEMREBOEMRE.. Bureau of Ocean Energy Management, Regulation and Enforcement (formerly the Minerals Management Service), was the federal agency that manages the nation’s natural gas, oil and other mineral resources on the outer continental shelf. The BOEMRE was split into three separate entities: the Office of Natural Resources Revenue; the Bureau of Ocean Energy Management; and the Bureau of Safety and Environmental Enforcement. BSEEBSEE. Bureau of Safety and Environmental Enforcement. The agency is responsible for enforcement of safety and environmental regulations. Previously, this function was managed by the Bureau of Ocean Energy Management, Regulation and Enforcement. Conventional shelf well. A well drilled in water depths less than 500 feet. Deep shelf well. A well drilled on the outer continental shelf to subsurface depths greater than 15,000 feet and water depths of less than 500 feet. DeepwaterDeepwater. Water depths greater than 500 feet in the Gulf of Mexico. Deterministic estimate. Refers to a method of estimation whereby a single value for each parameter in the reserves calculation is used in the reserves estimation procedure. Developed reserves. Oil and natural gas reserves of any category that can be expected to be recovered: (i) through existing wells with existing equipment and operating methods or in which the cost of the required equipment is relatively minor compared to the cost of a new well; and (ii) through installed extraction equipment and infrastructure operational at the time of the reserves estimate if the extraction is by means not involving a well. Development project. A project by which petroleum resources are brought to the status of economically producible. As examples, the development of a single reservoir or field, an incremental development in a producing field, or the integrated development of a group of several fields and associated facilities with a common ownership may constitute a development project. Development well. A well drilled within the proved area of an oil or natural gas reservoir to the depth of a stratigraphic horizon known to be productive. Dry hole or well. A well that proves to be incapable of producing either oil or natural gas in sufficient quantities to justify completion as an oil or natural gas well. Economically producible. Refers to a resource which generates revenue that exceeds, or is reasonably expected to exceed, the costs of the operation. Exploratory well. A well drilled to find a new field or to find a new reservoir in a field previously found to be productive of oil or natural gas in another reservoir. Generally, an exploratory well is any well that is not a development well, an extension well, a service well, or a stratigraphic test well. Extension well. A well drilled to extend the limits of a known reservoir. FieldField. An area consisting of a single reservoir or multiple reservoirs all grouped on or related to the same individual geological structural feature and/or stratigraphic condition. Gross acres or gross wells. The total acres or wells, as the case may be, in which a working interest is owned.
MBblsMBbls. One thousand barrels of crude oil or other liquid hydrocarbons. MBoeMBoe. One thousand barrels of oil equivalent. McfMcf. One thousand cubic feet. McfeMcfe. One thousand cubic feet equivalent, determined using the energy-equivalent ratio of six Mcf of natural gas to one Bbl of crude oil or other hydrocarbon. Mcfe/d. One thousand cubic feet equivalent per day. MMBbls. One million barrels of crude oil or other liquid hydrocarbons. MMBoeMMBoe. One million barrels of oil equivalent. MMBtuMMBtu. One million British thermal units. MMcfMMcf. One million cubic feet. MMcfeMMcfe. One million cubic feet equivalent, determined using aan energy-equivalent ratio of six Mcf of natural gas to one Bbl of crude oil condensate or natural gas liquids. Net acres or net wells. The sum of the fractional working interests owned in gross acres or gross wells, as the case may be. NGLsNGLs. Natural gas liquids. These are created during the processing of natural gas. Non-productive well. A well that is found not to have economically producible hydrocarbons. Oil. Crude oil and condensate. OCS. Outer continental shelf OCS block. A unit of defined area for purposes of management of offshore petroleum exploration and production by the BOEM. ONRRONRR.. Office of Natural Resources Revenue. The agency assumed the functions of the former Minerals Revenue Management Program, which had been renamed to the Bureau of Ocean Energy Management, Regulation and Enforcement. Probabilistic estimate. Refers to a method of estimation whereby the full range of values that could reasonably occur for each unknown parameter in the reserves estimation procedure is used to generate a full range of possible outcomes and their associated probabilities of occurrence. Productive well. A well that is found to have economically producible hydrocarbons. Proved properties. Properties with proved reserves. Proved reserves. Those quantities of oil and natural gas, which, by analysis of geoscience and engineering data, can be estimated with reasonable certainty to be economically producible – producible—from a given date forward, from known reservoirs, and under existing economic conditions, operating methods, and government regulations – regulations—prior to the time at which contracts providing the right to operate expire, unless evidence indicates that renewal is reasonably certain, regardless of whether deterministic or probabilistic methods are used for the estimation. The project to extract the hydrocarbons must have commenced or the operator must be reasonably certain that it will commence the project within a reasonable time. As used in this definition, “existing economic conditions” include prices and costs at which economic producibility from a reservoir is to be determined. The price shall be the average price during the 12-month period prior to the ending date of the period covered by the report, determined as an unweighted arithmetic average of the first-day-of-the- monthfirst-day-of-the-month price for each month within such period, unless prices are defined by contractual arrangements, excluding escalations based upon future conditions. The SEC provides a complete definition of proved reserves in Rule 4-10(a)(22) of Regulation S-X.
Proved undeveloped drilling location. A site on which a development well can be drilled consistent with spacing rules for purposes of recovering proved undeveloped reserves. PV-10 value. A term used in the industry that is not a defined term in generally accepted accounting principles. We define PV-10 as the present value of estimated future net revenues of estimated proved reserves as calculated by our independent petroleum consultant using a discount rate of 10%. This amount includes projected revenues, estimated production costs and estimated future development costs. PV-10 excludes cash flows for asset retirement obligations, general and administrative expenses, derivatives, debt service and income taxes. Reasonable certainty. When deterministic methods are used, reasonable certainty means a high degree of confidence that the quantities of hydrocarbons will be recovered. When probabilistic methods are used, reasonable certainty means at least a 90% probability that the quantities of hydrocarbons actually recovered will equal or exceed the estimate. A high degree of confidence exists if the quantity is much more likely to be achieved than not, and, as changes due to increased availability of
geoscience, engineering, and economic data are made to estimated ultimate recovery with time, reasonably certain estimated ultimate recovery is much more likely to increase or remain constant than to decrease. RecompletionRecompletion. The completion for production of an existing well bore in another formation from that which the well has been previously completed. Reliable technology. A grouping of one or more technologies (including computational methods) that has been field tested and has been demonstrated to provide reasonably certain results with consistency and repeatability in the formation being evaluated or in an analogous formation. ReservesReserves. Estimated remaining quantities of oil, natural gas and related substances anticipated to be economically producible, as of a given date, by application of development projects to known accumulations. In addition, there must exist, or there must be a reasonable expectation that there will exist, the legal right to produce or a revenue interest in the production, installed means of delivering the oil, natural gas or related substances to market, and all permits and financing required to implement the project. ReservoirReservoir. A porous and permeable underground formation containing a natural accumulation of producible oil and/or natural gas that is confined by impermeable rock or water barriers and is individual and separate from other reserves. Supra-saltSupra-salt. A geological layer lying above the salt layer. Undeveloped reserves. Oil and natural gas reserves of any category that are expected to be recovered from new wells on undrilled acreage, or from existing wells where a relatively major expenditure is required for recompletion. Reserves on undrilled acreage shall be limited to those directly offsetting development spacing areas that are reasonably certain of production when drilled, unless evidence using reliable technology exists that establishes reasonable certainty of economic producibility at greater distances. Undrilled locations can be classified as having undeveloped reserves only if a development plan has been adopted indicating that they are scheduled to be drilled within five years, unless the specific circumstances justify a longer time. Under no circumstances shall estimates for undeveloped reserves be attributable to any acreage for which an application of fluid injection or other improved recovery technique is contemplated, unless such techniques have been proved effective by actual projects in the same reservoir or an analogous reservoir, or by other evidence using reliable technology establishing reasonable certainty. Unproved properties. Properties with no proved reserves.
SIGNATURES Pursuant to the requirements of Section 13 or 15(d) of the Securities Exchange Act of 1934, the registrant has duly caused this report to be signed on its behalf by the undersigned, thereunto duly authorized, on February 27, 2013.March 6, 2015. | | | W&T OFFSHORE, INC. | | | By: | | /s/ JOHNJohn D. GIBBONSGibbons | | | John D. Gibbons | | | Senior Vice President and Chief Financial Officer and | | | Chief Accounting Officer |
Pursuant to the requirements of the Securities Exchange Act of 1934, this report has been signed below by the following persons on behalf of the registrant and in the capacities indicated on February 27, 2013.March 6, 2015. | | | /s/ TRACY W. KROHN Tracy W. Krohn | | Chairman, Chief Executive Officer and
Director (Principal | Tracy W. Krohn | | (Principal Executive Officer) | | | /s/ JOHN D. GIBBONS John D. Gibbons | | Senior Vice President and Chief Financial Officer | John D. Gibbons | | (Principal Financial Officer) | /s/ KAREN S. ACREE | | Vice President, Controller and Chief
Accounting Officer (Principal Financial and | Karen S. Acree | | (Principal Accounting Officer) | /s/ Virginia Boulet | | Director | /s/ VIRGINIA BOULET
Virginia Boulet | | Director | | | /s/ SAMIR G. GIBARA Samir G. GibaraRobert I. Israel
| | Director | | | /s/ ROBERT I. ISRAEL
Robert I. Israel | | Director | | | /s/ STUART B. KATZ Stuart B. Katz | | Director | | | Stuart B. Katz | | | /s/ S. JAMES NELSON, JRJames Nelson, Jr | | Director | S. James Nelson, Jr. | | Director | | | /s/ B. FRANK STANLEYFrank Stanley | | Director | B. Frank Stanley | | Director |
136127
|
|
|