| x | ANNUAL REPORT PURSUANT TO SECTION 13 OR 15(d) OF THE SECURITIES EXCHANGE ACT OF 1934 |
| ¨ | TRANSITION REPORT PURSUANT TO SECTION 13 OR 15(d) OF THE SECURITIES EXCHANGE ACT OF 1934 |

| Oklahoma | 73-0767549 | |
|
| |
| 20 N. Broadway, Oklahoma City, Oklahoma | 73102 | |
| (Address of principal executive offices) | (Zip Code) | |
Title of | Name of | |
| Common Stock, $0.01 par value | New York Stock Exchange | |
| Large accelerated filer | x | Accelerated filer | ¨ | |||
| Non-accelerated filer | ¨ (Do not check if a smaller reporting company) | Smaller reporting company | ¨ | |||
185,602,632
16, 2016.
| |||||
| ||||||
| Item 1. | ||||||
| Item 1A. | ||||||
| Item 1B. | ||||||
| Item 2. | ||||||
| Item 3. | ||||||
| Item 4. | ||||||
| ||||||
| ||||||
| ||||||
| ||||||
| ||||||
| ||||||
Item 5. | ||||||
Item 6. | ||||||
Item 7. | ||||||
Item 7A. | ||||||
Item 8. | ||||||
Item 9. | ||||||
| Item 9A. | ||||||
| Item 9B. | ||||||
| ||||||
| ||||||
| ||||||
Item 10. | ||||||
Item 11. | ||||||
Item 12. | ||||||
Item 13. | ||||||
Item 14. | ||||||
| ||||||
Item 15. | ||||||
When we refer to “us,” “we,” “our,” “Company,” or “Continental” we are describing Continental Resources, Inc. and our subsidiaries.
“MBbl” One thousand barrels of crude oil, condensate or natural gas liquids. our strategy; our future operations; our crude oil, natural gas liquids, and natural gas prices and differentials; the timing and amount of future production of crude oil and natural gas and flaring activities; the amount, nature and timing of capital expenditures; estimated revenues, expenses and results of operations; drilling and completing of wells; competition; marketing of crude oil and natural gas; transportation of crude oil, natural gas liquids, and natural gas to markets; property exploitation or property acquisitions and dispositions; costs of exploiting and developing our properties and conducting other operations; our financial position; general economic conditions; credit markets; our liquidity and access to capital; the impact of governmental policies, laws and regulations, as well as regulatory and legal proceedings involving us and of scheduled or potential regulatory or legal changes; our future operating our commodity or other hedging arrangements; and the ability and willingness of current or potential lenders, hedging contract counterparties, customers, and working interest owners to fulfill their obligations to us or to enter into transactions with us in the future on terms that are acceptable to us. report, or otherwise. with no current drilling or production operations. 1980s. For the year ended December 31, 2015, crude oil accounted for approximately 66% of our total production and approximately 85% of our crude oil and natural gas revenues. Crude oil represents approximately 57% of our estimated proved reserves as of December 31, 2015. bit. 2014. North Region: Bakken field North Dakota Bakken Montana Bakken Red River units Cedar Hills Other Red River units Other South Region: Oklahoma Woodford SCOOP (3) Northwest Cana (3) Arkoma Woodford Other East Region (4) Total North Region: Bakken field North Dakota Bakken Montana Bakken Red River units Niobrara - Colorado/Wyoming Other South Region: Oklahoma Woodford SCOOP Northwest Cana Arkoma Woodford Other East Region Total the subsequent section titled . include: strategy, including the following: liquidity and reduced our interest expense. Proved developed producing Proved developed non-producing Proved undeveloped Total proved reserves Standardized Measure North Region: Bakken field North Dakota Bakken Montana Bakken Red River units Cedar Hills Other Red River units Other South Region: Oklahoma Woodford SCOOP Northwest Cana Arkoma Woodford Other Total MBoe Proved reserves at beginning of year Revisions of previous estimates Extensions, discoveries and other additions Production Sales of minerals in place Purchases of minerals in place Proved reserves at end of year presented. and improvements in operating efficiencies as well as other factors. Cana/STACK areas. $50.28 per Bbl. North Region: Bakken field North Dakota Bakken Montana Bakken Red River units Niobrara - Colorado/Wyoming Other South Region: Oklahoma Woodford SCOOP Northwest Cana Arkoma Woodford Other East Region Total 2015: North Region: Bakken field North Dakota Bakken Montana Bakken Red River units Niobrara - Colorado/Wyoming Other South Region: Oklahoma Woodford SCOOP Northwest Cana Arkoma Woodford Other East Region Total dates or the leases are renewed. Exploratory wells: Crude oil Natural gas Dry holes Total exploratory wells Development wells: Crude oil Natural gas Dry holes Total development wells Total wells operating area. return. field. recoveries for these legacy properties. 2016. and STACK 2015. maximize wellhead value for our crude oil production. We continue to assess downstream transportation options Net production volumes: Crude oil (MBbls) (1) North Dakota Bakken Total Company Natural gas (MMcf) North Dakota Bakken Total Company Crude oil equivalents (MBoe) North Dakota Bakken Total Company Average sales prices: (2) Crude oil ($/Bbl) North Dakota Bakken Total Company Natural gas ($/Mcf) North Dakota Bakken Total Company Crude oil equivalents ($/Boe) North Dakota Bakken Total Company Average costs per Boe: (2) Production expenses ($/Boe) North Dakota Bakken Total Company Production taxes and other expenses ($/Boe) General and administrative expenses ($/Boe) (3) DD&A expense ($/Boe) North Region: Bakken field North Dakota Bakken Montana Bakken Red River units Cedar Hills Other Red River units Other South Region: Oklahoma Woodford SCOOP Northwest Cana Arkoma Woodford Other East Region Total 2015: North Region: Bakken field North Dakota Bakken Montana Bakken Red River units Other South Region: Oklahoma Woodford SCOOP Northwest Cana Arkoma Woodford Other Total the same well bore are counted as one well. leasehold sales. In addition, as a result of the significant decrease in commodity prices, the number of providers of materials and services has decreased in the regions where we operate. As a result, the likelihood of experiencing competition and shortages of materials and services may be increased in connection with any period of commodity price recovery. natural gas liquids situated competitors. same terms and under the same rates. When such pipelines operate at full capacity, access is governed by prorating provisions, which may be set forth in the pipelines’ published tariffs. We believe we generally will have access to crude oil pipeline transportation services to the same extent as our similarly situated competitors. natural gas legislative and regulatory changes, including changes in the interpretation of existing requirements or programs to implement those requirements. We do not believe we would be affected by any such regulatory changes in a materially different way than our similarly situated competitors. production industry Dodd-Frank Wall Street Reform and Consumer Protection Act. In July 2010, the Dodd-Frank Wall Street Reform and Consumer Protection Act (the “Dodd-Frank Act”) was enacted into law. the end-user exception from the clearing requirement for our swaps entered into to hedge our commercial risks, the application of the mandatory clearing requirements connection with wholesale purchases or sales of crude oil or refined petroleum products. Knowing or willful violations of the Commodity Exchange Act may also lead to a felony conviction. require the acquisition of various permits restrict the types, quantities and concentration of various substances that can be released into the environment in connection with crude oil and natural gas drilling, production and transportation activities; limit or prohibit drilling activities on certain lands lying within wilderness, wetlands and other protected areas including areas containing endangered species of plants and animals; require remedial measures to mitigate pollution from former and ongoing operations, such as requirements to close pits and plug abandoned In connection with our peer benchmarking with trade associations. owners. operations or cash flows. significant. markets for crude oil and natural gas have been worldwide, domestic and regional economic conditions impacting the global supply of, and demand for, crude oil and natural gas; the actions of the Organization of Petroleum Exporting the level of national and global crude oil and natural gas exploration and the level of national and global crude oil and natural gas the level and effect of trading in commodity futures markets; changes in supply, demand, and the cost of transporting, processing, and marketing crude oil and natural gas; technological advances affecting energy consumption; the price and availability of alternative expenditures and commitments. operations and cash flows. Should any of the above risks occur, operations and cash flows. revenues. In addition, funding our capital expenditures with additional debt will increase our leverage and doing so with equity securities may result in dilution that reduces the value of your stock. capacity, and regulatory, technological and competitive developments. Drilling for and producing crude oil and natural gas are high risk activities with many uncertainties that could adversely affect our business, financial condition or results of operations. abnormal pressure or irregularities in geological formations; shortages of or delays in obtaining equipment shortages of or delays in obtaining components used in fracture stimulation processes such as water and proppants; political events, public protests, civil disturbances, terrorist acts or cyber attacks; limited availability of financing with acceptable terms; title problems; environmental hazards, such as uncontrollable flows of crude oil, natural gas, brine, well fluids, hydraulic fracturing fluids, toxic gas or other pollutants into the environment, including groundwater and shoreline contamination; spillage or mishandling of crude oil, natural gas, brine, well fluids, hydraulic fracturing fluids, toxic gas or other pollutants by us or by third party service providers; limitations in infrastructure, including transportation, processing and refining capacity, or delays imposed by or resulting from compliance with regulatory The Company's current estimates of reserves could change, potentially in material amounts, in the future, in particular due to a continued decline in, or an extended period of historically low, commodity prices. reserves and, in particular, may be reduced due to the significant decline in commodity prices. the actual prices we receive for sales of crude oil and natural gas; the timing and amount of actual production; and Sensitivities properties if commodity prices remain at their currently low levels or decline further. operations and cash flows. environmental hazards, such as uncontrollable flows of crude oil, natural gas, brine, well fluids, hydraulic fracturing fluids, toxic gas or other pollutants into the environment, including groundwater and shoreline contamination; abnormally pressured formations; mechanical difficulties, such as stuck oilfield drilling and service tools and casing collapse; fires, explosions and ruptures of pipelines; loss of product or property damage occurring as a result of transfer to a rail car or train derailments; adverse weather conditions and natural disasters; and spillage or mishandling of crude oil, natural gas, brine, well fluids, hydraulic fracturing fluids, toxic gas or other pollutants by us or by third party service providers. injury or loss of life; damage to pollution and other environmental damage; regulatory investigations and penalties; suspension of our operations; repair and remediation operations and cash flows. prospect which is ready to drill to a prospect transportation. products. Strict liability or joint and several liability may be imposed under certain laws, which could cause us to become liable for the conduct of others or for consequences of our own actions. gases. operations and cash flows. cash flows. crude oil. legislators attributed to speculative trading in derivatives and commodity instruments related to crude oil and natural gas. Our revenues could therefore be adversely affected if a consequence of the legislation and regulations is to lower operations and cash flows. operations and cash flows. operations and cash flows. to, among other things, incur assets. Our revolving credit facility and three-year term loan also indebtedness, enter into certain sale-leaseback transactions, and consolidate, merge or transfer certain assets. indebtedness, which would adversely affect our financial condition and results of operations. results of operations. associated with our derivative instrument receivables ($ operations and cash flows, and it is difficult to predict how long the current depressed commodity price environment will continue and the ultimate impact it will have on the parties with which we do business. production is less than the volume covered by the derivative instruments; the counterparty to the derivative instrument defaults on its contractual obligations; or there is an increase in the differential between the underlying price in the derivative instrument and actual prices received. election of our directors, determine our corporate and management policies and determine, without the consent of our other shareholders, the outcome of certain corporate transactions or other matters submitted to our shareholders for approval, including potential mergers or acquisitions, asset sales and other significant corporate transactions. recoverable reserves; future crude oil and natural gas prices and the quality of the title to acquired properties; potential environmental and other liabilities. The Company will continue to assert its defenses to the case as certified as well as any future attempt to certify a money damages class. High Low Cash Dividend Period October 1, 2012 to October 31, 2012 November 1, 2012 to November 30, 2012 December 1, 2012 to December 31, 2012 Total Equity Compensation Plans Approved by Shareholders Equity Compensation Plans Not Approved by Shareholders future price performance. Income Statement data (in thousands, except per share data) Crude oil and natural gas sales Gain (loss) on derivative instruments, net (1) Total revenues Income from continuing operations Net income Basic earnings per share: From continuing operations Net income per share Shares used in basic earnings per share Diluted earnings per share: From continuing operations Net income per share Shares used in diluted earnings per share Production Crude oil (MBbl) (2) Natural gas (MMcf) Crude oil equivalents (MBoe) Average sales prices (3) Crude oil ($/Bbl) Natural gas ($/Mcf) Crude oil equivalents ($/Boe) Average costs per Boe ($/Boe) (3) Production expenses Production taxes and other expenses Depreciation, depletion, amortization and accretion General and administrative expenses (4) Proved reserves at December 31 Crude oil (MBbl) Natural gas (MMcf) Crude oil equivalents (MBoe) Other financial data (in thousands) Net cash provided by operating activities Net cash used in investing activities Net cash provided by financing activities EBITDAX (5) Total capital expenditures Balance Sheet data at December 31 (in thousands) Total assets Long-term debt, including current maturities Shareholders’ equityaremay be used throughout this report: TM™” A Continental Resources, Inc. trademark which describes a well site layout which allows for drilling multiple wells from a single pad resulting in less environmental impact and lower drilling and completion costs.a new fieldcrude oil or natural gas in an unproved area, to find a new reservoir in aan existing field previously found to be productive of crude oil or natural gas in another reservoir.reservoir, or to extend a known reservoir beyond the proved area.iat a right anglehorizontally within a specified interval.“HPAI” High pressure air injection.“hydraulic fracturing” A process involving the high pressure injection of water, sand and additives into rock formations to stimulate crude oil and natural gas production.“in-field well” A well drilled between producing wells in a field to provide more efficient recovery of crude oil or natural gas from the reservoir.“injection well” A well into which liquids or gases are injected in order to “push” additional crude oil or natural gas out of underground reservoirs and into the wellbores of producing wells. Typically considered an enhanced recovery process.net acres” The percentage of total acres an owner has out ofpad drilling" or "pad development" Describes a particular number of acres,well site layout which allows for drilling multiple wells from a single pad resulting in less environmental impact and lower drilling and completion costs. Also may be referred to as ECO-Pad drilling or a specified tract. An owner who has a 50% interest in 100 acres owns 50 net acres.development.iirevenuerevenues to be generated from the production of proved reserves using a 12-month unweighted arithmetic average of the first-day-of-the-month commodity prices for the period of January to December, net of estimated production and future development and abandonment costs using prices andbased on costs in effect at the determination date, before income taxes, and without giving effect to non-property-related expenses, discounted to a present value using an annual discount rate of 10% in accordance with the guidelines of the Securities and Exchange Commission (“SEC”). PV-10 is not a financial measure calculated in accordance with generally accepted accounting principles (“GAAP”) and generally differs from Standardized Measure, the most directly comparable GAAP financial measure, because it does not include the effects of income taxes on future net revenues. Neither PV-10 nor Standardized Measure represents an estimate of the fair market value of the Company’s crude oil and natural gas properties. The Company and others in the industry use PV-10 as a measure to compare the relative size and value of proved reserves held by companies without regard to the specific tax characteristics of such entities.multi-stage fracturingcompletion technologies.emerging area of crude oil and liquids-rich natural gas properties located in the Anadarko basinBasin of Oklahoma in which we operate.Woodford formation.in which we operate.iii3D (threethree dimensional seismic) defined locations” Locations that have been subjected to 3D seismic testing. We typically use 3D seismic testing to evaluate reservoir presence and/or continuity. We do not typically evaluate reservoir productivity using 3D seismic technology.(3D) seismic”“3D seismic” Seismic surveys using an instrument to send sound waves into the earth and collect data to help geophysicists define the underground configurations. 3D seismic provides three-dimensional pictures. We typically use 3D seismic testing to evaluate reservoir presence and/or continuity. We also use 3D seismic to identify sub-surface hazards to assist in steering, avoiding hazards and determining where to perform enhanced completions.require recently developed technologies to achieve profitability.may lack readily apparent traps, seals and discrete hydrocarbon-water boundaries that typically define conventional reservoirs. These areas tend to have low permeability and may be closely associated with source rock, as is the case with oil and gas shale, tight oil and gas sands and coalbed methane.methane, and generally require horizontal drilling, fracture stimulation treatments or other special recovery processes in order to achieve economic production. In general, unconventional plays require the application of more advanced technology and higher drilling and completion costs to produce relative to conventional plays.waterflood” The injection of water into a crude oil reservoir to “push” additional crude oil out of the reservoir rock and into the wellbores of producing wells. Typically an enhanced recovery process.well bore”“wellbore” The hole drilled by the bit that is equipped for crude oil or natural gas production on a completed well. Also called a well or borehole.ivincludesand information incorporated by reference in this report include “forward-looking statements” within the meaning of Section 27A of the Securities Act of 1933 and Section 21E of the Securities Exchange Act of 1934. All statements other than statements of historical fact, including, but not limited to, forecasts or expectations regarding the Company's business and statements or information concerning the Company’s future operations, performance, financial condition, production and reserves, schedules, plans, timing of development, returns,rates of return, budgets, costs, business strategy, objectives, and cash flow,flows, included in this report are forward-looking statements. When used in this report, theThe words “could,” “may,” “believe,” “anticipate,” “intend,” “estimate,” “expect,” “project,” “budget,” “plan,” “continue,” “potential,” “guidance,” “strategy” and similar expressions are intended to identify forward-looking statements, although not all forward-looking statements contain such identifying words. Forward-looking statements are based on the Company’s current expectations and assumptions about future events and currently available information as to the outcome and timing of future events. Although the Company believes the expectations reflected in the forward-looking statements are reasonable and based on reasonable assumptions, no assurance can be given that such expectations will be correct or achieved or that the assumptions are accurate. When considering forward-looking statements, you should keep in mind the risk factors and other cautionary statements described underPart I, Item 1A. Risk Factors included in this report, quarterly reports, registration statements filed from time to time with the SEC, and other announcements we make from time to time.Without limiting the generality of the foregoing, certain statements incorporated by reference, if any, or included in this report constitute forward-looking statements.strategy;and financial plans;reserves;our technology;our financial strategy;vresults;plans, objectives, expectations and intentions contained in this report that are not historical, including, without limitation, statements regarding our future growth plans;We caution you these forward-lookingForward-looking statements are based on the Company’s current expectations and assumptions about future events and currently available information as to the outcome and timing of future events. Although the Company believes these assumptions and expectations are reasonable, they are inherently subject to all of thenumerous business, economic, competitive, regulatory and other risks and uncertainties, most of which are difficult to predict and many of which are beyond our control, incident to the exploration for,Company's control. No assurance can be given that such expectations will be correct or achieved or that the assumptions are accurate or will not change over time. The risks and development, production,uncertainties that may affect the operations, performance and saleresults of crude oilthe business and natural gas. These risksforward-looking statements include, but are not limited to, commodity price volatility, inflation, lack of availability of drilling, completion and production equipment and services, environmental risks, drillingthose risk factors and other operating risks, regulatory changes, the uncertainty inherent in estimating crude oil and natural gas reserves and in projecting future rates of production, cash flows and access to capital, the timing of development expenditures, and the other riskscautionary statements described underPart I, Item 1A. Risk Factors and elsewhere in this report, quarterly reports, registration statements filedwe file from time to time with the SEC,Securities and Exchange Commission, and other announcements we make from time to time.hereof.on which such statement is made. Should one or more of the risks or uncertainties described in this report occur, or should underlying assumptions prove incorrect, ourthe Company's actual results and plans could differ materially from those expressed in any forward-looking statements. All forward-looking statements are expressly qualified in their entirety by this cautionary statement. This cautionary statement should also be considered in connection with any subsequent written or oral forward-looking statements that we or persons acting on our behalf may issue.we disclaim any dutythe Company undertakes no obligation to publicly correct or update any forward-looking statements to reflectstatement whether as a result of new information, future events or circumstances after the date of this report.vi“ us,“us,” “our,” “ours” or “the Company” refer to Continental Resources, Inc. and its subsidiaries.Item 1. Business exploration and production company with properties in the North, South and East regions of the United States. The North region consists of properties north of Kansas and west of the Mississippi River and includes North Dakota Bakken, Montana Bakken, and the Red River units. The South region includes Kansas and all properties south of Kansas and west of the Mississippi River including various plays in the SouthSCOOP (South Central Oklahoma Oil Province (“SCOOP”)Province), STACK (Sooner Trend Anadarko Canadian Kingfisher), Northwest Cana and Arkoma Woodford plays inareas of Oklahoma. The SCOOP and Northwest Cana plays were previously combined by the Company and referred to as the Anadarko Woodford play. In December 2012, we sold the producing crude oil and natural gas properties in our East region. Our remaining East region properties areis comprised of undeveloped leasehold acreage east of the Mississippi River that will be managed as part of our exploration program.1989,the late 1980s, our activities and growth remained focused primarily in Oklahoma. In 1989,the late 1980s, we expanded our activity into the North region.region, where a substantial portion of our operations is now concentrated due to our successful leasing and drilling activities in the Bakken field. The North region comprised approximately 68% of our crude oil and natural gas production and approximately 77% of our crude oil and natural gas revenues for the year ended December 31, 2015. Approximately 82%58% of our estimated proved reserves as of December 31, 20122015 are located in the North region. We completed an initial public offeringIn recent years, we have significantly expanded our activity in our South region resulting from our discovery of the SCOOP play and our increased activity in the Northwest Cana and STACK plays, all of which are located in Oklahoma. Our South region comprised approximately 32% of our common stock in 2007,crude oil and natural gas production, 23% of our common stock tradescrude oil and natural gas revenues, and 42% of our estimated proved reserves as of and for the year ended December 31, 2015.New York Stock Exchange underexploration and development of crude oil since the ticker symbol “CLR”.stimulationstimulation) and enhanced recovery technologies allow us to economically develop and produce crude oil and natural gas reserves from unconventional formations. As a result of these efforts, we have grown substantially through the drill bit, adding 649.0 MMBoe of proved crude oil and natural gas reserves through extensions and discoveries from January 1, 2008 through December 31, 2012 compared to 86.7 MMBoe added through proved reserve acquisitions during that same period. In October 2012, we announced a new five-year growth plan to triple our production and proved reserves from year-end 2012 to year-end 2017.2012,2015, our estimated proved reserves were 784.71,226 MMBoe, with estimated proved developed reserves of 317.8525 MMBoe, or 40%43% of our total estimated proved reserves. Crude oil comprised 72% of our total estimated proved reserves as of December 31, 2012. For the year ended December 31, 2012,2015, we generated crude oil and natural gas revenues of $2.4$2.6 billion and operating cash flows of $1.6$1.9 billion. For the year ended December 31, 2012, daily2015, production averaged 97,583221,715 Boe per day, a 58%27% increase over average production of 61,865174,189 Boe per day for the year ended December 31, 2011.2014. Average daily production for the quarter ended December 31, 20122015 increased 42%16% to 106,831224,936 Boe per day from 75,219193,456 Boe per day for the quarter ended December 31, 2011.following table below summarizes our total estimated proved reserves, PV-10 and net producing wells as of December 31, 2012,2015, average daily production for the quarter ended December 31, 20122015 and the reserve-to-production index in our principal regions. Our reserve estimates asoperating areas. The PV-10 values shown below are not intended to represent the fair market value of December 31, 2012 are based primarily on a reserve report prepared by our independent reserve engineers, Ryder Scott Company, L.P (“Ryder Scott”). In preparing its report, Ryder Scott evaluated properties representing approximately 99% of our PV-10, 99% of our proved crude oil reserves, and 96% of our proved natural gas reserves as of December 31, 2012. Our internal technical staff evaluated the remaining properties. Our estimated proved reserves and related future net revenues, PV-10 and Standardized Measure at December 31, 2012 were determined using the 12-month unweightedarithmetic average of the first-day-of-the-month commodity prices for the period of January 2012 through December 2012, without giving effect to derivative transactions, and were held constant throughout the lives of the properties. These prices were $94.71 per Bbl for crude oil and $2.76 per MMBtu for natural gas ($86.56 per Bbl forproperties. There are numerous uncertainties inherent in estimating quantities of crude oil and $4.31 per Mcf for natural gas adjustedreserves. See location and quality differentials). At December 31, 2012 Average daily
production for
fourth quarter
2012
(Boe per day) Annualized
reserve/production
index (2) Proved
reserves
(MBoe) Percent
of total PV-10 (1)
(In millions) Net
producing
wells Percent
of total 517,686 66.0 % $ 8,891 494 59,019 55.2 % 24.0 45,883 5.8 % 995 176 8,503 8.0 % 14.8 55,808 7.1 % 1,573 139 11,058 10.4 % 13.8 22,445 2.9 % 430 121 3,658 3.4 % 16.8 3,147 0.4 % 48 11 967 0.9 % 8.9 62,893 8.0 % 955 34 7,123 6.7 % 24.2 44,888 5.7 % 211 73 9,716 9.1 % 12.7 22,042 2.8 % 61 60 3,225 3.0 % 18.7 9,885 1.3 % 145 286 2,556 2.4 % 10.6 — — — — 1,006 0.9 % — 784,677 100.0 % $ 13,309 1,394 106,831 100.0 % 20.1 December 31, 2015 Average daily
production for
fourth quarter
2015
(Boe per day) Annualized
reserve/production
index (2) Proved
reserves
(MBoe) Percent
of total PV-10 (1)
(In millions) Net
producing
wells Percent
of total North Region: Bakken field North Dakota Bakken 618,197 50.4 % $ 4,005 1,196 125,583 55.8 % 13.5 Montana Bakken 44,837 3.6 % 431 273 10,772 4.8 % 11.4 Red River units Cedar Hills 42,456 3.5 % 523 132 8,658 3.9 % 13.4 Other Red River units 5,603 0.5 % 34 120 2,996 1.3 % 5.1 Other 2,271 0.2 % 20 8 902 0.4 % 6.9 South Region: SCOOP 412,546 33.7 % 2,508 220 64,534 28.7 % 17.5 Northwest Cana/STACK 83,951 6.8 % 378 67 7,709 3.4 % 29.8 Arkoma Woodford 9,912 0.8 % 49 56 2,124 0.9 % 12.8 Other 6,038 0.5 % 38 232 1,658 0.8 % 10.0 Total 1,225,811 100.0 % $ 7,986 2,304 224,936 100.0 % 14.9 (1) PV-10 is a non-GAAP financial measure and generally differs from Standardized Measure, the most directly comparable GAAP financial measure, because it does not include the effects of income taxes on future net revenues. Standardized Measure at December 31, 2012 is $11.2 billion, a $2.1 billion difference from PV-10 becauserevenues of the income tax effect.approximately $1.5 billion. Neither PV-10 nor Standardized Measure represents an estimate of the fair market value of our crude oil and natural gas properties. We and others in the crude oil and natural gas industry use PV-10 as a measure to compare the relative size and value of proved reserves held by companies without regard to the specific income tax characteristics of such entities.(2) The Annualized Reserve/Production Index is the number of years that estimated proved reserves would last assuming current production continued at the same rate. This index is calculated by dividing annualized fourth quarter 20122015 production into estimated proved reserve volumes at December 31, 2012.(3)The SCOOP and Northwest Cana plays were previously combined by the Company and referred to as the Anadarko Woodford play.(4)In December 2012, we sold the producing crude oil and natural gas properties in our East region. No proved reserves have been recorded for the East region as of December 31, 2012. SeePart II, Item 8. Notes to Consolidated Financial Statements—Note 13. Property Acquisitions and Dispositions for further discussion of the transaction.2015.following table provides additional informationdownward price pressure intensified in late 2015 and early 2016, with crude oil prices dropping below $27 per barrel in February 2016, a level not seen since 2003. Natural gas prices faced similar downward pressure in 2015, dropping below $1.70 per MMBtu in December 2015.key development areas asplanned non-acquisition capital spending for 2016 to $920 million, a reduction of 63% compared to $2.50 billion of non-acquisition capital spending in 2015. This non-acquisition investment level is designed to target capital expenditures and cash flows being relatively balanced for 2016 at an assumed average West Texas Intermediate benchmark crude oil price of approximately $37 per barrel for the year, with any cash flow deficiencies being funded by borrowings under our revolving credit facility. Our reduced spending is projected to result in a decrease in our 2016 average daily production of approximately 10% compared to 2015.20122015 to approximately 195 gross operated wells at year-end 2016. Our DUC inventory in Oklahoma is expected to increase from 35 gross operated wells at December 31, 2015 to approximately 50 gross operated wells at year-end 2016. We will continue to monitor our capital spending closely based on actual and projected cash flows and could make additional reductions to our 2016 capital spending should commodity prices decrease further. Conversely, a significant improvement in commodity prices could result in an increase in our capital expenditures.budgeted amounts we planchallenges facing our industry, our primary business strategies for 2016 will include: (1) optimizing cash flows through operating efficiencies and cost reductions, (2) high-grading investments based on rates of return and opportunities to spend on exploratoryconvert undeveloped acreage to acreage held by production, and development drilling,(3) working to balance capital workovers,spending with cash flows tofacilitiesmaintain ample liquidity, as elaborated upon in 2013. 2013 Plan Developed acres Undeveloped acres Gross wells
planned for
drilling Capital
expenditures (1)
(in millions) Gross Net Gross Net 758,998 473,068 619,786 393,899 507 $ 2,132 127,276 107,053 219,029 165,783 51 427 150,450 135,483 — — 10 63 11,271 7,726 183,985 103,585 13 32 22,427 8,491 191,916 104,741 35 102 33,023 21,995 379,793 196,172 90 466 115,742 71,539 156,001 106,893 2 5 107,402 26,291 12,064 5,302 — 1 96,803 45,896 115,169 80,197 16 102 — — 210,742 190,474 — — 1,423,392 897,542 2,088,485 1,347,046 724 $ 3,330 (1)The capital expenditures budgeted for 2013 as reflected above include amounts for drilling, capital workovers and facilities and exclude budgeted amounts for land of $220 million, seismic of $20 million, and $30 million for vehicles, computers and other equipment. Potential acquisition expenditures are not budgeted. We expect our cash flows from operations, our remaining cash balance, and our revolving credit facility, including our ability to increase our borrowing capacity thereunder, will be sufficient to satisfy our 2013 capital budget. We may choose to access the capital markets for additional financing to take advantage of business opportunities that may arise if such financing can be arranged at favorable terms. The actual amount and timing of our capital expenditures may differ materially from our estimates as a result of, among other things, available cash flows, unbudgeted acquisitions, actual drilling results, the availability of drilling rigs and other services and equipment, the availability of transportation capacity, and regulatory, technological and competitive developments. Further, a decline in crude oil and natural gas prices could cause us to curtail our actual capital expenditures. Conversely, an increase in commodity prices could result in increased capital expenditures.goalBusiness Strategyincreasebe focused on increasing shareholder value by finding and developing crude oil and natural gas reserves at costs that provide an attractive raterates of return on our investment.return. The principal elements of our businessthis strategy are:FocusGrowing and sustaining a premier portfolio of assets focused on crude oil. During the late 1980s we beganhigh rate-of-return projects. We hold a portfolio of leasehold acreage and drilling opportunities in certain premier U.S. resource plays with varying exposure to believe the valuation potential for crude oil, exceedednatural gas, and natural gas liquids. We pursue opportunities to develop our existing properties as well as explore for new resource plays where significant reserves may be economically developed. Our capital programs are designed to allocate investments to projects that provide opportunities to convert undeveloped acreage to acreage held by production and to maximize hydrocarbon recoveries and rates of natural gas. Accordingly, we began to shift our reservereturn on capital employed. Our operations are primarily focused on the exploration and production profiles toward crude oil. Asdevelopment of December 31, 2012, crude oil, comprised 72% of our total proved reserves and 70% of our 2012 annual production. Althoughbut we do pursuealso allocate capital to liquids-rich natural gas opportunities, such as those found in the SCOOP, weareas that provide attractive rates of return.believe crude oil valuations will be superior to natural gas valuationsmanage through the current commodity price downturn by focusing on improving operating efficiencies and reducing costs. Our key operating areas are characterized by large acreage positions in select unconventional resource plays with multiple stacked geologic formations that provide repeatable drilling opportunities and resource potential. We operate a relative Btu basis for the foreseeable future.Growth Through Drilling. A substantial portionmajority of our annual capital expenditures are invested in drilling projectswells and leasehold acreage acquisitions. From January 1, 2008 through December 31, 2012, proved crude oil and natural gas reserve additions through extensions and discoveries were 649.0 MMBoe compared to 86.7 MMBoe of proved reserve acquisitions.Internally Generated Prospects. Although we periodically evaluate and complete strategic acquisitions, our technical staff has internally generated a substantial portion ofbelieve the opportunities for the investmentconcentration of our capital. As an early entrant in new or emerging plays, we expect to acquire undeveloped acreage at a lower cost than later entrants into a developing play.Focus on Unconventional Crude Oil and Natural Gas Resource Plays. Our experience with horizontal drilling, advanced fracture stimulation and enhanced recovery technologiesoperated assets allows us to commercially develop unconventional crude oilleverage our technical expertise and natural gas resource reservoirs, such asmanage the Red River B Dolomite, Bakken,development of our properties to achieve cost reductions through operating efficiencies and Oklahoma Woodford formations. Production rateseconomies of scale.the Red River unitsvarious aspects of our business, including reductions in spud-to-total depth drilling times and average days to drill horizontal laterals, which translated into substantial reductions in drilling costs in our core areas. Our drilling and completion costs for most operated wells declined on average approximately 25% in 2015 due to operational efficiency gains and lower service costs. In addition to lowering our drilling and completion costs, we also have been increasedoptimize cash flows through the use of enhanced recovery technologies including watercompletion technologies. In North Dakota, we are optimizing cash flows through enhanced completions using new hybrid and high pressure air injection. Ourslickwater designs, which have increased 90-day production rates between 35% and 50% on average. In Oklahoma, we are optimizing cash flows using enhanced completions that target optimum sand and fluid combinations. Initial results from the Red River units, the Bakken field,our 2015 activities are encouraging, and the Oklahoma Woodford play comprised approximately 33,831 MBoe, or 95%,we expect most of our total crude oil2016 well completions in Oklahoma will use enhanced completion methods.natural gas production fora strong balance sheet. Maintaining a strong balance sheet and ample liquidity are key components of our business strategy. For 2016, we will continue our focus on preserving financial flexibility and ample liquidity as we manage the risks facing our industry. Our 2016 capital budget is reflective of decreased commodity prices and has been established based on an expectation of available cash flows, with any cash flow deficiencies expected to be funded by borrowings under our revolving credit facility. As we have done historically to preserve or enhance liquidity we may adjust our capital program throughout the year, endeddivest non-strategic assets, or enter into strategic joint ventures.2012.Acquire Significant Acreage Positions in New or Developing Plays. In addition2015, our proved reserve additions through organic extensions and discoveries were 1,534 MMBoe compared to the 971,634 net undeveloped acres held in the Bakken play in North Dakota and Montana, the Oklahoma Woodford play, and the Niobrara play in Colorado and Wyoming, we held 375,412 net undeveloped acres in other crude oil and natural gas plays as86 MMBoe of December 31, 2012. Our technical staff is focused on identifying and testing new unconventional crude oil and natural gas resource plays where significant reserves could be developed if economically producible volumes can be achieved through advanced drilling, fracture stimulation and enhanced recovery techniques.proved reserve acquisitions during that same period.we believe willto help us successfullymanage through the current commodity price downturn and execute our business strategy:hold 1,347,046held approximately 1.19 million net undeveloped acres and 897,5421.15 million net developed acres under lease in certain premier U.S. resource plays as of December 31, 2012.2015. Approximately 72%59% of theour net undeveloped acres are located within unconventional resource plays in the Bakken, (North DakotaSCOOP, Northwest Cana, STACK and Montana),Arkoma Woodford (Oklahoma)areas. We have developed sizable acreage positions in our core operating areas and believe the Niobrara (Coloradoconcentration of our assets allows us to achieve operating efficiencies and Wyoming). The remaining balancereduce costs through economies of scale. We are among the largest leaseholdersnet undeveloped acreage is located in conventional plays including 3D-defined locations for the Lodgepole (North Dakota), Morrow-Springer (Western Oklahoma) and Frio (South Texas) plays.ExperienceExpertise with Horizontal Drilling and Enhanced RecoveryCompletion Methods. We have substantial experience with horizontal drilling and enhanced recovery methods. In 1992, we drilled our first horizontal well,completion methods and we have drilled over 1,800 horizontal wells since that time. We continue to be a leaderamong the industry leaders in the developmentuse of new drilling and completion technologies. Our trademarked ECO-PadWe continue to optimize drilling concept, which allows forand completion efficiencies through the use of multi-well pad drilling multiple wells from a single pad, is becoming a standard drilling approach in theour operating areas. Further, we are among industry because it improves land use and increases operating efficiencies. We started with drilling four wells per pad but have since begun drilling as many as 14 wells on a pad site. We are also on the leading edge ofleaders in extending lateral drilling lengths, in some instances uplengths. Results to three miles. In 2012, we completed the first multiple-unit spaced well drilled in Oklahoma, which had a horizontal section that was twice the length of previousdate indicate longer laterals in the area. Longer laterals are believed to have a positive impact on well productivity and economics. Additionally, we are pioneering the explorationWe have also been among industry leaders in testing enhanced completion technologies involving various combinations of fluid types, proppant types and evaluationvolumes, and stimulation stage lengths to determine optimal methods for maximizing crude oil recoveries and rates of the lower layers or “benches” of the Three Forks formationreturn. We continually refine our drilling and completion techniques in the Bakken field, initially targeting the first bench of the Three Forks in mid-2008 followed by the successful completion ofan effort to deliver improved results across our first well in the second bench in October 2011. In 2012, we successfully completed the first well ever drilled in the third bench of the Three Forks, the discovery of which may lead to an increase in recoverable reserves for the Company and the Bakken field as a whole.properties.2012,2015, we operated properties comprising 84%87% of our total proved reserves and 83% of our PV-10. By controlling a significant portion of our operations, we are able to more effectively manage the cost and timing of exploration and development of our properties, including the drilling and fracture stimulationcompletion methods used.crude oil and natural gas industry. Our Chief Executive Officer, Harold G. Hamm, began his career in the crude oil and natural gas industry in 1967. Our 9 senior officers have an average of 2934 years of crude oil and natural gas industry experience.Strong Financial Position and Liquidity. We have a revolving credit facility with lender commitments totaling $1.5$2.75 billion and a borrowing base of $3.25 billion as of February 15, 2013, with available borrowing capacity of $655.2 million at that date after considering outstanding borrowings and letters of credit. While our current commitments total $1.5 billion, we have the ability to increase the aggregate commitment levelwhich may be increased up to the lessera total of $2.5$4.0 billion or the borrowing base then in effectupon agreement with participating lenders to provide additional available liquidity if needed to maintain our growth strategy, take advantage of business opportunities and fund our capital program.program and commitments. We believehad approximately $1.9 billion of available borrowing capacity under our planned explorationcredit facility at February 19, 2016 after considering outstanding borrowings and development activitiesletters of credit. We have no near-term debt maturities, with our earliest maturity being a $500 million term loan due in November 2018.be funded substantially fromhowever, trigger increases in our operating cash flowscredit facility's interest rates and borrowingscommitment fees paid on unused borrowing availability under certain circumstances.facility. Our 2013 capital expenditures budget has been established based on our current expectationfacility and refinanced a portion of available cash flows from operations and availability under our revolving credit facility. Should expected available cash flows from operations materially differ from expectations, we believe our credit facility has sufficient availabilityborrowings to fund any deficit or that we can reducean unsecured three-year term loan with a lower interest rate. These transactions enhanced our capital expenditures to be in line with cash flows from operations.TheIn connection with the estimation of proved reserves, the term “reasonable certainty” implies a high degree of confidence that the quantities of crude oil and/or natural gas actually recovered will equal or exceed the estimate. To achieve reasonable certainty, our internal reserve engineers and Ryder Scott Company, L.P (“Ryder Scott”), our independent reserve engineers, employed technologies that have been demonstrated to yield results with consistency and repeatability. The technologies and economic data used in the estimation of our proved reserves include, but are not limited to, well logs, geologic maps including isopach and structure maps, analogy and statistical analysis, and available downhole and production data, seismic data and well test data.tables settable sets forth our estimated proved crude oil and natural gas reserves and PV-10 by reserve category as of December 31, 2012.2015. The total Standardized Measure of discounted cash flows as of December 31, 20122015 is also presented. Our reserve estimates as of December 31, 2015 are based primarily on a reserve report prepared by Ryder Scott. In preparing its report, Ryder Scott evaluated properties representing approximately 99% of our PV-10, 99% of our proved crude oil reserves, and 96%97% of our proved natural gas reserves as of December 31, 2012, and our2015. Our internal technical staff evaluated the remaining properties. A copy of Ryder Scott’s summary report is included as an exhibit to this Annual Report on Form 10-K. PV-10Standardized Measure at December 31, 20122015 were determined using the 12-month unweighted arithmetic average of the first-day-of-the-month commodity prices for the period of January 20122015 through December 2012,2015, without giving effect to derivative transactions, and were held constant throughout the lives of the properties. These prices were $94.71$50.28 per Bbl for crude oil and $2.76$2.58 per MMBtu for natural gas ($86.5641.63 per Bbl for crude oil and $4.31$2.35 per Mcf for natural gas adjusted for location and quality differentials). Crude Oil
(MBbls) Natural Gas
(MMcf) Total
(MBoe) PV-10 (1)
(in millions) 220,392 531,776 309,021 $ 7,710.0 6,478 13,723 8,765 227.8 334,293 795,585 466,891 5,371.1 561,163 1,341,084 784,677 $ 13,308.9 $ 11,180.4 Crude Oil
(MBbls) Natural Gas
(MMcf) Total
(MBoe) PV-10 (1)
(in millions)Proved developed producing 324,631 1,178,434 521,037 $ 5,678.6 Proved developed non-producing 2,167 11,909 4,151 29.0 Proved undeveloped 373,716 1,961,443 700,623 2,278.4 Total proved reserves 700,514 3,151,786 1,225,811 $ 7,986.0 Standardized Measure (1) $ 6,476.3 (1) PV-10 is a non-GAAP financial measure and generally differs from Standardized Measure, the most directly comparable GAAP financial measure, because it does not include the effects of income taxes on future net revenues. Standardized Measure at December 31, 2012 is $11.2 billion, a $2.1 billion difference from PV-10 becauserevenues of the income tax effect.approximately $1.5 billion. Neither PV-10 nor Standardized Measure represents an estimate of the fair market value of our crude oil and natural gas properties. We and others in the crude oil and natural gas industry use PV-10 as a measure to compare the relative size and value of proved reserves held by companies without regard to the specific income tax characteristics of such entities.2012. Proved Developed Proved Undeveloped Crude
Oil
(MBbls) Natural
Gas
(MMcf) Total
(MBoe) Crude
Oil
(MBbls) Natural
Gas
(MMcf) Total
(MBoe) 124,880 189,054 156,389 298,333 377,782 361,297 20,931 25,248 25,139 17,082 21,970 20,744 52,694 15,488 55,275 533 — 533 19,094 355 19,153 3,292 — 3,292 867 12,083 2,881 59 1,245 266 4,594 84,631 18,698 11,922 193,638 44,195 1,806 117,206 21,340 1,844 130,219 23,548 44 66,881 11,192 25 64,951 10,850 1,960 34,553 7,719 1,203 5,780 2,166 226,870 545,499 317,786 334,293 795,585 466,891 Reserves at December 31, 2010, 2011 and 2012 were computed using the 12-month unweighted average of the first-day-of-the-month commodity prices as required by SEC rules. Changes2015. Proved Developed Proved Undeveloped Crude Oil
(MBbls) Natural Gas
(MMcf) Total
(MBoe) Crude Oil
(MBbls) Natural Gas
(MMcf) Total
(MBoe)North Region: Bakken field North Dakota Bakken 211,358 366,248 272,399 269,994 454,819 345,797 Montana Bakken 26,744 31,323 31,964 11,250 9,732 12,872 Red River units Cedar Hills 41,628 4,967 42,456 — — — Other Red River units 5,039 3,386 5,603 — — — Other 253 12,109 2,271 — — — South Region: SCOOP 37,516 575,754 133,475 73,442 1,233,778 279,072 Northwest Cana/STACK 2,736 109,999 21,070 19,030 263,114 62,882 Arkoma Woodford 11 59,404 9,912 — — — Other 1,513 27,153 6,038 — — — Total 326,798 1,190,343 525,188 373,716 1,961,443 700,623 were as follows for the periods indicated: Year Ended December 31, 2012 2011 2010 508,438 364,712 257,293 4,149 2,237 27,629 233,652 161,981 95,233 (35,716 ) (22,581 ) (15,811 ) (7,838 ) — — 81,992 2,089 368 784,677 508,438 364,712 Year Ended December 31, MBoe 2015 2014 2013 Proved reserves at beginning of year 1,351,091 1,084,125 784,677 Revisions of previous estimates (297,198 ) (107,949 ) (96,054 ) Extensions, discoveries and other additions 253,173 440,621 444,654 Production (80,926 ) (63,579 ) (49,610 ) Sales of minerals in place (329 ) (3,227 ) — Purchases of minerals in place — 1,100 458 Proved reserves at end of year 1,225,811 1,351,091 1,084,125 Revisions. Revisions of previous estimates. Revisions represent changes in previous reserve estimates, either upward or downward, resulting from new information normally obtained from development drilling and production history or resulting from a change in economic factors, such as commodity prices, operating costs, or development costs. Revisionsyear ended December 31, 201012-month average price for natural gas decreased 41% from $4.35 per MMBtu for 2014 to $2.58 per MMBtu for 2015. These decreases shortened the economic lives of certain producing properties and caused certain exploration and development projects to become uneconomic which had an adverse impact on our proved reserve estimates, resulting in downward reserve revisions of 185 MMBo and 391 Bcf (totaling 251 MMBoe) in 2015. We may experience additional downward reserve revisions as a result of prices in 2016 if the currently depressed price environment for crude oil and natural gas persists or worsens.duefirst booked. One factor leading to better thanthe removal is an increased emphasis on multi-well pad drilling in the Bakken, which resulted in the removal of PUDs in certain areas in favor of PUDs more likely to be developed with pad drilling where operating efficiencies may be realized. Further, in the SCOOP play we removed certain PUD locations originally planned to be developed with standard lateral drilling lengths in favor of PUDs to be developed with extended length laterals in similar locations. Longer laterals are believed to have a positive impact on well productivity and economics. The combination of these and other factors resulted inhigher average125 Bcf of upward revisions to natural gas proved reserves (netting to 42 MMBoe of downward revisions) in 2015.throughout 2010 compared to 2009.(1)(i) extension of the proved acreage of previously discovered reservoirs through additional drilling in periods subsequent to discovery and (2)(ii) discovery of new fields with proved reserves or of new reservoirs of proved reserves in old fields. Extensions, discoveries and other additions for each of the three years reflected in the table above were primarily due to increases in proved reserves associated with our successful drilling activity and strong production growth in the Bakken field and SCOOP play. Proved reserve additions from our drilling activities in North Dakota. In 2012, we continued to make significant headwaythe Bakken totaled 96 MMBoe, 222 MMBoe and 276 MMBoe for 2015, 2014 and 2013, respectively, while reserve additions in developingSCOOP totaled 93 MMBoe, 208 MMBoe and expanding158 MMBoe for 2015, 2014 and 2013, respectively. Additionally, extensions and discoveries in 2015 were significantly impacted by successful drilling results in the Northwest Cana/STACK area, resulting in proved reserve additions of 57 MMBoe in 2015. See the subsequent section titled Summary of Crude Oil and Natural Gas Properties and Projects for a discussion of our North Dakota Bakken assets, both laterally and vertically, throughstrategic exploration, planning and technology.2015 drilling activities. We expect a significant portion of future reserve additions will come from our major development projects in the Bakken, SCOOP, and Northwest Cana plays.that resultresulting from the disposition of properties during a period. During the year ended December 31, 2012, we disposed of certain non-strategic properties in Oklahoma, Wyoming, and our East region in an effort to redeploy capital to our strategic areas that we believe will deliver higher future growth potential. SeePart II, Item 8. Notes to Consolidated Financial Statements—Note 13.14. Property Acquisitions and Dispositions for further discussion of our 2012notable dispositions. We may continue to seek opportunities to sell non-strategic properties if and when we have the ability to dispose of such assets at favorable terms.that resultresulting from the acquisition of properties during a period. Purchases for the year ended December 31, 2012 primarily reflect the Company’s acquisition of propertiesWe have had no significant mineral purchases in the Bakken play of North Dakota during the year. SeePart II, Item 8. Notes to Consolidated Financial Statements—Note 13. Property Acquisitions and Dispositions andNote 14. Property Transaction with Related Party for further discussion of our 2012 acquisitions. Wepast three years. However, we may continue to participate as a buyer of properties when and if we have the ability to increase our position in strategic plays at favorable terms. Crude Oil
(MBbls) Natural Gas
(MMcf) Total
(MBoe)Proved undeveloped reserves at December 31, 2014 524,223 1,946,335 848,612 Revisions of previous estimates (216,289 ) (315,390 ) (268,855 ) Extensions and discoveries 111,058 546,854 202,201 Sales of minerals in place (63 ) (80 ) (76 ) Purchases of minerals in place — — — Conversion to proved developed reserves (45,213 ) (216,276 ) (81,259 ) Proved undeveloped reserves at December 31, 2015 373,716 1,961,443 700,623 . 96%97% of our proved natural gas reserves as of December 31, 20122015 included in this Annual Report on Form 10-K. The Ryder Scott technical personnel responsible for preparing the reserve estimates presented herein meet the requirements regarding qualifications, independence, objectivity and confidentiality set forth in the Standards Pertaining to the Estimating and Auditing of Oil and Gas Reserves Information promulgated by the Society of Petroleum Engineers. Refer to Exhibit 99 included with this Annual Report on Form 10-K for further discussion of the qualifications of Ryder Scott personnel.reservesreserve estimates. While we have no formal committee specifically designated to review reserves reporting and the reserves estimation process, a copy of the Ryder ScottProved reserve reportinformation is reviewed by our Audit Committee with representatives of Ryder Scott and by our internal technical staff before the information is filed with the SEC on Form 10-K. Additionally, certain members of our senior management review andquarterlysemi-annual basis review any internally estimated significant changes to our proved reserves.Resource DevelopmentCorporate Reserves is the technical person primarily responsible for overseeing the preparation of our reserve estimates. He has a Bachelor of Science degree in Petroleum Engineering, an MBA in Finance and 2731 years of industry experience with positions of increasing responsibility in operations, acquisitions, engineering and evaluations. He has worked in the area of reserves and reservoir engineering most of his career and is a member of the Society of Petroleum Engineers. The Vice President—Resource DevelopmentCorporate Reserves reports directly to our Senior Vice President—OperationsPresident and Resource Development.Chief Operating Officer. The reserve estimates are reviewed and approved by the President and Chief Operating Officer and certain other members of senior management.Undeveloped Reserves. Reserve and PV-10 Sensitivitiesundeveloped reserves at December 31, 2012reserve and PV-10 estimates were 466,891 MBoe, consistingprepared using 2015 average prices of 334,293 MBbls of$50.28 per Bbl for crude oil and 795,585 MMcf of$2.58 per MMBtu for natural gas. In 2012, we developed approximately 17%Commodity prices existing in February 2016 are lower than the 2015 average prices. If commodity prices do not increase from current levels, our future calculations of ourestimated proved undeveloped reserves booked as of December 31, 2011 through the drilling of 231 gross (127.9 net) development wells at an aggregate capital cost of approximately $892 million. Also in2012, we removed 202 gross (90.0 net) PUD locations,and PV-10 will be based on lower prices which resultedcould result in the removal of 3.5 MMBo and 183.8 Bcf (34.2 MMBoe) ofthen uneconomic reserves from our proved undeveloped reserves. These removals were predominantly due to our decision to declassify 100.4 Bcf (16.7 MMBoe) of proved undeveloped reserves in future periods.Arkoma Woodford district, which consists primarily of dryestimated proved reserves and PV-10 at December 31, 2015 under different pricing scenarios for crude oil and natural gas. For similar reasons, we removed 1.4 MMBoIn these sensitivities, all factors other than the commodity price assumption have been held constant for each well. These sensitivities are only meant to demonstrate the impact that changing commodity prices may have on estimated proved reserves and 73.3 Bcf (13.6 MMBoe) ofPV-10 and there is no assurance these outcomes will be realized.undeveloped reserves in our Northwest Cana district. Given current and projected prices forPV-10 under various crude oil price scenarios, with natural gas we elected to defer drillingprices being held constant at the 2015 average price of $2.58 per MMBtu.
as a result declassified these proved undeveloped reserves accordingly. Estimated future development costs relating toPV-10 under various natural gas price scenarios, with crude oil prices being held constant at the development2015 average price of proved undeveloped reserves are projected to be approximately $1.8 billion in 2013, $2.2 billion in 2014, $2.0 billion in 2015, $1.4 billion in 2016, and $0.9 billion in 2017.Since our entry into the Bakken field, we have acquired a substantial leasehold position. Our drilling programs to date have focused on proving our undeveloped leasehold acreage through strategic exploratory drilling, thereby increasing the amount of leasehold acreage in the secondary term of the lease with no further drilling obligations (i.e., categorized as held by production) and resulting in a reduced amount of leasehold acreage in the primary term of the lease with drilling obligations. While we will continue to drill strategic exploratory wells and build on our current leasehold position, we expect to increase our focus on developing our PUD locations. While full development of our current PUD inventory is expected to occur within five years, we believe additional PUD locations will be generated through drilling activities.
2012: Developed Acres Undeveloped Acres Total Gross Net Gross Net Gross Net 758,998 473,068 619,786 393,899 1,378,784 866,967 127,276 107,053 219,029 165,783 346,305 272,836 150,450 135,483 — — 150,450 135,483 11,271 7,726 183,985 103,585 195,256 111,311 22,427 8,491 191,916 104,741 214,343 113,232 33,023 21,995 379,793 196,172 412,816 218,167 115,742 71,539 156,001 106,893 271,743 178,432 107,402 26,291 12,064 5,302 119,466 31,593 96,803 45,896 115,169 80,197 211,972 126,093 — — 210,742 190,474 210,742 190,474 1,423,392 897,542 2,088,485 1,347,046 3,511,877 2,244,588 Developed acres Undeveloped acres Total Gross Net Gross Net Gross Net North Region: Bakken field North Dakota Bakken 1,053,294 595,396 318,341 205,227 1,371,635 800,623 Montana Bakken 188,424 148,764 154,017 96,049 342,441 244,813 Red River units 158,700 138,716 43,082 26,407 201,782 165,123 Other 17,957 5,731 246,076 202,615 264,033 208,346 South Region: SCOOP 192,863 115,513 578,470 324,307 771,333 439,820 Northwest Cana/STACK (1) 129,163 79,762 138,537 75,459 267,700 155,221 Arkoma Woodford 110,560 26,240 3,388 173 113,948 26,413 Other 80,796 44,281 112,280 60,626 193,076 104,907 East Region — — 224,142 204,012 224,142 204,012 Total 1,931,757 1,154,403 1,818,333 1,194,875 3,750,090 2,349,278 2012 that are expected2015 scheduled to expire over the next three years by region unless production is established within the spacing units covering the acreage prior to the expiration dates: 2013 2014 2015 Gross Net Gross Net Gross Net 245,602 114,101 116,545 63,992 108,842 71,683 71,494 45,749 72,244 59,083 39,654 33,964 — — — — — — 46,283 27,253 16,740 10,823 100,981 52,531 57,785 37,423 5,740 3,253 14,120 8,981 63,855 33,816 118,772 67,201 76,917 44,602 93,126 60,844 28,395 20,987 11,917 8,697 7,762 4,763 270 121 — — 5,101 3,604 2,198 1,294 71,123 49,265 41,196 32,446 9,704 7,543 14,188 9,763 632,204 359,999 370,608 234,297 437,742 279,486 2016 2017 2018 Gross Net Gross Net Gross Net North Region: Bakken field North Dakota Bakken 158,625 92,105 76,643 53,665 25,417 17,474 Montana Bakken 71,649 43,457 52,822 34,576 14,436 9,567 Red River units 13,800 10,190 5,319 3,227 4,931 3,444 Other 13,103 5,879 639 256 17,225 17,129 South Region: SCOOP 207,054 110,529 172,890 104,626 47,703 37,209 Northwest Cana/STACK 36,069 23,657 29,196 15,202 44,087 25,819 Arkoma Woodford — — — — — — Other 48,716 30,052 40,946 19,198 3,834 1,702 East Region 4,688 4,319 60,795 52,840 45 134 Total 553,704 320,188 439,250 283,590 157,678 112,478 2012,2015, we drilled and completed exploratory and development wells as set forth in the table below: 2012 2011 2010 Gross Net Gross Net Gross Net 76 37.0 50 23.4 42 11.8 78 43.8 109 45.9 25 10.9 1 1.0 2 1.3 4 2.2 155 81.8 161 70.6 71 24.9 561 211.3 380 126.1 231 91.5 5 2.4 17 1.6 44 5.2 3 1.1 5 0.6 3 1.0 569 214.8 402 128.3 278 97.7 724 296.6 563 198.9 349 122.6 2015 2014 2013 Gross Net Gross Net Gross Net Exploratory wells: Crude oil 28 19.8 94 70.5 75 51.5 Natural gas 19 1.4 42 8.3 40 23.7 Dry holes 1 1.0 3 1.6 3 2.1 Total exploratory wells 48 22.2 139 80.4 118 77.3 Development wells: Crude oil 707 215.5 897 290.3 734 250.9 Natural gas 142 32.8 64 16.8 26 5.4 Dry holes — — 1 1.0 — — Total development wells 849 248.3 962 308.1 760 256.3 Total wells 897 270.5 1,101 388.5 878 333.6 2012,2015, there were 323417 gross (122.4(178 net) operated and non-operated wells that have been spud and are in the process of drilling, completing or waiting on completion.AsFor 2016, we plan to operate an average of February 15, 2013, we operated 28approximately 19 drilling rigs on our properties.for the year. Our rig activity during 2013for 2016 will depend on potential drilling efficiency gains and crude oil and natural gas prices and potential drilling efficiency gains and, accordingly, our rig count may increase or decrease from currentplanned levels. There canAs a result of the significant decrease in commodity prices, the number of providers of materials and services has decreased in the regions where we operate. As a result, the likelihood of experiencing shortages of materials and services may be no assurance, however, that additional rigs will be available to us at an attractive cost.increased in connection with any period of commodity price recovery. SeePart I, Item 1A. Risk Factors—The unavailability or high cost of additional drilling rigs, equipment, supplies, personnel and oilfield services could adversely affect our ability to execute our exploration and development plans within budget and on a timely basis.Throughoutdiscussreview our budgeted number of wells and capital expenditures for 2013. Although we cannot provide any assurance, we believe2016 in our key operating areas. Our 2016 capital budget is reflective of the depressed commodity price environment and has been established based on an expectation of available cash flows. If cash flows from operations, remaining cash balance, andare materially impacted by a further decline in commodity prices, we have the ability to reduce our capital expenditures or utilize the availability of our revolving credit facility includingif needed to fund our ability to increase our borrowing capacity thereunder, will be sufficient to satisfy our 2013 capital budget. We may choose to access the capital markets for additional financing to take advantage of business opportunities that may arise if such financing can be arranged at favorable terms. The actual amount and timing of our capital expenditures may differ materially from our estimates as a result of, among other things, availableoperations. Conversely, higher cash flows unbudgeted acquisitions, actual drilling results, the availability of drilling rigs and other services and equipment, and regulatory, technological and competitive developments. Further, a decline in commodity prices could cause us to curtail our actual capital expenditures. Conversely,resulting from an increase in commodity prices could result in increased capital expenditures.As referred to throughout this report, a “play” is a term applied to a portion of the explorationproduction cycle following the identification2016 budgeted capital expenditures by geologists and geophysicists of areas with potential crude oil and natural gas reserves. “Conventional plays” are areas believed to be capable of producing crude oil and natural gas occurring in discrete accumulations in structural and stratigraphic traps. “Unconventional plays” are areas believed to be capable of producing crude oil and natural gas occurring in accumulations that are regionally extensive, but require recently developed technologies to achieve profitability. Unconventional plays tend to have low permeability and may be closely associated with source rock as is the case with oil and gas shale, tight oil and gas sands and coalbed methane. Our operations in unconventional plays include operations in the Bakken and Woodford plays and the Red River units. Our operations within conventional plays include operations in the Lodgepole of North Dakota, Morrow-Springer of western Oklahoma and Frio in south Texas. In general, unconventional plays require the application of more advanced technology and higher drilling and completion costs to produce relative to conventional plays. These technologies can include hydraulic fracturing treatments, horizontal wellbores, multilateral wellbores, or some other technique or combination of techniques to expose more of the reservoir to the wellbore.References throughout this report to “3D seismic” refer to seismic surveys of areas by means of an instrument which records the travel time of vibrations sent through the earth and the interpretation thereof. By recording the time interval between the source of the shock wave and the reflected or refracted shock waves from various formations, geophysicists are better able to define the underground configurations. “3D defined locations” are those locations that have been subjected to 3D seismic testing. We typically use 3D seismic testing to evaluate reservoir presence and/or continuity. We do not typically evaluate reservoir productivity using 3D seismic technology. 2016 Plan Gross wells
planned for
completion (1) Net wells
planned for
completion (1) Capital
expenditures
(in millions) North Region: North Dakota Bakken 127 26 $ 320 South Region: SCOOP 113 25 260 Northwest Cana 28 11 62 STACK 15 9 142 Total exploration and development drilling 283 71 $ 784 Land 78 Capital facilities, workovers and other corporate assets 55 Seismic 3 Total 2016 capital budget, excluding acquisitions $ 920 (1) Represents wells expected to be drilled, completed, and producing in 2016 and excludes an expected increase in our drilled but uncompleted well inventory of 75 gross (47 net) wells during the year. 90%63% of our PV-10 as of December 31, 20122015 and 78%66% of our average daily Boe production for the three months ended December 31, 2012. For the three months ended December 31, 2012, ourfourth quarter of 2015. Our average daily production from such properties was 83,205148,911 Boe per day for the fourth quarter of 2015, an increase of 45%3% over our average daily production for the three months ended December 31, 2011.comparable 2014 period. Our principal producing properties in the North region are located in the Bakken field and the Red River units.It has been described byWe are a leading producer, leasehold owner and operator in the United States Geological Survey (“USGS”) asBakken. As of December 31, 2015, we controlled one of the largest continuous crude oil accumulation it has ever assessed. Estimates of recoverable reserves forleasehold positions in the Bakken field have grownwith approximately 1.71 million gross (1.05 million net) acres under lease.4.3 billion barrels of crude oil, as publishedthe 2014 fourth quarter due to additional drilling and completion activity. Despite depressed commodity prices in a report issued by2015, we continued to make progress with our Bakken drilling program during the USGSyear which was almost entirely focused in April 2008, to potentially 11 billion barrels of crude oilNorth Dakota. Our 2015 drilling activity in North Dakota alone, as reported byfocused on the North Dakota Industrial Commission (“NDIC”)continued development of de-risked, higher rate-of-return areas in January 2011. In October 2011, the USGS began a study to update their 2008 assessment of recoverable reserves for the Bakken field to include reserves from the Three Forks formation and take into account improved well performance due to advances in drilling, completion and production technologies. Resultscore parts of the USGS study may be announced in late 2013.Industry-wide production fromplay and the Bakken field reached a record 801,500 Boe per day in October 2012, up 55% over October 2011 based on data published by IHS Inc. Industry-wide drilling activity in the Bakken field also reached record levels at 229 rigs in June 2012. North Dakota now ranks as the second largesttesting of various enhanced completion technologies to determine optimal methods for maximizing crude oil producing state in the U.S. due to production growth in the Bakken field. We continue to be a leader in the developmentrecoveries and expansionrates of the Bakken field and control the largest leasehold position with approximately 1,725,089 gross (1,139,803 net) acres as of December 31, 2012. We are also the most active driller in the Bakken field, with 21 operated rigs drilling as of February 15, 2013. During 2012,return.573650 gross (204.1(181 net) wells in the Bakken. Our Bakken field. Our properties within the Bakken field represented 74%56% of our PV-10 as ofat December 31, 20122015 and 63%61% of our average daily Boe production for the three months ended December 31, 2012. As of December 31, 2012 we had completed 1,887 gross (757.7 net) wells in the Bakken field.2015 fourth quarter. Our inventory of proved undeveloped drilling locations in the Bakken field as of December 31, 2012 totaled 1,501 gross (847.3 net) wells.During 2012, we saw our production, reserves and acreage position in the Bakken field grow while substantial portions of our undeveloped acreage continued to be de-risked due to the record levels of drilling activity in North Dakota. Our Bakken field production averaged 67,522 Boe per day during the three months ended December 31, 2012, up 64% from our average daily Bakken field production for the three months ended December 31, 2011. Our total proved Bakken field reserves at December 31, 2012 were 564 MMBoe, up 92% over our proved Bakken field reserves as of December 31, 2011.Our development drilling activity accelerated in 2012 since much2015 were 663 MMBoe, which represents a decrease of the Bakken field is now entering the development mode. This allowed us23% compared to increase the use of our ECO-Pad technology in 2012. Using ECO-Pad technology allows us to utilize more efficient centralized production facilities that accelerate production and reduce the environmental footprint of our operations. Combined, we expect these efficiencies will result in reduced costs for wells drilled from ECO-Pads. Approximately 18% of our operated wells completed in 2012 were drilled from ECO-Pads. At February 15, 2013, 67% of our 21 operated rigs in the Bakken were capable of ECO-Pad drilling and 14 rigs were actively drilling pad locations.We strengthened our Bakken focus in 2012 by executing strategic property acquisitions throughout the year, which allowed us to increase our ownership in existing and future operated and non-operated wells in the play. We believe the acquisitions will allow us to leverage the scale and efficiency of our Bakken operations to help lower our drilling and completion costs. As a result of our leasing and acquisition activities, we increased our net acreage position in the Bakken field by 24% during 2012, from 915,863 net acres as of December 31, 20112014 due in part to 1,139,803 net acres as of December 31, 2012. Approximately 51% of our net acreagedownward reserve revisions in the Bakken field is developed2015 prompted by lower commodity prices and the remaining 49% of our net acreage is undeveloped as of December 31, 2012.We plan to invest approximately $2.4 billionchanges in drilling 558 gross (226.2 net) wells in the Bakken field during 2013, of which approximately 83% will be invested in North Dakota and the remaining 17% will be invested in Montana. We plan to average 22 rigs drilling in the Bakken field throughout the year, with 17 rigs located in North Dakota and 5 rigs in Montana.North Dakota Bakken. Our production and reserve growth in the Bakken field during 2012 came primarily from our activities in North Dakota. Production increased to an average rate of 59,019 Boe per day during the three months ended December 31, 2012, up 66% from the average daily rate for the three months ended December 31, 2011. Proved reserves grew 102% year-over-year to 518 MMBoe as of December 31, 2012. As of December 31, 2012, our North Dakota Bakken properties represented 67% of our PV-10 and 55% of our average daily Boe production for the three months ended December 31, 2012. We completed 526 gross (173.0 net) wells during 2012, bringing our total number of wells drilled in the North Dakota Bakken to 1,589 gross (576.5 net) as of December 31, 2012. As of December 31, 2012, we had 1,378,784 gross (866,967 net) acres in the North Dakota Bakken field, of which 55% of the net acreage is developed and 45% of the net acreage is undeveloped.plans. Our inventory of proved undeveloped locations stood at 1,421totaled 1,292 gross (791.3(705 net) wells as of December 31, 2012.2015.Our drilling activityrigs in the Bakken, all in North Dakota, which we subsequently decreased to four operated rigs in early 2016. We plan to average approximately fouroperated rigs in North Dakota Bakken field during 2012 was diversified, reflecting the extensive nature of our acreage position. With 866,967 net acresthroughout 2016. We plan to operate fewer rigs in the North Dakota Bakken in 2016 compared to 2015 as part of December 31, 2012, some areas of the field were under development while other areas were being tested through step-out and exploratory drilling. All combined,our efforts to align our 2016 capital expenditures with cash flows in 2012 we made significant progress in developing and expanding our North Dakota Bakken assets through strategic exploration, planning and technology.During 2012, we expanded the known productive extents of the Bakken field laterally and vertically through strategic step-out and exploratory drilling. Our step-out drilling continued to expand the productive footprint of the field west and east of the Nesson anticline. Of particular significanceresponse to the Company and the Bakken fieldcontinued decrease in general during 2012 was our ongoing exploration efforts to evaluate the Lower Three Forks formation. Through our independent coring program, we discovered there were three additional layers or “benches” of crude oil bearing reservoir rockprices in the Lower Three Forks formation. We refer to these three benches as the second, thirdlate 2015 and fourth benches of the Three Forks formation (“TF2”, “TF3” and “TF4”, respectively) and they are located approximately 50 to 150 feet below the traditional Middle Bakken (“MB”) and Upper Three Forks (“TF1”) reservoirs. This discovery redefined the Bakken petroleum system and prompted the NDIC to expand the definition of the Bakken reservoir to include all zones from 50 feet above the top of the Bakken formation down to the base of the Three Forks formation across much of the Bakken field in North Dakota.The discovery of three additional benches indicates the Lower Three Forks formation has the potential to add incremental reserves in the Bakken field. The existence of more reserves in place could potentially translate into an increase in recoverable reserves for the Company and the Bakken field as a whole. To determine if there are incremental reserves to be recovered from the Lower Three Forks formation, we have begun drilling wells to test the TF2, TF3 and TF4 reservoirs. early 2016.October 2011, we successfully completed our first well in the TF2. The Charlotte 2-22H was completed flowing 1,396 Boe per day from the TF2 and as of February 15, 2013 the well had produced 107 MBoe and continues to produce in line with a typical commercial TF1 producing well. In November 2012, we successfully completed the first well ever drilled in the TF3. The Charlotte 3-22H was completed flowing 953 Boe per day from the TF3 and as of February 15, 2013 had produced 33 MBoe and continues to produce in line with a typical commercial TF1 producing well. In 2013, we plan to drill 20 gross (15.2 net) strategically placed wells throughout our Bakken acreage to accelerate our assessment of the Lower Three Forks reservoirs.During 2013,2016, we plan to invest approximately $2.0 billion drilling 507$320 million to drill, complete and initiate production on 127 gross (185.2(26 net) wells in the North Dakota Bakken field. Approximately 18% of the capital expenditures are expected to be spent on exploratoryBakken. Our 2016 drilling to test the lower benches of the Three Forks formation and conduct multi-zone pilot development projects. These pilot development projects will test the viability of developing four reservoirs (MB, TF1, TF2, and TF3) on 320-acre and 160-acre spacing. The remainder of the capital expenditures are expected to be spent on drilling development and step-out wells in the field. As of February 15, 2013, we had 16 operated rigs drilling in the North Dakota Bakken and plan to operate 17 rigs drilling in the play through most of 2013.Montana Bakken. Our Montana Bakken properties are located primarily in the Elm Coulee field in Richland County, Montana. The Elm Coulee field was listed by the Energy Information Administration (“EIA”) in 2010 as the 17th largest onshore field in the lower 48 states of the United States ranked by 2009 proved liquid reserves. During 2012, we completed 47 gross (31.0 net) wells, bringing our total number of wells drilled in the Montana Bakken to 298 gross (181.2 net) wells as of December 31, 2012. Our production increased to an average rate of 8,503 Boe per day for the three months ended December 31, 2012, up 50% from the average daily rate for the three months ended December 31, 2011. As of December 31, 2012 our Montana Bakken properties represented 7% of our PV-10 and 8% of our average daily Boe production for the three months ended December 31, 2012. As of December 31, 2012, we owned 346,305 gross (272,836 net) acres in Montana Bakken, of which 39% of the net acreage is developed and the remaining 61% of the net acreage is undeveloped.In 2012, we continued to expand the proven extents of the Elm Coulee field using state of the art drilling and completion technology. Areas once considered non-commercial based on old open hole completion technologyhave now proven to be commercial using cased hole, multi-stage fracture stimulation technology. During 2012, our well completions in the immediate Elm Coulee field area included in-field, step-out and strategic exploratory wells that were completed flowing at initial 24 hour rates of up to 1,301 Boe per day. Based on our 2012 drilling program the productive limits of the Elm Coulee field were expanded up to approximately 10 miles to the north onto portions of our undeveloped leasehold.We plan to invest approximately $426 million drilling 51 gross (41.0 net) wells in the Montana Bakken during 2013. Our drilling will focus on in-field development and continued expansiondrilling de-risked acreage in core parts of the Elm Coulee field onto ourplay that provide opportunities for converting undeveloped acreage northto acreage held by production, increasing capital efficiency, reducing finding and development costs, and maximizing rates of the field. As of February 15, 2013, we had 5 rigs drilling in the Montana Bakken and plan to maintain 5 rigs in the play through most of 2013. As of December 31, 2012, we had 80 gross (55.9 net) proved undeveloped locations identified in the Montana Bakken.eightnine units located along the Cedar Creek Anticline in North Dakota, South Dakota and Montana that produce crude oil and natural gas from the Red River “B” formation, a thin continuous, dolomite formation at depths of 8,000 to 9,500 feet.formation. Our principal producing properties in the Red River units include the Cedar Hills units in North Dakota and Montana, the Medicine Pole Hills units in North Dakota, and the Buffalo Red River units in South Dakota. Our properties in the Red River units comprise a portion of the Cedar Hills field, which was listed by the EIA in 2010 as the 9th largest onshore field in the lower 48 states of the United States ranked by 2009 proved liquid reserves.15%7% of our PV-10 as of December 31, 20122015 and 14%5% of our average daily Boe production for the three months ended December 2012. Productionfourth quarter of 2015. Our average daily production from these legacy properties increased 4%decreased 12% in 2012the fourth quarter of 2015 compared to 2011the fourth quarter of 2014 due to new wells being completednatural declines in production and enhanced recovery techniques being successfully applied. Proved reserves grew 22% year-over-yearreduced drilling activity. We undertook limited drilling activity in the Red River units in 2015, choosing instead to 78 MMBoe asallocate capital to areas in North Dakota Bakken and Oklahoma that generate more attractive rates of December 31, 2012. We are continuingreturn. For 2016, we plan to extend the peak performance life of our propertiesinvest approximately $8 million in the Red River units primarily by increasing our wateron well workover activities aimed at enhancing production and air injection capabilities and taking other measures to optimize production. As of December 31, 2012, we had 150,450 gross (135,483 net) acres in the Red River units, all of which is developed acreage.We have allocated $63 million of our 2013 capital expenditure budget to the Red River units, which will support one drilling rig and continued investment in facilities and infrastructure.are building uponutilize a portfolio approach (rail and pipe) to marketingmarket our crude oil that began in 2008 with our first shipments of crude oil by rail out of the Williston Basin. During 2012,Accessing new pipeline transportation optionality that came online in 2015, we accessed new market centers on the east and west coasts of the United States and expanded our marketing efforts along the U.S. gulf coast. This approach has provided flexibility to allow us to shift salesshifted a significant portion of our North region crude oil from rail transportation to pipeline transportation during the year. We plan to continue with a portfolio approach to reach the optimum markets that provide the most favorable pricing. During 2012, we moved from predominantly using pipelinesin an effort to delivermaximize wellhead value for our North region crude oil to traditional market centers in Guernsey, Wyoming and Clearbrook, Minnesota to using rail deliveries into U.S. coastal markets that yield superior pricing compared to the unstable mid-continent market centers.production.Rail transportation costs are typically higher than pipeline transportation costs per barrel mile; however, the premium received for our North region production being sold at Brent-based prices in U.S. coastal markets compared to mid-continent West Texas Intermediate (“WTI”) benchmark pricing has more than offset the increased transportation costs. We expect that rail transportation will take a prominent role in crude oil deliveries out of the North region throughout 2013 and then may lessen in significance as additional pipeline infrastructure is built out of the Williston Basin to the great lakes, upper mid-west, southern mid-continent and gulf coast regions of the United States. We expect rail transportation costs will then be impacted by pressure to compete with pipeline economics.We anticipate volatility in price differentials between the mid-continent and coastal markets will continue through 2013 as infrastructure is built out and refiners establish a desire for the high quality grade of Bakken crude oil. We believe the Bakken field contains superior quality crude oil with ample supply and volume growth to meet refiners’ needs for years to come.Transportation infrastructure continues to improve in the North region with gathering systems picking up crude oil at well site storage tanks with subsequent delivery to railhead or regional pipeline terminals, thereby mitigating the need for truck deliveries. We expect more of our North region crude oil will be shipped in this fashion through the coming years, especially as we accelerate development drilling using ECO-Pad technology.at a rapid pace in the Williston Basin in 20122015 as third party midstream gathering and processing companies expanded field gathering and compression facilities, cryogenic processing capacity and natural gas liquids (“NGL”) pipeline and rail capacity to market centers. Aided by improved infrastructure,In 2015, we reducedcontinued to be a leader in minimizing natural gas flaring in North Dakota. For the percentageyear ended December 31, 2015, we delivered approximately 87% of our operated natural gas production being flared in North Dakota Bakken to market, flaring approximately 13% compared to an average of 18% flared by approximately 50%industry peers operating in 2012. During December 2012, we flared approximately 10% of produced natural gas volumes on our operated North Dakota Bakken wells and expect to further reduce this amount as we continue to build out infrastructure and transition to a greater use of ECO-Pad development in 2013 and beyond.the play.10%37% of our PV-10 as of December 31, 20122015 and 21%34% of our average daily Boe production for the three months ended December 31, 2012.fourth quarter of 2015. For the three months ended December 31, 2012,2015 fourth quarter, our average daily production from such properties was 22,62076,025 Boe per day, up 36%an increase of 56% from the samecomparable period in 2011. Our principal producing properties in this region are located in the Anadarko and Arkoma basins of Oklahoma, as well as various basins in Texas and Louisiana.Oklahoma Woodford ShaleThe Oklahoma Woodford is a widespread unconventional shale reservoir that produces crude oil, natural gas and natural gas condensate in various basins across the state of Oklahoma.2014. Our principal producing properties in the Oklahoma WoodfordSouth region are located in the AnadarkoSCOOP, Northwest Cana and Arkoma basins. Combined, these propertiesSTACK areas of Oklahoma.9%31% of our PV-10 as of December 31, 20122015 and 19%29% of our average daily Boe production for the three months ended December 31, 2012. Production from the Oklahoma Woodford for 2012 totaled 7,099 MBoe, up 100% over 2011. Average daily production for our Oklahoma Woodford properties for the three months ended December 31, 2012 was 20,064 Boe per day, up 49% over our average daily production for the three months ended December 31, 2011. Asfourth quarter of December 31, 2012, we held 804,025 gross (428,192 net) acres in the Oklahoma Woodford. As of December 2012, 28% of the net acreage is developed and the remaining 72% of the net acreage is undeveloped.During 2012, we completed 93 gross (48.7 net) Oklahoma Woodford wells. During 2013, we plan to invest approximately $455 million drilling 92 gross (41.9 net) wells in the Oklahoma Woodford. As of February 15, 2013 we had 6 rigs drilling in the Oklahoma Woodford and plan to operate an average of 9 rigs in the play through most of 2013.In 2012, we divided our Anadarko Woodford assets into two projects we refer to as SCOOP and Northwest Cana. Our wells in the SCOOP area typically produce significantly more crude oil and natural gas liquids than wells in Northwest Cana and provide a higher rate of return on the dollars we invest. Consequently, our drilling and development plans for SCOOP differ from our plans for Northwest Cana. As a result, we now report and discuss the two areas separately. The difference between the SCOOP and Northwest Cana areas is rooted in our geologic model that determined the SCOOP area is ideally suited for crude oil and liquids rich production from the Woodford reservoir. Due to the depositional, tectonic and thermal history of the SCOOP area, we believe it contains some of the best and thickest Woodford reservoir rocks in Oklahoma. The Woodford formation isthought to be the source of much of the crude oil produced from over 60 different conventional reservoirs in Oklahoma since the early 1900s. Three of the largest crude oil producing counties in Oklahoma are located in the SCOOP play.SCOOPOur SCOOP properties are located in southern Oklahoma primarily in Garvin, Grady, Stephens, Carter, McClain and Love Counties. SCOOP represented 7% of our PV-10 as of December 31, 2012 and 7% of our average daily Boe production for the three months ended December 31, 2012.2015. For the year ended December 31, 2012,2015, SCOOP production grew 297%75% over 20112014 due to the continued success of our drilling activity in the play. We completed 204 gross (74 net) wells in SCOOP during 2015. Proved reserves increased drilling activity. For the three months ended December 31, 2012, SCOOP production averaged 7,123 Boe per day, up 281% over our average daily production for the three months ended December 31, 2011. As12% year-over-year to 413 MMBoe as of December 31, 2012 we held 412,816 gross (218,167 net) acres under lease in SCOOP. As2015, of December 31, 2012, 10% of the net acreage iswhich 32% represents proved developed and the remaining 90% of the net acreage is undeveloped.reserves. Our inventory of proved undeveloped drilling locations in SCOOP as of December 31, 20122015 totaled 122370 gross (58.4(224 net) wells.We completed 47 gross (24.8 net) wells in SCOOP during 2012 and as of December 31, 2012 we had completed a total of 68 gross (37.2 net) wells in SCOOP. Although SCOOP is in the early stages of development, industry-wide drilling results through December 31, 2012 have established a crude oil producing fairway and a condensate rich, natural gas producing fairway that combined is approximately 15 to 20 miles wide and 120 miles long. Our internal reserve models estimate wells in the SCOOP crude oil fairway may produce approximately 626 MBoe per well and wells in the SCOOP’s condensate rich natural gas fairway may produce approximately 1,190 MBoe per well. The SCOOP area could prove to be another significant opportunity for reserve and production growth for the Company.A possible upside to SCOOP is the potential to encounter additional pay from a variety of conventional and potential unconventional reservoirs overlying and underlying the Woodford formation. There are over 60 different conventional reservoirs known to produce in the SCOOP area. These conventional reservoirs have the potential to produce locally under our SCOOP acreage.2013,2016, we plan to invest approximately $450$260 million to drill, 90complete and initiate production on 113 gross (40.5(25 net) wells in the SCOOP play. We also expectOur 2016 drilling program will continue to invest approximately $9 millionfocus on expanding the known productive extents of the SCOOP Woodford and SCOOP Springer formations and de-risking our acreage, while focusing on areas that provide opportunities for converting undeveloped acreage to acquire 103 square milesacreage held by production, increasing capital efficiency, reducing finding and development costs, and maximizing rates of additional proprietary 3D seismic data to guide future drilling.return. As of February 15, 2013,December 31, 2015, we had 6six operated rigs drilling in the SCOOP. WeSCOOP play and plan to addaverage approximately five to six operated rigs throughout the year targeting 12 rigs by December 2013 with an expected average rig count of 9 for 2013.in northwestern Oklahoma primarily in Blaine, Dewey and Custer Counties.Counties of Oklahoma and primarily target the Woodford formation. In September 2014, we entered into an agreement with a U.S. subsidiary of SK E&S Co. Ltd (“SK”) of South Korea to jointly develop a significant portion of our Northwest Cana natural gas properties, primarily in Blaine and Dewey counties. Under the agreement, SK has committed to fund, or carry, 50% of our share of certain future drilling and completion costs through September 2019, which has enabled us to generate favorable economics and value from previously idle properties in Northwest Cana. As of December 31, 2015, we had five operated rigs drilling in Northwest Cana and plan to average approximately five operated rigs throughout 2016 to capitalize on the favorable economics provided by our joint development agreement with SK. In 2016, we plan to invest approximately $62 million to drill, complete and initiate production on 28 gross (11 net) wells in Northwest Cana within the area of mutual interest with SK.2%5% of our PV-10 as of December 31, 2012 and 9% of our average daily Boe production for the three months ended December 31, 2012. For the year ended December 31, 2012, Northwest Cana production grew 134% over 2011 due to our increased drilling activity. For the three months ended December 31, 2012, Northwest Cana production averaged 9,716 Boe per day, up 22% over our average daily production for the three months ended December 31, 2011. As of December 31, 2012 we held 271,743 gross (178,432 net) acres under lease in Northwest Cana. As of December 31, 2012, 40% of the net acreage is developed and the remaining 60% of the net acreage is undeveloped. During 2012, we completed 43 gross (22.8 net) wells in Northwest Cana and as of December 31, 2012 we had completed a total of 161 gross (73.3 net) wells in Northwest Cana. We had a total of 90 gross (38.6 net) proved undeveloped locations on our Northwest Cana acreage as of December 31, 2012. No significant drilling or development plans are expected to take place in the Northwest Cana play in 2013 due to the pricing environment for natural gas.Arkoma WoodfordThe Arkoma Woodford represented less than 1% of our PV-10 as of December 31, 20122015 and 3% of our average daily Boe production for the three months ended December 31, 2012. Year-over-year, Arkoma Woodford production decreased 2% due to the suspensionfourth quarter of our drilling program in 2012 due to the pricing environment for natural gas. In 2012, we completed 3 gross (1.1 net) wells, compared to 18 gross (4.8 net) wells in 2011.2015. As of December 31, 20122015, we had completedheld a total of 395 gross (59.6 net) wells in the Arkoma Woodford play. As of December 31, 2012, we held 119,466 gross (31,593 net)155,221 net acres under lease in Northwest Cana and STACK, representing acreage available for drilling in the Arkoma Woodford play. Approximately 83% of our net acreage is developedformation (Northwest Cana) and the remaining 17%Meramec and Osage formations (STACK) overlying the Woodford and inclusive of 38,600 total net acres of Woodford drilling rights in the area of mutual interest established under our net acreage is undevelopedNorthwest Cana joint development agreement with SK.2012. We had a total2015, of 22 gross (15.2 net)which 25% represents proved developed reserves. Our combined inventory of proved undeveloped locations in the Arkoma Woodfordstood at 198 gross (66 net) wells as of December 31, 2012. In 2013, we do not plan on drilling any new wells in the play.Due to the proximity of our Our South region operationsproduction is located in relatively close proximity to regional refineries as well as the market centercrude oil trading hub located in Cushing, Oklahoma,Oklahoma. Because of this close proximity to local markets as well as Cushing, we typically sellare able to market our South region production directly to midstream trading and transportation companies atwith the wellhead with price realizations that correlate with WTI benchmark pricing. We anticipate continuing this approach through early 2013 and to begin deliveryintent of production from our SCOOP properties via wellhead pipeline gathering systems directly into Cushing as field infrastructure is constructed and developed.During 2013, we expectcapturing the disparity of WTI pricing to Brent pricing will begin to improve asbest market prices available depending on the recently expanded Seaway Pipeline begins to alleviate the oversupply of crude oil at Cushinggrade and as Permian Basin production beginslocation. We use the competition among refineries, midstream companies, and bulk traders in an effort to take newly-developed routes to gulf coast market centers that do not go to or through Cushing.2012,2015, field infrastructure build-out continued at a rapid pace in the Anadarko Basin and in SCOOP as third party midstream gathering and processing companies expanded field gathering and compression facilities, cryogenic processing capacity and NGL pipeline capacity to market centers. On January 1, 2016 a third party placed a new lateral into service that connects to an existing plant which provides a connection to an interstate pipeline system for sales to downstream customers.2012, 20112015, 2014 and 20102013 in total and for each field containing 15 percent or more of our total proved reserves as of December 31, 2012: Year Ended December 31, 2012 2011 2010 15,936 8,480 4,450 25,070 16,469 11,820 16,454 7,523 3,994 63,875 36,671 23,943 18,679 9,733 5,116 35,716 22,581 15,811 $ 84.50 $ 88.43 $ 70.09 84.59 88.51 70.69 5.55 7.18 6.38 4.20 5.24 4.49 76.95 82.56 65.94 66.83 73.05 59.70 $ 4.31 $ 4.05 $ 2.94 5.49 6.13 5.87 6.42 6.42 4.82 3.42 3.23 3.09 19.44 17.33 15.33 Year ended December 31, 2015 2014 2013 Net production volumes: Crude oil (MBbls) (1) North Dakota Bakken 37,539 30,917 23,513 SCOOP 7,198 3,652 2,004 Total Company 53,517 44,530 34,989 Natural gas (MMcf) North Dakota Bakken 47,425 33,610 26,783 SCOOP 91,687 55,017 29,438 Total Company 164,454 114,295 87,730 Crude oil equivalents (MBoe) North Dakota Bakken 45,444 36,518 27,977 SCOOP 22,479 12,822 6,910 Total Company 80,926 63,579 49,610 Average sales prices: (2) Crude oil ($/Bbl) North Dakota Bakken $ 39.76 $ 80.22 $ 89.45 SCOOP 43.98 87.58 95.63 Total Company 40.50 81.26 89.93 Natural gas ($/Mcf) North Dakota Bakken $ 2.34 $ 6.63 $ 5.94 SCOOP 2.39 5.23 5.25 Total Company 2.31 5.40 4.87 Crude oil equivalents ($/Boe) North Dakota Bakken $ 35.29 $ 73.96 $ 80.87 SCOOP 23.81 47.35 50.08 Total Company 31.48 66.53 72.04 Average costs per Boe: (2) Production expenses ($/Boe) North Dakota Bakken $ 4.79 $ 5.67 $ 5.50 SCOOP 1.10 1.13 0.99 Total Company 4.30 5.58 5.69 Production taxes and other expenses ($/Boe) $ 2.47 $ 5.54 $ 6.02 General and administrative expenses ($/Boe) (3) $ 2.34 $ 2.92 $ 2.91 DD&A expense ($/Boe) $ 21.57 $ 21.51 $ 19.47 (1) Crude oil sales volumes differ from production volumes because, at various times, we have stored crude oil in inventory due to pipeline line fill requirements, low commodity prices, or transportation constraintsmarketing disruptions or we have sold crude oil from inventory. Crude oil sales volumes were 112147 MBbls more than production volumes for 2015, 408 MBbls less than production volumes for the year ended December 31, 2012, 302014, and 4 MBbls less than production volumes for the year ended December 31, 2011 and 78 MBbls more than production volumes for the year ended December 31, 2010.2013.(2) Average sales prices and per unit costs have been calculated using sales volumes and exclude any effect of derivative transactions. (3) General and administrative expense ($/Boe) includes non-cash equity compensation expenses of $0.82$0.64 per Boe, $0.73$0.86 per Boe, and $0.74$0.80 per Boe for the years ended December 31, 2012, 20112015, 2014 and 2010,2013, respectively, and corporate relocation expenses of $0.22 per Boe and $0.14$0.04 per Boe for the years ended December 31, 2012 and 2011, respectively. No corporate relocation expenses were incurred in 2010.2013.duringfor the fourth quarter of 2012: Fourth Quarter 2012 Daily Production Crude Oil
(Bbls per day) Natural Gas
(Mcf per day) Total
(Boe per day) 49,947 54,432 59,019 7,368 6,811 8,503 10,638 2,519 11,058 3,189 2,812 3,658 377 3,542 967 2,280 29,056 7,123 902 52,886 9,716 14 19,265 3,225 735 10,921 2,556 999 45 1,006 76,449 182,289 106,831 Fourth Quarter 2015 Daily Production Crude Oil
(Bbls per day) Natural Gas
(Mcf per day) Total
(Boe per day)North Region: Bakken field North Dakota Bakken 102,785 136,785 125,583 Montana Bakken 9,142 9,785 10,772 Red River units Cedar Hills 8,353 1,829 8,658 Other Red River units 2,560 2,619 2,996 Other 188 4,281 902 South Region: SCOOP 20,766 262,608 64,534 Northwest Cana/STACK 1,242 38,800 7,709 Arkoma Woodford 3 12,724 2,124 Other 537 6,729 1,658 Total 145,576 476,160 224,936 2012: Crude Oil Wells Natural Gas Wells Total Wells Gross Net Gross Net Gross Net 1,466 493 6 1 1,472 494 265 175 2 1 267 176 286 258 2 2 288 260 16 9 5 2 21 11 19 8 44 26 63 34 9 5 151 68 160 73 1 — 394 60 395 60 211 165 243 121 454 286 2,273 1,113 847 281 3,120 1,394 As of December 31, 2012, we did not own interests2015.any wells containing multiple completions. Crude Oil Wells Natural Gas Wells Total Wells Gross Net Gross Net Gross Net North Region: Bakken field North Dakota Bakken 3,700 1,196 — — 3,700 1,196 Montana Bakken 421 272 2 1 423 273 Red River units Cedar Hills 137 132 — — 137 132 Other Red River units 134 120 — — 134 120 Other 9 4 16 4 25 8 South Region: SCOOP 180 123 321 97 501 220 Northwest Cana/STACK 14 10 176 57 190 67 Arkoma Woodford 1 — 383 56 384 56 Other 176 136 199 96 375 232 Total 4,772 1,993 1,097 311 5,869 2,304 upon acquisition of undeveloped leaseholds which do not have proved reserves.to determine fee mineral ownership. Such title examinations are reviewed and approved by Company landmen. Upon entering into a purchase and sale agreement for an acquisition from a third party, whether lands are producing crude oil and natural gas leases or non-producing, Company and contract landmen perform title examinations at applicable courthouses and examine the seller's internal land, legal, well, marketing and accounting records including existing title opinions. We may also procure an acquisition title opinion from outside legal counsel on higher value properties.on those properties, we procure aan original title opinion, or supplement an existing title opinion, from externaloutside legal counsel and perform curative work necessary to satisfy requirements pertaining to material title defects.defects, if any. We generally will not commence drilling operations on aproperty until we have cured material title defects on such property. as to the Company's interest.Prior to completing an acquisition of producing crude oil and natural gas leases, Company and contract landmen perform title examinations at applicable courthouses and examine the seller’s internal land/legal records including existing title opinions. We may procure a title opinion depending on the materiality of the properties involved. Our crude oil and natural gas properties are subject to customary royalty and other interests, liens to secure borrowings under our revolving credit facility, and otherleasehold burdens which we believe do not materially interfere with the use of the properties or affect our carrying value of such properties.end userscrude oil refining companies at major market centers. Other production not sold at major market centers is sold to select midstream marketing companies or crude oil refining companies at the lease. We have significant production directly connected to pipeline gathering systems, with the remaining balance of our production being transported by truck or rail. Where directly marketed crude oil is transported by truck, it is delivered to the most practicala point on a connected pipeline system for delivery to a sales point “downstream” on another connecting pipeline. CrudeWhen crude oil is sold at the lease is delivered directly onto the purchaser’s truck and the sale is complete at that point.As a resultpipeline constraints, the continuous increase in Williston Basin production, and our desire to transport our crude oil to coastal markets which currently provide the most favorable pricing, in December 2012 we transported approximately 72% of our operated crude oil production from the Bakken field by rail. We are using both manifest and unit train facilities for these shipments and anticipate these shipments will continue.We have a strategic mix of gas transport, processing and sales arrangements for our natural gas production. Our natural gas production is sold at various points along the market chain from wellheadour lease locations to points downstreammidstream purchasers under monthly interruptible packaged-volume deals, short-term seasonal packages, and long-termterm contracts. These contracts include multi-year term agreements with acreage dedication type contracts. All of our natural gas is sold at market.dedication. Some of our contracts allow us the flexibility to sellaccept, as partial payment for our sale of gas in the field, an “in-kind” volume of processed gas at the well or,tailgate of the midstream purchaser’s processing plant. When we elect to do so, we transport this processed gas to a downstream market where it is sold. Sales at these downstream markets are mostly under monthly interruptible packaged volume deals, short term seasonal packages, and long term multi-year contracts. We continue to develop relationships and have potential future contracts with notice, take our gas “in-kind”, transport, process,end-use customers, including utilities, industrial users, and sell in the market area. Midstreamliquefied natural gas gathering and processing companies areexporters, for sale of gas we elect to take in-kind in lieu of cash for our primary transporters and purchasers.yearsyear ended December 31, 2012, 2011 and 2010, crude oil2015, sales to Marathon Crude OilPhillips 66 Company accounted for approximately 21%, 41% and 57% of our total crude oil and natural gas revenues, respectively. Additionally, crude oil sales to United Energy Trading accounted for approximately 11% of our total crude oil and natural gas revenues for the year ended December 31, 2012.revenues. No other purchasers accounted for more than 10% of our total crude oil and natural gas revenues for 2012, 2011 and 2010.2015. We believe the loss of our largestany single purchaser would not have a material adverse effect on our operations, as crude oil and natural gas are fungible products with well-established markets and numerous purchasers in our producingvarious regions.In addition, shortages or thehigh cost of drilling rigs, equipment or other services could delay or adversely affect our development and exploration operations. Our ability to acquire additional prospects and to find and develop reserves in the future will depend on our ability to evaluate and select suitable properties and to consummate transactions economically in a highly competitive environment.All of ourthe crude oil and natural gasour industry have been and are pervasive and are continuously reviewed by legislators and regulators, includingresulting in the imposition of new or increased requirements on us and other industry participants. Applicable laws and regulations and other requirements affecting our industry and its members often carry substantial penalties for failure to comply. SuchThese requirements may have a significant effect on the exploration, development, production and sale of crude oil and natural gas. These requirementsgas and increase the cost of doing business and consequently, affect profitability. We believe we are in substantial compliance with all laws and regulations and policies currently applicable to our operations and our continued compliance with existing requirements will not have a material adverse impact on us. However,In addition, because public policy changes affecting the crude oil and natural gas industry are commonplace and because laws, rules and regulations may be enacted, amended or reinterpreted, we are unable to predict the future cost or impact of complying with such laws, rules and regulations. We do not expect any future legislative or regulatory initiatives will affect our operationsus in a manner materially different than they would affect our similarly situated competitors.FollowingSalessales and Transportationtransportation of Crude Oilcrude oil and Natural Gas Liquidsregulatedsubject to price controls and are made at negotiated prices. Nevertheless, the U.S. Congress could enact price controls in the future. TheSince the 1970s, the United States does regulatehas regulated the exportation of petroleum and petroleum products, and these regulations could restrictwhich restricted the markets for these commodities and thus affectaffected sales prices. However, in December 2015, the U.S. Congress passed a legislative bill eliminating the export restrictions.Industry.Industry—FTC and CFTC Market Manipulation Rules.” ShouldIf we violate the anti-market manipulation laws and regulations, we could be subject to substantial penalties and related third-party damage claims by, among others, sellers, royalty owners and taxing authorities.1992.1992 and the rules and regulations promulgated under those laws. In general, such pipeline rates must be just and reasonable and must not be unduly discriminatory or confer any undue preference upon any shipper. Oil and other liquid pipeline rates are often cost-based, although many pipeline charges today are based on historical rates adjusted for inflation and other factors, and other charges may result from settlement rates agreed to by all shippers or market-based rates, which are permitted in certain circumstances. FERC or interested persons may challenge existing or changed rates or services. Intrastate crude oil and NGL pipeline transportation rates may be subject to regulation by state regulatory commissions. The basis for intrastate pipeline regulation, and the degree of regulatory oversight and scrutiny given to intrastate crude oil pipeline rates, varies from state to state. Insofar as the interstate and intrastate transportation rates we pay are generally applicable to all comparable shippers, we believe the regulation of intrastate transportation rates will not affect our operationsus in a way that materially differs from the effect on the operations of our competitors who are similarly situated.Salessales and Transportationtransportation of Natural Gasthat willto put natural gas sellers into more direct contractual relations with natural gas buyers by, among other things, unbundling the sale of natural gas from the sale of transportation and storage services. The FERC has issued a series of orders to implement its open access policies. As a result, the interstate pipelines’ traditional role as wholesalers of natural gas has been eliminated and replaced by a structure under which pipelines provide transportation and storage services on an open access basis to others who buy and sell natural gas. Although the FERC’s orders do not directly regulate natural gas producers, they are intended to foster increased competition within all phases of the natural gas industry. We cannot provide any assurance that the pro-competitive regulatoryothersimilarly situated natural gas producers.Industry.Industry—FTC and CFTC Market Manipulation Rules.” ShouldIf we violate the anti-market manipulation laws and regulations, we could be subject to substantial penalties and related third-party damage claims by, among others, sellers, royalty owners and taxing authorities. In addition, pursuant to various FERC orders, we may be required to submit reports to the FERC for some of our operations. See the discussion below of “Other Federal Laws and Regulations Affecting Our Industry—FERC Market Transparency and Reporting Rules.”our operations,us, but the natural gas industry could be required to incur additional capital expenditures and increased costs depending on futureour operationsus in a way that materially differs from the effect on the operations of our similarly situated competitors.Productionwells.wells, as well as regulations that generally limit or prohibit the venting or flaring of natural gas. The effect of these regulations is to limit the amount of crude oil and natural gas we can produce from our wells and to limit the number of wells or the locations at which we can drill, although we can apply for exceptions to such regulations or to have reductions in well spacing. Moreover, each state generally imposes a production, severance or excise tax with respect to the production and sale of crude oil, natural gas and natural gas liquids within its jurisdiction.restrictions that affectrestrictions.operations.Other Federal Laws and Regulations Affecting Our IndustryThis financial reform legislation includes provisionsThe Dodd-Frank Act established federal oversight and regulation of the over-the-counter derivatives market and entities, such as us, that require derivative transactionsparticipate in that are currently executed over-the-counter to be executed through an exchange and be centrally cleared.market. The Dodd-Frank Act requires the CFTC, the SEC, and other regulators to establish rules and regulations to implement the new legislation. TheAlthough the CFTC has issued final regulations to implement significant aspects of the legislation, including newothers remain to be finalized or implemented and it is not possible at this time to predict when this will be accomplished.for the registration of swap dealers and major swap participants (and related definitions of those terms), definitions of the term “swap,” rules to establish the ability to rely on the commercial end-user exception from the central clearing and exchange trading requirements, requirements for reporting and recordkeeping, rules on customer protection in the context of cleared swaps, andestablishing position limits with respect to certain futures and option contracts and equivalent swaps, subject to exceptions for swaps and other transactions based oncertain bona fide hedging. As these new position limit rules are not yet final, the price of certain reference contracts, some of which are referenced in our swap contracts. The position limits regulation has been vacated by a Federal court, and the CFTC is appealing that decision; accordingly, the effective dateimpact of these rules, if they are reinstatedprovisions on appeal, or of replacement rules proposed and adopted byus is uncertain at this time.CFTC, if applicable, is not currently known. Key regulations that have not yet been finalized include those establishing margin requirements for uncleared swaps, regulatory capital requirements for swap dealers and various trade execution requirements.On December 13, 2012, the CFTC published final rules regardingDodd-Frank Act, mandatory clearing ofis now required for all market participants, unless an exception is available. The CFTC has designated certain interest rate swaps and certain index credit default swaps and setting compliance dates for different categories of market participants, the earliest of which is March 11, 2013.mandatory clearing. The CFTC has not yet proposed any rules requiringrequired the clearing of any other classes of swaps, including physical commodity swaps.swaps, and the trade execution and revised capital requirements applicable to other market participants, such as swap dealers, along with changes to the markets for swaps as a result of the trade execution requirement, may change the cost and availability of the swaps we use for hedging.The CFTC’s swap regulations may require or cause our counterparties to collect margin from us, and if If any of our swaps do not qualify for the commercial end-user exception, or if the cost of entering into uncleared swaps becomes prohibitive, we may be required to clear such transactions or execute them on a derivatives contract market or swap execution facility. The ultimate effect of the proposed new rules and any additional regulations on our business is uncertain. Of particular concern is whetherstatuscommercial risks, the application of such requirements to other market participants, such as aswap dealers, may change the cost and availability of the swaps we use for hedging. If any of our swaps do not qualify for the commercial end-user will allowexception, the posting of collateral could reduce our derivative counterpartiesliquidity and cash available for capital expenditures and could reduce our ability to not require us to post margin in connection with ourmanage commodity price risk management activities. The remaining final rulesvolatility and the volatility in our cash flows.major provisionsproprietary trading adopted under Section 619 of the legislation, suchDodd-Frank Act, also known as new margin requirements, will be established through regulatory rulemaking. the Volcker Rule, may alter the business practices of some of our counterparties and in some cases may cause them to stop transacting in or making markets in derivatives. Moreover, federal banking regulators are reevaluating the authorization under which banking entities subject to their authority may engage in physical commodities transactions. in this area, to the extent applicable to us or our derivative counterparties, may result in increased costs and cash collateral requirements for the types of derivative instruments we use to manage our financial and commercial risks related to fluctuations in commodity prices. Additional effects of the new regulations, including increased regulatory reporting and recordkeeping costs, increased regulatory capital requirements for our counterparties, and market dislocations or disruptions, among other consequences, could have an adverse effect on our ability to hedge risks associated with our business.as described further below. provided the FERC with additional civil penalty authority. The EPAct 2005 provides the FERC with the power to assess civil penalties of up to $1,000,000 per day per violation for violations of the NGA and NGPA. Under EPAct 2005,NGPA and the FERC also has authority to order disgorgement of profits associated with any violation. The anti-market manipulation rules and enhanced civil penalty authority reflect an expansion of the FERC’s enforcement authority.provided under the EPAct 2005. 4, 2009, and prohibits fraudulent or deceptive conduct (including false or misleading statements of material fact) inThe Rule also bans intentional failures to state a material fact when the omission makes a statement misleading and distorts, or is likely to distort, market conditions for any product covered by the Rule. The FTC holds substantial enforcement authority underUnder the EISA, includingthe FTC has authority to request that a court to impose fines of up to $1,000,000 per day per violation. Under the Commodity Exchange Act, theThe CFTC is directed to prevent price manipulations for the commodity and futures markets, including the energy futures markets. Pursuant to the Dodd-Frank Act, the CFTC has also adopted anti-market manipulation regulations that prohibit, among other things, fraud and price manipulation in the commodity and futures markets. The CFTC also has statutory authority tomay assess fines of up to the greater of $1,000,000 or triple the monetary gain for violations of its anti-market manipulation regulations.of these or the above regulatory changes tolaws and regulations may have on our crude oil and natural gas operations. We do not believe we will be affected by any such action in a materially different way than our similarly situated competitors.Healthhealth and Safety Regulationsafety regulationGeneral. Our operationsWe are subject to stringent and complex federal, state, and local laws, rules and regulations governing environmental protection, health and safety,compliance, including the discharge of materials into the environment.environment, and worker health and safety. These laws, rules and regulations may, among other things:beforeto conduct exploration, drilling commences; andwells. initiatives. Continental is committed to conducting its operations in a manner that protects the health, safety and welfare of the public, its employees and the environment. We strive to operate in accordance with all applicable regulatory and legal requirements and have focused on continuously improving our health, safety, security and environmental (“HSS&E”HSE”) performance.performance; however, at times circumstances may arise that adversely affect our compliance with applicable HSE requirements. We believe excellent HSS&E performance is critical to the long-term success of our business,have established internal policies and is a key component in maximizing return to shareholders. We also believe achieving this excellence requires the commitment and involvement ofprocedures regarding HSE matters for all employees, in the Company, and we expect the same level of commitment from our contractors, and vendors. Our commitment to HSS&E excellence is a paramount objective.HSS&EHSE initiatives, we actively work to identify and manage theour environmental and safety risks and the impact of our operations. Further, we set corporate objectives aimed at producing continuous improvement ofoperations and improve our HSS&E efforts and we seek to provide the leadership and resources to enable our workforce to achieve our objectives.HSE efforts. We routinely monitor our HSS&EHSE performance to assess our conformitycompliance with environmental protection initiatives.We take a proactive and disciplined approach to emergency preparednesssafety initiatives and business continuity planning to address the health, safety, security, and environmental risks inherent to our industry. We continually train our workforce and conduct drills to improve awareness and readiness to mitigate such risks. Further, emergency response plans are maintained that establish procedures to be utilized during any type of emergency affecting our personnel, facilities or the environment. current focus of our HSS&EHSE initiatives is the reduction of air emissions produced from our operations, particularly with respect to the flaring of natural gas from our operated well sites in the Bakken field of North Dakota. North Dakota statutes permit flaring of natural gas from a well that has not been connected to a gas gathering line for a period of one year from the date of a well's first production. After one year, a producer is required to cap the well, connect it to a gas gathering line, find acceptable alternative uses for a percentage of the flared gas, or apply to the NDIC for a written exemption for any future flaring; otherwise, the producer is required to pay royalties and production taxes based on the volume and value of the gas flared from the unconnected well. While the NDIC ultimately determines the volume and value of any such gas flared and the applicable royalties and production taxes, the NDIC has thus far generally accepted our most active area. The rapid growthmethods for calculating these figures. Furthermore, the NDIC has generally accepted applications we have submitted to secure exemptions from the post-year flaring restrictions. Finally, NDIC rules for new drilling permit applications also require the submission of crude oilgas capture plans that address measures taken by operators to capture and not flare produced gas, regardless of whether it has been or will be connected within the first year of production. Thus far, the NDIC has generally accepted our gas capture plans submitted with applications for drilling permits. In September 2015, the NDIC extended the deadline to comply with the requirement to capture 85% of the natural gas produced from a well by one year, with a new compliance deadline of November 1, 2016.recent years, coupled2014, 11% in 2013 and 15% in 2012. Flaring from our operated well sites in the North Dakota Bakken is less than our industry peers operating in the play. According to data published by the NDIC, our industry as a whole flared approximately 18% of produced natural gas volumes in the state during 2015. We are a participant in the NDIC’s Flaring Reduction Task Force and are engaged in working with a lackother task force members and the NDIC to develop action plans for mitigating natural gas flaring in the state. Flared natural gas volumes from our operated SCOOP, Northwest Cana and STACK properties in Oklahoma are negligible given the existence of established natural gas transportation infrastructure in the state, has led to an industry-wide increase in flaring of natural gas produced in association with crude oil production. We recognize theinfrastructure.We set internal flaring reduction targets and toTo date, we have taken numerous actions to reduce flaring from our operated well sites. We make efforts to coordinate our well completion operations to coincide with well connections to gathering systems in order to minimize flaring, but may not always be successful in these efforts. Our ultimate goal is to reduce natural gas flaring from our operated well sites to as close to zero percent flaringmuch as possible. Inis practicable. For example, in operating areas such as the Buffalo Red River units in South Dakota, the quality of the natural gas is not adequate to meet requirements for sale, so we employ processes to efficiently combust the gas andin an effort to minimize impacts to the environment.In 2012, we made significant progress in achieving our Our levels of flaring reduction goals. For example, in 2012 we set a goal to reduce the flaring of natural gas from our operated well sites in North Dakota Bakken by 50% by December 2012. During December 2012, the percentage of our natural gas production flared in North Dakota Bakken was approximately 10% compared to approximately 20% in December 2011. We believe this reduction is a notable accomplishment given the significant increase in our natural gas production in 2012, including areas with less developed infrastructure. Flaring from our operated well sites in North Dakota Bakken is significantly less than our industry peers operating in the play. According to data published by the North Dakota Industrial Commission, our industry as a whole was flaring approximately 33% of produced natural gas volumes in the state as of late 2012. Since we are one of the largest producers in the North Dakota Bakken field, we believe the percentage of natural gas flared by the industry as a whole would be higher than 33% if Continental’s results were excluded from the NDIC’s data.We are experiencing similar or better flaring results in our other key operating areas outside of North Dakota. In Montana Bakken, we flared approximately 6% of the natural gas produced from our operated well sites in December 2012. Additionally, flared natural gas volumes from our operated SCOOP and Northwest Cana properties in Oklahoma are negligible given the existence of established natural gas transportation infrastructure in that state.Through our HSS&E global initiatives, we will continue to work toward maintaining an industry-leading position with respect to flaring reduction efforts in North Dakota and our other key operating areas. In the Medicine Pole Hills units, we substantially reduced impacts from flaring by removing all gas engines that drive high pressure air injection and converting to electric engines. We expect to further reduce flared natural gas volumes as we continue to build out transportation infrastructure and transition to a greater use of ECO-Pad drilling in 2013 and beyond. Our flaring reduction progress is and will be dependent upon external factors such as investment from third parties in the development of gas gathering systems, state regulations, and the granting of reasonable right-of-way access by land owners, among other factors.that the passage of more stringent laws or regulations in the future will not materially impact our financial position, or results of operations. to include, among others: (i) regulations by the Environmental Protection Agency (“EPA”) and various state agencies regarding approved methods of disposal for certain hazardous and nonhazardous wastes; (ii) the Comprehensive Environmental Response, Compensation, and Liability Act and analogous state laws that may require the removal of previously disposed wastes (including wastes disposed of or released by prior owners or operators), the cleanup of property contamination (including groundwater contamination), and remedial plugging operationslease restoration activities to prevent future contamination;contamination from prior operations; (iii) federal Department of Transportation safety laws and comparable state and local requirements; (iv) the Clean Air Act and comparable state and local requirements, which establish pollution control requirements with respect to air emissions from our operations; (v) the Oil Pollution Act of 1990, which contains numerous requirements relating to the prevention of and response to oil spills into waters of the United States; (vi) the Federal Water Pollution Control Act, or the Clean Water Act, and analogous state laws which impose restrictions and strict controls with respect to the discharge of pollutants, including crude oil and other substances generated by our operations, into waters of the United States or state waters; (vii) the Resource Conservation and Recovery Act, which is thea principal federal statute governing the treatment, storage and disposal of solid and hazardous wastes, and comparable state statutes; (viii) the Safe Drinking Water Act and analogous state laws which impose requirements relating to our underground injection activities; (ix) the National Environmental Policy Act and comparable state statutes, which require government agencies, including the Department of Interior, to evaluate major agency actions that have the potential to significantly impact the environment; (x) the federal Occupational SafetyEndangered Species Act and Healthcomparable state statutes, which afford protections to certain plant and animal species; (xi) the Migratory Bird Treaty Act, which imposes certain restrictions for the protection of migratory birds; (xii) the Bald and Golden Eagle Protection Act, which imposes certain restrictions for the protection of bald and golden eagles; (xiii) the Emergency Planning and Community Right to Know Act and comparable state statutes, which require that we organize and/or disclose information about hazardous materials stored, used or produced in our operations, and (xi)(xiv) state regulations and statutes governing the handling, treatment, storage and disposal of naturally occurring radioactive material. Any failure to comply with these laws, rules and regulations may result in the assessment of administrative, civil and criminal penalties, the imposition of corrective or remedial obligations, the issuance of orders enjoining performance of some or all of our operations, and potential litigation.ClimateAir emissions and climate change. Federal, state and local laws and regulations are increasingly being enacted to address concerns about the effects the emission of carbon dioxide and other identified “greenhouse gases” may have on the environment and climate worldwide. These effects are widelyworldwide, generally referred to as “climate change.” Since its December 2009 endangerment finding regarding the emission of carbon dioxide, methane and other greenhouse gases,For example, the EPA has begun regulatingadopted regulations under existing provisions of the federal Clean Air Act ("CAA") establishing, among other things, Prevention of Significant Deterioration (“PSD”) and construction and Title V operating permit reviews for certain large stationary sources. Facilities required to obtain PSD permits for greenhouse gas emissions are also required to meet “best available control technology” standards established on a case-by-under the federal Clean Air Act. Among severalsuch as electric power plants, to acquire and surrender emission allowances in return for emitting those greenhouse gases. Although it is not possible at this time to predict how such legislation or new regulations requiring reporting or permitting foradopted to address greenhouse gas sources, the EPA finalized its “tailoring rule” in May 2010 that identifies which stationary sourcesemissions would impact our business, any future laws and regulations imposing reporting obligations on, or limiting emissions of greenhouse gases are requiredfrom, our equipment and operations could require us to obtain permitsincur costs to construct, modify or operatereduce emissions of greenhouse gases associated with our operations. In addition, substantial limitations on account of, and to implement the best available control technology for, their greenhouse gases. In November 2010, the EPA also finalized its greenhouse gas reporting requirements for certain oil and gas production facilities that emit 25,000 metric tons or more of carbon dioxide equivalent per year. The rule requires annual reporting to the EPA of greenhouse gas emissions bycould adversely affect the demand for the crude oil and natural gas we produce. Finally, it should be noted that some scientists have concluded that increasing concentrations of greenhouse gases in the Earth’s atmosphere may produce climate changes that have significant physical effects, such regulated facilities.On April 17, 2012,as increased frequency and severity of storms, floods and other climatic events. If any such effects from such causes were to occur, they could have an adverse effect on our exploration and production operations.issued final rules thathas also established new air emission controls for crude oil and natural gas production and natural gas processing operations. These rules were published inoperations under the Federal Register on August 16, 2012. The EPA’s rule package includesCAA's New Source Performance Standards and National Standards for Emission of Hazardous Air Pollutants programs. With regard to address emissionsproduction activities, the rules require, among other things, the reduction of sulfur dioxide and volatile organic compoundscompound (“VOCs”VOC”) emissions from three subcategories of fractured and refractured gas wells for which well completion operations are conducted: wildcat (exploratory) and delineation gas wells; low reservoir pressure non-wildcat and non-delineation gas wells; and all “other” fractured and refractured gas wells. All three subcategories of wells must route flowback emissions to a separate set of emission standards to address hazardous air pollutants frequently associated with crude oilgathering line or be captured and natural gas production and processing activities. The final rules requirecombusted using a combustion device such as a flare. However, the “other” wells must use of reduced emission completions or “green completions” on all hydraulically-fractured wells completed or refractured after January 1, 2015 in order to achieve a 95 percent reduction in the emission of VOCs.completions.” The rules also establishestablished specific new requirements regarding emissions from compressors, controllers, dehydrators, storage tanks and other production equipment. TheseThe rules may require modificationsare designed to our operations, including the installation of new equipment to control emissions from our wells by January 1, 2015. Compliance with such rules could result in significant costs, including increased capital expenditures and operating costs, and could adversely impact our business.Moreover, in recent years the U.S. Congress has considered establishing a cap-and-trade program to reduce U.S.limit emissions of greenhouse gases, including carbonVOCs, sulfur dioxide, and methane. Under past proposals, the EPA would issue or sellhazardous air pollutants from a capped and steadily declining numbervariety of tradable emissions allowances to certain major sources of greenhousewithin natural gas emissions so that such sources could continue to emit greenhouse gases into the atmosphere.These allowances would be expected to escalate significantly in cost over time. The net effect of such legislation, if adopted, would be to impose increasing costs on the combustion of carbon-based fuels such as crude oil, refined petroleum products, and natural gas. In addition, while the prospect for such cap-and-trade legislation by the U.S. Congress remains uncertain, several states, including states in which we operate, have adopted, or are in the process of adopting, similar cap-and-trade programs.As a crudeprocessing plants, oil and natural gas company, the debate on climate change is relevant to our operations because the equipment we use to explore for, develop and produce crude oilproduction facilities, and natural gas emits greenhouse gases. Additionally, the combustion of carbon-based fuels, suchtransmission compressor stations. We have modified our operations and well equipment as the crude oil and natural gas we sell, emits carbon dioxide and other greenhouse gases. Thus, any current or future federal, state or local climate change initiatives could adversely affect demand for the crude oil and natural gas we produce by stimulating demand for alternative forms of energy that do not rely on the combustion of fossil fuels, and therefore could have a material adverse effect on our business. Although ourneeded to comply with these rules. Ongoing compliance with any greenhouse gas regulations maythe rules is not expected to affect us in a way that materially differs from our similarly situated competitors. In addition, in October 2015 the EPA revised the National Ambient Air Quality Standard (“NAAQS”) for ozone from 75 to 70 parts per billion for both the 8-hour primary and secondary standards. State implementation of the revised NAAQS could result in stricter permitting requirements, delay or prohibit our ability to obtain such permits, and result in increased compliance and operatingexpenditures for pollution control equipment, the costs we do not expect the compliance costs for currently applicable regulations toof which could be material. Moreover, while it is not possible at this time to estimate the compliance costs or operational impacts for any new legislative or regulatory developments in this area, we do not anticipate being impacted to any greater degree than other similarly situated competitors.Some activists have attempted to linkIn recent years there has been increased public concern regarding an alleged potential for hydraulic fracturing to various environmental problems, including adverse effects toadversely affect drinking water supplies and migration of methane and other hydrocarbons.to induce seismic events. As a result, several federal and state agencies are studying the environmental risks with respect to hydraulic fracturing, or evaluating whetherand proposals have been made to restrict its use. From timeenact separate federal, state and local legislation that would increase the regulatory burden imposed on hydraulic fracturing. time, legislation has been introduced in the U.S. Congress to amend the federal Safe Drinking Water Act to eliminate an existing exemption for(“SDWA”) over certain hydraulic fracturing activities frominvolving the definitionuse of “underground injection,” thereby requiringdiesel fuels and published permitting guidance in February 2014 related to such activities. In May 2014, the crude oil and natural gas industryEPA issued an Advance Notice of Proposed Rulemaking to obtain permits for hydraulic fracturing and to require disclosure of the additives used in the process. If adopted, such legislation could establish an additional level of regulation and permitting at the federal level. Scrutiny of hydraulic fracturing activities continues in other ways. The White House Councilcollect data on Environmental Quality is coordinating an administration-wide review of hydraulic fracturing practices, and a number of federal agencies are analyzing environmental issues associated with hydraulic fracturing. The EPA has commenced a multi-year study of the potential environmental impacts of hydraulic fracturing, the draft results of which are anticipated to be available in 2014. Further, on May 11, 2012, the Bureau of Land Management (“BLM”) issued a proposed rule that would require public disclosure of chemicals used in hydraulic fracturing operations and imposeunder Section 8 of the Toxic Substances Control Act. To date, no other operational requirements for allaction has been taken. Further, in April 2015 the EPA issued proposed regulations under the Clean Water Act governing discharges to publicly owned treatment works of waste water from hydraulic fracturing operationsand certain other natural gas operations. In 2015 the EPA completed a study of the potential impacts of hydraulic fracturing activities on water resources and published a draft assessment in June 2015 for peer review and public comment. In its assessment, the EPA indicated it did not find evidence that hydraulic fracturing mechanisms caused widespread, systemic impacts on drinking water resources in the United States. Nonetheless, the results of the study or similar governmental reviews could spur initiatives to regulate hydraulic fracturing under the SDWA or otherwise, and there has been recent speculation the EPA may conduct a second similar study. Finally, the U.S. Department of Interior issued final rules in March 2015 related to the regulation of hydraulic fracturing activities on federal lands, including Native American trust lands.requirements for chemical disclosure, well bore integrity and handling of flowback water. The DepartmentU.S. District Court of Wyoming has temporarily stayed implementation of this rule and a final decision remains pending.Interior announced on January 18, 2013 that the BLM will issue a revised draft rule by March 31, 2013. In addition to these federal initiatives,state level, several state and local governments,states, including states in which we operate, have movedadopted or are considering adopting legal requirements imposing more stringent permitting, disclosure and well construction requirements on hydraulic fracturing activities. Local governments also may seek to require disclosureadopt ordinances within their jurisdictions regulating the time, place and manner of drilling activities in general or hydraulic fracturing fluid componentsactivities in particular or otherwise to regulate their use more closely.prohibit the performance of well drilling in general or hydraulic fracturing in particular. In certain areas of the United States, new drilling permits for hydraulic fracturing have been put on hold pending development of additional standards.We currently disclose theThe additives used in the hydraulic fracturing process on all wells we operate.operate are disclosed on that website.the hydraulic fracturing processprocesses in areas in which we operate could make it more difficult and more expensive to complete crude oil and natural gas wells in low-permeability formations, increase our costs of compliance and doing business, and delay, prevent or prohibit the development of natural resources from unconventional formations. Compliance, or the consequences of our failure to comply, could have a material adverse effect on our financial condition and results of operations. At this time it is not possible to estimate the potential impact on our business if such federal or state legislation is enacted into law.2012,2015, we employed 7531,143 people. Our future success will depend partially on our ability to attract, retain and motivate qualified personnel. We are not a party to any collective bargaining agreements and have not experienced any strikes or work stoppages. We consider our relations with our employees to be satisfactory. We utilize the services of independent contractors to perform various field and other services.Item 1A. Risk Factors before deciding to invest in shares ofconnection with an investment in our common stock.securities. If any of the following risks develop into actual events, our business, financial condition or results of operations could be materially adversely affected, the trading price of your sharesour securities could decline and you may lose all or part of your investment.We are subject to certain risks and hazards due to the naturethe business activities we conduct. The risks discussed below, any of which could materially andhistorically low commodity prices adversely affect our business, financial condition, cash flows, and results of operations are not the only risks we face. We may experience additional risks and uncertainties not currently known to us or, as a result of developments occurring in the future, conditions that we currently deem to be immaterial may also materially and adversely affect our business, financial condition, cash flows and results of operations.A substantial or extended decline in crude oil and natural gas prices may adversely affect our business, financial condition or results of operations and our ability to meet our capital expenditure needs and financial commitments.priceprices we receive for sales of our crude oil and natural gas production heavily influencesinfluence our revenue, profitability, access to capital, capital budget and future rate of growth. Crude oil and natural gas are commodities and therefore, their prices are subject to wide fluctuations in response to relatively minor changes in supply and demand.demand, as evidenced by the significant decrease in crude oil and natural gas prices in 2014 and 2015, which has continued into 2016. Historically, thevolatile. These markets willvolatile and unpredictable. For example, the NYMEX West Texas Intermediate crude oil and Henry Hub natural gas spot prices ranged widely from approximately $35 to $61 per barrel and $1.63 to $3.32 per MMBtu, respectively, during 2015. Commodity prices are likely continue to beremain volatile and unpredictable in the future. 2016.our production, and the levelssales of our production depend on numerous factors beyond our control. These factors include, but are not limited to, the following:Countries;the priceCountries and quantity of imports of foreign crude oil and natural gas;political conditions in or affecting other crude oil-producing and natural gas-producing countries;production;inventories;fundamentalsfundamentals;availability;processing, storage and refining facilities;refineryrefining and processing capacity for various grades of crude oil and natural gas;conditions;conditions and natural disasters;fuels.Lower crude oil and natural gas could reduce our cash flows available for capital expenditures, repayment of indebtedness and other corporate purposes; result in a decrease in the borrowing base under our revolving credit facility or otherwisemay limit our ability to borrow money or raise additional capital; and may reduce our proved reserves and the amount of crude oil and natural gas we can economically produce.Substantial, extended decreaseswould render uneconomic a significant portiondo not improve or further decrease, some of our exploration and development projects could become uneconomic, and exploitation projects. Thiswe may result inalso have to make significant downward adjustments to our estimated proved reserves and our estimates of the present value of those reserves. If these price effects occur, or if our estimates of production or economic factors change, accounting rules may require us to write down the carrying value of our crude oil and natural gas properties. Lower commodity prices may also reduce our access to capital and lead to a downgrade or other negative rating action with respect to our credit rating, as was the case in February 2016 when our corporate credit rating was downgraded by Standard & Poor's Ratings Services ("S&P") and Moody's Investor Services, Inc. ("Moody's") in response to weakened oil and gas industry conditions and resulting revisions made to rating agency commodity price assumptions. These downgrades negatively impact our cost of capital, increase the borrowing costs under our revolving credit facility and $500 million term loan due in November 2018 (“three-year term loan”), and may limit our ability to access capital markets and execute aspects of our business plans. As a result, a substantialan extended continuation of the current commodity price environment, or extended declinefurther declines in crude oil or natural gascommodity prices, wouldwill materially and adversely affect our future business, financial condition, results of operations, cash flows, liquidity orand ability to finance planned capital expenditures.areis located in the North region,limited geographic areas, making us vulnerable to risks associated with having operationsgeographically concentrated in this geographic area.Becauseoperations.operations areproducing properties is geographically concentrated in the Bakken field of North region (78%Dakota and Montana, with that area comprising approximately 62% of our crude oil and natural gas production and approximately 69% of our crude oil and natural gas revenues for the year ended December 31, 2015. Approximately 54% of our estimated proved reserves were located in the fourth quarterBakken as of 2012 was fromDecember 31, 2015. Additionally, in recent years we have significantly expanded our operations in Oklahoma with our discovery of the North region),SCOOP play and our increased activity in the Northwest Cana and STACK plays. Our properties in Oklahoma comprised approximately 32% of our crude oil and natural gas production and approximately 23% of our crude oil and natural gas revenues for the year ended December 31, 2015. Approximately 42% of our estimated proved reserves were located in Oklahoma as of December 31, 2015.disproportionallydisproportionately exposed to the effect of regional events.factors relative to our competitors that have more geographically dispersed operations. These factors include, among others, fluctuations inothers: (i) the prices of crude oil and natural gas produced from wells in the regionregions and other regional supply and demand factors, including gathering, pipeline and rail transportation capacity constraints, availableconstraints; (ii) the availability of rigs, equipment, oil field services, supplies, labor and labor; (iii) the availability of processing and refining facilities; and (iv) infrastructure capacity. In addition, our operations in the North regionBakken field and Oklahoma may be adversely affected by seasonalsevere weather events such as floods, blizzards, ice storms and lease stipulations designed to protect wildlife,tornadoes, which can intensify competition for the items described above during months when drilling is possible and may result in periodic shortages. The concentration of our operations in the North regionlimited geographic areas also increases our exposure to changes in local laws and regulations, certain lease stipulations designed to protect wildlife, and unexpected events that may occur in this regionthe regions such as natural disasters, seismic events, industrial accidents or labor difficulties. Any one of these events has the potential to cause producing wells to be shut-in, delay operations, and growth plans, decrease cash flows, increase operating and capital costs and prevent development of lease inventory before expiration. Any of the risks described above could have a material adverse effect on our financial condition, and results of operations.The economic recession experienced in 2008-2009 led to turmoil in U.S.that wasmay experience periods of turmoil and volatility from time to time, which may be characterized by extreme volatility and declines in prices of securities, diminished liquidity and credit availability, inability to access capital markets, the bankruptcy, failure, collapse or sale of financial institutions, increased levels of unemployment, and an unprecedented level of intervention by the U.S. federal government and other governments. Improvements have occurred since 2008-2009 and some portions of the economy have stabilized and are showing signs of recovery. However, U.S. and global economies remain fragile and are still experiencing high unemployment, unstable consumer confidence, and diminished consumer demand and spending. Recent data has suggested the U.S. economy may be contracting again. Accordingly, although theRecently, certain global economies have experienced periods of political unrest, slowing economic recession experienced in recent years has ended, the extentgrowth, rising interest rates, changing economic sanctions, and timing of the current recovery, and whether it can be sustained are uncertain. Economic weakness or uncertainty could reduce demand for crude oil and natural gas andcurrency volatility. These global macroeconomic conditions continue to put significant downward pressure on the prices of crude oil prices, and natural gas.a continuation of that trend could continue or exacerbate that pressure. This would negatively impactimpacts our revenues, margins, profitability, operating cash flows, liquidity and financial condition. Such weakness or uncertainty could also cause our commodity hedging arrangements to become economically ineffective if our counterparties are unable to perform their obligations or seek bankruptcy protection. Furthermore, our ability to collect receivables may be adversely impacted.an existinga revolving credit facility with lender commitments totaling $1.5$2.75 billion, andwhich may be increased up to a borrowing basetotal of $3.25$4.0 billion as of February 15, 2013.upon agreement with participating lenders. In the future, we may not be able to access adequate funding under our revolving credit facility as a result of (i) a decrease in our borrowing base due to the outcome of a subsequent borrowing base redetermination, which is solely at the discretion ofif our lenders are unwilling or (ii) an unwillingness or inability on the part of our lending counterpartiesunable to meet their funding obligations or increase their commitments tounder the borrowing base amount. Declines in commodity prices could result in a determination to lower our borrowing base in the future and, in such case, we could be required to repay indebtedness in excess of the borrowing base.credit facility. Due to these and other factors, we cannot be certain that funding, if needed, will be available to the extent required andor on terms we find acceptable. If we are unable to access funding when needed on acceptable terms, we may not be able to fully implement our business plans, fund our capital program and commitments, complete new property acquisitions to replace reserves, take advantage of business opportunities, respond to competitive pressures, or refinance debt obligations as they come due.itthey could have a material adverse effect on our financial condition, and results of operations.production.2012,2015, we invested approximately $4.4$2.56 billion in our capital program, inclusive of property acquisitions. In October 2012, we announced a new five-year growth plan to triple our production and proved reserves from year-end 2012 to year-end 2017. OurWe have budgeted $920 million for capital expenditures for 2013 are budgeted to be $3.6 billion, excludingin 2016 (excluding acquisitions which are not budgeted, with $3.3 billionbudgeted) of which $784 million is allocated for drilling,exploration and development drilling. Our planned 2016 capital workovers and facilities. To date,expenditures are substantially lower than our 2015 expenditures as a result of a planned reduction in spending prompted by significantly depressed commodity prices. We may find that additional reductions in our 2016 capital spending become necessary depending on market conditions. Improvementresult in andecrease and we may have limited ability to obtain the capital necessary to sustain our operations at planned levels. Our revolving credit facility has lender commitments totaling $2.75 billion, which may be increased up to a total of $4.0 billion upon agreement with participating lenders. However, we can offer no assurance that our existing or other lenders would be willing to increase in actualtheir commitments under our credit facility. Such lenders could decline to do so based on our financial condition, the financial condition of our industry or the economy as a whole or other reasons beyond our control. If cash generated by operations or cash available under our revolving credit facility is not sufficient to meet capital expenditures. Conversely, a significant decline in commodity pricesrequirements and commitments, the failure to obtain additional financing could result in a decreasecurtailment of operations relating to development of our prospects, which in actual capital expenditures. turn could lead to a decline in our crude oil and natural gas reserves and could adversely affect our business, financial condition, results of operations, and cash flows.andwith any cash flow deficiencies expected to be funded by borrowings under our revolving credit facility; however,facility. However, our financing needs may require us to alter or increase our capitalization substantially through the issuance of debt or equity securities or the sale of assets. The issuance of additional debt requireswill require a portion of our cash flows from operations to be used for the payment of interest and principal on our debt, thereby reducing our ability to use cash flows to fund working capital needs, capital expenditures and acquisitions. The issuance of additional equity securities could have a dilutive effect on the value of our common stock.Our cash flows from operations and access to capital are subject to a number of variables, including:the amount of our proved reserves;the volume of crude oil and natural gas we are able to produce and sell from existing wells;the prices at which crude oil and natural gas are sold;our ability to acquire, locate and produce new reserves; andthe ability and willingness of our banks to extend credit.If revenues or the borrowing base under our revolving credit facility decrease as a result of lower crude oil or natural gas prices, operating difficulties, declines in reserves or for any other reason, we may have limited ability to obtain the capital necessary to sustain our operations at current levels. If additional capital is needed, we may not be able to obtain debt or equity financing. If cash generated by operations or cash available under our revolving credit facility is not sufficient to meet capital requirements, the failure to obtain additional financing could result in a curtailment of operations relating to development of our prospects, which in turn could lead to a decline in our crude oil and natural gas reserves and could adversely affect our business, financial condition and results of operations and our ability to achieve our growth plan. beyond our control, including the risk that drilling will not result in commercially viable crude oil or natural gas production. Our decisions to purchase, explore, develop or otherwise exploit prospects or properties will depend in part on the evaluation of data obtained through geophysical and geological analyses, production data, and engineering studies, the results of which are often inconclusive or subject to varying interpretations. Our cost of drilling, completing and operating wells may be uncertain before drilling commences.including:including but not limited to:andor qualified personnel;equipment failures or accidents;train derailments;adverse weather conditionsrestrictions on the use of underground injection wells for disposing of waste water from oil and natural disasters, such as flooding, blizzards and ice storms;reductionsdecreases in, or extended periods of historically low, crude oil and natural gas prices;the marketmarkets for crude oil and natural gas; andrequirements.maywill turn out to be inaccurate. Any material inaccuracies in these reserve estimates or underlying assumptions will materially affect the quantities and present value of our reserves.complex.complex and inherently imprecise. It requires interpretation of available technical data and many assumptions, including assumptions relating to current and future economic conditions, production rates, drilling and operating expenses, and commodity prices. Any significant inaccuracy in these interpretations or assumptions could materially affect our estimated quantities and present value of our reserves. SeePart I, Item 1. Business—Operations, Operations—Proved Reserves for information about our estimated crude oil and natural gas reserves, PV-10, and Standardized Measure of discounted future net cash flows as of December 31, 2012.2015.data.data in preparing reserve estimates. The extent, quality and reliability of this data can vary.vary which in turn can affect our ability to model the porosity, permeability and pressure relationships in unconventional resources. The process also requires economic assumptions, based on historical data but projected into the future, about matters such as crude oil and natural gas prices, drilling and operating expenses, capital expenditures, taxes and availability of funds.reserves.reserves, which in turn could have an adverse effect on the value of our assets. In addition, we may adjust estimates of proved reserves, potentially in material amounts, to reflect production history, results of exploration and development activities, prevailing crude oil and natural gas prices and other factors, many of which are beyond our control.reserves.In accordance with SEC rules, weWe base the estimated discounted future net revenues from proved reserves on the 12-month unweighted arithmetic average of the first-day-of-the-month commodity prices for the preceding twelve months. Actual future prices may be materially higher or lower than the average prices used in the calculations. Actual future net revenues from crude oil and natural gas properties will be affected by factors such as:the actual cost and timing of development and production expenditures;the amount and timing of actual production;we use when calculating which is required by the SEC to be used to calculate and costs may materially differ from those used in our estimate ofyear-end estimates.present value of future net revenues. If2015 average price used to determine our year-end PV-10. Holding all other factors constant, if crude oil prices declineused in our year-end PV-10 estimates were decreased by $10.00$15.00 per barrel, thereby approximating the pricing environment existing in February 2016, our PV-10 as ofat December 31, 2012 would2015 could decrease by approximately $2.1 billion. If natural gas prices decline by $1.00 per Mcf, our$3.4 billion, or 42%. See Part I, Item 1. Business—Crude Oil and Natural Gas Operations—Proved Reserves—Proved Reserve and PV-10 as of December 31, 2012 would decrease approximately $819 million.Our use of enhanced recovery methods creates uncertainties that could adversely affect our results of operations and financial condition.One of our business strategies is to commercially develop unconventional crude oil and natural gas resource plays using enhanced recovery technologies. For example, we inject water and high-pressure air into formations on some of our properties to increase the production of crude oil and natural gas. The for additional production and reserves attributable to the use of these enhanced recovery methods are inherently difficult to predict. If enhanced recovery programs do not allow for the extraction of crude oil and natural gas in the manner or to the extent we anticipate, our future results of operations and financial condition could be materially adversely affected.If crude oil and natural gas prices decrease, wePV-10 sensitivities under various commodity price scenarios.properties. that we periodically review the carrying values of our crude oil and natural gas properties for possible impairment. Proved properties are reviewed for impairment on a field-by-field basis each quarter. We use the successful efforts method of accounting whereby the estimated future cash flows expected in connection with a field are compared to the carrying amount of the field to determine if the carrying amount is recoverable. If the carrying amount of the field exceeds its estimated undiscounted future cash flows, the carrying amount of the field is reduced to its estimated fair value using a discounted cash flow model.constitutesresults in a non-cash charge to earnings. We may incurhave incurred impairment charges in the past and may incur additional impairment charges in the future, particularly if commodity prices remain at their currently low levels or decline further, which could have a material adverse effect on our results of operations for the periods in which such charges are taken. additional drilling rigs, equipment, supplies, personnel and oilfield services could adversely affect our ability to execute our exploration and development plans within budget and on a timely basis.Shortages orhigh costregions in which we operate, there have historically been shortages of drilling rigs, equipment, supplies, personnel or oilfield services, including key components used in fracture stimulation processes such as water and proppants, as well as high costs associated with these critical components of our operations. As a result of the significant decrease in commodity prices, the number of providers of the materials and services described above has decreased in the regions where we operate. As a result, the likelihood of experiencing shortages or higher costs of materials and services may be increased in connection with any period of commodity price recovery. Such shortages or high costs could delay the execution of our drilling plans or cause us to incur significant expenditures not provided for in our capital budget, which could have a material adverse effect on our business, financial condition, or results of operations.underinsuredunder-insured events could materially and adversely affect our business, financial condition or results of operations. Our crude oil and natural gas exploration and production activities are subject to all of the operating risks associated with drilling for and producing crude oil and natural gas, including the possibility of:andor destruction of property, natural resources and equipment; andcosts. are not fully insurable. The occurrence of an event that is not fully covered by insurance could have a material adverse effect on our business, financial condition, and results of operations.that will requirerequiring substantial additional seismic data processing and interpretation. It is not possible to predict with certainty in advance of drilling and testing whether any particular prospect will yield crude oil or natural gas in sufficient quantities to recover drilling or completion costs or be economically producible. The use of seismic data and other technologies and the study of producing fields in the same area will not enable us to know conclusively prior to drilling whether crude oil or natural gas will be present or, if present, whether crude oil or natural gas will be present in economically producible quantities. We cannot assure you that the analogies we draw from available data from other wells, more fully explored prospects or producing fields will be applicable to our drilling prospects.These drilling locations represent a significant part of our growth strategy. Our ability to drill and develop these locations depends onis subject to a number of uncertainties, including crude oil and natural gas prices, the availability of capital, costs, drilling results, regulatory approvals, available transportation capacity, and other factors. If future drilling results in these projects do not establish sufficient reserves to achieve an economic return, we may curtail drilling in these projects. Because of these uncertainties, we do not know if the numerous potential drilling locations we have identified will ever be drilled or if we will be able to produce crude oil or natural gas from these or any otherlocations.locations in sufficient quantities to achieve an economic return. In addition, unless production is established within the spacing units covering the undeveloped acres on which some of the locations are identified, the leases for such acreage will expire. IfCurrently low commodity prices, reduced capital spending and numerous other factors, many of which are beyond our control, could result in our failure to establish production on undeveloped acreage, and, if we are not able to renew leases before they expire, any proved undeveloped reserves associated with such leases will be removed from our proved reserves. The combined net acreage expiring in the next three years represents 65%60% of our total net undeveloped acreage at December 31, 2012.2015. At that date, we had leases representing 359,999320,188 net acres expiring in 2013, 234,2972016, 283,590 net acres expiring in 2014,2017, and 279,486112,478 net acres expiring in 2015.2018. Our actual drilling activities may materially differ from those presently identified, which could adversely affect our business.transportationmarketability ofvalue we receive for our crude oil and natural gas production depends in part on the availability, proximity and capacity of pipeline and rail systems and processing and refining facilities owned by third parties. The lackinadequacy or unavailability of capacity on these systems and facilities could result in the shut-in of producing wells or the delay, or discontinuance of, development plans for properties. Although we have some contractual control over the transportation of our product, materialproducts, changes in these business relationships could materially affect our operations. Federal and state regulation of crude oil and natural gas production and transportation, tax and energy policies, changes in supply and demand, pipeline pressures, damageor failure to or destruction of pipelines and rail systems, labor disputes and general economic conditionsobtain such services on acceptable terms could adversely affect our abilityoperations. If our production becomes shut-in for any of these or other reasons, we would be unable to produce, gather, transport and sell crude oil and natural gas. As a result of pipeline constraints,realize revenue from those wells until other arrangements were made for the continuous increase in Williston Basin production, and our desire to transport our crude oil to coastal markets which currently provide the most favorable pricing, in December 2012 we transported approximately 72%sale or delivery of our operated crude oil production from the Bakken field by rail.third-party pipelinestransportation, processing or rail transportationrefining facilities due to labor disputes, maintenance, and/civil disturbances, public protests, terrorist attacks, cyber attacks, adverse weather, natural disasters, seismic events, changes in tax and energy policies, federal, state and international regulatory developments, changes in supply and demand, equipment failures or weatheraccidents, including pipeline ruptures or train derailments, and general economic conditions could negatively impact our ability to market and deliver our products and achieve the most favorable prices for our crude oil and natural gas production. We have no control over when or if access to such pipeline or rail facilities would be restored or whatthe impact on prices would be charged.in the areas we operate. A significant shut-in of production in connection with any of the aforementioned items could materially affect our cash flows, and if a substantial portion of the impacted production is hedged at lower than market prices, those financial hedges would have to be paid from borrowings absent sufficient cash flows.thesenew or emerging areas are more uncertain than drilling results in developed and producing areas. Since new or emerging plays have limited or no production history, we are unable to use past drilling results in those areas to help predict our future drilling results. As a result, our cost of drilling, completing and operating wells in these areas may be higher than initially expected, and the value of our undeveloped acreage will decline if drilling results are unsuccessful.regulations.regulations, including those governing environmental protection, the occupational health and safety aspects of our operations, the discharge of materials into the environment, and the protection of certain plant and animal species. See Part I, Item 1. Business—Regulation of the Crude Oil and Natural Gas Industry for a description of the laws and regulations that affect us. In order to conduct operations in compliance with these laws and regulations, we must obtain and maintain numerous permits, approvals and certificates from various federal, state and local governmental authorities. WeEnvironmental regulations may incurrestrict the types, quantities and concentration of materials released into the environment in connection with drilling and production activities, limit or prohibit drilling activities on certain lands lying within wilderness, wetlands and other protected areas, and impose substantial costs in order to maintain compliance with these existing laws and regulations.liabilities for pollution resulting from our operations. In addition, we may experience delays in obtaining or be unable to obtain required permits, which may delay or interrupt our costs of compliance may increase if existing lawsoperations and regulations are revised or reinterpreted, or if new lawslimit our growth and regulations become applicable to our operations. Such costs could have a material adverse effect on our business, financial condition and results of operations.Our business is subject to federal, state and local laws and regulations as interpreted and enforced by governmental authorities possessing jurisdiction over various aspects of the exploration for, and the production and transportation of, crude oil and natural gas. revenues.such laws and regulations as interpretedmay trigger a variety of administrative, civil and enforced, could have a material adverse effect on our business, financial condition and resultscriminal enforcement measures, including investigatory actions, the assessment of monetary penalties, the imposition of remedial requirements, or the issuance of orders or judgments limiting or enjoining future operations. See Part I, Item 1. Business—Regulation of the Crude Oil and Natural Gas Industry for a description of the laws and regulations that affect us.In addition,For instance, an accidental release from one of our wells could subject us to substantial liabilities arising from environmental cleanup and restoration costs, claims made by neighboring landowners and other third parties for damages to personspersonal injury and property damage and fines or property, including natural resources, may result frompenalties for related violations of environmental laws or regulations.operations.Newcosts of compliance with existing laws regulations or enforcement policies could be more stringentsubstantial and imposemay increase, or unforeseen liabilities could be imposed, if existing laws and regulations are revised or significantly increase compliance costs.reinterpreted or if new laws and regulations become applicable to our operations. If we are not able to recover the resultingincreased costs through insurance or increased revenues, our business, financial condition, and results of operations and cash flows could be adversely affected.On December 15, 2009, the published its findings that emissions of carbon dioxide, methane and other greenhouse gases present an endangerment toendanger human health and the environment, because emissions of such gases are, according to the EPA contributing to the warming of the Earth’s atmosphere and other climate changes. These findings by the EPA allow the agency to proceed with the adoption and implementation of severalhas adopted regulations that would restrict emissions of greenhouse gases under existing provisions of the federal Clean Air Act such as the so-called “tailoring rule” adopted in May 2010, which imposes permittingestablishing, among other things, Prevention of Significant Deterioration ("PSD") and bestconstruction and Title V operating permit reviews for certain large stationary sources. Facilities required to obtain PSD permits for greenhouse gas emissions are also required to meet “best available control technology requirementstechnology” standards established on a case-by-case basis. We currently do not have any facilities that are required to adhere to the largest greenhouse gas stationary sources. In November 2010,PSD or Title V permit requirements; however, attempts by the EPA also finalized its greenhouse gas reporting requirements for certainto aggregate multiple oil and gas production facilities, that emit 25,000 metric tons each of which is currently and has long been regarded as an individual stationary source, for permitting purposes could result in the aggregate emissions from these independent facilities triggering Title V and/or more of carbon dioxide equivalent per year. The rule requires annual reportingPSD requirements. EPA rulemakings related to greenhouse gas emissions could adversely affect our operations and restrict or delay our ability to obtain air permits for new or modified sources.by such regulated facilities.On April 17, 2012,from specified onshore and offshore oil and gas production sources in the United States on an annual basis, which include certain of our operations. In August 2015, the EPA issued final rules that establishedproposed new airregulations setting methane emission controlsstandards for crudenew and modified oil and natural gas production and natural gas processing operations. These rules were publishedand transmission facilities as part of the Obama Administration’s efforts to reduce methane emissions from the oil and gas sector by up to 45% from 2012 levels by 2025. The proposed regulations are expected to be finalized in 2016. On January 22, 2016, the Federal RegisterBureau of Land Management issued a pre-publication version of a proposed venting and flaring rule, which is expected to be finalized in 2016 and, like the forthcoming EPA regulations, will address methane emissions from crude oil and natural gas sources. Recently, the EPA has increased the level of Clean Air Act enforcement activity within the upstream oil and gas sector, focusing onAugust 16, 2012. The EPA’s rule package includes New Source Performance Standards alleged violations related to address emissions of sulfur dioxidegreenhouse gases and volatile organic compounds (“VOCs”) from production facilities. To the extent the EPA experiences success in connection with enforcement efforts in a given geographical area, it may decide to extend such efforts to additional areas, including those where we have significant operations. The EPA may also choose to focus its initial efforts with respect to any new enforcement initiative on an area where we have significant operations. separate setmonitoring and review process of emission standardsgreenhouse gas emissions. The agreement includes binding and non-binding elements and did not require ratification by the U.S. Congress. Nonetheless, the agreement may result in increased political pressure on the United States to address hazardous air pollutants frequently associatedensure continued compliance with crude oilenforcement measures under the Clean Air Act and naturalmay spur further initiatives aimed at reducing greenhouse gas production and processing activities. The final rules require the use of reduced emission completions or “green completions” on all hydraulically-fractured wells completed or refractured after January 1, 2015 in order to achieve a 95 percent reductionemissions in the emission of VOCs. The rules also establish specific new requirements regarding emissions from compressors, controllers, dehydrators, storage tanks and other production equipment. These rules may require modifications to our operations, including the installation of new equipment to control emissions from our wells by January 1, 2015. Compliance with such rules could result in significant costs, including increased capital expenditures and operating costs, and could adversely impact our business.In addition, the U.S.future.and almost halfthere has not been significant activity in the form of the states, including states in which we operate, have enacted or passed measuresadopted legislation to reduce greenhouse gas emissions at the federal level in recent years. In the absence of such federal legislation, a number of state and regional efforts have emerged that are aimed at tracking and reducing greenhouse gases, primarily through the planned developmentgas emissions by means of cap and trade programs that typically require major sources of greenhouse gas emission inventories and/or regional greenhouse gas cap-and-trade programs. Most of these cap-and-trade programs work by requiring either major sources of emissions, or major producers of fuelssuch as electric power plants, to acquire and surrender emission allowances with the number of allowances availablein return for purchase reduced each year until the overallemitting greenhouse gas emission reduction goal is achieved. These reductions may cause the cost of allowances to escalate significantly over time.these regulatory initiativessubstantial limitations on greenhouse gas emissions could drive downadversely affect the demand for our products by stimulating demand for alternative forms of energy that do not rely on combustion of fossil fuels that serve as a major source of greenhousethe crude oil and natural gas emissions,we produce, which could have a material adverse effect on our business, financial condition, and results of operations.andor other climatic events. If any such effects were to occur as a result of climate change or otherwise, they could have an adverse effect on our assets and operations.A significant majority of our operations utilize hydraulicSome activists have attempted to linkIn recent years there has been increased public concern regarding an alleged potential for hydraulic fracturing to various environmental problems, including adverse effects toadversely affect drinking water supplies as well as migration of methane and other hydrocarbons.to induce seismic events. As a result, several federal and state agencies are studying potential environmental risks with respectconsidering legislation that would increase the regulatory burden imposed on hydraulic fracturing.hydraulic fracturing or evaluating whether to restrict its use. From time to time legislation has been introduced in the U.S. Congress to amend the federal Safe Drinking Water Act to eliminate an existing exemption for("SDWA") over certain hydraulic fracturing activities frominvolving the definitionuse of “underground injection,” thereby requiringdiesel fuels and published permitting guidance in February 2014 related to such activities. In May 2014, the crude oil and natural gas industryEPA issued an Advance Notice of Proposed Rulemaking to obtain permits for hydraulic fracturing, and to require disclosure of the additives used in the process. If ever adopted, such legislation could establish an additional level of regulation and permitting at the federal level. Scrutiny of hydraulic fracturing activities continues in other ways. The White House Councilcollect data on Environmental Quality is coordinating an administration-wide review of hydraulic fracturing practices, and a number of federal agencies are analyzing environmental issues associated with hydraulic fracturing. The EPA has commenced a multi-year study of the potential environmental impacts of hydraulic fracturing, the draft results of which are anticipated to be available by 2014. Further, on May 11, 2012, the BLM issued a proposed rule that would require publicdisclosure of chemicals used in hydraulic fracturing operations and imposeunder Section 8 of the Toxic Substances Control Act. To date, no other operational requirements for allaction has been taken. Further, in April 2015 the EPA issued proposed regulations under the Clean Water Act governing discharges to publicly owned treatment works of waste water from hydraulic fracturing operationsand certain other natural gas operations. Moreover, in 2015 the EPA completed a study of the potential impacts of hydraulic fracturing activities on water resources and published a draft assessment in June 2015 for peer review and public comment. In its assessment, the EPA indicated it did not find evidence that hydraulic fracturing mechanisms caused widespread, systemic impacts on drinking water resources in the United States. Nonetheless, the results of the study or similar governmental reviews could spur initiatives to regulate hydraulic fracturing under the SDWA or otherwise. Finally, the U.S. Department of Interior issued final rules in March 2015 related to the regulation of hydraulic fracturing activities on federal lands, including Native American trust lands.requirements for chemical disclosure, well bore integrity and handling of flowback water. The DepartmentU.S. District Court of the Interior announced on January 18, 2013 that BLM will issueWyoming has temporarily stayed implementation of this rule and a revised draft rule by March 31, 2013. Atfinal decision remains pending. As of December 31, 2012,2015, we held approximately 79,400181,500 net undeveloped acres on federal land, representing approximately 6%15% of our total net undeveloped acres. In addition to these federal initiatives,state and local governments,states, including states in which we operate, have movedadopted or are considering adopting legal requirements imposing more stringent permitting, disclosure, and well construction requirements on hydraulic fracturing activities. Local governments also may seek to require disclosureadopt ordinances within their jurisdictions regulating the time, place and manner of drilling activities in general or hydraulic fracturing fluid componentsactivities in particular or to otherwise regulate their use more closely.prohibit the performance of well drilling in general or hydraulic fracturing in particular. In certain areas of the United States, new drilling permits for hydraulic fracturing have been put on hold pending development of additional standards.thatto prohibit or significantly limit the use of hydraulic fracturing in states in which we operate, it would have a material adverse effect on our ability to economically find and develop crude oil and natural gas reserves in our strategic plays. The inability to achieve a satisfactory economic return could cause us to curtail or discontinue our exploration and development plans. Such a circumstanceplans, which would have a material adverse effect on our business, financial condition, results of operations and would impair our ability to implement our growth plan.Should we fail to comply with FERC, FTC and CFTC administered statutes and regulations on market behavior, we could be subject to substantial penalties and fines and other liabilities.The FERC, under the EPAct 2005, and the FTC, under the Independence and Security Act of 2007, may impose or seek to impose through judicial action penalties for violations of anti-market manipulation rules for natural gas, crude oil and petroleum products of up to $1,000,000 per day for each violation. The CFTC, under the Commodity Exchange Act, has similar authority to impose penalties of up to $1,000,000 or triple the monetary gain for violation of anti-market manipulation rules for certain derivative contracts. In addition, while we have not been regulated by the FERC as a natural gas company under the NGA, the FERC has adopted regulations that may subject us to the FERC annual reporting requirements. Additional rules and legislation pertaining to those and other matters may be considered or adopted by the FERC, the FTC or CFTC from time to time. Failure to comply with any of these regulations in the future could subject us to civil penalty liability, as well as the disgorgement of profits and third-party claims.regulationregulations under consideration could increase our operating costs, reduce our liquidity, delay our operations or otherwise alter the way we conduct our business.Our operations are subject to extensive federal, state and local laws and regulations. regulationregulations or other requirements are adopted, they could result in, among other items, additional limitations and restrictions on hydraulic fracturing of wells, restrictions on the disposal of waste water from oil and gas activities, restrictions on emissions of greenhouse gases, changes to the calculation of royalty payments, new safety requirements such as those involving rail transportation, and additional regulation of private energy commodity derivative and hedging activities. These and other potential laws, regulations and other requirements could increase our operating costs, reduce ourand results of operations.Certainoperations and cash flows.development may be eliminated as a result of future legislation.Among thedevelopment.contained in President Obama’s fiscal year 2013 budget proposal areto U.S. federal income tax laws, including the elimination or deferral of certain key U.S. federal income tax deductions currently available to crude oil and natural gas exploration and production companies. Such proposed changes include, but are not limited to,to: (i) the repeal of the percentage depletion allowance for crude oil and natural gas properties; (ii) the elimination of current deductions for intangible drilling and exploration and development costs; (iii) the elimination of the deduction for certain production activities; and (iv) an extension of the amortization period for certain geological and geophysical expenditures. These proposedmay negatively affect our financial condition and results of operations.how soon any such changes would become effective. The passage of such legislation in response to President Obama’s 2013 budget proposal or any other similar change in U.S. federal income tax law could eliminate or defer certain available tax deductions within theour industry, that are currently available with respect to crude oil and natural gas exploration and development, and any such changechanges could negativelyadversely affect our financial condition, results of operations and cash flows availableflows. Additionally, President Obama has proposed, as part of the Budget of the United States Government for capital expendituresFiscal Year 2017, to impose an “oil fee” of $10.25 per barrel equivalent of crude oil. This fee would be collected on domestically produced and imported petroleum products. If enacted into law, the fee would be phased in over five years, beginning October 1, 2016. The adoption of this, or similar proposals, could result in increased operating costs and/or reduced consumer demand for petroleum products, which in turn could affect the prices companies such as ours receive for our ability to achieve our growth plan.We our commodity price risk. In 2010, the U.S. Congress adopted the Dodd-Frank Act, which, among other provisions, establishes federal oversight and regulation of the over-the-counter derivatives market and entities, such as us, that participate in that market. This financial reform legislation includes provisions that require many derivative transactions that are currentlypreviously executed over-the-counter to be executed through an exchange and be centrally cleared. The newIn addition, this legislation was signed into law by President Obama on July 21, 2010 and requires the CFTC, the SEC, and in some cases banking regulators, to promulgate rules and regulations implementing the new legislation. The CFTC has issued final regulations to implement significant aspects of the legislation, including new rulescalls for the registrationimposition of position limits for swaps, including swaps involving physical commodities such as crude oil and natural gas, which have been proposed but have not been finalized. It also establishes minimum margin requirements for uncleared swaps for swap dealers and major swap participants (and related definitions of those terms), definitions of the term “swap,” rules to establish the ability to rely on the commercial end-user exception from the central clearing and exchange trading requirements, requirements for reporting and recordkeeping, rules on customer protection in the context of cleared swaps, and position limits for swaps and other transactions based on the price of certain reference contracts, some of which are referenced in our swap contracts. Key regulations that have not yet been finalized include those establishing margin requirements for uncleared swaps, regulatory capital requirements for swap dealers and various trade execution requirements.On December 13, 2012, the CFTC published final rules regarding mandatory clearing of certain interest rate swaps and certain index credit default swaps and setting compliance dates for different categories of market participants, the earliest of which is March 11, 2013. The CFTC has not yet proposed any rules requiring the clearing of any other classes of swaps, including physical commodity swaps.participants. If we do not qualify for the end-userend user exception from theany clearing requirement forrequirements applicable to our swaps, the mandatory clearing requirements and revised capital requirements applicable to other market participants, such as swap dealers, may change the cost and availability of the swaps we use for hedging.managing commodity price risk. Some of the counterparties to our derivative instruments may also need or choose to spin off some of their derivativesderivative activities to a separate entity, which may not be as creditworthycredit-worthy as our current counterparty.The new legislation and any (including through requirements to post collateral, which could adversely affect our available liquidity), materially alter the terms of derivative contracts, reduce the availability of derivatives to protect against risks we encounter, reduce our ability to monetize or restructure existing derivative contracts, lead to fewer potential counterparties, impose new recordkeeping and documentation requirements, and increase our exposure to less creditworthy counterparties. IfThe proposed position limits may limit our ability to implement price risk management strategies if we reduceare not able to qualify for any exemption from such limits. Additionally, if we do not qualify for the end user exemption, the margin requirements for uncleared swaps may require us to post collateral, which could adversely affect our available liquidity. If our use of derivatives becomes limited as a result of the legislation and regulations, our results of operations may become more volatile and our cash flows may be less predictable. Finally, the legislation was intended, in part, to reduce the volatility of crude oil and natural gas prices, which somecommoditycrude oil or natural gas prices. Any of these consequences could have a material adverse effect on our financial position, and results of operations.The cost to attract and retain qualified personnel has increased in recent years due to competition and may increase substantially in the future. We may not be able to compete successfully in the future in acquiring prospective reserves, developing reserves, marketing hydrocarbons, attracting and retaining quality personnel and raising additional capital, which could have a material adverse effect on our financial condition, and results of operations.2012,2015, non-operated properties represented 18%20% of our estimated proved developed reserves, 13%9% of our estimated proved undeveloped reserves, and 15%13% of our estimated total proved reserves. We have limited ability to influence or control the operationoperations or future development of suchnon-operated properties, including compliance with environmental, safety and other regulations, or the amount of capital expenditures required to fund the development and operation of such properties. Moreover, we are dependent on the other working interest owners of suchon these projects to fund their contractual share of the capital expenditures of such projects.and operating expenditures. These limitations and our dependence on the operator and other working interest owners for these projects could cause us to incur unexpected future costs and materially adversely affectcould have a material adverse effect on our financial condition, and results of operations. the indentures for our senior notes contain certain covenants and restrictions that may inhibit our ability to make certain investments, incur additional indebtedness and engage in certain other transactions, which could adversely affect our ability to meet our future goals.the indentures for our senior notes include certainthree-year term loan contain restrictive covenants and restrictions that among others, restrict:our investments, loans and advances and the paying of dividends and other restricted payments;our incurrence of additional indebtedness;the granting of liens, other than liens created pursuant to the revolving credit facility and certain permitted liens;mergers, consolidations and sales of all or a substantial part of our business or properties;the hedging, forward sale or swap of our production of crude oil or natural gas or other commodities; andthe sale of assets.The indentures for our outstanding senior notes limit our ability and the ability of our restricted subsidiaries to: assume or guarantee additional indebtedness, or issue redeemable stock;pay dividends on stock, repurchase stock or redeem subordinated debt;make certain investments;enter into certainincur liens, engage in sale-leaseback transactions, with affiliates;create certain liens on our assets;sell or otherwise dispose of certain assets, including capital stock of subsidiaries;restrict dividends, loans or other asset transfers from our restricted subsidiaries;enter into new lines of business; andconsolidate with or merge, with or into,consolidate or sell all or substantially all of our properties to another person.requires uscontain a requirement that we maintain a consolidated net debt to maintaintotal capitalization ratio of no greater than 0.65 to 1.00. This ratio represents the ratio of net debt (total debt less cash and cash equivalents) divided by the sum of net debt plus total shareholders’ equity plus, to the extent resulting in a reduction of total shareholders' equity, the amount of any non-cash impairment charges incurred, net of any tax effect, after June 30, 2014.financial ratios, such as leverage ratios. restrictive covenants in our revolving credit facility, three-year term loan, and the senior note indentures may restrict our ability to expand or pursue our business strategies. Our ability to comply with these and other provisions of our revolving credit facility, three-year term loan, or senior note indentures may be impacted by changes in economic or business conditions, results of operations or events beyond our control. The breach of any of these covenants could result in a default under our revolving credit facility, three-year term loan, or senior note indentures, in which case, depending on the actions taken by the lenders orsuch lenders or trustees could elect to declareresult in all amounts outstanding thereunder, together with accrued interest, to be due and payable. If we are unable to repay such borrowings or interest, our lenders could proceed against their collateral. If our indebtedness is accelerated, our assets may not be sufficient to repay in full such indebtedness.harmedadversely affected by factors such as the availability, terms of and cost of capital, increases in interest rates, or a reductiondowngrade or other negative rating action with respect to our credit rating. In February 2016, our corporate credit rating was downgraded by S&P and Moody's in response to weakened oil and gas industry conditions and resulting revisions made to rating agency commodity price assumptions. These downgrades will cause the interest rates on our revolving credit ratings. These changes could cause our cost of doing businessfacility borrowings and three-year term loan to increase by 0.250% and 0.125%, respectively, and may limit our ability to pursue acquisition opportunities, reduce cash flows used for drilling and place us at a competitive disadvantage. For example, asAs of February 15, 2013,19, 2016, outstanding variable rate borrowings under our revolving credit facility were $840 millionand three-year term loan totaled $1.33 billion and the impact of a 1% increase in interest rates on this amount of debt would result in increased annual interest expense of approximately $8.4$13.3 million and a $5.2an $8.2 million decrease in our annual net income. We require continued access to capital. A significant reduction in cash flows from operations or the availability of credit could materially and adversely affect our ability to achieve our planned growthfinancial condition and operating results.ourjoint interest owners, derivative counterparties, significant customers, and service providers to meet their obligations to us may adversely affect our financial results.refineriescrude oil refining companies, and affiliatesnatural gas gathering and processing companies ($480.3379 million in receivables at December 31, 2012),2015); our joint interest receivables ($356.8232 million at December 31, 2012),2015); and counterparty credit risk50.6108 million at December 31, 2012)2015).several significant customers. The largest purchaser of our crude oil and natural gas during the year ended December 31, 20122015 accounted for approximately 21%11% of our total crude oil and natural gas revenues.revenues for the year. We have not generally do not requirerequired our counterparties to provide collateral to supportsecure crude oil and natural gas sales receivables owed to us.obligations underobligations.arrangements. The inabilitydrilling and completion of wells and for certain midstream services.failureworsening of our significant customers to meet their obligationsthe depressed commodity price environment may result in a material adverse impact on the liquidity and financial position of the parties with whom we do business, resulting in delays in payment of, or non-payment of, amounts owed to us, or their insolvency or liquidation may adversely affectdelays in operations, loss of access to equipment and facilities and similar impacts. These events could have an adverse impact on our financial condition, and results of operations.production, including collars and fixed price swaps.production. SeePart II, Item 7. Management’s Discussion and Analysis of Financial Condition and Results of Operations—Crude Oil and Natural Gas Hedging andPart II, Item 8. Notes to Consolidated Financial Statements—Note 5. Derivative Instrumentsfor a summary of our crude oil and natural gas commodity derivative positions.positions as of December 31, 2015. We do not designate any of our derivative instruments as hedges for accounting purposes and we record all derivative instrumentsderivatives on our balance sheet at fair value. Changes in the fair value of our derivative instrumentsderivatives are recognized in current period earnings. Accordingly, our earnings may fluctuate significantly as a result of changes in crude oil and natural gas prices and resulting changes in the fair value of our derivative instruments.derivatives.the prices for crude oil and natural gas.commodity prices. Our decision on the quantity and price at which we choose to hedge our future production, if any, is based in part on our view of current and future market conditions and our desire to stabilize cash flows necessary for the development of our undeveloped crude oil and natural gas reserves. As partWe may choose not to hedge future production if the pricing environment for certain time periods is not deemed to be favorable. Additionally, we may choose to liquidate existing derivative positions prior to the expiration of their contractual maturities in order to monetize favorable gain positions for the purpose of funding our risk management program, we have hedgedcapital program. Our crude oil sales for future periods are currently unhedged and directly exposed to continued volatility in crude oil market prices, whether favorable or unfavorable. Additionally, a significant portion of our forecasted production. We utilize a combination of derivative contracts based on West Texas Intermediate (“WTI”) crude oil pricing, Inter-Continental Exchange (“ICE”) pricingnatural gas sales for Brent crude oil,future periods are unhedged and Henry Hub pricingdirectly exposed to continued volatility in natural gas market prices, whether favorable or unfavorable.natural gas. We believewhich our derivative contracts provide relevant protection from price fluctuations in the U.S. markets where we deliver and sell our production. The pricing for Brent crude oil is believed to be a better reflection of the sales prices realized in certain U.S. market centers. However, in the event Brent prices increase significantly, the prices realized in those U.S. market centers may no longer be reflective of Brent prices. In such a circumstance, we may incur significant realized cash losses upon settling our crude oil derivative instruments. Such losses may be incurred without seeing a corresponding increase in revenues from higher realized prices on our physical sales of crude oil.Our Chairman and Chief Executive Officer serves as sole manager beneficially owns approximately 68%76% of our outstanding common stock, giving him influence and control in corporate transactions and other matters, including a sale of our Company.2012,2015, a limited liability company for which Harold G. Hamm, our Chairman and Chief Executive Officer, serves as sole manager beneficially owned 126,296,891 shares of our outstanding common stock representing approximately 68%76% of our outstanding common shares. As a result, Mr. Hamm ishas control over our controlling shareholderCompany and will continue to be able to control theAs controlling shareholder,Therefore, Mr. Hamm could cause, delay or prevent a change of control of our Company. The interests of Mr. Hamm and the limited liability company for which he serves as sole manager may not coincide with the interests of other holders of our common stock.Severalcompanies controlled bywith Mr. Hamm provide oilfield, gathering and processing, marketing and other services to us. We expect theseif, after an independent review by our Audit Committee, it is determined such transactions will continueare in the futureCompany's best interests and are on terms no less favorable to us than could be achieved with an unaffiliated third party. These transactions may result in conflicts of interest between Mr. Hamm’s affiliated companies and us. We can provide no assurance that any such conflicts will be resolved in our favor.including:including but not limited to:theirlocation and quality differentials;of the subject propertieswhich we believe to be generally consistent with industry practices.practices, of the subject properties. Our review will not reveal all existing or potential problems nor will it permit us to become sufficiently familiar with the properties to fully assess their deficiencies and capabilities prior to acquisition. Inspections may not always be performed on every well, and environmental problems are not necessarily observable even when an inspection is undertaken. Even when problems are identified, the seller of the subject properties may be unwilling or unable to provide effective contractual protection against all or part of the problems. We oftensometimes are not entitled to contractual indemnification for environmental liabilities and acquire properties on an “as is” basis.subject to risks as a resultthe target of cyber attacks targetingor information security breaches, which could lead to disruptions in critical systems, unauthorized release of confidential or protected information, corruption of data or other disruptions of our business operations. In addition, certain cyber incidents, such as surveillance, may remain undetected for an extended period.used by theor that of our business associates, could disrupt our business and negatively impact our operations in a variety of ways, including but not limited to:industry.Computers control nearly allresources;the crude oil and natural gasproduction-related infrastructure could result in a loss of production, and distribution systems in the U.S. and abroad, some of which are utilized to transport our production to market. Aor accidental discharge;directed at crude oilon a vendor or service provider could result in supply chain disruptions which could delay or halt our major development projects; and natural gas production and distribution damage critical distribution and/or storage assets or the environment, delay or prevent deliveryus from transporting and marketing our production, resulting in a loss of productionrevenues.markets and make it difficultfinancial losses from remedial actions, loss of business or impossible to accurately account for production and settle transactions. The occurrence of such an attack against any of the aforementioned production and distribution systemspotential liability, which could have a material adverse effect on our financial condition, and results of operations.operations or cash flows.Item 1B.Unresolved Staff Comments2012.2015.Item 2. Properties Item 3. Legal Proceedings an allegeda putative class action was filed in the District Court of Blaine County, Oklahoma by Billy J. Strack and Daniela A. Renner as trustees of certain named trusts and on behalf of other similarly situated parties against the Company allegingCompany. The Petition alleged the Company improperly deducted post-production costs from royalties paid to plaintiffs and other royalty interest owners as categorized in the petition from crude oil and natural gas wells located in Oklahoma. The plaintiffs have alleged a number of claims, including breach of contract, fraud, breach of fiduciary duty, unjust enrichment, and other claims and seek recovery of compensatory damages, interest, punitive damages and attorney fees on behalf of the allegedproposed class. On November 3, 2014, plaintiffs filed an Amended Petition that did not add any substantive claims, but sought a “hybrid class action” in which they sought certification of certain claims for injunctive relief, reserving the right to seek a further class certification on money damages in the future. Plaintiffs filed an Amended Motion for Class Certification on January 9, 2015, that modified the proposed class to royalty owners in Oklahoma production from July 1, 1993, to the present (instead of 1980 to the present) and sought certification of over 45 separate “ issues” for injunctive or declaratory relief, again, reserving the right to seek a further class certification of money damages in the future. The Company has responded to the petition, deniedits amendment, and the motions for class certification denying the allegations and raisedraising a number of affirmative defenses. Discoverydefenses and legal arguments to each of the claims and filings. Certain discovery was undertaken and the “hybrid” motion was briefed by plaintiffs and the Company. A hearing on the “hybrid” class certification was held on June 1st and 2nd, 2015. On June 11, 2015, the trial court certified a “hybrid” class as requested by plaintiffs. The Company has appealed the trial court’s class certification order, which will be reviewed de novo by the appellate court. The appeal briefing is ongoingcomplete and information and documents continue to be exchanged.ready for determination by the court. An unsuccessful mediation was conducted on December 7, 2015. The Company is not currently able to estimate a reasonably possible loss or range of loss or what impact, if any, the action will have on its financial condition, results of operations or cash flows due to the preliminary status of the matter, the complexity and number of legal and factual issues presented by the matter and uncertainties with respect to, among other things, the nature of the claims and defenses, the potential size of the class, the scope and types of the properties and agreements involved, the production years involved, and the ultimate potential outcome of the matter. The class hasAlthough not been certified. Plaintiffscurrently at issue in the “hybrid” certification, plaintiffs have indicated that if the class is certified they may seek damagesalleged underpayments in excess of $145$200 million that they may claim as damages, which may increase with the passage of time, a majority of which would be comprised of interest. The Company disputes plaintiffs’ claims, disputes that the case meets the requirements for a class action and is vigorously defending the case.such asincluding, but not limited to, commercial disputes, claims from royalty and surface owners, property damage claims, personal injury claims, disputes with tax authorities and similarother matters. While the outcome of these legal matters cannot be predicted with certainty, the Company does not expect them to have a material adverse effect on its financial condition, results of operations or cash flows.Item 4. Mine Safety Disclosures Item 5. Market for Registrant’s Common Equity, Related Stockholder Matters and Issuer Purchases of Equity Securities 2012 2011 Quarter Ended Quarter Ended March 31 June 30 September 30 December 31 March 31 June 30 September 30 December 31 $ 97.19 $ 91.82 $ 84.19 $ 80.59 $ 73.48 $ 72.73 $ 71.77 $ 72.98 67.94 61.50 61.02 66.07 56.55 57.89 46.25 42.43 — — — — — — — — Our senior notes restrict the payment of dividends under certain circumstances and we 2015 2014 Quarter Ended Quarter Ended March 31 June 30 September 30 December 31 March 31 June 30 September 30 December 31 High $ 48.99 $ 53.65 $ 42.51 $ 38.16 $ 63.23 $ 79.44 $ 80.91 $ 67.25 Low $ 32.51 $ 41.74 $ 22.56 $ 19.60 $ 52.00 $ 60.51 $ 65.22 $ 30.06 Cash Dividend — — — — — — — — 20, 2013,16, 2016, the number of record holders of our common stock was 157.1,157. Management believes, after inquiry, that the number of beneficial owners of our common stock is approximately 49,600.53,700. On February 20, 2013,16, 2016, the last reported sales price of our common stock, as reported on the New York Stock Exchange, was $82.43$18.46 per share.2012: Total number of
shares purchased
(1) Average
price paid
per share
(2) Total number of shares
purchased as part of
publicly announced
plans or programs Maximum number of
shares that may yet be
purchased under the
plans or program (3) 41,404 $ 75.67 — — 27,384 $ 70.57 — — 6,141 $ 73.14 — — 74,929 $ 73.60 — — Period Total number of
shares purchased (1) Average
price paid
per share (2) Total number of shares
purchased as part of
publicly announced
plans or programs Maximum number of
shares that may yet be
purchased under the
plans or programs (3)October 1, 2015 to October 31, 2015 — — — — November 1, 2015 to November 30, 2015 39,369 $ 34.29 — — December 1, 2015 to December 31, 2015 5,109 28.28 — — Total 44,478 $ 33.60 — — (1) In connection with restricted stock grants under the Continental Resources, Inc.Company's 2005 Long-Term Incentive Plan (“("2005 Plan”Plan") and 2013 Long-Term Incentive Plan ("2013 Plan"), we adopted a policy that enables employees to surrender shares to cover their tax liability. All sharesIn May 2013, the 2013 Plan was adopted and replaced the 2005 Plan. Shares indicated as having been purchased in the table above represent shares surrendered by employees to cover tax liabilities. We paid the associated taxes to the Internal Revenue Service.(2) The price paid per share was the closing price of our common stock on the date the restrictions lapsed on such shares. (3) We are unable to determine at this time the total amount of securities or approximate dollar value of those securities that could potentially be surrendered to us pursuant to our policy that enables employees to surrender shares to cover their tax liability associated with the vesting of restrictions on shares under the 2005 Plan.shares.20122015 relating to equity compensation plans: Number of Shares
to be Issued Upon
Exercise of
Outstanding
Options Weighted-Average
Exercise Price of
Outstanding Options Remaining Shares
Available for Future
Issuance Under Equity
Compensation Plans (1) — — $— 17,028,213 1,867,967 — — — (1) AllRepresents the maximum remaining shares (1,867,967) are available for issuance under the 20052013 Plan.performance graph compares the yearly percentage change in the cumulative total shareholder return on our common stock performance with the cumulative total returnsperformance of the Standard & Poor’s 500 Stock Index (“S&P 500 Index”), and the Dow Jones US Oil and Gas Index (“Dow Jones US O&G Index”), and a peer group for the period of companies.In years prior to 2012,December 2010 through December 2015. The graph assumes the total shareholder returnvalue of the investment in our common stock and in each index was compared to$100 on December 31, 2010 and that any dividends were reinvested. The stock performance shown on the total returnsgraph below is not indicative of the S&P 500 Index and a group of peer companies. Companies included in our peer group represented publicly traded crude oil and natural gas exploration and production companies similar in size and operations to us. In recent years, companies deemed to be peers have been acquired or have merged with other companies in our industry. Additionally, the rapid growth of our Company in recent years has outpaced the growth of our peers. These factors have caused fluctuations in the companies comprising our peer group from one year to the next. To mitigate the impact of these fluctuations and provide more consistency to the performance graph disclosure year after year, in 2012 we elected to replace our peer group with the Dow Jones US O&G Index for disclosure purposes. In this year of transition, we have presented the total returns of both the peer group and Dow Jones US O&G Index in the performance graph below.The peer group, which represents the group presented in the performance graph from our 2011 Form 10-K, is comprised of Cabot Oil & Gas Corporation, Cimarex Energy Co., Concho Resources Inc., Denbury Resources Inc., Forest Oil Corporation, Newfield Exploration Company, Pioneer Natural Resources Company, Range Resources Corporation, Ultra Petroleum Corp., and Whiting Petroleum Corporation. As required by those rules, the performance graph was prepared based upon the following assumptions:$100 was invested in our common stock, the S&P 500 Index, the Dow Jones US O&G Index, and the peer group on December 31, 2007 at the closing price on such date;
investment in the peer group was weighted based on the stock price of each individual company within the peer group at the beginning of the period; anddividends were reinvested on the relevant payment dates.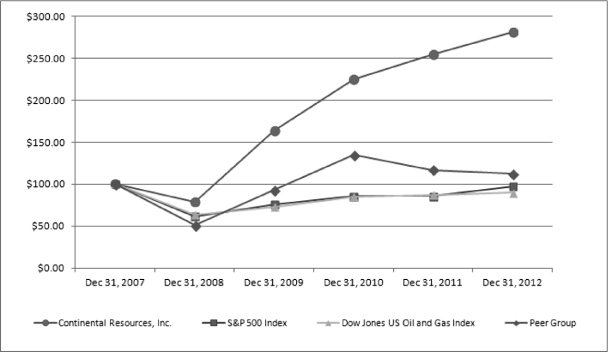
Item 6. Selected Financial Data our selected consolidated financial data for the years ended December 31, 20082011 through 2012.2015. The selected financial data presented below is not intended to replace our consolidated financial statements. as it relates to each of the fiscal years ended December 31, 2008 through 2012, has been derived from our audited consolidated financial statements for such periods. You should read the following selected consolidated financial data in connection withPart II, Item 7. Management’s Discussion and Analysis of Financial Condition and Results of Operations and our consolidated financial statements and related notes included elsewhere in this report. The selected consolidated results are not necessarily indicative of results to be expected in future periods. Year Ended December 31, 2012 2011 2010 2009 2008 $ 2,379,433 $ 1,647,419 $ 948,524 $ 610,698 $ 939,906 154,016 (30,049 ) (130,762 ) (1,520 ) (7,966 ) 2,572,520 1,649,789 839,065 626,211 960,490 739,385 429,072 168,255 71,338 320,950 739,385 429,072 168,255 71,338 320,950 $ 4.08 $ 2.42 $ 1.00 $ 0.42 $ 1.91 $ 4.08 $ 2.42 $ 1.00 $ 0.42 $ 1.91 181,340 177,590 168,985 168,559 168,087 $ 4.07 $ 2.41 $ 0.99 $ 0.42 $ 1.89 $ 4.07 $ 2.41 $ 0.99 $ 0.42 $ 1.89 181,846 178,230 169,779 169,529 169,392 25,070 16,469 11,820 10,022 9,147 63,875 36,671 23,943 21,606 17,151 35,716 22,581 15,811 13,623 12,006 $ 84.59 $ 88.51 $ 70.69 $ 54.44 $ 88.87 4.20 5.24 4.49 3.22 6.90 66.83 73.05 59.70 45.10 77.66 $ 5.49 $ 6.13 $ 5.87 $ 6.89 $ 8.40 6.42 6.42 4.82 3.37 4.84 19.44 17.33 15.33 15.34 12.30 3.42 3.23 3.09 3.03 2.95 561,163 326,133 224,784 173,280 106,239 1,341,084 1,093,832 839,568 504,080 318,138 784,677 508,438 364,712 257,293 159,262 $ 1,632,065 $ 1,067,915 $ 653,167 $ 372,986 $ 719,915 (3,903,370 ) (2,004,714 ) (1,039,416 ) (499,822 ) (927,617 ) 2,253,490 982,427 379,943 135,829 204,170 1,963,123 1,303,959 810,877 450,648 757,708 4,358,572 2,224,096 1,237,189 433,991 988,593 $ 9,140,009 $ 5,646,086 $ 3,591,785 $ 2,314,927 $ 2,215,879 3,539,721 1,254,301 925,991 523,524 376,400 3,163,699 2,308,126 1,208,155 1,030,279 948,708 Year Ended December 31, 2015 2014 2013 2012 2011 Income Statement data In thousands, except per share data Crude oil and natural gas sales $ 2,552,531 $ 4,203,022 $ 3,573,431 $ 2,349,500 $ 1,633,718 Gain (loss) on derivative instruments, net (1) 91,085 559,759 (191,751 ) 154,016 (30,049 ) Total revenues 2,680,167 4,801,618 3,421,807 2,542,587 1,636,088 Income (loss) from continuing operations (353,668 ) 977,341 764,219 739,385 429,072 Net income (loss) (353,668 ) 977,341 764,219 739,385 429,072 Basic earnings (loss) per share: From continuing operations $ (0.96 ) $ 2.65 $ 2.08 $ 2.04 $ 1.21 Net income (loss) per share $ (0.96 ) $ 2.65 $ 2.08 $ 2.04 $ 1.21 Shares used in basic earnings (loss) per share 369,540 368,829 368,150 362,680 355,180 Diluted earnings (loss) per share: From continuing operations $ (0.96 ) $ 2.64 $ 2.07 $ 2.03 $ 1.20 Net income (loss) per share $ (0.96 ) $ 2.64 $ 2.07 $ 2.03 $ 1.20 Shares used in diluted earnings (loss) per share 369,540 370,758 369,698 363,692 356,460 Production Crude oil (MBbl) (2) 53,517 44,530 34,989 25,070 16,469 Natural gas (MMcf) 164,454 114,295 87,730 63,875 36,671 Crude oil equivalents (MBoe) 80,926 63,579 49,610 35,716 22,581 Average sales prices (3) Crude oil ($/Bbl) $ 40.50 $ 81.26 $ 89.93 $ 84.59 $ 88.51 Natural gas ($/Mcf) $ 2.31 $ 5.40 $ 4.87 $ 3.73 $ 4.87 Crude oil equivalents ($/Boe) $ 31.48 $ 66.53 $ 72.04 $ 65.99 $ 72.45 Average costs per unit (3) Production expenses ($/Boe) $ 4.30 $ 5.58 $ 5.69 $ 5.49 $ 6.13 Production taxes (% of oil and gas revenues) 7.8 % 8.2 % 8.3 % 8.3 % 8.0 % DD&A ($/Boe) $ 21.57 $ 21.51 $ 19.47 $ 19.44 $ 17.33 General and administrative expenses ($/Boe) (4) $ 2.34 $ 2.92 $ 2.91 $ 3.42 $ 3.23 Proved reserves at December 31 Crude oil (MBbl) 700,514 866,360 737,788 561,163 326,133 Natural gas (MMcf) 3,151,786 2,908,386 2,078,020 1,341,084 1,093,832 Crude oil equivalents (MBoe) 1,225,811 1,351,091 1,084,125 784,677 508,438 Other financial data (in thousands) Net cash provided by operating activities $ 1,857,101 $ 3,355,715 $ 2,563,295 $ 1,632,065 $ 1,067,915 Net cash used in investing activities $ (3,046,247 ) $ (4,587,399 ) $ (3,711,011 ) $ (3,903,370 ) $ (2,004,714 ) Net cash provided by financing activities $ 1,187,189 $ 1,227,715 $ 1,140,469 $ 2,253,490 $ 982,427 EBITDAX (5) $ 1,978,896 $ 3,776,051 $ 2,839,510 $ 1,963,123 $ 1,303,959 Total capital expenditures $ 2,564,301 $ 5,015,595 $ 3,841,633 $ 4,358,572 $ 2,224,096 Balance Sheet data at December 31 (in thousands) Total assets (6) (7) $ 14,919,808 $ 15,076,033 $ 11,841,567 $ 9,091,918 $ 5,584,740 Long-term debt, including current maturities (6) $ 7,117,788 $ 5,928,878 $ 4,650,889 $ 3,491,994 $ 1,236,909 Shareholders’ equity $ 4,668,900 $ 4,967,844 $ 3,953,118 $ 3,163,699 $ 2,308,126 (1) Derivative instruments are not designated as hedges for accounting purposes and, therefore, realized and unrealized changes in the fair value of the instruments are shown separately from crude oil and natural gas sales. The amounts above include unrealized non-cash mark-to-market gains (losses) on derivative instruments of $21.5 million, $174.4 million, ($130.2) million, $199.7 million, $4.1 million, ($166.2) million and ($2.1)$4.1 million for the years ended December 31, 2015, 2014, 2013, 2012, and 2011, 2010, and 2009, respectively. ThereAdditionally, 2014 includes $433 million of gains recognized from crude oil derivative contracts that were no unrealized gains or losses on derivative instruments forsettled in the year endedfourth quarter of 2014 prior to their contractual maturities initially scheduled through December 31, 2008.2016.(2) At various times, we have stored crude oil due to pipeline line fill requirements, low commodity prices, or transportation constraintsmarketing disruptions or we have sold crude oil from inventory. These actions result in differences between our produced and sold crude oil volumes. For the year2015, crude oil sales volumes were 147 MBbls more than crude oil production volumes. For 2014, crude oil sales volumes were 408 MBbls less than crude oil production volumes. For 2013, crude oil sales volumes were 4 MBbls less than crude oil production volumes. For 2012, crude oil sales volumes were 112 MBbls less than crude oil production volumes. For the year 2011, crude oil sales volumes were 30 MBbls less than crude oil production volumes. For the year 2010, crude oil sales volumes were 78 MBbls more than crude oil production volumes. For the year 2009, crude oil sales volumes were 82 MBbls less than crude oil production volumes. For the year 2008, crude oil sales volumes were 97 MBbls more than crude oil production volumes.(3) Average sales prices and average costs per Boeunit have been computed using sales volumes and exclude any effect of derivative transactions.(4) General and administrative expenses ($/Boe) include non-cash equity compensation expenses of $0.64 per Boe, $0.86 per Boe, $0.80 per Boe, $0.82 per Boe, $0.73 per Boe, $0.74 per Boe, $0.84 per Boe and $0.75$0.73 per Boe for the years ended December 31, 2015, 2014, 2013, 2012, 2011, 2010, 2009 and 2008,2011, respectively. Additionally, general and administrative expenses include corporate relocation expenses of $0.04 per Boe, $0.22 per Boe and $0.14 per Boe for the years ended December 31, 2013, 2012, and 2011. No corporate relocation expenses were incurred prior to 2011.2011 and after 2013.(5) representsas earnings before interest expense, income taxes, depreciation, depletion, amortization and accretion, property impairments, exploration expenses, non-cash gains and losses resulting from the requirements of accounting for derivatives, and non-cash equity compensation expense.expense, and losses on extinguishment of debt. EBITDAX is not a measure of net income or operating cash flows as determined by generally accepted accounting principles. Reconciliations of net income and operating cash flows to EBITDAX are provided inPart II, Item 7. Management’s Discussion and Analysis of Financial Condition and Results of Operations—Non-GAAP Financial Measures.
| (6) | Balances at December 31, 2014, 2013, 2012, and 2011 have been retroactively adjusted to reflect our June 2015 adoption of Accounting Standards Update ("ASU") 2015-03, Interest—Imputation of Interest (Subtopic 835-30): Simplifying the Presentation of Debt Issuance Costs, which resulted in the reclassification of $69.0 million, $64.9 million, $47.7 million, and $17.4 million, respectively, of unamortized debt issuance costs from “Other noncurrent assets” to a reduction of “Long-term debt, net of current portion” on the consolidated balance sheets. See Part II, Item 8. Notes to Consolidated Financial Statements—Note 1. Organization and Summary of Significant Accounting Policies—New accounting pronouncements for further discussion. |
| (7) | Balances at December 31, 2013, 2012, and 2011 have been retroactively adjusted to reflect our December 2015 adoption of ASU 2015-17, Balance Sheet Classification of Deferred Taxes, which resulted in the reclassification of $34.7 million, $0.4 million, and $44.0 million, respectively, of deferred income tax assets to a non-current liability classification within “Deferred income tax liabilities, net” on the consolidated balance sheets. See Part II, Item 8. Notes to Consolidated Financial Statements—Note 1. Organization and Summary of Significant Accounting Policies—New accounting pronouncements for further discussion. No deferred income tax asset balances existed on the balance sheet at December 31, 2014 that required reclassification. |
| ITEM 7. | Management’s Discussion and Analysis of Financial Condition and Results of Operations |
We focus our exploration activities in large new or developing crude oil and liquids-rich plays that provide us the opportunity to acquire undeveloped acreage positions for future drilling operations. We have been successful in targeting large repeatable resource plays where horizontal drilling, advanced fracture stimulation and enhanced recovery technologies provide the means to economically develop and produce crude oil and natural gas reserves from unconventional formations. In October 2012, we announced a new five-year growth plan to triple our production and proved reserves from year-end 2012 to year-end 2017.
gas. We derive the majority of our operating income and cash flows from the sale of crude oil and natural gas. Wegas and expect growth in our revenues and operating income will primarily depend on commodity prices and our abilitythis to increase our crude oil and natural gas production. In recent months and years, there has been significant volatility in crude oil and natural gas prices due to a variety of factors we cannot control or predict, including political and economic events, weather conditions, and competition from other energy sources. These factors impact supply and demand for crude oil and natural gas, which affect crude oil and natural gas prices. In addition, the prices we realize for our crude oil and natural gas production are affected by price differencescontinue in the markets where we deliver our production.
2012 Highlights
Proved reserves
At December 31, 2012, our estimated proved reserves totaled 784.7 MMBoe, an increase of 54% over proved reserves of 508.4 MMBoe at December 31, 2011. Extensions and discoveries resulting from ourfuture. Our operations are primarily focused on exploration and development activities were the primary drivers of our proved reserves growth in 2012, adding 233.7 MMBoe of proved reserves during the year, with strategic acquisitions adding 82.0 MMBoe. Our extensions and discoveries were primarily driven by successful drilling results and strong production growth in the Bakken field. Our proved reserves in the Bakken field totaled 563.6 MMBoe at December 31, 2012, representing a 92% increase from 294.2 MMBoe at year-end 2011.
Our properties in the Bakken field comprised 72% of our proved reserves at December 31, 2012, with the SCOOP and Northwest Cana plays in Oklahoma comprising 14% and the Red River units in North Dakota, South Dakota and Montana comprising 10%. Estimated proved developed producing reserves were 309.0 MMBoe at
December 31, 2012, representing 39% of our total estimated proved reserves compared with 40% at year-end 2011.
Crude oil reserves comprised 72%, or 561.2 MMBoe, of our estimated proved reserves at December 31, 2012 compared to 64% at December 31, 2011. The increased percentage of crude oil reserves at December 31, 2012 is a reflection of our continued strategy of focusing on the exploration for and development of high-value crude oil and liquids-rich plays.
We seek to operate wells in which we own an interest. At December 31, 2012, we operated wells that accounted for 85% of our total proved reserves and 84% of our PV-10. By controlling operations, we are able to more effectively manage the costs and timing of exploration and development of our properties, including the drilling and fracture stimulation methods used. Additionally, our business strategy has historically focused on reserve and production growth through exploration and development activities. For the three-year period ended December 31, 2012, we added 490.9 MMBoe of proved reserves through extensions and discoveries, compared to 84.4 MMBoe added through acquisitions.
Production, revenues and operating cash flows
For the year ended December 31, 2012, our crude oil and natural gas production totaled 35,716 MBoe (97,583 Boe per day), representing a 58% increase from production of 22,581 MBoe (61,865 Boe per day) for the year ended December 31, 2011. Crude oil represented 70% of our 2012 production compared to 73% for 2011. The decreased percentage of crude oil production resulted from our natural gas production growth in 2012 of 74% outpacing our crude oil production growth of 52% due in part to the connecting of new and existing wells in North Dakota to gas processing plants, thereby resulting in a higher percentage of our production coming from natural gas in 2012.
Our crude oil and natural gas production totaled 9,829 MBoe (106,831 Boe per day) for the fourth quarter of 2012, a 4% increase over production of 9,472 MBoe (102,964 Boe per day) for the third quarter of 2012 and a 42% increase over production of 6,920 MBoe (75,219 Boe per day) for the fourth quarter of 2011. Crude oil represented 72% of our production for the fourth quarter of 2012, 70% for the third quarter of 2012, and 72% for the fourth quarter of 2011.
The increase in 2012 production was primarily driven by higher production from our properties in the North Dakota Bakken field and the Northwest Cana and SCOOP plays in Oklahoma due to the continued success of our drilling programs in those areas. Our Bakken production in North Dakota increased to 18,679 MBoe for the year ended December 31, 2012, a 92% increase over the comparable 2011 period. Fourth quarter 2012 production in North Dakota Bakken totaled 5,430 MBoe, a 6% increase over the third quarter of 2012 and 66% higher than the fourth quarter of 2011. Production in the Northwest Cana play totaled 4,097 MBoe for the year ended December 31, 2012, 134% higher than the same period in 2011. Northwest Cana production increased 22% in the fourth quarter of 2012 compared to the fourth quarter of 2011, yet decreased 15% from the third quarter of 2012 due to reduced drilling activity. Production from our properties in the emerging SCOOP play in south-central Oklahoma totaled 1,654 MBoe for the year ended December 31, 2012, a 297% increase over the comparable 2011 period. SCOOP production totaled 655 MBoe for the 2012 fourth quarter, a 39% increase over the third quarter of 2012 and a 281% increase over the fourth quarter of 2011.
Our crude oil and natural gas revenues for the year ended December 31, 2012 increased 44% to $2.4 billion due to a 58% increase in sales volumes partially offset by a 9% decrease in realized commodity prices compared to the same period in 2011. Our realized price per Boe decreased $6.22 to $66.83 for the year ended December 31, 2012 compared to 2011 due to lower commodity prices and higher crude oil differentials realized. Crude oil represented 89% of our total 2012 crude oil and natural gas revenues compared to 88% for 2011.
Crude oil and natural gas revenues totaled $670.4 million for the fourth quarter of 2012, a 32% increase over revenues of $508.3 million for the 2011 fourth quarter due to a 39% increase in sales volumes partially offset by a 5% decrease in realized commodity prices. Crude oil represented 88% of our total crude oil and natural gas revenues for the fourth quarter of 2012 compared to 89% for the 2011 fourth quarter.
Our cash flows from operating activities for the year ended December 31, 2012 were $1.6 billion, a 53% increase from $1.1 billion provided by our operating activities during the comparable 2011 period. For the fourth quarter of 2012, operating cash flows totaled $484.2 million, 22% higher than operating cash flows of $398.1 million for the 2011 fourth quarter. The increased operating cash flows were primarily due to higher crude oil and natural gas revenues driven mainly by increased sales volumes, partially offset by lower realized sales prices, an increase in realized losses on derivatives and higher production expenses, production taxes, general and administrative expenses and other expenses associated with the growth of our operations over the past year.
Capital expenditures and property acquisitions
For the year ended December 31, 2012, we invested approximately $4.4 billion in our capital program (including $15.0 million of seismic costs and $49.0 million of capital costs associated with increased accruals for capital expenditures), focusing primarily on increased exploration and development in the Bakken field of North Dakota and Montana and the SCOOP, playSTACK, and Northwest Cana areas of Oklahoma.
In December 2012, we acquiredOur 2016 capital budget reflects a planned reduction in operated rig count and deferral of certain producing and undeveloped propertieswell completion activities relative to 2015, primarily in the Bakken. At December 31, 2015, we operated 23 rigs on our properties, which we subsequently reduced to 19 operated rigs in early 2016 by dropping 4 rigs in the Bakken. We expect to maintain an average of 19 operated rigs for full-year 2016 and plan to complete 71 net operated and non-operated wells in 2016, a 74% decrease compared to 271 net well completions in 2015. We plan to defer well completion activities for most of our Bakken playwells in 2016, which is expected to increase our inventory of North Dakota fromdrilled but uncompleted wells during the year. As a third party for $663.3 million. In the transaction, we acquired interests in approximately 119,000 net acres as well as producing properties withresult of these and other actions, our production is expected to decline to an average of approximately 6,500 net200,000 Boe per day.
In August 2012, we acquired the crude2015 Results
In February 2012, we acquired certain producingday), a 1% increase over the third quarter of 2015 and undeveloped properties4% higher than the fourth quarter of 2014.
Through leasingday) for 2015, a 75% increase over 2014. SCOOP production for the 2015 fourth quarter totaled 5,937 MBoe (64,534 Boe per day), a 7% decrease compared to the third quarter of 2015 and acquisitions60% higher than the fourth quarter of 2014.
Our capital expenditures budget for 2013 is $3.6 billion, excluding acquisitions. Our 2013 capital program is expected to continue focusing on exploratory and development drilling in the Bakken field and 2014.
We hedge a portion of our anticipated future production to achieve more predictable cash flows and reduce our exposure to fluctuations in commodity prices. Reducing our exposure to price volatility helps ensure adequate funds are available for our capital program. We expect our cash flows from operations, our remaining cash balance, and our credit facility, including our ability to increase our borrowing capacity thereunder, will be sufficient to meet our budgeted capital expenditure needs for the next 12 months; however, we may choose to access the capital markets for additional financing to take advantage of business opportunities that may arise if such financing can be arranged at favorable terms.
Property dispositions
In 2012, we completed the following dispositions of non-strategic properties in an effort to redeploy capital to our strategic areas that we believe will deliver higher future growth potential. We may continue to seek opportunities to sell non-strategic properties if and when we have the ability to dispose of such assets at favorable terms.
In December 2012, we sold the producing properties in our East region to a third party for $126.4 million and recognized a pre-tax gain on the transaction of $68.0 million. The disposed properties
|
In June 2012, we sold certain non-strategic leaseholds and producing properties in Oklahoma to a third party for $15.9 million and recognized a pre-tax gain on the transaction of $15.9 million. The disposed properties represented an immaterial portion of our total proved reserves and production.
In February 2012, we sold certain non-strategic leaseholds and producing properties in Wyomingincreased 12% from 370 MMBoe at year-end 2014 to a third party for $84.4 million and recognized a pre-tax gain on the transaction of $50.1 million. The disposed properties had413 MMBoe at year-end 2015. SCOOP represented 3.2 MMBoe, or 1%,34% of our total proved reserves at December 31, 2011 and 259 MBoe,2015 compared to 27% at year-end 2014.
Corporate relocation
The previously announced relocation
| 1Q 2015 | 2Q 2015 | 3Q 2015 | 4Q 2015 | YTD 2015 | |||||||||||||||||||||||||
| Gross | Net | Gross | Net | Gross | Net | Gross | Net | Gross | Net | ||||||||||||||||||||
| North Dakota Bakken | 210 | 62 | 160 | 56 | 168 | 35 | 103 | 22 | 641 | 175 | |||||||||||||||||||
| Montana Bakken | 8 | 6 | 1 | — | — | — | — | — | 9 | 6 | |||||||||||||||||||
| SCOOP | 74 | 37 | 55 | 18 | 37 | 11 | 38 | �� | 8 | 204 | 74 | ||||||||||||||||||
| Northwest Cana | — | — | 5 | 2 | 5 | 2 | 4 | 2 | 14 | 6 | |||||||||||||||||||
| STACK | — | — | 1 | — | 5 | 1 | 6 | 3 | 12 | 4 | |||||||||||||||||||
| Other | 12 | 6 | 4 | — | 1 | — | — | — | 17 | 6 | |||||||||||||||||||
| Total wells | 304 | 111 | 226 | 76 | 216 | 49 | 151 | 35 | 897 | 271 | |||||||||||||||||||
$8 million for the 2015 fourth quarter compared to $120 million for the third quarter, $270 million for the second quarter, and $790 million for the first quarter. This decreasing trend resulted from a reduction in capital expenditures due to our efforts to align spending with cash flows in response to decreased commodity prices. Our total debt was nearly flat at December 31, 2015 compared to September 30, 2015.
Volumes of crude oil and natural gas produced,
Crude oil and natural gas prices realized,
Per unit operating and administrative costs,costs; and
EBITDAX (a non-GAAP financial measure)
.| Year ended December 31, | ||||||||||||
| 2012 | 2011 | 2010 | ||||||||||
Average daily production: | ||||||||||||
Crude oil (Bbl per day) | 68,497 | 45,121 | 32,385 | |||||||||
Natural gas (Mcf per day) | 174,521 | 100,469 | 65,598 | |||||||||
Crude oil equivalents (Boe per day) | 97,583 | 61,865 | 43,318 | |||||||||
Average sales prices: (1) | ||||||||||||
Crude oil ($/Bbl) | $ | 84.59 | $ | 88.51 | $ | 70.69 | ||||||
Natural gas ($/Mcf) | 4.20 | 5.24 | 4.49 | |||||||||
Crude oil equivalents ($/Boe) | 66.83 | 73.05 | 59.70 | |||||||||
Production expenses ($/Boe) (1) | 5.49 | 6.13 | 5.87 | |||||||||
General and administrative expenses ($/Boe) (1) | 3.42 | 3.23 | 3.09 | |||||||||
Net income (in thousands) | 739,385 | 429,072 | 168,255 | |||||||||
Diluted net income per share | 4.07 | 2.41 | 0.99 | |||||||||
EBITDAX (in thousands) (2) | 1,963,123 | 1,303,959 | 810,877 | |||||||||
| Year ended December 31, | ||||||||||||
| 2015 | 2014 | 2013 | ||||||||||
| Average daily production: | ||||||||||||
| Crude oil (Bbl per day) | 146,622 | 121,999 | 95,859 | |||||||||
| Natural gas (Mcf per day) | 450,558 | 313,137 | 240,355 | |||||||||
| Crude oil equivalents (Boe per day) | 221,715 | 174,189 | 135,919 | |||||||||
| Average sales prices: | ||||||||||||
| Crude oil ($/Bbl) | $ | 40.50 | $ | 81.26 | $ | 89.93 | ||||||
| Natural gas ($/Mcf) | $ | 2.31 | $ | 5.40 | $ | 4.87 | ||||||
| Crude oil equivalents ($/Boe) | $ | 31.48 | $ | 66.53 | $ | 72.04 | ||||||
| Crude oil sales price differential to NYMEX ($/Bbl) | $ | (8.33 | ) | $ | (10.81 | ) | $ | (8.23 | ) | |||
| Natural gas sales price premium (discount) to NYMEX ($/Mcf) | $ | (0.34 | ) | $ | 1.02 | $ | 1.21 | |||||
| Production expenses ($/Boe) | $ | 4.30 | $ | 5.58 | $ | 5.69 | ||||||
| Production taxes (% of oil and gas revenues) | 7.8 | % | 8.2 | % | 8.3 | % | ||||||
| DD&A ($/Boe) | $ | 21.57 | $ | 21.51 | $ | 19.47 | ||||||
| General and administrative expenses ($/Boe) (1) | $ | 1.70 | $ | 2.06 | $ | 2.11 | ||||||
| Non-cash equity compensation ($/Boe) | $ | 0.64 | $ | 0.86 | $ | 0.80 | ||||||
| Net income (loss) (in thousands) | $ | (353,668 | ) | $ | 977,341 | $ | 764,219 | |||||
| Diluted net income (loss) per share | $ | (0.96 | ) | $ | 2.64 | $ | 2.07 | |||||
| EBITDAX (in thousands) (2) | $ | 1,978,896 | $ | 3,776,051 | $ | 2,839,510 | ||||||
| (1) |
| (2) | We define EBITDAX |
Crude oil and natural gas sales Gain (loss) on derivative instruments, net (1) Crude oil and natural gas service operations Total revenues Operating costs and expenses (2) Other expenses, net Income before income taxes Provision for income taxes Net income Production volumes: Crude oil (MBbl) (3) Natural gas (MMcf) Crude oil equivalents (MBoe) Sales volumes: Crude oil (MBbl) (3) Natural gas (MMcf) Crude oil equivalents (MBoe) Average sales prices: (4) Crude oil ($/Bbl) Natural gas ($/Mcf) Crude oil equivalents ($/Boe) Year Ended December 31, 2012 2011 2010 In thousands, except sales price data $ 2,379,433 $ 1,647,419 $ 948,524 154,016 (30,049 ) (130,762 ) 39,071 32,419 21,303 2,572,520 1,649,789 839,065 1,279,713 889,037 528,744 137,611 73,307 51,854 1,155,196 687,445 258,467 415,811 258,373 90,212 $ 739,385 $ 429,072 $ 168,255 25,070 16,469 11,820 63,875 36,671 23,943 35,716 22,581 15,811 24,958 16,439 11,898 63,875 36,671 23,943 35,604 22,551 15,889 $ 84.59 $ 88.51 $ 70.69 4.20 5.24 4.49 66.83 73.05 59.70 Year Ended December 31, In thousands, except sales price data 2015 2014 2013 Crude oil and natural gas sales $ 2,552,531 $ 4,203,022 $ 3,573,431 Gain (loss) on derivative instruments, net (1) 91,085 559,759 (191,751 ) Crude oil and natural gas service operations 36,551 38,837 40,127 Total revenues 2,680,167 4,801,618 3,421,807 Operating costs and expenses (2,904,168 ) (2,933,782 ) (1,976,040 ) Other expenses, net (2) (311,084 ) (305,798 ) (232,718 ) Income (loss) before income taxes (535,085 ) 1,562,038 1,213,049 (Provision) benefit for income taxes 181,417 (584,697 ) (448,830 ) Net income (loss) $ (353,668 ) $ 977,341 $ 764,219 Production volumes: Crude oil (MBbl) 53,517 44,530 34,989 Natural gas (MMcf) 164,454 114,295 87,730 Crude oil equivalents (MBoe) 80,926 63,579 49,610 Sales volumes: Crude oil (MBbl) 53,664 44,122 34,985 Natural gas (MMcf) 164,454 114,295 87,730 Crude oil equivalents (MBoe) 81,073 63,172 49,607 Average sales prices: Crude oil ($/Bbl) $ 40.50 $ 81.26 $ 89.93 Natural gas ($/Mcf) $ 2.31 $ 5.40 $ 4.87 Crude oil equivalents ($/Boe) $ 31.48 $ 66.53 $ 72.04 (1) Amounts include unrealized non-cash mark-to-marketThe year 2014 includes $433 million of pre-tax gains onrecognized from crude oil derivative instrumentscontracts that were settled in the fourth quarter of $199.7 million and $4.1 million for the years ended December 31, 2012 and 2011, respectively, and an unrealized non-cash mark-to-market loss on derivative instruments of $166.2 million for thethat year ended December 31, 2010.prior to their contractual maturities.(2) Amounts are netThe year 2014 includes a loss on extinguishment of gains on salesdebt of assets$24.5 million related to the July 2014 redemption of $136.0 million, $20.8 million, and $29.6 million for the years ended December 31, 2012, 2011, and 2010, respectively. Seeour 8.25% Senior Notes to Consolidated Financial Statements—Note 13. Property Acquisitions and Dispositions for further discussion of the transactions.due 2019.(3)At various times we have stored crude oil due to pipeline line fill requirements, low commodity prices, or transportation constraints or we have sold crude oil from inventory. These actions result in differences between produced and sold crude oil volumes. Crude oil sales volumes were 112 MBbls less than crude oil production for the year ended December 31, 2012, 30 MBbls less than crude oil production for the year ended December 31, 2011 and 78 MBbls more than crude oil production for the year ended December 31, 2010.(4)Average sales prices have been calculated using sales volumes and exclude any effect of derivative transactions.
| Year Ended December 31, | Volume increase | Volume percent increase | ||||||||||||||||||||||
| 2012 | 2011 | |||||||||||||||||||||||
| Volume | Percent | Volume | Percent | |||||||||||||||||||||
Crude oil (MBbl) | 25,070 | 70 | % | 16,469 | 73 | % | 8,601 | 52 | % | |||||||||||||||
Natural Gas (MMcf) | 63,875 | 30 | % | 36,671 | 27 | % | 27,204 | 74 | % | |||||||||||||||
|
|
|
|
|
|
|
|
|
| |||||||||||||||
Total (MBoe) | 35,716 | 100 | % | 22,581 | 100 | % | 13,135 | 58 | % | |||||||||||||||
| Year Ended December 31, | Volume increase (decrease) | Percent increase (decrease) | ||||||||||||||||||||||
| 2012 | 2011 | |||||||||||||||||||||||
| MBoe | Percent | MBoe | Percent | |||||||||||||||||||||
North Region | 27,207 | 76 | % | 17,462 | 77 | % | 9,745 | 56 | % | |||||||||||||||
South Region | 8,110 | 23 | % | 4,705 | 21 | % | 3,405 | 72 | % | |||||||||||||||
East Region (1) | 399 | 1 | % | 414 | 2 | % | (15 | ) | (4 | %) | ||||||||||||||
|
|
|
|
|
|
|
|
|
| |||||||||||||||
Total | 35,716 | 100 | % | 22,581 | 100 | % | 13,135 | 58 | % | |||||||||||||||
52 The 20% increase in crude | |||||||||||||||||||||||||||||||||||||||||||||||||||||||||||||||||||||||||||||||||||||||||||||||||||||||||||||||||||||||||||||||||||||||||||||||||||||||||||||||||||||||||||||||||||||||||||||||||||||||||||||||||||||||||||||||||||||||||||||||||||||||||||||||||||||||||||||||||||||||||||||
Crude oil production volumes increased 52% during the year ended December 31, 2012in 2015 compared to 2014 was driven by increased production from our properties in North Dakota Bakken and SCOOP. Production in North Dakota Bakken increased 6,623 MBbls, or 21%, over the prior year, ended December 31, 2011. Production increases in the Bakken field, the Northwest Cana play andwhile SCOOP play contributed incremental production volumes in 2012 of 8,493increased 3,545 MBbls, an 81% increase over production in these areas for the same period in 2011.or 97%. Production growth in these areas iswas primarily due to increasedadditional drilling and completion activity resulting from our drilling program. Additionally, production in the Red River units increased 177 MBbls, or 4%, in 2012 due to new wells being completed and enhanced recovery techniques being successfully applied.
Natural gas production volumes increased 27,204 MMcf, or 74%, during the year ended December 31, 2012 compared to the same period in 2011. Natural gas production in the Bakken field increased 9,414 MMcf, or 104%, for the year ended December 31, 2012 compared to the same period in 2011 due to new wells being completed and gas from existing wells being connected to natural gas processing plants in the play. Natural gas production in the Northwest Cana and SCOOP plays in Oklahoma increased 17,839 MMcf, or 156%, due to additional wells being completed and producing in the year ended December 31, 2012 compared to the same period in 2011. Further, natural gas production increased 716 MMcf, or 81%, in non-Bakken areas in the North region compared to 2011 due to the completion of new wells during the period. These increases were partially offset by a decrease in production volumes of 837 MMcf,from our properties in Montana Bakken and the Red River units totaling 1,280 MBbls, or 6%14%, from non-core areas in our South regioncompared to the prior year due to a combination of natural declines in production and reduced drilling activity prompted by the pricing environment foractivity.
Revenues
Accordingly, we expect our natural gas production may increase to approximately 40% of our total production for 2016. As crude oil prices recover, we expect to increase our completion activities in the Bakken and shift our production back to a higher proportion of crude oil.
sales.
Oklahoma. Our realized price per Boe decreased $6.22 to $66.83 for the year ended December 31, 2012 from $73.05 for the year ended December 31, 2011 due to lower commodity prices, and higherpartially offset by an increase in sales volumes.
sales prices averaged $40.50 per barrel for 2015, a decrease of 50% compared to $81.26 for 2014. Market prices for crude oil remained depressed throughout 2015, resulting in significantly lower realized sales prices compared to the prior year. The differential between NYMEX West Texas Intermediate ("WTI") calendar month average crude oil prices and our realized crude oil priceprices averaged $8.33 per barrel for the year ended December 31, 2012 was $9.062015 compared to $6.39$10.81 for 2014. The improved differential was due in part to increased availability and use of pipeline transportation in the current year to move our crude oil to market with less dependence on more costly rail transportation.
Derivatives.We have entered into a numberextent of derivative instruments, including fixed price swaps and zero-cost collars, to reduce the uncertainty of future cash flows in order to underpin our capital expenditures and drilling program. We are required to recognize all derivative instruments on the balance sheet as either assets or liabilities measured at fair value. We have not designated our derivative instruments as hedges for accounting purposes. As a result, we mark our derivative instruments to fair value and recognize the realized and unrealized changes in fair value in the consolidated statements of income under the caption “Gain (loss) on derivative instruments, net”, which is a componentuncertain due to the unpredictable nature of total revenues.commodity prices.
Changes in commodity futures price stripsnatural gas prices during 20122015 had an overall positive neta favorable impact on the fair value of our derivatives, which resulted in net positive revenue adjustments of $154.0$91.1 million for the year. We expect ourOur revenues willmay continue to be significantly impacted, either positively or negatively, by changes in the fair value of our derivative instruments as a result of volatility in crude oil and natural gascommodity prices.
| Year ended December 31, | ||||||||
| 2012 | 2011 | |||||||
| In thousands | ||||||||
Realized gain (loss) on derivatives: | ||||||||
Crude oil derivatives | $ | (55,579 | ) | $ | (71,411 | ) | ||
Natural gas derivatives | 9,858 | 37,305 | ||||||
|
|
|
| |||||
Total realized gain (loss) on derivatives | $ | (45,721 | ) | $ | (34,106 | ) | ||
Unrealized gain (loss) on derivatives | ||||||||
Crude oil derivatives | $ | 202,478 | $ | 18,753 | ||||
Natural gas derivatives | (2,741 | ) | (14,696 | ) | ||||
|
|
|
| |||||
Total unrealized gain (loss) on derivatives | $ | 199,737 | $ | 4,057 | ||||
|
|
|
| |||||
Gain (loss) on derivative instruments, net | $ | 154,016 | $ | (30,049 | ) | |||
|
|
|
| |||||
Crude Oil and Natural Gas Service Operations. Our crude oil and natural gas service operations consist primarily of the treatment and sale of lower quality crude oil, or reclaimed crude oil. The table below shows the volumes and prices for the sale of reclaimed crude oil for the periods presented.
| Year Ended December 31, | Increase (Decrease) | |||||||||||
Reclaimed crude oil sales | 2012 | 2011 | ||||||||||
Average sales price ($/Bbl) | $ | 91.64 | $ | 92.30 | $ | (0.66 | ) | |||||
Sales volumes (MBbls) | 272 | 259 | 13 | |||||||||
The increase in sales volumes reflected above, partially offset by lower realized sales prices, resulted in a $1.3 million net increase in reclaimed oil revenues to $25.1 million for the year ended December 31, 2012. Additionally, revenues from saltwater disposal and other services increased $5.4 million to $14.0 million resulting from increased activity. Associated crude oil and natural gas service operations expenses increased $5.5 million to $32.2 million for the year ended December 31, 2012 due mainly to an increase in the costs of purchasing and treating reclaimed crude oil for resale and in providing saltwater disposal services.
| Year ended December 31, | ||||||||
| In thousands | 2015 | 2014 | ||||||
| Cash received (paid) on derivatives: | ||||||||
| Crude oil derivatives (1) | $ | — | $ | 396,901 | ||||
| Natural gas derivatives | 69,553 | (11,551 | ) | |||||
| Cash received on derivatives, net | 69,553 | 385,350 | ||||||
| Non-cash gain on derivatives: | ||||||||
| Crude oil derivatives | 4,715 | 89,894 | ||||||
| Natural gas derivatives | 16,817 | 84,515 | ||||||
| Non-cash gain on derivatives, net | 21,532 | 174,409 | ||||||
| Gain on derivative instruments, net | $ | 91,085 | $ | 559,759 | ||||
| (1) | Net cash receipts for crude oil derivatives in 2014 include $433 million of proceeds received from crude oil derivative contracts that were settled in the fourth quarter of 2014 prior to their contractual maturities. |
Production taxes and other expenses increased $83.6decreased $149.2 million, or 58%43%, to $228.4$200.6 million for the year ended December 31, 2012in 2015 compared to the year ended December 31, 2011 as a result of higher$349.8 million in 2014 primarily due to lower crude oil and natural gas revenues resulting primarily from increased sales volumes. Production taxes and other expenses in the consolidated statements of income include other charges for marketing, gathering, dehydration and compression fees primarily related to natural gas sales in the Oklahoma Woodford and North Dakota Bakken areas of $29.9 million and $13.7 million for the years ended December 31, 2012 and 2011, respectively. The increase in other charges is primarily due to the significant increasedecrease in natural gas sales volumes incommodity prices over the currentprior year. Production taxes excluding other charges,are generally based on the wellhead values of production and vary by state. Production taxes as a percentage of crude oil and natural gas revenues were 7.8% for 2015 compared to 8.2% for 2014, the decrease of which resulted from significant growth over the past year ended December 31, 2012 compared to 7.9% for the year ended December 31, 2011. Thein our SCOOP operations and resulting increase is due to higher taxablein revenues coming from North Dakota, our most active area,Oklahoma, which has lower production tax rates compared to the Bakken. We expect this downward trend in our average production tax rate to continue in 2016 as our operations in Oklahoma continue to
On a unit of sales basis, productionrevenues effective January 1, 2016.
| Year Ended December 31, | ||||||||
$/Boe | 2012 | 2011 | ||||||
Production expenses | $ | 5.49 | $ | 6.13 | ||||
Production taxes and other expenses | 6.42 | 6.42 | ||||||
|
|
|
| |||||
Production expenses, production taxes and other expenses | $ | 11.91 | $ | 12.55 | ||||
| Year Ended December 31, | ||||||||
(in thousands) | 2012 | 2011 | ||||||
Exploratory geological and geophysical costs | $ | 22,740 | $ | 19,971 | ||||
Dry hole costs | 767 | 7,949 | ||||||
|
|
|
| |||||
Exploration expenses | $ | 23,507 | $ | 27,920 | ||||
Exploratory
| Year ended December 31, | ||||||||
| In thousands | 2015 | 2014 | ||||||
| Geological and geophysical costs | $ | 11,032 | $ | 26,388 | ||||
| Exploratory dry hole costs | 8,381 | 23,679 | ||||||
| Exploration expenses | $ | 19,413 | $ | 50,067 | ||||
Depreciation, Depletion, Amortization and Accretionaccretion (“DD&A”). Total DD&A increased $301.2$390.4 million, or 77%29%, for the year ended December 31, 2012in 2015 compared to the year ended December 31, 20112014 primarily due to a 58%28% increase in productionsales volumes. The following table shows the components of our DD&A on a unit of sales basis.
| Year Ended December 31, | ||||||||
$/Boe | 2012 | 2011 | ||||||
Crude oil and natural gas production | $ | 19.10 | $ | 16.90 | ||||
Other equipment | 0.25 | 0.29 | ||||||
Asset retirement obligation accretion | 0.09 | 0.14 | ||||||
|
|
|
| |||||
Depreciation, depletion, amortization and accretion | $ | 19.44 | $ | 17.33 | ||||
The
| Year ended December 31, | ||||||||
| $/Boe | 2015 | 2014 | ||||||
| Crude oil and natural gas properties | $ | 21.18 | $ | 21.13 | ||||
| Other equipment | 0.33 | 0.32 | ||||||
| Asset retirement obligation accretion | 0.06 | 0.06 | ||||||
| Depreciation, depletion, amortization and accretion | $ | 21.57 | $ | 21.51 | ||||
Property Impairments.Propertyfuture reserve revisions or the impact such revisions may have on future impairments, increased in the year ended December 31, 2012 by $13.8 million to $122.3 million compared to $108.5 million for the year ended December 31, 2011.
Non-producing properties consist of undeveloped leasehold costs and costs associated with the purchase of certain proved undeveloped reserves. Individually insignificant non-producing properties are amortized on an aggregate basis based on our estimated experience of successful drilling and the average holding period. if any.
Impairment provisions for proved properties were $4.3 millioncharges for the year ended December 31, 2012 comparedprospect in 2014, with no leasehold impairments of a similar magnitude in 2015. This decrease was partially offset by higher rates of amortization being applied in 2015 to $16.1 million forundeveloped leasehold costs across various prospects resulting from a reduction in planned drilling activities prompted by the same periodcontinued decrease in 2011. We evaluate proved crude oilcommodity prices in 2015. Our rates of amortization may increase in future periods if commodity prices remain at current levels or decline further and natural gas properties for impairment by comparing their cost basisadditional changes are made to the estimated future cash flows on a field basis. If the cost basis is in excess of estimated future cash flows, then we impair it based on an estimate of fair value based on discounted cash flows. Impairments of proved properties in 2012 primarily reflect uneconomic operating results in a non-Woodford single-well field in our South region. Impairment provisions for proved properties in 2011 reflect uneconomic operating results for initial wells drilled on our acreage in the Niobrara play in Colorado.
drilling plans.
| Year Ended December 31, | ||||||||
$/Boe | 2012 | 2011 | ||||||
General and administrative expenses | $ | 2.38 | $ | 2.36 | ||||
Non-cash equity compensation | 0.82 | 0.73 | ||||||
Corporate relocation expenses | 0.22 | 0.14 | ||||||
|
|
|
| |||||
Total general and administrative expenses | $ | 3.42 | $ | 3.23 | ||||
| Year ended December 31, | ||||||||
| $/Boe | 2015 | 2014 | ||||||
| General and administrative expenses | $ | 1.70 | $ | 2.06 | ||||
| Non-cash equity compensation | 0.64 | 0.86 | ||||||
| Total general and administrative expenses | $ | 2.34 | $ | 2.92 | ||||
| Year Ended December 31, | Volume increase | Volume percent increase | ||||||||||||||||
| 2014 | 2013 | |||||||||||||||||
| Volume | Percent | Volume | Percent | |||||||||||||||
| Crude oil (MBbl) | 44,530 | 70 | % | 34,989 | 71 | % | 9,541 | 27 | % | |||||||||
| Natural Gas (MMcf) | 114,295 | 30 | % | 87,730 | 29 | % | 26,565 | 30 | % | |||||||||
| Total (MBoe) | 63,579 | 100 | % | 49,610 | 100 | % | 13,969 | 28 | % | |||||||||
| Year Ended December 31, | Volume increase | Percent increase | ||||||||||||||||
| 2014 | 2013 | |||||||||||||||||
| MBoe | Percent | MBoe | Percent | |||||||||||||||
| North Region | 47,206 | 74 | % | 38,023 | 77 | % | 9,183 | 24 | % | |||||||||
| South Region | 16,373 | 26 | % | 11,587 | 23 | % | 4,786 | 41 | % | |||||||||
| Total | 63,579 | 100 | % | 49,610 | 100 | % | 13,969 | 28 | % | |||||||||
| Year ended December 31, | ||||||||
| In thousands | 2014 | 2013 | ||||||
| Cash received (paid) on derivatives: | ||||||||
| Crude oil derivatives (1) | $ | 396,901 | $ | (71,156 | ) | |||
| Natural gas derivatives | (11,551 | ) | 9,601 | |||||
| Cash received (paid) on derivatives, net | 385,350 | (61,555 | ) | |||||
| Non-cash gain (loss) on derivatives: | ||||||||
| Crude oil derivatives | 89,894 | (126,167 | ) | |||||
| Natural gas derivatives | 84,515 | (4,029 | ) | |||||
| Non-cash gain (loss) on derivatives, net | 174,409 | (130,196 | ) | |||||
| Gain (loss) on derivative instruments, net | $ | 559,759 | $ | (191,751 | ) | |||
| (1) | Net cash receipts for crude oil derivatives in 2014 include $433 million of proceeds received from crude oil derivative contracts that were settled in the fourth quarter of 2014 prior to their contractual maturities. |
| Year ended December 31, | ||||||||
| In thousands | 2014 | 2013 | ||||||
| Geological and geophysical costs | $ | 26,388 | $ | 25,597 | ||||
| Exploratory dry hole costs | 23,679 | 9,350 | ||||||
| Exploration expenses | $ | 50,067 | $ | 34,947 | ||||
| Year ended December 31, | ||||||||
| $/Boe | 2014 | 2013 | ||||||
| Crude oil and natural gas properties | $ | 21.13 | $ | 19.17 | ||||
| Other equipment | 0.32 | 0.24 | ||||||
| Asset retirement obligation accretion | 0.06 | 0.06 | ||||||
| Depreciation, depletion, amortization and accretion | $ | 21.51 | $ | 19.47 | ||||
| Year ended December 31, | ||||||||
| $/Boe | 2014 | 2013 | ||||||
| General and administrative expenses | $ | 2.06 | $ | 2.07 | ||||
| Non-cash equity compensation | 0.86 | 0.80 | ||||||
| Corporate relocation expenses | — | 0.04 | ||||||
| Total general and administrative expenses | $ | 2.92 | $ | 2.91 | ||||
Our weighted average outstanding credit facility balance increased to $322.1 million for the year ended December 31, 2012 compared to $70.0 million for the year ended December 31, 2011. The weighted average interest rate on our credit facility borrowings was 2.3% for the year ended December 31, 2012 compared to 2.4% for the same period in 2011. At December 31, 2012, we had $595 million of outstanding borrowings on our credit facility compared to $358.0 million outstanding at December 31, 2011. The increase in credit facility borrowings in 2012 was driven by the aforementioned increase in capital expenditures and property acquisitions during the year.
Year ended December 31, 2011 compared to the year ended December 31, 2010
Production
The following tables reflect our production by product and region for the periods presented.
| Year Ended December 31, | Volume increase | Percent increase | ||||||||||||||||||||||
| 2011 | 2010 | |||||||||||||||||||||||
| Volume | Percent | Volume | Percent | |||||||||||||||||||||
Crude oil (MBbl) | 16,469 | 73 | % | 11,820 | 75 | % | 4,649 | 39 | % | |||||||||||||||
Natural Gas (MMcf) | 36,671 | 27 | % | 23,943 | 25 | % | 12,728 | 53 | % | |||||||||||||||
|
|
|
|
|
|
|
|
|
| |||||||||||||||
Total (MBoe) | 22,581 | 100 | % | 15,811 | 100 | % | 6,770 | 43 | % | |||||||||||||||
| Year Ended December 31, | Volume increase (decrease) | Percent increase (decrease) | ||||||||||||||||||||||
| 2011 | 2010 | |||||||||||||||||||||||
| MBoe | Percent | MBoe | Percent | |||||||||||||||||||||
North Region | 17,462 | 77 | % | 12,431 | 79 | % | 5,031 | 40 | % | |||||||||||||||
South Region | 4,705 | 21 | % | 2,915 | 18 | % | 1,790 | 61 | % | |||||||||||||||
East Region | 414 | 2 | % | 465 | 3 | % | (51 | ) | (11 | %) | ||||||||||||||
|
|
|
|
|
|
|
|
|
| |||||||||||||||
Total | 22,581 | 100 | % | 15,811 | 100 | % | 6,770 | 43 | % | |||||||||||||||
Crude oil production volumes increased 39% during the year ended December 31, 2011 compared to the year ended December 31, 2010. Production increases in the Bakken field and the SCOOP and Northwest Cana plays in the Oklahoma Woodford formation contributed incremental production volumes in 2011 of 4,410 MBbls, a 72% increase over production in these areas for the same period in 2010. Production growth in these areas was primarily due to increased drilling activity and higher well completions resulting from our accelerated drilling program for 2011. Additionally, production in the Cedar Hills field increased 203 MBbls, or 5%, in 2011 due to new wells being completed and enhanced recovery techniques being successfully applied.
Natural gas production volumes increased 12,728 MMcf, or 53%, during the year ended December 31, 2011 compared to the same period in 2010. Natural gas production in the North Dakota Bakken field was up 3,529 MMcf, or 88%, for the year ended December 31, 2011 compared to the same period in 2010 due to new wells being completed and gas from existing wells being connected to natural gas processing plants in North Dakota. Natural gas production in the SCOOP and Northwest Cana plays increased 8,971 MMcf, or 366%, due to additional wells being completed and producing in the year ended December 31, 2011 compared to the same period in 2010. Further, natural gas production increased 502 MMcf in non-Woodford areas of our South region due to the completion of new wells during the period. These increases were partially offset by a 498 MMcf decrease in natural gas production from our Arkoma Woodford properties, which consist primarily of dry gas. In 2011, we scaled back our Arkoma Woodford drilling program due to the pricing environment for natural gas.
Revenues
Our total revenues are comprised of sales of crude oil and natural gas, realized and unrealized changes in the fair value of our derivative instruments and revenues associated with crude oil and natural gas service operations.
Crude Oil and Natural Gas Sales. Crude oil and natural gas sales for the year ended December 31, 2011 were $1,647.4 million, a 74% increase from sales of $948.5 million for the same period in 2010. Our sales volumes increased 6,662 MBoe, or 42%, over the same period in 2010 due to the success of our drilling programs in the North Dakota Bakken field and the SCOOP and Northwest Cana plays. Our realized price per Boe increased $13.35 to $73.05 for the year ended December 31, 2011 from $59.70 for the year ended December 31, 2010. The differential between NYMEX calendar month average crude oil prices and our realized crude oil price per barrel for the year ended December 31, 2011 was $6.39 compared to $9.02 for the year ended December 31, 2010. In
2011, a significant portion of our operated crude oil production in the North region was sold in markets other than Cushing, Oklahoma and was priced, apart from transportation costs, at a premium to West Texas Intermediate benchmark pricing, which resulted in improved differentials.
Derivatives.Changes in commodity futures price strips during 2011 had an overall negative net impact on the fair value of our derivatives, which resulted in net negative revenue adjustments of $30.0 million for the year. We expect our revenues will continue to be significantly impacted, either positively or negatively, by changes in the fair value of our derivative instruments as a result of volatility in crude oil and natural gas prices. The following table presents the impact on total revenues related to realized and unrealized gains and losses on derivative instruments for the periods presented.
| Year ended December 31, | ||||||||
| 2011 | 2010 | |||||||
| In thousands | ||||||||
Realized gain (loss) on derivatives: | ||||||||
Crude oil derivatives | $ | (71,411 | ) | $ | 13,195 | |||
Natural gas derivatives | 37,305 | 22,300 | ||||||
|
|
|
| |||||
Total realized gain (loss) on derivatives | $ | (34,106 | ) | $ | 35,495 | |||
Unrealized gain (loss) on derivatives | ||||||||
Crude oil derivatives | $ | 18,753 | $ | (186,013 | ) | |||
Natural gas derivatives | (14,696 | ) | 19,756 | |||||
|
|
|
| |||||
Total unrealized gain (loss) on derivatives | $ | 4,057 | $ | (166,257 | ) | |||
|
|
|
| |||||
Gain (loss) on derivative instruments, net | $ | (30,049 | ) | $ | (130,762 | ) | ||
|
|
|
| |||||
Crude Oil and Natural Gas Service Operations. Our crude oil and natural gas service operations consist primarily of the treatment and sale of lower quality crude oil, or reclaimed crude oil. The table below shows the volumes and prices for the sale of reclaimed crude oil for the periods presented.
| Year Ended December 31, | Variance | |||||||||||
Reclaimed crude oil sales | 2011 | 2010 | ||||||||||
Average sales price ($/Bbl) | $ | 92.30 | $ | 69.35 | $ | 22.95 | ||||||
Sales volumes (MBbls) | 259 | 227 | 32 | |||||||||
The average sales price for reclaimed crude oil sold from our central treating units was $22.95 per barrel higher for the year ended December 31, 2011 than the comparable 2010 period. This contributed to an increase in reclaimed crude oil revenues of $7.0 million to $23.8 million and contributed to an overall increase in crude oil and natural gas service operations revenue of $11.1 million for the year ended December 31, 2011. Also contributing to the increase in crude oil and natural gas service operations revenue was a $3.3 million increase in saltwater disposal income resulting from increased activity. Associated crude oil and natural gas service operations expenses increased $8.6 million to $26.7 million during the year ended December 31, 2011 from $18.1 million during the year ended December 31, 2010 due mainly to an increase in the costs of purchasing and treating reclaimed crude oil for resale and in providing saltwater disposal services.
Operating Costs and Expenses
Production Expenses and Production Taxes and Other Expenses. Production expenses increased 48% to $138.2 million for the year ended December 31, 2011 from $93.2 million for the year ended December 31, 2010. This increase was primarily the result of higher production volumes from an increase in the number of producing wells. Production expenses per Boe increased to $6.13 for the year ended December 31, 2011 from $5.87 per Boe for the year ended December 31, 2010. Contributing to the per-unit increase were increases in well site and road maintenance costs and saltwater disposal costs in the 2011 second quarter, all resulting from abnormal rainfall
and flooding in North Dakota in April and May 2011. Also contributing to the per-unit increase were higher workover expenditures from increased activity as well as general inflationary pressure on the costs of oilfield services and equipment.
Production taxes and other expenses increased $68.2 million, or 89%, to $144.8 million during the year ended December 31, 2011 compared to the year ended December 31, 2010 as a result of higher crude oil and natural gas revenues resulting from increased commodity prices and sales volumes along with the expiration of various tax incentives. Production taxes and other expenses include charges for marketing, gathering, dehydration and compression fees primarily related to natural gas sales in the Oklahoma Woodford and North Dakota Bakken areas of $13.7 million and $6.1 million for the year ended December 31, 2011 and 2010, respectively. The increase in other charges is primarily due to the significant increase in natural gas sales volumes in 2011. Production taxes, excluding other charges, as a percentage of crude oil and natural gas revenues were 7.9% for the year ended December 31, 2011 compared to 7.5% for the year ended December 31, 2010. The increase was due to the expiration of various tax incentives coupled with higher taxable revenues in North Dakota, our most active area, which has production tax rates of up to 11.5% of crude oil revenues. Our overall production tax rate is expected to further increase as we continue to expand our operations in North Dakota and as production tax incentives we currently receive for horizontal wells reach the end of their incentive periods.
On a unit of sales basis, production expenses and production taxes and other expenses were as follows:
| Year Ended December 31, | ||||||||
$/Boe | 2011 | 2010 | ||||||
Production expenses | $ | 6.13 | $ | 5.87 | ||||
Production taxes and other expenses | 6.42 | 4.82 | ||||||
|
|
|
| |||||
Production expenses, production taxes and other expenses | $ | 12.55 | $ | 10.69 | ||||
Exploration Expenses. Exploration expenses consist primarily of dry hole costs and exploratory geological and geophysical costs that are expensed as incurred. The following table shows the components of exploration expenses for the periods indicated.
| Year Ended December 31, | ||||||||
(in thousands) | 2011 | 2010 | ||||||
Exploratory geological and geophysical costs | $ | 19,971 | $ | 9,739 | ||||
Dry hole costs | 7,949 | 3,024 | ||||||
|
|
|
| |||||
Exploration expenses | $ | 27,920 | $ | 12,763 | ||||
Exploratory geological and geophysical costs increased $10.2 million for the year ended December 31, 2011 due to an increase in acquisitions of seismic data in connection with our increased capital budget for 2011. Dry hole costs increased $4.9 million in 2011 resulting from increased drilling activity. Dry hole costs in 2011 were mainly concentrated in Arkoma Woodford and Michigan.
Depreciation, Depletion, Amortization and Accretion. Total DD&A increased $147.3 million, or 60%, in the year ended December 31, 2011 compared to the year ended December 31, 2010 primarily due to a 43% increase in production volumes. The following table shows the components of our DD&A on a unit of sales basis.
| Year Ended December 31, | ||||||||
$/Boe | 2011 | 2010 | ||||||
Crude oil and natural gas production | $ | 16.90 | $ | 14.92 | ||||
Other equipment | 0.29 | 0.24 | ||||||
Asset retirement obligation accretion | 0.14 | 0.17 | ||||||
|
|
|
| |||||
Depreciation, depletion, amortization and accretion | $ | 17.33 | $ | 15.33 | ||||
The increase in DD&A per Boe was partially the result of a gradual shift in our production from our historic base of the Red River units in the Cedar Hills field to newer production bases in the Bakken and Oklahoma Woodford plays. The producing properties in our newer areas typically carry higher DD&A rates due to the higher cost of developing reserves in those areas compared to our older, more mature properties.
Property Impairments. Property impairments increased in the year ended December 31, 2011 by $43.5 million to $108.5 million compared to $65.0 million for the year ended December 31, 2010.
Impairments of non-producing properties increased $29.1 million for the year ended December 31, 2011 to $92.4 million compared to $63.3 million for the year ended December 31, 2010. The increase resulted from a larger base of amortizable costs in 2011 coupled with changes in management’s estimates of the undeveloped properties no longer expected to be developed before lease expiration. Given the pricing environment for natural gas, we elected to defer drilling on certain dry gas properties, thereby resulting in higher amortization of costs in 2011. In 2011, we had no individually significant non-producing properties that were assessed for impairment on a property-by-property basis.
Impairment provisions for proved crude oil and natural gas properties were $16.1 million for the year ended December 31, 2011 compared to $1.7 million for the same period in 2010. Impairments of proved properties in 2011 primarily reflect uneconomic operating results for initial wells drilled on our acreage in the Niobrara play in Colorado. Impairments in 2010 reflect uneconomic operating results in the East region and a non-Bakken Montana field in the North region.
General and Administrative Expenses. General and administrative (“G&A”) expenses increased $23.7 million to $72.8 million for the year ended December 31, 2011 from $49.1 million for the comparable period in 2010. G&A expenses include non-cash charges for equity compensation of $16.6 million and $11.7 million for the years ended December 31, 2011 and 2010, respectively. The increase in equity compensation in 2011 resulted from larger grants of restricted stock due to employee growth along with an increase in our grant-date stock prices during the year which increased expense recognition. G&A expenses excluding equity compensation increased $18.8 million for the year ended December 31, 2011 compared to the same period in 2010. The increase was primarily related to an increase in personnel costs and office-related expenses associated with our rapid growth. In 2011, we grew from 493 total employees in December 2010 to 609 total employees in December 2011, a 24% increase. In March 2011, we announced plans to relocate our corporate headquarters from Enid, Oklahoma to Oklahoma City, Oklahoma. For the year ended December 31, 2011, we recognized approximately $3.2 million of costs in G&A expenses associated with the relocation.
The following table shows the components of G&A expenses on a unit of sales basis.
| Year Ended December 31, | ||||||||
$/Boe | 2011 | 2010 | ||||||
General and administrative expenses | $ | 2.36 | $ | 2.35 | ||||
Non-cash equity compensation | 0.73 | 0.74 | ||||||
Corporate relocation expenses | 0.14 | — | ||||||
|
|
|
| |||||
Total general and administrative expenses | $ | 3.23 | $ | 3.09 | ||||
Interest Expense. Interest expense increased $23.6 million, or 44%, for the year ended December 31, 2011 compared to the same period in 2010 due to increases in our weighted average outstanding long-term debt balance and our weighted average interest rate. Our weighted average interest rate for the year ended December 31, 2011 was 7.2% with a weighted average outstanding long-term debt balance of $970.0 million compared to a weighted average interest rate of 7.0% with a weighted average outstanding long-term debt balance of $685.8 million for the same period in 2010. We issued $200 million of 7 3/8% Senior Notes in April 2010 and $400 million of 7 1/8% Senior Notes in September 2010, the net proceeds of which were used to repay credit facility borrowings that carried lower interest rates.
Our weighted average outstanding credit facility balance decreased to $70.0 million for the year ended December 31, 2011 compared to $121.7 million for the year ended December 31, 2010. The weighted average interest rate on our credit facility borrowings was 2.4% for the year ended December 31, 2011 compared to 2.7% for the same period in 2010. At December 31, 2011, we had $358.0 million of outstanding borrowings on our credit facility at a weighted average interest rate of 2.0%.
Income Taxes. We recorded income tax expense for the year ended December 31, 2011 of $258.4 million compared to $90.2 million for the year ended December 31, 2010. We provide for income taxes at a combined federal and state tax rate of approximately 38% after taking into account permanent taxable differences. See Notes to Consolidated Financial Statements—Note 8. Income Taxes for more information.
At December 31, 2012,2015, we had $35.7$11.5 million of cash and cash equivalents and $900.2 millionapproximately $1.9 billion of borrowing availability on our revolving credit facility after considering outstanding borrowings and letters of credit.
We are focused on balancing our 2016 capital spending with cash flows in order to
unpredictable nature of commodity prices.
our credit facility during the year to fund a portion of our 2012 capital program. Net cash provided by financing activities of $982.4 million for the year ended December 31, 2011 was primarily the result of receiving $659.7 million of net proceeds from the issuance of an aggregate 10,080,000 shares$1.0 billion of our common stock3.8% Senior Notes due 2024 and $700 million of 4.9% Senior Notes due 2044 in March 2011 coupled withMay 2014, partially offset by net borrowingsrepayments of $328$110 million on our revolving credit facility to fund a portionand the July 2014 redemption of our 20118.25% Senior Notes due 2019 for $317.5 million.
expenditures with cash flows, which we expect will result in significantly reduced capital spending and credit facility borrowings in 2016 compared to 2015.
Based on Additionally, we may choose to sell assets to obtain funding for our planned production growthoperations and derivative contracts we have in place to limit the downside risk of adverse price movements associated with the forecasted sale of future production, wecapital program.
credit facility
Company and participating lenders. The commitments under our credit facility, which matures on July 1, 2015, are from a syndicate of 1417 banks and financial institutions. We believe each member of the current syndicate has the capability to fund its commitment. If one or more lenders cannot fund its commitment, we would not have the full availability of the $1.5 billion commitment.
We had $595.0 million of outstanding borrowings and $900.2 million of borrowing availability (after considering outstanding borrowings and letters of credit) on our credit facility at December 31, 2012. The outstanding borrowings at December 31, 2012 mainly represent borrowings incurred to fund a portion of our December 2012 acquisition of North Dakota Bakken properties for $663.3 million. At November 30, 2012, prior to the acquisition, we had no borrowings outstanding on our credit facility.
As of February 15, 2013,19, 2016, we had $840.0 million of outstanding borrowings and $655.2 millionapproximately $1.9 billion of borrowing availability on our credit facility after considering outstanding borrowings and letters of credit. Borrowings bear interest at market-based interest rates plus a margin that is based on the terms of the borrowing and the credit ratings assigned to our senior, unsecured, long-term indebtedness.
credit facility.
In the future, we may not be able to access adequate funding under our credit facility as a result of (i) a decrease in our borrowing base due to the outcome of a subsequent borrowing base redetermination, or (ii) an unwillingness or inability on the part of our lending counterparties to meet their funding obligations or increase their commitments to the borrowing base amount. We expect the next borrowing base redetermination to occur in the second quarter of 2013. Declines in commodity prices could result in a determination to lower the borrowing base in the future and, in such case, we could be required to repay any indebtedness in excess of the borrowing base.
If we are unable to access funding on acceptable terms when needed, we may not be able to fully implement our business plans, complete new property acquisitions to replace our reserves, take advantage of business opportunities, respond to competitive pressures, or refinance our debt obligations as they come due, any of which could have a material adverse effect on our operations and financial results.
Derivative Activities
As part of our risk management program, we hedge a portion of our anticipated future crude oil and natural gas production to achieve more predictable cash flows and to reduce our exposure to fluctuations in crude oil and natural gas prices. Reducing our exposure to price volatility helps ensure adequate funds are available for our capital program. Our decision on the quantity and price at which we choose to hedge our future production is based in part on our view of current and future market conditions and our desire to have the cash flowsextent if needed to fundsupport our business. At December 31, 2015, our total debt would have needed to independently increase by approximately $2.6 billion, or 36%, above existing levels at that date (with no corresponding increase in cash or reduction in refinanced debt) to reach the developmentmaximum covenant ratio of 0.65 to 1.00. Alternatively, our inventory of undeveloped crude oil and natural gas reserves in conjunction with our growth strategy. Refertotal shareholders' equity would have needed toNote 5. Derivative Instruments inNotes to Consolidated Financial Statements for further discussion of the accounting applicable to our derivative instruments, a summary of open contracts independently decrease by approximately $1.4 billion, or 30%, below existing levels at December 31, 20122015 (excluding the after-tax impact of any non-cash impairment charges) to reach the maximum covenant ratio. These independent point-in-time sensitivities do not take into account other factors that could arise to mitigate the impact of changes in debt and the estimated fair valueequity on our consolidated net debt to total capitalization ratio, such as disposing of those contracts asassets or exploring alternative sources of that date. Additionally, a summary of derivative contractscapitalization.
Future Capital Requirements
Senior Note Maturities
On March 8, 2012, we issued $800 millionSK E&S Co. Ltd ("SK") of 5% Senior Notes due 2022 and received net proceeds of approximately $787.0 million after deducting the initial purchasers’ fees. The net proceeds were usedSouth Korea to repayjointly develop a significant portion of the borrowings then outstanding under our credit facility.
On August 16, 2012, we issued an additional $1.2 billion of 5% Senior Notes due 2022 (the “New Notes”). The New Notes were issued pursuantCompany's Northwest Cana natural gas properties. Pursuant to the indenture applicableagreement SK will fund, or carry, 50% of our drilling and completion costs attributable to the $800an area of mutual interest within our Northwest Cana properties until approximately $270 million has been expended by SK on our behalf. As of December 31, 2015, approximately$200 million of 5% the carry had yet to be realized and is expected to be realized over the next four years.
The following table summarizes the maturity dates, semi-annual interest payment dates, and optional redemption periods related to ournotes
| ||||||||
| ||||||||
| ||||||||
| ||||||||
|
Currently, weobligations totaling $5.8 billion at December 31, 2015. We have no plans or intentionsnear-term senior note maturities, with our earliest scheduled maturity being our $200 million of exercising an early redemption option on the senior notes.2020 Notes due in October 2020. Our senior notes are not subject to any mandatory redemption or sinking fund requirements.
The Indentures contain certain For further information on the face values, maturity dates, semi-annual interest payment dates, optional redemption periods and covenant restrictions onrelated to our abilitysenior notes, see
expenditures
notably from the (i) February 2012 acquisition of properties in the Bakken play of North Dakota for $276 million, of which $51.7 million was allocated to producing properties, (ii) the non-cash acquisition of properties from Wheatland Oil Inc. in August 2012 recorded at $177 million, of which $167.4 million was allocated to producing properties, and (iii) the December 2012 acquisition of properties in the Bakken play of North Dakota for $663.3 million, of which $477.1 million was allocated to producing properties.
acquisitions. Our 20122015 capital expenditures were allocated as follows:
| Amount | ||||
| in millions | ||||
Exploration and development drilling | $ | 2,752 | ||
Land costs | 164 | |||
Capital facilities, workovers and re-completions | 55 | |||
Buildings, vehicles, computers and other equipment | 53 | |||
Seismic | 15 | |||
|
| |||
Capital expenditures, excluding acquisitions | $ | 3,039 | ||
Acquisitions of producing properties | 571 | |||
Acquisitions of non-producing properties | 572 | |||
Non-cash acquisition of Wheatland oil and gas properties | 177 | |||
|
| |||
Total acquisitions | $ | 1,320 | ||
|
| |||
Total capital expenditures | $ | 4,359 | ||
Our 2012 capital program focused primarily on increased development in the North Dakota Bakken field and the SCOOP play in south-central Oklahoma.
follows by quarter:
| In millions | 1Q 2015 | 2Q 2015 | 3Q 2015 | 4Q 2015 | YTD 2015 | ||||||||||
| Exploration and development drilling | $ | 914.2 | $ | 518.3 | $ | 477.8 | $ | 343.6 | $ | 2,253.9 | |||||
| Land costs | 27.1 | 19.9 | 28.3 | 32.8 | 108.1 | ||||||||||
| Capital facilities, workovers and other corporate assets | 40.9 | 45.1 | 33.8 | 17.5 | 137.3 | ||||||||||
| Seismic | 1.6 | 2.2 | 0.1 | 0.1 | 4.0 | ||||||||||
| Capital expenditures, excluding acquisitions | $ | 983.8 | $ | 585.5 | $ | 540.0 | $ | 394.0 | $ | 2,503.3 | |||||
| Acquisitions of producing properties | 0.1 | 0.4 | — | 0.1 | 0.6 | ||||||||||
| Acquisitions of non-producing properties | 36.7 | 6.0 | — | 17.7 | 60.4 | ||||||||||
| Total acquisitions | 36.8 | 6.4 | — | 17.8 | 61.0 | ||||||||||
| Total capital expenditures | $ | 1,020.6 | $ | 591.9 | $ | 540.0 | $ | 411.8 | $ | 2,564.3 | |||||
| Amount | ||||
| in millions | ||||
Exploration and development drilling | $ | 3,155 | ||
Land costs | 220 | |||
Capital facilities, workovers and re-completions | 175 | |||
Buildings, vehicles, computers and other equipment | 30 | |||
Seismic | 20 | |||
|
| |||
Total 2013 capital budget, excluding acquisitions | $ | 3,600 | ||
| In millions | Amount | ||
| Exploration and development drilling | $ | 784 | |
| Land costs | 78 | ||
| Capital facilities, workovers and other corporate assets | 55 | ||
| Seismic | 3 | ||
| Total 2016 capital budget, excluding acquisitions | $ | 920 | |
Although we cannot provide any assurance, assuming continued strength in crude oil prices and successful implementationspend 35% of our business strategy, including2016 capital expenditures in North Dakota Bakken and 28% in SCOOP. Other key investment areas will be the futureSTACK play, with 15% of capital expenditures, and our joint development area in Northwest Cana, with 7% of capital expenditures. The remaining 15% of our proved reserves2016 budget will target other capital expenditures such as routine leasing and realization of our cash flows as anticipated, we believe funds from operating cash flows, our remaining cash balance,renewals, work-overs, and our credit facility, including our ability to increase our borrowing capacity thereunder, will be sufficient to fund our planned 2013 capital budget; however, we may choose to accessfacilities.
We monitor our capital spending closely based on actual and projected cash flows and may continue to scale back our spending should commodity prices decrease further. Conversely, an increase in commodity prices could result in increased capital expenditures. We expect to continue participating as a buyer of properties when and if we have the ability to increase our position in strategic plays at competitive terms.
| Payments due by period | ||||||||||||||||||||
(in thousands) | Total | Less than 1 year (2013) | Years 2 and 3 (2014-2015) | Years 4 and 5 (2016-2017) | More than 5 years | |||||||||||||||
Arising from arrangements on the balance sheet: | ||||||||||||||||||||
Credit facility borrowings | $ | 595,000 | $ | — | $ | 595,000 | $ | — | $ | — | ||||||||||
Senior Notes (1) | 2,900,000 | — | — | — | 2,900,000 | |||||||||||||||
Note payable (2) | 20,421 | 1,950 | 4,091 | 4,358 | 10,022 | |||||||||||||||
Interest expense (3) | 1,516,769 | 178,856 | 352,390 | 337,245 | 648,278 | |||||||||||||||
Asset retirement obligations (4) | 47,171 | 2,227 | 6,418 | 1,539 | 36,987 | |||||||||||||||
Arising from arrangements not on balance sheet: | ||||||||||||||||||||
Operating leases (5) | 4,266 | 1,965 | 1,914 | 196 | 191 | |||||||||||||||
Drilling rig commitments (6) | 94,574 | 79,852 | 14,722 | — | — | |||||||||||||||
Fracturing and well stimulation services (7) | 16,688 | 16,688 | — | — | — | |||||||||||||||
Pipeline transportation commitments (8) | 55,069 | 13,323 | 26,645 | 15,101 | — | |||||||||||||||
Rail transportation commitments (9) | 51,800 | 34,587 | 17,213 | — | — | |||||||||||||||
|
|
|
|
|
|
|
|
|
| |||||||||||
Total contractual obligations | $ | 5,301,758 | $ | 329,448 | $ | 1,018,393 | $ | 358,439 | $ | 3,595,478 | ||||||||||
| Payments due by period | ||||||||||||||||||||
| In thousands | Total | Less than 1 year (2016) | Years 2 and 3 (2017-2018) | Years 4 and 5 (2019-2020) | More than 5 years | |||||||||||||||
| Arising from arrangements on the balance sheet: | ||||||||||||||||||||
| Credit facility borrowings | $ | 853,000 | $ | — | $ | — | $ | 853,000 | $ | — | ||||||||||
| Term loan | 500,000 | — | 500,000 | — | — | |||||||||||||||
| Senior Notes (1) | 5,800,000 | — | — | 200,000 | 5,600,000 | |||||||||||||||
| Note payable (2) | 14,379 | 2,144 | 4,500 | 4,795 | 2,940 | |||||||||||||||
| Interest payments (3) | 2,817,452 | 308,236 | 614,747 | 572,360 | 1,322,109 | |||||||||||||||
| Asset retirement obligations (4) | 102,909 | 1,658 | 13,187 | 600 | 87,464 | |||||||||||||||
| Arising from arrangements not on balance sheet: (5) | ||||||||||||||||||||
| Operating leases and other (6) | 26,430 | 9,197 | 10,838 | 3,289 | 3,106 | |||||||||||||||
| Drilling rig commitments (7) | 421,564 | 199,763 | 197,705 | 24,096 | — | |||||||||||||||
| Pipeline transportation commitments (8) | 1,005,094 | 214,734 | 419,284 | 201,290 | 169,786 | |||||||||||||||
| Fuel purchase commitment (9) | 30,845 | 30,845 | — | — | — | |||||||||||||||
| Total contractual obligations | $ | 11,571,673 | $ | 766,577 | $ | 1,760,261 | $ | 1,859,430 | $ | 7,185,405 | ||||||||||
| (1) | Amounts represent scheduled maturities of our senior note obligations at December 31, |
| (2) |
| (3) | Interest |
| (4) | Amounts represent estimated discounted costs for future dismantlement and abandonment of our crude oil and natural gas properties. SeePart II, Item 8. Notes to Consolidated Financial Statements—Note 1. Organization and Summary of Significant Accounting Policiesfor additional |
| (5) |
| (6) | Amounts primarily represent leases for electric infrastructure, office equipment, |
| (7) | Amounts represent commitments under drilling rig contracts with various terms extending |
| (8) | We have entered into firm transportation commitments to guarantee pipeline access capacity |
| (9) | We have entered into a |
In addition to the operational pipeline transportation commitments described above, we are a party to 5-year firm transportation commitments for future pipeline projects being considered for development that are not yet operational. Such projects require the granting of regulatory approvals or otherwise require significant additional construction efforts by our counterparties before being completed. Future commitments under the non-operational arrangements total approximately $1.0 billion at December 31, 2012, representing aggregate transportation charges expected to be incurred over the 5-year terms of the arrangements assuming the proposed pipeline projects are completed and become operational. The timing of the commencement of pipeline operations is not known due to uncertainties involving matters such as regulatory approvals, resolution of legal and environmental disputes, construction progress and the ultimate probability of pipeline completion. Accordingly, the timing of our obligations under these non-operational arrangements cannot be predicted with certainty and may not be incurred on a ratable basis over a calendar year or may not be incurred at all. Although timing is uncertain, our obligations under these arrangements are not expected to begin until at least 2014.
We are not committed under existing contracts to deliver fixed and determinable quantities of crude oil or natural gas in the future.
Crude Oil and Natural Gas Hedging
As part of our risk management program, we hedge a portion of our anticipated future crude oil and natural gas production to achieve more predictable cash flows and to reduce our exposure to fluctuations in crude oil and natural gas prices. Reducing our exposure to price volatility helps ensure adequate funds are available for our capital program. Our decision on the quantity and price at which we choose to hedge our future production is based in part on our view of current and future market conditions and our desire to have the cash flows needed to fund the development of our inventory of undeveloped crude oil and natural gas reserves in conjunction with our growth strategy. While the use of hedging arrangements limits the downside risk of adverse price movements, their use also limits future revenues from upward price movements. The use of hedging transactions also involves the risk that the counterparties will be unable to meet the financial terms of such transactions. Our derivative contracts are with multiple counterparties to minimize our exposure to any individual counterparty. Substantially all of our derivative contracts are with parties that are lenders (or affiliates of lenders) under our credit facility. For a discussion of the potential risks associated with our hedging program, refer toPart I, Item 1A. Risk Factors—Our derivative activities could result in financial losses or reduce our earnings.
Our derivative contracts are settled based upon reported settlement prices on commodity exchanges, with crude oil derivative settlements based on NYMEX West Texas Intermediate pricing or Inter-Continental Exchange pricing for Brent crude oil and natural gas derivative settlements based on NYMEX Henry Hub pricing. Please seeNotes to Consolidated Financial Statements—Note 5. Derivative Instrumentsfor further discussion of the accounting applicable to our derivative instruments, a summary of open contracts as of December 31, 2012 and the estimated fair value of those contracts as of that date.
Between January 1, 2013 and February 15, 2013, we entered into additional derivative contracts summarized in the tables below. None of these contracts have been designated for hedge accounting.
Crude Oil—ICE Brent
Period and Type of Contract | Bbls | Weighted Average Price | ||||||
January 2013 - March 2013 | ||||||||
Swaps - ICE Brent | 270,000 | $ | 107.87 | |||||
April 2013 - December 2013 | ||||||||
Swaps - ICE Brent | 1,100,000 | $ | 109.27 | |||||
January 2014 - December 2014 | ||||||||
Swaps - ICE Brent | 5,292,500 | $ | 105.51 | |||||
Natural Gas—NYMEX Henry Hub
Period and Type of Contract | MMBtus | Weighted Average Price | ||||||
February 2013 - December 2013 | ||||||||
Swaps - Henry Hub | 13,360,000 | $ | 3.66 | |||||
Common Stock Issued in Exchange for Acquired Assets
On March 27, 2012, we entered into a Reorganization and Purchase and Sale Agreement (the “Agreement”) with Wheatland Oil Inc. (“Wheatland”) and the shareholders of Wheatland. Wheatland is owned 75% by the Revocable Inter Vivos Trust of Harold G. Hamm, a trust of which Harold G. Hamm, our Chief Executive Officer, Chairman of the Board and principal shareholder is the trustee and sole beneficiary, and 25% by our Vice Chairman of Strategic Growth Initiatives, Jeffrey B. Hume. The Agreement provided for the acquisition by us, through the issuance of shares of our common stock, of all of Wheatland’s right, title and interest in and to certain crude oil and natural gas properties and related assets, in which we also owned an interest, in the states of Mississippi, Montana, North Dakota and Oklahoma and the assumption of certain liabilities related thereto.
A special meeting of our shareholders was held on August 10, 2012 for the purpose of voting on whether to approve the issuance of shares of our common stock pursuant to the Agreement as required by Oklahoma state law, the requirements of the New York Stock Exchange Listed Company Manual and the terms of the Agreement. The proposal to issue shares of our common stock pursuant to the Agreement received the requisite affirmative shareholder votes at the August 10, 2012 special meeting to satisfy the necessary approval requirements. As a result, the Wheatland transaction was consummated and closed on August 13, 2012, with an effective date of January 1, 2012. At closing, after considering customary purchase price adjustments, we issued an aggregate of approximately 3.9 million shares of our common stock, par value $0.01 per share, to the shareholders of Wheatland in accordance with the terms of the Agreement. The fair value of the consideration transferred at closing was approximately $279 million. All purchase price adjustments arising after the closing date as allowed for under the Agreement, which amounted to $0.5 million being owed to the Company by Wheatland, have been agreed upon by the parties and are reflected in our consolidated financial statements at December 31, 2012.
if different assumptions had been used. accounting. Differences between our fair value calculations and counterparty valuations have historically not been material. Estimated future net cash flows associated with risk-adjusted probable and possible reserves may be taken into consideration when determining fair value when such reserves exist and are economically recoverable. future if commodity prices recover from current levels. in thousands Net income Interest expense Provision for income taxes Depreciation, depletion, amortization and accretion Property impairments Exploration expenses Impact from derivative instruments: Total (gain) loss on derivatives, net Total realized gain (loss) (cash flow) on derivatives, net Non-cash (gain) loss on derivatives, net Non-cash equity compensation EBITDAX in thousands Net cash provided by operating activities Current income tax provision Interest expense Exploration expenses, excluding dry hole costs Gain on sale of assets, net Excess tax benefit from stock-based compensation Other, net Changes in assets and liabilities EBITDAX Our crude oil production and sales for 2016 and beyond are currently unhedged and directly exposed to continued volatility in crude oil market prices, whether favorable or unfavorable. 2015. In thousands Fixed rate debt: Senior Notes: Principal amount (1) Weighted-average interest rate Note payable: Principal amount Interest rate Variable rate debt: Revolving credit facility: Principal amount Weighted-average interest rate 24, 2016 In thousands, except par values and share data Assets Current assets: Cash and cash equivalents Receivables: Crude oil and natural gas sales Affiliated parties Joint interest and other, net Derivative assets Inventories Deferred and prepaid taxes Prepaid expenses and other Total current assets Net property and equipment, based on successful efforts method of accounting Net debt issuance costs and other Noncurrent derivative assets Total assets Liabilities and shareholders’ equity Current liabilities: Accounts payable trade Revenues and royalties payable Payables to affiliated parties Accrued liabilities and other Derivative liabilities Current portion of asset retirement obligations Current portion of long-term debt Total current liabilities Long-term debt, net of current portion Other noncurrent liabilities: Deferred income tax liabilities Asset retirement obligations, net of current portion Noncurrent derivative liabilities Other noncurrent liabilities Total other noncurrent liabilities Commitments and contingencies (Note 10) Shareholders’ equity: Preferred stock, $0.01 par value; 25,000,000 shares authorized; no shares issued and outstanding Common stock, $0.01 par value; 500,000,000 shares authorized; 185,604,681 shares issued and outstanding at December 31, 2012; 180,871,688 shares issued and outstanding at December 31, 2011 Additional paid-in capital Retained earnings Total shareholders’ equity Total liabilities and shareholders’ equity Revenues: Crude oil and natural gas sales Crude oil and natural gas sales to affiliates Gain (loss) on derivative instruments, net Crude oil and natural gas service operations Total revenues Operating costs and expenses: Production expenses Production and other expenses to affiliates Production taxes and other expenses Exploration expenses Crude oil and natural gas service operations Depreciation, depletion, amortization and accretion Property impairments General and administrative expenses Gain on sale of assets, net Total operating costs and expenses Income from operations Other income (expense): Interest expense Other Income before income taxes Provision for income taxes Net income Basic net income per share Diluted net income per share (Loss) Balance, December 31, 2009 Net income Stock-based compensation Excess tax benefit on stock-based compensation Stock options: Exercised Repurchased and canceled Restricted stock: Issued Repurchased and canceled Forfeited Balance, December 31, 2010 Net income Public offering of common stock Stock-based compensation Stock options: Exercised Repurchased and canceled Restricted stock: Issued Repurchased and canceled Forfeited Balance, December 31, 2011 Net income Common stock issued in exchange for assets Stock-based compensation Excess tax benefit on stock-based compensation Stock options: Exercised Repurchased and canceled Restricted stock: Issued Repurchased and canceled Forfeited Balance, December 31, 2012 Cash flows from operating activities: Net income Adjustments to reconcile net income to net cash provided by operating activities: Depreciation, depletion, amortization and accretion Property impairments Change in fair value of derivatives Stock-based compensation Provision for deferred income taxes Excess tax benefit from stock-based compensation Dry hole costs Gain on sale of assets, net Other, net Changes in assets and liabilities: Accounts receivable Inventories Prepaid expenses and other Accounts payable trade Revenues and royalties payable Accrued liabilities and other Other noncurrent assets and liabilities Net cash provided by operating activities Cash flows from investing activities: Exploration and development Purchase of producing crude oil and natural gas properties Purchase of other property and equipment Proceeds from sale of assets Net cash used in investing activities Cash flows from financing activities: Revolving credit facility borrowings Repayment of revolving credit facility Proceeds from issuance of Senior Notes Proceeds from issuance of common stock Proceeds from other debt Repayment of other debt Debt issuance costs Equity issuance costs Repurchase of equity grants Excess tax benefit from stock-based compensation Dividends to shareholders Exercise of stock options Net cash provided by financing activities Net change in cash and cash equivalents Cash and cash equivalents at beginning of period Cash and cash equivalents at end of period In recent years, the Company has significantly expanded its activity in the South region with its discovery of the SCOOP play and its increased activity in the Northwest Cana and STACK plays. The South region comprised approximately 32% of the Company's crude oil and natural gas production, 23% of its crude oil and natural gas revenues, and 42% of its estimated proved reserves at December 31, 2015. Crude oil represents approximately 57% of the Company's estimated proved reserves as of December 31, 2015. Estimated crude oil and natural gas revenues Tubular goods and equipment Crude oil Total development activities. Crude oil inventories are valued at the lower of cost or market primarily using the first-in, first-out inventory method. MBbls Crude oil line fill requirements Temporarily stored crude oil Total following: Consolidated Financial Statements Service property and equipment Machinery and equipment Gathering systems Enterprise resource planning software Buildings and improvements Asset retirement obligations at January 1 Accretion expense Revisions Plus: Additions for new assets Less: Plugging costs and sold assets (1) Total asset retirement obligations at December 31 Less: Current portion of asset retirement obligations at December 31 Non-current portion of asset retirement obligations at December 31 comprehensive income (loss). The realize a benefit. Income (numerator): Net income - basic and diluted Weighted average shares (denominator): Weighted average shares - basic Non-vested restricted stock Stock options Weighted average shares - diluted Net income per share: Basic Diluted Supplemental cash flow information: Cash paid for interest Cash paid for income taxes Cash received for income tax refunds Non-cash investing activities: Increase in accrued capital expenditures Acquisition of assets through issuance of common stock Asset retirement obligations, net Proved crude oil and natural gas properties Unproved crude oil and natural gas properties Service properties, equipment and other Total property and equipment Accumulated depreciation, depletion and amortization Net property and equipment Prepaid advances from joint interest owners Accrued compensation Accrued production taxes, ad valorem taxes and other non-income taxes Accrued income taxes Accrued interest Other Accrued liabilities and other Period and Type of Contract January 2013 - December 2013 Swaps - WTI Collars - WTI January 2014 - December 2014 Swaps - WTI Period and Type of Contract January 2013 - December 2013 Swaps - ICE Brent January 2014 - December 2014 Swaps - ICE Brent Collars - ICE Brent January 2015 - December 2015 Swaps - ICE Brent Period and Type of Contract January 2013 - December 2013 Swaps - Henry Hub may not be realized on a ratable basis over a calendar year. gains and losses Realized gain (loss) on derivatives: Crude oil fixed price swaps Crude oil collars Natural gas fixed price swaps Natural gas basis swaps Total realized gain (loss) on derivatives Unrealized gain (loss) on derivatives: Crude oil fixed price swaps Crude oil collars Natural gas fixed price swaps Natural gas basis swaps Total unrealized gain (loss) on derivatives Gain (loss) on derivative instruments, net In thousands Commodity swaps and collars Level 1: Observable inputs that reflect unadjusted quoted prices for identical assets or liabilities in active markets as of the reporting date. Level 2: Observable market-based inputs or unobservable inputs that are corroborated by market data. These are inputs other than quoted prices in active markets included in Level 1, which are either directly or indirectly observable as of the reporting date. Level 3: Unobservable inputs that are not corroborated by market data and may be used with internally developed methodologies that result in management’s best estimate of fair value. within the levels of the hierarchy. As Level 1 inputs generally provide the most reliable evidence of fair value, the Company uses Level 1 inputs when available. The Company’s policy is to Description Derivative assets (liabilities): Fixed price swaps Collars Total Description Derivative assets (liabilities): Fixed price swaps Collars Total Balance at January 1 Total realized or unrealized gains (losses), net Included in earnings Included in other comprehensive income Purchases Sales Issuances Settlements Transfers into Level 3 Transfers out of Level 3 Balance at December 31 Unrealized gains (losses) included in earnings relating to derivatives still held at December 31 2014. Asset Unobservable Input Assumption Future production Forward commodity prices Operating Productive life of field Discount rate Proved property impairments Unproved property impairments Total comprehensive income (loss). Debt: Revolving credit facility Note payable 8 1/4% Senior Notes due 2019 7 3/8% Senior Notes due 2020 7 1/8% Senior Notes due 2021 5% Senior Notes due 2022 Total debt Revolving credit facility Note payable 8 1/4% Senior Notes due 2019 (1) 7 3/8% Senior Notes due 2020 (2) 7 1/8% Senior Notes due 2021 (3) 5% Senior Notes due 2022 (4) Total debt Less: Current portion of long-term debt Long-term debt, net of current portion following. See December 31, 2015 was 1.9%. 2015. notes The 2019 Notes were redeemed for $317.5 million, representing a make-whole amount calculated in accordance with the terms of the 2019 Notes and related indenture. The Company recognized a pre-tax loss of $24.5 million related to the redemption, which included the make-whole premium and the write-off of deferred financing costs and unaccreted debt discount and is reflected under the caption “Loss on extinguishment of debt" in the consolidated statements of comprehensive income (loss) for the year ended December 31, 2014. 2015. Current income tax provision: Federal State Total current income tax provision Deferred income tax provision: Federal State Total deferred income tax provision Total provision for income taxes Federal income tax provision at statutory rate (35%) State income tax provision (benefit), net of Federal benefit Other, net Provision for income taxes difference are as follows: Current: Deferred tax assets (1) Unrealized losses on derivatives Other Total current deferred tax assets Deferred tax liabilities Unrealized gains on derivatives Total current deferred tax liabilities Net current deferred tax assets Noncurrent: Deferred tax assets Net operating loss carryforwards Unrealized losses on derivatives Alternative minimum tax carryforwards Other Total noncurrent deferred tax assets Deferred tax liabilities Property and equipment Unrealized gains on derivatives Total noncurrent deferred tax liabilities Net noncurrent deferred tax liabilities Net deferred tax liabilities (2) In these years 2013 2014 2015 2016 2017 Thereafter Total obligations Pipeline transportation commitments – The Company has entered into firm transportation commitments to guarantee pipeline access capacity matter, the complexity and number of legal and factual issues presented by the matter and uncertainties with respect to, among other things, the nature of the claims and defenses, the potential size of the class, the scope and types of the properties and agreements involved, the production years involved, and the ultimate potential outcome of the matter. The Company will continue to assert its defenses to the case as certified as well as any future attempt to certify a money damages class. Non-cash equity compensation Outstanding at December 31, 2009 Exercised Outstanding at December 31, 2010 Exercised Outstanding at December 31, 2011 Exercised Outstanding at December 31, 2012 Non-vested restricted shares at December 31, 2009 Granted Vested Forfeited Non-vested restricted shares at December 31, 2010 Granted Vested Forfeited Non-vested restricted shares at December 31, 2011 Granted Vested Forfeited Non-vested restricted shares at December 31, 2012 below. Crude oil and natural gas sales Production expenses Production taxes and other expenses Exploration expenses Depreciation, depletion, amortization and accretion Property impairments Income taxes Results from crude oil and natural gas producing activities 2013. Property Acquisition Costs: Proved Unproved Total property acquisition costs Exploration Costs Development Costs Total Proved crude oil and natural gas properties Unproved crude oil and natural gas properties Total Less accumulated depreciation, depletion and amortization Net capitalized costs Balance at January 1 Additions to capitalized exploratory well costs pending determination of proved reserves Reclassification to proved crude oil and natural gas properties based on the determination of proved reserves Capitalized exploratory well costs charged to expense Balance at December 31 Number of wells No proved reserves have been recorded for the Company's Canadian operations at December 31, 2015. quality of available data and of engineering and geological interpretation and judgment. Proved reserves as of December 31, 2009 Revisions of previous estimates Extensions, discoveries and other additions Production Sales of minerals in place Purchases of minerals in place Proved reserves as of December 31, 2010 Revisions of previous estimates Extensions, discoveries and other additions Production Sales of minerals in place Purchases of minerals in place Proved reserves as of December 31, 2011 Revisions of previous estimates Extensions, discoveries and other additions Production Sales of minerals in place Purchases of minerals in place Proved reserves as of December 31, 2012 2015. primarily due to increases in proved reserves associated with our successful drilling activity in our Bakken and 222 Bcf (totaling 57 MMBoe) in 2015. Proved Developed Reserves Crude oil (MBbl) Natural Gas (MMcf) Total (MBoe) Proved Undeveloped Reserves Crude oil (MBbl) Natural Gas (MMcf) Total (MBoe) Total Proved Reserves Crude oil (MBbl) Natural Gas (MMcf) Total (MBoe) 2013: Future cash inflows Future production costs Future development and abandonment costs Future income taxes Future net cash flows 10% annual discount for estimated timing of cash flows Standardized measure of discounted future net cash flows 2013. Standardized measure of discounted future net cash flows at January 1 Extensions, discoveries and improved recoveries, less related costs Revisions of previous quantity estimates Changes in estimated future development and abandonment costs Purchases (sales) of minerals in place Net change in prices and production costs Accretion of discount Sales of crude oil and natural gas produced, net of production costs Development costs incurred during the period Change in timing of estimated future production and other Change in income taxes Net change Standardized measure of discounted future net cash flows at December 31 years. 2012 Total revenues (1) Gain (loss) on derivative instruments, net (1) Income from operations Net income Net income per share: Basic Diluted 2011 Total revenues (1) Gain (loss) on derivative instruments, net (1) Income (loss) from operations Net income (loss) Net income (loss) per share: Basic Diluted report. Reference is made to the accompanying Index to Consolidated Financial Statements. Signature Title Date Director Director /s/ MARK E. MONROE Director PreparationThe preparation of financial statements in conformity with generally accepted accounting principles generally accepted in the United States requires our management to select appropriate accounting policies and to make estimates judgments and assumptions that affect the reported amounts of assets, liabilities, revenues, and expenses, and the disclosure and estimation of contingent assets and liabilities. However, theSee Part II, Item 8. Notes to Consolidated Financial Statements—Note 1. Organization and Summary of Significant Accounting Policies for descriptions of our major accounting principles used by us generally do not change ourpolicies. Certain of these accounting policies involve judgments and uncertainties to such an extent that there is a reasonable likelihood that materially different amounts could have been reported cash flowsunder different conditions or liquidity. Interpretation of existing rules must be done and judgments must be made on how the specifics of a given rule apply to us.income taxes.contingent liabilities. These areas are discussed below. Management’s judgments and estimates in these areas are based on information available from both internal and external sources, including engineers, geologists and historical experience in similar matters.matters and are believed to be reasonable under the circumstances. We evaluate our estimates and assumptions on a regular basis. Actual results could differ from the estimates as additional information becomes known.The SEC has defined proved reserves as the estimated quantities of crude oil and natural gas which, by analysis of geoscience and engineering data, can be estimated with reasonable certainty to be economically producible from a given date forward, from known reservoirs and under existing economic conditions, operating methods, and government regulations prior to the time at which contracts providing the right to operate expire, unless evidence indicates renewal is reasonably certain. Even though Ryder Scott and our external independent reserve engineers and internal technical staff are knowledgeable and follow authoritative guidelines for estimating reserves, they must make a number of subjective assumptions based on professional judgments in developing the reserve estimates. Estimates of reserves and their values, future production rates, and future costs and expenses are inherently uncertain for various reasons, including many factors beyond the Company's control. Reserve estimates are updated by us at least annuallysemi-annually and take into account recent production levels and other technical information about each of our fields.are often differentmay differ significantly from the quantities of crude oil and natural gas ultimately recovered. For the years ended December 31, 2015, 2014, and 2013, our proved reserves were revised downward from prior years' reports by approximately 297.2 MMBoe, 107.9 MMBoe, and 96.1 MMBoe, respectively. We cannot predict the amounts or timing of future reserve revisions. If suchare significant, theyof reserves may be material and could significantly alter future depreciation, depletion, and amortization expense and may result in material impairments of assets.recordedrecognized in the month the product is delivered to the purchaser and title transfers. We generally receive payment from one to three months after the sale has occurred. EachAt the end of each month, to record revenue we estimate the volumesamount of productionpriceprices at which they were sold to record revenue.sold. Variances between estimated revenues and actual amounts received for all prior months are recorded in the month payment is received and are reflected in our consolidatedfinancial statements of income as crude oil and natural gas sales. These variances have historically not been material.crude oil and natural gas properties, whereby costs incurredproperties. See Part II, Item 8. Notes to acquire mineral interests in crude oilConsolidated Financial Statements—Note 1. Organization and natural gas properties,Summary of Significant Accounting Policies for further discussion of the accounting policies applicable to drill and equip exploratory wells that find proved reserves, to drill and equip development wells, and expenditures for enhanced recovery operations are capitalized. Geological and geophysical costs, seismic costs incurred for exploratory projects, lease rentals and costs associated with unsuccessful exploratory wells or projects are expensed as incurred. Coststhe successful efforts method of seismic studies that are utilized in development drilling within an area of proved reserves are capitalized as development costs. To the extent a seismic project covers areas of both developmental and exploratory drilling, those seismic costs are proportionately allocated between capitalized development costs and exploration expense. Maintenance, repairs and costs of injection are expensed as incurred, except that the costs of replacements or renewals that expand capacity or improve production are capitalized.Depreciation, depletion, and amortization of capitalized drilling and development costs of crude oil and natural gas properties, including related support equipment and facilities, are generally computed using the unit-of-production method on a field basis based on total estimated proved developed crude oil and natural gas reserves. Amortization of producing leaseholds is based on the unit-of-production method using total estimated proved reserves. In arriving at rates under the unit-of-production method, the quantities of recoverable crude oil and natural gas reserves are established based on estimates made by our internal geologists and engineers and external independent reserve engineers. Service properties, equipment and other assets are depreciated using the straight-line method over estimated useful lives of 3 to 40 years. Upon sale or retirement of depreciable or depletable property, the cost and related accumulated depreciation, depletion and amortization are eliminated from the accounts and the resulting gain or loss, if any, is recognized. Unit of production rates are revised whenever there is an indication of a need, but at least in conjunction with semi-annual reserve reports. Revisions are accounted for prospectively as changes in accounting estimates. our future crude oil and natural gas production. In addition, we may utilize basis contracts to hedge the differential between NYMEX posted prices and those of our physical pricing points. We do not use derivative instruments for trading purposes. Under accounting rules, we may elect to designate those derivatives that qualify for hedge accounting as cash flow hedges against the price we will receive for our future crude oil and natural gas production. We have elected not to designate any of our price risk management activities as cash flow hedges. As a result, we mark our derivative instruments to fair value and recognize the realized and unrealized changes in fair value in current earnings. As such, we are likely to experience significant non-cash volatility in our reported earnings during periods of commodity price volatility. Derivative assets and liabilities with the same counterparty and subject to contractual terms which provide for net settlement are reported on a net basis on our consolidated balance sheets.calculation of the fair value ofcalculations for our collar contracts requirescollars and written call options require the use of an option-pricing model. The estimated future prices are compared to the prices fixed by the derivative agreements and the resulting estimated future cash inflows or outflows over the lives of the derivatives are discounted to calculate the fair value of the derivative contracts. These pricing and discounting variables are sensitive to market volatility as well as changes in future price forecasts and interest rates. See Part II, Item 7A. Quantitative and Qualitative Disclosures About Market Risk for a discussion of the sensitivity of derivative fair value calculations to changes in forward commodity prices.risk adjustedrisk-adjusted proved reserves.Any assets held for sale are reviewed for impairment when we approve the plan to sell. Estimates of anticipated sales prices and recoverable reserves are highly judgmental and are subject to material revision in future periods.thesethe numerous factors utilized in determining the fair value of producing properties, we cannot predict when or ifthe timing and amount of future impairment charges, will be recorded.Non-producing crude oil and natural gasif any. primarily of undeveloped leasehold costs and costs associated with the purchase of certain proved undeveloped reserves, are assessed for impairment on a property-by-property basis for individually significant balances, if any, and on an aggregate basis by prospect for individually insignificant balances. If the assessment indicates an impairment, a loss is recognized by providing a valuation allowance atamortizing the level consistent withportion of the level atproperties’ costs which impairment was assessed.management estimates will not be transferred to proved properties over the lives of the leases based on drilling plans, experience of successful drilling, and the average holding period. The impairment assessment isassessments are affected by economic factors such as the results of exploration activities, commodity price outlooks, anticipated drilling programs, remaining lease terms, and potential shifts in business strategy employed by management. For individually insignificant non-producing properties, impairment losses are recognized by amortizing the portion of the properties’ costs which management estimates will not be transferred to proved properties over the lives of the leases based on experience of successful drilling and the average holding period. The estimated timing and rate of successful drilling is highly judgmental and is subject to material revision in future periods as better information becomes available.that we will be able to recover or utilize our deferred tax assets. If recovery is not likely, we must record a valuation allowance against such deferred tax assets for the amount we would not expect to recover, which would result in an increase to our income tax expense. As of December 31, 2012,2015, we believe all deferred tax assets, recorded onnet of valuation allowances, reflected in our consolidated balance sheets will ultimately be utilized. We consider future taxable income in making such assessments. Numerous judgments and assumptions are inherent in the determination of future taxable income, including factors such as future operating conditions (particularly related to prevailing crude oil and natural gas prices). If our estimates and judgments change regarding our ability to utilize our deferred tax assets, our tax provision could increase in the period it is determined that it is more likely than not that a deferred tax asset will not be utilized.that are not reflected in the consolidated balance sheets as shown underPart II, Item 7. Management’s Discussion and Analysis of Financial Condition and Results of Operations—Contractual Obligations.Recent Accounting Pronouncement Not Yet AdoptedIn December 2011, the Financial Accounting Standards Board (“FASB”) issued Accounting Standards Update (“ASU”) No. 2011-11,Balance Sheet (Topic 210)–Disclosures about Offsetting Assets and Liabilities. The new standard requires an entity to disclose information about offsetting arrangements to enable financial statement users to understand the effect of netting arrangements on an entity’s financial position. The disclosures arerequired for recognized financial instruments and derivative instruments that are subject to offsetting under current accounting literature or are subject to master netting arrangements irrespective of whether they are offset. The objective of the new disclosures is to facilitate comparison between entities that prepare financial statements on the basis of U.S. GAAP and entities that prepare financial statements under International Financial Reporting Standards. The disclosure requirements are effective for periods beginning on or after January 1, 2013 and must be applied retrospectively to all periods presented on the balance sheet. We will adopt the requirements of ASU No. 2011-11 with the preparation of our Form 10-Q for the quarter ending March 31, 2013, which will require additional footnote disclosures for our derivative instruments and are not expected to have a material effect on our financial position, results of operations or cash flows.We are monitoring the joint standard-setting efforts of the FASB and International Accounting Standards Board. There are a number of pending accounting standards being targeted for completion in 2013 and beyond, including, but not limited to, standards relating to revenue recognition, accounting for leases, fair value measurements, and accounting for financial instruments. Because these pending standards have not yet been finalized, at this time we are not able to determine the potential future impact these standards will have, if any, on our financial position, results of operations or cash flows.Laws, rules, regulations, policies,See Part I, Item 1. Business—Regulation of the Crude Oil and interpretations affecting the crude oil and natural gas industry have been pervasive and are continuously reviewed by legislators and regulators, including the imposition of new or increased requirements on us and other industry participants. Following isNatural Gas Industry for a discussion of significant laws and regulations that have been enacted or are currently being considered by regulatory bodies that may affect us in the areas in which we operate.Hydraulic fracturing. Some activists have attempted to link hydraulic fracturing to various environmental problems, including adverse effects to drinking water supplies and migration of methane and other hydrocarbons. As a result, several federal agencies are studying the environmental risks with respect to hydraulic fracturing or evaluating whether to restrict its use. From time to time, legislation has been introduced in the U.S. Congress to amend the federal Safe Drinking Water Act to eliminate an existing exemption for hydraulic fracturing activities from the definition of “underground injection,” thereby requiring the crude oil and natural gas industry to obtain permits for hydraulic fracturing and to require disclosure of the additives used in the process. If adopted, such legislation could establish an additional level of regulation and permitting at the federal level. Scrutiny of hydraulic fracturing activities continues in other ways. The White House Council on Environmental Quality is coordinating an administration-wide review of hydraulic fracturing practices, and a number of federal agencies are analyzing environmental issues associated with hydraulic fracturing. The EPA has commenced a multi-year study of the potential environmental impacts of hydraulic fracturing, the draft results of which are anticipated to be available in 2014. Further, on May 11, 2012, the Bureau of Land Management (“BLM”) issued a proposed rule that would require public disclosure of chemicals used in hydraulic fracturing operations, and impose other operational requirements for all hydraulic fracturing operations on federal lands, including Native American trust lands. The Department of the Interior announced on January 18, 2013 that the BLM will issue a revised draft rule by March 31, 2013. In addition to these federal initiatives, several state and local governments, including states in which we operate, have moved to require disclosure of fracturing fluid components or otherwise to regulate their use more closely. In certain areas of the United States, new drilling permits for hydraulic fracturing have been put on hold pending development of additional standards. We voluntarily participate in FracFocus, a national publicly accessible Internet-based registry developed by the Ground Water Protection Council and the Interstate Oil and Gas Compact Commission. This registry, located atwww.fracfocus.org, provides our industry with an avenue to voluntarily disclose additives used in the hydraulic fracturing process. We currently disclose the additives used in the hydraulic fracturing process on all wells we operate.The adoption of any future federal, state or local laws or implementing regulations imposing permitting or reporting obligations on, or otherwise limiting, the hydraulic fracturing process could make it more difficult andmore expensive to complete crude oil and natural gas wells in low-permeability formations, increase our costs of compliance and doing business, and delay, prevent or prohibit the development of natural resources from unconventional formations. Compliance, or the consequences of any failure to comply by us, could have a material adverse effect on our financial condition and results of operations. At this time it is not possible to estimate the potential impact on our business if any such federal or state legislation is enacted into law.Climate change. Federal, state and local laws and regulations are increasingly being enacted to address concerns about the effects the emission of carbon dioxide and other identified “greenhouse gases” may have on the environment and climate worldwide. These effects are widely referred to as “climate change.” Since its December 2009 endangerment finding regarding the emission of carbon dioxide, methane and other greenhouse gases, the EPA has begun regulating sources of greenhouse gas emissions under the federal Clean Air Act. Among several regulations requiring reporting or permitting for greenhouse gas sources, the EPA finalized its “tailoring rule” in May 2010 that identifies which stationary sources of greenhouse gases are required to obtain permits to construct, modify or operate on account of, and to implement the best available control technology for, their greenhouse gases. In November 2010, the EPA also finalized its greenhouse gas reporting requirements for certain oil and gas production facilities that emit 25,000 metric tons or more of carbon dioxide equivalent per year. The rule requires annual reporting to the EPA of greenhouse gas emissions by such regulated facilities.Moreover, in recent years the U.S. Congress has considered establishing a cap-and-trade program to reduce U.S. emissions of greenhouse gases, including carbon dioxide and methane. Under past proposals, the EPA would issue or sell a capped and steadily declining number of tradable emissions allowances to certain major sources of greenhouse gas emissions so that such sources could continue to emit greenhouse gases into the atmosphere. These allowances would be expected to escalate significantly in cost over time. The net effect of such legislation, if adopted, would be to impose increasing costs on the combustion of carbon-based fuels such as crude oil, refined petroleum products, and natural gas. In addition, while the prospect for such cap-and-trade legislation by the U.S. Congress remains uncertain, several states, including states in which we operate, have adopted, or are in the process of adopting, similar cap-and-trade programs.As a crude oil and natural gas company, the debate on climate change is relevant to our operations because the equipment we use to explore for, develop and produce crude oil and natural gas emits greenhouse gases. Additionally, the combustion of carbon-based fuels, such as the crude oil and natural gas we sell, emits carbon dioxide and other greenhouse gases. Thus, any current or future federal, state or local climate change initiatives could adversely affect demand for the crude oil and natural gas we produce by stimulating demand for alternative forms of energy that do not rely on the combustion of fossil fuels, and therefore could have a material adverse effect on our business. Although our compliance with any greenhouse gas regulations may result in increased compliance and operating costs, we do not expect the compliance costs for currently applicable regulations to be material. Moreover, while it is not possible at this time to estimate the compliance costs or operational impacts for any new legislative or regulatory developments in this area, we do not anticipate being impacted to any greater degree than other similarly situated competitors.For a discussion of our environmental protection initiatives, particularly with respect to our efforts to reduce flaring of natural gas, seePart I, Item 1. Regulation of the Crude Oil and Natural Gas Industry—Environmental, Health and Safety Regulation.Dodd-Frank Wall Street Reform and Consumer Protection Act. In July 2010, the Dodd-Frank Act was enacted into law. This financial reform legislation includes provisions that require derivative transactions that are currently executed over-the-counter to be executed through an exchange and be centrally cleared. The Dodd-Frank Act requires the CFTC, the SEC, and other regulators to establish rules and regulations to implement the new legislation. The CFTC has issued final regulations to implement significant aspects of the legislation, including new rules for the registration of swap dealers and major swap participants (and related definitions of those terms), definitions of the term “swap,” rules to establish the ability to rely on the commercial end-user exception from the central clearing and exchange trading requirements, requirements for reporting and recordkeeping, rules on customer protection in the context of cleared swaps, and position limits for swaps andother transactions based on the price of certain reference contracts, some of which are referenced in our swap contracts. The position limits regulation has been vacated by a Federal court, and the CFTC is appealing that decision; accordingly, the effective date of these rules, if they are reinstated on appeal, or of replacement rules proposed and adopted by the CFTC, if applicable, is not currently known. Key regulations that have not yet been finalized include those establishing margin requirements for uncleared swaps, regulatory capital requirements for swap dealers and various trade execution requirements.On December 13, 2012, the CFTC published final rules regarding mandatory clearing of certain interest rate swaps and certain index credit default swaps and setting compliance dates for different categories of market participants, the earliest of which is March 11, 2013. The CFTC has not yet proposed any rules requiring the clearing of any other classes of swaps, including physical commodity swaps. Although we expect to qualify for the end-user exception from the clearing requirement for our swaps, mandatory clearing requirements and revised capital requirements applicable to other market participants, such as swap dealers, may change the cost and availability of the swaps we use for hedging.The CFTC’s swap regulations may require or cause our counterparties to collect margin from us, and if any of our swaps do not qualify for the commercial end-user exception, or if the cost of entering into uncleared swaps becomes prohibitive, we may be required to clear such transactions or execute them on a derivatives contract market or swap execution facility. The ultimate effect of the proposed new rules and any additional regulations on our business is uncertain. Of particular concern is whether our status as a commercial end-user will allow our derivative counterparties to not require us to post margin in connection with our commodity price risk management activities. The remaining final rules and regulations on major provisions of the legislation, such as new margin requirements, are to be established through regulatory rulemaking. Although we cannot predict the ultimate outcome of these rulemakings, new rules and regulations in this area, to the extent applicable to us or our derivative counterparties, may result in increased costs and cash collateral requirements for the types of derivative instruments we use to manage our financial and commercial risks related to fluctuations in commodity prices. Additional effects of the new regulations, including increased regulatory reporting and recordkeeping costs, increased regulatory capital requirements for our counterparties, and market dislocations or disruptions, among other consequences, could have an adverse effect on our ability to hedge risks associated with our business.Additionally, in August 2012 the SEC adopted the Dodd-Frank Act requirement that registrants disclose certain payments made to the U.S. Federal government and foreign governments in connection with the commercial development of crude oil, natural gas or minerals. The deadline for implementing the new disclosures is May 31, 2014 for applicable payments made during the period from October 1, 2013 to December 31, 2013. We are working to develop a responsive approach for complying with the new disclosure requirements by the required deadline. We are also monitoring our operations to determine if any disclosure or reporting obligations arise under the conflict mineral rules established under the Dodd-Frank Act. have experienced inflationary pressure on technical staff compensation and the cost of oilfield services and equipment due to the increases in drilling activity particularly in the North region, and competitive pressures resulting from higherattractive crude oil pricesprices. However, in 2015 certain service and equipment costs decreased below 2014 levels as service providers reduced their costs in response to the significant decrease in commodity prices. If the existing commodity price environment persists or worsens in 2016 our industry may againexperience an additional decrease in certain service and equipment costs. However, inflationary pressures may return in the future. Annual Report on Form 10-K, which is a non-GAAP financial measure. We define EBITDAX representsas earnings before interest expense, income taxes, depreciation, depletion, amortization and accretion, property impairments, exploration expenses, non-cash gains and losses resulting from the requirements of accounting for derivatives, and non-cash equity compensation expense.expense, and losses on extinguishment of debt. EBITDAX is not a measure of net income or operating cash flows as determined by U.S. GAAP.We believe EBITDAX is a widely followed measure of operating performance and may also be used by investors to measure our ability to meet future debt service requirements, if any. Our credit facility requires that we maintain a total funded debt to EBITDAX ratio of no greater than 4.0 to 1.0 on a rolling four-quarter basis. This ratio represents the sum of outstanding borrowings and letters of credit under our credit facility plus our note payable and Senior Note obligations, divided by total EBITDAX for the most recent four quarters. We were in compliance with this covenant at December 31, 2012. At that date, our total funded debt to EBITDAX ratio was 1.8 to 1.0. A violation of this covenant in the future could result in a default under our credit facility and such event could result in an acceleration of other outstanding indebtedness. In the event of such default, the lenders under our credit facility could elect to terminate their commitments thereunder, cease making further loans, and could declare all outstanding amounts, if any, to be due and payable. If we had any outstanding borrowings under our credit facility and such indebtedness were to be accelerated, our assets may not be sufficient to repay in full such indebtedness. Our credit facility defines EBITDAX consistently with the definition of EBITDAX utilized and presented by us. Year Ended December 31, 2012 2011 2010 2009 2008 $ 739,385 $ 429,072 $ 168,255 $ 71,338 $ 320,950 140,708 76,722 53,147 23,232 12,188 415,811 258,373 90,212 38,670 197,580 692,118 390,899 243,601 207,602 148,902 122,274 108,458 64,951 83,694 28,847 23,507 27,920 12,763 12,615 40,160 (154,016 ) 30,049 130,762 1,520 7,966 (45,721 ) (34,106 ) 35,495 569 (7,966 ) (199,737 ) (4,057 ) 166,257 2,089 — 29,057 16,572 11,691 11,408 9,081 $ 1,963,123 $ 1,303,959 $ 810,877 $ 450,648 $ 757,708 Year Ended December 31, In thousands 2015 2014 2013 2012 2011 Net income (loss) $ (353,668 ) $ 977,341 $ 764,219 $ 739,385 $ 429,072 Interest expense 313,079 283,928 235,275 140,708 76,722 Provision (benefit) for income taxes (181,417 ) 584,697 448,830 415,811 258,373 Depreciation, depletion, amortization and accretion 1,749,056 1,358,669 965,645 692,118 390,899 Property impairments 402,131 616,888 220,508 122,274 108,458 Exploration expenses 19,413 50,067 34,947 23,507 27,920 Impact from derivative instruments: Total (gain) loss on derivatives, net (91,085 ) (559,759 ) 191,751 (154,016 ) 30,049 Total cash (paid) received on derivatives, net 69,553 385,350 (61,555 ) (45,721 ) (34,106 ) Non-cash (gain) loss on derivatives, net (21,532 ) (174,409 ) 130,196 (199,737 ) (4,057 ) Non-cash equity compensation 51,834 54,353 39,890 29,057 16,572 Loss on extinguishment of debt — 24,517 — — — EBITDAX $ 1,978,896 $ 3,776,051 $ 2,839,510 $ 1,963,123 $ 1,303,959 Year Ended December 31, 2012 2011 2010 2009 2008 $ 1,632,065 $ 1,067,915 $ 653,167 $ 372,986 $ 719,915 10,517 13,170 12,853 2,551 13,465 140,708 76,722 53,147 23,232 12,188 22,740 19,971 9,739 6,138 20,158 136,047 20,838 29,588 709 894 15,618 — 5,230 2,872 — (7,587 ) (4,606 ) (3,513 ) (3,890 ) 26,252 13,015 109,949 50,666 46,050 (35,164 ) $ 1,963,123 $ 1,303,959 $ 810,877 $ 450,648 $ 757,708 Year Ended December 31, In thousands 2015 2014 2013 2012 2011 Net cash provided by operating activities $ 1,857,101 $ 3,355,715 $ 2,563,295 $ 1,632,065 $ 1,067,915 Current income tax provision 24 20 6,209 10,517 13,170 Interest expense 313,079 283,928 235,275 140,708 76,722 Exploration expenses, excluding dry hole costs 11,032 26,388 25,597 22,740 19,971 Gain on sale of assets, net 23,149 600 88 136,047 20,838 Excess tax benefit from stock-based compensation 13,177 — — 15,618 — Other, net (10,044 ) (17,279 ) (1,829 ) (7,587 ) (4,606 ) Changes in assets and liabilities (228,622 ) 126,679 10,875 13,015 109,949 EBITDAX $ 1,978,896 $ 3,776,051 $ 2,839,510 $ 1,963,123 $ 1,303,959 2012,2015, our PV-10 totaled approximately $13.3$8.0 billion. The Standardized Measure of our discounted future net cash flows was approximately $11.2$6.5 billion at December 31, 2012,2015, representing a $2.1$1.5 billion difference from PV-10 becausedue to the effect of thededucting estimated future income tax effect.taxes in arriving at Standardized Measure. We believe the presentation of PV-10 is relevant and useful to investors because it presents the discounted future net cash flows attributable to proved reserves held by companies without regard to the specific income tax characteristics of such entities and is a useful measure of evaluating the relative monetary significance of our crude oil and natural gas properties. Investors may utilize PV-10 as a basis for comparing the relative size and value of our proved reserves to other companies. PV-10 should not be considered as a substitute for, or more meaningful than, the Standardized Measure as determined in accordance with U.S. GAAP. Neither PV-10 nor Standardized Measure represents an estimate of the fair market value of our crude oil and natural gas properties.Item 7A. Quantitative and Qualitative Disclosures About Market Risk pricing applicable toprices we receive from sales of our crude oil and natural gas production. Realized pricing is primarily driven by the prevailing worldwide price for crude oil and spot market prices applicable to our natural gas production. Pricing for crude oil and natural gas production has been volatile and unpredictable for several years, and we expect this volatility to continue in the future. The prices we receive for production depend on many factors outside of our control, including volatility in the differences between product prices at sales points and the applicable index price.prices. Based on our average daily production for the year ended December 31, 20122015 and excluding any effect of our derivative instruments in place, our annual revenue would increase or decrease by approximately $250$535 million for each $10.00 per barrel change in crude oil prices and $64$164 million for each $1.00 per Mcf change in natural gas prices.periodicallymay economically hedge a portion of our anticipated crude oil and natural gas production as part of our risk management program. In addition, we may utilize basis contracts to hedge the differential between derivative contract index prices and those of our physical pricing points. Reducing our exposure to price volatility helps ensure we have adequatesecure funds availableto be used for our capital program. Our decision on the quantity and price at which we choose to hedge our production is based in part on our view of current and future market conditions. We may choose not to hedge future production if the pricing environment for certain time periods is deemed to be unfavorable. Additionally, we may choose to liquidate existing derivative positions prior to the expiration of their contractual maturities in order to monetize favorable gain positions for the purpose of funding our capital program. While hedging, if utilized, limits the downside risk of adverse price movements, it also limits future revenues from upward price movements.commodity futures price stripsnatural gas prices during the year ended December 31, 20122015 had an overall net positivefavorable impact on the fair value of our derivative contracts.instruments. For the year ended December 31, 2012,2015, we reported an unrealized non-cash mark-to-market gainrecognized cash gains on derivatives of $199.7$69.6 million the financial impact of which was partially offset by realized lossesand non-cash mark-to-market gains on derivatives of $45.7$21.5 million.20122015 was a net asset of $35.4$101 million. This mark-to-market net asset relates to derivative instruments with various terms that are scheduled to be realized over the period from January 2013 through December 2015. Over this period, actual realized derivative settlements may differ significantly, either positively or negatively, from the unrealized mark-to-market valuation at December 31, 2012. An assumed increase in the forward commodity prices used in the year-end valuation of our derivative instrumentsnatural gas derivatives of $10.00 per barrel for crude oil and $1.00 per MMBtu for natural gas would change our derivative valuation to a net liability of approximately $398$101 million at December 31, 2012.2015. Conversely, an assumed decrease in forward commodity prices of $10.00 per barrel for crude oil and $1.00 per MMBtu for natural gas would increase our netnatural gas derivative asset to approximately $461$302 million at December 31, 2012.For a further discussion of our hedging activities, seePart II, Item 7. Management’s Discussion and Analysis of Financial Condition and Results of Operations—Crude Oil and Natural Gas Hedging andSee Part II, Item 8. Notes to Consolidated Financial Statements—Note 5. Derivative Instruments appearingfor further discussion of our hedging activities, including a summary of derivative contracts in this Annual Report.place as of December 31, 2015.refineriescrude oil refining companies, and affiliatesnatural gas gathering and processing companies ($480.3379 millionin receivables at December 31, 2012)2015), our joint interest receivables ($356.8232 millionat December 31, 2012)2015), and counterparty credit risk associated with our derivative instrument receivables ($50.6108 million at December 31, 2012)2015).supportsecure crude oil and natural gas sales receivables owed to us. Historically, our credit losses on crude oil and natural gas sales receivables have been immaterial.whichwho own a partial interest in the wells we operate. These individuals and entities participate in our wells primarily based on their ownership in leases included in units on which we wish to drill. We can do very little to choose who participates in our wells. In order to minimize our exposure to credit risk we generally request prepayment of drilling costs where it is allowed by contract or state law. For such prepayments, a liability is recorded and subsequently reduced as the associated work is performed. This liability was $30.4$50 million as ofat December 31, 2012,2015, which will be used to offset future capital costs when billed. In this manner, we reduce credit risk. We alsomay have the right to place a lien on our co-owners interest in the well to redirect production proceeds in order to secure payment or, if necessary, foreclose on the interest. Historically, our credit losses on joint interest receivables have been immaterial. Substantially all of our derivative contracts are with parties that are lenders (or affiliates of lenders) under our credit facility.facility.facility and three-year term loan. We manage our interest rate exposure by monitoring both the effects of market changes in interest rates and the proportion of our debt portfolio that is variable-rate versus fixed-rate debt. We may utilize interest rate derivatives to alter interest rate exposure in an attempt to reduce interest rate expense related to existing debt issues. Interest rate derivatives may be used solely to modify interest rate exposure and not to modify the overall leverage of the debt portfolio. We currently have no interest rate derivatives.$840 millionan aggregate of $1.33 billion of variable rate borrowings outstanding borrowings underon our revolving credit facility and three-year term loan at February 15, 2013.19, 2016. The impact of a 1% increase in interest rates on this amount of debt would result in increased interest expense of approximately $8.4$13.3 million per year and a $5.2an $8.2 million decrease in net income per year. Our credit facility matures on July 1, 2015 and the weighted-average interest rate on outstanding borrowings at February 15, 2013 was 2.0%.2012: 2013 2014 2015 2016 2017 Thereafter Total $ — $ — $ — $ — $ — $ 2,900,000 $ 2,900,000 5.8 % 5.8 % $ 1,950 $ 2,013 $ 2,078 $ 2,144 $ 2,214 $ 10,022 $ 20,421 3.1 % 3.1 % 3.1 % 3.1 % 3.1 % 3.1 % 3.1 % $ — $ — $ 595,000 $ — $ — $ — $ 595,000 1.7 % 1.7 % In thousands 2016 2017 2018 2019 2020 Thereafter Total Fixed rate debt: Senior Notes: Principal amount (1) $ — $ — $ — $ — $ 200,000 $ 5,600,000 $ 5,800,000 Weighted-average interest rate — — — — 7.4 % 4.8 % 4.9 % Note payable: Principal amount $ 2,144 $ 2,214 $ 2,286 $ 2,360 $ 2,435 $ 2,940 $ 14,379 Interest rate 3.1 % 3.1 % 3.1 % 3.1 % 3.1 % 3.1 % 3.1 % Variable rate debt: Credit facility: Principal amount $ — $ — $ — $ 853,000 $ — $ — $ 853,000 Weighted-average interest rate — — — 1.9 % — — 1.9 % Term loan: Principal amount $ — $ — $ 500,000 $ — $ — $ — $ 500,000 Interest rate — — 1.8 % — — — 1.8 % (1) Amount doesAmounts do not reflect any discount or premium at which the senior notes were issued.facility.facility and three-year term loan. Such borrowings bear interest at market-based interest rates plus a margin that is based on the terms of the borrowing and the credit ratings assigned to our senior, unsecured, long-term indebtedness. In February 2016, our corporate credit rating was downgraded by S&P and Moody's in response to weakened oil and gas industry conditions and resulting revisions made to rating agency commodity price assumptions. These downgrades will cause the interest rates on our revolving credit facility borrowings and three-year term loan to increase by 0.250% and 0.125%, respectively. All of our other long-term indebtedness is fixed rate and does not expose us to the risk of cash flow loss due to changes in market interest rates. However, changes in interest rates do affect the fair values of our senior notes and note payable.Item 8. Financial Statements and Supplementary Data 828384858687Subsidiariessubsidiaries (the Company)"Company") as of December 31, 20122015 and 2011,2014, and the related consolidated statements of comprehensive income (loss), shareholders’ equity and cash flows for each of the three years in the period ended December 31, 2012.2015. These financial statements are the responsibility of the Company’s management. Our responsibility is to express an opinion on these financial statements based on our audits.Subsidiariessubsidiaries as of December 31, 20122015 and 2011,2014, and the results of their operations and their cash flows for each of the three years in the period ended December 31, 20122015 in conformity with accounting principles generally accepted in the United States of America.2012,2015, based on criteria established in the 2013 Internal Control—Integrated Framework issued by the Committee of Sponsoring Organizations of the Treadway Commission (COSO), and our report dated February 27, 201324, 2016 expressed an unqualified opinion.27, 2013 December 31, 2012 2011 $ 35,729 $ 53,544 468,650 366,441 12,410 31,108 356,111 379,991 18,389 6,669 46,743 41,270 365 47,658 8,386 9,692 946,783 936,373 8,105,269 4,681,733 55,726 24,355 32,231 3,625 $ 9,140,009 $ 5,646,086 $ 687,310 $ 642,889 261,856 222,027 6,069 9,939 153,454 117,674 12,999 116,985 2,227 2,287 1,950 — 1,125,865 1,111,801 3,537,771 1,254,301 1,262,576 850,282 44,944 60,338 2,173 57,598 2,981 3,640 1,312,674 971,858 — — 1,856 1,809 1,226,835 1,110,694 1,935,008 1,195,623 3,163,699 2,308,126 $ 9,140,009 $ 5,646,086 December 31, In thousands, except par values and share data 2015 2014 Assets Current assets: Cash and cash equivalents $ 11,463 $ 24,381 Receivables: Crude oil and natural gas sales 378,622 552,476 Affiliated parties 122 13,360 Joint interest and other, net 232,293 567,476 Derivative assets 93,922 52,423 Inventories 94,151 102,179 Prepaid taxes 94 63,266 Prepaid expenses and other 11,672 14,040 Total current assets 822,339 1,389,601 Net property and equipment, based on successful efforts method of accounting 14,063,328 13,635,852 Noncurrent derivative assets 14,560 31,992 Other noncurrent assets 19,581 18,588 Total assets $ 14,919,808 $ 15,076,033 Liabilities and shareholders’ equity Current liabilities: Accounts payable trade $ 553,285 $ 1,263,724 Revenues and royalties payable 187,000 272,755 Payables to affiliated parties 69 7,305 Accrued liabilities and other 176,947 259,157 Derivative liabilities 3,583 1,645 Current portion of long-term debt 2,144 2,078 Total current liabilities 923,028 1,806,664 Long-term debt, net of current portion 7,115,644 5,926,800 Other noncurrent liabilities: Deferred income tax liabilities, net 2,090,228 2,286,796 Asset retirement obligations, net of current portion 101,251 75,462 Noncurrent derivative liabilities 3,706 3,109 Other noncurrent liabilities 17,051 9,358 Total other noncurrent liabilities 2,212,236 2,374,725 Commitments and contingencies (Note 10) Shareholders’ equity: Preferred stock, $0.01 par value; 25,000,000 shares authorized; no shares issued and outstanding — — Common stock, $0.01 par value; 1,000,000,000 shares authorized; 372,959,080 shares issued and outstanding at December 31, 2015; 372,005,502 shares issued and outstanding at December 31, 2014 3,730 3,720 Additional paid-in capital 1,345,624 1,287,941 Accumulated other comprehensive loss (3,354 ) (385 ) Retained earnings 3,322,900 3,676,568 Total shareholders’ equity 4,668,900 4,967,844 Total liabilities and shareholders’ equity $ 14,919,808 $ 15,076,033 Year Ended December 31, 2012 2011 2010 In thousands, except per share data $ 2,315,840 $ 1,553,629 $ 917,503 63,593 93,790 31,021 154,016 (30,049 ) (130,762 ) 39,071 32,419 21,303 2,572,520 1,649,789 839,065 193,466 135,178 86,557 6,675 4,632 6,646 223,737 143,236 76,659 23,507 27,920 12,763 32,248 26,735 18,065 692,118 390,899 243,601 122,274 108,458 64,951 121,735 72,817 49,090 (136,047 ) (20,838 ) (29,588 ) 1,279,713 889,037 528,744 1,292,807 760,752 310,321 (140,708 ) (76,722 ) (53,147 ) 3,097 3,415 1,293 (137,611 ) (73,307 ) (51,854 ) 1,155,196 687,445 258,467 415,811 258,373 90,212 $ 739,385 $ 429,072 $ 168,255 $ 4.08 $ 2.42 $ 1.00 $ 4.07 $ 2.41 $ 0.99 Year Ended December 31, In thousands, except per share data 2015 2014 2013 Revenues: Crude oil and natural gas sales $ 2,551,131 $ 4,107,894 $ 3,473,026 Crude oil and natural gas sales to affiliates 1,400 95,128 100,405 Gain (loss) on derivative instruments, net 91,085 559,759 (191,751 ) Crude oil and natural gas service operations 36,551 38,837 40,127 Total revenues 2,680,167 4,801,618 3,421,807 Operating costs and expenses: Production expenses 347,243 347,349 280,789 Production expenses to affiliates 1,654 5,123 1,408 Production taxes and other expenses 200,637 349,760 298,787 Exploration expenses 19,413 50,067 34,947 Crude oil and natural gas service operations 17,337 21,871 29,665 Depreciation, depletion, amortization and accretion 1,749,056 1,358,669 965,645 Property impairments 402,131 616,888 220,508 General and administrative expenses 189,846 184,655 144,379 Gain on sale of assets, net (23,149 ) (600 ) (88 ) Total operating costs and expenses 2,904,168 2,933,782 1,976,040 Income (loss) from operations (224,001 ) 1,867,836 1,445,767 Other income (expense): Interest expense (313,079 ) (283,928 ) (235,275 ) Loss on extinguishment of debt — (24,517 ) — Other 1,995 2,647 2,557 (311,084 ) (305,798 ) (232,718 ) Income (loss) before income taxes (535,085 ) 1,562,038 1,213,049 Provision (benefit) for income taxes (181,417 ) 584,697 448,830 Net income (loss) $ (353,668 ) $ 977,341 $ 764,219 Basic net income (loss) per share $ (0.96 ) $ 2.65 $ 2.08 Diluted net income (loss) per share $ (0.96 ) $ 2.64 $ 2.07 Comprehensive income (loss): Net income (loss) $ (353,668 ) $ 977,341 $ 764,219 Other comprehensive loss, net of tax Foreign currency translation adjustments (2,969 ) (385 ) — Total other comprehensive loss, net of tax (2,969 ) (385 ) — Comprehensive income (loss) $ (356,637 ) $ 976,956 $ 764,219 Shares
outstanding Common
stock Additional
paid-in
capital Retained
earnings Total
shareholders’
equity In thousands, except share data 169,968,471 $ 1,700 $ 430,283 $ 598,296 $ 1,030,279 — — — 168,255 168,255 — — 11,691 — 11,691 — — 5,230 — 5,230 207,220 2 255 — 257 (59,877 ) (1 ) (2,661 ) — (2,662 ) 449,114 4 — — 4 (100,561 ) (1 ) (4,898 ) — (4,899 ) (55,715 ) — — — — 170,408,652 $ 1,704 $ 439,900 $ 766,551 $ 1,208,155 — — — 429,072 429,072 10,080,000 101 659,131 — 659,232 — — 16,567 — 16,567 18,470 — 13 — 13 (2,495 ) — (150 ) — (150 ) 491,315 5 — — 5 (82,807 ) (1 ) (4,767 ) — (4,768 ) (41,447 ) — — — — 180,871,688 $ 1,809 $ 1,110,694 $ 1,195,623 $ 2,308,126 — — — 739,385 739,385 3,916,157 39 81,489 — 81,528 — — 30,209 — 30,209 — — 15,618 — 15,618 86,500 — 60 — 60 (32,984 ) — (2,951 ) — (2,951 ) 916,028 9 — — 9 (112,521 ) (1 ) (8,284 ) — (8,285 ) (40,187 ) — — — — 185,604,681 $ 1,856 $ 1,226,835 $ 1,935,008 $ 3,163,699 In thousands, except share data Balance at December 31, 2012 371,209,362 $ 3,712 $ 1,224,979 $ — $ 1,935,008 $ 3,163,699 Net income — — — — 764,219 764,219 Stock-based compensation — — 39,886 — — 39,886 Restricted stock: Granted 522,518 5 — — — 5 Repurchased and canceled (277,050 ) (3 ) (14,687 ) — — (14,690 ) Forfeited (137,512 ) (1 ) — — — (1 ) Balance at December 31, 2013 371,317,318 $ 3,713 $ 1,250,178 $ — $ 2,699,227 $ 3,953,118 Net income — — — — 977,341 977,341 Other comprehensive loss, net of tax — — — (385 ) — (385 ) Stock-based compensation — — 54,343 — — 54,343 Restricted stock: Granted 1,424,764 14 — — — 14 Repurchased and canceled (283,434 ) (3 ) (16,580 ) — — (16,583 ) Forfeited (453,146 ) (4 ) — — — (4 ) Balance at December 31, 2014 372,005,502 $ 3,720 $ 1,287,941 $ (385 ) $ 3,676,568 $ 4,967,844 Net income (loss) — — — — (353,668 ) (353,668 ) Other comprehensive loss, net of tax — — — (2,969 ) — (2,969 ) Stock-based compensation — — 51,817 — — 51,817 Excess tax benefit from stock-based compensation — — 13,177 — — 13,177 Restricted stock: Granted 1,462,534 15 — — — 15 Repurchased and canceled (172,786 ) (2 ) (7,311 ) — — (7,313 ) Forfeited (336,170 ) (3 ) — — — (3 ) Balance at December 31, 2015 372,959,080 $ 3,730 $ 1,345,624 $ (3,354 ) $ 3,322,900 $ 4,668,900 Year Ended December 31, 2012 2011 2010 In thousands $ 739,385 $ 429,072 $ 168,255 694,698 391,844 242,748 122,274 108,458 64,951 (199,737 ) (4,057 ) 166,257 29,057 16,572 11,691 405,294 245,203 77,359 (15,618 ) — (5,230 ) 767 7,949 3,024 (136,047 ) (20,838 ) (29,588 ) 5,007 3,661 4,366 (91,791 ) (294,702 ) (299,480 ) (7,165 ) (3,412 ) (11,651 ) 14,381 (3,329 ) (2,398 ) (8,487 ) 83,907 146,473 40,030 88,976 66,262 40,309 20,784 47,842 (292 ) (2,173 ) 2,286 1,632,065 1,067,915 653,167 (3,493,652 ) (1,925,577 ) (1,031,499 ) (570,985 ) (65,315 ) (7,338 ) (53,468 ) (44,750 ) (44,564 ) 214,735 30,928 43,985 (3,903,370 ) (2,004,714 ) (1,039,416 ) 2,119,000 493,000 341,000 (1,882,000 ) (165,000 ) (537,000 ) 1,999,000 — 587,210 — 659,736 — 22,000 — — (1,579 ) — — (7,373 ) (36 ) (9,055 ) — (368 ) (136 ) (11,236 ) (4,918 ) (7,561 ) 15,618 — 5,230 — — (2 ) 60 13 257 2,253,490 982,427 379,943 (17,815 ) 45,628 (6,306 ) 53,544 7,916 14,222 $ 35,729 $ 53,544 $ 7,916 Year Ended December 31, In thousands 2015 2014 2013 Cash flows from operating activities: Net income (loss) $ (353,668 ) $ 977,341 $ 764,219 Adjustments to reconcile net income (loss) to cash provided by operating activities: Depreciation, depletion, amortization and accretion 1,746,454 1,368,311 965,437 Property impairments 402,131 616,888 220,508 Non-cash (gain) loss on derivatives, net (21,532 ) (174,409 ) 130,196 Stock-based compensation 51,834 54,353 39,890 Provision (benefit) for deferred income taxes (181,441 ) 584,677 442,621 Excess tax benefit from stock-based compensation (13,177 ) — — Dry hole costs 8,381 23,679 9,350 Gain on sale of assets, net (23,149 ) (600 ) (88 ) Loss on extinguishment of debt — 24,517 — Other, net 12,646 7,637 2,037 Changes in assets and liabilities: Accounts receivable 524,973 (129,634 ) (166,138 ) Inventories 7,997 (65,919 ) (7,697 ) Other current assets 65,493 (57,489 ) (11,537 ) Accounts payable trade (201,434 ) 85,540 107,250 Revenues and royalties payable (85,754 ) (18,022 ) 28,401 Accrued liabilities and other (84,056 ) 58,880 44,260 Other noncurrent assets and liabilities 1,403 (35 ) (5,414 ) Net cash provided by operating activities 1,857,101 3,355,715 2,563,295 Cash flows from investing activities: Exploration and development (3,042,747 ) (4,604,468 ) (3,660,773 ) Purchase of producing crude oil and natural gas properties (557 ) (48,917 ) (16,604 ) Purchase of other property and equipment (36,951 ) (63,402 ) (62,054 ) Proceeds from sale of assets and other 34,008 129,388 28,420 Net cash used in investing activities (3,046,247 ) (4,587,399 ) (3,711,011 ) Cash flows from financing activities: Credit facility borrowings 2,001,000 1,695,000 970,000 Repayment of credit facility (1,313,000 ) (1,805,000 ) (1,290,000 ) Proceeds from issuance of Senior Notes — 1,681,834 1,479,375 Redemption of Senior Notes — (300,000 ) — Premium on redemption of Senior Notes — (17,497 ) — Proceeds from other debt 500,000 — — Repayment of other debt (2,078 ) (2,013 ) (1,951 ) Debt issuance costs (4,597 ) (8,026 ) (2,265 ) Repurchase of restricted stock for tax withholdings (7,313 ) (16,583 ) (14,690 ) Excess tax benefit from stock-based compensation 13,177 — — Net cash provided by financing activities 1,187,189 1,227,715 1,140,469 Effect of exchange rate changes on cash (10,961 ) (132 ) — Net change in cash and cash equivalents (12,918 ) (4,101 ) (7,247 ) Cash and cash equivalents at beginning of period 24,381 28,482 35,729 Cash and cash equivalents at end of period $ 11,463 $ 24,381 $ 28,482 Company was originally formed in 1967 to explore for, develop and produceCompany's principal business is crude oil and natural gas. Continental’sgas exploration, development and production with properties areprimarily located in the North, South, and East regions of the United States. The North region consists of properties north of Kansas and west of the Mississippi River and includes North Dakota Bakken, Montana Bakken, and the Red River units. The South region includes Kansas and all properties south of Kansas and west of the Mississippi River including various plays in the SouthSCOOP (South Central Oklahoma Oil Province,Province), STACK (Sooner Trend Anadarko Canadian Kingfisher), Northwest Cana and Arkoma Woodford plays inareas of Oklahoma. In December 2012, the Company sold its producing properties in the East region. SeeNote 13. Property Acquisitions and Dispositions for further discussion. The Company’s remaining East region properties areis comprised of undeveloped leasehold acreage east of the Mississippi River.TheRiver with no current drilling or production operations. geographically concentrated in the North region, with that region comprising approximately 76%68% of the Company’s crude oil and natural gas production and approximately 77% of its crude oil and natural gas revenues for the year ended December 31, 2012. Additionally, as2015. The Company's principal producing properties in the North region are located in the Bakken field of North Dakota and Montana. As of December 31, 20122015, approximately 82%58% of the Company’s estimated proved reserves were located in the North region.2012,2015, crude oil accounted for approximately 70%66% of the Company’s crude oil and natural gastotal production and approximately 89%85% of its crude oil and natural gas revenues.Continental Resources, Inc.the Company and its subsidiaries. Allsubsidiaries, all of which are 100% owned, after all significant intercompany balancesaccounts and transactions have been eliminated upon consolidation. In the opinion of management, all adjustments (consisting only of normal recurring adjustments) necessary for a fair presentation in accordance with U.S. GAAP have been included in these consolidated financial statements.Continental Resources, Inc. and SubsidiariesNotes to Consolidated Financial StatementsEach month the Company estimates the volumes sold and the price at which they were sold to record revenue. The following table shows the amounts of estimated crude oil and natural gas sales recorded as of December 31 for each indicated year. December 31, 2012 2011 2010 In thousands $ 530,601 $ 491,585 $ 263,075 Variances between estimated revenues and actual amounts received are recorded in the month payment is received and are included in the consolidated statements of income under the caption “Revenues—Crude Oil and Natural Gas Sales”. These variances have historically not been material. The Company uses the sales method of accounting for natural gas imbalances in those circumstances where it has under-produced or over-produced its ownership percentage in a property. Under this method, a receivable or payable is recognized only to the extent an imbalance cannot be recouped from the reserves in the underlying properties. The Company’s aggregate imbalance positions at December 31, 20122015 and 20112014 were not material.2012,2015, the Company had cash deposits in excess of federally insured amounts of approximately $35.2$10.7 million. The Company has not experienced any losses in such accounts and believes it is not exposed to significant credit risk in this area.uncollectiblenoncollectable and any payments subsequently received on those receivables are credited to the allowance for doubtful accounts. Write-offs of uncollectiblenoncollectable receivables have historically not been material.years ended December 31, 2012, 2011 and 2010, crude oil and natural gas sales to the Company’s largest purchaser accounted for approximately 21%, 41% and 57% of total crude oil and natural gas sales, respectively. Additionally, for the year ended December 31, 20122015, sales to the Company’s second largest purchaser accounted for approximately 11% of its total crude oil and natural gas sales. No other purchasers accounted for more than 10% of the Company’s total crude oil and natural gas sales for those three years.2015. The Company does not require collateral and does not believe the loss of any single purchaser would materially impact its operating results, as crude oil and natural gas are fungible products with well-established markets and numerous purchasers in various regions.Company’s operating regions.Continental Resources, Inc.Company's exploration and SubsidiariesNotes to Consolidated Financial StatementsInventoriesInventories are stated at the lower of cost or market and consist of the following: December 31, 2012 2011 In thousands $ 13,590 $ 15,665 33,153 25,605 $ 46,743 $ 41,270 Crude oil inventories consistTubular goods and equipment are valued at the lower of cost or market, with cost determined primarily using a weighted average cost method applied to specific classes of inventory items.following volumes: December 31, 2012 2011 391 283 211 152 602 435 December 31, In thousands 2015 2014 Tubular goods and equipment $ 15,633 $ 15,659 Crude oil 78,518 86,520 Total $ 94,151 $ 102,179 Total capitalized exploratory drilling costs pending the determination$128.1 million as of December 31, 2012 and 2011, respectively. As of December 31, 2012, exploratory drilling costs of $8.1 million, representing 6 wells, were suspended one year beyond the completion of drilling and are expectedSubsidiariesbe fully evaluated in 2013. Of the suspended costs, $0.3 million was incurred in 2012, $6.6 million was incurred in 2011, $0.1 million was incurred in 2010 and $1.1 million was incurred in 2009.Continental Resources, Inc. and SubsidiariesNotes to Consolidated Financial Statementsfixtures, automobiles, machinery and equipment, office equipment, computer equipment and software,fixtures; and buildings and improvements. Major renewals and replacements are capitalized and stated at cost, while maintenance and repairs are expensed as incurred.FurnitureAutomobiles and fixtures105-10Automobiles510-206-1015-30 Storage tanks 10-30 Office equipment,and computer equipment, software, furniture and softwarefixtures 3-10 25 10-40 crude oil and natural gas reserves. Amortization of producing leaseholds is based on the unit-of-production method using total estimated proved reserves. In arriving at rates under the unit-of-production method, the quantities of recoverable crude oil and natural gas reserves are established based on estimates made by the Company’s internal geologists and engineers and external independent reserve engineers. Upon sale or retirement of properties, the cost and related accumulated depreciation, depletion and amortization are eliminated from the accounts and the resulting gain or loss, if any, is recognized. Unit of production rates are revised whenever there is an indication of a need, but at least in conjunction with semi-annual reserve reports. Revisions are accounted for prospectively as changes in accounting estimates.20102013 through December 31, 2012: 2012 2011 2010 In thousands $ 62,625 $ 56,320 $ 50,167 3,105 3,163 2,665 (2,871 ) 1,947 2,564 6,679 3,559 2,794 (22,367 ) (2,364 ) (1,870 ) $ 47,171 $ 62,625 $ 56,320 2,227 2,287 2,241 $ 44,944 $ 60,338 $ 54,079 In thousands 2015 2014 2013 Asset retirement obligations at January 1 $ 76,708 $ 55,787 $ 47,171 Accretion expense 4,740 3,366 2,767 Revisions (1) 15,068 9,916 2,826 Plus: Additions for new assets 7,404 9,022 6,009 Less: Plugging costs and sold assets (1,011 ) (1,383 ) (2,986 ) Total asset retirement obligations at December 31 $ 102,909 $ 76,708 $ 55,787 Less: Current portion of asset retirement obligations at December 31 (2) 1,658 1,246 1,434 Non-current portion of asset retirement obligations at December 31 $ 101,251 $ 75,462 $ 54,353 (1) As a result of asset dispositions duringRevisions for the yearyears ended December 31, 2012,2015 and 2014 primarily represent an increase in the Company removed $20.0 millionpresent value of its previously recognized asset retirement obligations that were assumedliabilities from an acceleration in the estimated timing of abandonment prompted by decreases in commodity prices in 2015 and 2014 which shortened the buyers. SeeNote 13. Property Acquisitions and Dispositions for further discussion.economic lives of certain producing properties.(2) Balance is included in the caption "Accrued liabilities and other" in the consolidated balance sheets. 20122015 and 2011,2014, net property and equipment on the consolidated balance sheets included $36.6$87.5 million and $43.8$64.7 million, respectively, of net asset retirement costs.quarter, or when events and circumstances indicate a possible decline in the recoverability of the carrying value of such field.quarter. The estimated future cash flows expected in connection with the field are compared to the carrying amount of the field to determine if the carrying amount is recoverable. If the carrying amount of the field exceeds its estimated undiscounted future cash flows, the carrying amount of the field is reduced to its estimated fair value. Due to the unavailability of relevant comparable market data, a discounted cash flow method is used to determine the fair value of proved properties. The discounted cash flow method estimates future cash flows based on management’s estimates of future crude oil and natural gas production, commodity prices based on commodity futures price strips, operating and development costs, and a risk-adjusted discount rate.Individually significantImpairment losses for non-producing properties if any, are assessed for impairment on a property-by-property basis and, if the assessment indicates an impairment, a loss is recognized by providing a valuation allowance consistent with the level at which impairment was assessed. For individually insignificant non-producing properties, impairment losses are recognized by amortizing the portion of the properties’ costs which management estimates will not be transferred to proved properties over the lives of the leases based on drilling plans, experience of successful drilling, and the average holding period. The Company’s impairment assessments are affected by economic factors such as the results of exploration activities, commodity price outlooks, anticipated drilling programs, remaining lease terms, and potential shifts in business strategy employed by management.wereare capitalized and are being amortized over the termterms of the facilityarrangements on a straight-line basis, the use of which approximates the effective interest method. Costs incurred upon the issuanceissuances of the 8 1/4% Senior Notes due 2019, the 7 3/8% Senior Notes due 2020, the 7 1/8% Senior Notes due 2021, and the 5% Senior Notes dueContinental Resources, Inc. and SubsidiariesNotes to Consolidated Financial Statements2022Company's various senior notes (collectively, the “Notes”) were capitalized and are being amortized over the terms of the Notes using the effective interest method.$55.3$71.8 million and $23.9$76.1 million (net of accumulated amortization of $20.2$47.0 million and $14.6$38.1 million) relating to its long-term debt at December 31, 20122015 and 2011,2014, respectively. The increase in 2012 resulted fromSee the capitalizationsubsequent heading titled New accounting pronouncements for a discussion of the presentation of these costs incurred in connection withon the Company’s issuances of 5% Senior Notes due 2022 as discussed inNote 7. Long-Term Debt. Duringconsolidated balance sheets.2012, 20112015, 2014 and 2010,2013, the Company recognized associated amortization expense associated with capitalized debt issuance costs of $5.6$8.9 million, $3.3$9.3 million and $3.5$8.6 million, respectively, which are reflected in “Interest expense” in the consolidated statements of income.is required to recognizerecognizes its derivative instruments on the balance sheet as either assets or liabilities measured at fair value with such amounts classified as current or long-term based on anticipatedcontractual settlement dates. The accounting for the changes in fair value of a derivative depends on the intended use of the derivative and resulting designation. The Company has not designated its derivative instruments as hedges for accounting purposes and, as a result, marks its derivative instruments to fair value and recognizes the realized and unrealized changes in fair value in the consolidated statements of comprehensive income (loss) under the caption “Gain (loss) on derivative instruments, net.”The carrying values of cash, trade receivables and trade payables are considered to be representative of their respective fair values due to the short term maturity of those instruments. The fair value of derivative contracts is based upon various factors, including commodity exchange prices, over-the-counter quotations, and, in the case of collars, volatility, the risk-free interest rate, and the time to expiration. SeeNote 5. Derivative Instruments for quantification of the fair value of the Company’s derivative instruments at December 31, 2012 and 2011.Long-term debt consists of the Company’s Notes, its note payable, and borrowings on its revolving credit facility. The fair values of the Notes are based on quoted market prices. The fair value of the note payable is determined using a discounted cash flow approach based on the interest rate and payment terms of the note payable and an assumed discount rate. The fair value of credit facility borrowings approximates carrying value based on borrowing rates available to the Company for bank loans with similar terms and maturities. SeeNote 6. Fair Value Measurements for a discussion of the methods used to determine fair value for the Company's financial instruments and the quantification of the fair value of the Company’sfor its derivatives and long-term debt obligations at December 31, 20122015 and 2011.2014.Company’s policy isCompany recorded valuation allowances of $13.5 million and $4.4 million for the years ended December 31, 2015 and 2014, respectively, against deferred tax assets associated with operating loss carryforwards generated by its Canadian subsidiary for which the Company does not expect to recognize penalties and interest related to unrecognized tax benefits, if any, in income tax expense.Continental Resources, Inc. and SubsidiariesNotes to Consolidated Financial Statementsand stock options, which are calculated using the treasury stock method as if the awards and options were exercised.method. The following table presents the calculation of basic and diluted weighted average shares outstanding and net income (loss) per share for the years ended December 31, 2012, 20112015, 2014 and 2010: Year ended December 31, 2012 2011 2010 In thousands, except per share data $ 739,385 $ 429,072 $ 168,255 181,340 177,590 168,985 490 544 546 16 96 248 181,846 178,230 169,779 $ 4.08 $ 2.42 $ 1.00 $ 4.07 $ 2.41 $ 0.99 Year ended December 31, In thousands, except per share data 2015 2014 2013 Income (loss) (numerator): Net income (loss) - basic and diluted $ (353,668 ) $ 977,341 $ 764,219 Weighted average shares (denominator): Weighted average shares - basic 369,540 368,829 368,150 Non-vested restricted stock (1) — 1,929 1,548 Weighted average shares - diluted 369,540 370,758 369,698 Net income (loss) per share: Basic $ (0.96 ) $ 2.65 $ 2.08 Diluted $ (0.96 ) $ 2.64 $ 2.07 (1) During the year ended December 31, 2015, the Company had a net loss and therefore the potential dilutive effect of approximately 1,567,000 weighted average restricted shares were not included in the calculation of diluted net loss per share for 2015 because to do so would have been anti-dilutive to the computations. taxes.tax payments and refunds. Also disclosed is information about investing activities that affects recognized assets and liabilities but does not result in cash receipts or payments. Year ended December 31, 2012 2011 2010 In thousands $ 102,043 $ 70,088 $ 36,845 $ 829 $ 16,030 $ 10,879 $ (13,866 ) $ (116 ) $ (1,406 ) $ 49,039 $ 173,591 $ 147,997 $ 176,563 $ — $ — $ 3,808 $ 5,506 $ 5,358 Year ended December 31, In thousands 2015 2014 2013 Supplemental cash flow information: Cash paid for interest $ 301,743 $ 267,384 $ 209,815 Cash paid for income taxes 30 53,457 29,017 Cash received for income tax refunds 61,403 7 174 Non-cash investing activities: Increase (decrease) in accrued capital expenditures (519,949 ) 290,782 89,482 Asset retirement obligation additions and revisions, net 22,472 18,938 8,835 20122015 and 2011: December 31, 2012 2011 In thousands $ 8,980,505 $ 5,376,109 1,073,944 663,493 170,763 124,357 10,225,212 6,163,959 (2,119,943 ) (1,482,226 ) $ 8,105,269 $ 4,681,733 Continental Resources, Inc. and SubsidiariesNotes to Consolidated Financial Statements December 31, In thousands 2015 2014 Proved crude oil and natural gas properties $ 19,520,724 $ 17,045,967 Unproved crude oil and natural gas properties 682,988 966,080 Service properties, equipment and other 307,059 274,584 Total property and equipment 20,510,771 18,286,631 Accumulated depreciation, depletion and amortization (6,447,443 ) (4,650,779 ) Net property and equipment $ 14,063,328 $ 13,635,852 20122015 and 2011: December 31, 2012 2011 In thousands $ 30,434 $ 52,798 27,797 14,449 33,466 30,208 10,455 — 46,973 16,922 4,329 3,297 $ 153,454 $ 117,674 December 31, In thousands 2015 2014 Prepaid advances from joint interest owners $ 49,917 $ 115,687 Accrued compensation 40,060 39,848 Accrued production taxes, ad valorem taxes and other non-income taxes 21,678 36,550 Accrued interest 62,058 60,861 Current portion of asset retirement obligations 1,658 1,246 Other 1,576 4,965 Accrued liabilities and other $ 176,947 $ 259,157 is required to recognizerecognizes all derivative instruments on the balance sheet as either assets or liabilities measured at fair value. The Company has not designated its derivative instruments as hedges for accounting purposes and, as a result, marks its derivative instruments to fair value and recognizes the realized and unrealized changes in fair value in the consolidated statements of comprehensive income (loss) under the caption “Gain (loss) on derivative instruments, net.”has utilizedmay utilize swap and collar derivative contracts to economically hedge against the variability in cash flows associated with the forecasted sale of future crude oil and natural gas production. While the use of these derivative instruments limits the downside risk of adverse price movements, their use also limits future revenues from upward price movements.price, and neitherprice. Neither party is required to make a payment to the other party if the settlement price for any settlement period is between the floor price and the ceiling price.All of the Company’s derivative contracts are carried at their fair value in the consolidated balance sheets under the captions “Derivative assets”, “Noncurrent derivative assets”, “Derivative liabilities”, and “Noncurrent derivative liabilities”. Derivative assets and liabilities with the same counterparty and subject to contractual terms which provide for net settlement are reported on a net basis in the consolidated balance sheets. The Company’sCompany's derivative contracts are settled based upon reported settlement prices on commodity exchanges, with crude oil derivative settlements based on NYMEX West Texas Intermediate (“WTI”) pricing or Inter-Continental Exchange (“ICE”("ICE") pricing for Brent crude oil and natural gas derivative settlements based on NYMEX Henry Hub pricing. The estimated fair value of derivative contracts is based upon various factors, including commodity exchange prices, over-the-counter quotations, and, in the case of collars and written call options, volatility, the risk-free interest rate, and the time to expiration. The calculation of the fair value of collars and written call options requires the use of an option-pricing model. SeeNote 6. Fair Value Measurements.2012,2015, the Company had outstanding derivative contracts with respect to future production as set forth in the tables below. Crude Oil–NYMEX WTI Swaps
Weighted
Average
Price Collars Bbls Floors Ceilings Range Weighted
Average
Price Range Weighted
Average
Price 11,862,500 $ 92.66 8,760,000 $ 80.00-$95.00 $ 86.92 $ 92.30-$110.33 $ 99.46 10,311,250 $ 96.20 Crude Oil–ICE Brent Swaps
Weighted
Average
Price Collars Bbls Floors Ceilings Range Weighted
Average
Price Range Weighted
Average
Price 3,467,500 $ 108.49 6,570,000 $ 100.66 2,190,000 $ 90.00-$95.00 $ 90.83 $ 104.70-$108.85 $ 107.13 1,277,500 $ 98.48 Natural Gas–NYMEX Henry Hub MMBtus Swaps
Weighted
Average
Price 18,250,000 $ 3.76 Continental Resources, Inc. The hedged volumes reflected below represent an aggregation of multiple derivative contracts that have varying durations and SubsidiariesNotes to Consolidated Financial StatementsCrude Oil - ICE Brent Period and Type of Contract Bbls Ceiling Price January 2016 - December 2016 Written call options - ICE Brent (1) 1,464,000 $ 107.70 (1) Written call options represent the ceiling positions remaining from the Company's previous crude oil collar contracts. The floor positions of the collars were liquidated in the fourth quarter of 2014. For these written call options, the Company is required to make a payment to the counterparty if the settlement price for any settlement period is above the ceiling price. Natural Gas - Henry Hub Swaps Weighted Average Price Floors Ceilings Weighted Average Price Weighted Average Price Period and Type of Contract MMBtus Range Range January 2016 - December 2016 Swaps - Henry Hub 133,710,000 $ 3.17 January 2017 - December 2017 Swaps - Henry Hub 25,550,000 $ 3.35 Collars - Henry Hub 65,700,000 $2.40 - $3.00 $ 2.47 $2.92 - $3.88 $ 3.08 Fair Value Gain (Loss)realizedcash settlements on matured or liquidated derivative instruments and unrealizednon-cash gains and losses on open derivative instruments for the periods presented. Year ended December 31, 2012 2011 2010 In thousands $ (40,238 ) $ (14,900 ) $ 11,386 (15,341 ) (56,511 ) 1,809 9,858 37,305 25,246 — — (2,946 ) $ (45,721 ) $ (34,106 ) $ 35,495 $ 142,567 $ (23,486 ) $ (85,870 ) 59,911 42,239 (100,143 ) (2,741 ) (14,696 ) 17,161 — — 2,595 $ 199,737 $ 4,057 $ (166,257 ) $ 154,016 $ (30,049 ) $ (130,762 ) The table Cash receipts and payments below provides balance sheet data aboutreflect proceeds received upon early liquidation of derivative positions and gains or losses on derivative contracts which matured during the period, calculated as the difference between the contract price and the market settlement price of matured contracts. Non-cash gains and losses below represent the change in fair value of derivativesderivative instruments which continue to be held at period end and the reversal of previously recognized non-cash gains or losses on derivative contracts that matured or were liquidated during the period. Year ended December 31, In thousands 2015 2014 2013 Cash received (paid) on derivatives: Crude oil fixed price swaps (1) $ — $ 331,591 $ (54,289 ) Crude oil collars (1) — 65,310 (16,867 ) Natural gas fixed price swaps 39,670 (11,551 ) 9,601 Natural gas collars 29,883 — — Cash received (paid) on derivatives, net 69,553 385,350 (61,555 ) Non-cash gain (loss) on derivatives: Crude oil fixed price swaps — 84,792 (117,580 ) Crude oil collars — 1,121 (8,587 ) Crude oil written call options 4,715 3,981 — Natural gas fixed price swaps 41,828 62,699 (4,029 ) Natural gas collars (25,011 ) 21,816 — Non-cash gain (loss) on derivatives, net 21,532 174,409 (130,196 ) Gain (loss) on derivative instruments, net $ 91,085 $ 559,759 $ (191,751 ) (1) Net cash receipts for crude oil swaps and collars for the year ended December 31, 2014 include $433 million of proceeds received from crude oil derivative contracts that were settled in the fourth quarter of 2014 prior to their contractual maturities. Of the proceeds, $373 million related to crude oil swap liquidations and $60 million related to crude oil collar liquidations. presented. December 31, 2012 December 31, 2011 Assets (Liabilities) Net Assets (Liabilities) Net Fair
Value Fair
Value Fair
Value Fair
Value Fair
Value Fair
Value $ 50,620 $ (15,172 ) $ 35,448 $ 10,294 $ (174,583 ) $ (164,289 ) December 31, In thousands 2015 2014 Commodity derivative assets: Gross amounts of recognized assets $ 120,385 $ 84,431 Gross amounts offset on balance sheet (11,903 ) (16 ) Net amounts of assets on balance sheet 108,482 84,415 Commodity derivative liabilities: Gross amounts of recognized liabilities (19,192 ) (4,770 ) Gross amounts offset on balance sheet 11,903 16 Net amounts of liabilities on balance sheet $ (7,289 ) $ (4,754 ) December 31, In thousands 2015 2014 Derivative assets $ 93,922 $ 52,423 Noncurrent derivative assets 14,560 31,992 Net amounts of assets on balance sheet 108,482 84,415 Derivative liabilities (3,583 ) (1,645 ) Noncurrent derivative liabilities (3,706 ) (3,109 ) Net amounts of liabilities on balance sheet (7,289 ) (4,754 ) Total derivative assets, net $ 101,193 $ 79,661 Accounting Standards Codification Topic 820,Fair Value Measurements and Disclosures, which establishes a three-level valuation hierarchy for disclosure of fair value measurements. The valuation hierarchy categorizes assets and liabilities measured at fair value into one of three different levels depending on the observability of the inputs employed in the measurement. The three levels are defined as follows:Continental Resources, Inc. and SubsidiariesNotes to Consolidated Financial StatementsCertain assets and liabilitiesbasis, including the Company’s derivative instruments.basis. In determining the fair values of fixed price swaps and basis swaps, a discounted cash flow method is used due to the unavailability of relevant comparable market data for the Company’s exact contracts. The discounted cash flow method estimates future cash flows based on quoted market prices for forward commodity prices observable inputs relating to basis differentials and a risk-adjusted discount rate. The fair values of fixed price swaps and basis swaps are calculated mainly using significant observable inputs (Level 2). Calculation of the fair values of collar contractscollars and written call options requires the use of an industry-standard option pricing model that considers various inputs including quoted forward prices for commodities, time value, volatility factors, and current market and contractual prices for the underlying instruments, as well as other relevant economic measures. These assumptions are observable in the marketplace or can be corroborated by active markets or broker quotes and are therefore designated as Level 2 within the valuation hierarchy. The Company’s calculation of fair value for each of its derivative positions is compared to the counterparty valuation for reasonableness.20122015 and 2011. Fair value measurements at December 31, 2012 using: Level 1 Level 2 Level 3 Total In thousands $ — $ 36,716 $ — $ 36,716 — (1,268 ) — (1,268 ) $ — $ 35,448 $ — $ 35,448 Fair value measurements at December 31, 2011 using: Level 1 Level 2 Level 3 Total In thousands $ — $ (103,110 ) $ — $ (103,110 ) — (61,179 ) — (61,179 ) $ — $ (164,289 ) $ — $ (164,289 ) Continental Resources, Inc. and SubsidiariesNotes to Consolidated Financial StatementsThe Company’s crude oil collar contracts, which were classified as Level 3 instruments in the fair value hierarchy in periods prior to the quarter ended September 30, 2011, were transferred from Level 3 to Level 2 in the third quarter of 2011 due to the Company’s ability to corroborate the volatility factors used to value its collar contracts with observable changes in forward commodity prices. The following table sets forth a reconciliation of changes in the fair value of collar contracts while classified as Level 3 in the fair value hierarchy for the indicated periods. 2011 2010 In thousands $ (103,418 ) $ (3,275 ) (47,515 ) (100,143 ) — — — — — — — — — — — — 150,933 — $ — $ (103,418 ) — (99,110 ) Gains and losses included in earnings that are attributable to the change in unrealized gains and losses relating to derivatives held at December 31 are reported in the consolidated statements of income under the caption “Gain (loss) on derivative instruments, net”. Fair value measurements at December 31, 2015 using: In thousands Level 1 Level 2 Level 3 Total Derivative assets (liabilities): Fixed price swaps $ — $ 104,426 $ — $ 104,426 Collars — (3,195 ) — (3,195 ) Written call options — (38 ) — (38 ) Total $ — $ 101,193 $ — $ 101,193 Fair value measurements at December 31, 2014 using: In thousands Level 1 Level 2 Level 3 Total Derivative assets (liabilities): Fixed price swaps $ — $ 62,599 $ — $ 62,599 Collars — 21,816 — 21,816 Written call options — (4,754 ) $ — (4,754 ) Total $ — $ 79,661 $ — $ 79,661 Continental Resources, Inc. and SubsidiariesNotes to Consolidated Financial StatementsImpairmentsimpairments – Proved crude oil and natural gas properties are reviewed for impairment on a field-by-field basis each quarter, or when events and circumstances indicate a possible decline in the recoverability of the carrying value of such field.quarter. The estimated future cash flows expected in connection with the field are compared to the carrying amount of the field to determine if the carrying amount is recoverable. If the carrying amount of the field exceeds its estimated undiscounted future cash flows, the carrying amount of the field is reduced to its estimated fair value. Due to the unavailability of relevant comparable market data, a discounted cash flow method is used to determine the fair value of proved properties. The discounted cash flow method estimates future cash flows based on management’sthe Company's estimates of future crude oil and natural gas production, commodity prices based on commodity futures price strips, operating and development costs, and a risk-adjusted discount rate. The fair value of proved crude oil and natural gas properties is calculated using significant unobservable inputs (Level 3). The following table sets forth quantitative information about the significant unobservable inputs used by the Company to calculate the fair value of proved crude oil and natural gas properties using a discounted cash flow method. Future production estimates for each property Forward NYMEX swap prices through 20152020 (adjusted for differentials), escalating 3% per year thereafterand development costs Estimated costs for the current year, escalating 3% per year thereafter Ranging from 0 to 5034 years 10% $4.3$138.9 million for the year ended December 31, 2012, all2015 resulting from declines in commodity prices that indicated the carrying amounts for certain fields were not recoverable. The 2015 impairments reflect fair value adjustments primarily concentrated in an emerging area with minimal production and costly reserve additions ($42.5 million), the Medicine Pole Hills units ($32.5 million), the Buffalo Red River units ($26.3 million), non-Bakken areas of which was recognizedNorth Dakota and Montana ($8.2 million), Wyoming properties ($17.9 million), and various legacy areas in the second quarter of the year.South region ($11.4 million). The impaired properties were written down to their estimated fair value totaling approximately $2.2$59.9 million. Further, certain2012,the years ended December 31, 2015, 2014, and 2013, reflecting recurring amortization of undeveloped leasehold costs on properties that managementthe Company expects will not be transferred to proved properties over the lives of the leases based on drilling plans, experience of successful drilling, and the average holding period.income. Year ended December 31, 2012 2011 2010 In thousands $ 4,332 $ 16,107 $ 1,681 117,942 92,351 63,270 $ 122,274 $ 108,458 $ 64,951 Continental Resources, Inc. and SubsidiariesNotes to Consolidated Financial Statements Year ended December 31, In thousands 2015 2014 2013 Proved property impairments $ 138,878 $ 324,302 $ 51,805 Unproved property impairments 263,253 292,586 168,703 Total $ 402,131 $ 616,888 $ 220,508 December 31, 2012 December 31, 2011 Carrying
Amount Fair Value Carrying
Amount Fair Value In thousands $ 595,000 $ 595,000 $ 358,000 $ 358,000 20,421 20,148 — — 298,085 339,000 297,882 331,000 198,552 226,833 198,419 219,000 400,000 454,333 400,000 435,333 2,027,663 2,165,833 — — $ 3,539,721 $ 3,801,147 $ 1,254,301 $ 1,343,333 December 31, 2015 December 31, 2014 In thousands Carrying Amount Fair Value Carrying Amount Fair Value Debt: Credit facility $ 853,000 $ 853,000 $ 165,000 $ 165,000 Term loan 498,274 500,000 — — Note payable 14,309 12,500 16,375 14,900 7.375% Senior Notes due 2020 196,574 179,200 195,997 213,000 7.125% Senior Notes due 2021 395,365 388,300 394,668 421,000 5% Senior Notes due 2022 1,996,831 1,480,400 1,996,507 1,857,900 4.5% Senior Notes due 2023 1,482,451 1,061,000 1,480,479 1,372,800 3.8% Senior Notes due 2024 989,932 700,300 988,940 868,700 4.9% Senior Notes due 2044 691,052 430,500 690,912 572,400 Total debt $ 7,117,788 $ 5,605,200 $ 5,928,878 $ 5,485,700 valuevalues of the revolving credit facility approximates itsborrowings and the term loan approximate carrying value based on borrowing rates available to the Company for bank loans with similar terms and maturities and isare classified as Level 2 in the fair value hierarchy.8 1/4% Senior Notes due 2019 (the “2019 Notes”), the 7 3/8%7.375% Senior Notes due 2020 (the “2020(“2020 Notes”), the 7 1/8%7.125% Senior Notes due 2021 (the “2021(“2021 Notes”) and, the 5% Senior Notes due 2022 (the “2022(“2022 Notes”), the 4.5% Senior Notes due 2023 (“2023 Notes”), the 3.8% Senior Notes due 2024 (“2024 Notes”), and the 4.9% Senior Notes due 2044 (“2044 Notes”) are based on quoted market prices and, accordingly, are classified as Level 1 in the fair value hierarchy.following: December 31, 2012 2011 In thousands $ 595,000 $ 358,000 20,421 — 298,085 297,882 198,552 198,419 400,000 400,000 2,027,663 — 3,539,721 1,254,301 (1,950 ) — $ 3,537,771 $ 1,254,301 Continental Resources, Inc.Note 1. Organization and SubsidiariesSummary of Significant Accounting Policies—New accounting pronouncements Notes to Consolidated Financial Statementsfor a discussion of the impact on long-term debt from the Company's adoption of ASU 2015-03.(1)The carrying amount is net of discounts of $1.9 million and $2.1 million at December 31, 2012 and 2011, respectively.(2)The carrying amount is net of discounts of $1.4 million and $1.6 million at December 31, 2012 and 2011, respectively.(3)These notes were sold at par and are recorded at 100% of face value.(4)The carrying amount represents $800 million of 2022 Notes issued at par in March 2012 and an additional $1.2 billion of 2022 Notes issued at 102.375% of par in August 2012, net of $0.8 million of premium amortization recognized through December 31, 2012. See further discussion below under the headingSenior Notes. December 31, In thousands 2015 2014 Credit facility $ 853,000 $ 165,000 Term loan 498,274 — Note payable 14,309 16,375 7.375% Senior Notes due 2020 196,574 195,997 7.125% Senior Notes due 2021 395,365 394,668 5% Senior Notes due 2022 1,996,831 1,996,507 4.5% Senior Notes due 2023 1,482,451 1,480,479 3.8% Senior Notes due 2024 989,932 988,940 4.9% Senior Notes due 2044 691,052 690,912 Total debt 7,117,788 5,928,878 Less: Current portion of long-term debt 2,144 2,078 Long-term debt, net of current portion $ 7,115,644 $ 5,926,800 $595$853 million of outstanding borrowings at December 31, 2012 on its credit facility, which matures on July 1, 2015. At December 31, 2011, the Company had $358and $165 million of outstanding borrowings on its credit facility. The credit facility had aggregate commitments of $1.5 billion and a borrowing base of $3.25 billion at December 31, 2012, subject to semi-annual redetermination. The most recent borrowing base redetermination was completed in December 2012, whereby2015 and 2014, respectively. Borrowings bear interest at market-based interest rates plus a margin that is based on the lenders approved an increase in the Company’s borrowing base from $2.75 billion to $3.25 billion. The terms of the facility provide thatborrowing and the commitment level can be increased upcredit ratings assigned to the lesser of the borrowing base then in effect or $2.5 billion. Borrowings under the facility bearCompany's senior, unsecured, long-term indebtedness. The weighted-average interest rate on outstanding borrowings at a rate per annum equal to the London Interbank Offered Rate (LIBOR) for one, two, three or six months, as elected by the Company, plus a margin ranging from 150 to 250 basis points, depending on the percentage of the borrowing base utilized, or the lead bank’s reference rate (prime) plus a margin ranging from 50 to 150 basis points. Credit facility borrowings are required to be secured by the Company’s interest in at least 80% (by value) of all of its proved reserves and associated crude oil and natural gas properties unless the Collateral Coverage Ratio, as defined in the amended credit agreement, is greater than or equal to 1.75 to 1.0, in which case the 80% requirement will not apply.$900.2 millionapproximately $1.9 billion of unused commitments (after considering outstanding borrowings and letters of credit) underborrowing availability on its credit facility at December 31, 20122015 and incursincurred commitment fees based on its assigned credit rating at that date of 0.375%0.225% per annum of the daily average amount of unused borrowing availability. availability under its credit facility.agreementfacility contains certain restrictive covenants including a requirement that the Company maintain a current ratio of not less than 1.0 to 1.0 and a ratio of total fundedconsolidated net debt to EBITDAXtotal capitalization ratio of no greater than 4.00.65 to 1.0. As defined by the credit agreement, the current1.00. This ratio represents the ratio of current assets to current liabilities, inclusive of available borrowing capacity under the credit agreementnet debt (total debt less cash and exclusive of current balances associated with derivative contracts and asset retirement obligations. EBITDAX represents earnings before interest expense, income taxes, depreciation, depletion, amortization and accretion, property impairments, exploration expenses, non-cash gains and losses resulting from the requirements of accounting for derivatives, and non-cash equity compensation expense. EBITDAX is not a measure of net income or operating cash flows as determinedequivalents) divided by U.S. GAAP. Reconciliations of net income and operating cash flows to EBITDAX are provided inPart II, Item 7. Management’s Discussion and Analysis of Financial Condition and Results of Operations—Non-GAAP Financial Measures. The total funded debt to EBITDAX ratio represents the sum of outstanding borrowingsnet debt plus total shareholders' equity plus, to the extent resulting inlettersSubsidiariescredit ontotal shareholders' equity, the credit facility plus the Company’s note payable and Senior Note obligations, divided by total EBITDAX for the most recent four quarters.amount of any non-cash impairment charges incurred, net of any tax effect, after June 30, 2014. The Company was in compliance with these covenantsthis covenant at December 31, 2012.NotesOn March 8, 2012, the Company issued $800 million of 5% Senior Notes due 2022 and received net proceeds of approximately $787.0 million after deducting the initial purchasers’ fees. The net proceeds were used to repay a portion of the borrowings then outstanding under the Company’s credit facility.Continental Resources, Inc. and SubsidiariesNotes to Consolidated Financial StatementsOn August 16, 2012, the Company issued an additional $1.2 billion of 5% Senior Notes due 2022 (the “New Notes”). The New Notes were issued pursuant to the indenture applicable to the $800 million of 5% Senior Notes previously issued on March 8, 2012, resulting in a total of $2.0 billion aggregate principal amount of 5% Senior Notes due 2022 being issued under that indenture. The New Notes have substantially identical terms to the $800 million of Senior Notes originally issued in March 2012. The New Notes were sold at 102.375% of par value, resulting in net proceeds of approximately $1.21 billion after deducting the initial purchasers’ fees. The Company used a portion of the net proceeds from the offering to repay all amounts then outstanding under its credit facility and used the remaining net proceeds to fund a portion of its 2012 capital budget and for general corporate purposes.obligations.obligations at December 31, 2015. 2020 Notes 2021 Notes 2022 Notes 2023 Notes 2024 Notes 2044 Notes Face value (in thousands) $200,000 $400,000 $2,000,000 $1,500,000 $1,000,000 $700,000 Maturity date Oct 1, 2020 April 1, 2021 Sep 15, 2022 April 15, 2023 June 1, 2024 June 1, 2044 Interest payment dates April 1, Oct 1 April 1, Oct 1 March 15, Sep 15 April 15, Oct 15 June 1, Dec 1 June 1, Dec 1 Call premium redemption period (1) Oct 1, 2015 April 1, 2016 March 15, 2017 — — — Make-whole redemption period (2) Oct 1, 2015 April 1, 2016 March 15, 2017 Jan 15, 2023 Mar 1, 2024 Dec 1, 2043 2019 Notes2020 Notes2021 Notes2022 NotesMaturity dateOctober 1, 2019October 1, 2020April 1, 2021September 15, 2022Semi-annual interest payment datesApril 1, October 1April 1, October 1April 1, October 1March 15, Sept. 15Decreasing call premium redemption period (1)October 1, 2014October 1, 2015April 1, 2016March 15, 2017Make-whole redemption period (2)October 1, 2014October 1, 2015April 1, 2016March 15, 2017Redemption using equity offering proceeds (3)—October 1, 2013April 1, 2014March 15, 2015(1) On or after these dates, the Company has the option to redeem all or a portion of its Notessenior notes of the applicable series at the decreasing redemption prices specified in the respective senior note indentures (together, the “Indentures”) plus any accrued and unpaid interest to the date of redemption.(2) At any time prior to these dates, the Company has the option to redeem all or a portion of its Notessenior notes of the applicable series at the “make-whole” redemption prices or amounts specified in the Indentures plus any accrued and unpaid interest to the date of redemption.(3)At any time prior to these dates, the Company may redeem up to 35% of the principal amount of its Notes under certain circumstances with the net cash proceeds from one or more equity offerings at the redemption prices specified in the Indentures plus any accrued and unpaid interest to the date of redemption. The optional redemption period for the 2019 Notes using equity offering proceeds expired on October 1, 2012.Notessenior notes are not subject to any mandatory redemption or sinking fund requirements.Indenturesindentures governing the Company's senior notes contain certain restrictions oncovenants that, among others, limit the Company’sCompany's ability to incur additional debt, pay dividends on common stock, makecreate liens securing certain investments, createindebtedness, enter into certain liens on assets, engage in certainsale-leaseback transactions, with affiliates, transfer or sell certain assets,and consolidate, or merge or sell substantially all of the Company’stransfer certain assets. TheseThe senior note covenants are subject to a number of important exceptions and qualifications. The Company was in compliance with these covenants at December 31, 2012.2015. Two of the Company’s subsidiaries, Banner Pipeline Company, L.L.C. and CLR Asset Holdings, LLC, which have no independentmaterial assets or operations, fully and unconditionally guarantee the Notes.senior notes on a joint and several basis. The Company’s other subsidiary, 20 Broadway Associates LLC,subsidiaries, the value of whose assets and operations are minor, doesdo not guarantee the senior notes.term loannote payable secured by the Company’s corporate office building in Oklahoma City, Oklahoma. The loan bears interest at a fixed rate of 3.14% per annum. Principal and interest are payable monthly through the loan’s maturity date of February 26, 2022. Accordingly, approximately $1.9$2.1 million is reflected as a current liability under the caption “Current portion of long-term debt” in the consolidated balance sheets at December 31, 2012.Continental Resources, Inc. and SubsidiariesNotes to Consolidated Financial Statements Year ended December 31, 2012 2011 2010 In thousands $ 9,191 $ 12,931 $ 12,545 1,326 239 308 10,517 13,170 12,853 383,157 212,406 78,769 22,137 32,797 (1,410 ) 405,294 245,203 77,359 $ 415,811 $ 258,373 $ 90,212 Year ended December 31, In thousands 2015 2014 2013 Current income tax provision: United States federal $ — $ — $ 6,193 Various states 24 20 16 Total current income tax provision 24 20 6,209 Deferred income tax provision (benefit): United States federal (140,578 ) 527,315 403,002 Various states (40,863 ) 57,362 39,619 Total deferred income tax provision (benefit) (181,441 ) 584,677 442,621 Total provision (benefit) for income taxes $ (181,417 ) $ 584,697 $ 448,830 following table reconciles the provision (benefit) for income taxes withdiffers from the amount computed by applying the United States statutory federal income tax atrate to income (loss) before income taxes. The sources and tax effects of the Federal statutory rate for the periods presented: Year ended December 31, 2012 2011 2010 In thousands $ 404,319 $ 240,606 $ 90,463 15,213 17,684 (681 ) (3,721 ) 83 430 $ 415,811 $ 258,373 $ 90,212 Year ended December 31, In thousands 2015 2014 2013 Expected income tax expense (benefit) based on US statutory tax rate of 35% $ (187,280 ) $ 546,713 $ 424,567 State income taxes, net of federal benefit (16,219 ) 42,169 25,838 Canadian valuation allowance 13,503 4,389 — Effect of differing statutory tax rate in Canada 5,239 (1,900 ) — Other, net 3,340 (6,674 ) (1,575 ) Provision (benefit) for income taxes $ (181,417 ) $ 584,697 $ 448,830 20122015 and 20112014 are reflected in the table below. As discussed in Note 1. Organization and Summary of Significant Accounting Policies—New accounting pronouncements, in November 2015 the FASB issued ASU 2015-17, Balance Sheet Classification of Deferred Taxes. This new standard requires that all deferred tax assets and deferred tax liabilities, along with any related valuation allowance, be classified as follows: December 31, 2012 2011 In thousands $ — $ 42,030 2,413 1,924 2,413 43,954 2,048 — 2,048 — 365 43,954 40,441 20,927 — 20,564 27,380 37,025 11,576 9,525 79,397 88,041 1,330,551 938,323 11,422 — 1,341,973 938,323 1,262,576 850,282 $ 1,262,211 $ 806,328 Continental Resources, Inc.noncurrent on the balance sheet. The new standard was early-adopted by the Company as of December 31, 2015 on a retrospective basis to all prior balance sheet periods presented. Accordingly, all deferred tax assets and SubsidiariesNotesdeferred tax liabilities have been reflected as noncurrent and the Company reclassified $36.2 million and $145.3 million as of December 31, 2015 and 2014, respectively, from "Accrued liabilities and other" to Consolidated Financial Statements“Deferred income tax liabilities, net” on the consolidated balance sheets.(1)Deferred and prepaid taxes on the accompanying consolidated balance sheets contain receivables of $3.7 million for overpaid income taxes at December 31, 2011.(2)In addition to the provision for income taxes of $415.8 million, activity during 2012 includes an increase to deferred tax liabilities of $56.6 million related to the acquisition of assets from Wheatland Oil Inc. (see Note 14) and a decrease of $15.6 million related to the excess tax benefits of stock-based compensation. December 31, In thousands 2015 2014 Deferred tax assets United States net operating loss carryforwards 398,024 60,904 Canadian net operating loss carryforwards 17,892 4,899 Alternative minimum tax carryforwards 40,796 38,715 Equity compensation 32,910 22,255 Other 11,048 8,920 Total deferred tax assets 500,670 135,693 Canadian valuation allowance (17,892 ) (4,389 ) Total deferred tax assets, net of valuation allowance 482,778 131,304 Deferred tax liabilities Property and equipment (2,528,125 ) (2,254,343 ) Non-cash gains on derivatives (38,452 ) (30,269 ) Gain on derivative liquidation (4,158 ) (132,356 ) Other (2,271 ) (1,132 ) Total deferred tax liabilities (2,573,006 ) (2,418,100 ) Deferred income tax liabilities, net $ (2,090,228 ) $ (2,286,796 ) 2012,2015, the Company had federal and state net operating loss carryforwards totaling $554.0of $865 million whichand $2.63 billion, respectively. The federal net operating loss carryforward will begin expiring in 2033. The Oklahoma net operating loss carryforward of $2.12 billion will begin to expire beginningin 2027. The remainder of the state net operating loss carryforwards will begin expiring in 2017. The carryforwards have expiration periods that vary according to state jurisdiction. The Company has alternative minimum tax credit carryforwards of $27.0$41 million that have no expiration date. Any available statutory depletion carryforwardcarryforwards will be recognized when realized. The Company files income tax returns in the U.S. Federal jurisdictionfederal, U.S. state and various stateCanadian jurisdictions. With few exceptions, the Company is no longer subject to U.S. Federal,federal, state and local income tax examinations by tax authorities for years prior to 2009.2012.expensespayments associated with operating leases for the years ended December 31, 2012, 20112015, 2014 and 20102013 were $2.2$9.6 million, $1.7$8.0 million and $1.7$3.0 million, respectively.respectively, a portion of which was capitalized and/or billed to other interest owners. At December 31, 2012,2015, the minimum future rental commitments under operating leases having initial or remaining non-cancelable lease terms in excess of one year are as follows: Total amount (in thousands) $ 1,965 1,692 222 141 55 191 $ 4,266 In thousands Total amount 2016 $ 3,348 2017 1,327 2018 979 2019 291 2020 210 Thereafter 3,105 Total obligations $ 9,260 2012,2015, the Company had drilling rig contracts with various terms extending through August 2014. These contracts were entered into in the ordinary course of businessto year-end 2019 to ensure rig availability to allow the Company to execute its business objectives in its key strategic plays.operating areas. Future commitments as of December 31, 20122015 total approximately $95$422 million, of which $80$200 million is expected to be incurred in 2013 and $152016, $136 million in 2014. These drilling commitments are not recorded2017, $62 million in the accompanying consolidated balance sheets.Fracturing2018, and well stimulation service agreement – The Company has an agreement with a third party whereby the third party will provide, on a take-or-pay basis, hydraulic fracturing services and related equipment to service certain of the Company’s properties$24 million in North Dakota and Montana. The agreement has a term of three years, beginning in October 2010, with two one-year extensions available to the Company at its discretion. Pursuant to the take-or-pay provisions, the Company is to pay a fixed rate per day for a minimum number of days per calendar quarter over the three-year term regardless of whether the services are provided. The agreement also stipulates the Company will bear the cost of certain products and materials used. Future commitments remaining as of December 31, 2012 amount to approximately $17 million, all of which is expected to be incurred in 2013.2019.Continental Resources, Inc. and SubsidiariesNotes to Consolidated Financial StatementsSince the inception of this agreement, the Company has been using the services more than the minimum number of days each quarter. The commitment under this agreement is not recorded in the accompanying consolidated balance sheets.totaling 15,000 barrels ofon operational crude oil per day on operational pipelines in order to reduce the impact of possible production curtailments that may arise due to limited transportation capacity.and natural gas pipelines. The commitments, which have 5-yearvarying terms extending as far as November 2017,2027, require the Company to pay varying per-barrelper-unit transportation charges regardless of the amount of pipeline capacity used. Future commitments remaining as of December 31, 20122015 under the operational pipeline transportation arrangements amount to approximately $55 million,$1.0 billion, of which $13 million is expected to be incurred annually in years 2013, 2014 and 2015, $10 million in 2016, and $5 million in 2017.Further, the Company is a party to additional 5-year firm transportation commitments for future pipeline projects being considered for development that are not yet operational. Such projects require the granting of regulatory approvals or otherwise require significant additional construction efforts by our counterparties before being completed. Future commitments under the non-operational arrangements total approximately $1.0 billion at December 31, 2012, representing aggregate transportation charges expected to be incurred over the 5-year terms of the arrangements assuming the proposed pipeline projects are completed and become operational. The timing of the commencement of pipeline operations is not known due to uncertainties involving matters such as regulatory approvals, resolution of legal and environmental disputes, construction progress and the ultimate probability of pipeline completion. Accordingly, the timing of the Company’s obligations under these non-operational arrangements cannot be predicted with certainty and may not be incurred on a ratable basis over a calendar year or may not be incurred at all. Although timing is uncertain, the Company’s obligations under these arrangements are not expected to begin until at least 2014.Rail transportation commitments –The Company has entered into firm transportation commitments to guarantee capacity on rail transportation facilities in order to reduce the impact of possible production curtailments that may arise due to limited transportation capacity. The rail commitments have various terms extending through December 2015 and require the Company to pay varying per-barrel transportation charges on volumes ranging from 2,500 to 10,000 barrels of crude oil per day regardless of the amount of rail capacity used. Future commitments remaining as of December 31, 2012 under the rail transportation arrangements amount to approximately $52 million, of which $35$215 million is expected to be incurred in 2013, $102016, $212 million in 2014, and $72017, $207 million in 2015.2018, $154 million in 2019, $47 million in 2020, and $170 million thereafter.and rail transportation commitments are for crude oil production primarily in the North region where the Company allocates a significant portion of its capital expenditures. The commitments under these arrangements are not recorded in the accompanying consolidated balance sheets.region. The Company is not committed under these contracts or any other existing contract, to deliver fixed and determinable quantities of crude oil or natural gas in the future.an allegeda putative class action was filed in the District Court of Blaine County, Oklahoma by Billy J. Strack and Daniela A. Renner as trustees of certain named trusts and on behalf of other similarly situated parties against the Company allegingCompany. The Petition alleged the Company improperly deducted post-production costs from royalties paid to plaintiffs and other royalty interest owners as categorized in the petition from crude oil and natural gas wells located in Oklahoma. The plaintiffs have alleged a number ofallegedproposed class. On November 3, 2014, plaintiffs filed an Amended Petition that did not add any substantive claims, but sought a “hybrid class action” in which they sought certification of certain claims for injunctive relief, reserving the right to seek a further class certification on money damages in the future. Plaintiffs filed an Amended Motion for Class Certification on January 9, 2015, that modified the proposed class to royalty owners in Oklahoma production from July 1, 1993, to the present (instead of 1980 to the present) and sought certification of over 45 separate “issues” for injunctive or declaratory relief, again, reserving the right to seek a further class certification of money damages in the future. The Company has responded to the petition, deniedits amendment, and the motions for class certification denying the allegations and raisedraising a number of affirmative defenses. Discoverydefenses and legal arguments to each of the claims and filings. Certain discovery was undertaken and the “hybrid” motion was briefed by plaintiffs and the Company. A hearing on the “hybrid” class certification was held on June 1st and 2nd, 2015. On June 11, 2015, the trial court certified a “hybrid” class as requested by plaintiffs. The Company has appealed the trial court’s class certification order, which will be reviewed de novo by the appellate court. The appeal briefing is ongoingcomplete and information and documents continue to be exchanged.ready for determination by the court. An unsuccessful mediation was conducted on December 7, 2015. The Company is not currently able to estimate a reasonably possible loss or range of loss or what impact, if any, the action will have on its financial condition, results of operations or cash flows due to the preliminary status of theContinental Resources, Inc. and SubsidiariesNotes to Consolidated Financial StatementsThe class hasAlthough not been certified. Plaintiffscurrently at issue in the “hybrid” certification, plaintiffs have indicated that if the class is certified they may seek damagesalleged underpayments in excess of $145$200 million that they may claim as damages, which may increase with the passage of time, a majority of which would be comprised of interest. The Company disputes plaintiffs’ claims, disputes that the case meets the requirements for a class action and is vigorously defending the case.such asincluding, but not limited to, commercial disputes, claims from royalty and surface owners, property damage claims, personal injury claims, disputes with tax authorities and similarother matters. While the outcome of these legal matters cannot be predicted with certainty, the Company does not expect them to have a material effect on its financial condition, results of operations or cash flows. As of December 31, 20122015 and 2011,2014, the Company hashad recorded a liability on the consolidated balance sheets under the caption “Other noncurrent liabilities” of $2.4$6.1 million and $2.6$2.9 million, respectively, for various matters, none of which are believed to be individually significant.Riskrisk – Due to the nature of the crude oil and natural gas business, the Company is exposed to possible environmental risks. The Company is not aware of any material environmental issues or claims.sellshistorically sold a portion of its natural gas production to affiliates.Hiland. For the years ended December 31, 2012, 2011,2015, 2014, and 2010,2013, these sales amounted to $61.7$1.4 million, $53.5$95.1 million, and $31.0$100.4 million, respectively, net of transportation and processing costs, and are included in the caption “Crude oil and natural gas sales to affiliates” in the consolidated statements of income.comprehensive income (loss). At December 31, 20122015 nothing was due to the Company and 2011, $11.7at December 31, 2014, $13.1 million and $12.3 million, respectively, was due to the Company from these affiliates,Hiland, which is included in the caption “Receivables—Affiliated parties” in the consolidated balance sheets.In August 2010, the Company began buying or selling crude oil with an affiliate. These purchases or sales are done with the affiliate each month with the net amount being paid to, or received from, the affiliate in the following month. For the years ended December 31, 2012, 2011, and 2010, crude oil sales to the affiliate totaled 21,000 barrels, 435,000 barrels, and 104,000 barrels, respectively, generating sales proceeds of $1.9 million, $41.7 million, and $7.3 million, respectively. In 2012 and 2010, the Company purchased 2,000 barrels and 15,000 barrels, respectively, from the affiliate for $0.2 million and $1.2 million, respectively, with no purchases being made from the affiliate in 2011. The Company incurred $2.7 million, $1.4 million, and $0.5 million in expenses in 2012, 2011, and 2010, respectively, associated with these transactions. At December 31, 2012, $0.22015 nothing was due from the Company and at December 31, 2014, $0.3 million was due from the Company to the affiliateHiland for transportation and processing costs associated with thesethe transactions, which is included in the caption “Payables to affiliated parties” in the consolidated balance sheets. At December 31, 2011, $0.9was dueand had no crude oil sales to the Company from the affiliate associated with these transactions, which is included in the caption “Receivables—Affiliated parties” in the consolidated balance sheets.The Company contracts for field services such as compression and drilling rig services and purchases residue fuel gas and reclaimed crude oil from certain affiliates. affiliate.$5.0$2.6 million, $4.1$5.9 million and $3.5$5.7 million in 2012, 20112015, 2014, and 2010,2013, respectively, associated with drilling rig services provided by an affiliate. Hiland historically provided field services such as compression, purchases of residue fuel gas and reclaimed crude oil, and reimbursements of generator rentals and fuel. Production and other expenses attributable to these affiliate transactions with Hiland were $2.0$1.7 million, $4.6$5.1 million and $6.6$1.4 million for the years ended December 31, 2012, 20112010,Subsidiaries$32.7$7.7 million, $30.8$58.2 million and $30.8$48.5 million for the years ended December 31, 2012, 20112015, 2014, and 2010,2013, respectively. The Company also received $146,000 in 2010 from a former affiliate for saltwater disposal fees. Under a contract for natural gas sales to an affiliate, the Company incurred gathering and treatment fees which amounted to $4.7 million in 2012,Continental Resources, Inc. and SubsidiariesNotes to Consolidated Financial Statements$4.6 million in 2011 and $5.5 million in 2010. At December 31, 20122015 nothing was due to these affiliates and 2011,at December 31, 2014, $5.6 million and $5.7 million, respectively, was due to these affiliates related to thesethe transactions, which is included in the caption “Payables to affiliated parties” in the consolidated balance sheets. and other key employees of the Company own or control entities that own working and royalty interests in wells operated by the Company. The Company paid revenues to these affiliates, including royalties, of $38.3$0.7 million, $46.8$1.7 million, and $17.7$2.3 million and received payments from these affiliates of $38.5$0.5 million, $67.5$0.8 million, and $20.9$1.3 million during the years ended December 31, 2012, 20112015, 2014, and 2010,2013, respectively, relating to the operations of the respective properties. The Company also paid to these affiliates $277,000 in 2012, $4,900 in 2011, and $48,000 in 2010 for their share of proceeds from undeveloped leasehold sales. At December 31, 20122015 and 2011, $0.7 million2014, $106,000 and $18.8 million$207,000 was due from these affiliates and approximately $0.3 million$52,000 and $4.2 million$133,000 was due to these affiliates, respectively, relating to these transactions.Prior to July 2012, the Company leased office space under an operating lease from an entity owned by the Company’s principal shareholder. Rents paid associated with the leases totaled approximately $0.7 million, $1.0 million and $1.0 million for the years ended December 31, 2012, 2011 and 2010, respectively.20122015, 2014, and 2011,2013, the Company charged affiliates approximately $112,000$9,600, $51,000, and $235,000,$55,000, respectively, for use of its corporate aircraft, crews, fuel, utilities and fuel costsreimbursement of expenses and received $33,000, $39,000, and $379,000 from affiliates in 2015, 2014, and 2013, respectively. The Company was charged $102,000$236,000, $97,000, and $88,000,$51,000, respectively, by affiliates for use of their aircraft and crews.In September 2012,reimbursement of expenses during 2015, 2014, and 2013 and paid $221,000, $34,000, and $238,000 to the affiliates in 2015, 2014, and 2013, respectively.entered intoin the third quarter of 2014. During the fourth quarter of 2015, the affiliate relationship terminated. The total amount invoiced and capitalized for 2015 and 2014 associated with the projects was $8.8 million and $1.8 million, respectively. The total amount paid, a 5-year firm transportation commitment with an affiliateportion of which was billed to guarantee pipeline access capacity totaling 10,000 barrels of crude oil per day on a pipeline project being developed that is not yet operational. The pipeline project requires significant additional construction effortsother interest owners, was $9.2 million and $1.9 million for 2015 and 2014 respectively. Nothing was owed by the affiliate before being completed. The commitment requires the Company to pay transportation charges of $5.25 per barrel regardless of the amount of pipeline capacity used. Future commitments under the arrangement total approximately $95.8 million at December 31, 2012, representing aggregate transportation charges expected to be incurred over2015 and $1.2 million was owed by the 5-year term assuming the pipeline projectCompany at December 31, 2014, which is completed and becomes operational. The timing of the commencement of the pipeline’s operations is not known. Accordingly, the timing of the Company’s obligations under the arrangement cannot be predicted with certainty and may not be incurred on a ratable basis over a calendar year or may not be incurred at all. Although timing is uncertain, the Company’s obligations under the arrangement are not expected to begin until at least 2014. The commitments under this arrangement are not recordedincluded in the accompanyingcaption “Payables to affiliated parties” in the consolidated balance sheets.In August 2012, the Company acquired the assets stock options to employees pursuant to the Continental Resources, Inc. 2000 Stock Option Plan (“2000 Plan”) and restricted stock to employees and directors pursuant to the Continental Resources, Inc. 2005 Long-Term Incentive Plan (“2005 Plan”) and 2013 Long-Term Incentive Plan ("2013 Plan") as discussed below. The Company’s associated compensation expense, which is included in the caption “General and administrative expenses” in the consolidated statements of comprehensive income is reflected in the table below(loss), was $51.8 million, $54.4 million, and $39.9 million for the periods presented. Year ended December 31, 2012 2011 2010 In thousands $ 29,057 $ 16,572 $ 11,691 Stock OptionsEffective October 1, 2000, the Company adopted the 2000 Plan and granted stock options to certain eligible employees. These grants consisted of either incentive stock options, nonqualified stock options or a combination of both. The granted stock options vested ratably over either a three or five-year period commencing on the first anniversary of the grant date and expired ten years from the date of grant. On November 10, 2005, the 2000 Plan was terminated. As of March 31, 2012, all options issued under the 2000 Plan had been exercised or expired.The Company’s stock option activity under the 2000 Plan from December 31, 2009 to December 31, 2012 is presented below: Outstanding Exercisable Number of
options Weighted
average
exercise
price Number of
options Weighted
average
exercise
price 312,190 $ 1.06 312,190 $ 1.06 (207,220 ) 1.24 104,970 0.71 104,970 0.71 (18,470 ) 0.71 86,500 0.71 86,500 0.71 (86,500 ) 0.71 — — — — The intrinsic value of a stock option is the amount by which the value of the underlying stock exceeds the exercise price of the option at its exercise date. The total intrinsic value of options exercised during the years ended December 31, 2012, 20112015, 2014 and 2010 was $7.6 million, $1.1 million and $8.9 million,2013, respectively.Restricted StockOn October 3, 2005,20052013 Plan and reserved a maximum of 5,500,00019,680,072 shares of common stock that may be issued pursuant to the plan. The 2013 Plan replaced the Company's 2005 Plan as the instrument used to grant long-term incentive awards and no further awards will be granted under the 2005 Plan. However, restricted stock awards granted under the 2005 Plan prior to the adoption of the 2013 Plan will remain outstanding in accordance with their terms. As of December 31, 2012,2015, the Company had 1,867,967a maximum of 17,028,213 shares of restricted stock available to grant to officers, directors officers and key employees under the 20052013 Plan.includingand, except as otherwise provided under the 2013 Plan, 2005 Plan, or agreement relevant to a given award, includes the right to vote the restricted stock or to receive dividends, subject to forfeiture. Restricted stock grants generally vest over periods ranging from one to three years.Continental Resources, Inc. and SubsidiariesNotes to Consolidated Financial Statements20092012 to December 31, 20122015 is presented below: Number of
non-vested
shares Weighted
average
grant-date
fair value 1,126,821 $ 26.55 449,114 48.71 (412,143 ) 25.50 (55,715 ) 30.52 1,108,077 35.72 491,315 63.59 (359,601 ) 29.95 (41,447 ) 41.93 1,198,344 48.66 916,028 73.46 (444,723 ) 45.25 (40,187 ) 59.05 1,629,462 63.28 Number of
non-vested
shares Weighted
average
grant-date
fair valueNon-vested restricted shares at December 31, 2012 3,258,924 $ 31.64 Granted 522,518 48.98 Vested (929,618 ) 23.65 Forfeited (137,512 ) 35.96 Non-vested restricted shares at December 31, 2013 2,714,312 $ 37.50 Granted 1,424,764 61.11 Vested (1,007,166 ) 35.91 Forfeited (453,146 ) 44.90 Non-vested restricted shares at December 31, 2014 2,678,764 $ 49.40 Granted 1,462,534 46.65 Vested (555,517 ) 48.07 Forfeited (336,170 ) 51.23 Non-vested restricted shares at December 31, 2015 3,249,611 $ 48.20 average of the high and low intradayclosing market pricesprice of the Company’s common stock on the date of grant. Compensation expense for a restricted stock grant is a fixed amount determined at the grant date fair value and is recognized ratably over the vesting period as services are rendered by employees and directors. The expected life of restricted stock is based on the non-vested period that remains subsequent to the date of grant. There are no post-vesting restrictions related to the Company’s restricted stock. The fair value at the vesting date of restricted stock that vested during 2012, 20112015, 2014 and 2010 at the vesting date2013 was $33.0$23.6 million, $19.9$58.2 million and $19.7$49.4 million, respectively. As of December 31, 2012,2015, there was approximately $73$67 million of unrecognized compensation expense related to non-vested restricted stock. This expense is expected to be recognized ratably over a weighted average period of 2.21.2 years.Property AcquisitionsAccumulated Other Comprehensive LossDispositionsAcquisitionsIn December 2012, the Company acquired certain producing and undeveloped properties in the Bakken play of North Dakota from a third party for $663.3 million, of which $477.1 million was allocated to producing properties. In the transaction, the Company acquired interests in approximately 119,000 net acres as well as producing properties with production of approximately 6,500 net barrels of oil equivalent per day.In August 2012, the Company acquired the assets of Wheatland Oil Inc. through the issuance of shares of the Company’s common stock. See2014: Year ended December 31, In thousands 2015 2014 Beginning accumulated other comprehensive loss, net of tax $ (385 ) $ — Foreign currency translation adjustments (2,969 ) (385 ) Income tax benefit (1) — — Other comprehensive loss, net of tax (2,969 ) (385 ) Ending accumulated other comprehensive loss, net of tax $ (3,354 ) $ (385 ) (1) A valuation allowance has been recognized against deferred tax assets associated with losses generated by the Company's Canadian operations, thereby resulting in no income taxes on other comprehensive loss. Transaction with Related Party for further discussion.In February 2012, the Company acquired certain producing and undeveloped properties in the Bakken play of North Dakota from a third party for $276 million, of which $51.7 million was allocated to producing properties. In the transaction, the Company acquired interests in approximately 23,100 net acres as well as producing properties with production of approximately 1,000 net barrels of oil equivalent per day. ForDispositions2012, the acquired properties comprised approximately 496 MBoe of the Company’s crude oil and natural gas production and approximately $38 million of its crude oil and natural gas revenues.Continental Resources, Inc. and SubsidiariesNotes to Consolidated Financial StatementsDispositionsIn December 2012,2015, the Company sold its producing crude oil and natural gascertain non-strategic properties and supporting assets in its East regionvarious areas to a third partyparties for $126.4 million, subjectproceeds totaling $34.0 million. The proceeds primarily related to customary post-closing adjustments. In connection with the transaction, the Company recognized a pre-tax gainassignment of $68.0 million, which included the effect of removing $8.3 million of asset retirement obligations for the disposed properties previously recognized by the Company that were assumed by the buyer. The transaction excluded a portion of the Company’scertain non-producing leasehold acreage in the East region, which is being retained by the Company for future exploration and development opportunities. The transaction also allowed for the Company to retain an overriding royalty interest in certain of the disposed properties as well as rights to drill in potential unproven deeper formations that may exist below the disposed properties. The producing properties included in the disposition comprised 399 MBoe, or 1%, of the Company’s total crude oil and natural gas production for 2012. Crude oil and natural gas revenues for the disposed properties amounted to $35 million for 2012, representing 1% of the Company’s total crude oil and natural gas revenues for the year. The disposed properties had represented approximately 1% of the Company’s total proved reserves prior to disposition.In June 2012, the Company assigned certain non-strategic leaseholds and producing properties located in Oklahoma to a third party for $15.9$25.9 million andin May 2015. The Company recognized a pre-tax gain on the transaction of $15.9$20.5 million. The assigned properties represented an immaterial portion of the Company’s leasehold acreage.which included the effect of removing $0.6and $85.8 million of asset retirement obligations forproceeds received in conjunction with the disposeddisposition of a portion of the Company's Northwest Cana properties previously recognized by the Company that were assumed by the buyer.in Oklahoma in September 2014. The disposed properties represented an immaterial portion of the Company’s total proved reserves, and production.In February 2012, the Company assigned certain non-strategic leaseholds and producing properties located in Wyoming to a third party for $84.4 million. In connection with the transaction, the Company recognized a pre-tax gain of $50.1 million, which included the effect of removing $11.1 million of asset retirement obligations for the disposed properties previously recognized by the Company that were assumed by the buyer. The disposed properties had represented 3.2 MMBoe, or 1%, of the Company’s total proved reserves at December 31, 2011 and 259 MBoe, or 1%, of its 2011 total crude oil and natural gas production.During 2011, the Company assigned certain non-strategic properties in Michigan, North Dakota, and Montana to third parties for total proceeds of $30.2 million. In connection with the transactions, the Company recognized pre-tax gains totaling $21.4 million. Substantially all of the properties disposed of in 2011 consisted of undeveloped leasehold acreage with no proved reserves and no production or revenues.In June 2010, the Company assigned certain non-strategic properties in Louisiana to a third party for $35.4 million and recognized a pre-tax gain on the transaction of $31.7 million. The 2010 transaction involved undeveloped acreage with no proved reserves and no production or revenues.The gains on the above dispositions are included in the caption “Gain on sale of assets, net” in the consolidated statements of income.Note 14. Property Transaction with Related PartyOn March 27, 2012, the Company entered into a Reorganization and Purchase and Sale Agreement (the “Agreement”) with Wheatland Oil Inc. (“Wheatland”) and the shareholders of Wheatland. Wheatland is owned 75% by the Revocable Inter Vivos Trust of Harold G. Hamm, a trust of which Harold G. Hamm, the Company’s Chief Executive Officer, Chairman of the Board and principal shareholder is the trustee and sole beneficiary, and 25% by the Company’s Vice Chairman of Strategic Growth Initiatives, Jeffrey B. Hume. The Agreement provided for the acquisition by the Company, through the issuance of shares of the Company’s common stock, ofContinental Resources, Inc. and SubsidiariesNotes to Consolidated Financial Statementsall of Wheatland’s right, title and interest in and to certain crude oil and natural gas properties and related assets, in which the Company also owned an interest, in the states of Mississippi, Montana, North Dakota and Oklahoma and the assumption of certain liabilities related thereto.A special meeting of the Company’s shareholders was held on August 10, 2012 for the purpose of voting on whether to approve the issuance of shares of the Company’s common stock pursuant to the Agreement as required by Oklahoma state law, the requirements of the New York Stock Exchange Listed Company Manual and the terms of the Agreement. The proposal to issue shares of the Company’s common stock pursuant to the Agreement received the requisite affirmative shareholder votes at the August 10, 2012 special meeting to satisfy the necessary approval requirements. As a result, the Wheatland transaction was consummated and closed on August 13, 2012, with an effective date of January 1, 2012. At closing, after considering customary purchase price adjustments, the Company issued an aggregate of approximately 3.9 million shares of its common stock, par value $0.01 per share, to the shareholders of Wheatland in accordance with the terms of the Agreement. The fair value of the consideration transferred by the Company at closing was approximately $279 million.For accounting purposes, the acquisition represented a transaction between entities under common control as Mr. Hamm is the controlling shareholder of both the Company and Wheatland. Accordingly, the Company recorded the assets acquired and liabilities assumed at Wheatland’s carrying amount. The net book basis of Wheatland’s assets was approximately $82 million, primarily representing $177 million for acquired crude oil and natural gas properties partially offset by $38 million of joint interest obligations assumed, $0.6 million of asset retirement obligations assumed and $57 million of deferred income tax liabilities recognized. All purchase price adjustments arising after the closing date as allowed for under the Agreement, which amounted to $0.5 million being owed to the Company by Wheatland, have been agreed upon by the parties and are reflected in the Company’s consolidated financial statements at December 31, 2012.The Company’s consolidated financial statements at December 31, 2012 include the results of operations and cash flows for the acquired properties subsequent to the closing date. For the year ended December 31, 2012, the acquired Wheatland properties comprised approximately 484 MBoe of the Company’s crude oil and natural gas production, and approximately $38 million of its crude oil and natural gas revenues.Note 15. Relocation of Corporate HeadquartersIn March 2011, the Company announced plans to relocate its corporate headquarters from Enid, Oklahoma to Oklahoma City, Oklahoma. The Company’s relocation efforts were completed during 2012. For the years ended December 31, 2012 and 2011, the Company recognized $7.8 million and $3.2 million, respectively, of costs associated with its relocation efforts. These costs are included in the caption “General and administrative expenses” in the consolidated statements of income.Continental Resources, Inc. and SubsidiariesNotes to Consolidated Financial Statements16.15. Crude Oil and Natural Gas Property Information2012, 20112015, 2014 and 2010. Year ended December 31, 2012 2011 2010 In thousands $ 2,379,433 $ 1,647,419 $ 948,524 (195,440 ) (138,236 ) (93,203 ) (228,438 ) (144,810 ) (76,659 ) (23,507 ) (27,920 ) (12,763 ) (683,207 ) (384,301 ) (239,748 ) (122,274 ) (108,458 ) (64,951 ) (428,095 ) (321,447 ) (175,256 ) $ 698,472 $ 522,247 $ 285,944 Year ended December 31, In thousands 2015 2014 2013 Crude oil and natural gas sales $ 2,552,531 $ 4,203,022 $ 3,573,431 Production expenses (348,897 ) (352,472 ) (282,197 ) Production taxes and other expenses (200,637 ) (349,760 ) (298,787 ) Exploration expenses (19,413 ) (50,067 ) (34,947 ) Depreciation, depletion, amortization and accretion (1,722,336 ) (1,338,351 ) (953,796 ) Property impairments (402,131 ) (616,888 ) (220,508 ) Income tax benefit (provision) 33,680 (559,311 ) (659,783 ) Results from crude oil and natural gas producing activities $ (107,203 ) $ 936,173 $ 1,123,413 2012, 20112015, 2014 and 20102013 are shownpresented below: Year ended December 31, 2012 2011 2010 In thousands $ 738,415 $ 65,315 $ 7,338 745,601 183,247 340,064 1,484,016 248,562 347,402 857,681 734,797 289,175 1,975,660 1,178,136 565,551 $ 4,317,357 $ 2,161,495 $ 1,202,128 Year ended December 31, In thousands 2015 2014 2013 Property acquisition costs: Proved $ 557 $ 48,917 $ 16,604 Unproved 168,492 409,529 546,881 Total property acquisition costs 169,049 458,446 563,485 Exploration Costs 241,523 863,606 687,767 Development Costs 2,148,530 3,670,448 2,549,203 Total $ 2,559,102 $ 4,992,500 $ 3,800,455 $1.7$1.2 million and $0.6$1.8 million and development costs above include asset retirement costs of $1.0$19.5 million, $3.7$19.1 million and $4.7$6.0 million for the years ended December 31, 2012, 20112015, 2014 and 2010,2013, respectively.20122015 and 20112014 are as follows: December 31, 2012 2011 In thousands $ 8,980,505 $ 5,376,109 1,073,944 663,493 10,054,449 6,039,602 (2,090,845 ) (1,458,224 ) $ 7,963,604 $ 4,581,378 Continental Resources, Inc. and SubsidiariesNotes to Consolidated Financial Statements December 31, In thousands 2015 2014 Proved crude oil and natural gas properties $ 19,520,724 $ 17,045,967 Unproved crude oil and natural gas properties 682,988 966,080 Total 20,203,712 18,012,047 Less accumulated depreciation, depletion and amortization (6,374,218 ) (4,601,864 ) Net capitalized costs $ 13,829,494 $ 13,410,183 determinesattempts to determine whether the well has discovered crude oil and natural gas reserves and, if so, whether those reserves can be classified as proved reserves. Often, the determination of whether proved reserves can be recorded under SEC guidelines cannot be made when drilling is completed. In those situations where management believes that economically producible hydrocarbons have not been discovered, the exploratory drilling costs are reflected on the consolidated statements of comprehensive income (loss) as dry hole costs, a component of “Exploration expenses”. Where sufficient hydrocarbons have been discovered to justify further exploration or appraisal activities, exploratory drilling costs are deferred under the caption “Net property and equipment” on the consolidated balance sheets pending the outcome of those activities. Year ended December 31, 2012 2011 2010 In thousands $ 128,123 $ 92,806 $ 22,856 485,530 500,046 185,713 (520,187 ) (456,780 ) (112,739 ) (767 ) (7,949 ) (3,024 ) $ 92,699 $ 128,123 $ 92,806 46 56 87 Year ended December 31, In thousands 2015 2014 2013 Balance at January 1 $ 93,421 $ 152,775 $ 92,699 Additions to capitalized exploratory well costs pending determination of proved reserves 132,806 627,853 548,933 Reclassification to proved crude oil and natural gas properties based on the determination of proved reserves (160,779 ) (671,618 ) (479,507 ) Capitalized exploratory well costs charged to expense (6,051 ) (15,589 ) (9,350 ) Balance at December 31 $ 59,397 $ 93,421 $ 152,775 Number of gross wells 73 119 67 17.16. Supplemental Crude Oil and Natural Gas Information (Unaudited)96%99%, and 94%99% of the Company’s discounted future net cash flows (PV-10) as of December 31, 2012, 2011,2015, 2014, and 2010,2013, respectively. Properties comprising 99% of proved crude oil reserves and 96%97% of proved natural gas reserves were evaluated by Ryder Scott as of December 31, 2012.2015. Remaining reserve estimates were prepared by the Company’s internal technical staff. All proved reserves stated herein are located in the United States.Continental Resources, Inc. and SubsidiariesNotes to Consolidated Financial StatementsResults of drilling, testing and production subsequentPeriodic revisions to the dateestimated reserves and future cash flows may be necessary as a result of the estimate may justify revisiona number of such estimate.factors, including reservoir performance, new drilling, crude oil and natural gas prices, changes in costs, technological advances, new geological or geophysical data, or other economic factors. Accordingly, reserve estimates are often differentmay differ significantly from the quantities of crude oil and natural gas ultimately recovered.2012, 20112015, 2014 and 20102013 were computed using the 12-month unweighted average of the first-day-of-the-month commodity prices as required by SEC rules.2012, 20112015, 2014 and 20102013 were not material and have not been included in the reserve estimates. Crude Oil
(MBbls) Natural Gas
(MMcf) Total
(MBoe)Proved reserves as of December 31, 2012 561,163 1,341,084 784,677 Revisions of previous estimates (55,783 ) (241,623 ) (96,054 ) Extensions, discoveries and other additions 267,009 1,065,870 444,654 Production (34,989 ) (87,730 ) (49,610 ) Sales of minerals in place — — — Purchases of minerals in place 388 419 458 Proved reserves as of December 31, 2013 737,788 2,078,020 1,084,125 Revisions of previous estimates (67,151 ) (244,783 ) (107,949 ) Extensions, discoveries and other additions 239,526 1,206,569 440,621 Production (44,530 ) (114,295 ) (63,579 ) Sales of minerals in place (123 ) (18,623 ) (3,227 ) Purchases of minerals in place 850 1,498 1,100 Proved reserves as of December 31, 2014 866,360 2,908,386 1,351,091 Revisions of previous estimates (246,840 ) (302,143 ) (297,198 ) Extensions, discoveries and other additions 134,764 710,453 253,173 Production (53,517 ) (164,454 ) (80,926 ) Sales of minerals in place (253 ) (456 ) (329 ) Purchases of minerals in place — — — Proved reserves as of December 31, 2015 700,514 3,151,786 1,225,811 Crude Oil
(MBbls) Natural Gas
(MMcf) Total
(MBoe) 173,280 504,080 257,293 14,414 79,285 27,629 48,542 280,146 95,233 (11,820 ) (23,943 ) (15,811 ) — — — 368 — 368 224,784 839,568 364,712 28,607 (158,219 ) 2,237 87,465 447,098 161,981 (16,469 ) (36,671 ) (22,581 ) — — — 1,746 2,056 2,089 326,133 1,093,832 508,438 33,272 (174,736 ) 4,149 166,844 400,848 233,652 (25,070 ) (63,875 ) (35,716 ) (7,165 ) (4,046 ) (7,838 ) 67,149 89,061 81,992 561,163 1,341,084 784,677 Revisions. Revisions represent changes in previous reserve estimates, either upward or downward, resulting from new information normally obtained from development drilling and production history or resulting from a change in economic factors, such as commodity prices, operating costs or development costs. Revisions foryear ended December 31, 2010 were dueremoval of PUD reserves resulting from a decision in 2013 to better than anticipated production performancefocus the Company's drilling program on certain areas of the Bakken and higher average commodity prices throughout 2010 as comparedSCOOP plays with more attractive rates of return and multi-well pad drilling capabilities, while building on success in the Company's development of the Lower Three Forks reservoirs in the Bakken.2009. Revisionsproved reserves in 2014 resulted from the Company refining its drilling program and reducing its planned rig count in response to the significant decrease in crude oil reserves forprices in the year ended December 31, 2011 were due to better than anticipated production performance and higher average commodity prices throughout 2011 as compared to 2010. Revisions to natural gas reserves for bothlatter part of the years ended December 31, 2011 and 2012 were primarily due2014, which contributed to the removal of PUD reserves no longer scheduled to be developed within five years from the date in which they were first booked.undeveloped reserves in 2015 resulted primarily from the significant decrease in commodity prices in 2015. The 12-month average price for crude oil decreased 47% from $94.99 per Bbl for 2014 to $50.28 per Bbl for 2015, while the 12-month average price for natural gas decreased 41% from $4.35 per MMBtu for 2014 to $2.58 per MMBtu for 2015. These decreases shortened the economic lives of certain producing properties and caused certain exploration and development projects to become uneconomic which had an adverse impact on the Company's proved reserve estimates, resulting in downward revisions of 185 MMBo and 391 Bcf (totaling 251 MMBoe) in 2015.management’s decisionthe date in which they were first booked. One element leading to deferthe removal is an increased emphasis on multi-well pad drilling in the Bakken, which resulted in the removal of PUDs in certain areas in favor of PUDs more likely to be developed with pad drilling where operating efficiencies may be realized. Further, in the SCOOP play the Company removed certain PUD locations originally planned to be developed with standard lateral drilling lengths in favor of PUDs to be developed with extended length laterals in similardryproperties resulted in 63 MMBo of downward revisions to crude oil proved reserves and 125 Bcf of upward revisions to natural gas propertiesproved reserves (netting to 42 MMBoe of downward revisions) in the Oklahoma Woodford play given the pricing environment for natural gas.Continental Resources, Inc. and SubsidiariesNotes to Consolidated Financial Statementsstrong production growthSCOOP plays. Proved reserve additions in the Bakken fieldtotaled 75 MMBo and 124 Bcf (totaling 96 MMBoe) and reserve additions in North Dakota. In 2012, significant progress continued to be madeSCOOP totaled 36 MMBo and 340 Bcf (totaling 93 MMBoe) for the year ended December 31, 2015. Additionally, 2015 extensions and discoveries were significantly impacted by successful drilling results in developingthe Northwest Cana/STACK area, resulting in proved reserve additions of 20 MMBo and expanding the Company’s North Dakota Bakken assets, both laterally and vertically, through strategic exploration, planning and technology.During the year ended December 31, 2012, the Company disposed of certain non-strategic properties in Oklahoma, Wyoming, and the East region. SeeNote 13.14. Property Acquisitions and Dispositions for furthera discussion of the Company’s 2012notable dispositions.Purchases for the year ended December 31, 2012 primarily reflect the Company’s acquisition of propertiesThere were no notable acquisitions in the Bakken play of North Dakota duringthree years reflected in the year. SeeNote 13. Property Acquisitions and Dispositions andNote 14. Property Transaction with Related Party for further discussion of the Company’s 2012 acquisitions.table above.2012, 20112015, 2014 and 2010: December 31, 2012 2011 2010 226,870 145,024 101,272 545,499 361,265 234,699 317,786 205,235 140,389 334,293 181,109 123,512 795,585 732,567 604,869 466,891 303,203 224,323 561,163 326,133 224,784 1,341,084 1,093,832 839,568 784,677 508,438 364,712 December 31, 2015 2014 2013 Proved Developed Reserves Crude oil (MBbl) 326,798 342,137 278,630 Natural Gas (MMcf) 1,190,343 962,051 768,969 Total (MBoe) 525,188 502,479 406,792 Proved Undeveloped Reserves Crude oil (MBbl) 373,716 524,223 459,158 Natural Gas (MMcf) 1,961,443 1,946,335 1,309,051 Total (MBoe) 700,623 848,612 677,333 Total Proved Reserves Crude oil (MBbl) 700,514 866,360 737,788 Natural Gas (MMcf) 3,151,786 2,908,386 2,078,020 Total (MBoe) 1,225,811 1,351,091 1,084,125 proved reserves expected to be recovered through existing wells with existing equipment and operating methods. Proved undeveloped reserves are proved reserves that require incrementalrelatively major capital expenditures to recover. Natural gas is converted to barrels of crude oil equivalent using a conversion factor of six thousand cubic feet per barrel of crude oil based on the average equivalent energy content of natural gas compared to crude oil.Continental Resources, Inc. and SubsidiariesNotes to Consolidated Financial Statements2012, 20112015, 2014 and 2010. December 31, 2012 2011 2010 In thousands $ 54,362,574 $ 35,042,916 $ 20,420,667 (13,103,469 ) (7,495,552 ) (4,931,251 ) (8,295,130 ) (5,073,043 ) (3,517,389 ) (8,500,766 ) (5,956,615 ) (2,890,644 ) 24,463,209 16,517,706 9,081,383 (13,282,852 ) (9,012,350 ) (5,296,061 ) $ 11,180,357 $ 7,505,356 $ 3,785,322 December 31, In thousands 2015 2014 2013 Future cash inflows $ 36,551,672 $ 90,867,459 $ 78,646,274 Future production costs (10,869,493 ) (25,799,221 ) (21,333,460 ) Future development and abandonment costs (6,935,958 ) (12,842,174 ) (10,250,789 ) Future income taxes (3,717,612 ) (13,800,737 ) (12,447,127 ) Future net cash flows 15,028,609 38,425,327 34,614,898 10% annual discount for estimated timing of cash flows (8,552,325 ) (19,992,293 ) (18,319,131 ) Standardized measure of discounted future net cash flows $ 6,476,284 $ 18,433,034 $ 16,295,767 $86.56, $88.71,$41.63, $84.54, and $71.92$91.50 per barrel at December 31, 2012, 20112015, 2014 and 2010,2013, respectively. The weighted average natural gas price (adjusted for location and quality differentials) utilized in the computation of future cash inflows was $4.31, $5.59,$2.35, $6.06, and $5.07$5.36 per Mcf at December 31, 2012, 20112015, 2014 and 2010,2013, respectively. Future cash flows are reduced by estimated future costs to develop and produce the proved reserves, as well as certain abandonment costs, based on year-end cost estimates assuming continuation of existing economic conditions. The expected tax benefits to be realized from the utilization of net operating loss carryforwards and known tax credits are used in the computation of future income tax cash flows.years: December 31, 2012 2011 2010 $ 7,505,356 $ 3,785,322 $ 1,841,540 3,724,136 2,276,355 926,938 254,493 133,990 490,563 (298,148 ) (70,219 ) (376,848 ) 1,171,047 56,246 8,022 (530,515 ) 1,855,532 1,177,446 750,536 378,532 184,154 (1,955,555 ) (1,364,373 ) (778,662 ) 1,095,156 528,737 356,992 (102,519 ) 773,279 397,669 (433,630 ) (848,045 ) (442,492 ) 3,675,001 3,720,034 1,943,782 $ 11,180,357 $ 7,505,356 $ 3,785,322 December 31, In thousands 2015 2014 2013 Standardized measure of discounted future net cash flows at January 1 $ 18,433,034 $ 16,295,767 $ 11,180,357 Extensions, discoveries and improved recoveries, less related costs 1,091,283 5,516,528 6,613,665 Revisions of previous quantity estimates (2,156,028 ) (1,755,366 ) (1,765,300 ) Changes in estimated future development and abandonment costs 5,008,731 476,665 1,942,585 Purchases (sales) of minerals in place, net (7,768 ) (3,196 ) 12,012 Net change in prices and production costs (16,111,142 ) (1,925,349 ) 263,541 Accretion of discount 1,843,303 1,629,576 1,118,036 Sales of crude oil and natural gas produced, net of production costs (2,002,997 ) (3,500,790 ) (2,992,447 ) Development costs incurred during the period 1,394,584 2,466,748 1,210,223 Change in timing of estimated future production and other (3,844,259 ) (309,902 ) 464,111 Change in income taxes 2,827,543 (457,647 ) (1,751,016 ) Net change (11,956,750 ) 2,137,267 5,115,410 Standardized measure of discounted future net cash flows at December 31 $ 6,476,284 $ 18,433,034 $ 16,295,767 18.17. Quarterly Financial Data (Unaudited)20122015 and 20112014 is summarized below. Quarter ended March 31 June 30 September 30 December 31 In thousands, except per share data $ 395,100 $ 1,004,719 $ 483,729 $ 688,972 $ (169,057 ) $ 471,728 $ (158,294 ) $ 9,639 $ 135,591 $ 686,474 $ 105,522 $ 365,220 $ 69,094 $ 405,684 $ 44,096 $ 220,511 $ 0.38 $ 2.26 $ 0.24 $ 1.20 $ 0.38 $ 2.25 $ 0.24 $ 1.19 $ (36,210 ) $ 602,892 $ 968,989 $ 114,118 $ (369,303 ) $ 204,453 $ 537,340 $ (402,539 ) $ (202,893 ) $ 404,308 $ 727,618 $ (168,281 ) $ (137,201 ) $ 239,194 $ 439,143 $ (112,064 ) $ (0.80 ) $ 1.33 $ 2.45 $ (0.62 ) $ (0.80 ) $ 1.33 $ 2.44 $ (0.62 ) Quarter ended In thousands, except per share data March 31 June 30 September 30 December 31 2015 Total revenues (1) $ 625,644 $ 796,374 $ 682,669 $ 575,480 Gain (loss) on derivative instruments, net (1) $ 32,755 $ (4,737 ) $ 46,527 $ 16,540 Property impairments (2) $ 147,561 $ 76,872 $ 96,697 $ 81,001 Income (loss) from operations $ (111,276 ) $ 82,447 $ (52,356 ) $ (142,816 ) Net income (loss) $ (131,971 ) $ 403 $ (82,423 ) $ (139,677 ) Net income (loss) per share: Basic $ (0.36 ) $ — $ (0.22 ) $ (0.38 ) Diluted $ (0.36 ) $ — $ (0.22 ) $ (0.38 ) 2014 (3) (4) Total revenues (1) $ 972,495 $ 886,095 $ 1,645,328 $ 1,297,700 Gain (loss) on derivative instruments, net (1) $ (39,674 ) $ (262,524 ) $ 473,999 $ 387,958 Property impairments (2) $ 58,208 $ 79,316 $ 85,561 $ 393,803 Income from operations $ 421,317 $ 236,394 $ 944,897 $ 265,228 Net income $ 226,234 $ 103,538 $ 533,521 $ 114,048 Net income per share: Basic $ 0.61 $ 0.28 $ 1.45 $ 0.31 Diluted $ 0.61 $ 0.28 $ 1.44 $ 0.31 (1) Gains and losses on mark-to-market derivative instruments are reflected in “Total revenues” on both the consolidated statements of comprehensive income (loss) and this table of unaudited quarterly financial data. Derivative gains and losses have been shown separately to illustrate the fluctuations in revenues that are attributable to the Company’s derivative instruments. Commodity price fluctuations at quarter-end have resultedeach quarter can result in significant swings in mark-to-market gains and losses, which has affectedaffects comparability between periods. Derivative losses exceeded(2) Property impairments have been shown separately to illustrate the fluctuations in income (loss) that are attributable to write downs of the Company's assets. Commodity price fluctuations each quarter can result in significant changes in estimated future cash flows and resulting impairments, which affects comparability between periods. (3) (4) Balances for the fourth quarter of 2014 include $433 million of pre-tax gains ($273 million after tax, or $0.74 per basic and diluted share) recognized from crude oil and natural gas sales for the quarter ended March 31, 2011, resulting in negative total revenues forderivative contracts that period.were settled prior to their contractual maturities.Item 9. Changes in and Disagreements with Accountants on Accounting and Financial Disclosure Item 9A. Controls and Procedures 20122015 to ensure that information required to be disclosed in the reports it files and submits under the Exchange Act is recorded, processed, summarized and reported within the time periods specified in the SEC’s rules and forms and that information required to be disclosed under the Exchange Act is accumulated and communicated to the Company’s management, including its Chief Executive Officer and Chief Financial Officer, as appropriate to allow timely decisions regarding required disclosure.2012.2015.20122015 has been audited by Grant Thornton LLP, an independent registered public accounting firm, as stated in their report that follows.Subsidiariessubsidiaries (the “Company”) as of December 31, 2012,2015, based on criteria established in the 2013 Internal Control—Integrated Framework issued by the Committee of Sponsoring Organizations of the Treadway Commission (COSO). The Company’s management is responsible for maintaining effective internal control over financial reporting and for its assessment of the effectiveness of internal control over financial reporting, included in the accompanyingManagement’s Report on Internal Control Overover Financial Reporting. Our responsibility is to express an opinion on the Company’s internal control over financial reporting based on our audit.2012,2015, based on criteria established in the 2013 Internal Control—Integrated Framework issued by COSO.2012,2015, and our report dated February 27, 201324, 2016 expressed an unqualified opinion on those financial statements./s/ GRANT THORNTON LLP Oklahoma City, Oklahoma February 27, 201324, 2016Changes in Internal Control over Financial ReportingAs of the end of the period covered by this report, we carried out an evaluation, under the supervision and with the participation of our Chief Executive Officer and Chief Financial Officer, of our internal control over financial reporting to determine whether any changes occurred during the fourth quarter of 2012 that have materially affected, or are reasonably likely to materially affect, our internal control over financial reporting. Based on that evaluation, there were no changes in our internal control over financial reporting or in other factors during the fourth quarter of 2012 that have materially affected or are reasonably likely to materially affect our internal control over financial reporting.Item 9B. Other Information Item 10. Directors, Executive Officers and Corporate Governance 20132016 (the “Annual Meeting”) and is incorporated herein by reference.Item 11. Executive Compensation Item 12. Security Ownership of Certain Beneficial Owners and Management and Related Stockholder Matters Item 13. Certain Relationships and Related Transactions, and Director Independence Item 14. Principal Accountant Fees and Services Item 15. Exhibits and Financial Statement Schedules Consolidated Financial Statementsconsolidated financial statements of Continental Resources, Inc. and Subsidiaries and the Report of Independent Registered Public Accounting Firm are included in Part II, Item 8 of this report beginning on page 81. 2.1Reorganization and Purchase and Sale Agreement dated as of March 27, 2012 among Continental Resources, Inc., Wheatland Oil Inc. and the shareholders of Wheatland Oil Inc. filed as Exhibit 2.1 to the Company’s Current Report on Form 8-K (Commission File No. 001-32886) filed April 2, 2012 and incorporated herein by reference.3.1 Conformed version of Third Amended and Restated Certificate of Incorporation of Continental Resources, Inc. as amended by amendment filed February 24, 2012on June 15, 2015 filed as Exhibit 3.1 to the Company’s 2011 Form 10-K10-Q for the quarter ended June 30, 2015 (Commission File No. 001-32886) filed August 5, 2015 and incorporated herein by reference.3.2 Third Amended and Restated Bylaws of Continental Resources, Inc. filed as Exhibit 3.1 to the Company’s Current Report on Form 8-K (Commission File No. 001-32886) filed November 6, 2012 and incorporated herein by reference. 4.1 Registration Rights Agreement dated as of May 18, 2007 by and among Continental Resources, Inc., the Revocable Inter Vivos Trust of Harold G. Hamm, the Harold Hamm DST Trust and the Harold Hamm HJ Trust filed February 24, 2012 as Exhibit 4.1 to the Company’s 2011 Form 10-K (Commission File No. 001-32886) and incorporated herein by reference. 4.2 Specimen Common Stock Certificate filed as Exhibit 4.1 to the Company’s Registration Statement on Form S-1 (Commission File No. 333-132257) filed April 14, 2006 and incorporated herein by reference. 4.3Indenture dated as of September 23, 2009 among Continental Resources, Inc., Banner Pipeline Company, L.L.C. and Wilmington Trust FSB, as trustee, filed as Exhibit 4.1 to the Company’s Current Report on Form 8-K (Commission File No. 001-32886) filed September 24, 2009 and incorporated herein by reference. 4.44.3*** Indenture dated as of April 5, 2010 among Continental Resources, Inc., Banner Pipeline Company, L.L.C. and Wilmington Trust FSB, as trustee, filed as Exhibit 4.1 to the Company’s Current Report on Form 8-K (Commission File No. 001-32886) filed April 7, 2010 and incorporated herein by reference.trustee. 4.54.4*** Indenture dated as of September 16, 2010 among Continental Resources, Inc., Banner Pipeline Company, L.L.C. and Wilmington Trust FSB, as trustee, filed as Exhibit 4.1 to the Company’s Current Report on Form 8-K (Commission File No. 001-32886) filed September 17, 2010 and incorporated herein by reference.trustee. 4.64.5 Indenture dated as of March 8, 2012 among Continental Resources, Inc., Banner Pipeline Company, L.L.C. and Wilmington Trust, National Association, as trustee, filed as Exhibit 4.1 to the Company’s Current Report on Form 8-K (Commission File No. 001-32886) filed March 8, 2012 and incorporated herein by reference. 4.6 Indenture dated as of April 5, 2013 among Continental Resources, Inc., Banner Pipeline Company, L.L.C., CLR Asset Holdings, LLC and Wilmington Trust, National Association, as trustee, filed as Exhibit 4.1 to the Company’s Current Report on Form 8-K (Commission File No. 001-32886) filed April 11, 2013 and incorporated herein by reference. 4.7 Indenture dated as of May 19, 2014 among Continental Resources, Inc., Banner Pipeline Company, L.L.C., CLR Asset Holdings, LLC and Wilmington Trust, National Association, as trustee, filed as Exhibit 4.1 to the Company’s Current Report on Form 8-K (Commission File No. 001-32886) filed May 22, 2014 and incorporated herein by reference. 4.8 Registration Rights Agreement dated as of August 13, 2012 among Continental Resources, Inc., the Revocable Inter Vivos Trust of Harold G. Hamm, and Jeffrey B. Hume filed as Exhibit 4.1 to the Company’s Current Report on Form 8-K (Commission File No. 001-32886) filed August 17, 2012 and incorporated herein by reference. 10.1† Amended and Restated Continental Resources, Inc. 2005 Long-Term Incentive Plan effective as of April 3, 2006 filed as Exhibit 10.9 to the Company’s Registration Statement on Form S-1 (Commission File No. 333-132257) filed April 14, 2006 and incorporated herein by reference. 10.2*†10.2† First Amendment toForm of Restricted Stock Award Agreement under the Continental Resources, Inc. 2005 Long-Term Incentive Plan as approved on February 24, 2010. 10.3†Form of Restricted Stock Award Agreement filed as Exhibit 10.10 to the Company’s Registration Statement on Form S-1 (Commission File No. 333-132257) filed April 14, 2006 and incorporated herein by reference. 10.4†10.3† Form of Indemnification Agreement between Continental Resources, Inc. and each of the directors and executive officers thereof filed as Exhibit 10.12 to the Company’s Registration Statement on Form S-1 (Commission File No. 333-132257) filed April 14, 2006 and incorporated herein by reference. 10.5†10.4† Membership Interest Assignment Agreement by and between Continental Resources, Inc., the Harold Hamm Revocable Inter Vivos Trust, the Harold Hamm HJ Trust and the Harold Hamm DST Trust dated March 30, 2006 filed as Exhibit 10.13 to the Company’s Registration Statement on Form S-1 (Commission File No. 333-132257) filed April 14, 2006 and incorporated herein by reference. 10.610.5† Crude oil transportation agreement between Banner Pipeline Company, L.L.C., a wholly owned subsidiary ofFirst Amendment to the Continental Resources, Inc. and Banner Transportation Company dated July 11, 20072005 Long-Term Incentive Plan filed February 24, 201228, 2013 as Exhibit 10.810.2 to the Company’s 20112012 Form 10-K (Commission File No. 001-32886) and incorporated herein by reference.10.6† Continental Resources, Inc. 2013 Long-Term Incentive Plan included as Appendix A to the Company's Definitive Proxy Statement on Schedule 14A (Commission File No. 001-32886) filed April 10, 2013 and incorporated herein by reference. 10.7† SummaryForm of Non-Employee Director Compensation as of March 31, 2011Employee Restricted Stock Award Agreement under the Continental Resources, Inc. 2013 Long-Term Incentive Plan filed as Exhibit 10.2 to the Company’sCompany's Current Report on Form 8-K (Commission File No. 001-32886) filed May 24, 2013 and incorporated herein by reference.10.8† Form of Non-Employee Director Restricted Stock Award Agreement under the Continental Resources, Inc. 2013 Long-Term Incentive Plan filed as Exhibit 10.3 to the Company's Current Report on Form 8-K (Commission File No. 001-32886) filed May 24, 2013 and incorporated herein by reference. 10.9† Continental Resources, Inc. Deferred Compensation Plan filed as Exhibit 10.1 to the Company's Current Report on Form 8-K (Commission File No. 001-32886) filed September 26, 2013 and incorporated herein by reference. 10.10† First Amendment to the Continental Resources, Inc. Deferred Compensation Plan filed as Exhibit 10.1 to the Company's Form 10-Q for the quarter ended March 31, 20112014 (Commission File No. 001-32886) filed May 5, 20118, 2014 and incorporated herein by reference. 10.8 Seventh Amended and Restated10.11 Revolving Credit Agreement dated June 30, 2010as of May 16, 2014 among Continental Resources, Inc., as borrower, Banner Pipeline Company L.L.C. and CLR Asset Holdings, LLC, as guarantors, Union Bank, N.A., as administrative agent, as issuing lender and as swing line lender, and the other lenders party thereto filed as Exhibit 10.1 to the Company’s Current Report on Form 8-K (Commission File No. 001-32886) filed July 7, 2010May 21, 2014 and incorporated herein by reference. 10.9† Employment Agreement between10.12† Second Amendment to the Continental Resources, Inc. Deferred Compensation Plan adopted and Eric S. Eissenstat dated October 14, 2010effective as of May 23, 2014 filed as Exhibit 10.1210.15 to the Company’s 2010Registration Statement on Form 10-KS-4 (Commission File No. 001-32886)333-196944) filed February 25, 2011June 20, 2014 and incorporated herein by reference.10.13† Description of cash bonus plan approved as of March 20, 2015 filed as Exhibit 10.1 to the Company's Form 10-Q for the quarter ended March 31, 2015 (Commission File No. 001-32886) filed May 6, 2015 and incorporated herein by reference. 10.1010.14 Amendment No. 1 dated July 26, 2012May 4, 2015 to the Seventh Amended and RestatedRevolving Credit Agreement dated June 30, 2010,as of May 16, 2014 among Continental Resources, Inc., as borrower, Banner Pipeline Company L.L.C., and CLR Asset Holdings, LLC, as guarantor,guarantors, the lenders party thereto, and MUFG Union Bank, N.A., as administrative agentAdministrative Agent, filed as Exhibit 10.2 to the Company's Form 10-Q for the quarter ended March 31, 2015 (Commission File No. 001-32886) filed May 6, 2015 and issuing lender,incorporated herein by reference.10.15† Summary of Non-Employee Director Compensation Approved as of May 19, 2015 to be effective July 1, 2015 filed as Exhibit 10.2 to the Company's Form 10-Q for the quarter ended June 30, 2015 (Commission File No. 001-32886) filed August 5, 2015 and incorporated herein by reference. 10.16 Term Loan Agreement dated as of November 4, 2015 among Continental Resources, Inc., as borrower, and its subsidiaries Banner Pipeline Company, L.L.C. and CLR Asset Holdings, LLC, as guarantors, and MUFG Union Bank, N.A., as Administrative Agent, Bank of America, N.A., Citibank, N.A., JPMorgan Chase Bank, N.A. and Mizuho Bank, LTD., as Co-Syndication Agents, and Compass Bank, Toronto Dominion (Texas) LLC and U.S. Bank National Association, as Co-Documentation Agents, and the other lenders party thereto filed as Exhibit 10.1 to the Company’s Current Report onCompany's Form 8-K10-Q for the quarter ended September 30, 2015 (Commission File No. 001-32886) filed August 1, 2012November 4, 2015 and incorporated herein by reference.21* Subsidiaries of Continental Resources, Inc. 23.1* Consent of Grant Thornton LLP. 23.2* Consent of Ryder Scott Company, L.P. 31.1* Certification of the Company’s Chief Executive Officer Pursuant to Section 302 of the Sarbanes-Oxley Act of 2002 (15 U.S.C. Section 7241) 31.2* Certification of the Company’s Chief Financial Officer Pursuant to Section 302 of the Sarbanes-Oxley Act of 2002 (15 U.S.C. Section 7241) 32** Certification of the Company’s Chief Executive Officer and Chief Financial Officer Pursuant to Section 906 of the Sarbanes-Oxley Act of 2002 (18 U.S.C. Section 1350) 99* Report of Ryder Scott Company, L.P., Independent Petroleum Engineers and Geologists 101.INS** XBRL Instance Document 101.SCH** XBRL Taxonomy Extension Schema Document 101.CAL** XBRL Taxonomy Extension Calculation Linkbase Document 101.DEF** XBRL Taxonomy Extension Definition Linkbase Document 101.LAB** XBRL Taxonomy Extension Label Linkbase Document 101.PRE** XBRL Taxonomy Extension Presentation Linkbase Document * Filed herewith ** Furnished herewith † Management contracts or compensatory plans or arrangements filed pursuant to Item 601(b)(10)(iii) of Regulation S-K. CONTINENTAL RESOURCES, INC. By: Name: Harold G. Hamm Title: Chairman of the Board and Chief Executive Officer Date: February 27, 201324, 2016 Harold G. Hamm February 27, 201324, 2016Harold G. Hamm John D. Hart February 27, 201324, 2016John D. Hart /s/ DAVID L. BOREN David L. Boren February 27, 201324, 2016/s/ ROBERT J. GRANTRobert J. Grant /s/ WILLIAM B. BERRY Director February 27, 201324, 2016William B. Berry /s/ LON MCCAIN Lon McCain February 27, 201324, 2016Lon McCain /s/ JOHN T. MCNABB II Director February 24, 2016 John T. McNabb II Director February 27, 2013Mark E. Monroe February 27, 201324, 2016/s/ EDWARD T. SCHAFEREdward T. Schafer Director February 27, 2013