
UNITED STATES
SECURITIES AND EXCHANGE COMMISSION
WASHINGTON, D.C. 20549
FORM 10-K
| x | ANNUAL REPORT PURSUANT TO SECTION 13 OR 15(d) OF THE SECURITIES EXCHANGE ACT OF 1934 |
For the Fiscal Year Ended December 31, 20122015
OR
| ¨ | TRANSITION REPORT PURSUANT TO SECTION 13 OR 15(d) OF THE SECURITIES EXCHANGE ACT OF 1934 |
Commission File No. 001-35456
ALLISON TRANSMISSION HOLDINGS, INC.
(Exact Name of Registrant as Specified in Its Charter)
| Delaware | 26-0414014 | |
| (State of Incorporation) | (I.R.S. Employer Identification Number) |

One Allison Way
Indianapolis, IN 46222
(Address of Principal Executive Offices and Zip Code)
(317) 242-5000
(Registrant’s Telephone Number, Including Area Code)
Securities registered pursuant to Section 12(b) of the Act:
Title of each class | Name of each exchange on which registered | |
| Common Stock, $0.01 par value | New York Stock Exchange |
Securities registered pursuant to Section 12(g) of the Act:
None
Indicate by check mark if the registrant is a well-known seasoned issuer, as defined in Rule 405 of the Securities Act. Yes ¨x No x¨
Indicate by check mark if the registrant is not required to file reports pursuant to Section 13 or Section 15(d) of the Act. Yes ¨ No x
Indicate by check mark whether the registrant (1) has filed all reports required to be filed by Section 13 or 15(d) of the Securities Exchange Act of 1934 during the preceding 12 months (or for such shorter period that the registrant was required to file such reports), and (2) has been subject to such filing requirements for the past 90 days. Yes x No ¨
Indicate by check mark whether the registrant has submitted electronically and posted on its corporate Web site, if any, every Interactive Data File required to be submitted and posted pursuant to Rule 405 of Regulation S-T (232.405(§232.405 of this chapter) during the preceding 12 months (or for such shorter period that the registrant was required to submit and post such files). Yes x No ¨
Indicate by check mark if disclosure of delinquent filers pursuant to Item 405 of Regulation S-K is not contained herein, and will not be contained, to the best of registrant’s knowledge, in definitive proxy or information statements incorporated by reference in Part III of this Form 10-K or any amendment to this Form 10-K. ¨
Indicate by check mark whether the registrant is a large accelerated filer, an accelerated filer, a non-accelerated filer, or a smaller reporting company. See definitions of “large accelerated filer,” “accelerated filer,” and “smaller reporting company” in Rule 12b-2 of the Exchange Act.
| Large accelerated filer | Accelerated filer | ¨ | ||||
| Non-accelerated filer | Smaller reporting company | ¨ | ||||
Indicate by check mark whether the registrant is a shell company (as defined in Rule 12b-2 of the Exchange Act). Yes ¨ No x
The aggregate market value of the voting and non-voting stock held by non-affiliates was approximately $531.5$4,599.4 million as of June 29, 2012.30, 2015.
As of February 15, 2013,5, 2016, there were 184,723,754171,138,742 shares of Common Stock and 1,185 shares of Non-voting Common Stock outstanding.
Documents Incorporated by Reference
Portions of the Registrant’s definitive Proxy Statement for its 20132016 annual meeting of stockholders will be incorporated by reference in Part III of this Annual Report on Form 10-K.
Cautionary Note Regarding Forward-Looking Statements
This Annual Report on Form 10-K contains forward-looking statements. The words “believe,” “expect,” “anticipate,” “intend,” “estimate” and other expressions that are predictions of or indicate future events and trends and that do not relate to historical matters identify forward-looking statements. You should not place undue reliance on these forward-looking statements. Although forward-looking statements reflect management’s good faith beliefs, reliance should not be placed on forward-looking statements because they involve known and unknown risks, uncertainties and other factors, which may cause the actual results, performance or achievements to differ materially from anticipated future results, performance or achievements expressed or implied by such forward-looking statements. Forward-looking statements speak only as of the date the statements are made. We undertake no obligation to publicly update or revise any forward-looking statement, whether as a result of new information, future events, changed circumstances or otherwise. These forward-looking statements are subject to numerous risks and uncertainties, including, but not limited to: risks related to our substantial indebtedness; our participation in markets that are competitive; general economic and industry conditions; our ability to prepare for, respond to and successfully achieve our objectives relating to technological and market developments and changing customer needs; the failure of markets outside North America to increase adoption of fully-automatic transmissions; the concentration of our net sales in our top five customers and the loss of any one of these; the discovery of defects in our products, resulting in delays in new model launches, recall campaigns and/or increased warranty costs and reduction in future sales or damage to our brand and reputation; the concentration ofbrand and reputational risks; our net sales inability to prepare for, respond to and successfully achieve our top five customersobjectives relating to technological and the loss of any one of these;market developments and changing customer needs; risks associated with our international operations; brand and reputational risks; our intention to pay dividends; and labor strikes, work stoppages or similar labor disputes, which could significantly disrupt our operations or those of our principal customers.customers; risks related to our substantial indebtedness; and our intention to pay dividends and repurchase shares of our common stock.
Important factors that could cause actual results to differ materially from our expectations are disclosed under Part I, Item 1A, “Risk Factors” in this Annual Report on Form 10-K. All written and oral forward-looking statements attributable to us, or persons acting on our behalf, are expressly qualified in their entirety by the cautionary statements as well as other cautionary statements that are made from time to time in our other Securities and Exchange Commission filings or public communications. You should evaluate all forward-looking statements made in this Annual Report on Form 10-K in the context of these risks and uncertainties.
Certain Trademarks
This Annual Report on Form 10-K includes trademarks, such as Allison Transmission and ReTran, which are protected under applicable intellectual property laws and are our property and/or the property of our subsidiaries. This report also contains trademarks, service marks, copyrights and trade names of other companies, which are the property of their respective owners. We do not intend our use or display of other companies’ trademarks, service marks, copyrights or trade names to imply a relationship with, or endorsement or sponsorship of us by, any other companies. Solely for convenience, our trademarks and tradenamestrade names referred to in this report may appear without the® or ™ symbols, but such references are not intended to indicate, in any way, that we will not assert, to the fullest extent under applicable law, our rights or the right of the applicable licensor to these trademarks and tradenames.trade names.
Overview
Allison Transmission Holdings, Inc. and its subsidiaries (“Allison,” the “Company” or “we”) design and manufacture commercial and militarydefense fully-automatic transmissions.
The business was founded in 1915 and has been headquartered in Indianapolis, Indiana since inception. Allison was an operating unit of General Motors Corporation (“Old GM”) from 1929 until 2007, when Allison once again became a stand-alone company. In March 2012, Allison began trading on the New York Stock Exchange under the symbol, “ALSN”.
We have approximately 2,8002,700 employees and 1213 different transmission product lines. Although approximately 78% percent81% of revenues arewere generated in North America in 2015, we have a global presence by serving customers in Europe, Asia, South America and Africa. We serve customers through an independent network of approximately 1,400 independent distributor and dealer locations worldwide.
History
We were formerly known as Allison Transmission (the “Predecessor”), an operating unit of General Motors Corporation, which, in the course of its bankruptcy proceeding was renamed Motors Liquidation Company (“Old GM”). On August 7, 2007, substantially all of the assets and liabilities of the Predecessor were acquired by us, under an Asset Purchase Agreement (the “Asset Purchase Agreement”) dated June 28, 2007 and entered into between Clutch Operating Company, Inc., a Delaware corporation owned by investment funds affiliated with The Carlyle Group (“Carlyle”) and Onex Corporation (“Onex” and together with Carlyle, the “Sponsors”), and Old GM, the direct parent of the Predecessor, pursuant to which we acquired certain equity interests of, and certain assets and liabilities held by, direct and indirect operating subsidiaries of Old GM (the “Acquisition Transaction”). After completion of the Acquisition Transaction, Clutch Holdings, Inc., changed its name to Allison Transmission Holdings, Inc. and Clutch Operating Company, Inc. changed its name to Allison Transmission, Inc. (“ATI”).
On July 10, 2009, General Motors Company (“GM”) emerged from bankruptcy. On August 3, 2009, we finalized an agreement with GM (the “Cure Agreement”) pursuant to which GM assumed certain contracts and agreements between us and Old GM, including among others, the Asset Purchase Agreement, certain intellectual property and software license agreements, lease agreements, engineering services agreements, proving grounds use agreements, an employee matters agreement, a contract manufacturing agreement and a hybrid co-branding agreement. GM also assumed certain other commercial contracts, arrangements and purchase orders with us in connection with conducting its business.
Our Business
We are the world’s largest manufacturer of fully-automatic transmissions for medium- and heavy-duty commercial vehicles and medium- and heavy-tactical U.S. military vehicles and hybrid-propulsion systems for transit buses.defense vehicles. Allison transmissions are used in a wide variety of applications, including on-highway trucks (distribution, refuse, construction, fire and emergency), buses (primarily school, transit and transit)hybrid-transit), motorhomes, off-highway vehicles and equipment (primarily energy, mining and mining)construction) and militarydefense vehicles (wheeled and tracked). We estimate that globally, in 2012,2015, we sold approximately 62%63% of all fully-automatic transmissions for medium- and heavy-duty on-highway commercial vehicle applications, and we believe we are well-positioned to capitalize on attractive growth opportunities.applications. We believe the Allison brand is one of the most recognized in our industry as a result of the performance, reliability and fuel efficiency of our transmissions and is associated with high quality, durability, vocational value, technological leadership and superior customer service. We believe our brand helps us maintain our leading market position and price our products commensurate with the value provided to the end user.
We introduced the world’s first fully-automatic transmission for commercial vehicles over 60 years ago. Since that time, we have driven the trend in North America and Western Europe towards increasing automaticity by targeting a diverse range of commercial vehicle vocations. As compared to manual transmissions and automated manual transmissions (“AMTs”), we believe the superior performance attributes of our fully-automatic transmissions in vocations with a high degree of “start and stop” activity, as well as in urban environments, include lower maintenance costs, reduced vehicle downtime, ease of operation, increased safety and improved driver and passenger comfort. We believe our transmissions offer increased fuel efficiency and faster acceleration, resulting in lower operating costs and increased productivity when they are used in vehicles with duty cycles that require a high degree of “start and stop” activity. As a result of these attributes, our fully-automatic transmissions are the standard or exclusive transmission offered in the powertrain configuration of certain types of vehicles in North America, including school buses, fire and emergency vehicles, medium- and heavy-tactical U.S. military vehicles and certain mining trucks. In applications where our transmission is offered as an alternative to a manual transmission or an AMT, such as distribution and refuse trucks, we believe end users frequently specify an “Allison” transmission when ordering a commercial vehicle, which can create pull-through demand for our products to our original equipment manufacturer (“OEM”) customers. Our transmissions are also commonly used in various oil and natural gas drilling and extraction equipment where we believe our products’ performance, reliability, equipment uptime and ease of operation are critical to end users.
Allison transmissions are optimized for the unique performance requirements of end users, which typically vary by vocation. Our products are highly engineered, requiring advanced manufacturing processes, and employ complex software algorithms for our transmission controls to maximize end user performance. We have developed over 100 different models that are used in more than 2,500 different vehicle configurations and are compatible with more than 500 combinations of engine brands, models and ratings (including diesel, gasoline, natural gas and other alternative fuels). In 2012, over 8,000Additionally, we have created thousands of unique Allison-developed calibrations wereavailable to be used with our transmission control modules. We believe our scale, experience and culture of innovation reinforce our leading market position and provide us with a competitive advantage.
Based on our market leadership, history of innovation, brand recognition and global presence, we believe we are well-positioned to capitalize on attractive growth opportunities globally. Our core North American on-highway market, which we define as Class 4-7 trucks, Class 8 straight trucks, buses (school, conventional transit, shuttle and coach) and motorhomes, is poised for continued recovery. According to America’s Commercial Transportation (“ACT”) Research, on-highway commercial vehicle production in North America (excluding transit and coach bus, and motorhome) is anticipated to experience a CAGR of 7% from 2012 to 2015, representing increases of 3%, 14% and 4% from 2012 to 2013, 2013 to 2014 and 2014 to 2015, respectively, although we cannot give assurance that such growth rates will materialize. In addition, we believe markets outside North America represent a major growth opportunity for us, as we estimate less than 5% of the medium- and heavy-duty commercial vehicles sold outside North America in 2012 were equipped with fully-automatic transmissions, as compared to 74% in our core North American market as defined above. We intend to drive the rate of adoption of fully-automatic transmissions in commercial vehicles globally by pursuing the same vocational strategy we employ in North America, though we cannot provide assurances that our business strategies will be successful or that fully-automatic transmissions will be increasingly adopted outside North America. Our anticipated growth outside of North America will be facilitated by our established international operations and customer relationships. For example, we are the leading provider of fully-automatic transmissions for medium- and heavy-duty commercial vehicles in China with a substantial installed base of over 45,000 Allison transmissions. In addition, in response to the evolving global focus on fuel consumption, we are developing new products to improve fuel efficiency without compromising performance.
Our Industry
Commercial vehicles typically employ one of three transmission types: manual, AMTautomated manual transmissions (“AMT”) or fully-automatic. Manual transmissions are the most prevalent transmission type used in Class 8 tractors in North America and in medium- and heavy-duty commercial vehicles, generally, outside North America. Manual transmissions utilize a disconnect clutch causing power to be interrupted during each gear shift resulting in energy loss-related inefficiencies and less work being accomplished for a given amount of fuel consumed. In long-distance trucking, this power interruption is not a significant factor, as the manual transmission provides its highest degree of fuel economy during steady-state cruising. However, steady-state cruising is only one part of the duty cycle. When the duty cycle requires a high degree of “start and stop” activity or speed transients, as is common in many vocations as well as in urban environments, we believe manual transmissions result in reduced performance, lower fuel efficiency, lower average speed for a given amount of fuel consumed and inferior ride quality. Moreover, the clutches must be replaced regularly, resulting in increased maintenance expense and vehicle downtime. Manual transmissions also require a skilled driver to operate the disconnect clutch when launching the vehicle and shifting gears. AMTs are manual transmissions that feature automated operation of the disconnect clutch. Fully-automatic transmissions utilize technology that smoothly shifts gears instead of a disconnect clutch, thereby delivering uninterrupted power to the wheels during gear shifts and requiring minimal driver input. These transmissions deliver superior acceleration, higher productivity, increased fuel efficiency, reduced operating costs, less driveline shock and smoother shifting relative to both manual transmissions and AMTs in vocations with a high degree of “start and stop” activity, as well as in urban environments.
Fuel efficiency, reduction in fuel consumption and greenhouse gas emissions are important considerations for commercial vehicles everywhere and they tend to go together. We believe fuel efficiency, the measure of work performed for a given amount of fuel consumed, is the best method to assess fuel consumption of commercial vehicles as compared to the more commonly-used fuel economy metric of miles-per-gallon (“MPG”). MPG is inadequate for commercial vehicles because it does not encompass two key elements of efficiency that we believe are important to vehicle owners and operators: payload and transport time. For example, if more work can be completed or more payload hauled using the same amount of fuel and/or over a shorter period of time, then we believe the vehicle is more fuel efficient. Since fuel economy and its MPG metric only accounts for distance traveled and fuel consumed, ignoring time and work performed, it is therefore an inferior metric to fuel efficiency when it comes to assessing commercial vehicles. Markets, regulations, policies and technology continue to evaluate these topics.
Our Served Markets
We sell our transmissions globally for use in medium- and heavy-duty on-highway commercial vehicles, (with limited exposure to the Class 8 tractor market), off-highway vehicles and equipment and militarydefense vehicles. In addition to the sale of transmissions, we also sell branded replacement parts, support equipment and other products necessary to service the installed base of vehicles utilizing our transmissions. The following table provides a summary of our business by end market, for the fiscal year ended December 31, 2012.2015.
| NORTH AMERICA | OUTSIDE NORTH AMERICA | SERVICE PARTS, SUPPORT | ||||||||||||
| END MARKET | ON-HIGHWAY | HYBRID BUS | OFF-HIGHWAY | ON-HIGHWAY | OFF-HIGHWAY | MILITARY | EQUIPMENT & OTHER | |||||||
2012 NET SALES (IN MILLIONS) | $813 | $115 | $157 | $290 | $114 | $305 | $348 | |||||||
%OFTOTAL | 38% | 6% | 7% | 14% | 5% | 14% | 16% | |||||||
MARKET POSITION | • #1 supplier of fully-automatic transmissions | • #1 supplier | • A leading independent supplier | • #1 supplier • Established presence in | • A leading independent supplier | • #1 supplier of | • Approximately 1,400 dealers and distributors worldwide | |||||||
VOCATIONSOR END USE | • Distribution • Emergency • Refuse • Construction • Utility • School, • Motorhome | • Hybrid • Hybrid shuttle | • Energy • Mining • Construction • Specialty | • Distribution • Emergency • Refuse • Construction • Utility • Transit, shuttle and coach buses | • Energy • Mining • Construction • Specialty | • Medium- • Tracked combat platforms | • Parts • Support equipment • Remanufactured transmissions • Fluids | |||||||
| NORTH AMERICA | OUTSIDE NORTH AMERICA | DEFENSE | SERVICE | |||||||||||||
| END MARKET | ON- HIGHWAY | HYBRID BUS | OFF- HIGHWAY | ON- HIGHWAY | OFF- HIGHWAY | PARTS, OTHER | ||||||||||
2015 NET SALES (IN MILLIONS) | $1,059 | $73 | $55 | $262 | $35 | $113 | $389 | |||||||||
% OF TOTAL | 53% | 4% | 3% | 13% | 2% | 6% | 19% | |||||||||
| MARKET POSITION | • #1 supplier of fully-automatic transmissions | • A leading supplier of hybrid-propulsion systems | • A leading independent supplier | • #1 supplier of fully-automatic transmissions in China and India
• Established presence in Western Europe | • A leading independent supplier | • #1 supplier of transmissions for the U.S. Department of Defense | • Approximately 1,400 dealers and distributors worldwide | |||||||||
| VOCATIONS OR END USE | • Distribution
• Emergency
• Refuse
• Construction
• Utility
• School, transit, shuttle and coach buses
• Motorhome
• Metro tractors | • Hybrid transit bus
• Hybrid shuttle bus | • Energy
• Mining
• Construction
• Specialty vehicle | • Distribution
• Emergency
• Refuse
• Construction
• Utility
• Transit, shuttle and coach buses | • Energy
• Mining
• Construction
• Specialty vehicle | • Medium- and heavy-tactical wheeled platforms
• Tracked combat platforms | • Parts
• Support equipment
• Remanufactured transmissions
• Fluids | |||||||||
For the years ended December 31, 2012, 2011Refer to NOTE 18, “Concentration of Risk” and 2010,NOTE 22, “Geographic Information” in Part II, Item 8, of this Annual Report on Form 10-K for additional information on our top five OEMsignificant original equipment manufacturer (“OEM”) customers accounted for approximately 45%, 38% and 41% of our net sales respectively. Our top three OEM customers, Daimler, Navistar and Oshkosh, accounted for approximately 13%, 11% and 11%, respectively, of our net sales in 2012.by geographical areas.
North America
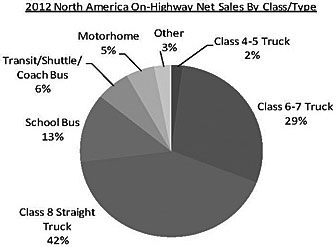
On-Highway.We are the largest manufacturer of fully-automatic transmissions for the on-highway medium- and heavy-duty commercial vehicle market in North America. Our core markets are those in which the value proposition ofThe following is a fully-automatic transmission to end users is highest, typically where the vehicle is operated with a high degree of “start and stop” activity. We believe end user preferences for superior acceleration, higher productivity, increased fuel efficiency, reduced operating costs, less driveline shock and smoother shifting relative to both manual transmissions and AMTs results in a willingness to pay a meaningful premium for the attributessummary of our fully-automatic transmissions. Overall, we believe the demand for on-highway fully-automatic transmissions in our core markets is increasingnet sales by vehicle class in North America.
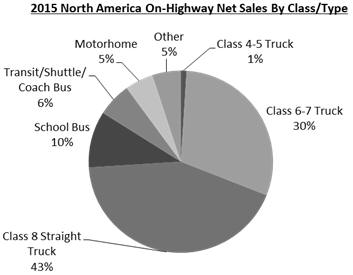
Our core North American on-highway market includes Class 4-5, Class 6-7 and Class 8 straight trucks, conventional transit, shuttle and coach buses, school buses and motorhomes. Class 8 trucks are subdivided into two markets: straight and tractor. Class 8 straight trucks are those with a unified body (e.g., refuse, construction, and dump trucks), while tractors have a vehicle chassis that is separable from the trailer they haul.pull. We have been supplying transmissions for Class 8 straight trucks for decades, and it is a core end market for us. Today, we have very limited exposure to the Class 8 tractor market because lower priced manual transmissions generally meet the needs of these vehicles which are primarily used in long distance hauling. However, we have identified a portion of the Class 8 tractor market that we call metro tractors that are used primarily in urban environments more than 60%the majority of the time. We are developingtime and developed a new fully-automatic transmission (the “TC10”) that meets the unique duty cycle requirements of the Class 8 metro tractor marketmarket. Combining the startability and believe this representscontinuous, uninterrupted power qualities of a significant long term growth opportunity.fully-automatic transmission with the cruising aspects of a manual transmission, the TC10 offers an alternative to traditional manual and automated manual transmissions in tractor applications.
We sell substantially all of our transmissions in the North American on-highway market to OEMs, including Blue Bird, Daimler, Hino, Navistar, PACCAR, Spartan Motors, Volvo and many others.OEMs. These OEMs, in turn, install our transmissions in vehicles in which our transmission is either the exclusive transmission available or is specifically requested by end users who are choosing between a manual transmission, an AMT or a fully-automatic transmission. In 2015, OEM customers representing approximatelyover 90% of our 2012 North American on-highway unit volume participateparticipated in long-term supply agreements (“LTSA”) with us. Generally, these supply agreements offer the OEM customer defined levels of mutual commitment with respect to growing Allison’s presence in the OEMs’ products and promotional efforts, pricing and sharing of commodity cost risk. The typical length of our customer agreements is typically between three and five years. We often compete in this market against independent manufacturers of manual transmissions, AMTs, fully-automatic transmissions manufactured by Ford Motor Company (“Ford”), ZF Friedrichshafen AG (“ZF”) and AMTs,Voith GmbH (“Voith”), and to a lesser extent, against OEMs in certain weight classes that use their own internally manufactured transmissions in certain vehicles. For example, Ford Motor Company (“Ford”) offers its own fully-automatic transmission in its Class 4-5 vehicles in North America, though we supply Ford with our fully-automatic transmissions for their Class 6-7 diesel-powered trucks.
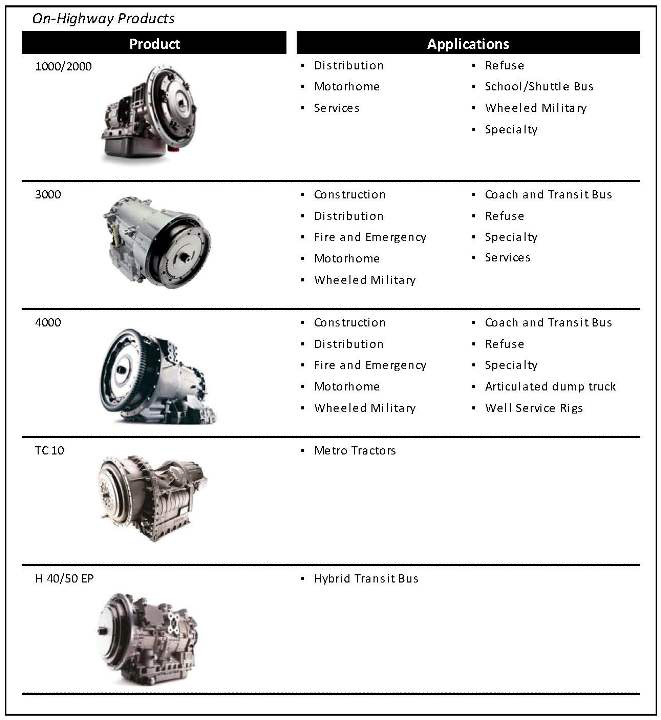
On-Highway
The following istable presents a summary of our on-highway net salescompetitive position by vehicle class in the North America.America on-highway end market.
Class 4-5 Trucks. Class 4-5 trucks are generally used in urban applications, including distribution, commercial lease and rental, as well as ambulance. The primary demand drivers impacting the purchase of these trucks are economic factors, such as gross domestic product growth, industrial activity and fuel costs, as well as government spending.
The largest Class 4-5 truck OEM is Ford, which offers its own transmission in these vehicles. Until 2009, Ford and GM were the largest OEMs in this end market with a combined market share of 88% in 2008, but GM exited the medium-duty truck market after emerging from bankruptcy. Since Ford uses its own fully-automatic transmission in this vehicle class, GM’s departure from this market resulted in a decline in our sales of fully-automatic transmissions for use in the Class 4-5 truck market, which we had served almost exclusively through GM. To partially offset the loss of GM’s presence in this market, we are the exclusive transmission supplier to the Navistar Class 4-5 TerraStar truck specifically targeted at this end market. We also intend to pursue business with other OEMs, should they choose to participate in this end market.
CLASS 4-5 TRUCKS | CLASS 6-7 TRUCKS | CLASS 8 STRAIGHT TRUCKS | SCHOOL BUSES | MOTORHOMES | ||||||
| 2015 SHARE | 5% | 77% | 61% | 98% | 40% | |||||
| PRIMARY COMPETITION | • Ford | • Manual Transmissions • AMTs • Ford | • Manual Transmissions • AMTs | • Ford | • Ford |
Class 6-7 Trucks. Class 6-7 trucks are generally used in urban applications, including larger distribution, commercial lease and rental, ambulance, rescue and fire trucks. While demand drivers for the Class 6-7 truck end market are generally similar to those of the Class 4-5 truck end market, economic and pre-buy volatility are higher in these classes. The largest OEMs in this end market are Navistar, Daimler, Ford, Hino and PACCAR. Our overall penetration of the Class 6-7 truck transmission end market was approximately 67% in 2012, and we supply virtually all of the fully-automatic transmissions sold in this end market. In this market, we compete primarily with manual transmissions and AMTs manufactured by Eaton Corp. (“Eaton”).
Class 8 Straight Trucks. The most common vocations that utilize straight trucks are refuse, construction, fire and emergency. Primary drivers of Class 8 straight truck demand are general economic conditions and federal, state and municipal spending, which affect the purchases of many fire and emergency trucks, refuse vehicles and construction vehicles, and the purchases of other private refuse fleet operators. The largest Class 8 straight truck OEMs are Navistar, Daimler, PACCAR and Volvo. In 2012, our overall penetration of the Class 8 straight truck transmission end market was approximately 50%, and we supply virtually all of the fully-automatic transmissions sold in this end market. In this market, we compete primarily with manual transmissions and AMTs manufactured by Eaton.
Buses. School buses have historically comprised approximately 75% of the North American bus market by volume. While school buses vary in weight and engine size, the majority of our transmissions are used in Class 6-7 buses. The primary demand driver for school bus purchases is municipal spending, specifically school district budgets and the capital expenditure plans of private fleet operators. School bus demand is also affected by the number of school-age children, which is driven by birth rates and immigration. The demand in this end market has generally been stable, although it does experience declines during economic downturns as municipalities defer purchases. The largest school bus OEMs are Navistar, Daimler and Blue Bird. We supply our transmissions for virtually all of the school buses produced in North America and currently face limited competition from other suppliers to this end market. The bus market also encompasses non-hybrid transit and conventional coach and shuttle buses. We have the leading market share in the non-hybrid transit bus market, where we primarily compete against Voith GmbH (“Voith”) and ZF Friedrichshafen AG (“ZF”).
Motorhomes. We sell our transmissions for use primarily in larger motorhomes (Type A). Substantially all of the Type A motorhomes used fully-automatic transmissions in this market in 2012. The motorhome market was severely impacted by the recent economic downturn with volumes declining approximately 60% from 2007 to 2012. We expect motorhome demand will benefit from improving economic conditions, increased availability of credit and favorable demographic trends such as the aging of “baby boomers.” We typically sell to the chassis manufacturers, such as Navistar and Daimler, that supply body manufacturers, such as Thor Industries, Winnebago Industries and Fleetwood RV. We had approximately a 52% share of the fully-automatic transmissions used in Type A diesel and gasoline powered motorhomes and substantially all of the share of the fully-automatic transmissions sold in Type A diesel powered motorhomes. In this market, we compete primarily with Ford, who uses its own internally-produced transmission in the lighter-duty motorhomes.
Hybrid Transit BusesBuses.
The global interest in conserving fuel and reducing greenhouse gas emissions is driving demand for more fuel efficient commercial vehicles. As of December 31, 2012, we have delivered over 5,000 H 40/50 EP hybrid-propulsion transit bus systems globally to 246 cities in 14 countries, making us the world’s largest supplier of hybrid-propulsion transit bus systems. In North America, we sold approximately 80%60% of all units for the hybrid transit bus market in 2012.2015. Our customers in this North American end market are typically city, state and federal governmental entities, which utilize government funds to subsidize a portion of the purchase price for the transit buses containing our hybrid-propulsion system. In this market, we compete primarily with BAE Systems plc (“BAE”).
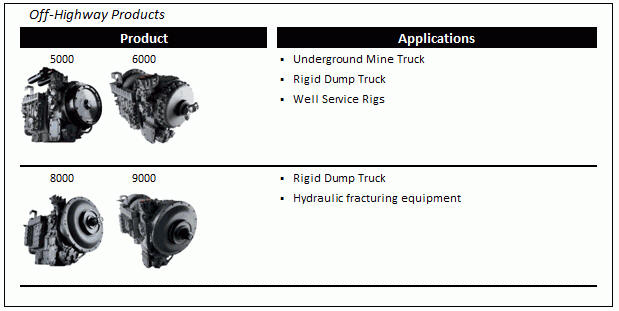
Off-HighwayOff-Highway.
We have provided products used in vehicles and equipment that serve energy, mining and construction applications in North America for over 50 years.
Off-highway energy applications include hydraulic fracturing equipment, well-stimulation equipment, pumping equipment, and well-servicing rigs, which often use a fully-automatic transmission to propel the vehicle and drive auxiliary equipment. We maintain a leadership position in this end market, with nearly all producers of well stimulationwell-stimulation and well servicingwell-servicing equipment utilizing our heavy-dutyheavy duty off-highway transmissions. Customers include Halliburton Company, Baker Hughes, Weatherford International, National Oilwell Varco, and Key Energy Services. Traditional and new methodsAdditionally, we sell kits that can increase the horsepower of drilling and extracting oil and natural gas from shale formations utilize highly engineered heavy-duty fully-automatic transmissions.our existing off-highway products. Competition in both the well stimulation and well servicing markets comes primarily fromincludes Caterpillar, Inc. (“Caterpillar”) and Twin Disc.Disc, Inc. (“Twin Disc”).
We also provide heavy-duty transmissions used in mining trucks, specialty vehicles and construction vehicles. Mining applications include trucks used to haul various commodities and other products, including rigid dump trucks, underground trucks and long-haul tractor trailer trucks with load capacities between 40 to 110 tons. Our major competitors in this end market are Caterpillar and Komatsu, Ltd. (“Komatsu”), both of which are vertically integrated and manufacture fully-automatic transmissions for their own vehicles. Specialty vehicles using our heavy-duty transmissions include airport rescue and firefighting vehicles and heavy-equipment transporters. Our major competitor in this end market is Twin Disc. Construction applications include articulated dump trucks with Caterpillar, Volvo and ZF as competitors.
Outside North America
Outside North America we serve several different markets, including: Europe, Middle East, Africa (“EMEA”), Asia-Pacific, South America and India.
On-Highway.We are the largest manufacturer of fully-automatic transmissions for the commercial vehicle market outside of North America. The following is a summary of our net sales by region outside of North America.
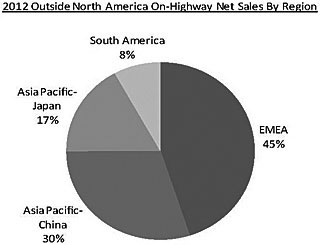 |  |
While the use of fully-automatic transmissions in the medium- and heavy-duty commercial vehicle market has been widely accepted in North America, the markets outside North America continue to be dominated by manual transmissions. In 2012,2015, fully-automatic transmission-equipped medium- and heavy-duty commercial vehicles represented less than 5% of the vehicles in markets outside North America and are concentrated in certain vocational end markets. In other global regions, we believe we have attractive opportunities for expansion for our fully-automatic transmissions as end users increasingly recognize the benefits that result from the useThe following is a summary of our products. However, we cannot assure you that such growth will materialize in anyon-highway net sales by region outside of these emerging markets.North America.
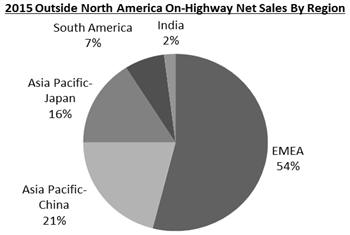
Europe, Middle East, Africa. AfricaThe Europe, Middle East, Africa region (“EMEA”),. EMEA is composed of several different markets, each of which differs significantly from our core North American market by the degree of market maturity, sophistication and acceptance of fully-automatic transmission technology.
Within Europe, we serve Western European developed markets, as well as Russian and Eastern European emerging markets, principally in the refuse, emergency, bus, coach, distribution and utility markets. Our key on-highway customersCompetition in these markets are Daimler, Iveco, Scania, and Volvo. Fully-automatic transmission technology has approximately a 6% market share in European truck applications. We lead this end market with approximately a 66% share of the fully-automatic transmissions sold in 2012. Transit bus transmission sales are more evenly divided between manual and fully-automatic transmissions. However, we face strong competition from European-based bus-focused competitors in this market such as ZF and Voith.Western Europe is most notably characterized by a high level of vertical powertrain integration with OEMs such as Daimler, Scania and Volvo often utilizing their own manual transmissions and AMTs in their vehicles. These OEMs have not generally elected to manufacture fully-automatic commercial vehicle transmissions. We believe they have not done so due to the large initial investment required that would be amortized over a limited number of medium and heavy-duty commercial vehicles utilizing fully-automatic transmissions in their European market. The Middle East and Africa regions are generally characterized by very limited local vehicle production, with imports from the U.S., South America, Turkey, China, India and Europe accounting for the majority of vehicles.
AlthoughAsia-Pacific. Our key Asia-Pacific markets include China, Japan, Australia, and South Korea; however, we have low market penetration today, we supplyactively participate in several other important Asia-Pacific countries including Taiwan, Indonesia, Malaysia and Thailand, which are primarily importers of commercial vehicles. Within Asia-Pacific, our sales efforts are principally focused on the transit bus and vocational truck markets. Currently, manual transmissions to all major European OEMs. We have targeted specific vocationsare the predominant transmissions used in commercial vehicles in the Asia-Pacific region.
South America. The South American region is characterized by a high level of OEM integration, with captive manual transmission and AMT manufacturing. Currently, manual transmissions are the predominant transmissions used in commercial vehicles in South America.
India. Currently, manual transmissions are the predominant transmission used in commercial vehicles in India.
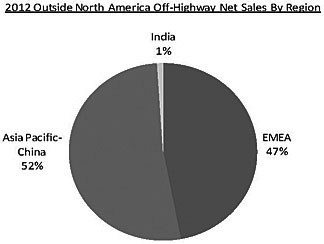
Off-Highway.The following is a summary of our off-highway net sales by region outside of North America.
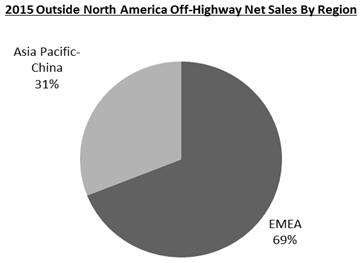
Europe, Middle East, Africa.Our off-highway markets in EMEA that we believe benefit from our value proposition. For example, we are the exclusive transmission in refuse chassis with Daimler, Dennis Eaglemining and Renault SA. We also supply mining OEMs such as Atlas Copco UK, Perlini Equipment, Sandvik AB and Terex.construction. Our major off-highway competitors are Caterpillar and Komatsu, both of which are vertically integrated manufacturers of off-highway mining vehicles, including the specific fully-automatic transmission used in their mining trucks. Construction applications includeA typical construction application is the articulated dump truckstruck, with competition from Caterpillar, Volvo and ZF as competitors.transmissions.
Asia-Pacific. Asia-PacificCurrently, manual transmissions. Off-highway markets in Asia are the predominant transmissions used in commercial vehicles in the Asia-Pacific region. We believe we are well-positioned to capitalize on the relatively low penetration rate of automatic transmissions because of our transmissions’ established reputation for performance and durability, as well as our distributor and dealer network presence in most of the key Asia-Pacific markets.
In China, our largest growth market, we are the leading provider of fully-automatic commercial vehicle transmissions with a substantial installed base of over 45,000 Allison transmissions, including 30,000 units in transit buses, operatedshared by 90 different bus fleets in 55 cities as of December 31, 2012. Our success in penetrating the domestic commercial vehicle OEMs combined with the value of our fully-automatic transmissions have generated a significant growth opportunity for us as Chinese OEMs have begun to export products. For example, we have grown significantly in commercial vehicles used to transport cargo at shipping ports (dock spotters) in China, increasing our share from essentially 0% in 2004 to virtually 100% today. In targeted vocations such as fire and emergency, construction and specialty vehicles (e.g. crane carriers), we have increased the number of vehicle configurations in which our transmissions are available from 17 in 2008 to 92 in 2012. Specifically, we increased our availability in heavy duty mining and construction dump trucks by 21 vehicle configurations and our transmissions are now offered by all major Chinese OEMs serving this market. In 2010, we obtained the first exclusive fully-automatic transmission vehicle configuration in a Chinese fire truck that is being promoted by China FAW Group Corporation and Allison. Our off-highway transmissions are also used in China for energy, mining and construction by OEM customers including 4th Petroleum and Yantai Jereh Oilfield Services Group Co. in energy applications and Qinhuangdao Tolian Speciality Transporter Co., Sany Group Co. and North Hauler in mining and construction applications.
In addition to China, we actively participate in several other important Asia-Pacific countries. Currently, Taiwan, Indonesia, Malaysia and Thailand are primarily importers of commercial vehicles, with limited domestic manufacturing capabilities. Australia and South Korea have a few OEMs with domestic production capabilities for which we are a supplier, including Iveco, Hyundai Motor Company and Daewoo International Corporation. The distribution of our fully-automatic transmissions throughout the broader Asia-Pacific region helps to develop end user relationships and represents an attractive growth opportunity.
The Japanese market for commercial vehicles is unique due to the country’s compact size and its transportation congestion constraints. This generally encourages the use of smaller engines and commensurately lighter-duty commercial vehicles than those used in North America. Sales of fully-automatic transmissions for use in the domestic Japanese commercial vehicle market are expected to grow over the long-term as a result of the declining number of drivers in the active workforce who are trained to operate manual transmissions. Historically, the Japanese commercial vehicle fully-automatic transmission market has been served by local suppliers such as Aisin Seiki Co., Ltd. (“Aisin”), who supplies its products predominantly for vehicles in the Class 4-5 equivalent and lighter weight categories. We have built relationships with domestic Japanese vehicle OEMs, including Hino, Isuzu, Mitsubishi Fuso Truck and Bus Corporation (“Mitsubishi”) and Nissan Diesel (“Nissan”), and we are working to expand our commercial vehicle releases in the Japanese market. Opportunities for vehicles exported to Australia, Thailand and Indonesia, which are produced by Japanese OEMs, are improving with the Australia refuse, construction and distribution markets representing the most significant near-term potential.
Competition in the Asia-Pacific region includes fully-automatic transmissions from Aisin and JATCO for lighter-duty trucks, ZF and Voith for buses, as well as Shaanxi Fast Gear Co., Ltd. (“Fast Gear”) for heavy-duty trucks. We also face competition from the captive OEM production of manual transmissions and AMTs from companies such as Mitsubishi, Hino, Isuzu and Nissan. Fast Gear has a leading market share of the manual transmissions sold for use in the Chinese truck market, while Qijiang is the leading Chinese tour-coach manual transmission supplier. Both Fast Gear and Qijiang are seeing their market shares erode as the heavy-duty commercial truck OEMs, such as Sinotruk, manufacture both engines and manual transmissions. In the off-highway market our Our primary competitors are Caterpillar, and Danyang Winstar Auto Parts Co. and Twin Disc in energy applications, and vertically integrated OEMs Caterpillar and Komatsu in mining applications. Off-highway construction applications include articulated dump trucks withand Caterpillar, Volvo and ZF as competitors.
India. Currently, manual transmissions are the predominant transmissions used in commercial vehicles in India. Since 2007, we have had an established foothold in the India on-highway market, beginning with the low-floor transit bus. We have been successful in obtaining releases and generating sales in support of the desire of the Indian government to upgrade its public transportation infrastructure. Currently, Allison transmissions are operating in over 21 major cities across India.
In order for us to take a more direct and proactive role in the Indian market, we opened a regional office and customization center in 2009 and a manufacturing facility in 2010 to produce components for our 3000 and 4000 products assembled in Hungary. In 2012, we added assembly operations for our 1000 and 2000 products in the India facility. We have also launched vehicle release programs with Indian OEMs in the truck, bus, military and off-highway markets.
India’s commercial vehicle industry is dominated by manual transmissions. We believe our opportunity for growth is strong, especially as the various Indian vocational end markets seek to upgrade and modernize their equipment to global specifications. Competition primarily comes from the locally produced manual transmissions, as well as from ZF and Voith, which compete with us predominantly in the bus market with their fully-automatic transmissions. Allison is or is expected to be offered as an option by Indian bus and truck OEMs such as Tata, Ashok Leyland, JCBL, Asia Motor Works and BEML, and we expect to continue to increase our penetration in this region. India is also characterized by some OEMs with vertical powertrain integration often utilizing their own manual transmissions and AMTs in their vehicles.
South America. Currently, manual transmissions are the predominant transmissions used in commercial vehicles in South America. We have a long history in South America, dating back to our initial entry into Brazil in 1975, and we continue to maintain a presence supporting OEMs such as Daimler, MAN, Agrale S.A., Encava C.A., Scania, Iveco, Randon Veículos, Technología Avanzada en Transporte S.A. and Ford. During the last several years, the vast majority of the net sales of our products in the region were for use in buses, while on-highway and off-highway trucks accounted for a small portion of our net sales. Off-highway vehicles and equipment represent a growth opportunity due to heavy mining activity in Chile, Brazil, Colombia and Peru. We are growing our truck release base and the off-highway energy market is emerging. The South American region is characterized by a high level of OEM integration, with captive manual transmission and AMT manufacturing by OEMs such as Scania, MAN and Daimler.
MilitaryDefense
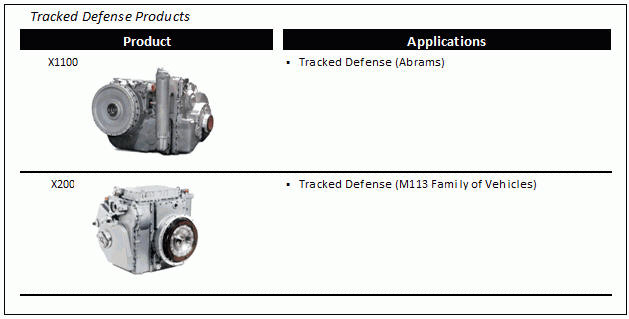
We have a long-standing relationship with the U.S. military,Department of Defense (“DOD”), dating back to 1946, when we began developing our first-generation tank transmission. Today, we sell substantially all of the transmissions for medium- and heavy-tactical wheeled vehicle platforms including the Family of Medium Tactical Vehicles, Armored Security Vehicles, Heavy Expanded Mobility Tactical Trucks, Heavy Equipment Transporters, Palletized Loading Systems, M915 Series Trucks, Medium Tactical Vehicle Replacements and the Logistic Vehicle System Replacement. Additionally, we supplied transmissions for the majority of Mine-Resistant Ambush Protected (“MRAP”) Vehicles and the MRAP All TerrainAll-Terrain Vehicle and for all three potential manufacturers of the Joint Light Tactical Vehicles.Vehicles, which is the replacement vehicle for Humvee personnel transport. Transmissions for our wheeled vehicle platforms are typically sold to OEMs, including BAE, Daimler, General Dynamics Land Systems, Oshkosh, Navistar and Textron Marine & Land Systems.OEMs.
We are also the supplier on two of the three key tracked vehicle platforms, the Abrams tank and the M113 family of vehicles, which are sold directly to the U.S. military.DOD. Additionally, we sell parts kits to licensees for the production of transmissions for tracked vehicles manufactured outside North America. We have been selected as the transmission supplier for one of the prime contractors bidding for the new U.S. Army ground combat vehicle. Overall, we have seen the demand for U.S. militarydefense vehicles decrease as the funding for militarydefense vehicles declines. Additionally, U.S. Department of Defense (“DOD”)the DOD budgets and supplemental spending have allowed the militarythem to recapitalize and reset many vehicle systems, which has reduced the average age of the fleet and the need to procure new vehicles.
Globally, we face competition for the supply of our transmissions in tracked militarydefense vehicles primarily from Renk AG, L-3 Communications Corporation, Renk AG and ZF. Additionally, we face limited competition from Caterpillar in certain U.S. militarydefense wheeled vehicle platforms.
Service Parts, Support Equipment and Other (Aftermarket)
AftermarketThe aftermarket provides us with a relatively stable source of revenues as the installed base of vehicles and equipment utilizing our transmissions continues to grow. The need for replacement parts is driven by normal vehicle and equipment maintenance requirements and is not significantly impacted by economic cycles. Uninterrupted operation is generally critical for end users’ profitability. End users focus on getting the vehicle back in service, which in some cases results in the aftermarket purchase decision being less price-sensitive.
The sale of Allison-branded parts and fluids, remanufactured transmissions and support equipment is fundamental to our brand promise. We have assembled a worldwide network of approximately 1,400 independent distributor and dealer locations to sell, service and support our transmissions. As part of our brand strategy, our independent distributors and dealers are required to sell genuine Allison-branded parts. Within the aftermarket, we offer remanufactured transmissions under our ReTran brand, which provides a cost-effective alternative for transmission repairs and replacements. We also provide support equipment to our OEMs to assist in installing new Allison transmissions into vehicles, and, therefore, sales of support equipment are dependent upon sales of new transmissions.
Over the last few years, our growth in traditional aftermarket sales hashave been tempered by improvements in product quality and durability. While traditional aftermarket sales are expected to grow, support equipment sales fluctuate with the introduction of new transmissions. The competition for service parts and ReTran remanufactured transmissions comes from a variety of smaller-scale companies sourcing non-genuine “will-fit” parts from unauthorized manufacturers. These “will-fit” parts often do not meet our product specifications, and therefore may be of lesser quality than genuine Allison parts.
Our Product Offering
Allison transmissions are sold under the Allison Transmission brand name and remanufactured transmissions are sold under the ReTran brand name, which we believe are recognized throughout the industry for delivering the combinationname. The following is a summary of quality, reliability, durability, vocational value and superior customer service. We have 12our 13 transmission product lines with over 100 different product models. Allison transmissions are included in more than 2,500 vehicle configurations that are compatible with more than 500 combinations of engine brands, models and ratings worldwide.

In addition to our current product offerings, we have various products under development, including the TC10, a Class 8 metro truck fully-automatic transmission, and the H 3000 and the H 4000 hybrid-propulsion systems designed for use in medium- and heavy-duty commercial trucks and buses.
We are developing the TC10 for the Class 8 metro tractor market, in which we have a very limited presence. The metro market accounts for approximately 30% of the Class 8 tractor market. We believe our new TC10 product is more fuel efficient than the incumbent manual transmissions and AMTs currently used in these vehicles, and is well suited to address end user demands in this market given the high “start and stop” frequency of the Class 8 metro tractor duty cycle. We expect to begin production of the TC10 in 2013.
In August 2009, our success with the hybrid-propulsion systems for transit buses helped us secure a $62.8 million U.S. Department of Energy (“DOE”) cost-share grant award which is being used to develop increased U.S. manufacturing capacity for another family of hybrid-propulsion systems. The first of the new family, the H 3000, is a hybrid variant of our current 3000 Series product and is expected to initially serve medium- and heavy-duty distribution vehicles, shuttle buses, refuse trucks and utility trucks. It is expected to begin production in 2013. The second of the new family, the H 4000, is a hybrid variant of our current 4000 Series product. We continue our H 4000 design validation efforts and plan for the start of production to coincide with market demand. The objective for this family of hybrid-propulsion systems is to create an improvement in fuel economy of approximately 25% for a typical vehicle, dependent upon the vocation and duty cycle. The reduction in fuel consumption, while delivering the same productive work in the same amount of time, also reduces greenhouse gas emissions and reduces other air pollutants from commercial trucks. The combustion of a lower quantity of fuel within the engine may also reduce the wear on the engine and the hybrid regenerative braking captures and stores deceleration energy, thereby potentially reducing wear on the vehicle’s service brakes, helping reduce vehicle maintenance and service costs. Demand for our hybrid-propulsion systems has historically been supported by various governmental subsidies to end users. If such subsidies were to be discontinued or if our products failed to qualify for such subsidies, sales of our hybrid-propulsion systems could be negatively impacted. Other external factors also could negatively impact sales including diesel fuel price trends, natural gas fuel price trends, availability from engine manufacturers of compatible engine calibrations, and alternative emerging green technologies.
Product Development and Engineering
We maintain an industry leading product development and engineering capability dedicated to the design, development, refinement and support of our fully-automatic transmissions and hybrid-propulsion systems. Our approximately 350 product development and engineering staff are distinguished by their depth of analytical skills and industry experience and significantly contribute to our product performance. With decades of experience, knowledge and expertise in our markets, we believe we have the skills to create, evolve and apply products to a wide variety of uses under various vocations and operating conditions. Within the product development engineering process, insights gained in one area can be leveraged across our entire portfolio.
We believe our customers expect our products to provide unparalleled performance and value defined in various ways, including delivering maximum cargo in minimum time, using the least amount of fuel possible while employing the fewest vehicles possible and experiencing maximum vehicle uptime. In response to those needs and the evolving customer focus on fuel efficiency, we provide vehicle specification guidelines, superior transmission control software and mechanical components to optimize fuel economy while delivering desired vehicle performance. Further, we are developing new technology and products to improve fuel efficiency and fuel economy by allowing engines to operate more efficiently and at lower speeds to avoid consuming fuel without compromising performance. Building on our engineering capabilities, we pioneered hybrid propulsionhybrid-propulsion in commercial vehicles and are developing new hybrid variants and alternative technologies for use in our global commercial vehicle markets.
Inmarkets; however, decreased fuel costs, alternative fuels and other technologies have resulted in deteriorating market conditions for hybrid-propulsion vehicles in recent years. For the years ended December 31, 2015, 2014 and 2013, we have acceleratedinvested $92.5 million, $103.8 million and significantly increased our investment$97.1 million in engineering – research and development above our historical levels. Examples of our key innovations include the development of a fully-automatic hybrid-propulsion system for the medium- and heavy-duty commercial truck and bus markets and a twin countershaft, fully-automatic transmission for a portion of the Class 8 tractor truck market. expense, respectively.
From time to time, we acquire certain licenses to provide us with technology to complement our portfolio of products and product initiatives, such as our engineering development agreement with Torotrak plc (“Torotrak”). During 2012, we entered into aand our development agreement with Fallbrook Technologies, Inc. (“Fallbrook”) to acquire technology-related licenses. For the years ended December 31, 2012, 20112015, 2014 and 2010,2013, we have incurred $115.1invested $0.2 million, $116.4$6.1 million and $101.5$6.0 million, ofrespectively, in engineering – research and development expense respectively.related to technology-related licenses.
We maintain a test tracktracks on our Indianapolis, Indiana campus and at our location in Szentgotthard, Hungary for vehicle drive, testing and calibration activities in addition to being a demonstration venue for customers. We opened a comparable facility in October 2011, at our location in Szentgotthard, Hungary. We also leaseuse test track facilities in New Carlisle, Indiana and Apache Junction, Arizona, and Sweden. In 2012, we hosted approximately 1,000 OEM and end user representatives at these facilities.Arizona.
Sales and Marketing Organization
Our sales and marketing effort is organized along geographic and customer lines and is comprised of marketing, sales and service professionals, supported by application engineers worldwide. In North America, selling efforts in the on-highway end market, our largest end market are organized by distributor area responsibility, OEM sales and national accounts, for our large end users. Outside North America, we manage our sales, marketing, service and application engineering professionals through regional areas of responsibility. These regional management teams distribute OEM service and application engineering resources globally. Since 2007, we have significantly expanded our sales and marketing teams and distribution relationships in emerging markets to capitalize on growth opportunities in these regions. We manage our militarydefense products sales, marketing, service and application engineering through professionals based in Indianapolis, INIndiana and Detroit, MI based professionals with extensive defense industry experience.Michigan.
We have developed a marketing strategy to reach OEM customers as well as end users. We target our end users primarily through marketing activities by our sales staff, who directly call on end users and attend local trade shows, targeting specific vocations globally and through our plant tour program,programs, where end users may test our products on the Indianapolis test track. In 2012, we completed antrack and our enhanced customer experience demonstration track at our new Hungary facility, to provide our global end users an opportunity to test our products.facility.
While our marketing management uses the term “customer” interchangeably for OEMs and end users, the primary objective of our marketing strategy is to create demand for fully-automatic transmissions through:
OEM promotion of our products and incorporation of fully-automatic transmissions in their commercial vehicle product offerings;
Allison representative and/or Allison distributor contact with identified, major end users; and
our network of independent dealers who contact other end users.
The process is interactive, as Allison representatives, Allison distributors and OEM dealers educate customers and respond to the specific applications, requirements and needs of numerous specialty markets.
Similarly, we work with customers, dealers and OEMs to educate, improve and simplify how they specify vehicles and vehicle systems in order to optimize vehicle performance and fuel consumption. This instructional initiative is known as “Science to Sales.” Our field organization also works closely with distributors who, in turn, work with dealers to provide end users with education, parts, service and warranty support. The militarydefense marketing group follows a defined plan that identifies country, vehicle and specific OEMs and then approaches the ultimate end user through a variety of channels.
Manufacturing
Our manufacturing strategy provides for distributed capability in manufacturing and assembly of our products for the global commercial vehicle market. Our primary manufacturing facilities, located in Indianapolis, Indiana, consist of approximately 3.22.3 million square feet of usable manufacturing space in sevensix plants. We also have established customization and parts distribution in the United States, The Netherlands, Brazil, China, Hungary, India and Japan. We have further expanded our global manufacturing presence to provide access to low-cost manufacturingJapan, and a regional presence to support our emerging market growth strategy. Our facilities are designed and located globally to respond to customer orders within competitive lead times and to minimize tangible and intangible market entry costs, while taking full advantage of our global supply chain. In support of these initiatives, we opened a plantplants in Chennai, India in 2010 and a plant in Szentgotthard, Hungary in 2011. Our Chennai facility manufactures gear components for our global manufacturing operations and allows us to control the quality and durability of the gears, consistent with those produced in our U.S. facilities, at a lower cost. Assembly of our 1000 and 2000 products commenced in 2012. In 2011, our Hungarian facility relocated our existing assembly and final test operations from a nearby GM plant, with which we have a contract manufacturing arrangement. This Allison facility is equipped to customize the units it produces to meet unique customer demands, a process formerly handled by our operations in The Netherlands. Our Chennai and Szentgotthard, facilities also provide us with a meaningful level of manufacturing redundancy for our high volume on-highway transmission products.
Our day-to-day manufacturing operations are sustained through the fundamentals of the Allison Transmission Global Manufacturing System (“GMS”). This system supports five key principles to ensure the highest quality and reliable products for our customers: people involvement, standardization, built-in quality, short lead time, and continuous improvement. All on-highway products manufacturing plants embrace these concepts in total, while production areas of lower product volumes apply specific GMS concepts applicable to their operations. Each of these principles is supported by key elements that serve as criteria for process execution that ensure minimized waste within the production system.
Hungary. Our high volume on-highway products are produced in multiple global locations while off-highway, hybrid-propulsion and militarydefense tracked and wheeled products are produced in Indianapolis. The type of facility employed in a given area depends on regional product demand
Suppliers and delivery time requirements. Assemble-to-order is achieved through lean manufacturing processes with short lead times intended to respond to customer line sets in less than 10 days. GMS supports product-focused factories, which include lean-configured manufacturing cells and efficiently designed assembly lines that align with a specific product. We believe a comprehensive quality system and a regimented system structured around Kanban fundamentals are the foundation for the system’s dependability. Each factory is structured with its own dedicated leadership team. We have extensive in-house machining capabilities,Raw Materials
A significant technical expertise and advanced processes for component manufacturing and total product assembly. Manufacturing operations consist of the vast majority of machining processes utilized in the conversion of cast iron, steel and aluminum products into transmission components, as well as the heat treating facilities that exist in four of our plants.
Approximately 80%amount of the part numbers that make up our transmissions are purchased from outside suppliers. Based on thorough on-going analyses of our own manufacturing competencies in the context of supply base capabilities, the proportion of purchased parts has increased in our most recent product designs. This has enabled our valuable operations resources to be focused on the most complex, competitively differentiating, value-adding machiningsuppliers, and assembly process elements at optimally efficient levels of capital expenditure.
Suppliers and Raw Materials
During 2012,during 2015, we purchased approximately $800.0$700.0 million of direct materials and components from outside suppliers. The largest elements of our direct spending are aluminum and steel castings and forgings that are formed by our suppliers into our larger components and assemblies for use in our transmissions. However, our spending on aluminum and steel raw materials directly and indirectly through our purchase of these components constituted approximately 10% of our direct material and component costs in 2012.2015. The balance of our direct and indirect materials and components costs are primarily composed of value-added services and conversion costs. Over 60% of ourOur supply contracts are for terms of greater than one year. Such contracts, along with an intensive supplier selection and performance monitoring process, have enabled us to establish and maintain close relationships with suppliers and have contributed to our overall operating efficiency and industry-leading quality.
Intellectual Property
Patents and other proprietary rights are important to the continued success of our business. We also rely upon trade secrets, know-how, continuing technological innovation and licensing opportunities to develop and maintain our competitive position. We protect our proprietary rights through a variety of methods, including confidentiality agreements and proprietary information agreements with suppliers, employees, consultants and others who may have access to proprietary information. We own 30109 issued patents, and we have licensing arrangements with respect to approximately 500more than 600 additional issued patents. We have more than 150300 pending patent applications throughout the world that relate to aspects of the technology incorporated in many of our products.
In addition, in conjunction with the sale of Allison (the “Acquisition Transaction”) by Old GM, we acquired an irrevocable, royalty-free, worldwide license of more than 250400 U.S. and foreign patents and patent applications, as well as certain unpatented technology and know-how, to manufacture, use and sell fully-automatic transmissions and certain hybrid-propulsion systems for use in vocational and militarydefense vehicles and off-highway products. Such licenses are subject to certain limitations. See Part I, Item 1A, “Risk Factors” of this Annual Report on Form 10-K for a complete discussion of these risks and limitations. In addition, we acquired from Old GM an irrevocable, royalty-free, worldwide license under computer software programs that we use to run our business, including product design. Allison also acquired ownership of trademarks and copyrights relating to our business, subject in some cases to a non-exclusive license back to Old GM for use in connection with its existing six-speed A1000 transmission products, but only up to the termination of production of the A1000 transmission product by General Motors Company (“GM”), the successor to Old GM. GM has assumed Old GM’s obligations under these agreements pursuant to an agreement between us and GM in which GM assumed certain contracts and agreements between us and Old GM (the “Cure Agreement”).
Seasonality
Overall, the demand for our products is relatively consistent over the year. However, in typical market conditions, the North American truck market experiences a higher level of production in the first half of the year due to fewer holidays and the practice of plant shutdowns in July and December. However, this pattern has not always held in recent business cycles, particularly during and following an economic downturn. Working capital levels do not fluctuate significantly in the normal course for our business.
Employees
As of December 31, 2012,2015, we had approximately 2,8002,700 employees, with more thanapproximately 90% of those employees in the U.S. Approximately 60% of our U.S. employees are represented by the International Union, United Automobile, Aerospace and Agricultural Implement Workers of America (“UAW”) and are subject to a collective bargaining agreement. In November 2012, we entered into a new five year agreement with the UAW Local 933 that expires in November 2017. The multi-tiered wage and benefit structure from the prior agreement was retained and the parties agreed to additional changes, such as implementing a new retirement health care plan and eliminating the consumer price index based cost of living allowance that had been part of the prior agreement. As approximately 55%50% of our represented employees are currently retirement eligible, we anticipate a significant shift toward increasing the number of second tier employees over the coming years. There have been no strikes or work stoppages due to Allison-specific issues in over 30 years.
Environmental
We are subject to a variety of Federal,federal, state, local and foreign environmental laws and regulations, including those governing the discharge of pollutants into the air or water, the management and disposal of hazardous substances or wastes, and the cleanup of contaminated sites. Some of our operations require environmental permits and controls to prevent and reduce air and water pollution. These permits are subject to modification, renewal and revocation by issuing authorities. In addition, certain of our products and our customer’s products are subject to certification requirements by a variety of regulatory bodies. We believe we are in substantial compliance with all applicable material environmental laws and regulations in the U.S.applicable to our plants and operations. Historically, our costs of achieving and maintaining compliance with environmental, health and safety requirements have not been material to our results.
In addition, increasingIncreasing global efforts globally to control emissions of carbon dioxide, methane, ozone, nitrogen oxide and other greenhouse gases and pollutants, as well as the shifting focus of regulatory efforts towards total emissions output, have the potential to impact our facilities, costs, products and customers. Pursuant to the Clean Air ActThe U.S. Environmental Protection Agency (“CAA”EPA”), the EPA has recently taken action to control greenhouse gases from certain stationary and mobile sources. These actions include issuance of a greenhouse gas reporting rule applicable to specified stationary sources, as well as a rule requiring limits on greenhouse gas emissions for certain sources underIn addition, the CAA New Source Review of Significant Deterioration and Title V Operating Permit programs. The U.S. Congress is also considering proposals to limit greenhouse gas emissions, and several states have taken steps, such as adoption of cap and trade programs or other regulatory systems, to address greenhouse gases. At the same time, opponents of greenhouse gas regulation have initiated litigation, as well as introduced legislation in Congress, to delay, limit or eliminate the EPA’s, and possibly states’, actions to regulate greenhouse gases. There have also been international efforts seeking legally binding reductions in emissions of greenhouse gases. These developments and further actions that may be taken in the U.S. and in other countries, states or provinces could affect our operations both positively and negatively (e.g., by affecting the demand for or suitability of some of our products). As described above, we believe increased regulation of greenhouse gases will increase demand for green technologies, including our hybrid technologies.
Also, under the Asset Purchase Agreement, GM agreed to indemnify us against certain environmental liabilities, including pre-acquisition offsite waste disposal from our facilities, former facilities associated with our business and any properties or facilities relating to our business that GM retained. GM also continues to perform remedial activities at our Indianapolis, Indiana manufacturing facilities relating to historical soil and groundwater contamination at the facilities. GM is performing such activities pursuant to a voluntary Corrective Action Agreement with EPA and pursuant to the Asset Purchase Agreement retained responsibility for completing all remediation activities covered by the Corrective Action Agreement. Except to the extent specifically retained by GM, we would be responsible for environmental liabilities that may arise at any of our properties, including with respect to contamination that may have occurred at our properties prior to the Acquisition Transaction. Additionally, there can be no assurances that GM will comply with its indemnity obligations or with its remedial obligations at the Indianapolis, Indiana facility, or that future environmental remediation obligations will not have a material adverse impact on our results.
We also may be subject to liability as a potentially responsible party under the Comprehensive Environmental Response, Compensation and Liability Act and similar state or foreign laws for contaminated properties that we currently own, lease or operate or that we or our predecessors have previously owned, leased or operated, and sites to which we or our predecessors sent hazardous substances. Such liability may be joint and several so that we may be liable for more than our share of contamination, and any such liability may be determined without regard to causation or knowledge of contamination. We or our predecessors have been named potentially responsible parties at contaminated sites from time to time. We do not anticipate our liabilities relating to contaminated sites will be material to our results.
Under the asset purchase agreement with Old GM, Old GM agreed to indemnify us against certain environmental liabilities, including pre-acquisition offsite waste disposal from our facilities, former facilities associated with the business and any properties or facilities relating to the business that Old GM retained. While we are responsible for environmental liabilities that arise due to post-acquisition activities, GM, as successor to Old GM’s obligations, performed remedial activities at our Indianapolis, Indiana manufacturing facilities relating to historical soil and groundwater contamination at the facilities. GM’s activities were referred to as the “Corrective Action” plan, pursuant to the asset purchase agreement, whereby it retained responsibility for completing all obligations covered by a voluntary Corrective Action Agreement that Old GM entered with the EPA. By operation of the asset purchase agreement, once the EPA issues a final decision on GM’s activities under the Corrective Action plan, we assume all responsibility for operating, monitoring and maintaining the ongoing Corrective Action and GM’s indemnification obligations cease.
During the third quarter of 2015, the EPA determined that GM’s remedial activities were complete and that the migration of any contamination is under control, and published a public notice seeking comment on a draft final decision, the issuance of which would result in us assuming responsibility for operating, monitoring and maintaining the ongoing Corrective Action activities through an anticipated agreed order of consent (“AOC”) with the EPA. As a result of the publishing of the draft final decision, we determined that appropriate liabilities for operating, monitoring and maintaining the ongoing remedial activities could be reasonably estimated and recorded approximately $14.0 million for the estimated undiscounted liabilities to be paid out over the next 30 years. The recorded liabilities will be adjusted periodically as remediation efforts progress or as additional technical, regulatory or legal information becomes available. We expect to fund the expenditures for these activities from operating cash flow.
On January 27, 2016, the EPA issued a final decision. With the AOC, financial assurance is required by the EPA to complete the operation, monitoring and maintenance activities in the event we fail to do so. This financial assurance can take a variety of forms including, but not limited to meeting certain financial metrics, providing a letter of credit, or securing a bond or an insurance policy. The amount and method by which we will be required to provide financial assurance is expected to be determined in 2016.
Competition
We compete on the basis of product performance, quality, price, distribution capability and service in addition to other factors. We face competition from numerous manufacturers of manual transmissions, AMTs and fully-automaticvarious types of transmissions for commercial vehicles. We also face competition from manufacturers in our international operations and from international manufacturers entering our domestic market. Furthermore, some of our customers are OEMs that manufacture transmissions for their own products. Despite their transmission manufacturing abilities, our existing OEM customers have chosen to purchase certain transmissions from us due to the quality, reliability and strong brand of our transmissions and in order to limit fixed costs, minimize production risks and maintain company focus on commercial vehicle design, production and marketing.
Corporate Information
Allison Transmission Holdings, Inc. was incorporated in Delaware on June 22, 2007. Our principal executive offices are located at One Allison Way, Indianapolis, IN 46222 and our telephone number is (317) 242-5000. Our internet address is www.allisontransmission.com. We file annual, quarterly and current reports, proxy statements and other documents with the United States Securities and Exchange Commission (“SEC”), under the Securities Exchange Act of 1934, as amended (the “Exchange Act”). These periodic and current reports and all amendments to those reports are available free of charge on the investor relations page of our website at http://ir.allisontransmission.com.Weir.allisontransmission.com. We have included our website address throughout this filing as textual references only. The information contained on our website is not incorporated into this Annual Report on Form 10-K.
The public may read and copy any materials we file with the SEC at the SEC’s Public Reference Room at 100 F Street, NE, Washington, DC 20549. The public may obtain information on the operation of the Public Reference Room by calling the SEC at 1-800-SEC-0330. The SEC also maintains an Internet site that contains reports, proxy and information statements, and other information regarding issuers that file electronically with the SEC at http://www.sec.gov.
| ITEM 1A. | Risk Factors |
The following is a cautionary discussion of risks, uncertainties and assumptions that we believe are significant to our business. In addition to the factors discussed elsewhere in this Annual Report on Form 10-K, the following are some of the important factors that, individually or in the aggregate, we believe could make our actual results differ materially from those described in any forward-looking statements. It is impossible to predict or identify all such factors and, as a result, you should not consider the following factors to be a complete discussion of risks, uncertainties and assumptions.
Risks Related to Our substantial indebtedness could adversely affect our financial health, restrict our activities and affect our ability to meet our obligations.Business
We have a significant amount of indebtedness. As of December 31, 2012, we had total indebtedness of $2,820.8 million and we would have been able to borrow an additional $400.0 million under the revolving portion of our credit facility, less $27.9 million of offsetting outstanding letters of credit. As of December 31, 2012, we had no outstanding borrowings against the revolving credit facility. Of our total indebtedness at December 31, 2012, $2,349.5 million consists of the term loans under ATI’s credit facility, including $411.4 million of indebtedness associated with ATI’s Senior Secured Credit Facility Term B-1 Loan due 2014 (“Term B-1 Loan”), $793.1 million of indebtedness associated with ATI’s Senior Secured Credit Facility Term B-2 Loan due 2017 (“Term B-2 Loan”), $1,145.0 million of indebtedness associated with ATI’s Senior Secured Credit Facility Term B-3 Loan due 2019 (“Term B-3 Loan” and together with the Term B-1 Loan, Term B-2 Loan, Term B-3 Loan and revolving credit facility defined as the “Senior Secured Credit Facility”). We also had indebtedness of $471.3 million of ATI’s 7.125% senior cash pay notes due May 2019 (“7.125% Senior Notes”). For a complete description of the terms of the Senior Secured Credit Facility and the 7.125% Senior Notes, please see Part II, Item 7, “Management’s Discussion and Analysis of Financial Condition and Results of Operations – Recent Developments,” “– Description of the Senior Secured Credit Facility” and “– Description of the Senior Notes.”
Our substantial indebtedness could have important consequences. For example, it could:
make it more difficult for us to satisfy our obligations under our indebtedness;
require us to further dedicate a substantial portion of our cash flow from operations to payments of principal and interest on our indebtedness, thereby reducing the availability of our cash flow to fund acquisitions, working capital, capital expenditures, research and development efforts and other general corporate purposes;
increase our vulnerability to and limit our flexibility in planning for, or reacting to, downturns or changes in our business and the industry in which we operate;
restrict us from making strategic acquisitions or cause us to make non-strategic divestitures;
expose us to the risk of increased interest rates as borrowings under the Senior Secured Credit Facility are subject to variable rates of interest;
place us at a competitive disadvantage compared to our competitors that have less debt; and
limit our ability to borrow additional funds.
In addition, the Senior Secured Credit Facility contains a maximum total senior secured leverage ratio. The Senior Secured Credit Facility and the indenture governing the 7.125% Senior Notes also contain other negative and affirmative covenants that will limit our ability to engage in activities that may be in our long-term best interests. Our failure to comply with any of the covenants could result in an event of default which, if not cured or waived, could result in the acceleration of all of our indebtedness.
We participate in markets that are competitive, and our competitors’ actions could have a material adverse effect on our business, results of operations and financial condition.
Our business operates in competitive markets. We compete against other existing or new global manufacturers of transmissions for commercial vehicles on the basis of product performance, quality, price, distribution capability and service in addition to other factors. Actions by our competitors could lead to downward pressure on prices and/or a decline in our market share, either or both of which could adversely affect our results. We face competition from domestic manufacturers of manual transmissions, AMTs and fully-automatic transmissions for commercial vehicles. In particular, we could face competition from well-capitalized entrants into the transmission market, as well as from aggressive pricing tactics by other transmission manufacturers trying to gain market share. We also face competition from international manufacturers in our international markets and from international manufacturers entering our domestic market.
In addition, some of our customers or future customers are OEMs that manufacture or could in the future manufacture transmissions for their own products. Despite their transmission manufacturing abilities, our existing OEM customers have chosen to purchase certain transmissions from us due to customer demand, resulting from the quality of our transmission products and in order to reduce fixed costs, eliminate production risks and maintain company focus. However, we cannot be certain these customers will continue to purchase our products in the future. Increased levels of production insourcing by these customers could result from a number of factors, such as shifts in our customers’ business strategies, acquisition by a customer of another transmission manufacturer, the inability of third-party suppliers to meet specifications and the emergence of low-cost production opportunities in foreign countries. As a result, these OEMs may use transmissions produced internally or by another manufacturer and no longer choose to purchase transmissions from us. A significant reduction in the level of external sourcing of transmission production by our OEM customers could significantly impact our net sales and cash flows and, accordingly, have a material adverse effect on our business, results of operations and financial condition.
Certain of our end users operate in highly cyclical industries, which can result in uncertainty and significantly impact the demand for our products, which could have a material adverse effect on our business, results of operations and financial condition.
Some of the markets in which we operate, including energy, mining, construction, distribution and motorhomes, exhibit a high degree of cyclicality. Decisions to purchase our transmissions are largely a result of the performance of these and other industries we serve. If demand for output in these industries decreases, the demand for our products will likely decrease. Demand in these industries is impacted by numerous factors including prices of commodities, rates of infrastructure spending, housing starts, real estate equity values, interest rates, consumer spending, fuel costs, energy demands, municipal spending and commercial construction, among others. Increases or decreases in these variables globally may significantly impact the demand for our products, which could have a material adverse effect on our business, results of operations and financial condition. If we are unable to accurately predict demand, we may be unable to meet our customers’ needs, resulting in the loss of potential sales, or we may manufacture excess products, resulting in increased inventories and overcapacity in our production facilities, increasing our unit production cost and decreasing our operating margins.
Continued volatility in and disruption to the global economic environment could adversely affect the ability of customers and suppliers to obtain credit and may have a material adverse effect on our business, results of operations and financial condition.
The commercial vehicle industry as a whole has been more adversely affected by volatile economic conditions than many other industries, as the purchase or replacement of commercial vehicles, which are durable items, can be deferred for many reasons, including reduced spending by end users. Furthermore, financial instability or bankruptcy at any of our suppliers or customers could disrupt our ability to manufacture our products and impair our ability to collect receivables, any or all of which may have a material adverse effect on our business, results of operations and financial condition. In addition, some of our customers and suppliers may experience serious cash flow problems and, thus, may find it difficult to obtain financing, if financing is available at all. As a result, our customers’ need for and ability to purchase our products or services may decrease, and our suppliers may increase their prices, reduce their output or change their terms of sale. Any inability of customers to pay us for our products and services, or any demands by suppliers for different payment terms, may materially and adversely affect our results of operations and financial condition. Furthermore, our suppliers may not be successful in generating sufficient sales or securing alternate financing arrangements, and therefore may no longer be able to supply goods and services to us. In that event, we would need to find alternate sources for these goods and services, and there is no assurance we would be able to find such alternate sources on favorable terms, if at all. Any such disruption in our supply chain could adversely affect our ability to manufacture and deliver our products on a timely basis, and thereby affect our results of operations.
Our long-term growth prospects and results of operations may be impaired if the rate of adoption of fully-automatic transmissions in commercial vehicles outside North America does not increase.
Our long-term growth strategy depends in part on an increased rate of automaticity outside North America. As part of that strategy, we have established manufacturing facilities in India and Hungary. We have also dedicated significant human resources to serve markets where we anticipate increased adoption of automaticity, including China, India, Brazil and Russia. However, manual transmissions remain the market leader outside North America and there can be no assurance that adoption of automatic transmissions will increase. Factors potentially impacting adoption of automatic transmissions outside of North America may include the large existing installed base of manual transmissions, customer preferences for manual transmissions, commercial vehicle OEM integration into manual transmission and AMT manufacturing, and failure to further develop the Allison brand. If the rate of adoption of fully-automatic transmissions does not increase as we have anticipated, our long-term growth prospects and results of operations may be impaired.
Our sales are concentrated among our top five OEM customers and the loss or consolidation of any one of these customers or the discontinuation of particular vehicle models for which we are a significant supplier could reduce our net sales and have a materially adverse effect on our results of operations.
We have in the past and may in the future derive a significant portion of our net sales from a relatively limited number of OEM customers. For the years ended December 31, 2012, 20112015, 2014 and 2010,2013, our top five customers accounted for approximately 45%52%, 38%45% and 41%48% of our net sales, respectively. Our top three customers, Daimler, Navistar and Oshkosh,Volvo, accounted for approximately 13%21%, 11%10% and 11%10%, respectively, of our net sales during 2012.2015. The commercial vehicle industry, including our customers and suppliers, continues to experience volatility and uncertainty as a result of the recent global economic downturn.uncertainty. The loss of, or consolidation of any one of these customers, or a significant decrease in business from, one or more of these customers could harm our business. In addition, the discontinuation of particular vehicle models for which we are a significant supplier could reduce our net sales and have a material adverse effect on our results of operations.
Sales of our hybrid-propulsion systems have been, and mayare expected to continue to be, negatively impacted by external factors, including fuel price trends, regulatory requirements, alternative technologies and governmental entities electing not to subsidize the purchase of such products by end users,users.
External factors, including diesel and other external factors.
Thenatural gas fuel price trends, emissions and on-board diagnostics regulatory requirements, availability of compatible engine calibrations from engine manufacturers and alternative emerging green technologies, have, and are expected to continue to, negatively impact sales of our hybrid-propulsion systems. In addition, the sales of our hybrid-propulsion systems for use in transit buses have been, and mayare expected to continue to be, negatively impacted by governmental entities electing not to subsidize the purchase of such products by end users. In 2012,2015, we derived approximately 6%4% of our net sales from the sale of hybrid-propulsion systems for use in transit buses to city, state and federal governmental end users. Such end users may be eligible to receive certain subsidies as a result of their purchase of vehicles using hybrid-propulsion systems. For example, the Federal Transit Authority and the DOE provide funds for end users to pursue alternative fuel propulsion systems. While we do not directly receive these subsidies, if any of the subsidizing entities elect to curtail such subsidies to end users for any reason including governmental budget reductions and related fiscal matters, failure of our hybrid technology to qualify for such subsidies or redundancy by alternative technologies created by our competitors, our sales from our hybrid-propulsion systems may be negatively impacted. In addition, other external factors, including diesel and natural gas fuel price trends, availability of compatible engine calibrations from engine manufacturers and alternative emerging green technologies, may negatively impact sales of our hybrid-propulsion systems. For the years ended December 31, 2012, 20112015, 2014 and 2010,2013, we experienced decreases in revenue generated from hybrid-propulsion systems for use in transit buses of 14%22%, 14%11% and 23%9%, respectively.
A majority of our sales to the militarydefense end market are to U.S. government entities and contractors for the U.S. government, and the loss of a significant number of our contracts, or budgetary declines would have a material adverse effect on our results of operations and financial condition.
Our net sales to the military end market are predominantly derived from contracts (revenue arrangements) with agencies of, and prime system contractors to, the U.S. government. The loss of all or a substantial portion of our net sales tofuture reductions or changes in spending by the U.S. government would have a material adverse effect on our results of operations and financial condition. Approximately 14%, or $305.0 million,
The majority of our net sales to the defense end market are derived from contracts (revenue arrangements) with agencies of, and prime system contractors for, the year ended December 31, 2012 were made directly or indirectly to U.S. government agencies, including the DOD.
A significant portion of our total net sales are for products and services under contracts with various agencies and procurement offices of the DOD or with prime contractors to the DOD. Although these various agencies, procurement offices and prime contractors are subject to common budgetary pressures and other factors, our customers exercise independent purchasing decisions. Because of this concentration of contracts, ifgovernment. If a significant number of our DOD contracts and subcontracts are simultaneously delayed or cancelled for budgetary, performance or other reasons, it would have a material adverse effect on our results of operations and financial condition. Approximately 6%, or $113 million, of our net sales for the year ended December 31, 2015 were from our Defense end market.
Future reductions or changesSales in U.S. government spending couldour defense end market have a material adverse effect on our results of operationsbeen, and financial condition.
We have benefited from the upward trend in DOD budget authorization and spending outlays over recent years, including supplemental appropriations for military operations in Afghanistan. However, we expect futurewill continue to be, negatively impacted by declining DOD spending on wheeled and tracked vehicles will likely decline. In particular, significant volume reductions in one of our Indianapolis plants, which primarily produces our U.S. military tracked products, may increase operating costs, which directly impacts our competitive advantage and would materially adversely affect our business, results of operations and financial condition. Moreover, as U.S. involvement in Afghanistan continues to diminish, the demand for our products may decline significantly, which could have a material adverse effect on our results of operations and financial condition.
vehicles. In addition to declines in agencydefense budgets, our future financial results may be adversely affected by:
sequestration of the military’s spending for products and services;
curtailment of the U.S. government’s use of technology or other services and product providers, including curtailment due to government budget reductions, future government shutdowns and related fiscal matters;
developments in Afghanistan, or other geopolitical developments that affect demand for our products and services; and
technological developments that impact purchasing decisions or our competitive position.
Continued volatility in and disruption to the global economic environment may have a material adverse effect on our business, results of operations and financial condition.
The global economy has recently experienced a period of significant volatility and disruption. The commercial vehicle industry as a whole has been more adversely affected by the economic conditions than many other industries, as the purchase or replacement of commercial vehicles, which are durable items, can be deferred for many reasons, including reduced spending by end users. Many of the economic and market conditions that drove the drop in commercial vehicle sales, primarily continued reduced spending by end users, continue to affect sales. Furthermore, financial instability or bankruptcy at any of our suppliers or customers could disrupt our ability to manufacture our products and impair our ability to collect receivables, any or all of which may have a material adverse effect on our business, results of operations and financial condition.
Any events that impact our brand name, including if the products we manufacture or distribute are found to be defective, could have an adverse effect on our reputation, cause us to incur significant costs and negatively impact our business, results of operations and financial condition.
We face exposure to product liability claims in the event that the use of our products has, or is alleged to have, resulted in injury, death or other adverse effects. We currently maintain product liability insurance coverage, but we cannot be assured that we will be able to obtain such insurance on acceptable terms in the future, if at all, or that any such insurance will provide adequate coverage against potential claims. Product liability claims can be expensive to defend and can divert the attention of management and other personnel for long periods of time, regardless of the ultimate outcome. An unsuccessful product liability defense could have a material adverse effect on our business, results of operation, financial condition or prospects. If one of our products is determined to be defective, we may face substantial warranty costs and may be responsible for significant costs associated with a product recall or a redesign. We have had defect and warranty issues associated with certain of our products in the past, such as our H 40/50 EP hybrid-propulsion transit bus system, where certain units were falling short of their expected service life and our Predecessor decided to cover repair and replacement for an extended period.we cannot give assurance similar product defects will not occur in the future. See NOTE 9 of Notes to Consolidated Financial Statements included in Part II, Item 8 of this Annual Report on Form 10-K for additional details regarding thisthese warranty issue. We cannot give assurance similar product defects will not occur in the future.issues.
Furthermore, our business depends on the strong brand reputation we have developed. In addition to the risk of defective products we face with our new product installations, we also face significant risks in our efforts to penetrate new markets, where we have limited brand recognition. We also rely on our reputation with end users of our transmissions to specify our transmissions when purchasing new vehicles from our OEM customers. In the event we are not able to maintain or enhance our brand in these new markets or our reputation is damaged in our existing markets as a result of product defects or recalls, we may face difficulty in maintaining our pricing positions with respect to some of our products or experience reduced demand for our products, which could negatively impact our business, results of operations and financial condition.
Our brand and reputation are dependent on the continued participation and level of service of our numerous independent distributors and dealers.
We work with a network of approximately 1,400 independent distributors and dealers that provide post-sale service and parts and support equipment. Because we depend on the pull-through demand generated by end users for our products, any actions by the independent distributors or dealers, which are not in our control, may harm our reputation and damage the brand loyalty among our customer base. In the event that we are not able to maintain our brand reputation because of the actions of our independent distributors and dealers, we may face difficulty in maintaining our pricing positions with respect to some of our products or have reduced demand for our products, which could negatively impact our business, results of operations and financial condition. In addition, if a significant number of independent dealers were to terminate their contracts, it could adversely impact our business, results of operations and financial condition.
In the event of a catastrophic loss of our key manufacturing facility, our business would be adversely affected.
While we manufacture our products in several facilities and maintain insurance covering our facilities, including business interruption insurance, a catastrophic loss of the use of all or a portion of one of our manufacturing facilities due to accident, labor issues, weather conditions, acts of war, political unrest, terrorist activity, natural disaster or otherwise, whether short- or long-term, would have a material adverse effect on our business, results of operations and financial condition. Our most significant concentration of manufacturing is around our corporate headquarters in Indianapolis, Indiana where we produce approximately 90% of our transmissions. In addition to our Indianapolis manufacturing facilities, we currently operate manufacturing facilities in both Szentgotthard, Hungary and Chennai, India. In the event of a disruption at the Indianapolis facilities, our other facilities may not be adequately equipped to operate at a level sufficient to compensate for the volume of production at the Indianapolis facility due to their size and the fact that they have not yet been tested for such significant increases in production volume.
We may not be successful in introducing our new products and responding to customer needs.
We currently have more new products and technologies under development than at any time in our history as a result of increased spending on new product development in recent years.development. The development of new products and technologies is difficult and the timetable for commercial release is uncertain, and we may not be successful in introducing our new products and responding to customer needs. In addition, it often takes significant time, in some cases multiple fleet buy cycles, before customers gain experience with new products and technologies and those new products and technologies become widely-accepted by the market. If we do not adequately anticipate the changing needs of our customers by developing and introducing new and effective products and technologies on a timely basis, our competitive position and prospects could be harmed. If our competitors are able to respond to changing market demands and adopt new technologies more quickly than we do, demand for our products could decline, our competitive position could be harmed, and we will not be able to recoup a return on our development investments. Moreover, changing customer demands as well as evolving safety and environmental standards could require us to adapt our products and technologies to address such changes. As a result, in the future we may experience delays in the introduction of some or all of our new products or modifications or enhancements of existing products. Furthermore, there may be production delays due to unanticipated technological setbacks, which may, in turn, delay the release of new products to our end users. If we experience significant delays in production, our net sales and results of operations may be materially adversely affected.
Our success depends on continued research and development efforts, the outcome of which is uncertain.
Our success depends on our ability to improve the efficiency and performance of our transmissions, and we invest significant resources in research and development in order to do so. Nevertheless, the research and development process is time-consuming and costly, and offers uncertain results. We may not be able through our research and development efforts to keep pace with improvements in transmission-related technology of our competitors, and licenses for technologies that would enable us to keep pace with our competitors may not be available on commercially reasonable terms if at all. Finally, our research and development efforts, and generally our ability to introduce improved products in the marketplace, may be constrained by the patents and other intellectual property rights of competitors and others.
Our international operations, in particular our emerging markets, are subject to various risks which could have a material adverse effect on our business, results of operations and financial condition.
Our business is subject to certain risks associated with doing business internationally, particularly in emerging markets. Non-North AmericanOutside-North America net sales represented approximately 22%19% of our net sales for 2012.2015. Most of our operations are in the U.S., but we also have a manufacturing and customization facilityfacilities in India a manufacturing and customization facility in Hungary with a services agreement with Opel Szentgotthard Automotive Manufacturing Ltd., formerly GM-PTH, and customization capability in Brazil, The Netherlands, China and Japan. Further, we intend to continue to pursue growth opportunities for our business in a variety of business environments outside the U.S., which could exacerbate the risks set forth below. Our international operations are subject to, without limitation, the following risks:
the burden of complying with multiple and possibly conflicting laws and any unexpected changes in regulatory requirements;
foreign currency exchange controls, import and export restrictions and tariffs, including restrictions promulgated by the Office of Foreign Assets Control of the U.S. Department of the Treasury, and other trade protection regulations and measures;
political risks, including risks of loss due to civil disturbances, acts of terrorism, acts of war, guerilla activities and insurrection;
unstable economic, financial and market conditions and increased expenses as a result of inflation, or higher interest rates;
difficulties in enforcement of third-party contractual obligations and intellectual property rights and collecting receivables through foreign legal systems;
difficulty in staffing and managing international operations and the application of foreign labor regulations;
differing local product preferences and product requirements;
fluctuations in currency exchange rates to the extent that our assets or liabilities are denominated in a currency other than the functional currency of the country where we operate;
potentially adverse tax consequences from changes in tax laws, requirements relating to withholding taxes on remittances and other payments by subsidiaries and restrictions on our ability to repatriate dividends from our subsidiaries; and
exposure to liabilities under anti-corruption and anti-money laundering laws, including the U.S. Foreign Corrupt Practices Act (“FCPA”) and similar laws and regulations in other jurisdictions.
Any one of these factors could materially adversely affect our sales of products or services to international customers or harm our reputation, which could have a material adverse effect on our business, results of operations and financial condition.
Our international operations require us to comply with anti-corruption laws and regulations of the U.S. government and various international jurisdictions.
Doing business on a worldwide basis requires us and our subsidiaries to comply with the laws and regulations of the U.S. government and various international jurisdictions, and our failure to comply with these rules and regulations may expose us to liabilities. These laws and regulations may apply to companies, individual directors, officers, employees and agents, and may restrict our operations, trade practices investment decisions and partnering activities. In particular, our international operations are subject to U.S. and foreign anti-corruption laws and regulations, such as the FCPA. The FCPA prohibits U.S. companies and their officers, directors, employees and agents acting on their behalf from corruptly offering, promising, authorizing or providing anything of value to foreign officials for the purposes of influencing official decisions or obtaining or retaining business or otherwise obtaining favorable treatment. The FCPA also requires companies to make and keep books, records and accounts that accurately and fairly reflect transactions and dispositions of assets and to maintain a system of adequate internal accounting controls. As part of our business, we deal with state-owned business enterprises, the employees and representatives of which may be considered foreign officials for purposes of the FCPA. In addition, some of the international locations in which we operate lack a developed legal system and have elevated levels of corruption. As a result of the above activities, we are exposed to the risk of violating anti-corruption laws. Violations of these legal requirements are punishable by criminal fines and imprisonment, civil penalties, disgorgement of profits, injunctions, debarment from government contracts as well as other remedial measures. We have established policies and procedures designed to assist us and our personnel in complying with applicable U.S. and international laws and regulations. However, our employees, subcontractors and agents could take actions that violate these requirements, which could adversely affect our reputation, business, financial condition and results of operations.
The current economic environment could adversely affect our ability and the ability of our customers and suppliers to obtain credit.
In the current economic environment, some of our customers and suppliers may experience serious cash flow problems and, thus, may find it difficult to obtain financing, if financing is available at all. As a result, our customers’ need for and ability to purchase our products or services may decrease, and our suppliers may increase their prices, reduce their output or change their terms of sale. Any inability of customers to pay us for our products and services, or any demands by suppliers for different payment terms, may materially and adversely affect our results of operations and financial condition. Furthermore, our suppliers may not be successful in generating sufficient sales or securing alternate financing arrangements, and therefore may no longer be able to supply goods and services to us. In that event, we would need to find alternate sources for these goods and services, and there is no assurance we would be able to find such alternate sources on favorable terms, if at all. Any such disruption in our supply chain could adversely affect our ability to manufacture and deliver our products on a timely basis, and thereby affect our results of operations.
Labor unrest could have a material adverse effect on our business, results of operations and financial condition.
As of December 31, 2012,2015, approximately 60% of our U.S. employees, representing over 50% of our total employees, were represented by the UAW and are subject to a collective bargaining agreement. In November 2012, we reached an agreement on a new five-year collective bargaining agreement with the UAW Local 933, which is effective through November 2017.
In addition to our unionized work force, many of our direct and indirect customers and vendors have unionized work forces. Strikes, work stoppages or slowdowns experienced by these customers or vendors or their other suppliers could result in slowdowns or closings of assembly plants that use our products or supply materials for use in the production of our products. Organizations responsible for shipping our products may also be impacted by strikes. Any interruption in the delivery of our products could reduce demand for our products and could have a material adverse effect on us.
In general, we consider our labor relations with all of our employees to be good. However, in the future we may be subject to labor unrest. The inability to reach a new agreement could delay or disrupt our operations in the affected regions, including the acquisition of raw materials and components, the manufacture, sales and distribution of products and the provision of services. If strikes, work stoppages or lock-outs at our facilities or at the facilities of our vendors or customers occur or continue for a long period of time, our business, results of operations and financial condition may be materially adversely affected.
In the event of a catastrophic loss of one of our key manufacturing facilities, our business would be adversely affected.
While we manufacture our products in several facilities and maintain insurance covering our facilities, including business interruption insurance, a catastrophic loss of the use of all or a portion of one of our manufacturing facilities due to accident, labor issues, weather conditions, acts of war, political unrest, terrorist activity, natural disaster or otherwise, whether short- or long-term, would have a material adverse effect on our business, results of operations and financial condition. Our most significant concentration of manufacturing is around our corporate headquarters in Indianapolis, Indiana where we maintain approximately 90% of our production capacity. In addition to our Indianapolis manufacturing facilities, we currently operate manufacturing facilities in both Szentgotthard, Hungary and Chennai, India. However, those facilities are smaller and newer than the Indianapolis facilities. In the event of a disruption at the Indianapolis facilities, they may not be adequately equipped to operate at a level sufficient to compensate for the volume of production at the Indianapolis facility due to their size and the fact that they have not yet been tested for such significant increases in production volume.
Increases in cost, disruption of supply or shortage of raw materials or components used in our products could harm our business and profitability.
Our products contain various raw materials, including corrosion-resistant steel, non-ferrous metals such as aluminum and nickel, and precious metals such as platinum and palladium. We use raw materials directly in manufacturing and in transmission components that we purchase from our suppliers. We generally purchase components with significant raw material content on the open market. The prices for these raw materials fluctuate depending on market conditions. In recent years, we have experienced significant volatilityVolatility in the costprices of raw materials such as steel, aluminum and nickel as well as in freight charges, and such volatility in the prices of these commodities could increase the cost of manufacturing our products. We may not be able to pass on these costs to our customers, and this could have a material adverse effect on our business, results of operations and financial condition. Even in the event that increased costs can be passed through to customers, our gross margin percentages would decline. Additionally, our suppliers are also subject to fluctuations in the prices of raw materials and may attempt to pass all or a portion of such increases on to us. In the event they are successful in doing so, our margins would decline.
In 2012,2015, approximately 80%75% of our total spending on components was sourced from approximately 40 suppliers.suppliers, some of which are the single source for such components. All of the suppliers from which we purchase materials and components used in our business are fully validated suppliers, meaning the suppliers’ manufacturing processes and inputs have been validated under a production part approval process (“PPAP”). Furthermore, there are only a limited number of suppliers for certain of the materials used in our business, such as corrosion-resistant steel. As a result, our business is subject to the risk of additional price fluctuations and periodic delays in the delivery of our materials or components if supplies from a validated supplier are interrupted and a new supplier, if one is available, must be validated or materials and components must be purchased from a supplier without a completed PPAP. Any such price fluctuations or delays, if significant, could harm our profitability or operations. In addition, the loss of a supplier could result in significant material cost increases or reduce our production capacity. We also cannot guarantee we will be able to maintain favorable arrangements and relationships with these suppliers. An increase in the cost or a sustained interruption in the supply or shortage of some of these raw materials or components that may be caused by a deterioration of our relationships with suppliers or by events such as natural disasters, power outages, labor strikes, or the like could negatively impact our business, results of operations and financial condition. Although we have agreements with many of our customers that we will pass such price increases through to them, such contracts may be cancelled by our customers and/or we may not be able to recoup the costs of such price increases. Additionally, if we are unable to continue to purchase our required quantities of raw materials on commercially reasonable terms, or at all, if we are unable to maintain or enter into purchasing contracts for commodities, or if delivery of materials from suppliers is delayed or non-conforming, our operations could be disrupted or our profitability could be adversely impacted.
Our business and financial results mayWe could be materially adversely affected by government contracting risks.any failure to maintain cost controls.
We rely on our cost structure and operating discipline to achieve strong operating margins. There are subject to various laws and regulations applicable to parties doing business with the U.S. government, including laws and regulations governing performance of U.S. government contracts, the use and treatment of U.S. government furnished property and the nature of materials used in our products. We may be unilaterally suspended or barred from conducting business with the U.S. government, or become subject to fines or other sanctions if we are found to have violated such laws or regulations. As a result of the need to comply with these laws and regulations, we are subject to increased risks of governmental investigations, civil fraud actions, criminal prosecutions, whistleblower law suits and other enforcement actions. The laws and regulations to which we are subject include, but are not limited to, Export Administration Regulations, Federal Acquisition Regulation, International Traffic in Arms Regulations, Foreign Assets Control documentation and regulations from the Bureau of Alcohol, Tobacco and Firearms and the FCPA.
U.S. government contracts are subject to modification, curtailment or termination by the U.S. government without prior written notice, either for convenience or for default as a result of our failure to perform under the applicable contract. If terminated by the U.S. government as a result of our default, wemany factors that could be liable for additional costs the U.S. government incurs in acquiring undelivered goods or services from another source and any other damages it suffers. Additionally, we cannot assign prime U.S. government contracts without the prior consent of the U.S. government contracting officer, and we are required to register with the Central Contractor Registration Database. Furthermore, the U.S. government periodically audits our governmental contract costs, which could result in fines, penalties or adjustment of costs and prices under the contracts.
We are subject to the requirements of the National Industrial Security Program Operating Manual for our facility security clearance, which is a prerequisite foraffect our ability to perform on classified contracts for the U.S. government.
Certain contracts with the various departments and agencies of the U.S. government, including the DOD, require that our offices be issued facility security clearances under the National Industrial Security Program. The National Industrial Security Program requires that a corporation maintaining a facility security clearance be effectively insulated from foreign ownership, controlrealize expected cost savings or influence (“FOCI”). Because one of our principal stockholders is a Canadian entity, we have agreed to, and have implemented, a Security Control Agreement with the Defense Security Service (“DSS”), as a suitable FOCI mitigation arrangement under the National Industrial Security Program Operating Manual. A FOCI arrangement is necessary for us to continue to maintain the requisite security clearances to complete performance under these contracts. Failure to reach and/or maintain an appropriate agreement with DSS regarding the appropriate FOCI mitigation arrangement could result in invalidation or termination of the security clearances, which in turn would mean that we would not be able to enter intoachieve future contracts with the U.S. government requiring facility security clearances, and may result in the loss of our ability to complete certain of our existing contracts with the U.S. government.
Our brand and reputation are dependent on the continued participation and level of service of our numerous independent distributors and dealers.
We work with a network of approximately 1,400 independent distributors and dealers that provide post-sale service and parts and support equipment. Because we depend on the pull-through demand generated by end users for our products, any actions by the independent distributors or dealers, which are not in our control, may harm our reputation and damage the brand loyalty among our customer base. In the eventcost savings that we are not able to control, including the inability to meet demand through our low-cost country sourcing initiatives; the need for unexpected significant capital expenditures; unexpected changes in commodity or component pricing that we are unable to pass on to our suppliers or customers; our inability to maintain efficiencies gained from our workforce optimization initiatives; and our failure to achieve and maintain expected cost savings from our multi-tier wage and benefit structure. Additionally, we have substantial indebtedness of approximately $2,402.8 million as of December 31, 2015. Our inability to maintain our brand reputation because of the actions of our independent distributors and dealers, we may face difficulty in maintaining our pricing positions with respect to some of our products or have reduced demand for our products, which could negatively impact our business, results of operations and financial condition. In addition, if a significant number of independent dealers were to terminate their contracts, itcost controls could adversely impact our business, results of operations and financial condition.operating margins.
Many of the key patents and unpatented technology we use in our business are licensed to us, not owned by us, and our ability to use and enforce such patents and technology is restricted by the terms of the license.
Protecting our intellectual property rights is critical to our ability to compete and succeed as a company. In connection with the Acquisition Transaction, under the patent and technology license agreement (the “Patent and Technology License Agreement”), which was assumed by GM, we were granted us an irrevocable, perpetual, royalty-free, worldwide license under a large number of U.S. and foreign patents and patent applications, as well as certain unpatented technology and know-how, to design, develop, manufacture, use and sell fully-automatic transmissions and H 40/50 EP hybrid-propulsion transit bus systems for use in certain vocational vehicles, militarydefense vehicles and off-road products. With respect to the bulk of the intellectual property licensed to us under such license agreement, our license is exclusive with respect to the design, development, manufacture, use and sale of fully-automatic transmissions and H 40/50 EP hybrid-propulsion transit bus systems in vocational vehicles above certain weight rating thresholds, certain militarydefense vehicles and certain off-road products. It is non-exclusive with respect to certain other products that are within the scope of the licensed patents or to which the licensed technology can be applied. We consider the patents and technology licensed under such license agreement, as a whole, to be critical to preserving our competitive position in the market. However, GM continues to own such patents and technology, and pursuant to the terms of such license agreement, GM has the right, in the first instance, to control the maintenance, enforcement and defense of such patents and the prosecution of the licensed patent applications. In addition, the license agreement limits our ability to sublicense our rights. The Patent and Technology License Agreement permits us to utilize the bulk of the intellectual property rights on an exclusive basis in non-militarynon-defense vehicles with gross vehicle weights above 5900 kilograms (typically Class 4 and higher) with some limited exceptions for GM light-duty pickup truck and van platforms. It also permits us to utilize the bulk of the intellectual property rights on an exclusive basis in militarydefense vehicles that exceed 4250 kilograms (generally Class 3 to Class 4 and higher). GM continues to have the right under such patents and technology to utilize the licensed intellectual property for use in vehicles below the above mentioned rating thresholds, as well as in some light-duty van and pickup truck platforms.
We rely on unpatented technology, which exposes us to certain risks.
We currently do, and may continue in the future to, rely on unpatented proprietary technology. In such regard, we cannot be assured that any of our applications for protection of our intellectual property rights will be approved or that others will not infringe or challenge our intellectual property rights. It is possible our competitors will independently develop the same or similar technology or otherwise obtain access to our unpatented technology.
Although we believe the loss or expiration of any single patent would not have a material effect on our business, results of operations or financial position, there can be no assurance that any one, or more, of the patents licensed from GM, or any other intellectual property owned by or licensed to us, will not be challenged, invalidated or circumvented by third parties. In fact, a number of the patents licensed to us by GM have expired since the date of the Acquisition Transaction, and others are set to expire in the next few years. When a patent expires, the inventions it discloses can be used freely by others. Thus, the competitive advantage that we gain from the patents licensed to us from GM pursuant to the Acquisition Transaction will decrease over time, and a greater burden will be placed on our own research and development and licensing efforts to develop and otherwise acquire technologies to keep pace with improvements of transmission-related technology in the marketplace. We enter into confidentiality and invention assignment agreements with employees, and into non-disclosure agreements with suppliers and appropriate customers so as to limit access to and disclosure of our proprietary information. We cannot be assured that these measures will provide meaningful protection for our trade secrets, know-how or other proprietary information in the event of any unauthorized use, misappropriation or disclosure. If we are unable to maintain the proprietary nature of our technologies, our ability to sustain margins on some or all of our products may be affected, which could reduce our sales and profitability. Moreover, the protection provided for our intellectual property by the laws and courts of foreign nations may not be as advantageous to us as the protection available under U.S. law.
Our pension and other post-retirement benefits funding obligations could increase significantly due to a reduction in funded status as a result of a variety of factors.
Our earnings may be positively or negatively impacted by the amount of income or expense recorded for our defined benefit pension plans and other post-retirement benefits (“OPEB”). Accounting principles generally accepted in the United States of America (“GAAP”) requires that income or expense for defined benefit pension plans be calculated at the annual measurement date using actuarial assumptions and calculations. These calculations reflect certain assumptions, the most significant of which relate to the capital markets, interest rates, health care inflation rates and other economic conditions. Changes in key economic indicators can change these assumptions. These assumptions, along with the actual value of assets at the measurement date, will impact the calculation of pension expense for the year. Although GAAP pension expense and pension contributions are not directly related, the key economic indicators that affect GAAP pension expense also affect the amount of cash that we would contribute to our defined benefit pension plans. Because the values of these defined benefit pension plans’ assets have fluctuated and will fluctuate in response to changing market conditions, the amount of gains or losses that will be recognized in subsequent periods, the impact on the funded status of the defined benefit pension plans and the future minimum required contributions, if any, could have a material adverse effect on our business, results of operations and financial condition. The magnitude of such impact cannot be determined with certainty at this time. However, the effect of a one percentage point decrease in the assumed discount rate would result in an increase in the December 31, 20122015 defined benefit pension plans obligation of approximately $16.5$21.1 million. Likewise, a one percentage point decrease in the effective interest rate for determining defined benefit pension plans contributions would result in an increase in the minimum required contributions for 20132015 of approximately $4.7$4.1 million. Similarly, a one percentage point decrease in the assumed discount rate would result in an increase in the December 31, 20122015 OPEB obligation of approximately $27.3$28.0 million. As of December 31, 20122015, the unfunded status of our defined benefit pension plans and OPEB benefitsplan was $13.9$0.3 million and $142.6$147.3 million, respectively.
Environmental, health and safety laws and regulations may impose significant compliance costs and liabilities on us.
We are subject to many environmental, health and safety laws and regulations governing emissions to air, discharges to water, the generation, handling and disposal of waste and the cleanup of contaminated properties. Compliance with these laws and regulations is costly. We have incurred and expect to continue to incur significant costs to maintain or achieve compliance with applicable environmental, health and safety laws and regulations. Moreover, if these environmental, health and safety laws and regulations become more stringent or expand to include a larger portion of our products or our customer’s products in the future, we could incur additional costs in order to ensure that our business and products comply with such regulations. In addition, we may not be successful in complying with or the vehicle or customer OEMs to which we sell our products may choose not to comply with such laws and regulations, which could impact our ability to sell our products in certain locations. Furthermore, if our products that are already placed in service are found to be non-compliant with certain laws, regulations and certifications, we may incur additional costs and fines. We cannot assure we are in full compliance with all environmental, health and safety laws and regulations. Our failure to comply with applicable environmental, health and safety laws and regulations and permit requirements could result in civil or criminal fines, penalties or enforcement actions, third-party claims for property damage and personal injury, requirements to clean up property or to pay for the costs of cleanup or regulatory or judicial orders enjoining or curtailing operations or requiring corrective measures, including the installation of pollution control equipment or remedial actions. Our failure to comply could also result in our failure to secure adequate insurance for our business, resulting in significant exposure, diminished ability to hedge our risks and material modifications of our business operations.
We may be subject to liability as a potentially responsible party under the Comprehensive Environmental Response, Compensation and Liability Act and similar state or foreign laws for contaminated properties that we currently own, lease or operate or that we or our predecessors have previously owned, leased or operated, and sites to which we or our predecessors sent hazardous substances. Such liability may be joint and several so that we may be liable for more than our share of contamination, and any such liability may be determined without regard to causation or knowledge of contamination. We or our predecessors have been named potentially responsible parties at contaminated sites from time to time.
GM continues to perform remedialperformed remediation activities at our Indianapolis, Indiana manufacturing facilities relating to historical soil and groundwater contamination at the facilities. GM is performing suchGM’s activities are referred to as the “Corrective Action” plan, pursuant to the asset purchase agreement, whereby it retained responsibility for completing all obligations covered by a voluntary Corrective Action Agreement that Old GM entered with the U.S. Environmental Protection Agency, which we refer to as the Corrective Action.EPA. GM retained responsibility for completing all remediation activities covered by the Corrective Action at the Indianapolis, Indiana facilities, and agreed to indemnify us against certain environmental liabilities.liabilities as successor to Old GM’s obligations. During the third quarter of 2015, the EPA determined that GM’s remediation activities were complete and that migration of any contamination is under control, and published a public notice seeking comment on a draft final decision, the issuance of which would result in us assuming responsibility for maintaining the ongoing operating, monitoring and maintenance activities through an AOC with the EPA. As a result of the publishing of the draft final decision, we determined that appropriate liability for operating, monitoring and maintaining the ongoing, remedial activities could be reasonably estimated and recorded approximately $14.0 million for the estimated undiscounted liabilities to be paid out over the next 30 years. See Part I, Item 1, “Business — Environmental”Environmental Compliance” and Part II, Item 8, NOTE 17, “Commitments and Contingencies” of this Annual Report on Form 10-K. There can be no assurances that GM will comply with its indemnity obligations or with its remedial obligations at the Indianapolis, Indiana facilities, or that future environmental remediation obligations will not have a material adverse effect on our results of operations. In addition, we occasionally evaluate various alternatives with respect to our facilities, including possible dispositions or closings. Investigations undertaken in connection with these activities may lead to discoveries of contamination that must be remediated, and closings of facilities may trigger remediation requirements that are not applicable to operating facilities. We may also face lawsuits brought by third parties that either allege property damage or personal injury as a result of, or seek reimbursement for costs associated with, such contamination.
We couldOur business and financial results may be materially adversely affected by anygovernment contracting risks.
We are subject to various laws and regulations applicable to parties doing business with the U.S. government, including laws and regulations governing performance of U.S. government contracts, the use and treatment of U.S. government furnished property and the nature of materials used in our products. We may be unilaterally suspended or barred from conducting business with the U.S. government, or become subject to fines or other sanctions if we are found to have violated such laws or regulations. As a result of the need to comply with these laws and regulations, we are subject to increased risks of governmental investigations, civil fraud actions, criminal prosecutions, whistleblower law suits and other enforcement actions. The laws and regulations to which we are subject include, but are not limited to, Export Administration Regulations, Federal Acquisition Regulation, International Traffic in Arms Regulations, Foreign Assets Control documentation and regulations from the Bureau of Alcohol, Tobacco and Firearms and the FCPA.
U.S. government contracts are subject to modification, curtailment or termination by the U.S. government without prior written notice, either for convenience or for default as a result of our failure to maintain cost controls.perform under the applicable contract. If terminated by the U.S. government as a result of our default, we could be liable for additional costs the U.S. government incurs in acquiring undelivered goods or services from another source and any other damages it suffers. Additionally, we cannot assign prime U.S. government contracts without the prior consent of the U.S. government contracting officer, and we are required to register with the Central Contractor Registration Database. Furthermore, the U.S. government periodically audits our governmental contract costs, which could result in fines, penalties or adjustment of costs and prices under the contracts.
Exchange rate fluctuations could adversely affect our results of operations and financial position.
We rely onAs a result of the expansion of our cost structure and operating discipline to achieve strong operating margins. There are many factors thatinternational operations, currency exchange rate fluctuations could affect our abilityresults of operations and financial position. We expect to realize expected cost savings or achieve future cost savingsgenerate an increasing portion of our net sales and expenses in such foreign currencies as the Japanese Yen, Euro, Indian Rupee, Brazilian Real, Chinese Yuan Renminbi, Canadian Dollar, British Pound, and Hungarian Forint. Although we may enter into foreign exchange agreements with financial institutions in order to reduce our exposure to fluctuations in the value of these and other foreign currencies, these transactions, if entered into, will not eliminate that we are not able to control, includingrisk entirely. To the inability to meet demand through our low-cost country sourcing model; the need for unexpected significant capital expenditures; unexpected changes in commodity or component pricingextent that we are unable to passmatch net sales received in foreign currencies with expenses paid in the same currency, exchange rate fluctuations could have a negative impact on to our suppliersresults of operations and financial condition. Additionally, because our consolidated financial results are reported in U.S. Dollars, if we generate net sales or customers;earnings in other currencies, the conversion of such amounts into U.S. Dollars can result in an increase or decrease in the amount of our inability to maintain efficiencies gained fromnet sales or earnings. Furthermore, we sell certain of our workforce optimization initiatives; andproducts in our failure to achieve and maintain expected cost savings fromnon-North American markets denominated in the U.S. Dollar. To the extent that certain of the local currencies in our multi-tier wage and benefit structure. Additionally, we have substantial indebtedness of approximately $2,820.8 million as of December 31, 2012. Our inability to maintain our cost controls could adversely impact our operating margins.
We have incurred, and will continue to incur, increased costsnon-North American markets are relatively weaker than the U.S. Dollar, whether as a result of operating as a publicly traded company, and our management is required to devote substantial time to new and continued compliance initiatives.
As a publicly traded company,foreign governments’ influence or otherwise, we have incurred, and will continue to incur, additional legal, accounting and other expenses that we did not previously incur while a private company. In addition, the Sarbanes-Oxley Act of 2002 (the “Sarbanes-Oxley Act”), the Dodd-Frank Wall Street Reform and Consumer Protection Act and the rules of the SEC and the New York Stock Exchange (“NYSE”), have imposed various requirements on public companies. Our management and other personnel devote a substantial amount of time to these compliance initiatives. Moreover, these rules and regulations have increased, and will continue to increase, our legal and financial compliance costs and have made, and will continue to make, some activities more time-consuming and costly. For example, these rules and regulations make it more difficult and more expensive for us to obtain director and officer liability insurance, and we are required to incur additional costs to maintain the same or similar coverage.
We have experienced significant losses and we cannot assure you that we will achieve or maintain profitability.
Although our net income for fiscal years 2012, 2011 and 2010 was $514.2 million, $103.0 million and $29.6 million, respectively, we had net losses of $328.1 million and $323.9 million for fiscal years 2008 and 2009, respectively. Our ability to achieve or maintain profitability is dependent upon a number of risks and uncertainties, many ofcould become less price competitive, which are beyond our control. We cannot ensure that we will be successful in executing our business strategy and achieving or maintaining profitability, and our failure to do so could have a material adverse effect on the results of our operations.
GM’s actions may materially affect our business and operating results.
Although we are an independent company as a result of the Acquisition Transaction, GM’s future actions may still have a material impact on our business and results of operations. Pursuant to the Cure Agreement after GM’s emergence from bankruptcy in 2009, GM has assumed certain agreements from its predecessor, including the asset purchase agreement, intellectual property and software license agreements and a hybrid co-branding agreement. GM’s failure to comply with any portion of these agreements for any reason, including the indemnities therein, could inhibit us from operating and expanding our business in the future.
Additionally, GM has received a non-exclusive, royalty-free, worldwide license to use the “Allison Transmission” name and certain related trademarks on GM’s line of A1000 transmissions for use primarily in Class 2 and 3 pick-up trucks. If GM, or any of its subsidiaries or affiliated entities, or any third party uses the trade name “Allison Transmission” in ways that adversely affect such trade name or trademark, our reputation could suffer damage, which in turn could have a material adverse effect on our business, results of operations and financial condition.
In connection with the Acquisition Transaction, we entered into a mutual non-compete agreement with GM that restricts GM from competing with us in non-defense vehicles in North America with gross vehicle weights above 5900 kilograms (typically Class 4 and higher) with some limited exceptions for certain GM light-duty pickup truck and van platforms. It also restricts GM from competing with us in defense vehicles globally and in non-defense vehicles outside North America that exceed 4250 kilograms (generally Class 3 to Class 4 and higher) with some limited exceptions. The non-compete periods extend until August 2017 globally, except in Europe, where they expired in 2012. Similarly, we are restricted from competing with GM in weight classes below the above mentioned thresholds for similar periods of time. Upon expiration of the non-competition periods, both Allison and GM will be permitted to compete with each other but such expiration will generally not affect Allison’s rights under the Patent and Technology License Agreement to use on an exclusive basis within its respective weight classes (subject to previously mentioned exceptions) the intellectual property that is licensed to Allison on an exclusive basis.
In addition, because of our current manufacturing services agreement with Opel Szentgotthard Automotive Manufacturing Ltd., a GM subsidiary, we may be materially adversely affected by the failure of GM to perform as expected. This non-performance may consist of delays or failures caused by production issues. The risk of non-performance may also result from the insolvency or bankruptcy of GM. GM’s ability to provide personnel and technical resources to us is also subject to a number of risks, including destruction of our equipment or work stoppages. In addition, our failure to provide an adequate facility, or order sufficient quantities of inventory, may increase the cost of production or may lead to GM refusing to provide resources to us at all. Our efforts to protect against and to minimize these risks may not always be effective.
An impairment in the carrying value of goodwill or other indefinite-lived intangible assets could negatively affect our consolidated results of operations and net worth.
Pursuant to GAAP, we are required to assess our goodwill and indefinite-lived intangible assets to determine if they are impaired on an annual basis, or more often if events or changes in circumstances indicate that impairment may have occurred. Intangible assets with finite lives are amortized over the useful life and are reviewed for impairment on triggering events such as events or changes in circumstances indicating that an impairment may have occurred. If the testing performed indicates that impairment has occurred, we are required to record a non-cash impairment charge for the difference between the carrying value of the goodwill and the implied fair value of the goodwill or the carrying value of the intangible assets and the fair value of the intangible assets in the period the determination is made. Disruptions to our business, end market conditions, protracted economic weakness and unexpected significant declines in operating results may result in charges for goodwill and other asset impairments.
Our annual goodwill impairment test for 2015 resulted in no goodwill impairment. Although our analysis regarding the fair value of goodwill indicates that it exceeds its carrying value, materially different assumptions regarding the future performance of our business could result in goodwill impairment losses. A review of our trade name in 2015 resulted in an impairment charge of $80.0 million. The impairment charge was triggered principally by lower forecasted net sales for certain of our end markets in the fourth quarter of 2015. The effects of the impairment did not result in any other charges to goodwill, other intangible assets or long-lived assets. See NOTE 2 and NOTE 5 of Notes to Consolidated Financial Statements included in Part II, Item 8 of this Annual Report on Form 10-K for additional details.
Provisions of our amended and restated certificate of incorporation and amended and restated bylaws and Delaware law might discourage, delay or prevent a change of control of our company or changes in our management and, as a result, depress the trading price of our common stock.
Our amended and restated certificate of incorporation and amended and restated bylaws contain provisions that could discourage, delay or prevent a change in control of our company or changes in our management that the stockholders of our company may deem advantageous. These provisions:
These anti-takeover defenses could discourage, delay or prevent a transaction involving a change in control of our company. These provisions could also discourage proxy contests and make it more difficult for our stockholders to elect directors of their choosing and cause us to take corporate actions other than those they desire.
Risks Related to Our Indebtedness
Our substantial indebtedness could adversely affect our financial health, restrict our activities and affect our ability to meet our obligations.
We have a significant amount of indebtedness. As of December 31, 2015, we had total indebtedness of $2,402.8 million and we would have been able to borrow an additional $461.0 million under the revolving portion of our credit facility, less $4.0 million of letters of credit. As of December 31, 2015, we had no outstanding borrowings against the revolving credit facility. At December 31, 2015, all $2,402.8 million of our total indebtedness was associated with ATI’s Senior Secured Credit Facility Term B-3 Loan due 2019 (“Term B-3 Loan,” and together with the revolving credit facility, the “Senior Secured Credit Facility”). For a complete description of the terms of the Senior Secured Credit Facility, please see Part II, Item 7, “Management’s Discussion and Analysis of Financial Condition and Results of Operations – Liquidity and Capital Resources.”
Our substantial indebtedness could have important consequences. For example, it could:
In addition, the revolving portion of our Senior Secured Credit Facility contains a maximum total senior secured leverage ratio. The Senior Secured Credit Facility also contain other negative and affirmative covenants that will limit our ability to engage in activities that may be in our long-term best interests. Our failure to comply with any of the covenants could result in an event of default which, if not cured or waived, could result in the acceleration of all of our indebtedness.
Our ability to pay regular dividends on our common stock is subject to the discretion of our Board of Directors and may be limited by our structure and statutory restrictions and restrictions imposed by the Senior Secured Credit Facility.
Our Board of Directors declared a quarterly dividend of $0.06 per share of common stock beginning in the second quarter of 2012, increased the quarterly dividend to $0.12 per share of common stock beginning in the second quarter of 2013 and increased the quarterly dividend again to $0.15 per share of common stock beginning in the fourth quarter of 2014. However, the payment of future dividends will be at the discretion of our Board of Directors and will depend on, among other things, our earnings, financial condition, capital requirements, level of indebtedness, statutory and contractual restrictions applying to the payment of dividends and other considerations that our Board of Directors deems relevant. The Senior Secured Credit Facility also effectively limits our ability to pay dividends. As a consequence of these limitations and restrictions, we may not be able to make, or may have to reduce or eliminate, the payment of dividends on our common stock. Accordingly, you may have to sell some or all of your common stock after price appreciation in order to generate cash flow from your investment. You may not receive a gain on your investment when you sell your common stock and you may lose the entire amount of the investment. Additionally, any change in the level of our dividends or the suspension of the payment thereof could adversely affect the market price of our common stock.
To service our indebtedness, we will require a significant amount of cash and our ability to generate cash depends on many factors beyond our control.
Our ability to make cash payments on our indebtedness and to fund planned capital expenditures will depend on our ability to generate significant operating cash flow in the future. This, to a significant extent, is subject to general economic, financial, competitive, legislative, regulatory and other factors that are beyond our control.
We cannot ensure that our business will generate sufficient cash flow from operations or that future borrowings will be available to us under the Senior Secured Credit Facility in an amount sufficient to enable us to pay our indebtedness or to fund our other liquidity needs. In such circumstances, we may need to refinance all or a portion of our indebtedness on or before maturity. We cannot ensure that we will be able to refinance any of our indebtedness on commercially reasonable terms or at all. If we cannot service our indebtedness, we may have to take actions such as selling assets, seeking additional equity or reducing or delaying capital expenditures, strategic acquisitions, investments and alliances. We cannot ensure that any such actions, if necessary, could be effected on commercially reasonable terms or at all.
If we are unable to generate sufficient cash flow or are otherwise unable to obtain funds necessary to meet required payments of principal, premium, if any, and interest on our indebtedness, or if we otherwise fail to comply with the various covenants in the instruments governing our indebtedness, we could be in default under the terms of the agreements governing such indebtedness. In the event of such default, the holders of such indebtedness could elect to declare all the funds borrowed thereunder to be due and payable, together with accrued and unpaid interest, the lenders under the Senior Secured Credit Facility could elect to terminate their commitments thereunder, cease making further loans and institute foreclosure proceedings against our assets, and we could be forced into bankruptcy or liquidation. If our operating performance declines, we may in the future need to obtain waivers from the required lenders under the Senior Secured Credit Facility to avoid being in default. If we or any of our subsidiaries breach the covenants under the Senior Secured Credit Facility and seek a waiver, we may not be able to obtain a waiver from the required lenders. If this occurs, we would be in default under the Senior Secured Credit Facility, the lenders could exercise their rights, as described above, and we could be forced into bankruptcy or liquidation.
Despite current indebtedness levels, we and our subsidiaries may still be able to incur additional indebtedness, which could further exacerbate the risks associated with our substantial financial leverage.
We and our subsidiaries may be able to incur additional indebtedness in the future because the terms of our indebtedness do not fully prohibit us or our subsidiaries from doing so. Subject to covenant compliance and certain conditions, our indebtedness permits additional borrowing, including total borrowing up to $400.0$461.0 million under the revolving portion of the Senior Secured Credit Facility. If new debt is added to our current debt levels and our subsidiaries’ current debt levels, the related risks that we and they now face could intensify.
Exchange rate fluctuations could adversely affect our results of operations and financial position.
As a result of the expansion of our international operations, currency exchange rate fluctuations could affect our results of operations and financial position. We expect to generate an increasing portion of our net sales and expenses in such foreign currencies as the Japanese Yen, Euro, Indian Rupee, Brazilian Real, Chinese Yuan Renminbi, Canadian Dollar, British Pound, and Hungarian Forint. Although we may enter into foreign exchange agreements with financial institutions in order to reduce our exposure to fluctuations in the value of these and other foreign currencies, these transactions, if entered into, will not eliminate that risk entirely. To the extent that we are unable to match net sales received in foreign currencies with expenses paid in the same currency, exchange rate fluctuations could have a negative impact on our results of operations and financial condition. Additionally, because our consolidated financial results are reported in U.S. Dollars, if we generate net sales or earnings in other currencies, the conversion of such amounts into U.S. Dollars can result in an increase or decrease in the amount of our net sales or earnings. Furthermore, we sell certain of our products in our non-North American markets denominated in the U.S. Dollar. To the extent that certain of the local currencies in our non-North American markets are relatively weaker than the U.S. Dollar, whether as a result of foreign governments’ influence or otherwise, we could become less price competitive, which could have a material adverse effect on the results of our operations.
GM’s actions may materially affect our business and operating results.
Although we are an independent company as a result of the Acquisition Transaction, GM’s future actions may still have a material impact on our business and results of operations. Pursuant to the Cure Agreement resulting from GM’s emergence from bankruptcy in 2009, GM has assumed certain agreements from its predecessor, including the Asset Purchase Agreement, intellectual property and software license agreements, lease agreements, engineering services agreements, an employee matters agreement and a hybrid co-branding agreement. GM’s failure to comply with any portion of these agreements for any reason, including the indemnities therein, could inhibit us from operating and expanding our business in the future.
Additionally, GM has received a non-exclusive, royalty-free, worldwide license to use the “Allison Transmission” name and certain related trademarks on GM’s line of A1000 transmission for use primarily in Class 2 and 3 pick up trucks. If GM, or any of its subsidiaries or affiliated entities, or any third party uses the trade name “Allison Transmission” in ways that adversely affect such trade name or trademark, our reputation could suffer damage, which in turn could have a material adverse effect on our business, results of operations and financial condition.
In connection with the Acquisition Transaction, we entered into a mutual non-compete agreement with GM that restricts GM from competing with us in non-military vehicles in North America with gross vehicle weights above 5900 kilograms (typically Class 4 and higher) with some limited exceptions for certain GM light-duty pickup truck and van platforms. It also restricts GM from competing with us in military vehicles globally and in non-military vehicles outside North America that exceed 4250 kilograms (generally Class 3 to Class 4 and higher) with some limited exceptions. The non-compete periods extend until August 2017 globally, except in Europe, where they expired in 2012. Similarly, we are restricted from competing with GM in weight classes below the above mentioned thresholds for similar periods of time. Upon expiration of the non-competition periods, both Allison and GM will be permitted to compete with each other but such expiration will generally not affect Allison’s rights under the Patent and Technology License Agreement to use on an exclusive basis within its respective weight classes (subject to previously mentioned exceptions) the intellectual property that is licensed to Allison on an exclusive basis.
In addition, because of our current manufacturing services agreement with Opel Szentgotthard Automotive Manufacturing Ltd., a GM subsidiary, we may be materially adversely affected by the failure of GM to perform as expected. This non-performance may consist of delays or failures caused by production issues. The risk of non-performance may also result from the insolvency or bankruptcy of GM. GM’s ability to provide personnel and technical resources to us is also subject to a number of risks, including destruction of our equipment or work stoppages. In addition, our failure to provide an adequate facility, or order sufficient quantities of inventory, may increase the cost of production or may lead to GM refusing to provide resources to us at all. Our efforts to protect against and to minimize these risks may not always be effective.
Usage of our net operating losses for U.S. federal income tax purposes may be subject to limitations in the future.
As of December 31, 2012, we had $363.0 million of net operating losses for U.S. federal income tax purposes. If we continue to generate taxable income in the future, we may be able to utilize these net operating losses to offset future federal income tax liabilities. In addition, our future financial performance may diminish our tax savings more rapidly than we currently anticipate. To the extent possible, we will structure our operating activities to minimize our income tax liabilities. However, there can be no assurance we will be able to reduce it to a specified level. Additionally, we are a controlled company, with two of our shareholders owning approximately 82% of our common stock, and should either of these shareholders sell a significant amount of their holdings we may experience a delay in our ability to recognize a portion of our net operating losses under Internal Revenue Code 382.
An impairment in the carrying value of goodwill or other indefinite-lived intangible assets could negatively affect our consolidated results of operations and net worth.
Pursuant to GAAP, we are required to assess our goodwill and indefinite-lived intangible assets to determine if they are impaired on an annual basis, or more often if events or changes in circumstances indicate that impairment may have occurred. Intangible assets with finite lives are amortized over the useful life and are reviewed for impairment on triggering events such as events or changes in circumstances indicating that an impairment may have occurred. If the testing performed indicates that impairment has occurred, we are required to record a non-cash impairment charge for the difference between the carrying value of the goodwill and the implied fair value of the goodwill or the carrying value of the intangible assets and the fair value of the intangible assets in the period the determination is made. Disruptions to our business, end market conditions, protracted economic weakness and unexpected significant declines in operating results may result in charges for goodwill and other asset impairments.
Our annual goodwill and trade name impairment test for the year ended December 31, 2012 resulted in no impairment. Although our analysis regarding the fair values of our goodwill and trade name indicates that they more likely than not exceed their carrying values, materially different assumptions regarding the future performance of our business could result in impairment losses. See NOTE 2 and NOTE 5 of Notes to Consolidated Financial Statements included in Part II, Item 8 of this Annual Report on From 10-K for additional details.
We are controlled by Carlyle and Onex, whose interests in our business may be different than our other stockholders.
As of December 31, 2012, Carlyle and Onex each owned approximately 40.9% of our equity. Pursuant to an amended and restated stockholders agreement, a majority of the Board of Directors has been designated by Carlyle and Onex and is affiliated with Carlyle and Onex. See Part III, Item 13, “Certain Relationships and Related Transactions, and Director Independence” of this Annual Report on Form 10-K. As a result, Carlyle and Onex or their nominees to the Board of Directors have the ability to control the appointment of our management, the entering into of mergers, sales of substantially all of our assets and other extraordinary transactions and influence amendments to our certificate of incorporation. So long as Carlyle and Onex continue to own a majority of our equity, they will have the ability to control the vote in any election of directors and will have the ability to prevent any transaction that requires stockholder approval regardless of whether others believe the transaction is in our best interests. The interests of Carlyle and Onex could conflict with those of our other stockholders. In addition, Carlyle and Onex may in the future own businesses that directly compete with ours.
Our ability to pay regular dividends on our common stock is subject to the discretion of our Board of Directors and may be limited by our structure and statutory restrictions and restrictions imposed by the Senior Secured Credit Facility and the indenture governing the 7.125% Senior Notes as well as any future agreements.
Our Board of Directors declared quarterly dividends of $0.06 per share of common stock beginning in the second quarter of 2012. However, the payment of future dividends will be at the discretion of our Board of Directors and will depend on, among other things, our earnings, financial condition, capital requirements, level of indebtedness, statutory and contractual restrictions applying to the payment of dividends and other considerations that our Board of Directors deems relevant. The Senior Secured Credit Facility and the indenture governing the 7.125% Senior Notes also effectively limit our ability to pay dividends. As a consequence of these limitations and restrictions, we may not be able to make, or may have to reduce or eliminate, the payment of dividends on our common stock. Accordingly, you may have to sell some or all of your common stock after price appreciation in order to generate cash flow from your investment. You may not receive a gain on your investment when you sell your common stock and you may lose the entire amount of the investment. Additionally, any change in the level of our dividends or the suspension of the payment thereof could adversely affect the market price of our common stock.
Provisions of our amended and restated certificate of incorporation and amended and restated bylaws and Delaware law might discourage, delay or prevent a change of control of our company or changes in our management and, as a result, depress the trading price of our common stock.
As of March 12, 2012, our amended and restated certificate of incorporation and amended and restated bylaws contain provisions that could discourage, delay or prevent a change in control of our company or changes in our management that the stockholders of our company may deem advantageous. These provisions:
authorize the issuance of blank check preferred stock that our Board of Directors could issue to increase the number of outstanding shares and to discourage a takeover attempt;
limit the ability of stockholders to remove directors only “for cause” if the Sponsors and their respective affiliates (other than Allison) collectively cease to own more than 50% of our common stock;
prohibit our stockholders from calling a special meeting of stockholders if the Sponsors and their respective affiliates (other than Allison) collectively cease to own more than 50% of our common stock;
prohibit stockholder action by written consent, which requires all stockholder actions to be taken at a meeting of our stockholders, if the Sponsors and their respective affiliates (other than Allison) collectively cease to own more than 50% of our common stock;
provide that the Board of Directors is expressly authorized to adopt, or to alter or repeal our bylaws;
establish advance notice requirements for nominations for election to our Board of Directors or for proposing matters that can be acted upon by stockholders at stockholder meetings;
establish a classified Board of Directors, with three staggered terms; and
require the approval of holders of at least two-thirds of the outstanding shares of common stock to amend the bylaws and certain provisions of the certificate of incorporation if the Sponsors and their respective affiliates (other than Allison) collectively cease to own more than 50% of our common stock.
These anti-takeover defenses could discourage, delay or prevent a transaction involving a change in control of our company. These provisions could also discourage proxy contests and make it more difficult for our non-controlling stockholders to elect directors of their choosing and cause us to take corporate actions other than those they desire.
We are a “controlled company” within the meaning of the NYSE rules and, as a result, qualify for, and rely on, exemptions from certain corporate governance requirements. Our stockholders do not have the same protections afforded to stockholders of companies that are subject to such requirements.
As of December 31, 2012, Carlyle and Onex continue to control a majority of the voting power of our outstanding common stock. As a result, we are a “controlled company” within the meaning of the NYSE corporate governance standards. Under these rules, a company of which more than 50% of the voting power is held by an individual, group or another company is a “controlled company” and may elect not to comply with certain corporate governance requirements, including:
the requirement that a majority of the Board of Directors consist of independent directors;
the requirement that we have a nominating and corporate governance committee that is composed entirely of independent directors with a written charter addressing the committee’s purpose and responsibilities;
the requirement that we have a compensation committee that is composed entirely of independent directors with a written charter addressing the committee’s purpose and responsibilities; and
the requirement for an annual performance evaluation of the nominating and corporate governance committee and compensation committee.
We currently utilize certain of these exemptions and intend to continue to do so for so long as we continue to qualify as a “controlled company.” Our nominating and corporate governance and compensation committees do not consist entirely of independent directors and such committees are not subject to annual performance evaluations. Accordingly, our stockholders do not have the same protections afforded to stockholders of companies that are subject to all of the corporate governance requirements of the NYSE.
ITEM 1B. Unresolved Staff Comments
None.
Our world headquarters, which we own, is located at One Allison Way, Indianapolis, Indiana 46222. As of December 31, 2012,2015, we have a total of 1617 manufacturing and certain other facilities in sixseven countries. The following table sets forth certain information regarding these facilities.
Plant | Location | Approximate | Owned / Leased |
| Description | ||||||||||
Plant #3 | Indianapolis | 927,000 | Own | Engineering, Operational Support | |||||||||||
Plant #4 | Indianapolis | 425,900 | Own | Manufacturing | |||||||||||
Plant #6 | Indianapolis | 431,500 | Own | Manufacturing | |||||||||||
Plant #16 | Indianapolis | 391,700 | Own | Manufacturing | |||||||||||
Plant #12 | Indianapolis | 534,900 | Own | Manufacturing | |||||||||||
Plant #14 | Indianapolis | 481,100 | Own | Manufacturing | |||||||||||
Plant #15 | Indianapolis | 126,400 | Lease | Manufacturing | |||||||||||
Plant #17 | Indianapolis | 389,000 | Own | Parts Distribution Center | |||||||||||
Plant #20 Tech. Center | Indianapolis | 59,000 | Own | Engineering & Testing | |||||||||||
Plant #21 Tech. Center | Indianapolis | 10,000 | Own | Engineering & Testing | |||||||||||
Szentgotthard | Hungary | 149,000 | Own | Manufacturing & Customization | |||||||||||
Szentgotthard | Hungary | 3,900 | Own | Sales & Marketing Support | |||||||||||
Shanghai | China | 38,000 | Lease | Customization & Distribution | |||||||||||
Santo Amaro/Sorocabo | Brazil | 31,400 | Own | Customization & Distribution | |||||||||||
Chennai | India | 258,500 | Own | Manufacturing | |||||||||||
Dubai | United Arab Emirates | 16,500 | Lease | Distribution | |||||||||||
Sliedrecht | The Netherlands | 37,000 | Lease | Customization & Distribution | |||||||||||
We believe all our facilities are suitable for their intended purpose, are being efficiently utilized and provide adequate capacity to meet demand for the next several years. The table above does not include sales offices located in various countries.
We are subject to various contingencies, including routine legal proceedings and claims arising out of the normal course of business. These proceedings primarily involve commercial claims, product liability claims, personal injury claims and workers’ compensation claims. The outcome of these lawsuits, legal proceedings and claims cannot be predicted with certainty. Nevertheless, we believe the outcome of any of these currently existing proceedings, even if determined adversely, would not have a material adverse effect on our financial condition or results of operations.
ITEM 4. Mine Safety Disclosures
Not applicable.
ITEM 5. Market for Registrant’s Common Equity, Related Stockholder Matters and Issuer Purchases of Equity Securities
Market Information
Shares of ourOur common stock began tradingis listed on the NYSE under the symbol “ALSN” on March 15, 2012. Prior to that time, there was no established public trading market for our common stock.“ALSN.” The following table sets forth the high and low sale prices per share for our common stock on the NYSE and the dividends declared per share for each quarter for the periods indicated:
| High | Low | Dividends Declared | High | Low | Dividends Declared | |||||||||||||||||||
Year Ended December 31, 2012: | ||||||||||||||||||||||||
First Quarter (beginning March 15, 2012) | $ | 25.20 | $ | 22.70 | $ | 0.00 | ||||||||||||||||||
Year Ended December 31, 2015: | ||||||||||||||||||||||||
First Quarter | $ | 33.85 | $ | 31.14 | $ | 0.15 | ||||||||||||||||||
Second Quarter | $ | 25.22 | $ | 15.92 | $ | 0.06 | $ | 32.31 | $ | 29.21 | $ | 0.15 | ||||||||||||
Third Quarter | $ | 20.65 | $ | 15.82 | $ | 0.06 | $ | 29.91 | $ | 26.12 | $ | 0.15 | ||||||||||||
Fourth Quarter | $ | 22.00 | $ | 17.95 | $ | 0.06 | $ | 29.28 | $ | 24.64 | $ | 0.15 | ||||||||||||
Year Ended December 31, 2014: | ||||||||||||||||||||||||
First Quarter | $ | 31.27 | $ | 26.41 | $ | 0.12 | ||||||||||||||||||
Second Quarter | $ | 31.42 | $ | 28.56 | $ | 0.12 | ||||||||||||||||||
Third Quarter | $ | 32.21 | $ | 28.34 | $ | 0.12 | ||||||||||||||||||
Fourth Quarter | $ | 34.62 | $ | 26.15 | $ | 0.15 | ||||||||||||||||||
Holders
As of December 31, 2012,February 5, 2016, there were 40approximately 38,700 stockholders of record of our common stock. The number of record holders is based uponstock, which includes the actual number of holders registered on the books of the Company at such date and does not include holders of shares in “street name” or persons, partnerships, associations, corporations or other entities identified in security position listings maintained by depositories.
Dividends
Our Board of Directors declared a quarterly dividendsdividend of $0.06(i) $0.15 per share beginning ineach quarter during 2015 and for the secondfourth quarter of 2012. Prior to these dividend payments, we had not paid dividends on our common stock.2014 and (ii) $0.12 per share for the first, second and third quarters of 2014. We expect to continue paying cash dividends on a quarterly basis; however, future dividends are subject to approval of the Board of Directors and may be adjusted as business needs or market conditions change. In addition, our Senior Secured Credit Facility restricts the payment of dividends under certain circumstances.
Unregistered Sales of Securities
During the period covered by this Annual Report on Form 10-K, we did not offer or sell any securities that were not registered under the Securities Act of 1933, as amended (the “Securities Act”).
Issuer Purchases of Equity Securities
We did not purchase anyOn October 30, 2014, our Board of Directors authorized us to repurchase up to $500.0 million of our equity securities duringcommon stock pursuant to a stock repurchase program (“Repurchase Program”). The terms of the fourth quarterRepurchase Program provide that we may repurchase shares of 2012.our common stock, from time to time depending on market conditions and corporate needs, in the open market or through privately negotiated transactions in accordance with Rule 10b-18 of the Exchange Act. Unless earlier terminated by our Board of Directors, the Repurchase Program will expire on December 31, 2016.
The following table sets forth information related to our repurchase of our common stock on a monthly basis in the three months ended December 31, 2015:
| Total Number of Shares Purchased(1) | Average Price Paid per Share | Total Number of Shares Purchased as Part of Publicly Announced Plans or Programs(2) | Approximate Dollar Value of Shares that May Yet Be Purchased Under Plans(2) | |||||||||||||
October 1 – October 31, 2015 | — | $ | — | — | $ | 203,773,549 | ||||||||||
November 1 – November 30, 2015 | 348,505 | $ | 27.30 | 348,505 | $ | 194,260,559 | ||||||||||
December 1 – December 31, 2015 | 1,807 | $ | 25.89 | — | $ | 194,260,559 | ||||||||||
|
|
|
| |||||||||||||
Total | 350,312 | $ | 27.29 | 348,505 | ||||||||||||
|
|
|
| |||||||||||||
| (1) | Shares purchased include 1,807 shares withheld to cover taxes due upon the vesting of restricted stock in December 2015. |
| (2) | These values reflect repurchases made under the Repurchase Program. |
Issuances Under Equity Compensation Plans
For information regarding the securities authorized for issuance under our equity compensation plans, see Part II,III, Item 12 of this Annual Report on Form 10-K.
Comparative Stock Performance Graph
The information included under the heading “Comparative Stock Performance Graph” in this Item 5 of Part II of this Annual Report on Form 10-K shall not be deemed to be “soliciting material” or subject to Regulation 14A or 14C, shall not be deemed “filed” for purposes of Section 18 of the Exchange Act, or otherwise subject to the liabilities of that section, nor shall it be deemed incorporated by reference in any filing under the Securities Act or the Exchange Act.
Set forth below is a graph comparing the total cumulative returns of ALSN, the S&P 500 Index and an index of peer companies selected by us. Our peer group includes Pall Corporation, Donaldson Company Inc., Graco Inc., Roper Industries Inc., Gentex Corporation, Rockwell Automation Inc. and Sensata Technologies Holding N.V. The graph assumes $100 was invested on March 15, 2012 in our common stock and each of the indices and that all dividends, if any, are reinvested.
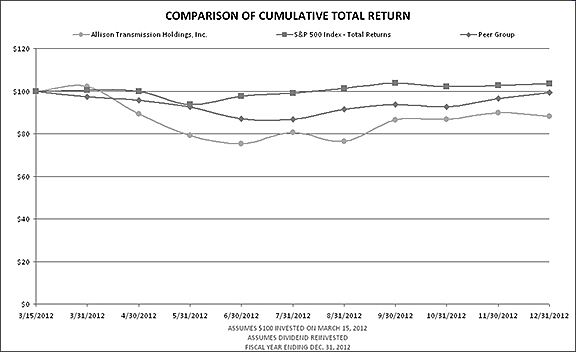
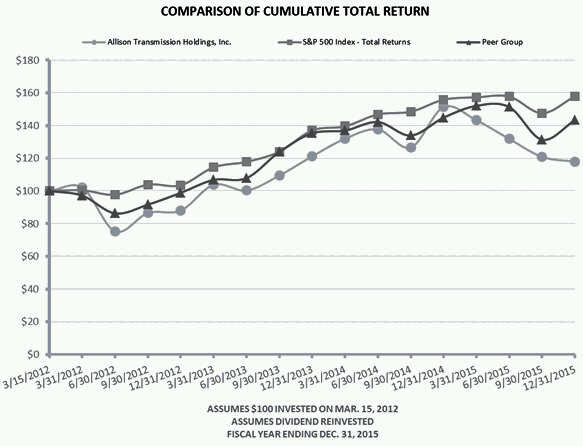
| As of March 15, 2012 | As of December 31, 2012 | As of March 15, 2012 | As of December 31, 2012 | As of December 31, 2013 | As of December 31, 2014 | As of December 31, 2015 | ||||||||||||||||||||||||
Allison Transmission Holdings, Inc. | $ | 100.00 | $ | 88.06 | $ | 100.00 | $ | 88.06 | $ | 121.20 | $ | 151.30 | $ | 117.90 | ||||||||||||||||
S&P 500 Index | 100.00 | 103.52 | 100.00 | 103.52 | 137.04 | 155.80 | 157.96 | |||||||||||||||||||||||
Peer Group | 100.00 | 99.32 | 100.00 | 98.89 | 135.29 | 144.86 | 143.33 | |||||||||||||||||||||||
| (1) | Pall Corporation has been removed from our Peer Group as a result of no longer being a publicly traded company. |
ITEM 6. Selected Financial Data
The following table sets forth certain financial information for the most recent five years ended December 31, 2012.years. The following table should be read in conjunction with Part II, Item 7, “Management’s Discussion and Analysis of Financial Condition and Results of Operations” and Part II, Item 8, “Financial Statements and Supplementary Data” of this Annual Report on Form 10-K.
| (in millions, except per share data) | Dec. 31, 2012 | Dec. 31, 2011 | Dec. 31, 2010 | Dec. 31, 2009 | Dec. 31, 2008 | |||||||||||||||
Consolidated Statements of Operations: | ||||||||||||||||||||
Net sales | $ | 2,141.8 | $ | 2,162.8 | $ | 1,926.3 | $ | 1,766.7 | $ | 2,061.4 | ||||||||||
Gross profit | 954.3 | 954.5 | 828.2 | 619.8 | 735.9 | |||||||||||||||
Operating expenses: | ||||||||||||||||||||
Selling, general and administrative expenses | 419.0 | 409.1 | 384.9 | 391.2 | 412.6 | |||||||||||||||
Engineering—research and development | 115.1 | 116.4 | 101.5 | 89.7 | 88.6 | |||||||||||||||
Trade name impairment | — | — | — | 190.0 | 179.8 | |||||||||||||||
Total operating expenses | 534.1 | 525.5 | 486.4 | 670.9 | 681.0 | |||||||||||||||
Operating income (loss) | 420.2 | 429.0 | 341.8 | (51.1 | ) | 54.9 | ||||||||||||||
Other (expense) income, net: | ||||||||||||||||||||
Interest income | 0.9 | 0.9 | 3.5 | 1.4 | 5.1 | |||||||||||||||
Interest expense | (152.1 | ) | (218.2 | ) | (281.0 | ) | (235.6 | ) | (391.0 | ) | ||||||||||
Premiums and expenses on tender offer for long-term debt | — | (56.9 | ) | — | — | — | ||||||||||||||
Other (expense) income, net | (52.8 | ) | (4.2 | ) | 19.0 | 2.8 | 40.0 | |||||||||||||
Total other expense, net | (204.0 | ) | (278.4 | ) | (258.5 | ) | (231.4 | ) | (345.9 | ) | ||||||||||
Income (loss) before income taxes | 216.2 | 150.6 | 83.3 | (282.5 | ) | (291.0 | ) | |||||||||||||
Income tax benefit (expense) | 298.0 | (47.6 | ) | (53.7 | ) | (41.4 | ) | (37.1 | ) | |||||||||||
Net income (loss) | $ | 514.2 | $ | 103.0 | $ | 29.6 | $ | (323.9 | ) | $ | (328.1 | ) | ||||||||
Earnings (Loss) Per Share Data: | ||||||||||||||||||||
Basic earnings (loss) per share | $ | 2.83 | $ | 0.57 | $ | 0.16 | $ | (1.79 | ) | $ | (1.81 | ) | ||||||||
Weighted-average shares outstanding (in thousands) | 182.0 | 181.4 | 181.4 | 181.3 | 181.4 | |||||||||||||||
Diluted earnings (loss) per share | $ | 2.76 | $ | 0.56 | $ | 0.16 | $ | (1.79 | ) | $ | (1.81 | ) | ||||||||
Diluted weighted-average shares outstanding (in thousands) | 186.2 | 183.3 | 181.4 | 181.3 | 181.4 | |||||||||||||||
Dividends per common share | $ | 0.18 | $ | — | $ | — | $ | — | $ | — | ||||||||||
Consolidated Balance Sheet Data: | ||||||||||||||||||||
Cash and cash equivalents | $ | 80.2 | $ | 314.0 | $ | 252.2 | $ | 153.1 | $ | 237.9 | ||||||||||
Total assets | 4,866.0 | 5,192.6 | 5,310.4 | 5,410.8 | 5,977.8 | |||||||||||||||
Total debt | 2,820.8 | 3,378.6 | 3,671.1 | 3,874.1 | 3,991.3 | |||||||||||||||
Stockholders’ equity | 1,356.9 | 821.7 | 741.7 | 736.6 | 1,015.5 | |||||||||||||||
| (in millions, except per share data) | Dec. 31, 2015 | Dec. 31, 2014 | Dec. 31, 2013 | Dec. 31, 2012 | Dec. 31, 2011 | |||||||||||||||
Consolidated Statements of Operations: | ||||||||||||||||||||
Net sales | $ | 1,985.8 | $ | 2,127.4 | $ | 1,926.8 | $ | 2,141.8 | $ | 2,162.8 | ||||||||||
Gross profit | 933.8 | 975.9 | 841.9 | 954.3 | 954.5 | |||||||||||||||
Operating expenses: | ||||||||||||||||||||
Selling, general and administrative expenses | 317.1 | 344.6 | 334.9 | 419.0 | 409.1 | |||||||||||||||
Engineering — research and development | 92.5 | 103.8 | 97.1 | 115.1 | 116.4 | |||||||||||||||
Trade name impairment | 80.0 | — | — | — | — | |||||||||||||||
Environmental remediation | 14.0 | — | — | — | — | |||||||||||||||
Loss associated with impairment of long-lived assets | 1.3 | 15.4 | — | — | — | |||||||||||||||
Total operating expenses | 504.9 | 463.8 | 432.0 | 534.1 | 525.5 | |||||||||||||||
Operating income | 428.9 | 512.1 | 409.9 | 420.2 | 429.0 | |||||||||||||||
Other income (expense), net: | ||||||||||||||||||||
Interest income | 0.7 | 0.9 | 0.8 | 0.9 | 0.9 | |||||||||||||||
Interest expense | (115.2 | ) | (139.3 | ) | (133.7 | ) | (152.1 | ) | (218.2 | ) | ||||||||||
Premiums and expenses on tender offer and redemption of long-term debt | (25.3 | ) | — | — | — | (56.9 | ) | |||||||||||||
Other expense, net | (0.3 | ) | (5.6 | ) | (10.9 | ) | (52.8 | ) | (4.2 | ) | ||||||||||
Total other expense, net | (140.1 | ) | (144.0 | ) | (143.8 | ) | (204.0 | ) | (278.4 | ) | ||||||||||
Income before income taxes | 288.8 | 368.1 | 266.1 | 216.2 | 150.6 | |||||||||||||||
Income tax (expense) benefit | (106.5 | ) | (139.5 | ) | (100.7 | ) | 298.0 | (47.6 | ) | |||||||||||
Net income | $ | 182.3 | $ | 228.6 | $ | 165.4 | $ | 514.2 | $ | 103.0 | ||||||||||
Earnings Per Share Data: | ||||||||||||||||||||
Basic earnings per share | $ | 1.03 | $ | 1.27 | $ | 0.90 | $ | 2.83 | $ | 0.57 | ||||||||||
Weighted-average shares outstanding | 175.9 | 179.8 | 184.5 | 182.0 | 181.4 | |||||||||||||||
Diluted earnings per share | $ | 1.03 | $ | 1.25 | $ | 0.88 | $ | 2.76 | $ | 0.56 | ||||||||||
Diluted weighted-average shares outstanding | 177.2 | 182.3 | 187.9 | 186.2 | 183.3 | |||||||||||||||
Dividends declared per common share | $ | 0.60 | $ | 0.51 | $ | 0.42 | $ | 0.18 | $ | — | ||||||||||
Consolidated Balance Sheet Data: | ||||||||||||||||||||
Cash and cash equivalents | $ | 251.6 | $ | 263.0 | $ | 184.7 | $ | 80.2 | $ | 314.0 | ||||||||||
Total assets(1) | 4,408.4 | 4,656.2 | 4,812.6 | 4,866.0 | 5,192.6 | |||||||||||||||
Total debt(1) | 2,377.2 | 2,491.2 | 2,678.3 | 2,820.8 | 3,378.6 | |||||||||||||||
Stockholders’ equity | 1,188.6 | 1,397.8 | 1,438.8 | 1,356.9 | 821.7 | |||||||||||||||
| (1) | Total assets and total debt as of December 31, 2015 and 2014 include reclassifications as a result of compliance with newly adopted Financial Accounting Standards Board’s (“FASB”) authoritative accounting guidance. For more information, see our consolidated financial statements and the notes thereto included in Part II, Item 8 of this Annual Report on Form 10-K. |
ITEM 7. Management’s Discussion and Analysis of Financial Condition and Results of Operations
The following discussion contains forward-looking statements that involve risks and uncertainties. Our actual results may differ materially from those discussed in the forward looking statements as a result of various factors, including, without limitation, those set forth under Part I, Item 1A, “Risk Factors,” and other matters included elsewhere in this Annual Report on Form 10-K. The following discussion and analysis of our financial condition and results of operations should be read in conjunction with our consolidated financial statements and the notes thereto included elsewhere in this Annual Report on Form 10-K, as well as the information presented under Part II, Item 6 of this Annual Report on Form 10-K.
Overview
We design and manufacture commercial and defense fully-automatic transmissions for medium-transmissions. The business was founded in 1915 and heavy-duty commercial vehicles, medium-has been headquartered in Indianapolis, Indiana since inception. Allison was an operating unit of Old GM from 1929 until 2007, when Allison once again became a stand-alone company. In March 2012, Allison began trading on the New York Stock Exchange under the symbol, “ALSN”.
We have approximately 2,700 employees and heavy-tactical U.S. military vehicles and hybrid-propulsion systems for transit buses. We generate our net sales primarily from the sale of transmissions,13 different transmission parts, support equipment, military kits, engineering services and extended transmission coverage (“ETC”) to a wide array of OEMs, distributors and the U.S. government.product lines. Although approximately 78%81% of our net salesrevenues were generated in North America in 2012,2015, we have a global presence by serving customers in Europe, Asia, South America and Africa. As of December 31, 2012, we had approximately 2,800 employees and 12 different transmission product lines. Since the introduction of our first fully-automatic transmission over 60 years ago, our products have gained acceptance in a wide variety of applications, including on-highway trucks (distribution, refuse, construction, fire and emergency), buses (primarily school, transit and hybrid-transit), motorhomes, off-highway vehicles and equipment (primarily energy, mining and construction) and military vehicles (wheeled and tracked). We have developed over 100 different product models that are used in more than 2,500 different vehicle configurations, which are compatible with more than 500 combinations of engine brands, models and ratings. We also sell support equipment and Allison-branded replacement parts for our transmissions and remanufactured transmissions for use in the vehicle aftermarket.
Allison Transmission, which is headquartered in Indianapolis, Indiana, was founded in 1915 and acquired by our Sponsors in August 2007 from Old GM. The Acquisition Transaction was structured asserve customers through an asset purchase for U.S. federal income tax purposes, which resulted in a step-up in the U.S. federal income tax basis of our assets that allows us to take substantial amortization deductions for U.S. federal income tax purposes. As of December 31, 2012, we had $3.0 billion of unamortized intangible assets for income tax purposes which may be amortized over a periodindependent network of approximately 9.6 years. These assets are expected to generate U.S. federal income tax deductions of approximately $315.0 million annually through 20211,400 independent distributor and approximately $183.0 million in 2022. If we continue to generate taxable income in the future, the amortization of these assets, together with existing U.S. net operating losses of $363.0 million as of December 31, 2012, will be used to reduce our U.S. federal cash income tax payments.dealer locations worldwide.
Recent Developments
On February 6, 2013, we completed an extension and refinance of ATI’s Senior Secured Credit Facility replacing $411.4 million of the Term B-1 Loan and $793.1 million of the Term B-2 Loan for term loan debt due August 2017 with an interest rate margin at our option, either (a) 3.00% above the LIBOR or (b) 2.00% above the greater of the prime lending rate provided by the British Banking Association or the federal funds effective rate published by the Federal Reserve Bank of New York. The extension of the Term B-1 Loan also extended the revolving credit facility to August 2016.
Trends Impacting Our Business
Our net sales are driven by commercial vehicle production, which tends to be highly correlated to macroeconomic conditions. According to ACT Research, commercial truck and bus production volumesIn 2016, we expect tempering demand conditions in ourthe North American on-highway markets are projected to grow, but to remain belowAmerica On-Highway end market, no meaningful relief from the 1998-2008 average production levels through 2015. However, we maintain a cautious approach given the continued heightened level of uncertainty in ourglobal Off-Highway end markets challenges and the lack of near-term visibility and confidence in certain of our end markets.divergent global economic environments. Our 20132016 net sales outlook also incorporates an assumed continuation of cyclically low levels of demand in the North America energy sector’s hydraulic fracturing market, theassumes previously considered reductions in U.S. defense spending to longer term averages experienced during periods without active conflicts and lower demand in thefor North America Hybrid-Propulsion Systems for Transit Bus end market due to municipal spending constraints. Accordingly, we assume year over year net sales reductions in the Global Off-Highway, Militaryengine emissions improvements and North America Hybrid-Propulsion Systems for Transit Bus end markets partially offset by year over year net sales growth in the Global On-Highway and Service Parts, Support Equipment & Other end markets.non-hybrid alternatives.
Full Year 20122015 and 20112014 Net Sales by End Market (in millions)
End Market | 2012 Net Sales | 2011 Net Sales | % Variance | 2015 Net Sales | 2014 Net Sales | % Variance | ||||||||||||||||||
North America On-Highway | $ | 813 | $ | 727 | 12 | % | $ | 1,059 | $ | 988 | 7 | % | ||||||||||||
North America Hybrid Propulsion Systems for Transit Bus | $ | 115 | $ | 134 | (14 | %) | ||||||||||||||||||
North America Hybrid-Propulsion Systems for Transit Bus | 73 | 93 | (22 | %) | ||||||||||||||||||||
North America Off-Highway | $ | 157 | $ | 280 | (44 | %) | 55 | 100 | (45 | %) | ||||||||||||||
Military | $ | 305 | $ | 304 | 0 | % | ||||||||||||||||||
Defense | 113 | 157 | (28 | %) | ||||||||||||||||||||
Outside North America On-Highway | $ | 290 | $ | 277 | 5 | % | 262 | 264 | (1 | %) | ||||||||||||||
Outside North America Off-Highway | $ | 114 | $ | 87 | 31 | % | 35 | 81 | (57 | %) | ||||||||||||||
Service, Parts, Support Equipment & Other | $ | 348 | $ | 354 | (2 | %) | ||||||||||||||||||
Service Parts, Support Equipment and Other | 389 | 444 | (12 | %) | ||||||||||||||||||||
|
|
|
| |||||||||||||||||||||
Total Net Sales | $ | 2,142 | $ | 2,163 | (1 | %) | $ | 1,986 | $ | 2,127 | (7 | %) | ||||||||||||
North America On-Highway end market net sales were up 12%7% for the year ended December 31, 20122015 compared to the year ended December 31, 2011. The increase was2014, principally driven by higher demand for Rugged Duty Series Pupil Transport/Shuttle Series and MotorhomeHighway Series models.
North America Hybrid-Propulsion Systems for Transit Bus end market net sales were down 14%22% for the year ended December 31, 20122015 compared to the year ended December 31, 20112014, principally driven by lower demand due to municipal subsidy and spending constraints, engine emissions improvements and non-hybrid alternative technologiesalternatives that generally require a fully-automatic transmission.transmission (e.g. xNG).
North America Off-Highway end market net sales were down 44%45% for the year ended December 31, 20122015 compared to the year ended December 31, 2011. The decrease was2014, principally driven by lower demand from hydraulic fracturing applications due to weakness in natural gas pricing.applications.
MilitaryDefense end market net sales were flatdown 28% for the year ended December 31, 20122015 compared to the year ended December 31, 2011 due2014, principally driven by the recognition of previously deferred revenue in 2014 related to higher wheeled product requirements being offset byshipment of certain tracked transmissions at the request of the U.S. government and lower tracked product requirements.U.S. defense spending.
Outside North America On-Highway end market net sales were up 5%down 1% for the year ended December 31, 20122015 compared to the year ended December 31, 2011 reflecting strength2014, principally driven by lower demand in China partially offset by weakerhigher demand in Europe and Latin America.Europe.
Outside North America Off-Highway end market net sales were up 31%down 57% for the year ended December 31, 20122015 compared to the year ended December 31, 20112014, principally driven by increasedweak demand in the miningenergy and energymining sectors.
Service parts, support equipment & other end market net sales were down 2%12% for the year ended December 31, 20122015 compared to the year ended December 31, 2011. The decrease was2014, principally driven by lower demand for global off-highwayNorth America service parts, partially offset by increased support equipment sales commensurate with increased transmission unit volumes.
Key Components of our Results of Operations
Net sales
We generate our net sales primarily from the sale of transmissions, transmission parts, support equipment, militarydefense kits, engineering services, royalties and extended transmission coverageExtended Transmission Coverage to a wide array of OEMs, distributors and the U.S. government. Sales are recorded net of provisions for customer allowances and other rebates. Engineering services are recorded as net sales in accordance with the terms of the contract. The associated costs are recorded in cost of sales. We also have royalty agreements with third parties that provide net sales as a result of joint efforts in developing marketable products.
Cost of sales
Our most significantprimary components of cost of sales are purchased parts, the overhead expense related to our manufacturing operations and direct labor associated with the manufacture and assembly of transmissions and parts. For the year ended December 31, 2012,2015, direct material costs were approximately 70%68%, overhead costs were approximately 24%,26% and direct labor costs were approximately 6% of total cost of sales. We are subject to changes in our cost of sales caused by movements in underlying commodity prices. We seek to hedge against this risk by using commodity swap contracts and LTSAs. See Part II, Item 7A, “Quantitative and Qualitative Disclosures about Market Risk—Commodity Price Risk” included in this Annual Report on Form 10-K.
Selling, general and administrative expenses
The principal components of our selling, general and administrative expenses are salaries and benefits for our office personnel, advertising and promotional expenses, product warranty expense, expenses relating to certain information technology systems and amortization of our intangibles.
Engineering — research and development
We incur costs in connection with research and development programs that are expected to contribute to future earnings. Such costs are expensed as incurred. In 2009, we were notified by the DOE that we were selected to receive matching funds up to $62.8 million from a cost-share grant program funded by the American Recovery and Reinvestment Act for the development of hybrid-propulsion system manufacturing capacity in the U.S. (the “Grant Program”). Applicable costs associated with the Grant Program have been charged to Engineering — research and development. The DOE’s matching reimbursement is recorded to Other (expense) income, net in the Consolidated Statements of Comprehensive Income (Loss) included in Part II, Item 8, of this Annual Report on Form 10-K, or in the case of capital expenditure, as a reduction in the cost basis of the capital asset.
Critical Accounting Policies and Significant Accounting Estimates
The preparation of the consolidated financial statements in accordance with GAAP requires management to make estimates and assumptions that affect the reported amounts of some assets and liabilities and, in some instances, the reported amounts of net sales and expenses during the applicable reporting period. Differences between actual amounts and estimates are recorded in the period identified. Management believes the accounting estimates discussed below represent those accounting estimates that require the exercise of judgment where a different set of judgments could result in changes to our reported results.
Revenue recognition
We record sales when title has transferred to the customer, there is evidence of an agreement, the sales price is fixed and determinable and the collection of the related accounts receivable is reasonably assured. We sell ETC for which sales are deferred. ETC sales are recognized ratably over the period of the ETC, which typically ranges from three to five years after initial sale. Distributor and customer sales incentives, consisting of allowances and other rebates, are estimated at the time of sale based upon our history and experience and are recorded as a reduction to net sales. Incentive programs are generally product specific or region specific. Some factors used in estimating the cost of incentives include the number of transmissions that will be affected by the incentive program and rate of acceptance of any incentive program. If the actual number of affected transmissions differs from this estimate, or if a different mix of incentives is actually paid, the impact on net sales would be recorded in the period that the change was identified.
Sales under U.S. government production contracts are recorded when the product is accepted and title has transferred to the U.S. government. Under the terms of the U.S. government contracts, there are certain price reduction clauses and provisions for potential price reductions which are estimated at the time of sale based upon our history and experience and are recorded as a reduction to net sales. Potential reductions may be attributed to a change in projected sales volumes or plant efficiencies which impact overall costs.
Inventory
We value our inventory using the first-in, first-out method, and state our inventories at the lower of cost or net realizable value. In order to determine net realizable value, we analyze our inventory on a periodic basis to determine the amount of excess or obsolete inventory. Any decline in carrying value of estimated excess or obsolete inventory is recorded as a reduction of inventory and as an expense included in cost of sales in the period it is identified.
Impairment of goodwill and other intangibles
Goodwill represents the excess of purchase price paid over the fair value of net assets acquired. In accordance with the Financial Accounting Standards Board’s (“FASB”) authoritative accounting guidance on goodwill, we do not amortize goodwill but rather evaluate it for impairment on an annual basis, or more often if events or circumstances change that could cause goodwill to become impaired. There is one reporting unit which is the same as our one operating and reportable segment. We have elected to perform our annual impairment test on October 31 of every year. A multi-step impairment test is performed on goodwill. In Step 0, we evaluate various qualitative factors to determine the likelihood of impairment. If determined that the fair value is more likely than not less than the carrying value, then we are required to perform Step 1. In Step 1, we perform a quantitative analysis to compare the fair value of our reporting unit to its carrying value including goodwill. If the fair value of the reporting unit exceeds the carrying value of the net assets assigned to that unit, goodwill is not considered impaired, and we are not required to perform further testing. If the carrying value of the net assets assigned to the reporting unit exceeds the fair value of the reporting unit, then we must perform Step 2 of the impairment test in order to determine the implied fair value of the reporting unit’s goodwill. If the carrying value of a reporting unit’s goodwill exceeds its implied fair value, then we would record an impairment loss equal to the difference.
After reviewing various qualitative factors, our 2012 annual goodwill impairment test indicated that the fair value of the reporting unit more likely than not exceeded its carrying value, indicating no impairment. Our qualitative review included an assessment of various key assumptions and factors including, among others, an assessment of business changes, economic outlooks, financial trends and forecasts, credit ratings, equity ratings and discount rates. Events or circumstances that could unfavorably impact the key assumptions include lower net sales driven by market conditions, our inability to execute on marketing programs and/or delay in the introduction of new products, lower gross margins as a result of market conditions or failure to obtain forecasted cost reductions, or a higher discount rate as a result of market conditions. While unpredictable and inherently uncertain, we believe our forecast estimates were reasonable and incorporate assumptions that similar market participants would use in their estimates of fair value.
Other intangible assets have both indefinite and finite useful lives. Intangible assets with indefinite useful lives, such as our trade name, are not amortized but are tested annually for impairment. We have elected to perform our annual trade name impairment test on October 31 of every year and follow a similar multi-step impairment test that is performed on goodwill. After reviewing various qualitative factors, our 2012 annual trade name impairment test indicated that the fair value of the trade name more likely than not exceeded its carrying value, indicating no impairment. Our qualitative review included an assessment of various key assumptions and factors including, among others, an assessment of business changes, economic outlooks, financial trends and forecasts, royalty savings rates, credit ratings, equity ratings and discount rates. Events or circumstances that could unfavorably impact the key assumptions include lower net sales driven by market conditions, our inability to execute on marketing programs and/or delay in introduction of new products, and higher discount rate as a result of market conditions. While unpredictable and inherently uncertain, we believe the forecast estimates are reasonable and incorporate those assumptions that similar market participants would use in their estimates of fair value.
Intangible assets with finite lives are amortized over their estimated useful lives and reviewed for impairment when circumstances change that would create a triggering event. Customer relationships are amortized over the life in which expected benefits are to be consumed. The other remaining finite useful life intangibles are amortized on a straight-line basis over their useful lives. We evaluate the remaining useful life of the other intangible assets on a periodic basis to determine whether events or circumstances warrant a revision to the remaining useful life. Assumptions and estimates about future values and remaining useful lives of our intangible and other long-lived assets are complex and subjective. They can be affected by a variety of factors, including external factors, such as industry and economic trends, and internal factors such as changes in our business strategy and our internal forecasts. Although we believe the historical assumptions and estimates we have made are reasonable and appropriate, different assumptions and estimates could materially impact our reported financial results.
Impairment of long-lived assets
The carrying value of long-lived assets is evaluated whenever events or circumstances indicate that the carrying value of an asset may not be recoverable. Events or circumstances that would result in an impairment review primarily include a significant change in the use of an asset, or the planned sale or disposal of an asset. The asset would be considered impaired when there is no future use planned for the asset or the future net undiscounted cash flows generated by the asset or asset group are less than its carrying value. An impairment loss would be recognized based on the amount by which the carrying value exceeds fair value.
Assumptions and estimates used to determine cash flows in the evaluation of impairment and the fair values used to determine the impairment are subject to a degree of judgment and complexity. Any changes to the assumptions and estimates resulting from changes in actual results or market conditions from those anticipated may affect the carrying value of long-lived assets and could result in an impairment charge.
Warranty
We provide reserves for costs associated with warranty claims at the time the products are sold. Warranty claims arise when a transmission fails while in service during the relevant warranty period. The warranty reserve is provided for by adjusting selling, general and administrative expenses by an amount based on our current and historical warranty claims paid and associated repair costs. These estimates are established using historical information including the nature, frequency and average cost of warranty claims and are adjusted as actual information becomes available. Costs associated with ETC are recorded as incurred during the extended coverage period. From time to time, we may get involved in a specific field action program. As a result of the uncertainty surrounding the nature and frequency of specific field action programs, the liability for such programs is recorded when we commit to a specific field action. We review and assess the liability for these programs on a quarterly basis. We also assess our ability to recover certain costs from our suppliers and record a receivable from the supplier when we believe a recovery is probable.
Pension and post-retirement obligations
For pension and OPEB plans in which employees participate, costs are determined within the FASB’s authoritative accounting guidance set forth on employers’ defined benefit pensions including accounting for settlements and curtailments of defined benefit pension plans, termination of benefits and post-retirement benefits other than pensions. In accordance with the authoritative accounting guidance, we recognize the funded status of our defined benefit pension plans and OPEB plan in our Consolidated Balance Sheets with a corresponding adjustment to Accumulated other comprehensive loss, net of tax. Currently, our OPEB liability is unfunded and costs related to our obligations are funded by current period cash flows.
Post-retirement benefit costs consist of service cost, interest cost on accrued obligations and the expected return on assets (calculated using a smoothed market value of assets). Any difference between actual and expected returns on assets during a year and actuarial gains and losses on liabilities together with any prior service costs are charged (or credited) to income over the average remaining service lives of employees.
The benefit cost components in the Consolidated Statements of Comprehensive Income (Loss) included in Part II, Item 8, of this Annual Report on Form 10-K are based upon various actuarial assumptions and methodologies as prescribed by authoritative accounting guidance. These assumptions include discount rates, expected return on plan assets, health care cost trend rates, inflation, rate of compensation increases, population demographics, mortality rates and other factors. We review all actuarial assumptions on an annual basis.
Income taxes
Income taxes are accounted for under the asset and liability method. Deferred tax assets and liabilities are recognized for the expected future tax consequences attributable to temporary differences between the financial statement carrying amounts of existing assets and liabilities and their respective tax bases. The future tax benefits associated with operating losses and tax credit carryforwards are recognized as deferred tax assets. Deferred tax assets and liabilities are measured using enacted tax rates expected to apply to taxable income in the years in which those temporary differences are expected to be recovered or settled.
The need to establish a valuation allowance against the deferred tax assets is assessed periodically based on a more-likely-than-not realization threshold, in accordance with authoritative accounting guidance. Appropriate consideration is given to all positive and negative evidence related to that realization. This assessment considers, among other matters, the nature, frequency and severity of recent losses, forecasts of future profitability, the duration of statutory carryforward periods, experience with tax attributes expiring unused and tax planning alternatives. The weight given to these considerations depends upon the degree to which they can be objectively verified.
Stock-based compensation
We maintain a stock-based compensation plan which allows employees (including executive officers), consultants and directors to receive equity awards. We have adopted the FASB’s authoritative accounting guidance on share-based payments and recognizes the fair value of the awards as compensation expense over the vesting period. The accounting guidance also requires that forfeitures be estimated over the vesting period of an award instead of being recognized as a reduction of compensation expense when the forfeiture actually occurs.
Off-Balance Sheet Arrangements
We are not a party to any off-balance sheet arrangements.
Recently Adopted Accounting Pronouncements
In July 2012, the FASB issued authoritative accounting guidance on testing indefinite-lived intangibles for impairment. The guidance gives an entity the option to first assess qualitative factors to determine whether the existence of events and circumstances indicates that it is more likely than not that the indefinite-lived intangible asset is impaired. If an entity concludes that it is more likely than not that the indefinite-lived intangible asset is impaired, then it is required to determine the fair value of the indefinite-lived intangible asset and perform the quantitative impairment test by comparing the fair value with the carrying amount. However, if an entity concludes otherwise, then the entity is not required to take further action. The guidance is effective for interim and annual impairment tests performed for fiscal years beginning after September 15, 2012 with early adoption permitted. We early adopted this guidance in October 2012 in conjunction with our fiscal year 2012 annual indefinite-lived intangible impairment test. This guidance only changed the methodology of testing for impairment and did not affect the outcome of such testing. The adoption of this guidance did not have an effect on our consolidated financial statements.
In December 2011, the FASB issued authoritative accounting guidance on enhancing disclosures to evaluate the effect or potential effect of netting arrangements on an entity’s financial position. The guidance requires improved information and disclosures about gross and net amounts of recognized assets and liabilities of financial and derivative instruments that are offset in an entity’s statement of financial position. The guidance is to be applied retrospectively for interim and annual reporting periods beginning on or after January 1, 2013. The adoption of this guidance is not expected to have a material effect on our consolidated financial statements.
In September 2011, the FASB issued authoritative accounting guidance on testing goodwill for impairment. Under the revised guidance, entities testing goodwill for impairment have the option of performing a qualitative assessment before calculating fair value (i.e., Step 1 of the goodwill impairment test). If entities determine, on the basis of qualitative factors, that fair value is more likely than not less than carrying value, the two-step impairment test would be required. The guidance does not change how goodwill is calculated or assigned to reporting units, nor does it revise the requirement to test goodwill annually for impairment. In addition, it does not amend the requirement to test goodwill for impairment between annual tests if events or circumstances warrant; however, it does revise the examples of events and circumstances that an entity should consider. The guidance became effective for interim and annual goodwill impairment tests performed for fiscal years beginning after December 15, 2011. We adopted this guidance in October 2012 in conjunction with our fiscal year 2012 annual goodwill impairment test. This guidance only changed the methodology of testing for impairment and did not affect the outcome of such testing. The adoption of this guidance did not have an effect on our consolidated financial statements.
In June 2011, the FASB issued authoritative accounting guidance on improving comparability, consistency, and transparency of items reported in other comprehensive income. The guidance eliminates the option to present components of other comprehensive income as part of the statement of stockholders’ equity and requires either a single continuous statement of comprehensive income or in two separate but consecutive statements. In a single continuous statement, the entity is required to present the components of net income and total net income, the components of other comprehensive income and a total for other comprehensive income, along with the total of comprehensive income in that statement. In the two-statement approach, the first statement should present total net income and its components followed consecutively by a second statement that should present total other comprehensive income, the components of other comprehensive income, and the total of comprehensive income. In December 2011, the FASB issued additional authoritative accounting guidance indefinitely deferring the requirement to present reclassifications of items out of accumulated other comprehensive income. The accounting guidance also establishes a common approach with International Financial Reporting Standards (“IFRS”). The guidance is to be applied retrospectively for interim and annual reporting periods beginning after December 15, 2011 for public entities. The adoption of this guidance did not have a material effect on our consolidated financial statements, but required a change in the presentation of comprehensive income from the notes of our consolidated financial statements to the face of our Consolidated Statements of Comprehensive Income (Loss).
In May 2011, the FASB issued authoritative accounting guidance that amended wording used to describe many of the requirements in measuring fair value and disclosing information about fair value measurements. The changes are not intended to change the application of the requirements of fair value measurement, but to clarify the application and disclosure of information. The amendments to the accounting guidance also establish a common approach with IFRS. The guidance is to be applied prospectively for interim and annual reporting periods beginning after December 15, 2011. The adoption of this guidance did not have a material effect on our consolidated financial statements.
Non-GAAP Financial Measures
We use Adjusted net income to measure our overall profitability because we believe it better reflects our cash flow generation by capturing the actual cash interest paid and cash taxes paid rather than our interest expense and tax expense as calculated under GAAPaccounting principles generally accepted in the United States of America (“GAAP”) and excludes the impact of the non-cash annual amortization of certain intangible assets and other certain non-recurring items. We use Adjusted EBITDA, Adjusted EBITDA excluding technology-related license expenses, Adjusted EBITDA margin, Adjusted EBITDA margin excluding technology-related license expenses and Adjusted free cash flow to evaluate and control our cash operating costs and to measure our operating profitability. We believe the presentation of Adjusted net income, Adjusted EBITDA, Adjusted EBITDA excluding technology-related license expenses, Adjusted EBITDA margin, Adjusted EBITDA margin excluding technology-related license expenses and Adjusted free cash flow enhances our investors’ overall understanding of the financial performance and cash flow of our business.
You should not consider Adjusted net income, Adjusted EBITDA, Adjusted EBITDA excluding technology-related license expenses, Adjusted EBITDA margin and Adjusted EBITDA margin excluding technology-related license expenses as an alternative to net income, determined in accordance with GAAP, as an indicator of operating performance. You should not consider Adjusted free cash flow as an alternative to net cash provided by operating activities, determined in accordance with GAAP, as an indicator of our cash flow.
A directly comparable GAAP measure to Adjusted net income, Adjusted EBITDA and Adjusted EBITDA excluding technology-related license expenses is Net income. A directly comparable GAAP measure to Adjusted free cash flow is Net cash provided by operating activities. The following is a reconciliation of Net income to Adjusted net income, Adjusted EBITDA, Adjusted EBITDA excluding technology-related license expenses, Adjusted EBITDA margin and Adjusted EBITDA margin excluding technology-related license expenses, and a reconciliation of Net cash provided by operating activities to Adjusted free cash flow:
| For the year ended December 31, | For the years ended December 31, | |||||||||||||||||||||||
| (unaudited, dollars in millions) | 2012 | 2011 | 2010 | |||||||||||||||||||||
| (unaudited, in millions) | 2015 | 2014 | 2013 | |||||||||||||||||||||
Net income | $ | 514.2 | $ | 103.0 | $ | 29.6 | $ | 182.3 | $ | 228.6 | $ | 165.4 | ||||||||||||
plus: | ||||||||||||||||||||||||
Interest expense, net | 151.2 | 217.3 | 277.5 | 114.5 | 138.4 | 132.9 | ||||||||||||||||||
Cash interest expense | (167.3 | ) | (208.6 | ) | (239.1 | ) | (97.1 | ) | (140.0 | ) | (159.2 | ) | ||||||||||||
Income tax (benefit) expense | (298.0 | ) | 47.6 | 53.7 | ||||||||||||||||||||
Income tax expense | 106.5 | 139.5 | 100.7 | |||||||||||||||||||||
Cash income taxes | (10.7 | ) | (5.8 | ) | (2.2 | ) | (5.2 | ) | (5.0 | ) | (3.8 | ) | ||||||||||||
Fee to terminate services agreement with the Sponsors (a) | 16.0 | — | — | |||||||||||||||||||||
Technology-related investments expense (b) | 14.4 | — | — | |||||||||||||||||||||
Initial public offering expenses (c) | 6.1 | — | — | |||||||||||||||||||||
Amortization of intangible assets | 150.0 | 151.9 | 154.2 | 97.1 | 98.8 | 105.3 | ||||||||||||||||||
Trade name impairment (a) | 80.0 | — | — | |||||||||||||||||||||
Environmental remediation (b) | 14.0 | — | — | |||||||||||||||||||||
Loss associated with impairment of long-lived assets (c) | 1.3 | 15.4 | — | |||||||||||||||||||||
Technology-related investment expense (d) | — | 2.0 | 5.0 | |||||||||||||||||||||
Public offering expenses (e) | — | 1.4 | 1.6 | |||||||||||||||||||||
|
|
|
|
|
| |||||||||||||||||||
Adjusted net income | $ | 375.9 | $ | 305.4 | $ | 273.7 | $ | 493.4 | $ | 479.1 | $ | 347.9 | ||||||||||||
Cash interest expense | 167.3 | 208.6 | 239.1 | 97.1 | 140.0 | 159.2 | ||||||||||||||||||
Cash income taxes | 10.7 | 5.8 | 2.2 | 5.2 | 5.0 | 3.8 | ||||||||||||||||||
Depreciation of property, plant and equipment | 102.5 | 103.8 | 99.6 | 88.3 | 93.8 | 98.7 | ||||||||||||||||||
Loss (gain) on repurchases of long-term debt (d) | 22.1 | 16.0 | (3.3 | ) | ||||||||||||||||||||
Dual power inverter module extended coverage (e) | 9.4 | — | (1.9 | ) | ||||||||||||||||||||
UAW Local 933 contract signing bonus (f) | 8.8 | — | — | |||||||||||||||||||||
Benefit plan re-measurement (g) | 2.3 | — | — | |||||||||||||||||||||
Unrealized (gain) loss on hedge contracts (h) | (0.9 | ) | 6.8 | 0.1 | ||||||||||||||||||||
Premiums and expenses on tender offer for long-term debt (i) | — | 56.9 | �� | — | ||||||||||||||||||||
Benefit plan adjustment (j) | — | (2.5 | ) | — | ||||||||||||||||||||
Reduction of supply contract liability (k) | — | — | (3.4 | ) | ||||||||||||||||||||
Premiums and expenses on tender offer and redemption of long-term debt (f) | 25.3 | — | — | |||||||||||||||||||||
Dual power inverter module extended coverage (g) | (2.1 | ) | 1.0 | (2.4 | ) | |||||||||||||||||||
Unrealized loss on foreign exchange (h) | 1.4 | 5.2 | 2.3 | |||||||||||||||||||||
Unrealized loss (gain) on commodity hedge contracts (i) | 1.1 | (1.0 | ) | 1.5 | ||||||||||||||||||||
Loss on repayments of long-term debt (j) | 0.3 | 0.5 | 0.8 | |||||||||||||||||||||
Restructuring charge (k) | — | 0.7 | 1.0 | |||||||||||||||||||||
Other (l) | 7.0 | 11.1 | 10.9 | 9.8 | 14.7 | 13.8 | ||||||||||||||||||
|
|
|
|
|
| |||||||||||||||||||
Adjusted EBITDA | $ | 705.1 | $ | 711.9 | $ | 617.0 | $ | 719.8 | $ | 739.0 | $ | 626.6 | ||||||||||||
|
|
|
|
|
| |||||||||||||||||||
Adjusted EBITDA excluding technology-related license expenses (m) | $ | 717.1 | $ | 711.9 | $ | 617.0 | ||||||||||||||||||
Adjusted EBITDA excluding technology-related licenses expenses (m) | $ | 720.0 | $ | 745.1 | $ | 632.6 | ||||||||||||||||||
|
|
|
|
|
| |||||||||||||||||||
Net sales | $ | 2,141.8 | $ | 2,162.8 | $ | 1,926.3 | $ | 1,985.8 | $ | 2,127.4 | $ | 1,926.8 | ||||||||||||
Adjusted EBITDA margin | 32.9 | % | 32.9 | % | 32.0 | % | 36.2 | % | 34.7 | % | 32.5 | % | ||||||||||||
Adjusted EBITDA margin excluding technology-related license expenses (m) | 33.5 | % | 32.9 | % | 32.0 | % | ||||||||||||||||||
Adjusted EBITDA margin excluding technology-related licenses expenses (m) | 36.3 | % | 35.0 | % | 32.8 | % | ||||||||||||||||||
Net cash provided by operating activities | $ | 497.5 | $ | 469.2 | $ | 388.9 | $ | 579.9 | $ | 573.3 | $ | 463.5 | ||||||||||||
(Deductions) or additions to reconcile to Adjusted free cash flow: | ||||||||||||||||||||||||
Additions of long-lived assets | (123.9 | ) | (96.9 | ) | (73.8 | ) | (58.1 | ) | (64.1 | ) | (74.4 | ) | ||||||||||||
Fee to terminate services agreement with the Sponsors (a) | 16.0 | — | — | |||||||||||||||||||||
Excess tax benefit from stock-based compensation (n) | 8.4 | 24.6 | 13.7 | |||||||||||||||||||||
Technology-related license expenses (m) | 12.0 | — | — | 0.2 | 6.1 | 6.0 | ||||||||||||||||||
|
|
|
|
|
| |||||||||||||||||||
Adjusted free cash flow | $ | 401.6 | $ | 372.3 | $ | 315.1 | $ | 530.4 | $ | 539.9 | $ | 408.8 | ||||||||||||
|
|
|
|
|
| |||||||||||||||||||
| (a) | Represents a |
| (b) | Represents |
| (c) | Represents a charge associated with the impairment of long-lived assets related to the production of the H3000 and H4000 hybrid-propulsion systems. |
| (d) | Represents a charge (recorded in Other expense, |
| Represents fees and expenses (recorded in Other expense, |
| Represents |
| (h) | Represents |
| (i) | Represents |
| (j) | Represents losses (recorded in Other expense, net) realized on the repayments of ATI’s long-term debt. |
| (k) | Represents a |
| (l) | Represents employee stock compensation expense |
| (m) | Represents payments |
| (n) | Represents the amount of tax benefit (recorded in Income tax expense) related to stock-based compensation adjusted from cash flows from operating activities to cash flows from financing activities. |
Results of Operations
The following table setstables set forth certain financial information for the yearyears ended December 31, 20122015 and 2011.2014 and for the years ended December 31, 2014 and 2013. The following tabletables and discussion should be read in conjunction with the information contained in our consolidated financial statements and the notes thereto included in Part II, Item 8 of this Annual Report onForm 10-K.
Comparison of yearyears ended December 31, 20122015 and 20112014
| Year ended December 31, | Years ended December 31, | |||||||||||||||||||||||||||||||
| (dollars in millions) | 2012 | % of net sales | 2011 | % of net sales | 2015 | % of net sales | 2014 | % of net sales | ||||||||||||||||||||||||
Net sales | $ | 2,141.8 | — | $ | 2,162.8 | — | $ | 1,985.8 | 100 | % | $ | 2,127.4 | 100 | % | ||||||||||||||||||
Cost of sales | 1,052.0 | 53 | 1,151.5 | 54 | ||||||||||||||||||||||||||||
|
|
|
| |||||||||||||||||||||||||||||
Gross profit | 954.3 | 44.6 | % | 954.5 | 44.1 | % | 933.8 | 47 | 975.9 | 46 | ||||||||||||||||||||||
Operating expenses: | ||||||||||||||||||||||||||||||||
Selling, general and administrative expenses | 419.0 | 19.6 | 409.1 | 18.9 | 317.1 | 16 | 344.6 | 16 | ||||||||||||||||||||||||
Engineering — research and development | 115.1 | 5.4 | 116.4 | 5.3 | 92.5 | 5 | 103.8 | 5 | ||||||||||||||||||||||||
Trade name impairment | 80.0 | 4 | — | — | ||||||||||||||||||||||||||||
Environmental remediation | 14.0 | 1 | — | — | ||||||||||||||||||||||||||||
Loss associated with impairment of long-lived assets | 1.3 | 0 | 15.4 | 1 | ||||||||||||||||||||||||||||
|
|
|
|
|
|
|
| |||||||||||||||||||||||||
Total operating expenses | 534.1 | 25.0 | 525.5 | 24.2 | 504.9 | 26 | 463.8 | 22 | ||||||||||||||||||||||||
|
|
|
|
|
|
|
| |||||||||||||||||||||||||
Operating income | 420.2 | 19.6 | 429.0 | 19.9 | 428.9 | 21 | 512.1 | 24 | ||||||||||||||||||||||||
Other expense, net: | ||||||||||||||||||||||||||||||||
Interest expense, net | (151.2 | ) | (7.1 | ) | (217.3 | ) | (10.1 | ) | (114.5 | ) | (6 | ) | (138.4 | ) | (7 | ) | ||||||||||||||||
Premiums and expenses on tender offer for long-term debt | — | — | (56.9 | ) | (2.6 | ) | ||||||||||||||||||||||||||
Premiums and expenses on tender offer and redemption of long-term debt | (25.3 | ) | (1 | ) | — | — | ||||||||||||||||||||||||||
Other expense, net | (52.8 | ) | (2.4 | ) | (4.2 | ) | (0.2 | ) | (0.3 | ) | (0 | ) | (5.6 | ) | (0 | ) | ||||||||||||||||
|
|
|
|
|
|
|
| |||||||||||||||||||||||||
Total other expense, net | (204.0 | ) | (9.5 | ) | (278.4 | ) | (12.9 | ) | (140.1 | ) | (7 | ) | (144.0 | ) | (7 | ) | ||||||||||||||||
|
|
|
|
|
|
|
| |||||||||||||||||||||||||
Income before income taxes | 216.2 | 10.1 | 150.6 | 7.0 | 288.8 | 14 | 368.1 | 17 | ||||||||||||||||||||||||
Income tax benefit (expense) | 298.0 | 13.9 | (47.6 | ) | (2.2 | ) | ||||||||||||||||||||||||||
Income tax expense | (106.5 | ) | (5 | ) | (139.5 | ) | (7 | ) | ||||||||||||||||||||||||
|
|
|
|
|
|
|
| |||||||||||||||||||||||||
Net income | $ | 514.2 | 24.0 | % | $ | 103.0 | 4.8 | % | $ | 182.3 | 9 | % | $ | 228.6 | 10 | % | ||||||||||||||||
|
|
|
|
|
|
|
| |||||||||||||||||||||||||
Net sales
Net sales for the year ended December 31, 20122015 were $2,141.8$1,985.8 million compared to $2,162.8$2,127.4 million for the year ended December 31, 2011,2014, a decrease of 1.0%7%. The decrease was principally driven by a $55.0 million, or 12%, decrease in net sales of $123.0parts and other products principally driven by lower demand for North American service parts, a $46.0 million, or 44%57%, decrease in net sales of Outside North America off-highway products principally driven by lower demand from natural gas fracturing applications due to weakness in natural gas pricing,the energy and mining sectors, a $45.0 million, or 45%, decrease in net sales of $19.0North American off-highway products principally driven by lower demand from hydraulic fracturing applications, a $44.0 million, or 14%28%, fordecrease in net sales of defense products driven by lower U.S. defense spending and the recognition of previously deferred revenue in 2014 related to shipment of certain tracked transmissions at the request of the U.S. government, a $20.0 million, or 22%, decrease in net sales of North America hybrid-propulsion systems for transit buses primarily driven by lower municipal spendingdemand due to engine emissions improvements and non-hybrid alternatives that generally require a fully-automatic transmission (e.g. xNG), and a $2.0 million, or 1%, decrease in net sales of $6.0 million, or 2%, for parts and otherOutside North America on-highway products principally driven by lower demand in China partially offset by higher demand in Europe, partially offset by a $99.0$71.0 million, or 10%7%, increase in net sales of globalNorth American on-highway commercial products principally driven by higher demand from Rugged Duty Series and a $27.0 million, or 31%, increase in net sales of outside North America off-highway products.Highway Series models. See “Trends Impacting Our Business” above for additional information on net sales by end markets.
Cost of sales
Cost of sales for the year ended December 31, 2015 was $1,052.0 million compared to $1,151.5 million for the year ended December 31, 2014, a decrease of 9%. The decrease was principally driven by approximately $59.0 million of decreased direct material costs commensurate with decreased sales, $14.0 million of favorable direct material costs, $7.5 million of lower incentive compensation expense, and lower manufacturing cost commensurate with decreased sales and consistent with historical trends and management’s expectations given the respective change in sales volume.
Gross profit
Gross profit for the year ended December 31, 20122015 was $954.3$933.8 million compared to $954.5$975.9 million for the year ended December 31, 2011.2014, a decrease of 4%. The decrease was principally driven by $29.0$93.0 million related to decreased sales volume and $7.7$1.0 million related to the fourth quarter 2012 UAW Local 933 contract signing bonus,of unfavorable foreign exchange, partially offset by $20.0$26.0 million of price increases on certain products, $13.0$14.0 million of favorable material costs, $7.5 million of lower incentive compensation expense and $3.5$5.0 million attributable to improved manufacturing performance.of lower depreciation expense. Gross profit as a percentage of net sales increased 1%, principally driven by price increases on certain products and favorable material costs.
Selling, general and administrative expenses
Selling, general and administrative expenses for the year ended December 31, 20122015 were $419.0$317.1 million compared to $409.1$344.6 million for the year ended December 31, 2011, an increase2014, a decrease of 2.4%8%. The increasedecrease was principally driven by $9.4$9.6 million of lower incentive compensation expense, $4.4 million of lower stock-based compensation expense, a $3.1 million favorable adjustment related to the DPIM extended coverage program, $8.0 million of unfavorable product warranty adjustments from prior period estimates, $7.2 million of higher product warranty expense and $1.0 million related to the fourth quarter 2012 UAW Local 933 contract signing bonus, partially offset by $9.0$1.7 million of lower incentive compensation expenseintangible asset amortization and reduced global commercial spending activities.
Engineering—Engineering — research and development
Engineering expenses for the year ended December 31, 20122015 were $115.1$92.5 million compared to $116.4$103.8 million for the year ended December 31, 2011,2014, a decrease of 1.1%11%. The decrease was principally driven by lower product initiatives spending, partially offset by an increase$5.9 million of $2.1 million related to certainlower technology-related license expenses to expand our position in transmission technologies, $4.2 million of lower incentive compensation expense and $0.1decreased product initiatives spending.
Trade name impairment
During the fourth quarter of 2015, we recorded a trade name impairment charge of $80.0 million as a result of lower forecasted net sales for certain of our end markets. Refer to NOTE 5, “Goodwill and other intangible assets” in Part II, Item 8, of this Annual Report on Form 10-K.
Environmental remediation
During the third quarter of 2015, we recorded approximately $14.0 million for environmental remediation expenses as a result of the EPA determining that GM’s environmental remediation activities at our Indianapolis, Indiana manufacturing facilities were complete, and we were assuming responsibility for future operating, monitoring and maintenance activities. Refer to NOTE 17 “Commitments and contingencies” in Part II, Item 8, of this Annual Report on Form 10-K.
Loss associated with impairment of long-lived assets
During the first quarter of 2015 and the fourth quarter of 2014, we recorded approximately $1.3 million and $15.4 million, respectively, of losses associated with impairment of certain of our long-lived assets related to the fourth quarter 2012 UAW Local 933 contract signing bonus.
Interest expense, net
Interest expense, net for the year ended December 31, 20122015 was $151.2$114.5 million compared to $217.3$138.4 million for the year ended December 31, 2011,2014, a decrease of 30.4%17%. The decrease was principally driven by $52.4$24.3 million of lower interest expense as a result of the repurchase and redemption of ATI’s 7.125% Senior Notes during the second quarter of 2015, $18.8 million of lower interest expense as a result of the maturity of $950.0 million of interest rate derivatives, $5.5 million of lower interest expense as a result of debt repayments, and purchases, and a $32.5 million decrease in mark-to-market expense for our interest rate derivatives, partially offset by $10.0 million of higher interest expense primarily due to the effectiveness of $700.0 million of new interest rate swaps at higher interest rates, and $8.3 million of higher interest expense primarily driven by higher interest rates and $0.5 million of higher deferred financing fees due to refinancing the Term B-1 Loan.
Premiums and expenses on tender offer for long-term debt
In May 2011, we completed a cash tender offer to purchase any and all of our Senior Toggle Notes. The tender offer resulted in us purchasing $468.1 million of $505.3 million of our outstanding Senior Toggle Notes with premiums and expenses totaling $56.9 million.
Other expense, net
Other expense, net for the year ended December 31, 2012 was ($52.8) million compared to ($4.2) million for the year ended December 31, 2011. The increase was principally driven by a $16.0 million payment to terminate the services agreement with the Sponsors, a $14.4 million impairment of technology-related investments, a $6.1 million increase in premiums and expenses related to redemptions of long-term debt, $6.1 million of fees and expenses related to our IPO, $4.1 million of decreased Grant Program income, a $3.7 million favorable vendor settlement in 2011, $2.3 million related to the hourly pension plan settlement and $1.2 million of lower miscellaneous income, partially offset by $4.1 million of favorable foreign currency exchange and $1.2 million of higher gains on derivative contracts.
Income tax benefit (expense)
Income tax benefit (expense) for the year ended December 31, 2012 was $298.0 million resulting in an effective tax rate of 137.8% versus an effective tax rate of (31.6%) for the year ended December 31, 2011. The change in effective tax rate was principally driven by the release of our valuation allowance on our deferred tax assets in the second quarter of 2012. Management determined, based on the evaluation of both objective and subjective evidence available, that a valuation allowance was no longer necessary and that it is more likely than not that the deferred tax assets are fully realizable.
Comparison of years ended December 31, 2011 and 2010
| Year ended December 31, | ||||||||||||||||
| (dollars in millions) | 2011 | % of net sales | 2010 | % of net sales | ||||||||||||
Net sales | $ | 2,162.8 | — | $ | 1,926.3 | — | ||||||||||
Gross profit | 954.5 | 44.1 | % | 828.2 | 43.0 | % | ||||||||||
Operating expenses: | ||||||||||||||||
Selling, general and administrative expenses | 409.1 | 18.9 | 384.9 | 20.0 | ||||||||||||
Engineering — research and development | 116.4 | 5.3 | 101.5 | 5.3 | ||||||||||||
|
|
|
|
|
|
|
| |||||||||
Total operating expenses | 525.5 | 24.2 | 486.4 | 25.3 | ||||||||||||
|
|
|
|
|
|
|
| |||||||||
Operating income | 429.0 | 19.9 | 341.8 | 17.7 | ||||||||||||
Other expense, net: | ||||||||||||||||
Interest expense, net | (217.3 | ) | (10.1 | ) | (277.5 | ) | (14.4 | ) | ||||||||
Premiums and expenses on tender offer for long-term debt | (56.9 | ) | (2.6 | ) | — | — | ||||||||||
Other (expense) income, net | (4.2 | ) | (0.2 | ) | 19.0 | 1.0 | ||||||||||
|
|
|
|
|
|
|
| |||||||||
Total other expense, net | (278.4 | ) | (12.9 | ) | (258.5 | ) | (13.4 | ) | ||||||||
|
|
|
|
|
|
|
| |||||||||
Income before income taxes | 150.6 | 7.0 | 83.3 | 4.3 | ||||||||||||
Income tax expense | (47.6 | ) | (2.2 | ) | (53.7 | ) | (2.8 | ) | ||||||||
|
|
|
|
|
|
|
| |||||||||
Net income | $ | 103.0 | 4.8 | % | $ | 29.6 | 1.5 | % | ||||||||
|
|
|
|
|
|
|
| |||||||||
Net sales
Net sales for the year ended December 31, 2011 were $2,162.8 million compared to $1,926.3 million for the year ended December 31, 2010, an increase of 12.3%. The increase was principally driven by a $403.3 million, or 30.6%, increase in net sales of global off-highway and on-highway commercial products, parts and other products, partially offset by a $144.7 million, or 32.2%, decrease in net sales of military products driven by lower U.S. military spending, a decrease in net sales of $22.1 million, or 14.1%, for hybrid-propulsion systems for transit buses primarily driven by lower municipal spending and a decrease in net sales of $7.3 million, or 50.7%, for saleable engineering services.
Gross profit
Gross profit for the year ended December 31, 2011 was $954.5 million compared to $828.2 million for the year ended December 31, 2010, an increase of 15.2%. The increase was principally driven by $138.2 million related to increased net sales, $20.4 million of price increases on certain products, $8.8 million related to the elimination of unfavorable 2010 remanufacturing costs, $4.1 million of favorable foreign exchange and $0.8 million related to certain benefit plan discrepancies, partially offset by $24.1 million of unfavorable material costs and $21.9 million of higher manufacturing expense commensurate with increased sales. The increase in material costs was principally driven by increased commodity prices and higher component prices driven by increased demand for off-highway products.
Selling, general and administrative expenses
Selling, general and administrative expenses for the year ended December 31, 2011 were $409.1 million compared to $384.9 million for the year ended December 31, 2010, an increase of 6.3%. The increase was principally driven by $11.9 million of increased spending commensurate with expanded global commercial activities, $6.8 million of unfavorable product warranty expense adjustments from prior period estimates, $6.4 million of increased product warranty expense commensurate with increased sales and $1.9 million of unfavorable DPIM warranty expense adjustments from prior period estimates, partially offset by lower bad debt expense of $1.9 million driven by a reduction in the aged accounts receivable balances in North America and Europe, and $0.9 million related to certain benefit plan discrepancies.
Engineering—research and development
Engineering expenses for the year ended December 31, 2011 were $116.4 million compared to $101.5 million for the year ended December 31, 2010, an increase of 14.7%. The increase was principally driven by $8.8 million of higher technology-related license expense and $6.9 million of higher product initiatives spending, partially offset by $0.8 million related to certain benefit plan discrepancies.
Interest expense, net
Interest expense, net for the year ended December 31, 2011 was $217.3 million compared to $277.5 million for the year ended December 31, 2010, a decrease of 21.7%. The decrease was principally driven by $22.8 million of lower interest expense as a result of debt repayments and purchases, $21.8 million of lower mark-to-market expense for our interest rate derivatives, approximately $17.2$3.9 million of lower interest expense as a result of lower interest rates and $0.2$0.9 million of decreasedlower amortization of deferred financing fees,charges, partially offset by a one-time payment$17.5 million of $1.8 million to eliminate certain collateral requirementsunfavorable mark-to-market adjustments for our interest rate derivatives.derivatives and $11.8 million of higher interest expense as a result of the addition of $470.0 million to ATI’s Term B-3 Loan in April 2015.
Premiums and expenses on tender offer forand redemption of long-term debt
In May 2011,April 2015, we completed a cash tender offer to purchase any and all of ourATI’s outstanding 7.125% Senior Toggle Notes. The tender offer resulted in us purchasing $468.1the repurchase of $420.9 million of $505.3the 7.125% Senior Notes in April 2015. In May 2015, we redeemed the remaining $50.4 million of ourthe outstanding 7.125% Senior Toggle Notes, withresulting in premiums and expenses totaling $56.9 million.of $25.3 million for the year ended December 31, 2015.
Other (expense) income,expense, net
Other (expense) income,expense, net for the year ended December 31, 20112015 was ($4.2)$0.3 million compared to $19.0$5.6 million for the year ended December 31, 2010.2014, a decrease of 95%. The decrease was principally driven by $19.3$3.6 million of lower foreign exchange losses on intercompany financing, a $2.9 million gain as a result of a vendor settlement, $2.4 million of gains related to foreign exchange, $2.0 million of 2014 losses on impairment of technology-related investments, $1.4 million of 2014 public offering fees and expenses, and $0.2 million of lower expenses related to debt repayments, partially offset by $2.6 million of 2014 cost-share grant program income, $2.2 million of higher premiums and expenses related to additional repurchases, repaymentsunrealized and redemptions of long-term debt, $6.7 million of higher unrealizedrealized losses on derivative contracts, $4.4a $2.0 million 2014 gain related to the negotiation of a commercial agreement and $0.4 million of unfavorable foreign exchange and $3.4 million of lowerhigher miscellaneous income, partially offset by a $3.7 million vendor settlement, $3.6 million of increased Grant Program income and $3.3 million of increased realized gains on derivative contracts.expenses.
Income tax expense
Income tax expense for the year ended December 31, 20112015 was $47.6$106.5 million compared to $139.5 million for the year ended December 31, 2014, resulting in effective tax rates of 37% and 38% for the years ended December 31, 2015 and 2014, respectively.
Comparison of years ended December 31, 2014 and 2013
| Years ended December 31, | ||||||||||||||||
| (dollars in millions) | 2014 | % of net sales | 2013 | % of net sales | ||||||||||||
Net sales | $ | 2,127.4 | 100 | % | $ | 1,926.8 | 100 | % | ||||||||
Cost of sales | 1,151.5 | 54 | 1,084.9 | 56 | ||||||||||||
|
|
|
|
|
|
|
| |||||||||
Gross profit | 975.9 | 46 | 841.9 | 44 | ||||||||||||
Operating expenses: | ||||||||||||||||
Selling, general and administrative expenses | 344.6 | 16 | 334.9 | 17 | ||||||||||||
Engineering — research and development | 103.8 | 5 | 97.1 | 5 | ||||||||||||
Loss associated with impairment of long-lived assets | 15.4 | 1 | — | — | ||||||||||||
|
|
|
|
|
|
|
| |||||||||
Total operating expenses | 463.8 | 22 | 432.0 | 22 | ||||||||||||
|
|
|
|
|
|
|
| |||||||||
Operating income | 512.1 | 24 | 409.9 | 22 | ||||||||||||
Other expense, net: | ||||||||||||||||
Interest expense, net | (138.4 | ) | (7 | ) | (132.9 | ) | (7 | ) | ||||||||
Other expense, net | (5.6 | ) | (0 | ) | (10.9 | ) | (1 | ) | ||||||||
|
|
|
|
|
|
|
| |||||||||
Total other expense, net | (144.0 | ) | (7 | ) | (143.8 | ) | (8 | ) | ||||||||
|
|
|
|
|
|
|
| |||||||||
Income before income taxes | 368.1 | 17 | 266.1 | 14 | ||||||||||||
Income tax expense | (139.5 | ) | (7 | ) | (100.7 | ) | (5 | ) | ||||||||
|
|
|
|
|
|
|
| |||||||||
Net income | $ | 228.6 | 10 | % | $ | 165.4 | 9 | % | ||||||||
|
|
|
|
|
|
|
| |||||||||
Net sales
Net sales for the year ended December 31, 2014 were $2,127.4 million compared to $1,926.8 million for the year ended December 31, 2013, an increase of 10%. The increase was principally driven by a $163.0 million, or 20%, increase in net sales of North American on-highway products principally driven by higher demand from Rugged Duty Series and Pupil Transport/Shuttle Series models, a $69.0 million, or 18%, increase in net sales of parts and other products principally driven by higher demand for North American service parts and support equipment commensurate with increased transmission unit volumes, and a $61.0 million, or 156%, increase in net sales of North American off-highway products principally driven by higher demand from hydraulic fracturing applications, partially offset by a $45.0 million, or 22%, decrease in net sales of defense products due to lower U.S. defense spending, a $29.0 million, or 10%, decrease in net sales of Outside North America on-highway products principally driven by weakness in Europe and Asia, a $12.0 million, or 11%, decrease in net sales of North America hybrid-propulsion systems for transit buses principally driven by lower demand due to engine emissions improvements and non-hybrid alternatives (e.g. xNG), and a $7.0 million, or 8%, decrease in net sales of Outside North America off-highway products principally driven by lower demand from the energy sector. See “Trends Impacting Our Business” above for additional information on net sales by end markets.
Cost of sales
Cost of sales for the year ended December 31, 2014 was $1,151.5 million compared to $1,084.9 million for the year ended December 31, 2013, an increase of 6%. The increase was principally driven by $45.3 million related to increased direct material costs, $17.3 million of higher overhead costs and $4.0 million of higher direct labor costs, in each case commensurate with increased sales volume and consistent with historical trends for these three cost of sales components. The increase in each of these cost of sales components was consistent with historical trends and management’s expectations given the respective change in sales volume.
Gross profit
Gross profit for the year ended December 31, 2014 was $975.9 million compared to $841.9 million for the year ended December 31, 2013, an increase of 16%. The increase was principally driven by $122.0 million related to increased net sales, $20.0 million of price increases on certain products and $3.0 million of favorable foreign exchange, partially offset by $5.8 million of higher incentive compensation expense and $5.2 million of higher manufacturing expense commensurate with increased net sales. Gross profit as a percent of net sales increased by 2%. This increase was principally driven by increased net sales and price increases on certain products.
Selling, general and administrative expenses
Selling, general and administrative expenses for the year ended December 31, 2014 were $344.6 million compared to $334.9 million for the year ended December 31, 2013, an increase of 3%. The increase was principally driven by $7.1 million of higher incentive compensation expense, increased global commercial spending activities, a $2.4 million favorable adjustment in 2013 related to the DPIM extended coverage program and a $1.0 million unfavorable adjustment in 2014 related to the DPIM extended coverage program, partially offset by $6.5 million of lower intangible asset amortization.
Engineering — research and development
Engineering expenses for the year ended December 31, 2014 were $103.8 million compared to $97.1 million for the year ended December 31, 2013, an increase of 7%. The increase was principally driven by increased spending on product initiatives and $2.7 million of higher incentive compensation expense.
Loss associated with impairment of long-lived assets
During 2014, we reviewed certain of our long-lived assets related to the production of the H3000 and H4000 hybrid-propulsion systems, resulting in a $15.4 million loss recorded for the year ended December 31, 2014. The loss included approximately $1.7 million of accrued expenses related to the impairment of the long-lived assets.
Interest expense, net
Interest expense, net for the year ended December 31, 2014 was $138.4 million compared to $132.9 million for the year ended December 31, 2013, an increase of 4%. The increase was principally driven by $30.8 million of less favorable mark-to-market adjustments for interest rate derivatives, partially offset by $12.3 million of lower interest expense as a result of the maturity of $950.0 million of interest rate derivatives, $5.2 million of lower interest expense as a result of debt repayments, $4.7 million of lower interest expense related to lower interest rates and $2.8 million of lower amortization of deferred financing fees.
Other expense, net
Other expense, net for the year ended December 31, 2014 was $5.6 million compared to $10.9 million for the year ended December 31, 2013, a decrease of 49%. The decrease in expense was principally driven by $4.5 million of lower expenses related to unrealized and realized losses on derivative contracts, $3.0 million of lower technology-related investment impairment expense, a $2.0 million gain related to the negotiation of a commercial agreement, $1.4 million of lower expenses related to foreign exchange losses, $0.3 million of lower expenses related to debt repayments, and $0.2 million of lower public offering fees and expenses, partially offset by $3.1 million of increased foreign exchange losses on intercompany financing, $2.6 million of lower grant program income and $0.4 million of lower miscellaneous income.
Income tax expense
Income tax expense for the year ended December 31, 2014 was $139.5 million compared to $100.7 million for the year ended December 31, 2013, resulting in an effective tax rate of 31.6% versus an effective rate38% for each of 64.5% for the yearyears ended 2010. The change in the effective tax rate was primarily driven by the increase in income before tax, book treatment of certain indefinite life intangiblesDecember 31, 2014 and maintaining a full valuation allowance against our non-current deferred tax asset. A sustained period of profitability in our operations is required before we would change our judgment regarding the need for a full valuation allowance against our net deferred tax assets. Accordingly, although we were profitable in 2010 and 2011, we recorded a full valuation allowance against the net deferred tax assets in 2011. Although the weight of negative evidence related to cumulative losses is decreasing, we believe that this objectively-measured negative evidence outweighs the subjectively-determined positive evidence and, as such, we have not changed our judgment regarding the need for a full valuation allowance in 2011. Continued improvement in our operating results, however, could lead to reversal of all of our valuation allowance as early as the second quarter of 2012.December 31, 2013.
Liquidity and Capital Resources
We generate cash primarily from our operating activities to fund our operating, investing and financing activities. Our principal uses of cash are operating expenses, capital expenditures, debt service, stock repurchases, dividends on common stock and working capital needs. We had total available cash and cash equivalents of $80.2$251.6 million and $314.0$263.0 million as of December 31, 20122015 and 2011,2014, respectively. Of the available cash and cash equivalents, approximately $75.2$151.6 million and $188.1$208.0 million waswere deposited in operating accounts while approximately $5.0$100.0 million and $125.9$55.0 million waswere invested in U.S. government backed securities as of December 31, 20122015 and 2011,2014, respectively. We expect to meet our domestic funding needs through available cash and credit in the United States and currently do not anticipate repatriating any cash to meet these needs.
Additionally, we had $372.1 million and $369.2 million available under the revolving credit facility, net of approximately $27.9 million and $30.8 million in letters of credit issued and outstanding as of December 31, 2012 and 2011, respectively. Throughout the year ended December 31, 2012, we made periodic withdrawals on our revolving credit facility as part of our debt management plans. The maximum amount outstanding at any time on the revolving credit facility was $27.5 million, and all balances were repaid within the quarter they were borrowed. As of December 31, 20122015, the total of cash and 2011,cash equivalents held by foreign subsidiaries was $32.4 million, the majority of which was located in China, Europe and India. The geographic location of our cash aligns with our business growth strategy. We manage our worldwide cash requirements considering available funds among the subsidiaries through which we had no outstanding borrowings onconduct our revolving credit facility.business and the cost effectiveness with which those funds can be accessed. As a result, we do not anticipate any local liquidity restrictions to preclude us from funding our targeted expectations or operating needs with local resources.
If we distribute our foreign cash balance to the U.S. or to other foreign subsidiaries, we could be required to accrue and pay U.S. taxes. For example, we would be required to accrue and pay additional U.S. taxes if we repatriate cash from certain foreign subsidiaries whose earnings we have asserted are permanently reinvested outside of the U.S. Foreign earnings for which we assert permanent reinvestment outside the U.S. consists primarily of earnings of our Europe and China subsidiaries. We currently do not foresee a need to repatriate earnings from these subsidiaries for which we have asserted permanent reinvestment.
Our liquidity requirements are significant, primarily due to our debt service requirements. In March 2012, ATI2015, we commenced a cash tender offer to purchase ATI’s outstanding 7.125% Senior Notes. The total principal amount accepted for purchase in April 2015 was $420.9 million. In April 2015, we also entered into an amendment with the term loan lenders under itsour Senior Secured Credit Facility to extendadd an additional $470.0 million of term loans under the maturityTerm B-3 Loan. A portion of approximately $801.1the proceeds from the addition to the Term B-3 Loan was used to purchase $420.9 million of the tendered 7.125% Senior Notes plus accrued and unpaid interest, applicable premiums and expenses. The purchase resulted in a loss (the premium between the purchase price of the notes and the face value of such notes) of $22.7 million including deferred financing fees written off. In May 2015, we redeemed the remaining $50.4 million of outstanding 7.125% Senior Notes, at the redemption price equal to 103.563% of the principal amount plus any accrued and unpaid interest, using the remaining proceeds from the additional term loans and cash on hand, resulting in a loss (the premium between the purchase price of the notes and the face value of such notes) of $2.4 million including deferred financing fees written off.
In November 2015, we entered into an amendment with the term loan lenders under our Senior Secured Credit Facility to refinance $189.0 million of the Senior Secured Credit Facility Term B-1B-2 Loan due 2017 replacing it with an additional $189.0 million of term loan under the Term B-3 Loan. This addition to the Term B-3 Loan increased the debt maturity from August 20142017 to August 20172019 and to increase the applicable interest rate margin at our option, tois either (a) 3.50%2.50% over the LIBOR (which may not be less than 1.00%) or (b) 2.50%1.50% over the greater of the prime lending rate provided by the British Banking Association or the federal funds effective rate published by the Federal Reserve Bank of New York. In August 2012, ATI entered into anAs of December 31, 2015, the interest rate was approximately 3.50% on the Term B-3 Loan. The November 2015 amendment was treated as a modification of debt under GAAP, and thus we expensed $0.3 million of deferred financing fees and recorded $1.3 million of new deferred financing fees in the consolidated financial statements.
As of December 31, 2015, we had $2,402.8 million of indebtedness, all of which was associated with our Term B-3 Loan. Our ability to make payments on and to refinance our indebtedness, and to fund planned capital expenditures will depend on our ability to generate cash in the term loan lenders under itsfuture. This is subject to general economic, financial, competitive, legislative, regulatory and other factors that may be beyond our control. We made principal payments of $116.5 million, $157.6 million and $142.4 million on our long-term debt for the years ended December 31, 2015, 2014 and 2013, respectively.
The Senior Secured Credit Facility to extend the maturity of approximately $850.0also provides for $465.0 million in principal amountrevolving credit borrowings, net of an allowance for up to $75.0 million in outstanding letters of credit commitments. As of December 31, 2015, we had no outstanding borrowings on our revolving credit facility. Additionally within the Term B-1 Loan from August 2014 to August 2019 and to increase the applicable margin at our option to either (a) 3.25% or 3.00%, subject to our total leverage ratio, over the LIBOR (but not less than 1.00%) or (b) 2.25% or 2.00%, subject to our total leverage ratio, over the greaterterms of the prime lending rate provided by the British Banking Association or the federal funds effective rate published by the Federal Reserve Bank of New York (but not less than 2.00%). In October 2012, ATI entered into an amendment with the term loan lenders under its Senior Secured Credit Facility, to extenda senior secured leverage ratio at or below 3.50x results in the maturityelimination of $300.0 million ofexcess cash flow payments on the Term B-1 Loan debt from August 2014Senior Secured Credit Facility for the applicable year. The Senior Secured Credit Facility provides certain financial incentives based on our total leverage ratio. A total leverage ratio at or below 4.00x results in a 25 basis point reduction to August 2019 and to increase the applicable margin aton our option to either (a) 3.25% or 3.00%, subject to ourrevolving credit facility, and a total leverage ratio overat or below 3.50x results in a 12.5 basis point reduction to the LIBOR (but not less than 1.00%) or (b) 2.25% or 2.00%, subjectrevolving credit facility commitment fee and an additional 25 basis point reduction to the applicable margin on our revolving credit facility. A total leverage ratio overat or below 3.25x results in a 25 basis point reduction to the greaterapplicable margin on our Term B-3 Loan. These reductions would remain in effect as long as we achieve a total leverage ratio at or below the related threshold. As of December 31, 2015, the total leverage ratio was 2.99x.
In addition to the maximum total senior secured leverage ratio for the revolving portion of the prime lending rate providedSenior Secured Credit Facility, the Senior Secured Credit Facility includes, among other things, customary restrictions (subject to certain exceptions) on our ability to incur certain indebtedness or liens, make certain investments, declare or pay certain dividends or repurchase shares of our common stock. As of December 31, 2015, we are in compliance with all covenants under the Senior Secured Credit Facility.
Our credit ratings are reviewed regularly by major debt ratings agencies such as Standard and Poor’s, Moody’s Investors Service and Fitch Ratings. In March 2015, Standard and Poor’s raised our corporate rating to ‘BB’ from ‘BB-’ and assigned ‘BB+’ to the British Banking Association orincremental Term B-3 Loan. Moody’s raised our corporate rating to ‘Ba2’ from ‘Ba3’ and assigned ‘Ba2’ to the federal funds effective rate published byincremental Term B-3 Loan. In August 2015, Fitch ratings assigned ‘BB’ to the Federal Reserve Bankincremental Term B-3 Loan and raised our corporate rating to ‘BB+’ from ‘BB’.
On October 30, 2014, our Board of New York (but not less than 2.00%). The remaining Term B-1 Loan of $411.4 million with an applicable margin over the LIBOR ofDirectors authorized us to purchase up to 2.75% matures in August 2014. Please see “Recent Developments” above for additional information.
Our principal uses$500.0 million of cash are operating expenses, capital expenditures, debt service, dividends onour common stock and working capital needs. under a stock repurchase program. During 2015, we repurchased approximately $305.8 million of our common stock under the Repurchase Program. All of the repurchase transactions during the fourth quarter of 2015 were settled in cash during the same period.
The following table shows our sources and uses of funds for the years ended December 31, 2012, 20112015, 2014 and 20102013 (in millions):
| Year ended December 31, | Years ended December 31, | |||||||||||||||||||||||
| Statement of Cash Flows Data | 2012 | 2011 | 2010 | 2015 | 2014 | 2013 | ||||||||||||||||||
Cash flows from operating activities | $ | 497.5 | $ | 469.2 | $ | 388.9 | $ | 579.9 | $ | 573.3 | $ | 463.5 | ||||||||||||
Cash flows used for investing activities | (138.7 | ) | (55.9 | ) | (95.3 | ) | (59.7 | ) | (67.9 | ) | (81.5 | ) | ||||||||||||
Cash flows used for financing activities | (593.5 | ) | (369.9 | ) | (197.9 | ) | (528.7 | ) | (424.1 | ) | (277.5 | ) | ||||||||||||
Generally, cash provided by operating activities has been adequate to fund our operations. Due to fluctuations in our cash flows and the growth in our operations, it may be necessary from time to time in the future to borrow under the Senior Secured Credit Facility to meet cash demands. We anticipate cash provided by operating activities, cash and cash equivalents and borrowing capacity under the Senior Secured Credit Facility will be sufficient to meet our cash requirements for the next twelve months.
As of December 31, 2015 and 2014, we had approximately $97.4 million and $253.3 million, respectively, of net operating loss carryforwards for U.S. federal income tax purposes. If we continue to generate taxable income, we expect to utilize the remaining U.S. federal net operating loss carryforwards by the end of 2016.
Cash provided by operating activities
Operating activities for the year ended December 31, 20122015 generated $497.5$579.9 million of cash compared to $469.2$573.3 million for the year ended December 31, 2011.2014. The increase was primarilyprincipally driven by lower cash interest expense, lower accounts receivable commensurate with decreased net sales, and decreased spending commensurate with reduced global commercial activities,excess tax benefit from stock-based compensation, partially offset by lower accounts payable, commensurate with decreasedlower other liabilities, net, sales and increased other expense, net.higher inventories.
Operating activities for the year ended December 31, 20112014 generated $469.2$573.3 million of cash compared to $388.9$463.5 million for the year ended December 31, 2010.2013. The increase was primarilyprincipally driven by increased net sales, higher accounts payable commensurate with increased net sales and lower inventories, lower cash interest expense and higher other liabilities, net, partially offset by higher accounts receivable commensurate with increased net sales and increased spending commensurate with expanded global commercial activities and engineering — research and development costs, and decreased other income, net.excess tax benefit from stock-based compensation.
Cash used for investing activities
Investing activities for the year ended December 31, 20122015 used $138.7$59.7 million of cash compared to $55.9$67.9 million for the year ended December 31, 2011.2014. The increasedecrease was primarilyprincipally driven by a 2011 reduction in collateral requirementsdecrease of $39.6 million related to certain of our interest rate derivatives, an increase of $27.0$6.0 million in capital expenditures and a $14.4decrease of $3.9 million investmentin investments in technology-related initiatives and the 2011 proceeds related to the sale of property.initiatives. The increasedecrease in capital expenditures was attributable to the continued expansion of our India facility, higherprincipally driven by lower product initiatives spending and increased investments in productivity and replacement programs, partially offset by the 2011 construction of our Hungarian manufacturing facility. The India expansion project was completed and production commenced during the third quarter of 2012.spending.
Investing activities for the year ended December 31, 20112014 used $55.9$67.9 million of cash compared to $95.3$81.5 million for the year ended December 31, 2010.2013. The decrease was primarilyprincipally driven by a reduction in the 2011 collateral requirements related to certaindecrease of our interest rate derivatives of $60.4 million and increased proceeds related to the sale of property of $2.1 million, partially offset by an increase of $23.1$10.3 million in capital expenditures.expenditures and a decrease of $3.0 million in investments in technology-related initiatives. The increasedecrease in capital expenditures was attributable to the construction of our Hungary and India manufacturing facilities, andprincipally driven by lower product initiatives spending, partially offset by increased investments in productivity and replacement initiatives.programs.
Cash used for financing activities
Financing activities for the year ended December 31, 20122015 used $593.5$528.7 million of cash compared to $369.9$424.1 million for the year ended December 31, 2011.2014. The increase was primarilyprincipally driven by $217.4$56.0 million related to increased repurchases of our common stock, $36.7 million of decreased proceeds from the exercise of stock options, $16.2 million of decreased excess tax benefit from stock based compensation, $14.0 million of increased dividend payments repurchases and redemptions$8.1 million of increased debt financing fees, partially offset by $19.9 million of decreased payments related to our long-term debt $32.8and $6.5 million of dividend payments in 2012, $20.2 million of paymentslower taxes paid related to extending a portionnet share settlement of the Senior Secured Credit Facility, and a $2.5 million principal payment on our Japanese Yen denominated unsecured short-term notes, partially offset by $15.0 million of 2011 debt issuance costs and $29.0 million related to the issuance of common stock in 2012.equity awards.
Financing activities for the year ended December 31, 20112014 used $369.9$424.1 million of cash compared to $197.9$277.5 million of cash used for the year ended December 31, 2010.2013. The differenceincrease was principally driven by the$150.3 million related to increased repurchases of ATI’s 7.125% Senior Notes, Senior Toggle Notesour common stock in connection with the June 2014 and 11.0% senior cash pay notes due November 2015 (“11.0% Senior Notes”)February 2014 secondary offerings by investment funds affiliated with the Carlyle Group and principalOnex Corporation (together, the “Sponsors”), $15.2 million of increased payments on the Senior Secured Credit Facility, $14.5 million of increased dividend payments and $4.8 million of higher taxes paid related to net share settlement of equity awards, partially offset by ATI’s issuance of the 7.125% Senior Notes in the second quarter of 2011.
In February 2012, ATI redeemed $200.0$14.0 million of 11.0% Senior Notes resulting in a loss (the premium between the purchase price of the notes and the face value of such notes) of $13.5 million, including deferreddecreased debt financing fees, written off.
In May 2012, ATI redeemed the remaining $109.8$13.3 million of the 11.0% Senior Notes resulting in a loss (the premium between the purchase price of the notes and the face value of such notes) of $7.3 million, including deferred financing fees written off.
Our liquidity requirements are significant, primarily due to our debt service requirements. A one-eighth percent change in assumed interest rates for the Senior Secured Credit Facility, if fully drawn, for the year ended December 31, 2012 would have a yearly impact of $0.6 million on interest expense, which includes the partial offset of our interest rate swaps. Our ability to make payments on and to refinance our indebtedness, and to fund planned capital expenditures will depend on our ability to generate cash in the future. This is subject to general economic, financial, competitive, legislative, regulatory and other factors that may be beyond our control.
In November 2008, we entered into an amendment related to the Senior Secured Credit Facility that permits us to make discounted voluntary prepayments of our term loan in an aggregated amount not to exceed $750.0 million pursuant to a modified Dutch auction. As part of the May 2011 amendment to the Senior Secured Credit Facility, described in more detail below, the amount available for discounted voluntary prepayments of the term loan pursuant to a modified Dutch auction was reset to $750.0 million. This provision is available to us for so long as the Senior Secured Credit Facility is outstanding. For the years ended December 31, 2012, 2011 and 2010, we repurchased $0.0 million, $0.0 million and $97.2 million of our term loan under these amendments, respectively. The repurchases of the term loan resulted in gains (the discount between the purchase price of the term loan and the face value of such term loan) for the years ended December 31, 2012, 2011 and 2010 of $0.0 million, $0.0 million and $4.1 million, net of deferred financing fees written off, respectively.
In addition, we made principal payments of $245.4 million, $90.5 million and $106.0 million on the Senior Secured Credit Facility for the years ended December 31, 2012, 2011 and 2010, respectively. The principal payments made on the Senior Secured Credit Facility for the years ended December 31, 2012, 2011 and 2010 resulted in losses of $1.3 million, $0.6 million and $0.8 million associated with the write off of related deferred debt issuance costs, respectively.
The Senior Secured Credit Facility requires us to maintain a specified maximum total senior secured leverage of 5.50x for the remainder of the term of the facility. As of December 31, 2012, we were in compliance with the maximum total senior secured leverage ratio, achieving a 3.22x ratio. Within the terms of the Senior Secured Credit Facility, a senior secured leverage ratio below 3.50x results in a 25 basis point reduction to the applicable margin on the Term B-1 Loan, a 12.5 basis point reduction to the revolving credit facility commitment fee and elimination of excess cash flow payments on the Senior Secured Credit Facility for the applicable year. These reductions remain in effect as long as we continue to achieve a senior secured leverage ratio below 3.50x. A total leverage ratio below 3.25x results in a 25 basis point reduction to the applicable margin on the Term B-3 Loan. This reduction would remain in effect as long as we achieve a total leverage ratio below 3.25x. As of December 31, 2012, the total leverage ratio was 3.89x.
In addition to the maximum total secured leverage ratio, the Senior Secured Credit Facility and the indenture governing the 7.125% Senior Notes include, among other things, customary restrictions (subject to certain exceptions) on our ability to incur certain indebtedness or liens, make certain investments or declare or pay certain dividends. As of December 31, 2012, we are in compliance with all covenants under the Senior Secured Credit Facility.
To manage interest rate risk associated with our variable rate debt, we currently have eight interest rate swap contracts as of December 31, 2012 that qualify as derivatives under authoritative accounting guidance for derivative instruments and hedging activities. Our interest rate swaps do not qualify for hedge accounting treatment and, as a result, fair value adjustments are charged directly to interest expense in the Consolidated Statements of Comprehensive Income (Loss) included in Part II, Item 8, of this Annual Report on Form 10-K. For the years ended December 31, 2012, 2011 and 2010, fair value adjustments were ($25.5) million, ($7.0) million and ($28.8) million, respectively. All contracts are used strictly as an economic hedge and not for speculative purposes.
As of December 31, 2012, certain of our interest rate derivatives contain credit-risk and collateral contingent features. Certain interest rate derivatives contain provisions under which downgrades in our credit rating could require us to increase our collateral. Certain interest rate derivatives also contain provisions under which we may be required to post additional collateral if LIBOR reaches certain levels. As of December 31, 2012, we have been required to post collateral of $3.0 million in cash and $23.0 million in letters of credit as a result of changes in interest rates. We may be required to post additional collateral until the LIBOR curve reaches zero.
Assuming all collateral contingent features remain the same, a 1% increase or decrease in the LIBOR interest rate curve as of December 31, 2012 would reduce our collateral requirement by approximately $7.7 million or increase our collateral requirement by approximately $7.8 million, respectively, in a combination of cash and letters of credit.
Description of the Senior Secured Credit Facility
In 2007, ATI entered into a Senior Secured Credit Facility having a term loan in the amount of $3,100.0 million with a maturity date of August 2014. In March 2012, ATI entered into an amendment with the term loan lenders under its Senior Secured Credit Facility to extend the maturity of $801.1 million in principal amount of the Term B-1 Loan from August 2014 to August 2017 and to increase the applicable margin at our option to either (a) 3.50% over the LIBOR or (b) 2.50% over the greater of the prime lending rate provided by the British Banking Association or the federal funds effective rate published by the Federal Reserve Bank of New York. As a result of the debt modification, we recorded an additional $2.3 million as deferred financing fees in the Consolidated Balance Sheets included in Part II, Item 8, of this Annual Report on Form 10-K and extended the amortization period of $5.1 million of deferred financing fees from 2014 to 2017. In August 2012, ATI entered into an amendment with the term loan lenders under its Senior Secured Credit Facility to extend the maturity of $850.0 million of the Term B-1 Loan from August 2014 to August 2019 and to increase the applicable margin at our option to either (a) 3.25% or 3.00%, subject to our total leverage ratio, over the LIBOR (but not less than 1.00%) or (b) 2.25% or 2.00%, subject to our total leverage ratio, over the greater of the prime lending rate provided by the British Banking Association or the federal funds effective rate published by the Federal Reserve Bank of New York (but not less than 2.00%). The amendment was treated as an extinguishment of debt under GAAP, and thus we expensed $4.5 million of deferred financing fees and recorded $16.1 million of new deferred financing fees in the consolidated financial statements. In October 2012, ATI entered into an amendment with the term loan lenders under its Senior Secured Credit Facility to extend the maturity of $300.0 million of the Term B-1 Loan from August 2014 to August 2019 and to increase the applicable margin at our option to either (a) 3.25% or 3.00%, subject to our total leverage ratio, over the LIBOR (but not less than 1.00%) or (b) 2.25% or 2.00%, subject to our total leverage ratio, over the greater of the prime lending rate provided by the British Banking Association or the federal funds effective rate published by the Federal Reserve Bank of New York (but not less than 2.00%). The amendment was treated as an extinguishment of debt under GAAP, and thus we expensed $1.4 million of deferred financing fees and recorded $1.8 million of new deferred financing fees in the consolidated financial statements.
The Senior Secured Credit Facility is collateralized by a lien on substantially all of our assets including all of ATI’s capital stock and all of the capital stock or other equity interests held by us, ATI and each of our existing and future U.S. subsidiary guarantors (subject to certain limitations for equity interests of foreign subsidiaries and other exceptions set forth in the terms of the Senior Secured Credit Facility). Interest on the Term B-1 Loan is variable and as of December 31, 2012 equal to the LIBOR plus 2.50% based on our total senior secured leverage ratio; interest on the Term B-2 Loan is variable and as of December 31, 2012 equal to the LIBOR plus 3.50%; and interest on the Term B-3 Loan is variable and as of December 31, 2012 equal to the LIBOR (but not less than 1.00%) plus 3.25% based on our total leverage ratio. As of December 31, 2012, these rates were approximately 2.71%, 3.71% and 4.25% on the Term B-1 Loan, Term B-2 Loan and Term B-3 Loan, respectively, and the weighted average rate on the Senior Secured Credit Facility was approximately 3.80%. The Senior Secured Credit Facility requires minimum quarterly principal payments of $7.75 million on the Term B-1 Loan, which commenced December 2007, as well as prepayments from certain net cash proceeds of non-ordinary course asset sales and casualty and condemnation events and from a percentage of excess cash flow, if applicable. As of December 31, 2012, there had been no payments required for certain net cash proceeds of non-ordinary course asset sales and casualty and condemnation events. Due to voluntary prepayments, we have fulfilled all Term B-1 Loan required quarterly payments through its maturity date of 2014. The minimum required quarterly principal payments on the Term B-2 Loan and Term B-3 Loan are $2.0 million and $2.9 million, respectively, and remain through the maturity dates of 2017 and 2019, respectively. The remaining principal balance on each loan is due upon maturity.
In November 2008, we entered into an amendment to the Senior Secured Credit Facility that permits us to make discounted voluntary prepayments of the term loan in an aggregated amount not to exceed $750.0 million pursuant to a modified Dutch auction. As part of the May 2011 amendment to the Senior Secured Credit Facility, the amount available for discounted voluntary prepayments of the term loan pursuant to a modified Dutch auction was reset to $750.0 million. This provision is available to us for so long as the term loans are outstanding.
The Senior Secured Credit Facility also provides for $400.0 million in revolving credit borrowings, net of an allowance for up to $50.0 million in outstanding letter of credit commitments. Throughout the year ended December 31, 2012, we made periodic withdrawals on our revolving credit facility as part of our debt management plans. The maximum amount outstanding at any time on the revolving credit facility was $27.5 million, and all balances were repaid within the quarter they were borrowed. As of December 31, 2012, we had $372.1 million available under the revolving credit facility, net of $27.9 million in letters of credit. Revolving credit borrowings bear interest at a variable base rate plus an applicable margin based on our total senior secured leverage ratio. As of December 31, 2012, this rate would have been between approximately 2.96% and 5.00%. In addition, there is an annual commitment fee, based on our total senior secured leverage ratio, which is currently equal to 0.375% of the average unused revolving credit borrowings available under the Senior Secured Credit Facility. Revolving credit borrowings are payable at our option throughout the term of the Senior Secured Credit Facility, with the balance due in August 2016, or August 2014 as long as the Term B-1 Loan is outstanding.
In May 2011, we effectively amended some of the terms under the revolving credit facility including extending the term from August 2013 to August 2016, or August 2014 as long as the Term B-1 Loan is outstanding, and increasing the borrowing capacity from $317.5 million to $400.0 million. As a result, we recorded an additional $4.2 million as deferred financing fees in the Consolidated Balance Sheets in Part II, Item 8, of this Annual Report on Form 10-K and $0.9 million as deferred financing fees expensed in the Consolidated Statements of Comprehensive Income (Loss) in Part II, Item 8, of this Annual Report on Form 10-K. All deferred financing fees associated with the revolving credit facility will be amortized to interest expense on a straight-line basis over the term of the revolving credit facility.
In accordance with the Senior Secured Credit Facility, net cash proceeds of non-ordinary course asset sales and casualty and condemnation events will only be required to prepay the term loan if we do not reinvest or commit to reinvest such net cash proceeds in assets to be used in our business or to make certain other permitted investments within 15 months of the related transactions or events, subject to certain limitations. We must apply 50% of our annual excess cash flow (as defined in the Senior Secured Credit Facility) to the prepayment of the Senior Secured Credit Facility, however this percentage reduces to certain levels and eventually to zero upon achievement of certain total senior secured leverage ratios. For the year ended December 31, 2012, the excess cash flow percentage was 0%, and as a result, we are not required to make an excess cash flow payment.
In addition, the Senior Secured Credit Facility, among other things, includes customary restrictions (subject to certain exceptions) on our ability to incur certain indebtedness, grant certain liens, make certain investments or declare or pay certain dividends. As of December 31, 2012, we are in compliance with all covenants under the Senior Secured Credit Facility.
Description of the Senior Notes
In October of 2007, we issued $550.0 million of 11.0% Senior Notes and $550.0 million of Senior Toggle Notes. Interest on the 11.0% Senior Notes accrued at a rate of 11.0% per year and was payable semi-annually in arrears on May 1 and November 1 of each year. In November 2011, we fully retired the Senior Toggle Notes, and in May 2012 we fully retired the 11.0% Senior Notes.
In May 2011, we completed an offering of $500.0 million of 7.125% Senior Notes due May 2019. Interest on the 7.125% Senior Notes accrues at a rate of 7.125% per year and is payable semi-annually in arrears on November 15 and May 15. Theincreased proceeds from the offering, together with cash on hand, were used to complete a cash tender offer for $468.1exercise of stock options and $10.9 million of our Senior Toggle Notes plus accrued and unpaid interest, applicable premiums and expenses of $56.9 million. As a result of the offering, we recorded approximately $10.8 million as deferred financing fees in the Consolidated Balance Sheets included in Part II, Item 8, of this Annual Report on Form 10-K. The 7.125% Senior Notes are unsecured and guaranteed by the subsidiaries that guarantee the Senior Secured Credit Facility and will be unconditionally guaranteed, jointly and severally, by any future domestic subsidiaries that guarantee the Senior Secured Credit Facility.increased excess tax benefit from stock based compensation.
We may from time to time seek to retire the 7.125% Senior Notes through cash purchases and/or exchanges for equity securities, in open market purchases, privately negotiated transactions, contractual redemptions or otherwise. Such repurchases or exchanges, if any, will depend on prevailing market conditions, liquidity requirements, contractual restrictions and other factors. The amounts involved may be material. Prior to May 2015, we may redeem some or all of the 7.125% Senior Notes by paying the applicable “make-whole” premium. Beginning in May 2015, we may redeem some or all of the 7.125% Senior Notes at specified redemption prices in the governing indenture. For the years ended December 31, 2012, 2011 and 2010 we repurchased $0.0 million, $28.7 million and $0.0 million (at face value) of the 7.125% Senior Notes, respectively. The repurchases resulted in a net gain (the discount between the purchase price of the notes and the face value of such notes) of $0.0 million, $1.3 million, and $0.0 million for the years ended December 31, 2012, 2011 and 2010, respectively, net of deferred financing fees written off.
The indenture governing the 7.125% Senior Notes contain negative covenants restricting or limiting our ability to, among other things: incur or guarantee additional indebtedness, incur liens, pay dividends on, redeem or repurchase our capital stock, make certain investments, permit payment or dividend restrictions on certain of our subsidiaries, sell assets, engage in certain transactions with affiliates, and consolidate or merge or sell all or substantially all of our assets. Certain of these covenants would be suspended if the 7.125% Senior Notes were to reach investment grade.
Contractual Obligations, Contingent Liabilities and Commitments
The following table summarizes our contractual obligations as of December 31, 20122015 (dollars in millions):
| Payments due by period | ||||||||||||||||||||
| Total | Less than 1 year | 1-3 years | 3-5 years | More than 5 years | ||||||||||||||||
7.125% Senior Notes(1) | $ | 689.5 | $ | 33.6 | $ | 67.2 | $ | 67.2 | $ | 521.5 | ||||||||||
Senior Secured Credit Facility(2) | 2,827.7 | 108.4 | 610.0 | 930.3 | 1,179.0 | |||||||||||||||
Operating leases | 6.4 | 3.9 | 2.3 | 0.2 | 0.0 | |||||||||||||||
Pension & OPEB liabilities(3) | 53.1 | 12.6 | 28.5 | 12.0 | see (3) below | |||||||||||||||
|
|
|
|
|
|
|
|
|
| |||||||||||
Total(4) | $ | 3,576.7 | $ | 158.5 | $ | 708.0 | $ | 1,009.7 | $ | 1,700.5 | ||||||||||
|
|
|
|
|
|
|
|
|
| |||||||||||
| Payments due by period | ||||||||||||||||||||
| Total | Less than 1 year | 1-3 years | 3-5 years | More than 5 years | ||||||||||||||||
Senior Secured Credit Facility(1) | $ | 2,732.4 | $ | 108.2 | $ | 213.8 | $ | 2,410.4 | $ | — | ||||||||||
Operating leases | 14.8 | 4.7 | 5.4 | 2.7 | 2.0 | |||||||||||||||
Pension & OPEB liabilities(2) | 39.7 | 9.7 | 14.0 | 16.0 | see (2) below | |||||||||||||||
|
|
|
|
|
|
|
|
|
| |||||||||||
Total(3) | $ | 2,786.9 | $ | 122.6 | $ | 233.2 | $ | 2,429.1 | $ | 2.0 | ||||||||||
|
|
|
|
|
|
|
|
|
| |||||||||||
| (1) |
| Senior Secured Credit Facility includes principal payments and estimated interest payments excluding the effects of our interest rate swaps. |
| Estimated pension funding and post-retirement benefit payments are based on an increasing discount rate and effective interest rate for funding purposes between |
| Estimated warranty obligations, sales allowance programs and |
Critical Accounting Policies and Significant Accounting Estimates
The preparation of the consolidated financial statements in accordance with GAAP requires management to make estimates and assumptions that affect the reported amounts of some assets and liabilities and, in some instances, the reported amounts of net sales and expenses during the applicable reporting period. Differences between actual amounts and estimates are recorded in the period identified. Estimates can require a significant amount of judgment, and a different set of judgments could result in changes to our reported results. A summary of our critical accounting estimates is included below.
Revenue Recognition
Revenue recognition contains uncertainties because it requires management to make assumptions and to apply judgment to estimate the amount of sales incentives and provision for government price reductions. Distributor and customer sales incentives, consisting of allowances and other rebates, are estimated at the time of sale based upon history and experience and are recorded as a reduction to net sales. Incentive programs are generally product specific or region specific. Some factors used in estimating the cost of incentives include the number of transmissions that will be affected by the incentive program and the rate of acceptance of any incentive program. If the actual number of affected transmissions differs from this estimate, or if a different mix of incentives is actually paid, the impact on net sales would be recorded in the period that the change was identified. Assuming our current mix of sales incentives, a 10% change in sales incentives would have affected our earnings by approximately $5.0 million to $7.0 million per year for each of the prior three fiscal years.
Under terms of the U.S. government contracts, there are certain price reduction clauses and provisions for potential price reductions which are estimated at the time of sale based upon history and experience, and finalized after completion of U.S. government audits. Potential reductions may be attributed to a change in projected sales volumes or plant efficiencies which impact overall costs. Assuming our current level of government contracts, a 10% adjustment in our price reduction reserve, would have affected our earnings by approximately $5.0 million to $6.0 million per year for each of the prior three fiscal years.
Further information is provided in NOTE 2 to the consolidated financial statements in our Annual Report on Form 10-K for the year ended December 31, 2015.
Goodwill and Other Intangible Assets
Goodwill is tested for impairment at the reporting unit level, which is the same as our one operating and reportable segment. We have elected to perform our annual impairment test on October 31 of every year. A multi-step impairment test is performed on goodwill. In Step 0, we have the option to evaluate various qualitative factors to determine the likelihood of impairment. If we determine that the fair value is more likely than not less than the carrying value, then we are required to perform Step 1. If we do not elect to perform Step 0, we can voluntarily proceed directly to Step 1. In Step 1, we perform a quantitative analysis to compare the fair value of our reporting unit to our carrying value including goodwill. If the fair value of the reporting unit exceeds the carrying value of the net assets assigned to that unit, goodwill is not considered impaired, and we are not required to perform further testing. If the carrying value of the net assets assigned to the reporting unit exceeds the fair value of the reporting unit, then we must perform Step 2 of the impairment test in order to determine the implied fair value of the reporting unit’s goodwill. If the carrying value of a reporting unit’s goodwill exceeds its implied fair value, then we would record an impairment loss equal to the difference.
Our qualitative assessment contains uncertainties because it requires management to make assumptions and to apply judgment to assess business changes, economic outlook, financial trends and forecasts, growth rates, credit ratings, equity ratings, discount rates, industry data and other relevant qualitative factors.
Our quantitative analysis contains uncertainties because it is performed utilizing a discounted cash flow model which includes key assumptions, such as net sales growth derived from market information, industry reports, marketing programs and future new product introductions; operating margin improvements derived from cost reduction programs and fixed cost leverage driven by higher sales volumes; and a risk-adjusted discount rate.
Events or circumstances that could unfavorably impact the key assumptions include lower net sales driven by market conditions, our inability to execute on marketing programs and/or a delay in the introduction of new products, lower gross margins as a result of market conditions or failure to obtain forecasted cost reductions, or a higher discount rate as a result of market conditions.
Goodwill impairment testing for 2015 was performed by assessing certain qualitative trends and factors. These trends and factors were compared to, and based on, the assumptions used in prior years. After reviewing the various qualitative factors mentioned above, our 2015 annual goodwill impairment test indicated that the fair value of the reporting unit more likely than not exceeded its carrying value, indicating no impairment.
Other intangible assets have both indefinite and finite useful lives. Intangible assets with indefinite useful lives, such as our trade name, are not amortized but are tested annually for impairment. We have elected to perform our annual trade name impairment test on October 31 of every year and follow a similar multi-step impairment test that is performed on goodwill. Events or circumstances that could unfavorably impact the key assumptions include lower net sales driven by market conditions, our inability to execute on marketing programs and/or a delay in introduction of new products, and higher discount rate as a result of market conditions. While unpredictable and inherently uncertain, we believe the forecast estimates are reasonable and incorporate those assumptions that similar market participants would use in their estimates of fair value. After reviewing the various qualitative factors mentioned above, our annual 2015 trade name impairment test, as of October 31, 2015, indicated that the fair value of our trade name more likely than not exceeded the respective carrying value, indicating no impairment. However, late in the fourth quarter of 2015, we obtained updated market data showing a further decline in forecasted net sales for certain of our end markets. As a result of the new market data and revised near term and long term forecasts, we completed a Step 1 analysis for the trade name to assess the impact of these changes on its fair value. We performed a quantitative analysis to compare the fair value of trade name to the carrying value of the trade name primarily using the relief–from-royalty method under the income valuation approach consistent with prior years. Significant assumptions used to determine fair value under the relief–from-royalty method include forecasted net sales, royalty rates and a discount rate to be applied to the forecasted net sales. The estimated fair value of the trade name, as of December 31, 2015, was approximately $790.0 million versus a carrying amount of $870.0 million, resulting in a trade name impairment of $80.0 million as of December 31, 2015. The trade name impairment did not result in any other charges to goodwill, other intangible assets or long-lived assets.
Intangible assets with finite lives are amortized over their estimated useful lives and reviewed for impairment when circumstances change that would create a triggering event. Assumptions and estimates about future values and remaining useful lives of our intangible and other long-lived assets are complex and subjective. They can be affected by a variety of factors, including external factors such as industry and economic trends, and internal factors, such as changes in our business strategy and internal forecasts. Although management believes the historical assumptions and estimates are reasonable and appropriate, different assumptions and estimates could materially impact our reported financial results.
Further information is provided in NOTE 2 and NOTE 5 to the consolidated financial statements in our Annual Report on Form 10-K for the year ended December 31, 2015.
Impairment of Long-Lived Assets
The carrying value of long-lived assets is evaluated whenever events or circumstances indicate that the carrying value of a long-lived asset may not be recoverable. Events or circumstances that would result in an impairment review primarily include a significant change in the use of an asset, or the planned sale or disposal of an asset. The asset would be considered impaired when there is no future use planned for the asset or the future net undiscounted cash flows generated by the asset or asset group are less than its carrying value. An impairment loss would be recognized based on the amount by which the carrying value exceeds fair value.
Assumptions and estimates used to determine cash flows in the evaluation of impairment and the fair values used to determine the impairment are subject to a degree of judgment and complexity. Any changes to the assumptions and estimates resulting from changes in actual results or market conditions from those anticipated may affect the carrying value of long-lived assets and could result in an impairment charge.
As a result of events and circumstances in the fourth quarter of 2014, we reviewed certain of our long-lived assets related to the production of the H3000 and H4000 hybrid-propulsion systems, resulting in a $15.4 million loss recorded for the year ended December 31, 2014. The loss, determined by using future net discounted cash flows, included approximately $1.7 million of accrued expenses related to the impairment of the long-lived assets. We also recorded $1.3 million loss during the first quarter of 2015. Deteriorating market conditions for hybrid-propulsion vehicles, principally as a result of decreased fuel costs, alternative fuels and other technologies, significantly contributed to the future cash flows of the related assets being less than the carrying value of those assets.
Warranty
Provisions for estimated expenses related to product warranties are made at the time products are sold. Warranty claims arise when a transmission fails while in service during the relevant warranty period. The warranty reserve is adjusted in Selling, general and administrative expenses based on our current and historical warranty claims paid and associated repair costs. These estimates are established using historical information including the nature, frequency, and average cost of warranty claims and are adjusted as actual information becomes available. From time to time, we may initiate a specific field action program. As a result of the uncertainty surrounding the nature and frequency of specific field action programs, the liability for such programs is recorded when we commit to an action. We review and assess the liability for these programs on a quarterly basis. We also assess our ability to recover certain costs from our suppliers and record a receivable from the supplier when we believe a recovery is probable. Warranty costs may differ from those estimated if actual claim rates are higher or lower than our historical rates. Further information is provided in NOTE 9 to our consolidated financial statements in our Annual Report on Form 10-K for the year ended December 31, 2015 which contains a summary of the activity in our warranty liability account for 2015 and 2014 including adjustments to pre-existing warranties.
Pension and Post-retirement Benefit Plans
OPEB costs are based upon various actuarial assumptions and methodologies as prescribed by authoritative accounting guidance. These assumptions include discount rates, expected return on plan assets, health care cost trend rates, inflation, rate of compensation increases, population demographics, mortality rates and other factors. We review all actuarial assumptions on an annual basis.
A change in the discount rate can have a significant impact on determining our benefit obligations. Our current discount rate is determined by matching the plans’ projected cash flows to a yield curve based on long-term, fixed income debt instruments available as of the measurement date of December 31, 2015. The effect of a one percentage point decrease in the assumed discount rate would result in an increase in the December 31, 2015 defined benefit pension plans obligation of approximately $21.1 million. Similarly, a one percentage point decrease in the assumed discount rate would result in an increase in the December 31, 2015 OPEB obligation of approximately $28.0 million.
Further information is provided in NOTE 13 to the consolidated financial statements in our Annual Report on Form 10-K for the year ended December 31, 2015, which contains our review on various actuarial assumptions.
Income Taxes
Income taxes are accounted for under the asset and liability method. Deferred tax assets and liabilities are recognized for the expected future tax consequences attributable to temporary differences between the financial statement carrying amounts of existing assets and liabilities and their respective tax bases. The future tax benefits associated with operating loss and tax credit carryforwards are recognized as deferred tax assets. Deferred tax assets and liabilities are measured using enacted tax rates expected to apply to taxable income in the years in which those temporary differences are expected to be recovered or settled.
Excluding net operating loss carryforwards, our expected tax payments would have increased by approximately $58.0 million for the year ended December 31, 2015. If we continue to generate taxable income, we expect to utilize the remaining U.S. federal net operating loss carryforwards by the end of 2016.
The need to establish a valuation allowance against the deferred tax assets is assessed periodically based on a more-likely-than-not realization threshold, in accordance with the FASB’s authoritative accounting guidance on income taxes. Appropriate consideration is given to all positive and negative evidence related to that realization. This assessment considers, among other matters, the nature, frequency and severity of recent losses, forecasts of future profitability, the duration of statutory carryforward periods, and experience with tax attributes expiring unused and tax planning alternatives. The weight given to these considerations depends upon the degree to which they can be objectively verified.
As of December 31, 2015, we early adopted the FASB’s authoritative accounting guidance on a retrospective basis to classify all deferred tax assets and liabilities, along with any related valuation allowance, as noncurrent on the balance sheet. Further information on income taxes is provided in NOTE 15 to the consolidated financial statements in our Annual Report on Form 10-K for the year ended December 31, 2015.
Off-Balance Sheet Arrangements
We are not a party to any off-balance sheet arrangements.
Recently Adopted Accounting Pronouncements
Refer to NOTE 2, “Summary of Significant Accounting Policies” in Part II, Item 8, of this Annual Report on Form 10-K.
| ITEM 7A. | Quantitative and Qualitative Disclosures About Market Risk |
Our exposure to market risk consists of changes in interest rates, foreign currency rate fluctuations and movements in commodity prices.
Interest Rate Risk
We are subject to interest rate market risk in connection with a portion of our long-term debt. Our principal interest rate exposure relates to outstanding amounts under our Senior Secured Credit Facility. Our Senior Secured Credit Facility provides for variable rate borrowings of up to $2,721.6$2,863.8 million including $372.1$461.0 million under our revolving credit facility, net of $27.9$4.0 million of letters of credit. AssumingA one-eighth percent change in assumed interest rates for the Senior Secured Credit Facility, isif fully drawn, eachas of December 31, 2015 would have an impact of approximately $0.6 million on interest expense assuming the 1.00% LIBOR floor is in effect for our Term B-3 Loan. Should LIBOR exceed 1.00%, a one-eighth percentage point increase or decreasepercent change in the applicableassumed interest rates would correspondingly change our interest expense onfor the Senior Secured Credit Facility, byif fully drawn, as of December 31, 2015 would have an impact of approximately $0.6$3.6 million per year. This includes the partial offset of theon interest rate swaps described below.expense. As of December 31, 2012,2015, we had no outstanding borrowings against the revolving credit facility.
From time to time, we enter into interest rate swap agreements to hedge our variable interest rate debt. Below is a list of our interest rate swaps as of December 31, 2012:2015:
Counterparty | Effective | Notional Amount (in millions) | LIBOR Fixed Rate | |||||||||
Interest Rate Swap D | Fifth Third Bank | 2009-2013 | $ | 125.0 | 4.26 | % | ||||||
Interest Rate Swap E | Barclays Capital | 2010-2013 | $ | 150.0 | 2.79 | % | ||||||
Interest Rate Swap F | Barclays Capital | 2010-2013 | $ | 75.0 | 2.66 | % | ||||||
Interest Rate Swap G | Barclays Capital | 2010-2013 | $ | 75.0 | 2.99 | % | ||||||
Interest Rate Swap H | Barclays Capital | 2011-2014 | $ | 350.0 | 3.75 | % | ||||||
Interest Rate Swap I | Deutsche Bank | 2011-2014 | $ | 350.0 | 3.77 | % | ||||||
Interest Rate Swap J | UBS | 2013-2014 | $ | 125.0 | 2.96 | % | ||||||
Interest Rate Swap K | UBS | 2013-2014 | $ | 125.0 | 3.05 | % | ||||||
| Counterparty | Effective Date | Notional Amount (in millions) | LIBOR Fixed Rate | |||||||||
Interest Rate Swap L | Barclays | Aug 2016-Aug 2019 | $ | 75.0 | 3.44 | %* | ||||||
Interest Rate Swap M | JP Morgan | Aug 2016-Aug 2019 | $ | 100.0 | 3.43 | %* | ||||||
Interest Rate Swap N | Bank of America | Aug 2016-Aug 2019 | $ | 75.0 | 3.37 | %* | ||||||
Interest Rate Swap O | Deutsche Bank | Aug 2016-Aug 2019 | $ | 75.0 | 3.19 | %* | ||||||
Interest Rate Swap P | Barclays | Aug 2016-Aug 2019 | $ | 75.0 | 3.08 | %* | ||||||
Interest Rate Swap Q | Barclays | Aug 2016-Aug 2019 | $ | 50.0 | 2.99 | %* | ||||||
Interest Rate Swap R | Deutsche Bank | Aug 2016-Aug 2019 | $ | 50.0 | 2.98 | %* | ||||||
Interest Rate Swap S | Deutsche Bank | Aug 2016-Aug 2019 | $ | 50.0 | 2.73 | %* | ||||||
Interest Rate Swap T | Bank of America | Aug 2016-Aug 2019 | $ | 75.0 | 2.74 | %* | ||||||
Interest Rate Swap U | Fifth Third Bank | Aug 2016-Aug 2019 | $ | 50.0 | 2.66 | %* | ||||||
Interest Rate Swap V | Fifth Third Bank | Aug 2016-Aug 2019 | $ | 50.0 | 2.60 | %* | ||||||
Interest Rate Swap W | Fifth Third Bank | Aug 2016-Aug 2019 | $ | 25.0 | 2.40 | %* | ||||||
Interest Rate Swap X | Huntington Bank | Aug 2016-Aug 2019 | $ | 50.0 | 2.25 | %* | ||||||
* includes LIBOR floor of 1.00% | ||||||||||||
In certain circumstances, we and the counterparty are required to provide additional collateral under these swaps. We are exposed to increased interest expense if a counterparty defaults. Refer to NOTE 7 and NOTE 8 of Notes to Consolidated Financial Statements included in Part II, Item 8, of this Annual Report on Form 10-K.
Exchange Rate Risk
While our net sales and costs are denominated primarily in U.S. Dollars, net sales, costs, assets and liabilities are generated in other currencies including Japanese Yen, Euro, Indian Rupee, Brazilian Real, Chinese Yuan Renminbi, Canadian Dollar and Hungarian Forint. The expansion of our business outside North America may further increase the risk that cash flows resulting from these activities may be adversely affected by changes in currency exchange rates. As of December 31, 2012,During 2015, we holdheld hedging contracts in the Japanese Yen, which arewere intended to hedge either known or forecasted cash flow payments denominated in the currency. We do not hold financial instruments for trading or speculative purposes.
Assuming current levels of foreign currency transactions, a 10% aggregate increase or decrease in the Japanese Yen, Euro, Indian Rupee, Chinese Yuan Renminbi and Canadian Dollar would correspondingly change our earnings by an estimated $5$3 million per year. This includes the partial offset of our hedging contracts described above. All other exposure to foreign currencies is considered immaterial.
Commodity Price Risk
We are subject to changes in our cost of sales caused by movements in underlying commodity prices. Approximately two-thirds of our cost of sales consists of purchased components with significant raw material content. A substantial portion of the purchased parts are made of aluminum and steel. The cost of aluminum parts include an adjustment factor on future purchases for fluctuations in aluminum prices based on accepted industry indices. In addition, a substantial amount of steel-based contracts also include an index-based component. As our costs change, we are able to pass through a portion of the changes in commodity prices to certain of our customers according to our LTSAs. We historically have not entered into long-term purchase contracts related to the purchase of aluminum and steel. We currently hold financial forward contractscommodity swaps that are intended to hedge forecasted aluminum purchases. Based on our forecasted demand for 20132016 and 2014,2017, as of December 31, 2012,2015, the hedge contracts cover approximately 30%32% and 20%23% of our aluminum requirements, respectively. We do not hold financial instruments for trading or speculative purposes.
Assuming current levels of commodity purchases, a 10% increase or decrease in the price of aluminum and steel would correspondingly change our earnings by approximately $1 million and $4$3 million per year, respectively. This includes the partial offset of our hedging contracts described above.
Many of our LTSAs have incorporated a cost-sharing arrangement related to potential future commodity price fluctuations. Our hedging policy is that we only hedge for our exposure and do not hedge any portion of the customers’ exposure. For purposes of the sensitivity analysis above, the impact of these cost sharing arrangements havehas not been included.
ITEM 8. Financial Statements and Supplementary Data Report of Independent Registered Public Accounting Firm
To the Board of Directors and Stockholders of
Allison Transmission Holdings, Inc.:
In our opinion, the accompanying consolidated financialbalance sheets and the related consolidated statements of comprehensive income, of stockholders’ equity and of cash flows present fairly, in all material respects, the financial position of Allison Transmission Holdings, Inc. and its subsidiaries at December 31, 20122015 and December 31, 2011,2014, and the results of their operations and their cash flows for each of the three years in the period ended December 31, 20122015 in conformity with accounting principles generally accepted in the United States of America. In addition, in our opinion, the accompanying financial statement schedule listed in the index appearing under Item 15(a)(2) presents fairly, in all material respects, the information set forth therein when read in conjunction with the related consolidated financial statements. TheseAlso in our opinion, the Company maintained, in all material respects, effective internal control over financial statements and financial statement schedule arereporting as of December 31, 2015, based on criteria established inInternal Control - Integrated Framework (2013) issued by the responsibilityCommittee of Sponsoring Organizations of the Treadway Commission (COSO). The Company’s management. Our responsibilitymanagement is to express an opinion onresponsible for these financial statements and financial statement schedule, for maintaining effective internal control over financial reporting and for its assessment of the effectiveness of internal control over financial reporting, included in Management’s Report on Internal Control Over Financial Reporting appearing under Item 9A. Our responsibility is to express opinions on these financial statements, on the financial statement schedule, and on the Company’s internal control over financial reporting based on our integrated audits. We conducted our audits of these statements in accordance with the standards of the Public Company Accounting Oversight Board (United States). Those standards require that we plan and perform the auditaudits to obtain reasonable assurance about whether the financial statements are free of material misstatement. An audit includesmisstatement and whether effective internal control over financial reporting was maintained in all material respects. Our audits of the financial statements included examining, on a test basis, evidence supporting the amounts and disclosures in the financial statements, assessing the accounting principles used and significant estimates made by management, and evaluating the overall financial statement presentation. Our audit of internal control over financial reporting included obtaining an understanding of internal control over financial reporting, assessing the risk that a material weakness exists, and testing and evaluating the design and operating effectiveness of internal control based on the assessed risk. Our audits also included performing such other procedures as we considered necessary in the circumstances. We believe that our audits provide a reasonable basis for our opinion.opinions.
As discussed in NOTE 2 to the consolidated financial statements, the Company changed the manner in which it classifies deferred taxes and deferred financing costs in 2015.
A company’s internal control over financial reporting is a process designed to provide reasonable assurance regarding the reliability of financial reporting and the preparation of financial statements for external purposes in accordance with generally accepted accounting principles. A company’s internal control over financial reporting includes those policies and procedures that (i) pertain to the maintenance of records that, in reasonable detail, accurately and fairly reflect the transactions and dispositions of the assets of the company; (ii) provide reasonable assurance that transactions are recorded as necessary to permit preparation of financial statements in accordance with generally accepted accounting principles, and that receipts and expenditures of the company are being made only in accordance with authorizations of management and directors of the company; and (iii) provide reasonable assurance regarding prevention or timely detection of unauthorized acquisition, use, or disposition of the company’s assets that could have a material effect on the financial statements.
Because of its inherent limitations, internal control over financial reporting may not prevent or detect misstatements. Also, projections of any evaluation of effectiveness to future periods are subject to the risk that controls may become inadequate because of changes in conditions, or that the degree of compliance with the policies or procedures may deteriorate.
/s/ PricewaterhouseCoopers LLP
Indianapolis, Indiana
February 28, 201319, 2016
Allison Transmission Holdings, Inc.
Consolidated Balance Sheets
(dollars in millions, except share data)
| December 31, 2012 | December 31, 2011 | December 31, 2015 | December 31, 2014 | |||||||||||||
ASSETS | ||||||||||||||||
Current Assets | ||||||||||||||||
Cash and cash equivalents | $ | 80.2 | $ | 314.0 | $ | 251.6 | $ | 263.0 | ||||||||
Accounts receivable — net of allowance for doubtful accounts of $0.9 and $1.3, respectively | 165.0 | 194.7 | ||||||||||||||
Accounts receivable — net of allowance for doubtful accounts of $0.4 and $0.3, respectively | 195.0 | 207.4 | ||||||||||||||
Inventories | 157.1 | 155.9 | 141.4 | 143.5 | ||||||||||||
Deferred income taxes, net | 55.3 | 3.4 | ||||||||||||||
Other current assets | 32.7 | 34.7 | 28.8 | 24.4 | ||||||||||||
|
|
|
| |||||||||||||
Total Current Assets | 490.3 | 702.7 | 616.8 | 638.3 | ||||||||||||
Property, plant and equipment, net | 596.2 | 581.8 | 479.7 | 514.6 | ||||||||||||
Intangible assets, net | 1,716.1 | 1,866.1 | 1,334.8 | 1,512.0 | ||||||||||||
Goodwill | 1,941.0 | 1,941.0 | 1,941.0 | 1,941.0 | ||||||||||||
Deferred income taxes, net | 32.3 | 0.8 | 1.9 | 2.3 | ||||||||||||
Other non-current assets | 90.1 | 100.2 | 34.2 | 48.0 | ||||||||||||
|
|
|
| |||||||||||||
TOTAL ASSETS | $ | 4,866.0 | $ | 5,192.6 | $ | 4,408.4 | $ | 4,656.2 | ||||||||
|
|
|
| |||||||||||||
LIABILITIES | ||||||||||||||||
Current Liabilities | ||||||||||||||||
Accounts payable | $ | 133.1 | $ | 162.6 | $ | 126.2 | $ | 151.7 | ||||||||
Product warranty liability | 36.2 | 33.9 | 24.9 | 24.0 | ||||||||||||
Current portion of long-term debt | 19.5 | 31.0 | 24.5 | 17.9 | ||||||||||||
Notes payable | — | 2.6 | ||||||||||||||
Deferred revenue | 21.6 | 19.9 | 22.9 | 20.6 | ||||||||||||
Other current liabilities | 167.4 | 199.9 | 106.1 | 131.7 | ||||||||||||
|
|
|
| |||||||||||||
Total Current Liabilities | 377.8 | 449.9 | 304.6 | 345.9 | ||||||||||||
Product warranty liability | 73.5 | 81.5 | 53.4 | 59.6 | ||||||||||||
Deferred revenue | 42.6 | 40.8 | 56.4 | 48.7 | ||||||||||||
Long-term debt | 2,801.3 | 3,345.0 | 2,352.7 | 2,473.3 | ||||||||||||
Deferred income taxes | 0.1 | 214.2 | 204.6 | 119.5 | ||||||||||||
Other non-current liabilities | 213.8 | 239.5 | 248.1 | 211.4 | ||||||||||||
|
|
|
| |||||||||||||
TOTAL LIABILITIES | 3,509.1 | 4,370.9 | 3,219.8 | 3,258.4 | ||||||||||||
Commitments and contingencies (see NOTE 16) | ||||||||||||||||
Commitments and contingencies (see NOTE 17) | ||||||||||||||||
STOCKHOLDERS’ EQUITY | ||||||||||||||||
Common stock, $0.01 par value, 1,880,000,000 shares authorized, 184,107,393 issued and 184,083,693 outstanding | 1.8 | 1.8 | ||||||||||||||
Non-voting common stock, $0.01 par value, 20,000,000 shares authorized, 1,185 issued and outstanding | 0.0 | 0.0 | ||||||||||||||
Common stock, $0.01 par value, 1,880,000,000 shares authorized, 171,157,004 shares issued and outstanding and 179,488,247 shares issued and outstanding, respectively | 1.7 | 1.8 | ||||||||||||||
Non-voting common stock, $0.01 par value, 20,000,000 shares authorized, none issued and outstanding | — | — | ||||||||||||||
Preferred stock, $0.01 par value, 100,000,000 shares authorized, none issued and outstanding | — | — | — | — | ||||||||||||
Treasury stock | (0.2 | ) | (0.2 | ) | ||||||||||||
Paid in capital | 1,601.5 | 1,560.8 | 1,690.2 | 1,651.0 | ||||||||||||
Accumulated deficit | (202.3 | ) | (683.7 | ) | (444.5 | ) | (215.5 | ) | ||||||||
Accumulated other comprehensive loss, net of tax | (43.9 | ) | (57.0 | ) | (58.8 | ) | (39.5 | ) | ||||||||
|
|
|
| |||||||||||||
TOTAL STOCKHOLDERS’ EQUITY | 1,356.9 | 821.7 | 1,188.6 | 1,397.8 | ||||||||||||
|
|
|
| |||||||||||||
TOTAL LIABILITIES & STOCKHOLDERS’ EQUITY | $ | 4,866.0 | $ | 5,192.6 | $ | 4,408.4 | $ | 4,656.2 | ||||||||
|
|
|
| |||||||||||||
The accompanying notes are an integral part of the consolidated financial statements.
Allison Transmission Holdings, Inc.
Consolidated Statements of Comprehensive Income (Loss)
(dollars in millions, except per share data)
| Year ended December 31, | Years ended December 31, | |||||||||||||||||||||||
| 2012 | 2011 | 2010 | 2015 | 2014 | 2013 | |||||||||||||||||||
Net sales | $ | 2,141.8 | $ | 2,162.8 | $ | 1,926.3 | $ | 1,985.8 | $ | 2,127.4 | $ | 1,926.8 | ||||||||||||
Cost of sales | 1,187.5 | 1,208.3 | 1,098.1 | 1,052.0 | 1,151.5 | 1,084.9 | ||||||||||||||||||
|
|
|
|
|
| |||||||||||||||||||
Gross profit | 954.3 | 954.5 | 828.2 | 933.8 | 975.9 | 841.9 | ||||||||||||||||||
Selling, general and administrative expenses | 419.0 | 409.1 | 384.9 | 317.1 | 344.6 | 334.9 | ||||||||||||||||||
Engineering — research and development | 115.1 | 116.4 | 101.5 | 92.5 | 103.8 | 97.1 | ||||||||||||||||||
Trade name impairment (see NOTE 5) | 80.0 | — | — | |||||||||||||||||||||
Environmental remediation | 14.0 | — | — | |||||||||||||||||||||
Loss associated with impairment of long-lived assets | 1.3 | 15.4 | — | |||||||||||||||||||||
|
|
|
|
|
| |||||||||||||||||||
Operating income | 420.2 | 429.0 | 341.8 | 428.9 | 512.1 | 409.9 | ||||||||||||||||||
Interest income | 0.9 | 0.9 | 3.5 | 0.7 | 0.9 | 0.8 | ||||||||||||||||||
Interest expense | (152.1 | ) | (218.2 | ) | (281.0 | ) | (115.2 | ) | (139.3 | ) | (133.7 | ) | ||||||||||||
Premiums and expenses on tender offer for long-term debt | — | (56.9 | ) | — | ||||||||||||||||||||
Other (expense) income, net | (52.8 | ) | (4.2 | ) | 19.0 | |||||||||||||||||||
Premiums and expenses on tender offer and redemption of long-term debt | (25.3 | ) | — | — | ||||||||||||||||||||
Other expense, net | (0.3 | ) | (5.6 | ) | (10.9 | ) | ||||||||||||||||||
|
|
|
|
|
| |||||||||||||||||||
Income before income taxes | 216.2 | 150.6 | 83.3 | 288.8 | 368.1 | 266.1 | ||||||||||||||||||
Income tax benefit (expense) | 298.0 | (47.6 | ) | (53.7 | ) | |||||||||||||||||||
Income tax expense | (106.5 | ) | (139.5 | ) | (100.7 | ) | ||||||||||||||||||
|
|
|
|
|
| |||||||||||||||||||
Net income | $ | 514.2 | $ | 103.0 | $ | 29.6 | $ | 182.3 | $ | 228.6 | $ | 165.4 | ||||||||||||
|
|
|
|
|
| |||||||||||||||||||
Basic earnings per share attributable to common stockholders | $ | 2.83 | $ | 0.57 | $ | 0.16 | $ | 1.03 | $ | 1.27 | $ | 0.90 | ||||||||||||
|
|
|
|
|
| |||||||||||||||||||
Diluted earnings per share attributable to common stockholders | $ | 2.76 | $ | 0.56 | $ | 0.16 | $ | 1.03 | $ | 1.25 | $ | 0.88 | ||||||||||||
|
|
|
|
|
| |||||||||||||||||||
Dividends per common share | $ | 0.18 | — | — | ||||||||||||||||||||
Dividends declared per common share | $ | 0.60 | $ | 0.51 | $ | 0.42 | ||||||||||||||||||
|
|
|
|
|
| |||||||||||||||||||
Other comprehensive income (loss), net of tax | ||||||||||||||||||||||||
Other comprehensive (loss) income, net of tax: | ||||||||||||||||||||||||
Foreign currency translation | (0.7 | ) | (11.6 | ) | 0.1 | (11.5 | ) | (7.4 | ) | (5.0 | ) | |||||||||||||
Pension and OPEB liability adjustment | 15.1 | (22.6 | ) | (31.9 | ) | (3.0 | ) | (9.1 | ) | 29.0 | ||||||||||||||
Available-for-sale securities | (1.3 | ) | 3.2 | (1.2 | ) | (4.8 | ) | (2.0 | ) | (1.1 | ) | |||||||||||||
|
|
|
|
|
| |||||||||||||||||||
Total other comprehensive income (loss), net of tax | 13.1 | (31.0 | ) | (32.9 | ) | |||||||||||||||||||
Total other comprehensive (loss) income, net of tax | (19.3 | ) | (18.5 | ) | 22.9 | |||||||||||||||||||
|
|
|
|
|
| |||||||||||||||||||
Comprehensive income (loss) | $ | 527.3 | $ | 72.0 | $ | (3.4 | ) | |||||||||||||||||
Comprehensive income | $ | 163.0 | $ | 210.1 | $ | 188.3 | ||||||||||||||||||
|
|
|
|
|
| |||||||||||||||||||
The accompanying notes are an integral part of the consolidated financial statements.
Allison Transmission Holdings, Inc.
Consolidated Statements of Cash Flows
(dollars in millions)
| Year ended December 31, | Years ended December 31, | |||||||||||||||||||||||
| 2012 | 2011 | 2010 | 2015 | 2014 | 2013 | |||||||||||||||||||
CASH FLOWS FROM OPERATING ACTIVITIES: | ||||||||||||||||||||||||
Net income | $ | 514.2 | $ | 103.0 | $ | 29.6 | $ | 182.3 | $ | 228.6 | $ | 165.4 | ||||||||||||
Add (deduct) items included in net income not using (providing) cash: | ||||||||||||||||||||||||
Adjustments to reconcile net income to net cash provided by operating activities: | ||||||||||||||||||||||||
Amortization of intangible assets | 150.0 | 151.9 | 154.2 | 97.1 | 98.8 | 105.3 | ||||||||||||||||||
Depreciation of property, plant and equipment | 102.5 | 103.8 | 99.6 | 88.3 | 93.8 | 98.7 | ||||||||||||||||||
Premiums and expenses on tender offer for long-term debt | — | 56.9 | — | |||||||||||||||||||||
Deferred income taxes | (303.8 | ) | 39.8 | 51.5 | 96.0 | 131.8 | 98.0 | |||||||||||||||||
Unrealized (gain) loss on derivatives | (26.2 | ) | 13.9 | 28.8 | ||||||||||||||||||||
Trade name impairment | 80.0 | — | — | |||||||||||||||||||||
Premiums and expenses on tender offer and redemption of long-term debt | 25.3 | — | — | |||||||||||||||||||||
Unrealized loss (gain) on derivatives | 14.7 | (4.7 | ) | (32.8 | ) | |||||||||||||||||||
Stock-based compensation | 9.8 | 14.7 | 13.7 | |||||||||||||||||||||
Excess tax benefit from stock-based compensation | (8.4 | ) | (24.6 | ) | (13.7 | ) | ||||||||||||||||||
Amortization of deferred financing costs | 14.5 | 12.1 | 11.6 | 8.0 | 8.1 | 10.9 | ||||||||||||||||||
Loss associated with impairment of long-lived assets | 1.3 | 15.4 | — | |||||||||||||||||||||
Loss on repayments of long-term debt | 0.3 | 0.5 | 0.8 | |||||||||||||||||||||
Impairment loss on investments in technology-related initiatives | 14.4 | — | — | — | 2.0 | 5.0 | ||||||||||||||||||
Stock-based compensation | 6.4 | 8.0 | 8.5 | |||||||||||||||||||||
Loss (gain) on repurchases and redemptions of long-term debt | 22.1 | 16.0 | (3.3 | ) | ||||||||||||||||||||
Loss on re-measurement of employee benefit plans | 2.3 | — | — | |||||||||||||||||||||
Excess tax benefit from stock-based compensation | (5.3 | ) | — | — | ||||||||||||||||||||
Other | (0.2 | ) | (1.4 | ) | 2.1 | 2.0 | 5.2 | 2.1 | ||||||||||||||||
Changes in assets and liabilities: | ||||||||||||||||||||||||
Accounts receivable | 29.9 | (25.0 | ) | 23.7 | 9.0 | (35.8 | ) | (9.9 | ) | |||||||||||||||
Inventories | (1.8 | ) | (11.0 | ) | (11.8 | ) | (2.2 | ) | 12.7 | (4.4 | ) | |||||||||||||
Accounts payable | (29.4 | ) | 24.9 | 3.2 | (25.1 | ) | 2.1 | 17.6 | ||||||||||||||||
Other assets and liabilities | 7.9 | (23.7 | ) | (8.8 | ) | 1.5 | 24.7 | 6.8 | ||||||||||||||||
|
|
|
|
|
| |||||||||||||||||||
Net cash provided by operating activities | 497.5 | 469.2 | 388.9 | 579.9 | 573.3 | 463.5 | ||||||||||||||||||
CASH FLOWS FROM INVESTING ACTIVITIES: | ||||||||||||||||||||||||
Additions of long-lived assets | (123.9 | ) | (96.9 | ) | (73.8 | ) | (58.1 | ) | (64.1 | ) | (74.4 | ) | ||||||||||||
Investments in technology-related initiatives | (14.4 | ) | — | — | (1.9 | ) | (5.8 | ) | (8.8 | ) | ||||||||||||||
Proceeds from disposal of assets | 0.3 | 0.3 | 0.5 | |||||||||||||||||||||
Collateral for interest rate derivatives | (1.0 | ) | 38.6 | (21.8 | ) | — | 1.7 | 1.2 | ||||||||||||||||
Proceeds from disposal of assets | 0.6 | 2.4 | 0.3 | |||||||||||||||||||||
|
|
|
|
|
| |||||||||||||||||||
Net cash used for investing activities | (138.7 | ) | (55.9 | ) | (95.3 | ) | (59.7 | ) | (67.9 | ) | (81.5 | ) | ||||||||||||
CASH FLOWS FROM FINANCING ACTIVITIES: | ||||||||||||||||||||||||
Repurchases and redemption of long-term debt | (491.2 | ) | — | — | ||||||||||||||||||||
Issuance of long-term debt | — | 500.0 | — | 470.0 | — | — | ||||||||||||||||||
Debt issuance costs | — | (15.0 | ) | — | ||||||||||||||||||||
Debt financing fees | (20.2 | ) | — | — | ||||||||||||||||||||
Repurchases and redemptions of long-term debt | (326.9 | ) | (764.4 | ) | (91.9 | ) | ||||||||||||||||||
Repurchase of common stock | (305.8 | ) | (249.8 | ) | (99.5 | ) | ||||||||||||||||||
Payments on long-term debt | (245.4 | ) | (90.5 | ) | (106.0 | ) | (116.5 | ) | (157.6 | ) | (142.4 | ) | ||||||||||||
Dividend payments | (32.8 | ) | — | — | (105.6 | ) | (91.6 | ) | (77.1 | ) | ||||||||||||||
Issuance of common stock | 29.0 | — | — | |||||||||||||||||||||
Payments on notes payable | (2.5 | ) | — | — | ||||||||||||||||||||
Proceeds from exercise of stock options | 22.9 | 59.6 | 46.3 | |||||||||||||||||||||
Debt financing costs | (9.0 | ) | (0.9 | ) | (14.9 | ) | ||||||||||||||||||
Excess tax benefit from stock-based compensation | 5.3 | — | — | 8.4 | 24.6 | 13.7 | ||||||||||||||||||
Taxes paid related to net share settlement of equity awards | (1.9 | ) | (8.4 | ) | (3.6 | ) | ||||||||||||||||||
|
|
|
|
|
| |||||||||||||||||||
Net cash used for financing activities | (593.5 | ) | (369.9 | ) | (197.9 | ) | (528.7 | ) | (424.1 | ) | (277.5 | ) | ||||||||||||
Effect of exchange rate changes on cash | 0.9 | 18.4 | 3.4 | (2.9 | ) | (3.0 | ) | (0.0 | ) | |||||||||||||||
Net (decrease) increase in cash and cash equivalents | (233.8 | ) | 61.8 | 99.1 | (11.4 | ) | 78.3 | 104.5 | ||||||||||||||||
Cash and cash equivalents at beginning of period | 314.0 | 252.2 | 153.1 | 263.0 | 184.7 | 80.2 | ||||||||||||||||||
|
|
|
|
|
| |||||||||||||||||||
Cash and cash equivalents at end of period | $ | 80.2 | $ | 314.0 | $ | 252.2 | $ | 251.6 | $ | 263.0 | $ | 184.7 | ||||||||||||
|
|
|
|
|
| |||||||||||||||||||
Supplemental disclosures: | ||||||||||||||||||||||||
Interest paid | $ | 167.3 | $ | 208.6 | $ | 239.1 | $ | 97.1 | $ | 140.0 | $ | 159.2 | ||||||||||||
Income taxes paid | $ | 10.7 | $ | 5.8 | $ | 2.2 | $ | 5.2 | $ | 5.0 | $ | 3.8 | ||||||||||||
The accompanying notes are an integral part of the consolidated financial statements.
Allison Transmission Holdings, Inc.
Consolidated Statements of Stockholders’ Equity
(dollars in millions)
| Common Stock | Non-voting Common Stock | Preferred Stock | Treasury Stock | Paid-in Capital | Accumulated Deficit | Accumulated Other Comprehensive Income (Loss), net of tax | Stockholders’ Equity | Common Stock | Non- voting Common Stock | Preferred Stock | Treasury Stock | Paid-in Capital | Accumulated Deficit | Accumulated Other Comprehensive Income (Loss), net of tax | Stockholders’ Equity | |||||||||||||||||||||||||||||||||||||||||||||||||
Balance at December 31, 2009 | $ | 1.8 | $ | — | $ | — | $ | (0.2 | ) | $ | 1,544.3 | $ | (816.3 | ) | $ | 7.0 | $ | 736.6 | ||||||||||||||||||||||||||||||||||||||||||||||
Additional investment | — | — | — | — | 0.1 | — | — | 0.1 | ||||||||||||||||||||||||||||||||||||||||||||||||||||||||
Stock-based compensation | — | — | — | — | 8.4 | — | — | 8.4 | ||||||||||||||||||||||||||||||||||||||||||||||||||||||||
Pension and OPEB liability adjustment | — | — | — | — | — | — | (31.9 | ) | (31.9 | ) | ||||||||||||||||||||||||||||||||||||||||||||||||||||||
Foreign currency translation adjustment | — | — | — | — | — | — | 0.1 | 0.1 | ||||||||||||||||||||||||||||||||||||||||||||||||||||||||
Available-for-sale securities | — | — | — | — | — | — | (1.2 | ) | (1.2 | ) | ||||||||||||||||||||||||||||||||||||||||||||||||||||||
Net income | — | — | — | — | — | 29.6 | — | 29.6 | ||||||||||||||||||||||||||||||||||||||||||||||||||||||||
|
|
|
|
|
|
|
| |||||||||||||||||||||||||||||||||||||||||||||||||||||||||
Balance at December 31, 2010 | $ | 1.8 | $ | — | $ | — | $ | (0.2 | ) | $ | 1,552.8 | $ | (786.7 | ) | $ | (26.0 | ) | $ | 741.7 | |||||||||||||||||||||||||||||||||||||||||||||
Stock-based compensation | — | — | — | — | 8.0 | — | — | 8.0 | ||||||||||||||||||||||||||||||||||||||||||||||||||||||||
Pension and OPEB liability adjustment | — | — | — | — | — | — | (22.6 | ) | (22.6 | ) | ||||||||||||||||||||||||||||||||||||||||||||||||||||||
Foreign currency translation adjustment | — | — | — | — | — | — | (11.6 | ) | (11.6 | ) | ||||||||||||||||||||||||||||||||||||||||||||||||||||||
Available-for-sale securities | — | — | — | — | — | — | 3.2 | 3.2 | ||||||||||||||||||||||||||||||||||||||||||||||||||||||||
Net income | — | — | — | — | — | 103.0 | — | 103.0 | ||||||||||||||||||||||||||||||||||||||||||||||||||||||||
|
|
|
|
|
|
|
| |||||||||||||||||||||||||||||||||||||||||||||||||||||||||
Balance at December 31, 2011 | $ | 1.8 | $ | — | $ | — | $ | (0.2 | ) | $ | 1,560.8 | $ | (683.7 | ) | $ | (57.0 | ) | $ | 821.7 | |||||||||||||||||||||||||||||||||||||||||||||
Balance at December 31, 2012 | $ | 1.8 | $ | 0.0 | $ | — | $ | (0.2 | ) | $ | 1,601.5 | $ | (202.3 | ) | $ | (43.9 | ) | $ | 1,356.9 | |||||||||||||||||||||||||||||||||||||||||||||
Stock-based compensation | — | — | — | — | 6.4 | — | — | 6.4 | — | — | — | — | 13.7 | — | — | 13.7 | ||||||||||||||||||||||||||||||||||||||||||||||||
Pension and OPEB liability adjustment | — | — | — | — | — | — | 15.1 | 15.1 | — | — | — | — | — | — | 29.0 | 29.0 | ||||||||||||||||||||||||||||||||||||||||||||||||
Foreign currency translation adjustment | — | — | — | — | — | — | (0.7 | ) | (0.7 | ) | — | — | — | — | — | — | (5.0 | ) | (5.0 | ) | ||||||||||||||||||||||||||||||||||||||||||||
Available-for-sale securities | — | — | — | — | — | — | (1.3 | ) | (1.3 | ) | — | — | — | — | — | — | (1.1 | ) | (1.1 | ) | ||||||||||||||||||||||||||||||||||||||||||||
Issuance of common stock | 0.0 | — | — | — | 29.0 | — | — | 29.0 | 0.0 | — | — | — | 42.6 | — | — | 42.6 | ||||||||||||||||||||||||||||||||||||||||||||||||
Repurchase of common stock | (0.0 | ) | — | — | — | (39.7 | ) | (59.8 | ) | — | (99.5 | ) | ||||||||||||||||||||||||||||||||||||||||||||||||||||
Retirement of treasury stock | — | — | — | 0.2 | — | — | — | 0.2 | ||||||||||||||||||||||||||||||||||||||||||||||||||||||||
Dividends on common stock | — | — | — | — | — | (32.8 | ) | — | (32.8 | ) | — | — | — | — | — | (77.1 | ) | — | (77.1 | ) | ||||||||||||||||||||||||||||||||||||||||||||
Excess tax benefit from stock-based compensation | — | — | — | — | 5.3 | — | — | 5.3 | — | — | — | — | 13.7 | — | — | 13.7 | ||||||||||||||||||||||||||||||||||||||||||||||||
Net income | — | — | — | — | — | 514.2 | — | 514.2 | — | — | — | — | — | 165.4 | — | 165.4 | ||||||||||||||||||||||||||||||||||||||||||||||||
|
|
|
|
|
|
|
|
|
|
|
|
|
|
|
| |||||||||||||||||||||||||||||||||||||||||||||||||
Balance at December 31, 2012 | $ | 1.8 | $ | — | $ | — | $ | (0.2 | ) | $ | 1,601.5 | $ | (202.3 | ) | $ | (43.9 | ) | $ | 1,356.9 | |||||||||||||||||||||||||||||||||||||||||||||
Balance at December 31, 2013 | $ | 1.8 | $ | 0.0 | $ | — | $ | — | $ | 1,631.8 | $ | (173.8 | ) | $ | (21.0 | ) | $ | 1,438.8 | ||||||||||||||||||||||||||||||||||||||||||||||
Stock-based compensation | — | — | — | — | 14.7 | — | — | 14.7 | ||||||||||||||||||||||||||||||||||||||||||||||||||||||||
Pension and OPEB liability adjustment | — | — | — | — | — | — | (9.1 | ) | (9.1 | ) | ||||||||||||||||||||||||||||||||||||||||||||||||||||||
Foreign currency translation adjustment | — | — | — | — | — | — | (7.4 | ) | (7.4 | ) | ||||||||||||||||||||||||||||||||||||||||||||||||||||||
Available-for-sale securities | — | — | — | — | — | — | (2.0 | ) | (2.0 | ) | ||||||||||||||||||||||||||||||||||||||||||||||||||||||
Issuance of common stock | 0.0 | — | — | — | 51.0 | — | — | 51.0 | ||||||||||||||||||||||||||||||||||||||||||||||||||||||||
Repurchase of common stock | (0.0 | ) | (0.0 | ) | — | — | (71.1 | ) | (178.7 | ) | — | (249.8 | ) | |||||||||||||||||||||||||||||||||||||||||||||||||||
Dividends on common stock | — | — | — | — | — | (91.6 | ) | — | (91.6 | ) | ||||||||||||||||||||||||||||||||||||||||||||||||||||||
Excess tax benefit from stock-based compensation | — | — | — | — | 24.6 | — | — | 24.6 | ||||||||||||||||||||||||||||||||||||||||||||||||||||||||
Net income | — | — | — | — | — | 228.6 | — | 228.6 | ||||||||||||||||||||||||||||||||||||||||||||||||||||||||
|
|
|
|
|
|
|
|
|
|
|
|
|
|
|
| |||||||||||||||||||||||||||||||||||||||||||||||||
Balance at December 31, 2014 | $ | 1.8 | $ | — | $ | — | $ | — | $ | 1,651.0 | $ | (215.5 | ) | $ | (39.5 | ) | $ | 1,397.8 | ||||||||||||||||||||||||||||||||||||||||||||||
Stock-based compensation | — | — | — | — | 9.8 | — | — | 9.8 | ||||||||||||||||||||||||||||||||||||||||||||||||||||||||
Pension and OPEB liability adjustment | — | — | — | — | — | — | (3.0 | ) | (3.0 | ) | ||||||||||||||||||||||||||||||||||||||||||||||||||||||
Foreign currency translation adjustment | — | — | — | — | — | — | (11.5 | ) | (11.5 | ) | ||||||||||||||||||||||||||||||||||||||||||||||||||||||
Available-for-sale securities | — | — | — | — | — | — | (4.8 | ) | (4.8 | ) | ||||||||||||||||||||||||||||||||||||||||||||||||||||||
Issuance of common stock | 0.0 | — | — | — | 21.0 | — | — | 21.0 | ||||||||||||||||||||||||||||||||||||||||||||||||||||||||
Repurchase of common stock | (0.1 | ) | — | — | — | — | (305.7 | ) | — | (305.8 | ) | |||||||||||||||||||||||||||||||||||||||||||||||||||||
Dividends on common stock | — | — | — | — | — | (105.6 | ) | — | (105.6 | ) | ||||||||||||||||||||||||||||||||||||||||||||||||||||||
Excess tax benefit from stock-based compensation | — | — | — | — | 8.4 | — | — | 8.4 | ||||||||||||||||||||||||||||||||||||||||||||||||||||||||
Net income | — | — | — | — | — | 182.3 | — | 182.3 | ||||||||||||||||||||||||||||||||||||||||||||||||||||||||
|
|
|
|
|
|
|
| |||||||||||||||||||||||||||||||||||||||||||||||||||||||||
Balance at December 31, 2015 | $ | 1.7 | $ | — | $ | — | $ | — | $ | 1,690.2 | $ | (444.5 | ) | $ | (58.8 | ) | $ | 1,188.6 | ||||||||||||||||||||||||||||||||||||||||||||||
|
|
|
|
|
|
|
| |||||||||||||||||||||||||||||||||||||||||||||||||||||||||
The accompanying notes are an integral part of the consolidated financial statements.
Allison Transmission Holdings, Inc.
Notes to Consolidated Financial Statements
NOTE 1. OVERVIEW
| NOTE 1. | OVERVIEW |
Overview
Allison Transmission Holdings, Inc. and its subsidiaries (the “Company,(“Allison,” “we”the “Company” or “Allison”“we”), design and manufacture commercial and militarydefense fully-automatic transmissions.
The business was founded in 1915 and has been headquartered in Indianapolis, Indiana since inception. Allison was an operating unit of General Motors Corporation (“Old GM”) from 1929 until 2007, when Allison once again became a stand-alone company. In March 2012, Allison began trading on the New York Stock Exchange under the symbol, “ALSN”.
The Company has approximately 2,8002,700 employees and 1213 different transmission product lines. Although approximately 78% percent81% of revenues were generated in North America in 2012,2015, the Company has a global presence by serving customers in Europe, Asia, South America and Africa. The Company serves customers through an independent network of approximately 1,400 independent distributor and dealer locations worldwide.
Since the introduction of the Company’s first fully-automatic transmission over 60 years ago, the Company’s products have gained acceptance in a wide variety of applications, including on-highway trucks (distribution, refuse, construction, fire and emergency), buses (primarily school, transit and hybrid-transit), motorhomes, off-highway vehicles and equipment (primarily energy, mining and construction) and military vehicles (wheeled and tracked). The Company has developed over 100 different product models that are used in more than 2,500 different vehicle configurations, which are compatible with more than 500 combinations of engine brands, models and ratings. The Company also sells support equipment and Allison-branded replacement parts for the Company’s transmissions and remanufactured transmissions for use in the vehicle aftermarket.
History
The Company was formerly known as Allison Transmission (the “Predecessor”), an operating unit of General Motors Corporation, which, in the course of its bankruptcy proceeding was renamed Motors Liquidation Company (“Old GM”). On August 7, 2007, substantially all of the assets and liabilities of the Predecessor were acquired by the Company, under an Asset Purchase Agreement (the “Asset Purchase Agreement”) dated June 28, 2007 and entered into between Clutch Operating Company, Inc., a Delaware corporation owned by investment funds affiliated with The Carlyle Group and Onex Corporation (collectively, the “Sponsors”), and Old GM, the direct parent of the Predecessor, pursuant to which the Company acquired certain equity interests of, and certain assets and liabilities held by, direct and indirect operating subsidiaries of Old GM (the “Acquisition Transaction”). After completion of the Acquisition Transaction, Clutch Holdings, Inc., changed its name to Allison Transmission Holdings, Inc. and Clutch Operating Company, Inc. changed its name to Allison Transmission, Inc. (“ATI”).
In July 2009, General Motors Company (“GM”) emerged from bankruptcy. In August 2009, the Company and GM finalized an agreement , pursuant to which GM assumed certain contracts and agreements between the Company and Old GM, including among others, the Asset Purchase Agreement, certain intellectual property and software license agreements, lease agreements, engineering services agreements, proving grounds use agreements, an employee matters agreement, a contract manufacturing agreement and a hybrid co-branding agreement. GM also assumed certain other commercial contracts, arrangements and purchase orders with the Company in connection with conducting its business.
| NOTE 2. | SUMMARY OF SIGNIFICANT ACCOUNTING POLICIES |
NOTE 2. SUMMARY OF SIGNIFICANT ACCOUNTING POLICIES
Basis of Presentation and Principles of Consolidation
The consolidated financial statements have been prepared in accordance with accounting principles generally accepted in the United States of America (“GAAP”). The information herein reflects all normal recurring material adjustments, which are, in the opinion of management, necessary for the fair presentationstatements of the results for the periods presented. The consolidated financial statements herein consist of all wholly-owned domestic and foreign subsidiaries with all significant intercompany transactions eliminated.
These consolidated financial statements present the financial position, results of operations, financial position,comprehensive income, cash flows and statements of equity. Certain immaterial reclassifications have been made in the consolidated financial statements of prior periods to conform to the current period presentation. TheseThe Company revised its consolidated statements of cash flows for prior periods due to changes in how foreign currency exchange rate movements on cash were calculated. The revisions resulted in a decrease to the “Effect of exchange rate changes on cash” with a corresponding increase to “Net cash provided by operating activities.” Management believes the revisions are immaterial to the consolidated financial statements.
The Company made reclassifications haveto the balance sheets for deferred financing costs and deferred taxes as a result of newly adopted accounting guidance. All reclassifications and revisions had no impact on previously reported net income, total stockholders’ equity or cash flows.cash. See “Recently Issued Accounting Pronouncements” below for more details.
Use of Estimates
The preparation of financial statements in conformity with GAAP requires management to make estimates and assumptions that affect the reported amounts of assets and liabilities, disclosure of contingent assets and liabilities and the reported amounts of revenue and expenses. TheseSignificant estimates include, but are not limited to, allowance for doubtful accounts, sales allowances, government price adjustments, fair market values and future cash flows associated with goodwill, indefinite-life intangibles, long-lived asset impairment tests, useful lives for depreciation and amortization, warranty liability,liabilities, environmental liabilities, determination of discount rate and other assumptions for pension and other postretirement benefit expense, income taxes lease classification,and deferred tax valuation allowances, derivative valuation, and contingencies. The Company’s accounting policies involve the application of judgments and assumptions made by management that include inherent risks and uncertainties. Actual results could differ materially from these estimates. Changes in estimates are recorded in results of operations in the period that the events or circumstances giving rise to such changes occur.
Segment Reporting
In accordance with the Financial Accounting Standards BoardBoard’s (“FASB”) authoritative accounting guidance on segment reporting, the Company has one operating segment and reportable segment. The Company is in one line of business, which is in the manufacturingmanufacture and distribution of fully-automatic transmissions.
Government Grants
The Company recognizes government grants when there is reasonable assurance that the Company will comply with the conditions attached to the grant arrangement and the funds will be received. When the government grants relate to reimbursement of costs, the grant income is recognized in Other (expense) income, net in the Consolidated Statements of Comprehensive Income (Loss). When the government grants relate to a reimbursement of capital expenditures, the grants are recognized as a reduction of the basis of the assets in the Consolidated Balance Sheets.
Cash and Cash Equivalents
Cash equivalents are defined as short-term, highly-liquid investments with original maturities of 90 days or less. Under the Company’s cash management system, checks issued but not presented to banks may result in book overdraft balances for accounting purposes and are classified within Accounts payable in the Consolidated Balance Sheets. The change in book overdrafts is reported as a component of operating cash flows for Accounts payable.
Marketable Securities
The Company determines the appropriate classification of all marketable securities as “held-to-maturity”,“held-to-maturity,” “available-for-sale” or “trading” at the time of purchase, and re-evaluates such classifications as of each balance sheet date. As of December 31, 2012,2015, the Company’s marketable securities are classified as either available-for-sale or trading.
Available-for-sale securities are carried at fair value with the unrealized gain or loss reported in Accumulated other comprehensive loss (“AOCL”). Unrealized gains or losses considered to be “other-than-temporary” are recognized in income. Trading securities are carried at fair value with the unrealized gain or loss recognized in Other expense, (income), net. The fair value of the Company’s investment securities is determined by currently available market prices. See NOTE 6 for more details.
Allowance for Doubtful Accounts
The allowance for doubtful trade accounts receivable reflects estimated losses to be incurred in the collection of the receivables. Estimated losses are based on historical collection experience as well as a review by management of the current status of all receivables. Account balances are charged against the allowance after all means of collection have been exhausted and the potential for recovery is considered remote.
Inventories
Inventories are stated at the lower of cost or net realizable value.market. The Company determines cost using the first-in, first-out method. The Company analyzes inventory on a quarterly basis to determine whether it is excess or obsolete inventory. Any decline in carrying value of estimated excess or obsolete inventory is recorded as a reduction of inventory and as an expense included in Cost of sales in the period it is identified.
Property, Plant and Equipment
Property, plant and equipment are recorded at cost less accumulated depreciation. Depreciation expense is recorded using the straight-line method over the following estimated lives:
| Range in Years | ||
Land improvements | 5 – 30 | |
Buildings and building improvements | 10 – 40 | |
Machinery and equipment | 2 – 20 | |
Software | 2 – 5 | |
Special tools | 2 – 10 |
Software represents the costs of software developed or obtained for internal use. Software costs are amortized on a straight-line basis over their estimated useful lives. Software assets are reviewed for impairment when events or circumstances indicate that the carrying value may not be recoverable over the remaining lives of the assets. Upgrades and enhancements are capitalized if they result in added functionality, which enables the software to perform tasks it was previously incapable of performing. Software maintenance, training, data conversion and business process reengineering costs are expensed in the period in which they are incurred.
Special tooling represents the costs to design and develop tools, dies, jigs and other items owned by the Company and used in the manufacture of components by suppliers under long-term supply agreements. Special tooling is depreciated over the tool’s expected life. Special tooling used in the development of new technology is expensed as incurred. Engineering, testing and other costs incurred in the design and development of production parts are expensed as incurred.
Impairment of Long-Lived Assets
The carrying value of long-lived assets is evaluated whenever events or circumstances indicate that the carrying value of an asset may not be recoverable. Events or circumstances that would result in an impairment review primarily include a significant change in the use of an asset, or the planned sale or disposal of an asset. The asset would be considered impaired when there is no future use planned for the asset or the future net undiscounted cash flows generated by the asset or asset group are less than its carrying value. An impairment loss would be recognized based on the amount by which the carrying value exceeds fair value.
Assumptions and estimates used to determine cash flows in the evaluation of impairment and the fair values used to determine the impairment are subject to a degree of judgment and complexity. Any changes to the assumptions and estimates resulting from changes in actual results or market conditions from those anticipated may affect the carrying value of long-lived assets and could result in an impairment charge.
As a result of events and circumstances in the fourth quarter of 2014, the Company reviewed certain of its long-lived assets related to the production of the H3000 and H4000 hybrid-propulsion systems, resulting in a $15.4 million loss recorded for the year ended December 31, 2014. The loss, determined by using future net discounted cash flows, included approximately $1.7 million of accrued expenses related to the impairment of the long-lived assets. The Company also recorded $1.3 million impairment loss during the first quarter of 2015. Deteriorating market conditions for hybrid-propulsion vehicles, principally as a result of decreased fuel costs, alternative fuels and other technologies, significantly contributed to the future cash flows of the related assets being less than the carrying value of those assets.
Goodwill and Other Intangible Assets
Goodwill represents the excess of purchase price paid over the fair value of net assets acquired. In accordance with the FASB’s authoritative accounting guidance on goodwill, the Company does not amortize goodwill but rather evaluates it for impairment on an annual basis, or more often if events or circumstances change that could cause goodwill to become impaired. ThereGoodwill is onetested for impairment at the reporting unit level, which is the same as the Company’s one operating and reportable segment. The Company has elected to perform its annual impairment test on October 31 of every year. A multi-step impairment test is performed on goodwill. In Step 0, the Company evaluateshas the option to evaluate various qualitative factors to determine the likelihood of impairment. If determined that the fair value is more likely than not less than the carrying value, then the Company is required to perform Step 1. If the Company does not elect to perform Step 0, it can voluntarily proceed directly to Step 1. In Step 1, the Company performs a quantitative analysis to compare the fair value of its reporting unit to its carrying value including goodwill. If the fair value of the reporting unit exceeds the carrying value of the net assets assigned to that unit, goodwill is not considered impaired, and the Company is not required to perform further testing. If the carrying value of the net assets assigned to the reporting unit exceeds the fair value of the reporting unit, then the Company must perform Step 2 of the impairment test in order to determine the implied fair value of the reporting unit’s goodwill. If the carrying value of a reporting unit’s goodwill exceeds its implied fair value, then the Company would record an impairment loss equal to the difference.
After reviewing variousGoodwill impairment testing for 2015 was performed by assessing certain qualitative factors, the Company’s 2012 annual goodwill impairment test indicated that the fair value of the reporting unit more likely than not exceeded its carrying value, indicating no impairment.trends and factors. The Company’s qualitative assessment included a review of various key assumptions and factors including, among others, an assessment of business changes, economic outlook, financial trends and forecasts, growth rates, credit ratings, equity ratings, discount rates, industry data and discount rates.other relevant qualitative factors. Events or circumstances that could unfavorably impact the key assumptions include lower net sales driven by market conditions, the Company’sour inability to execute on marketing programs and/or delay in the introduction of new products, lower gross margins as a result of market conditions or failure to obtain forecasted cost reductions, or a higher discount rate as a result of market conditions. While unpredictable and inherently uncertain, managementthe Company believes theits forecast estimates wereare reasonable and incorporate assumptions that similar market participants would use in their estimates of fair value. These trends and factors were compared to, and based on, the assumptions used in prior years. After reviewing various qualitative factors, the Company’s 2015 annual goodwill impairment test indicated that the fair value of the reporting unit more likely than not exceeded its carrying value, indicating no impairment.
Other intangible assets have both indefinite and finite useful lives. Intangible assets with indefinite useful lives, such as the Company’s trade name, are not amortized but are tested annually for impairment. After reviewing various qualitative factors, the Company’s 2012The Company has elected to perform our annual trade name impairment test indicatedon October 31 of every year and follow a similar multi-step impairment test that the fair value of the trade name more likely than not exceeded its carrying value, indicating no impairment. The Company’s qualitative assessment included a review of various key assumptions and factors including, among others, an assessment of business changes, economic outlook, financial trends and forecasts, royalty savings rates, credit ratings, equity ratings and discount rates.is performed on goodwill. Events or circumstances that could unfavorably impact the key assumptions include lower net sales driven by market conditions, the Company’sour inability to execute on marketing programs and/or delay in introduction of new products, and higher discount rate as a result of market conditions. While unpredictable and inherently uncertain, managementthe Company believes the forecast estimates are reasonable and incorporate those assumptions that similar market participants would use in their estimates of fair value. After reviewing various qualitative factors, the Company’s annual 2015 trade name impairment test, as of October 31, 2015, indicated that the fair value of the trade name more likely than not exceeded its carrying value, indicating no impairment. However, late in the fourth quarter of 2015, the Company obtained updated market data showing a further decline in forecasted net sales for certain of the Company’s end markets. As a result of the new market data and revised near term and long term forecasts, the Company completed a Step 1 analysis for the trade name to assess the impact of these changes on its fair value. The Company performed a quantitative analysis to compare the fair value of trade name to the carrying value of the trade name primarily using the relief-from-royalty method under the income valuation approach consistent with prior years. Significant assumptions used to determine fair value under the relief-from-royalty method include forecasted net sales, royalty rates and a discount rate to be applied to the forecasted net sales. The estimated fair value of the trade name, as of December 31, 2015, was approximately $790.0 million versus a carrying amount of $870.0 million, resulting in a trade name impairment of $80.0 million as of December 31, 2015. The trade name impairment did not result in any other charges to goodwill, other intangible assets or long-lived assets. Refer to NOTE 5 for further information.
Intangible assets with finite lives are amortized over their estimated useful lives and reviewed for impairment when circumstances change that would create a triggering event. Customer relationships are amortized over the life in which expected benefits are to be consumed. The other remaining finite useful life intangibles are amortized on a straight-line basis over their useful lives. The Company evaluates the remaining useful life of the other intangible assets on a periodic basis to determine whether events or circumstances warrant a revision to the remaining useful life. Assumptions and estimates about future values and remaining useful lives of the Company’s intangible and other long-lived assets are complex and subjective. They can be affected by a variety of factors, including external factors such as industry and economic trends, and internal factors, such as changes in the Company’s business strategy and internal forecasts. Although management believes the historical assumptions and estimates are reasonable and appropriate, different assumptions and estimates could materially impact the Company’s reported financial results.
NOTE 5 provides further information on Goodwill and Other intangible assets.
Deferred Financing Costs
DeferredThe Company early adopted the FASB’s authoritative accounting guidance, as of December 31, 2015, to present the deferred financing costs are statedon the balance sheet as a direct deduction from the carrying amount of the debt rather than at cost as a component of other non-current assets. The debt issuance costs related to line-of-credit arrangements is presented as a component of other non-current assets andas permitted by the new guidance. Deferred financing costs continue to be amortized over the life of the related debt using the effective interest method. Amortization of deferred financing costs is recorded as part of interest expense and totaled $14.5$8.0 million, $12.1$8.1 million and $11.6$10.9 million for the years ended December 31, 2012, 20112015, 2014 and 2010,2013, respectively.
Financial Instruments
The Company’s cash equivalents are invested in U.S. Government backed securities and recorded at fair value in the Consolidated Balance Sheets. The carrying values of accounts receivable and accounts payable approximate fair value due to their short-term nature. The Company’s financial derivative instruments, including interest rate swaps and foreign currency and commodity forward contracts are carried at fair value on the Consolidated Balance Sheets. Refer to NOTE 6 for more detail. The Company’s long-term debt obligations are carried at historical amounts with the Company providing fair value disclosure in NOTE 7.
Insurable Liabilities
The Company records liabilities for its medical, workers’ compensation, long-term disability, product, general and auto liabilities. The determination of these liabilities and related expenses is dependent on claims experience. For most of these liabilities, claims incurred but not yet reported are estimated based upon historical claims experience.
Revenue Recognition
The Company records sales when title has transferred to the customer, there is evidence of an agreement, the sales price is fixed or determinable, delivery has occurred or services have been rendered, and determinable, and the collection of the related accounts receivablecollectability is reasonably assured. The Company sells Extended Transmission Coverage (“ETC”) for which sales are deferred. ETC sales are recognized ratably over the period of the ETC, which typically ranges from threetwo to five years after initial sale. Costs associated with ETC programs are recorded as incurred during the extended period. Distributor and customer sales incentives, consisting of allowances and other rebates, are estimated at the time of sale based upon the Company’s history and experience and are recorded as a reduction to Net sales. Incentive programs are generally product specific or region specific. Some factors used in estimating the cost of incentives include the number of transmissions that will be affected by the incentive program and rate of acceptance of any incentive program. If the actual number of affected transmissions differs from this estimate, or if a different mix of incentives is actually paid, the impact on Net sales would be recorded in the period that the change was identified. Consideration given to commercial customers recorded as a reduction of Net sales in the Consolidated Statements of Comprehensive Income (Loss) included $59.9$46.7 million, $59.2$66.9 million, and $55.6$65.2 million for the years ended December 31, 2012, 20112015, 2014 and 2010,2013, respectively.
Sales under U.S. government production contracts are recorded when the product is accepted, and title has transferred to the U.S. government.government, the sales price is fixed or determinable, and delivery has occurred. Deferred revenue arises from cash received in advance of the culmination of the earnings process and is recognized as revenue in future periods when the applicable revenue recognition criteria have been met. Under the terms of thesome U.S. government contracts, there are certain price reduction clauses and provisions for potential price reductions which are estimated at the time of sale based upon the Company’s history and experience and are recorded as a reduction to Net sales. Potential reductions may be attributed to a change in projected sales volumes or plant efficiencies which impact overall costs. As of December 31, 20122015 and 2011,2014, the Company had $46.9$55.1 million and $34.0$63.1 million recorded in the price reduction reserve account, respectively.
Due to requests from the U.S. government, the Company billed, but did not ship certain tracked transmissions during 2013. Based on the lack of a fixed delivery date from the U.S. government, the Company deferred approximately $8.8 million of Net sales for these transmissions until they were shipped in 2014. See NOTE 10 for additional details.
The Company classifies shipping and handling billed to customers in Net sales and shipping and handling costs in Cost of sales, in accordance with authoritative accounting guidance.
The Company contracts with various third parties to provide engineering services. These services are recorded as Net sales in accordance with the terms of the contract. The saleable engineering recorded was $7.8$4.2 million, $7.1$7.4 million and $14.4$12.4 million for the years ended December 31, 2012, 20112015, 2014 and 2010,2013, respectively. The associated costs are recorded in Cost of sales.
Warranty
Provisions for estimated expenses related to product warranties are made at the time products are sold. Warranty claims arise when a transmission fails while in service during the relevant warranty period. The warranty reserve is provided for by adjustingadjusted in Selling, general and administrative expenses by an amount based on the Company’s current and historical warranty claims paid and associated repair costs. These estimates are established using historical information including the nature, frequency, and average cost of warranty claims and are adjusted as actual information becomes available. Costs associated with ETC programs are recorded as incurred during the extended period. From time to time, the Company may initiate a specific field action program. As a result of the uncertainty surrounding the nature and frequency of specific field action programs, the liability for such programs is recorded when the Company commits to an action. The Company reviews and assesses the liability for these programs on a quarterly basis. The Company also assesses its ability to recover certain costs from its suppliers and records a receivable from the supplier when it believes a recovery is probable. Warranty costs may differ from those estimated if actual claim rates are higher or lower than our historical rates.
Research and Development
The Company incurs costs in connection with research and development programs that are expected to contribute to future earnings. Such costs are charged to Engineering — research and development as incurred.
Environmental
The Company accrues costs related to environmental matters when it is probable that the Company has incurred a liability related to a contaminated site and the costs can be reasonably estimated. For additional information, see NOTE 17 Commitments and Contingencies.
Foreign Currency Translation
Most of the subsidiaries outside the United States prepare financial statements in currencies other than the U.S. dollar. The functional currency for all these subsidiaries is the local currency, except for the Company’s Hong Kong and Middle East subsidiaries which currently use the U.S. dollar as thetheir functional currency, and balancescurrency. Balances are translated at period-end exchange rates for assets and liabilities and monthly weighted-average exchange rates for revenues and expenses. The translation gains (losses) are stated as a component of AOCL as disclosed in NOTE 15.
Derivative Instruments
In the normal course of business, the Company is exposed to fluctuations in interest rates, foreign currency exchange rates, and commodity prices. The risk is managed through the use of financial derivative instruments including interest rate swaps and commodity and foreign currency forward contracts. Despite the fact that the Company either has not elected or does not qualify for hedge accounting treatment on all of its derivative instruments, the contracts are used strictly as an economic hedge and not for speculative purposes. As necessary, the Company adjusts the values of the derivative instruments for counter-party or credit risk. NOTE 8 provides further information on the accounting treatment of the Company’s derivative instruments.
Income Taxes
Income taxes are accounted for under the asset and liability method. Deferred tax assets and liabilities are recognized for the expected future tax consequences attributable to temporary differences between the financial statement carrying amounts of existing assets and liabilities and their respective tax bases. The future tax benefits associated with operating loss and tax credit carryforwards are recognized as deferred tax assets. Deferred tax assets and liabilities are measured using enacted tax rates expected to apply to taxable income in the years in which those temporary differences are expected to be recovered or settled.
The need to establish a valuation allowance against the deferred tax assets is assessed periodically based on a more-likely-than-not realization threshold, in accordance with the FASB’s authoritative accounting guidance on income taxes. Appropriate consideration is given to all positive and negative evidence related to that realization. This assessment considers, among other matters, the nature, frequency and severity of recent losses, forecasts of future profitability, the duration of statutory carryforward periods, and experience with tax attributes expiring unused and tax planning alternatives. The weight given to these considerations depends upon the degree to which they can be objectively verified.
The Company early adopted the FASB’s authoritative accounting guidance on a retrospective basis, as of December 31, 2015, to classify all deferred tax assets and liabilities, along with any related valuation allowance, as noncurrent on the balance sheet. Stock-Based Compensation
The Company maintains a stock-based compensation plan which allows employees (including executive officers), consultants and directors to receive equity awards. The Company has adoptedfollows the FASB’s authoritative accounting guidance on share-based payments and recognizes the fair value of the awards as compensation expense over the vesting period. The accounting guidance also requires that forfeitures be estimated over the vesting period of an award instead of being recognized as a reduction of compensation expense when the forfeiture actually occurs.
Pension and Post-retirement Benefit Plans
For pension and other post-retirement benefits (“OPEB”) plans in which employees participate, costs are determined within the FASB’s authoritative accounting guidance set forth in employers’ defined benefit pensions including accounting for settlements and curtailments of defined benefit pension plans, termination of benefits and accounting for post-retirement benefits other than pensions. In accordance with the authoritative accounting guidance, the Company recognizes the funded status of its defined benefit pension plans and OPEB plan in its Consolidated Balance Sheets with a corresponding adjustment to AOCL, net of tax.
Post-retirement benefit costs consist of service cost, interest cost on accrued obligations and the expected return on assets (calculated using a smoothed market value of assets). Any difference between actual and expected returns on assets during a year and actuarial gains and losses on liabilities together with any prior service costs are charged (or credited) to income over the average remaining service lives of employees.
The benefit cost components shown in the Consolidated Statements of Comprehensive Income (Loss) are based upon various actuarial assumptions and methodologies as prescribed by authoritative accounting guidance. These assumptions include discount rates, expected return on plan assets, health care cost trend rates, inflation, rate of compensation increases, population demographics, mortality rates and other factors. The Company reviews all actuarial assumptions on an annual basis.
Recently AdoptedIssued Accounting Pronouncements
In July 2012,November 2015, the FASB issued authoritative accounting guidance on testing indefinite-lived intangibles for impairment. The guidance gives an entityto simplify the option to first assess qualitative factors to determine whether the existencebalance sheet classification of events and circumstances indicates that it is more likely than not that the indefinite-lived intangible asset is impaired. If an entity concludes that it is more likely than not that the indefinite-lived intangible asset is impaired, then it is required to determine the fair value of the indefinite-lived intangible asset and perform the quantitative impairment test by comparing the fair value with the carrying amount. However, if an entity concludes otherwise, then the entity is not required to take further action. The guidance is effective for interim and annual impairment tests performed for fiscal years beginning after September 15, 2012 with early adoption permitted. The Company early adopted this guidance in October 2012 in conjunction with the fiscal year 2012 annual indefinite-lived intangible impairment test. This guidance only changed the methodology of testing for impairment and did not affect the outcome of such testing. The adoption of this guidance did not have an effect on our consolidated financial statements.
In December 2011, the FASB issued authoritative accounting guidance on enhancing disclosures to evaluate the effect or potential effect of netting arrangements on an entity’s financial position.deferred taxes. The guidance requires improved information and disclosures about gross and net amounts of recognizedthat all deferred tax assets and liabilities, of financial and derivative instruments that are offset in an entity’s statement of financial position.along with any related valuation allowance, be classified as noncurrent on the balance sheet. As a result, each jurisdiction will now only have one net noncurrent deferred tax asset or liability. The guidance is towill be appliedeffective prospectively or retrospectively for interim and annual reporting periods beginning on or after January 1, 2013. The adoption of this guidance is not expected to have a material effect on our consolidated financial statements.
In September 2011, the FASB issued authoritative accounting guidance on testing goodwill for impairment. Under the revised guidance,public entities testing goodwill for impairment have the option of performing a qualitative assessment before calculating fair value (i.e., Step 1 of the goodwill impairment test). If entities determine, on the basis of qualitative factors, that fair value is more likely than not less than carrying value, the two-step impairment test would be required. The guidance does not change how goodwill is calculated or assigned to reporting units, nor does it revise the requirement to test goodwill annually for impairment. In addition, it does not amend the requirement to test goodwill for impairment between annual tests if events or circumstances warrant; however, it does revise the examples of events and circumstances that an entity should consider. The guidance became effective for interim and annual goodwill impairment tests performed for fiscal years beginning after December 15, 2011. The Company adopted this guidance in October 2012 in conjunction with the fiscal year 2012 annual goodwill impairment test. This guidance only changed the methodology of testing for impairment and did not affect the outcome of such testing. The adoption of this guidance did not have an effect on our consolidated financial statements.
In June 2011, the FASB issued authoritative accounting guidance on improving comparability, consistency, and transparency of items reported in other comprehensive income. The guidance eliminates the option to present components of other comprehensive income as part of the statement of changes in stockholders’ equity and requires either a single continuous statement of comprehensive income or in two separate but consecutive statements. In a single continuous statement, the entity is required to present the components of net income and total net income, the components of other comprehensive income and a total for other comprehensive income, along with the total of comprehensive income in that statement. In the two-statement approach, the first statement should present total net income and its components followed consecutively by a second statement that should present total other comprehensive income, the components of other comprehensive income, and the total of comprehensive income. In December 2011, the FASB issued additional authoritative accounting guidance indefinitely deferring the requirement to present reclassifications of items out of accumulated other comprehensive income. The accounting guidance also establishes a common approach with International Financial Reporting Standards (“IFRS”). The guidance is to be applied retrospectively for interim and annual reporting periods beginning after December 15, 2011 for public entities. The adoption2016, but can be early-adopted. Management has elected to early adopt the guidance on a retrospective basis as of this guidance did not have a material effect on our consolidated financial statements, but required a change inDecember 31, 2015. As of December 31, 2014, the presentation of comprehensiveCompany reclassified $1.0 million and ($118.7) million to non-current deferred income from the notes of our consolidated financial statementstax assets, net and non-current deferred income tax liabilities, net, respectively, to conform to the face of our Consolidated Statements of Comprehensive Income (Loss).current period presentation.
In May 2011,July 2015, the FASB issued authoritative accounting guidance to simplify the measurement of inventory. The guidance requires that amended wording used to describe manyinventory be measured at the lower of cost and net realizable value. When evidence exists that the requirementsnet realizable value of inventory is lower than its cost, the difference shall be recognized as a loss in measuring fair valueearnings in the period in which it occurs. Inventory measured using last-in, first-out and disclosing information about fair value measurements. The changesthe retail inventory method are not intended to changeimpacted by the application of the requirements of fair value measurement, but to clarify the application and disclosure of information. The amendments to the accounting guidance also establish a common approach with IFRS.new guidance. The guidance is to be applied prospectivelyeffective for public entities for interim and annual reporting periods beginning after December 15, 2011. The2016, but can be early-adopted. Management is assessing the potential impact of the adoption of this guidance did not have a material effect on ourthe Company’s consolidated financial statements.
In April 2015, the FASB issued authoritative accounting guidance to simplify the presentation of the debt issuance costs. The guidance requires that the debt issuance costs be presented in the balance sheet as a direct deduction from the carrying amount of debt liability, consistent with debt discounts or premiums. The debt issuance costs related to line-of-credit arrangements can still be deferred and presented as an asset and subsequently amortized ratably over the term of the line-of-credit arrangement. The recognition and measurement guidance for debt issuance costs are not affected. The guidance is effective for public entities for interim and annual reporting periods beginning after December 15, 2015, but can be early-adopted. The guidance should also be applied on a retrospective basis. As of December 31, 2015, management has decided to early adopt this guidance. As of December 31, 2015 and 2014, approximately $25.6 million and $29.3 million of debt issuance costs, net of accumulated amortization, were presented in the consolidated balance sheet as direct deductions from the carrying amounts of the debt.
NOTE 3. INVENTORIESIn August 2014, the FASB issued authoritative accounting guidance on the disclosure of uncertainties about an entity’s ability to continue as a going concern. The guidance requires management to evaluate whether there is substantial doubt about an entity’s ability to continue as a going concern within one year after the date that the financial statements are issued (or within one year after the date that financial statements are available to be issued when applicable) and to provide related footnote disclosures. The guidance is effective prospectively for fiscal years beginning after December 15, 2016, but can be early-adopted. While the adoption of this guidance is not expected to have an effect on the Company’s consolidated financial statements, it could affect the disclosure applied under these circumstances in the future.
In May 2014, the FASB issued authoritative accounting guidance on a company’s accounting for revenue from contracts with customers. The guidance applies to all companies that enter into contracts with customers to transfer goods, services or nonfinancial assets. The guidance requires these companies to recognize revenue to depict the transfer of promised goods or services to customers in an amount that reflects the consideration to which the entity expects to be entitled in exchange for those goods or services. The guidance also requires disclosures regarding the nature, timing, amount and uncertainty of revenue that is recognized. The guidance allows either full or modified retrospective adoption. The new guidance would have become effective for annual and interim periods beginning January 1, 2017. In July 2015, the FASB approved a one year delay of the effective date of the standard to January 1, 2018, to provide adequate time for implementation. Management is in the early stage of assessing the impact of both methods of adoption on the Company’s consolidated financial statements.
| NOTE 3. | INVENTORIES |
Inventories consisted of the following components (dollars in millions):
| December 31, 2012 | December 31, 2011 | December 31, 2015 | December 31, 2014 | |||||||||||||
Purchased parts and raw materials | $ | 80.6 | $ | 71.3 | $ | 69.5 | $ | 72.3 | ||||||||
Work in progress | 7.5 | 7.6 | 5.1 | 6.1 | ||||||||||||
Service parts | 44.5 | 43.6 | 45.8 | 46.5 | ||||||||||||
Finished goods | 24.5 | 33.4 | 21.0 | 18.6 | ||||||||||||
|
|
|
| |||||||||||||
Total inventories | $ | 157.1 | $ | 155.9 | $ | 141.4 | $ | 143.5 | ||||||||
|
|
|
| |||||||||||||
Inventory components shipped to third parties, primarily cores, parts to re-manufacturers, and parts to contract manufacturers, which the Company has an obligation to buy back, are included in purchased parts and raw materials, with an offsetting liability in Other current liabilities. See NOTE 12, “Other Current Liabilities” for more information.
NOTE 4. PROPERTY, PLANT AND EQUIPMENT
| NOTE 4. | PROPERTY, PLANT AND EQUIPMENT |
The cost and accumulated depreciation of property, plant and equipment are as follows (dollars in millions):
| December 31, 2012 | December 31, 2011 | December 31, 2015 | December 31, 2014 | |||||||||||||
Land and land improvements | $ | 16.2 | $ | 15.9 | $ | 25.0 | $ | 23.6 | ||||||||
Buildings and building improvements | 263.3 | 244.4 | 293.8 | 281.6 | ||||||||||||
Machinery and equipment | 543.7 | 479.3 | 585.7 | 576.2 | ||||||||||||
Software | 102.9 | 94.4 | 121.3 | 117.0 | ||||||||||||
Special tools | 129.6 | 109.3 | 160.0 | 143.6 | ||||||||||||
Construction in progress | 56.0 | 72.3 | 28.8 | 39.9 | ||||||||||||
|
|
|
| |||||||||||||
Total property, plant and equipment | 1,111.7 | 1,015.6 | 1,214.6 | 1,181.9 | ||||||||||||
Accumulated depreciation and amortization | (515.5 | ) | (433.8 | ) | ||||||||||||
Accumulated depreciation | (734.9 | ) | (667.3 | ) | ||||||||||||
|
|
|
| |||||||||||||
Property, plant and equipment, net | $ | 596.2 | $ | 581.8 | $ | 479.7 | $ | 514.6 | ||||||||
|
|
|
| |||||||||||||
Depreciation of property, plant and equipment was $102.5$88.3 million, $103.8$93.8 million and $99.6$98.7 million for the years ended December 31, 2012, 20112015, 2014 and 2010,2013, respectively.
During 2015 and 2014, the Company recorded an impairment of certain machinery and equipment, and special tools associated with the production of the H3000 and H4000 hybrid-propulsion systems. See NOTE 2, “Impairment of long-lived assets” for more information.
| NOTE 5. | GOODWILL AND OTHER INTANGIBLE ASSETS |
NOTE 5. GOODWILL AND OTHER INTANGIBLE ASSETSAs of December 31, 2015 and 2014, the carrying amount of the Company’s Goodwill was $1,941.0 million.
The following presents a summary of goodwill and other intangible assets (dollars in millions):
| Expected useful life (years) | December 31, 2012 | December 31, 2011 | ||||||||
Goodwill | Indefinite | $ | 1,941.0 | $ | 1,941.0 | |||||
Other intangible assets: | ||||||||||
Trade name | Indefinite | $ | 870.0 | $ | 870.0 | |||||
Customer relationships — military | 18.5 | 62.3 | 62.3 | |||||||
Customer relationships — commercial | 16.5 | 831.8 | 831.8 | |||||||
Proprietary technology | 12.5 | 476.3 | 476.3 | |||||||
Non-compete agreement | 10.0 | 17.3 | 17.3 | |||||||
Patented technology — military | 8.5 | 28.2 | 28.2 | |||||||
Tooling rights | 6.0 | 4.5 | 4.5 | |||||||
Patented technology — commercial | 5.5 | 260.6 | 260.6 | |||||||
|
|
|
| |||||||
Other intangible assets | 2,551.0 | 2,551.0 | ||||||||
Less: accumulated amortization | (834.9 | ) | (684.9 | ) | ||||||
|
|
|
| |||||||
Other intangible assets, net | $ | 1,716.1 | $ | 1,866.1 | ||||||
|
|
|
| |||||||
| December 31, 2015 | December 31, 2014 | |||||||||||||||||||||||
| Intangible assets, gross | Accumulated amortization | Intangible assets, net | Intangible assets, gross | Accumulated amortization | Intangible assets, net | |||||||||||||||||||
Other intangible assets: | ||||||||||||||||||||||||
Trade name | $ | 790.0 | $ | — | $ | 790.0 | $ | 870.0 | $ | — | $ | 870.0 | ||||||||||||
Customer relationships - defense | 62.3 | (31.3 | ) | 31.0 | 62.3 | (27.9 | ) | 34.4 | ||||||||||||||||
Customer relationships – commercial | 831.8 | (477.3 | ) | 354.5 | 831.8 | (426.9 | ) | 404.9 | ||||||||||||||||
Proprietary technology | 476.3 | (320.1 | ) | 156.2 | 476.3 | (282.0 | ) | 194.3 | ||||||||||||||||
Non-compete agreement | 17.3 | (14.6 | ) | 2.7 | 17.3 | (12.8 | ) | 4.5 | ||||||||||||||||
Patented technology - defense | 28.2 | (27.9 | ) | 0.3 | 28.2 | (24.5 | ) | 3.7 | ||||||||||||||||
Tooling rights | 4.5 | (4.4 | ) | 0.1 | 4.5 | (4.3 | ) | 0.2 | ||||||||||||||||
Patented technology - commercial | 260.6 | (260.6 | ) | — | 260.6 | (260.6 | ) | — | ||||||||||||||||
|
|
|
|
|
|
|
|
|
|
|
| |||||||||||||
Total | $ | 2,471.0 | $ | (1,136.2 | ) | $ | 1,334.8 | $ | 2,551.0 | $ | (1,039.0 | ) | $ | 1,512.0 | ||||||||||
|
|
|
|
|
|
|
|
|
|
|
| |||||||||||||
The expected U.S. federal tax basis for Goodwill and Trade name deductionsAmortization of intangible assets was $1,150.0$97.1 million, $98.8 million and $792.0$105.3 million as offor the years ended December 31, 20122015, 2014 and $1,274.0 million and $875.0 million as of December 31, 2011,2013, respectively.
As of December 31, 2012,2015, the Company recorded a trade name impairment charge of $80.0 million. The impairment charge was a result of a decline in forecasted net sales for certain of the Company’s end markets. The impairment charge was derived from an income approach by which the relief-from-royalty method was applied valuing the savings to cash flow. The relief-from-royalty method requires assumptions be made concerning forecasted revenue, a discount rate, and a royalty rate. The underlying concept of the relief-from-royalty method is that the value of the trade name can be estimated by determining the cost savings the Company achieves by not having to license the trade name.
The trade name impairment did not result in any other charges to goodwill, other intangible assets or long-lived assets.
As of December 31, 2015, the net carrying value of the Company’s Goodwill and Other intangible assets, net was $3,657.1$3,275.8 million. The Company performed a qualitative assessment of goodwill in 2012 and determined that the fair value of goodwill was more likely than not greater than carrying value, thus indicating no impairment. The Company’s assessment included a review of various key assumptions and factors including, among others, an assessment of business changes, economic outlooks, financial trends and forecasts, credit ratings, equity ratings and discount rates. Events or circumstances that could unfavorably impact the key assumptions include lower net sales driven by market conditions, the Company’s inability to execute on marketing programs and/or delay in the introduction of new products, lower gross margins as a result of market conditions or failure to obtain forecasted cost reductions, or a higher discount rate as a result of market conditions. While unpredictable and inherently uncertain, management believes its forecast estimates and qualitative assessment were reasonable and incorporate information that similar market participants would use in their estimates of fair value.
After reviewing various qualitative factors, the Company’s 2012 annual trade name impairment test indicated that the fair value of the trade name more likely than not exceeded its carrying value, indicating no impairment. The Company’s review included an assessment of various key assumptions and factors including, among others, an assessment of business changes, economic outlooks, financial trends and forecasts, royalty savings rates, credit ratings, equity ratings and discount rates. Events or circumstances that could unfavorably impact the key assumptions include lower net sales driven by market conditions, the Company’s inability to execute on marketing programs and/or delay in introduction of new products; and higher discount rate as a result of market conditions. While unpredictable and inherently uncertain, management believes the forecast estimates are reasonable and incorporate those that similar market participants would use in their estimates of fair value.
Amortization expense related to Otherother intangible assets for the next five years and thereafter is expected to be (dollars in millions):
| 2013 | 2014 | 2015 | 2016 | 2017 | Thereafter | |||||||||||||||||||
Amortization expense | $ | 105.4 | $ | 98.8 | $ | 97.1 | $ | 92.4 | $ | 89.7 | $ | 362.7 | ||||||||||||
|
|
|
|
|
|
|
|
|
|
|
| |||||||||||||
| 2016 | 2017 | 2018 | 2019 | 2020 | Thereafter | |||||||||||||||||||
Amortization expense | $ | 92.4 | $ | 89.7 | $ | 87.2 | $ | 85.7 | $ | 49.9 | $ | 140.6 | ||||||||||||
NOTE 6. FAIR VALUE OF FINANCIAL INSTRUMENTS
| NOTE 6. | FAIR VALUE OF FINANCIAL INSTRUMENTS |
In accordance with the FASB’s authoritative accounting guidance on fair value measurements, fair value is the price (exit price) that would be received to sell an asset or paid to transfer a liability in an orderly transaction between market participants at the measurement date. The Company utilizes market data or assumptions that market participants would use in pricing the asset or liability, including assumptions about risk and the risks inherent in the inputs to the valuation technique. These inputs can be readily observable, market corroborated, or generally unobservable. The Company primarily applies the market approach for recurring fair value measurements and utilizes the best available information that maximizes the use of observable inputs and minimizes the use of unobservable inputs. The Company is able to classify fair value balances based on the observability of those inputs. The accounting guidance establishes a fair value hierarchy that prioritizes the inputs used to measure fair value. The hierarchy gives the highest priority to unadjusted quoted prices in active markets for identical assets or liabilities (Level 1 measurement) and the lowest priority to unobservable inputs (Level 3 measurement). The three levels of the fair value hierarchy defined by the relevant guidance are as follows:
Level 1 — Quoted prices are available in active markets for identical assets or liabilities as of the reporting date. Active markets are those in which transactions for the asset or liability occur in sufficient frequency and volume to provide pricing information on an ongoing basis. Level 1 primarily consists of financial instruments such as exchange-traded derivatives, listed equities and publicly traded bonds.
Level 2 — Pricing inputs are other than quoted prices in active markets included in Level 1, which are either directly or indirectly observable as of the reported date. Level 2 includes financial instruments that are valued using quoted prices in markets that are not active and those financial instruments that are valued using models or other valuation methodologies. These models are primarily industry standard models that consider various assumptions, including quoted forward prices for commodities, time value, volatility factors, and current market and contractual prices for the underlying instruments, as well as other relevant economic measures. Substantially all of these assumptions are observable in the marketplace throughout the full term of the instrument, can be derived from observable data or are supported by observable levels at which transactions are executed in the marketplace.
Level 3 — Pricing inputs include significant inputs that are generally less observable from objective sources. These inputs may be used with internally developed methodologies that result in management’s best estimate of fair value. At each balance sheet date, the Company performs an analysis of all instruments subject to authoritative accounting guidance and includes, in Level 3, all of those whose fair value is based on significant unobservable inputs. As of December 31, 20122015 and 2011,2014, the Company did not have any Level 3 financial assets or liabilities.
The Company’s assets and liabilities that are measured at fair value include cash and cash equivalents, available-for-sale securities, derivative instruments, assets held in a rabbi trust and a deferred compensation obligation. The Company’s cash equivalents consist of short-term U.S. Governmentgovernment backed securities. The Company’s available-for-sale securities consist of ordinary shares of Torotrak plc (“Torotrak”) associated with a license and exclusivity agreement with Torotrak. Torotrak’s listed shares are traded on the London Stock Exchange under the ticker symbol “TRK.” The Company’s derivative instruments consist of interest rate swaps, foreign currency forward contractsswaps and commodity swaps. The Company’s assets held in the rabbi trust consist primarilyprincipally of publicly available mutual funds and target date retirement funds. The Company’s deferred compensation obligation is directly related to the fair value of assets held in the rabbi trust.
The Company’s valuation techniques used to calculate the fair value of cash and cash equivalents, available-for-sale securities, assets held in the rabbi trust and the deferred compensation obligation represent a market approach in active markets for identical assets that qualifiesqualify as Level 1 in the fair value hierarchy. The Company’s valuation techniques used to calculate the fair value of derivative instruments represent a market approach with observable inputs that qualify as Level 2 in the fair value hierarchy.
The foreign currency contractsswaps consist of forward rate contracts which are intended to hedge exposure of transactions denominated in certain currencies and reduce the impact of currency price volatility on the Company’s financial results. The commodity contractsswaps consist of forward rate contracts which are intended to hedge exposure of transactions involving purchases of component parts containing aluminum and steel and natural gasenergy to power our facilities, reducing the impact of commodity price volatility on the Company’s financial results.
For the fair value measurement of foreign currency derivatives, the Company uses forward foreign exchange rates received from the issuing financial institution. These rates are periodically corroborated by comparing to third-party broker quotes. The foreign currency hedgesswaps are accounted for within the authoritative accounting guidance set forth on accounting for derivative instruments and hedging activities and have been recorded at fair value based upon quoted market rates. The fair values are included in Other current and non-current assets and liabilities in the Consolidated Balance Sheets. The Company generally does not elect to apply hedge accounting under the authoritative accounting guidancefor these foreign currency swaps, and records theas a result, unrealized fair value adjustments and realized gains and losses associated with these contractsare recorded in Other (expense) income,expense, net in the Consolidated Statements of Comprehensive Income (Loss) during the period of change.
For the fair value measurement of commodity derivatives, the Company uses forward prices received from the issuing financial institution. These rates are periodically corroborated by comparing to third-party broker quotes. The commodity derivatives are accounted for within the authoritative accounting guidance set forth on accounting for derivative instruments and hedging activities and have been recorded at fair value based upon quoted market rates. The fair values are included in Other current and non-current assets and liabilities in the Consolidated Balance Sheets. The Company has either not qualified for or not elected hedge accounting treatment for these commodity contracts,swaps, and as a result, unrealized fair value adjustments and realized gains and losses are recorded in Other (expense) income,expense, net in the Consolidated Statements of Comprehensive Income (Loss).Income.
For the fair value measurement of interest rate derivatives, the Company uses valuations from the issuing financial institution. The Company corroborates the valuation through the use of third-party valuation services using a standard replacement valuation model. The floating-to-fixed interest rate swaps are based on the LIBORLondon Interbank Offered Rate (“LIBOR”) which is observable at commonly quoted intervals. The fair values are included in other current and non-current assets and liabilities in the Consolidated Balance Sheets. The Company has not qualified for hedge accounting treatment for the interest rate swaps and, as a result, fair value adjustments are charged directly to Interest expense in the Consolidated Statements of Comprehensive Income (Loss).Income.
The following table summarizes the fair value of the Company’s financial assets and (liabilities) as of December 31 (dollars in millions):
| Fair Value Measurements Using | Fair Value Measurements Using | |||||||||||||||||||||||||||||||||||||||||||||||
| Quoted Prices in Active Markets for Identical Assets (Level 1) | Significant Other Observable Inputs (Level 2) | TOTAL | Quoted Prices in Active Markets for Identical Assets (Level 1) | Significant Other Observable Inputs (Level 2) | TOTAL | |||||||||||||||||||||||||||||||||||||||||||
| 2012 | 2011 | 2012 | 2011 | 2012 | 2011 | 2015 | 2014 | 2015 | 2014 | 2015 | 2014 | |||||||||||||||||||||||||||||||||||||
Cash equivalents | $ | 80.2 | $ | 125.9 | $ | — | $ | — | $ | 80.2 | $ | 125.9 | $ | 100.0 | $ | 55.0 | $ | — | $ | — | $ | 100.0 | $ | 55.0 | ||||||||||||||||||||||||
Available-for-sale securities | 6.1 | 8.1 | — | — | 6.1 | 8.1 | 2.9 | 8.6 | — | — | 2.9 | 8.6 | ||||||||||||||||||||||||||||||||||||
Rabbi trust assets | 0.2 | — | — | — | 0.2 | — | 4.8 | 2.9 | — | — | 4.8 | 2.9 | ||||||||||||||||||||||||||||||||||||
Deferred compensation obligation | (0.2 | ) | — | — | — | (0.2 | ) | — | (4.8 | ) | (2.9 | ) | — | — | (4.8 | ) | (2.9 | ) | ||||||||||||||||||||||||||||||
Derivative assets | — | — | 0.2 | 0.0 | 0.2 | 0.0 | — | — | 0.0 | 0.0 | 0.0 | 0.0 | ||||||||||||||||||||||||||||||||||||
Derivative liabilities | — | — | (52.9 | ) | (78.9 | ) | (52.9 | ) | (78.9 | ) | — | — | (30.1 | ) | (15.4 | ) | (30.1 | ) | (15.4 | ) | ||||||||||||||||||||||||||||
|
|
|
|
|
|
|
|
|
|
|
| |||||||||||||||||||||||||||||||||||||
Total | $ | 86.3 | $ | 134.0 | $ | (52.7 | ) | $ | (78.9 | ) | $ | 33.6 | $ | 55.1 | $ | 102.9 | $ | 63.6 | $ | (30.1 | ) | $ | (15.4 | ) | $ | 72.8 | $ | 48.2 | ||||||||||||||||||||
|
|
|
|
|
|
|
|
|
|
|
| |||||||||||||||||||||||||||||||||||||
NOTE 7. DEBT
| NOTE 7. | DEBT |
Long-term debt and maturities are as follows (dollars in millions):
| December 31, 2012 | December 31, 2011 | December 31, 2015 | December 31, 2014 | |||||||||||||
Long-term debt: | ||||||||||||||||
Senior Secured Credit Facility Term B-1 Loan, variable, due 2014 | $ | 411.4 | $ | 2,594.9 | ||||||||||||
Senior Secured Credit Facility Term B-2 Loan, variable, due 2017 | 793.1 | — | $ | — | $ | 283.6 | ||||||||||
Senior Secured Credit Facility Term B-3 Loan, variable, due 2019 | 1,145.0 | — | 2,402.8 | 1,765.6 | ||||||||||||
Senior Cash Pay Notes, fixed 7.125%, due 2019 | 471.3 | 471.3 | ||||||||||||||
Senior Cash Pay Notes, fixed 11.0%, due 2015 | — | 309.8 | ||||||||||||||
Senior Notes, fixed 7.125%, due 2019 | — | 471.3 | ||||||||||||||
|
|
|
| |||||||||||||
Total long-term debt | 2,820.8 | 3,376.0 | $ | 2,402.8 | $ | 2,520.5 | ||||||||||
Less: current maturities of long-term debt | 19.5 | 31.0 | 24.5 | 17.9 | ||||||||||||
deferred financing costs, net (see NOTE 2) | 25.6 | 29.3 | ||||||||||||||
|
|
|
| |||||||||||||
Total long-term debt less current portion | $ | 2,801.3 | $ | 3,345.0 | ||||||||||||
Total long-term debt, net | $ | 2,352.7 | $ | 2,473.3 | ||||||||||||
|
|
|
| |||||||||||||
Principal payments required on long-term debt during the next five years are $19.5 million in 2013, $430.9 million in 2014, $19.5 million in 2015, $19.5 million in 2016 and $772.5 million in 2017.as follows:
| Required Principal Payments | ||||||||||||||||||||
| (dollars in millions) | 2016 | 2017 | 2018 | 2019 | 2020 | |||||||||||||||
Payment | $ | 24.5 | $ | 24.5 | $ | 24.5 | $ | 2,329.3 | $ | — | ||||||||||
As of December 31, 2012,2015, the Company had $411.4$2,402.8 million of indebtedness associated with ATI’s Senior Secured Credit Facility Term B-1 Loan due 2014Allison Transmission, Inc.’s (“Term B-1 Loan”ATI”), $793.1 million of indebtedness associated with ATI’s Senior Secured Credit Facility Term B-2 Loan due 2017 (“Term B-2 Loan”), $1,145.0 million of indebtedness associated with ATI’sthe Company’s wholly-owned subsidiary, Senior Secured Credit Facility Term B-3 Loan due 2019 (“Term B-3 Loan”), and (togethertogether the Term B-1 Loan, Term B-2 Loan, Term B-3 Loan and revolving credit facility, defined as the “Senior Secured Credit Facility”). The Company also had indebtedness of $471.3 million of ATI’s 7.125% senior cash pay notes due May 2019 (“7.125% Senior Notes”).
The fair value of the Company’s long-term debt obligations as of December 31, 20122015 was $2,872.0$2,384.8 million. The fair value is based on quoted Level 12 market prices of the Company’s debt as of December 31, 2012.2015. It is not expected that the Company would be able to repurchase a significant amount of its debt at these levels. The difference between the fair value and carrying value of the long-term debt is driven primarily by trends in the financial markets.
In March 2015, ATI commenced a cash tender offer to purchase its outstanding 7.125% senior cash pay notes due May 2019 (“7.125% Senior Secured Credit Facility
Notes”). In 2007,connection with the cash tender offer, ATI solicited consents to enter into a supplemental indenture to eliminate substantially all of the restrictive covenants, certain events of default and related provisions contained in the indenture dated as of May 6, 2011 (the “Indenture”) governing the 7.125% Senior Notes. On March 31, 2015, ATI received valid consents from holders with an aggregate principal amount of $420.9 million of the 7.125% Senior Notes. Accordingly, ATI entered into a first supplemental indenture to the Indenture contingent on the execution of an amendment with the term loan lenders under its Senior Secured Credit Facility having a term loan in the amount of $3,100.0 million with a maturity date of August 2014. Facility.
In March 2012,April 2015, ATI entered into an amendment with the term loan lenders under its Senior Secured Credit Facility to extend the maturityadd up to an additional $470.0 million of $801.1 millionTerm B-3 Loan commitments and incur term loans in an aggregate principal amount of $470.0 million. The amendment also, among other things, (i) permits prepayment, repurchase or redemption of ATI’s 7.125% Senior Notes with the proceeds of the financing and (ii) resets the period for which a prepayment premium of 1.00% will apply in the event of a repricing transaction to the six-month anniversary of the closing date of the financing. With the exception of the items noted above, the terms (including maturity and pricing) of the financing are materially the same as the terms of the existing Term B-3 Loan outstanding. As a result of the newly structured Senior Secured Credit Facility, ATI recorded approximately $7.7 million as deferred financing fees in the Consolidated Balance Sheets. Immediately following the financing, ATI purchased $420.9 million of the tendered 7.125% Senior Notes using the proceeds from the financing in a cash payment equal to $1,042 per $1,000 aggregate principal amount of the 7.125% Senior Notes plus accrued and unpaid interest. Upon the payment, the supplemental indenture to the Indenture became operative. The purchase resulted in a loss (the premium between the purchase price of the notes and the face value of such notes) of $22.7 million including deferred financing fees written off.
In May 2015, ATI redeemed the remaining $50.4 million of its outstanding 7.125% Senior Notes, at the redemption price equal to 103.563% of the principal amount plus any accrued and unpaid interest, using the remaining proceeds from the financing and cash on hand, resulting in a loss (the premium between the purchase price of the notes and the face value of such notes) of $2.4 million including deferred financing fees written off.
In November 2015, ATI entered into an amendment with the term loan lenders under its Senior Secured Credit Facility to refinance $189.0 million of Senior Secured Credit Facility Term B-2 Loan due 2017 (“Term B-2 Loan”) replacing it with an additional $189.0 million of term loans under the Term B-3 Loan. The addition to the Term B-3 Loan increased the Company’s debt maturity from August 7, 20142017 to August 7, 20172019 and to increase the applicable interest rate margin at the Company’s option, tois either (a) 3.50%2.50% over the LIBOR (which may not be less than 1.00%) or (b) 2.50%1.50% over the greater of the prime lending rate provided by the British Banking Association or the federal funds effective rate published by the Federal Reserve Bank of New York. As a result of December 31, 2015, the debt modification,rate was approximately 3.50% on the Company recorded an additional $2.3 million as deferred financing fees in the Consolidated Balance Sheets and extended the amortization period of $5.1 million of deferred financing fees from 2014 to 2017. In August 2012, ATI entered into an amendment with the term loan lenders under its Senior Secured Credit Facility to extend the maturity of $850.0 million of term loan debt from August 7, 2014 to August 23, 2019 and to increase the applicable margin at the Company’s option to either (a) 3.25% or 3.00%, subject to the Company’s total leverage ratio, over the LIBOR or (b) 2.25% or 2.00%, subject to the Company’s total leverage ratio, over the greater of the prime lending rate provided by the British Banking Association or the federal funds effective rate published by the Federal Reserve Bank of New York (but not less than 2.00%).Term B-3 Loan. The November 2015 amendment was treated as an extinguishmenta modification of debt under GAAP, and thus the Company expensed $4.5$0.3 million of deferred financing fees and recorded $16.1$1.3 million of new deferred financing fees in the consolidated financial statements. In October 2012, ATI entered into an amendment with the term loan lenders under its
The Senior Secured Credit Facility to extendrequires minimum quarterly principal payments on the maturityTerm B-3 Loan as well as prepayments from certain net cash proceeds of $300.0 millionnon-ordinary course asset sales and casualty and condemnation events and from a percentage of term loan debt from August 7, 2014 to August 23, 2019 and to increase the applicable margin at the Company’s option to either (a) 3.25% or 3.00%, subject to the Company’s total leverage ratio, over the LIBOR or (b) 2.25% or 2.00%, subject to the Company’s total leverage ratio, over the greater of the prime lending rate provided by the British Banking Association or the federal funds effective rate published by the Federal Reserve Bank of New York (but not less than 2.00%). The amendment was treated as an extinguishment of debt under GAAP, and thusexcess cash flow, if applicable. During 2015, the Company expensed $1.4made principal payments of $94.5 million on the Term B-2 Loan, resulting in a loss of $0.3 million associated with the write off of related deferred financing feesdebt issuance costs. The minimum required quarterly principal payment on the Term B-3 Loan is $6.1 million and recorded $1.8 millionremains through its maturity date of new deferred financing fees in the consolidated financial statements.2019. As of December 31, 2015, there had been no payments required from certain net cash proceeds of non-ordinary course asset sales and casualty and condemnation events. The remaining principal balance is due upon maturity.
The Senior Secured Credit Facility is collateralized by a lien on substantially all assets of the Company including all of ATI’s capital stock and all of the capital stock or other equity interest held by the Company, ATI and each of the Company’s existing and future U.S. subsidiary guarantors (subject to certain limitations for equity interests of foreign subsidiaries and other exceptions set forth in the terms of the Senior Secured Credit Facility). Interest on the Term B-1 Loan is variable and as of December 31, 2012 equal to the LIBOR plus 2.50% based on the Company’s total senior secured leverage ratio; interest on the Term B-2 Loan is variable and as of December 31, 2012 equal to the LIBOR plus 3.50%; and interest on the Term B-3 Loan is variable and as of December 31, 2012 equal to the LIBOR (but not less than 1.00%) plus 3.25% based on the Company’s total leverage ratio. As of December 31, 2012, these rates were approximately 2.71%, 3.71% and 4.25% on the Term B-1 Loan, Term B-2 Loan and Term B-3 Loan, respectively, and the weighted average rate on the Senior Secured Credit Facility was approximately 3.80%. The Senior Secured Credit Facility requires minimum quarterly principal payments of $7.75 million on the Term B-1 Loan, which commenced December 2007, as well as prepayments from certain net cash proceeds of non-ordinary course asset sales and casualty and condemnation events and from a percentage of excess cash flow, if applicable. As of December 31, 2012, there had been no payments required for certain net cash proceeds of non-ordinary course asset sales and casualty and condemnation events. Due to voluntary prepayments, the Company has fulfilled all Term B-1 Loan required quarterly payments through its maturity date of 2014. The minimum required quarterly principal payments on the Term B-2 Loan and Term B-3 Loan are $2.0 million and $2.9 million, respectively, and remain through the maturity dates of 2017 and 2019, respectively. The remaining principal balance on each loan is due upon maturity.
In accordance with the Senior Secured Credit Facility, net cash proceeds of non-ordinary course asset sales, and casualty and condemnation events will only be required to prepay the term loan if the Company does not reinvest or commit to reinvest such net cash proceeds in assets to be used in its business or to make certain other permitted investments within 15 months of the related transactionstransaction or events,event, subject to certain limitations. The Company must apply 50% of its annual excess cash flow (as defined in the Senior Secured Credit Facility) to the prepayment of the Senior Secured Credit Facility, however this percentage reduces to certain levels and eventually to zero upon achievement of certain total senior secured leverage ratios. For the yearyears ended December 31, 2012, the excess cash flow percentage was 0%,2015 and as a result,2014, the Company iswas not required to make an excess cash flow payment.
The Senior Secured Credit Facility also provides for $400.0 million ina revolving credit borrowings,borrowing. In 2014, ATI increased the revolving commitments available under the revolving portion of the Senior Secured Credit Facility to $465.0 million, net of an allowance for up to $50.0$75.0 million in outstanding letterletters of credit commitments. ThroughoutThe increase was treated as a modification of debt under GAAP, and thus the year ended December 31, 2012, we made periodic withdrawals on our revolving credit facility as partCompany recorded $0.6 million of our debt management plans. The maximum amount outstanding at any time onnew deferred financing fees in the revolving credit facility was $27.5 million, and all balances were repaid within the quarter they were borrowed.consolidated financial statements. As of December 31, 2012,2015, the Company had $372.1$461.0 million available under the revolving credit facility, net of $27.9$4.0 million in letters of credit. Revolving credit borrowings bear interest at a variable base rate plus an applicable margin based on the Company’s total senior secured leverage ratio. As of December 31, 2012,2015, this rate would have been between approximately 2.96% and 5.00%1.63%. In addition, there is an annual commitment fee, based on the Company’s total senior secured leverage ratio, which is currentlyas of December 31, 2015, was equal to 0.375%0.25% of the average unused revolving credit borrowings available under the Senior Secured Credit Facility. Revolving credit borrowings are payable at the option of the Company throughout the term of the Senior Secured Credit Facility with the balance due in August 2016, or August 2014 as long as the Term B-1 Loan is outstanding.January 2019.
In November 2008, ATI entered into an amendment to its Senior Secured Credit Facility that permits it to make discounted voluntary prepayments of its term loan in an aggregated amount not to exceed $750.0 million pursuant to a modified Dutch auction. As partThe revolving portion of the May 2011 amendment to the Senior Secured Credit Facility, the amount available for discounted voluntary prepayments of the term loan pursuant to a modified Dutch auction was reset to $750.0 million. This provision is available to the Company for so long as the term loans are outstanding. For the year ended December 31, 2012, 2011 and 2010, the Company repurchased $0.0 million, $0.0 million and $97.2 million of its term loans under this amendment, respectively. The repurchases of the term loan resulted in gains (the discount between the purchase price of the term loan and the face value of such term loan) for the years ended December 31, 2012, 2011 and 2010 of $0.0 million, $0.0 million and $4.1 million, respectively, net of deferred financing fees written off.
In May 2011, ATI effectively amended some of its terms under the revolving credit facility including extending the term from August 2013 to August 2016, or August 2014 as long as the Term B-1 Loan is outstanding, and increasing the borrowing capacity from $317.5 million to $400.0 million. As a result, the Company recorded an additional $4.2 million as deferred financing fees in the Consolidated Balance Sheets and $0.9 million as deferred financing fees expensed in the Consolidated Statements of Comprehensive Income (Loss). All deferred financing fees associated with the revolving credit facility will be amortized to Interest expense on a straight-line basis over the term of the revolving credit facility.
In addition, the Company made principal payments of $245.4 million, $90.5 million and $106.0 million on the Senior Secured Credit Facility for the years ended December 31, 2012, 2011 and 2012, respectively. The principal payments made on the Senior Secured Credit Facility for the years ended December 31, 2012, 2011 and 2010 resulted in losses of $1.3 million, $0.6 million and $0.8 million, respectively, associated with the write off of related deferred debt issuance costs.
The Senior Secured Credit Facility requires the Company to maintain a specified maximum total senior secured leverage ratio.ratio of 5.50x when revolving loan commitments remain outstanding at the end of a fiscal quarter. In March 2014, however, the revolving lenders holding a majority of the revolving loan commitments permanently waived and agreed that no event of default would result from any non-compliance so long as there were no revolving loans outstanding as of the last day of any fiscal quarter. As of December 31, 2012,2015, the Company washad no revolving loans outstanding; however the Company would have been in compliance with the maximum total senior secured leverage ratio, achieving a 3.22x ratio versus a 5.50x requirement threshold. Within2.99x ratio. Additionally within the terms of the Senior Secured Credit Facility, a senior secured leverage ratio at or below 3.50x results in the elimination of excess cash flow payments on the Senior Secured Credit Facility for the applicable year. The Senior Secured Credit Facility also provides certain financial incentives based on our total leverage ratio. A total leverage ratio at or below 4.00x results in a 25 basis point reduction to the applicable margin on the Term B-1 Loan,revolving credit facility, and a total leverage ratio at or below 3.50x results in a 12.5 basis point reduction to the revolving credit facility commitment fee and elimination of excess cash flow paymentsan additional 25 basis point reduction to the applicable margin on the term loans for the applicable year. These reductions remain in effect as long as the Company continues to achieve a senior secured leverage ratio below 3.50x.revolving credit facility. A total leverage ratio at or below 3.25x results in a 25 basis point reduction to the applicable margin on theour Term B-3 Loan. This reductionThese reductions would remain in effect as long as we achievethe Company achieves a total leverage ratio at or below 3.25x.the related threshold. As of December 31, 2012,2015, the total leverage ratio was 3.89x.2.99x.
In addition, the Senior Secured Credit Facility, among other things, includes customary restrictions (subject to certain exceptions) on the Company’s ability to incur certain indebtedness, grant certain liens, make certain investments, or declare or pay certain dividends.dividends, or repurchase shares of the Company’s common stock. As of December 31, 2012,2015, the Company is in compliance with all covenants under the Senior Secured Credit Facility.
Senior Notes
In October of 2007, ATI issued $550.0 million of 11.0% Senior Notes due November 2015 (“11.0% Senior Notes”) and $550.0 million of 11.25% Senior Toggle Notes due November 2015 (“Senior Toggle Notes”). Interest on the 11.0% Senior Notes accrued at a rate of 11.0% per year and was payable semi-annually in arrears on May 1 and November 1 of each year. In November 2011, the Company fully retired the Senior Toggle Notes.
In May 2011, the Company completed an offering of $500.0 million of 7.125% Senior Notes due May 2019. Interest on the 7.125% Senior Notes accrues at a rate of 7.125% per year and is payable semi-annually in arrears on November 15 and May 15. The proceeds from the offering, together with cash on hand, were used to complete a cash tender offer for $468.1 million of the Company’s Senior Toggle Notes plus accrued and unpaid interest, applicable premiums and expenses of $56.9 million. As a result of the offering, the Company recorded approximately $10.8 million as deferred financing fees in the Consolidated Balance Sheets. The 7.125% Senior Notes are unsecured and guaranteed by the subsidiaries that guarantee the Senior Secured Credit Facility and will be unconditionally guaranteed, jointly and severally, by any future domestic subsidiaries that guarantee the Senior Secured Credit Facility.
In February 2012, the Company redeemed $200.0 million of the 11.0% Senior Notes resulting in a loss (the premium between the purchase price of the notes and the face value of such notes) of $13.5 million, including deferred financing fees written off.
In May 2012, the Company redeemed the remaining $109.8 million of the 11.0% Senior Notes resulting in a loss (the premium between the purchase price of the notes and the face value of such notes) of $7.3 million, including deferred financing fees written off.
The Company may from time to time seek to retire the 7.125% Senior Notes through cash purchases and/or exchanges for equity securities, in open market purchases, privately negotiated transactions, contractual redemptions or otherwise. Such repurchases or exchanges, if any, will depend on prevailing market conditions, liquidity requirements, contractual restrictions and other factors. The amounts involved may be material. Prior to May 15, 2015, the Company may redeem some or all of the 7.125% Senior Notes by paying the applicable “make-whole” premium. At any time on or after May 15, 2015, the Company may redeem some or all of the 7.125% Senior Notes at specified redemption prices in the governing indenture. For the years ended December 31, 2012, 2011 and 2010 the Company repurchased $0.0 million, $28.7 million and $0.0 million (at face value) of its 7.125% Senior Notes, respectively. The repurchases resulted in a net gain (the discount between the purchase price of the notes and the face value of such notes) of $0.0 million, $1.3 million, and $0.0 million for the years ended December 31, 2012, 2011 and 2010, respectively, net of deferred financing fees written off.
The indenture governing the 7.125% Senior Notes contain negative covenants restricting or limiting the Company’s ability to, among other things: incur or guarantee additional indebtedness, incur liens, pay dividends on, redeem or repurchase the Company’s capital stock, make certain investments, permit payment or dividend restrictions on certain of the Company’s subsidiaries, sell assets, engage in certain transactions with affiliates, and consolidate or merge or sell all or substantially all of the Company’s assets. Certain of these covenants would be suspended if the 7.125% Senior Notes were to reach investment grade.
Notes Payable
As of December 31, 2012, the Company had no short-term notes payable. As of December 31, 2011, the Company had Japanese Yen denominated unsecured short-term notes of 200 million Yen (approximately $2.6 million) with a weighted average interest rate of 1.24%.
NOTE 8. DERIVATIVES
| NOTE 8. | DERIVATIVES |
The Company is exposed to certain financial risk from volatility in interest rates, foreign exchange rates and commodity prices. The risk is managed through the use of financial derivative instruments including interest rate swaps, foreign currency forward contractsswaps and commodity swaps. The Company’s current derivative instruments are used strictly as an economic hedge and not for speculative purposes. As necessary, the Company adjusts the values of the derivative instruments for counter-party or credit risk.
Interest Rate
The maturities of theCompany is subject to interest rate swaps outstanding as of December 31, 2012risk related to the Senior Secured Credit Facility and 2011 do not correspond with the maturity of the term loans, but theenters into interest rate swapsswap contracts that are similarbased on the LIBOR to the Term B-1 Loan and Term B-2 Loan in all other respects.manage a portion of this exposure. The Company doeshas not qualify forelected hedge accounting treatment for these derivatives, and as a result, fair value adjustments are charged directly to Interest expense in the Consolidated Statements of Comprehensive Income (Loss).Income. A summary of the Company’s interest rate derivatives as of December 31, 20122015 and 2011December 31, 2014 follows (dollars in millions):
| December 31, 2012 | December 31, 2011 | |||||||||||||||
| Notional Amount | Fair Value | Notional Amount | Fair Value | |||||||||||||
Interest Rate Swap D, due 2013 | $ | 125.0 | $ | (2.8 | ) | $ | 125.0 | $ | (7.3 | ) | ||||||
Interest Rate Swap E, due 2013 | 150.0 | (2.3 | ) | 150.0 | (5.2 | ) | ||||||||||
Interest Rate Swap F, due 2013 | 75.0 | (1.1 | ) | 75.0 | (2.4 | ) | ||||||||||
Interest Rate Swap G, due 2013 | 75.0 | (1.2 | ) | 75.0 | (2.8 | ) | ||||||||||
Interest Rate Swap H, due 2014 | 350.0 | (19.0 | ) | 350.0 | (27.3 | ) | ||||||||||
Interest Rate Swap I, due 2014 | 350.0 | (19.2 | ) | 350.0 | (27.5 | ) | ||||||||||
Interest Rate Swap J, due 2014 | 125.0 | (3.3 | ) | 125.0 | (2.6 | ) | ||||||||||
Interest Rate Swap K, due 2014 | 125.0 | (3.4 | ) | 125.0 | (2.7 | ) | ||||||||||
|
|
|
|
|
|
|
| |||||||||
| $ | 1,375.0 | $ | (52.3 | ) | $ | 1,375.0 | $ | (77.8 | ) | |||||||
|
|
|
|
|
|
|
| |||||||||
| December 31, 2015 | December 31, 2014 | |||||||||||||||
| Notional Amount | Fair Value | Notional Amount | Fair Value | |||||||||||||
3.44% Interest Rate Swap L, Aug 2016 – Aug 2019* | $ | 75.0 | (3.6 | ) | 75.0 | (2.3 | ) | |||||||||
3.43% Interest Rate Swap M, Aug 2016 – Aug 2019* | 100.0 | (4.8 | ) | 100.0 | (3.0 | ) | ||||||||||
3.37% Interest Rate Swap N, Aug 2016 – Aug 2019* | 75.0 | (3.5 | ) | 75.0 | (2.1 | ) | ||||||||||
3.19% Interest Rate Swap O, Aug 2016 – Aug 2019* | 75.0 | (3.1 | ) | 75.0 | (1.7 | ) | ||||||||||
3.08% Interest Rate Swap P, Aug 2016 – Aug 2019* | 75.0 | (2.8 | ) | 75.0 | (1.5 | ) | ||||||||||
2.99% Interest Rate Swap Q, Aug 2016 – Aug 2019* | 50.0 | (1.7 | ) | 50.0 | (0.9 | ) | ||||||||||
2.98% Interest Rate Swap R, Aug 2016 – Aug 2019* | 50.0 | (1.7 | ) | 50.0 | (0.9 | ) | ||||||||||
2.73% Interest Rate Swap S, Aug 2016 – Aug 2019* | 50.0 | (1.4 | ) | 50.0 | (0.5 | ) | ||||||||||
2.74% Interest Rate Swap T, Aug 2016 – Aug 2019* | 75.0 | (2.1 | ) | 75.0 | (0.8 | ) | ||||||||||
2.66% Interest Rate Swap U, Aug 2016 – Aug 2019* | 50.0 | (1.2 | ) | 50.0 | (0.4 | ) | ||||||||||
2.60% Interest Rate Swap V, Aug 2016 – Aug 2019* | 50.0 | (1.2 | ) | 50.0 | (0.3 | ) | ||||||||||
2.40% Interest Rate Swap W, Aug 2016 – Aug 2019* | 25.0 | (0.5 | ) | 25.0 | 0.0 | |||||||||||
2.25% Interest Rate Swap X, Aug 2016 – Aug 2019* | 50.0 | (0.8 | ) | — | — | |||||||||||
|
|
|
|
|
|
|
| |||||||||
* includes LIBOR floor of 1.00% | $ | 800.0 | $ | (28.4 | ) | $ | 750.0 | $ | (14.4 | ) | ||||||
|
|
|
|
|
|
|
| |||||||||
Certain of the Company’s interest rate derivatives contain credit-risk and collateral contingent features under which downgrades in the Company’s credit rating could require the Company to increase its collateral. Certain interest rate derivatives also contain provisions under which the Company may be required to post additional collateral if the LIBOR interest rate curve reaches certain levels.
As of December 31, 2012 and 2011, the Company had recorded cash collateral of $3.0 million and $2.0 million, respectively, in Other current assets in the Consolidated Balance Sheets, as the balances are subject to frequent change. The Company has also posted $23.0 million of collateral in the form of letters of credit.
Currency Exchange
The Company’s business is subject to foreign exchange rate risk. As a result, the Company enters into various forward rate contracts that qualify as derivatives under the authoritative accounting guidance to manage certain of these exposures. Forward contracts are used to hedge forecasted transactions and known exposure of payables denominated in a foreign currency. The Company generally doeshas not electelected to apply hedge accounting under the authoritative accounting guidance and recordsrecorded the unrealized fair value adjustments and realized gains and losses associated with these contracts in Other expense, net in the Consolidated Statements of Comprehensive Income (Loss) during the period of change.
The following table summarizes the outstanding foreign currency forward contractsswaps as of December 31, 20122015 and 20112014 (amounts in millions):
| December 31, 2012 | December 31, 2011 | |||||||||||||||
| Notional Amount | Fair Value | Notional Amount | Fair Value | |||||||||||||
Japanese Yen (JPY) | ¥ | 675.0 | $ | (0.2 | ) | N/A | — | |||||||||
Indian Rupee (INR) | N/A | — |  | 81.0 | $ | (0.1 | ) | |||||||||
British Pound (GBP) | N/A | — | £ | 2.0 | (0.0 | ) | ||||||||||
Canadian Dollar (CAD) | N/A | — | C$ | 0.3 | 0.0 | |||||||||||
|
|
|
| |||||||||||||
| $ | (0.2 | ) | $ | (0.1 | ) | |||||||||||
|
|
|
| |||||||||||||
| December 31, 2015 | December 31, 2014 | |||||||||||||||
| Notional Amount | Fair Value | Notional Amount | Fair Value | |||||||||||||
Japanese Yen (JPY) | ¥ | — | $ | — | ¥ | 300.0 | $ | (0.3 | ) | |||||||
|
|
|
| |||||||||||||
| $ | — | $ | (0.3 | ) | ||||||||||||
|
|
|
| |||||||||||||
Commodity
As a result of theThe Company’s business is subject to commodity price risk, primarily with component suppliers, it has chosen to manage steel, aluminum and natural gas exposure by enteringsuppliers. As a result, the Company enters into various commodity swap contracts that qualify as derivatives under the authoritative accounting guidance.guidance to manage certain of these exposures. Swap contracts are used to hedge forecasted transactions either of the commodity or of components containing the commodity. The Company has not qualified for hedge accounting treatment for these commodity contractsswaps, and as a result, unrealized fair value adjustments and realized gains and losses will beassociated with these contracts were charged directly to Other expense, net in the Consolidated Statements of Comprehensive Income (Loss).during the period of change.
The following table summarizes the outstanding commodity swaps as of December 31, 20122015 and December 31, 20112014 (dollars in millions):
| December 31, 2012 | December 31, 2011 | December 31, 2015 | December 31, 2014 | |||||||||||||||||||||||||||||||||||||
| Notional Amount | Quantity | Fair Value | Notional Amount | Quantity | Fair Value | Notional Amount | Quantity | Fair Value | Notional Amount | Quantity | Fair Value | |||||||||||||||||||||||||||||
Aluminum | $ | 19.4 | 9,050 metric tons | $ | (0.1 | ) | $ | 17.0 | 7,725 metric tons | $ | (1.0 | ) | $ | 13.7 | 8,150 metric tons | $ | (1.7 | ) | $ | 11.3 | 6,200 metric tons | $ | (0.7 | ) | ||||||||||||||||
Steel | $ | 0.2 | 340 metric tons | (0.1 | ) | $ | 0.5 | 900 metric tons | (0.0 | ) | ||||||||||||||||||||||||||||||
Natural Gas | $ | 0.3 | 80,000 MMBtu | 0.0 | $ | 0.3 | 80,000 MMBtu | (0.0 | ) | $ | 0.2 | 70,000 MMBtu | 0.0 | $ | 0.2 | 60,000 MMBtu | 0.0 | |||||||||||||||||||||||
| �� |
|
|
|
| ||||||||||||||||||||||||||||||||||||
| $ | (0.2 | ) | $ | (1.0 | ) | $ | (1.7 | ) | $ | (0.7 | ) | |||||||||||||||||||||||||||||
|
|
|
| |||||||||||||||||||||||||||||||||||||
The following tabular disclosures further describe the Company’s derivative instruments and their impact on the financial condition of the Company (dollars in millions):
December 31, 2012 | December 31, 2011 | |||||||||||
Balance Sheet Location | Fair Value | Balance Sheet Location | Fair Value | |||||||||
Derivatives not designated as hedging instruments | ||||||||||||
Foreign currency contracts | Other current liabilities | $ | (0.2 | ) | Other non-current liabilities | $ | (0.1 | ) | ||||
Commodity contracts | Other current and non-current assets | 0.2 | Other current and non-current liabilities | (1.0 | ) | |||||||
| Other current and non-current liabilities | (0.4 | ) | ||||||||||
Interest rate contracts | Other current and non-current liabilities | (52.3 | ) | Other current and non-current liabilities | (77.8 | ) | ||||||
|
|
|
| |||||||||
Total derivatives not designated as hedging instruments | $ | (52.7 | ) | $ | (78.9 | ) | ||||||
|
|
|
| |||||||||
| December 31, 2015 | December 31, 2014 | |||||||||||
| Balance Sheet Location | Fair Value | Balance Sheet Location | Fair Value | |||||||||
Derivatives not designated as hedging instruments | ||||||||||||
Foreign currency swaps | Other current assets | $ | — | Other current liabilities | $ | (0.3 | ) | |||||
Commodity swaps | ||||||||||||
| Other current and non-current liabilities | (1.7 | ) | Other current and non-current liabilities | (0.7 | ) | |||||||
Interest rate swaps | ||||||||||||
| Other current and non-current liabilities | (28.4 | ) | Other non- current liabilities | (14.4 | ) | |||||||
|
|
|
| |||||||||
Total derivatives not designated as hedging instruments | $ | (30.1 | ) | $ | (15.4 | ) | ||||||
|
|
|
| |||||||||
The fair values of the derivatives are recorded between Other current and non-current assets and Other current and non-current liabilities as appropriate in the Consolidated Balance Sheets. As of December 31, 2012,2015, the amount recorded to Other current liabilities for foreign currency contracts was ($0.2) million. The amounts recorded to Other current and non-current assets and Other current and non-current liabilities for commodity contractsswaps were $0.1 million, $0.1 million, ($0.3)1.1) million and ($0.1)0.6) million, respectively. The amounts recorded to Other current and non-current liabilities for interest rate contractsswaps were ($31.2)3.9) million and ($21.1)24.5) million, respectively.
As of December 31, 2011,2014, the amount recorded to Other non-currentcurrent liabilities for foreign currency contractsswaps was ($0.1)0.3) million. The amounts recorded to Other current and non-current liabilities for commodity contractsswaps were ($0.7)0.6) million and ($0.3)0.1) million, respectively. The amountsamount recorded to Other current and non-current liabilities for interest rate contracts wereswaps was ($31.9) million and ($45.9)14.4) million, respectively.
The following tabular disclosures further describe the Company’s derivative instruments and their impact on the Company’s Consolidated Statements of Comprehensive Income related to foreign currency and commodity swaps can be found in NOTE 11, and the following tabular disclosure describes the location and impact on the Company’s results of operations of the Companyrelated to unrealized (loss) gain on interest rate derivatives (dollars in millions):
Year ended | Year ended | Year ended | ||||||||||||||||
Location of | Amount of gain (loss) recognized on derivatives | Location of | Amount of gain (loss) recognized on derivatives | Location of | Amount of gain (loss) recognized on derivatives | |||||||||||||
Derivatives not designated as hedging instruments | ||||||||||||||||||
Foreign currency contracts | Other (expense) income, net | $ | 0.1 | Other (expense) income, net | $ | 0.9 | Other (expense) income, net | $ | 0.4 | |||||||||
Commodity contracts | Other (expense) income, net | (0.5 | ) | Other (expense) income, net | (2.5 | ) | Other (expense) income, net | 1.4 | ||||||||||
Interest rate contracts | Interest expense | 25.5 | Interest expense | (7.0 | ) | Interest expense | (28.8 | ) | ||||||||||
|
|
|
|
|
| |||||||||||||
Total derivatives not designated as | $ | 25.1 | $ | (8.6 | ) | $ | (27.0 | ) | ||||||||||
|
|
|
|
|
| |||||||||||||
| December 31, 2015 | December 31, 2014 | December 31, 2013 | ||||||||||
Location of impact on results of operations | ||||||||||||
Interest expense | $ | (14.0 | ) | $ | 3.5 | $ | 34.3 | |||||
| NOTE 9. | PRODUCT WARRANTY LIABILITIES |
NOTE 9. PRODUCT WARRANTY LIABILITIES
As of December 31, 2015, the current and non-current product warranty liabilities were $24.9 million and $53.4 million, respectively. As of December 31, 2014, the current and non-current product warranty liabilities were $24.0 million and $59.6 million, respectively. Product warranty liability activities consist of the following (dollars in millions):
| Year ended December 31, 2012 | Year ended December 31, 2011 | Year ended December 31, 2010 | Year ended December 31, 2015 | Year ended December 31, 2014 | Year ended December 31, 2013 | |||||||||||||||||||
Beginning balance | $ | 115.4 | $ | 128.5 | $ | 175.7 | $ | 83.6 | $ | 90.5 | $ | 109.7 | ||||||||||||
Payments | (47.3 | ) | (35.5 | ) | (36.5 | ) | (32.5 | ) | (35.0 | ) | (38.7 | ) | ||||||||||||
Increase in liability (warranties issued during period) | 25.5 | 26.5 | 21.0 | |||||||||||||||||||||
Increase in liability (warranty issued during period) | 21.2 | 26.8 | 28.4 | |||||||||||||||||||||
Net adjustments to liability | 15.3 | (5.1 | ) | (35.5 | ) | 5.5 | 0.7 | (9.6 | ) | |||||||||||||||
Accretion (for Predecessor liabilities) | 0.8 | 1.0 | 3.8 | |||||||||||||||||||||
Accretion (for predecessor liabilities) | 0.5 | 0.6 | 0.7 | |||||||||||||||||||||
|
|
|
|
|
| |||||||||||||||||||
Ending balance | $ | 109.7 | $ | 115.4 | $ | 128.5 | $ | 78.3 | $ | 83.6 | $ | 90.5 | ||||||||||||
|
|
|
|
|
| |||||||||||||||||||
During 2015, the Company recorded approximately $9.2 million of adjustments to the product warranty liabilities as a result of specific field action programs. As a result of December 31, 2012, the currentuncertainty surrounding the nature and non-currentfrequency of specific field action programs, these liabilities will change as additional field information becomes available.
The remaining adjustments to the total liability in 2015, 2014 and 2013, excluding the Dual Power Inverter Module (“DPIM”) as discussed below, were $36.2 millionthe result of general changes in estimates for various products as additional claims data and $73.5 million, respectively. As of December 31, 2011 the current and non-current liabilities were $33.9 million and $81.5 million, respectively.field information became available.
Dual Power Inverter Module
During June 2007, Old GM recognized the estimated cost of replacing the Dual Power Inverter Module (“DPIM”)DPIM used on H 40/50 EP hybrid systems. Certain units were falling short of their expected service life and the PredecessorCompany’s predecessor, Allison Transmission, an operating unit of General Motors Corporation, decided to cover repair or replacement for an extended period. The Company is responsible for the first $12.0 million of qualified cost while GMGeneral Motors Company (“GM”) is responsible for the next $34.0 million of costs, with any amount over $46.0 million being shared one-third by the Company and two-thirds by GM for shipments through June 30, 2009.
During 2012,2015, the Company reviewedcompleted an analysis of its DPIM extended coverage program and determined, based on current claims, that the product warranty liability should be reducedincreased by $7.9$1.8 million. This resulted in a $7.3$2.1 million reductionincrease in the GM DPIM receivable and a $0.6$0.3 million favorable adjustment to the Consolidated Statements of Comprehensive Income (Loss). As part ofIncome. During 2015, the analysis, it wasCompany also determined that design issuesreceived a $1.8 million favorable settlement related to the early introductionspecific DPIM field action programs. As of December 31, 2015, the replacement DPIM unit resulted in a $10.0liability was $50.3 million increase to the product warranty liability. As the replacement DPIM unit is the responsibilitywith an associated receivable from GM of $30.7 million. Through December 31, 2015, the Company had paid approximately $39.6 million in DPIM claims and not covered by the Asset Purchase Agreement, the Company recorded a $10.0received approximately $23.6 million charge to the Consolidated Statements of Comprehensive Income (Loss).in reimbursement from GM. The Company will continue to review the total DPIM liability and GM receivable for any changes in estimateestimates as additional data becomes available.
During 2011,2014, the Company reviewedcompleted an analysis of its DPIM costs associated with the extended coverage resulting in no change toprogram and determined, based on current claims, that the DPIMproduct warranty liability and no change to the associated GM receivable.
During 2010, the Company reviewed its DPIM costs associated with the extended coverage resultingshould be increased by $3.9 million. This resulted in a $22.7$2.9 million increase in the GM DPIM receivable and a $1.0 million unfavorable adjustment to the total liability. The associated GM receivable was reduced by $20.8 million as a resultConsolidated Statements of the review. The reduction inComprehensive Income. As of December 31, 2014, the DPIM liability was the result of additional claims data and field information becoming available.
As of December 31, 2012, the DPIM liability was $52.8$48.5 million with an associated receivable from GM of $31.6$28.7 million. To date,Through December 31, 2014, the Company hashad paid approximately $17.6$32.8 million in DPIM claims.
claims and received approximately $14.9 million in reimbursement from GM. The remaining adjustmentsCompany will continue to review the total DPIM liability in 2012, 2011 and 2010 were the result of generalGM receivable for any changes in estimates for various products as additional claims data and field information becamebecomes available.
During 2013, the Company completed an analysis of its DPIM extended coverage program and determined, based on current claims, that the product warranty liability should be reduced by $8.2 million. This resulted in a $5.8 million reduction in the GM DPIM receivable and a $2.4 million favorable adjustment to the Consolidated Statements of Comprehensive Income. As of December 31, 2013, the DPIM liability was $44.6 million with an associated receivable from GM of $25.8 million. Through December 31, 2013, the Company had paid approximately $25.5 million in DPIM claims and received approximately $9.1 million in reimbursement from GM.
| NOTE 10. | DEFERRED REVENUE |
As of December 31, 2015, the current and non-current deferred revenue for ETC were $22.9 million and $56.4 million, respectively. As of December 31, 2014, the current and non-current deferred revenue for ETC were $20.3 million and $48.7 million, respectively. Deferred revenue for ETC activity (dollars in millions):
| Year ended December 31, 2012 | Year ended December 31, 2011 | Year ended December 31, 2010 | Year ended December 31, 2015 | Year ended December 31, 2014 | Year ended December 31, 2013 | |||||||||||||||||||
Beginning balance | $ | 60.7 | $ | 56.2 | $ | 40.3 | $ | 69.0 | $ | 63.6 | $ | 63.5 | ||||||||||||
Increases | 23.9 | 19.7 | 24.2 | 31.9 | 26.2 | 21.1 | ||||||||||||||||||
Revenue earned | (20.4 | ) | (15.2 | ) | (8.3 | ) | (21.6 | ) | (20.8 | ) | (21.0 | ) | ||||||||||||
|
|
|
|
|
| |||||||||||||||||||
Ending balance | $ | 64.2 | $ | 60.7 | $ | 56.2 | $ | 79.3 | $ | 69.0 | $ | 63.6 | ||||||||||||
|
|
|
|
|
| |||||||||||||||||||
As ofDeferred revenue recorded in current liabilities related to unearned net sales for defense contracts for the years ended December 31, 2012, the current2015, 2014 and non-current liabilities were $21.62013 was approximately $0.0 million, $0.3 million and $42.6 million, respectively. As of December 31, 2011, the current and non-current liabilities were $19.9 million and $40.8 million, respectively. As of December 31, 2010, the current and non-current liabilities were $14.8 million and $41.4$8.8 million, respectively.
NOTE 10. OTHER (EXPENSE) INCOME, NETDue to requests from the U.S. government, the Company billed, but did not ship certain tracked transmissions during 2013. Based on the lack of a fixed delivery date from the U.S. government, the Company deferred approximately $8.8 million of net sales for these transmissions until they were shipped in 2014.
| NOTE 11. | OTHER EXPENSE, NET |
Other (expense) income,expense, net consists of the following (dollars in millions):
| Year ended December 31, | ||||||||||||
| 2012 | 2011 | 2010 | ||||||||||
(Loss) gain on repurchases and redemptions of long-term debt (see NOTE 7) | $ | (22.1 | ) | $ | (16.0 | ) | $ | 3.3 | ||||
Termination of Sponsor services agreement (see NOTE 18) | (16.0 | ) | — | — | ||||||||
Impairment loss on investments in technology-related initiatives | (14.4 | ) | — | — | ||||||||
Grant Program income | 11.5 | 15.6 | 12.0 | |||||||||
Initial public offering fees and expenses | (6.1 | ) | — | — | ||||||||
Loss on foreign exchange | (2.6 | ) | (6.7 | ) | (2.3 | ) | ||||||
Loss on re-measurement of employee benefit plans (see NOTE 12) | (2.3 | ) | — | — | ||||||||
Realized (loss) gain on derivative contracts (see NOTE 8) | (1.3 | ) | 5.2 | 1.9 | ||||||||
Unrealized gain (loss) on derivative contracts (see NOTE 8) | 0.9 | (6.8 | ) | (0.1 | ) | |||||||
Vendor settlement | — | 3.7 | — | |||||||||
Gain on sale of land | — | 0.7 | — | |||||||||
Reduction of supply contract liability | — | — | 3.4 | |||||||||
Other | (0.4 | ) | 0.1 | 0.8 | ||||||||
|
|
|
|
|
| |||||||
Total | $ | (52.8 | ) | $ | (4.2 | ) | $ | 19.0 | ||||
|
|
|
|
|
| |||||||
Vendor settlement Loss on intercompany foreign exchange Gain (loss) on foreign exchange Realized loss on derivative contracts (see NOTE 8) Unrealized (loss) gain on derivative contracts (see NOTE 8) Loss on repayments and repurchases of long-term debt (see NOTE 7) Grant program income Impairment loss on investments in technology-related initiatives Gain on negotiation of commercial agreement Public offering fees and expenses Other Total During 2012, the Company entered into co-development agreements with various companies to expand our position in transmission technologies. Due to various uncertainties surrounding these investments including, but not limited to, the startup nature of the underlying businesses, their continued negative cash flows, undercapitalization and unproven business plans, the Company has impaired these investments to zero as of December 31, 2012. The related charge of $14.4 million was recorded in Other (expense) income, net in the Consolidated Statements of Comprehensive Income (Loss) for the year ended December 31, 2012. Years ended December 31, 2015 2014 2013 $ 2.9 $ — $ — (1.7 ) (5.4 ) (2.3 ) 1.4 (1.0 ) (2.4 ) (1.3 ) (1.0 ) (2.8 ) (0.8 ) 1.2 (1.5 ) (0.3 ) (0.5 ) (0.8 ) — 2.6 5.2 — (2.0 ) (5.0 ) — 2.0 — — (1.4 ) (1.6 ) (0.5 ) (0.1 ) 0.3 $ (0.3 ) $ (5.6 ) $ (10.9 )
In March 2012, the Company priced its initial public offering of common stock. All of the shares of common stock offered were sold by existing stockholders with the Company receiving no proceeds from the sale. As a result, approximately $6.1 million of fees and expenses related to the initial public offering have been recorded to Other (expense) income, net in the Consolidated Statements of Comprehensive Income (Loss).
In 2009, the Company was notified by the U.S. Department of Energy that it was selected to receive matching funds from a grant program funded by the American Recovery and Reinvestment Act for the development of Hybrid manufacturing capacity in the U.S. (the “Grant Program”). All applicable costs associated with the Grant Program have been charged to Engineering — research and development while the Government’s matching reimbursement is recorded to Other (expense) income, net in the Consolidated Statements of Comprehensive Income (Loss). Since inception of the Grant Program, the Company has recorded $40.8 million of Grant Program income to Other (expense) income, net in the Consolidated Statements of Comprehensive Income (Loss).
For the years ended December 31, 2012, 2011 and 2010, the Company recorded $3.2 million, $4.9 million and $2.2 million, respectively, as a reduction of the basis of capital assets purchased under the Grant Program. Since inception of the Grant Program, the Company has placed approximately $7.1 million of assets in service under the Grant Program, resulting in related depreciation of $0.1 million, $0.1 million and $0.0 million for the years ended December 31, 2012, 2011 and 2010, respectively.
NOTE 11. OTHER CURRENT LIABILITIES
| NOTE 12. | OTHER CURRENT LIABILITIES |
Other current liabilities consist of the following (dollars in millions):
| As of December 31, 2012 | As of December 31, 2011 | As of December 31, 2015 | As of December 31, 2014 | |||||||||||||
Payroll and related costs | $ | 47.5 | $ | 49.9 | $ | 31.5 | $ | 50.9 | ||||||||
Sales allowances | 27.0 | 32.3 | 24.3 | 25.5 | ||||||||||||
Vendor buyback obligation | 12.1 | 13.2 | ||||||||||||||
Taxes payable | 12.6 | 8.5 | ||||||||||||||
Defense price reduction reserve | 8.7 | 16.2 | ||||||||||||||
Derivative liabilities | 34.6 | 31.9 | 5.0 | 0.8 | ||||||||||||
Accrued interest payable | 14.2 | 19.1 | 0.6 | 5.2 | ||||||||||||
Military price reduction reserve | 12.0 | 17.6 | ||||||||||||||
Taxes payable | 6.9 | 17.1 | ||||||||||||||
Vendor buyback obligation | 13.9 | 15.4 | ||||||||||||||
Research and development payable | — | 5.0 | ||||||||||||||
Environmental liabilities | 0.5 | — | ||||||||||||||
Other accruals | 11.3 | 11.6 | 10.8 | 11.4 | ||||||||||||
|
|
|
| |||||||||||||
Total | $ | 167.4 | $ | 199.9 | $ | 106.1 | $ | 131.7 | ||||||||
|
|
|
| |||||||||||||
NOTE 12. EMPLOYEE BENEFIT PLANS
| NOTE 13. | EMPLOYEE BENEFIT PLANS |
The Company’s hourly defined benefit pension plan generally provides benefits of negotiated, stated amounts for each year of service as well as significant supplemental benefits for employees who retire with 30 years of service before normal retirement age. For all hourly employees hired after May 18, 2008, the defined benefit pension plan was replaced with a defined contribution pension plan, and the company-sponsored retiree healthcare was also eliminated for those hired after May 18, 2008. The charge to expense for the hourly defined contribution pension plan was $0.9$1.5 million, $0.6$1.3 million and $0.5$1.0 million for the years ended December 31, 2012, 20112015, 2014 and 2010,2013, respectively.
In accordance with the Asset Purchase Agreement, the Company’s hourly employees who retired prior to October 2, 2011 (the “Cutoff Date”) will have their pension and OPEB paid by GM. The Company was required, pursuant to the Asset Purchase Agreement, to transfer pension assets to GM’s pension plan to cover the Company’s portion of its pension liability related to the employees who retired prior to the Cutoff Date. During the second quarter of 2012, the Company completed the transfer of its pension obligation for certain qualified hourly employees to GM’s pension plan. The transfer required a re-measurement of the hourly defined benefit pension plan resulting in a one-time non-cash settlement charge of $2.3 million recorded in Other expense, net in the Consolidated Statements of Comprehensive Income (Loss) and a $4.2 million reduction to the Company’s pension liability with corresponding adjustments to AOCL, net of tax. The employees who retired prior to the Cutoff Date are the responsibility of GM and will have their OPEB paid by GM. This resulted in a $17.9 million gain to the Company’s 2011 actuarial valuation. Employees that retire subsequent to the Cutoff Date will have their Allison pension and OPEB paid by the Company and their GM pension benefit paid by GM.
The Company’s salaried defined benefit plan covering salaried employees with a service date prior to January 1, 2001 is generally based on years of service and compensation history. The salaried defined contribution retirement savings plan requires the Company to match employee contributions up to certain predefined limits based upon eligible base salary. In addition to the matching contribution, the Company is required to make a contribution equal to 1% of eligible base salary for salaried employees with a service date on or after January 1, 1993 to cover certain benefits in retirement that are different from salaried employees with a service date prior to January 1, 1993. In addition, for salaried employees with a service date on or after January 1, 2001, the Company is required to contribute to its defined contribution retirement savings plan an amount equal to 4% of eligible base salary under the program. The charge to expense for the salaried defined contribution retirement savings plan was $5.1$5.7 million, $4.7$5.4 million and $4.4$5.4 million for the years ended December 31, 2012, 20112015, 2014 and 2010,2013, respectively.
The Company is also responsible for OPEB costs (medical, dental, vision, and life insurance) for hourly employees hired prior to May 19, 2008. Post-retirement benefit costs consist of service cost, interest cost on accrued obligations and the expected return on assets (calculated using a smoothed market value of assets). Any difference between actual and expected returns on assets during a year and actuarial gains and losses on liabilities together with any prior service costs are charged (or credited) to income over the average remaining service lives of employees. The benefit cost components shown in the Consolidated Statements of Comprehensive Income (Loss) are based upon certain data specific to the Company, actuarial assumptions that were used for OPEB accounting disclosures, and certain allocation methodologies such as population demographics. The plan is unfunded and any future payments will be funded by the Company’s operating cash flows. As of December 31, 20122015 and 2011,2014, the Company had an estimated OPEB liability for hourly employees hired prior to May 19, 2008, excluding those employees eligible to retire at the time of $142.6the sale of the Company (“the Acquisition Transaction”), of $147.3 million and $156.6$136.0 million, respectively.
As part of the Health Care Reform Act enacted in 2010, the Company has evaluated the impact on “High-cost Health Plans” in which employers offering health plan coverage exceeding certain thresholds must pay an excise tax equal to 40% of the value of the plan that exceeds the threshold amount. AlthoughAs a result of the excise tax, does not come into effect until 2018, the Company has recorded $4.0$12.2 million in its OPEB liability as of December 31, 20122015 with a corresponding adjustment to AOCL, net of tax. This includes an adjustment for the delay in the start date from 2018 to 2020 as a result of the Bipartisan Budget Act of 2015.
The Company provides contributions to certain international benefit plans; however, these contributions are not material for all periods presented.
For all pension and OPEB plans in which employees participate, costs are determined within the FASB’s authoritative accounting guidance set forth on employers’ defined benefit pensions including accounting for settlements and curtailments of defined benefit pension plans, termination of benefits and accounting for post-retirement benefits other than pensions. In accordance with the authoritative accounting guidance, the Company recognizes the funded status of its defined benefit pension plans and OPEB plan in its Consolidated Balance Sheets with a corresponding adjustment to AOCL, net of tax.
Information about the net periodic benefit cost and other changes recognized in Accumulated Other Comprehensive LossAOCL for the pension and post-retirement benefit plans is as follows (dollars in millions):
| Pension Plans | Post-retirement Benefits | |||||||||||||||||||||||
| Year ended December 31, 2012 | Year ended December 31, 2011 | Year ended December 31, 2010 | Year ended December 31, 2012 | Year ended December 31, 2011 | Year ended December 31, 2010 | |||||||||||||||||||
Net Periodic Benefit Cost: | ||||||||||||||||||||||||
Service cost | $ | 15.2 | $ | 14.7 | $ | 13.9 | $ | 3.9 | $ | 3.7 | $ | 2.8 | ||||||||||||
Interest cost | 4.1 | 3.9 | 2.9 | 7.2 | 7.1 | 5.9 | ||||||||||||||||||
Expected return on assets | (5.9 | ) | (4.2 | ) | (3.4 | ) | — | — | — | |||||||||||||||
Prior service cost | 0.1 | 0.1 | 0.1 | — | — | — | ||||||||||||||||||
Loss (gain) | 1.2 | 1.0 | 0.4 | — | — | (2.4 | ) | |||||||||||||||||
Settlement loss | 2.3 | — | — | — | — | — | ||||||||||||||||||
|
|
|
|
|
|
|
|
|
|
|
| |||||||||||||
Net Periodic Benefit Cost | $ | 17.0 | $ | 15.5 | $ | 13.9 | $ | 11.1 | $ | 10.8 | $ | 6.3 | ||||||||||||
|
|
|
|
|
|
|
|
|
|
|
| |||||||||||||
| Pension Plans | Post-retirement Benefits | |||||||||||||||||||||||
| Year ended December 31, 2012 | Year ended December 31, 2011 | Year ended December 31, 2010 | Year ended December 31, 2012 | Year ended December 31, 2011 | Year ended December 31, 2010 | |||||||||||||||||||
Other changes recognized in other comprehensive (income) loss: | ||||||||||||||||||||||||
Prior service credit | $ | — | $ | (0.1 | ) | $ | — | $ | (28.9 | ) | $ | — | $ | — | ||||||||||
Net (gain) loss | (2.1 | ) | 7.7 | 7.8 | 3.8 | 18.9 | 21.8 | |||||||||||||||||
Amortizations | (3.6 | ) | (1.1 | ) | (0.5 | ) | — | — | 2.4 | |||||||||||||||
|
|
|
|
|
|
|
|
|
|
|
| |||||||||||||
Total recognized – other comprehensive (income) loss | $ | (5.7 | ) | $ | 6.5 | $ | 7.3 | $ | (25.1 | ) | $ | 18.9 | $ | 24.2 | ||||||||||
|
|
|
|
|
|
|
|
|
|
|
| |||||||||||||
Net Periodic Benefit Cost: Service cost Interest cost Expected return on assets Prior service cost (Gain) loss Net Periodic Benefit Cost Other changes recognized in other comprehensive income: Prior service credit Net (gain) loss Amortizations Total recognized – other comprehensive income Pension Plans Post-retirement Benefits Year ended
December 31,
2015 Year ended
December 31,
2014 Year ended
December 31,
2013 Year ended
December 31,
2015 Year ended
December 31,
2014 Year ended
December 31,
2013 $ 14.4 $ 13.2 $ 16.3 $ 2.2 $ 2.2 $ 3.3 5.2 5.0 4.0 5.4 5.9 5.8 (8.5 ) (7.7 ) (6.7 ) — — — 0.1 0.1 0.1 (3.6 ) (3.6 ) (3.6 ) (0.1 ) — 0.7 — (0.7 ) — $ 11.1 $ 10.6 $ 14.4 $ 4.0 $ 3.8 $ 5.5 $ 0.2 $ — $ — $ — $ — $ — (4.4 ) 2.1 (18.4 ) 4.4 7.8 (30.7 ) (0.0 ) (0.1 ) (0.8 ) 3.6 4.3 3.6 $ (4.2 ) $ 2.0 $ (19.2 ) $ 8.0 $ 12.1 $ (27.1 )
The table below provides the weighted-average actuarial assumptions used to determine the net periodic benefit cost.
| Pension Plans | Post-retirement Benefits | |||||||||||||||||||||||
| Year ended December 31, 2012 | Year ended December 31, 2011 | Year ended December 31, 2010 | Year ended December 31, 2012 | Year ended December 31, 2011 | Year ended December 31, 2010 | |||||||||||||||||||
Discount rate | 4.60 | %1 | 5.60 | % | 6.10 | % | 4.60 | % | 5.60 | % | 6.10 | % | ||||||||||||
Rate of compensation increase (salaried) | 4.00 | % | 4.00 | % | 4.00 | % | N/A | N/A | N/A | |||||||||||||||
Expected return on assets | 7.00 | % | 7.00 | % | 7.00 | % | N/A | N/A | N/A | |||||||||||||||
|
| Pension Plans | Post-retirement Benefits | |||||||||||||||||||||||
| Year ended December 31, 2015 | Year ended December 31, 2014 | Year ended December 31, 2013 | Year ended December 31, 2015 | Year ended December 31, 2014 | Year ended December 31, 2013 | |||||||||||||||||||
Discount rate | 3.90 | % | 4.80 | % | 3.90 | % | 4.00 | % | 4.90 | % | 4.10 | % | ||||||||||||
Rate of compensation increase (salaried) | 3.00 | % | 3.00 | % | 3.00 | % | N/A | N/A | N/A | |||||||||||||||
Expected return on assets | 6.25 | % | 6.80 | % | 7.00 | % | N/A | N/A | N/A | |||||||||||||||
The table below provides the weighted-average actuarial assumptions used to determine the benefit obligations of the Company’s plans.
| Pension Plans | Post-retirement Benefits | Pension Plans | Post-retirement Benefits | |||||||||||||||||||||||||||||
| As of December 31, | As of December 31, | |||||||||||||||||||||||||||||||
| 2012 | 2011 | 2012 | 2011 | 2015 | 2014 | 2015 | 2014 | |||||||||||||||||||||||||
Discount rate | 3.90 | % | 4.60 | % | 4.10 | % | 4.60 | % | 4.40 | % | 3.90 | % | 4.60 | % | 4.00 | % | ||||||||||||||||
Rate of compensation increase (salaried) | 3.00 | % | 4.00 | % | N/A | N/A | 3.00 | % | 3.00 | % | N/A | N/A | ||||||||||||||||||||
The Company’s pension and OPEB costs are calculated using various actuarial assumptions and methodologies as prescribed by authoritative accounting guidance. These assumptions include discount rates, expected return on plan assets, health care cost trend rates, inflation, rate of compensation increases, mortality rates and other factors. The Company reviews all actuarial assumptions on an annual basis.
The discount rate is used to determine the present value of the Company’s benefit obligations. The Company’s discount rate is determined by matching the plans projected cash flows to a yield curve based on long-term, fixed income debt instruments available as of the measurement date of December 31, 2012.2015.
The overall expected rate of return on plan assets is based upon historical and expected future returns consistent with the expected benefit duration of the plan for each asset group adjusted for investment and administrative fees.
Health care cost trends are used to project future post-retirement benefits payable from the Company’s plans. For the Company’s December 31, 20122015 obligations, future post-retirement medical care costs were forecasted assuming an initial annual increase of 6.72%6.67%, decreasing to 4.50% by the year 2027. Future post-retirement prescription drug costs were forecasted assuming an initial annual increase of 6.00%5.75%, decreasing to 4.50% by the year 2027.
As health care costs trends have a significant effect on the amounts reported, the following effects of an increase and decrease of one-percentage-point would have the following effects in the year ended December 31, 20122015 (dollars in millions):
| 1% Increase | 1% Decrease | |||||||
Effect on total of service and interest cost | $ | 2.7 | $ | (2.0 | ) | |||
Effect on post-retirement benefit obligation | $ | 30.0 | $ | (23.4 | ) | |||
Effect on total of service and interest cost Effect on post-retirement benefit obligation 1% Increase 1% Decrease $ 1.8 $ (1.3 ) $ 31.2 $ (24.3 )
The following table provides a reconciliation of the changes in the net benefit obligations and fair value of plan assets for the years ended December 31, 2012, 20112015, 2014 and 20102013 (dollars in millions):
| Pension Plans | Post-retirement Benefits | |||||||||||||||||||||||
| Year ended December 31, 2012 | Year ended December 31, 2011 | Year ended December 31, 2010 | Year ended December 31, 2012 | Year ended December 31, 2011 | Year ended December 31, 2010 | |||||||||||||||||||
Benefit Obligations: | ||||||||||||||||||||||||
Net benefit obligation at beginning of year | $ | 99.7 | $ | 71.4 | $ | 48.5 | $ | 156.6 | $ | 127.0 | $ | 96.5 | ||||||||||||
Service cost | 15.2 | 14.7 | 13.9 | 3.9 | 3.7 | 2.8 | ||||||||||||||||||
Interest cost | 4.1 | 4.0 | 2.9 | 7.2 | 7.1 | 5.9 | ||||||||||||||||||
Plan Amendments | — | — | — | (28.9 | ) | — | — | |||||||||||||||||
Settlements | (18.8 | ) | — | — | — | — | — | |||||||||||||||||
Benefits paid | (0.4 | ) | (0.3 | ) | (0.2 | ) | — | — | — | |||||||||||||||
Actuarial loss | 3.5 | 9.9 | 6.3 | 3.8 | 18.8 | 21.8 | ||||||||||||||||||
|
|
|
|
|
|
|
|
|
|
|
| |||||||||||||
Net benefit obligation at end of year | $ | 103.3 | $ | 99.7 | $ | 71.4 | $ | 142.6 | $ | 156.6 | $ | 127.0 | ||||||||||||
|
|
|
|
|
|
|
|
|
|
|
| |||||||||||||
Fair Value of Plan Assets: | ||||||||||||||||||||||||
Fair value of plan assets at beginning of year | $ | 83.4 | $ | 54.9 | $ | 39.5 | $ | — | $ | — | $ | — | ||||||||||||
Actual return on plan assets | 11.5 | 6.6 | 1.9 | — | — | — | ||||||||||||||||||
Employer contributions | 13.7 | 22.2 | 13.7 | — | — | — | ||||||||||||||||||
Settlements | (18.8 | ) | — | — | — | — | — | |||||||||||||||||
Benefits paid | (0.4 | ) | (0.3 | ) | (0.2 | ) | — | — | ||||||||||||||||
|
|
|
|
|
|
|
|
|
|
|
| |||||||||||||
Fair value of plan assets at end of year | $ | 89.4 | $ | 83.4 | $ | 54.9 | $ | — | $ | — | $ | — | ||||||||||||
|
|
|
|
|
|
|
|
|
|
|
| |||||||||||||
Net Funded Status | $ | (13.9 | ) | $ | (16.3 | ) | $ | (16.5 | ) | $ | (142.6 | ) | $ | (156.6 | ) | $ | (127.0 | ) | ||||||
|
|
|
|
|
|
|
|
|
|
|
| |||||||||||||
In the second quarter of 2012, the Company completed its negotiation with GM to determine the amount of pension assets to be transferred from the Company to GM as required by the Asset Purchase Agreement. The Company transferred $18.8 million of plan assets to GM to settle this obligation.
In the fourth quarter of 2012, the Company and the International Union, United Automobile, Aerospace and Agricultural Implement Workers of America (“UAW”) Local 933 entered into a new five year collective bargaining agreement that expires in November 2017. The multi-tiered wage and benefit structure from the prior agreement was retained and the parties agreed to additional changes, such as implementing a new retirement health care plan and eliminating the consumer price index based cost of living allowance that had been part of the prior agreement. As a result, the Company recorded a $28.9 million favorable adjustment to the net benefit obligation.
| Pension Plans | Post-retirement Benefits | |||||||||||||||||||||||
| Year ended December 31, 2015 | Year ended December 31, 2014 | Year ended December 31, 2013 | Year ended December 31, 2015 | Year ended December 31, 2014 | Year ended December 31, 2013 | |||||||||||||||||||
Benefit Obligations: | ||||||||||||||||||||||||
Net benefit obligation at beginning of year | $ | 133.5 | $ | 105.9 | $ | 103.3 | $ | 136.0 | $ | 120.7 | $ | 142.6 | ||||||||||||
Service cost | 14.4 | 13.2 | 16.3 | 2.2 | 2.2 | 3.3 | ||||||||||||||||||
Interest cost | 5.2 | 5.0 | 4.0 | 5.4 | 5.9 | 5.8 | ||||||||||||||||||
Plan Amendments | 0.2 | — | — | — | — | — | ||||||||||||||||||
Benefits paid | (2.0 | ) | (1.5 | ) | (0.8 | ) | (0.7 | ) | (0.6 | ) | (0.3 | ) | ||||||||||||
Actuarial (gain) loss | (10.9 | ) | 10.9 | (16.9 | ) | 4.4 | 7.8 | (30.7 | ) | |||||||||||||||
|
|
|
|
|
|
|
|
|
|
|
| |||||||||||||
Net benefit obligation at end of year | $ | 140.4 | $ | 133.5 | $ | 105.9 | $ | 147.3 | $ | 136.0 | $ | 120.7 | ||||||||||||
|
|
|
|
|
|
|
|
|
|
|
| |||||||||||||
Fair Value of Plan Assets: | ||||||||||||||||||||||||
Fair value of plan assets at beginning of year | $ | 135.3 | $ | 108.6 | $ | 89.4 | $ | — | $ | — | $ | — | ||||||||||||
Actual return on plan assets | 2.0 | 16.4 | 8.2 | — | — | — | ||||||||||||||||||
Employer contributions | 4.8 | 11.8 | 11.8 | 0.7 | 0.6 | 0.3 | ||||||||||||||||||
Benefits paid | (2.0 | ) | (1.5 | ) | (0.8 | ) | (0.7 | ) | (0.6 | ) | (0.3 | ) | ||||||||||||
|
|
|
|
|
|
|
|
|
|
|
| |||||||||||||
Fair value of plan assets at end of year | $ | 140.1 | $ | 135.3 | $ | 108.6 | $ | — | $ | — | $ | — | ||||||||||||
|
|
|
|
|
|
|
|
|
|
|
| |||||||||||||
Net Funded Status | $ | (0.3 | ) | $ | 1.8 | $ | 2.7 | $ | (147.3 | ) | $ | (136.0 | ) | $ | (120.7 | ) | ||||||||
|
|
|
|
|
|
|
|
|
|
|
| |||||||||||||
The Company’s pension plan assets mostly consist of money market funds, mutual funds, listed equitiesdiversified equity securities and publicly traded bonds. The Company’s valuation techniques used to fair value pension plan assets represents a market approach in active markets for identical assets that qualifies as Level 1 in the fair value hierarchy.
diversified debt securities. The fair values of plan assets for the Company’s pension plans as of December 31, 20122015 and 20112014 are as follows (dollars in millions):
| Quoted Prices in Active Markets for Identical Assets (Level 1) | Fair Value Measurements Using | |||||||||||||||||||||||||||||||||||||||
| 2012 | 2011 | Quoted Prices in Active Markets for Identical Assets (Level 1) | Significant Other Observable Inputs (Level 2) | TOTAL | ||||||||||||||||||||||||||||||||||||
Asset Category | Fair Value | % | Fair Value | % | ||||||||||||||||||||||||||||||||||||
Cash and cash equivalents | $ | 3.6 | 4 | % | $ | 9.9 | 12 | % | ||||||||||||||||||||||||||||||||
| 2015 | 2014 | 2015 | 2014 | 2015 | 2014 | |||||||||||||||||||||||||||||||||||
Cash equivalents | $ | 3.0 | $ | 8.6 | $ | — | $ | — | $ | 3.0 | $ | 8.6 | ||||||||||||||||||||||||||||
Diversified equity securities | 41.1 | 46 | 18.6 | 22 | 21.1 | 57.8 | — | — | 21.1 | 57.8 | ||||||||||||||||||||||||||||||
Diversified debt securities | 44.7 | 50 | 54.9 | 66 | 21.9 | 68.9 | 94.1 | — | 116.0 | 68.9 | ||||||||||||||||||||||||||||||
|
|
|
|
|
|
|
|
|
| |||||||||||||||||||||||||||||||
Total | $ | 89.4 | 100 | % | $ | 83.4 | 100 | % | $ | 46.0 | $ | 135.3 | $ | 94.1 | $ | — | $ | 140.1 | $ | 135.3 | ||||||||||||||||||||
|
|
|
|
|
|
|
|
|
| |||||||||||||||||||||||||||||||
The Company’s investment strategy with respect to pension plan assets is to invest the assets in accordance with laws and regulations. The long-term primary objectives for the Company’s pension assets are to provide results that meet or exceed the plans’ actuarially assumed long-term rate of return without subjecting the funds to undue risk. To achieve these objectives the Company has established the following targets:
| ||||
| ||||
| ||||
| ||||
| ||||
| Target | ||||||||
Asset Category | Hourly | Salary | ||||||
Cash equivalents | 2 | % | 2 | % | ||||
Diversified equity securities | 15 | 15 | ||||||
Diversified debt securities | 83 | 83 | ||||||
|
|
|
| |||||
Total | 100 | % | 100 | % | ||||
|
|
|
| |||||
Through 2012,2015, the Company’s investment committee has continued to evaluate the investments and take steps toward the established targets.
The following table discloses the amounts recognized in the balance sheet and in AOCL at December 31, 20122015 and 2011,2014, on a pre-tax basis (dollars in millions):
| Pension Plans | Post-retirement Benefits | Pension Plans | Post-retirement Benefits | |||||||||||||||||||||||||||||
| As of December 31, | As of December 31, | |||||||||||||||||||||||||||||||
| 2012 | 2011 | 2012 | 2011 | 2015 | 2014 | 2015 | 2014 | |||||||||||||||||||||||||
Amounts Recognized in Balance Sheet: | ||||||||||||||||||||||||||||||||
Noncurrent assets | $ | 6.6 | $ | 7.9 | $ | — | $ | — | ||||||||||||||||||||||||
Current liabilities | $ | — | $ | — | $ | (1.2 | ) | $ | (0.9 | ) | — | — | (1.6 | ) | (1.2 | ) | ||||||||||||||||
Noncurrent liabilities | (13.9 | ) | (16.3 | ) | (141.4 | ) | (155.7 | ) | (6.9 | ) | (6.1 | ) | (145.7 | ) | (134.8 | ) | ||||||||||||||||
|
|
|
|
|
|
|
| |||||||||||||||||||||||||
Total liability | $ | (13.9 | ) | $ | (16.3 | ) | $ | (142.6 | ) | $ | (156.6 | ) | ||||||||||||||||||||
Total (liability) asset | $ | (0.3 | ) | $ | 1.8 | $ | (147.3 | ) | $ | (136.0 | ) | |||||||||||||||||||||
|
|
|
|
|
|
|
| |||||||||||||||||||||||||
Accumulated Other Comprehensive (Loss) Income: | ||||||||||||||||||||||||||||||||
Unrecognized prior service (cost) credit | $ | (0.3 | ) | $ | (0.4 | ) | $ | 28.9 | $ | — | ||||||||||||||||||||||
Unrecognized actuarial loss | (16.4 | ) | (22.0 | ) | (13.5 | ) | (9.8 | ) | ||||||||||||||||||||||||
Accumulated Other Comprehensive Loss: | ||||||||||||||||||||||||||||||||
Prior service (cost) credit | $ | (0.3 | ) | $ | (0.1 | ) | $ | 18.1 | $ | 21.7 | ||||||||||||||||||||||
Actuarial gain | 5.0 | 0.6 | 4.2 | 8.6 | ||||||||||||||||||||||||||||
|
|
|
|
|
|
|
| |||||||||||||||||||||||||
Total | $ | (16.7 | ) | $ | (22.4 | ) | $ | 15.4 | $ | (9.8 | ) | $ | 4.7 | $ | 0.5 | $ | 22.3 | $ | 30.3 | |||||||||||||
|
|
|
|
|
|
|
| |||||||||||||||||||||||||
The amounts in AOCL expected to be amortized and recognized as a component of net periodic benefit cost in 20132016 are as follows (dollars in millions):
| 2013 | 2016 | |||||||||||||||
| Pension Plans | Post-retirement Benefits | Pension Plans | Post-retirement Benefits | |||||||||||||
Prior service (cost) credit | $ | (0.1 | ) | $ | 3.6 | $ | (0.2 | ) | $ | 3.6 | ||||||
Actuarial loss | (0.7 | ) | — | |||||||||||||
Actuarial gain | 0.3 | — | ||||||||||||||
|
|
|
| |||||||||||||
Total | $ | (0.8 | ) | $ | 3.6 | $ | 0.1 | $ | 3.6 | |||||||
|
|
|
| |||||||||||||
The accumulated benefit obligation for the Company’s pension plans as of December 31, 20122015 and 20112014 was $100.0$136.6 million and $96.1$129.7 million, respectively.
As of December 31, 20122015 and 2011,2014, the projected benefit obligation, the accumulated benefit obligation, and the fair value of plan assets for pension plans with a projected benefit obligation in excess of plan assets and for pension plans with an accumulated benefit obligation in excess of plan assets were as follows (dollars in millions):
| Hourly Plan | Salary Plan | |||||||||||||||||||||||
| As of December 31, | As of December 31, | |||||||||||||||||||||||
| 2012 | 2011 | 2015 | 2014 | 2015 | 2014 | |||||||||||||||||||
Plans with projected benefit obligation in excess of plan assets: | ||||||||||||||||||||||||
Projected benefit obligation | $ | 103.3 | $ | 99.7 | N/A | 1 | N/A | 1 | $ | 74.6 | $ | 71.4 | ||||||||||||
Fair value of plan assets | $ | 89.4 | $ | 83.4 | N/A | 1 | N/A | 1 | $ | 67.7 | $ | 65.3 | ||||||||||||
Plans with accumulated benefit obligation in excess of plan assets: | ||||||||||||||||||||||||
Accumulated benefit obligation | $ | 100.0 | $ | 96.1 | N/A | 1 | N/A | 1 | $ | 70.8 | $ | 67.6 | ||||||||||||
Fair value of plan assets | $ | 89.4 | $ | 83.4 | N/A | 1 | N/A | 1 | $ | 67.7 | $ | 65.3 | ||||||||||||
| 1 | As of December 31, 2015 and 2014, the hourly defined benefit pension plan had plan assets greater than both the projected benefit obligation and accumulated benefit obligation. |
Information about expected cash flows for the Company’s pension and post-retirement benefit plans is as follows (dollars in millions):
| Pension Plans | Post-retirement Benefits | |||||||
Employer Contributions: | ||||||||
2013 expected contributions | $ | 12.0 | $ | 1.2 | ||||
Expected Benefit Payments: | ||||||||
2013 | $ | 1.8 | $ | 1.2 | ||||
2014 | 2.6 | 1.9 | ||||||
2015 | 3.4 | 2.8 | ||||||
2016 | 4.3 | 3.7 | ||||||
2017 | 5.0 | 4.6 | ||||||
2018-2022 | 34.8 | 34.1 | ||||||
| Pension Plans | Post-retirement Benefits | |||||||
Employer Contributions: | ||||||||
2016 expected contributions | $ | 8.0 | $ | 1.7 | ||||
Expected Benefit Payments: | ||||||||
2016 | 3.3 | 1.7 | ||||||
2017 | 4.1 | 2.3 | ||||||
2018 | 4.8 | 3.0 | ||||||
2019 | 5.6 | 3.7 | ||||||
2020 | 6.4 | 4.5 | ||||||
2021-2025 | 45.6 | 30.8 | ||||||
Expected benefit payments for pension and post-retirement benefits will be paid from plan trusts or corporate assets. The Company’s funding policy is to contribute amounts annually that are at least equal to the amounts required by applicable laws and regulations or to directly fund payments to plan participants. Additional discretionary contributions will be made when deemed appropriate to meet the Company’s long-term obligation to the plans.
In June 2012, the Company established a non-qualified deferred compensation plan (“Deferred Compensation Plan”) for a select group of management. Under the terms of the plan, the Company has utilized a rabbi trust to accumulate assets to fund its promise to pay benefits under the Deferred Compensation Plan. The rabbi trust is an irrevocable trust, which restricts any use of funds (operational or otherwise) by the Company other than to pay benefits under the Deferred Compensation Plan, and prevents immediate taxation of contributed amounts. Funds are accumulated through both employee deferrals and a company match. Funds can be invested by the employee into a diversified group of investment options, which have been selected by the Company’s investment committee, that are all categorized as Level 1 in the fair value hierarchy. The company match resulted in a charge of $0.1$0.2 million, $0.2 million, and $0.3 million to the Consolidated Statements of Comprehensive Income (Loss) for the yearyears ended December 31, 2012,2015, 2014 and 2013, respectively, and the fair value of the rabbi trust plan assets and deferred compensation obligation was $0.2$4.8 million and $2.9 million as of December 31, 2012. In December 2012, the Company established a non-qualified deferred compensation plan for non-employee directors that becomes effective in May 2013.2015 and 2014, respectively.
NOTE 13. STOCK-BASED COMPENSATION
| NOTE 14. | STOCK-BASED COMPENSATION |
In March 2012,2015, the Company’s Board of Directors adopted and in May 2015, the Company’s stockholders approved the Allison Transmission Holdings, Inc. 20112015 Equity Incentive Award Plan (“20112015 Plan”), which became effective as of the day prior to the consummation of the Company’s IPO.on May 14, 2015. Under the 20112015 Plan, certain employees (including executive officers), consultants and directors are eligible to receive equity-based compensation, including non-qualified stock options, incentive stock options, restricted stock, dividend equivalents, stock payments, restricted stock units (“RSU”), performance awards, stock appreciation rights and other equity-based awards, or any combination thereof. The 20112015 Plan limits the aggregate number of shares of common stock available for issue to 15.3 million and will expire on, and no option or other equity award may be granted pursuant to the 20112015 Plan after, the tenth anniversary of the date the 20112015 Plan was approved by the Board of Directors.
Prior to the adoption of the 20112015 Plan, the Company’s equity-based awards were granted under Allison Transmission Holdings, Inc. 2011 Equity Incentive Award Plan (“2011 Plan”) and the Equity Incentive Plan of Allison Transmission Holdings, Inc. (“PriorEquity Plan” and, together with the 2011 Plan, the “Prior Plans”). As of the effective date of the 20112015 Plan, no new awards will be granted under the Prior Plan,Plans, but the Prior PlanPlans will continue to govern the equity awards issued under the Prior Plan.Plans.
Restricted Stock Units
RSUs were issued to certain employees in 20122015, 2014 and 2013 under the 2011 Plan, toand certain employeesdirectors in 2015 and 2014 under the 2015 Plan and 2011 Plan, at fair market value at the date of grant. These awards entitle the holder to receive one common share for each RSU upon vesting, which generally occurs over two years.one to three years upon continued performance of services by the RSU holders. A summary of RSU activity as of December 31, 20122015, 2014 and 2013, and changes during the period then ended is presented below:
Non-vested Shares: | RSUs (in millions) | Weighted-Average Grant-Date Fair Value | ||||||||||||||
Non-vested as of December 31, 2011 | — | $ | — | |||||||||||||
Non-vested RSUs: | RSUs (in millions) | Weighted-Average Grant-Date Fair Value | ||||||||||||||
Non-vested as of December 31, 2012 | 1.0 | $ | 20.20 | |||||||||||||
Granted | 1.0 | 20.20 | 0.2 | 23.31 | ||||||||||||
Vested | — | — | (0.4 | ) | 20.23 | |||||||||||
Forfeited | — | — | ||||||||||||||
Non-vested as of December 31, 2012 | 1.0 | $ | 20.20 | |||||||||||||
Non-vested as of December 31, 2013 | 0.8 | $ | 20.90 | |||||||||||||
Granted | 0.0 | 29.85 | ||||||||||||||
Vested | (0.6 | ) | 20.32 | |||||||||||||
Non-vested as of December 31, 2014 | 0.2 | $ | 26.57 | |||||||||||||
Granted | 0.1 | 31.96 | ||||||||||||||
Vested | (0.1 | ) | 23.95 | |||||||||||||
Non-vested as of December 31, 2015 | 0.2 | $ | 30.61 | |||||||||||||
As of December 31, 2012, 20112015 and 2010,2014, there was $18.5 million, $0.0were $2.8 million and $0.0$3.0 million, respectively, of unrecognized compensation cost related to non-vested RSU compensation arrangements granted under the 20112015 Plan and Prior2011 Plan. This cost is expected to be recognized, on a straight line basis, over a period of approximately two years. RSU incentive compensation expense recorded was $0.9$3.0 million, $0.0$9.8 million and $0.0$12.0 million for the years ended December 31, 2012,2015, 2014 and 2013, respectively. The total intrinsic value of RSUs vested during the years ended December 31, 2015, 2014 and 2013 was $0.2 million, $7.4 million and $1.1 million, respectively. The total fair value of RSUs vested during the years ended December 31, 2015, 2014 and 2013 was approximately $3.8 million, $20.2 million and $9.0 million, respectively.
Pursuant to the share withholding provisions of the 2011 Plan and 2010,the related RSU award agreement, certain employees, in lieu of paying withholding taxes on the vesting of RSUs, authorized the withholding of an aggregate of approximately 0.1 million, 0.3 million and 0.1 million shares, respectively of the Company’s common stock to satisfy their minimum statutory tax withholding requirements related to such vesting events during 2015, 2014 and 2013. The withheld shares were recorded as a reduction to equity on the applicable vesting dates of approximately $1.4 million, $8.4 million and $3.6 million during 2015, 2014 and 2013, respectively.
Restricted Stock Awards Restricted stock was granted to certain employees in 2015 and 2014 under the 2011 Plan at fair market value on the date of grant. The restrictions lapse upon continued performance by the restricted stock holders on the vest date which generally occurs over one, two or three years. A summary of restricted stock activity as of December 31, 2015 and 2014, and changes during the period ended December 31, 2015 and 2014 is presented below: Non-vested Shares: Non-vested as of December 31, 2013 Granted Vested Non-vested as of December 31, 2014 Granted Vested Non-vested as of December 31, 2015 As of December 31, 2015 and 2014, there was $2.8 million and $3.4 million, respectively, of unrecognized compensation cost related to non-vested restricted stock compensation arrangements granted under the 2011 Plan. This cost is expected to be recognized, on a straight line basis, over a period of approximately two years. Restricted stock incentive compensation expense recorded was $2.2 million and $1.6 million for the years ended December 31, 2015 and 2014, respectively. The total intrinsic value of restricted stock vested during the year ended December 31, 2015 was $0.1 million. Pursuant to the share withholding provisions of the 2011 Plan and the related restricted stock award agreement, certain employees, in lieu of paying withholding taxes on the vesting of restricted stock, authorized the withholding of the Company’s common stock to satisfy their minimum statutory tax withholding requirements related to such vesting events during 2015. The withheld shares were recorded as a reduction to equity on the applicable vesting dates of approximately $0.5 million during 2015. Performance Awards Performance awards were granted to certain employees in 2015 under the 2011 Plan. In accordance with the FASB’s authoritative accounting guidance on stock compensation, each performance award granted is to be recorded at fair value. The Company records the fair value of each performance award based on a Monte-Carlo pricing model using the assumptions noted in the following table: Expected volatility Expected term (in years) Risk-free rate The restrictions lapse on the date the Compensation Committee of the Board of Directors determines the number of shares that shall vest based on the total stockholders return of the Company and the specified peer group, which date should be no later than February 28, 2018. A summary of performance award activity as of December 31, 2015, and changes during the period ended December 31, 2015 is presented below: Non-vested Shares: Non-vested as of December 31, 2014 Granted Vested Non-vested as of December 31, 2015 As of December 31, 2015, there was $1.7 million of unrecognized compensation cost related to non-vested performance awards granted under the 2011 Plan. This cost is expected to be recognized, on a straight line basis, over a period of approximately three years. Performance award incentive compensation expense recorded was $0.7 million for the year ended December 31, 2015. Restricted
Stock
(in millions) Weighted-Average
Grant-Date Fair
Value — $ — 0.2 29.47 — — 0.2 $ 29.47 0.0 32.05 0.0 29.08 0.2 $ 30.27 2015 18%-34% 2.9 1.0% Performance
award
(in millions) Weighted-Average
Grant-Date
Fair Value — $ — 0.1 $ 36.53 — — 0.1 $ 36.53
Stock Options
Stock options granted under the Equity Plan after the completion of the Acquisition Transaction and under the Prior Plan,through March 2012, have a per share exercise price based on the fair market value of the Company at the date of grantgrant. Stock options granted under the 2015 Plan and 2011 Plan have a per share exercise price based on the closing price of a share of the Company’s common stock as reported by the NYSE on the date of grant. All stock options expire 10 years after the grant dates.date. The options will vest upon the continued performance of services by the option holder over time, with either 20% or 33% of the award vesting on each anniversary of the grant date over three to five years. Consultantyears for awards under the Equity Plan and director options vest100% of the award vesting in full within oneDecember of the year fromthat is two years after the year of grant date.or the third anniversary of the grant date under the 2011 Plan. Upon termination of employment for reasons other than cause, retirement at or afterbefore the age of 65 with less than 90 points (calculated as age plus years of service), death or disability, the options shall cease to be exercisable ninety days following the date of the optionees’ termination of service. Upon termination of employment for cause, the options shall not be exercisable on the date of such termination. Upon termination of employment for retirement at or after the age of 65, the options shall cease to be exercisable three years following such date. Upon termination of employment for retirement before the age of 65 with 90 or more points, the options shall cease to be exercisable two years following such date. Upon termination of employment for death or disability, the options shall cease to be exercisable twelve months following such date.
In accordance with the FASB’s authoritative accounting guidance on stock compensation, each option grant is to be recorded at fair value. For the year ended December 31, 2012, the Company did not grant any stock options. When options are granted, the Company useduses a Black-Scholes option pricing model to calculate the fair value of each option award using the assumptions noted in the following table:
| 2012 | 2011 | 2010 | 2015 | 2014 | 2013 | |||||||||||||||
Expected volatility | N/A | 101% | 101% | 31 | % | 38 | % | 51 | % | |||||||||||
Expected dividend yield | N/A | 0.0% | 0.0% | 1.9 | % | 1.6 | % | 1.2 | % | |||||||||||
Expected term (in years) | N/A | 3.6 | 3.6 | 6.0 | 5.5 | 5.4 | ||||||||||||||
Expected forfeitures | N/A | 0% | 0% | |||||||||||||||||
Risk-free rate | N/A | 0.6% – 1.7% | 0.6% – 1.7% | 1.5 | % | 1.7 | % | 1.6 | % | |||||||||||
Expected volatility is based on “the average volatilities of otherwise similar public entities” as defined by authoritative accounting guidance. The Company currently pays a $0.06$0.15 dividend per quarter. The expected term is derived from the average of the weighted vesting life and the contractual term. The risk-free rate for periods within the contractual life of the option is based on the U.S. Treasury yield curve in effect at the time of grant. The Company has assumed no forfeitures primarily because of a history of retaining senior executives.
A summary of option activity as of December 31, 2012, 20112015, 2014 and 2010,2013, and changes during the period then ended is presented below:
| Options (in millions) | Weighted- Average Exercise Price | Weighted-Average Remaining Contractual Term | ||||||||||
Outstanding as of December 31, 2009 | 14.7 | $ | 13.40 | 6.90 years | ||||||||
Exercisable as of December 31, 2009 | 5.5 | $ | 13.31 | 6.80 years | ||||||||
Granted | 0.2 | $ | 13.69 | |||||||||
Exercised | — | — | ||||||||||
Forfeited or expired | (0.1 | ) | $ | 10.78 | ||||||||
Outstanding as of December 31, 2010 | 14.8 | $ | 13.42 | 5.94 years | ||||||||
Exercisable as of December 31, 2010 | 8.4 | $ | 13.38 | 5.84 years | ||||||||
Granted | 0.1 | $ | 8.44 | |||||||||
Exercised | — | — | ||||||||||
Forfeited or expired | — | — | ||||||||||
Outstanding as of December 31, 2011 | 14.9 | $ | 13.40 | 4.94 years | ||||||||
Exercisable as of December 31, 2011 | 11.5 | $ | 13.37 | 4.88 years | ||||||||
Granted | — | — | ||||||||||
Exercised | (2.7 | ) | — | |||||||||
Forfeited or expired | (0.3 | ) | — | |||||||||
Outstanding as of December 31, 2012 | 11.9 | $ | 14.01 | 4.93 years | ||||||||
Exercisable as of December 31, 2012 | 11.8 | $ | 14.02 | 4.91 years | ||||||||
| Options (in millions) | Weighted- Average Exercise Price | Weighted-Average Remaining Contractual Term | ||||||||||
Outstanding as of December 31, 2012 | 11.9 | $ | 14.01 | 4.93 years | ||||||||
Exercisable as of December 31, 2012 | 11.8 | $ | 14.02 | 4.91 years | ||||||||
Granted | 0.6 | $ | 23.39 | |||||||||
Exercised | (3.8 | ) | — | |||||||||
Outstanding as of December 31, 2013 | 8.7 | $ | 15.33 | 4.30 years | ||||||||
Exercisable as of December 31, 2013 | 8.1 | $ | 14.79 | 3.94 years | ||||||||
Granted | 0.4 | $ | 30.23 | |||||||||
Exercised | (4.2 | ) | — | |||||||||
Outstanding as of December 31, 2014 | 4.9 | $ | 17.49 | 4.19 years | ||||||||
Exercisable as of December 31, 2014 | 3.9 | $ | 15.32 | 3.08 years | ||||||||
Granted | 0.2 | $ | 32.13 | |||||||||
Exercised | (1.5 | ) | — | |||||||||
Outstanding as of December 31, 2015 | 3.6 | $ | 19.47 | 4.12 years | ||||||||
Exercisable as of December 31, 2015 | 3.0 | $ | 16.87 | 3.12 years | �� | |||||||
The weighted-average grant-date fair value of options granted during the years ended December 31, 20112015, 2014 and 20102013 was $5.43$8.39, $9.51 and $4.72,$9.76, respectively. No stock options were granted during the year ended December 31, 2012. The total fair value of sharesstock options vested during the years ended December 31, 2012, 20112015, 2014 and 20102013 was $7.5$5.9 million, $8.1$0.0 million and $7.6$0.7 million, respectively. The total intrinsic value of stock options exercised during the yearyears ended December 31, 20122015, 2014 and 2013 was $24.6 million.$25.8 million, $82.3 million and $58.0 million, respectively. The aggregate intrinsic value of sharesstock options outstanding and exercisable was $23.1 million and $27.1 million as of December 31, 2012 was $77.52015, and $80.4 million and $76.7$72.5 million as of December 31, 2014, respectively.
A summary of the status of the Company’s non-vested stock options as of December 31, 2012, 20112015, 2014 and 2010,2013, and changes during the period ended December 31, 2012, 20112015, 2014 and 20102013 is presented below:
Non-vested Stock Options: | Options (in millions) | Weighted-Average Grant-Date Fair Value | Options (in millions) | Weighted-Average Grant-Date Fair Value | ||||||||||||
Non-vested at December 31, 2009 | 9.1 | $ | 2.59 | |||||||||||||
Non-vested at December 31, 2012 | 0.2 | $ | 4.34 | |||||||||||||
Granted | 0.2 | 4.72 | 0.6 | 9.76 | ||||||||||||
Vested | (2.9 | ) | 2.62 | (0.2 | ) | 3.59 | ||||||||||
Forfeited | (0.1 | ) | 3.31 | |||||||||||||
Non-vested at December 31, 2010 | 6.3 | $ | 2.62 | |||||||||||||
Non-vested at December 31, 2013 | 0.6 | $ | 9.06 | |||||||||||||
Granted | 0.1 | 5.43 | 0.4 | 9.51 | ||||||||||||
Vested | (3.0 | ) | 2.67 | — | — | |||||||||||
Forfeited | — | — | ||||||||||||||
Non-vested at December 31, 2011 | 3.4 | $ | 2.81 | |||||||||||||
Non-vested at December 31, 2014 | 1.0 | $ | 9.44 | |||||||||||||
Granted | — | — | 0.2 | 8.39 | ||||||||||||
Vested | (2.9 | ) | 2.58 | (0.6 | ) | 9.76 | ||||||||||
Forfeited | (0.3 | ) | 4.00 | |||||||||||||
Non-vested at December 31, 2012 | 0.2 | $ | 4.34 | |||||||||||||
Non-vested at December 31, 2015 | 0.6 | $ | 9.12 | |||||||||||||
As of December 31, 2012, 20112015, 2014 and 2010,2013, there was $0.5$2.9 million, $9.5$4.8 million and $16.7$4.2 million, respectively, of unrecognized compensation cost related to non-vested stock option compensation arrangements granted under the Prior Plan. No stock options have been granted under the 2011 Plan.Plans. This cost is expected to be recognized, on a straight line basis, over a period of approximately two to three years. Stock option incentive compensation expense recorded was $5.5$3.9 million, $8.0$3.3 million and $8.5$1.7 million for the years ended December 31, 2012, 20112015, 2014 and 2010,2013, respectively.
NOTE 14. INCOME TAXES
Income taxes are accounted for under the asset and liability method. Deferred tax assets and liabilities are recognized for the expected future tax consequences attributable to temporary differences between the financial statement carrying amounts of existing assets and liabilities and their respective tax bases. The future tax benefits associated with operating loss and tax credit carryforwards are recognized as deferred tax assets. Deferred tax assets and liabilities are measured using enacted tax rates expected to apply to taxable income in the years in which those temporary differences are expected to be recovered or settled.
The need to establish a valuation allowance against the deferred tax assets is assessed periodically based on a more-likely-than-not realization threshold, in accordance with authoritative accounting guidance. Appropriate consideration is given to all positive and negative evidence related to that realization. In assessing the realizability of deferred tax assets, management considers whether it is more likely than not that all or some portion of the deferred tax assets will not be realized. This assessment considers, among other matters, the nature, frequency and severity of recent losses, forecasts of future profitability, the duration of statutory carryforward periods, experience with tax attributes expiring unused, and tax planning alternatives. The ultimate realization of deferred tax assets is dependent upon the generation of future taxable income during the periods in which those temporary differences become deductible. Because the timing of the reversal of the amortizable goodwill and trade name intangible are indefinite, these deferred tax liabilities are not considered in evaluating the reversal of the temporary differences. The weight given to these considerations depends upon the degree to which they can be objectively verified.
Management has determined, based on the evaluation of both objective and subjective evidence available, that the domestic valuation allowance is no longer necessary and that it is more likely than not that the deferred tax assets are fully realizable. The Company has reached a sustained period of profitability and believes its objectively measured positive evidence outweighs the negative evidence. Accordingly, the Company has recognized an income tax benefit as a result of the release of the valuation allowance which had previously been recorded against the deferred tax assets. The Company continues to provide for a valuation allowance on certain of its foreign deferred tax assets.
| NOTE 15. | INCOME TAXES |
Income before income taxes included the following (dollars in millions):
| Year ended December 31, | Years ended December 31, | |||||||||||||||||||||||
| 2012 | 2011 | 2010 | 2015 | 2014 | 2013 | |||||||||||||||||||
U.S. income | $ | 204.1 | $ | 133.8 | $ | 75.3 | $ | 260.5 | $ | 355.1 | $ | 259.0 | ||||||||||||
Foreign income | 12.1 | 16.8 | 8.0 | 28.3 | 13.0 | 7.1 | ||||||||||||||||||
|
|
|
|
|
| |||||||||||||||||||
Total | $ | 216.2 | $ | 150.6 | $ | 83.3 | $ | 288.8 | $ | 368.1 | $ | 266.1 | ||||||||||||
|
|
|
|
|
| |||||||||||||||||||
The provision for income tax (benefit) expense was estimated as follows (dollars in millions):
| Year ended December 31, | Years ended December 31, | |||||||||||||||||||||||
| 2012 | 2011 | 2010 | 2015 | 2014 | 2013 | |||||||||||||||||||
Estimated current income taxes: | ||||||||||||||||||||||||
U.S. federal | $ | 1.5 | $ | — | $ | — | $ | 3.0 | $ | 1.6 | $ | 0.2 | ||||||||||||
Foreign | 3.9 | 6.7 | 1.6 | 5.4 | 6.3 | 1.9 | ||||||||||||||||||
U.S. state and local | 0.4 | 1.1 | 0.6 | 2.1 | (0.2 | ) | 0.6 | |||||||||||||||||
|
|
|
|
|
| |||||||||||||||||||
Total Current | 5.8 | 7.8 | 2.2 | 10.5 | 7.7 | 2.7 | ||||||||||||||||||
Deferred income tax expense (credit), net: | ||||||||||||||||||||||||
U.S. federal | (282.5 | ) | 37.5 | 45.7 | 89.7 | 125.6 | 87.6 | |||||||||||||||||
Foreign | 0.1 | (0.4 | ) | 1.1 | (0.1 | ) | (0.3 | ) | 0.1 | |||||||||||||||
U.S. state and local | (21.4 | ) | 2.7 | 4.7 | 6.4 | 6.5 | 10.3 | |||||||||||||||||
|
|
|
|
|
| |||||||||||||||||||
Total Deferred | (303.8 | ) | 39.8 | 51.5 | 96.0 | 131.8 | 98.0 | |||||||||||||||||
|
|
|
|
|
| |||||||||||||||||||
Total income tax expense | $ | (298.0 | ) | $ | 47.6 | $ | 53.7 | $ | 106.5 | $ | 139.5 | $ | 100.7 | |||||||||||
|
|
|
|
|
| |||||||||||||||||||
Cash paid for income taxes for the years ended December 31, 2012, 20112015, 2014 and 20102013 was $10.7$5.2 million, $5.8$5.0 million and $2.2$3.8 million, respectively.
A reconciliation of the provision for income tax expense compared with the amounts at the U.S. federal statutory rate is as follows (dollars in millions):
| Year ended December 31, | Years ended December 31, | |||||||||||||||||||||||
| 2012 | 2011 | 2010 | 2015 | 2014 | 2013 | |||||||||||||||||||
Tax at U.S. statutory income tax rate | $ | 75.7 | $ | 52.9 | $ | 29.2 | $ | 101.1 | $ | 128.9 | $ | 93.1 | ||||||||||||
Foreign rate differential | (2.6 | ) | (2.0 | ) | (0.5 | ) | (3.0 | ) | (2.3 | ) | (0.7 | ) | ||||||||||||
Non-deductible expenses | 4.2 | 5.6 | 4.5 | 3.9 | 3.9 | 0.8 | ||||||||||||||||||
Valuation allowance | (384.1 | ) | (19.2 | ) | 24.1 | (0.8 | ) | 2.6 | 1.0 | |||||||||||||||
State tax expense | 5.7 | 4.4 | 3.5 | 5.4 | 4.0 | 7.3 | ||||||||||||||||||
Adjustment to deferred tax expense | 2.2 | 4.3 | (4.2 | ) | 1.2 | 2.4 | (0.3 | ) | ||||||||||||||||
Branch income taxes-not creditable | — | (0.1 | ) | 0.1 | ||||||||||||||||||||
Other adjustments | 0.9 | 1.7 | (3.0 | ) | (1.3 | ) | (0.0 | ) | (0.5 | ) | ||||||||||||||
|
|
|
|
|
| |||||||||||||||||||
Total income tax expense | $ | (298.0 | ) | $ | 47.6 | $ | 53.7 | $ | 106.5 | $ | 139.5 | $ | 100.7 | |||||||||||
|
|
|
|
|
| |||||||||||||||||||
Deferred income
Temporary differences and carryforwards that gave rise to deferred tax assets and liabilities included the following (dollars in millions):
| As of December 31, 2015 | As of December 31, 2014 | |||||||
Deferred tax assets: | ||||||||
Inventories | $ | 5.4 | $ | 5.1 | ||||
Warranty accrual | 26.3 | 26.2 | ||||||
Sales allowances and rebates | 6.8 | 6.7 | ||||||
Deferred revenue | 29.4 | 25.7 | ||||||
Post-retirement | 11.2 | 5.0 | ||||||
Intangibles | 71.8 | 77.3 | ||||||
Other accrued liabilities | 24.1 | 32.8 | ||||||
Unrealized loss on interest rate derivatives | 13.4 | 6.6 | ||||||
Operating loss carryforwards | 48.6 | 107.8 | ||||||
Tax credits | 6.2 | 3.1 | ||||||
Environmental remediation | 5.2 | — | ||||||
Stock based compensation | 7.4 | 6.9 | ||||||
Technology-related investments | 10.2 | 7.5 | ||||||
Other | 13.8 | 10.8 | ||||||
|
|
|
| |||||
Total Deferred tax assets | 279.8 | 321.5 | ||||||
|
|
|
| |||||
Valuation allowances | (4.2 | ) | (5.2 | ) | ||||
|
|
|
| |||||
Deferred tax liabilities: | ||||||||
Property, plant and equipment | (19.0 | ) | (19.6 | ) | ||||
Goodwill | (365.0 | ) | (320.8 | ) | ||||
Trade name | (91.3 | ) | (90.3 | ) | ||||
Other | (3.0 | ) | (2.8 | ) | ||||
|
|
|
| |||||
Total Deferred tax liabilities | (478.3 | ) | (433.5 | ) | ||||
|
|
|
| |||||
Net Deferred tax liability | $ | (202.7 | ) | $ | (117.2 | ) | ||
|
|
|
| |||||
As of December 31, 2015, the Company early adopted the FASB’s authoritative accounting guidance on a retrospective basis to classify all deferred tax assets and liabilities, along with any related valuation allowance, as noncurrent on the balance sheet. Refer to NOTE 2 for 2012more details.
Of the estimated net operating loss carryforwards as of December 31, 2015, approximately 85% relates to U.S. federal net operating loss carryforwards and 2011 reflectapproximately 16% relates to the effectU.S. state net operating loss carryforwards. Substantially all U.S. Federal and State operating loss carryforwards will not expire until 2027-2032. As of temporary differences between amountsDecember 31, 2015 and 2014, the Company had $97.4 million and $253.3 million, respectively, of net operating loss carryforwards for U.S. federal income tax purposes. If the Company continues to generate taxable income, it expects to utilize the remaining U.S. federal net operating loss carryforwards by the end of 2016.
Management has determined, based on an evaluation of available objective and subjective evidence, that it is more likely than not that certain foreign deferred tax assets liabilitieswill not be realized and equity for financial reporting purposestherefore continue to offset these deferred tax assets with a valuation allowance of $4.2 million and the bases$5.2 million as of such assets, liabilitiesDecember 31, 2015 and equity as measured by tax laws, as well as tax loss and tax credit carryforwards. 2014, respectively.
The Company has not recognized any deferred tax liabilities associated with investments and earnings in foreign subsidiaries as they are intended to be permanent in duration. Such amounts may become taxable upon an actual or deemed repatriation in the future. As minimal cash in maintained outside the U.S.,future; however, at this time, management believes that estimating anany related unrecognized deferred tax liability is unnecessary at this time.immaterial.
Temporary differences and carryforwards that gave rise to deferred tax assets and liabilities included the following (dollars in millions):
| As of December 31, 2012 | As of December 31, 2011 | |||||||
Deferred tax assets: | ||||||||
Inventories | $ | 4.0 | $ | 3.7 | ||||
Warranty accrual | 39.2 | 38.8 | ||||||
Sales allowances and rebates | 8.0 | 9.9 | ||||||
Deferred revenue | 24.2 | 22.8 | ||||||
Post-retirement health care | 8.0 | 13.3 | ||||||
Intangibles | 112.4 | 97.8 | ||||||
Other accrued liabilities | 22.0 | 30.2 | ||||||
Unrealized loss on interest rate derivatives | 20.0 | 29.6 | ||||||
Trade name | — | 1.8 | ||||||
Operating loss carryforwards | 145.3 | 158.1 | ||||||
Stock based compensation | 10.6 | 12.1 | ||||||
Technology-related investments | 4.4 | — | ||||||
Loan fees | 1.5 | — | ||||||
Pension | 5.6 | 8.6 | ||||||
Other | 13.9 | 13.8 | ||||||
|
|
|
| |||||
Total Deferred tax assets | 419.1 | 440.5 | ||||||
|
|
|
| |||||
Valuation allowances | (1.7 | ) | (390.9 | ) | ||||
|
|
|
| |||||
Deferred tax liabilities: | ||||||||
Property, plant and equipment | (25.8 | ) | (25.8 | ) | ||||
Loan fees | — | (1.6 | ) | |||||
Goodwill | (261.1 | ) | (211.4 | ) | ||||
Trade name | (29.3 | ) | — | |||||
Product warranty liabilities | (10.6 | ) | (13.7 | ) | ||||
Other comprehensive income | — | (1.7 | ) | |||||
Other liabilities | (3.1 | ) | (6.2 | ) | ||||
|
|
|
| |||||
Total Deferred tax liabilities | (329.9 | ) | (260.4 | ) | ||||
|
|
|
| |||||
Net Deferred tax asset (liability) | $ | 87.5 | $ | (210.8 | ) | |||
|
|
|
| |||||
The following deferred tax balances are included in the Consolidated Balance Sheets (dollars in millions):
| As of December 31, 2012 | As of December 31, 2011 | |||||||
Current deferred tax assets | $ | 55.3 | $ | 3.4 | ||||
Non-current deferred tax assets | 32.3 | 0.8 | ||||||
Current deferred tax liabilities | — | (0.8 | ) | |||||
Non-current deferred tax liabilities | (0.1 | ) | (214.2 | ) | ||||
|
|
|
| |||||
Net Deferred tax asset (liability) | $ | 87.5 | $ | (210.8 | ) | |||
|
|
|
| |||||
Of the estimated net operating loss carryforwards as of December 31, 2012, approximately 87% relates to U.S. federal net operating loss carryforwards and approximately 6% relates to the U.S. state net operating loss carryforwards. Substantially all U.S. Federal and State operating loss carryforwards will not expire until 2027-2031. Should either of our Sponsors sell a significant portion of their holdings, the Company may experience a delay in its ability to recognize net operating losses under Internal Revenue Code 382.
Management has determined, based on the evaluation of both objective and subjective evidence available, that the domestic valuation allowance is no longer necessary and that it is more likely than not that the deferred tax assets are fully realizable. Accordingly, the Company has recognized an income tax benefit as a result of the release of the valuation allowance which had previously been recorded against the deferred tax assets. The Company continues to provide for a valuation allowance on certain of its foreign deferred tax assets. The change in the valuation allowance and related considerations are as follows (dollars in millions):
December 31, 2009 | $ | 366.5 | ||
Additions | 35.4 | |||
December 31, 2010 | $ | 401.9 | ||
Reductions | (11.0 | ) | ||
December 31, 2011 | $ | 390.9 | ||
Reductions | (390.6 | ) | ||
Additions | 1.4 | |||
|
| |||
December 31, 2012 | $ | 1.7 | ||
|
|
In accordance with the FASB’s authoritative guidance on accounting for uncertainty in income taxes, the Company had nohas recorded a liability for unrecognized tax benefits for the years ended December 31, 2012, 2011 and 2010.related to a 2010 Research & Development Credit. The accounting guidance prescribes a recognition threshold and measurement attributes for the financial statement recognition and measurement of a tax position taken or expected to be taken in a tax return. AllFor the year ended December 31, 2015, all of the company’s returns (when filed) will remain subject to examination by the various taxing authorities for the duration of the applicable statute of limitations (generally three years from the earlierlater of the date of filing or the due date of the return). The change in the liability for unrecognized tax benefits are as follows (dollars in millions):
December 31, 2013 | $ | 2.3 | ||
December 31, 2014 | $ | 2.5 | ||
Increases in unrecognized tax benefits as a result of current year activity | — | |||
|
| |||
December 31, 2015 | $ | 2.5 | ||
|
| |||
For the years ended December 31, 2012, 20112015, 2014 and 2010,2013, the Company recognized no interest and penalties in the Consolidated Statements of Comprehensive Income (Loss) because no uncertain tax positions were identified.Income. The Company follows a policy of recording any tax related interest or penalties in Income tax expense.
In December 2011, the Treasury Department and the Internal Revenue Service issued temporary and proposed regulations that provide guidance with respect to the treatment
| NOTE 16. | OTHER COMPREHENSIVE LOSS |
The changes in components of materials and supplies andaccumulated other tangible personal property. These temporary Regulations were generally effective for taxable years beginning on or after January 1, 2012. In December 2012, these temporary regulations were amended, extending the applicability datecomprehensive loss consisted of the Temporary Regulations to taxable years beginning on or after January 1, 2014. As of December 31, 2012, the Company is in the process of completing an assessment of the impact to the consolidated financial statements.
NOTE 15. COMPREHENSIVE INCOME (LOSS)
The Company’s comprehensive income (loss) consists of unrealized net gains and losses on the translation of the assets and liabilities of its foreign operations, available-for-sale securities, and pension and OPEB liability adjustments. The following table reconciles net income to comprehensive income (loss) with the related tax effects (dollars in millions):
| Before Tax | Tax (Expense) Benefit | After Tax | ||||||||||
Balance at December 31, 2012 | $ | (9.2 | ) | $ | (34.7 | ) | $ | (43.9 | ) | |||
Foreign currency translation | (5.0 | ) | — | (5.0 | ) | |||||||
Pension and OPEB liability adjustment | 46.4 | (17.4 | ) | 29.0 | ||||||||
Available-for-sale securities | (1.9 | ) | 0.8 | (1.1 | ) | |||||||
|
|
|
|
|
| |||||||
Net current period other comprehensive income | $ | 39.5 | $ | (16.6 | ) | $ | 22.9 | |||||
|
|
|
|
|
| |||||||
Balance at December 31, 2013 | $ | 30.3 | $ | (51.3 | ) | $ | (21.0 | ) | ||||
Foreign currency translation | (7.4 | ) | — | (7.4 | ) | |||||||
Pension and OPEB liability adjustment | (14.6 | ) | 5.5 | (9.1 | ) | |||||||
Available-for-sale securities | (3.2 | ) | 1.2 | (2.0 | ) | |||||||
|
|
|
|
|
| |||||||
Net current period other comprehensive loss | $ | (25.2 | ) | $ | 6.7 | $ | (18.5 | ) | ||||
|
|
|
|
|
| |||||||
Balance at December 31, 2014 | $ | 5.1 | $ | (44.6 | ) | $ | (39.5 | ) | ||||
Foreign currency translation | (11.5 | ) | — | (11.5 | ) | |||||||
Pension and OPEB liability adjustment | (3.4 | ) | 0.4 | (3.0 | ) | |||||||
Available-for-sale securities | (7.6 | ) | 2.8 | (4.8 | ) | |||||||
|
|
|
|
|
| |||||||
Net current period other comprehensive loss | $ | (22.5 | ) | $ | 3.2 | $ | (19.3 | ) | ||||
| Balance at December 31, 2015 | $ | (17.4 | ) | $ | (41.4 | ) | $ | (58.8 | ) | |||
The following table shows the location in the Consolidated Statements of Comprehensive Income (Loss)affected by reclassifications from AOCL (dollars in millions):
| Before Tax | Tax (Expense) Benefit | After Tax | ||||||||||
Year ended December 31, 2010 | ||||||||||||
Net income | $ | 83.3 | $ | (53.7 | ) | $ | 29.6 | |||||
Foreign currency translation | 0.1 | — | 0.1 | |||||||||
Pension and OPEB liability adjustment | (31.8 | ) | (0.1 | ) | (31.9 | ) | ||||||
Available-for-sale securities | (1.2 | ) | — | (1.2 | ) | |||||||
|
|
|
|
|
| |||||||
Total comprehensive loss | $ | 50.4 | $ | (53.8 | ) | $ | (3.4 | ) | ||||
|
|
|
|
|
| |||||||
Year ended December 31, 2011 | ||||||||||||
Net income | $ | 150.6 | $ | (47.6 | ) | $ | 103.0 | |||||
Foreign currency translation | (11.6 | ) | — | (11.6 | ) | |||||||
Pension and OPEB liability adjustment | (22.6 | ) | — | (22.6 | ) | |||||||
Available-for-sale securities | 3.2 | — | 3.2 | |||||||||
|
|
|
|
|
| |||||||
Total comprehensive income | $ | 119.6 | $ | (47.6 | ) | $ | 72.0 | |||||
|
|
|
|
|
| |||||||
Year ended December 31, 2012 | ||||||||||||
Net income | $ | 216.2 | $ | 298.0 | $ | 514.2 | ||||||
Foreign currency translation | (0.7 | ) | — | (0.7 | ) | |||||||
Pension and OPEB liability adjustment | 26.7 | (11.6 | ) | 15.1 | ||||||||
Available-for-sale securities | (2.0 | ) | 0.7 | (1.3 | ) | |||||||
|
|
|
|
|
| |||||||
Total comprehensive income | $ | 240.2 | $ | 287.1 | $ | 527.3 | ||||||
|
|
|
|
|
| |||||||
| For the year ended December 31, 2015 | ||||||
| AOCL Components | Amount reclassified from AOCL | Affected line item in the consolidated statements of comprehensive income | ||||
Amortization of defined benefit pension items: | ||||||
Prior service cost | $ | 3.2 | Cost of sales | |||
| 0.2 | Selling, general and administrative | |||||
| 0.1 | Engineering – research and development | |||||
Actuarial loss | 0.1 | Cost of sales | ||||
| 0.0 | Selling, general and administrative | |||||
| 0.0 | Engineering – research and development | |||||
|
| |||||
Total reclassifications, before tax | 3.6 | Income before income taxes | ||||
Income tax expense | (1.3 | ) | Tax expense | |||
|
| |||||
Total reclassifications | $ | 2.3 | Net of tax | |||
|
| |||||
Prior service cost and actuarial loss are included in the computation of the Company’s net periodic benefit cost. Please see NOTE 13 for additional details.
| NOTE 17. | COMMITMENTS AND CONTINGENCIES |
NOTE 16. COMMITMENTS AND CONTINGENCIES
Operating Leases
The Company leases certain facilities under various operating leases. Rent expense under the non-cancelable operating leases was $5.5$5.1 million, $6.6$5.4 million, and $8.2$5.7 million for the years ended December 31, 2012, 20112015, 2014 and 2010,2013, respectively. Certain leases contain renewal options.
As of December 31, 2012,2015, future payments under non-cancelable operating leases with a remaining term greater than one year are as follows over each of the next five years and thereafter (dollars in millions):
2013 | $ | 3.9 | ||||||
2014 | 1.6 | |||||||
2015 | 0.7 | |||||||
2016 | 0.2 | $ | 4.7 | |||||
2017 | 0.0 | 3.3 | ||||||
2018 | 2.1 | |||||||
2019 | 1.4 | |||||||
2020 | 1.3 | |||||||
Thereafter | 0.0 | 2.0 | ||||||
|
| |||||||
Total | $ | 6.4 | $ | 14.8 | ||||
|
| |||||||
Environmental Matters
Under the asset purchase agreement with Old GM, Old GM agreed to indemnify the Company against certain environmental liabilities, including pre-acquisition offsite waste disposal from the Company’s facilities, former facilities associated with the business and any properties or facilities relating to the business that Old GM retained. While the Company is responsible for environmental liabilities that arise due to post-acquisition activities, GM, as successor to Old GM’s obligations, has continued to perform remedial activities at the Company’s Indianapolis, Indiana manufacturing facilities relating to historical soil and groundwater contamination at the facilities. GM’s activities are referred to as the “Corrective Action” plan, pursuant to the asset purchase agreement, whereby it retained responsibility for completing all obligations covered by a voluntary Corrective Action Agreement that Old GM entered with the U.S. Environmental Protection Agency (“EPA”). By operation of the asset purchase agreement, once the EPA issues a final decision on GM’s activities under the Corrective Action Plan, the Company assumes all responsibility for operating, monitoring and maintaining the ongoing corrective action and GM’s indemnification obligations cease.
During the third quarter of 2015, the EPA determined that GM’s remedial activities were complete and that the migration of any contamination is under control, and published a public notice seeking comment on a draft final decision, the issuance of which would result in the Company assuming responsibility for operating, monitoring and maintaining the ongoing Corrective Action activities through an agreed order of consent (“AOC”) with the EPA.
As a result of the publishing of the draft final decision, the Company has determined that appropriate liabilities for the operating, monitoring and maintaining the ongoing remedial activities can be reasonably estimated. As of September 30, 2015, the Company recorded approximately $14.0 million for the estimated undiscounted liabilities to be paid out over the next 30 years, including approximately $0.5 million recorded to Other current liabilities and approximately $13.5 million to Other non-current liabilities. The recorded liabilities will be adjusted periodically as remediation efforts progress or as additional technical, regulatory or legal information becomes available. The Company expects to fund the expenditures for these activities from operating cash flow.
On January 27, 2016, the EPA issued a final decision. With the AOC, financial assurance is required by the EPA to complete the operation, monitoring and maintenance activities in the event the Company fails to do so. This financial assurance can take a variety of forms including, but not limited to meeting certain financial metrics, providing a letter of credit, or securing a bond or an insurance policy. The amount and method by which the Company will be required to provide financial assurance is expected to be determined in 2016.
Claims, Disputes, and Litigation
The Company is party to various legal actions and administrative proceedings and subject to various claims arising in the ordinary course of business. These proceedings primarily involve commercial claims, product liability claims, personal injury claims and workers’ compensation claims. The Company believes that the ultimate liability, if any, in excess of amounts already provided for in the consolidated financial statements or covered by insurance on the disposition of these matters will not have a material adverse effect on the financial position, results of operations or cash flows of the Company.
NOTE 17. CONCENTRATION OF RISK
| NOTE 18. | CONCENTRATION OF RISK |
As of December 31, 20122015 and 2011,2014, the Company employed approximately 2,8002,700 employees with 90% of those employees in the U.S. Approximately 60% of the Company’s U.S. employees were represented by unions and subject to a collective bargaining agreement as of December 31, 20122015 and 2011.2014. In addition, many of the hourly employees outside the U.S. are represented by various unions. The Company is currently operating under a collective bargaining agreement with the UAW Local 933 that expires in November 2017.
Three customers accounted for greater than 10% of net sales within the last three years presented.
| Year ended December 31, | Years ended December 31, | |||||||||||||||||||||||
| % of Net sales | 2012 | 2011 | 2010 | |||||||||||||||||||||
| % of net sales | 2015 | 2014 | 2013 | |||||||||||||||||||||
Daimler AG | 13 | % | 10 | % | 10 | % | 21 | % | 17 | % | 17 | % | ||||||||||||
Navistar, Inc. | 11 | % | 12 | % | 11 | % | 10 | % | 10 | % | 10 | % | ||||||||||||
Oshkosh Corporation | 11 | % | 8 | % | 9 | % | ||||||||||||||||||
Volvo Group | 10 | % | 8 | % | 6 | % | ||||||||||||||||||
No other customers accounted for more than 10% of net sales of the Company during the years ended December 31, 2012, 2011 and 2010.2015, 2014 or 2013.
Two customers accounted for greater than 10% of outstanding Accountsaccounts receivable within the last two years presented.
| % of Accounts receivable | As of December 31, 2012 | As of December 31, 2011 | ||||||||||||||
| % of accounts receivable | As of December 31, 2015 | As of December 31, 2014 | ||||||||||||||
Daimler AG | 24 | % | 15 | % | ||||||||||||
Navistar, Inc. | 13 | % | 10 | % | 8 | % | 12 | % | ||||||||
Daimler AG | 10 | % | 9 | % | ||||||||||||
No other customers accounted for more than 10% of the outstanding Accountsaccounts receivable as of December 31, 20122015 or December 31, 2011.2014.
One supplier accounted for greater than 10% of materials purchased for the periods presented:
| Year ended December 31, | Years ended December 31, | |||||||||||||||||||||||
| % of material purchased | 2012 | 2011 | 2010 | 2015 | 2014 | 2013 | ||||||||||||||||||
Linamar Corporation Inc. | 13 | % | 12 | % | 13 | % | 8 | % | 10 | % | 13 | % | ||||||||||||
No other supplier accounted for more than 10% of material purchasesmaterials purchased during the years ended December 31, 2012, 2011 and 2010.2015, 2014 or 2013.
| NOTE 19. | CERTAIN RELATIONSHIPS AND RELATED PARTY TRANSACTIONS |
NOTE 18. CERTAIN RELATIONSHIPS AND RELATED PARTY TRANSACTIONS
On August 7, 2007, the Sponsors entered into a services agreement with ATI, pursuant to which ATI paid the Sponsors an annual fee of $3.0 million (shared equally by the Sponsors) for certain advisory, consulting and other services to be performed by the Sponsors, exclusive of the reimbursements for certain out-of-pocket expenses incurred in connection with the performance of such services, and additional reasonable compensation for other services provided by the Sponsors from time to time, including consulting and other services with respect to acquisitions and divestitures or sales of equity or debt instruments. For the years ended December 31, 2012, 2011 and 2010, the Sponsors did not provide any additional services beyond the customary services. In March 2012, the Company and the Sponsors agreed to terminate the services agreement. The Company agreed to make a one-time termination payment of $16.0 million, representing the present value of payments over the estimated term of the services agreement.
Senior Notes Held by Executive Officers
AsIn May 2015, the Company redeemed $100,000 and $450,000 of December 31, 2012,ATI’s 7.125% Senior Notes held by Lawrence E. Dewey, our Chairman President and Chief Executive Officer, and David S. Graziosi, our Executive Vice President, Chief Financial Officer and Treasurer, and Robert M. Price, our Vice President, Human Resources, held approximately $100,000, $450,000, and $150,000, respectively, at the specified redemption price in aggregatethe governing indenture equal to 103.563% of the principal amount plus any accrued and unpaid interest. Refer to NOTE 7 for additional details.
Repurchase of Common Stock held by Sponsors
During 2014, the Company completed four secondary public offerings in September, June, April and February of 5,392,499, 40,250,000, 25,000,000, and 28,750,000 shares of its common stock held by investment funds affiliated with the Carlyle Group and Onex Corporation (collectively, the Sponsors”) at public offering prices, less underwriting discounts and commissions, of $30.46, $29.95, $29.78 and $29.17 per share, respectively. In connection with certain of the 7.125% Senior Notes.
| NOTE 20. | COMMON STOCK |
NOTE 19. EARNINGS PER SHAREThe Company’s current stock repurchase program was announced on October 30, 2014. The Board authorized management to repurchase up to $500.0 million of its common stock on the open market or through privately negotiated transactions through December 31, 2016. The timing and amount of stock purchases are subject to market conditions and corporate needs. This stock repurchase program may be extended, modified, suspended or discontinued at any time at the Board’s discretion. During 2015, the Company repurchased approximately $305.8 million of its common stock under the repurchase program. All of the repurchase transactions during the fourth quarter of 2015 were settled in cash during the same period.
| NOTE 21. | EARNINGS PER SHARE |
The Company presents both basic and diluted earnings per share (“EPS”) amounts. Basic EPS is calculated by dividing net income by the weighted average number of common shares outstanding during the reporting period. Diluted EPS is calculated by dividing net income by the weighted average number of common shares and common equivalent shares outstanding during the reporting period that are calculated using the treasury stock method for stock-based awards. The treasury stock method assumes that the Company uses the proceeds from the exercise of awards to repurchase common stock at the average market price during the period. The assumed proceeds under the treasury stock method include the purchase price that the grantee will pay in the future, compensation cost for future service that the Company has not yet recognized and any tax benefits that would be credited to additional paid-in-capital when the award generates a tax deduction. If there would be a shortfall resulting in a charge to additional paid-in-capital, such an amount would be a reduction of the proceeds to the extent of the gains. ForThe diluted weighted-average common shares outstanding exclude the year endedanti-dilutive effect of certain stock options since such options had an exercise price in excess of the monthly average market value of our common stock. As of December 31, 2010,2015, the Company had 0.7 million shares of outstanding anti-dilutive stock options were not included in the diluted EPS computation because they were anti-dilutive.options.
The following table reconciles the numerators and denominators used to calculate basic EPS and diluted EPS (in millions, except per share data):
| Year ended December 31, | Years ended December 31, | |||||||||||||||||||||||
| 2012 | 2011 | 2010 | 2015 | 2014 | 2013 | |||||||||||||||||||
Net income | $ | 514.2 | $ | 103.0 | $ | 29.6 | $ | 182.3 | $ | 228.6 | $ | 165.4 | ||||||||||||
|
|
|
|
|
| |||||||||||||||||||
Weighted average shares of common stock outstanding | 182.0 | 181.4 | 181.4 | 175.9 | 179.8 | 184.5 | ||||||||||||||||||
Dilutive effect stock-based awards | 4.2 | 1.9 | — | 1.3 | 2.5 | 3.4 | ||||||||||||||||||
|
|
|
|
|
| |||||||||||||||||||
Diluted weighted average shares of common stock outstanding | 186.2 | 183.3 | 181.4 | 177.2 | 182.3 | 187.9 | ||||||||||||||||||
|
|
|
|
|
| |||||||||||||||||||
Basic earnings per share attributable to common stockholders | $ | 2.83 | $ | 0.57 | $ | 0.16 | $ | 1.03 | $ | 1.27 | $ | 0.90 | ||||||||||||
|
|
|
|
|
| |||||||||||||||||||
Diluted earnings per share attributable to common stockholders | $ | 2.76 | $ | 0.56 | $ | 0.16 | $ | 1.03 | $ | 1.25 | $ | 0.88 | ||||||||||||
|
|
|
|
|
| |||||||||||||||||||
NOTE 20. GEOGRAPHIC INFORMATION
| NOTE 22. | GEOGRAPHIC INFORMATION |
The Company had the following Netnet sales by country as follows (dollars in millions):
| Year ended December 31, | Years ended December 31, | |||||||||||||||||||||||
| 2012 | 2011 | 2010 | 2015 | 2014 | 2013 | |||||||||||||||||||
United States | $ | 1,509.6 | $ | 1,532.7 | $ | 1,411.0 | $ | 1,459.8 | $ | 1,578.0 | $ | 1,354.3 | ||||||||||||
Canada | 95.5 | 85.1 | 88.6 | |||||||||||||||||||||
China | 136.4 | 93.3 | 67.3 | 63.9 | 128.7 | 141.0 | ||||||||||||||||||
Canada | 123.0 | 165.6 | 133.1 | |||||||||||||||||||||
Japan | 48.7 | 45.8 | 37.0 | |||||||||||||||||||||
United Kingdom | 74.1 | 58.2 | 49.0 | 44.0 | 36.8 | 42.5 | ||||||||||||||||||
Japan | 52.0 | 46.5 | 33.7 | |||||||||||||||||||||
Germany | 39.1 | 42.9 | 33.9 | 39.6 | 38.1 | 53.9 | ||||||||||||||||||
India | 6.9 | 7.9 | 24.6 | |||||||||||||||||||||
Other | 200.7 | 215.7 | 173.7 | 234.3 | 214.9 | 209.5 | ||||||||||||||||||
|
|
|
|
|
| |||||||||||||||||||
Total | $ | 2,141.8 | $ | 2,162.8 | $ | 1,926.3 | $ | 1,985.8 | $ | 2,127.4 | $ | 1,926.8 | ||||||||||||
|
|
|
|
|
| |||||||||||||||||||
The Company had net long-lived assets by country as follows (dollars in millions):
| Year ended December 31, | Years ended December 31, | |||||||||||||||||||||||
| 2012 | 2011 | 2010 | 2015 | 2014 | 2013 | |||||||||||||||||||
United States | $ | 493.6 | $ | 492.5 | $ | 523.1 | $ | 419.2 | $ | 442.6 | $ | 478.7 | ||||||||||||
India | 76.8 | 62.1 | 54.0 | 43.2 | 51.5 | 59.9 | ||||||||||||||||||
Hungary | 18.4 | 18.3 | 4.2 | 12.5 | 15.1 | 18.1 | ||||||||||||||||||
Netherlands | 1.2 | 1.7 | 7.1 | |||||||||||||||||||||
Others | 6.2 | 7.2 | 6.9 | 4.8 | 5.4 | 6.7 | ||||||||||||||||||
|
|
|
|
|
| |||||||||||||||||||
Total | $ | 596.2 | $ | 581.8 | $ | 595.3 | $ | 479.7 | $ | 514.6 | $ | 563.4 | ||||||||||||
|
|
|
|
|
| |||||||||||||||||||
NOTE 21. QUARTERLY FINANCIAL INFORMATION
| NOTE 23. | QUARTERLY FINANCIAL INFORMATION |
The following is a summary of the unaudited quarterly results of operations. The Company believes that all adjustments considered necessary for a fair presentation in accordance with GAAP have been included (unaudited, in millions, except per share data).
| Quarter ended, | Quarters ended, | |||||||||||||||||||||||||||||||
| March 31 | June 30 | September 30 | December 31 | March 31 | June 30 | September 30 | December 31 | |||||||||||||||||||||||||
2012 | ||||||||||||||||||||||||||||||||
2015 | ||||||||||||||||||||||||||||||||
Net sales | $ | 601.9 | $ | 559.4 | $ | 493.5 | $ | 487.0 | $ | 503.6 | $ | 511.0 | $ | 493.0 | $ | 478.2 | ||||||||||||||||
Gross profit | 283.8 | 251.9 | 224.4 | 194.2 | 239.2 | 236.3 | 236.1 | 222.2 | ||||||||||||||||||||||||
Operating income | 154.7 | 119.6 | 91.8 | 54.1 | 142.3 | 137.5 | 111.9 | 37.2 | ||||||||||||||||||||||||
Income before income taxes | 83.2 | 62.7 | 49.2 | 21.1 | 108.2 | 87.1 | 73.8 | 19.7 | ||||||||||||||||||||||||
Net income | 58.0 | 412.8 | 32.2 | 11.2 | 68.4 | 54.4 | 46.5 | 13.0 | ||||||||||||||||||||||||
Basic earnings per share | $ | 0.32 | $ | 2.28 | $ | 0.18 | $ | 0.06 | $ | 0.38 | $ | 0.30 | $ | 0.27 | $ | 0.08 | ||||||||||||||||
Diluted earnings per share | $ | 0.31 | $ | 2.21 | $ | 0.17 | $ | 0.06 | $ | 0.38 | $ | 0.30 | $ | 0.27 | $ | 0.08 | ||||||||||||||||
2011 | ||||||||||||||||||||||||||||||||
2014 | ||||||||||||||||||||||||||||||||
Net sales | $ | 517.0 | $ | 555.7 | $ | 574.0 | $ | 516.1 | $ | 493.6 | $ | 536.1 | $ | 553.3 | $ | 544.4 | ||||||||||||||||
Gross profit | 230.0 | 244.5 | 257.6 | 222.4 | 222.5 | 238.5 | 259.3 | 255.6 | ||||||||||||||||||||||||
Operating income | 98.8 | 119.6 | 124.1 | 86.5 | 114.8 | 132.2 | 147.3 | 117.8 | ||||||||||||||||||||||||
Income (loss) before income taxes | 54.9 | (11.2 | ) | 57.1 | 49.8 | |||||||||||||||||||||||||||
Net income (loss) | 36.9 | (17.2 | ) | 38.8 | 44.5 | |||||||||||||||||||||||||||
Basic earnings (loss) per share | $ | 0.20 | $ | (0.09 | ) | $ | 0.21 | $ | 0.25 | |||||||||||||||||||||||
Diluted earnings (loss) per share | $ | 0.20 | $ | (0.09 | ) | $ | 0.21 | $ | 0.24 | |||||||||||||||||||||||
Income before income taxes | 79.3 | 94.7 | 116.3 | 77.8 | ||||||||||||||||||||||||||||
Net income | 52.1 | 57.2 | 68.8 | 50.5 | ||||||||||||||||||||||||||||
Basic earnings per share | $ | 0.29 | $ | 0.32 | $ | 0.38 | $ | 0.28 | ||||||||||||||||||||||||
Diluted earnings per share | $ | 0.28 | $ | 0.31 | $ | 0.38 | $ | 0.28 | ||||||||||||||||||||||||
The Company’s 2012 and 20112015 quarterly results were affected by certain nonrecurring items. InFor the quarter ended June 30, 2012,December 31, 2015, the Company recorded an income tax benefit$80.0 million of $384.8 million related to the releasetrade name impairment charge as a result of lower forecasted net sales for certain of the Company’s valuation allowance against its deferred tax asset. In the quarter ended June 30, 2011, the Company recorded $56.9 of premiums and expenses related to the tender offer for our Senior Toggle Notes as discussed in NOTE 7.
NOTE 22. SUBSEQUENT EVENTS
On February 6, 2013, the Company completed an extension and refinance of the Senior Secured Credit Facility replacing $411.4 million of Term B-1 loans due 2014 and $793.1 million of Term B-2 loans due 2017 for term loan debt due August 2017 with an interest rate margin at ATI’s option, either (a) 3.00% above the London Interbank Offered Rate or (b) 2.00% above the greater of the prime lending rate provided by the British Banking Association or the federal funds effective rate published by the Federal Reserve Bank of New York. The extension of the Term B-1 loan also extended the revolving credit facility to August 2016.end markets.
Allison Transmission Holdings, Inc.
Schedule I—Parent Company only Balance Sheets
(dollars in millions)
| December 31, 2012 | December 31, 2011 | December 31, 2015 | December 31, 2014 | |||||||||||||
ASSETS | ||||||||||||||||
Current Assets: | ||||||||||||||||
Cash | $ | 0.0 | $ | 0.0 | $ | — | $ | — | ||||||||
|
|
|
| |||||||||||||
Total Current Assets | 0.0 | 0.0 | — | — | ||||||||||||
Investments in and advances to subsidiaries | 1,356.9 | 821.7 | 1,188.6 | 1,397.8 | ||||||||||||
|
|
|
| |||||||||||||
TOTAL ASSETS | $ | 1,356.9 | $ | 821.7 | $ | 1,188.6 | $ | 1,397.8 | ||||||||
|
|
|
| |||||||||||||
LIABILITIES AND STOCKHOLDERS’ EQUITY | ||||||||||||||||
Current Liabilities: | ||||||||||||||||
Accounts payable | $ | 0.0 | $ | 0.0 | $ | — | $ | — | ||||||||
|
|
|
| |||||||||||||
Total Current Liabilities | 0.0 | 0.0 | — | — | ||||||||||||
Capital stock | 1.8 | 1.8 | 1.7 | 1.8 | ||||||||||||
Additional paid-in-capital | 1,601.5 | 1,560.8 | 1,690.2 | 1,651.0 | ||||||||||||
Treasury stock | (0.2 | ) | (0.2 | ) | — | — | ||||||||||
Accumulated deficit | (202.3 | ) | (683.7 | ) | (444.5 | ) | (215.5 | ) | ||||||||
Accumulated other comprehensive (loss) income, net of tax | (43.9 | ) | (57.0 | ) | ||||||||||||
Accumulated other comprehensive loss, net of tax | (58.8 | ) | (39.5 | ) | ||||||||||||
|
|
|
| |||||||||||||
TOTAL LIABILITIES AND STOCKHOLDERS’ EQUITY | $ | 1,356.9 | $ | 821.7 | $ | 1,188.6 | $ | 1,397.8 | ||||||||
|
|
| �� |
| ||||||||||||
The accompanying note is an integral part of the Parent Company only financial statements.
Allison Transmission Holdings, Inc.
Schedule I—Parent Company only Statements of Comprehensive Income
(dollars in millions)
| Year ended December 31, | Years ended December 31, | |||||||||||||||||||||||
| 2012 | 2011 | 2010 | 2015 | 2014 | 2013 | |||||||||||||||||||
Net sales | $ | 0.0 | $ | 0.0 | $ | 0.0 | $ | — | $ | — | $ | — | ||||||||||||
General and administrative fees | 0.0 | 0.0 | 0.0 | — | — | — | ||||||||||||||||||
|
|
|
|
|
| |||||||||||||||||||
Total operating income | 0.0 | 0.0 | 0.0 | — | — | — | ||||||||||||||||||
|
|
|
|
|
| |||||||||||||||||||
Other income: | ||||||||||||||||||||||||
Equity earnings of consolidated subsidiary | 514.2 | 103.0 | 29.6 | 182.3 | 228.6 | 165.4 | ||||||||||||||||||
|
|
|
|
|
| |||||||||||||||||||
Income before income taxes | 514.2 | 103.0 | 29.6 | 182.3 | 228.6 | 165.4 | ||||||||||||||||||
Income tax expense | 0.0 | 0.0 | 0.0 | — | — | — | ||||||||||||||||||
|
|
|
|
|
| |||||||||||||||||||
Net income | $ | 514.2 | $ | 103.0 | $ | 29.6 | $ | 182.3 | $ | 228.6 | $ | 165.4 | ||||||||||||
|
|
|
|
|
| |||||||||||||||||||
Comprehensive income | $ | 514.2 | $ | 103.0 | $ | 29.6 | $ | 182.3 | $ | 228.6 | $ | 165.4 | ||||||||||||
|
|
|
|
|
| |||||||||||||||||||
The accompanying note is an integral part of the Parent Company only financial statements.
Allison Transmission Holdings, Inc.
Schedule I—Parent Company only Statements of Cash Flows
(dollars in millions)
| Year ended December 31, | Years ended December 31, | |||||||||||||||||||||||
| 2012 | 2011 | 2010 | 2015 | 2014 | 2013 | |||||||||||||||||||
CASH FLOWS FROM OPERATING ACTIVITIES: | ||||||||||||||||||||||||
Net income | $ | 514.2 | $ | 103.0 | $ | 29.6 | $ | 182.3 | $ | 228.6 | $ | 165.4 | ||||||||||||
Deduct items included in net income not providing cash: | ||||||||||||||||||||||||
Equity in earnings in consolidated subsidiary | (514.2 | ) | (103.0 | ) | (29.6 | ) | (182.3 | ) | (228.6 | ) | (165.4 | ) | ||||||||||||
|
|
|
|
|
| |||||||||||||||||||
Net cash provided by operating activities | — | — | — | — | — | — | ||||||||||||||||||
|
|
|
|
|
| |||||||||||||||||||
CASH FLOWS FROM INVESTING ACTIVITIES: | ||||||||||||||||||||||||
Investments in subsidiaries | (29.0 | ) | — | (0.1 | ) | (22.9 | ) | (59.6 | ) | (46.3 | ) | |||||||||||||
Dividends | 32.8 | — | (0.1 | ) | 105.6 | 91.6 | 77.1 | |||||||||||||||||
|
|
|
|
|
| |||||||||||||||||||
Net cash provided by (used in) investing activities | 3.8 | — | (0.1 | ) | ||||||||||||||||||||
Net cash provided by investing activities | 82.7 | 32.0 | 30.8 | |||||||||||||||||||||
|
|
|
|
|
| |||||||||||||||||||
CASH FLOWS FROM FINANCING ACTIVITIES: | ||||||||||||||||||||||||
Capital contributions | 29.0 | — | 0.1 | 22.9 | 59.6 | 46.3 | ||||||||||||||||||
Dividends | (32.8 | ) | — | — | (105.6 | ) | (91.6 | ) | (77.1 | ) | ||||||||||||||
|
|
|
|
|
| |||||||||||||||||||
Net cash (used in) provided by financing activities | (3.8 | ) | — | 0.1 | ||||||||||||||||||||
Net cash used in financing activities | (82.7 | ) | (32.0 | ) | (30.8 | ) | ||||||||||||||||||
|
|
|
|
|
| |||||||||||||||||||
Net increase (decrease) during period | — | — | — | — | — | — | ||||||||||||||||||
Cash and cash equivalents at beginning of period | — | — | — | — | — | — | ||||||||||||||||||
|
|
|
|
|
| |||||||||||||||||||
Cash and cash equivalents at end of period | $ | — | $ | — | $ | — | $ | — | $ | — | $ | — | ||||||||||||
|
|
|
|
|
| |||||||||||||||||||
The accompanying note is an integral part of the Parent Company only financial statements.
Allison Transmission Holdings, Inc.
Schedule I—Parent Company only Footnote
NOTE 1—BASIS OF PRESENTATION
Allison Transmission Holdings, Inc. (the “Parent Company”) is a holding company that conducts all of its business operations through its subsidiaries. There are restrictions on the Parent Company’s ability to obtain funds from its subsidiaries through dividends (refer to NOTE 7 to ourof the Consolidated Financial Statements). The entire amount of our consolidated net assets was subject to restrictions on payment of dividends at the end of December 31, 20122015, 2014 and 2011.2013. Accordingly, these financial statements have been presented on a “parent-only” basis. Under a parent-only presentation, the Parent Company’s investments in its consolidated subsidiaries are presented under the equity method of accounting. These parent-only financial statements should be read in conjunction with Allison Transmission Holdings, Inc.’s audited Consolidated Financial Statements included elsewhere herein.
| ITEM 9. | Changes in and Disagreements |
None.
ITEM 9A. Controls and Procedures
Evaluation of Disclosure Controls and Procedures
Our management, with the participation of our chief executive officerChief Executive Officer and chief financial officer,Chief Financial Officer, evaluated the effectiveness of our disclosure controls and procedures (as defined in Rules 13a-15(e) orand 15d-15(e) under the Exchange Act), as of the end of the period covered by this report.December 31, 2015. In designing and evaluating the disclosure controls and procedures, management recognized that any controls and procedures, no matter how well designed and operated, can provide only reasonable assurance of achieving the desired control objectives. In addition, the design of disclosure controls and procedures must reflect the fact that there are resource constraints and that management is required to apply its judgment in evaluating the benefits of possible controls and procedures relative to their costs.
Based on thatthe evaluation, our chief executive officerChief Executive Officer and chief financial officerChief Financial Officer concluded that our disclosure controls and procedures as of December 31, 2015, the end of the period covered by this Annual Report on Form 10-K, were effective to provide reasonable assurance that information we are required to disclose in reports that we file or submit under the Exchange Act is recorded, processed, summarized and reported within the time periods specified in the Securities and Exchange Commission rules and forms, and that such information is accumulated and communicated to our management, including our chief executive officerChief Executive Officer and chief financial officer,Chief Financial Officer, as appropriate, to allow timely decisions regarding required disclosure.
Management’s Report on Internal Control Over Financial Reporting
Our management is responsible for establishing and maintaining adequate internal control over financial reporting (as defined in Rules 13a-15(f) and 15d-15(f) under the Exchange Act). Our internal control over financial reporting is a process designed to provide reasonable assurance regarding the reliability of financial reporting and the preparation of financial statements for external purposes in accordance with generally accepted accounting principles.
Because of its inherent limitations, internal control over financial reporting may not prevent or detect misstatements. Also, projections of any evaluation of effectiveness to future periods are subject to the risk that controls may become inadequate because of changes in conditions, or that the degree of compliance with the policies or procedures may deteriorate.
Under the supervision and with the participation of our management, including our Chief Executive Officer and Chief Financial Officer, we conducted an assessment of the effectiveness of our internal control over financial reporting as of December 31, 2015. In making this assessment, our management used the criteria set forth by the Committee of Sponsoring Organizations of the Treadway Commission inInternal Control—Integrated Framework (2013). Based on this assessment, management concluded that our internal control over financial reporting was effective as of December 31, 2015. PricewaterhouseCoopers LLP, our independent registered public accounting firm, has audited the effectiveness of our internal control over financial reporting as of December 31, 2015. Their report is included in Part II, Item 8, “Financial Statements and Supplementary Data” in this Annual Report on Form 10-K.
Changes in Internal Control over Financial Reporting
There were no changes in our internal control over financial reporting (as defined in Rules 13a-15(f) orand 15d-15(f) under the Exchange Act) during the quarter ended December 31, 20122015 that have materially affected, or are reasonably likely to materially affect, our internal control over financial reporting.
Management’s Annual Report on Internal Control Over Financial Reporting
This annual report does not include a report of management’s assessment regarding internal control over financial reporting or an attestation report of the Company’s registered public accounting firm due to a transition period established by rules of the Securities and Exchange Commission for newly public companies.
None.
ITEM 10. Directors, Executive Officers and Corporate Governance
The information required by this Item concerning our executive officers, directors and nominees for director, Audit Committee members and financial expert(s) and disclosure of delinquent filers under Section 16(a) of the Exchange Act is incorporated herein by reference from our definitive Proxy Statement for our 20132016 annual meeting of stockholders which will be filed with the SEC pursuant to Regulation 14A within 120 days after the end of our last fiscal year.
Code of Business Conduct
We have adopted the Allison Code of Business Conduct that applies to all of our directors and officers and other employees, including our principal executive officer, principal financial officer and principal accounting officer. This code is publicly available through the Investor Relations section of our website at www.allisontransmission.com. We will post on the Investor Relations section of our website any amendment to the code of business conduct, or any grant of a waiver from a provision of the code of business conduct.
ITEM 11. Executive Compensation
The information required by this Item concerning remuneration of our executive officers and directors, material transactions involving such executive officers and directors and Compensation Committee interlocks, as well as the Compensation Committee Report, are incorporated herein by reference to our definitive Proxy Statement for our 20132016 annual meeting of stockholders which will be filed with the SEC pursuant to Regulation 14A within 120 days after the end of our last fiscal year.
ITEM 12. Security Ownership of Certain Beneficial Owners and Management and Related Stockholder Matters
The information required by this Item concerning the stock ownership of management, five percent beneficial owners and securities authorized for issuance under equity compensation plans is incorporated herein by reference to our definitive Proxy Statement for our 20132016 annual meeting of stockholders which will be filed with the SEC pursuant to Regulation 14A within 120 days after the end of our last fiscal year.
ITEM 13. Certain Relationships and Related Transactions, and Director Independence
The information required by this Item concerning certain relationships and related person transactions, and director independence is incorporated herein by reference to our definitive Proxy Statement for our 20132016 annual meeting of stockholders which will be filed with the SEC pursuant to Regulation 14A within 120 days after the end of our last fiscal year.
ITEM 14. Principal Accounting Fees and Services
The information required by this Item concerning the fees and services of our independent registered public accounting firm and our Audit Committee actions with respect thereto is incorporated herein by reference to our definitive Proxy Statement for our 20132016 annual meeting of stockholders which will be filed with the SEC pursuant to Regulation 14A within 120 days after the end of our last fiscal year.
ITEM 15. Exhibits, Financial Statement Schedules
(a)(1) Financial Statements.
The response to this item is included in Part II, Item 8, of this Annual Report on Form 10-K.
(a)(2) Financial Statement Schedules.
Schedule I is included in Part II, Item 8, of this Annual Report on Form 10-K. All other schedules arehave been omitted because they are not required or because the information required information is shownincluded in the consolidated financial statements orand notes thereto.
(a)(3) Exhibits
See the response to Item 15(b) below.
(b) Exhibits
The following exhibits are filed as part of, or are incorporated by reference into, this Annual Report on Form 10-K:
Exhibit No. | DESCRIPTION OF EXHIBIT | |
3.1 | Second Amended and Restated Certificate of Incorporation of Allison Transmission Holdings, Inc. (incorporated by reference to Exhibit 3.1 to the Registrant’s Quarterly Report on Form 10-Q for the quarter ended March 31, 2012 filed on April 26, 2012) | |
3.2 | Third Amended and Restated Bylaws of Allison Transmission Holdings, Inc. (incorporated by reference to Exhibit 3.2 to the Registrant’s Quarterly Report on Form 10-Q for the quarter ended March 31, 2012 filed on April 26, 2012) | |
4.1 | Form of Stock Certificate (incorporated by reference to Exhibit 4.1 to Amendment No. 3 to the Registrant’s Registration Statement on Form S-1 filed June 16, 2011) | |
4.2 | ||
| ||
| ||
| ||
| Indenture governing the 7.125% Senior Notes due 2019, among Allison Transmission, Inc. as Issuer, the Guarantors named therein, and Wells Fargo Bank, National Association, as trustee, dated May 6, 2011 (incorporated by reference to Exhibit 4.6 to Amendment No. 2 to the Registrant’s Registration Statement on Form S-1 filed May 16, 2011) | |
| Form of 7.125% Senior Note due 2019 (included in Exhibit | |
4.4 | First Supplemental Indenture, dated as of March 31, 2015, between Allison Transmission, Inc. and Wells Fargo Bank, National Association, as Trustee (incorporated by reference to Exhibit 4.1 to the Registrant’s Current Report on Form 8-K filed on April 7, 2015) | |
| 10.1 | Credit Agreement among Allison Transmission Holdings, Inc., Allison Transmission, Inc., as Borrower, the Several Lenders from time to time parties thereto, Citicorp North America, Inc., as Administrative Agent, Lehman Brothers Commercial Bank and Merrill Lynch, Pierce, Fenner & Smith Incorporated, as Syndication Agents, Sumitomo Mitsui Banking Corporation, as Documentation Agent and Co-Arranger and Citigroup Global Markets Inc., Lehman Brothers Inc. and Merrill Lynch & Co., Merrill Lynch, Pierce, Fenner & Smith Incorporated, As Joint Lead Arrangers And Joint Bookrunners, dated as of August 7, 2007 (incorporated by reference to Exhibit 10.1 to Amendment No. 1 to the Registrant’s Registration Statement on Form S-1 filed April 26, 2011) | |
10.2 | First Amendment to the Credit Agreement among Allison Transmission Holdings, Inc., Allison Transmission, Inc., as Borrower, the Several Lenders from time to time parties thereto, Citicorp North America, Inc., as Administrative Agent, Lehman Brothers Commercial Bank and Merrill Lynch, Pierce, Fenner & Smith Incorporated, as Syndication Agents, Sumitomo Mitsui Banking Corporation, as Documentation Agent and Co-Arranger and Citigroup Global Markets Inc., Lehman Brothers Inc. and Merrill Lynch & Co., Merrill Lynch, Pierce, Fenner & Smith Incorporated, As Joint Lead Arrangers And Joint Bookrunners, dated as of November 21, 2008 (incorporated by reference to Exhibit 10.2 to the Registrant’s Registration Statement on Form S-1 filed March 18, 2011) | |
10.3 | Guarantee And Collateral Agreement made by Allison Transmission Holdings, Inc. Allison Transmission, Inc. as Borrower, and the Subsidiary Guarantors party hereto in favor of Citicorp North America, Inc., as Administrative Agent, dated as of August 7, 2007 (incorporated by reference to Exhibit 10.3 to the Registrant’s Registration Statement on Form S-1 filed March 18, 2011) | ||
10.4 | Trademark Security Agreement made by Allison Transmission, Inc. in favor of Citicorp North America, Inc., as Administrative Agent, dated as of August 7, 2007 (incorporated by reference to Exhibit 10.4 to the Registrant’s Registration Statement on Form S-1 filed March 18, 2011) | |
10.5 | Copyright Security Agreement made by Allison Transmission, Inc. in favor of Citicorp North America, Inc., as Administrative Agent, dated as of August 7, 2007 (incorporated by reference to Exhibit 10.5 to Amendment No. 2 to the Registrant’s Registration Statement on Form S-1 filed May 16, 2011) | |
| ||
| ||
| ||
| Form of Allison Transmission Holdings, Inc. Indemnification Agreement (incorporated by reference to Exhibit 10.9 to Amendment No. 2 to the Registrant’s Registration Statement on Form S-1 filed May 16, 2011) | |
| Allison Transmission Holdings, Inc. 2011 Equity Incentive Award Plan (incorporated by reference to Exhibit 10.10 to Amendment No. 3 to the Registrant’s Registration Statement on Form S-1 filed June 16, 2011) | |
| Form of 2011 Equity Incentive Award Plan Restricted Stock Agreement (incorporated by reference to Exhibit 10.11 to Amendment No. 3 to the Registrant’s Registration Statement on Form S-1 filed June 16, 2011) | |
| Form of 2011 Equity Incentive Award Plan Restricted Stock Unit Agreement (incorporated by reference to Exhibit 10.12 to Amendment No. 3 to the Registrant’s Registration Statement on Form S-1 filed June 16, 2011) | |
| Form of 2011 Equity Incentive Award Plan Stock Option Agreement (incorporated by reference to Exhibit 10.13 to Amendment No. 3 to the Registrant’s Registration Statement on Form S-1 filed June 16, 2011) | |
| Equity Incentive Plan of Allison Transmission Holdings, Inc. (incorporated by reference to Exhibit 10.14 to Amendment No. 2 to the Registrant’s Registration Statement on Form S-1 filed May 16, 2011) | |
| Form of Employee Stock Option Agreement under Equity Incentive Plan of Allison Transmission Holdings, Inc. (incorporated by reference to Exhibit 10.15 to Amendment No. 2 to the Registrant’s Registration Statement on Form S-1 filed May 16, 2011) | |
| Form of Independent Director Stock Option Agreement under Equity Incentive Plan of Allison Transmission Holdings, Inc. (incorporated by reference to Exhibit 10.16 to Amendment No. 2 to the Registrant’s Registration Statement on Form S-1 filed May 16, 2011) | |
| Second Amendment to the Credit Agreement among Allison Transmission Holdings, Inc., Allison Transmission, Inc., as Borrower, the several banks and other financial institutions or entities from time to time parties thereto as Lenders, Citicorp North America, Inc., as Administrative Agent and Collateral Agent, Lehman Brothers Commercial Bank and Merrill Lynch, Pierce, Fenner & Smith Incorporated, as Syndication Agents, Sumitomo Mitsui Banking Corporation, as Documentation Agent and Co-Arranger, and Citigroup Global Markets Inc., Lehman Brothers Inc., and Merrill Lynch & Co., Merrill Lynch, Pierce, Fenner & Smith Incorporated, as Joint Lead Arrangers and Joint Bookrunners, dated as of May 13, 2011 (incorporated by reference to Exhibit 10.17 to Amendment No. 3 to the Registrant’s Registration Statement on Form S-1 filed June 16, 2011) | |
| Third Amendment to the Credit Agreement among Allison Transmission Holdings, Inc., Allison Transmission, Inc., as Borrower, the several banks and other financial institutions or entities from time to time parties thereto as Lenders, Citicorp North America, Inc., as Administrative Agent and Collateral Agent and the other agents and arrangers party thereto, dated as of March 9, 2012 (incorporated by reference to Exhibit 10.19 to Amendment No. 8 to the Registrant’s Registration Statement on Form S-1 filed March 12, 2012) | |
| Incentive Plan of Allison Transmission Holdings, Inc. (incorporated by reference to Exhibit 10.20 to the Registrant’s Quarterly Report on Form 10-Q for the quarter ended June 30, 2012 filed on July 31, 2012) | |
| Deferred Compensation Plan of Allison Transmission Inc. (incorporated by reference to Exhibit 10.21 to the Registrant’s Quarterly Report on Form 10-Q for the quarter ended June 30, 2012 filed on July 31, 2012) | |
| Amendment No. 4 to the Credit Agreement, dated as of August 23, 2012, among Allison Transmission Holdings, Inc., Allison Transmission, Inc., as Borrower, the several banks and other financial institutions or entities from time to time parties thereto as Lenders, Citicorp North America, Inc., as Administrative Agent and the other agents and arrangers party thereto (incorporated by reference to Exhibit 10.1 to the Registrant’s Current Report on Form 8-K filed August 23, 2012) | |
| Amendment No. 5 to the Credit Agreement, dated as of October 4, 2012, among Allison Transmission Holdings, Inc., Allison Transmission, Inc., as Borrower, the several banks and other financial institutions or entities from time to time parties thereto as Lenders, Citicorp North America, Inc., as Administrative Agent and the other agents and arrangers party thereto (incorporated by reference to Exhibit 10.1 to the Registrant’s Current Report on Form 8-K filed October 4, 2012) | ||
| Non-Employee Director Deferred Compensation Plan of Allison Transmission Holdings, Inc. | |
| Form Amendment to Stock Option Agreement under Equity Incentive Plan of Allison Transmission Holdings, Inc. (incorporated by reference to Exhibit 10.24 to the Registrant’s Annual Report on Form 10-K for the year ended December 31, 2012 filed on February 28, 2013) | |
| 10.22 | Amendment No. 6 to the Credit Agreement, dated as of February 6, 2013, among Allison Transmission Holdings, Inc., Allison Transmission, Inc., as Borrower, the several banks and other financial institutions or entities from time to time parties thereto as Lenders, Citicorp North America, Inc., as Administrative Agent and the other agents and arrangers party thereto (incorporated by reference to Exhibit 10.1 to the Registrant’s Current Report on Form 8-K filed February 6, 2013) | |
| 10.23 | Amendment No. 7 to the Credit Agreement, dated as of February 6, 2013 among Allison Transmission Holdings, Inc., Allison Transmission, Inc., as Borrower, the several banks and other financial institutions or entities from time to time parties thereto as Lenders, Citicorp North America, Inc., as Administrative Agent and the other agents and arrangers party thereto (incorporated by reference to Exhibit 10.2 to the Registrant’s Current Report on Form 8-K filed February 6, 2013) | |
| 10.24* | Form Amendment to Stock Option Agreement under the Allison Transmission Holdings, Inc. 2011 Equity Incentive Award Plan and Equity Incentive Plan of Allison Transmission Holdings, Inc. (incorporated by reference to Exhibit 10.27 to the Registrant’s Quarterly Report on Form 10-Q for the quarter ended June 30, 2013 filed on July 30, 2013) | |
| 10.25* | Form of 2011 Equity Incentive Award Plan Stock Option Agreement (incorporated by reference to Exhibit 10.29 to the Registrant’s Quarterly Report on Form 10-Q for the quarter ended September 30, 2013 filed on October 29, 2013) | |
| 10.26 | Amendment No. 8 to the Credit Agreement, dated as of August 26, 2013, among Allison Transmission Holdings, Inc., Allison Transmission, Inc., as Borrower, the several banks and other financial institutions or entities from time to time parties thereto as Lenders, Citicorp North America, Inc., as Administrative Agent and the other agents and arrangers party thereto (incorporated by reference to Exhibit 10.1 to the Registrant’s Current Report on Form 8-K filed August 26, 2013) | |
| 10.27 | Amendment No. 9 to the Credit Agreement, dated as of December 31, 2013, among Allison Transmission Holdings, Inc., Allison Transmission, Inc., as Borrower, the several banks and other financial institutions or entities from time to time parties thereto as Lenders, Citicorp North America, Inc., as Administrative Agent and the other agents and arrangers party thereto (incorporated by reference to Exhibit 10.1 to the Registrant’s Current Report on Form 8-K filed December 31, 2013) | |
| 10.28* | Form of Change in Control Severance Agreement (incorporated by reference to Exhibit 10.34 to the Registrant’s Annual Report on Form 10-K for the year ended December 31, 2013 filed on February 24, 2014) | |
| 10.29 | Consent Agreement to the Credit Agreement, dated as of March 12, 2014, among Allison Transmission Holdings, Inc., Allison Transmission, Inc., as Borrower, the several banks and other financial institutions or entities from time to time parties thereto as Lenders, Citicorp North America, Inc., as Administrative Agent, and the other agents and arrangers party thereto (incorporated by reference to Exhibit 10.1 to the Registrant’s Current Report on Form 8-K filed March 14, 2014) | |
| 10.30 | Amendment No. 10 to the Credit Agreement, dated as of April 14, 2014, among Allison Transmission Holdings, Inc., Allison Transmission, Inc., as Borrower, the several banks and other financial institutions or entities from time to time parties thereto as Lenders, Citicorp North America, Inc., as Administrative Agent and the other agents and arrangers party thereto (incorporated by reference to Exhibit 10.1 to the Registrant’s Current Report on Form 8-K filed April 15, 2014) | |
| 10.31* | Employment Agreement, between Allison Transmission, Inc. and Lawrence E. Dewey, dated as of April 15, 2014 (incorporated by reference to Exhibit 10.2 to the Registrant’s Current Report on Form 8-K filed April 15, 2014) | |
| 10.32* | Employment Agreement, between Allison Transmission, Inc. and David S. Graziosi, dated as of April 15, 2014 (incorporated by reference to Exhibit 10.3 to the Registrant’s Current Report on Form 8-K filed April 15, 2014) | |
| 10.33* | Form of 2011 Equity Incentive Award Plan Restricted Stock Unit Agreement for Non-Employee Directors for 2014 Compensation (incorporated by reference to Exhibit 10.40 to the Registrant’s Quarterly Report on Form 10-Q for the quarter ended June 30, 2014 filed July 25, 2014) | |
| 10.34 | Amendment No. 11 to the Credit Agreement, dated as of April 7, 2015, among Allison Transmission Holdings, Inc., Allison Transmission, Inc., as Borrower, the several banks and other financial institutions or entities from time to time parties thereto as Lenders, Citicorp North America, Inc., as Administrative Agent and the other agents and arrangers parties thereto (incorporated by reference to Exhibit 10.1 to the Registrant’s Current Report on Form 8-K filed on April 7, 2015) | |
| 10.35* | Amended and Restated Non-Employee Directors Deferred Compensation Plan of Allison Transmission Holdings, Inc. (incorporated by reference to Exhibit 10.38 to the Registrant’s Quarterly Report on Form 10-Q for the quarter ended March 31, 2015 filed on April 28, 2015) | |
| 10.36* | Separation Agreement between the Company and David L. Parish, dated October 15, 2015 (incorporated by reference to Exhibit 10.1 to the Registrant’s Current Report on Form 8-K filed on October 16, 2015) | |
| 10.37 | Amendment No. 12 to the Credit Agreement, dated as of November 30, 2015, among Allison Transmission Holdings, Inc., Allison Transmission, Inc., as Borrower, the several banks and other financial institutions or entities from time to time parties thereto as Lenders, Citicorp North America, Inc., as Administrative Agent and the other agents and arrangers party thereto (incorporated by reference to Exhibit 10.1 to the Registrant’s Current Report on Form 8-K filed on November 30, 2015) | |
| 10.38* | Separation Agreement between the Company and Michael G. Headly, dated December 17, 2015 (incorporated by reference to Exhibit 10.1 to the Registrant’s Current Report on Form 8-K filed on December 18, 2015) | |
| 10.39* | Allison Transmission Holdings, Inc. 2015 Equity Incentive Award Plan (incorporated by reference to Appendix A to the Registrant’s Definitive Proxy Statement on Schedule 14A filed April 2, 2015) | |
| 10.40* | Allison Transmission Holdings, Inc. 2016 Incentive Plan (incorporated by reference to Appendix B to the Registrant’s Definitive Proxy Statement on Schedule 14A filed April 2, 2015) | |
| 10.41* | Form of 2015 Equity Incentive Award Plan Restricted Stock Agreement (filed herewith) | |
10.42* | Form of 2015 Equity Incentive Award Plan Restricted Stock Unit Agreement (filed herewith) | |
| 10.43* | Form of 2015 Equity Incentive Award Plan Stock Option Agreement (filed herewith) | |
| 10.44* | Second Amended and Restated Non-Employee Directors Compensation Policy (filed herewith) | |
| 14.1 | Code of Business Conduct, adopted by the Board of Directors on | |
21.1 | List of Subsidiaries of Allison Transmission Holdings, Inc. (filed herewith) | |
23.1 | Consent of PricewaterhouseCoopers LLP (filed herewith) | |
31.1 | Certification pursuant to Rule 13a-14(a)/15d-14(a) of the Securities Exchange Act of 1934 of the Chief Executive Officer, as adopted pursuant to Section 302 of the Sarbanes-Oxley Act of 2002 (filed herewith) | |
31.2 | Certification pursuant to Rule 13a-14(a)/15d-14(a) of the Securities Exchange Act of 1934 of the Chief Financial Officer, as adopted pursuant to Section 302 of the Sarbanes-Oxley Act of 2002 (filed herewith) | |
32.1 | Certification pursuant to 18 U.S.C. Section 1350, as adopted pursuant to Section 906 of the Sarbanes-Oxley Act of 2002 (filed herewith) | |
| XBRL Instance Document | |
| XBRL Taxonomy Extension Schema Document | |
| XBRL Taxonomy Extension Calculation Linkbase Document | |
| XBRL Taxonomy Extension Definition Linkbase Document | |
| XBRL Taxonomy Extension Label Linkbase Document | |
| XBRL Taxonomy Extension Presentation Linkbase Document | |
| * | Indicates a management contract or compensatory plan or arrangement |
SIGNATURES
Pursuant to the requirements of Section 13 or 15(d) of the Securities Exchange Act of 1934, the registrant has duly caused this report to be signed on its behalf by the undersigned, thereunto duly authorized.
| Allison Transmission Holdings, Inc. | ||||||||
| (Registrant) | ||||||||
| Date: | February | By: | /s/ Lawrence E. Dewey | |||||
| Lawrence E. Dewey | ||||||||
Chairman of the Board Chief Executive Officer (Principal Executive Officer) | ||||||||
Pursuant to the requirements of the Securities Exchange Act of 1934, this report has been signed below by the following persons on behalf of the registrant and in the capacities and on the dates indicated.
SIGNATURES | CAPACITY | DATE | ||
/s/ Lawrence E. Dewey Lawrence E. Dewey | Chairman of the Board Chief Executive Officer
| February | ||
/s/ David S. Graziosi David S. Graziosi |
Treasurer (Principal Financial Officer and Principal Accounting Officer) | February | ||
|
| |||
/s/ David Denison David Denison | Director | February | ||
/s/
| Director | February | ||
/s/ Alvaro Garcia-Tunon Alvaro Garcia-Tunon | Director | February 19, 2016 | ||
/s/ Gregory S. Ledford Gregory S. Ledford | Director | February | ||
|
| |||
/s/ Thomas W. Rabaut Thomas W. Rabaut | Director | February | ||
/s/ Francis Raborn Francis Raborn | Director | February | ||
/s/ Richard V. Reynolds Richard V. Reynolds | Director | February | ||
/s/ Gregory P. Spivy Gregory P. Spivy | Director | February 19, 2016 | ||
9994