
| Florida | 59-0324412 | |
| (State of Incorporation) | (I.R.S. Employer Identification No.) | |
| 3300 Publix Corporate Parkway | ||
| Lakeland, Florida | 33811 | |
| (Address of principal executive offices) | (Zip code) | |
(X)
Large accelerated filer | Accelerated filer | Non-accelerated filer X | Smaller reporting company | |||
768,799,000.
12, 2016.
| Page | |||||||||
| Item 1. | |||||||||
| Item 1A. | |||||||||
| Item 1B. | |||||||||
| Item 2. | |||||||||
| Item 3. | |||||||||
| Item 4. | |||||||||
| |||||||||
| |||||||||
| |||||||||
| |||||||||
| |||||||||
| |||||||||
Item 5. | |||||||||
Item 6. | |||||||||
Item 7. | |||||||||
Item 7A. | |||||||||
Item 8. | |||||||||
Item 9. | |||||||||
| Item 9A. | |||||||||
| Item 9B. | |||||||||
| |||||||||
| |||||||||
Item 10. | |||||||||
Item 11. | |||||||||
Item 12. | |||||||||
Item 13. | |||||||||
Item 14. | |||||||||
Item 15. | |||||||||
Grocery Other Tennessee. store location. competitors as well as competitor format innovation and location additions. applicable Name Business Experience During Last Five Years Served as John A. Attaway, Jr. Senior Vice President, General Counsel and Secretary of the Company. Hoyt R. Barnett Vice Chairman of the Company and Trustee of the Employee Stock Ownership Plan. David E. Bornmann Vice President of the Company. David E. Bridges Vice President of the Company. Scott E. Brubaker Vice President of the Company. Jeffrey G. Chamberlain Director of Real Estate Strategy of the Company to January 2011, Vice President thereafter. William E. Crenshaw President of the Company to March 2008, Chief Executive Officer thereafter. Joseph DiBenedetto, Jr. Regional Director of Retail Operations of the Company to January 2011, Vice President thereafter. G. Gino DiGrazia Vice President of the Company. Laurie Z. Douglas Senior Vice President and Chief Information Officer of the Company. David S. Duncan Vice President of the Company. Sandra J. Estep Vice President of the Company. William V. Fauerbach Vice President of the Company. Linda S. Hall Vice President of the Company. John T. Hrabusa Senior Vice President of the Company. Mark R. Irby Vice President of the Company. Randall T. Jones, Sr. Senior Vice President of the Company to March 2008, President thereafter. Linda S. Kane Vice President and Assistant Secretary of the Company. Erik J. Katenkamp Director of Information Systems to January 2013, Vice President thereafter. L. Renee Kelly Director of Information Systems to January 2013, Vice President thereafter. Thomas G. Larson Director of Information Systems to January 2013, Vice President thereafter. Thomas M. McLaughlin Vice President of the Company. Dale S. Myers Vice President of the Company. Alfred J. Ottolino Vice President of the Company. David P. Phillips Chief Financial Officer and Treasurer of the Company. Charles B. Roskovich, Jr. Regional Director of Retail Operations of the Company to January 2008, Vice President to January 2011, Senior Vice President to January 2013, Vice President thereafter. Marc H. Salm Director and Counsel of Risk Management of the Company to June 2008, Vice President thereafter. Richard J. Schuler II Vice President of the Company. Alison Midili Smith Director of Human Resources to January 2013, Vice President thereafter. Michael R. Smith Vice President of the Company. Steven B. Wellslager Director of Information Systems to January 2013, Vice President thereafter. 2012 2011 January - February March - April May - July August - October November - December future. Total Number of Approximate that May Yet Be Period Purchased Share Programs (1) Programs (1) September 30, 2012 through November 3, 2012 November 4, 2012 through December 1, 2012 December 2, 2012 through December 29, 2012 Total Common stock is made available for sale by the Company only to Past stock performance shown below is no guarantee of future performance. Sales: Sales Percent change Comparable store sales percent change Earnings: Gross profit(2) Earnings before income tax expense Net earnings Net earnings as a percent of sales Common stock: Weighted average shares outstanding Basic and diluted earnings per share Dividends per share Financial data: Capital expenditures Working capital Current ratio Total assets Long-term debt (including current portion) Common stock related to ESOP Total equity Supermarkets In the normal course of operations, the Company replaces supermarkets and closes supermarkets that are not meeting performance expectations. The impact of future supermarket closings is not expected to be material. climate in 2015. climate in 2014. tax expense Recently Issued Accounting Standards below. Net earnings as a percentage of sales for 2014 as compared with 2013 remained unchanged. payments. income tax payments. The primary use of net cash in investing activities for continuing change and review. Payments Due by Period Total 2013 2015 2017 after Contractual obligations: Operating leases(1) Purchase obligations(2)(3)(4) Other long-term liabilities: Self-insurance reserves(5) Accrued postretirement benefit cost(6) Long-term debt(7) Other Total 26, 2015: 2015. Consolidated Financial Statements: Consolidated Balance Sheets – December 2012 2011 Current assets: Cash and cash equivalents Short-term investments Trade receivables Merchandise inventories Deferred tax assets Prepaid expenses Total current assets Long-term investments Other noncurrent assets Property, plant and equipment: Land Buildings and improvements Furniture, fixtures and equipment Leasehold improvements Construction in progress Accumulated depreciation Net property, plant and equipment 2012 2011 Current liabilities: Accounts payable Accrued expenses: Contribution to retirement plans Self-insurance reserves Salaries and wages Other Current portion of long-term debt Federal and state income taxes Total current liabilities Deferred tax liabilities Self-insurance reserves Accrued postretirement benefit cost Long-term debt Other noncurrent liabilities Total liabilities Common stock related to Employee Stock Ownership Plan (ESOP) Stockholders’ equity: Common stock of $1 par value. Authorized 1,000,000 shares; issued and outstanding 776,094 shares in 2012 and 779,675 shares in 2011 Additional paid-in capital Retained earnings Accumulated other comprehensive earnings Common stock related to ESOP Total stockholders’ equity Noncontrolling interests Total equity Commitments and contingencies 2012 2011 2010 Revenues: Sales Other operating income Total revenues Costs and expenses: Cost of merchandise sold Operating and administrative expenses Total costs and expenses Operating profit Investment income Other-than-temporary impairment losses Investment income, net Other income, net Earnings before income tax expense Income tax expense Net earnings Weighted average shares outstanding Basic and diluted earnings per share 2012 2011 2010 (Amounts are in thousands) Net earnings Other comprehensive earnings (losses): Unrealized gain on available-for-sale (AFS) securities, net of tax effect of $12,567, $6,324 and $8,251 in 2012, 2011 and 2010, respectively Reclassification adjustment for net realized gain on AFS securities, net of tax effect of ($4,013), ($7,684) and ($9,473) in 2012, 2011 and 2010, respectively Adjustment to postretirement benefit plan obligation, net of tax effect of ($3,498), ($3,655) and ($1,913) in 2012, 2011 and 2010, respectively Comprehensive earnings 2012 2011 2010 (Amounts are in thousands) Cash flows from operating activities: Cash received from customers Cash paid to employees and suppliers Income taxes paid Self-insured claims paid Dividends and interest received Other operating cash receipts Other operating cash payments Net cash provided by operating activities Cash flows from investing activities: Payment for capital expenditures Proceeds from sale of property, plant and equipment Payment for investments Proceeds from sale and maturity of investments Net cash used in investing activities Cash flows from financing activities: Payment for acquisition of common stock Proceeds from sale of common stock Dividends paid Repayments of long-term debt Other, net Net cash used in financing activities Net (decrease) increase in cash and cash equivalents Cash and cash equivalents at beginning of year Cash and cash equivalents at end of year 2012 2011 2010 Reconciliation of net earnings to net cash provided by operating activities: Net earnings Adjustments to reconcile net earnings to net cash provided by operating activities: Depreciation and amortization Increase in LIFO reserve Retirement contributions paid or payable in common stock Deferred income taxes Loss on disposal and impairment of property, plant and equipment Gain on AFS securities Net amortization of investments Change in operating assets and liabilities providing (requiring) cash: Trade receivables Merchandise inventories Prepaid expenses and other noncurrent assets Accounts payable and accrued expenses Self-insurance reserves Federal and state income taxes Other noncurrent liabilities Total adjustments Net cash provided by operating activities Common Stock Accumulated Other Comprehensive Earnings Common Stock Related to ESOP Balances at December 26, 2009 Comprehensive earnings Dividends, $0.46 per share Contribution of 14,363 shares to retirement plans Acquired 23,731 shares from stockholders Sale of 9,771 shares to stockholders Retirement of 14,820 shares Change for ESOP related shares Balances at December 25, 2010 Comprehensive earnings Dividends, $0.53 per share Contribution of 12,508 shares to retirement plans Acquired 23,513 shares from stockholders Sale of 9,711 shares to stockholders Retirement of 14,278 shares Change for ESOP related shares Balances at December 31, 2011 Comprehensive earnings Dividends, $0.89 per share Contribution of 12,451 shares to retirement plans Acquired 24,889 shares from stockholders Sale of 8,857 shares to stockholders Retirement of 16,076 shares Change for ESOP related shares Balances at December 29, 2012 28, 2013 Business Principles of Consolidation Fiscal Year Cash Equivalents Trade Receivables Inventories Investments Property, Plant and Equipment and Depreciation Buildings and improvements Furniture, fixtures and equipment Leasehold improvements Self-Insurance Comprehensive Earnings Revenue Recognition Sales Taxes Other Operating Income Cost of Merchandise Sold Advertising Costs Other Nonoperating Income, net Income Taxes Common Stock and Earnings Per Share Use of Estimates December 29, 2012 December 31, 2011 27, 2014: 2012 2011 Tax exempt bonds Taxable bonds Restricted investments Equity securities 27, 2014: 2015. 2014. 2013. Due in one year or less Due after one year through five years Due after five years through ten years Due after ten years Restricted investments Equity securities Less Than 12 Months 12 Months or Longer Total Value Losses Value Losses Value Losses 2012 Tax exempt bonds Taxable bonds Equity securities Total temporarily impaired AFS securities 2011 Tax exempt bonds Taxable bonds Restricted investments Equity securities Total temporarily impaired AFS securities 27, 2014: fluctuations that are expected to recover. Year (Amounts are in thousands) 2013 2014 2015 2016 2017 Thereafter Change in benefit obligation: Benefit obligation as of beginning of year Service cost Interest cost Actuarial loss Benefit payments Benefit obligation as of end of year Change in fair value of plan assets: Fair value of plan assets as of beginning of year Employer contributions Benefit payments Fair value of plan assets as of end of year Unfunded status of the plan as of end of year Current liability Noncurrent liability Total recognized liability 27, 2014 is as follows: Year (Amounts are in thousands) 2013 2014 2015 2016 2017 2018 through 2022 Thereafter Service cost Interest cost Amortization of actuarial losses Net periodic postretirement benefit cost Discount rate Rate of compensation increase Discount rate Rate of compensation increase 2012 2011 2010 Earnings Other comprehensive earnings (losses) Current Deferred Total 2012 Federal State 2011 Federal State 2010 Federal State 2012 2011 2010 Federal tax at statutory tax rate State income taxes (net of federal tax benefit) ESOP dividend Other, net 2012 2011 Deferred tax assets: Self-insurance reserves Retirement plan contributions Postretirement benefit cost Reserves not currently deductible Inventory capitalization Other Total deferred tax assets Deferred tax liabilities: Property, plant and equipment, primarily due to depreciation Investment valuation Other Total deferred tax liabilities 27, 2014. 2015 includes the net effect of this settlement. The Company had no unrecognized tax benefits in 2015. Operating Leases 2012 2011 2010 Minimum rentals Contingent rentals Sublease rental income Year 2013 2014 2015 2016 2017 Thereafter as follows: First Second Third Fourth 2012 Revenues Costs and expenses Net earnings Basic and diluted earnings per share 2011 Revenues Costs and expenses Net earnings Basic and diluted earnings per share Description Year ended December 29, 2012 Reserves not deducted from assets: Self-insurance reserves: Current Noncurrent Year ended December 31, 2011 Reserves not deducted from assets: Self-insurance reserves: Current Noncurrent Year ended December 25, 2010 Reserves not deducted from assets: Self-insurance reserves: Current Noncurrent Consolidated Financial Statements and Schedule Composite of the Restated Articles of Incorporation Articles of Amendment of the Restated Articles of Incorporation Amended and Restated By-Laws Indemnification Agreement is incorporated by reference to the form attached as an exhibit to the Quarterly Report Incentive Bonus Plan is incorporated by reference to the exhibits to the Annual Report Indemnification Agreement is incorporated by reference to the form attached as an exhibit to the Current Report Supplemental Executive Retirement Plan is incorporated by reference to an exhibit to the Current Report on Form 8-K dated November 14, 2012. Code of Ethical Conduct for Financial Managers is incorporated by reference to the exhibits to the Annual Report Subsidiaries of the Registrant. Consent of Independent Registered Public Accounting Firm. Certification Pursuant to Section 302 of the Sarbanes-Oxley Act of 2002. Certification Pursuant to Section 302 of the Sarbanes-Oxley Act of 2002. Certification Pursuant to 18 U.S.C. Section 1350, as Adopted Pursuant to Section 906 of the Sarbanes-Oxley Act of 2002. Certification Pursuant to 18 U.S.C. Section 1350, as Adopted Pursuant to Section 906 of the Sarbanes-Oxley Act of 2002. The following financial information from the /s/ John A. Attaway, Jr. John A. Attaway, Jr. Secretaryprimary business of operating retail food supermarkets in Florida, Georgia, Alabama, South Carolina, Tennessee and Tennessee. The Company has signed leases for supermarket sites in North Carolina expected to open in 2014.Carolina. The Company was founded in 1930 and later merged into another corporation that was originally incorporated in 1921. The Company has no other significant lines of business or industry segments.2012, 20112015, 2014 and 20102013 was as follows: 2012 2011 2010 85% 86% 85% 15% 14% 15% 100% 100% 100% 2015 2014 2013 Grocery 85 % 85 % 85 % Other 15 % 15 % 15 % 100 % 100 % 100 % non-foodnonfood products it distributes from many sources. These products are delivered to the supermarkets through Company distribution centers or directly from the suppliers and are generally available in sufficient quantities to enable the Company to adequately satisfy its customers. Approximately 73%74% of the total cost of products purchased is delivered to the supermarkets through the Company’s distribution centers. The Company believes that its sources of supply of these products and raw materials used in manufacturing are adequate for its needs and that it is not dependent upon a single supplier or relatively few suppliers. Private label items are produced in the Company’s dairy, bakery and deli manufacturing facilities or are manufactured for the Company by outside suppliers.1,0691,114 supermarkets at the end of 2012,2015, compared with 1,0461,095 at the beginning of the year. In 2012, 312015, 28 supermarkets were opened (including 1210 replacement supermarkets) and 113154 supermarkets were remodeled. EightNine supermarkets were closed during 2012.the period. Replacement supermarkets opened in 20122015 replaced sevensix of the supermarkets closed during the same period, two of which were replaced on site, and fivefour supermarkets closed in 20112014 that were replaced on site. TheTwo of the remaining supermarketsupermarkets closed in 20122015 will be replaced on site in subsequent periods and one supermarket will not be replaced. New supermarkets added 1.10.9 million square feet in 2012,2015, an increase of 2.3%1.8%. At the end of 2012,2015, the Company had 757768 supermarkets located in Florida, 180182 in Georgia, 5261 in Alabama, 4754 in South Carolina, 38 in Tennessee and 3311 in Tennessee.North Carolina. Also, asat the end of year end,2015, the Company had fourseven supermarkets under construction in Florida, seven in North Carolina, three in Alabama, twoSouth Carolina, one in TennesseeAlabama and one each in Georgia and South Carolina.Competition is based primarily on quality of goods and service, price, convenience, product mix and store location. The Company’s primary competition throughout its market areas is with severalcompetitors include national and regional supermarket chains, independent supermarkets, supercenters, membership warehouse clubs, mass merchandisers, dollar stores, drug stores, specialty food stores, restaurants, convenience stores and online retailers. The Company’s ability to attract and retain customers is based primarily on quality of goods and service, price, convenience, stores. The Company anticipates continued competitor format innovationproduct mix and location additions in 2013.20122015 consisted of $3,149.1$4,314.4 million in current assets and $2,221.0$2,902.7 million in current liabilities. Normal operating fluctuations in these balances can result in changes to cash flows from operating activities presented in the consolidated statements of cash flows that are not necessarily indicative of long-term operating trends. There are no unusual industry practices or requirements relating to working capital items.158,000 full-time and part-time180,000 employees at the end of 2012.2015. The Company considers its employee relations to be good.Compliance by the Company withregulations during 2012regulations. The Company may be subject to liability under applicable environmental laws for cleanup of contamination at its facilities. Compliance with these laws had no material effect uponon capital expenditures, results of operations or the competitive position of the Company.20132016 Proxy Statement will be mailed on or about March 14, 201310, 2016 to stockholders of record as of the close of business on February 5, 2013.2, 2016. These reports as well as Quarterly Reports on Form 10-Q, Current Reports on Form 8-K and any amendments to those reports may also be obtained electronically, free of charge, through the Company’s website at www.publix.com/stock.convenience stores.online retailers. The Company’s ability to attract and retain customers is based primarily on quality of goods and service, price, convenience, product mix and store location.all of theseexisting and potentially new competitors and its financial condition and results of operations could be impacted by the pricing, purchasing, advertising or promotional decisions made by its competitors.disposable consumer incomespending include increases in tax, interest and inflation rates, increases in fuel and energy costs, increases in health care costs, the impact of natural disasters or acts of terrorism, and other factors. This reduction in the level of consumer spending could cause customers to purchase lower-marginlower margin items or to shift spending to lower-pricedlower priced competitors, which could adversely affect the Company’s financial condition and results of operations.such asincluding payroll, facilities or other non-product related costs, could adversely affect the Company’s financial condition and results of operations.increasedsustained market share and sustained financial growth. Failure to execute on these core strategies, or a failure to execute the core strategies on a cost effective basis, could adversely affect the Company’s financial condition and results of operations.or a security breach could adversely affect the Company.security breaches,malicious service disruptions, catastrophic events and user errors. The Company’sSignificant disruptions in the information technology systems are also subject to security breaches, including cyber security breaches and breaches of transaction processing, that could result in the compromise of confidential customer data, including debit and credit cardholder data. Any disruptions in information technology systemsCompany or a security breachits third party service providers could have an adverse effect on the Company’s financial condition and results of operations. employee benefits and directors and officers liability. The Company is self insuredself-insured for property, plant and equipment losses. There is no assurance that the Company will be able to continue to maintain its insurance coverage or obtain comparable insurance coverage at aon commercially reasonable cost.terms. Self-insurance reserves are determined based on actual claims experience and an estimate of claims incurred but not reported including, where necessary, actuarial studies. Actuarial projections of losses are subject to variability caused by, but not limited to, such factors as future interest and inflation rates, future economic conditions, claims experience, litigation trends and benefit level changes. The Company’s financial condition and results of operations could be adversely affected by an increase in the frequency or costs of claims, and changes in actuarial assumptions or a catastrophic eventevents involving property, plant and equipment losses. packaging, marketing, distribution and sale of grocery, drug and other products purchased from suppliers or manufactured by the Company entails an inherent risk of product liability claims, product recall and the resulting adverse publicity. Such products may contain contaminants that may be inadvertently distributedsold by the Company. These contaminants may, in certain cases, result in illness, injury or death if processing at the consumer level, if applicable, does not eliminate the contaminants. Even an inadvertent shipment of adulterated products ismay be a violation of law and may lead to a product recall and/or an increased risk of exposure to product liability claims. There can be no assurance that such claims will not be asserted against the Company or that the Company will not be obligated to perform product recalls in the future. If a product liability claim is successful, the Company’s insurance coverage may not be adequate to pay all liabilities, and itthe Company may not be able to continue to maintain such insurance coverage or obtain comparable insurance coverage at aon commercially reasonable cost.terms. If the Company does not have adequate insurance coverage or contractual indemnification available, product liability claims relating to defective products could have an adverse effect on the Company’s abilityas well asthe passage of new laws and the inability to deal with increased government regulation could adversely affect the Company’s financial condition and results of operations.a party insubject from time to time to various legallawsuits, claims and actions consideredcharges arising in the normal course of business, including labor and employment, personal injury, intellectual propertycommercial and other issues.matters. Some lawsuits also contain class action allegations. The Company estimates its exposure to these legal proceedings and establishes reserves for the estimated liabilities. Assessing and predicting the outcome of these matters involves substantial uncertainties. Although not currently anticipated by management, the results of pendingCompany, differences in actual outcomes or future legal proceedingschanges in the Company’s evaluation could adversely affecthave an adverse effect on the Company’s financial condition andor results of operations.approximately 49.852.1 million square feet of supermarket space. The Company’s supermarkets vary in size. Current supermarket prototypes range from 28,000 to 61,000 square feet. Supermarkets are often located in strip shopping centers where the Company is the anchor tenant. The majority of the Company’s supermarkets are leased. Substantially all of these leases will expire during the next 20 years. However, in the normal course of business, it is expected that the leases will be renewed or replaced by leases on other properties.new leases. Both the building and land are owned at 134232 locations. The building is owned while the land is leased at 5356 other locations.and adequate for operating its business.a party insubject from time to time to various legallawsuits, claims and actions consideredcharges arising in the normal course of business. The Company believes its recorded reserves are adequate in light of the probable and estimable liabilities. The estimated amount of reasonably possible losses for lawsuits, claims and charges, individually and in the aggregate, is considered to be immaterial. In the opinion of management, the ultimate resolution of these legal proceedings will not have a material adverse effect on the Company’s financial condition, results of operations or cash flows.applicable.Executive Officers of the Company Age
Officer of
Company
Since 54 2000 69 1977 55 1998 63 2000 54 2005 56 2011 62 1990 53 2011 50 2002 49 2006 59 1999 53 2002 66 1997 53 2002 57 2004 57 1989 50 2003 47 2000 41 2013 51 2013 56 2013 62 1994 60 2001 47 2004 53 1990 51 2008 52 2008 57 2000 42 2013 53 2005 46 2013 The terms of all officers expire in May 2013 or upon the election of their successors.(a)(a) Market Information Therefore, substantiallySubstantially all transactions of the Company’s common stock have been among the Company, its employees, former employees, their families and the benefit plans established for the Company’s employees. The Company’s commonCommon stock is made available for sale by the Company only to the Company’sits current employees and members of its Board of Directors through the Company’s Employee Stock Purchase Plan (ESPP) and Non-Employee Directors Stock Purchase Plan (Directors Plan) and to participants of the Company’s 401(k) Plan. In addition, common stock is made available underprovided to employees through the Employee Stock Ownership Plan (ESOP). Common stock is also made available for sale to members of the Company’s Board of Directors through the Non-Employee Directors Stock Purchase Plan (Directors Plan). The Company currently repurchases common stock subject to certain terms and conditions. The ESPP, Directors Plan, 401(k) Plan ESOP and Directors PlanESOP each contain provisions prohibiting any transfer for value without the owner first offering the common stock to the Company. The Company serves as the registrar and stock transfer agent for its common stock.20122015 and 20112014 were as follows: $ 20.20 19.85 22.40 20.90 22.70 21.65 22.00 22.05 22.50 20.20 2015 2014 January - February $ 33.80 30.00 March - April 39.05 30.15 May - July 42.10 32.50 August - October 42.00 33.85 November - December 41.80 33.80 (b)(b) Approximate Number of Equity Security Holders 5, 2013,2, 2016, the approximate number of holders of record of the Company’s common stock was 155,000.172,000.(c)(c) Dividends Thedividends on its common stockone semiannual dividend of $0.89$0.39 per share in 2012, which included an annual dividendand two quarterly dividends of $0.59$0.20 per share for a total of $0.79 per share. During 2014, the Company paid in June 2012 and a semi-annual dividendtwo semiannual dividends of $0.30$0.37 per share paid in December 2012. The Company paid an annual dividend on its common stockfor a total of $0.53$0.74 per share in 2011. Due to the growth of the Company’s dividend over the last several years, the Company decided to begin paying a semi-annual dividend rather than an annual dividend. To not delay any dividend payments to the Company’s stockholders, the first semi-annual dividend was paid on December 3, 2012.share. Payment of dividends is within the discretion of the Company’s Board of Directors and depends on, among other factors, net earnings, capital requirements and the financial condition of the Company. In the future, it is believed thatHowever, the Company willintends to continue to pay semi-annualcomparable dividends thatto stockholders in total will be comparable to the annual dividend paid in June 2012.(d)(d) Purchases of Equity Securities by the Issuer 29, 201226, 2015 were as follows (amounts are in thousands, except per share amounts): Total
Number of
Shares Average
Price
Paid per
Shares
Purchased as
Part of Publicly
Announced
Plans or
Dollar Value of
Shares
Purchased Under
the Plans or 1,873 $22.32 N/A N/A 1,635 22.50 N/A N/A 2,802 22.50 N/A N/A 6,310 $22.45 N/A N/A Period 865 $ 42.00 N/A N/A 2,055 41.80 N/A N/A 1,230 41.80 N/A N/A 4,150 $ 41.84 N/A N/A (1) the Company’sits current employees and members of its Board of Directors through the Company’s ESPP and Directors Plan and to participants of the Company’s 401(k) Plan. In addition, common stock is made available underprovided to employees through the ESOP. Common stock is also made available for sale to members of the Company’s Board of Directors through the Directors Plan. The Company currently repurchases common stock subject to certain terms and conditions. The ESPP, Directors Plan, 401(k) Plan ESOP and Directors PlanESOP each contain provisions prohibiting any transfer for value without the owner first offering the common stock to the Company.29, 201226, 2015 required to be disclosed in the last two columns of the table.(e)(e) Performance Graph 29, 2012,26, 2015, compared to the cumulative total return on the S&P 500 Index and a custom Peer Group Index including retail food supermarket companies.(1)(1) The Peer Group Index is weighted based on the various companies’ market capitalization. The comparison assumes $100 was invested at the end of 20072010 in the Company’s common stock and in each of the related indices and assumes reinvestment of dividends.calendartrading price as of the Company’s fiscal year end trading price.end. The following performance graph is based on the Company’s trading price at fiscal year end based on its market price as of the prior fiscal quarter. Because the Company’s fiscal year end valuation of the Company’s shares is effective after the date this document is to be filed with the Securities and Exchange Commission (SEC),For comparative purposes, a performance graph based on the fiscal year end valuation (market price as of March 1, 2013) is not presented below. Rather, for comparative purposes, a performance graph based on the fiscal year end valuation2016) is provided in the 20132016 Proxy Statement.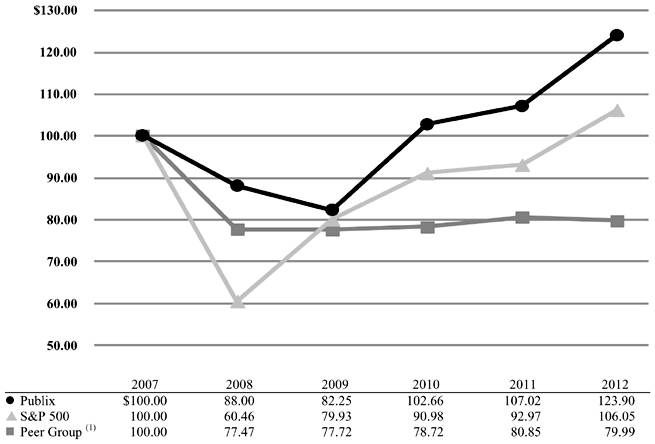
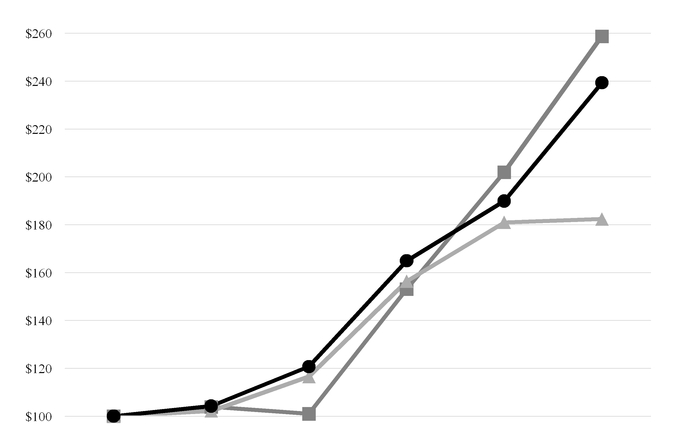
2010 2011 2012 2013 2014 2015 
Publix $100.00 104.25 120.69 164.89 189.93 239.30 
S&P 500 100.00 102.19 116.57 156.33 180.99 182.38 
100.00 103.90 101.00 153.12 201.99 258.75 (1)(1) Companies included in the Peer Group are:are Ahold, Delhaize Group, Kroger, Safeway, Supervalu and Weis Markets. Winn DixieSafeway is no longer included in the Peer Group due to its acquisition by Bi-LoAlbertson’s in 2012.2015. 2012 2011(1) 2010 2009 2008 (Amounts are in thousands, except per share amounts and number of supermarkets.) $27,484,766 26,967,389 25,134,054 24,319,716 23,929,064 1.9% 7.3% 3.3% 1.6% 4.0% 2.2% 4.1% 2.3% (3.2% ) 1.3% $ 7,573,782 7,447,019 7,022,611 6,727,037 6,442,241 $ 2,302,594 2,261,773 2,039,418 1,774,714 1,651,412 $ 1,552,255 1,491,966 1,338,147 1,161,442 1,089,770 5.6% 5.5% 5.3% 4.8% 4.6% 782,553 784,815 786,378 788,835 818,248 $ 1.98 1.90 1.70 1.47 1.33 $ 0.89 (3) 0.53 0.46 0.41 0.44 $ 697,112 602,952 468,530 693,489 1,289,707 $ 928,138 752,464 771,918 469,260 232,809 1.42 1.37 1.37 1.24 1.13 $12,278,320 11,268,232 10,159,087 9,004,292 8,089,672 $ 158,472 134,584 149,361 99,326 71,940 $ 2,272,963 2,137,217 2,016,696 1,862,350 1,777,153 $ 9,128,818 8,341,457 7,305,592 6,303,538 5,643,298 1,069 1,046 1,034 1,014 993 2015 2014 2013 2012 (Amounts are in thousands, except per share amounts and number of supermarkets) Sales: Sales $ 32,362,579 30,559,505 28,917,439 27,484,766 26,967,389 Percent change 5.9 % 5.7 % 5.2 % 1.9 % 7.3 % Comparable store sales percent change 4.2 % 5.4 % 3.6 % 2.2 % 4.1 % Earnings: $ 8,902,969 8,326,855 7,980,120 7,573,782 7,447,019 Earnings before income tax expense $ 2,869,261 2,570,121 2,465,689 2,302,594 2,261,773 Net earnings $ 1,965,048 1,735,308 1,653,954 1,552,255 1,491,966 Net earnings as a percent of sales 6.1 % 5.7 % 5.7 % 5.6 % 5.5 % Common stock: Weighted average shares outstanding 774,428 778,708 780,188 782,553 784,815 Basic and diluted earnings per share $ 2.54 2.23 2.12 1.98 1.90 Dividends per share $ 0.79 0.74 0.70 0.53 Financial data: Capital expenditures $ 1,235,648 1,374,124 668,485 697,112 602,952 Working capital $ 1,411,744 1,035,758 881,222 928,138 752,464 Current ratio 1.49 1.38 1.37 1.42 1.37 Total assets $ 16,359,278 15,083,480 13,546,641 12,278,320 11,268,232 Long-term debt (including current portion) $ 236,446 217,638 162,154 158,472 134,584 Common stock related to ESOP $ 2,953,878 2,680,528 2,322,903 2,272,963 2,137,217 Total equity $ 12,431,262 11,345,223 10,267,796 9,128,818 8,341,457 Supermarkets 1,114 1,095 1,079 1,069 1,046 (1)(1) Fiscal year 2011 includes 53 weeks. All other years include 52 weeks. (2)(2) Gross profit represents sales less cost of merchandise sold as reported in the consolidated statements of earnings. (3)(3) The Company paid dividends on its common stock of $0.89 per share in 2012, which included an annual dividend of $0.59 per share paid in June 2012 and a semi-annualsemiannual dividend of $0.30 per share paid in December 2012. primarily engaged in the retail food industry, operating supermarkets in Florida, Georgia, Alabama, South Carolina, Tennessee and Tennessee. The Company has signed leases for supermarket sites in North Carolina expected to open in 2014.Carolina. The Company has no other significant lines of business or industry segments. As of December 29, 2012,26, 2015, the Company operated 1,0691,114 supermarkets including 757768 located in Florida, 180182 in Georgia, 5261 in Alabama, 4754 in South Carolina, 38 in Tennessee and 3311 in Tennessee.North Carolina. In 2012, 312015, 28 supermarkets were opened (including 1210 replacement supermarkets) and 113154 supermarkets were remodeled. EightNine supermarkets were closed during 2012. Thethe period. During 2015, the Company opened 2115 supermarkets in Florida, five in North Carolina, three in Alabama, three in Tennessee, two in GeorgiaSouth Carolina and two in South Carolina during 2012.Georgia. Replacement supermarkets opened in 20122015 replaced sevensix of the supermarkets closed during the same period and fiveperiod. Two of the remaining supermarkets closed in 2011 that were2015 will be replaced on site. The remainingsite in subsequent periods and one supermarket closed in 2012 will not be replaced. revenues in excess of the cost of merchandise sold and operating and administrative expenses. The Company has generally been able to increase revenues and net earnings from year to year. Further, the Company has been able to meet its cash requirements from internally generated funds without the need to generate cash throughfor debt financing. The Company’s year end cash balances are significantly impacted by its operating results as well as by capital expenditures, investment transactions, stock repurchases and dividend payments.increasingly important role in its merchandising strategy.CompetitionThe Company’s competitors include traditional supermarkets, such as national and regional supermarket chains and independent supermarkets, as well as nontraditional competitors, such as supercenters, membership warehouse clubs, mass merchandisers, dollar stores, drug stores, specialty food stores, restaurants, convenience stores and online retailers. The Company’s ability to attract and retain customers is based primarily on quality of goods and service, price, convenience, product mix and store location. In addition, the Company competes with other retailerscompanies for additional retail site locations. The Company also competes with retailers as well asand other labor market competitors in attracting and retaining quality employees. The Company’s primary competition throughout its market areas is with several national and regional traditional supermarket chains, independent supermarkets and specialty food stores as well as non-traditional competition such as supercenters, membership warehouse clubs, mass merchandisers, dollar stores, drug stores, restaurants and convenience stores. As a result of the highly competitive environment, traditional supermarkets, including the Company, face business challenges. There has been a trend in recent years for traditional supermarkets to lose market share to non-traditional competition.nontraditional competitors. The success of the Company, in particular its ability to retain its customers, depends on its ability to meet the business challenges created by this highly competitive environment.increasedsustained market share and sustained financial growth.20122015, 2014 and 20102013 include 52 weeks and fiscal year 2011 includes 53 weeks.20122015 were $27.5$32.4 billion as compared with $27.0$30.6 billion in 2011,2014, an increase of $517.4$1,803.1 million or 5.9%. The increase in sales for 2015 as compared with 2014 was primarily due to a 1.9% increase. After excluding sales of $485.2 million for the extra week4.2% increase in 2011, the Company estimates that its sales increased $420.0 million or 1.6% from new supermarkets (excluding replacement supermarkets) and $582.6 million or 2.2% from comparable store sales (supermarkets open for the same weeks in both periods, including replacement supermarkets). Sales for supermarkets that are replaced on site are classified as new supermarket sales since the replacement period for the supermarket is generally 9 to 12 months. Comparable store sales for 2012 increased primarily due to product cost inflation and increased customer counts resulting from a better, but still difficult, economic climate.Sales for 2011 were $27.0 billion as compared with $25.1 billion in 2010, an increase of $1,833.3 million or a 7.3% increase. The Company estimates that its sales increased $485.2 million or 1.9% from the additional week in 2011, $317.6 million or 1.3% from new supermarkets and $1,030.5 million or 4.1% from comparable store sales. Comparable store sales for 20112015 increased primarily due to product cost inflation and increased customer counts resulting from a better economic climate.20102014 were $25.1$30.6 billion as compared with $24.3$28.9 billion in 2009,2013, an increase of $814.3$1,642.1 million or 5.7%. The increase in sales for 2014 as compared with 2013 was primarily due to a 3.3% increase. The Company estimates that its sales increased $254.9 million or 1.0% from new supermarkets and $559.4 million or 2.3% from5.4% increase in comparable store sales. Comparable store sales for 20102014 increased primarily due to product cost inflation and increased customer counts resulting from a better economic climate.27.6%27.5%, 27.2% and 27.6% in 2015, 2014 and 27.9% in 2012, 2011 and 2010,2013, respectively. Excluding the last-in, first-out (LIFO) reserve effect of $28.4$26.0 million, $67.1$30.7 million and $14.1$14.8 million in 2012, 20112015, 2014 and 2010,2013, respectively, gross profit as a percentage of sales would have been 27.7%27.6%, 27.9%27.3% and 28.0%27.6% in 2012, 20112015, 2014 and 2010,2013, respectively. After excluding the LIFO reserve effect, the decreasesincrease in gross profit as a percentage of sales for 20122015 as compared with 20112014 was primarily due to changes in promotional activities and pricing strategies. After excluding the LIFO reserve effect, the decrease in gross profit as a percentage of sales for 20112014 as compared with 2010 were2013 was primarily due to increases in promotional activities and product cost increases, some of which were not passed on to customers.20.5%20.0%, 20.5%20.2% and 21.1%20.4% in 2012, 20112015, 2014 and 2010,2013, respectively. After excluding the effect of the incremental sales from the additional week in 2011, operating and administrative expenses as a percentage of sales would have been 20.9%. The decrease in operating and administrative expenses as a percentage of sales for 20122015 as compared with 20112014 was primarily due to a decrease in payrollrent as a percentage of sales primarily due to more effective scheduling. After excluding the effectacquisition of shopping centers with the incremental sales forCompany as the additional weekanchor tenant. The decrease in 2011, operating and administrative expenses as a percentage of sales for 20112014 as compared with 2010 remained relatively unchanged.Investment income, netInvestment income, net was $88.4 million, $93.0 million and $91.8 million in 2012, 2011 and 2010, respectively. The decrease in investment income, net for 2012 as compared with 20112013 was primarily due to a decrease in rent as a percentage of sales due to the acquisition of shopping centers with the Company as the anchor tenant and the adoption of the Accounting Standards Update (ASU) discussed insecurities partially offset by a decrease in other-than-temporary impairment (OTTI) losses on equity securities and an increase in dividend income.securities. The increase in investment income net for 20112014 as compared with 20102013 was primarily due to an increase in dividend income partially offset by OTTI lossesand realized gains on the sale of equity securities.There were no OTTI losses on available-for-sale (AFS) securities in 2012 and 2010. The Company recorded OTTI losses on equity securities of $6.1 million in 2011. There were no OTTI losses on debt securities in 2011.Other income, netOther income, net was $48.9 million, $33.9 million and $26.3 million in 2012, 2011 and 2010, respectively. The increase in other income, net for 2012 as compared with 2011 was primarily due to a settlement received from credit card companies.taxes32.6%31.5%, 34.0%32.5% and 34.4%32.9% in 2012, 20112015, 2014 and 2010,2013, respectively. The decrease in the effective income tax rate for 20122015 as compared with 20112014 was primarily due to an increase in dividends paid to ESOP participants due to the payment of the semi-annual dividend, as noted inDividends below.a state income tax settlement and investment related tax credits. The decrease in the effective income tax rate for 20112014 as compared with 20102013 was primarily due to increasesan increase in dividends paidqualified inventory donations and investment related tax credits partially offset by an increase in income tax expense due to ESOP participants and jobs tax credits.the adoption of the ASU discussed in$1,552.3$1,965.0 million or $1.98$2.54 per share, $1,492.0$1,735.3 million or $1.90$2.23 per share and $1,338.1$1,654.0 million or $1.70$2.12 per share for 2012, 20112015, 2014 and 2010,2013, respectively. Net earnings as a percentage of sales were 5.6%6.1%, 5.5%5.7% and 5.3%5.7% for 2012, 20112015, 2014 and 2010,2013, respectively. The increase in net earnings as a percentage of sales for 20122015 as compared with 20112014 was primarily due to the decrease in the effective income tax rate, as noted above. The increase in net earnings as a percentage of sales for 2011 as compared with 2010 was primarily due to incremental sales from the additional week in 2011 partially offset by the decrease in gross profit as a percentage of sales and the decrease in operating and administrative expenses as a percentage of sales, as noted above.$5,370.5$6,955.1 million as of December 29, 2012,26, 2015, as compared with $4,620.1$6,638.2 million as of December 31, 2011.27, 2014. This increase iswas primarily due to the Company generating cash in excess of the amount needed for current operations, capital expenditures, common stock repurchases and the timing of payments, particularly for merchandise, partially offset by the additional dividend paid in December 2012 to transition from an annual to a semi-annual dividend.$2,604.2$2,941.4 million, for 2012, as compared with $2,341.2$2,777.2 million and $2,266.0$2,567.3 million for 2011in 2015, 2014 and 2010,2013, respectively. The increase in net cash provided by operating activities for 20122015 as compared with 20112014 was primarily due to the timing of payments, particularly for merchandise.income tax payments. The increase in net cash provided by operating activities for 20112014 as compared with 20102013 was primarily due to anthe increase in net earnings and the timing of $153.8 million. Any net cash in excesspayments for merchandise, partially offset by the timing of the amount needed for current operations is invested in short-term and long-term investments.$1,563.6$1,846.5 million, for 2012, as compared with $1,819.4$1,641.7 million and $1,408.7$1,721.5 million for 2011in 2015, 2014 and 2010,2013, respectively. The primary use of net cash in investing activities for 20122015 was funding capital expenditures and net increases in investment securities. Capital expenditures for 20122015 totaled $697.1$1,235.6 million. These expenditures were incurred in connection with the opening of 3128 new supermarkets (including 1210 replacement supermarkets) and remodeling 113154 supermarkets. Eight supermarkets were closed during 2012. Replacement supermarkets opened in 2012 replaced seven of the supermarkets closed during the same period and five supermarkets closed in 2011 that were replaced on site. The remaining supermarket closed in 2012 will not be replaced. New supermarkets added 1.1 million square feet in 2012, an increase of 2.3%. Expenditures were also incurred for supermarkets and remodels in progress, new or enhanced information technology hardware and applications and the acquisition of shopping centers with the Company as the anchor tenant, the expansion of warehouses and new or enhanced information technology hardware and applications. For the same period,tenant. In 2015, the payment for investments, net of the proceeds from the sale and maturity of such investments, was $871.9$615.2 million.20112014 was funding capital expenditures and net increases in investment securities. Capital expenditures for 20112014 totaled $603.0$1,374.1 million. These expenditures were incurred in connection with the opening of 2932 new supermarkets (including 14 replacement replacement 126138 supermarkets. Seventeen supermarkets were closed during 2011. Replacement supermarkets opened in 2011 replaced 11 of the 17 supermarkets closed during the same period. Five of the supermarkets closed in 2011 were replaced on site in 2012. The remaining supermarket closed in 2011 was not replaced. New supermarkets added 0.6 million square feet in 2011, an increase of 1.3%. Expenditures were also incurred for supermarkets and remodels in progress, the construction of new warehouses, new or enhanced information technology hardware and applications and the acquisition of shopping centers with the Company as the anchor tenant and new or enhanced information technology hardware and applications. For the same period,tenant. In 2014, the payment for investments, net of the proceeds from the sale and maturity of such investments, was $1,221.7$307.8 million.The primary use of net cash in investing activities for 2010 was funding capital expenditures and net increases in investment securities. Capital expenditures for 2010 totaled $468.5 million. These expenditures were incurred in connection with the opening of 41 new supermarkets (including 21 replacement supermarkets) and remodeling 115 supermarkets. Twenty-one supermarkets were closed during 2010. Replacement supermarkets opened in 2010 replaced 19 of the 21 supermarkets closed during the same period and two supermarkets closed in 2009. The remaining two supermarkets closed in 2010 were not replaced. New supermarkets opened included five of the remaining Florida supermarket locations acquired from Albertson’s LLC not opened in 2008 or 2009. New supermarkets added 1.1 million square feet in 2010, an increase of 2.4%. Expenditures were also incurred for new or enhanced information technology hardware and applications. For the same period, the payment for investments, net of the proceeds from the sale and maturity of such investments, was $943.0 million.Capital expenditure projectionIn 2013, the Company plans to open 24 supermarkets. Although real estate development is unpredictable, the Company’s 2013 new store growth represents a reasonable estimate of anticipated future growth. Capital expenditures for 2013 are expected to be approximately $810 million, primarily consisting of new supermarkets, remodeling certain existing supermarkets, construction of new or expansion of existing warehouses, new or enhanced information technology hardware and applications and acquisition of certain shopping centers with the Company as the anchor tenant. The shopping center acquisitions are financed with internally generated funds and assumed debt, if prepayment penalties for the debt are determined to be significant. This capital program is subject to continuing change and review. In the normal course of operations, the Company replaces supermarkets and closes supermarkets that are not meeting performance expectations. The impact of future supermarket closings is not expected to be material.$1,070.1$1,150.2 million, $1,029.9 million and $881.3 million in 2012, as compared with $760.8 million2015, 2014 and $621.9 million in 2011 and 2010,2013, respectively. The increase in net cash used in financing activities for 20122015 as compared with 20112014 was primarily due to an increase in net common stock repurchases and the payment of the semi-annual dividend, as noted inDividends below.repurchases. Net common stock repurchases totaled $354.4$510.5 million in 2012,2015, as compared with $291.3 million and $257.3$404.2 million in 2011 and 2010, respectively.2014. The increase in net cash used in financing activities for 2014 as compared with 2013 was primarily due to an increase in net common stock repurchases. Net common stock repurchases totaled $404.2 million in 2014, as compared with $321.3 million in 2013. The Company currently repurchases common stock at the stockholders’ request in accordance with the terms of the Company’s ESPP, Directors Plan, 401(k) Plan ESOP and Directors Plan.ESOP. The amount of common stock offered to the Company for repurchase is not within the control of the Company, but is at the discretion of the stockholders. The Company expects to continue to repurchase its common stock, as offered by its stockholders from time to time, at its then current value for amounts similar to those in prior years. However, with the exception of certain shares distributed from the ESOP, such purchases are not required and the Company retains the right to discontinue them at any time.$0.89$0.79 per share or $698.7$612.8 million, $0.53$0.74 per share or $418.7$577.2 million and $0.46$0.70 per share or $364.1$547.3 million in 2012, 20112015, 2014 and 2010,2013, respectively. The increasedividends paid for 2012 as compared2016 are approximately $1,500 million, primarily consisting of new supermarkets, remodeling existing supermarkets, construction of new warehouses, new or enhanced information technology hardware and applications and the acquisition of shopping centers with 2011 is primarily due to the payment of the first semi-annual dividend of $0.30 per share or $234.1 million, paid on December 3, 2012. Due to the growth of the Company’s dividend over the last several years, the Company decidedas the anchor tenant. The shopping center acquisitions are financed with internally generated funds and assumed debt, if prepayment penalties for the debt are determined to begin paying a semi-annual dividend rather than an annual dividend. To not delay any dividend paymentsbe significant. This capital program is subject to the Company’s stockholders, the first semi-annual dividend was paid on December 3, 2012.2013,2016, the cash requirements for current operations, capital expenditures, common stock repurchases and dividend payments are expected to be financed by internally generated funds or liquid assets. Based on the Company’s financial position, it is expected that short-term and long-term borrowings would be available to support the Company’s liquidity requirements, if needed.29, 2012: 2014- 2016- There- (Amounts are in thousands) $ 4,215,456 426,665 782,172 682,269 2,324,350 1,923,043 897,873 308,340 178,504 538,326 351,726 138,998 94,157 38,106 80,465 121,021 4,300 9,362 10,278 97,081 158,472 5,018 80,116 57,128 16,210 16,293 500 531 471 14,791 $ 6,786,011 1,473,354 1,274,678 966,756 3,071,223 Payments Due by Period Total 2016 (Amounts are in thousands) Contractual obligations: $ 3,684,651 416,196 762,129 638,090 1,868,236 1,969,748 1,052,376 310,971 175,037 431,364 Other long-term liabilities: 350,339 135,865 94,975 42,070 77,429 106,204 4,479 9,411 10,032 82,282 236,446 56,693 116,994 22,087 40,672 Other 101,896 81,185 1,814 1,331 17,566 Total $ 6,449,284 1,746,794 1,296,294 888,647 2,517,549 (1)(1) For a more detailed description of the operating lease obligations, refer to Note 8(a)9(a) Commitments and Contingencies - Operating Leases in the Notes to Consolidated Financial Statements.(2)(2) Purchase obligations include agreements to purchase goods or services that are enforceable and legally binding on the Company and that specify all significant terms, including fixed or minimum quantities to be purchased, fixed, minimum or variable price provisions and the approximate timing of the transaction. Purchase obligations exclude agreements that are cancelable within 30 days without penalty. (3)(3) 29, 2012,26, 2015, the Company had $7.5$6.2 million outstanding in trade letters of credit and $10.2$6.1 million in standby letters of credit to support certain of these purchase obligations.(4)(4) Purchase obligations include $1,026.8$902.7 million in real estate taxes, insurance and maintenance commitments related to operating leases. The actual amounts to be paid are variable and have been estimated based on current costs.(5)(5) 29, 2012,26, 2015, the Company had a restricted trust account in the amount of $170.0$163.2 million for the benefit of the Company’s insurance carrier related to support this obligation.self-insurance reserves.(6)(6) For a more detailed description of the postretirement benefit obligations, refer to Note 5 Postretirement Benefits in the Notes to Consolidated Financial Statements. (7)(7) For a more detailed description of the long-term debt obligations, refer to Note 4 Consolidation of Joint Ventures and Long-Term Debt in the Notes to Consolidated Financial Statements. 29, 201226, 2015 and December 31, 2011.27, 2014. Under this method, inventory is stated at cost, which is determined by applying a cost-to-retail ratio to each similar merchandise category’s ending retail value. The cost of the remaining inventories was determined using the first-in, first-out (FIFO) method. The FIFO cost of inventory approximates replacement or current cost. The FIFO method is used to value manufactured, seasonal, certain perishable and other miscellaneous inventory items because of fluctuating costs and inconsistent product availability. The Company also reduces inventory for estimated losses related to shrink.AFSavailable-for-sale (AFS) and carried at fair value. The Company evaluates whether AFS securities are OTTIother-than-temporarily impaired (OTTI) based on criteria that include the extent to which cost exceeds market value, the duration of the market decline, the credit rating of the issuer or security, the failure of the issuer to make scheduled principal or interest payments and the financial health and prospects of the issuer or security. Declines in the value of AFS securities determined to be OTTI are recognized in earnings and reported as OTTI losses, while declines in the value of AFS securities determined to be temporary are reported net of tax,income taxes as other comprehensive losses and included as a component of stockholders’ equity. If market or issuer conditions decline, the Company may incur future impairments.municipality issuedmunicipal bonds and collateralized mortgage obligations with high credit ratings; therefore, the Company believes the credit risk is low. The Company believes a one percentage100 basis point increase in long-term interest rates or 100 basis points, would result in an immaterial unrealized loss on its debt securities. Since the Company does not intend to sell its debt securities or will likely not be required to sell its debt securities prior to any anticipated recovery, such a theoreticalhypothetical temporary unrealized loss would impact comprehensive earnings, but not net earnings or cash flows.theoreticalhypothetical decrease of 10% in the value of the Company’s equity securities would result in an immaterial decrease in the value of long-term investments.Property, Plant and Equipment and DepreciationAssets are recorded at cost and are depreciated using the straight-line method over their estimated useful lives or the terms of their leases, if shorter, as follows: buildings and improvements are at 10 – 40 years, furniture, fixtures and equipment are at 3 – 20 years and leasehold improvements are at 5 – 40 years. The Company considers lease renewals in the useful life of its leasehold improvements when such renewals are reasonably assured.asset impaired.asset. The fair value is estimated based on expected discounted future cash flows. Assets to be disposed of are reported at the lower of the carrying amount or fair value less cost to sell and are no longer depreciated. Long-lived assets, including buildings and improvements, leasehold improvements, and furniture, fixtures and equipment, are evaluated for impairment at the supermarket level.2012.Vendor allowancesfees,allowances, received from a vendor in connection with the purchase or promotion of the vendor’s products are recognized as a reduction of cost of merchandise sold as earned. These allowances and credits are recognized as earned in accordance with the underlying agreement with the vendor and completion of the earnings process. Short-term vendor agreements with advance payment provisions are recorded as a current liability and are recognized over the appropriate period as earned according to the underlying agreements. Long-term vendor agreements with advance payment provisions are recorded as a noncurrent liability and are recognized over the appropriate period as earned according to the underlying agreements.self insuredself-insured for health care claims and property, plant and equipment losses. The Company has insurance coverage for losses in excess of self-insurance limits for fleet liability,workers’ compensation, general liability and workers’ compensationfleet liability claims. Historically, it has been infrequent for incurred claims to exceed these self-insurance limits.fleet liability,workers’ compensation, general liability and workers’ compensationfleet liability claims. These reserves are determined based on actual claims experience and an estimate of claims incurred but not reported including, where necessary, actuarial studies. The Company believes that the use of actuarial studies to determine self-insurance reserves represents a consistent method of measuring these subjective estimates. Actuarial projections of losses for general liability and workers’ compensation claims are discounted and subject to variability. The causes of variability include, but are not limited to, such factors as future interest and inflation rates, future economic conditions, claims experience, litigation trends and benefit level changes. The Company believes a one percentage100 basis point change in the discount rate or 100 basis points, would result in an immaterial change in the Company’s self-insurance reserves.private-labelprivate label sales; results of programs to control or reduce costs; changes in buying, pricing and promotional practices; changes in shrink management; changes in the general economy; changes in consumer spending; changes in population, employment and job growth in the Company’s principal markets; and other factors affecting the Company’s business within or beyond the Company’s control. These factors include changes in the rate of inflation, changes in federal, state and federal legislation or regulation,local laws and regulations, adverse determinations with respect to litigation or other claims, ability to recruit and retain employees, increases in operating costs including, but not limited to, labor costs, credit card fees and utility costs, particularly electric rates, ability to construct new supermarkets or complete remodels as rapidly as planned and stability of product costs. Other factors and assumptions not identified above could also cause the actual results to differ materially from those set forth in the forward-looking statements. TheExcept as may be required by applicable law, the Company assumes no obligation to publicly update these forward-looking statements.The Company’s cashnamely:namely interest rate risk, credit risk and secondary market risk. Most of the cash equivalents and short-term investments are held in money market investments and debt securities that mature in less than one year. Due to the quality of the short-term investments held, the Company does not expect the valuation of these investments to be significantly impacted by future market conditions.The Company’s long-termtax,income taxes as other comprehensive losses and included as a component of stockholders’ equity. If market or issuer conditions decline, the Company may incur future impairments.held by the Company at year end primarily consisted of corporate, state and municipality issuedmunicipal bonds and collateralized mortgage obligations with high credit ratings; therefore, the Company believes the credit risk is low. The Company believes a one percentage100 basis point increase in long-term interest rates or 100 basis points, would result in an immaterial unrealized loss on its debt securities. Since the Company does not intend to sell its debt securities or will likely not be required to sell its debt securities prior to any anticipated recovery, such a theoreticalhypothetical temporary unrealized loss would impact comprehensive earnings, but not net earnings or cash flows. held by the Company are subject to equity price risk that results from fluctuations in quoted market prices as of the balance sheet date. Market price fluctuations may result from perceived changes in the underlying economic characteristics of the issuer, the relative price of alternative investments and general market conditions. An equity security is determined to be OTTI if the Company does not expect to recover the cost of the equity security. A theoreticalhypothetical decrease of 10% in the value of the Company’s equity securities would result in an immaterial decrease in the value of long-term investments.Management’s Report on Internal Control over Financial ReportingManagement of the Company is responsible for establishing and maintaining adequate internal control over financial reporting (as defined in Rule 13a-15(f) and Rule 15d-15(f) under the Securities Exchange Act of 1934). The Company’s internal control over financial reporting is designed to provide reasonable assurance regarding the reliability of financial reporting and the preparation of financial statements for external purposes in accordance with U.S. generally accepted accounting principles. Because of inherent limitations, internal control over financial reporting may not prevent or detect misstatements. Also, projections of any evaluation of effectiveness to future periods are subject to the risk that controls may become inadequate because of changes in conditions, or that the degree of compliance with the policies or procedures may deteriorate.Management assessed the effectiveness of the Company’s internal control over financial reporting as of December 29, 2012. In making this assessment, management used the criteria set forth by the Committee of Sponsoring Organizations of the Treadway Commission inInternal Control – Integrated Framework. Based on this assessment and these criteria, management believes that the Company’s internal control over financial reporting was effective as of December 29, 2012.Index to Consolidated Financial Statements and ScheduleIndex to Consolidated Financial Statements and Schedule PagePage 21 29, 201226, 2015 and December 31, 2011 22 24 25 26 28 2929, 2012,26, 2015, December 31, 201127, 2014 and December 25, 201028, 2013 is submitted herewith: 42 29, 201226, 2015 and December 31, 2011,27, 2014, and the related consolidated statements of earnings, comprehensive earnings, cash flows and stockholders’ equity for each of the years in the three-year period ended December 29, 2012.26, 2015. In connection with our audits of the consolidated financial statements, we also have audited the financial statement schedule listed in the accompanying index. These consolidated financial statements and financial statement schedule are the responsibility of the Company’s management. Our responsibility is to express an opinion on these consolidated financial statements and financial statement schedule based on our audits.29, 201226, 2015 and December 31, 2011,27, 2014, and the results of their operations and their cash flows for each of the years in the three-year period ended December 29, 2012,26, 2015, in conformity with U.S. generally accepted accounting principles. Also in our opinion, the related financial statement schedule, when considered in relation to the basic consolidated financial statements taken as a whole, presents fairly, in all material respects, the information set forth therein.February 28, 201329, 2012 and27, 2014December 31, 2011Assets (Amounts are in thousands) $ 337,400 366,853 797,260 447,972 519,137 542,990 1,409,367 1,361,709 57,834 59,400 28,124 24,316 3,149,122 2,803,240 4,235,846 3,805,283 202,636 171,179 688,812 592,843 2,249,176 2,062,833 4,587,883 4,540,988 1,385,823 1,321,646 67,775 103,006 8,979,469 8,621,316 (4,288,753 ) (4,132,786 ) 4,690,716 4,488,530 $ 12,278,320 11,268,232 2015 2014 ASSETS (Amounts are in thousands) Current assets: Cash and cash equivalents $ 352,176 407,493 Short-term investments 1,376,698 999,169 Trade receivables 723,685 549,443 Merchandise inventories 1,740,513 1,597,683 Deferred tax assets 51,216 71,142 Prepaid expenses 70,145 108,619 Total current assets 4,314,433 3,733,549 Long-term investments 5,226,236 5,231,561 Other noncurrent assets 431,311 395,428 Property, plant and equipment: Land 1,157,619 936,185 Buildings and improvements 3,467,015 2,959,186 Furniture, fixtures and equipment 4,303,132 4,101,837 Leasehold improvements 1,635,791 1,514,200 Construction in progress 148,755 155,382 10,712,312 9,666,790 Accumulated depreciation (4,325,014 ) (3,943,848 ) Net property, plant and equipment 6,387,298 5,722,942 $ 16,359,278 15,083,480 Liabilities and Equity (Amounts are in thousands,
except par value) $ 1,306,996 1,133,120 430,395 405,818 138,998 125,569 109,091 110,207 230,486 221,713 5,018 15,124 --- 39,225 2,220,984 2,050,776 327,294 316,802 212,728 219,660 116,721 103,595 153,454 119,460 118,321 116,482 3,149,502 2,926,775 2,272,963 2,137,217 776,094 779,675 1,627,258 1,354,881 6,640,538 6,131,193 38,289 30,261 (2,272,963 ) (2,137,217 ) 6,809,216 6,158,793 46,639 45,447 9,128,818 8,341,457 --- --- $12,278,320 11,268,232 2015 2014 LIABILITIES AND EQUITY Current liabilities: Accounts payable $ 1,675,858 1,538,108 Accrued expenses: Contributions to retirement plans 513,072 477,154 Self-insurance reserves 135,865 151,153 Salaries and wages 131,253 120,372 Other 380,314 373,086 Current portion of long-term debt 56,693 24,936 Federal and state income taxes 9,634 12,982 Total current liabilities 2,902,689 2,697,791 Deferred tax liabilities 425,132 388,667 Self-insurance reserves 214,474 213,213 Accrued postretirement benefit cost 101,725 106,570 Long-term debt 179,753 192,702 Other noncurrent liabilities 104,243 139,314 Total liabilities 3,928,016 3,738,257 Common stock related to Employee Stock Ownership Plan (ESOP) 2,953,878 2,680,528 Stockholders’ equity: 770,175 774,472 Additional paid-in capital 2,556,391 2,200,892 Retained earnings 9,041,497 8,218,340 Accumulated other comprehensive earnings 26,268 109,134 Common stock related to ESOP (2,953,878 ) (2,680,528 ) Total stockholders’ equity 9,440,453 8,622,310 Noncontrolling interests 36,931 42,385 Total equity 12,431,262 11,345,223 Commitments and contingencies — — $ 16,359,278 15,083,480 29, 2012,26, 2015, December 31, 201127, 201425, 201028, 2013 (Amounts are in thousands, except per share amounts) $27,484,766 26,967,389 25,134,054 222,006 211,375 194,000 27,706,772 27,178,764 25,328,054 19,910,984 19,520,370 18,111,443 5,630,537 5,523,469 5,295,287 25,541,521 25,043,839 23,406,730 2,165,251 2,134,925 1,921,324 88,449 99,039 91,835 --- (6,082) --- 88,449 92,957 91,835 48,894 33,891 26,259 2,302,594 2,261,773 2,039,418 750,339 769,807 701,271 $ 1,552,255 1,491,966 1,338,147 782,553 784,815 786,378 $ 1.98 1.90 1.70 2015 2014 2013 (Amounts are in thousands, except per share amounts) Revenues: Sales $ 32,362,579 30,559,505 28,917,439 Other operating income 256,180 242,961 230,079 Total revenues 32,618,759 30,802,466 29,147,518 Costs and expenses: Cost of merchandise sold 23,459,610 22,232,650 20,937,319 Operating and administrative expenses 6,480,908 6,168,955 5,890,461 Total costs and expenses 29,940,518 28,401,605 26,827,780 Operating profit 2,678,241 2,400,861 2,319,738 Investment income 156,026 143,875 127,299 Other nonoperating income, net 34,994 25,385 18,652 Earnings before income tax expense 2,869,261 2,570,121 2,465,689 Income tax expense 904,213 834,813 811,735 Net earnings $ 1,965,048 1,735,308 1,653,954 Weighted average shares outstanding 774,428 778,708 780,188 Basic and diluted earnings per share $ 2.54 2.23 2.12 29, 2012,26, 2015, December 31, 201127, 201425, 201028, 2013 $ 1,552,255 1,491,966 1,338,147 19,956 10,041 13,102 (6,373 ) (12,202 ) (15,043 ) (5,555 ) (5,804 ) (3,038 ) $ 1,560,283 1,484,001 1,333,168 2015 2014 2013 (Amounts are in thousands) Net earnings $ 1,965,048 1,735,308 1,653,954 Other comprehensive earnings: (43,838 ) 58,968 65,861 (42,829 ) (35,842 ) (29,311 ) 3,801 (991 ) 12,160 Comprehensive earnings $ 1,882,182 1,757,443 1,702,664 29, 2012,26, 2015, December 31, 201127, 201425, 201028, 2013 $ 27,579,893 26,980,492 25,209,753 (24,279,245 ) (24,024,194 ) (22,253,046 ) (785,147 ) (658,213 ) (686,037 ) (293,359 ) (285,362 ) (274,305 ) 182,025 139,727 95,794 214,022 203,112 184,760 (13,982 ) (14,375 ) (10,951 ) 2,604,207 2,341,187 2,265,968 (697,112 ) (602,952 ) (468,530 ) 5,503 5,312 2,815 (1,882,223 ) (2,062,775 ) (1,598,759 ) 1,010,277 841,028 655,799 (1,563,555 ) (1,819,387 ) (1,408,675 ) (551,816 ) (497,570 ) (436,224 ) 197,448 206,245 178,914 (698,652 ) (418,680 ) (364,087 ) (18,277 ) (49,076 ) (10,875 ) 1,192 (1,767 ) 10,364 (1,070,105 ) (760,848 ) (621,908 ) (29,453 ) (239,048 ) 235,385 366,853 605,901 370,516 $ 337,400 366,853 605,901 2015 2014 2013 (Amounts are in thousands) Cash flows from operating activities: Cash received from customers $ 32,249,651 30,596,486 28,942,460 Cash paid to employees and suppliers (28,718,224 ) (27,045,219 ) (25,673,800 ) Income taxes paid (721,226 ) (895,758 ) (789,721 ) Self-insured claims paid (315,624 ) (317,441 ) (321,060 ) Dividends and interest received 219,589 222,134 205,923 Other operating cash receipts 249,588 235,642 222,178 Other operating cash payments (22,389 ) (18,612 ) (18,677 ) Net cash provided by operating activities 2,941,365 2,777,232 2,567,303 Cash flows from investing activities: Payment for capital expenditures (1,235,648 ) (1,374,124 ) (668,485 ) Proceeds from sale of property, plant and equipment 4,350 40,222 21,360 Payment for investments (2,764,436 ) (1,839,814 ) (2,442,298 ) Proceeds from sale and maturity of investments 2,149,233 1,532,007 1,367,922 Net cash used in investing activities (1,846,501 ) (1,641,709 ) (1,721,501 ) Cash flows from financing activities: Payment for acquisition of common stock (855,801 ) (688,339 ) (563,470 ) Proceeds from sale of common stock 345,319 284,105 242,211 Dividends paid (612,766 ) (577,227 ) (547,287 ) Repayments of long-term debt (30,164 ) (57,442 ) (16,803 ) Other, net 3,231 9,005 4,015 Net cash used in financing activities (1,150,181 ) (1,029,898 ) (881,334 ) Net (decrease) increase in cash and cash equivalents (55,317 ) 105,625 (35,532 ) Cash and cash equivalents at beginning of year 407,493 301,868 337,400 Cash and cash equivalents at end of year $ 352,176 407,493 301,868 (Amounts are in thousands) $ 1,552,255 1,491,966 1,338,147 493,239 492,639 507,341 28,419 67,145 14,124 304,285 291,240 275,547 7,002 95,848 20,722 24,855 13,734 19,896 (10,386 ) (19,886 ) (24,516 ) 108,300 80,890 48,113 22,517 (50,782 ) 16,165 (76,077 ) (70,277 ) 12,121 (3,374 ) (15,635 ) (8,054 ) 181,916 (51,741 ) 63,852 6,497 9,762 (13,494 ) (41,153 ) 15,763 (5,113 ) 5,912 (9,479 ) 1,117 1,051,952 849,221 927,821 $ 2,604,207 2,341,187 2,265,968 2015 2014 2013 (Amounts are in thousands) Reconciliation of net earnings to net cash provided by operating activities: Net earnings $ 1,965,048 1,735,308 1,653,954 Depreciation and amortization 581,892 513,393 501,689 Increase in LIFO reserve 25,996 30,743 14,787 369,017 338,979 319,175 Deferred income taxes 108,574 2,392 1,061 49,596 26,155 26,065 Gain on AFS securities (69,801 ) (58,413 ) (47,769 ) Net amortization of investments 137,883 137,533 133,422 Change in operating assets and liabilities providing (requiring) cash: Trade receivables (174,610 ) (8,829 ) (21,086 ) Merchandise inventories (168,826 ) (121,449 ) (112,397 ) Prepaid expenses and other noncurrent assets (12,571 ) (4,210 ) (1,757 ) Accounts payable and accrued expenses 114,811 268,491 76,083 Self-insurance reserves (14,027 ) 8,325 4,315 Federal and state income taxes 38,920 (86,910 ) 21,844 Other noncurrent liabilities (10,537 ) (4,276 ) (2,083 ) Total adjustments 976,317 1,041,924 913,349 Net cash provided by operating activities $ 2,941,365 2,777,232 2,567,303 29, 2012,26, 2015, December 31, 201127, 201425, 2010 Common
Stock Additional
Paid-in
Capital Retained
Earnings
(Acquired
from) Sold
to Stock-
holders
(Losses) Total
Stock-
holders’
Equity (Amounts are in thousands, except per share amounts) $780,566 837,969 4,637,884 --- 43,205 (1,862,350 ) 4,437,274 --- --- 1,338,147 --- (4,979 ) --- 1,333,168 --- --- (364,087 ) --- --- --- (364,087 ) 12,968 214,414 --- 21,813 --- --- 249,195 --- --- --- (436,224 ) --- --- (436,224 ) 2,255 39,625 --- 137,034 --- --- 178,914 (14,820 ) --- (262,557 ) 277,377 --- --- --- --- --- --- --- --- (154,346 ) (154,346 ) 780,969 1,092,008 5,349,387 --- 38,226 (2,016,696 ) 5,243,894 --- --- 1,491,966 --- (7,965 ) --- 1,484,001 --- --- (418,680 ) --- --- --- (418,680 ) 10,064 202,761 --- 48,599 --- --- 261,424 --- --- --- (497,570 ) --- --- (497,570 ) 2,920 60,112 --- 143,213 --- --- 206,245 (14,278 ) --- (291,480 ) 305,758 --- --- --- --- --- --- --- --- (120,521 ) (120,521 ) 779,675 1,354,881 6,131,193 --- 30,261 (2,137,217 ) 6,158,793 --- --- 1,552,255 --- 8,028 --- 1,560,283 --- --- (698,652 ) --- --- --- (698,652 ) 9,845 216,232 --- 52,829 --- --- 278,906 --- --- --- (551,816 ) --- --- (551,816 ) 2,650 56,145 --- 138,653 --- --- 197,448 (16,076 ) --- (344,258 ) 360,334 --- --- --- --- --- --- --- --- (135,746 ) (135,746 ) $776,094 1,627,258 6,640,538 --- 38,289 (2,272,963 ) 6,809,216 (Amounts are in thousands, except per share amounts) Balances at December 29, 2012 $ 776,094 1,627,258 6,640,538 — 38,289 (2,272,963 ) 6,809,216 Comprehensive earnings — — 1,653,954 — 48,710 — 1,702,664 Dividends, $0.70 per share — — (547,287 ) — — — (547,287 ) Contribution of 12,967 shares to retirement plans 9,548 214,371 — 76,926 — — 300,845 Acquisition of 21,602 shares from stockholders — — — (563,470 ) — — (563,470 ) Sale of 9,262 shares to stockholders 2,275 57,345 — 182,591 — — 242,211 Retirement of 11,196 shares (11,196 ) — (292,757 ) 303,953 — — — Change for ESOP related shares — — — — — (49,940 ) (49,940 ) Balances at December 28, 2013 776,721 1,898,974 7,454,448 — 86,999 (2,322,903 ) 7,894,239 Comprehensive earnings — — 1,735,308 — 22,135 — 1,757,443 Dividends, $0.74 per share — — (577,227 ) — — — (577,227 ) Contribution of 10,272 shares to retirement plans 8,063 235,362 — 66,289 — — 309,714 Acquisition of 21,356 shares from stockholders — — — (688,339 ) — — (688,339 ) Sale of 8,835 shares to stockholders 2,168 66,556 — 215,381 — — 284,105 Retirement of 12,480 shares (12,480 ) — (394,189 ) 406,669 — — — Change for ESOP related shares — — — — — (357,625 ) (357,625 ) Balances at December 27, 2014 774,472 2,200,892 8,218,340 — 109,134 (2,680,528 ) 8,622,310 Comprehensive earnings — — 1,965,048 — (82,866 ) — 1,882,182 Dividends, $0.79 per share — — (612,766 ) — — — (612,766 ) Contribution of 8,516 shares to retirement plans 6,172 247,139 — 79,248 — — 332,559 Acquisition of 21,276 shares from stockholders — — — (855,801 ) — — (855,801 ) Sale of 8,463 shares to stockholders 2,756 108,360 — 234,203 — — 345,319 Retirement of 13,225 shares (13,225 ) — (529,125 ) 542,350 — — — Change for ESOP related shares — — — — — (273,350 ) (273,350 ) Balances at December 26, 2015 $ 770,175 2,556,391 9,041,497 — 26,268 (2,953,878 ) 9,440,453 (a) primary business of operating retail food supermarkets in Florida, Georgia, Alabama, South Carolina, Tennessee and Tennessee. The Company has signed leases for supermarket sites in North Carolina expected to open in 2014.Carolina. The Company was founded in 1930 and later merged into another corporation that was originally incorporated in 1921. The Company has no other significant lines of business or industry segments. See percentage of consolidated sales by merchandise category on page 1.(b) (c) 20122015, 2014 and 20102013 include 52 weeks. Fiscal year 2011 includes 53 weeks.(d) (e) (f) 29, 201226, 2015 and December 31, 2011.27, 2014. Under this method, inventory is stated at cost, which is determined by applying a cost-to-retail ratio to each similar merchandise category’s ending retail value. The cost of the remaining inventories was determined using the first-in, first-out (FIFO) method. The FIFO cost of inventory approximates replacement or current cost. The FIFO method is used to value manufactured, seasonal, certain perishable and other miscellaneous inventory items because of fluctuating costs and inconsistent product availability. The Company also reduces inventory for estimated losses related to shrink. If all inventories were valued using the FIFO method, of valuing inventories had been used by the Company to value all inventories, then inventories and current assets would have been higher than reported by $374,977,000$446,503,000 and $346,558,000$420,507,000 as of December 29, 201226, 2015 and December 31, 2011,27, 2014, respectively.(g) All of the Company’s debttax,income taxes as other comprehensive losses and included as a component of stockholders’ equity.PUBLIX SUPER MARKETS, INC.Notes to Consolidated Financial Statements(h) 10 – 10–40 years 3 – 3–20 years 5 – 40 10–20 years(i) Capitalized Computer Software CostsThe Company capitalizes certain costs incurred in connection with developing or obtaining software for internal use. These costs are capitalized and amortized over a three year life. The amounts capitalized were $11,144,000, $9,818,000 and $7,514,000 for 2012, 2011 and 2010, respectively.(j)Long-Lived Assetsasset impaired.asset. The fair value is estimated based on expected discounted future cash flows. Assets to be disposed of are reported at the lower of the carrying amount or fair value less cost to sell and are no longer depreciated. Long-lived assets, including buildings and improvements, leasehold improvements, and furniture, fixtures and equipment, are evaluated for impairment at the supermarket level.(k)(j) self insuredself-insured for health care claims and property, plant and equipment losses. The Company has insurance coverage for losses in excess of self-insurance limits for fleet liability,workers’ compensation, general liability and workers’ compensationfleet liability claims. Self-insurance reserves are established for health care, fleet liability,workers’ compensation, general liability and workers’ compensationfleet liability claims. These reserves are determined based on actual claims experience and an estimate of claims incurred but not reported including, where necessary, actuarial studies. Actuarial projections of losses for general liability and workers’ compensation claims are discounted.(l)(k) As of December 29, 2012, accumulated other comprehensive earnings included net unrealized gains on AFS securities of $95,016,000, less tax effect of $36,730,000, and an unfunded postretirement benefit obligation of $32,589,000, less tax effect of $12,592,000. As of December 31, 2011, accumulated other comprehensive earnings included net unrealized gains on AFS securities of $72,879,000, less tax effect of $28,176,000, and an unfunded postretirement benefit obligation of $23,536,000, less tax effect of $9,094,000.PUBLIX SUPER MARKETS, INC.Notes to Consolidated Financial Statements(m)(l) (n)(m) (o)(n) commissions on licensee sales, mall gift card commissions, vending machine commissions, money transfer fees vending machine commissions and coupon redemption income.(p)(o) Vendor allowancesare recognized over the appropriate period as earned according to the underlying agreements. Long-term vendor agreements with advance payment provisions are recorded as a noncurrent liability and are recognized over the appropriate period as earned according to the underlying agreements.The amount of cooperative advertising allowances recognized as a reduction of cost of merchandise sold was $9,190,000, $8,898,000 and $10,715,000 for 2012, 2011 and 2010, respectively.(q)(p) $208,295,000, $202,405,000$248,454,000, $232,499,000 and $191,788,000$217,451,000 for 2012, 20112015, 2014 and 2010,2013, respectively.(r)(q) (s)(r) (t)(s) PUBLIX SUPER MARKETS, INC.Notes to Consolidated Financial Statements(u)(t) a mutual fundfunds, exchange traded funds and equity securities. In addition, the value of collateralized mortgage obligation securities is determined by using models to develop prepayment and interest rate scenarios for these securities which have prepayment features. AFS securities that are included in this category are primarily debt securities (tax exempt and taxable bonds).29, 201226, 2015 and December 31, 2011: Fair Value Level 1 Level 2 Level 3 (Amounts are in thousands) $ 5,033,106 713,741 4,319,365 --- $ 4,253,255 473,099 3,780,156 --- PUBLIX SUPER MARKETS, INC.Notes to Consolidated Financial Statements Fair Value Level 1 Level 2 Level 3 (Amounts are in thousands) December 26, 2015 $ 6,602,934 1,049,791 5,553,143 — December 27, 2014 6,230,730 1,439,360 4,791,370 — 29, 201226, 2015 and December 31, 2011: Gross Gross Amortized Unrealized Unrealized Fair Cost Gains Losses Value (Amounts are in thousands) Tax exempt bonds $3,115,963 33,787 2,646 3,147,104 Taxable bonds 1,141,514 17,667 355 1,158,826 Restricted investments 170,000 431 --- 170,431 Equity securities 510,613 58,631 12,499 556,745 $4,938,090 110,516 15,500 5,033,106 $2,488,135 36,657 550 2,524,242 1,226,136 20,015 1,514 1,244,637 170,000 --- 3,019 166,981 296,105 35,564 14,274 317,395 $4,180,376 92,236 19,357 4,253,255 Fair Value (Amounts are in thousands) 2015 Tax exempt bonds $ 3,336,841 12,038 2,737 3,346,142 Taxable bonds 2,214,366 1,492 10,399 2,205,459 Restricted investments 164,548 — 1,389 163,159 Equity securities 836,153 78,378 26,357 888,174 $ 6,551,908 91,908 40,882 6,602,934 2014 Tax exempt bonds $ 3,205,647 17,460 4,011 3,219,096 Taxable bonds 1,569,828 3,005 4,592 1,568,241 Restricted investments 170,000 — 776 169,224 Equity securities 1,092,985 191,493 10,309 1,274,169 $ 6,038,460 211,958 19,688 6,230,730 $23,772,000$94,778,000 for 2012.2015. Realized losses on sales of AFS securities totaled $13,386,000$24,977,000 for 2012. There were no OTTI losses on AFS securities in 2012.$35,864,000$61,390,000 for 2011.2014. Realized losses on sales of AFS securities totaled $15,978,000$2,977,000 for 2011, including OTTI losses on equity securities of $6,082,000. There were no OTTI losses on debt securities in 2011.$28,935,000$64,637,000 for 2010.2013. Realized losses on sales of AFS securities totaled $4,419,000$16,868,000 for 2010. There were no OTTI losses on AFS securities in 2010.29, 201226, 2015 and December 31, 201127, 2014 are as follows: 2012 2011 Amortized Fair Amortized Fair Cost Value Cost Value (Amounts are in thousands) $ 792,946 797,260 445,296 447,972 2,725,036 2,755,043 2,492,484 2,524,020 520,800 526,924 348,427 356,808 218,695 226,703 428,064 440,079 4,257,477 4,305,930 3,714,271 3,768,879 170,000 170,431 170,000 166,981 510,613 556,745 296,105 317,395 $4,938,090 5,033,106 4,180,376 4,253,255 PUBLIX SUPER MARKETS, INC.Notes to Consolidated Financial Statements 2015 2014 (Amounts are in thousands) Due in one year or less $ 1,375,450 1,376,698 996,674 999,169 Due after one year through five years 3,951,600 3,948,654 3,493,708 3,501,821 Due after five years through ten years 161,732 162,999 183,552 183,168 Due after ten years 62,425 63,250 101,541 103,179 5,551,207 5,551,601 4,775,475 4,787,337 Restricted investments 164,548 163,159 170,000 169,224 Equity securities 836,153 888,174 1,092,985 1,274,169 $ 6,551,908 6,602,934 6,038,460 6,230,730 29, 201226, 2015 and December 31, 2011: Fair Unrealized Fair Unrealized Fair Unrealized (Amounts are in thousands) $566,914 2,646 --- --- 566,914 2,646 81,876 355 --- --- 81,876 355 209,759 8,878 14,260 3,621 224,019 12,499 $858,549 11,879 14,260 3,621 872,809 15,500 $138,892 536 6,026 14 144,918 550 201,538 1,514 --- --- 201,538 1,514 166,981 3,019 --- --- 166,981 3,019 86,236 13,899 1,889 375 88,125 14,274 $593,647 18,968 7,915 389 601,562 19,357 Total (Amounts are in thousands) 2015 Tax exempt bonds $ 890,907 2,264 63,474 473 954,381 2,737 Taxable bonds 1,676,719 9,988 70,309 411 1,747,028 10,399 Restricted investments 163,159 1,389 — — 163,159 1,389 Equity securities 274,517 20,561 16,112 5,796 290,629 26,357 $ 3,005,302 34,202 149,895 6,680 3,155,197 40,882 2014 Tax exempt bonds $ 689,909 2,359 93,454 1,652 783,363 4,011 Taxable bonds 936,512 3,666 68,035 926 1,004,547 4,592 Restricted investments 169,224 776 — — 169,224 776 Equity securities 107,352 8,373 6,229 1,936 113,581 10,309 $ 1,902,997 15,174 167,718 4,514 2,070,715 19,688 329448 AFS securities contributing to the total unrealized loss of $15,500,000$40,882,000 as of December 29, 2012.26, 2015. Unrealized losses related to debt securities are primarily driven bydue to interest rate volatility impacting the market value of certain bonds. The Company continues to receive scheduled principal and interest payments on these debt securities. Unrealized losses related to the equity securities are primarily driven by stockdue to temporary equity market volatility.29, 2012,26, 2015, the carrying amounts of the assets and liabilities of the consolidated JVs were $157,675,000$141,355,000 and $60,364,000,$64,928,000, respectively. As of December 31, 2011,27, 2014, the carrying amounts of the assets and liabilities of the consolidated JVs were $177,226,000$149,745,000 and $76,249,000,$62,867,000, respectively. The assets are owned by and the liabilities are obligations of the JVs, not the Company, except for a portion of the long-term debt of certain JVs guaranteed by the Company. The JVs are financed with capital contributions from the members, loans and/or the cash flows generated by the JV owned shopping centers once in operation. Total earnings attributable to noncontrolling interests for 2012, 20112015, 2014 and 20102013 were immaterial. The Company’s involvement with these JVs does not have a significant effect on the Company’s financial condition, results of operations or cash flows.PUBLIX SUPER MARKETS, INC.Notes to Consolidated Financial Statements$42,165,000$40,287,000 and $34,299,000$92,678,000 during 20122015 and 2011,2014, respectively. Maturities of JV loans range from April 2014June 2016 through June 2015August 2017 and have either (1) fixed interest rates ranging from 4.5% to 5.3% or (2) variable interest rates based on a LIBOR index plus basis points ranging from 195 basis points175 to 250 basis points. Maturities of assumed shopping center loans range from September 2013January 2016 through January 2027 and have fixed interest rates ranging from 5.1%4.0% to 7.5%.29, 2012,26, 2015, the aggregate annual maturities and scheduled payments of long-term debt are as follows: $ 5,018 38,487 41,629 49,818 7,310 16,210 $ 158,472 Year (Amounts are in thousands) 2016 $ 56,693 2017 79,928 2018 37,066 2019 3,809 2020 18,278 Thereafter 40,672 $ 236,446 Actuarial losses were recognized in other comprehensive earnings of $9,053,000, less tax effect of $3,498,000, in 2012, $9,459,000, less tax effect of $3,655,000, in 2011 and $4,951,000, less tax effect of $1,913,000, in 2010.$3,785,000, $3,146,000$3,719,000, $3,671,000 and $2,626,000$3,769,000 during 2012, 20112015, 2014 and 2010,2013, respectively.PUBLIX SUPER MARKETS, INC.Notes to Consolidated Financial StatementsThe following tables provide a29, 201226, 2015 and December 31, 2011: 2012 2011 (Amounts are in thousands) $ 107,624 94,776 148 163 4,866 5,301 12,168 10,530 (3,785) (3,146) 121,021 107,624 --- --- 3,785 3,146 (3,785) (3,146) --- --- $121,021 107,624 $ 4,300 4,029 116,721 103,595 $121,021 107,624 2015 2014 (Amounts are in thousands) Change in benefit obligation: Benefit obligation as of beginning of year $ 110,808 107,324 Service cost 17 50 Interest cost 4,348 4,939 Actuarial (gain) loss (5,250 ) 2,166 Benefit payments (3,719 ) (3,671 ) Benefit obligation as of end of year 106,204 110,808 Change in fair value of plan assets: Fair value of plan assets as of beginning of year — — Employer contributions 3,719 3,671 Benefit payments (3,719 ) (3,671 ) Fair value of plan assets as of end of year — — Unfunded status of the plan as of end of year $ 106,204 110,808 Current liability $ 4,479 4,238 Noncurrent liability 101,725 106,570 Total recognized liability $ 106,204 110,808 $ 4,300 4,561 4,801 5,029 5,249 29,756 67,325 $ 121,021 Year (Amounts are in thousands) 2016 $ 4,479 2017 4,629 2018 4,782 2019 4,935 2020 5,097 2021 through 2025 28,214 Thereafter 54,068 $ 106,204 2012 2011 2010 (Amounts are in thousands) $ 148 163 175 4,866 5,301 5,291 3,115 1,071 95 $8,129 6,535 5,561 2015 2014 2013 (Amounts are in thousands) Service cost $ 17 50 114 Interest cost 4,348 4,939 4,521 Amortization of actuarial loss 945 552 5,253 Net periodic postretirement benefit cost $ 5,310 5,541 9,888 PUBLIX SUPER MARKETS, INC.Notes to Consolidated Financial Statements 2012 2011 2010 3.8% 4.6% 5.7% 4.0% 4.0% 4.0% 2015 2014 2013 Discount rate 4.3% 4.0% 4.7% Rate of compensation increase 4.0% 4.0% 4.0% 2012 2011 2010 4.6% 5.7% 6.2% 4.0% 4.0% 4.0% 2015 2014 2013 Discount rate 4.0% 4.7% 3.8% Rate of compensation increase 4.0% 4.0% 4.0% $278,529,000, $267,099,000$337,703,000, $310,050,000 and $253,093,000$292,075,000 for 2012, 20112015, 2014 and 2010,2013, respectively.TheSinceUnder the Company’s common stock is not currently traded on an established securities market,administration of the ESOP’s put option, if the owners of distributed shares desire to sell their shares, the Company is required to purchase the shares at fair value for a 15-monthspecified time period after distribution of the shares from the ESOP. The fair value of distributed shares subject to the put option totaled $126,647,000$427,226,000 and $116,824,000$243,992,000 as of December 29, 201226, 2015 and December 31, 2011,27, 2014, respectively. The cost of the shares held by the ESOP totaled $2,146,316,000$2,526,652,000 and $2,020,393,000$2,436,536,000 as of December 29, 201226, 2015 and December 31, 2011,27, 2014, respectively. Due to the Company’s obligation under the put option, the distributed shares subject to the put option and the shares held by the ESOP are classified as temporary equity in the mezzanine section of the consolidated balance sheets and totaled $2,272,963,000$2,953,878,000 and $2,137,217,000$2,680,528,000 as of December 29, 201226, 2015 and December 31, 2011,27, 2014, respectively. The fair value of the shares held by the ESOP totaled $5,418,856,000$9,201,171,000 and $4,917,283,000$7,811,906,000 as ofDecember 29, 201226, 2015 and December 31, 2011,27, 2014, respectively.planPlan for the benefit of eligible employees. The 401(k) planPlan is a voluntary defined contribution plan. Eligible employees may contribute up to 10% of their eligible annual compensation, subject to the maximum contribution limits established by federal law. The Company may make a discretionary annual matching contribution to eligible participants of this plan as determined by the Board of Directors. During 2012, 20112015, 2014 and 2010,2013, the Board of Directors approved a match of 50% of eligible annual contributions up to 3% of eligible wages,annual compensation, not to exceed a maximum match of $750$750 per employee. The match, which is determined as of the last day of the plan year and paid in the subsequent plan year, is in common stock of the Company. Compensation expense recorded for the Company’s match to the 401(k) planPlan was $24,957,000, $24,141,000$30,775,000, $28,475,000 and $22,454,000$26,714,000 for 2012, 20112015, 2014 and 2010,2013, respectively.2012, 20112015, 2014 and 20102013 were allocated as follows: (Amounts are in thousands) $ 750,339 769,807 701,271 5,056 (5,015 ) (3,135 ) $ 755,395 764,792 698,136 2015 2014 2013 (Amounts are in thousands) Earnings $ 904,213 834,813 811,735 Other comprehensive (losses) earnings (52,183 ) 13,938 30,674 $ 852,030 848,751 842,409 (Amounts are in thousands) $654,715 9,861 664,576 88,622 (2,859 ) 85,763 $743,337 7,002 750,339 $592,275 90,486 682,761 81,684 5,362 87,046 $673,959 95,848 769,807 $601,098 23,778 624,876 79,451 (3,056 ) 76,395 $680,549 20,722 701,271 Current Deferred Total (Amounts are in thousands) 2015 Federal $ 758,084 97,586 855,670 State 37,555 10,988 48,543 $ 795,639 108,574 904,213 2014 Federal $ 754,187 2,021 756,208 State 78,234 371 78,605 $ 832,421 2,392 834,813 2013 Federal $ 725,463 (17 ) 725,446 State 85,211 1,078 86,289 $ 810,674 1,061 811,735 (Amounts are in thousands) $ 805,908 791,621 713,796 55,746 56,580 49,657 (76,900 ) (46,675 ) (40,718 ) (34,415 ) (31,719 ) (21,464 ) $ 750,339 769,807 701,271 2015 2014 2013 (Amounts are in thousands) Federal tax at statutory tax rate $ 1,004,241 899,542 862,991 State income taxes (net of federal tax benefit) 31,553 51,093 56,088 ESOP dividend (62,630 ) (61,270 ) (59,561 ) Other, net (68,951 ) (54,552 ) (47,783 ) $ 904,213 834,813 811,735 29, 201226, 2015 and December 31, 201127, 2014 are as follows: (Amounts are in thousands) $116,901 114,522 49,876 48,825 46,688 41,515 15,986 18,047 11,768 11,687 23,045 18,642 $264,264 253,238 $497,932 491,485 24,086 7,831 11,706 11,324 $533,724 510,640 2015 2014 (Amounts are in thousands) Deferred tax assets: Self-insurance reserves $ 118,082 120,965 Retirement plan contributions 61,898 55,673 Postretirement benefit cost 40,883 42,733 Leases 19,250 21,374 Inventory capitalization 15,072 14,437 Purchase allowances 13,792 16,717 Reserves not currently deductible 10,873 23,326 Other 1,489 1,533 Total deferred tax assets $ 281,339 296,758 Deferred tax liabilities: $ 615,408 528,469 Investment valuation 16,390 69,777 Other 23,457 16,037 Total deferred tax liabilities $ 655,255 614,283 29, 201226, 2015 and December 31, 2011.20082010 through 20112014 tax years, and the Internal Revenue Service is currently auditing the 20082012 through 20112014 tax years. The periods subject to examination for the Company’s state returns are the 20072011 through 20112014 tax years. The Company believes that the outcome of any examination will not have a material effect on its financial condition, results of operations or cash flows. As of December 31, 2011,an immaterial accrual$55,000,000 of unrecognized tax benefits that were effectively settled in 2015. Income tax expense for income tax related interest expense.2012 and 2011. Because the Company does not have any unrecognized tax benefits as of December 29, 2012, there will be no effect on the Company’s effective income tax rate in future periods due to the recognition of unrecognized tax benefits.(8) Accumulated Other Comprehensive Earnings (Amounts are in thousands) Balances at December 29, 2012 $ 58,286 (19,997 ) 38,289 Unrealized gain on AFS securities 65,861 — 65,861 Net realized gain on AFS securities reclassified to investment income (29,311 ) — (29,311 ) Amortization of actuarial gain reclassified to operating and administrative expenses — 12,160 12,160 Net other comprehensive earnings 36,550 12,160 48,710 Balances at December 28, 2013 94,836 (7,837 ) 86,999 Unrealized gain on AFS securities 58,968 — 58,968 Net realized gain on AFS securities reclassified to investment income (35,842 ) — (35,842 ) Amortization of actuarial loss reclassified to operating and administrative expenses — (991 ) (991 ) Net other comprehensive earnings (losses) 23,126 (991 ) 22,135 Balances at December 27, 2014 117,962 (8,828 ) 109,134 Unrealized loss on AFS securities (43,838 ) — (43,838 ) Net realized gain on AFS securities reclassified to investment income (42,829 ) — (42,829 ) Amortization of actuarial gain reclassified to operating and administrative expenses — 3,801 3,801 Net other comprehensive (losses) earnings (86,667 ) 3,801 (82,866 ) Balances at December 26, 2015 $ 31,295 (5,027 ) 26,268 (a)Operating Leases payment of variable lease obligations, including real estate taxes, insurance, maintenance and, for certain premises, additional rentals based on a percentage of sales in excess of stipulated minimums (excess rent). The payment of variable real estate taxes, insurance and maintenance is generally based on the Company’s pro-rata share of total shopping center square footage. The Company recognizes rent expense for operating leases with rent escalation clauses on a straight-line basis over the applicable lease term. The Company estimates excess rent, where applicable, based on annual sales projections and uses the straight-line method to amortize thisthe cost to rent expense. The annual sales projections are reviewed periodically and adjusted if necessary. Additionally, the Company has operating leases for certain transportation and other equipment.2012, 20112015, 2014 and 20102013 is as follows: (Amounts are in thousands) $ 432,450 410,590 410,390 112,819 110,900 117,249 (4,564 ) (4,699 ) (5,912 ) $ 540,705 516,791 521,727 2015 2014 2013 (Amounts are in thousands) Minimum rentals $ 426,703 439,525 429,755 Contingent rentals 123,152 118,839 116,445 Sublease rental income (4,979 ) (4,867 ) (4,820 ) $ 544,876 553,497 541,380 29, 2012,26, 2015, future minimum lease payments for all noncancelable operating leases and related subleases are as follows: Minimum
Rental
Commitments Sublease
Rental
Income Net (Amounts are in thousands) $ 431,438 4,773 426,665 407,895 4,031 403,864 379,976 1,668 378,308 355,038 1,062 353,976 328,927 634 328,293 2,325,425 1,075 2,324,350 $4,228,699 13,243 4,215,456 Year Net (Amounts are in thousands) 2016 $ 421,226 5,030 416,196 2017 397,261 4,018 393,243 2018 372,623 3,737 368,886 2019 339,057 3,360 335,697 2020 303,068 675 302,393 Thereafter 1,869,706 1,470 1,868,236 $ 3,702,941 18,290 3,684,651 commitments,obligations, including insurance and maintenance. Contingent rentals represent variable lease obligations, including real estate taxes, insurance, maintenance and, infor certain instances,premises, excess rent. Rental income was $40,367,000, $36,057,000$95,519,000, $63,026,000 and $32,576,000$47,056,000 for 2012, 20112015, 2014 and 2010,2013, respectively. The amounts future rental payments to be received underfor all noncancelable operating leases are $34,458,000, $28,830,000, $22,516,000, $17,202,000 and $12,268,000 for the years 2013 through 2017, respectively, and $53,672,000 thereafter.(b)Letters of CreditYear (Amounts are in thousands) 2016 $ 79,509 2017 67,892 2018 54,642 2019 42,354 2020 29,888 Thereafter 124,939 $ 399,224 29, 2012,26, 2015, the Company had $7,544,000$6,245,000 outstanding in trade letters of credit and $10,233,000$6,138,000 in standby letters of credit to support certain purchase obligations.PUBLIX SUPER MARKETS, INC.(c)Notes to Consolidated Financial StatementsLitigation(c)Litigationa party insubject from time to time to various legallawsuits, claims and actions consideredcharges arising in the normal course of business. The Company believes its recorded reserves are adequate in light of the probable and estimable liabilities. The estimated amount of reasonably possible losses for lawsuits, claims and charges, individually and in the aggregate, is considered to be immaterial. In the opinion of management, the ultimate resolution of these legal proceedings will not have a material adverse effect on the Company’s financial condition, results of operations or cash flows.(9)20122015 and 2011.2014. All quarters have 13 weeks, except the fourth quarter of 2011 which has 14 weeks. Quarter (Amounts are in thousands, except per share amounts) $7,126,096 6,838,426 6,702,251 7,039,999 6,526,747 6,291,900 6,208,015 6,514,859 409,411 381,631 368,426 392,787 0.52 0.49 0.47 0.50 $6,836,402 6,621,633 6,425,379 7,295,350 6,264,682 6,079,262 5,978,544 6,721,351 398,167 382,369 311,902 399,528 0.51 0.48 0.40 0.51 Quarter First Second Third Fourth (Amounts are in thousands, except per share amounts) 2015 Revenues $ 8,412,745 8,018,031 7,902,144 8,285,839 Costs and expenses 7,638,951 7,349,591 7,344,018 7,607,958 Net earnings 548,918 482,741 412,314 521,075 Basic and diluted earnings per share 0.71 0.62 0.53 0.68 2014 Revenues $ 7,875,702 7,564,660 7,437,109 7,924,995 Costs and expenses 7,168,648 7,003,741 6,919,123 7,310,093 Net earnings 493,706 404,060 384,218 453,324 Basic and diluted earnings per share 0.63 0.52 0.49 0.58 29, 2012,26, 2015, December 31, 201127, 201425, 201028, 2013 Balance at
Beginning
of Year Additions
Charged to
Income Deductions
From
Reserves Balance at
End of
Year (Amounts are in thousands) $125,569 306,788 293,359 138,998 219,660 --- 6,932 212,728 $345,229 306,788 300,291 351,726 $114,133 296,798 285,362 125,569 221,337 --- 1,677 219,660 $335,470 296,798 287,039 345,229 $119,375 269,063 274,305 114,133 229,589 --- 8,252 221,337 $348,964 269,063 282,557 335,470 (Amounts are in thousands) Year Ended December 26, 2015 Reserves not deducted from assets: Self-insurance reserves: Current $ 151,153 300,336 315,624 135,865 Noncurrent 213,213 1,261 — 214,474 $ 364,366 301,597 315,624 350,339 Year Ended December 27, 2014 Reserves not deducted from assets: Self-insurance reserves: Current $ 150,860 317,734 317,441 151,153 Noncurrent 205,181 8,032 — 213,213 $ 356,041 325,766 317,441 364,366 Year Ended December 28, 2013 Reserves not deducted from assets: Self-insurance reserves: Current $ 138,998 332,922 321,060 150,860 Noncurrent 212,728 — 7,547 205,181 $ 351,726 332,922 328,607 356,041 Securities and Exchange Commission’sSEC’s rules and forms, and that such information has been accumulated and communicated to the Company’s management, including the Company’s Chief Executive Officer and Chief Financial Officer, in a manner that allows timely decisions regarding required disclosure.29, 201226, 2015 that have materially affected, or are reasonably likely to materially affect, the internal control over financial reporting.Management’s report ontheCompany is responsible for establishing and maintaining adequate internal control over financial reporting (as defined in Rule 13a-15(f) and Rule 15d-15(f) under the Securities Exchange Act of 1934). The Company’s internal control over financial reporting is designed to provide reasonable assurance regarding the reliability of financial reporting and the preparation of financial statements for external purposes in accordance with U.S. generally accepted accounting principles. Because of inherent limitations, internal control over financial reporting may not prevent or detect misstatements. Also, projections of any evaluation of effectiveness to future periods are subject to the risk that controls may become inadequate because of changes in conditions or that the degree of compliance with the policies or procedures may deteriorate.is includedas of December 26, 2015. In making this assessment, management used the criteria set forth by the Committee of Sponsoring Organizations of the Treadway Commission in Internal Control – Integrated Framework (2013). Based on page 19this assessment and these criteria, management believes that the Company’s internal control over financial reporting was effective as of this report.December 26, 2015.in Part I underon the caption “Executive Officers of the Company.”following page. All other information concerning the directors and executive officers of the Companyregarding this item is incorporated by reference from the Proxy Statement of the Company (2013(2016 Proxy Statement), which the Company intends to file no later than 120 days after its fiscal year end.of the Company on Form 10-K for the year ended December 28, 2002.Name Age Business Experience During Last Five Years Executive Officers of the Company John A. Attaway, Jr. 57 Senior Vice President, General Counsel and Secretary of the Company. 2000 Hoyt R. Barnett 72 Vice Chairman of the Company and Trustee of the Employee Stock Ownership Plan (ESOP) to July 2015, Vice Chairman and Trustee on Committee of Trustees of the ESOP thereafter. 1977 David E. Bornmann 58 Vice President of the Company to March 2013, Senior Vice President thereafter. 1998 William E. Crenshaw 65 Chief Executive Officer of the Company. 1990 Laurie Z. Douglas 52 Senior Vice President and Chief Information Officer of the Company. 2006 John T. Hrabusa 60 Senior Vice President of the Company. 2004 Randall T. Jones, Sr. 53 President of the Company. 2003 David P. Phillips 56 Chief Financial Officer and Treasurer of the Company to July 2015, Chief Financial Officer, Treasurer and Trustee on Committee of Trustees of the ESOP thereafter. 1990 Michael R. Smith 56 Vice President of the Company to March 2013, Senior Vice President thereafter. 2005 Officers of the Company Scott E. Brubaker 57 Vice President of the Company. 2005 Jeffrey G. Chamberlain 59 2011 Joseph DiBenedetto, Jr. 56 2011 G. Gino DiGrazia 53 Vice President of the Company. 2002 David S. Duncan 62 Vice President of the Company. 1999 Sandra J. Estep 56 Vice President of the Company. 2002 Linda S. Hall 56 Vice President of the Company. 2002 Mark R. Irby 60 Vice President of the Company. 1989 Linda S. Kane 50 Vice President and Assistant Secretary of the Company. 2000 Erik J. Katenkamp 44 2013 L. Renee Kelly 54 2013 Christopher M. Litz 52 Regional Director of Retail Operations of the Company to January 2016, Vice President thereafter. 2016 Thomas M. McLaughlin 65 Vice President of the Company. 1994 56 Business Development Director of Grocery Retail Support of the Company to March 2013, Vice President thereafter. 2013 Kevin S. Murphy 45 Regional Director of Retail Operations of the Company to March 2014, Vice President thereafter. 2014 Dale S. Myers 63 Vice President of the Company. 2001 Alfred J. Ottolino 50 Vice President of the Company. 2004 Charles B. Roskovich, Jr. 54 Vice President of the Company to January 2011, Senior Vice President to January 2013, Vice President thereafter. 2008 Marc H. Salm 55 Vice President of the Company. 2008 Alison Midili Smith 45 2013 Jeffrey D. Stephens 60 Director of Manufacturing Operations of the Company to March 2013, Vice President thereafter. 2013 Casey D. Suarez, Sr. 56 Director of Warehousing of the Company to May 2014, Vice President thereafter. 2014 Steven B. Wellslager 49 2013 executive compensationthis item is incorporated by reference from the 20132016 Proxy Statement.security ownership of certain beneficial owners and management and related stockholder mattersthis item is incorporated by reference from the 20132016 Proxy Statement.certain relationships, related transactions and director independencethis item is incorporated by reference from the 20132016 Proxy Statement.principal accounting fees and servicesthis item is incorporated by reference from the 20132016 Proxy Statement.(a)Consolidated Financial Statements and Schedule(b)Exhibits3.1(a) of the Company dated June 25, 1979 as amended by (i) Articles of Amendment dated February 22, 1984, (ii) Articles of Amendment dated June 24, 1992, (iii) Articles of Amendment dated June 4, 1993, and (iv) Articles of Amendment dated April 18, 2006 are incorporated by reference to the exhibits to the Quarterly Report of the Company on Form 10-Q for the quarter ended April 1, 2006.3.1(b) of the Company dated April 18, 2006 are incorporated by reference to the exhibits to the Quarterly Report of the Company on Form 10-Q for the quarter ended April 1, 2006.3.2 of the Company are incorporated by reference to an exhibit to the Current Report on Form 8-K dated November 14, 2012.10 of the Company on Form 10-Q for the quarter ended March 31, 2001 between the Company and all of its directors and officers as reported in the Company’s Quarterly Reports on Form 10-Q, Annual Reports on Form 10-K and Current Reports on Form 8-K for the periods ended or dated March 31, 2001, June 30, 2001, September 29, 2001, June 29, 2002, December 28, 2002, September 27, 2003, December 27, 2003, March 27, 2004, May 18, 2005, July 1, 2005, January 30, 2006, January 30, 2008, December 22, 2008, April 14, 2009, January 1, 2011, January 4, 2013, April 1, 2013, April 16, 2013, April 1, 2014, May 3, 2014, April 14, 2015 and January 4, 2013.10.2 of the Company on Form 10-K for the year ended December 31, 2011.10.5 of the Company on Form 8-K dated December 14, 2011 between the Company and the Trustee of its ESOP, one of the Trustees of its 401(k) SMART Plan and with each member of its 401(k) SMART Plan investment committee.10.6 10.7 Indemnification Agreement is incorporated by reference to the form attached as an exhibit to the Current Report on Form 8-K dated July 1, 2015 between the Company and the Trustees on the Committee of Trustees of the ESOP. 14 of the Company on Form 10-K for the year ended December 28, 2002.21 23 31.1 31.2 32.1 32.2 101 Company’s Annual Report on Form 10-K for the year ended December 29, 2012,26, 2015 is formatted in Extensible Business Reporting Language: (i) Consolidated Balance Sheets, (ii) Consolidated Statements of Earnings, (iii) Consolidated Statements of Comprehensive Earnings, (iv) Consolidated Statements of Cash Flows, (v) Consolidated Statements of Stockholders’ Equity and (vi) Notes to Consolidated Financial Statements. PUBLIX SUPER MARKETS, INC. February 28, 2013 March 1, 2016 By: /s/ Carol Jenkins Barnett Director February 28, 2013March 1, 2016Carol Jenkins Barnett /s/ Hoyt R. Barnett Vice Chairman and Director February 28, 2013March 1, 2016Hoyt R. Barnett /s/ William E. Crenshaw Chief Executive Officer and Director February 28, 2013March 1, 2016William E. Crenshaw (Principal Executive Officer) /s/ Jane B. Finley Director February 28, 2013March 1, 2016Jane B. Finley /s/ Sherrill W. HudsonG. Thomas Hough Director February 28, 2013March 1, 2016Sherrill W. HudsonG. Thomas Hough /s/ Charles H. Jenkins, Jr. Chairman of the Board and Director February 28, 2013March 1, 2016Charles H. Jenkins, Jr. /s/ Howard M. Jenkins Director February 28, 2013March 1, 2016Howard M. Jenkins /s/ E. Vane McClurgStephen M. Knopik Director February 28, 2013March 1, 2016E. Vane McClurgStephen M. Knopik /s/ Maria A. Sastre Director February 28, 2013March 1, 2016Maria A. Sastre /s/ David P. Phillips Chief Financial Officer and Treasurer February 28, 2013March 1, 2016David P. Phillips (Principal Financial and Accounting Officer)