| þ | ANNUAL REPORT PURSUANT TO SECTION 13 OR 15(d) OF THE SECURITIES EXCHANGE ACT OF 1934 |
OF THE SECURITIES EXCHANGE ACT OF 1934
2015
| ¨ | TRANSITION REPORT PURSUANT TO SECTION 13 OR 15(d) OF THE SECURITIES EXCHANGE ACT OF 1934 |
OF THE SECURITIES EXCHANGE ACT OF 1934
| Delaware | 76-0515284 | |
(State or other jurisdiction of incorporation or organization) | (I.R.S. Employer Identification No.) | |
|
| |
Title of each class |
| |
| Common Stock, par value $.01 per share | New York and Chicago Stock Exchanges | |
Note — Checking the box above will not relieve any registrant required to file reports pursuant to Section 13 or 15(d) of the Exchange Act from their obligations under those Sections.
Large accelerated filer þ | Accelerated filer ¨ | Non-accelerated filer ¨ | Smaller reporting company ¨ | |||
| (Do not check if a smaller reporting company) | ||||||
State the
| ||
|
INDICATE THE NUMBER OF SHARES OUTSTANDING OF EACH OF THE REGISTRANT’S CLASSES OF COMMON STOCK, AS OF THE LATEST PRACTICABLE DATE. New York Stock Exchange on June 30, 2015, was approximately $3.4 billion.
19, 2016 was 57,514,337.
| Document | Part of the Form 10-K into which incorporated | |
| Portions of Tenneco Inc.’s Definitive Proxy Statement for the Annual Meeting of Stockholders to be held May | Part III | |
general economic, business and market conditions; our ability to source and procure needed materials, components and other products and services in accordance with customer demand and at competitive prices; the cost and outcome of existing and any future claims, legal proceedings or investigations, including, but not limited to, any of the foregoing arising in connection with the ongoing global antitrust investigation, product performance, product safety or intellectual property rights; changes in consumer demand, prices and our ability to have our products included on top selling vehicles, including any shifts in consumer preferences away from light trucks, which tend to be higher margin products for our customers and us, to other lower margin vehicles, for which we may or may not have supply arrangements; changes in consumer demand for our automotive, commercial or aftermarket products, or changes in automotive and commercial vehicle manufacturers’ production rates and their actual and forecasted requirements for our products, due to difficult economic conditions, such as the the overall highly competitive nature of the automobile and commercial vehicle parts industries, and any resultant inability to realize the sales represented by our awarded book of business (which is based on anticipated pricing and volumes over the life of the applicable program); the loss of any of our large original equipment manufacturer (“OEM”) customers (on whom we depend for a substantial portion of our revenues), or the loss of market shares by these customers if we are unable to achieve increased sales to other OEMs or any change in customer demand due to delays in the adoption or enforcement of worldwide emissions regulations; our ability to successfully execute cash management and other cost reduction plans, including our economic, exchange rate and political conditions in the countries where we operate or sell our products; increases in the costs of raw materials, including our ability to successfully reduce the impact of any such cost increases through materials substitutions, cost reduction initiatives, customer recovery and other methods; the negative impact of the cyclical nature of the global vehicle industry, including the performance of the global aftermarket sector and the impact of vehicle parts’ longer product lives;Reportreport contains forward-looking statements within the meaning of the Private Securities Litigation Reform Act of 1995 concerning, among other things, our prospects and business strategies. These forward-looking statements are included in various sections of this report, including the section entitled “Outlook” appearing in Item 7 of this report. The words “may,” “will,” “believe,” “should,” “could,” “plan,” “expect,” “anticipate,” “estimate,” and similar expressions (and variations thereof), identify these forward-looking statements. Although we believe that the expectations reflected in these forward-looking statements are based on reasonable assumptions, these expectations may not prove to be correct. Because these forward-looking statements are also subject to risks and uncertainties, actual results may differ materially from the expectations expressed in the forward-looking statements. Important factors that could cause actual results to differ materially from the expectations reflected in the forward-looking statements include:significant production cuts by automotive manufacturers during 2008 and 2009, as well as any future reductionprolonged recession in demand for our products due to the sovereign debt crisis in Europe;current European cost reduction initiatives, and to realize anticipated benefits from these plans;suppliers (such as the 2008 strike at American Axle, which disrupted our supply of products for significant General Motors (GM) platforms);suppliers;higher fuel pricesprice volatility on transportation and logistics costs, raw material costs, and discretionary purchases of vehicles or aftermarket products;
costs related to product warranties and other customer satisfaction actions;
the cost and outcome of existing and any future claims or legal proceedings, including, but not limited to, claims or proceedings against us or our customers relating to product performance, product safety or intellectual property rights;
the failure or breach of our information technology systems, including the consequences of any misappropriation, exposure or corruption of sensitive information stored on such systems and the interruption to our business that such failure or breach may cause;
the impact of consolidation among vehicle parts suppliers and customers on our ability to compete;
changes in distribution channels or competitive conditions in the markets and countries where we operate, including the impact of changes in distribution channels for aftermarketincreasing competition from lower cost, private-label products on our ability to increase or maintain aftermarket sales;
economic, exchange rate and political conditions in the countries where we operate or sell our products;
customer acceptance of new products;
new technologies that reduce the demand for certain of our products or otherwise render them obsolete;
our ability to introduce new products and technologies that satisfy customers' needs in a timely fashion;
our ability to successfully integrate any acquisitions that we complete and effectively manage our joint ventures and other third-party relationships;
changes by the Financial Accounting Standards Board or the Securities and Exchange Commission of authoritative generally accepted accounting principles or policies;
changes in accounting estimates and assumptions, including changes based on additional information;
any changes by the International Organization for Standardization (ISO) or other such committees in their certification protocols for processes and products, which may have the effect of delaying or hindering our ability to bring new products to market;
the impact of changes inthe extensive, increasing and compliance withchanging laws and regulations including:to which we are subject, including environmental laws and regulations, which may result in our incurrence of environmental liabilities in excess of the amount reserved; and any changes to the timing of the funding requirements for our pension and other postretirement benefit liabilities;
the potential impairment in the carrying value of our long-lived assets and goodwill or our deferred tax assets;
potential volatility in our effective tax rate;
natural disasters, such as the 2011 earthquake in Japan and flooding in Thailand, and any resultant disruptions in the supply or production of goods or services to us or by us or in demand by our customers;
acts of war and/or terrorism, as well as actions taken or to be taken by the United States and other governments as a result of further acts or threats of terrorism, and the impact of these acts on economic, financial and social conditions in the countries where we operate; and
the timing and occurrence (or non-occurrence) of other transactions, events and circumstances which may be beyond our control.
| PART I | ||||||||
Item 1. | ||||||||
Item 1A. | ||||||||
Item 1B. | ||||||||
Item 2. | ||||||||
Item 3. | ||||||||
Item 4. | ||||||||
Item 4.1. | ||||||||
| PART II | ||||||||
Item 5. | ||||||||
Item 6. | ||||||||
Item 7. | ||||||||
Item 7A. | ||||||||
Item 8. | ||||||||
Item 9. | ||||||||
Item 9A. | ||||||||
| Item 9B. | ||||||||
| PART III | |||||||
Item 10. | ||||||||
Item 11. | ||||||||
Item 12. | ||||||||
Item 13. | ||||||||
Item 14. | ||||||||
| PART IV | ||||||||
Item 15. | ||||||||
18, 2016.
SevenEight of our nine directors are independent under the NYSE listing standards.
Independent directors are scheduled to meet separately in executive session after every regularly scheduled Board of Directors meeting.
We have a lead independent director, Mr. Paul T. Stecko.
All members meet the independence standards for audit committee membership under the NYSE listing standards and applicable Securities and Exchange Commission (“SEC”) rules. Two members of the Audit Committee, Mr. Dennis J. Letham and Mr. Thomas C. Freyman, have been designated by the Board as “audit committee financial experts,” as defined in the SEC rules, and all members of the Audit Committee satisfy the NYSE’s financial literacy requirements. The Audit Committee operates under a written charter which governs its duties and responsibilities, including its sole authority to appoint, review, evaluate and replace our independent auditors. The Audit Committee has adopted policies and procedures governing the pre-approval of all audit, audit-related, tax and other services provided by our independent auditors.
All members meet the independence standards for compensation and nominating committee membership under the NYSE listing standards. The Compensation/Nominating/Governance Committee operates under a written charter that governs its duties and responsibilities, including the responsibility for executive compensation. We have an Executive Compensation Subcommittee which has the responsibility to consider and approve compensation for our executive officers which is intended to qualify as “performance based compensation” under Section 162(m) of the Internal Revenue Code. We have adopted Corporate Governance Principles, including qualification and independence standards for directors. We have adopted Stock Ownership Guidelines to align the interests of our executives with the interests of stockholders and promote our commitment to sound corporate governance. The Stock Ownership Guidelines apply to the independent directors, the Chairman and Chief Executive Officer, and all other officers with a rank of Vice President or higher. The Audit Committee has established a process for confidential and anonymous submission by our employees, as well as submissions by other interested parties, regarding questionable accounting or auditing matters. Additionally, the Board of Directors has established a process for stockholders to communicate with the Board of Directors, as a whole, or any independent director. We have adopted a Code of Ethical Conduct for Financial Managers, which applies to our Chief Executive Officer, Chief Operating Officer, Chief Financial Officer, Controller and other key financial managers. This code is filed as Exhibit 14 to this report. We also operate under a Code of Conduct that applies to all directors, officers and employees and includes provisions ranging from restrictions on gifts to conflicts of interests. All salaried employees are required to affirm annually their acceptance of, and compliance with, the Code of Conduct. We have adopted a Policy and Procedure for Transactions With Related Persons, under which our We have adopted a written policy for all issuances by our company of compensatory awards in the form of our common stock or any derivative of We comply with and operate in a manner consistent with the legislation outlawing extensions of credit in the form of a personal loan to or for our directors or executive officers. Within each geographical area, each operating segment manufactures and distributes either clean air or ride performance products primarily for the original equipment and aftermarket industries. Each of the six operating segments constitutes a reportable segment. Costs related to other business activities, primarily corporate headquarter functions, are disclosed separately from the six operating segments as "Other". We evaluate segment performance based primarily on earnings before interest expense, income taxes, and noncontrolling interests. Products are transferred between segments and geographic areas on a basis intended to reflect as nearly as possible the "market value" of the products. North America Europe, South America and India Asia Pacific Intergroup sales Total North America Europe, South America and India Asia Pacific Total North America Europe, South America and India Asia Pacific Total Interest expense (net of interest capitalized) Income tax expense Noncontrolling interests Engines 2016. performance development efforts. from their parts suppliers fully integrated, functional modules and systems made possible with the development of advanced electronics in addition to innovative, individual vehicle components and parts that may not readily interface together. “Modules” are groups of component parts arranged in close physical proximity to each other within a vehicle. Modules are often assembled by the supplier and shipped to the OEM for installation in a vehicle as a unit. Integrated shock and spring units, seats, instrument panels, axles and door panels are examples. “Systems” are groups of component parts located throughout a vehicle which operate together to provide a specific vehicle functionality. Emission control systems, anti-lock braking systems, safety restraint systems, roll control systems and powertrain systems are examples. world. 57 percent in 2020 based on data provided by IHS Automotive. and Increased Competition from Lower cost, Private-Label Products products and a reputation for customer service provide benefits to both wholesalers and retailers. Emission Control Products & Systems Aftermarket Original Equipment OE Value-add OE Substrate(1) Ride Control Products & Systems Aftermarket Original Equipment Total Revenues 2015. AM General (Iveco) PSA Peugeot Citroen Kubota Customer General Motors Ford Motor 2015. During periods of economic recession, OE sales traditionally decline due to reduced consumer demand for automobiles and other capital goods. Aftermarket sales tend not to be as adversely affected during periods of economic downturn, as consumers forego new vehicle purchases and keep their vehicles longer, thereby increasing demand for repair and maintenance services. By participating in both the OE and aftermarket segments, we generally see a smaller revenue decline during economic downturns than the overall change in OE production. Catalytic converters and diesel oxidation catalysts — Devices consisting of a substrate coated with precious metals enclosed in a steel casing used to reduce harmful gaseous emissions such as carbon monoxide; Diesel Particulate Filters (DPFs) — Devices to capture and regenerate particulate matter emitted from diesel engines; Burner systems — Devices which actively combust fuel and air inside the exhaust system to create extra heat for DPF regeneration, or to improve the efficiency of SCR systems; Lean NOx traps — Devices which reduce nitrogen oxide (NOx) emissions from diesel powertrains using capture and store technology; Hydrocarbon vaporizers and injectors — Devices to add fuel to a diesel exhaust system in order to regenerate SCR-coated diesel particulate filters (SDPF) systems - Lightweight and compact devices combining the SCR catalyst and the particulate filter onto the same substrate for reducing NOx and particulate matter emissions; Mufflers and resonators — Devices to provide noise elimination and acoustic tuning; Fabricated Pipes — Utilized to connect various parts of both the hot and cold ends of an exhaust system; Hydroformed assemblies — Forms in various geometric shapes, such as Y-pipes or T-pipes, which provide optimization in both design and installation as compared to conventional pipes; Aftertreatment control units — Computerized electronic devices that utilize embedded software to regulate the performance of active aftertreatment systems, including the control of sensors, injectors, vaporizers, pumps, heaters, valves, actuators, wiring harnesses, relays and other mechatronic components. Shock absorbers — A broad range of mechanical shock absorbers and related components for light- and heavy-duty vehicles, including twin-tube and monotube shock absorbers; Struts — A complete line of struts and strut assemblies for light vehicles; Other — We also offer other ride Paccar. production system called the Tenneco Manufacturing System (TMS), that is designed to eliminate waste, develop skills, share best practices and lead our manufacturing enterprise to reduce overall costs, while maintaining quality standards and reducing manufacturing cycle time. As part of TMS, we use Six Sigma techniques both in manufacturing and design to minimize product defects and improve operational efficiencies. We deploy new technology to differentiate our products from our competitors’ and to achieve higher quality and productivity. We continue to adapt our capacity to customer demand, both expanding capabilities in growth areas as well as reallocating capacity away from segments in decline. in Europe. India, and 13 in Asia Pacific. Of the seven ride performance engineering and technical facilities, two are located in North America, four in Europe, South America and India, and one in Asia Pacific. facilities located in Europe and India. Adaptive damping systems — adapt to the vehicle’s motion to better control undesirable vehicle motions; Electronically adjustable suspensions — change suspension performance based on a variety of inputs such as steering, braking, vehicle height, and velocity; and Air leveling systems — manually or automatically adjust the height of the vehicle. To help make electronic suspension more affordable to a wider range of vehicles, we are designing an innovative, electronically-controlled DRiV™ suspension system that features hydraulic valve technology we purchased in 2014 from Sturman Industries. Management the applicable standard's requirements. Each employee is expected to follow the relevant standards, policies, and procedures contained in the Global Business Policy Manual. Market Segments aggressively revenues in both 2015 and 2014. and Adjust Manufacturing Footprint and Engineering Capabilities In addition, we built out our engineering capabilities in Poland, as well as the expansion of our testing capabilities in Germany. filters which were first sold in the OE market and then tailored for the aftermarket. vehicle manufacturers. Italian company, VRM S.p.A. closure. 2017. For example, as a result of the economic downturn in 2008 and 2009, we needed to amend our senior credit agreement to revise the financial ratios we are required to maintain. Even though we were able to obtain that amendment, we cannot assure you that we would be able to obtain an amendment on commercially reasonable terms, or at all, if required in the future. our annual structural costs in the region. outside suppliers to guarantee or warrant their products and to be responsible for the operation of these component products in new vehicles sold to consumers. Warranty claims may range from individual customer claims to full recalls of all products in the field. We cannot assure you that costs associated with providing product warranties will not be material, or that those costs will not exceed any amounts reserved in our consolidated financial statements. For a description of our accounting policies regarding warranty reserves, see “Management’s Discussion and Analysis of Financial Condition and Results of Operations — Critical Accounting Policies” included in Item 7. In addition, violations of the laws and regulations we are subject to could result in civil and criminal fines, penalties and sanctions against us, our officers or our employees, as well as prohibitions on the conduct of our business, and could also materially affect our reputation, business and results of operations. compensate them for their discontinued use or replacing infringing technology with non-infringing technology; or cessation of the manufacture, use or sale of the infringing products. Any of the foregoing results could have a material adverse effect on our business, financial condition, results of operations or our competitive position. aftermarket business. 2014. currency exchange rate fluctuations; exposure to local political conditions, including the risk of seizure of assets by a foreign government; exposure to local social unrest, including any resultant acts of war, terrorism or similar events; exposure to local public health issues and the resultant impact on economic and political conditions; hyperinflation in certain foreign countries; controls on the repatriation of cash, including imposition or increase of withholding and other taxes on remittances and other payments by foreign subsidiaries; export and import restrictions; and requirements for manufacturers to use locally produced goods. facilities located in Europe and India. estimates and are subject to revision as more information becomes available about the extent of remediation required. At some sites, we expect that other parties will contribute liquidity. liquidity. liquidity. Name and Age Offices Held Josep Fornos Timothy E. Jackson Kenneth R. Trammell Gregg Bolt James D. Harrington Gregg Bolt — Mr. Bolt was named our Senior Vice President, Global Human Resources and Administration in February 2013. Prior to joining Tenneco, Mr. Bolt worked for Quad/Graphics, Inc. as Executive Vice President, Human Resources and Administration from March 2009 to January 2013. Previously, he was with Johnson Controls Inc. for more than 10 years, serving most recently as Vice President, Human Resources for JCI’s Building Efficiency division. corporate governance and compliance. Mr. Harrington joined us in January 2005 as Corporate Counsel and was named Vice President — Law in July 2007. Prior to joining Tenneco, he worked at Mayer Brown LLP in the firm’s corporate and securities practice. Quarter 2012 1st 2nd 3rd 4th 2011 1st 2nd 3rd 4th Period October 2012 November 2012 December 2012 Total 2017. Tenneco Inc. S&P 500 Peer Group Statements of Income (Loss) Data: Net sales and operating revenues — North America Europe, South America and India Asia Pacific Intergroup sales Earnings (loss) before interest expense, income taxes, and noncontrolling interests North America Europe, South America and India Asia Pacific Total Interest expense (net of interest capitalized) Income tax expense Net income (loss) Less: Net income attributable to noncontrolling interests Net income (loss) attributable to Tenneco Inc. Weighted average shares of common stock outstanding — Basic Diluted Basic earnings (loss) per share of common stock Diluted earnings (loss) per share of common stock Balance Sheet Data (at year end): Total assets Short-term debt Long-term debt Redeemable noncontrolling interests Total Tenneco Inc. shareholders’ equity Noncontrolling interests Total equity Statement of Cash Flows Data: Net cash provided by operating activities Net cash used by investing activities Net cash used by financing activities Cash payments for plant, property and equipment Other Data: EBITDA including noncontrolling interests(e) Ratio of EBITDA including noncontrolling interests to interest expense Ratio of net debt (total debt less cash and cash equivalents) to EBITDA including noncontrolling interests(f) Ratio of earnings to fixed charges(g) Net income (loss) Noncontrolling interests Income tax expense Interest expense, net of interest capitalized Depreciation and amortization of other intangibles Total EBITDA including noncontrolling interests other business activities, primarily corporate headquarter functions, are disclosed separately from the six operating segments as "Other." truck, off-highway and other revenue mainly in South America and China. Year ended December 31, 2011 Volume and mix Material Currency exchange rates Restructuring Other costs Year ended December 31, 2012 unfavorable currency. timing of customers' recoveries. currency impact. for 2015 and 2014, respectively. EBIT for 2015 also benefited from the timing of a customer recovery in China Clean Air of $5 million. EBIT for 2014 included a $7 million adjustment to workers' compensation reserves. 2014 North America Original Equipment Ride Control Emission Control Total North America Original Equipment North America Aftermarket Ride Control Emission Control Total North America Aftermarket Total North America Europe Original Equipment Ride Control Emission Control Total Europe Original Equipment Europe Aftermarket Ride Control Emission Control Total Europe Aftermarket South America & India Total Europe, South America & India Asia Australia Total Asia Pacific Total Tenneco North America Original Equipment Ride Control Emission Control Total North America Original Equipment North America Aftermarket Ride Control Emission Control Total North America Aftermarket Total North America Europe Original Equipment Ride Control Emission Control Total Europe Original Equipment Europe Aftermarket Ride Control Emission Control Total Europe Aftermarket South America & India Total Europe, South America & India Asia Australia Total Asia Pacific Total Tenneco North America Original Equipment Ride Control Emission Control Total North America Original Equipment North America Aftermarket Ride Control Emission Control Total North America Aftermarket Total North America Europe Original Equipment Ride Control Emission Control Total Europe Original Equipment Europe Aftermarket Ride Control Emission Control Total Europe Aftermarket South America & India Total Europe, South America & India Asia Australia Total Asia Pacific Total Tenneco North America Europe South America India Total Europe, South America & India China Australia revenues. 2013 North America Original Equipment Ride Control Emission Control Total North America Original Equipment North America Aftermarket Ride Control Emission Control Total North America Aftermarket Total North America Europe Original Equipment Ride Control Emission Control Total Europe Original Equipment Europe Aftermarket Ride Control Emission Control Total Europe Aftermarket South America & India Total Europe, South America & India Asia Australia Total Asia Pacific Total Tenneco North America Original Equipment Ride Control Emission Control Total North America Original Equipment North America Aftermarket Ride Control Emission Control Total North America Aftermarket Total North America Europe Original Equipment Ride Control Emission Control Total Europe Original Equipment Europe Aftermarket Ride Control Emission Control Total Europe Aftermarket South America & India Total Europe, South America & India Asia Australia Total Asia Pacific Total Tenneco North America Original Equipment Ride Control Emission Control Total North America Original Equipment North America Aftermarket Ride Control Emission Control Total North America Aftermarket Total North America Europe Original Equipment Ride Control Emission Control Total Europe Original Equipment Europe Aftermarket Ride Control Emission Control Total Europe Aftermarket South America & India Total Europe, South America & India Asia Australia Total Asia Pacific Total Tenneco North America Europe South America India Total Europe, South America & India China Australia revenues. North America Europe, South America and India Asia Pacific 2014 North America Restructuring and related expenses Pullman property recoveries(1) Europe, South America and India Restructuring and related expenses Asset impairment charge(2) Asia Pacific Restructuring and related expenses Goodwill impairment charge(3) 2014. 2014. North America Europe, South America and India Asia Pacific 2013 North America Restructuring and related expenses Pension Charges(1) Europe, South America and India Restructuring and related expenses Asia Pacific Restructuring and related expenses Goodwill impairment charge(2) 2013. EBIT for 2013. North America Europe, South America and India Asia Pacific Total Tenneco 2013 currency. Australia. 2013. Restructuring and Other Charges &A, $7 million in engineering expense, $4 million in other expenses and $1 million in depreciation and amortization. In 2015, we incurred $63 million in restructuring and related costs Employee Severance and Termination Benefits $0.81. Cash provided (used) by: Operating activities Investing activities Financing activities 2014 each 2015 and 2014. Cash provided (used) by: Operating activities Investing activities Financing activities the ramp up of recently launched programs, additional content on commercial truck and off-highway programs to meet emissions regulations, and year-over-year growth in the aftermarket. We anticipate a currency headwind in the first quarter of approximately two percent based on current exchange rates. 2017. $160 million and our 2016 tax rate to be between 31 percent to 32 percent. Short-term debt and maturities classified as current Long-term debt Total debt Total redeemable noncontrolling interests Total noncontrolling interests Tenneco Inc. shareholders’ equity Total equity Total capitalization benefits. Leverage Ratio (maximum) Interest Coverage Ratio (minimum) 8, 2019. requirements. The second priority facility also monetizes certain accounts receivable generated in the U.S. or Canada that would otherwise be ineligible under the first priority securitization facility. The 2014. 2013. December 31, Obligations: Revolver borrowings Senior term loans Senior notes Notes payable to customers Debentures Other subsidiary debt and capital lease obligations Short-term debt Debt and capital lease obligations Operating leases Interest payments Capital commitments Total payments by the sponsoring or participating employers of the Walker Plans. and Estimates Future reversals of existing taxable temporary differences; Taxable income or loss, based on recent results, exclusive of reversing temporary differences and carryforwards; Tax-planning strategies; and Taxable income in prior carryback years if carryback is permitted under the relevant tax law. related to our Asia Pacific Ride Performance reporting unit. 2014. in 2014. forward contracts was a net asset position of $1 million at December 31, Australian dollars British pounds Canadian dollars South African rand U.S. dollars statements of Tenneco Inc. located in Part II Item 8 — Financial Statements and Supplemental Data is incorporated herein by reference. year. At December 31, 2012, and for the Year Then Ended Revenues from external customers Intersegment revenues Interest income Depreciation and amortization of intangibles EBIT, Earnings (loss) before interest expense, income taxes and noncontrolling interests Total assets Equity in net assets of unconsolidated affiliates Expenditures for plant, property and equipment Noncash items other than depreciation and amortization. At December 31, 2011, and for the Year Then Ended Revenues from external customers Intersegment revenues Interest income Depreciation and amortization of intangibles EBIT, Earnings (loss) before interest expense, income taxes and noncontrolling interests Total assets Equity in net assets of unconsolidated affiliates Expenditures for plant, property and equipment Noncash items other than depreciation and amortization At December 31, 2010, and for the Year Then Ended Revenues from external customers Intersegment revenues Interest income Depreciation and amortization of intangibles EBIT, Earnings (loss) before interest expense, income taxes and noncontrolling interests Total assets Equity in net assets of unconsolidated affiliates Expenditures for plant, property and equipment Noncash items other than depreciation and amortization QUANTITATIVE AND QUALITATIVE DISCLOSURES ABOUT MARKET RISK. 2015. 24, 2016 24, 2016 Revenues Net sales and operating revenues Costs and expenses Cost of sales (exclusive of depreciation and amortization shown below) Goodwill impairment charge Engineering, research, and development Selling, general, and administrative Depreciation and amortization of other intangibles Other income (expense) Loss on sale of receivables Other expense Earnings before interest expense, income taxes, and noncontrolling interests Interest expense (net of interest capitalized of $4 million each for 2012, 2011 and 2010, respectively) Earnings before income taxes and noncontrolling interests Income tax expense Net income Less: Net income attributable to noncontrolling interests Net income attributable to Tenneco Inc. Earnings per share Weighted average shares of common stock outstanding — Basic Diluted Basic earnings per share of common stock Diluted earnings per share of common stock Net Income Accumulated Other Comprehensive Income (Loss) Cumulative Translation Adjustment Balance January 1 Translation of foreign currency statements Balance December 31 Additional Liability for Pension and Postretirement Benefits Balance January 1 Additional Liability for Pension and Postretirement benefits, net of tax Balance December 31 Balance December 31 Other comprehensive income (loss) Comprehensive Income Net Income Accumulated Other Comprehensive Income (Loss) Cumulative Translation Adjustment Balance January 1 Translation of foreign currency statements Balance December 31 Additional Liability for Pension and Postretirement Benefits Balance January 1 Additional liability for pension and postretirement benefits, net of tax Balance December 31 Balance December 31 Other comprehensive loss Comprehensive Income Net Income Accumulated Other Comprehensive Income (Loss) Cumulative Translation Adjustment Balance January 1 Translation of foreign currency statements Balance December 31 Additional Liability for Pension and Postretirement Benefits Balance January 1 Additional liability for pension and postretirement benefits, net of tax of $1 million Balance December 31 Balance December 31 Other comprehensive income (loss) Comprehensive Income Current assets: Cash and cash equivalents Receivables — Customer notes and accounts, net Other Inventories Deferred income taxes Prepayments and other Total current assets Other assets: Long-term receivables, net Goodwill Intangibles, net Deferred income taxes Other Plant, property, and equipment, at cost Less — Accumulated depreciation and amortization Total Assets Current liabilities: Short-term debt (including current maturities of long-term debt) Trade payables Accrued taxes Accrued interest Accrued liabilities Other Total current liabilities Long-term debt Deferred income taxes Postretirement benefits Deferred credits and other liabilities Commitments and contingencies Total liabilities Redeemable noncontrolling interests Tenneco Inc. Shareholders’ equity: Common stock Premium on common stock and other capital surplus Accumulated other comprehensive loss Retained earnings (accumulated deficit) Less — Shares held as treasury stock, at cost Total Tenneco Inc. shareholders’ equity Noncontrolling interests Total equity Total liabilities, redeemable noncontrolling interests and equity Operating Activities Net income Adjustments to reconcile net income to cash provided by operating activities — Goodwill impairment charge Depreciation and amortization of other intangibles Deferred income taxes Stock-based compensation Loss on sale of assets Changes in components of working capital — Increase in receivables Increase in inventories (Increase) decrease in prepayments and other current assets Increase in payables Increase (decrease) in accrued taxes Decrease in accrued interest Increase (decrease) in other current liabilities Change in long-term assets Change in long-term liabilities Other Net cash provided by operating activities Investing Activities Proceeds from sale of assets Cash payments for plant, property, and equipment Cash payments for software related intangible assets Cash payments for net assets purchased Other Net cash used by investing activities Financing Activities Retirement of long-term debt Issuance of long-term debt Debt issuance costs of long-term debt Purchase of common stock under the share repurchase program Issuance of common stock Increase in bank overdrafts Net increase (decrease) in revolver borrowings and short-term debt excluding current maturities of long-term debt Net increase in short-term borrowings secured by accounts receivable Capital contribution from noncontrolling interest partner Purchase of additional noncontrolling equity interest Distribution to noncontrolling interests partners Net cash used by financing activities Effect of foreign exchange rate changes on cash and cash equivalents Increase (decrease) in cash and cash equivalents Cash and cash equivalents, January 1 Cash and cash equivalents, December 31 (Note) Supplemental Cash Flow Information Cash paid during the year for interest Cash paid during the year for income taxes (net of refunds) Non-cash Investing and Financing Activities Period end balance of trade payables for plant, property, and equipment Common Stock Balance January 1 Issued Issued pursuant to benefit plans Stock options exercised Balance December 31 Premium on Common Stock and Other Capital Surplus Balance January 1 Purchase of additional noncontrolling equity interest Premium on common stock issued pursuant to benefit plans Balance December 31 Accumulated Other Comprehensive Loss Balance January 1 Other comprehensive loss Balance December 31 Retained Earnings (Accumulated Deficit) Balance January 1 Net income attributable to Tenneco Inc. Balance December 31 Less — Common Stock Held as Treasury Stock, at Cost Balance January 1 Purchase of common stock through stock repurchase program Balance December 31 Total Tenneco Inc. shareholders’ equity Noncontrolling interests: Balance January 1 Net income Capital contribution Sale of twenty percent equity interest to Tenneco Inc. Other comprehensive income (loss) Dividends declared Balance December 31 Total equity Summary of Accounting Policies Balance January 1 Net income attributable to redeemable noncontrolling interests Sale of 25 percent equity interest to Tenneco Inc Capital Contributions Other comprehensive income Dividends declared Balance December 31 Finished goods Work in process Raw materials Materials and supplies Work in process includes purchased parts such as substrates coated with precious metals. related to our Asia Pacific Ride Performance reporting unit. Balance as January 1 Goodwill Accumulated impairment losses Translation adjustments Balance at December 31 Goodwill Accumulated impairment losses Balance as January 1 Goodwill Accumulated impairment losses Translation adjustments Goodwill impairment charge Balance at December 31 Goodwill Accumulated impairment losses We have capitalized certain intangible assets, primarily technology rights, trademarks and patents, based on their estimated fair value at the date we acquired them. We amortize our finite useful life intangible assets on a straight-line basis over periods ranging from Customer contract Patents Technology rights Other Total 2018, 2019 and 2020. Land, buildings, and improvements Machinery and equipment Other, including construction in progress 2014. recovered or paid. sufficient taxable income within the carryforward periods provided for in the tax law for each tax jurisdiction. We have considered the following possible sources of taxable income when assessing the realization of our deferred tax assets: Future reversals of existing taxable temporary differences; Taxable income or loss, based on recent results, exclusive of reversing temporary differences and carryforwards; Tax-planning strategies; and Taxable income in prior carryback years if carryback is permitted under the relevant tax law. similar to the computation of basic earnings per share, except that we adjust the weighted-average number of shares outstanding to include estimates of additional shares that would be issued if potentially dilutive common shares had been issued. In addition, we adjust income available to common shareholders to include any changes in income or loss that would result from the assumed issuance of the dilutive common shares. See Note 2 to the consolidated financial statements of Tenneco Inc. Consolidated Balance Sheet as of December 31, 2015. No prior periods were retrospectively adjusted. revenue recognition. The amendment in this update creates Topic 606, Revenue from Contracts with Customers, and supersedes the revenue recognition requirements in Topic 605, Revenue Recognition, including most industry-specific revenue recognition guidance throughout the Industry Topics of the Codification. In addition, the amendment supersedes the cost guidance in Subtopic 605-35, Revenue Recognition-Construction-Type and Basic earnings per share — Net income attributable to Tenneco Inc. Average shares of common stock outstanding Earnings per average share of common stock Diluted earnings per share — Net income attributable to Tenneco Inc. Average shares of common stock outstanding Effect of dilutive securities: Restricted stock Stock options Average shares of common stock outstanding including dilutive securities Earnings per average share of common stock The net impact to equity from the sale was less than $1 million. 2015 related to severance and other employee related costs, asset write-downs and other expenses related to the closure. &A, $7 million in engineering expense, $4 million in other expense and $1 million in depreciation and amortization. In 2015, we incurred $63 million in restructuring and related costs including asset write-downs of $10 million, primarily related to European cost reduction efforts, exiting the Marzocchi suspension business, headcount reductions in Australia and South America, and the closure of a JIT plant in Australia, of which $46 million was recorded in cost of sales, $11 million in SG&A, $1 million in engineering expense, $4 million in depreciation and amortization expense and $1 million in other expense. Employee Severance and Termination Benefits Tenneco Inc. — Revolver borrowings due 2017, average effective interest rate 1.2% in 2012 and 5.3% in 2011 Senior Term Loan due 2013 through 2016, average effective interest rate 3.0% in 2012 and 4.9% in 2011 7 3/4% Senior Notes due 2018 6 7/8% Senior Notes due 2020 8 1/8% Senior Notes due 2015 Debentures due 2013 through 2025, average effective interest rate 8.4% in 2012 and 2011 Customer Notes due 2013, average effective interest rate 8.0% in 2012 and 2011 Other subsidiaries — Notes due 2013 through 2025, average effective interest rate 1.3% in 2012 and 3.0% in 2011 Less — maturities classified as current Total long-term debt ability to refinance the obligations on a long-term basis by using our revolving credit facility. Maturities classified as current Notes payable Total short-term debt Outstanding borrowings at end of year Weighted average interest rate on outstanding borrowings at end of year(b) Approximate maximum month-end outstanding borrowings during year Approximate average month-end outstanding borrowings during year Weighted average interest rate on approximate average month-end outstanding borrowings during year(b) Tenneco Inc. revolving credit agreement Tenneco Inc. tranche A term facility Subsidiaries’ credit agreements December 8, 2019. We have excluded the required payments, within the next twelve months, under the Tranche A Term Facility totaling $15 million from current liabilities as of December 31, 2015, because we have the intent and ability to refinance the obligations on a long-term basis by using our revolving credit facility. Leverage Ratio (maximum) Interest Coverage Ratio (minimum) The 8, 2019. Pro forma Consolidated Leverage Ratio Greater than or equal to 3.0x Greater than or equal to 2.5x Greater than or equal to 2.0x Less than 2.0x principal amount thereof plus a premium based on the present values of the remaining payments due to the 2014. Long-term debt (including current maturities) Instruments with off-balance sheet risk: Foreign exchange forward contracts: Asset derivative contracts counter-party credit risk by entering into derivative financial instruments with major financial institutions that can be expected to fully perform under the terms of such agreements. We do not enter into derivative financial instruments for speculative purposes. The fair value of our foreign currency forward contracts is based on an internally developed model which incorporates observable inputs including quoted spot rates, forward exchange rates and discounted future expected cash flows utilizing market interest rates with similar quality and maturity characteristics. We record the change in fair value of these foreign exchange forward contracts as part of currency gains (losses) within cost of sales in the consolidated statements of income. The fair value of foreign exchange forward contracts are recorded in prepayments and other current assets or other current liabilities in the consolidated balance sheet. The fair value of our foreign Foreign exchange forward contracts Financial Assets: Foreign exchange contracts 2014. Australian dollars British pounds Canadian dollars South African rand U.S. dollars In certain instances, several of our Chinese subsidiaries receive payment from U.S. income (loss) before income taxes Foreign income before income taxes Income before income taxes and noncontrolling interests Current — U.S. federal State and local Foreign Deferred — U.S. federal State and local Foreign Income tax expense Income tax expense computed at the statutory U.S. federal income tax rate Increases (reductions) in income tax expense resulting from: Foreign income taxed at different rates Taxes on repatriation of dividends State and local taxes on income, net of U.S. federal income tax benefit Changes in valuation allowance for tax loss carryforwards and credits Foreign tax holidays Investment and R&D tax credits Foreign earnings subject to U.S. federal income tax Adjustment of prior years taxes Impact of foreign tax law changes Tax contingencies Goodwill impairment Other Income tax expense Deferred tax assets — Tax loss carryforwards: U.S. federal State Foreign Investment tax credit benefits Postretirement benefits other than pensions Pensions Bad debts Sales allowances Payroll and other accruals Valuation allowance Total deferred tax assets Deferred tax liabilities — Tax over book depreciation Other Total deferred tax liabilities Net deferred tax assets Additionally, foreign tax loss carryforwards, have been presented net of uncertain tax positions that if realized, would reduce tax loss carryforwards in 2015 and 2014 by $13 million and $12 million, respectively. Balance Sheet: Current portion — deferred tax asset Non-current portion — deferred tax asset Current portion — deferred tax liability shown in other current liabilities Non-current portion — deferred tax liability Net deferred tax assets We do not provide for U.S. income taxes on unremitted earnings of foreign subsidiaries, except for the earnings of certain of our China operations, as our present intention is to reinvest the unremitted earnings in our foreign operations. Unremitted earnings of foreign subsidiaries were approximately Uncertain tax positions — Balance January 1 Gross increases in tax positions in current period Gross increases in tax positions in prior period Gross decreases in tax positions in prior period Gross decreases — settlements Gross decreases — statute of limitations expired Balance December 31 accrued interest and penalties related to unrecognized tax benefits as income tax expense. Penalties of less than $1 million were accrued in next twelve months. United States China Spain Brazil United Kingdom We have authorized 135 million shares December 31, $14 million was related to the historic tax benefit on stock options from 2011 to 2013. In 2013, we recorded a tax benefit of $24 million related to the historic tax benefit on stock options from 2006 through 2011. Stock Options Granted Weighted average grant date fair value, per share Weighted average assumptions used: Expected volatility Expected lives Risk-free interest rates Dividends yields There were no stock options granted in 2015. Outstanding Stock Options Outstanding, January 1, 2012 Granted Canceled Forfeited Exercised Outstanding, March 31, 2012 Granted Forfeited Exercised Outstanding, June 30, 2012 Granted Forfeited Exercised Outstanding, September 30, 2012 Granted Canceled Forfeited Exercised Outstanding, December 31, 2012 2014 and Nonvested Restricted Shares Nonvested balance at January 1, 2012 Granted Vested Forfeited Nonvested balance at March 31, 2012 Granted Vested Forfeited Nonvested balance at June 30, 2012 Granted Vested Forfeited Nonvested balance at September 30, 2012 Granted Vested Forfeited Nonvested balance at December 31, 2012 2013. In January 2013, our Board of Directors approved a share repurchase program, authorizing our company to repurchase up to 550,000 shares of our outstanding common stock over a 12 month period. This share repurchase program is intended to offset dilution from shares of restricted stock and stock options issued in 2013 to employees. We purchased 450,000 shares through open market purchases and 100,000 shares from the Tenneco Retirement Plan for Salaried Employees, both of which were funded through cash from operations, at a total cost of $27 million, at an average price of 49.33 per share. These repurchased shares are held as part of our treasury stock which increased to 2,844,692 shares at December 31, 2013 from 2,294,692 shares at December 31,2012. We had 50 million shares of preferred stock Equity Securities Debt Securities Real Estate Other Asset Category Equity securities: U.S. large cap U.S. mid cap U.S. Small Cap Non-U.S. large cap Non-U.S. mid cap Non-U.S. small cap Emerging markets Debt securities: U.S. corporate bonds U.S. other fixed income Non-U.S. treasuries/government bonds Non-U.S. corporate bonds Non-U.S. mortgage backed securities Non-U.S. municipal obligations Non-U.S. asset backed securities Non-U.S. other fixed income Real Estate: Non-U.S. real estate Other: Insurance contracts Cash held in bank accounts Total Asset Category Equity securities: U.S. large cap U.S. mid cap U.S. Small Cap Non-U.S. large cap Non-U.S. mid cap Non-U.S. small cap Emerging markets Debt securities: U.S. treasuries/government bonds U.S. corporate bonds U.S. mortgage backed securities U.S. asset backed securities U.S. other fixed income Non-U.S. treasuries/government bonds Non-U.S. corporate bonds Non-U.S. other fixed income Real Estate: Non-U.S. real estate Other: Insurance contracts Cash held in bank accounts Total Balance at December 31 of the previous year Actual return on plan assets: Relating to assets still held at the reporting date Ending Balance at December 31 Asset Category 2012: Tenneco Stock 2011: Tenneco Stock Change in benefit obligation: Benefit obligation at December 31 of the previous year Currency rate conversion Settlement Service cost Interest cost Administrative expenses/taxes paid Plan amendments Actuarial (gain)/loss Benefits paid Participants’ contributions Benefit obligation at December 31 Change in plan assets: Fair value at December 31 of the previous year Currency rate conversion Settlement Actual return on plan assets Employer contributions Prescription drug subsidy received Participants’ contributions Benefits paid Fair value at December 31 Development of net amount recognized: Unfunded status at December 31 Unrecognized cost: Actuarial loss Prior service cost/(credit) Net amount recognized at December 31 Amounts recognized in the balance sheets as of December 31 Current liabilities Noncurrent liabilities Net amount recognized Service cost — benefits earned during the year Interest cost Expected return on plan assets Curtailment loss Settlement loss Net amortization: Actuarial loss Prior service cost Net pension costs Net actuarial loss Prior service cost Defined benefit pension and postretirement plans: Change in total actuarial loss Amortization of prior service cost included in net periodic pension and postretirement cost Amortization of actuarial loss included in net periodic pension and postretirement cost Other comprehensive income — pension benefits Net actuarial loss Prior service cost Projected benefit obligation Accumulated benefit obligation Fair value of plan assets Year 2013 2014 2015 2016 2017 2018-2022 Weighted-average assumptions used to determine benefit obligations Discount rate Rate of compensation increase Weighted-average assumptions used to determine net periodic benefit cost Discount rate Expected long-term return on plan assets Rate of compensation increase 2013: Service cost — benefits earned during the year Interest on accumulated postretirement benefit obligation Net amortization: Actuarial loss Prior service credit Net periodic postretirement benefit cost Net actuarial loss Prior service credit Year 2013 2014 2015 2016 2017 2018-2022 2019. Weighted-average assumptions used to determine benefit obligations Discount rate Rate of compensation increase Weighted-average assumptions used to determine net periodic benefit cost Discount rate Rate of compensation increase 2013: 2016. At December 31, 2012, and for the Year Then Ended Revenues from external customers Intersegment revenues Interest income Depreciation and amortization of intangibles Earnings before interest expense, income taxes, and noncontrolling interests Total assets Equity in net assets of unconsolidated affiliates Expenditures for plant, property and equipment Noncash items other than depreciation and amortization At December 31, 2011, and for the Year Then Ended Revenues from external customers Intersegment revenues Interest income Depreciation and amortization of intangibles Earnings before interest expense, income taxes, and noncontrolling interests Total assets Equity in net assets of unconsolidated affiliates Expenditures for plant, property and equipment Noncash items other than depreciation and amortization At December 31, 2010, and for the Year Then Ended Revenues from external customers Intersegment revenues Interest income Depreciation and amortization of intangibles Earnings before interest expense, income taxes, and noncontrolling interests Total assets Equity in net assets of unconsolidated affiliates Expenditures for plant, property and equipment Noncash items other than depreciation and amortization Emission Control Systems & Products Aftermarket Original Equipment OE Value-add OE Substrate Ride Control Systems & Products Aftermarket Original Equipment Total Revenues Customer General Motors Ford The net sales to both customers were across segments. At December 31, 2012, and for the Year Then Ended Revenues from external customers(b) Long-lived assets(c) Total assets At December 31, 2011, and for the Year Then Ended Revenues from external customers(b) Long-lived assets(c) Total assets At December 31, 2010, and for the Year Then Ended Revenues from external customers(b) Long-lived assets(c) Total assets Revenues from external customers and long-lived assets for individual foreign countries other than China, Germany, each year beginning liquidity. liquidity. liquidity. Beginning Balance Accruals related to product warranties Reductions for payments made Ending Balance Revenues Net sales and operating revenues — External Affiliated companies Costs and expenses Cost of sales (exclusive of depreciation and amortization shown below) Goodwill impairment charge Engineering, research, and development Selling, general, and administrative Depreciation and amortization of other intangibles Other income (expense) Loss on sale of receivables Other income (expense) Earnings (loss) before interest expense, income taxes, noncontrolling interests and equity in net income from affiliated companies Interest expense — External (net of interest capitalized) Affiliated companies (net of interest income) Earnings (loss) before income taxes, noncontrolling interests and equity in net income from affiliated companies Income tax expense Equity in net income (loss) from affiliated companies Net income (loss) Less: Net income attributable to noncontrolling interests Net income (loss) attributable to Tenneco Inc. Comprehensive income (loss) attributable to Tenneco Inc. Revenues Net sales and operating revenues — External Affiliated companies Costs and expenses Cost of sales (exclusive of depreciation and amortization shown below) Goodwill impairment charge Engineering, research, and development Selling, general, and administrative Depreciation and amortization of other intangibles Other income (expense) Loss on sale of receivables Other income (expense) Earnings (loss) before interest expense, income taxes, noncontrolling interests and equity in net income from affiliated companies Interest expense — External (net of interest capitalized) Affiliated companies (net of interest income) Earnings (loss) before income taxes, noncontrolling interests and equity in net income from affiliated companies Income tax expense Equity in net income (loss) from affiliated companies Net income (loss) Less: Net income attributable to noncontrolling interests Net income (loss) attributable to Tenneco Inc. Comprehensive income (loss) attributable to Tenneco Inc. Revenues Net sales and operating revenues — External Affiliated companies Costs and expenses Cost of sales (exclusive of depreciation and amortization shown below) Engineering, research, and development Selling, general, and administrative Depreciation and amortization of other intangibles Other income (expense) Loss on sale of receivables Other income (expense) Earnings (loss) before interest expense, income taxes, noncontrolling interests, and equity in net income from affiliated companies Interest expense — External (net of interest capitalized) Affiliated companies (net of interest income) Earnings (loss) before income taxes, noncontrolling interests, and equity in net income from affiliated companies Income tax expense Equity in net income (loss) from affiliated companies Net income (loss) Less: Net income attributable to noncontrolling interests Net income (loss) attributable to Tenneco Inc. Comprehensive income (loss) attributable to Tenneco Inc. Current assets: Cash and cash equivalents Receivables, net Inventories Deferred income taxes Prepayments and other Total current assets Other assets: Investment in affiliated companies Notes and advances receivable from affiliates Long-term receivables, net Goodwill Intangibles, net Deferred income taxes Other Plant, property, and equipment, at cost Less — Accumulated depreciation and amortization Total assets Current liabilities: Short-term debt (including current maturities of long-term debt) Short-term debt — non-affiliated Short-term debt — affiliated Trade payables Accrued taxes Other Total current liabilities Long-term debt — non-affiliated Long-term debt — affiliated Deferred income taxes Postretirement benefits and other liabilities Commitments and contingencies Total liabilities Redeemable noncontrolling interests Tenneco Inc. Shareholders’ equity Noncontrolling interests Total equity Total liabilities, redeemable noncontrolling interests and equity Current assets: Cash and cash equivalents Receivables, net Inventories Deferred income taxes Prepayments and other Total current assets Other assets: Investment in affiliated companies Notes and advances receivable from affiliates Long-term receivables, net Goodwill Intangibles, net Deferred income taxes Other Plant, property, and equipment, at cost Less — Accumulated depreciation and amortization Total assets Current liabilities: Short-term debt (including current maturities of long-term debt) Short-term debt — non-affiliated Short-term debt — affiliated Trade payables Accrued taxes Other Total current liabilities Long-term debt — non-affiliated Long-term debt — affiliated Deferred income taxes Postretirement benefits and other liabilities Commitments and contingencies Total liabilities Redeemable noncontrolling interests Tenneco Inc. Shareholders’ equity Noncontrolling interests Total equity Total liabilities, redeemable noncontrolling interests and equity Operating Activities Net cash provided (used) by operating activities Investing Activities Proceeds from sale of assets Cash payments for plant, property, and equipment Cash payments for software related intangible assets Cash payments for net assets purchased Net cash used by investing activities Financing Activities Retirement of long-term debt Issuance of long-term debt Debt issuance cost on long-term debt Purchase of common stock under the share repurchase program Issuance of common stock Increase in bank overdrafts Net increase in revolver borrowings and short-term debt excluding current maturities of long-term debt Net increase in short-term borrowings secured by accounts receivable Intercompany dividends and net increase (decrease) in intercompany obligations Capital contribution from noncontrolling interest partner Purchase of additional noncontrolling equity interest Distribution to noncontrolling interests partners Net cash provided (used) by financing activities Effect of foreign exchange rate changes on cash and cash equivalents Increase in cash and cash equivalents Cash and cash equivalents, January 1 Cash and cash equivalents, December 31 (Note) Operating Activities Net cash provided (used) by operating activities Investing Activities Proceeds from sale of assets Cash payments for plant, property, and equipment Cash payments for software related intangible assets Net cash used by investing activities Financing Activities Issuance of long-term debt Debt issuance cost on long-term debt Retirement of long-term debt Increase in bank overdrafts Net increase in revolver borrowings and short-term debt excluding current maturities of long-term debt Intercompany dividends and net increase (decrease) in intercompany obligations Capital contribution from noncontrolling interest partner Purchase of additional noncontrolling equity interest Distribution to noncontrolling interests partners Purchase of common stock under the share repurchase program Net cash provided (used) by financing activities Effect of foreign exchange rate changes on cash and cash equivalents Increase (decrease) in cash and cash equivalents Cash and cash equivalents, January 1 Cash and cash equivalents, December 31 (Note) Operating Activities Net cash provided (used) by operating activities Investing Activities Proceeds from sale of assets Cash payments for plant, property, and equipment Cash payments for software related intangible assets Investment and other Net cash used by investing activities Financing Activities Issuance of long-term debt Debt issuance cost on long-term debt Retirement of long-term debt Increase in bank overdrafts Net decrease in revolver borrowings and short-term debt excluding current maturities of long-term debt Intercompany dividends and net increase (decrease) in intercompany obligations Distribution to noncontrolling interests partners Net cash provided (used) by financing activities Effect of foreign exchange rate changes on cash and cash equivalents Increase (decrease) in cash and cash equivalents Cash and cash equivalents, January 1 Cash and cash equivalents, December 31 (Note) Quarter 2012 1st 2nd 3rd 4th 2011 1st 2nd 3rd 4th Quarter 2012 1st 2nd 3rd 4th Full Year 2011 1st 2nd 3rd 4th Full Year Column A Description Allowance for Doubtful Accounts and Notes Receivable Deducted from Assets to Which it Applies: Year Ended December 31, 2012 Year Ended December 31, 2011 Year Ended December 31, 2010 DIRECTORS, EXECUTIVE OFFICERS AND CORPORATE GOVERNANCE. Plan category Equity compensation plans approved by security holders: Stock Ownership Plan(2) 2002 Long-Term Incentive Plan (as amended)(3) 2006 Long-Term Incentive Plan (as amended)(4) Description Description 24, 2016 Signature Title Jane L. WarnerBoard of DirectorsAudit Committee must generally pre-approve transactions involving more than $120,000 with our directors, executive officers, five percent or greater stockholders and their immediate family members.theour common stock.management’s announced organizational changes on February 14, 2013 that will align our business along product lines, effective with the first quarter of 2013, such that our three prior geographic reportablesix operating segments have each been split into two product segments (NA(North America Clean Air, NANorth America Ride Performance, ESIEurope, South America and India Clean Air, ESIEurope, South America and India Ride Performance, APAsia Pacific Clean Air and APAsia Pacific Ride Performance). 2012 2011 2010 (Dollar Amounts in Millions) $ 3,735 51 % $ 3,426 48 % $ 2,832 48 % 2,921 40 % 3,169 44 % 2,594 44 % 908 12 % 804 11 % 698 12 % (201 ) (3 )% (194 ) (3 )% (187 ) (4 )% $ 7,363 100 % $ 7,205 100 % $ 5,937 100 % 2015 2014 2013 (Dollar Amounts in Millions) Clean Air Division North America $ 2,867 35 % $ 2,840 34 % $ 2,666 33 % Europe, South America & India 1,935 23 % 2,088 25 % 2,045 26 % Asia Pacific 1,037 13 % 1,022 12 % 853 11 % Intergroup sales (116 ) (1 )% (139 ) (2 )% (120 ) (2 )% Total Clean Air Division 5,723 70 % 5,811 69 % 5,444 68 % Ride Performance Division North America 1,323 16 % 1,361 16 % 1,265 16 % Europe, South America & India 972 12 % 1,070 13 % 1,087 14 % Asia Pacific 275 3 % 269 3 % 251 3 % Intergroup sales (84 ) (1 )% (91 ) (1 )% (83 ) (1 )% Total Ride Performance Division 2,486 30 % 2,609 31 % 2,520 32 % Total Tenneco Inc. $ 8,209 100 % $ 8,420 100 % $ 7,964 100 % 2012 2011 2010 (Dollar Amounts in Millions) $ 288 67 % $ 216 57 % $ 155 55 % 71 17 % 125 33 % 76 27 % 69 16 % 38 10 % 50 18 % $ 428 100 % $ 379 100 % $ 281 100 % 2015 2014 2013 (Dollar Amounts in Millions) Clean Air Division North America $ 244 47 % $ 237 48 % $ 229 54 % Europe, South America & India 52 10 % 59 12 % 57 13 % Asia Pacific 121 23 % 101 21 % 84 20 % Total Clean Air Division 417 80 % 397 81 % 370 87 % Ride Performance Division North America 155 30 % 143 29 % 124 29 % Europe, South America & India (5 ) (1 )% 40 8 % (7 ) (1 )% Asia Pacific 39 8 % 36 7 % 22 5 % Total Ride Performance Division 189 37 % 219 44 % 139 33 % Other (87 ) (17 )% (124 ) (25 )% (85 ) (20 )% Total Tenneco Inc. $ 519 100 % $ 492 100 % $ 424 100 % 2012 2011 2010 (Dollar Amounts in Millions) $ 122 46 % $ 88 40 % $ 59 38 % 88 34 % 95 44 % 66 43 % 53 20 % 35 16 % 29 19 % $ 263 100 % $ 218 100 % $ 154 100 % 2015 2014 2013 (Dollar Amounts in Millions) Clean Air Division North America $ 95 32 % $ 83 26 % $ 76 30 % Europe, South America & India 74 25 % 84 26 % 61 24 % Asia Pacific 43 15 % 56 18 % 44 17 % Total Clean Air Division 212 72 % 223 70 % 181 71 % Ride Performance Division North America 34 12 % 35 11 % 32 13 % Europe, South America & India 42 14 % 47 15 % 33 13 % Asia Pacific 6 2 % 10 3 % 6 2 % Total Ride Performance Division 82 28 % 92 29 % 71 28 % Other 1 — % 2 1 % 2 1 % Total Tenneco Inc. $ 295 100 % $ 317 100 % $ 254 100 % 2012 2011 2010 (Millions) $ 105 $ 108 $ 149 19 88 69 29 26 24 2015 2014 2013 (Millions) Interest expense (net of interest capitalized) $ 67 $ 91 $ 80 Income tax expense 149 131 122 Noncontrolling interests 56 44 39 emission controlclean air and ride controlperformance systems and products for light vehicle, commercial truck, off-highway and specialty vehicleother applications, and generated revenues of $7.4$8.2 billion in 2012.2015. We serve both original equipment manufacturers (OEMs) and replacement markets worldwide through leading brands, including Monroe®, Rancho®, Clevite® Elastomers, Marzocchi®, AxiosTM™, KineticTM®, and Fric-RotTM™ ride controlperformance products and Walker®, XNOx®, FonosTM™, DynoMax®,and ThrushTM® , and LukeyTM emission controlclean air products.vehicletruck and off-highway engine manufacturers, and aftermarket distribution channels.Vehicle Parts Industry for Vehicles and Adjacent Markets vehicle parts industry for vehicles and engines is generally separated into two categories: (1) “original equipment” or “OE” in which parts that are sold in large quantities directly for use by OEMsmanufacturers of light vehicles, commercial trucks and commercial vehicle engine manufacturers;off-highway engines; and (2) “aftermarket” in whichor replacement parts that are sold in varying quantities to wholesalers, retailers and installers. In the OE category, parts suppliers are generally divided into tiers — “Tier 1” suppliers that provide their products directly to OEMs, and “Tier 2” or “Tier 3” suppliers that sell their products principally to other suppliers for combination into thethose other suppliers’ own product offerings.(SUV)(SUVs), crossover vehicles (CUV)(CUVs), pick-up trucks, vans and multi-purpose passenger vehicles. Demand for OE light vehicle automotive parts is generally a function of the number of new vehicles produced, which in turn is a function ofdepends on prevailing economic conditions and consumer preferences. In 2012, the number of light vehicles produced by region was 15.4 million in North America, 29.0 million in Europe, South America and India and 37.1 million in Asia Pacific. Worldwide light vehicle production is forecasted to increase to 82.8 million units in 2013 from approximately 81.5 million units in 2012, according to IHS Automotive. Although OE demand is tied to planned vehicle production, parts suppliers also have the opportunity to grow revenues by increasing their product content per vehicle, by further expanding business with existing customers and by serving new customers in existing or new markets. Companies with a global presence and advanced technology, engineering, manufacturing and support capabilities, such as our Company,company, are better positioned to take advantage of these opportunities.TheIndiaSouth Korea have enabled suppliers such as us to serve customers beyond light vehicles. Certain parts suppliers that have traditionally supplied the automotive industry are now developingalso develop and producingproduce components and integrated systems for commercial truck, off-highway and specialtyother applications, such as medium- and heavy-duty trucks, buses, off-roadstationary engines, agricultural and construction equipment, locomotive and locomotive/marine applications as well as theengines and recreational segment for two-wheelers and all-terrain vehicles. Tenneco foreseesWe foresee this product application diversification of content and applications as a source of future growth.of OE parts and increases in theincreased average useful life of automotivevehicle parts that has come to pass as a result of technological innovation. SuppliersParts suppliers are increasingly being required to deliver innovative aftermarket products to drive increased aftermarket demand. Global economic downturns generally impact aftermarket sales less adversely than OE sales, as customers forego new vehicle purchases and keep their vehicles longer, thereby increasing demand for repair and maintenance parts and services.As a result of the lack of consumer confidence caused by the global economic downturn and credit market crisis, the industry experienced a rapid decline in light vehicle purchases in 2008 and the first half of 2009. The industry began to recover during the second half of 2009 when OEbeganhas increased at a moderate but slowing pace over the past three years, increasing 4% in 2013, 3% in 2014 and 1% in 2015. The overall rate of growth in 2015 was largely impacted by the South America and Japan production declines of 21% and 5%, respectively. Of these regions, South America has the biggest impact on Tenneco and continues to stabilizestruggle with political and then strengthen, as inventory levels began to be replenished, tracking more closely to vehicle sales. In 2010,economic turmoil. IHS Automotive projects global light vehicle production continuedwill grow 3% in 2016. Production of commercial trucks globally and off-highway equipment in regulated regions has weakened over the past three years with production increasing 4% in 2013, about flat in 2014 and declining 7% in 2015. IHS and Power Systems Research forecast these markets to strengthen, evidenced by North America, Asia Pacific and Europe light vehicle production volumes increasing 39 percent, 30 percent and 16 percent, respectivelydecline 1% in 2010 as compared to 2009. Production volumes continued to strengthen in 2011 in most geographic regions in which we operate. For example, production volumes in North America and Europe increased 10 percent and five percent, respectively, in 2011. The Asia Pacific region experienced a decline of two percent in production volumes as a result of a continued decline in industry production in Australia, and lower OE volumes in Thailand and Japan as a result of the flooding and earthquakes experienced in those regions in 2011. For 2012, light vehicle production continued to improve from recent years in some of the geographic regions in which we operate, but declined markedly in Europe. Light vehicle production was up 17 percent in North America, though not to levels seen in recent history, and six percent in China. European light vehicle production was down five percent from 2011 levels.theengines using diesel applicationsand alternative fuels and increased demand for better fuel economy. Government regulations adopted over the past decade require substantial reductions in vehicle tailpipe criteria pollutantwarranties on parts ofwarranty periods for a vehicle’s pollution control equipment and additional equipment to control fuel vapor emissions. The products that our clean air division provides reduce the tailpipe emissions of criteria pollutants. In addition, new regulations have been adopted to regulate greenhouse gas emissions of carbon dioxide. Reducing CO2 emissions requires improving fuel economy; as a result improved combustion efficiency and reduction of vehicle mass have become priorities. Manufacturers are responding to all of these regulations with new technologies for gasoline- and diesel-fueled vehicles that minimize pollution and improve fuel economy.emission controlclean air systems with strong technical capabilities, we are well positioned to benefit from the more rigorous environmental standards being adopted around the world. We continue to expand our investment in all regions such as China, India, Thailand and Japan to capitalize on the growing demand for environmentally friendly solutions for light vehicle, commercial truck and commercial vehiclesoff-highway applications driven by environmental regulations in these regions. and BMW 1 series passenger cars and Scania trucks and in Europe andNorth America for GM Duramax engine applications, the Ford Super Duty, the Chrysler Ram Navistar medium-duty trucks in North America,Heavy Duty, and off-roadoff-highway applications for Caterpillar and John Deere in North America and Europe.Europe, and Kubota in Japan. These particulate filters, coupled with converters, reduce emissions of particulate matter by up to 90 percent and of nitrogen oxide by up to 85 percent. In addition, we have development and production contracts for our selective catalytic reduction (SCR) systems with light and medium-duty truck manufacturers in North America,commercial vehicle manufacturers. These SCR systems reduce emissions of nitrogen oxides by up to 95 percent. In China, South America, Europe, and Asia. In China,Japan, we have development and production contracts for complete turnkey SCR systems includingthat include the urea dosing technology acquired in 2007 and now sold globally under the name XNOxTM®. Customers have also purchased prototypes of our hydrocarbon injector, a product acquired in 2007 alongside our XNOxTM technology, which is used to inject hydrocarbons directly into the exhaust system to regenerate diesel particulate filters and Lean NOx Traps. New regulations in the U.S. and European markets, which require reductions in carbon dioxide emissions and improvements in fuel economy, are creating increased demand for our fabricated manifolds, maniverters, integrated turbocharger/manifold modules, electronic exhaust valves, and lightweight components. Lastly, for various off-roadoff-highway customers, we have developedoffer emission aftertreatment systems designed to meet Tier 4 interimenvironmental regulations or their equivalent outside of the U.S. Both commercial truck and Tier 4 final environmental regulations. Both on-road and off-roadoff-highway customers are embracing the concept of turnkey aftertreatment systems leading to our having developed and soldwhich require aftertreatment electronic control units (ECUs) as well as the related control software.software which we have developed and sold to several customers.$126$146 million in 2012, $1332015, $169 million in 2011,2014, and $117$144 million in 2010,2013, net of customer reimbursements. Such expenses reimbursed by our customers totaled $145 million in 2015, $159 million in 2012, $1192014, and $169 million in 2011, and $110 million in 2010. In addition, we build2013, including building prototypes and incurincurring other costs on behalf of our customers to further our technological capabilities.customers. We also fund and sponsor university and other independent research to advance our emission controlclean air and ride control development.canhave been able to expand our product offerings and penetrate new markets. For example, we developed DPFs which were first sold in Europe and then offered in North America. Since these original innovations, we have developed T.R.U.E-Clean® systems with our partners, a product used to regenerate DPFs. We have also built prototypes of urea SCR systems for locomotive and marine engines. We expanded our suite of NOx-reduction technologies, developing prototypes of SCR systems using gaseous ammonia, absorbed on a solid salt, as the reductant or a hydrocarbon lean NOx catalyst (HC-LNC for NOx reduction) that relies on hydrocarbons, ethanol, or other reductants instead of urea. For example, during our period of exclusive development with General Electric (GE), we have developed a commercially viable hydrocarbon lean NOx catalyst system which utilizes GE’s proprietary silver based catalyst formulation and have attracted multiple customers in Brazil testing this system using ethanol as the reductant. We successfully developed and sold fabricated manifolds, previously used only on gasoline engines, into the passenger car diesel segment. Recently, weWe developed our first prototype aftertreatment system for large engines, up to 4500 horsepower, used asin line haul locomotives. Tenneco, through an exclusive partnership with Jiangsu Lvyuan in China, has become the first company to obtain China Classification Society (CCS) approval to sell marine selective catalytic reduction systems for China flagged vessels, as required by the International Maritime Organization. On the ride controlperformance side of our business, we co-developed with Öhlins Racing AB a continuously controlled electronic suspension system (CES) now offered by OEMs such as Volvo, Audi, Ford, VW, and Mercedes Benz and BMW on their vehicles.BMW.The European Union and North America have made electronic stability control (ESC) systems mandatory for all passenger cars and commercial vehicles. co-developed with Öhlins Racing AB, CES,offers adjustable and offers Kinetic® ride control technologyadaptive damping as well as semi-active suspension systems designed to improve vehicle stability, handling, safety and handling. We also develop other advancedcontrol. Our systems are based on various technologies including DRiV™ digital valve, Continuously Variable Semi-Active (CVSA) suspension systems likeand Kinetic® ride control, and Actively Controlled Car (ACOCAR)(ACOCARTM™ that are being designed to provide improved vehicle safety and control. Further,). Into furtherthat complement our product offerings in the aftermarket space.ride performance offerings. In addition, to these efforts, we continue to promote the Safety TriangleTM™ of Steering-Stopping-Stability to educate consumers about the detrimental effect of worn shock absorbers on vehicle steering and stopping distances. As a result, successfuloffer a variety of component products individuallyare described as well as integrated modules and systems:follows:systemsmodules and modules.systems. As an established Tier 1 supplier, we have produced modules and systems for various vehicle platforms produced worldwide, supplying ride controlperformance modules for the Chevrolet Silverado, GMC Sierra, Chevrolet Malibu, Chevrolet Impala and Chevrolet Cruze and emission control systems for the Chevrolet Colorado, GMC Canyon, Ford Super Duty, Ford Focus, Chevrolet Silverado, GMC Sierra, Chevrolet Malibu, Opel Astra, and VW Golf. In addition, we continue to design other modules and systems for platforms yet to be introduced to the global marketplace.OE manufacturersOEMs and their parts suppliers to expand their global reach:•Growing Importance of Developing Markets: Because the North American and Western European automotive regions are mature, OEMs are increasingly focusing on developing markets for growth opportunities, particularly Brazil, Russia, India and China, collectively known as the BRIC economies, as well as Thailand. As OEMs have penetrated new regions, growth opportunities for suppliers have emerged.•Governmental Tariffs and Local Parts Requirements: Many governments around the world require vehicles sold within their country to contain specified percentages of locally produced parts. Additionally, some governments place high tariffs on imported parts.•Location of Production Closer to End Markets: As OE manufacturers and parts suppliers have shifted production globally to be closer to their end markets, suppliers have expanded their reach, capturing sales in developing markets and taking advantage of relatively lower labor costs.OE manufacturersOEMs are increasingly seeking suppliers capable of supporting vehicle platforms on a global basis. They want suppliers like Tenneco with design, production, engineering and logistics capabilities that can be accessed not just in North America and Europe but also in many other regions of the developing markets.OE manufacturers continue to standardize“globalglobal platforms” designing basic mechanical structures that are suitable for a number of similar vehicle models and able to accommodate different features for more than one region. LightThis standardization will drive production of light vehicles designed on global platforms to grow. Accordingly light vehicle platforms of overwhose annual production exceed one million units are expected towill grow from 48 percent to 5453 percent of global OE production from 2012in 2015 to 2017.OE manufacturersOEMs realize significant economies of scale by limiting variations in items such as steering columns, brake systems, transmissions, axles, exhaust systems, support structures and power window and door lock mechanisms. The shift towards standardization can also benefit automotive parts suppliers. They can experience greater economies of scale, lower material costs, and reduced development costs.20012003 to 2011,2015, the number of retail outlets supplying aftermarket parts increased significantly while the number oftraditional jobber stores declined nearly 10 percent in the U.S. Major aftermarket retailers, such as AutoZone and Advance Auto Parts, attemptedhave continued their work to expand their retail outlets and commercial sales by sellingdistribution strategies to sell directly and more effectively to parts installers, which historically had historically purchased the majority of their needs from their local warehouse distributors and jobbers,jobbers. The size and number of consolidations as they continuedwell as key customer distribution center footprint expansions have increased in the last a few years, including Advance Auto Parts' purchase of Carquest (which included WorldPac), Auto Zone's purchase of Interamerican Motor Company, O'Reilly Auto Parts' purchase of V.I.P. to expand their entrance into the Northeast U.S. market, and Icahn Enterprises L.P.'s agreement to individual retail consumers. Retailers now have the option to offer premium brands which are often preferred by their commercial customers in addition to standard products which are often selected by their individual store buyers.acquire Pep Boys. We are well positioned to respond to this trend because we producethese trends and feel our strategy and portfolio of customers are in line with the market changes and opportunities. We make and sell high-quality products marketed under premium brands that appeal to aftermarket retailers and products. As distribution channels continue to consolidate, both wholesalers and retailers can realize the benefits of sourcing products from a supplier like Tenneco withcustomers they serve. In addition, our breadth of suspension and emissions control products.20102013 through 2012,2015, information relating to our net sales and operating revenues, by primary product lines and customer categories. Net Sales
Year Ended December 31, 2012 2011 2010 (Millions) $ 318 $ 351 $ 318 2,948 2,732 2,223 1,660 1,678 1,284 4,608 4,410 3,507 4,926 4,761 3,825 944 944 851 1,493 1,500 1,261 2,437 2,444 2,112 $ 7,363 $ 7,205 $ 5,937 2015 2014 2013 (Millions) Clean Air Products & Systems Aftermarket $ 318 $ 318 $ 327 Original Equipment OE Value-add 3,489 3,559 3,282 OE Substrate(1) 1,916 1,934 1,835 5,405 5,493 5,117 5,723 5,811 5,444 Ride Performance Products & Systems Aftermarket 941 976 953 Original Equipment 1,545 1,633 1,567 2,486 2,609 2,520 Total Revenues $ 8,209 $ 8,420 $ 7,964 (1) See “Management’s Discussion and Analysis of Financial Condition and Results of Operations” included in Item 7 for a discussion of substrate sales. BrandsIn each of our operating segments, we manufacture and market products with leading brand names. Monroe® ride control products and Walker® exhaust products areWe have two of the most recognized brands in the industry. We emphasize product value differentiation with brands such asindustry: Monroe®,KineticTMand Fric-RotTM( used for ride control products), XNOxproducts and WalkerTM (emission control products), DynoMax®, ThrushTM for exhaust products. We differentiate our products and Lukeytheir value proposition with our brands:TM (performance exhaust products), Rancho® (ride control products for high performance light trucks), Clevite® Elastomers and AxiosTM (noise, vibration and harshness control components), and Marzocchi® (forks and suspensions for two-wheelers).• • • • • have developedstrive to develop long-standing business relationships with our customers around the world. In each of our operating segments, we work collaboratively with our OE customers in all stages of production, including design, development, component sourcing, quality assurance, manufacturing and delivery. With a diverse mix ofFor both OE and aftermarket customers, we provide timely delivery of quality products at competitive prices and deliver customer service. With our diverse product mix and numerous facilities in major markets worldwide, we believe we are well positioned to meet customer needs. We believe we have a strong, established reputation with customers for providing high-quality products at competitive prices, as well as for timely delivery and customer service.2012,2015, we served more than 6380 different OEMs and commercial vehicletruck and off-highway engine manufacturers worldwide, and our products were included on all tennine of the top 10 passenger car models produced for sale in Europe and eight of the top 10 light truck models produced for sale in North America for 2012.2012,2015, our OEMOE customers included the following manufacturers of light vehicles, commercial trucks and commercial vehicle engine manufacturer customers included:off-highway equipment and engines:North America Europe Asia Agco Corp Beijing Automotive Caterpillar Club CarAvtoVAZ BMW CNH Industrial BMW Brilliance Automobile Daimler AG E-Z GoFiat-ChryslerFiatCaterpillar Chang'an Automotive FCA CNH Industrial (CNH)China National Heavy-Duty Truck Group Ford Motor Daimler AG Daimler AG General Motors Deutz AG Dongfeng Motor Harley-Davidson FCA Deutz AG Honda Motors Ford Motor First Auto Works Hyundai Motor Geely Automobile Ford Motor John Deere General Motors Geely Automobile Navistar International John Deere General Motors Nissan Motor Oshkosh TruckMazda Motor Great Wall Motor Paccar McLaren Automotive Isuzu Motor Company Toyota Motor Nissan Motor Jiangling Motors Volkswagen Group Paccar JND Volvo Global Truck AvtoVAZBMWCaterpillarDaimler AGDeutz AGDucati MotorFiat-ChryslerFiat Industrial (Iveco)Ford MotorGeely AutomobileGeneral MotorsHarley-DavidsonJohn DeereMazda MotorMcLaren AutomotiveNissan MotorPaccarRenaultSuzuki MotorTata MotorsToyota MotorVolkswagen GroupVolvo Global Truck Beijing AutomotiveBMWBrilliance AutomobileChangan AutomotiveChina National Heavy-DutyTruck GroupDaimler AGDongfeng MotorDucati MotorFirst Auto WorksFord MotorGeely AutomobileGeneral MotorsGreat Wall MotorHyundai MotorIsuzu MotorsJiangling MotorsNissan MotorSAIC MotorSuzuki MotorVolkswagen GroupWeichai Power Renault Nissan Motor Suzuki Motor SAIC Motor Tata Motors Toyota Motor Toyota Motor Weichai Power Volkswagen Group Yuchai Group Volvo Global Truck Australia South America India Club CarFord MotorAgrale S.A. Ashok Leyland General Motors CNH Industrial (Iveco) BMW Toyota Motor Daimler AG Club CarDaimler AGFiat Industrial (Iveco) Fiat-ChryslerE-Z GoFord MotorFiat Industrial (Iveco)FCA Ford Motor General Motors Ford Motor General Motors Toyota Motor General Motors Isuzu MotorMAN SE Mahindra & Mahindra Navistar International Nissan Motor Nissan Motor Suzuki Motor PSA Peugeot Citroen Tata Motors RenaultRandon S.A. Toyota Motor ScaniaRenault Volkswagen Group Toyota Motor Volkswagen Group Volvo Global Truck 2012 2011 2010 17 % 19 % 19 % 15 % 15 % 13 % Customer 2015 2014 2013 General Motors Company 15 % 15 % 15 % Ford Motor Company 13 % 13 % 14 % 2012,2015, our aftermarket customers were comprised of full-line and specialty warehouse distributors, retailers, jobbers, installer chains and car dealers. These customers included National Auto Parts Association (NAPA), Advance Auto Parts, Uni-Select, O’Reilly Auto Parts, Aftermarket Auto Parts Alliance, and O’Reilly AutomotiveAutoZone in North America, Temot Autoteile GmbH, Autodistribution International, Group Auto Union, Auto Teile Ring and AP United in Europe and Rede Presidente in South America. We believe our aftermarket revenue mix is balanced, with our top 10 aftermarket customers accounting for 5263 percent of our net aftermarket sales and our aftermarket sales representing 1715 percent of our total net sales in 2012.applications we service throughout most regions in the world for both emission controlclean air and ride controlperformance products and systems.systems in many regions of the world. In the aftermarket, we believe that we are thea leader in supplying emission controlclean air and ride controlperformance products for light vehicles for the key applications we serve throughout the world. and the winter months in North America and Europe generally. Our aftermarket operations, also affected by seasonality, experience relatively higher demand during the springSpring as vehicle owners prepare for the summerSummer driving season.Emission Controlextendextends from the manifold that connects an engine’s exhaust ports to an exhaust pipe, to the catalytic converter that eliminates pollutants from the exhaust, and to the muffler that modulates noise and emissions — leads to a pleasant,pleasantly tuned engine sound, reduced pollutants and optimized engine performance.diesel particulate filters or Lean NOx traps;• Industrieindustrie e.V. (AdBlue)'s AdBlueTM® or Diesel Exhaust Fluid (DEF);Exhaustexhaust manifolds — Components that collect gases from individual cylinders of a vehicle’s engine and direct them into a single exhaust pipe; fabricatedpipe. Fabricated manifolds can form the core of an emissions module that includes an integrated catalytic converter (maniverter) and/or turbocharger;HangersElastomeric hangers and isolators — Used for system installation and elimination of noise and vibration, and for the improvement of useful life; andeither buy completed catalytic converters systems orneed to procure substrates coated with precious metals which we incorporate into fullor in the case of catalytic converter systems only, purchase the complete systems. We obtain these components and systems from third parties, often at the OEM's direction, or directly from OE manufacturers, often at the OEM’s direction.vehicle and engine manufacturers. See Item 7, “Management’s Discussion and Analysis of Financial Condition and Results of Operations” for more information on our sales of these products.emission controlclean air offerings to 28approximately 30 light vehicle manufacturers for use on over 220225 light vehicle models, including eightsix of the top 10 passenger car models produced in Europe and seven of the top 10 light truck models produced in North America for 2012.2015. We also supply emission controlclean air products to 19approximately 30 manufacturers of commercial vehiclestrucks, off-highway equipment and engines, and specialtyother vehicles including Harley-Davidson, BMW Motorcycle, Caterpillar, CNHTC, Daimler Trucks, Navistar, Caterpillar,Deutz, FAW Truck, Harley-Davidson, John Deere, DeutzKubota, Scania and Weichai Power.entered the emission control marketacquired our original clean air product line in 1967 with the acquisition of Walker Manufacturing Company, which was founded in 1888, and became one of Europe’s leading OE emission controlclean air systems suppliers with the acquisition of Heinrich Gillet GmbH & Co. in 1994. Throughout this document, the term “Walker” refers to our subsidiaries and affiliates that produce emission controlclean air products and systems.TM™.ControlPerformance Systemsexcessexcessive transfer of the vehicle’s weight — either from side to side, which is calledknown as “roll;” from front to rear, which is called “pitch;” or up and down, which is called “bounce.” ShockBecause shock absorbers and struts are designed to control the vertical loads placed on tires, and therebythey provide resistance to vehicleexcessive roll, pitch and bounce. They function as safety components and provide a comfortable ride.controlperformance products and systems including:• • KineticMonroe® Intelligent Suspension Portfolio:◦ TheWe have won the PACE Award for our Kinetic®suspension technology was incorporatedtechnology;◦ Dual-mode suspension - An adaptive suspension solution used for small- and medium-sized vehicles that provides drivers a choice of two suspension modes such as comfort and sport; ◦ ◦ Citroën World Rally Car that was featured in the World Rally Championship of 2003, 2004McLaren MP4-12C; and 2005. Additionally, the Kinetic® suspension technology was offered on the Lexus GX 470 sport utility vehicle which resulted in our winning the PACE Award;Advanced suspension systems — Shock absorbers and suspension systems that electronically adjust a vehicle’s performance based on inputs such as steering and braking; andcontrolperformance products such as load assist products, springs, steering stabilizers, adjustable suspension systems, suspension kits and modular assemblies.controlperformance offerings to 21approximately 25 light vehicle manufacturers for use on over 155195 light vehicle models, including eight of the top 10 passenger car models produced in Europe and eight of the top 10 light truck models produced in North America for 2012.2015. We also supply ride controlperformance products and systems to over 40 manufacturers of commercial truck, off-highway and specialty vehicle manufacturersother vehicles including Volvo Truck, Scania, Navistar, Daimler Trucks and PACCAR.controlperformance aftermarket, we manufacture, market and distribute replacement shock absorbers for virtually all North American, European and Asian light vehicle models under several brand names including Gas-Matic®, Sensa-Trac®, Monroe Reflex® Reflex® and Monroe® AdventureTM™, Quick-Strut®, as well as Clevite® Elastomers and Axios™ for elastomeric vibration control components. We also sell ride controlperformance offerings for the heavy-duty, off-roadcommercial truck and specialtyother aftermarket segments, such as our Gas-Magnum® shock absorbers for the North American heavy-duty category and Marzocchi front forks for two-wheelers.commercial category.controlperformance product line in 1977 with the acquisition of Monroe Auto Equipment Company, which was founded in 1916, and introduced the world’s first modern tubular shock absorber in 1930. When the term “Monroe” is used in this document it refers to our subsidiaries and affiliates that produce ride controlperformance products and systems.controlperformance and emission control)clean air). Our sales and marketing team provides the appropriate mix of operational and technical expertise needed to interface successfully with the OEMs. Our new business “capture process” involves working closely with the OEM platform engineering and purchasing teams. Bidding on OE automotive platforms typically encompasses many months of engineering and business development activity. Throughout the process, our sales team, program managers and product engineers assist the OE customer in defining the project’s technical and business requirements. A normal part of the process includes our engineering and sales personnel working on customers’ integrated product teams, and assisting with developing component/system specifications and test procedures. Given that the OE business involves long-term production contracts awarded on a platform-by-platform basis, our strategy is to leverage our engineering expertise and strong customer relationships to target and win new business and increase operating margins.televisionoutdoor advertisements and offer pricing promotions. We offer business-to-business services to customers with TA-Direct, an on-line order entry and customer service tool. In addition, we maintain detailed web sites for each of Walker®, Monroe®, Rancho®, DynoMax®, Monroe® brake brands and our heavy-duty products.Emission ControlOur consolidated businesses11 emission control63 clean air manufacturing facilities worldwide, of which 14 facilities are located in North America, 25 in Europe, South America and India, and 24 in Asia Pacific. We operate 18 of the manufacturing facilities in the U.S. and 50 emission control manufacturing facilities outside of the U.S. We operate 17 of these international manufacturing facilitiesAsia Pacific through joint ventures in which we hold a controlling interest. We operate four emission controlfive clean air engineering and technical facilities worldwide and share three other such facilities with our ride controlperformance operations. Of the five clean air engineering and technical facilities, one is located in North America, two in Europe, and two in Asia Pacific. In addition, two joint ventures in which we hold a noncontrolling interest operate a total of two manufacturing facilities outside the U.S.emission controlclean air manufacturing facilities, operations are organized by component (e.g., muffler, catalytic converter, pipe, resonator and manifold). Our manufacturing systems incorporate cell-based designs, allowing work-in-process to move through the operation with greater speed and flexibility. We continue to invest in plant and equipment to stay competitive in the industry. For instance, in our Smithville, Tennessee, OE manufacturing facility, we have developed a muffler assembly cell that utilizes laser welding. This allows for quicker change-over times in the process as well as less material used and less weight for the product. There is also a reduced cycle time compared to traditional joining and increased manufacturing precision for superior durability and performance. In 2007, we introduced the Measured and Matched Converter technique in North America. This allows us to maintain the optimum GBD (Gap Bulk Density) in our converter manufacturing operations with Tenneco proprietary processing. This process, coupled with cold spinning of the converter body, versus traditional cone to can welding, allows for more effective use of material through reduced welding, lower cost, and better performance of the product. In 2009, we introduced low-cost fabricated diesel manifolds in Europe which utilize advanced manufacturing processes such as deep drawing, laser welding, and furnace brazing.emission controlclean air manufacturing operations into “just-in-time” or “JIT” systems. In this system, a JIT facility located close to our OE customer’s manufacturing plant receives product components from both our manufacturing operations and independent suppliers, and then assembles and ships products to the OEMs on an as-needed basis. To manage the JIT functions and material flow, we have advanced computerized material requirements planning systems linked with our customers’ and supplier partners’ resource management systems. We have three emission control25 clean air JIT assembly facilities worldwide, of which two facilities are located in the United StatesNorth America, ten in Europe and 24 throughout the rest of the world.theacquisitions in 2007 acquisitionand 2012 of Combustion Component Associates’ technology for use in mobile emission and stationary engine applications, respectively. That technology, nowwith its urea and hydrocarbon injectors, electronic controls and software, is marketed and sold globally under the XNOxTM® name that includes urea and hydrocarbon injection, and electronic controls and software for use in selective catalytic reduction.reduction (SCR) and other exhaust aftertreatment systems. We also offer a complete suite of alternative full system NOx aftertreatment technologies, including the Hydrocarbon Lean NOx Catalyst (HC-LNC) technology under joint development with General Electric, and SOLIDSolid SCRTM™technology licensed from Amminex, an engineering and manufacturing company located in Denmark. We also developed advanced predictive engineering tools, including KBM&E (Knowledge Based Manufacturing & Engineering). The innovation of our KBM&E (which we call TEN-KBM&E) is a modular toolbox set of CAD embedded applications for manufacturing and engineering compliant design. The encapsulated TEN-KBM&E content is driven by an analytical method which continuously captures and updates the knowledge of our main manufacturing and engineering processes. Our global engineering capabilities are standardized through the use of the ATLAS Global PDM (Product Data Management) system, enabling a more efficient transfer of knowledge around the world.ControlOur consolidated businessesPerformancesix30 ride controlperformance manufacturing facilities worldwide, of which nine facilities are located in the U.S.North America, 15 in Europe, South America and 22 ride control manufacturing facilities outside the U.S.India, and six in Asia Pacific. We operate two of these internationalthe facilities through joint ventures in which we hold a controlling interest.interest, one in Europe and another one in Asia. We operate seven engineering and technical facilities worldwide and share three other such facilities with our emission controlclean air operations.controlperformance manufacturing facilities, operations are organized by product (e.g., shocks, struts and vibration control products) and include computer numerically controlled and conventional machine centers; tube milling and drawn-over-mandrel manufacturing equipment; metal inert gas and resistance welding; powdered metal pressing and sintering; chrome plating; stamping; and assembly/test capabilities. Our manufacturing systems incorporate cell-based designs, allowing work-in-process to move through the operation with greater speed and flexibility.onefour of our ride performance manufacturing operations outside the U.S.facilities into a JIT assembly operation.eitherbetween ride comfort or vehicle control.and handling. Our innovative grooved-tube, gas-charged shock absorbers and struts provide both ride comfort and vehicle control, resulting in improved handling, reduced vibration and a wider range of vehicle control. This technology can be found in our premium quality Sensa-TracOESpectrum® shock absorbers. We further enhanced this technology by adding the SafeTechTM™ fluon banded piston, which improves shock absorber performance and durability. We introduced the Monroe Reflex® Reflex® shock absorber, which incorporates our Impact SensorTM™ device. This technology permits the shock absorber to automatically switch in a matter of milliseconds between firm and soft compression damping when the vehicle encounters rough road conditions, and thus maintaining better tire-to-road contact and improving handling and safety. We developed the Quick-Strut® which simplifies and shortens the installation of aftermarket struts. This technology combines the spring and upper mount into a single, complete module, eliminating the need for special tools and skills required previously. We have also developed an innovative computerized electronic suspension system, which features dampers developed by Tenneco and electronic valves designed by Öhlins Racing AB. The continuously controlledContinuously Variable Semi Active ("CVSA") electronic suspension (“CES”) ride controlperformance system is featured on Audi, Volvo, Ford, Volkswagen, BMW, andControlcontrolManagement System is an important part of our production process. Our qualityproduct and process development and validation. Design engineers establish performance and reliability standards in the product’sproduct's design stage, and use prototypes to confirm that the component/system can be manufactured to specifications. Quality controlManagement is also integrated into the launch and manufacturing process, with shop operators responsible for quality controlteam members at every stage of their specific work product. In addition, our inspectors test work-in-progress at various stages to ensure componentsthe work-in-process, ensuring finished goods are being fabricated to meet customers’customers' requirements.We believe our commitment to quality control and sound management practices and policiesdemonstrated by our successful participationdetailed in Tenneco's Global Business Policy Manual. The Global Business Policy Manual complies with the International Standards Organization/Technical Specifications certification process (“ISO/TS”). ISO/TS certifications are semi-annual or annual audits that certify that a company’s facilities meet stringent quality16949:2009, ISO 9001:2008 specifications, and business systemscustomers' specific requirements. Without ISO or TS certification, we would not be able to supply our products for the aftermarket or to our OE customers, eitherlocally or globally. All of ourTenneco's manufacturing facilities, where we haveit has been determined that TS certification is requirednecessary to serve our customersthe customer, or would provide us with an advantage in securing additional business, have successfully achieved ISO/TS 16949 certification.emission controlclean air and ride controlperformance products and systems for OEMs and the aftermarket. We work toward achieving a balanced mix of products, markets and customers by capitalizing on emerging trends, specific regional preferences and changing customer requirements. We target both mature and developing markets for both light vehicles, commercial trucks, off-highway engines and other vehicle and commercial and specialty vehicle business.or engine applications. We further enhance our operations by focusing on operational excellence in all functional areas.marketsmarket segments and serve our existing customers. By anticipating customer needs and preferences, we design advanced technologies that meet global market needs. For example, to meet the increasingly stringent emissions regulations being introduced around the world, we offer several technologies designed to reduce NOx emissions onfrom passenger, commercial truck and commercialoff-highway vehicles. This includesThese technologies include an integrated Selective Catalytic Reduction (SCR) system that incorporates our XNOxTM® technology.technology, electrical valves for diesel-powered vehicles with low-pressure exhaust gas recirculation systems, and diesel and gasoline particulate filters. We also offer a NOx absorber and are developing a hydrocarbon lean NOx catalyst system, and a solid form of ammonia SCR system to address NOx emissions. Additionally, we offer thermal management solutions, includingsuch as our T.R.U.E.-Clean® active diesel particulate filter system.system and, through a consortium, thermoelectric generators that convert waste exhaust heat into electrical energy.available content per vehicledemand for our products to continue to rise over the next several years. Advanced aftertreatment exhaust systems are required to comply with emissions regulations that affect light, commercial truck and commercialoff-highway vehicles as well as off-road, locomotive, marine and stationary engines. In addition, vehicle manufacturers we believe, will offerare offering greater comfort, handling and safety features by offeringwith products such as electronic suspension and adjustable dampers. Our Continuously Controlled Electronic Suspension (CES)Variable Semi Active ("CVSA") electronic suspension shock absorbers, which we co-developed with Öhlins Racing AB, are now sold to Volvo, Audi, Mercedes, VW, BMW, and Ford, among others, and our engineered elastomers to manufacturers with unique requirements. Our newest electronic suspension product DRiVTM™, based on technology licensed from Sturman Industries, is the first industry example of multiple digital valves coupled with smart switching for use in ride controlperformance products offeringthat results in faster response, lighter weight, and reduced power consumption compared to existing analog products.developingintroducing highly engineered systems and complex assemblies and modules designed tothat provide value-added solutions to our customers and increase vehicleour content generally.on vehicles. Having many of our engineering and manufacturing facilities integrated electronically, we believe, has helped our products continue to be selected for inclusion in top-selling vehicles. In addition, our just-in-time and in-line sequencing manufacturing processes and distribution capabilities have enabled us to be more responsive to our customers’ needs.Marketsexisting design, engineering and manufacturing capabilities. For example, we areleveragingleverage our technology and engineering leadership in emissionclean air and ride controlperformance into adjacent sales opportunities for heavy-duty trucks, buses, agricultural equipment, construction machinery and other vehicles in other regions around the world.specialty vehicles. Commercial vehicle emission control launches are being ramped up in line with regulatory enforcement in North America, Europe, China, Japan, South America and India. Theseoff-highway customers includesuch as Caterpillar, for whom we are their global diesel emission controlclean air system integrator, as well as John Deere, Navistar, Deutz, Daimler Trucks, MAN SE, Scania, China National Heavy Truck Company, Shanghai Diesel Engine Company, Weichai Power, FAW Group and YuChai.Kubota.addition,2015, we continue to expand into new markets with new customers, including our most recently announced new emission control business with Kubota, a commercial vehicle customer in Japan,received three Product Design Assessment (PDA) certificates from the American Bureau of Shipping, one of the world's leading ship-classification societies, and Mahindra, a commercial vehicle customer in India. two Approved-In-Principle (AIP) certificates from DNV GL, another leading global classification society and recognized advisor of the maritime industry.2011 and 2012 revenuerevenues generated by our commercial truck, off-highway and specialty vehicleother business was 11 percent and 13sectors were 15 percent of our total annual OE revenue, respectively.Geographicallyinto growth regions around the world. In 2010, we opened wholly-owned emission control manufacturing facilities in Chennai, Indiato serve OE and Guangzhou, China, and a ride control facility in Chonburi, Thailand. In addition, we opened new emission control facilities in Changchun, China and in Beijing, China as a result of our joint venture agreements with FAW Sihuan and Beijing Hainachuan Automotive Part Company Limited, respectively. In 2011 we relocated and expanded two plants in China and during the third quarter, increased our investment in Thailand by acquiring the remaining interest in our emission control joint venture. We continue to develop our Thailand footprint with the goal of using it as a base for our future operations in that region. In 2012, we opened our first manufacturing plant in Japan, an emission control facility located in Osaka, which will support further growth in the region. As OEMs have expanded in the fast-growing regions of Brazil, Russia, India, China, and Thailand, we have followed,aftermarket customers, building our capabilities to engineer and produce locally cost-competitive andcost competitively cutting-edge products which has enabled usaround the world. After adding to captureour footprint in China, Japan and Thailand from 2011 to 2012, we opened our clean air manufacturing facility in Chakan, India located close to key customers in the Pune region in 2013. In 2014, we opened our clean air research and development facility in Kunshan, China to enhance our engineering capabilities and develop China-specific solutions. In 2015, we opened new facilities in Jeffersonville, Indiana, Sanand, India, Stanowice, Poland and Suzhou, China. We also expanded our manufacturing operations in Celaya, Mexico that produce shock absorbers and other ride performance products for light vehicles and commercial trucks and in Tredegar, U.K. to support growth on significant incremental new business.marketsell leading, brand-name products to a diversified and global aftermarket customer base. Two of the most recognized brand-name products in the automotive parts industry are our Monroe® ride controlperformance products and Walker® emission control clean air products, which have been offered to consumers since the 1930s. We believe our brand equity in the aftermarket is a key asset especially as customers consolidate and distribution channels converge. Reflex® and Monroe Reflex® Sensa-Trac and Monroe® OESpectrum® shock absorbers, Walker® Quiet-Flow® mufflers, Rancho® ride controlperformance products, DynoMax® exhaust products and Walker Ultra® catalytic converters, and in Europe, Walker and Aluminox ProTM™ mufflers. Further, we introducedmarket Monroe® Springs and Monro-Magnum® (bus and truck shock line) in Europe and continue to grow our Monroe Dynamics® and Monroe Ceramics® brake Brake pads in the United States.North America. We continue to explore other opportunities for developing new product lines that will be marketed under our existing, well-known brands.To this end,For one, we offer an innovative ride controlperformance product, the Quick-Strut®, that combines the spring and the upper mount into a single, complete module and simplifies and shortens the installation process, eliminating the need for the special tools and skills required previously. We are adapting our products further for use in foreign nameplate vehicles with the OESpectrum line of ride control products. Additionally, we benefitedfind ways to benefit from the consolidation of, and the regional expansion by, our customers and gainedgain business lost byfrom our competitors that encountered financial difficulties.given our strength and understanding in the markets and channels we do business in.business strengthens our competitive position with OEMs.OEMs, and vice versa. We gain timely market and product knowledge that can be used to modify and enhance our offerings for greater customer acceptance. ForWe also can readily introduce aftermarket products by leveraging our exhaust product line, we continue to enhanceexperience in the OE market. An example of such is our converter coverage, including additionalsuite of manifold converter part numbers. In addition, we also offer aftermarketconverters and diesel particulate filters.strategic acquisitions, alliances and alliancesdivestitures to achieve growth.strategic growth and alignment. Through these acquisitions and alliances,transactions, we have (1) expanded our product portfolio with complementary technologies; (2) realizedand (4) achieved leadership positions in geographic regions outside North America.We developed a strategic alliance with Futaba Industrial Co., Ltd., a leading exhaust manufacturer in Japan. This alliance helps us growAmerica; and (5) re-focused on areas that will contribute to our business with Japan-based OEMs by leveraging the geographical reach of our partner to serve global vehicle platforms of these OEMs. profitable growth.In June 2009, we formed a joint venture with Beijing Hainachuan Automotive Parts Company Limited in Beijing that produces emission control exhaust systems for Hyundai. In addition, we continue to serve North American and European OEMs located in China; we supply luxury cars produced by BMW and Audi through our joint venture with Eberspächer International GmbH, and we supply various Ford platforms through our joint venture with Chengdu Lingchuan Mechanical Plant. We established a local engineering center in Shanghai to develop automotive exhaust products when our joint venture with Shanghai Tractor and Engine Company, a subsidiary of Shanghai Automotive Industry Corp., was expanded. Also, we increased our investment from 6080 percent to 80100 percent in Tenneco Tongtai Exhaust Company Limited (TTEC) located in Dalian in January 2010 and from 75 percent to 100 percent in our Thailand emission control company, Walker Exhaust Co. Limited in August 2011. Further, we formedthe fourth quarter of 2013.new joint venture in March 2010 with FAW Sihuan to supply emission control components and systemslicensing agreement for passenger and commercial vehicles.In February 2009, we signed a joint development agreement with GE Transportation, a unit of General Electric Company, to develop a proprietary dieselT.R.U.E.-Cleanvarious transportationautomatic and active regeneration of Diesel Particulate Filters (DPFs), with Woodward Governor Company. This is an example of a technology which complements our array of existing clean air products, allowing us to provide integrated exhaust aftertreatment systems to commercial truck, off-highway and other applications. We are collaborating with GE Transportation on the development and production of GE’s Hydrocarbon Lean NOx catalyst technology, a diesel aftertreatment innovation aimed at reducing harmful nitrogen oxide (NOx) emissions as effectively as urea-based SCR systems. We are working with others on alternative urea SCR technologies, such as solid forms of ammonia. late 2012, we signed an exclusive joint development agreement with Cormetech Inc., a joint equity company of Corning Inc. and Mitsubishi Heavy Industries Ltd, to design ultra-large diameter SCR catalysts for marine, locomotive and certain stationary applications. Also in late 2012, we signed a nonexclusive Joint Development and Licensing Agreement with Amminex for the design and development of SOLID-SCRSolid SCRTM™ systems.We haveIn February 2014, we secured the exclusive licensing agreements for T.R.U.E.-Clean®, an exhaust aftertreatmentrights to the digital valve technology used for automaticin our DRiV™ suspension systems from Sturman Industries, Inc. DRiV™ systems feature electronically controlled dampers with hydraulic valves that can be used in a variety of vehicle damping applications.active regenerationour mountain bike suspension product line, and liquidate our Marzocchi operations. In November 2015, we closed on the sale of Diesel Particulate Filters (DPFs), with Woodward Governor Company. This iscertain assets related to our Marzocchi mountain bike suspension product line to the affiliates of Fox Factory Holding Corp.; and in December 2015, we closed on the sale of the Marzocchi motorcycle fork product line to an example of a technology, which complements our array of existing emissions control products, allowing us to provide integrated exhaust aftertreatment systems to commercial vehicle manufacturers and others.On September 22, 2009, we announced that we were closing our original equipment ride control plant in Cozad, Nebraska. The closure of the Cozad plant eliminated approximately 500 positions. We hired at other facilities as we moved production from Cozad to those facilities, which resulted in a net decrease ofapproximately 60 positions. Much of the production was shifted from Cozad to our plant in Hartwell, Georgia. The closure of the Cozad plant was completed in August 2012 at a total cost of $23 million. Annualized cost savings as a result of these actions total $8 million.We have continued to implement cost reduction initiatives where appropriate and in the third quarter of 2011, we completed a restructuring action that permanently eliminated 53 positions, or seven percent of our total workforce in Australia. This restructuring is part of a continuing broader plan for the Asia Pacific region where we are positioning Tenneco for growth by re-deploying assets to maximize utilization while at the same time addressing the industry environment in the region.On September 13, 2012, we announced our intention to close our aftermarket emission control plant in Vittaryd, Sweden. We expect to complete the closure in the third quarter of 2013. We expect a smooth transition of production from the Vittaryd plant to other Tenneco emission control operations in Laval, France; Edenkoben, Germany; Valencia, Spain, and Rybnik, Poland, which began in late 2012. We expect to take restructuring and related charges in the range of $10 million to $14 million. These charges include non-cash asset impairments, the cost of relocating tooling, equipment and production to other facilities, severance and retention payments to employees, and other costs related to the closure. In 2012, we recorded non-cash charges of $4 million related to this initiative. We expect to record the remainder of the charges over the first three quarters of 2013.OnFor example, on January 31, 2013, we announced our planintent to reduce structural costs in Europe by approximately $60 million annually,annually. We still expect to reach our target annual savings rate in 2016, however the recent dramatic changes in exchange rates will likely have an impact on the actual savings achieved when translated from Euros to U.S. dollars. We incurred $78 million in restructuring and anticipaterelated costs in 2013, of which $69 million was related to this initiative including $3 million for non-cash asset write downs. In 2014, we incurred $49 million in restructuring and related costs, of approximately $120which $31 million was related to this initiative including $3 million for non-cash asset write downs. In 2015, we incurred $63 million in restructuring and related costs, of which $22 million was related to this initiative. While we are nearing the completion of this initiative, we expect to incur additional restructuring and related costs in 2016 due to certain ongoing matters. For example, we closed a plant in Gijon Spain in 2013, but subsequently re-opened it in July 2014 with about half of its prior workforce after the employees' works council successfully filed suit challenging the closure decision. Pursuant to an agreement we entered into with employee representatives, we are currently engaged in a sale process to identify potential purchasers for the facility and intend to continue operating it until a complete transfer of ownership takes place. In November 2015, we closed on the sale of certain assets related to our Marzocchi mountain bike suspension product line to the affiliates of Fox Factory Holding Corp.; and in December 2015, we closed on the sale of the Marzocchi motorcycle fork product line to an Italian company, VRM S.p.A. We recorded charges of $29 million in 2015 related to severance and other employee related costs, asset write-downs and other expenses related to the closing of the Vittaryd facility and the $7 million charge recorded in the fourth quarter of 2012 to impair certain assets in the European ride control business. We expect that most of the remaining expense will be recorded in late 2013 and 2014, and that the company will reach a full savings run rate in 2016. Any plans affecting our European hourly and salaried workforce would be subject to union consultation.$7$6 million in 20132016 and $2 million in 2014.” Item 7, “Management’s Discussion and Analysis of Financial Condition and Results of Operations — Environmental and Other Matters,” Item 7, “Management’s Discussion and Analysis of Financial Condition and Results of Operations — Liquidity and Capital Resources” and Note 12 to the consolidated financial statements of Tenneco Inc. included in Item 8.2012,2015, we had approximately 25,00030,000 employees of whom approximately 45 percent were covered by collective bargaining agreements. European works councils cover 1916 percent of our total employees, a majority of whom are also included under collective bargaining agreements. Several of our existing labor agreements in Mexico and the United States are scheduled for renegotiation in 2013.2016. In addition, agreements covering plants in France, Germany, Poland,Argentina, Brazil and ArgentinaThailand are expiring in 2013.2016. We regard our employee relations as satisfactory.In general, steel prices have been increasing since 2004 with the exception of a temporary but significant decline in prices as a result of the economic turmoil in 2008 and 2009. We address such price increases by evaluating alternative materials and processes, reviewing material substitution opportunities, increasing component and assembly to best cost countries, as well as strategically pursuing regional and global purchasing strategies for specific commodities, and aggressively negotiating with our customers to allow us to recover these higher costs from them. As global economies continue to recover, we expect increasing price pressure on key commodities, including rubber, oil and steel.emission controlclean air products to OE manufacturers under the names SOLIDSolid SCRTM™ and XNOxTM®. The patents, trademarks and other intellectual property owned by or licensed to us are important in the manufacturing, marketing and distribution of our products.ITEM 1A.RISK FACTORS.Thecrisisconditions in 2008 and 2009 and the related worldwide financial industry turmoil resultedvarious geographic regions in a severe and globalwhich we do business. Economic difficulties generally lead to tightening of credit and liquidity. These conditions ledoften lead to low consumer confidence, which resultedin turn results in delayed and reduced purchases of durable consumer goods such as automobiles.automobiles and other vehicles. As a result, during difficult economic times our OEM customers can significantly reducedreduce their production schedules. Light vehicle production has been increasing since the second half of 2009 and this trend has continued in most regions through 2012, with the exception of Europe whereFor example, light vehicle production declined five percentsignificantly during the economic crisis in 2012 as compared to 2011. We cannot assure you that production levels will increase or that they may not decline. Further, it is uncertain how much further2008 and 2009 in North America and Europe, and European production will decline or when it will stabilize. Futureremains below pre-crisis levels. More recently, light vehicle and commercial truck production has declined significantly in South America in 2014 and 2015 and persistent challenges in the Chinese economy going into 2016 may result in lower-than-anticipated growth in both light and commercial vehicles in the region. Additionally, production of off-highway equipment with our content on them continues to be weak in certain product applications, such as agricultural and construction equipment in the United States and Europe. Any deterioration or prolonged difficulty in economic conditions in any region in which we do business could have a material adverse effect on our business, financial position and liquidity.For example, as we saw in 2008 and 2009,Company.company. Future disruptions in the capital and credit markets could adversely affect our customers’ and our ability to access the liquidity that is necessary to fund operations on terms that are acceptable to us or at all. automotive industry, leading to supply chain disruptions and labor unrest, among other things. These disruptions could force automotiveoriginal equipment manufacturers and, in turn, other suppliers, including us, to shut down production at plants. While the difficulties facingissues that our customers and suppliers over the last several years have beenface during economic difficulties may be primarily financial in nature, other difficulties, such as an inability to meet increased demand as the economy recovers,conditions recover, could also result in supply chain and other disruptions.theour products are sold. Demand for our OE products is subject to the level of consumer demand for new vehicles that are equipped with our parts. The level of new light vehicle, commercial truck and commercialoff-highway vehicle purchases is cyclical, affected by such factors as general economic conditions, interest rates and availability of credit, consumer confidence, patterns of consumer spending, industrial construction levels, fuel costs, government incentives and vehicle replacement cycles. Consumer preferences also impact the demand for new light vehicle purchases. For example, if consumers increasingly prefer electric vehicles, demand for the vehicles equipped with our emission controlclean air products would decrease.emissions control business.clean air product line. We cannot assure you, however, that environmental standards for emissions will continue to become more stringent or that the adoption of any new standards will not be delayed beyond our expectations.2012,2015, GM and Ford accounted for 1715 percent and 1513 percent of our net sales, respectively. The loss of all or a substantial portion of our sales to any of our large-volume customers could have a material adverse effect on our financial condition and results of operations by reducing cash flows and our ability to spread costs over a larger revenue base. We may make fewer sales to these customers for a variety of reasons, including but not limited to: (1) loss of awarded business; (2) reduced or delayed customer requirements; (3) strikes or other work stoppages affecting production by the customers; or (4) reduced demand for our customers’ products.several years prior to 2008, substantially all of our North American vehicle manufacturing customers had slowed or maintained at relatively flat levels new vehicle production. In 2009, new vehicle production decreased dramatically in many geographic regions as a result of the global economic crisis. During the second half of 2009 and in 2010, new vehicle production stabilized and began to strengthen from these low production levels. For 2011 and 2012,example, light vehicle production continued to improvedeclined significantly during the economic crisis in most geographic regions2008 and 2009 in which we operate, though still not to the levels seen in recent history in many of those regions. Further,North America and Europe, and European production remains below pre-crisis levels. More recently, light vehicle and commercial truck production has declined significantly in 2012South America in 2014 and it is unclear when it will stabilize.2015 and persistent challenges in the Chinese economy going into 2016 may result in lower-than-anticipated growth in both light and commercial vehicles in the region. In addition to the risks inherent in the cyclicality of vehicle production, our customers generally have the right to replace us with another supplier at any time for a variety of reasons and have demanded price decreases over the life of awarded business. Accordingly, we cannot assure you that we will in fact realize any or all of the future sales represented by our awarded business. Any failure to realize these sales could have a material adverse effect on our financial condition, results of operations, and liquidity.our level of debt and provisions in our debt agreements could limitconstrain our ability to react to changes in the economy or our industry.substantialsignificant portion of our cash flow from operations is dedicated to servicing our debt and is not available for other purposes. Ourpurposes and our level of debt could have other negative consequences to us, including the following:limitingimpair our ability to borrow money or sell stock forraise additional capital if necessary. Further, under the terms of our working capital, capital expenditures, debt service requirements orexisting senior secured credit facility, the indentures governing our notes and the agreements governing our other general corporate purposes;limiting our flexibility in planning for, or reactingindebtedness, we are able to changes in our operations, our business or the industry in which we compete; andour leverage may place us at a competitive disadvantage by limiting our ability to investincur significant additional indebtedness in the business orfuture. The more we become leveraged, the more we, and in further research and development.This may make it more difficult for us to obtain financing on terms that are acceptable to us, or at all. Without such financing, we could be forced to sell assets to make up for any shortfall in our payment obligations under unfavorable circumstances. If necessary,circumstances and we may not be able to sell assets quickly enough or for sufficient amounts to enable us to meet our obligations. Complying with these covenants may impair our ability to finance our future operations and capital needs or to engage in other favorable business activities. senior credit facility or the indentures for our other debt instruments, including as a result of events beyond our control, could result in an event of default, which could materially and adversely affect our operating results and our financial condition.immediately.immediately (which, in turn, could also result in an event of default under one or more of our other financing arrangements). If such event occurs, the lenders under our senior credit facility could elect to terminate their commitments, cease making further loans and institute foreclosure proceedings against our assets and we could lose access to our securitization program. We cannot assure you that our assets or cash flow would be sufficient to fully repay borrowings under our outstanding debt instruments, either upon maturity or if accelerated, upon an event of default, or that we would be able to refinance or restructure the payments on those debt instruments.For example, in February 2009, we sought an amendment to our senior credit facility to revise the financial ratios we are required to maintain thereunder. If, in the future, we are required to obtain similar amendments as a result of our inability to meet the required financial ratios, there can be no assurance that those amendments will be available on commercially reasonable terms or at all. If, as or when required, we are unable to repay, refinance or restructure our indebtedness under our senior credit facility, or amend the covenants contained therein, the lenders under our senior credit facility could elect to terminate their commitments thereunder, cease making further loans and institute foreclosure proceedings against our assets. In addition, any event of default or declaration of acceleration under one of our debt instruments could also result in an event of default under one or more of our other financing agreements, including our other debt instruments and/or the agreements under which we sell certain of our accounts receivable. This would have a material adverse impact on our liquidity, financial position and results of operations.growing our business and generating savings and improvements. recently announced a cost reduction initiative in Europe that is anticipated to significantly reduceTheOur inability to implement these initiatives in accordance with our plans or our failure to achieve the goals of these initiatives could have a material adverse effect on our business, particularly since we rely on these initiatives to offset pricing pressures from our suppliers and our customers, as described above, as well as to manage the impacts of production cuts, such as the significant production decreases we experienced during 2008 and 2009 as a result of the recent global economic crisis, and the lingering effects this crisis continues to havehad in Europe in particular, where light vehicle production declined in 2012 and continues to remain below pre-crisis level. Our implementation of announced initiatives is not forecastedfrom time to recovertime subject to legal challenge in 2013.certain non-U.S. jurisdictions (where applicable employment laws differ from those in the United States). Furthermore, the terms of our senior credit facility and the indentures governing our notes may restrict the types of initiatives we undertake, as these agreements include certain restrictions on our uses of cash and require us to maintain defined financial ratios and otherwise prohibit us from undertaking certain other activities.undertake. In the past we have been successful in obtaining the consent of our senior lenders where appropriate in connection with our initiatives. We cannot assure you, however, that we will be able to pursue, successfully implement or realize the expected benefits of any initiative or that we will be able to sustain improvements made to date.Europe and Chinaother regions are unionized. Although we consider our current relations with our employees to be satisfactory, if major work disruptions were to occur, our business could be adversely affected by, for instance, a loss of revenues, increased costs or reduced profitability. We have not experienced a material labor disruption in our recent history, but there can be no assurance that we will not experience a material labor disruption at one of our facilities in the future in the course of renegotiation of our labor arrangements or otherwise.In general, commodity prices including steel, oil and rubber, have been increasing since 2004 with the exception of a temporary but significant decline in prices as a result of the economic turmoil in 2008 and 2009. Notwithstanding this temporary decline, the trend of increasing commodity prices has continued. We mitigated these challengesattempt to mitigate price increases by evaluating alternative materials and processes, reviewing material substitution opportunities, increasing component sourcing and parts assembly in best cost countries as well as by strategically pursuing regional and global purchasing strategies for specific commodities, and aggressively negotiating to recover these higher costs from our customers. We also continue to pursue productivity initiatives and other opportunities to reduce costs through restructuring activities. During periods of economic recovery, the cost of raw materials and utility services generally rise. Accordingly, we cannot ensure that we will not face increased prices in the future or, if we do, whether these actions will be effective in containing them.investigations thatinvestigations. These matters typically are incidental to the conduct of our business. Some of these proceedings allegematters involve allegations of damages against us relating to environmental liabilities, intellectual property matters, personal injury claims, taxes, employment matters or commercial or contractual disputes.disputes or allegations relating to legal compliance by us or our employees. For example, we are subject to a number of lawsuits initiated by a significant number of claimants alleging health problems as a result of exposure to asbestos. Many of these cases involve significant numbers of individual claimants. Many of these cases also involve numerous defendants, with the number of defendants in some cases exceeding 100 defendants from a variety of industries. As major asbestos manufacturers or other companies that used asbestos in their manufacturing processes continue to go out of business, we may experience an increased number of these claims.are resultinghas resulted in fewer, larger suppliers who benefit from purchasing and distribution economies of scale. If we cannot achieve cost savings and operational improvements sufficient to allow us to compete favorably in the future with these larger companies, our financial condition and results of operations could be adversely affected due to a reduction of, or inability to increase, sales.Wenot be ablenegatively impacted by increasing competition from lower cost, private-label products.successfully respondconsolidate and, as a result, our sales to the changing distribution channels forlarge retail customers represent a significant portion of our aftermarket products.Major automotivebusiness. Private-label aftermarket products, which are typically manufactured at a lower cost, often containing little or no premium technology, and are branded with a store or other private-label brand, are increasingly available to these large retail customers. Our aftermarket business is facing increasing competition from these lower cost, private-label products and there is growing pressure to expand our entry-level product lines so that retailers such as AutoZone and Advance Auto Parts, are attemptingmay offer a greater range of price points to increase their commercial sales by selling directly to automotive parts installers in addition to individual consumers. These installers have historically purchased from their local warehouse distributors and jobbers, whoare our more traditionalconsumer customers. We cannot assure you that we will be able to maintain or increase our aftermarket sales through increasing our sales to retailers. Furthermore, because of thethese large retail customers or that increased competition from these lower cost, focus of major retailers, we have occasionally been requested to offer price concessions to them. Our failure to maintain or increaseprivate-label aftermarket sales, or to offset the impact of any reduced sales or pricing through cost improvements, couldproducts will not have an adverse impact on our business and operating results.17 percent and 1815 percent of our net sales in both the fiscal years ended December 31, 20122015 and 2011, respectively.2012,2015, approximately 5049 percent of our net sales were derived from operations outside North America. International operations are subject to various risks which could have a material adverse effect on those operations or our business as a whole, including:currency exchange rate fluctuations;New regulationswill require ongoing due diligence efforts, with initial disclosure requirements beginningthat began in May 2014. Our supply chain is complex and we may incur significant costs to determine the source of any such minerals used in our products. We may also incur costs with respect to potential changes to products, processes or sources of supply as a consequence of our diligence activities. Further, the implementation of these rules and their effect on customer, supplier and/or consumer behavior could adversely affect the sourcing, supply and pricing of materials used in our products. As there may be only a limited number of suppliers offering conflict-free minerals, we cannot be sure that we will be able to obtain necessary minerals from such suppliers in sufficient quantities or at competitive prices. We may face reputational challenges if we determine that certain of our products contain minerals not determined to be conflict-free or if we are unable to sufficiently verify the origins for all conflict minerals used in our products through the procedures we implement. Accordingly, the implementation of these rules could have a material adverse effect on our business, results of operations and/or financial condition.Exchange rate fluctuations could cause a decline in our financial condition and results of operations.As a result of our international operations, we are subject to increased risk because we generate a significant portion of our net sales and incur a significant portion of our expenses in currencies other than the U.S. dollar. For example, where we have a greater portion of costs than revenues generated in a foreign currency, we are subject to risk if the foreign currency in which our costs are paid appreciates against the currency in which we generate revenue because the appreciation effectively increases our cost in that country.The financial condition and results of operations of some of our operating entities are reported in foreign currencies and then translated into U.S. dollars at the applicable exchange rate for inclusion in our consolidated financial statements. As a result, appreciation of the U.S. dollar against these foreign currencies generally will have a negative impact on our reported revenues and operating profit while depreciation of the U.S. dollar against these foreign currencies will generally have a positive effect on reported revenues and operating profit. For example, our consolidated results of operations were negatively impacted in 2012 due to the weakening of the Euro against the U.S. dollar and positively impacted in 2011 due to the strengthening of the Euro against the U.S. dollar. However, in 2008 through 2010, the dollar strengthened against the Euro which had negative effects on our results of operations. Our South American operations were negatively impacted by the devaluation in 2000 of the Brazilian currency as well as by the devaluation of the Argentine currency in 2002. We do not generally seek to mitigate this translation effect through the use of derivative financial instruments. To the extent we are unable to match revenues received in foreign currencies with costs paid in the same currency, exchange rate fluctuations in that currency could have a material adverse effect on our business.For example, during the fiscal year ended December 31, 2008, we recorded a $114 million asset impairment charge to write-off the remaining goodwill related to our 1996 acquisition of Clevite Industries and during the fiscal year ended December 31, 2011, we recorded a $11 million goodwill impairment charge relating to our Australian reporting unit. During the fiscal year ended December 31, 2012, we recordedWe did not record any non-cash asset impairment charges during the fiscal years ended December 31, 2013, 2014 or 2015.2012,2015, we had approximately $155$211 million in net deferred tax assets. These deferred tax assets include net operating loss carryovers and tax credits that can be used to offset taxable income in future periods and reduce income taxes payable in those future periods. Each quarter, we determine the probability of the realization of deferred tax assets, using significant judgments and estimates with respect to, among other things, historical operating results and expectations of future earnings and tax planning strategies. If we determine in the future that there is not sufficient positive evidence to support the valuation of these assets, due to the risk factors described herein or other factors, we may be required to further adjust the valuation allowance to reduce our deferred tax assets. Such a reduction could result in material non-cash expenses in the period in which the valuation allowance is adjusted and could have a material adverse effect on our results of operations.ITEM 1B.UNRESOLVED STAFF COMMENTS.emission control businessClean Air product line operates 1163 manufacturing facilities worldwide, of which 14 facilities are located in the U.S.North America, 25 in Europe, South America and 50 manufacturing facilities outside of the U.S. Our emission control businessIndia, and 24 in Asia Pacific. Clean Air also operates fourfive engineering and technical facilities worldwide and shares three other such facilities with our ride control business. Twenty-sevenRide Performance. Twenty-five of these manufacturing plants are JIT facilities. In addition, two joint ventures in which we hold a noncontrolling interest operate a total of two manufacturing facilities outside the U.S.,in Europe, all of which are JIT facilities.ride control businessRide Performance product line operates six30 manufacturing facilities worldwide, of which nine facilities are located in the U.S.North America, 15 in Europe, South America and 22 manufacturing facilities outside the U.S. Our ride control businessIndia, and six in Asia Pacific. Ride Performance also operates seven engineering and technical facilities worldwide and shares three other such facilities with our emission control business. OneClean Air. Four of these manufacturing plants is aare JIT facility. outside of the U.S. are located in Argentina, Australia, Belgium, Brazil, Canada, China, Czech Republic, France, Germany, Hungary, India, Italy, Japan, Korea, Mexico, Poland, Portugal, Russia, Spain, South Africa, South Korea, Sweden, Thailand, the United Kingdom and the United Kingdom.States. We also have sales offices located in Singapore and Taiwan.4849 and lease 64 of the properties described above and lease 71.above. We hold 18 of the above-described international manufacturing facilities through sevennine joint ventures in which we own a controlling interest. In addition, two joint ventures in which we hold a noncontrolling interest operate a total of two manufacturing facilities outside the U.S.in Europe. We also have distribution facilities at our manufacturing sites and at a few offsiteoff-site locations, substantially all of which we lease.ITEM 3.LEGAL PROCEEDINGS.obligations thatobligations. These matters are typically incidental to the conduct of our business and create the potential for contingent losses. We accrue for potential contingent losses when our review of available facts indicates that it is probable a loss has been incurred and the amount of the loss is reasonably estimable. Each quarter we assess our loss contingencies based upon currently available facts, existing technology, and presently enacted laws and regulations and taking into consideration the likely effects of inflation and other societal and economic factors and record adjustments to these reserves as required. As an example, we consider all available evidence including prior experience in remediation of contaminated sites, other companies’ cleanup experiences and data released by the United States Environmental Protection Agency or other organizations when we evaluateFurther, allAll of our loss contingency estimates are subject to revision in future periods based on actual costs or new information. With respect to our environmental liabilities, where future cash flows are fixed or reliably determinable, we have discounted those liabilities. All other environmental liabilities are recorded at their undiscounted amounts. We evaluate recoveries separately from the liability and, when they are assured, recoveries are recorded and reported separately from the associated liability in our consolidated financial statements.2012,2015, we have the obligation to remediate or contribute towards the remediation of certain sites, including one Federal Superfund site. At December 31, 2012,2015, our aggregated estimated share of environmental remediation costs for all these sites on a discounted basis was approximately $18$14 million, of which $5$2 million is recorded in other current liabilities and $13$12 million is recorded in deferred credits and other liabilities in our consolidated balance sheet. For those locations where the liability was discounted, the weighted average discount rate used was 1.61.8 percent. The undiscounted value of the estimated remediation costs was $21$17 million. Our expected payments of environmental remediation costs are estimated to be approximately $3$2 million in 2013,2016, $1 million each year beginning 20142017 through 20172020 and $14$11 million in aggregate thereafter.towardsto the remediation costs. In addition, certain environmental statutes provide that our liability could be joint and several, meaning that we could be required to pay in excess of our share of remediation costs. Our understanding of the financial strength of other potentially responsible parties at these sites has been considered, where appropriate, in our determination of our estimated liability. We do not believe that any potential costs associated with our current status as a potentially responsible party in the Federal Superfund site, or as a liable party at the other locations referenced herein, will be material to our consolidated financial position, results of operations, or liquidity.cash flows.are involved in other legal proceedings, claims or investigations. Some of these proceedings allegematters involve allegations of damages against us relating to environmental liabilities (including, toxic tort, property damage and remediation), intellectual property matters (including patent, trademark and copyright infringement, and licensing disputes), personal injury claims (including injuries due to product failure, design or warning issues, and other product liability related matters), taxes, employment matters, and commercial or contractual disputes, sometimes related to acquisitions or divestitures.that thesethe legal proceedings, claims or claimsinvestigations currently pending against us will have any material adverse impact on our future consolidated financial position, results of operations or cash flows.arehave been and continue to be subject to lawsuits initiated by a significant number of claimants alleging health problems as a result of exposure to asbestos. In the early 2000’s we were named in nearly 20,000 complaints, most of which were filed in Mississippi state court and the vast majority of which made no allegations of exposure to asbestos from our product categories. Most of these claims have been dismissed and ourOur current docket of active and inactive cases is less than 500 cases nationwide. A small number of claims have been asserted against one of our subsidiaries by railroad workers alleging exposure to asbestos products in railroad cars manufactured by The Pullman Company, one of our subsidiaries.cars. The substantial majority of the remaining claims are related to alleged exposure to asbestos in our automotive products. Only a small percentage of the claimants allege that they were automobile mechanics andproducts although a significant number of those claims appear also to involve workersoccupational exposures sustained in industries other industries or otherwise do not include sufficient information to determine whether there is any basis for a claim against us.than automotive. We believe, based on scientific and other evidence, it is unlikely that mechanicsclaimants were exposed to asbestos by our former products and that, in any event, they would not be at increased risk of asbestos-related disease based on their work with these products. Further, many of these cases involve numerous defendants, with the number in some cases exceeding 100 defendants from a variety of industries. Additionally, the plaintiffs either do not specify any, or specify the jurisdictional minimum, dollar amount for damages. As major asbestos manufacturers and/or users continue to go out of business or file for bankruptcy, we may experience an increased number of these claims. We vigorously defend ourselves against these claims as part of our ordinary course of business. In future periods, we could be subject to cash costs or charges to earnings if any of these matters are resolved unfavorably to us. To date, with respect to claims that have proceeded sufficiently through the judicial process, we have regularly achieved favorable resolutions. Accordingly, we presently believe that these asbestos-related claims will not have a material adverse impact on our future consolidated financial condition,position, results of operations or cash flows.ITEM 4.MINE SAFETY DISCLOSURES.27, 2013.24, 2016. Gregg M. Sherrill (60)(63) Chairman and Chief Executive Officer Hari N. Nair (53) Chief Operating Officer (60) Executive Vice President, Ride Performance DivisionEnterprise Business Initiatives(56) Executive Vice President, Technology, Strategy and Business Development (52) Executive Vice President and Chief Financial Officer Neal A. Yanos (51)Executive Vice President, Clean Air DivisionBrent J. Bauer (57)Senior Vice President and General Manager — North America Original Equipment Emission Control(53) Senior Vice President, Global Human Resources and Administration Michael J. Charlton (54) Senior Vice President Global Manufacturing Development and European Cost Reduction InitiativesGeneral Manager, Asia Pacific(52) Senior Vice President, General Counsel and Corporate Secretary Barbara A. Kluth (56) Senior Vice President Global Human Resourcesand General Manager, Clean Air DivisionPaul D. Novas (54)Senior Vice President, Ride Performance Division Joseph A. Pomaranski (60) Senior Vice President and General Manager, Global Aftermarket John E. Kunz (50) Vice President and Controller Hari N. Nair —Brian J. Kesseler - Mr. NairKesseler was named Chief Operating Officer in July 2010.January 2015. Prior to that,joining Tenneco, he spent more than 20 years working for Johnson Controls Inc., most recently serving as President of the Johnson Controls Power Solutions business. In 2013, he was elected a corporate officer, and was a member of the Johnson Controls executive operating team. Mr. Kesseler also served as our Executivethe sponsor of Johnson Controls’ Manufacturing Operations Council. Mr. Kesseler joined JCI in 1994 and during his tenure held leadership positions in all of the company’s business units, including serving as Vice President and President — International since March 2007. Previously, Mr. Nair served as Executive Vice PresidentGeneral Manager, Service-North America, Systems and Managing Director of our business inServices Europe, South America and India. Before that, he was Senior Vice President and Managing Director — International. Prior to December 2000, Mr. Nair wasUnitary Products Group, for the Vice President and Managing Director — Emerging Markets. Previously, Mr. Nair was the Managing Director for Tenneco Automotive Asia, based in Singapore and responsible for all operations and development projects in Asia.Building Efficiency business. He began his career with the former Tenneco Inc.Ford Motor Company in 1987, holding various positions1989 and worked in strategic planning, marketing, business development, quality systems and finance. Prior to joining Tenneco, Mr. Nair was a senior financial analyst at General Motors Corporation focusing on European operations. Mr. Nair became a director of our companyNorth America Assembly Operations for five years, specializing in March 2009.manufacturing management. — - Mr. Fornos was named Executive Vice President, Enterprise Business Initiatives in September 2015. He served as Executive Vice President, Clean Air Division from October 2014 to September 2015. Prior to that, Mr. Fornos served as Executive Vice President, Ride Performance Division infrom February 2013. He served2013 to October 2014, as Executive Vice President and General Manager, Europe, South America and India from March 2012 to February 2013 and as Senior Vice President and General Manager, Europe, South America and India from July 2010 to March 2012. Prior to that, he had served as Vice President and General Manager, Europe Original Equipment Emission Control since March 2007. Mr. Fornos joined Tenneco in July 2000 as Vice President and General Manager, Europe Original Equipment Ride Control. Prior to joining Tenneco, Fornos spent a year at Lear Corporation as General Manager of the company’s seating and wire and harness business in France, following Lear’s acquisition of United Technologies Automotive. Mr. Fornos spent 16 years with United Technologies Automotive, holding several management positions in production, engineering and quality control in Spain and later having Europe-wide responsibility for engineering and quality control.1425 within the automotive industry, he had also served as Chief Executive Officer for HiSan, a joint venture between ITT Industries and Sanoh Industrial Company. Mr. Jackson has also held senior management positions at BF Goodrich Aerospace and General Motors Corporation.Executive Vice President and Chief Financial Officer since January 2006.September 2003. Mr. Trammell was named oura Senior Vice President and Chief Financial Officer infrom September 2003 having served asuntil January 2006 when he became an Executive Vice President. He was our Vice President and Controller sincefrom September 1999. From1999 to September 2003 and Corporate Controller of Tenneco Inc. from April 1997 to November 1999, he served as Corporate Controller of Tenneco Inc.1999. He joined Tenneco Inc. in May 1996 as Assistant Controller. Before joining Tenneco Inc., Mr. Trammell spent 12 years with the international public accounting firm of Arthur Andersen LLP, last serving as a senior manager.Neal A. Yanos — Mr. Yanos was named Executive Vice President, Clean Air Division in February 2013. He served as Executive Vice President, North America from July 2008 to February 2013. Prior to that, he served as our Senior Vice President and General Manager — North American Original Equipment Ride Control and North American Aftermarket since May 2003. He joined our Monroe ride control division as a process engineer in 1988 and since that time has served in a broad range of assignments including product engineering, strategic planning, business development, finance, program management and marketing, including Director of our North American Original Equipment GM/VW business unit and most recently as our Vice President and General Manager — North American Original Equipment Ride Control from December 2000. Before joining our company, Mr. Yanos was employed in various engineering positions by Sheller Globe Inc. from 1985 to 1988.Brent J. Bauer — Mr. Bauer has served as our Senior Vice President and General Manager — North American Original Equipment Emission Control since May 2002. Prior to this appointment, Mr. Bauer was named Vice President and General Manager — European and North American Original Equipment Emission Control in July 2001. Mr. Bauer joined Tenneco Automotive in August 1996 as a Plant Manager and was named Vice President and General Manager — European Original Equipment Emission Control in September 1999. Prior to joining Tenneco, he was employed at AeroquipVickers Corporation for 20 years in positions of increasing responsibility serving most recently as Director of Operations.Michael J. Charlton —Peng (Patrick) Guo - Mr. Charlton was namedGuo has served as Senior Vice President Global Manufacturing Development and European Cost Reduction Initiatives in February 2013. HeGeneral Manager, Asia Pacific since October 2014. Prior to this appointment, Mr. Guo served as our Senior Vice President Global Supply Chain Management and Manufacturing from January 2010Managing Director, China since 2007. From 1996 to February 2013.2003, Mr. CharltonGuo served as our Vice President, Global Supply Chain Management and Manufacturing from November 2008 through December 2009. Mr. Charlton served as Tenneco’s Managing Director for India from January 2008 until November 2008. Prior to that, he served as the operations director for the Company’s emission control businessGeneral Manager, Asia Aftermarket Operations while based in Europe since 2005. Prior to joiningBeijing, China. He left Tenneco in 2005, Mr. Charlton held a varietyOctober 2003 to become president of positions of increasing responsibility at TRWthe AGC Automotive the most recent being Lead Director, European Purchasing andChina Operations for the United Kingdom.Ashai Glass Company. He returned to Tenneco in July 2007. Before joining Tenneco, Mr. Guo was an engineer at the Ford Motor Company, which included assignments in manufacturing, quality and product design.BarbaraHenry Hummel - Mr. Hummel was named Senior Vice President and General Manager, Clean Air Division in September 2015. He is responsible for leading Tenneco's Clean Air product line. Mr. Hummel joined Tenneco from GE Healthcare where, since October 2014, he had been serving as President and CEO of molecular imaging and computed tomography, leading the company's $3.5 billion global business focused on diagnostic imaging equipment and services. He had been with GE Healthcare for more than 20 years, managing global business and functions including operations, strategic planning, new product introductions, technology and business integration. In addition to his time with GE Healthcare, Mr. Hummel also spent time with Johnson Controls, Inc., serving as Vice President and General Manager Service North America and Covance, as Vice President and General Manager of the company's Madison, Wisconsin laboratories.Kluth — Ms. KluthPomaranski - Mr. Pomaranski has served as our Senior Vice President and General Manager, Global Human ResourcesAftermarket since March 2011. She was namedOctober 2014. Prior to this appointment, Mr. Pomaranski served as Vice President Global Human Resources in April 2010. In December 2001, she was named Executive Director, HR,and General Manager, North America after beginning her career in human resources in 1988Aftermarket since November 2010. He served as HR manager for our Marshall, Michigan facility. SheVice President, North America Aftermarket from August 2008 to November 2010. Prior to that, Mr. Pomaranski served as Vice President, North America Aftermarket Sales from May 1999 to August 2008. Mr. Pomaranski joined Tenneco in 19851999 from Federal Mogul where he held the position of Director of Sales, Special Markets. Prior to that, he worked for Cooper Automotive as an internal auditor.Vice President of Sales. He began his career with Champion Spark Plug where he held various positions from 1977 to 1998.Paul D. NovasJohn E. Kunz — Mr. NovasKunz has served as our Vice President and Controller since July 2006.March 2015 and is our company's principal accounting officer with responsibility for Tenneco's corporate accounting and financial reporting globally. Prior to assuming his role as Controller, Mr. NovasKunz served as Vice President, FinanceTreasurer and AdministrationTax, responsible for Tenneco Europe from January 2004 until July 2006our company's global tax function. Mr. Kunz also oversaw our company's treasury, insurance and as Vice Presidentinvestment activities including building and Treasurer of Tenneco from November 1999 until January 2004.managing relationships with the banking community and rating agencies. Mr. NovasKunz joined Tenneco in 1996 as assistant treasurer responsible for corporate finance2004 from Great Lakes Chemical Corporation, where he rose through responsibility to become vice president and North American treasury operations.treasurer. Prior to joining Tenneco,Great Lakes in 1999, Mr. Novas workedKunz was director of corporate development at Weirton Steel Corporation, where he also held prior positions in capital planning, business development and financial analysis. Prior to that, Mr. Kunz spent four years with the treasurer’s officeinternational public accounting firm of General Motors Corporation for ten years.KPMG.ITEM 5. MARKET FOR REGISTRANT’S COMMON EQUITY, RELATED STOCKHOLDER MATTERS, AND ISSUER PURCHASES OF EQUITY SECURITIES. Sales Prices High Low $ 40.69 $ 29.45 39.28 24.35 32.81 24.43 35.25 26.72 $ 46.81 $ 36.23 46.80 36.52 46.49 24.33 36.96 22.47 Sales Prices Quarter High Low 2015 1st $ 59.87 $ 49.14 2nd 61.73 55.01 3rd 58.20 39.13 4th 57.18 44.15 2014 1st $ 62.75 $ 52.21 2nd 67.69 56.10 3rd 69.22 52.20 4th 58.08 46.64 21, 2013,19, 2016, there were approximately 17,79215,712 holders of record of our common stock, including brokers and other nominees.Werestricted with respect toour debt agreements contain certain restrictions on the payment of dividends underdepending upon the termsratio of our financing arrangements. On January 10, 2001, we announced thatearnings to our Board of Directors eliminated the regular quarterly dividend on the Company’s common stock. The Board took this action in response to then current industry conditions, primarily greater than anticipated production volume reductions by OEMs in North America and continued softness in the global aftermarket.debt. We have not paid dividends on our common stock since the fourth quarter of 2000. There are no current plans to reinstate a dividend on our common stock. For additional information concerning our payment of dividends, see “Management’s Discussion and Analysis of Financial Condition and Results of Operations” included in Item 7.2012. All these2015. These purchases reflectinclude shares withheld upon vesting of restricted stock for minimum tax withholding obligations. We generally intend to continue to satisfy statutory minimum tax withholding obligations in connection with the vesting of outstanding restricted stock through the withholding of shares. Total Number of
Shares Purchased Average Price
Paid — $— 10 30.85 — — 10 $30.85 Period Total Number of
Shares Purchased Average Price
Paid Total Number of Shares Purchased as Part of Publicly Announced Plans or Programs Maximum Value of Shares That May Yet be Purchased Under These Plans or Programs (Millions) October 2015 1,065,919 $ 48.55 1,065,919 $ 340 November 2015 58,345 $ 56.13 57,951 $ 337 December 2015 32 $ 50.50 — $ 337 Total 1,124,296 1,123,870 $ 337 January 2013,October 2015, our Board of Directors approved aexpanded our company’s share repurchase program, authorizing the repurchase of an additional $200 million of our company to repurchase up to 550,000 shares of the Company’scompany's outstanding common stock over a 12 month period. Ourstock. This authorization was in addition to the $350 million share repurchase program is intended to offset dilution from sharesour company announced in January 2015. We anticipate completing the additional $200 million share repurchase program by the end of restricted stock and stock options issued in 2013 to employees.Meritor, Inc., American Axle & Manufacturing Co., Borg Warner Inc., Cummins Inc., Johnson Controls Inc., Lear Corp., Magna International Inc., and TRW Automotive Holdings Corp.Meritor, Inc. These comparisons assume an initial investment of $100 and the reinvestment of dividends.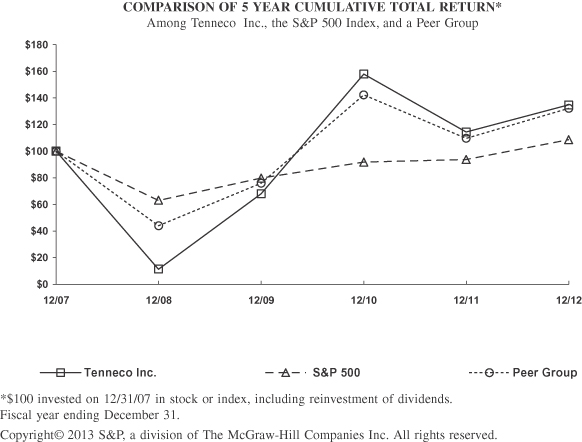
12/31/07 12/31/08 12/31/09 12/31/10 12/31/11 12/31/12 100.00 11.32 68.01 157.88 114.23 134.68 100.00 63.00 79.67 91.67 93.61 108.59 100.00 43.85 75.82 142.16 109.60 131.99 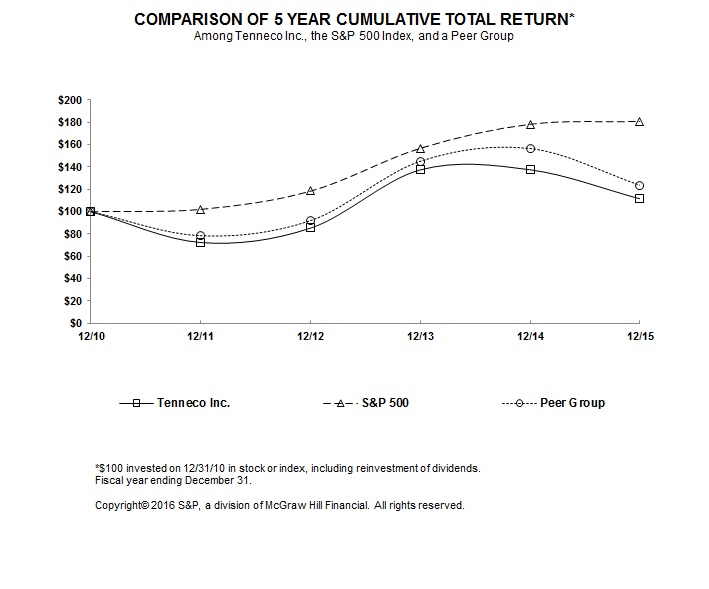
12/31/2010 12/31/2011 12/31/2012 12/31/2013 12/31/2014 12/31/2015 Tenneco Inc. 100.00 72.35 85.30 137.44 137.54 111.54 S&P 500 100.00 102.11 118.45 156.82 178.29 180.75 Peer Group 100.00 78.45 92.10 145.18 156.60 123.67 ITEM 6.SELECTED FINANCIAL DATA. Year Ended December 31, 2012(a) 2011(b) 2010 2009(c) 2008(d) (Millions Except Share and Per Share Amounts) $ 3,735 $ 3,426 $ 2,832 $ 2,099 $ 2,641 2,921 3,169 2,594 2,209 2,983 908 804 698 525 543 (201 ) (194 ) (187 ) (184 ) (251 ) $ 7,363 $ 7,205 $ 5,937 $ 4,649 $ 5,916 $ 288 $ 216 $ 155 $ 42 $ (107 ) 71 125 76 20 85 69 38 50 30 19 428 379 281 92 (3 ) 105 108 149 133 113 19 88 69 13 289 304 183 63 (54 ) (405 ) 29 26 24 19 10 $ 275 $ 157 $ 39 $ (73 ) $ (415 ) 59,985,677 59,884,139 59,208,103 48,572,463 46,406,095 61,083,510 61,520,160 60,998,694 48,572,463 46,406,095 $ 4.58 $ 2.62 $ 0.65 $ (1.50 ) $ (8.95 ) $ 4.50 $ 2.55 $ 0.63 $ (1.50 ) $ (8.95 ) Years Ended December 31, 2012 2011 2010 2009 2008 (Millions Except Ratio and Percent Amounts) $ 3,608 $ 3,337 $ 3,167 $ 2,841 $ 2,828 113 66 63 75 49 1,067 1,158 1,160 1,145 1,402 15 12 12 7 7 246 — (4 ) (21 ) (251 ) 45 43 39 32 24 291 43 35 11 (227 ) $ 365 $ 245 $ 244 $ 241 $ 160 (273 ) (224 ) (157 ) (119 ) (261 ) (89 ) (26 ) (30 ) (87 ) 58 (256 ) (213 ) (151 ) (120 ) (233 ) $ 633 $ 586 $ 497 $ 313 $ 219 6.03 5.43 3.34 2.35 1.94 1.51 1.72 1.99 3.36 6.05 3.55 3.10 1.79 — — Year Ended December 31, 2015(a) 2014(b) 2013(c) 2012(d) 2011(e) (Millions Except Share and Per Share Amounts) Statements of Income Data: Net sales and operating revenues — Clean Air Division North America $ 2,867 $ 2,840 $ 2,666 $ 2,512 $ 2,291 Europe, South America & India 1,935 2,088 2,045 1,827 1,952 Asia Pacific 1,037 1,022 853 695 625 Intergroup sales (116 ) (139 ) (120 ) (108 ) (107 ) Total Clean Air Division 5,723 5,811 5,444 4,926 4,761 Ride Performance Division North America 1,323 1,361 1,265 1,223 1,135 Europe, South America & India 972 1,070 1,087 1,094 1,217 Asia Pacific 275 269 251 213 179 Intergroup sales (84 ) (91 ) (83 ) (93 ) (87 ) Total Ride Performance Division 2,486 2,609 2,520 2,437 2,444 Total Tenneco Inc. $ 8,209 $ 8,420 $ 7,964 $ 7,363 $ 7,205 Earnings before interest expense, income taxes, and noncontrolling interests — Clean Air Division North America $ 244 $ 237 $ 229 $ 202 $ 172 Europe, South America & India 52 59 57 $ 54 $ 79 Asia Pacific 121 101 84 $ 71 $ 47 Total Clean Air Division 417 397 370 $ 327 $ 298 Ride Performance Division North America 155 143 124 $ 122 $ 76 Europe, South America & India (5 ) 40 (7 ) $ 41 $ 69 Asia Pacific 39 36 22 $ 5 $ (6 ) Total Ride Performance Division 189 219 139 $ 168 $ 139 Other (87 ) (124 ) (85 ) (67 ) (58 ) Total Tenneco Inc. $ 519 $ 492 $ 424 428 379 Interest expense (net of interest capitalized) 67 91 80 105 108 Income tax expense 149 131 122 19 88 Net income 303 270 222 304 183 Less: Net income attributable to noncontrolling interests 56 44 39 29 26 Net income attributable to Tenneco Inc. $ 247 $ 226 $ 183 $ 275 $ 157 Weighted average shares of common stock outstanding — Basic 59,678,309 60,734,022 60,474,492 59,985,677 59,884,139 Diluted 60,193,150 61,782,508 61,594,062 61,083,510 61,520,160 Basic earnings per share of common stock $ 4.14 $ 3.72 $ 3.03 $ 4.58 $ 2.62 Diluted earnings per share of common stock $ 4.11 $ 3.66 $ 2.97 $ 4.50 $ 2.55 Years Ended December 31, 2015 2014 2013 2012 2011 (Millions Except Ratio and Percent Amounts) Balance Sheet Data (at year end): Total assets(f) $ 3,967 $ 3,996 $ 3,817 $ 3,593 $ 3,317 Short-term debt 86 60 83 113 66 Long-term debt(f) 1,124 1,055 1,006 1,052 1,138 Redeemable noncontrolling interests 43 35 20 15 12 Total Tenneco Inc. shareholders’ equity 433 497 433 246 — Noncontrolling interests 42 41 39 45 43 Total equity 475 538 472 291 43 Statement of Cash Flows Data: Net cash provided by operating activities $ 517 $ 341 $ 503 $ 365 $ 245 Net cash used by investing activities (303 ) (339 ) (266 ) (273 ) (224 ) Net cash provided (used) by financing activities (172 ) 20 (175 ) (89 ) (26 ) Cash payments for plant, property and equipment (286 ) (328 ) (244 ) (256 ) (213 ) Other Data: EBITDA including noncontrolling interests(g) $ 722 $ 700 $ 629 $ 633 $ 586 Ratio of EBITDA including noncontrolling interests to interest expense 10.78 7.69 7.86 6.03 5.43 Ratio of net debt (total debt less cash and cash equivalents) to EBITDA including noncontrolling interests(h) 1.28 1.19 1.29 1.49 1.69 Ratio of earnings to fixed charges(i) 5.85 4.41 4.34 3.55 3.10 2012,2015, which are discussed in the following notes, are included in this Form 10-K under Item 8.(a) 2015 includes $63 million of restructuring and related costs primarily related to the European cost reduction efforts, exiting the Marzocchi suspension business, headcount reductions in Australia and South America, and the closure of a JIT plant in Australia. Of the total $63 million we incurred in restructuring and related costs, $10 million was related to asset write-downs. 2015 also includes $4 million in charges related to pension benefits. (b) 2014 includes $49 million of restructuring and related costs primarily related to the European cost reduction efforts, headcount reductions in Australia and South America, the sale of a closed facility in Cozad, Nebraska and costs related to organizational changes. Of the total $49 million we incurred in restructuring and related costs, $3 million was related to non-cash asset write downs and $2 million was related to a non-cash charge on the sale of a closed facility. 2014 also includes $32 million in charges related to postretirement benefits, of which $21 million was a non-cash charge related to payments made to retirement plan participants out of pension assets and $11 million related to an adjustment to the postretirement medical liability. (c) 2013 includes $78 million of restructuring and related costs primarily related to European cost reduction efforts including the planned closing of the ride performance plant in Gijon, Spain and intended reductions to the workforce at our ride performance plant in Sint-Truiden, our exit from the distribution of aftermarket exhaust products and ending production of leaf springs in Australia, headcount reductions in various regions, and the net impact of freezing our defined benefit plans in the United Kingdom. Of the total $78 million we incurred in restructuring and related costs, $3 million was related to non-cash asset write downs. (d) 2012 includes a $7 million asset impairment charge related to certain assets of our European ride controlRide Performance business and a benefit of $5 million from property recoveries related to transactions originated by The Pullman Company before being acquired by Tenneco in 1996.(b)(e) During the third quarter of 2011, we recorded a goodwill impairment charge of $11 million related to our Australian reporting unit within the Asia Pacific segment. (c)We incurred no(f) In April 2015, the FASB issued Accounting Standard Update 2015-03, Simplifying the Presentation of Debt Issuance Costs, which requires debt issuance costs to be presented in the balance sheet as a direct economic lossdeduction from the bankruptcy filing of Chrysler and General Motors plants in North America during the second and third quarters of 2009. In this regard, we collected substantially all of our pre-petition receivables from Chrysler Group LLC and Chrysler Group LLC has assumed substantially all of the contracts which we had with Chrysler LLC. We collected substantially all of our pre-petition receivables from General Motors Company and General Motors Company has assumed substantially all of the contracts which we had with General Motors Corporation. However, the vehicle production shutdowns at Chrysler and significant reductions in vehicle production volumes at General Motors plants in North America during the second quarter of 2009 that coincided with their bankruptcies did cause Tenneco’s revenue from those two customers in North America to decline to $123 million in the second quarter of 2009, down from $242 million in the second quarter of 2008. We believe that General Motors and Chrysler were able to meet any unmet demand for their vehicles resulting from their production volume reductions in the second quarter of 2009 during the second half of 2009 after they exited their respective bankruptcy proceedings. Accordingly, for the entire 2009 calendar year, we consider the vehicle production volume reductions at Chrysler and General Motors to have been primarily driven by the same severe deterioration in overall economic conditions that caused substantially all of our original equipment customers in North America to significantly reduce production volumes in response to lower purchases of new vehicles.associated(d)During the fourth quarter of 2008, we recorded a goodwill impairment charge of $114 million related to our North American Original Equipment Ride Control reporting unit whose carrying value exceeded the estimated fair value. In addition, during the second half of 2008, we recorded tax expense of $190 million related to establishing a valuation allowance against our net deferred tax assets in the U.S.(e)(g)EBITDA including noncontrolling interests is a non-GAAP measure defined as net income before extraordinary items, cumulative effect of changes in accounting principle, interest expense, income taxes, depreciation and amortization and noncontrolling interests. We use EBITDA including noncontrolling interests, together with GAAP measures, to evaluate and compare our operating performance on a consistent basis between time periods and with other companies that compete in our markets but which may have different capital structures and tax positions, which can have an impact on the comparability of interest expense, noncontrolling interests and tax expense. We also believe that using this measure allows us to understand and compare operating performance both with and without depreciation expense, which can vary based on several factors.expense. We believe EBITDA including noncontrolling interests is useful to our investors and other parties for these same reasons. Year Ended December 31, 2012 2011 2010 2009 2008 (Millions) $ 275 $ 157 $ 39 $ (73 ) $ (415 ) 29 26 24 19 10 19 88 69 13 289 105 108 149 133 113 205 207 216 221 222 $ 633 $ 586 $ 497 $ 313 $ 219 Year Ended December 31, 2015 2014 2013 2012 2011 (Millions) Net income $ 247 $ 226 $ 183 $ 275 $ 157 Noncontrolling interests 56 44 39 29 26 Income tax expense 149 131 122 19 88 Interest expense, net of interest capitalized 67 91 80 105 108 Depreciation and amortization of other intangibles 203 208 205 205 207 Total EBITDA including noncontrolling interests $ 722 $ 700 $ 629 $ 633 $ 586 (f)(h) We present the ratio of net debt (total debt less cash and cash equivalents) to EBITDA including noncontrolling interests because management believes it is a useful measure of Tenneco’s credit position and progress toward reducing leverage. The calculation is limited in that we may not always be able to use cash to repay debt on a dollar-for-dollar basis. Net debt balances are derived from the balance sheets as follows: Year Ended December 31, 2015 2014 2013 2012 2011 (Millions) Total Debt $ 1,210 $ 1,115 $ 1,089 $ 1,165 $ 1,204 Total Cash 288 285 280 223 214 Net Debt $ 922 $ 830 $ 809 $ 942 $ 990 (g)(i) For purposes of computing this ratio, earnings generally consist of income before income taxes and fixed charges excluding capitalized interest. Fixed charges consist of interest expense, the portion of rental expense considered representative of the interest factor and capitalized interest. Earnings were insufficient to cover fixed charges by $39 million and $121 million for the years ended December 31, 2009 and 2008, respectively. See Exhibit 12 to this Form 10-K for the calculation of this ratio.ITEM 7. MANAGEMENT’S DISCUSSION AND ANALYSIS OF FINANCIAL CONDITION AND RESULTS OF OPERATIONS. ITEMItem 8.emission controlclean air and ride controlperformance products and systems for light vehicle, commercial truck and specialty vehicleoff-highway applications. We serve both original equipment (OE) vehicle designers and manufacturers and the repair and replacement markets, or aftermarket, globally through leading brands, including Monroe®, Rancho®, Clevite® Elastomers, MarzocchiAxios™, Kinetic®, Axiosand Fric-Rot™ ride performance products and Walker®, KineticXNOx®, Fonos™ and Fric-Rot™, DynoMax ride control products and Walker®, XNOx™ and Thrush, Fonos™, DynoMax®, Thrush™ and Lukey™ emission controlclean air products. We serve more than 6380 different original equipment manufacturers and commercial vehicletruck and off-highway engine manufacturers, and our products are included on all tennine of the top 10 car models produced for sale in Europe and eight of the top 10 light truck models produced for sale in North America for 2012.2015. Our aftermarket customers are comprised of full-line and specialty warehouse distributors, retailers, jobbers, installer chains and car dealers. As of December 31, 2012,2015, we operated 8993 manufacturing facilities worldwide and employed approximately 25,00030,000 people to service our customers’ demands.2012,2015, light vehicle production continued to improve from recent years in some of the geographic regions in which we operate. Light vehicle production was up 17three percent in North America, though not to levels seen in recent history, and six percent in India, and four percent in both Europe and China. EuropeanSouth America light vehicle production was down five21 percent and Australia was down two percent from 20112014 levels.haveare organized and manage our business along our two major product lines (clean air and ride performance) and three geographic areas (North America; Europe, South America and India; and Asia Pacific), resulting in six operating segments (North America Clean Air, North America Ride Performance, Europe, South America and India Clean Air, Europe, South America and India Ride Performance, Asia Pacific Clean Air and Asia Pacific Ride Performance). Within each geographical area, each operating segment manufactures and distributes either clean air or ride performance products primarily for the original equipment and aftermarket industries. Each of the six operating segments constitutes a substantial amount of indebtedness. As such, our abilityreportable segment. Costs related to generate cash — both to fund operations and service our debt — is also a significant area of focus for our company. See “Liquidity and Capital Resources” below for further discussion of cash flows and Item 1A, “Risk Factors” included in this Annual Report on Form 10-K.20122015 was $7,363$8,209 million, a twothree percent increasedecrease from $7,205$8,420 million in 2011.2014. Excluding the impact of currency and substrate sales, revenue was up $411$315 million from $5,527$6,486 million to $5,938$6,801 million, driven primarily by higher year-over-yearstronger OE light vehicle production volumes higherin North AmericanAmerica, Europe, India and China, increased aftermarket sales in North America and incrementalSouth America and new platforms in Europe, China and Japan, which were partially offset by lower commercial vehicle revenue.20122015 was $6,170$6,845 million, or 83.4 percent of sales, compared to $6,037$7,025 million, in 2011, or 83.883.4 percent of sales in both years.2014. The following table lists the primary drivers behind the change in cost of sales ($ millions). $ 6,037 348 (32 ) (231 ) 1 47 $ 6,170 Year ended December 31, 2014 $ 7,025 Volume and mix 471 Material (120 ) Currency exchange rates (521 ) Restructuring — Other Costs (10 ) Year ended December 31, 2015 $ 6,845 increasedecrease in cost of sales was due primarily to the impact of currency exchange rates, lower net material costs, and lower other costs, mainly manufacturing, partially offset by the year-over-year increase in production volumes and other costs, mainly manufacturing, offset by the impactvolume.20122015 was $1,193$1,364 million, or 16.6 percent of sales, versus $1,168$1,395 million, in 2011, or 16.216.6 percent of sales in both years.2014. The effectseffect on gross margin resulting from higher volumesyear-over-year increase in volume, lower net material costs and material cost management werelower other costs, mainly manufacturing, was more than offset by a higher mix of OE revenues, negative currency and higher manufacturing costs.$126$146 million and $133$169 million in 20122015 and 2011, respectively. Increased spending2014, respectively, mainly due to support customer programs, technology applications,currency impact and growth in emerging markets were more than offset by increased engineering cost recoveries and a strong U.S. dollar which drove the decrease in expense year-over-year.administrative:administrative (SG&A): Selling, general and administrative expense was down $1$28 million in 2012,2015, at $427$491 million, compared to $428$519 million in 2011. Increased costs2014, mainly due to investments in new facilities in China and Thailand were more than offset by lower aftermarket changeover costs, a $5 million benefit from property recoveries related to transactions originated by The Pullman Company before being acquired by Tenneco in 1996 and the stronger U.S. dollar.in 2012 was $205$203 million compared to $207and $208 million in 2011. 2012 includes a $7 million asset impairment charge related to the European ride control business.Goodwill impairment: There were no goodwill impairment charges in 2012. In 2011 we recorded a goodwill impairment charge of $11 million related to our Australian business.$428$519 million for 2012,2015, an improvementincrease of $49$27 million, when compared to $379$492 million in the prior year. StrongerHigher OE light vehicle production volumes in North America, Europe, India and China, increased aftermarket sales in North America and South America, new platforms in Europe, China and Japan, the related fixed manufacturing cost absorption, incremental commercial vehicle business, decreased material costs, a benefit of $5 millionour product cost leadership initiatives and savings from property recoveries related to transactions originatedprevious restructuring activities were partially offset by The Pullman Company before being acquired by Tennecolower commercial truck, off-highway and other revenue mainly in 1996, higher engineering cost recoveries,South America and no goodwill impairment charges drove the year-over-year increase to EBIT. Partially offsetting the increase were higher costs due to investments in China, and Thailand, contractual price reductions,unfavorable mix, higher restructuring costs and related expenses, increased manufacturing and freight expenses and $23$64 million of negative currency.20122015 and 2011following tables below reflect our revenues for 20122015 and 2011.2014. We present these reconciliations of revenues in order to reflect the trend in our sales in various product lines and geographic regions separately from the effects of doing business in currencies other than the U.S. dollar. We have not reflected any currency impact in the 2011 table since this is the base period for measuring the effects of currency during 2012 on our operations. We believe investors find this information useful in understanding period-to-period comparisons in our revenues.Additionally, we show the component of our OE revenue represented by substrate sales in the following tables.sales. While we generally have primary design, engineering and manufacturing responsibility for OE emission control systems, we do not manufacture substrates. Substrates are porous ceramic filters coated with a catalyst —- typically, precious metals such as platinum, palladium and rhodium. These are supplied to us by Tier 2 suppliers generally as directed by our OE customers. We generally earn a small margin on these components of the system. As the need for more sophisticated emission control solutions increases to meet more stringent environmental regulations, and as we capture more diesel aftertreatment business, these substrate components have been increasing as a percentage of our revenue. While these substrates dilute our gross margin percentage, they are a necessary component of an emission control system. We view the growth of substrates as a key indicator that our value-add content in an emission control system is moving toward the higher technology hot-end gas and diesel business. Year Ended December 31, 2012 Revenues Currency
Impact Revenues
Excluding
Currency Substrate
Sales
Excluding
Currency Revenues
Excluding
Currency and
Substrate
Sales (Millions) $ 660 $ (1 ) $ 661 $ — $ 661 2,297 — 2,297 997 1,300 2,957 (1 ) 2,958 997 1,961 553 1 552 — 552 209 — 209 — 209 762 1 761 — 761 3,719 — 3,719 997 2,722 496 (43 ) 539 — 539 1,398 (125 ) 1,523 534 989 1,894 (168 ) 2,062 534 1,528 197 (20 ) 217 — 217 106 (9 ) 115 — 115 303 (29 ) 332 — 332 570 (89 ) 659 89 570 2,767 (286 ) 3,053 623 2,430 724 2 722 80 642 153 (2 ) 155 11 144 877 — 877 91 786 $ 7,363 $ (286 ) $ 7,649 $ 1,711 $ 5,938 Year Ended December 31, 2011 Revenues Currency
Impact Revenues
Excluding
Currency Substrate
Sales
Excluding
Currency Revenues
Excluding
Currency and
Substrate
Sales (Millions) $ 608 $ — $ 608 $ — $ 608 2,085 — 2,085 971 1,114 2,693 — 2,693 971 1,722 518 — 518 — 518 203 — 203 — 203 721 — 721 — 721 3,414 — 3,414 971 2,443 567 — 567 — 567 1,455 — 1,455 494 961 2,022 — 2,022 494 1,528 219 — 219 — 219 140 — 140 — 140 359 — 359 — 359 632 — 632 103 529 3,013 — 3,013 597 2,416 618 — 618 98 520 160 — 160 12 148 778 — 778 110 668 $ 7,205 $ — $ 7,205 $ 1,678 $ 5,527 Year Ended December 31, 2012
Versus Year Ended December 31, 2011
Dollar and Percent Increase (Decrease) Revenues Percent Revenues
Excluding
Currency and
Substrate
Sales Percent (Millions Except Percent Amounts) $ 52 9 % $ 53 9 % 212 10 % 186 17 % 264 10 % 239 14 % 35 7 % 34 7 % 6 3 % 6 3 % 41 6 % 40 6 % 305 9 % 279 11 % (71 ) (13 )% (28 ) (5 )% (57 ) (4 )% 28 3 % (128 ) (6 )% — 0 % (22 ) (10 )% (2 ) (1 )% (34 ) (24 )% (25 ) (18 )% (56 ) (16 )% (27 ) (8 )% (62 ) (10 )% 41 8 % (246 ) (8 )% 14 1 % 106 17 % 122 23 % (7 ) (4 )% (4 ) (3 )% 99 13 % 118 18 % $ 158 2 % $ 411 7 % Year Ended December 31, 2015 Revenues Substrate Sales Value-add Revenues Currency Impact on Value-add Revenues Value-add Revenues excluding Currency (Millions) Clean Air Division North America $ 2,851 $ 1,007 $ 1,844 $ (5 ) $ 1,849 Europe, South America & India 1,835 664 1,171 (236 ) 1,407 Asia Pacific 1,037 245 792 (28 ) 820 Total Clean Air Division 5,723 1,916 3,807 (269 ) 4,076 Ride Performance Division North America 1,313 — 1,313 (29 ) 1,342 Europe, South America & India 944 — 944 (195 ) 1,139 Asia Pacific 229 — 229 (15 ) 244 Total Ride Performance Division 2,486 — 2,486 (239 ) 2,725 Total Tenneco Inc. $ 8,209 $ 1,916 $ 6,293 $ (508 ) $ 6,801 Year Ended December 31, 2014 Revenues Substrate Sales Value-add Revenues Currency Impact on Value-add Revenues Value-add Revenues excluding Currency (Millions) Clean Air Division North America $ 2,815 $ 1,045 $ 1,770 $ — $ 1,770 Europe, South America & India 1,974 668 1,306 — 1,306 Asia Pacific 1,022 221 801 — 801 Total Clean Air Division 5,811 1,934 3,877 — 3,877 Ride Performance Division North America 1,351 — 1,351 — 1,351 Europe, South America & India 1,032 — 1,032 — 1,032 Asia Pacific 226 — 226 — 226 Total Ride Performance Division 2,609 — 2,609 — 2,609 Total Tenneco Inc. $ 8,420 $ 1,934 $ 6,486 $ — $ 6,486 Year Ended December 31, 2015
Versus Year Ended December 31, 2014
Dollar and Percent Increase (Decrease) Revenues Percent Value-add Revenues excluding Currency Percent (Millions Except Percent Amounts) Clean Air Division North America $ 36 1 % $ 79 4 % Europe, South America & India (139 ) (7 )% 101 8 % Asia Pacific 15 1 % 19 2 % Total Clean Air Division (88 ) (2 )% 199 5 % Ride Performance Division North America (38 ) (3 )% (9 ) (1 )% Europe, South America & India (88 ) (9 )% 107 10 % Asia Pacific 3 1 % 18 8 % Total Ride Performance Division (123 ) (5 )% 116 4 % Total Tenneco Inc. $ (211 ) (3 )% $ 315 5 % 20122015 and 2011(According2014 (According to IHS Automotive, January 2013)2016) Year Ended
December 31, Increase
(Decrease) % Increase 2012 2011 (Number of Vehicles in Thousands) 15,414 13,126 2,288 17 % 19,205 20,159 (954 ) (5 )% 4,289 4,312 (23 ) (1 )% 3,791 3,600 191 5 % 27,285 28,071 (786 ) (3 )% 18,283 17,276 1,007 6 % 229 222 7 3 % Year Ended December 31, 2015 2014 Increase
(Decrease) % Increase
(Decrease) (Number of Vehicles in Thousands) North America 17,497 17,029 468 3 % Europe 20,918 20,151 767 4 % South America 3,034 3,818 (784 ) (21 )% India 3,805 3,594 211 6 % Total Europe, South America & India 27,757 27,563 194 1 % China 23,580 22,610 970 4 % Australia 172 175 (3 ) (2 )% light vehicle production increased 17 percent, while industry Class 8 commercial vehicle production was up nine percentrevenues. In the European, South American and industry Class 4-7 commercial vehicle production was up 12 percentIndian region, higher volumes drove a $230 million increase in 2012 when compared to 2011. Revenues from our North American operations increased in 2012 compared to last yearrevenues mainly due to higher OElight vehicle volumes, higher commercial truck, off-highway and other vehicle volumes and new platforms in Europe, partially offset by lower year-over-year volumes in South America and lower aftermarket sales of both product lines.volumes in Europe. Currency had a $358 million unfavorable impact on European, South American and Indian revenues. The increase in North American OEAsia Pacific revenues was primarily driven by improvedhigher volumes of $70 million, mostly due to higher light vehicle production in China and new programs in China and Japan, partially offset by lower commercial truck vehicle volumes which accounted for $254 million of the year-over-year change in revenues, on Tenneco-supplied platforms. Also contributing to the increase were incremental commercial vehicle revenues.China. Currency had a $1$36 million unfavorable impact on OEAsia Pacific revenues.year-over-year. The increasewas down $123 million in aftermarket revenue for2015 compared to 2014. In North America, was primarily due tolower volumes of $2 million driven by lower light vehicle and commercial truck, off-highway and other vehicle volumes, were partially offset by higher ride control volumes which resulted in an increase in revenue ofaftermarket sales. Currency had a $29 million. Favorable currency impacted aftermarket revenue by $1 million year-over-year.Ourunfavorable impact on North American revenues. In the European, South American and Indian segment’s revenues decreased in 2012 compared to last year, due to unfavorable currency, decreased OE ride controlregion, higher volumes of $104 million were driven by light vehicle and aftermarket salesincreases in Europethe region and lowerhigher commercial truck and off-highway vehicle revenues and new platforms in South America. The full year total European light vehicle industry production was down five percent, while industry Class 8 commercial vehicle production and industry Class 4-7 commercial vehicle production were each down six percent in 2012 when compared to 2011. Excluding negative currency, our Europe OE emission control revenues increased on improved volumes due to higher OE production on Tenneco-supplied platforms, as well as the beginning of the ramp-up on commercial vehicle programs which combined contributed to an increase in revenue of $73 million. Excluding currency, European OE ride control revenues decreased $28 million due to lower volumes. Excluding currency, European ride control aftermarket revenues were down compared to last year due to lower sales volumes whichEurope. Currency had a $4$195 million impact. Excluding currency,unfavorable impact on European, emission control aftermarket sales were down due to lower volumes which impacted revenue by $24 million. Light vehicle production decreased one percent in South America but increased five percent in India in 2012 when compared to 2011. Excluding negative currency, combined South American and Indian revenues wererevenues. In the Asia Pacific region, higher in 2012 when compared to the prior year primarilyvolumes of $19 million, mostly due to improved pricing in South America and strongerhigher light vehicle production volumes in IndiaChina, were partially offset by lower volumes in South America, which combined improved revenue by $27 million.Industry light vehicle production increased six percent year-over-year in China and three percent year-over-year in Australia. Revenues from ourCurrency had a $15 million unfavorable impact on Asia Pacific segment increased mainly due to higher sales in Asia. Asian revenues for 2012 improved from last year, primarily due to $120 million from stronger production volumes, particularly in China on key Tenneco-supplied platforms. Lower OE production volumes in Australia drove a $5 million negative impact on revenue for 2012 over 2011.20112014 and 201020112014 and 2010.2013. See “Net Sales and Operating Revenues for Years 20122015 and 2011”2014” for a description of why we present these reconciliations of revenue. Year Ended December 31, 2011 Revenues Currency
Impact Revenues
Excluding
Currency Substrate
Sales
Excluding
Currency Revenues
Excluding
Currency and
Substrate
Sales (Millions) $ 608 $ 4 $ 604 $ — $ 604 2,085 — 2,085 971 1,114 2,693 4 2,689 971 1,718 518 5 513 — 513 203 3 200 — 200 721 8 713 — 713 3,414 12 3,402 971 2,431 567 31 536 — 536 1,455 81 1,374 464 910 2,022 112 1,910 464 1,446 219 12 207 — 207 140 8 132 — 132 359 20 339 — 339 632 8 624 102 522 3,013 140 2,873 566 2,307 618 29 589 93 496 160 20 140 10 130 778 49 729 103 626 $ 7,205 $ 201 $ 7,004 $ 1,640 $ 5,364 Year Ended December 31, 2010 Revenues Currency
Impact Revenues
Excluding
Currency Substrate
Sales
Excluding
Currency Revenues
Excluding
Currency and
Substrate
Sales (Millions) $ 527 $ — $ 527 $ — $ 527 1,642 — 1,642 739 903 2,169 — 2,169 739 1,430 484 — 484 — 484 168 — 168 — 168 652 — 652 — 652 2,821 — 2,821 739 2,082 462 — 462 — 462 1,121 — 1,121 351 770 1,583 — 1,583 351 1,232 190 — 190 — 190 141 — 141 — 141 331 — 331 — 331 532 — 532 76 456 2,446 — 2,446 427 2,019 517 — 517 107 410 153 — 153 11 142 670 — 670 118 552 $ 5,937 $ — $ 5,937 $ 1,284 $ 4,653 Year Ended December 31, 2011
Versus Year Ended December 31, 2010
Dollar and Percent Increase (Decrease) Revenues Percent Revenues
Excluding
Currency and
Substrate
Sales Percent (Millions Except Percent Amounts) $ 81 15 % $ 77 15 % 443 27 % 211 23 % 524 24 % 288 20 % 34 7 % 29 6 % 35 21 % 32 19 % 69 11 % 61 9 % 593 21 % 349 17 % 105 23 % 74 16 % 334 30 % 140 18 % 439 28 % 214 17 % 29 15 % 17 9 % (1 ) (1 )% (9 ) (7 )% 28 8 % 8 2 % 100 19 % 66 15 % 567 23 % 288 14 % 101 20 % 86 21 % 7 5 % (12 ) (9 )% 108 16 % 74 13 % $ 1,268 21 % $ 711 15 % Year Ended December 31, 2014 Revenues Substrate Sales Value-add Revenues Currency Impact on Value-add Revenues Value-add Revenues excluding Currency (Millions) Clean Air Division North America $ 2,815 $ 1,045 $ 1,770 $ (3 ) $ 1,773 Europe, South America & India 1,974 668 1,306 (36 ) 1,342 Asia Pacific 1,022 221 801 (9 ) 810 Total Clean Air Division 5,811 1,934 3,877 (48 ) 3,925 Ride Performance Division North America 1,351 — 1,351 (14 ) 1,365 Europe, South America & India 1,032 — 1,032 (59 ) 1,091 Asia Pacific 226 — 226 (5 ) 231 Total Ride Performance Division 2,609 — 2,609 (78 ) 2,687 Total Tenneco Inc. $ 8,420 $ 1,934 $ 6,486 $ (126 ) $ 6,612 Year Ended December 31, 2013 Revenues Substrate Sales Value-add Revenues Currency Impact on Value-add Revenues Value-add Revenues excluding Currency (Millions) Clean Air Division North America $ 2,658 $ 1,030 $ 1,628 $ — $ 1,628 Europe, South America & India 1,934 663 1,271 — 1,271 Asia Pacific 852 142 710 — 710 Total Clean Air Division 5,444 1,835 3,609 — 3,609 Ride Performance Division North America 1,255 — 1,255 — 1,255 Europe, South America & India 1,046 — 1,046 — 1,046 Asia Pacific 219 — 219 — 219 Total Ride Performance Division 2,520 — 2,520 — 2,520 Total Tenneco Inc. $ 7,964 $ 1,835 $ 6,129 $ — $ 6,129 Year Ended December 31, 2014
Versus Year Ended December 31, 2013
Dollar and Percent Increase (Decrease) Revenues Percent Value-add Revenues excluding Currency Percent (Millions Except Percent Amounts) Clean Air Division North America $ 157 6% $ 145 9 % Europe, South America & India 40 2% 71 6 % Asia Pacific 170 20% 100 14 % Total Clean Air Division 367 7% 316 9 % Ride Performance Division North America 96 8% 110 9 % Europe, South America & India (14 ) (1)% 45 4 % Asia Pacific 7 3% 12 5 % Total Ride Performance Division 89 4% 167 7 % Total Tenneco Inc. $ 456 6% $ 483 8 % 20112014 and 2010(Updated2013 (Updated according to IHS Automotive, January 2013)2016) Year Ended
December 31, Increase
(Decrease) % Increase 2011 2010 (Number of Vehicles in Thousands) 13,126 11,941 1,185 10 % 20,159 19,208 951 5 % 4,312 4,173 139 3 % 3,600 3,247 353 11 % 28,071 26,628 1,443 5 % 17,276 16,398 878 5 % 222 242 (20 ) (8 )% North American light vehicle production increased 10 percent, while industry Class 8 commercial vehicle production Year Ended December 31, 2014 2013 Increase
(Decrease) % Increase
(Decrease) (Number of Vehicles in Thousands) North America 17,029 16,177 852 5% Europe 20,151 19,502 649 3% South America 3,818 4,534 (716 ) (16)% India 3,594 3,655 (61 ) (2)% Total Europe, South America & India 27,563 27,691 (128 ) —% China 22,610 20,920 1,690 8% Australia 175 210 (35 ) (17)% 61 percent and industry Class 4-7 commercial vehicle production was up 49 percent$367 million in 2011 when2014 compared to 2010. Revenues from our North American operations increased2013, driven by higher sales in 2011 compared to 2010 due to higher OE and aftermarket sales of both product lines.all the regions. The increase in North American OErevenues was driven by higher light vehicle volumes, new platforms launches and increased aftermarket revenues, which accounted for $174 million of the year-over-year change in revenues. Currency had a $3 million unfavorable impact on North American revenues. The increase in European, South American and Indian revenues was mostly driven by higher volumes of $91 million, mainly due to higher year-over-year light vehicle and commercial truck and off-highway vehicle revenues in Europe partially offset by lower revenues in South America and India and lower aftermarket volumes in Europe. Currency had a $43 million unfavorable impact on European, South American and Indian revenues. The increase in Asia Pacific revenues was primarily driven by improvedhigher volumes of $194 million, mostly due to higher light vehicle production, new programs and commercial truck and off-highway vehicle volumes which accounted for $503in China and Japan partially offset by lower volumes in Australia and Thailand. Currency had a $10 million of the change in revenues, on Tenneco-supplied vehicles such as the Ford Super-Duty and F-150 pick-ups, Ford Focus, Chevy Malibu, VW Jetta, Chevrolet Equinox, GM’s crossover models and the Toyota Tundra. Also contributing to the increase was a 63 percent increase in commercial vehicle OE revenues and a favorable $4 million currencyunfavorable impact on OEAsia Pacific revenues.2011 when2014 compared to 2010.2013, primarily driven by higher volumes in all the regions. The increase in aftermarket revenue for North AmericaAmerican revenues was primarily driven by higher volumes and mix of $108 million due to light vehicle and commercial truck volume growth and higher volumes and favorable mix in both product lines which resulted inthe aftermarket. Currency had a combined increase in revenue of $57 million. Favorable currency impacted aftermarket revenue by $8 million.Our$14 million unfavorable impact on North American revenues. In European, South American and Indian segment’s revenuesregion, higher volumes of $28 million was driven by increased light vehicle and commercial truck volumes in 2011 compared to 2010, due to increased sales in both Europe OE business units and European Aftermarket ride control as well ashigher aftermarket volumes in South America and India. The full year total European light vehicle industry production was up five percent, while industry Class 8 commercial vehicle production was up 37 percent and industry Class 4-7 commercial vehicle production was up eight percent in 2011 when compared to 2010. Improved volumes due to higher OE production on platforms such as the VW Golf and Polo, the Mercedes E-class and CLS, Daimler Sprinter, the Ford Focus, the BMW 1 and 3 Series, Audi A4, A6 and A1, Renault/Dacia Logan and Opel Astra and Zafira were the primary drivers of our increased Europe OE revenues and contributed to an increase in revenue of $315 million. Higher commercial and specialty revenue also contributed to this increase. European OE revenue also benefited compared to 2010 from improved pricing, mainly material cost recovery and favorable foreign currency whichCurrency had a combined$59 million unfavorable impact of $127 million. Excluding currency,on European, ride control aftermarket revenues improved compared to 2010 on higher sales volumes which had a $17 million impact, tied in part to heavy duty sales. Excluding currency, European emission control aftermarket sales were down mainly due to volumes which accounted for $8 million of the decline. Light vehicle production increased three percent in South America and 11 percent in India for 2011 when compared to 2010. South American and Indian revenues. The increase in Asia Pacific revenues werewas driven by higher in 2011 when compared to the 2010 primarilyvolumes of $16 million, mostly due to stronger OE and aftermarket volumes in both regions, which increased revenue by $76 million. Currency also added $8 million to South American and Indian revenue.Industryhigher light vehicle production increased five percentvolumes in China, but decreased eight percentpartially offset by lower volumes in Australia when comparing 2011 to 2010. Revenues from ourAustralia. Currency had a $5 million unfavorable impact on Asia Pacific segment increased mainly due to higher sales in China. Asian revenues for 2011 improved from 2010, primarily due to $77 million from stronger production volumes, particularly in China on key Tenneco-supplied GM, Ford, Audi, Volkswagen, FAW and Nissan platforms. Foreign currency also benefited Asian revenue by $29 million. Excluding $20 million in favorable foreign currency, lower OE production volumes in Australia drove a $10 million negative impact on revenue for 2011 over 2010.20122015 and 2011 Year Ended
December 31, Change 2012 2011 (Millions) $ 288 $ 216 $ 72 71 125 (54 ) 69 38 31 $ 428 $ 379 $ 49 Year Ended December 31, Change 2015 2014 (Millions) Clean Air Division North America $ 244 $ 237 $ 7 Europe, South America & India 52 59 (7 ) Asia Pacific 121 101 20 Total Clean Air Division 417 397 20 Ride Performance Division North America 155 143 12 Europe, South America & India (5 ) 40 (45 ) Asia Pacific 39 36 3 Total Ride Performance Division 189 219 (30 ) Other (87 ) (124 ) 37 Total Tenneco Inc. $ 519 $ 492 $ 27 Year Ended
December 31, 2012 2011 (Millions) $ 1 $ 2 (5 ) — 12 3 7 — — 3 — 11 Year Ended December 31, 2015 2014 (Millions) Clean Air Division North America Restructuring and related expenses $ — $ 1 Europe, South America & India Restructuring and related expenses 6 10 Bad debt charge (1) — 4 Asia Pacific Restructuring and related expenses 4 6 Total Clean Air Division $ 10 $ 21 Ride Performance Division North America Restructuring and related expenses $ 2 $ 5 Pension/Postretirement charges (2) — 1 Europe, South America & India Restructuring and related expenses 49 22 Asia Pacific Restructuring and related expenses 2 1 Total Ride Performance Division $ 53 $ 29 Other Restructuring and related expenses $ — $ 4 Pension/Postretirement charges (2) 4 31 Total Other $ 4 $ 35 (1) Benefit from property recoveriesCharge related to transactions originated by The Pullman Company before being acquired by Tennecothe bankruptcy of an aftermarket customer in 1996.Europe.(2) Non-cash asset impairment chargeCharges related to certain assetspension derisking and the correction of our European ride control business.postretirement census data.(3)Non-cash asset impairment charge related to goodwill for Tenneco’s Australian reporting unit.from North American operations increased to $288for the Clean Air division was $417 million in 2012, from $2162015 compared to $397 million one year ago.in 2014. EBIT for North America increased $7 million to $244 million in 2015 versus 2014. The benefits to EBITbenefit from higher OE production volumes, the related manufacturing efficiencies, incremental commerciallight vehicle revenue, materialand aftermarket sales and operational cost management a benefit of $5 million from property recoveries related to transactions originated by The Pullman Company before being acquired by Tenneco in 1996, decreased depreciation and amortization expense, increased aftermarket revenues, and positive currency of $1 million werewas partially offset by lower volumes in commercial truck and off-highway vehicle, unfavorable mix and negative currency. Europe, South America and India's EBIT was $52 million in 2015 compared to $59 million in 2014.aftermarket mix changecurrency. EBIT for Asia Pacific increased $20 million to $121 million in 2015 from $101 million in 2014. EBIT benefited from higher light vehicle volumes in China, new platforms in China and increased manufacturingJapan, strong operational cost management, lower restructuring and distribution costs. Restructuringrelated expenses and year-over-year savings from prior restructuring activities, partially offset by lower commercial truck revenue in China. For the Clean Air division, restructuring and related expenses of $1$10 million were included in EBIT for 2015 and $2$17 million in 2014. EBIT for Clean Air division also benefited from the timing of a customer recovery in China of $5 million in 2015. EBIT for Clean Air division included a charge of $4 million related to the bankruptcy of an aftermarket customer in Europe in 2014. Currency had a $22 million unfavorable impact on EBIT of the Clean Air division in 2015 when compared to last year.20122015 and 2011, respectively.Our European, South American and Indian segment’s$28 million in 2014. EBIT was $71for the Ride Performance division included a charge of $1 million for 2012 comparedrelated to $125 million during the same period last year.postretirement medical true-up in 2014. Currency had a $24$42 million unfavorable impact on EBIT of the Ride Performance division for 20122015 when compared to last year. The decrease in EBIT was driven by unfavorable pricing, mainly contractual price reductions and increased manufacturing expense. In addition, lower volumes in our European OE ride control business,for the Company’s decision to relinquishRide Performance division also included a platform due to pricing and profitability in South America, lower Europe aftermarket emission control sales, as well as unfavorable aftermarket ride control product mix driven by higher unit sales in eastern Europe, where the premium mix is lower than western Europe where unit sales decreased, contributed to the year-over-year decrease. Stronger European OE emission control volumes, higher revenues in India, new platform launches, material cost management activities and higher engineering recoveries, partially offset the decrease. Restructuring and related expenses of $12 million were recorded in 2012 compared to $3 million in 2011. We also incurred an asset impairment charge of $7 million expense to adjust workers' compensation reserves in 2012 related to certain assets of our European ride control business.EBIT for our Asia Pacific segment in 2012 was $69 million compared to $38 million in 2011. Higher volumes, mostly in China on current and new platforms, the related manufacturing efficiencies, decreased material costs net of recoveries and restructuring savings from last year’s restructuring activities drove EBIT improvement, but was partially offset by unfavorable pricing and increased selling, general, administrative, and engineering costs to support new plants and new customers in Asia. Restructuring and related expenses of $3 million and a goodwill impairment charge of $11 million were included in EBIT for 2011.$23$64 million unfavorable impact on overall company EBIT for 2012in 2015 as compared to the prior year.20112014 and 2010 Year Ended
December 31, Change 2011 2010 (Millions) $ 216 $ 155 $ 61 125 76 49 38 50 (12 ) $ 379 $ 281 $ 98 Year Ended December 31, Change 2014 2013 (Millions) Clean Air Division North America $ 237 $ 229 $ 8 Europe, South America & India 59 57 2 Asia Pacific 101 84 17 Total Clean Air Division 397 370 27 Ride Performance Division North America 143 124 19 Europe, South America & India 40 (7 ) 47 Asia Pacific 36 22 14 Total Ride Performance Division 219 139 80 Other (124 ) (85 ) (39 ) Total Tenneco Inc. $ 492 $ 424 $ 68 Year Ended
December 31, 2011 2010 (Millions) $ 2 $ 14 — 6 3 3 3 2 11 — Year Ended December 31, 2014 2013 (Millions) Clean Air Division North America Restructuring and related expenses $ 1 $ — Europe, South America & India Restructuring and related expenses 10 8 Bad debt charge (1) 4 — Asia Pacific Restructuring and related expenses 6 3 Total Clean Air Division $ 21 $ 11 Ride Performance Division North America Restructuring and related expenses $ 5 $ 1 Pension/Postretirement charges (2) 1 — Europe, South America & India Restructuring and related expenses 22 62 Asia Pacific Restructuring and related expenses 1 2 Total Ride Performance Division $ 29 $ 65 Other Restructuring and related expenses $ 4 $ 2 Pension/Postretirement charges (2) 31 — Total Other $ 35 $ 2 (1) Represents chargesCharge related to the bankruptcy of an actuarial loss for lump-sum pension paymentsaftermarket customer in a non-qualified pension plan in which one current and three former employees were participants. Lump-sum pension payments are required when participants retire or when they turn 55. Two former employees turned 55 in 2010.Europe.(2) Non-cash asset impairment chargeCharges related to goodwill for Tenneco’s Australian reporting unit.pension derisking and the correction of postretirement census data.from North American operations increased to $216for the Clean Air division was $397 million in 2011, from $1552014 compared to $370 million in 2010. The benefits2013. EBIT for North America increased $8 million to $237 million in 2014 versus $229 million in 2013. EBIT benefited from significantly higher OE production volumes, the related manufacturing efficiencies, decreased depreciationlight vehicle and amortization expense, lower deferred and long-term compensation expense indexed to the Company’s stock price and improved aftermarket revenues, werea ramp up on new platforms and positive currency, partially offset by increased material spending, increased manufacturinghigher engineering investments. Europe, South America and distribution costs, and higher selling, general, administrative and engineering costs, which included an increase to aftermarket changeover costs related to new aftermarket business. Restructuring and related expenses of $2 million were included in 2011 compared to $14 million of restructuring and related expenses and charges of $6 million for an actuarial loss from lump-sum pension payments in 2010. TheIndia's EBIT increased manufacturing costs included higher costs, particularly in the third and fourth quarters of 2011, related to our North American OE ride control business as we incur some temporarily higher costs while consolidating two North American manufacturing locations. Additionally, in the fourth quarter of 2011, we encountered an issue involving struts supplied on one particular OE platform. As a result, we directly incurred approximately $2 million in premium freight and overtime costs2014 to $59 million from $57 million in 2011.Our European, South American and Indian segment’s EBIT was $125 million for 2011 compared to $76 million for 2010.2013. The increase was driven by higher OE revenue, new platforms in Europe and year-over-year savings from prior restructuring activities, partially offset by higher year-over-year restructuring and related expenses, a charge related to the bankruptcy of an European aftermarket customer in 2014 and negative currency. EBIT for Asia Pacific increased $17 million to $101 million in 2014 from $84 million in 2013. EBIT benefited from higher light vehicle production volumes, material cost management activitiesnew platforms and lower deferredhigher commercial truck and long-term compensation expense indexed to the Company’s stock price. Unfavorable pricing, mainly contractual price reductionsoff-highway vehicle revenues in China and increased manufacturingJapan, and selling, general, administrative and engineering costs,restructuring savings in particular inflationary wage costs in South America,Australia, partially offset by lower volumes in Australia and Thailand, higher engineering expenses and higher restructuring and related expenses. For the increase. RestructuringClean Air division, EBIT included restructuring and related expenses of $3$17 million was included in 2014 and $11 million in 2013. EBIT for both 2011the Clean Air division included a charge of $4 million related to the bankruptcy of an aftermarket customer in Europe in 2014. Currency had a $2 million unfavorable impact on EBIT of the Clean Air division for 2014 when compared to 2013.2010.commercial truck volumes and positive aftermarket product mix were partially offset by higher restructuring and related expenses and unfavorable currency. Europe, South America and India's EBIT was $40 million in 2014, compared to a loss of $7 million in 2013. The increase was driven by lower year-over-year restructuring and related expenses, increased light vehicle and commercial truck volumes in Europe, higher aftermarket revenues in South America and India and year-over-year savings from prior restructuring activities, partially offset by lower light vehicle sales in South America and negative currency. EBIT from Asia Pacific increased $14 million in 2014 to $36 million from 2013. EBIT benefited from higher light vehicle production volumes in China, savings from prior restructuring activities in Australia and positive currency, partially offset by lower volumes in Australia. For the Ride Performance division, EBIT included restructuring and related expenses of $28 million in$11$8 million favorableunfavorable impact on EBIT of the Ride Performance division for 20112014 when compared to 2010.our Asia Pacific segmentthe Ride Performance division also included a $7 million expense to adjust workers' compensation reserves in 2011 was $38 million compared to $50 million in 2010. Higher volumes and the related manufacturing efficiencies in China and lower deferred and long-term compensation expense indexed to the Company’s stock price drove EBIT improvement, but was more than offset by a goodwill impairment charge and volume declines in Australia, unfavorable pricing and increased selling, general, administrative, and engineering costs to support new plants in China. In addition, lower OE production volumes in Thailand due to the flooding negatively impacted EBIT. 2014.$3$10 million favorable impact on EBIT for 2011 when compared to 2010.Currency had a $14 million favorableunfavorable impact on overall company EBIT for 2011in 2014 as compared to 2010.2012, 20112015, 2014 and 2010 Year Ended
December 31, 2012 2011 2010 8 % 6 % 6 % 3 % 4 % 3 % 8 % 5 % 7 % 6 % 5 % 5 % Year Ended December 31, 2015 2014 2013 Clean Air Division North America 9% 8% 9% Europe, South America & India 3% 3% 3% Asia Pacific 12% 10% 10% Total Clean Air Division 7% 7% 7% Ride Performance Division North America 12% 11% 10% Europe, South America & India (1)% 4% (1)% Asia Pacific 17% 16% 10% Total Ride Performance Division 8% 8% 6% Total Tenneco Inc. 6% 6% 5% revenuerevenues in 2015 was up one percentage point compared to last year. The benefit from higher light vehicle and aftermarket sales and operational cost management was partially offset by lower volumes in commercial truck and off-highway vehicle, unfavorable mix and negative currency. Europe, South America and India's EBIT as a percentage of revenues in 2015 was even compared to the prior year. The benefit from higher light vehicle volumes, higher commercial truck, off-highway and other vehicle volumes and new platforms in Europe, lower restructuring and related expenses, year-over-year restructuring savings and a charge related to the bankruptcy of an European aftermarket customer in prior year was offset by lower volumes in South America, lower aftermarket volumes in Europe, unfavorable mix, higher SG&A and engineering expenses and negative currency. EBIT as a percentage of revenues for 2012Asia Pacific in 2015 was up two percentage points whencompared to 2014. The benefit from higher light vehicle volumes in China, new platforms in China and Japan, strong operational cost management, lower restructuring and related expenses, year-over-year savings from prior restructuring activities and the timing of a customer recovery in China was partially offset by lower commercial truck revenue in China.increase in EBIT from higher OE production volumes and the related manufacturing efficiencies, a benefit from property recoveries related to transactions originated by the Pullman Company before being acquired by Tenneco in 1996, higherincreased aftermarket sales, incremental commercial vehicle revenues,volumes, lower depreciation and amortization expense, decreased restructuring and related charges, favorable currencyexpenses and materialimproved operational cost management activities was partially offset by lower light vehicle volumes, lower commercial truck, off-highway and other vehicle volumes and negative currency. EBIT as a percentage of revenue by increased manufacturing and distribution costs. Inrevenues in Europe, South America and India EBIT margin for 2012 was down onefive percentage pointpoints compared withto the prior year. LowerThe benefit from higher light vehicle and aftermarket volumes in the related manufacturing inefficiencies, increasedregion, higher commercial truck, off-highway and other vehicle volumes and new platforms in Europe and savings from prior restructuring activities was more than offset by higher restructuring and related charges, an asset impairment charge, negative currency and unfavorable pricing were partially offset as a percentage of revenue by material cost management actions, and decreased selling, general, administrativeexpenses, higher SG&A and engineering expenses.expenses, unfavorable mix and negative currency. In Asia Pacific, EBIT as a percentage of revenue for our Asia Pacific segment increased threerevenues in 2015 was up one percentage points in 2012 versuspoint from the prior year asyear. The benefit from higher light vehicle volumes and the related manufacturing efficiencies in China materialand operational cost management and restructuring savings werewas partially offset by increased selling, general, administrative, and engineering expenseslower volumes in Australia and unfavorable pricing.2011Asia Pacific in 2014 was even when compared to 2010.2013. The increase in EBITbenefit from higher OElight vehicle production volumes, new platforms and the related manufacturing efficiencies, higher aftermarket sales,commercial truck and off-highway vehicle revenues in China and Japan and restructuring savings in Australia was offset by lower depreciationvolumes in Australia and amortization expense, lower deferredThailand, higher engineering expenses and long-term compensation expense indexed to the Company’s stock price and decreasedhigher restructuring and related charges was offsetexpenses.revenuerevenues in 2014 was up two percentage points compared to the 2013. In 2014, EBIT as a percentage of revenues for North America was up one percentage point compared to 2013. The benefits of increased light vehicle and commercial truck volumes and positive aftermarket product mix were partially offset by increased material spendinghigher restructuring and manufacturingrelated expenses and distribution costs and higher selling, general, administrative and engineering expenses, including higher aftermarket changeover costs. Inunfavorable currency. EBIT as a percentage of revenues in Europe, South America and India EBIT margin for 2011 was up onefive percentage point from 2010. Improvedpoints in 2014 when compared to 2013. The increase was driven by lower year-over-year restructuring and related expenses, increased light vehicle and commercial truck volumes lower deferred and long-term compensation expense indexed to the Company’s stock price, currency benefits and material cost management actions, were almost offset as a percentage of revenue by unfavorable pricing and increased manufacturing and selling, general, administrative and engineering expenses, in particular inflationary wage costsEurope, higher aftermarket revenues in South America.America and India and year-over-year savings from prior restructuring activities, partially offset by lower light vehicle sales in South America and negative currency. In Asia Pacific, EBIT as a percentage of revenue for our Asia Pacific segment decreased tworevenues in 2014 was up six percentage points in 2011 versus 2010 asfrom 2013. EBIT benefited from higher light vehicle production volumes and the related manufacturing efficiencies in China, and lower deferred and long-term compensation expense indexed to the Company’s stock price, were more than offset by unfavorable pricing, a goodwill impairment charge, production declinessavings from prior restructuring activities in Australia and increased selling, general, administrative, and engineering expenses to support new plants in China. In addition,positive currency, partially offset by lower OE production volumes in Thailand due to the flooding negatively impacted EBIT as a percentage of revenue.20122015 of $105$67 million ($102 million(substantially all in our U.S. operations and $3 million in our foreign operations) net of interest capitalized of $4$6 million, down from $108and $91 million ($105 million(substantially all in our U.S. operations and $3operations) net of interest capitalized of $5 million in 2014. Included in 2014 was $13 million of expense related to our foreignrefinancing activities. The decrease was due to lower interest rates from the refinancing completed in December 2014 where we extended maturities, increased the size of our senior secured credit facility and reduced the rates on the credit facility and refinanced the senior unsecured notes with new maturity dates bearing lower interest rates.2011.2013. Included in 20122014 was $18 million of expense related to our refinancing activities. Included in 2011 was $1$13 million of expense related to our refinancing activities. Excluding the refinancing expenses, interest expense decreased by $2 million in 20122014 compared to the prior year as a result of lower rates due to the debt refinancing transactions from the first quarter of 2012.We reported interest expense in 2011 of $108 million ($105 million in our U.S. operations and $3 million in our foreign operations) net of interest capitalized of $4 million, down from $149 million ($146 million in our U.S. operations and $3 million in our foreign operations) net of interest capitalized of $4 million in 2010. Included in 2011 was $1 million of expense related to our refinancing activities. Included in 2010 was $27 million of expense related to our refinancing activities and $4 million of expense related to an accounting change impacting our factored receivables. See “Liquidity and Capital Resources” below for further discussion on the accounting change. Excluding the refinancing expenses, interest expense decreased in 2011 compared to 2010 as a result of lower rates due to debt refinancing transactions in 2010.2012,2015, we had $734$758 million in long-term debt obligations that have fixed interest rates. Of that amount, $500 million is fixed through December 2020, $225 million is fixed through August 2018December 2024 and the remainder is fixed from 20132015 through 2025. We also have $333$382 million in long-term debt obligations that are subject to variable interest rates. For more detailed explanations on our debt structure and senior credit facility refer to “Liquidity and Capital Resources — Capitalization” later in this Management’s Discussion and Analysis.$19$149 million for 2012.in 2015. The tax expense recorded in 2012 differs from a statutory rate of 35 percent due primarily to the impact of the U.S. 2012 valuation allowance release and income generated in lower tax rate jurisdictions, partially offset by the impact of recording a valuation allowance against the tax benefit for tax credits and losses in certain foreign jurisdictions. Income tax expense was $88 million for 2011. The tax expense recorded for 2011 differs from a statutory rate of 35 percent due to2015 included a net tax benefit of $7$15 million primarily relatedrelating to prior year U.S. taxableresearch and development tax credits, changes to uncertain tax positions, and prior year income with no associatedtax adjustments. We reported an income tax expense due to our net operating loss carryforward and income generated in lower tax rate jurisdictions, partially offset by the impact of recording a valuation allowance against the tax benefit for losses in certain foreign jurisdictions and taxes on repatriation of foreign earnings. Income tax expense was $69$131 million for 2010.2014. The tax expense recorded in 2014 includes a net tax benefit of $11 million for 2010 differs fromprior year tax adjustments primarily relating to changes to uncertain tax positions and prior year income tax estimates. We reported an income tax expense of $122 million for 2013. The tax expense recorded in 2013 includes a statutory ratenet tax benefit of 35 percent due to$25 million for tax charges of $23 millionadjustments primarily related to the impact of recordingrecognizing a valuation allowance against theU.S. tax benefit for lossesforeign taxes and changes to prior year estimates including changes to uncertain tax positions. The U.S. tax benefit for foreign taxes is driven by our ability to claim a U.S. foreign tax credit beginning in 2013. The U.S. foreign tax credit regime provides for a credit against U.S. taxes otherwise payable for foreign taxes paid with regard to dividends, interest and royalties paid to us in the U.S. and certain foreign jurisdictions and chargesadjustments to prior yearthe expiration of foreign statute of limitations and the conclusion of income taxes and tax contingencies, partially offset by income generated in lower tax rate jurisdictions.We evaluate our deferred income taxes quarterly to determine if valuation allowances are required or shouldexaminations may be adjusted. U.S. GAAP requires that companies assess whether valuation allowances should be established against their deferred tax assets based on consideration of all available evidence, both positive and negative, using a “more likely than not” standard. This assessment considers, among other matters,recognized within the nature, frequency and amount of recent losses, the duration of statutory carryforward periods, and tax planning strategies. In making such judgments, significant weight is given to evidence that can be objectively verified.In 2008, given our historical losses in the U.S., we concluded that our ability to fully utilize ournext twelve months. and state net operating loss carryforward (“NOL”("NOL") was limited. As a result, we recorded a valuation allowance against all of our U.S. deferred tax assets except for our tax planning strategies which had not yet been implemented and which did not depend upon generating future taxable income. Prior to the reversal of the valuation allowance in the third quarter of 2012, we carried a deferred tax asset in the U.S. of $90 million relating to the expected utilization of the federal and state NOL. The recording of a valuation allowance did not impact the amount of the NOL that would be available for federal and state income tax purposes in future periods.In 2012, we reversed the tax valuation allowance against our net deferred tax assets in the U.S. based on operating improvements we had made, the outlook for light and commercial vehicle production in the U.S. and the positive impact this should have on our U.S. operations. The net income impact of the tax valuation allowance release in the U.S. was a tax benefit of approximately $81 million. We now have a federal NOL at December 31, 20122013 totaled $37 million. We had fully utilized our NOL as of $190 million, which expires beginning in tax years ending in 2022 through 2030.June 30, 2014. The state NOLs expire in various tax years through 2032.Valuation allowances have been established in certain foreign jurisdictions for deferred tax assets based on a “more likely than not” threshold. The ability to realize deferred tax assets depends on our ability to generate sufficient taxable income within the carryforward periods provided for in the tax law for each tax jurisdiction. We have considered the following possible sources of taxable income when assessing the realization of our deferred tax assets:Future reversals of existing taxable temporary differences;Taxable income or loss, based on recent results, exclusive of reversing temporary differences and carryforwards;Tax-planning strategies; andTaxable income in prior carryback years if carryback is permitted under the relevant tax law.In 2012, after considering all available evidence and all possible sources of taxable income, we recorded a $19 million tax valuation allowance in Spain for tax credits that may not be utilized due to tax losses in Spain.The valuation allowances recorded against deferred tax assets generated by taxable losses in Spain and certain other foreign jurisdictions will impact our provision for income taxes until the valuation allowances are released. Our provision for income taxes will include no tax benefit for losses incurred and no tax expense with respect to income generated in these jurisdictions until the respective valuation allowance is eliminated.2010,2013, we incurred $19 million in restructuring and related costs, of which $14 million was recorded in cost of sales and $5 million was recorded in depreciation and amortization expense. In 2011, we incurred $8$78 million in restructuring and related costs, primarily related to headcount reductions in Europe and Australia and the closure of our ride control plant in Cozad, Nebraska, all of which was recorded inEuropean cost of sales. In 2012, we incurred $13 million in restructuring and related costs, primarily related to headcount reductions in South America andreduction efforts, including non-cash asset write downs of $4$3 million, the costs to exit the distribution of aftermarket exhaust products and ending production of leaf springs in Europe,Australia, headcount reductions in various regions, and the net impact of freezing our defined benefit plans in the United Kingdom, of which $10$70 million was recorded in cost of sales, $6 million in SG&A, $1 million in engineering expense and $3$1 million in other expense. In 2014, we incurred $49 million in restructuring and related costs including non-cash charges of $5 million, primarily related to European cost reduction efforts, headcount reductions in Australia and South America, the sale of a closed facility in Cozad, Nebraska and costs related to organizational changes, of which $28 million was recorded in cost of sales, $9 million in SG&A. December 31,
2011
Restructuring
Reserve 2012
Expenses 2012
Cash
Payments December 31,
2012
Restructuring
Reserve (millions) $ 1 9 (10 ) $ — Impact of Exchange Rates (Millions) Employee Severance, Termination Benefits and Other Related Costs $ 40 53 (59 ) (4 ) $ 30 extendedrestated senior credit agreement that took effect on March 22, 2012,December 8, 2014, we are allowed to exclude $80up to $150 million in the aggregate of cash chargesall costs, expenses, fees, fines, penalties, judgments, legal settlements and expenses, before taxes,other amounts associated with any restructuring, litigation, claim, proceeding or investigation related to cost reduction initiativesor undertaken by us or any of our subsidiaries, together with any related provision for taxes, incurred after March 22, 2012 fromDecember 8, 2014 in the calculation of the financial covenant ratios required under our senior credit facility. As of December 31, 2012,2015, we havehad excluded $13$53 million in cumulativeof allowable charges relating to restructuring initiatives against the $80$150 million available under the terms of the senior credit facility.On September 22, 2009, we announced that we were closing our original equipment ride control plant in Cozad, Nebraska. The closure of the Cozad plant eliminated approximately 500 positions. We hired at other facilities as we moved production from Cozad to those facilities, which resulted in a net decrease of approximately 60 positions. Much of the production was shifted from Cozad to our plant in Hartwell, Georgia.During the transition of production from our Cozad facility to our Hartwell facility, several customer programs, which were planned to phase out, were reinstated and volumes increased beyond the amount in our original restructuring plan. To meet the higher volume requirements, we took a number of actions to stabilize the production environment in Hartwell including reinforcing several core processes, realigning assembly lines, upgrading equipment to increase output and accelerating our Lean manufacturing activities. Based on the higher volumes, we have adjusted our consolidation plan which included temporarily continuing some basic production operations in Cozad, and redirecting some programs from our Hartwell facility to our other North American facilities to better balance production. In August 2012, we completed the closure of our Cozad facility and transitioned all remaining production to other North American facilities. Annualized cost savings as a result of these actions total $8 million. During 2009 and 2010, we recorded $11 million and $10 million, respectively, of restructuring and related expenses related to this initiative, of which approximately $16 million represented cash expenditures. In 2011, we recorded an additional cash charge of $2 million related to this initiative.On September 13, 2012, we announced our intention to close our aftermarket emission control plant in Vittaryd, Sweden. We expect to complete the closure in the third quarter of 2013. We expect a smooth transition of production from the Vittaryd plant to other Tenneco emission control operations in Laval, France; Edenkoben, Germany; Valencia, Spain, and Rybnik, Poland, which began in late 2012. We expect to take restructuring and related charges in the range of $10 million to $14 million. These charges include non-cash asset impairments, the cost of relocating tooling, equipment and production to other facilities, severance and retention payments to employees, and other costs related to the closure. In 2012, we recorded non-cash charges of $4 million related to this initiative. We expect to record the remainder of the charges over the first three quarters of 2013.On January 31, 2013, we announced our plan to reduce structural costs in Europe by approximately $60 million annually, and anticipate related costs of approximately $120 million, including the cost reductions and charges related to the closing of the Vittaryd facility and a $7 million charge recorded in the fourth quarter of 2012 to impair certain assets in the European ride control business. We expect that most of the remaining expense will be recorded in late 2013 and 2014, and that the company will reach a full savings run rate in 2016. Any plans affecting our European hourly and salaried workforce would be subject to union consultation. (Loss) Per Share$275$247 million or $4.50$4.11 per diluted common share for 2012.2015. Included in the results for 20122015 were negative impacts from expenses related to our restructuring activities an asset impairment charge and costscharges related to our refinancing activities,pension derisking, which were more thanpartially offset by the benefit from The Pullman Company property recoveries and net tax benefits which included the net impact of approximately $81 million or $1.33 per diluted common share related to the reversal of the tax valuation allowance on the Company’s U.S. net operating loss position in the third quarter.benefits. The nettotal impact of these items increaseddecreased earnings per diluted common share by $1.18.$0.76. We reported net income attributable to Tenneco Inc. of $157$226 million or $2.55$3.66 per diluted common share for 2011.2014. Included in the results for 20112014 were negative impacts from expenses related to our restructuring activities, a goodwill impairmentbad debt charge, costs related to our refinancing activities and charges related to pension derisking and postretirement medical true-up, which were partially offset by net tax adjustments.benefits. The net impact of these items decreased earnings per diluted share by $0.11.$0.99. We reported net income attributable to Tenneco Inc. of $39$183 million or $0.63$2.97 per diluted common share for 2010.2013. Included in the results for 20102013 were negative impacts from expenses related to our restructuring activities, pension charges, costs related to our refinancing activities andwhich were partially offset by net tax adjustments.benefits. The net impact of these items decreased earnings per diluted share by $0.94.On January 10, 2001, our Board of Directors eliminated the quarterly dividend on our common stock. There are no current plans to reinstate20122015 and 2011 Year Ended
December 31, 2012 2011 (Millions) $ 365 $ 245 (273 ) (224 ) (89 ) (26 ) 2015 2014 (Millions) Cash provided (used) by: Operating activities $ 517 $ 341 Investing activities (303 ) (339 ) Financing activities (172 ) 20 2012,2015, operating activities provided $365$517 million in cash compared to $245$341 million in cash provided during last year. The higher cash from operations was primarily driven by higher earnings, working capital improvements, lower interest payments and lower tax payments. For 2012,2015, cash used for working capital was $76$9 million versus $130$137 million of cash used for working capital in 2011.2014. Receivables were a use of cash of $9$90 million in 2012for 2015 compared to a cash use of $183cash of $83 million in the prior year. Inventory represented a cash outflow of $72$36 million during 2012, compared tofor 2015 and a cash outflow of $64$74 million for the prior year.during 2014. Accounts payable provided cash$90 million of $12 millioncash for the year ended December 31, 2012,2015, compared to $94 million of cash provided of $144 million for the year ended December 31, 2011.2014. Cash taxes were $80$105 million for 20122015, net of a US tax refund of $25 million for overpayment in 2014, compared to $85$136 million in the prior year.$49$36 million higherlower in 20122015 compared to the same period a year ago.2014. Cash payments for plant, property and equipment were $256$286 million in 20122015 versus payments of $213$328 million in 2011, an increase2014, a decrease of $43$42 million. The majority of the spending went to our Europe and North America OE businesses to support new light and commercial vehicle program launches, and in China to accommodate new programs and new customers. Cash of $7 million was used to acquire certain rights from Combustion Components Associates, Inc. primarily pertaining to emission control technology for stationary reciprocating engine applications. Cash payments for software-related intangible assets were $23 million in 2015 compared to $13 million in 2012 compared to $152014. Change in restricted cash was a source of cash of $2 million in 2011.$89$172 million for the year endingended December 31, 20122015 compared to an outflowinflow of $26$20 million for the year endingended December 31, 2011.2014. During 2012,2015, we completed a previously announced stock buyback plan, repurchasing 600,000repurchased 4,228,633 shares of our outstanding common stock for $18$213 million at an average price of $29.22$50.32 per share. In 2011,share as part of the previously announced stock buyback plan of up to $350 million. Taking into account our operating performance, we now anticipate completing this initial share repurchase program by the end of 2016. Additionally, on October 23, 2015, we announced that our Board of Directors has expanded our repurchase program, authorizing the repurchase of an additional $200 million of common stock which we anticipate completing by the end of 2017. During 2014, we completed a previously announced stock buyback plan, repurchasing 400,000 shares of our outstanding common stock for $16$22 million, at an average price of $39.84$56.06 per share.2012,2014, refinancing activities included retiring certain of our 8 1/8 percent senior notes due in 2015 and the $148 million Tranche B Term Facility, addingraising a new $250senior secured credit facility consisting of a 5-year revolving credit facility and a 5-year Tranche A Term Facility. Proceeds from the new credit facility were used to refinance our existing senior secured credit facility, which included an $850 million revolving credit facility due 2017 and a $213 million Tranche A Term Facility and increasingdue 2017. In conjunction with this transaction, we also raised $225 million of new 10-year senior unsecured notes priced at 5 3/8 percent to refinance the amount and extending the maturity date ofexisting 7 3/4 percent notes due 2018.facility. We also paidfacility were $105 million at December 31, 2015 and no borrowings at December 31, 2014. There was $30 million borrowed under the North American accounts receivable securitization programs at December 31, 2015 and no borrowings at December 31, 2014. In 2014, we received $4 million for selling a 45 percent equity interest in Tenneco Fusheng (Chengdu) Automobile Parts Co., Ltd. to securea third party partner. 2014 2013 (Millions) Cash provided (used) by: Operating activities $ 341 $ 503 Investing activities (339 ) (266 ) Financing activities 20 (175 ) 2520 percent equity interest in Tenneco Tongtai (Dalian) Exhaust System Co. Ltd. ("TTEC"), our emission control joint venture in Thailand,Dalian, China, and an additional $9 million to the partner in lieu of receiving its pro-rata share of dividends owed from the joint venture. As a result of this purchase, TTEC is now wholly-owned, during 2011.a wholly owned indirect subsidiary of Tenneco. In 2014, refinancing activities included raising a new senior secured credit facility consisting of a 5-year revolving credit facility and a 5-year Tranche A Term Facility. Proceeds from the new credit facility were used to refinance our existing senior secured credit facility, which included an $850 million revolving credit facility due 2017 and a $213 million Tranche A Term Facility due 2017. In conjunction with this transaction, we also raised $225 million of new 10-year senior unsecured notes priced at 5 3/8 percent to refinance the existing 7 3/4 percent notes due 2018. We ended 2012 and 2011 with $92 million and $24 million, respectively, inhad no borrowings under our revolving credit facility.facility at December 31, 2014 versus $58 million borrowed at December 31, 2013. At December 31, 2011,2014, there werewas no borrowings outstandingborrowing under the North American accounts receivable securitization programs, whereas at December 31, 2012,2013, there was $50$10 million outstanding.Cash Flows In 2014, we received $4 million for 2011selling a 45 percent equity interest in Tenneco Fusheng (Chengdu) Automobile Parts Co., Ltd. to a third party partner.2010 Year Ended
December 31, 2011 2010 (Millions) $ 245 $ 244 (224 ) (157 ) (26 ) (30 ) Operating Activities2011, operating activities provided $245 millionthe full year 2016, we expect total revenue to grow five percent over 2015, excluding the impact of currency, driven by:cash compared2016;$244 million in cash provided during 2010. For 2011, cash usedcomply with BS IV regulations.working capital was $130 million versus $71 million2016 assumes aggregate industry production growth of cash used for working capital in 2010. The demand for working capital to support higher revenue primarily drove thethree percent including a three percent increase in 2011 versus 2010. Receivables wereglobal light vehicle production, and an one percent decline in commercial truck and off-highway equipment production.use of cash of $183 million in 2011 compared to a cash use of $231 million in 2010. Inventory represented a cash outflow of $64 million during 2011, compared to a cash outflow of $122 million for 2010. Accounts payable provided cash of $144 million for the year ended December 31, 2011, compared to cash provided of $238 million for the year ended December 31, 2010. Cash taxes were $85 million for 2011 compared to $53 million in 2010.Investing ActivitiesCash used for investing activities was $67 million higher in 2011 compared to 2010. Cash payments for plant, property and equipment were $213 million in 2011 versus payments of $151 million in 2010, an increase of $62 million. This increase was due to investments for new business launches, technology development and future growth opportunities. Cash payments for software-related intangible assets were $15 million in 2011 compared to $12 million in 2010.Financing ActivitiesCash flow from financing activities was an outflow of $26 million for the year ending December 31, 2011 compared to an outflow of $30 million for the year ending December 31, 2010. In the second quarter of 2011, we announced a planshare repurchase program, authorizing our company to repurchase up to 400,000 shares of our outstanding common stock. During 2011, we purchased all 400,000 shares$350 million of our outstanding common stock for $16 million. We also paid $4 million to secure the remaining 25 percent interest inover a three-year period. Based on our emission control joint venture in Thailand, now wholly-owned, during 2011. We ended 2011 with $24 million in borrowings under our revolving credit facility. At December 31, 2011, there were no borrowings outstanding under the North American accounts receivable securitization programs.OutlookFor 2013, IHS Automotiveoperating performance, current industry production forecasts that global OE light vehicle production will be up three percent in the regions where we operate. Full-year production is estimated to increase year-over-year in North America by three percent, China by nine percent, South America by four percent and India by eight percent, while estimates show a three percent decline in European industry production. In 2013, according to Power Systems Research, class 4-8 on-road commercial vehicle production in Europe and North America is expected to be essentially flat year-over-year, and up 31 percent in South America. We anticipate little industry volume recovery during the year in the commercial vehicle off-road market.Full-year estimates indicate an overall improving production environment in 2013. However, as we previously indicated, macroeconomic uncertainty remains relatively high and while good full-year revenue growth is expected, it will be weighted toward the second half of this year. Additionally, the current effective implementation date for China’s pending commercial vehicle emissions regulation is July 2013; however, there is a great deal of uncertainty regarding the timing of its implementation. Consequently, our revenue estimates reflect a conservative estimate of growth in this market although it remains a very significant opportunity as installation rates increase in the future. With this level of overall uncertainty, we are providing our revenue guidance as a range instead of a specific estimate.In 2013, we estimate total OE revenue to be in the range of $6.4 billion to $6.8 billion including commercial vehicle revenue of $0.9 billion to $1.1 billion. This growth will be driven by our excellent position on light vehicle platforms globally and leveraging higher light vehicle volumes in North America, South America and China. Our commercial vehicle business will have a relatively quiet year in launches with the main launches occurring later in the year in preparation for regulatory changes taking place in 2014. As a result, commercial vehicle revenue in 2013 will be primarily driven by the strength and timing of any industry volume recovery without any significant changes to customers, programs or content.In 2014, we estimate total OE revenues in the range of $7.2 billion to $7.7 billion including commercial vehicle revenue of $1.3 billion to $1.6 billion. The increase will be driven by the anticipated further improvement in macroeconomic conditions globally resulting in stronger lightrequirements for capital expenditures and commercial vehicle volumes. Additionally,working capital to continue funding growth, we expect to benefit from significant incremental commercial vehicle content as U.S. Tier 4 final, Europe Stage 4 off-road and Euro VI on-road emissions regulations take effect.Incomplete it by the end of 2016. Additionally, on October 23, 2015, we estimate total OE revenues inannounced that our Board of Directors has expanded our share repurchase program, authorizing the rangerepurchase of $8.3 billion to $9.0 billion including commercial vehicle revenue comprising about 25 percentan additional $200 million of this revenue. In 2016,common stock which we estimate total OE revenues inanticipate completing by the rangeend of $9.0 billion to $10.0 billion including commercial vehicle revenue comprising about 27 percent of this revenue. In 2017, we estimate total OE revenues in the range of $10.0 billion to $11.0 billion including commercial vehicle revenue comprising about 30 percent of this revenue.2013;2016; original equipment manufacturers’ programs that have been formally awarded to the company;us; programs where the company iswe are highly confident that itwe will be awarded business based on informal customer indications consistent with past practices; and our status as supplier for the existing programs and our relationships and experience with our customers; and the actual original equipment revenues achieved by the company for each of the last several years compared to the amount of those revenues that the company estimated it would generate at the beginning of each year.customers. The revenue estimates are also based on anticipated vehicle production levels and pricing, including precious metals pricing and the impact of material cost changes. Finally, for our foreign operations, our revenue estimate assumes fixed foreign currency values relative to the U.S. dollar. These values are used to translate foreign revenues to the U.S. dollar. Although such currency values are subject to fluctuations based on the economic conditions in each of our foreign operations, we do not intend to update the annual revenue estimates shown above due to these fluctuations. Currency is assumed to be constant at $1.27 per Euro throughout our projection. We plan to update our revenue guidance during the first quarter of 2014. See “Cautionary Statement for Purposes of the ‘Safe Harbor’ Provisions of the Private Securities Litigation Reform Act of 1995” and Item 1A, “Risk Factors”.20132016 to be between $260$300 million and $270$330 million, our 20132016 interest expense to be about $80$75 million, and our 2016 cash taxes to be between $90$140 million and $100 million. % Change 2015 2014 (Millions) Short-term debt and maturities classified as current $ 86 $ 60 43 % Long-term debt 1,124 1,055 7 Total debt 1,210 1,115 9 Total redeemable noncontrolling interests 43 35 23 Total noncontrolling interests 42 41 2 Tenneco Inc. shareholders’ equity 433 497 (13 ) Total equity 475 538 (12 ) Total capitalization $ 1,728 $ 1,688 2 % Capitalization Year Ended
December 31, % Change 2012 2011 (Millions) $ 113 $ 66 71 % 1,067 1,158 (8 ) 1,180 1,224 (4 ) 15 12 25 45 43 5 246 — NM 291 43 577 $ 1,486 $ 1,279 16 % General. Short-term debt, which includes maturities classified as current, borrowings by parent company and foreign subsidiaries, and borrowings securitized byunder our North American accounts receivable securitization program, was $113were $86 million and $66$60 million as of December 31, 20122015 and December 31, 2011,2014, respectively. Borrowings under our revolving credit facilities, which are classified as long-term debt, were $92$105 million and $24$58 million at December 31, 20122015 and December 31, 2011,2014, respectively.20122015 year-to-date increasedecrease in totalTenneco Inc. shareholders' equity primarily resulted from net income attributable to Tenneco Inc. of $275a $131 million a $15 million increase in premium on common stock and other capital surplus relating to common stock issued pursuant to benefit plans, and a $6 million increasedecrease caused by the impact of changes in foreign exchange rates on the translation of financial statements of our foreign subsidiaries into U.S. dollars offset in part by an $18and a $213 million increase in treasury stock as a result of open market purchases of common stock under our share repurchasepurchase program, andpartially offset by net income attributable to Tenneco Inc. of $247 million, a $32$22 million increase in accumulatedpremium on common stock and other comprehensive loss duecapital surplus relating to higher unrecognizedcommon stock issued pursuant to benefit plans and a $11 million increase related to pension and postretirement benefit costs.March 22, 2012,December 8, 2014, we completed an amendment and restatement of our senior credit facility by increasing the amountamounts and extending the maturity datedates of our revolving credit facility and adding a newour Tranche A Term Facility. The amended and restated facility replaces our former $556$850 million revolving credit facility $148and $213 million Tranche BA Term Facility and $130 million Tranche B-1 letter of credit/revolving loan facility.Facility. The proceeds from this refinancing transaction were used to repay our $148the $213 million Tranche BA Term Facility, and to fund the fees and expenses associated with the purchase and redemption of our $250$225 million 87 13/84 percent senior notes due in 2015.2018 and for general corporate purposes. As of December 31, 2012,2015, the senior credit facility provides us with a total revolving credit facility size of $850$1,200 million and a $241$285 million Tranche A Term Facility, both of which will mature on March 22, 2017.December 8, 2019. Funds may be borrowed, repaid and re-borrowed under the revolving credit facility without premium or penalty.penalty (subject to any customary LIBOR breakage fees). The revolving credit facility is reflected as debt on our balance sheet only if we borrow money under this facility or if we use the facility to make payments for letters of credit. Outstanding letters of credit reduce our availability to enter intoborrow revolving loans under the facility. We are required to make quarterly principal payments under the Tranche A Term Facility of $3.1$3.75 million from June 30, 2012 through March 31, 2014, $6.3 million beginning June 30, 2014 through March 31, 2015, $9.4 million beginning June 30, 2015 through March 31, 2016, $12.5 million beginning June 30, 2016 through December 31, 2016, $5.625 million beginning March 31, 2017 through December 31, 2017, $7.5 million beginning March 31, 2018 through September 30, 2019 and a final payment of $125$195 million is due on March 22, 2017.December 8, 2019. We have excluded the required payments, within the next twelve months, under the Tranche A Term Facility totaling $15 million from current liabilities as of December 31, 2015, because we have the intent and ability to refinance the obligations on a long-term basis by using our revolving credit facility.March 8, 2012,November 20, 2014, we announced a cash tender offer to purchase our outstanding $250$225 million 87 1 3/84 percent senior notes due in 20152018 and a solicitation of consents to certain proposed amendments to the indenture governing these notes. We received tenders and consents representing $232$181 million aggregate principal amount of the notes and, on March 22, 2012,December 5, 2014, we purchased the tendered notes at a price of 104.44104.35 percent of the principal amount (which includes a consent payment of three percent of the principal amount), plus accrued and unpaid interest, and amended the related indenture. On April 6, 2012,December 22, 2014, we redeemed the remaining outstanding $18$44 million aggregate principal amount of senior notes that were not purchased pursuant to the tender offer at a price of 104.06103.88 percent of the principal amount, plus accrued and unpaid interest. The additional liquidity provided by the new $850$1,200 million revolving credit facility and the new $250$300 million Tranche A Term Facility was used in part to fund the total costfees and expenses of the tender offer and redemption, including all related fees and expenses.redemption.As a result of the refinancing of our senior credit facility and the repurchase of our 8 1/8 percent senior notes due in 2015, we expect to reduce our annual interest expense by approximately $20 million. We recorded $17$13 million of pre-tax charges in March 2012December 2014 related to the refinancing of our senior credit facility, the repurchase and redemption of $232 million aggregate principal amount of our 87 1 3/84 percent senior notes due in 20152018 and the write-off of deferred debt issuance costs relating to these seniorthose notes. We recorded an additional $1 million of pre-tax charges during the second quarter of 2012 relating to the redemption of the remaining $18 million aggregate principal amount of our 8 1/8 percent senior notes which occurred in April 2012. During the first quarter of 2011, we recorded $1 million of pre-tax charges related to our repurchase and redemption of our 8 5/8 percent senior subordinated notes.2012,2015, of the $850$1,200 million available under the revolving credit facility, we had unused borrowing capacity of $710$1,095 million with $92 million$105 in outstanding borrowings and $48 millionzero in outstanding letters of credit. As of December 31, 2012,2015, our outstanding debt also included $241(i) $285 million of a term loan which consisted of a $283 million net carrying amount including a $2 million debt issuance cost related to our Tranche A Term Facility due March 22, 2017,which is subject to quarterly principal payments as described above through December 8, 2019, (ii) $225 million of 7notes which consisted of a $221 million net carrying amount including a $4 million debt issuance cost of 53/48percent senior notes due AugustDecember 15, 2018,2024, (iii) $500 million of notes which consisted of a $494 million net carrying amount including a $6 million debt issuance cost of 67/8 percent senior notes due December 15, 2020, and $122(iv) $107 million of other debt.March 22, 2012,December 8, 2014, our Tranche A Term Facility and revolving credit facility bear interest at an annual rate equal to, at our option, either (i) London Interbank Offered Rate (“LIBOR”) plus a margin of 250175 basis points, or (ii) a rate consisting of the greater of (a) the JPMorgan Chase prime rate plus a margin of 15075 basis points, (b) the Federal Funds rate plus 50 basis points plus a margin of 15075 basis points, and (c) the Eurodollar Rateone month LIBOR plus 100 basis points plus a margin of 15075 basis points. The margin we pay on these borrowings will be increased by a total of 25 basis points above the original margin following each fiscal quarter for which our consolidated net leverage ratio is equal to or greater than 2.25 and less than 3.25, and will be increased by a total of 50 basis points above the original margin following each fiscal quarter for which our consolidated net leverage ratio is equal to or greater than 3.25. In addition, the margin we pay on these borrowings will be reduced by a total of 25 basis points below the original margin following each fiscal quarter for whichif our consolidated net leverage ratio is less than 1.50 or will be increased by a total of 25 basis points above the original margin if our consolidated net leverage ratio is greater than or equal to 2.50.1.25. We also pay a commitment fee equal to 30 basis points that will be reduced to 25 basis points or increased to up to 40 basis points.points depending on consolidated net leverage ratio changes as set forth in the senior credit facility.underin the senior credit facility agreement) at the end of each period indicated. Failure to maintain these ratios will result in a default under our senior credit facility. The financial ratios required under the amended and restated senior credit facility (or the predecessor facility, as applicable) and the actual ratios we achieved for the four quarters of 2012,2015, are as follows: Quarter Ended March 31,
2012 June 30,
2012 September 30,
2012 December 31,
2012 Req. Act. Req. Act. Req. Act. Req. Act. 3.50 2.07 3.50 2.05 3.50 1.96 3.50 1.69 2.55 5.82 2.55 6.40 2.55 7.18 2.55 7.73 Quarter Ended Req. Act. Req. Act. Req. Act. Req. Act. Leverage Ratio (maximum) 3.50 1.32 3.50 1.51 3.50 1.36 3.50 1.41 Interest Coverage Ratio (minimum) 2.75 13.99 2.75 13.07 2.75 12.43 2.75 11.95 financial ratios required under the senior credit facility for each quarter beyond December 31, 2012 includeincludes a maximum leverage ratio covenant of 3.50 and a minimum interest coverage ratio of 2.552.75, in each case through December 31, 2013 and 2.75 thereafter.agreementagreement) or with the net cash proceeds of our common stock);stock, in each case issued within 180 days prior to such repayment; (ii) with the net cash proceeds of the incremental facilities (as defined in the senior credit facility agreement); and certain indebtedness incurred by our foreign subsidiaries; (iii) with the net cash proceeds of the revolving loans (as defined in the senior credit facility agreement); (iv) with the cash generated by our operations; (v) in an amount equal to the net cash proceeds of qualified capital stock (as defined in the senior credit facility agreement) issued by us after March 22, 2012;December 8, 2014; and (vi) in exchange for permitted refinancing indebtedness or in exchange for shares of our common stock; provided that such purchases are capped as follows (with respect to clauses (iii), (iv) and (v) based on a pro forma consolidated leverage ratio after giving effect to such purchase, cancellation or redemption):Pro forma Consolidated Leverage Ratio (Millions) Greater than or equal to 3.0x $ 20 Greater than or equal to 2.5x $ 100 Greater than or equal to 2.0x $ 200 Less than 2.0x no limit 2012,2015, we were in compliance with all the financial covenants and operational restrictions of the senior credit facility. Our senior credit facility does not contain any terms that could accelerate payment of the facility or affect pricing under the facility as a result of a credit rating agency downgrade.2012,2015, our outstanding senior notes also included $225 million of 753/48 percent senior notes due AugustDecember 15, 20182024 which consisted of $221 million net carrying amount including a $4 million debt issuance cost and $500 million of 67/8 percent senior notes due December 15, 2020.2020 which consisted of $494 million net carrying amountat any time(a) on andor after AugustDecember 15, 20142019, in the case of the senior notes due 2018,2024, and (b) on or after December 15, 2015, in the case of the senior notes due 2020. In addition, prior to such dates the notes may also be redeemed at a price generally equal to 100 percent of the principal amount thereof plus a premium based on the present values of the remaining payments due to the note holders. Further, the indentures governing the notes also permit us to redeem up to 35 percent of the senior notes due 2018, with the proceeds of certain equity offerings completed on or before August 15, 2013 and up to 35 percent of the senior notes due 2020,2024, with the proceeds of certain equity offerings completed on or before December 15, 2013.2017. If we sell certain of our assets or experience specified kinds of changes in control, we must offer to repurchase the notes due 20182024 and 2020 at 101 percent of the principal amount thereof plus accrued and unpaid interest.2012,2015, we were in compliance with the covenants and restrictions of these indentures.2012,2015, the North American program was amended and extended to March 22, 2013.April 30, 2017. The first priority facility continues to provide financing of up to $110$130 million and the second priority facility, which is subordinated to the first priority facility, continues to provideprovides up to an additional $40$50 million of financing. Both facilities monetize accounts receivable generated in the U.S. and Canada that meet certain eligibilityamendments to the North American program decreased the margin we pay to our banks. The amount of outstanding third-party investments in our securitized accounts receivable under the North American program was $50$30 million at December 31, 20122015 and zero at December 31, 2011.Europe. The arrangements to securitize receivables in Europe are provided under sevenvarious separate facilities provided by various financial institutions in each of the foreign jurisdictions.facilities. The commitments for these arrangements are generally for one year, but some may be cancelled with notice 90 days prior to renewal. In some instances, the arrangement provides for cancellation by the applicable financial institution at any time upon 15 days, or less, notification. The amount of outstanding third-party investments in our securitized accounts receivable in Europe was $94$174 million and $121$153 million at December 31, 20122015 and December 31, 2011,2014, respectively.$3$2 million in interest expense for theeach years ended 20122015, 2014 and 2011, respectively,2013, relating to our North American securitization program. In addition, we recognized a loss of $4 million $5 million and $3 million for each of the years ended 2012, 20112015, 2014 and 2010,2013, on the sale of trade accounts receivable in our European accounts receivable securitization programs, representing the discount from book values at which these receivables were sold to our banks. The discount rate varies based on funding costs incurred by ourthreetwo percent three percentfor both years ended 2015 and four2014 and three percent for the yearsyear ended 2012, 2011 and 2010, respectively.Negotiable Financial Instruments. One of our European subsidiaries receives payment from one of its OE customers whereby the accounts receivable are satisfied through the early delivery of negotiable financial instruments. We may collect these financial instruments before their maturity date by either selling them at a discount or using them to satisfy accounts receivable that have previously been sold to a European bank. Any of these financial instruments which are not sold are classified as other current assets. The amount of theseSuch financial instruments that was collected before their maturity date and sold at a discount totaled $6 million and $10 million at December 31, 2012 and December 31, 2011, respectively. No negotiable financial instruments were held by our European subsidiary totaled less than $1 million and $1 million as of December 31, 20122015 and December 31, 2011,2014, respectively.OE customers andthrough the receipt of financial instruments on the date the customer payments are due. Several of our Chinese subsidiaries also satisfy vendor payments through the receipt and delivery of negotiable financial instruments.instruments on the date the payments are due. Financial instruments usedissued to satisfy vendor payables and not redeemed totaled $12$15 million and $14$24 million at December 31, 20122015 and2011,2014, respectively, and were classified as notes payable. Financial instruments received from OE customers and not redeemed totaled $8 million and $9$17 million at December 31, 20122015 and December 31, 2011,2014, respectively. We classify financial instruments received from our OE customers as other current assets if issued by a financial institution of our customers or as customer notes and accounts net if issued by our customer. We classified $8 million and $9$17 million in other current assets at December 31, 20122015 and December 31, 2011,2014, respectively. Some of our Chinese subsidiaries that issue their own negotiable financial instruments to pay vendors are required to maintain a cash balance if they exceed certain credit limits with the financial institution that guarantees those financial instruments. A restricted cash balance was not required at those Chinese subsidiaries at December 31, 2012 and December 31, 2011. negotiable financial instruments received by one of our European subsidiaries and some of our Chinese subsidiaries are checksdrafts drawn by our OE customers and guaranteed by their banks that are payable at a future date.date and, in some cases, are negotiable and/or are guaranteed by banks of the customers. The use of these instruments for payment follows local commercial practice. Because negotiablecertain of such financial instruments are financial obligations of our customers and are guaranteed by our customers’ banks, we believe they represent a lower financial risk than the outstanding accounts receivable that they satisfy which are not guaranteed by a bank.20122015 are shown in the following table: Payments due in: 2013 2014 2015 2016 2017 Beyond
2017 Total (Millions) $ — $ — $ — $ — $ 92 $ — $ 92 13 22 34 47 125 — 241 — — — — — 725 725 1 — — — — — 1 — — — — — 1 1 2 1 1 1 1 5 11 110 — — — — — 110 126 23 35 48 218 731 1,181 21 16 11 9 7 11 75 104 97 84 60 52 120 517 92 — — — — — 92 $ 343 $ 136 $ 130 $ 117 $ 277 $ 862 $ 1,865 Payments due in: 2016 2017 2018 2019 2020 Total (Millions) Obligations: Revolver borrowings $ — $ — $ — $ 105 $ — $ — $ 105 Senior term loans 15 23 30 217 — — 285 Senior notes — — — — — 725 725 Other long term debt — — — 15 — — 15 Other subsidiary debt and capital lease obligations — 1 — 1 1 4 7 Short-term debt 85 — — — — — 85 Debt and capital lease obligations 100 24 30 338 1 729 1,222 Operating leases 38 28 18 13 13 15 125 Purchase obligations 117 43 1 — — — 161 Interest payments 56 54 64 64 46 12 296 Capital commitments 89 — — — — — 89 Total payments $ 400 $ 149 $ 113 $ 415 $ 60 $ 756 $ 1,893 75 3/48 percent and 6 7/8 percent, and 8 1/8 percent, respectively. Interest on our variable rate debt is calculated as LIBOR plus the applicable margin in effect at December 31, 20122015 for the Eurodollar termand Term Loan A loan B and Tranche B-1 loans and prime plus the applicable margin in effect on December 31, 20122015 on the prime-based loans. We have assumed that both LIBOR and the prime rate will remain unchanged for the outlying years. See “— Capitalization.”20122015 to complete the projects authorized at December 31, 2012,2015, in which we have made substantial commitments in connection with purchasing plant, property and equipment for our operations. For 2013,2016, we expect our capital expenditures to be between $260$300 million and $270$330 million.not included an estimate of the expenditures necessary after December 31, 2015 to satisfy purchase obligations as part ofrequirements pursuant to certain ordinary course supply agreements that we have entered into. With respect to our contractual obligations as weother supply agreements, they generally do not enter into long-term agreements with our suppliers. In addition, the agreements we currently have do not specify the volumes we are required to purchase. IfIn many cases, if any commitment is provided, in many cases the agreements state only the minimum percentage of our purchase requirements we must buy from the supplier. As a result, these purchase obligations fluctuate from year-to-year and we are not able to quantify the amount of our future obligations.taxes as we are a taxpayer in certain foreign jurisdictions, but generally not in the U.S. Additionally, ittaxes. It is difficult to estimate taxes to be paid as changes in where we generate income can have a significant impact on future tax payments. We have also not included cash requirements for funding pension and postretirement benefit costs. Based upon current estimates, we believe we will be required to make contributions of approximately $68$15 million to those plans in 2013.2016. Pension and postretirement contributions beyond 20132016 will be required but those amounts will vary based upon many factors, including the performance of our pension fund investments during 20132016 and future discount rate changes. For additional information relating to the funding of our pension and other postretirement plans, refer to Note 10 of our consolidated financial statements. In addition, we have not included cash requirements for environmental remediation. Based upon current estimates we believe we will be required to spend approximately $21$17 million over the next 30 years. However, due to possible modifications in remediation processes and other factors, it is difficult to determine the actual timing of the payments. See “— Environmental and Other Matters.”wholly-owned subsidiaries fully and unconditionally guarantee our senior credit facility and our senior notes on a joint and several basis. The arrangement for the senior credit facility is also secured by first-priority liens on substantially all our domestic assets and pledges of up to 66 percent of the stock of certain first-tier foreign subsidiaries. No assets or capital stock secure our senior notes. You should also read Note 13 of the consolidated financial statements of Tenneco Inc., where we present the Supplemental Guarantor Consolidating Financial Statements.In March 2011, we entered into As a result of our decision to enter into these performance guarantee agreements, the levy due to the U.K. Pension Protection Fund was reduced. The Walker Plans are comprised of employees from Tenneco Walker (U.K.) Limited and our Futaba-Tenneco U.K. joint venture. Employer contributions are funded by both Tenneco Walker (U.K.) Limited, as the sponsoring employer and Futaba-Tenneco U.K., as a participating employer. The performance guarantee agreements are expected to remain in effect until all pension obligations for the Walker Plans’ sponsoring and participating employers have been satisfied. The maximum amount payable for these pension performance guarantees relatingthat is not attributable to other participating employers,Tenneco is approximately $17$7 million as of December 31, 20122015 which is determined by taking 105 percent of the liability of the Walker Plans calculated under section 179 of the U.K. Pension Act of 2004 offset by plan assets.assets multiplied by the ownership percentage in Futaba-Tenneco U.K. that is attributable to Futaba Industrial Co. Ltd. We did not record an additional liability in March 2011 for this performance guarantee since Tenneco Walker (U.K.) Limited, as the sponsoring employer of the Walker Plans, already recognizes 100 percent of the pension obligation calculated based on U.S. GAAP, for all of the Walker Plans’ participating employers on its balance sheet, which was $7$11 million and $13$17 million at December 31, 20122015 and December 31, 2011,2014, respectively. At December 31, 2012,2015, all pension contributions under the Walker Plans were current for all of the Walker Plans’ sponsoring and participating employers.20122015, the maximum amount reimbursable by Futaba to TMEL is approximately $3$7 million.2012,2015, we have $48$32 million in letters of credit to support some of our subsidiaries’ insurance arrangements, foreign employee benefit programs, environmental remediation activities and cash management and capital requirements.$1,711$1,916 million, $1,640$1,934 million and $1,297$1,835 million in 2012, 20112015, 2014 and 2010,2013, respectively. For our aftermarket customers, we provide for promotional incentives and returns at the time of sale. Estimates are based upon the terms of the incentives and historical experience with returns. Certain taxes assessed by governmental authorities on revenue producing transactions, such as value added taxes, are excluded from revenue and recorded on a net basis. Shipping and handling costs billed to customers are included in revenues and the related costs are included in cost of sales in our Statements of Income.$126$146 million for 2012, $1332015, $169 million for 20112014 and $117$144 million for 2010,2013, net of reimbursements from our customers. Of these amounts, $13$17 million in 2012, $162015, $26 million in 20112014 and $13$19 million in 20102013 relate to research and development, which includes the research, design, and development of a new unproven product or process. Additionally, $92$111 million, $92$118 million and $80$101 million of engineering, research, and development expense for 2012, 20112015, 2014 and 2010,2013, respectively, relates to engineering costs we incurred for application of existing products and processes to vehicle platforms. The remainder of the expenses in each year relate to improvements and enhancements to existing products and processes. Further, our customers reimburse us for engineering, research, and development costs on some platforms when we prepare prototypes and incur costs before platform awards. Our engineering, research, and development expense for 2012, 20112015, 2014 and 20102013 has been reduced by $145 million, $159 million $119 million and $110$169 million, respectively, for these reimbursements.were $25totaled $21 million and $19$23 million on December 31, 20122015 and 2011,2014, respectively. In addition, plant, property and equipment included $50$64 million and $38$59 million at December 31, 20122015 and 2011,2014, respectively, for original equipment tools and dies that we own, and prepayments and other included $66$107 million and $49$98 million at December 31, 20122015 and 2011,2014, respectively, for in-process tools and dies that we are building for our original equipment customers.In 2008, given our historical losses in the U.S., we concluded that our ability to fully utilize our federal and state NOL was limited. As a result, we recorded a valuation allowance against all of our U.S. deferred tax assets except for our tax planning strategies which had not yet been implemented and which did not depend upon generating future taxable income. Prior to the reversal of the valuation allowance in the third quarter of 2012, we carried a deferred tax asset in the U.S. of $90 million relating to the expected utilization of the federal and state NOL.In 2012, we reversed the tax valuation allowance against our net deferred tax assets in the U.S. based on operating improvements we had made, the outlook for light and commercial vehicle production in the U.S. and the positive impact this should have on our U.S. operations. The net income impact of the tax valuation allowance release in the U.S. was a tax benefit of approximately $81 million.In 2012, after considering all available evidence and all possible sources of taxable income, we recorded a $19 million tax valuation allowance in Spain for tax credits that may not be utilized due to tax losses in Spain.generated by taxable losses in Spain and certain other foreign jurisdictions will impact our provision for income taxes until the valuation allowances are released. Our provision for income taxes will include no tax benefit for losses incurred and no tax expense with respect to income generated in these jurisdictions until the respective valuation allowance is eliminated.During the third quarter of 2011, we performed an impairment evaluation of our Australian reporting unit’s goodwill balance as a result of the continued deterioration of that reporting unit’s financial performance driven by significant declines in industry production volumes in that region. As a result of performing steps one and two of thetest, we concluded that the remaining amount of goodwillcharges include $306 million related to our AustralianNorth America Ride Performance reporting unit, was impaired$32 million related to our Europe, South America & India Ride Performance reporting unit and accordingly, we recorded a goodwill impairment charge of $11 million during the third quarter of 2011.20122015, 2014 and 2011,2013, as a result of our annual goodwill impairment testing, the estimated fair value of each of our reporting units exceeded the carrying value of their assets and liabilities as of the testing date.lowered raisedthe weighted average discount rate for all our pension plans to 4.13.9 percent in 20122015 from 5.53.7 percent in 2011.2014. The discount rate for postretirement benefits was loweredraised to 4.3 percent in 2015 from 4.1 percent in 2012 from 4.8 percent in 2011.6.96.6 percent for 2012in 2015 from 7.26.7 percent for 2011.2012,2015, all legal funding requirements had been met. In 2010, we recognized a charge of $6 million related to an actuarial loss for lump sum pension payments to two former employees. Other postretirement benefit obligations, such as retire medical, and certain foreign pension plans are funded as the obligations become due.areis incorporated herein by reference.20122015 and is based on an internally developed model which incorporates observable inputs including quoted spot rates, forward exchange rates and discounted future expected cash flows utilizing market interest rates with similar quality and maturity characteristics. The following table summarizes by major currency the notional amounts for our foreign currency forward purchase and sale contracts as of December 31, 2012.2015. All contracts in the following table mature in 2013. (Millions) —Purchase 1 —Purchase 45 9European euro —Sell ( 5043) —Sell (2 ) European euro —Sell (16 ) Japanese yen —Purchase 50 482 —Sell ( 6661,153) —Purchase 80 184—Purchase 93 10 —Sell ( 6071) Other—Purchase1—Sell(1) 2012,2015, we had $734$758 million in long-term debt obligations that have fixed interest rates. Of that amount, $500 million is fixed through December 2020, $225 million is fixed through August 2018December 2024 and the remainder is fixed from 20132015 through 2025. We also have $333$382 million in long-term debt obligations that are subject to variable interest rates. For more detailed explanations on our debt structure and senior credit facility refer to “Liquidity and Capital Resources — Capitalization” earlier in this Management’s Discussion and Analysis.20122015 was about 106102 percent of its book value. A one percentage point increase or decrease in interest rates would increase or decrease the annual interest expense we recognize in the income statement and the cash we pay for interest expense by about $4$5 million.Legal ContingenciesWe are involved in environmental remediation matters, legal proceedings, claims, investigations and warranty obligations that are incidentalProduct Warrantiesconduct of our business and create the potential for contingent losses. We accrue for potential contingent losses when our review of available facts indicates that it is probable a loss has been incurred and the amount of the loss is reasonably estimable. Each quarter we assess our loss contingencies based upon currently available facts, existing technology, and presently enacted laws and regulations taking into consideration the likely effects of inflation and other societal and economic factors and record adjustments to these reserves as required. As an example, we consider all available evidence including prior experience in remediation of contaminated sites, other companies’ cleanup experiences and data released by the United States Environmental Protection Agency or other organizations when we evaluate our environmental remediation contingencies. Further, all of our loss contingency estimates are subject to revision in future periods based on actual costs or new information. With respect to our environmental liabilities, where future cash flows are fixed or reliably determinable, we have discounted those liabilities. All other environmental liabilities are recorded at their undiscounted amounts. We evaluate recoveries separately from the liability and, when they are assured, recoveries are recorded and reported separately from the associated liability in our consolidated financial statements.are subjectexpect to a variety of environmentalcontinue to incur legal and pollution control laws and regulationsrelated costs in all jurisdictions in which we operate. We expense or capitalize, as appropriate, expenditures for ongoing compliance with environmental regulations that relate to current operations. We expense costs related to an existing condition caused by past operations that do not contribute to current or future revenue generation. As of December 31, 2012, we have the obligation to remediate or contribute towards the remediation of certain sites, including one Federal Superfund site. At December 31, 2012, our aggregated estimated share of environmental remediation costs for all these sites on a discounted basis was approximately $18 million, of which $5 million is recorded in other current liabilities and $13 million is recorded in deferred credits and other liabilities in our consolidated balance sheet. For those locations where the liability was discounted, the weighted average discount rate used was 1.6 percent. The undiscounted value of the estimated remediation costs was $21 million. Our expected payments of environmental remediation costs are estimated to be approximately $3 million in 2013, $1 million each year beginning 2014 through 2017 and $14 million in aggregate thereafter. Based on information known to us, we have established reserves that we believe are adequate for these costs. Although we believe these estimates of remediation costs are reasonable and are based on the latest available information, the costs are estimates and are subject to revision as more information becomes available about the extent of remediation required. At some sites, we expect that other parties will contribute towards the remediation costs. In addition, certain environmental statutes provide that our liability could be joint and several, meaning that we could be required to pay in excess of our share of remediation costs. Our understanding of the financial strength of other potentially responsible parties at these sites has been considered, where appropriate, in our determination of our estimated liability. We do not believe that any potential costs associated with our current status as a potentially responsible party in the Federal Superfund site, or as a liable party at the other locations referenced herein, will be material to our consolidated results of operations, financial position or cash flows.We also from time to time are involved in legal proceedings, claims or investigations. Some of these proceedings allege damages against us relating to environmental liabilities (including toxic tort, property damage and remediation), intellectual property matters (including patent, trademark and copyright infringement, and licensing disputes), personal injury claims (including injuries due to product failure, design or warning issues, and other product liability related matters), taxes, employment matters, and commercial or contractual disputes, sometimes related to acquisitions or divestitures. For example, one of our Argentine subsidiaries is currently defending against a criminal complaint alleging the failure to comply with laws requiring the proceeds of export transactions to be collected, reported and/or converted to local currency within specified time periods. As another example, in the U.S. we are subject to an audit in 11 states with respect2016 pertaining to the payment of unclaimed property to those states, spanning a period as far back as over 30 years. While we vigorously defend ourselves against all of these claims, in future periods we could be subject to cashongoing antitrust investigation. Such costs or charges to earnings if any of these matters are resolved on unfavorable terms. Although the ultimate outcome of any legal matter cannot be predicted with certainty, based on current information, including our assessment of the merits of the particular claim, we do not expect that these legal proceedings or claims will have any material adverse impact on our future consolidated financial position, results of operations or cash flows.In addition, we are subject to lawsuits initiated by a significant number of claimants alleging health problems as a result of exposure to asbestos. In the early 2000’s we were named in nearly 20,000 complaints, most of which were filed in Mississippi state court and the vast majority of which made no allegations of exposure to asbestos from our product categories. Most of these claims have been dismissed and our current docket of active and inactive cases is less than 500 cases nationwide. A small number of claims have been asserted by railroad workers alleging exposure to asbestos products in railroad cars manufactured by The Pullman Company, one of our subsidiaries. The substantial majority of the remaining claims are related to alleged exposure to asbestos in our automotive products. Only a small percentage of the claimants allege that they were automobile mechanics and a significant number appear to involve workers in other industries or otherwise do not include sufficient information to determine whether there is any basis for a claim against us. We believe, based on scientific and other evidence, it is unlikely that mechanics were exposed to asbestos by our former products and that, in any event, they wouldmay not be at increased risk of asbestos-related disease based on their work with these products. Further, many of these cases involve numerous defendants, withevenly distributed throughout the number in some cases exceeding 100 defendants from a variety of industries. Additionally, the plaintiffs either do notspecify any, or specify the jurisdictional minimum, dollar amount for damages. As major asbestos manufacturers and/or users continue to go out of business or file for bankruptcy, we may experience an increased number of these claims. We vigorously defend ourselves against these claims as part of our ordinary course of business. In future periods, we could be subject to cash costs or charges to earnings if any of these matters are resolved unfavorably to us. To date, with respect to claims that have proceeded sufficiently through the judicial process, we have regularly achieved favorable resolutions. Accordingly, we presently believe that these asbestos-related claims will not have a material adverse impact on our future consolidated financial condition, results of operations or cash flows.in cash 100 percent onof an employee's contributions up to three percent of the firstemployee's salary and 50 percent of an employee's contributions that are between three percent and 50 percent on the next twofive percent of employee contributions.the employee's salary. In connection with freezing the defined benefit pension plans for nearly all U.S. based salaried and non-union hourly employees effective December 31, 2006, and the related replacement of those defined benefit plans with defined contribution plans, we are making additional contributions to the Employee Stock Ownership Plans. We recorded expense for these contributions of$21$27 million, $18$25 million and $17$23 million in 2012, 2011,2015, 2014, and 2010,2013, respectively. Matching contributions vest immediately. Defined benefit replacement contributions fully vest on the employee’s third anniversary of employment.Change in Reportable SegmentsITEM 7A.In connection with the organizational changes announced on February 14, 2013 that will align our businesses along product lines, effective with the first quarter of 2013, our three prior geographic reportable segments have each been split into two product segments. Accordingly, beginning with the first quarter of 2013, we will be managed and organized along our two major product lines (emission control and ride control) and three geographic areas (North America (“NA”); Europe, South America and India (“ESI”); and Asia Pacific (“AP”)), resulting in six operating segments (NA Clean Air, NA Ride Performance, ESI Clean Air, ESI Ride Performance, AP Clean Air and AP Ride Performance). Within each geographical area, each operating segment manufactures and distributes either ride control or emission control products primarily for the original equipment and aftermarket industries. Each of the six operating segments constitutes a reportable segment. Costs related to other business activities, primarily corporate headquarter functions, will be disclosed separately from the six operating segments. We evaluate segment performance based primarily on earnings before interest expense, income taxes, and noncontrolling interests. Products are transferred between segments and geographic areas on a basis intended to reflect as nearly as possible the “market value” of the products. The following table summarizes annual data for 2010, 2011 and 2012 for the six new reportable segments. Clean Air Division Ride Performance Division North
America Europe,
SA & India Asia
Pacific North
America Europe,
SA & India Asia
Pacific Other Reclass
&
Elims Total $ 2,506 $ 1,726 $ 694 $ 1,213 $ 1,041 $ 183 $ — $ — $ 7,363 6 101 1 10 53 30 — (201 ) — — 1 1 — — — — — 2 58 43 18 30 48 8 — — 205 202 54 71 122 41 5 (67 ) — 428 1,029 725 435 593 600 202 — 24 3,608 — 8 — — — — — — 8 76 56 40 46 32 13 — — 263 7 2 — 4 (2 ) — — — 11 $ 2,288 $ 1,849 $ 624 $ 1,126 $ 1,164 $ 154 $ — $ — $ 7,205 3 104 — 9 52 26 — (194 ) — — 1 1 — 2 — — — 4 60 47 16 30 45 9 — — 207 172 79 47 76 69 (6 ) (58 ) — 379 902 719 386 517 607 181 — 25 3,337 — 9 — — — — — — 9 49 55 24 39 40 11 — — 218 5 11 2 1 1 9 — — 29 Clean Air Division Ride Performance Division North
America Europe,
SA & India Asia
Pacific North
America Europe,
SA & India Asia
Pacific Other Reclass
&
Elims Total $ 1,810 $ 1,473 $ 542 $ 1,011 $ 973 $ 128 $ — $ — $ 5,937 3 89 1 8 59 27 — (187 ) — — 1 1 — 2 — — — 4 66 46 14 37 45 8 — — 216 114 50 53 87 55 3 (81 ) — 281 806 688 348 475 649 177 — 24 3,167 — 9 — — — — — — 9 37 44 24 22 22 5 — — 154 3 6 — 1 — — — — 10 ITEM 7A.QUANTITATIVE AND QUALITATIVE DISCLOSURES ABOUT MARKET RISK.ITEM 8.FINANCIAL STATEMENTS AND SUPPLEMENTARY DATA. Page 8081828386878889139Framework.Framework (2013).2012.20122015 has been audited by PricewaterhouseCoopers LLP, our independent registered public accounting firm, as stated in their report, which is included herein.27, 20132012,2015, and 20112014 and the results of their operations and their cash flows for each of the three years in the period ended December 31, 20122015 in conformity with accounting principles generally accepted in the United States of America. In addition, in our opinion, the financial statement schedule listed in the accompanying index presents fairly, in all material respects, the information set forth therein when read in conjunction with the related consolidated financial statements. Also in our opinion, the Company maintained, in all material respects, effective internal control over financial reporting as of December 31, 2012,2015, based on criteria established inInternal Control — Integrated Framework (2013) issued by the Committee of Sponsoring Organizations of the Treadway Commission (COSO). The Company’s management is responsible for these financial statements and financial statement schedule, for maintaining effective internal control over financial reporting and for its assessment of the effectiveness of internal control over financial reporting, included in the accompanying Management’s Report on Internal Control over Financial Reporting. Our responsibility is to express opinions on these financial statements, on the financial statement schedule, and on the Company’s internal control over financial reporting based on our integrated audits. We conducted our audits in accordance with the standards of the Public Company Accounting Oversight Board (United States). Those standards require that we plan and perform the audits to obtain reasonable assurance about whether the financial statements are free of material misstatement and whether effective internal control over financial reporting was maintained in all material respects. Our audits of the financial statements included examining, on a test basis, evidence supporting the amounts and disclosures in the financial statements, assessing the accounting principles used and significant estimates made by management, and evaluating the overall financial statement presentation. Our audit of internal control over financial reporting included obtaining an understanding of internal control over financial reporting, assessing the risk that a material weakness exists, and testing and evaluating the design and operating effectiveness of internal control based on the assessed risk. Our audits also included performing such other procedures as we considered necessary in the circumstances. We believe that our audits provide a reasonable basis for our opinions.PricewaterhouseCoopers LLPChicago, Illinois27, 2013 Year Ended December 31, 2012 2011 2010 (Millions Except Share and Per Share Amounts) $ 7,363 $ 7,205 $ 5,937 6,170 6,037 4,900 — 11 — 126 133 117 427 428 417 205 207 216 6,928 6,816 5,650 (4 ) (5 ) (3 ) (3 ) (5 ) (3 ) (7 ) (10 ) (6 ) 428 379 281 105 108 149 323 271 132 19 88 69 304 183 63 29 26 24 $ 275 $ 157 $ 39 59,985,677 59,884,139 59,208,103 61,083,510 61,520,160 60,998,694 $ 4.58 $ 2.62 $ 0.65 $ 4.50 $ 2.55 $ 0.63 Year Ended December 31, 2015 2014 2013 (Millions Except Share and Per Share Amounts) Revenues Net sales and operating revenues $ 8,209 $ 8,420 $ 7,964 Costs and expenses Cost of sales (exclusive of depreciation and amortization shown below) 6,845 7,025 6,734 Engineering, research, and development 146 169 144 Selling, general, and administrative 491 519 453 Depreciation and amortization of other intangibles 203 208 205 7,685 7,921 7,536 Other income (expense) Loss on sale of receivables (4 ) (4 ) (4 ) Other expense (1 ) (3 ) — (5 ) (7 ) (4 ) Earnings before interest expense, income taxes, and noncontrolling interests 519 492 424 Interest expense 67 91 80 Earnings before income taxes and noncontrolling interests 452 401 344 Income tax expense 149 131 122 Net income 303 270 222 Less: Net income attributable to noncontrolling interests 56 44 39 Net income attributable to Tenneco Inc. $ 247 $ 226 $ 183 Earnings per share Weighted average shares of common stock outstanding — Basic 59,678,309 60,734,022 60,474,492 Diluted 60,193,150 61,782,508 61,594,062 Basic earnings per share of common stock $ 4.14 $ 3.72 $ 3.03 Diluted earnings per share of common stock $ 4.11 $ 3.66 $ 2.97 Year Ended December 31, 2012 Tenneco Inc. Noncontrolling interests Total Accumulated
Other
Comprehensive
Income
(Loss) Comprehensive
Income
(Loss) Accumulated
Other
Comprehensive
Income
(Loss) Comprehensive
Income
(Loss) Accumulated
Other
Comprehensive
Income
(Loss) Comprehensive
Income
(Loss) (Millions) $ 275 $ 29 $ 304 $ (30 ) $ 4 $ (26 ) 6 6 1 1 7 7 (24 ) 5 (19 ) (352 ) — (352 ) (32 ) (32 ) (32 ) (32 ) (384 ) (384 ) $ (408 ) $ 5 $ (403 ) (26 ) 1 (25 ) $ 249 $ 30 $ 279 Year Ended December 31, 2015 Tenneco Inc. Noncontrolling interests Total (Millions) Net Income $ 247 $ 56 $ 303 Accumulated Other Comprehensive Income (Loss) Cumulative Translation Adjustment Balance January 1 $ (166 ) $ 3 $ (163 ) Translation of foreign currency statements (131 ) (131 ) (4 ) (4 ) (135 ) (135 ) Balance December 31 (297 ) (1 ) (298 ) Adjustment to the Liability for Pension and Postretirement Benefits Balance January 1 (379 ) — (379 ) Adjustment to the Liability for Pension and Postretirement benefits, net of tax 11 11 11 11 Balance December 31 (368 ) — (368 ) Balance December 31 $ (665 ) $ (1 ) $ (666 ) Other comprehensive loss (120 ) (4 ) (124 ) Comprehensive Income $ 127 $ 52 $ 179 Year Ended December 31, 2011 Tenneco Inc. Noncontrolling interests Total Accumulated
Other
Comprehensive
Income
(Loss) Comprehensive
Income
(Loss) Accumulated
Other
Comprehensive
Income
(Loss) Comprehensive
Income
(Loss) Accumulated
Other
Comprehensive
Income
(Loss) Comprehensive
Income
(Loss) (Millions) $ 157 $ 26 $ 183 $ 8 $ 5 $ 13 (38 ) (38 ) (1 ) (1 ) (39 ) (39 ) (30 ) 4 (26 ) (250 ) — (250 ) (102 ) (102 ) (102 ) (102 ) (352 ) (352 ) $ (382 ) $ 4 $ (378 ) (140 ) (1 ) (141 ) $ 17 $ 25 $ 42 Year Ended December 31, 2014 Tenneco Inc. Noncontrolling interests Total (Millions) Net Income $ 226 $ 44 $ 270 Accumulated Other Comprehensive Income (Loss) Cumulative Translation Adjustment Balance January 1 $ (61 ) $ 5 $ (56 ) Translation of foreign currency statements (105 ) (105 ) (2 ) (2 ) (107 ) (107 ) Balance December 31 (166 ) 3 (163 ) Adjustment to the Liability for Pension and Postretirement Benefits Balance January 1 (299 ) — (299 ) Adjustment to the Liability for Pension and Postretirement benefits, net of tax (80 ) (80 ) (80 ) (80 ) Balance December 31 (379 ) — (379 ) Balance December 31 $ (545 ) $ 3 $ (542 ) Other comprehensive loss (185 ) (2 ) (187 ) Comprehensive Income $ 41 $ 42 $ 83 Year Ended December 31, 2010 Tenneco Inc. Noncontrolling interests Total Accumulated
Other
Comprehensive
Income
(Loss) Comprehensive
Income
(Loss) Accumulated
Other
Comprehensive
Income
(Loss) Comprehensive
Income
(Loss) Accumulated
Other
Comprehensive
Income
(Loss) Comprehensive
Income
(Loss) (Millions) $ 39 $ 24 $ 63 $ 37 $ — $ 37 (29 ) (29 ) 5 5 (24 ) (24 ) 8 5 13 (249 ) — (249 ) (1 ) (1 ) (1 ) (1 ) (250 ) (250 ) $ (242 ) $ 5 $ (237 ) (30 ) 5 (25 ) $ 9 $ 29 $ 38 Year Ended December 31, 2013 Tenneco Inc. Noncontrolling interests Total (Millions) Net Income $ 183 $ 39 $ 222 Accumulated Other Comprehensive Income (Loss) Cumulative Translation Adjustment Balance January 1 $ (24 ) $ 5 $ (19 ) Translation of foreign currency statements (37 ) (37 ) — — (37 ) (37 ) Balance December 31 (61 ) 5 (56 ) Adjustment to the Liability for Pension and Postretirement Benefits Balance January 1 (384 ) — (384 ) Adjustment to the Liability for Pension and Postretirement benefits, net of tax 85 85 85 85 Balance December 31 (299 ) — (299 ) Balance December 31 $ (360 ) $ 5 $ (355 ) Other comprehensive income 48 — 48 Comprehensive Income $ 231 $ 39 $ 270 December 31, 2012 2011 (Millions) ASSETS $ 223 $ 214 966 936 20 44 667 592 72 40 176 153 2,124 1,979 4 10 72 74 35 32 116 92 135 103 362 311 3,365 3,153 (2,243 ) (2,106 ) 1,122 1,047 $ 3,608 $ 3,337 LIABILITIES AND SHAREHOLDERS’ EQUITY $ 113 $ 66 1,186 1,171 50 44 10 13 239 226 51 50 1,649 1,570 1,067 1,158 27 51 407 385 152 118 3,302 3,282 15 12 1 1 3,031 3,016 (408 ) (382 ) (2,104 ) (2,379 ) 520 256 274 256 246 — 45 43 291 43 $ 3,608 $ 3,337 December 31, 2015 2014 (Millions) ASSETS Current assets: Cash and cash equivalents $ 287 $ 282 Restricted cash 1 3 Receivables — Customer notes and accounts, net 1,102 1,064 Other 10 24 Inventories 682 688 Deferred income taxes — 81 Prepayments and other 229 284 Total current assets 2,311 2,426 Other assets: Long-term receivables, net 13 12 Goodwill 60 65 Intangibles, net 22 26 Deferred income taxes 218 143 Other 100 106 413 352 Plant, property, and equipment, at cost 3,418 3,490 Less — Accumulated depreciation and amortization (2,175 ) (2,272 ) 1,243 1,218 Total Assets $ 3,967 $ 3,996 LIABILITIES AND SHAREHOLDERS’ EQUITY Current liabilities: Short-term debt (including current maturities of long-term debt) $ 86 $ 60 Accounts payable 1,376 1,372 Accrued taxes 37 40 Accrued interest 4 3 Accrued liabilities 250 258 Other 41 66 Total current liabilities 1,794 1,799 Long-term debt 1,124 1,055 Deferred income taxes 7 18 Postretirement benefits 318 339 Deferred credits and other liabilities 206 212 Commitments and contingencies Total liabilities 3,449 3,423 Redeemable noncontrolling interests 43 35 Tenneco Inc. Shareholders’ equity: Common stock 1 1 Premium on common stock and other capital surplus 3,081 3,059 Accumulated other comprehensive loss (665 ) (545 ) Retained earnings (accumulated deficit) (1,448 ) (1,695 ) 969 820 Less — Shares held as treasury stock, at cost 536 323 Total Tenneco Inc. shareholders’ equity 433 497 Noncontrolling interests 42 41 Total equity 475 538 Total liabilities, redeemable noncontrolling interests and equity $ 3,967 $ 3,996 Year Ended December 31, 2012 2011 2010 (Millions) $ 304 $ 183 $ 63 — 11 — 205 207 216 (65 ) (5 ) 4 11 8 9 4 4 3 (9 ) (183 ) (231 ) (72 ) (64 ) (122 ) (21 ) (13 ) 20 12 144 238 7 (7 ) 12 (3 ) — (8 ) 10 (7 ) 20 14 1 12 (37 ) (41 ) 6 5 7 2 365 245 244 3 4 3 (256 ) (213 ) (151 ) (13 ) (15 ) (12 ) (7 ) — — — — 3 (273 ) (224 ) (157 ) (411 ) (24 ) (864 ) 250 5 880 (13 ) (1 ) (24 ) (18 ) (16 ) — 5 — — 5 3 2 67 30 (10 ) 50 — — 5 1 — — (4 ) — (29 ) (20 ) (14 ) (89 ) (26 ) (30 ) 6 (14 ) 9 9 (19 ) 66 214 233 167 $ 223 $ 214 $ 233 $ 100 $ 106 $ 149 80 85 53 $ 42 $ 35 $ 29 Year Ended December 31, 2015 2014 2013 (Millions) Operating Activities Net income $ 303 $ 270 $ 222 Adjustments to reconcile net income to cash provided by operating activities — Depreciation and amortization of other intangibles 203 208 205 Deferred income taxes — (1 ) 5 Stock-based compensation 15 13 13 Loss on sale of assets 4 6 1 Changes in components of working capital — (Increase) decrease in receivables (90 ) (83 ) (88 ) (Increase) decrease in inventories (36 ) (74 ) 3 (Increase) decrease in prepayments and other current assets 37 (81 ) (53 ) Increase (decrease) in payables 90 94 161 Increase (decrease) in accrued taxes (1 ) — (10 ) Increase (decrease) in accrued interest 1 (6 ) — Increase (decrease) in other current liabilities (10 ) 13 64 Change in long-term assets 3 12 7 Change in long-term liabilities (2 ) (13 ) (32 ) Other — (17 ) 5 Net cash provided by operating activities 517 341 503 Investing Activities Proceeds from sale of assets 4 3 8 Cash payments for plant, property, and equipment (286 ) (328 ) (244 ) Cash payments for software related intangible assets (23 ) (13 ) (25 ) Cash payments for net assets purchased — (3 ) — Change in restricted cash 2 2 (5 ) Net cash used by investing activities (303 ) (339 ) (266 ) Financing Activities Retirement of long-term debt (37 ) (462 ) (16 ) Issuance of long-term debt 1 570 — Debt issuance costs of long-term debt (1 ) (12 ) — Purchase of common stock under the share repurchase program (213 ) (22 ) (27 ) Issuance of common stock 6 19 20 Tax benefit from stock-based compensation 6 26 24 Increase (decrease) in bank overdrafts (22 ) 6 (6 ) Net increase (decrease) in revolver borrowings and short-term debt excluding current maturities of long-term debt and short-term borrowings secured by accounts receivable 102 (70 ) (22 ) Net increase (decrease) in short-term borrowings secured by accounts receivable 30 (10 ) (40 ) Capital contribution from noncontrolling interest partner — 5 — Purchase of noncontrolling equity interest — — (69 ) Distribution to noncontrolling interest partners (44 ) (30 ) (39 ) Net cash provided (used) by financing activities (172 ) 20 (175 ) Effect of foreign exchange rate changes on cash and cash equivalents (37 ) (15 ) (10 ) Increase in cash and cash equivalents 5 7 52 Cash and cash equivalents, January 1 282 275 223 Cash and cash equivalents, December 31 (Note) $ 287 $ 282 $ 275 Supplemental Cash Flow Information Cash paid during the year for interest $ 68 $ 93 $ 79 Cash paid during the year for income taxes (net of refunds) 105 136 109 Non-cash Investing and Financing Activities Period end balance of trade payables for plant, property, and equipment $ 50 $ 41 $ 52 Note: Cash and cash equivalents include highly liquid investments with a maturity of three months or less at the date of purchase. Year Ended December 31, 2012 2011 2010 Shares Amount Shares Amount Shares Amount (Millions Except Share Amounts) 62,101,335 $ 1 61,541,760 $ 1 60,789,739 $ 1 — — — — — — 149,398 — 49,871 — 142,643 — 538,649 — 509,704 — 609,378 — 62,789,382 1 62,101,335 1 61,541,760 1 3,016 3,008 3,005 — (2 ) (11 ) 15 10 14 3,031 3,016 3,008 (382 ) (237 ) (212 ) (26 ) (145 ) (25 ) (408 ) (382 ) (237 ) (2,379 ) (2,536 ) (2,575 ) 275 157 39 (2,104 ) (2,379 ) (2,536 ) 1,694,692 256 1,294,692 240 1,294,692 240 600,000 18 400,000 16 — — 2,294,692 274 1,694,692 256 1,294,692 240 $ 246 $ — $ (4 ) 43 39 32 20 19 16 3 — — — — (4 ) 1 (1 ) 3 (22 ) (14 ) (8 ) $ 45 $ 43 $ 39 $ 291 $ 43 $ 35 Year Ended December 31, 2015 2014 2013 Shares Amount Shares Amount Shares Amount (Millions Except Share Amounts) Common Stock Balance January 1 64,454,248 $ 1 63,714,728 $ 1 62,789,382 $ 1 Issued pursuant to benefit plans 335,766 — 62,334 — 156,213 — Stock options exercised 277,118 — 677,186 — 769,133 — Balance December 31 65,067,132 1 64,454,248 1 63,714,728 1 Premium on Common Stock and Other Capital Surplus Balance January 1 3,059 3,014 3,031 Purchase of noncontrolling equity interest — — (68 ) Premium on common stock issued pursuant to benefit plans 22 45 51 Balance December 31 3,081 3,059 3,014 Accumulated Other Comprehensive Loss Balance January 1 (545 ) (360 ) (408 ) Other comprehensive income (loss) (120 ) (185 ) 48 Balance December 31 (665 ) (545 ) (360 ) Retained Earnings (Accumulated Deficit) Balance January 1 (1,695 ) (1,921 ) (2,104 ) Net income attributable to Tenneco Inc. 247 226 183 Balance December 31 (1,448 ) (1,695 ) (1,921 ) Less — Common Stock Held as Treasury Stock, at Cost Balance January 1 3,244,692 323 2,844,692 301 2,294,692 274 Purchase of common stock through stock repurchase program 4,228,633 213 400,000 22 550,000 27 Balance December 31 7,473,325 536 3,244,692 323 2,844,692 301 Total Tenneco Inc. shareholders’ equity $ 433 $ 497 $ 433 Noncontrolling interests: Balance January 1 41 39 45 Net income 24 21 24 Sale of noncontrolling equity interest — — (1 ) Other comprehensive income (loss) (3 ) (1 ) — Dividends declared (20 ) (18 ) (29 ) Balance December 31 $ 42 $ 41 $ 39 Total equity $ 475 $ 538 $ 472 1.Summary of Accounting Policiesthreefive joint ventures with redemption features that could require us to purchase the noncontrolling interests at fair value in the event of a change in control of Tenneco Inc. or certain of our subsidiaries. We do not believe that it is probable that the redemption features in any of these joint venture agreements will be triggered. However, the redemption of these shares is not solely within our control. Accordingly, the related noncontrolling interests are presented as “Redeemable noncontrolling interests” in the temporary equity section of our consolidated balance sheets.August 2011,May 2014, we purchased the remaining 25sold a 45 percent equity interest in our emission control joint venture in ThailandTenneco Fusheng (Chengdu) Automobile Parts Co., Ltd., to a third party for $4 million in cash.million. As a result of this purchase,the sale, our equity ownership of this joint venture investmentTenneco Fusheng (Chengdu) Automobile Parts Co., Ltd. changed to 10055 percent from 75100 percent. Refer to Note 3 of the consolidated financial statements of Tenneco Inc. for additional details.2012, 20112015, 2014 and 2010,2013, respectively: 2012 2011 2010 (Millions) $ 12 $ 12 $ 7 9 7 8 — (2 ) — 2 1 — — — 2 (8 ) (6 ) (5 ) $ 15 $ 12 $ 12 TENNECO INC.NOTES TO CONSOLIDATED FINANCIAL STATEMENTS — (Continued)2015 2014 2013 (Millions) Balance January 1 $ 35 $ 20 $ 15 Net income attributable to redeemable noncontrolling interests 33 23 14 Sale of 45 percent equity interest from Tenneco Inc — 4 — Capital Contributions — 1 — Dividends declared (24 ) (13 ) (9 ) Balance December 31 $ 43 $ 35 $ 20 20122015 and 2011,2014, inventory by major classification was as follows: 2012 2011 (Millions) $ 273 $ 244 207 181 133 121 54 46 $ 667 $ 592 2015 2014 (Millions) Finished goods $ 257 $ 272 Work in process 233 221 Raw materials 135 137 Materials and supplies 57 58 $ 682 $ 688 During the third quarter of 2011, we performed an impairment evaluation of our Australian reporting unit’s goodwill balance as a result of continued deterioration of that reporting unit’s financial performance driven primarily by significant declines in industry production volumes in that region. As a result of performing steps one and two of thetest, we concluded that the remaining amount of goodwillcharges include $306 million related to our AustralianNorth America Ride Performance reporting unit, was impaired$32 million related to our Europe, South America & India Ride Performance reporting unit and accordingly, we recorded a goodwill impairment charge of $11 million during the third quarter of 2011.20122015, 2014 and 2011,2013, as a result of our annual goodwill impairment testing, the estimated fair value of each of our reporting units exceeded the carrying value of their assets and liabilities as of the testing date.TENNECO INC.NOTES TO CONSOLIDATED FINANCIAL STATEMENTS — (Continued)20122015, 2014 and 20112013 were as follows: Year Ended December 31, 2012 North
America Europe,
South
America
and India Asia
Pacific Total (Millions) $ 331 $ 80 $ 12 $ 423 (306 ) (31 ) (12 ) (349 ) 25 49 — 74 (1 ) (1 ) — (2 ) 330 79 12 421 (306 ) (31 ) (12 ) (349 ) $ 24 $ 48 $ — $ 72 Year Ended December 31, 2011 North
America Europe,
South
America
and India Asia
Pacific Total (Millions) $ 330 $ 85 $ 12 $ 427 (306 ) (31 ) (1 ) (338 ) 24 54 11 89 1 (5 ) — (4 ) — — 11 11 331 80 12 423 (306 ) (31 ) (12 ) (349 ) $ 25 $ 49 $ — $ 74 Clean Air Division Ride Performance Division North
America Europe, South America & India Asia
Pacific North
America Europe, South America & India Asia
Pacific Total (Millions) Balance at December 31, 2013 $ 14 $ 14 $ — $ 10 $ 31 $ — $ 69 Translation Adjustment — (2 ) — — (2 ) — (4 ) Balance at December 31, 2014 14 12 — 10 29 — 65 Translation Adjustment — (1 ) — — (4 ) — (5 ) Balance at December 31, 2015 14 11 — 10 25 — 60 TENNECO INC.NOTES TO CONSOLIDATED FINANCIAL STATEMENTS — (Continued)five5 to 50 years. Amortization of intangibles amounted to $5 million in 2012 and $22015, $4 million in each of 20112014, and 2010,$5 million in 2013, and are included in the statements of income caption “Depreciation and amortization of intangibles.” The carrying amount and accumulated amortization of our finite useful life intangible assets were as follows: December 31, 2012 December 31, 2011 Gross Carrying
Value Accumulated
Amortization Gross Carrying
Value Accumulated
Amortization (Millions) (Millions) $ 8 $ (3) $ 8 $ (3) 3 (1) 5 (4) 26 (7) 20 (6) 11 (1) 9 — $ 48 $ (12) $ 42 $ (13) December 31, 2015 December 31, 2014 Gross Carrying
Value Accumulated
Amortization Gross Carrying
Value Accumulated
Amortization (Millions) (Millions) Customer contract $ 8 $ (4 ) $ 8 $ (4 ) Patents 2 (2 ) 3 (2 ) Technology rights 29 (19 ) 26 (15 ) Other 10 (2 ) 11 (2 ) Total $ 49 $ (27 ) $ 48 $ (23 ) 2013, $4 million in both 2014 and 2015, $3 million in 2016, and $2 million in 2017. We have capitalized indefinite life intangibles of2017 and $1 million relating to purchased trademarks from our Marzocchi acquisition in 2008.20122015 and 2011,2014, plant, property, and equipment, at cost, by major category were as follows: 2012 2011 (Millions) $ 563 $ 530 2,574 2,406 228 217 $ 3,365 $ 3,153 2015 2014 (Millions) Land, buildings, and improvements $ 561 $ 569 Machinery and equipment 2,569 2,655 Other, including construction in progress 288 266 $ 3,418 $ 3,490 three3 to 25 years for machinery and equipment.$980$1,126 million and $959$1,088 million at December 31, 20122015 and 2011,2014, respectively. The allowance for doubtful accounts on short-term and long-term accounts receivable was $14 million and $17$16 million at both December 31, 20122015 and 2011, respectively.2014. Short and long-term notes receivable outstanding were $3 million and $4was $5 million at both December 31, 20122015 and 2011, respectively.2014. The allowance for doubtful accounts on short-term and long-term notes receivable was zero at both December 31, 20122015 and 2011.$25$21 million andTENNECO INC.$23 millionNOTES TO CONSOLIDATED FINANCIAL STATEMENTS — (Continued)$19 million at December 31, 20122015 and 2011,2014, respectively. In addition, plant, property and equipment included $50$64 million and $38$59 million at both December 31, 20122015 and 2011,2014, respectively, for original equipment tools and dies that we own, and prepayments and other included $66$107 million and $49$98 million at December 31, 20122015 and 2011,2014, respectively, for in-process tools and dies that we are building for our original equipment customers.$58$54 million at December 31, 20122015 and 2011,2014, respectively, and are recorded in other long-term assets. Amortization of software development costs was approximately $14 million, $15 million and $18$13 million for the year ended December 31, 2015 and $15 million for both years ended December 31, 2012, 20112014 and 2010, respectively,2013, and is included in the statements of income (loss) caption “Depreciation and amortization of intangibles.” Additions to capitalized software development costs, including payroll and payroll-related costs for those employees directly associated with developing and obtaining the internal use software, are classified as investing activities in the statements of cash flows.Income TaxesWe reported income tax expenses of $19 million, $88$69$91 million at December 31, 2015 and December 31, 2014 , respectively, for accrued compensation and $17 million and $39 million at December 31, 2015 and December 31, 2014, respectively, for bank overdrafts at our European subsidiaries.ended 2012, 2011 and 2010, respectively. The tax expense recorded in 2012 differs fromwhich we expect the expense that wouldtemporary differences to be recorded using a U.S. Federal statutory rate of 35 percent due primarily to the impact of the U.S. 2012 valuation allowance release described below and income generated in lower tax rate jurisdictions, partially offset by the impact of recording a valuation allowance against the tax benefit for tax credits and losses in certain foreign jurisdictions.In 2008, given our historical losses in the U.S., we concluded that our ability to fully utilize our federal and state net operating loss carryforward (“NOL”) was limited. As a result, we recorded a valuation allowance against all of our U.S. deferred tax assets except for our tax planning strategies which had not yet been implemented and which did not depend upon generating future taxable income. Prior to the reversal of the valuation allowance in the third quarter of 2012, we carried a deferred tax asset in the U.S. of $90 million relating to the expected utilization of the federal and state NOL. The recording of a valuation allowance did not impact the amount of the NOL that would be available for federal and state income tax purposes in future periods.In 2012, we reversed the tax valuation allowance against our net deferred tax assets in the U.S. based on operating improvements we had made, the outlook for light and commercial vehicle production in the U.S. and the positive impact this should have on our U.S. operations. The net income impact of the tax valuation allowance release in the U.S. was a tax benefit of approximately $81 million. We now have a federal NOL at December 31, 2012 of $190 million, which expires beginning in tax years ending in 2022 through 2030. The state NOLs expire in various tax years through 2032.TENNECO INC.NOTES TO CONSOLIDATED FINANCIAL STATEMENTS — (Continued)In 2012, after considering all available evidence and all possible sources of taxable income, we recorded a $19 million tax valuation allowance in Spain for tax credits that may not be utilized due to tax losses in Spain. Spain and certain other foreign jurisdictions will impact our provision for income taxes until the valuation allowances are released. Our provision for income taxes will include no tax benefit for losses incurred and no tax expense with respect to income generated in these jurisdictions until the respective valuation allowance is eliminated.$1,711$1,916 million, $1,640$1,934 million and $1,297$1,835 million in 2012, 20112015, 2014 and 2010,2013, respectively. For our aftermarket customers, we provide for promotional incentives and returns at the time of sale. Estimates are based upon the terms of the incentives and historical experience with returns. Certain taxes assessed by governmental authorities on revenue producing transactions, such as value added taxes, are excluded from revenue and recorded on a net basis. Shipping and handling costs billed to customers are included in revenues and the related costs are included in cost of sales in our consolidated statements of income (loss).TENNECO INC.NOTES TO CONSOLIDATED FINANCIAL STATEMENTS — (Continued)$126$146 million for 2012, $1332015, $169 million for 2011,2014, and $117$144 million for 2010,2013, net of reimbursements from our customers. Our customers reimburse us for engineering, research, and development costs on some platforms when we prepare prototypes and incur costs before platform awards. Our engineering, research, and development expense for 2012, 20112015, 2014 and 20102013 has been reduced by $159$145 million, $119$159 million and $110$169 million, respectively, for these reimbursements.$61$57 million, and $59$53 million for the years ended December 31, 2012, 2011,2015, 2014, and 2010,2013, respectively. Translationtransactions which hedge purchase commitments and for those intercompany balances which are designated as long-term investments. Our results include foreign currency transaction losses of $8$6 million in 2012,2015, of $3$1 million in 2014 and $13 million in 2011 and less than $1 million2013. The amounts are recorded in 2010.Risk Management Activitiescost of sales.20122015 and a net liability position of less than $1 million at December 31, 2014 and is based on an internally developed model which incorporates observable inputs including quoted spot rates, forward exchange rates and discounted future expected cash flows utilizing market interest rates with similar quality and maturity characteristics. We record the change in fair value of these foreign exchange forward contracts as part of currency gains (losses) within cost of sales in the consolidated statements of income (loss). The fair value of foreign exchange forward contracts are recorded in prepayments and other current assets or other current liabilities in the consolidated balance sheet.TENNECO INC.NOTES TO CONSOLIDATED FINANCIAL STATEMENTS — (Continued)February 2013,November 2015, the Financial Accounting Standards Board (“FASB”) issued an amendmentAccounting Standard Update 2015-17, Balance Sheet Classification of Deferred Taxes, which requires companies to the accounting guidance to improve the transparency of reporting amounts reclassified out of other comprehensive income. Other comprehensive income (loss) includes gainsclassify all deferred tax assets and losses that are initially excluded from net income for an accounting period. Those gains and losses are later reclassified out of accumulated other comprehensive income into net income. This amendment does not change the current requirements for reporting net income or other comprehensive income in the financial statements. All of the information that this amendment requires already is required to be disclosed elsewhere in the financial statements under United States Generally Accepted Accounting Principles (U.S. GAAP). This new amendment requires presentation eitherliabilities as noncurrent on the facebalance sheet instead of separating deferred taxes into current and noncurrent amounts. For public business entities, the statement where net income is presented or in the notes, the effects of significant amounts reclassified out of accumulated other comprehensive income, and that the reclassified amounts be cross-referenced to the other disclosures required under U.S. GAAP. This amendmentstandard is effective for reportingfinancial statements issued for annual periods beginning after December 15, 2012.2016, and interim periods within those annual periods. Early adoption is permitted for all companies in any interim or annual period. We adopted this standard as of December 31, 2015 and applied prospectively. Adoption of this guidance resulted in a reclassification of our net current deferred tax asset to the amendment will not have any impact onnet non-current deferred tax asset in our consolidated financial statements.July 2012,May 2015, the FASB issued an amendmentAccounting Standard Update (ASU) No. 2015-07, Disclosures for Investments in Certain Entities that Calculate Net Asset Value per Share (or Its Equivalent). ASU No. 2015-07 removes the requirement to categorize within the accounting guidancefair value hierarchy all investments for impairment test for indefinite-lived intangible assets by simplifying how an entity tests those assets for impairment and to improve consistency in impairment testing guidance among long-livedwhich fair value is measured using the net asset categories. The amendments permit an entity first to assess qualitative factors to determine whether it is more likely than not that an indefinite-lived intangible asset is impaired as a basis for determining whether it is necessary to performvalue per share practical expedient. Such investments should be disclosed separate from the quantitative impairment test in accordance withfair value hierarchy. For public business entities, the accounting guidance for goodwill for impairment. This amendmentstandard is effective for a reporting entity’s first interim or annual period beginning on or after September 15, 2012. The early adoption of this amendment on October 1, 2012 did not have any impact on our consolidated financial statements.In December 2011, the FASBstatements issued an amendment relating to the disclosure about offsetting assets and liabilities. This amendment requires disclosure to provide information to help reconcile differences in the offsetting requirements under U.S. GAAP and International Financial Reporting Standards (“IFRS”). A reporting entity will be required to disclose (1) the gross amount of recognized assets and liabilities, (2) the amounts offset to determine the net amounts presented in the statement of financial position, (3) the net amounts presented in the statement of financial position, (4) the amounts subject to an enforceable master netting arrangement or similar agreement not otherwise included in (2), and (5) the net amount after deducting the amounts in (4) and (3). This amendment is effective for a reporting entity’s interim and annual periods beginning on or after January 1, 2013. Following issuance of this amendment, considerable concerns were raised regarding the broad scope of this amendment. In response to the concerns, in January, 2013, the FASB issued a new amendment revising the scope of the disclosure requirements to apply only to derivatives, repurchase agreements and reverse repurchase agreements, and security borrowing and lending transactions subject to a master netting arrangement or similar agreement. As a result of this new amendment the disclosure about offsetting assets and liabilities will not have any impact to our consolidated financial statements.In September 2011, the FASB issued an amendment to the accounting guidance for testing goodwill for impairment. This amendment provides a reporting entity the option to first assess qualitative factors to determine whether the existence of events and circumstances leads to a determination that it is more likely than not that the fair value of a reporting unit is less than its carrying amount. If the reporting entity’s assessment after considering all events and circumstances is that it is not more likely than not that its fair value is less than its carrying amount, then performing the two-step impairment test is not required. If the reporting entity concludes that it is more likely than not that its fair value is less than its carrying amount then the first step of the two-step impairment test is required. If the carrying amount of the reporting unit exceeds its fair value, then the reporting unit is required to perform the second step of the goodwill impairment test to measure the amount of the impairment loss. This amendment is effective for annual and interim goodwill impairment tests performed for fiscal years beginning after December 15, 2011.2015, and interim periods within those fiscal years. The adoption of this guidance is not expected to have an impact on the Company's consolidated financial statements but will impact pension asset disclosure.January 1, 2012 for testing goodwill for impairment did not have any impact on our consolidated financial statements.issued an amendment to the accounting guidance for the presentation on comprehensive income which must be applied retrospectively for all periods presented. This amendment removes onehas approved a one-year deferral of the three presentation optionseffective date from January 1, 2017 to January 1, 2018, while allowing for presenting the componentsearly adoption as of other comprehensive income as part of the statement of changes in stockholders’ equity and requires either a single continuous statement of comprehensive income or a two statement approach and is effectiveJanuary 1, 2017 for fiscal years, and interim periods within those fiscal years, beginning after December 15, 2011. If a reporting entity elects the two statement approach,public entities. We will adopt this amendment requires consecutive presentation ofon January1, 2018. We are currently evaluating the statement of net income followed by the statement of other comprehensive income. In addition, this amendment requires an entity to present reclassification adjustments on the face of the financial statements from other comprehensive income to net income. On January 1, 2012, this amendment was adopted for the two statement approach in the presentation of comprehensive income and did not have anypotential impact on the other consolidated financial statements.In May 2011, the FASB issued an amendment to achieve common fair value measurement and disclosure requirements in U.S. GAAP and IFRS. The amendment (1) provides that the concepts of highest and best use and valuation premise in a fair value measurement are relevant only when measuring the fair value of nonfinancial assets, (2) provides specific requirements for measuring the fair value of an instrument classified in a reporting entity’s shareholders’ equity, (3) requires disclosure of quantitative information about unobservable inputs used in a fair value measurement that is categorized within Level 3 of the fair value hierarchy, (4) allows the use of a price, that would be received to sell a net asset position for a particular risk or to transfer a net liability position for a particular risk, in measuring the fair value of financial instruments that are managed within a portfolio, (5) provides that in the absence of a Level 1 input a reporting entity should apply premiums or discounts when market participants would do so when pricing an asset or liability and (6) requires additional disclosure about fair value measurements. This amendment is effective for a reporting entity’s interim and annual periods beginning after December 15, 2011. The adoption of this amendment for fair value measurements on January 1, 2012 did not have any impact on the measurement of our financial assets and liabilities. We added additional fair value disclosures, as required by this amendment, beginning with our first interim reporting period ending March 31, 2012.In April 2011, the FASB issued an amendment to the accountingnew guidance for transfers of financial assets which changes the criteria that must be met to achieve sales accounting. This amendment removes from the assessment of effective control the criterion relating to the transferor’s ability to repurchase or redeem financial assets on substantially the agreed terms, even in the event of default by the transferee. In addition, this amendment eliminates the requirement to demonstrate that the transferor possesses adequate collateral to fund substantially all the cost of purchasing replacement financial assets. This amendment is effective for a reporting entity’s first interim or annual period beginning on or after December 15, 2011. The adoption of this amendment to the accounting guidance for transfers of financial assets on January 1, 2012 did not have any impact on our consolidated financial statements.Brazil, China, India, Russia, South Africa, and Thailand. The net asset balance of our subsidiaries in the countries in which we operate that have such restrictions was $183$248 million and $137$218 million as of December 31, 20122015 and 2011,2014, respectively. These central banking restrictions do not have a significant effect on our ability to manage liquidity on a global basis.TENNECO INC.2.NOTES TO CONSOLIDATED FINANCIAL STATEMENTS — (Continued)Earnings Per Share2.Earnings Per Share Year Ended December 31, 2012 2011 2010 (Millions Except Share and Per Share Amounts) $ 275 $ 157 $ 39 59,985,677 59,884,139 59,208,103 $ 4.58 $ 2.62 $ 0.65 $ 275 $ 157 $ 39 59,985,677 59,884,139 59,208,103 140,609 168,539 441,561 957,224 1,467,482 1,349,030 61,083,510 61,520,160 60,998,694 $ 4.50 $ 2.55 $ 0.63 Year Ended December 31, 2015 2014 2013 (Millions Except Share and Per Share Amounts) Basic earnings per share — Net income attributable to Tenneco Inc. $ 247 $ 226 $ 183 Average shares of common stock outstanding 59,678,309 60,734,022 60,474,492 Earnings per average share of common stock $ 4.14 $ 3.72 $ 3.03 Diluted earnings per share — Net income attributable to Tenneco Inc. $ 247 $ 226 $ 183 Average shares of common stock outstanding 59,678,309 60,734,022 60,474,492 Effect of dilutive securities: Restricted stock 96,168 130,732 205,020 Stock options 418,673 917,754 914,550 Average shares of common stock outstanding including dilutive securities 60,193,150 61,782,508 61,594,062 Earnings per average share of common stock $ 4.11 $ 3.66 $ 2.97 521,249, 202,009175,216, 1,357 and 612,832205,104 shares of common stock were outstanding as of December 31, 2012, 20112015, 2014 and 2010,2013, respectively, but not included in the computation of diluted earnings per share, because the options were anti-dilutive.3.AcquisitionsAugust 2011,the fourth quarter of 2013, we purchased the remaining 25 percent equity interest in our emission control joint venture in Thailand for $4 million in cash. As a result of this purchase, our equity ownership of this joint venture investment changed to 100 percent from 75 percent.In January 2010, we purchased an additional 20 percent equity interest in our Tenneco Tongtai (Dalian) Exhaust System Co., Ltd. (TTEC) joint venture investment in China for $15$69 million in cash.cash through two transactions. The joint venture partner also received an additional amount of $9 million in lieu of receiving its pro-rata share of dividends owed from the joint venture. As a result of thisthe purchase, TTEC became a wholly owned indirect subsidiary of Tenneco.percentage of this joint venture investment increasedTenneco Fusheng (Chengdu) Automobile Parts Co., Ltd. changed to 8055 percent from 60100 percent. Year Ended December 31, 2015 2014 2013 (Millions) Net income attributable to Tenneco Inc. $ 247 $ 226 $ 183 Decrease in equity for purchase of noncontrolling equity interest — — (68 ) Net income attributable to Tenneco Inc. shareholders less purchase of noncontrolling equity interest 247 226 115 September 2012,November 2015, we purchasedclosed on the sale of certain rights from Combustion Components Associates, Inc. primarily pertainingassets related to emission control technology for stationary reciprocating engine applications for $7our Marzocchi mountain bike suspension product line to affiliates of Fox Factory Holding Corp.; and in December 2015, we closed on the sale of the Marzocchi motorcycle fork product line to an Italian company, VRM S.p.A. We recorded charges of $29 million in cash.4.Restructuring and Other Charges2010,2013, we incurred $19 million in restructuring and related costs, of which $14 million was recorded in cost of sales and $5 million was recorded in depreciation and amortization expense. In 2011, we incurred $8$78 million in restructuring and related costs, primarily related to headcount reductions in Europe and Australia and the closure of our ride control plant in Cozad, Nebraska, all of which was recorded inEuropean cost of sales. In 2012, we incurred $13 million in restructuring and related costs, primarily related to headcount reductions in South America andreduction efforts including non-cash asset write downs of $4$3 million, the costs to exit the distribution of aftermarket exhaust products and ending production of leaf springs in Europe,Australia, headcount reductions in various regions, and the net impact of freezing our defined benefit plans in the United Kingdom, of which $10$70 million was recorded in cost of sales, $6 million in SG&A, $1 million in engineering expense and $3$1 million in other expense. In 2014, we incurred $49 million in restructuring and related costs including non-cash charges of $5 million, primarily related to European cost reduction efforts, headcount reductions in Australia and South America, the sale of a closed facility in Cozad, Nebraska and costs related to organizational change, of which $28 million was recorded in cost of sales, $9 million in SG&A.TENNECO INC.NOTES TO CONSOLIDATED FINANCIAL STATEMENTS — (Continued) December 31,
2011
Restructuring
Reserve 2012
Expenses 2012
Cash
Payments December 31,
2012
Restructuring
Reserve (Millions) $ 1 9 (10 ) $ — December 31,
2014
Restructuring
Reserve 2015
Expenses 2015
Cash
Payments Impact of Exchange Rates December 31,
2015
Restructuring
Reserve (Millions) Employee Severance, Termination Benefits and Other Related Costs $ 40 53 (59 ) (4 ) $ 30 March 22, 2012,December 8, 2014, we are allowed to exclude $80up to $150 million in the aggregate of cash chargesall costs, expenses, fees, fines, penalties, judgments, legal settlements and expenses, before taxes,other amounts associated with any restructuring, litigation, claim, proceeding or investigation related to cost reduction initiativesor undertaken by us or any of our subsidiaries, together with any related provision for taxes, incurred after March 22, 2012 fromDecember 8, 2014 in the calculation of the financial covenant ratios required under our senior credit facility. As of December 31, 2012,2015, we havehad excluded $13$53 million in cumulativeof allowable charges relating to restructuring initiatives against the $80$150 million available under the terms of the senior credit facility.On September 22, 2009, we announced that we were closing our original equipment ride control plant in Cozad, Nebraska. The closure of the Cozad plant eliminated approximately 500 positions. We hired at other facilities as we moved production from Cozad to those facilities, which resulted in a net decrease of approximately 60 positions. Much of the production is being shifted from Cozad to our plant in Hartwell, Georgia.During the transition of production from our Cozad facility to our Hartwell facility, several customer programs, which were planned to phase out, were reinstatedvolumes increased beyond the amount in our original restructuring plan. To meet the higher volume requirements, we took a number of actions to stabilize the production environment in Hartwell including reinforcing several core processes, realigning assembly lines, upgrading equipment to increase output and accelerating our Lean manufacturing activities. Based on the higher volumes, we have adjusted our consolidation plan which included temporarily continuing some basic production operations in Cozad, and redirecting some programs from our Hartwell facility to our other North American facilities to better balance production. In August 2012, we completed the closure of our Cozad facility and transitioned all remaining production to other North American facilities. During 2009 and 2010, we recorded $11 million and $10 million, respectively, of restructuring and related expenses related to this initiative, of which approximately $16 million represented cash expenditures. In 2011, we recorded an additional cash charge of $2 million related to this initiative.On September 13, 2012, we announced our intention to close our aftermarket emission control plant in Vittaryd, Sweden. In 2012, we recorded non-cash charges of $4 million related to this initiative. We also recorded a $7 million non-cash impairment charge related to certain asset of our European ride control business in 2012.TENNECO INC.Financing ArrangementsNOTES TO CONSOLIDATED FINANCIAL STATEMENTS — (Continued)5.Long-Term Debt, Short-Term Debt, and Financing Arrangements20122015 and 2011,2014, is set forth in the following table: 2012 2011 (Millions) $ 92 $ 24 241 148 225 225 500 500 — 250 1 1 1 3 10 11 1,070 1,162 3 4 $ 1,067 $ 1,158 2015 2014 (Millions) Tenneco Inc. — Revolver borrowings due 2019, average effective interest rate 2.0% in 2015 $ 105 $ — Senior Tranche A Term Loan due 2016 through 2019, average effective interest rate 1.9% in 2015 285 300 5 3/8% Senior Notes due 2024 225 225 6 7/8% Senior Notes due 2020 500 500 Debentures due 2017 through 2025, average effective interest rate 7.5% in 2014 — 1 Other subsidiaries — Other Long Term Debt due in 2019, average interest rate 6.55% in 2015 and 5.45% in 2014 15 37 Notes due 2016 through 2026, average effective interest rate 0.1% in 2015 and 1.3% in 2014 7 8 1,137 1,071 Less — maturities classified as current 1 2 Total long-term debt $ 1,136 $ 1,069 and sinking fund requirements applicable to the long-term debt outstanding at December 31, 2012,2015, are $16$15 million, $23$24 million, $35$30 million, $48$338 million and $218$1 million for 2013, 2014,2016, 2017, 2018, 2019 and 2020, respectively.2016because we have the intent and 2017, respectively.20122015 and 20112014 is as follows: 2012 2011 (Millions) $ 3 $ 4 110 62 $ 113 $ 66 2015 2014 (Millions) Maturities classified as current $ 1 $ 2 Short-term borrowings 85 58 Total short-term debt $ 86 $ 60 Notes Payable(a) �� 2012 2011 (Dollars in Millions) $ 110 $ 62 5.3 % 6.0 % $ 156 $ 178 $ 123 $ 118 5.5 % 5.6 % Notes Payable(a) 2015 2014 (Dollars in Millions) Outstanding borrowings at end of year $ 85 $ 58 Weighted average interest rate on outstanding borrowings at end of year(b) 3.2 % 2.6 % Maximum month-end outstanding borrowings during year $ 178 $ 124 Average month-end outstanding borrowings during year $ 118 $ 107 Weighted average interest rate on average month-end outstanding borrowings during year(b) 3.0 % 4.0 % (a) Includes borrowings under both committed credit facilities and uncommitted lines of credit and similar arrangements. (b) This calculation does not include the commitment fees to be paid on the unused revolving credit facility balances which are recorded as interest expense for accounting purposes. Committed Credit Facilities(a) as of December 31, 2012 Term Commitments Borrowings Letters of
Credit(b) Available (Millions) 2017 850 92 48 710 2017 241 241 — — 2013-2026 135 120 — 15 $ 1,226 $ 453 $ 48 $ 725 Committed Credit Facilities(a) as of December 31, 2015 Term Commitments Borrowings Available (Millions) Tenneco Inc. revolving credit agreement 2019 $ 1,200 $ 105 $ — $ 1,095 Tenneco Inc. tranche A term facility 2019 285 285 — — Subsidiaries’ credit agreements 2016-2027 136 107 — 29 $ 1,621 $ 497 $ — $ 1,124 (a) We generally are required to pay commitment fees on the unused portion of the total commitment. (b) Letters of credit reduce the available borrowings under the revolving credit agreement. March 22, 2012,December 8, 2014, we completed an amendment and restatement of our senior credit facility by increasing the amountamounts and extending the maturity datedates of our revolving credit facility and adding a newour Tranche A Term Facility. The amended and restated facility replaces our former $556$850 million revolving credit facility $148and $213 million Tranche BA Term Facility and $130 million Tranche B-1 letter of credit/revolving loan facility.Facility. The proceeds from this refinancing transaction were used to repay our $148the $213 million Tranche BA Term Facility, and to fund the fees and expenses associated with the purchase and redemption of our $250$225 million 8 7 13/84 percent senior notes due in 2015.2018 and for general corporate purposes. As of December 31, 2012,2015, the senior credit facility provides us with a total revolving credit facility size of $850$1,200 million and a $241$300 million Tranche A Term Facility, both of which will mature on March 22, 2017.December 8, 2019. Funds may be borrowed, repaid and re-borrowed under the revolving credit facility without premium or penalty.penalty (subject to any customary LIBOR breakage fees). The revolving credit facility is reflected as debt on our balance sheet only if we borrow money under this facility or if we use the facility to make payments for letters of credit. Outstanding letters of credit reduce our availability to enter intoborrow revolving loans under the facility. We are required to make quarterly principal payments under the Tranche A Term Facility of $3.1$3.75 million from June 30, 2012 through March 31, 2014, $6.3 million beginning June 30, 2014TENNECO INC.NOTES TO CONSOLIDATED FINANCIAL STATEMENTS — (Continued)through March 31, 2015, $9.4 million beginning June 30, 2015 through March 31, 2016, $12.5 million beginning June 30, 2016 through December 31, 2016,$5.625 million beginning March 31, 2017 through December 31, 2017, $7.5 million beginning March 31, 2018 through September 30, 2019 and a final payment of $125$195 million is due on March 22, 2017.March 8, 2012,November 20, 2014, we announced a cash tender offer to purchase our outstanding $250$225 million 8 7 13/84 percent senior notes due in 20152018 and a solicitation of consents to certain proposed amendments to the indenture governing these notes. We$232$181 million aggregate principal amount of the notes and, on March 22, 2012,December 5, 2014, we purchased the tendered notes at a price of 104.44104.35 percent of the principal amount (which includes a consent payment of three percent of the principal amount), plus accrued and unpaid interest, and amended the related indenture. On April 6, 2012,December 22, 2014, we redeemed the remaining outstanding $18$44 million aggregate principal amount of senior notes that were not purchased pursuant to the tender offer at a price of 104.06103.88 percent of the principal amount, plus accrued and unpaid interest. The additional liquidity provided by the new $850$1,200 million revolving credit facility and the new $250$300 million Tranche A Term Facility was used in part to fund the total costfees and expenses of the tender offer and redemption, including all related fees and expenses.redemption.$17$13 million of pre-tax interest charges in March 2012December 2014 related to the refinancing of our senior credit facility, the repurchase and redemption of $232 million aggregate principal amount of our 87 1 3/84 percent senior notes due in 20152018 and the write-off of deferred debt issuance costs relating to these seniorthose notes. We recorded an additional $1 million of pre-tax charges during the second quarter of 2012 relating to the redemption of the remaining $18 million aggregate principal amount of our 8 1/8 percent senior notes which occurred in April 2012. During the first quarter of 2011, we recorded $1 million of pre-tax charges related to our repurchase and redemption of our 8 5/8 percent senior subordinated notes.2012,2015, of the $850$1,200 million available under the revolving credit facility, we had unused borrowing capacity of $710$1,095 million with $92$105 million in balance in outstanding borrowings and $48 millionzero in outstanding letters of credit. As of December 31, 2012,2015, our outstanding debt also included $241(i) $285 million of a term loan which consisted of a $283 million net carrying amount including a $2 million debt issuance cost related to our Tranche A Term Facility due March 22, 2017,which is subject to quarterly principal payments as described above through December 8, 2019, (ii) $225 million of 7notes which consisted of a $221 million net carrying amount including a $4 million debt issuance cost of 53/48 percent senior notes due AugustDecember 15, 2018,2024, (iii) $500 million of notes which consisted of a $494 million net carrying amount including a $6 million debt issuance cost of 67/8 percent senior notes due December 15, 2020, and $122(iv) $107 million of other debt.March 22, 2012,December 8, 2014, our Tranche A Term Facility and revolving credit facility bear interest at an annual rate equal to, at our option, either (i) London Interbank Offered Rate (“LIBOR”) plus a margin of 250175 basis points, or (ii) a rate consisting of the greater of (a) the JPMorgan Chase prime rate plus a margin of 15075 basis points, (b) the Federal Funds rate plus 50 basis points plus a margin of 15075 basis points, and (c) the Eurodollar Rateone month LIBOR plus 100 basis points plus a margin of 15075 basis points. The margin we pay on these borrowings will be increased by a total of 25 basis points above the original margin following each fiscal quarter for which our consolidated net leverage ratio is equal to or greater than 2.25 and less than 3.25, and will be increased by a total of 50 basis points above the original margin following each fiscal quarter for which our consolidated net leverage ratio is equal to or greater than 3.25. In addition, the margin we pay on these borrowings will be reduced by a total of 25 basis points below the original margin following each fiscal quarter for whichif our consolidated net leverage ratio is less than 1.50 or will be increased by a total of 25 basis points above the original margin if our consolidated net leverage ratio is greater than or equal to 2.50.1.25. We also pay a commitment fee equal to 30 basis points that will be reduced to 25 basis points or increased to up to 40 basis points.points depending on consolidated net leverage ratio changes as set forth in the senior credit facility.underin the senior credit facility agreement) at the end of each period indicated. Failure to maintain these ratios will result in a default under our senior credit facility. The financial ratios required under the amended and restated senior credit facility (or the predecessor facility, as applicable) and the actual ratios we achieved for the four quarters of 2012,2015, are as follows: Quarter Ended March 31,
2012 June 30,
2012 September 30,
2012 December 31,
2012 Req. Act. Req. Act. Req. Act. Req. Act. 3.50 2.07 3.50 2.05 3.50 1.96 3.50 1.69 2.55 5.82 2.55 6.40 2.55 7.18 2.55 7.73 Quarter Ended December 31,
2015September 30,
2015June 30,
2015March 31,
2015 Req. Act. Req. Act. Req. Act. Req. Act. Leverage Ratio (maximum) 3.50 1.32 3.50 1.51 3.50 1.36 3.50 1.41 Interest Coverage Ratio (minimum) 2.75 13.99 2.75 13.07 2.75 12.43 2.75 11.95 TENNECO INC.NOTES TO CONSOLIDATED FINANCIAL STATEMENTS — (Continued) financial ratios required under the senior credit facility for each quarter beyond December 31, 2012 includeincludes a maximum leverage ratio covenant of 3.50 and a minimum interest coverage ratio of 2.552.75 through December 31, 2013 and 2.75 thereafter.agreementagreement) or with the net cash proceeds of our common stock);stock in each case issued within 180 days prior to such repayment; (ii) with the net cash proceeds of the incremental facilities (as defined in the senior credit facility agreement); and certain indebtedness incurred by our foreign subsidiaries; (iii) with the net cash proceeds of the revolving loans (as defined in the senior credit facility agreement); (iv) with the cash generated by our operations; (v) in an amount equal to the net cash proceeds of qualified capital stock (as defined in the senior credit facility agreement) issued by us after March 22, 2012;December 8, 2014; and (vi) in exchange for Aggregate Senior
Note Maximum Amount (Millions) $ 20 $ 100 $ 200 no limit Pro forma Consolidated
Leverage RatioAggregate Senior
Note Maximum Amount (Millions) Greater than or equal to 3.0x $ 20 Greater than or equal to 2.5x $ 100 Greater than or equal to 2.0x $ 200 Less than 2.0x no limit 2012,2015, we were in compliance with all the financial covenants and operational restrictions of the senior credit facility. Our senior credit facility does not contain any terms that could accelerate payment of the facility or affect pricing under the facility as a result of a credit rating agency downgrade.2012,2015, our outstanding senior notes included $225 million of 75 3/48 percent senior notes due AugustDecember 15, 20182024 which consisted of $221 million net carrying amount including a $4 million debt issuance cost and $500 million of 6 7/8 percent senior notes due December 15, 2020.2020 which consisted of $494 million net carrying amount including a $6 million debt issuance cost. Under the indentures governing the notes, we are permitted to redeem some or all of the remaining senior notes at specified prices that decline to par over a specified period, at any time(a) on andor after AugustDecember 15, 20142019, in the case of the senior notes due 2018,2024, and (b) on or after December 15, 2015, in the case of the senior notes due 2020. In addition, prior to such dates the notes may also be redeemed at a price generally equal to 100 percent of theTENNECO INC.NOTES TO CONSOLIDATED FINANCIAL STATEMENTS — (Continued)noteholders.note holders. Further, the indentures governing the notes also permit us to redeem up to 35 percent of the senior notes due 2018, with the proceeds of certain equity offerings completed on or before August 15, 2013 and up to 35 percent of the senior notes due 2020,2024, with the proceeds of certain equity offerings completed on or before December 15, 2013.2017. If we sell certain of our assets or experience specified kinds of changes in control, we must offer to repurchase the notes due 20182024 and 2020 at 101 percent of the principal amount thereof plus accrued and unpaid interest.2012,2015, we were in compliance with the covenants and restrictions of these indentures.2012,2015, the North American program was amended and extended to March 22, 2013.April 30, 2017. The first priority facility continues to provideprovides financing of up to $110$130 million and the second priority facility, which is subordinated to the first priority facility, continues to provideprovides up to an additional $40$50 million of financing. Both facilities monetize accountsamendments to the North American program decreased the margin we pay to our banks. The amount of outstanding third-party investments in our securitized accounts receivable under the North American program was $50$30 million at December 31, 20122015 and zero at December 31, 2011.sevensix separate facilities provided by various financial institutions in each of the foreign jurisdictions. The commitments for these arrangements are generally for one year, but some may be cancelled with notice 90 days prior to renewal. In some instances, the arrangement provides for cancellation by the applicable financial institution at any time upon 15 days, or less, notification. The amount of outstanding third-party investments in our securitized accounts receivable in Europe was $94$174 million and $121$153 million at December 31, 20122015 and December 31, 2011,2014, respectively.TENNECO INC.NOTES TO CONSOLIDATED FINANCIAL STATEMENTS — (Continued)$3$2 million in interest expense for each of the years ended 20122015, 2014 and 2011, respectively,2013 relating to our North American securitization program. In addition, we recognized a loss of $4 million $5 million and $3 million for each of the years ended 2012, 20112015, 2014 and 2010,2013, on the sale of trade accounts receivable in our European accounts receivable securitization programs, representing the discount from book values at which these receivables were sold to our banks. The discount rate varies based on funding costs incurred by our banks, which averaged approximately threetwo percent three percentfor both years ended 2015 and four2014 and three percent for the yearsyear ended 2012, 2011 and 2010,2013, respectively.6.Financial Instruments20122015 and 20112014 were as follows: December 31, 2012 December 31, 2011 Carrying
Amount Fair
Value Carrying
Amount Fair
Value (Millions) $ 1,070 $ 1,136 $ 1,162 $ 1,200 1 1 1 1 December 31, 2015 December 31, 2014 Carrying
Amount Fair
Value Carrying
Amount Fair
Value (Millions) Long-term debt (including current maturities) $ 1,125 $ 1,160 $ 1,057 $ 1,106 Instruments with off-balance sheet risk: Foreign exchange forward contracts: Asset derivative contracts 1 1 — — $790$748 million and $1,013$759 million at December 31, 20122015 and December 31, 2011,2014, respectively. We haveremaining $334$390 million and $187$301 million as level 2 in the fair value hierarchy at December 31, 20122015 and December 31, 2011,2014, respectively, since we utilize valuation inputs that are observable both directly and indirectly. We classified the remaining $22 million and $46 million, consisting of foreign subsidiary debt, as level 3 in the fair value hierarchy at December 31, 2015, and December 31, 2014, respectively.Level 1 — Quoted prices in active markets for identical assets or liabilities. Level 2 — Inputs, other than quoted prices in active markets, that are observable either directly or indirectly. Level 3 — Unobservable inputs based on our own assumptions. TENNECO INC.NOTES TO CONSOLIDATED FINANCIAL STATEMENTS — (Continued)exchangecurrency forward contracts presented onwas a gross basis by derivative contractnet asset position of $1 million at December 31, 20122015 and 2011, respectively, was as follows: Fair Value of Derivative Instruments December 31, 2012 December 31, 2011 Asset
Derivatives Liability
Derivatives Total Asset
Derivatives Liability
Derivatives Total (Millions) $ 1 $ — $ 1 $ 1 $ — $ 1 The fair valuea net liability position of our recurring financial assets and liabilitiesless than $1 million at December 31, 2012 and 2011, respectively, are as follows: December 31, 2012 December 31, 2011 Level 1 Level 2 Level 3 Level 1 Level 2 Level 3 (Millions) n/a $ 1 n/a n/a $ 1 n/a The fair value hierarchy definition prioritizes the inputs used in measuring fair value into the following levels:Level 1—Quoted prices in active markets for identical assets or liabilities.Level 2—Inputs, other than quoted prices in active markets, that are observable either directly or indirectly.Level 3—Unobservable inputs based on our own assumptions.20122015 (all of which mature in 2013)2016): Notional Amount
in Foreign Currency (Millions) —Purchase 1 —Purchase 45 9European euro —Sell ( 5043) —Sell (2 ) European euro —Sell (16 ) Japanese Yenyen —Purchase 50 482—Sell ( 6661,153) —Purchase 80 184—Purchase 93 10—Sell ( 6071) Other—Purchase1—Sell(1) TENNECO INC.GuaranteesNOTES TO CONSOLIDATED FINANCIAL STATEMENTS — (Continued)Guarantees — We have from time to time issued guarantees for the performance of obligations by some of our subsidiaries, and some of our subsidiaries have guaranteed our debt. All of our existing and future material domestic wholly-owned subsidiaries fully and unconditionally guarantee our senior credit facility and our senior notes on a joint and several basis. The arrangement for the senior credit facility is also secured by first-priority liens on substantially all our domestic assets and pledges of up to 66 percent of the stock of certain first-tier foreign subsidiaries. No assets or capital stock secure our senior notes. For additional information, refer to Note 13 of the consolidated financial statements of Tenneco Inc., where we present the Supplemental Guarantor Condensed Consolidating Financial Statements.In March 2011, we entered intoAs a result of our decision to enter into these performance guarantee agreements, the levy due to the U.K. Pension Protection Fund was reduced. The Walker Plans are comprised of employees from Tenneco Walker (U.K.) Limited and our Futaba-Tenneco U.K. joint venture. Employer contributions are funded by both Tenneco Walker (U.K.) Limited, as the sponsoring employer and Futaba-Tenneco U.K., as arelatedthat is not attributable to other participating employers,Tenneco is approximately $17$7 million as of December 31, 20122015 which is determined by taking 105 percent of the liability of the Walker Plans calculated under section 179 of the U.K. Pension Act of 2004 offset by plan assets.assets multiplied by the ownership percentage in Futaba-Tenneco U.K. that is attributable to Futaba Industrial Co. Ltd. We did not record an additional liability in March 2011 for this performance guarantee since Tenneco Walker (U.K.) Limited, as the sponsoring employer of the Walker Plans, already recognizes 100 percent of the pension obligation calculated based on U.S. GAAP, for all of the Walker Plans’ participating employers on its balance sheet, which was $7$11 million and $13$17 million at December 31, 20122015 and December 31, 2011,2014, respectively. At December 31, 2012,2015, all pension contributions under the Walker Plans were current for all of the Walker Plans’ sponsoring and participating employers.20122015, the maximum amount reimbursable by Futaba to TMEL is approximately $3$7 million.2012,2015, we have guaranteed $48$32 million in letters of credit to support some of our subsidiaries’ insurance arrangements, foreign employee benefit programs, environmental remediation activities and cash management and capital requirements.Negotiable Financial Instruments — One of our European subsidiaries receives payment from one of its Original Equipment (OE) customers whereby the accounts receivable are satisfied through the delivery of negotiable financial instruments. We may collect these financial instruments before their maturity date by either selling them at a discount or using them to satisfy accounts receivable that have previously been sold to a European bank. Any of these financial instruments which are not sold are classified as other current assets. The amount of theseSuch financial instruments that was collected before their maturity date and sold at a discount totaled $6 million and $10 million at December 31, 2012 and December 31, 2011, respectively. No negotiable financial instruments were held by our European subsidiary totaled less than $1 million and $1 million as of December 31, 20122015 and December 31, 2011,2014, respectively.TENNECO INC.NOTES TO CONSOLIDATED FINANCIAL STATEMENTS — (Continued)OE customers andthrough the receipt of financial instruments on the date the customer payments are due. Several of our Chinese subsidiaries also satisfy vendor payments through the receipt and delivery of negotiable financial instruments.instruments on the date the payments are due. Financial instruments usedissued to satisfy vendor payables and not redeemed totaled $12$15 million and $14$24 million at December 31, 20122015 and December 31, 2011,2014, respectively, and were classified as notes payable. Financial instruments received from OE customers and not redeemed totaled $8 million and $9$17 million at December 31, 20122015 and December 31, 2011,2014, respectively. We classify financial instruments received from our OE customers as other current assets if issued by a financial institution of our customers or as customer notes and accounts, net if issued by our customer. We classified $8 million and $9$17 million in other current assets at December 31, 20122015 and December 31, 2011,2014, respectively. Some of our Chinese subsidiaries that issue their own negotiable financial instruments to pay vendors are required to maintain a cash balance if they exceed certain credit limits with the financial institution that guarantees those financial instruments. A restricted cash balance was not required at those Chinese subsidiaries at December 31, 2012 or December 31, 2011. negotiable financial instruments received by one of our European subsidiaries and some of our Chinese subsidiaries are checksdrafts drawn by our OE customers and guaranteed by their banks that are payable at a future date.date and, in some cases, are negotiable and/or are guaranteed by the banks of the customers. The use of these instruments for payment follows local commercial practice. Because negotiablecertain of such financial instruments are financial obligations of our customers and are guaranteed by our customers’ banks, we believe they represent a lower financial risk than the outstanding accounts receivable that they satisfy which are not guaranteed by a bank.7.Income Taxes Year Ended December 31, 2012 2011 2010 (Millions) $ 166 $ 55 $ (45 ) 157 216 177 $ 323 $ 271 $ 132 Year Ended December 31, 2015 2014 2013 (Millions) U.S. income before income taxes $ 198 $ 130 $ 150 Foreign income before income taxes 254 271 194 Income before income taxes and noncontrolling interests $ 452 $ 401 $ 344 Year Ended December 31, 2012 2011 2010 (Millions) $ — $ — $ — 4 2 1 89 91 64 93 93 65 (25 ) — — (20 ) — — (29 ) (5 ) 4 (74 ) (5 ) 4 $ 19 $ 88 $ 69 TENNECO INC.NOTES TO CONSOLIDATED FINANCIAL STATEMENTS — (Continued) Year Ended December 31, 2015 2014 2013 (Millions) Current — U.S. federal $ 64 $ 38 $ 25 State and local 5 3 4 Foreign 83 92 81 152 133 110 Deferred — U.S. federal (1 ) 2 (4 ) State and local 1 7 2 Foreign (3 ) (11 ) 14 (3 ) (2 ) 12 Income tax expense $ 149 $ 131 $ 122 Year Ended December 31, 2012 2011 2010 (Millions) $ 113 $ 95 $ 46 (21 ) (14 ) (16 ) 8 6 4 4 2 2 (91 ) (11 ) 16 (5 ) (4 ) (5 ) (1 ) (4 ) (2 ) 23 6 5 (5 ) — 4 (1 ) — (1 ) (6 ) 3 12 — 3 — 1 6 4 $ 19 $ 88 $ 69 Year Ended December 31, 2015 2014 2013 (Millions) Income tax expense computed at the statutory U.S. federal income tax rate $ 158 $ 140 $ 120 Increases (reductions) in income tax expense resulting from: Foreign income taxed at different rates (15 ) (21 ) (21 ) Taxes on repatriation of dividends 9 4 9 Remeasurement of estimated tax on unremitted earnings (4 ) — (17 ) State and local taxes on income, net of U.S. federal income tax benefit 11 8 6 Changes in valuation allowance for tax loss carryforwards and credits 13 12 27 Foreign tax holidays (7 ) (6 ) (5 ) Investment and R&D tax credits (26 ) (10 ) (8 ) Foreign earnings subject to U.S. federal income tax 3 7 5 Adjustment of prior years taxes 2 (2 ) (1 ) Impact of tax law changes — — (3 ) Tax contingencies 4 — 6 Other 1 (1 ) 4 Income tax expense $ 149 $ 131 $ 122 Year Ended December 31, 2012 2011 (Millions) $ — $ 41 23 45 63 57 51 45 50 54 87 79 1 3 6 6 119 98 (118 ) (225 ) 282 203 57 65 70 62 127 127 $ 155 $ 76 TENNECO INC.NOTES TO CONSOLIDATED FINANCIAL STATEMENTS — (Continued)U.S. and state Year Ended December 31, 2015 2014 (Millions) Deferred tax assets — Tax loss carryforwards: U.S. federal $ — $ — State 14 15 Foreign 72 75 Tax credit benefits 89 86 Postretirement benefits other than pensions 54 55 Pensions 50 56 Bad debts 2 2 Sales allowances 8 7 Payroll accruals 34 38 Other accruals 55 58 Valuation allowance (127 ) (139 ) Total deferred tax assets 251 253 Deferred tax liabilities — Tax over book depreciation 40 51 Total deferred tax liabilities 40 51 Net deferred tax assets $ 211 $ 202 20122015 and 20112014 by $47$3 million and $53$6 million, respectively. Year Ended December 31, 2012 2011 (Millions) $ 72 $ 40 116 92 (6 ) (5 ) (27 ) (51 ) $ 155 $ 76 Year Ended December 31, 2015 2014 (Millions) Balance Sheet: Current portion — deferred tax asset $ — $ 81 Non-current portion — deferred tax asset 218 143 Current portion — deferred tax liability — (4 ) Non-current portion — deferred tax liability (7 ) (18 ) Net deferred tax assets $ 211 $ 202 $118$127 million and $225$139 million at December 31, 20122015 and 2011,2014, respectively, we have potential tax assets that were not recognized on our balance sheet. These unrecognized tax assets resulted primarily from foreign tax loss carryforwards, foreign investment tax credits, foreign research and development credits and U.S. state net operating losses that are available to reduce future tax liabilities.$19$149 million, $88$131 million and $69$122 million in the years ended 2012, 20112015, 2014 and 2010,2013, respectively. The tax expense recorded in 20122015 includes a net tax benefit of $15 million primarily relating to prior year U.S. research and development tax credits, changes to uncertain tax positions, and prior year income tax adjustments. The tax expense recorded in 2014 includes a net tax benefit of $11 million for prior year tax adjustments primarily relating to changes to uncertain tax positions and prior year income tax estimates. The tax expense recorded in 2013 differs from the expense thatprimarily to the impact of the U.S. 2012 valuation allowance release described below and income generated in lower tax rate jurisdictions, partially offset by the impact of recording a valuation allowance against thea tax benefit for restructuring activities in Spain and Belgium and U.S. taxes on repatriation of dividends, partially offset by tax creditsadjustments related to recognizing a U.S. tax benefit for foreign taxes and lossesa favorable mix of income generated in certain foreignlow tax rate jurisdictions.evaluate our deferred income taxes quarterly to determine if valuation allowances are required or should be adjusted. U.S. GAAP requires that companies assess whether valuation allowances should be established against their deferred tax assets based on consideration of all available evidence, both positive and negative, using a “more likely than not” standard. This assessment considers, among other matters, the nature, frequency and amount of recent losses, the duration of statutory carryforward periods, and tax planning strategies. In making such judgments, significant weight is given to evidence that can be objectively verified.In 2008, given our historical losses in the U.S., we concluded that our ability tohave fully utilizeutilized our federal and state net operating loss carryforward (“NOL”("NOL") was limited. As a result, we recorded a valuation allowance against allas of our U.S. deferred tax assets except for our tax planning strategies which had not yet been implemented and which did not depend upon generating future taxable income. Prior to the reversal of the valuation allowance in the third quarter of 2012, we carried a deferred tax asset in the U.S. of $90 million relating to the expected utilization of the federal and state NOL. The recording of a valuation allowance did not impact the amount of the NOL that would be available for federal and state income tax purposes in future periods.In 2012, we reversed the tax valuation allowance against our net deferred tax assets in the U.S. based on operating improvements we had made, the outlook for light and commercial vehicle production in the U.S. and the positive impact this should have on our U.S. operations. The net income impact of the tax valuation allowance release in the U.S was a tax benefit of approximately $81 million. We now have a federal NOL at December 31, 2012 of $190 million, which expires beginning in tax years ending in 2022 through 2030.June 30, 2014. The state NOLs expire in various tax years through 2032.TENNECO INC.NOTES TO CONSOLIDATED FINANCIAL STATEMENTS — (Continued)Valuation allowances have been established in certain foreign jurisdictions for deferred tax assets based on a “more likely than not” threshold. The ability to realize deferred tax assets depends on our ability to generate sufficient taxable income within the carryforward periods provided for in the tax law for each tax jurisdiction. We have considered the following possible sources of taxable income when assessing the realization of our deferred tax assets:Future reversals of existing taxable temporary differences;Taxable income or loss, based on recent results, exclusive of reversing temporary differences and carryforwards;Tax-planning strategies; andTaxable income in prior carryback years if carryback is permitted under the relevant tax law.In 2012, after considering all available evidence and all possible sources of taxable income, we recorded a $19 million tax valuation allowance in Spain for tax credits that may not be utilized due to tax losses in Spain.The valuation allowances recorded against deferred tax assets generated by taxable losses in Spain and certain other foreign jurisdictions will impact our provision for income taxes until the valuation allowances are released. Our provision for income taxes will include no tax benefit for losses incurred and no tax expense with respect to income generated in these jurisdictions until the respective valuation allowance is eliminated.$728$731 million at December 31, 2012.2015. We estimated that the amount of U.S. and foreign income taxes that would be accrued or paid upon remittance of the assets that represent those unremitted earnings was $239$150 million. The estimated U.S. and foreign income taxes on unremitted earnings may be impacted in the future if we are ableunable to claim a U.S. foreign tax credit.We have tax sharing agreements with our former affiliates that allocate tax liabilities for periods prior to year 2000 and establish indemnity rights on certain tax issues. 2012 2011 2010 (Millions) $ 119 $ 111 $ 96 �� 13 19 23 1 3 4 (12 ) (10 ) (6 ) (5 ) — (2 ) (9 ) (4 ) (4 ) $ 107 $ 119 $ 111 2015 2014 2013 (Millions) Uncertain tax positions — Balance January 1 $ 114 $ 115 $ 107 Gross increases in tax positions in current period 7 8 15 Gross increases in tax positions in prior period 14 5 — Gross decreases in tax positions in prior period (4 ) (5 ) (1 ) Gross decreases — settlements (1 ) (2 ) — Gross decreases — statute of limitations expired (7 ) (7 ) (6 ) Balance December 31 $ 123 $ 114 $ 115 2012 and $362014, $107 million at both December 31, 2011 and 2010,in 2013, of tax benefits, that if recognized, would affect the effective tax rate. We recognizeTENNECO INC.NOTES TO CONSOLIDATED FINANCIAL STATEMENTS — (Continued)2012, 20112015, 2014 and 2010.2013. Additionally, we accrued interest income related to uncertain tax positions of less than $12012,both 2015 and 2014, and interest expense of $2 million in 2011, and less than $1 million in 2010.2013. Our liability for penalties was $3 million at 2012, $2 million at December 31, 2011 and2015, $3 million at December 31, 2010,2014 and $2 million at December 31, 2013, respectively, and our liability for interest was $5$6 million, $7$6 million, and $5$7 million at December 31, 2012, 20112015, 2014 and 2010,2013, respectively.20122015 and 20112014 included exposures relating to the disallowance of deductions, global transfer pricing and various other issues. We believe it is reasonably possible that a decrease of up to $27$10 million in unrecognized tax benefits related to the expiration of foreign statute of limitations and the conclusion of income tax examinations may occur within the coming year.2012,2015, our tax years open to examination in primary jurisdictions are as follows: Open To Tax
Year — due to NOL19982000 20022005 2003 Canada 2012 20072010 Canada20072010 Mexico20072013 Belgium20102013 Germany201020112013 8.Common Stock($($0.01 par value) of common stock, of which 62,789,38265,067,132 shares and 62,101,33564,454,248 shares were issued at December 31, 20122015 and 2011,2014, respectively. We held 2,294,6927,473,325 and 1,694,6923,244,692 shares of treasury stock at December 31, 20122015 and 2011,2014, respectively.million.million. Each share underlying an award generally counts as one share against the total plan availability. Eachavailability under the 2009 amendment, each share underlying a full value award (e.g. restricted stock), however, counts as 1.25 shares against the total plan availability. On May 15, 2013 our stockholders approved another amendment to the Tenneco Inc. 2006 Long-Term Incentive Plan to increase the shares of common stock available thereunder by 3.5 million. As part of this amendment, each share underlying a full value award subsequently issued counts as 1.49 shares against total plan availability. As ofTENNECO INC.NOTES TO CONSOLIDATED FINANCIAL STATEMENTS — (Continued)2012,2015, up to 1,036,8833,042,433 shares of our common stock remain authorized for delivery under the 2006 Long-Term Incentive Plan. Our nonqualified stock options have seven to 20 year terms and vest equally over a three-year service period from the date of the grant.2012,2015, the long-term performance units outstanding included a three-year grant for 2010-20122013-2015 payable in the first quarter of 2013,2016, a three-year grant for 2011-20132014-2016 payable in the first quarter of 2014,2017 and a three-year grant for 2012-20142015-2017 payable in the first quarter of 2015.2018. Payment is based on the attainment of specified performance goals. Grant value is based on stock price, cumulative EBITDA and free cashflowcash flow metrics. In addition, we have granted SARs to certain key employees in our Asian and Indian operations that are payable in cash after a three-year service period. The grant value is indexed to the stock price.$5taxes) of $2 million,$3 million, and $6 million in the year ended December 31, 2012 and $3 million in each of the two years ended December 31, 20112015, 2014 and 2010,2013, respectively, related to nonqualified stock options as part of our selling, general and administrative expense. This resulted in a $0.09$0.03 decrease in basic and diluted earnings per share in 2015, a $0.06 decrease in basic and diluted earnings per share in 2014, and a $0.10 decrease in basic and a $0.08$0.09 decrease in diluted earnings per share in 2012, and a $0.05 decrease in both basic and diluted earnings per share in 2011 and 2010.2013.2012,2015, there was approximately $5$2 million of unrecognized compensation costs related to our stock options awards that we expect to recognize over a weighted average period of 1.00.3 years.$16$12 million, $11$13 million, and $14$17 million for each of the years ended 2012, 20112015, 2014 and 2010,2013, respectively, and was recorded in selling, general, and administrative expense on the consolidated statements of income.$7$4 million in 2012,2015, $10 million in 2014, and $6$15 million in both 2011 and 2010.2013. Stock option exercises would have generated an excess tax benefit of $4$6 million in each of 2012, 20112015, $12 million in 2014 and 2010.$6 million in 2013. We did notstarted to record the excessthis tax benefit asin the third quarter of 2013 when we havebegan utilizing our federal and state net operating lossesNOLs. We recorded a tax benefit of $26 million in 2014, of which are not currently being utilized. Year Ended December 31, 2012 2011 2010 $ 17.35 $ 26.13 $ 11.76 73.5 % 70.1 % 75.4 % 4.7 4.8 4.6 0.8 % 1.8 % 2.2 % 0.00 % 0.00 % 0.00 % TENNECO INC.NOTES TO CONSOLIDATED FINANCIAL STATEMENTS — (Continued) 2015 2014 2013 Stock Options Granted: Weighted average grant date fair value, per share $ — $ 26.46 $ 19.84 Weighted average assumptions used: Expected volatility — % 52.8 % 66.4 % Expected lives 0.0 5.0 4.9 Risk-free interest rates — % 1.7 % 0.8 % Dividends yields — % — % — % Year Ended December 31, 2012 Shares
Under
Option Weighted Avg.
Exercise
Prices Weighted Avg.
Remaining
Life in Years Aggregate
Intrinsic
Value (Millions) 2,743,199 $ 17.43 4.0 $ 37 316,799 29.83 (22,840 ) 16.00 (15,206 ) 16.68 (104,742 ) 13.99 2 2,917,210 $ 18.92 4.2 $ 51 8,729 38.52 (4,417 ) 32.03 (10,274 ) 5.56 — 2,911,248 $ 19.00 4.0 $ 36 202 28.76 (15,602 ) 25.54 (117,242 ) 12.75 2 2,778,606 $ 19.23 3.9 $ 31 — — (5,100 ) 8.93 (5,406 ) 20.23 (320,625 ) 12.19 6 2,447,475 $ 20.14 4.1 $ 29 Year Ended December 31, 2015 Shares
Under
Option Weighted Avg.
Exercise
Prices Weighted Avg.
Remaining
Life in Years Aggregate
Intrinsic
Value (Millions) Outstanding Stock Options: Outstanding, January 1, 2015 1,454,003 $ 31.16 4.4 $ 33 Canceled (20,427 ) 23.75 Exercised (96,997 ) 20.78 3 Outstanding, March 31, 2015 1,336,579 $ 32.03 4.3 $ 31 Forfeited (7,531 ) 47.36 Exercised (141,644 ) 14.68 6 Outstanding, June 30, 2015 1,187,404 $ 34.00 4.2 $ 30 Exercised (749 ) 19.48 — Outstanding, September 30, 2015 1,186,655 $ 33.99 3.9 $ 19 Forfeited (5,066 ) 39.81 Exercised (36,870 ) 11.49 1 Outstanding, December 31, 2015 1,144,719 $ 34.69 3.7 $ 19 2012, 20112014 and 20102013 was $17.49, $26.11$26.48 and $11.84,$19.91, respectively. There were no stock options granted in 2015. The total intrinsic value of options exercised during the years ended December 31, 2012, 2011,2015, 2014, and 20102013 was $10 million, $13$30 million and $10$19 million, respectively. The total fair value of shares vested was $4 million in 2012, and $3$6 million in both 20112015 and 2010. Year Ended
December 31, 2012 Shares Weighted Avg.
Grant Date
Fair Value 407,751 $ 22.64 217,225 29.83 (246,314 ) 15.74 (2,378 ) 9.71 376,284 $ 31.39 5,974 38.52 (7,126 ) 24.32 (2,491 ) 31.79 372,641 $ 31.64 125 28.76 (20,660 ) 30.63 (3,161 ) 32.12 348,945 $ 31.69 — — (27 ) 33.34 — — 348,918 $ 31.69 Year Ended December 31, 2015 Shares Weighted Avg.
Grant Date
Fair ValueNonvested Restricted Shares Nonvested balance at January 1, 2015 286,051 $ 42.35 Granted 350,101 53.40 Vested (150,171 ) 37.86 Nonvested balance at March 31, 2015 485,981 $ 51.70 Granted 17,164 56.06 Vested (13,008 ) 46.37 Forfeited (11,034 ) 48.85 Nonvested balance at June 30, 2015 479,103 $ 52.07 Granted 7,824 57.98 Vested (14,948 ) 49.98 Nonvested balance at September 30, 2015 471,979 $ 52.15 Granted 32,264 44.24 Vested (1,427 ) 35.62 Forfeited (5,974 ) 54.76 Nonvested balance at December 31, 2015 496,842 $ 51.65 2012,2015, approximately $5$15 million of total unrecognized compensation costs related to restricted stock awards is expected to be recognized over a weighted-average period of approximately 1.92.4 years.2012, 20112015, 2014 and 20102013 was $30.06, $45.38,$52.85, $55.26, and $19.60,$36.40, respectively. The total fair value of restricted shares vested was $5$7 million in 2012, $32015, $8 million in 20112014 and $2$6 million in 2010.In May 2011, our Board of Directors approved a share repurchase program, authorizing us to repurchase up to 400,000 shares of our outstanding common stock over a 12 month period. This share repurchase program was intended to offset dilution from shares of restricted stock and stock options issued in 2011 to employees. We purchased all of the 400,000 shares through open market purchases, which were funded through cash from operations, as of August 3, 2011 at a total cost of $16 million through this program. These repurchased shares are held as part of our treasury stock which increased to 1,694,692 shares at December 31, 2011 from 1,294,692 shares at December 31, 2010.In January 2012, our Board of Directors approved a share repurchase program, authorizing us to repurchase up to 600,000 shares of our outstanding common stock over a 12 month period. This share repurchase program was intended to offset dilution from shares of restricted stock and stock options issued in 2012 to employees. We purchased all of the 600,000 shares during the second quarter of 2012 through open marketTENNECO INC.NOTES TO CONSOLIDATED FINANCIAL STATEMENTS — (Continued)purchases, which were funded through cash from operations, at a total cost of $18 million, at an average price of $29.22 per share. These repurchased shares are held as part of our treasury stock which increased to 2,294,692 shares at December 31, 2012 from 1,694,692 shares at December 31, 2011.2012, $72015, $14 million of total unrecognized compensation costs is expected to be recognized over a weighted-average period of approximately 1.8 years.9.Preferred Stock($($0.01 par value) authorized at December 31, 20122015 and 2011,2014, respectively. No shares of preferred stock were outstanding at those dates.10.Pension Plans, Postretirement and Other Employee Benefits$892$841 million benefit obligation at December 31, 2012,2015, approximately $807$770 million required funding under applicable federal and foreign laws. At December 31, 2012, we had approximately $607 million in assets to fund that obligation. The balance of our benefit obligation, $85$71 million, did not require funding under applicable federal or foreign laws and regulations. At December 31, 2015, we had approximately $657 million in assets to fund that obligation. Pension plan assets were invested in the following classes of securities: Percentage of Fair Market Value December 31,
2012 December 31,
2011 US Foreign US Foreign 70 % 59 % 70 % 53 % 30 % 33 % 29 % 40 % — 2 % — 2 % — 6 % 1 % 5 % Percentage of Fair Market Value December 31, 2015 December 31, 2014 US Foreign US Foreign Equity Securities 51 % 61 % 70 % 60 % Debt Securities 49 % 30 % 30 % 32 % Real Estate — 2 % — 4 % Other — 7 % — % 4 % TENNECO INC.NOTES TO CONSOLIDATED FINANCIAL STATEMENTS — (Continued)20122015 and 2011,2014, respectively. The fair value hierarchy has three levels based on the methods used to determine the fair value. Level 1 assets refer to those asset values based on quoted market prices in active markets for identical assets at the measurement date. Level 2 assets refer to assets with values determined using significant other observable inputs, and Level 3 assets include values determined with non-observable inputs. Fair Value Level as of December 31, 2012 US Foreign Level 1 Level 2 Level 3 Level 1 Level 2 Level 3 (Millions) $ 29 $ 117 $ — $ 26 $ 15 $ — — — — 2 5 — — 20 — — — — — — — 48 63 — — 20 — 13 16 — — — — 1 4 — — 7 — 2 1 — — 4 — — — — — 78 — — — — — — — 36 24 — — — — 18 24 — — — — — 3 — — — — 1 — — — — — — 3 — — — — 1 — — — — — 1 5 — — — — — 8 8 — — — 4 — — $ 29 $ 246 $ — $ 153 $ 171 $ 8 Fair Value Level as of December 31, 2011 US Foreign Level 1 Level 2 Level 3 Level 1 Level 2 Level 3 (Millions) $ 24 $ 102 $ — $ 23 $ 9 $ — — — — — 2 — — 18 — — 1 — — — — 26 63 — — 17 — 3 19 — — — — — 5 — — 5 — 1 — — — 4 — — — — — 67 — — — — — — — 37 35 — — — — 17 20 — — — — — 3 — — — — 1 — — — — — — 3 — — — — — 1 — — — — — 5 — — — — — 7 6 2 — — 3 — — $ 26 $ 213 $ — $ 111 $ 173 $ 6 Fair Value Level as of December 31, 2015 US Foreign Asset Category Level 1 Level 2 Level 3 Level 1 Level 2 Level 3 (Millions) Equity securities: U.S. large cap $ 33 $ 63 $ — $ 28 $ 24 $ — U.S. mid cap — 8 — 3 5 — U.S. Small Cap — 15 — — — — Non-U.S. large cap — — — 46 66 — Non-U.S. mid cap — 25 — 16 15 — Non-U.S. small cap — — — — 3 — Emerging markets — 8 — 2 4 — Debt securities: U.S. corporate bonds — 35 — — 3 — U.S. other fixed income — 113 — — — — Non-U.S. treasuries/government bonds — — — 29 28 — Non-U.S. corporate bonds — — — 18 21 — Non-U.S. mortgage backed securities — — — — 3 — Non-U.S. municipal obligations — — — 1 — — Non-U.S. asset backed securities — — — — 2 — Non-U.S. other fixed income — — — 2 — — Real Estate: Non-U.S. real estate — — — 1 6 — Other: Insurance contracts — — — — 12 8 Cash held in bank accounts 2 — — 11 — — Total $ 35 $ 267 $ — $ 157 $ 192 $ 8 Fair Value Level as of December 31, 2014 US Foreign Asset Category Level 1 Level 2 Level 3 Level 1 Level 2 Level 3 (Millions) Equity securities: U.S. large cap $ 41 $ 134 $ — $ 31 $ 25 $ — U.S. mid cap — — — 4 5 — U.S. Small Cap — 25 — — — — Non-U.S. large cap — — — 57 68 — Non-U.S. mid cap — 24 — 20 16 — Non-U.S. small cap — — — 1 6 — Emerging markets — 8 — — 3 — Debt securities: U.S. corporate bonds — 5 — — 5 — U.S. other fixed income — 95 — — — — Non-U.S. treasuries/government bonds — — — 41 27 — Non-U.S. corporate bonds — — — 20 27 — Non-U.S. mortgage backed securities — — — — 2 — Non-U.S. municipal obligations — — — 1 — — Non-U.S. asset backed securities — — — — — — Non-U.S. other fixed income — — — 1 — — Real Estate: Non-U.S. real estate — — — — 6 — Other: Insurance contracts — — — — 13 9 Cash held in bank accounts 2 — — 4 — — Total $ 43 $ 291 $ — $ 180 $ 203 $ 9 TENNECO INC.NOTES TO CONSOLIDATED FINANCIAL STATEMENTS — (Continued) December 31,
2012 December 31,
2011 Level 3 Assets Level 3 Assets US Foreign US Foreign (Millions) (Millions) $ — $ 6 $ — $ 6 — 2 — — $ — $ 8 $ — $ 6 December 31, 2015 December 31, 2014 Level 3 Assets Level 3 Assets US Foreign US Foreign (Millions) (Millions) Balance at December 31 of the previous year $ — $ 9 $ — $ 8 Actual return on plan assets: Relating to assets still held at the reporting date — (1 ) — 1 Ending Balance at December 31 $ — $ 8 $ — $ 9 Fair Value Level Value Percentage of
Total Assets (Millions) 1 $ 29 4.7 % 1 $ 24 4.6 % Asset Category Fair Value Level Value Percentage of
Total Assets (Millions) 2015: Tenneco Stock 1 $ 33 5.0 % 2014: Tenneco Stock 1 $ 41 5.6 % Pension Postretirement 2012 2011 2012 2011 US Foreign US Foreign US US (Millions) $ 414 $ 370 $ 354 $ 361 $ 140 $ 135 — 13 — (6 ) — — — (4 ) — (4 ) — — 1 7 1 6 — 1 20 18 20 19 6 7 — (1 ) — (1 ) — — — — — — — — 44 42 56 8 (6 ) 5 (18 ) (16 ) (17 ) (15 ) (9 ) (8 ) — 2 — 2 — — $ 461 $ 431 $ 414 $ 370 $ 131 $ 140 $ 239 $ 290 $ 242 $ 287 $ — $ — — 11 — (4 ) — — — (4 ) — (4 ) — — 28 27 (7 ) — — — 26 22 21 24 10 9 — — — — (1 ) (1 ) — 2 — 2 — — (18 ) (16 ) (17 ) (15 ) (9 ) (8 ) $ 275 $ 332 $ 239 $ 290 $ — $ — $ (186 ) $ (99 ) $ (175 ) $ (80 ) $ (131 ) $ (140 ) 278 168 248 138 52 64 1 8 1 9 (22 ) (29 ) $ 93 $ 77 $ 74 $ 67 $ (101 ) $ (105 ) (3 ) (2 ) (3 ) (2 ) (8 ) (9 ) (183 ) (97 ) (172 ) (78 ) (123 ) (131 ) $ (186 ) $ (99 ) $ (175 ) $ (80 ) $ (131 ) $ (140 ) Pension Postretirement 2015 2014 2015 2014 US Foreign US Foreign US US (Millions) Change in benefit obligation: Benefit obligation at December 31 of the previous year $ 448 $ 483 $ 421 $ 442 $ 143 $ 112 Currency rate conversion — (46 ) — (41 ) — — Settlement (8 ) (2 ) (53 ) — — — Service cost 1 9 1 8 — — Interest cost 18 15 20 18 6 6 Administrative expenses/taxes paid — (2 ) — (2 ) — — Plan amendments — 2 — — — — Actuarial (gain)/loss (21 ) (17 ) 77 73 1 18 Prior period correction — — — — — 15 Benefits paid (22 ) (18 ) (18 ) (17 ) (9 ) (8 ) Participants’ contributions — 1 — 2 — — Benefit obligation at December 31 $ 416 $ 425 $ 448 $ 483 $ 141 $ 143 Change in plan assets: Fair value at December 31 of the previous year $ 334 $ 392 $ 347 $ 379 $ — $ — Currency rate conversion — (38 ) — (32 ) — — Settlement (8 ) (2 ) (41 ) — — — Actual return on plan assets (11 ) 8 23 40 — — Administrative expenses/taxes paid — (2 ) — (2 ) — — Employer contributions 9 16 23 22 9 8 Participants’ contributions — 1 — 2 — — Benefits paid (22 ) (18 ) (18 ) (17 ) (9 ) (8 ) Fair value at December 31 $ 302 $ 357 $ 334 $ 392 $ — $ — Development of net amount recognized: Unfunded status at December 31 $ (114 ) $ (68 ) $ (115 ) $ (90 ) $ (141 ) $ (143 ) Unrecognized cost: Actuarial loss 232 144 230 172 49 53 Prior service cost/(credit) — 5 1 5 (6 ) (10 ) Net amount recognized at December 31 $ 118 $ 81 $ 116 $ 87 $ (98 ) $ (100 ) Amounts recognized in the balance sheets as of December 31 Noncurrent assets $ — $ 6 $ — $ 8 $ — $ — Current liabilities (2 ) (3 ) (10 ) (3 ) (9 ) (9 ) Noncurrent liabilities (112 ) (71 ) (105 ) (95 ) (132 ) (134 ) Net amount recognized $ (114 ) $ (68 ) $ (115 ) $ (90 ) $ (141 ) $ (143 ) 2012, 20112015, 2014 and 2010,2013, consist of the following components: 2012 2011 2010 US Foreign US Foreign US Foreign (Millions) $ 1 $ 7 $ 1 $ 6 $ 1 $ 5 20 18 20 19 20 19 (22 ) (20 ) (23 ) (20 ) (21 ) (19 ) — — — — — — — 1 — 1 6 — 7 7 4 5 3 3 — 2 — 2 — 2 $ 6 $ 15 $ 2 $ 13 $ 9 $ 10 2015 2014 2013 US Foreign US Foreign US Foreign (Millions) Service cost — benefits earned during the year $ 1 $ 9 $ 1 $ 8 $ 1 $ 9 Interest cost 17 15 20 18 19 17 Expected return on plan assets (23 ) (21 ) (25 ) (23 ) (22 ) (20 ) Curtailment loss — — — — — — Settlement loss 4 — 21 — — 1 Net amortization: Actuarial loss 8 8 7 7 9 10 Prior service cost — 1 — 2 — 1 Net pension costs $ 7 $ 12 $ 24 $ 12 $ 7 $ 18 2012 2011 US Foreign US Foreign (Millions) $ 278 $ 168 $ 248 $ 138 1 8 1 9 $ 279 $ 176 $ 249 $ 147 2015 2014 US Foreign US Foreign (Millions) Net actuarial loss $ 232 $ 144 $ 230 $ 172 Prior service cost — 5 1 5 $ 232 $ 149 $ 231 $ 177 20122015 and 20112014 include the following components: Year Ended December 31, 2012 2011 Before-Tax
Amount Tax
Benefit Net-of-Tax
Amount Before-Tax
Amount Tax
Benefit Net-of-Tax
Amount (Millions) $ (66 ) $ 22 $ (44 ) $ (118 ) $ 7 $ (111 ) (4 ) 2 (2 ) (4 ) — (4 ) 20 (6 ) 14 14 (1 ) 13 $ (50 ) $ 18 $ (32 ) $ (108 ) $ 6 $ (102 ) TENNECO INC.NOTES TO CONSOLIDATED FINANCIAL STATEMENTS — (Continued) Year Ended December 31, 2015 2014 Before-Tax
Amount Tax
Benefit Net-of-Tax
Amount Before-Tax
Amount Tax
Benefit Net-of-Tax
Amount (Millions) Defined benefit pension and postretirement plans: Change in total actuarial gain (loss) $ (7 ) $ 2 $ (5 ) $ (124 ) $ 35 $ (89 ) Amortization of prior service cost included in net periodic pension and postretirement cost (3 ) — (3 ) (5 ) 1 (4 ) Amortization of actuarial gain (loss) included in net periodic pension and postretirement cost 23 (4 ) 19 18 (5 ) 13 Other comprehensive income — pension benefits $ 13 $ (2 ) $ 11 $ (111 ) $ 31 $ (80 ) 2013,2016, we expect to recognize the following amounts, which are currently reflected in accumulated other comprehensive loss, as components of net periodic benefit cost: 2013 US Foreign (Millions) $ 9 $ 11 — 1 $ 9 $ 12 2016 US Foreign (Millions) Net actuarial loss $ 7 $ 7 Prior service cost — 1 $ 7 $ 8 20122015 and 20112014 were as follows: December 31,
2012 December 31,
2011 US Foreign US Foreign (Millions) $ 461 $ 400 $ 414 $ 363 461 389 414 355 275 301 239 284 December 31, 2015 December 31, 2014 US Foreign US Foreign (Millions) Projected benefit obligation $ 416 $ 337 $ 448 $ 349 Accumulated benefit obligation 416 332 448 344 Fair value of plan assets 302 262 334 253 US Foreign (Millions) $ 20 $ 17 23 16 21 18 21 20 28 20 128 115 Year US Foreign (Millions) 2016 $ 22 $ 17 2017 30 16 2018 22 17 2019 24 20 2020 24 20 2021-2025 120 102 2012, 2011,2015, 2014, and 2010: 2012 2011 US Foreign US Foreign 4.1 % 4.2 % 4.8 % 4.9 % N/A 3.4 % N/A 3.5 % 2012 2011 2010 US Foreign US Foreign US Foreign 4.8 % 4.9 % 5.6 % 5.4 % 6.1 % 6.0 % 8.3 % 6.3 % 8.3 % 6.4 % 8.3 % 6.9 % N/A 3.5 % N/A 3.5 % N/A 3.5 % TENNECO INC.NOTES TO CONSOLIDATED FINANCIAL STATEMENTS — (Continued) 2015 2014 US Foreign US Foreign Weighted-average assumptions used to determine benefit obligations Discount rate 4.4 % 3.5 % 4.1 % 3.3 % Rate of compensation increase N/A 2.7 % N/A 3.4 % 2015 2014 2013 US Foreign US Foreign US Foreign Weighted-average assumptions used to determine net periodic benefit cost Discount rate 4.1 % 3.2 % 4.8 % 4.3 % 4.1 % 4.2 % Expected long-term return on plan assets 7.8 % 5.9 % 7.8 % 6.1 % 7.8 % 6.2 % Rate of compensation increase N/A 3.0 % N/A 3.3 % N/A 3.4 % $48$25 million to our pension plans during 2012.2015. Based on current actuarial estimates, we believe we will be required to make contributions of $59$15 million to those plans during 2013.2016. Pension contributions beyond 20132016 will be required, but those amounts will vary based upon many factors, including the performance of our pension fund investments during 20132016 and future discount rate changes.us after attaining age 45.us. For hourly employees, the postretirement benefit plans generally cover employees who retire according to one of our hourly employee retirement plans. All of these benefits may be subject to deductibles, co-payment provisions and other limitations, and we have reserved the right to change these benefits. For those employees hired after January 1, 2001, we do not provide any postretirement benefits. Our postretirement healthcare and life insurance plans are not funded. The measurement date used to determine postretirement benefit obligations is December 31.2012, 2011,2015, 2014, and 2010,2013, consists of the following components: 2012 2011 2010 (Millions) $ 1 $ 1 $ 1 6 7 8 5 4 4 (6 ) (6 ) (6 ) $ 6 $ 6 $ 7 2015 2014 2013 (Millions) Service cost — benefits earned during the year $ — $ — $ — Interest on accumulated postretirement benefit obligation 6 6 5 Net amortization: Actuarial loss 6 4 4 Prior service credit (4 ) (7 ) (6 ) Prior period correction — $ 9 $ — Net periodic postretirement benefit cost $ 8 $ 12 $ 3 2013,the fourth quarter of 2014, we recorded an $11 million adjustment to our postretirement medical expense as a result of approximately 170 retirees who were entitled to benefits but had not been included in the prior year calculations of net periodic postretirement benefit cost. 2013 (Millions) $ 4 (6 ) $ (2 ) 2016 (Millions) Net actuarial loss $ 5 Prior service credit (2 ) $ 3 Postretirement
Benefits (Millions) $ 9 9 9 9 9 42 Year Postretirement
Benefits (Millions) 2016 $ 9 2017 9 2018 9 2019 9 2020 9 2021-2025 44 TENNECO INC.NOTES TO CONSOLIDATED FINANCIAL STATEMENTS — (Continued)20122015 accumulated postretirement benefit obligation was 7.57.0 percent, declining to 4.5 percent by 2019.2026. For 2011,2014, the health care cost trend rate was 8.06.5 percent declining to 4.5 percent by 2019 and for 2010,2013, the health care cost trend rate was 7.57.0 percent declining to 5.04.5 percent by 2014.2012, 20112015, 2014 and 2010: 2012 2011 4.1 % 4.8 % N/A N/A 2012 2011 2010 4.8 % 5.6 % 6.1 % N/A N/A N/A 2015 2014 Weighted-average assumptions used to determine benefit obligations Discount rate 4.3 % 4.1 % Rate of compensation increase N/A N/A 2015 2014 2013 Weighted-average assumptions used to determine net periodic benefit cost Discount rate 4.1 % 4.8 % 4.1 % Rate of compensation increase N/A N/A N/A 20122015 assumed health care cost trend rates would increase total service and interest cost by less than $1 million and would increase the postretirement benefit obligation by $10$15 million. A one-percentage-point decrease in the 20122015 assumed health care cost trend rates would decrease the total service and interest cost by less than $1 million and decrease the postretirement benefit obligation by $8$13 million.2013.in cash 100 percent on of an employee's contributions up to three percent of the firstemployee's salary and 50 percent of an employee's contributions that are between three percent and 50 percent on the next twofive percent of employee contributions.the employee's salary. In connection with freezing the defined benefit pension plans for nearly all U.S. based salaried and non-union hourly employees effective December 31, 2006, and the related replacement of those defined benefit plans with defined contribution plans, we are making additional contributions to the Employee Stock Ownership Plans. We recorded expense for these contributions of approximately $21$27 million, $18$25 million and $17$23 million in 2012, 20112015, 2014 and 2010,2013, respectively. Matching contributions vest immediately. Defined benefit replacement contributions fully vest on the employee’s third anniversary of employment.11.Segment and Geographic Area Informationa global manufacturer withorganized and manage our business along our two major product lines (clean air and ride performance) and three geographic reportable segments: (1)areas (North America; Europe, South America and India; and Asia Pacific), resulting in six operating segments (North America Clean Air, North America (2)Ride Performance, Europe, South America and India (“Europe”),Clean Air, Europe, South America and (3)India Ride Performance, Asia Pacific. EachPacific Clean Air and Asia Pacific Ride Performance). Within each geographical area, each operating segment manufactures and distributes either clean air or ride control and emission controlperformance products primarily for the automotive industry. We have not aggregated individualoriginal equipment and aftermarket industries. Each of the six operating segments within theseconstitutes a reportable segments.segment. Costs related to other business activities, primarily corporate headquarter functions, are disclosed separately from the six operating segments as "Other." We evaluate segment performance based primarily on earnings before interest expense, income taxes, and noncontrolling interests. Products are transferred between segments and geographic areas on a basis intended to reflect as nearly as possible the “market value”"market value" of the products.2012, 20112015, 2014 and 20102013 are as follows: Segment North
America Europe Asia
Pacific Reclass &
Elims Consolidated (Millions) $ 3,719 $ 2,767 $ 877 $ — $ 7,363 16 154 31 (201 ) — — 1 1 — 2 91 89 25 — 205 288 71 69 — 428 1,622 1,325 637 24 3,608 — 8 — — 8 122 88 53 — 263 11 — — — 11 $ 3,414 $ 3,013 $ 778 $ — $ 7,205 12 156 26 (194 ) — — 3 1 — 4 95 88 24 — 207 216 125 38 — 379 1,419 1,326 567 25 3,337 — 9 — — 9 88 95 35 — 218 6 12 11 — 29 $ 2,821 $ 2,446 $ 670 $ — $ 5,937 11 148 28 (187 ) — — 3 1 — 4 109 86 21 — 216 155 76 50 — 281 1,281 1,337 525 24 3,167 — 9 — — 9 59 66 29 — 154 4 6 — — 10 Clean Air Division Ride Performance Division North
AmericaEurope, South America & India Asia
PacificNorth
AmericaEurope, South America & India Asia
PacificOther Reclass & Elims Total (Millions) At December 31, 2015, and for the Year Ended Revenues from external customers $ 2,851 $ 1,835 $ 1,037 $ 1,313 $ 944 $ 229 $ — $ — $ 8,209 Intersegment revenues 16 100 — 10 28 46 — (200 ) — EBIT, Earnings (loss) before interest expense, income taxes, and noncontrolling interests 244 52 121 155 (5 ) 39 (87 ) — 519 Total assets 1,209 713 596 692 499 226 — 32 3,967 At December 31, 2014, and for the Year Ended Revenues from external customers $ 2,815 $ 1,974 $ 1,022 $ 1,351 $ 1,032 $ 226 $ — $ — $ 8,420 Intersegment revenues 25 114 — 10 38 43 — (230 ) — EBIT, Earnings (loss) before interest expense, income taxes, and noncontrolling interests 237 59 101 143 40 36 (124 ) — 492 Total assets 1,156 789 593 659 503 227 — 69 3,996 At December 31, 2013, and for the Year Ended Revenues from external customers $ 2,658 $ 1,934 $ 852 $ 1,255 $ 1,046 $ 219 $ — $ — $ 7,964 Intersegment revenues 8 111 1 10 41 32 — (203 ) — EBIT, Earnings (loss) before interest expense, income taxes, and noncontrolling interests 229 57 84 124 (7 ) 22 (85 ) — 424 Total assets 1,030 827 544 628 552 213 — 36 3,830 Net Sales
Year Ended December 31, 2012 2011 2010 (Millions) $ 318 $ 351 $ 318 2,948 2,732 2,223 1,660 1,678 1,284 4,608 4,410 3,507 4,926 4,761 3,825 944 944 851 1,493 1,500 1,261 2,437 2,444 2,112 $ 7,363 $ 7,205 $ 5,937 Net Sales
Year Ended December 31, 2015 2014 2013 (Millions) Clean Air Products & Systems Aftermarket $ 318 $ 318 $ 327 Original Equipment OE Value-add 3,489 3,559 3,282 OE Substrate 1,916 1,934 1,835 5,405 5,493 5,117 5,723 5,811 5,444 Ride Performance Products & Systems Aftermarket 941 976 953 Original Equipment 1,545 1,633 1,567 2,486 2,609 2,520 Total Revenues $ 8,209 $ 8,420 $ 7,964 2012 2011 2010 17 % 19 % 19 % 15 % 15 % 13 % Customer 2015 2014 2013 General Motors Company 15 % 15 % 15 % Ford Motor Company 13 % 13 % 14 % Geographic Area United
States Germany Canada China Other
Foreign(a) Reclass &
Elims Consolidated (Millions) $ 2,975 $ 817 $ 389 $ 661 $ 2,521 $ — $ 7,363 429 115 57 139 521 — 1,261 1,521 344 168 448 1,307 (180 ) 3,608 $ 2,795 $ 826 $ 343 $ 567 $ 2,674 $ — $ 7,205 359 110 57 104 530 — 1,160 1,280 347 163 387 1,251 (91 ) 3,337 $ 2,275 $ 616 $ 327 $ 473 $ 2,246 $ — $ 5,937 352 109 64 76 564 — 1,165 1,147 322 149 321 1,308 (80 ) 3,167 TENNECO INC.NOTES TO CONSOLIDATED FINANCIAL STATEMENTS — (Continued) Geographic Area United
States China Germany Mexico Canada Other
Foreign(a) Reclass &
Elims Consolidated (Millions) At December 31, 2015, and for the Year Then Ended Revenues from external customers(b) $ 3,362 $ 1,101 $ 807 $ 431 $ 387 $ 2,121 $ — $ 8,209 Long-lived assets(c) 496 203 108 35 41 473 — 1,356 Total assets 1,726 696 258 158 146 1,099 (116 ) 3,967 At December 31, 2014, and for the Year Then Ended Revenues from external customers(b) $ 3,348 $ 1,079 $ 955 $ 423 $ 413 $ 2,202 $ — $ 8,420 Long-lived assets(c) 473 192 113 34 52 487 — 1,351 Total assets 1,696 683 319 156 164 1,133 (155 ) 3,996 At December 31, 2013, and for the Year Then Ended Revenues from external customers(b) $ 3,144 $ 875 $ 941 $ 397 $ 387 $ 2,220 $ — $ 7,964 Long-lived assets(c) 448 158 120 31 59 500 — 1,316 Total assets 1,552 602 358 126 182 1,200 (190 ) 3,830 Note:(a) Canada,Mexico, and ChinaCanada are not material.(b) Revenues are attributed to countries based on location of the shipper. (c) Long-lived assets include all long-term assets except goodwill, intangibles and deferred tax assets. 12.Commitments and Contingencies$92$89 million will be required after December 31, 20122015 to complete facilities and projects authorized at such date, and we have made substantial commitments in connection with these facilities and projects.$21 million in 2013, $16 million in 2014, $11 million in 2015, $9$38 million in 2016, and $7$28 million in 2017, $18 million in 2018, $13 million in 2019, and $11$13 million in 2020 and $15 million in subsequent years. The minimum lease payments under our non-cancelable capital leases with lease terms in excess of one year are less than $1 million in each of the next five years. Total rental expense for the year 2012, 20112015, 2014 and 20102013 was $55$61 million, $52$64 million and $45$58 million, respectively.LitigationLegal Proceedings and Product Warrantiesobligations thatobligations. These matters are typically incidental to the conduct of our business and create the potential for contingent losses. We accrue for potential contingent losses when our review of available facts indicates that it is probable a loss has been incurred and the amount of the loss is reasonably estimable. Each quarter we assess our loss contingencies based upon currently available facts, existing technology, and presently enacted laws and regulations and taking into consideration the likely effects of inflation and other societal and economic factors and record adjustments to these reserves as required. As an example, we consider all available evidence including prior experience in remediation of contaminated sites, other companies’ cleanup experiences and data released by the United States Environmental Protection Agency or other organizations when we evaluate our environmental remediation contingencies. Further, allAll of our loss contingency estimates are subject to revision in future periods based on actual costs or new information. With respect to our environmental liabilities, where future cash flows are fixed or reliably determinable, we have discounted those liabilities. All other environmental liabilities are recorded at their undiscounted amounts. We evaluate recoveries separately from the liability and, when they are assured, recoveries are recorded and reported separately from the associated liability in our consolidated financial statements.2012,2015, we have the obligation to remediate or contribute towards the remediation of certain sites, including one Federal Superfund site. At December 31, 2012,2015, our aggregated estimated share of environmental remediation costs for all these sites on a discounted basis was approximately $18$14 million, of which $5$2 million is recorded in other current liabilities and $13$12 million is recorded in deferred credits and other liabilities in our consolidated balance sheet. For those locations where the liability was discounted, the weighted average discount rate used was 1.61.8 percent. The undiscounted value of the estimated remediation costs was $21$17 million. Our expected payments of environmental remediation costs are estimated to be approximately $3$2 million in 2013,2016, $1 millionTENNECO INC.NOTES TO CONSOLIDATED FINANCIAL STATEMENTS — (Continued)20142017 through 20172020 and $14$11 million in aggregate thereafter.towardsto the remediation costs. In addition, certain environmental statutes provide that our liability could be joint and several, meaning that we could be required to pay in excess of our share of remediation costs. Our understanding of the financial strength of other potentially responsible parties at these sites has been considered, where appropriate, in our determination of our estimated liability. We do not believe that any potential costs associated with our current status as a potentially responsible party in the Federal Superfund site, or as a liable party at the other locations referenced herein, will be material to our consolidated financial position, results of operations, or liquidity.cash flows.are involved in other legal proceedings, claims or investigations. Some of these proceedings allegematters involve allegations of damages against us relating to environmental liabilities (including, toxic tort, property damage and remediation), intellectual property matters (including patent, trademark and copyright infringement, and licensing disputes), personal injury claims (including injuries due to product failure, design or warning issues, and other product liability related matters), taxes, employment matters, and commercial or contractual disputes, sometimes related to acquisitions or divestitures. Additionally, some of these matters involve allegations relating to legal compliance. For example, one of our Argentine subsidiaries is currently defending itself against a criminal complaint alleging the failure to comply with laws requiring the proceeds of export transactions to be collected, reported and/or converted to local currency within specified time periods. As another example, in the U.S. we are subject to an audit in 11 states with respect to the payment of unclaimed property to those states, spanning a period as far back as over 30 years. While we vigorously defend ourselves against all of these legal proceedings, claims and investigations and take other actions to minimize our potential exposure, in future periods, we could be subject to cash costs or charges to earnings if any of these matters are resolved on unfavorable terms. Although the ultimate outcome of any legal matter cannot be predicted with certainty, based on current information, including our assessment of the merits of the particular claim, except as described above under "Antitrust Investigations," we do not expect that thesethe legal proceedings, claims or claimsinvestigations currently pending against us will have any material adverse impact on our future consolidated financial position, results of operations or cash flows.arehave been and continue to be subject to lawsuits initiated by a significant number of claimants alleging health problems as a result of exposure to asbestos. In the early 2000’s we were named in nearly 20,000 complaints, most of which were filed in Mississippi state court and the vast majority of which made no allegations of exposure to asbestos from our product categories. Most of these claims have been dismissed and ourOur current docket of active and inactive cases is less than 500 cases nationwide. A small number of claims have been asserted against one of our subsidiaries by railroad workers alleging exposure to asbestos products in railroad cars manufactured by The Pullman Company, one of our subsidiaries.cars. The substantial majority of the remaining claims are related to alleged exposure to asbestos in our automotive products. Only a small percentage of the claimants allege that they were automobile mechanics andproducts although a significant number of those claims appear also to involve workersoccupational exposures sustained in industries other industries or otherwise do not include sufficient information to determine whether there is any basis for a claim against us.than automotive. We believe, based on scientific and other evidence, it is unlikely that mechanicsclaimants were exposed to asbestos by our former products and that, in any event, they would not be at increased risk of asbestos-related disease based on their work with these products. Further, many of these cases involve numerous defendants, with the number ofin some cases exceeding 100 defendants from a variety of industries. Additionally, the plaintiffs either do not specify any, or specify the jurisdictional minimum, dollar amount for damages. As major asbestos manufacturers and/or users continue to go out of business or file for bankruptcy, we may experience an increased number of these claims. We vigorously defend ourselves against these claims as part of our ordinary course of business. In future periods, we could be subject to cash costs or charges to earnings if any of these matters are resolved unfavorably to us. To date, with respect to claims that have proceeded sufficiently through the judicial process, we have regularly achieved favorable resolutions. Accordingly, we presently believe that these asbestos-related claims will not have a material adverse impact on our future consolidated financial condition,position, results of operations or cash flows. Year Ended
December 31, 2012 2011 2010 (Millions) $ 26 $ 33 $ 32 15 11 19 (18 ) (18 ) (18 ) $ 23 $ 26 $ 33 In the fourth quarter of 2011, we encountered an issue in our North America OE ride control business involving struts supplied on one particular OE platform. As a result, we directly incurred approximately $2 million in premium freight and overtime costs in the fourth quarter of 2011 and $3 million in 2012. We are continuing to work through details with the customer to determine responsibility for any other costs associated with this issue. We cannot estimate the amount of these costs at this time, but do not believe they will be material to our annual operating results.13.Supplemental Guarantor Condensed Consolidating Financial Statements Year Ended
December 31, 2015 2014 2013 (Millions) Beginning Balance $ 26 $ 24 $ 23 Accruals related to product warranties 15 24 20 Reductions for payments made (18 ) (22 ) (19 ) Ending Balance $ 23 $ 26 $ 24 20182020 and 20202024 on a joint and several basis. However, a subsidiary’s guarantee may be released in certain customary circumstances such as a sale of the subsidiary or all or substantially all of its assets in accordance with the indenture applicable to the notes. The Guarantor Subsidiaries are combined in the presentation below. For the Year Ended December 31, 2012 Guarantor
Subsidiaries Nonguarantor
Subsidiaries Tenneco Inc.
(Parent
Company) Reclass
& Elims Consolidated (Millions) $ 3,331 $ 4,032 $ — $ — $ 7,363 182 547 — (729 ) — 3,513 4,579 — (729 ) 7,363 3,056 3,843 — (729 ) 6,170 — — — — — 57 69 — — 126 198 224 5 — 427 72 133 — — 205 3,383 4,269 5 (729 ) 6,928 — (4 ) — — (4 ) 115 (71 ) — (47 ) (3 ) 115 (75 ) — (47 ) (7 ) 245 235 (5 ) (47 ) 428 — 5 100 — 105 212 (81 ) (131 ) — — 33 311 26 (47 ) 323 (39 ) 58 — — 19 217 — 249 (466 ) — 289 253 275 (513 ) 304 — 29 — — 29 $ 289 $ 224 $ 275 $ (513 ) $ 275 $ 277 $ 210 $ 275 $ (513 ) $ 249 For the Year Ended December 31, 2015 Guarantor
Subsidiaries Nonguarantor
Subsidiaries Tenneco Inc.
(Parent
Company) Reclass
& Elims Consolidated (Millions) Revenues Net sales and operating revenues — External $ 3,711 $ 4,498 $ — $ — $ 8,209 Affiliated companies 411 558 — (969 ) — 4,122 5,056 — (969 ) 8,209 Costs and expenses Cost of sales (exclusive of depreciation and amortization shown below) 3,442 4,372 — (969 ) 6,845 Engineering, research, and development 70 76 — — 146 Selling, general, and administrative 193 295 3 — 491 Depreciation and amortization of other intangibles 87 116 — — 203 3,792 4,859 3 (969 ) 7,685 Other income (expense) Loss on sale of receivables (1 ) (3 ) — — (4 ) Other income (expense) 41 6 — (48 ) (1 ) 40 3 — (48 ) (5 ) Earnings (loss) before interest expense, income taxes, noncontrolling interests and equity in net income from affiliated companies 370 200 (3 ) (48 ) 519 Interest expense — External (net of interest capitalized) (2 ) 3 66 — 67 Affiliated companies (net of interest income) 54 (56 ) 2 — — Earnings (loss) before income taxes, noncontrolling interests and equity in net income from affiliated companies 318 253 (71 ) (48 ) 452 Income tax expense 43 106 — — 149 Equity in net income (loss) from affiliated companies 84 — 318 (402 ) — Net income (loss) 359 147 247 (450 ) 303 Less: Net income attributable to noncontrolling interests — 56 — — 56 Net income (loss) attributable to Tenneco Inc. $ 359 $ 91 $ 247 $ (450 ) $ 247 Comprehensive income (loss) attributable to Tenneco Inc. $ 359 $ 91 $ 127 $ (450 ) $ 127 For the Year Ended December 31, 2011 Guarantor
Subsidiaries Nonguarantor
Subsidiaries Tenneco Inc.
(Parent
Company) Reclass
& Elims Consolidated (Millions) $ 3,103 $ 4,102 $ — $ — $ 7,205 162 514 — (676 ) — 3,265 4,616 — (676 ) 7,205 2,764 3,949 — (676 ) 6,037 — 11 — — 11 57 76 — — 133 144 281 3 — 428 74 133 — — 207 3,039 4,450 3 (676 ) 6,816 — (5 ) — — (5 ) 80 1 — (86 ) (5 ) 80 (4 ) — (86 ) (10 ) 306 162 (3 ) (86 ) 379 (1 ) 6 103 — 108 211 (72 ) (139 ) — — 96 228 33 (86 ) 271 12 76 — — 88 116 — 124 (240 ) — 200 152 157 (326 ) 183 — 26 — — 26 $ 200 $ 126 $ 157 $ (326 ) $ 157 $ 105 $ 81 $ 157 $ (326 ) $ 17 For the Year Ended December 31, 2014 Guarantor
Subsidiaries Nonguarantor
Subsidiaries Tenneco Inc.
(Parent
Company) Reclass
& Elims Consolidated (Millions) Revenues Net sales and operating revenues — External $ 3,727 $ 4,693 $ — $ — $ 8,420 Affiliated companies 403 602 — (1,005 ) — 4,130 5,295 — (1,005 ) 8,420 Costs and expenses Cost of sales (exclusive of depreciation and amortization shown below) 3,391 4,639 — (1,005 ) 7,025 Engineering, research, and development 81 88 — — 169 Selling, general, and administrative 211 302 6 — 519 Depreciation and amortization of other intangibles 86 122 — — 208 3,769 5,151 6 (1,005 ) 7,921 Other income (expense) Loss on sale of receivables — (4 ) — — (4 ) Other income (expense) 26 9 — (38 ) (3 ) 26 5 — (38 ) (7 ) Earnings (loss) before interest expense, income taxes, noncontrolling interests and equity in net income from affiliated companies 387 149 (6 ) (38 ) 492 Interest expense — External (net of interest capitalized) (1 ) 4 88 — 91 Affiliated companies (net of interest income) 73 (75 ) 2 — — Earnings (loss) before income taxes, noncontrolling interests and equity in net income from affiliated companies 315 220 (96 ) (38 ) 401 Income tax expense 94 37 — — 131 Equity in net income (loss) from affiliated companies 129 — 322 (451 ) — Net income (loss) 350 183 226 (489 ) 270 Less: Net income attributable to noncontrolling interests — 44 — — 44 Net income (loss) attributable to Tenneco Inc. $ 350 $ 139 $ 226 $ (489 ) $ 226 Comprehensive income (loss) attributable to Tenneco Inc. $ 350 $ 139 $ 41 $ (489 ) $ 41 For the Year Ended December 31, 2010 Guarantor
Subsidiaries Nonguarantor
Subsidiaries Tenneco Inc.
(Parent
Company) Reclass
& Elims Consolidated (Millions) $ 2,571 $ 3,366 $ — $ — $ 5,937 130 472 — (602 ) — 2,701 3,838 — (602 ) 5,937 2,331 3,171 — (602 ) 4,900 48 69 — — 117 153 261 3 — 417 86 130 — — 216 2,618 3,631 3 (602 ) 5,650 — (3 ) — — (3 ) 12 1 — (16 ) (3 ) 12 (2 ) — (16 ) (6 ) 95 205 (3 ) (16 ) 281 (2 ) 7 144 — 149 186 (54 ) (132 ) — — (89 ) 252 (15 ) (16 ) 132 7 62 — — 69 154 — 54 (208 ) — 58 190 39 (224 ) 63 — 24 — — 24 $ 58 $ 166 $ 39 $ (224 ) $ 39 $ 76 $ 118 $ 39 $ (244 ) $ 9 For the Year Ended December 31, 2013 Guarantor
Subsidiaries Nonguarantor
Subsidiaries Tenneco Inc.
(Parent
Company) Reclass
& Elims Consolidated (Millions) Revenues Net sales and operating revenues — External $ 3,498 $ 4,466 $ — $ — $ 7,964 Affiliated companies 350 572 — (922 ) — 3,848 5,038 — (922 ) 7,964 Costs and expenses Cost of sales (exclusive of depreciation and amortization shown below) 3,103 4,553 — (922 ) 6,734 Engineering, research, and development 66 78 — — 144 Selling, general, and administrative 187 260 6 — 453 Depreciation and amortization of other intangibles 78 127 — — 205 3,434 5,018 6 (922 ) 7,536 Other income (expense) Loss on sale of receivables — (4 ) — — (4 ) Other income (expense) (1 ) 59 — (58 ) — (1 ) 55 — (58 ) (4 ) Earnings (loss) before interest expense, income taxes, noncontrolling interests, and equity in net income from affiliated companies 413 75 (6 ) (58 ) 424 Interest expense — External (net of interest capitalized) (2 ) 5 77 — 80 Affiliated companies (net of interest income) 70 (72 ) 2 — — Earnings (loss) before income taxes, noncontrolling interests, and equity in net income from affiliated companies 345 142 (85 ) (58 ) 344 Income tax expense 60 62 — — 122 Equity in net income (loss) from affiliated companies 32 — 268 (300 ) — Net income (loss) 317 80 183 (358 ) 222 Less: Net income attributable to noncontrolling interests — 39 — — 39 Net income (loss) attributable to Tenneco Inc. $ 317 $ 41 $ 183 $ (358 ) $ 183 Comprehensive income (loss) attributable to Tenneco Inc. $ 317 $ 41 $ 231 $ (358 ) $ 231 December 31, 2012 Guarantor
Subsidiaries Nonguarantor
Subsidiaries Tenneco Inc.
(Parent
Company) Reclass
& Elims Consolidated (Millions) ASSETS $ 4 $ 219 $ — $ — $ 223 341 1,268 30 (653 ) 986 278 389 — — 667 91 — 6 (25 ) 72 28 148 — — 176 742 2,024 36 (678 ) 2,124 551 — 717 (1,268 ) — 957 4,495 4,594 (10,046 ) — 2 2 — — 4 21 51 — — 72 18 17 — — 35 55 1 60 — 116 31 75 29 — 135 1,635 4,641 5,400 (11,314 ) 362 1,098 2,267 — — 3,365 (763 ) (1,480 ) — — (2,243 ) 335 787 — — 1,122 $ 2,712 $ 7,452 $ 5,436 $ (11,992 ) $ 3,608 LIABILITIES AND SHAREHOLDERS’ EQUITY $ — $ 112 $ 1 $ — $ 113 250 173 10 (433 ) — 423 954 — (191 ) 1,186 16 34 — — 50 135 210 9 (54 ) 300 824 1,483 20 (678 ) 1,649 — 8 1,059 — 1,067 1,447 4,533 4,066 (10,046 ) — — 27 — — 27 438 118 — 3 559 2,709 6,169 5,145 (10,721 ) 3,302 — 15 — — 15 3 1,223 291 (1,271 ) 246 — 45 — — 45 3 1,268 291 (1,271 ) 291 $ 2,712 $ 7,452 $ 5,436 $ (11,992 ) $ 3,608 December 31, 2015 Guarantor
Subsidiaries Nonguarantor
Subsidiaries Tenneco Inc.
(Parent
Company) Reclass
& Elims Consolidated (Millions) ASSETS Current assets: Cash and cash equivalents $ 2 $ 285 $ — $ — $ 287 Restricted cash — 1 — — 1 Receivables, net 299 1,241 — (428 ) 1,112 Inventories 333 349 — — 682 Prepayments and other 67 162 — — 229 Total current assets 701 2,038 — (428 ) 2,311 Other assets: Investment in affiliated companies 1,146 — 891 (2,037 ) — Notes and advances receivable from affiliates 938 13,291 4,788 (19,017 ) — Long-term receivables, net 11 2 — — 13 Goodwill 22 38 — — 60 Intangibles, net 9 13 — — 22 Deferred income taxes 122 28 68 — 218 Other 42 47 11 — 100 2,290 13,419 5,758 (21,054 ) 413 Plant, property, and equipment, at cost 1,281 2,137 — — 3,418 Less — Accumulated depreciation and amortization (851 ) (1,324 ) — — (2,175 ) 430 813 — — 1,243 Total assets $ 3,421 $ 16,270 $ 5,758 $ (21,482 ) $ 3,967 LIABILITIES AND SHAREHOLDERS’ EQUITY Current liabilities: Short-term debt (including current maturities of long-term debt) Short-term debt — non-affiliated $ — $ 73 $ 13 $ — $ 86 Short-term debt — affiliated 164 147 — (311 ) — Accounts payable 484 955 — (63 ) 1,376 Accrued taxes 6 31 — — 37 Other 125 221 3 (54 ) 295 Total current liabilities 779 1,427 16 (428 ) 1,794 Long-term debt — non-affiliated — 21 1,103 — 1,124 Long-term debt — affiliated 1,583 13,226 4,208 (19,017 ) — Deferred income taxes — 7 — — 7 Postretirement benefits and other liabilities 424 100 — — 524 Commitments and contingencies Total liabilities 2,786 14,781 5,327 (19,445 ) 3,449 Redeemable noncontrolling interests — 43 — — 43 Tenneco Inc. Shareholders’ equity 635 1,404 433 (2,039 ) 433 Noncontrolling interests — 42 — — 42 Total equity 635 1,446 433 (2,039 ) 475 Total liabilities, redeemable noncontrolling interests and equity $ 3,421 $ 16,270 $ 5,760 $ (21,484 ) $ 3,967 December 31, 2011 Guarantor
Subsidiaries Nonguarantor
Subsidiaries Tenneco Inc.
(Parent
Company) Reclass
& Elims Consolidated (Millions) ASSETS $ 1 $ 213 $ — $ — $ 214 455 1,214 27 (716 ) 980 248 344 — — 592 35 31 — (26 ) 40 21 132 — — 153 760 1,934 27 (742 ) 1,979 444 — 681 (1,125 ) — 4,252 1,507 6,059 (11,818 ) — 2 8 — — 10 22 52 — — 74 13 19 — — 32 64 25 3 — 92 31 45 27 — 103 4,828 1,656 6,770 (12,943 ) 311 1,041 2,112 — — 3,153 (749 ) (1,357 ) — — (2,106 ) 292 755 — — 1,047 $ 5,880 $ 4,345 $ 6,797 $ (13,685 ) $ 3,337 LIABILITIES AND SHAREHOLDERS’ EQUITY $ — $ 64 $ 2 $ — $ 66 203 374 10 (587 ) — 455 825 — (109 ) 1,171 11 33 — — 44 118 178 39 (46 ) 289 787 1,474 51 (742 ) 1,570 — 9 1,149 — 1,158 4,718 1,546 5,554 (11,818 ) — — 51 — — 51 407 92 — 4 503 5,912 3,172 6,754 (12,556 ) 3,282 — 12 — — 12 (32 ) 1,118 43 (1,129 ) — — 43 — — 43 (32 ) 1,161 43 (1,129 ) 43 $ 5,880 $ 4,345 $ 6,797 $ (13,685 ) $ 3,337 December 31, 2014 Guarantor
Subsidiaries Nonguarantor
Subsidiaries Tenneco Inc.
(Parent
Company) Reclass
& Elims Consolidated (Millions) ASSETS Current assets: Cash and cash equivalents $ 10 $ 272 $ — $ — $ 282 Restricted cash — 3 — — 3 Receivables, net 408 1,309 — (629 ) 1,088 Inventories 312 376 — — 688 Deferred income taxes 49 25 7 — 81 Prepayments and other 96 188 — — 284 Total current assets 875 2,173 7 (629 ) 2,426 Other assets: Investment in affiliated companies 1,064 — 764 (1,828 ) — Notes and advances receivable from affiliates 944 10,589 4,844 (16,377 ) — Long-term receivables, net 12 — — — 12 Goodwill 22 43 — — 65 Intangibles, net 10 16 — — 26 Deferred income taxes 76 14 53 — 143 Other 40 53 13 — 106 2,168 10,715 5,674 (18,205 ) 352 Plant, property, and equipment, at cost 1,236 2,254 — — 3,490 Less — Accumulated depreciation and amortization (845 ) (1,427 ) — — (2,272 ) 391 827 — — 1,218 Total assets $ 3,434 $ 13,715 $ 5,681 $ (18,834 ) $ 3,996 LIABILITIES AND SHAREHOLDERS’ EQUITY Current liabilities: Short-term debt (including current maturities of long-term debt) Short-term debt — non-affiliated $ — $ 54 $ 6 $ — $ 60 Short-term debt — affiliated 243 220 9 (472 ) — Accounts payable 478 1,000 — (106 ) 1,372 Accrued taxes (15 ) 31 24 — 40 Other 134 241 3 (51 ) 327 Total current liabilities 840 1,546 42 (629 ) 1,799 Long-term debt — non-affiliated — 44 1,011 — 1,055 Long-term debt — affiliated 1,730 10,516 4,131 (16,377 ) — Deferred income taxes — 18 — — 18 Postretirement benefits and other liabilities 418 129 — 4 551 Commitments and contingencies Total liabilities 2,988 12,253 5,184 (17,002 ) 3,423 Redeemable noncontrolling interests — 35 — — 35 Tenneco Inc. Shareholders’ equity 446 1,386 497 (1,832 ) 497 Noncontrolling interests — 41 — — 41 Total equity 446 1,427 497 (1,832 ) 538 Total liabilities, redeemable noncontrolling interests and equity $ 3,434 $ 13,715 $ 5,681 $ (18,834 ) $ 3,996 Year Ended December 31, 2012 Guarantor
Subsidiaries Nonguarantor
Subsidiaries Tenneco Inc.
(Parent
Company) Reclass
& Elims Consolidated (Millions) $ 385 $ 206 $ (226 ) $ — $ 365 — 3 — — 3 (101 ) (155 ) — — (256 ) (6 ) (7 ) — — (13 ) (7 ) — — — (7 ) (114 ) (159 ) — — (273 ) — (1 ) (410 ) — (411 ) — — 250 — 250 — — (13 ) — (13 ) — — (18 ) — (18 ) — — 5 — 5 — 5 — — 5 — 48 19 — 67 — — 50 — 50 (268 ) (75 ) 343 — — — 5 — — 5 — — — — — — (29 ) — — (29 ) (268 ) (47 ) 226 — (89 ) — 6 — — 6 3 6 — — 9 1 213 — — 214 $ 4 $ 219 $ — $ — $ 223 Year Ended December 31, 2015 Guarantor
Subsidiaries Nonguarantor
Subsidiaries Tenneco Inc.
(Parent
Company) Reclass
& Elims Consolidated (Millions) Operating Activities Net cash provided (used) by operating activities $ 204 $ 311 $ 49 $ (47 ) $ 517 Investing Activities Proceeds from sale of assets — 4 — — 4 Cash payments for plant, property, and equipment (114 ) (172 ) — — (286 ) Cash payments for software related intangible assets (16 ) (7 ) — — (23 ) Change in restricted cash — 2 — — 2 Net cash used by investing activities (130 ) (173 ) — — (303 ) Financing Activities Retirement of long-term debt — (22 ) (15 ) — (37 ) Issuance of long-term debt — 1 — — 1 Debt issuance cost on long-term debt — — (1 ) — (1 ) Tax impact from stock-based compensation — — 6 — 6 Purchase of common stock under the share repurchase program — — (213 ) — (213 ) Issuance of common shares — — 6 — 6 Increase in bank overdrafts — (22 ) — — (22 ) Net increase in revolver borrowings and short-term debt excluding current maturities of long-term debt and short-term borrowings secured by accounts receivable — 20 82 — 102 Net increase (decrease) in short-term borrowings secured by accounts receivable — — 30 — 30 Intercompany dividends and net increase (decrease) in intercompany obligations (82 ) (21 ) 56 47 — Distribution to noncontrolling interests partners — (44 ) — — (44 ) Net cash provided (used) by financing activities (82 ) (88 ) (49 ) 47 (172 ) Effect of foreign exchange rate changes on cash and cash equivalents — (37 ) — — (37 ) Increase in cash and cash equivalents (8 ) 13 — — 5 Cash and cash equivalents, January 1 10 272 — — 282 Cash and cash equivalents, December 31 (Note) $ 2 $ 285 $ — $ — $ 287 Note: Cash and cash equivalents include highly liquid investments with a maturity of three months or less at the date of purchase. Year Ended December 31, 2011 Guarantor
Subsidiaries Nonguarantor
Subsidiaries Tenneco Inc.
(Parent
Company) Reclass
& Elims Consolidated (Millions) $ 401 $ 83 $ (239 ) $ — $ 245 3 1 — — 4 (69 ) (144 ) — — (213 ) (4 ) (11 ) — — (15 ) (70 ) (154 ) — — (224 ) — 5 — — 5 — — (1 ) — (1 ) — (1 ) (23 ) — (24 ) — 3 — — 3 — 6 24 — 30 (330 ) 75 255 — — — 1 — — 1 — (4 ) — — (4 ) — (20 ) — — (20 ) — — (16 ) — (16 ) (330 ) 65 239 — (26 ) — (14 ) — — (14 ) 1 (20 ) — — (19 ) — 233 — — 233 $ 1 $ 213 $ — $ — $ 214 Year Ended December 31, 2014 Guarantor
SubsidiariesNonguarantor
SubsidiariesTenneco Inc.
(Parent
Company)Reclass
& ElimsConsolidated (Millions) Operating Activities Net cash provided (used) by operating activities $ 44 $ 314 $ 21 $ (38 ) $ 341 Investing Activities Proceeds from sale of assets — 3 — — 3 Cash payments for plant, property, and equipment (106 ) (222 ) — — (328 ) Cash payments for software related intangible assets (5 ) (8 ) — — (13 ) Cash payments for net assets purchased (3 ) — — — (3 ) Change in restricted cash — 2 — — 2 Net cash used by investing activities (114 ) (225 ) — — (339 ) Financing Activities Retirement of long-term debt — (9 ) (453 ) — (462 ) Issuance of long-term debt — 45 525 — 570 Debt issuance cost on long-term debt — — (12 ) — (12 ) Tax impact from stock-based compensation — — 26 — 26 Purchase of common stock under the share repurchase program — — (22 ) — (22 ) Issuance of common shares — — 19 — 19 Increase in bank overdrafts — 6 — — 6 Net decrease in revolver borrowings and short-term debt excluding current maturities of long-term debt and short-term borrowings secured by accounts receivable — (13 ) (57 ) — (70 ) Net decrease in short-term borrowings secured by accounts receivable — — (10 ) — (10 ) Intercompany dividends and net increase (decrease) in intercompany obligations 74 (75 ) (37 ) 38 — Capital contribution from noncontrolling interest partner — 5 — — 5 Distribution to noncontrolling interests partners — (30 ) — — (30 ) Net cash provided (used) by financing activities 74 (71 ) (21 ) 38 20 Effect of foreign exchange rate changes on cash and cash equivalents — (15 ) — — (15 ) Increase in cash and cash equivalents 4 3 — — 7 Cash and cash equivalents, January 1 6 269 — — 275 Cash and cash equivalents, December 31 (Note) $ 10 $ 272 $ — $ — $ 282 Note: Cash and cash equivalents include highly liquid investments with a maturity of three months or less at the date of purchase. Year Ended December 31, 2010 Guarantor
Subsidiaries Nonguarantor
Subsidiaries Tenneco Inc.
(Parent
Company) Reclass
& Elims Consolidated (Millions) $ 97 $ 380 $ (233 ) $ — $ 244 1 2 — — 3 (50 ) (101 ) — — (151 ) (7 ) (5 ) — — (12 ) — 3 — — 3 (56 ) (101 ) — — (157 ) — 5 875 — 880 — — (24 ) — (24 ) — (4 ) (860 ) — (864 ) — 2 — — 2 — (10 ) — — (10 ) (61 ) (181 ) 242 — — — (14 ) — — (14 ) (61 ) (202 ) 233 — (30 ) — 9 — — 9 (20 ) 86 — — 66 20 147 — — 167 $ — $ 233 $ — $ — $ 233 Year Ended December 31, 2013 Guarantor
Subsidiaries Nonguarantor
Subsidiaries Tenneco Inc.
(Parent
Company) Reclass
& Elims Consolidated (Millions) Operating Activities Net cash provided (used) by operating activities $ 270 $ 244 $ 48 $ (59 ) $ 503 Investing Activities Proceeds from sale of assets 1 7 — — 8 Cash payments for plant, property, and equipment (102 ) (142 ) — — (244 ) Cash payments for software related intangible assets (19 ) (6 ) — — (25 ) Cash payments for net assets purchased — (5 ) — — (5 ) Net cash used by investing activities (120 ) (146 ) — — (266 ) Financing Activities Retirement of long-term debt — (2 ) (14 ) — (16 ) Tax impact from stock-based compensation — — 24 — 24 Purchase of common stock under the share repurchase program — — (27 ) — (27 ) Issuance of common shares — — 20 — 20 Increase in bank overdrafts — (6 ) — — (6 ) Net increase (decrease) in revolver borrowings and short-term debt excluding current maturities of long-term debt — (43 ) 21 — (22 ) Net decrease in short-term borrowings secured by accounts receivable — — (40 ) — (40 ) Intercompany dividends and net increase (decrease) in intercompany obligations (148 ) 121 (32 ) 59 — Purchase of noncontrolling equity interest — (69 ) — — (69 ) Distribution to noncontrolling interests partners — (39 ) — — (39 ) Net cash provided (used) by financing activities (148 ) (38 ) (48 ) 59 (175 ) Effect of foreign exchange rate changes on cash and cash equivalents — (10 ) — — (10 ) Increase (decrease) in cash and cash equivalents 2 50 — — 52 Cash and cash equivalents, January 1 4 219 — — 223 Cash and cash equivalents, December 31 (Note) $ 6 $ 269 $ — $ — $ 275 Note: Cash and cash equivalents include highly liquid investments with a maturity of three months or less at the date of purchase. Quarter Net Sales
and
Operating
Revenues Cost of Sales
(Excluding
Depreciation and
Amortization) Earnings Before
Interest Expense,
Income Taxes
and Noncontrolling
Interests Net Income
Attributable
to Tenneco
Inc. (Millions) 2015 1st $ 2,023 $ 1,686 $ 120 $ 49 2nd 2,130 1,764 155 78 3rd 2,025 1,707 116 52 4th 2,031 1,688 128 68 $ 8,209 $ 6,845 $ 519 $ 247 2014 1st $ 2,094 $ 1,754 $ 113 $ 46 2nd 2,241 1,851 156 81 3rd 2,081 1,735 140 78 4th 2,004 1,685 83 21 $ 8,420 $ 7,025 $ 492 $ 226 Quarter Basic
Earnings
per Share of
Common Stock Diluted
Earnings
per Share of
Common Stock2015 1st $ 0.81 $ 0.80 2nd 1.27 1.26 3rd 0.89 0.88 4th 1.18 1.17 Full Year 4.14 4.11 2014 1st $ 0.76 $ 0.75 2nd 1.34 1.32 3rd 1.29 1.27 4th 0.34 0.33 Full Year 3.72 3.66 14.Quarterly Financial Data (Unaudited) Net Sales
and
Operating
Revenues Cost of Sales
(Excluding
Depreciation and
Amortization) Earnings Before
Interest Expense,
Income Taxes
and Noncontrolling
Interests Net Income
Attributable
to Tenneco
Inc. (Millions) $ 1,912 $ 1,607 $ 96 $ 30 1,920 1,595 137 87 1,778 1,494 111 125 1,753 1,474 84 33 $ 7,363 $ 6,170 $ 428 $ 275 $ 1,760 $ 1,466 $ 94 $ 47 1,888 1,565 113 50 1,773 1,492 84 30 1,784 1,514 88 30 $ 7,205 $ 6,037 $ 379 $ 157 Basic
Earnings
per Share of
Common Stock Diluted
Earnings
per Share of
Common Stock $ 0.50 $ 0.49 1.45 1.42 2.09 2.05 0.55 0.54 4.58 4.50 $ 0.78 $ 0.75 0.84 0.81 0.51 0.49 0.50 0.49 2.62 2.55 Note: The sum of the quarters may not equal the total of the respective year’s earnings per share on either a basic or diluted basis due to changes in the weighted average shares outstanding throughout the year. Column B Column C Column D Column E Additions Balance
at
Beginning
of Year Charged
to
Costs and
Expenses Charged
to
Other
Accounts Deductions Balance
at End of
Year (Millions) $ 17 3 — 6 $ 14 $ 20 1 — 4 $ 17 $ 25 2 — 7 $ 20 Additions Description Balance
at
Beginning
of Year Charged
to
Costs and
Expenses Charged
to
Other
Accounts Deductions Balance
at End of
Year (Millions) Allowance for Doubtful Accounts and Notes Receivable Deducted from Assets to Which it Applies: Year Ended December 31, 2015 $ 16 4 — 4 $ 16 Year Ended December 31, 2014 $ 14 4 — 2 $ 16 Year Ended December 31, 2013 $ 14 1 — 1 $ 14 Description Balance
at
Beginning
of Year Provision Charged (Credited) to Expense Allowance Changes Other Additions (Deductions) Balance
at End of
Year (Millions) Deferred Tax Assets- Valuation Allowance Year Ended December 31, 2015 $ 139 15 (3 ) (24 ) $ 127 Year Ended December 31, 2014 $ 135 15 (3 ) (8 ) $ 139 Year Ended December 31, 2013 $ 118 19 8 (10 ) $ 135 ITEM 9. CHANGES IN AND DISAGREEMENTS WITH ACCOUNTANTS ON ACCOUNTING AND FINANCIAL DISCLOSURE. 2012,2015, that have materially affected, or are reasonably likely to materially affect, our internal control over financial reporting.ITEM 9B.OTHER INFORMATION.ITEM 10.DIRECTORS, EXECUTIVE OFFICERS AND CORPORATE GOVERNANCE.15, 201318, 2016 are incorporated herein by reference. In addition, Item 4.1 of this Annual Report on Form 10-K, which appears at the end of Part I, is incorporated herein by reference.ITEM 11.EXECUTIVE COMPENSATION.15, 201318, 2016 is incorporated herein by reference.ITEM 12. SECURITY OWNERSHIP OF CERTAIN BENEFICIAL OWNERS AND MANAGEMENT AND RELATED STOCKHOLDER MATTERS. 15, 201318, 2016 is incorporated herein by reference.2012,2015, information regarding outstanding awards available under our compensation plans (including individual compensation arrangements) under which our equity securities may be delivered: (a)
Number of
securities to be
issued upon
exercise of
outstanding
options,
warrants and
rights(1) (b)
Weighted-
average exercise
price of
outstanding
options,
warrants and
rights (c)
Number of
securities
available for
future
issuance
(excluding
shares in
column (a))(1) 78,103 $ 20.39 — 159,720 $ 2.91 — 2,209,652 $ 20.83 1,036,883 Plan category (a)
Number of
securities to be
issued upon
exercise of
outstanding
options,
warrants and
rights(1) (b)
Weighted-
average exercise
price of
outstanding
options,
warrants and
rights (c)
Number of
securities
available for
future
issuance
(excluding
shares in
column (a))(1)Equity compensation plans approved by security holders: Stock Ownership Plan(2) 70,575 $ 20.14 — 2002 Long-Term Incentive Plan (as amended)(3) — $ — — 2006 Long-Term Incentive Plan (as amended)(4) 1,074,144 $ 26.46 3,042,433 (1) Reflects the number of shares of the Company’s common stock. Does not include 397,456278,815 shares that may be issued in settlement of common stock equivalent units that were (i) credited to outside directors as payment for their retainer and other fees or (ii) credited to any of our executive officers who have elected to defer a portion of their compensation. In general, these units are settled in cash. At the option of the Company, however, the units may be settled in shares of the Company’s common stock.(2) This plan terminated as to new awards on December 31, 2001 (except awards pursuant to commitments outstanding at that date). (3) This plan terminated as to new awards upon adoption of our 2006 Long-term Incentive Plan (except awards pursuant to commitments outstanding on that date). (4) Does not include 348,918496,842 shares subject to outstanding restricted stock (vest over time) as of December 31, 20122015 that were issued at a weighted average grant date fair value of $31.69.$51.65. Under this plan, as of December 31, 2012,2015, a maximum of 829,5062,041,901 shares remained available for delivery under full value awards (i.e., bonus stock, stock equivalent units, performance units, restricted stock and restricted stock units).ITEM 13. CERTAIN RELATIONSHIPS AND RELATED TRANSACTIONS, AND DIRECTOR INDEPENDENCE. 15, 201318, 2016 are incorporated herein by reference.ITEM 14.PRINCIPAL ACCOUNTANT FEES AND SERVICES.15, 201318, 2016 are incorporated herein by reference. Page 1392012,2015, or incorporated herein by reference (exhibits designated by an asterisk are filed with the report; all other exhibits are incorporated by reference): 2 — None. 3.1(a) — Restated Certificate of Incorporation of the registrant dated December 11, 1996 (incorporated herein by reference to Exhibit 3.1(a) of the registrant’s Annual Report on Form 10-K for the year ended December 31, 1997, File No. 1-12387). 3.1(b) — Certificate of Amendment, dated December 11, 1996 (incorporated herein by reference to Exhibit 3.1(c) of the registrant’s Annual Report on Form 10-K for the year ended December 31, 1997, File No. 1-12387). 3.1(c) — Certificate of Ownership and Merger, dated July 8, 1997 (incorporated herein by reference to Exhibit 3.1(d) of the registrant’s Annual Report on Form 10-K for the year ended December 31, 1997, File No. 1-12387). 3.1(d) — Certificate of Designation of Series B Junior Participating Preferred Stock dated September 9, 1998 (incorporated herein by reference to Exhibit 3.1(d) of the registrant’s Quarterly Report on Form 10-Q for the quarter ended September 30, 1998, File No. 1-12387). 3.1(e) — Certificate of Elimination of the Series A Participating Junior Preferred Stock of the registrant dated September 11, 1998 (incorporated herein by reference to Exhibit 3.1(e) of the registrant’s Quarterly Report on Form 10-Q for the quarter ended September 30, 1998, File No. 1-12387). 3.1(f) — Certificate of Amendment to Restated Certificate of Incorporation of the registrant dated November 5, 1999 (incorporated herein by reference to Exhibit 3.1(f) of the registrant’s Quarterly Report on Form 10-Q for the quarter ended September 30, 1999, File No. 1-12387). 3.1(g) — Certificate of Amendment to Restated Certificate of Incorporation of the registrant dated November 5, 1999 (incorporated herein by reference to Exhibit 3.1(g) of the registrant’s Quarterly Report on Form 10-Q for the quarter ended September 30, 1999, File No. 1-12387). 3.1(h) — Certificate of Ownership and Merger merging Tenneco Automotive Merger Sub Inc. with and into the registrant, dated November 5, 1999 (incorporated herein by reference to Exhibit 3.1(h) of the registrant’s Quarterly Report on Form 10-Q for the quarter ended September 30, 1999, File No. 1-12387). 3.1(i) — Certificate of Amendment to Restated Certificate of Incorporation of the registrant dated May 9, 2000 (incorporated herein by reference to Exhibit 3.1(i) of the registrant’s Quarterly Report on Form 10-Q for the quarter ended March 31, 2000, File No. 1-12387). 3.1(j) — Certificate of Ownership and Merger merging Tenneco Inc. with and into the registrant, dated October 27, 2005 (incorporated herein by reference to Exhibit 99.1 of the registrant’s Current Report on Form 8-K dated October 28, 2005, File No. 1-12387). 3.2 — By-laws of the registrant, as amended March 4, 2008 (incorporated herein by reference to Exhibit 99.1 of the registrant’s Current Report on Form 8-K event date March 4, 2008, File No. 1-12387). 3.34.1 — Certificate of Incorporation of Tenneco Global Holdings Inc. (“Global”), as amended (incorporated herein by reference to Exhibit 3.3 of the registrant’s Registration Statement on Form S-4, Reg. No. 333-93757).3.4—By-laws of Global (incorporated herein by reference to Exhibit 3.4 of the registrant’s Registration Statement on Form S-4, Reg. No. 333-93757).ExhibitNumberDescription3.5—Certificate of Incorporation of TMC Texas Inc. (“TMC”) (incorporated herein by reference to Exhibit 3.5 of the registrant’s Registration Statement on Form S-4, Reg. No. 333-93757).3.6—By-laws of TMC (incorporated herein by reference to Exhibit 3.6 of the registrant’s Registration Statement on Form S-4, Reg. No. 333-93757).3.7—Amended and Restated Certificate of Incorporation of Tenneco International Holding Corp. (“TIHC”) dated as of April 29, 2010 (incorporated herein by reference to Exhibit 3.1 of the registrant’s Quarterly Report on Form 10-Q for the quarter ended September 30, 2010, File No. 1-12387).3.8—Amended and Restated By-laws of TIHC (incorporated herein by reference to Exhibit 3.8 of the registrant’s Registration Statement on Form S-4, Reg. No. 333-93757).3.9—Certificate of Incorporation of Clevite Industries Inc. (“Clevite”), as amended (incorporated herein by reference to Exhibit 3.9 of the registrant’s Registration Statement on Form S-4, Reg. No. 333-93757).3.10—By-laws of Clevite (incorporated herein by reference to Exhibit 3.10 of the registrant’s Registration Statement on Form S-4, Reg. No. 333-93757).3.11—Amended and Restated Certificate of Incorporation of The Pullman Company (“Pullman”) (incorporated herein by reference to Exhibit 3.11 of the registrant’s Registration Statement on Form S-4, Reg. No. 333-93757).3.12—By-laws of Pullman (incorporated herein by reference to Exhibit 3.12 of the registrant’s Registration Statement on Form S-4, Reg. No. 333-93757).3.13—Certificate of Incorporation of Tenneco Automotive Operating Company Inc. (“Operating”) (incorporated herein by reference to Exhibit 3.13 of the registrant’s Registration Statement on Form S-4, Reg. No. 333-93757).3.14—By-laws of Operating (incorporated herein by reference to Exhibit 3.14 of the registrant’s Registration Statement on Form S-4, Reg. No. 333-93757).4.1(a)—Indenture, dated as of November 1, 1996, between the registrant and The Chase Manhattan Bank, as Trustee (incorporated herein by reference to Exhibit 4.1 of the registrant’s Registration Statement on Form S-4, Registration No. 333-14003).4.1(b)—Third Supplemental Indenture dated as of December 11, 1996 to Indenture dated as of November 1, 1996 between the registrant and The Chase Manhattan Bank, as Trustee (incorporated herein by reference to Exhibit 4.3(d) of the registrant’s Annual Report on Form 10-K for the year ended December 31, 1996, File No. 1-12387).4.1(c)—Eleventh Supplemental Indenture, dated October 21, 1999, to Indenture dated November 1, 1996 between The Chase Manhattan Bank, as Trustee, and the registrant (incorporated herein by reference to Exhibit 4.2(l) of the registrant’s Quarterly Report on Form 10-Q for the quarter ended September 30, 1999, File No. 1-12387).4.2—Specimen stock certificate for Tenneco Inc. common stock (incorporated herein by reference to Exhibit 4.3 of the registrant’s Annual Report on Form 10-K for the year ended December 31, 2006, File No. 1-12387). 4.3(a)4.2(a) — ThirdFourth Amended and Restated Credit Agreement, dated as of March 22, 2012,December 8,2014, among Tenneco Inc., JPMorgan Chase Bank, N.A., as administrative agent, and the other lenders party thereto (incorporated herein by reference to Exhibit 4.1 of the registrant’s Current Report on Form 8-K dated March 22, 2012)December 8, 2014, File No. 1-12387).4.3(b)4.2(b) — Amended and Restated Guarantee and Collateral Agreement, dated as of March 22, 2012 (amending and restating the Guarantee and Collateral Agreement dated as of March 17, 2007, as previously amended and restated),December 8, 2014, among Tenneco Inc., various of its subsidiaries and JPMorgan Chase Bank, N.A., as administrative agent (incorporated herein by reference to Exhibit 4.2 of the registrant’sregistrant's Current Report on Form 8-K dated March 22, 2012).ExhibitNumberDescription 4.4—Indenture, dated August 3, 2010, among the registrant, various subsidiaries of the registrant and U.S. Bank National Association, as trustee (incorporated herein by reference to Exhibit 4.1 of the registrant’s Current Report on Form 8-K filed August 3, 2010,December 8, 2014, File No. 1-12387). 4.54.3 — Indenture, dated December 23, 2010, among the registrant, various subsidiaries of the registrant and The Bank of New York Mellon Trust Company, N.A., as trustee (incorporated herein by reference to Exhibit 4.1 of the registrant’s Current Report on Form 8-K filed December 23, 2010, File No. 1-12387). 94.4— Indenture, dated December 5, 2014, among the registrant, various subsidiaries of the registrant and U.S, Bank National Association, as trustee (incorporated herein by reference to Exhibit 4.1 of the registrant’s Current Report on Form 8-K filed December 5, 2014, File No. 1-12387). 4.5 — First Supplemental Indenture, dated December 5, 2014, among the registrant, various subsidiaries of the registrant and U.S. Bank National Association, as trustee (incorporated herein by reference to Exhibit 4.2 of the registrant's Current Report on Form 8-K filed December 5, 2014, File No. 1-12387). Description 4.6 — The registrant is a party to other agreements for unregistered long-term debt securities, which do not exceed 10% of the registrant’s total assets. The registrant agrees to furnish a copy of such agreements to the Commission upon request. 9 — None +10.1 — Change of Control Severance Benefits Plan for Key Executives (incorporated herein by reference to Exhibit 10.13 of the registrant’s Quarterly Report on Form 10-Q for the quarter ended September 30, 1999, File No. 1-12387). +10.2 — Stock Ownership Plan (incorporated herein by reference to Exhibit 10.1010.14 of the registrant’s Registration Statement on Form S-4, Reg. No. 333-93757).]1+10.3 — Key Executive Pension Plan (incorporated herein by reference to Exhibit 10.11 of the registrant’s Quarterly Report on Form 10-Q for the quarter ended June 30, 2000, File No. 1-12387). +10.4 — Deferred Compensation Plan (incorporated herein by reference to Exhibit 10.12 of the registrant’s Quarterly Report on Form 10-Q for the quarter ended June 30, 2000, File No. 1-12387). +10.5 — Supplemental Executive Retirement Plan (incorporated herein by reference to Exhibit 10.13 of the registrant’s Quarterly Report on Form 10-Q for the quarter ended June 30, 2000, File No. 1-12387). +10.6 — Amendment No. 1 to Change in Control Severance Benefits Plan for Key Executives (incorporated herein by reference to Exhibit 10.23 of the registrant’s Quarterly Report on Form 10-Q for the quarter ended June 30, 2000, File No. 1-12387). +10.7 — Form of Indemnity Agreement entered into between the registrant and Paul Stecko (incorporated herein by reference to Exhibit 10.29 of the registrant’s Quarterly Report on Form 10-Q for the quarter ended September 30, 2000, File No. 1-12387). +10.8 — Letter Agreement dated July 27, 2000 between the registrant and Timothy E. Jackson (incorporated herein by reference to Exhibit 10.27 of the registrant’s Quarterly Report on Form 10-Q for the quarter ended June 30, 2000, File No. 1-12387).+10.9—Letter Agreement dated as of June 1, 2001 between the registrant and Hari Nair (incorporated herein by reference to Exhibit 10.28 of the registrant’s Annual Report on Form 10-K for the year ended December 31, 2001, File No. 1-12387).+10.10—2002 Long-Term Incentive Plan (As Amended and Restated Effective March 11, 2003) (incorporated herein by reference to Exhibit 10.26 of the registrant’s Quarterly Report on Form 10-Q for the quarter ended June 30, 2003, File No. 1-12387). + 10.1110.9 — Amendment No. 1 to Deferred Compensation Plan (incorporated herein by reference to Exhibit 10.27 of the registrant’s Annual Report on Form 10-K for the year ended December 31, 2002, File No. 1-12387). + 10.1210.10 — Form of Stock Option Agreement for employees under the 2002 Long-Term Incentive Plan, as amended (providing for a ten year option term) (incorporated herein by reference to Exhibit 99.2 of the registrant’s Current Report on Form 8-K dated January 13, 2005, File No. 1-12387). + 10.1310.11 — Amendment No. 1 to the Key Executive Pension Plan (incorporated herein by reference to Exhibit 10.39 of the registrant’s Quarterly Report on Form 10-Q for the quarter ended March 31, 2005, File No. 1-12387). + 10.1410.12 — Amendment No. 1 to the Supplemental Executive Retirement Plan (incorporated herein by reference to Exhibit 10.40 of the registrant’s Quarterly Report on Form 10-Q for the quarter ended June 30, 2005, File No. 1-12387). ExhibitNumberDescription+ 10.1510.13 — Second Amendment to the Key Executive Pension Plan (incorporated herein by reference to Exhibit 10.41 of the registrant’s Quarterly Report on Form 10-Q for the quarter ended June 30, 2005, File No. 1-12387). + 10.1610.14 — Amendment No. 2 to the Deferred Compensation Plan (incorporated herein by reference to Exhibit 10.42 of the registrant’s Quarterly Report on Form 10-Q for the quarter ended June 30, 2005, File No. 1-12387). + 10.1710.15 — Supplemental Retirement Plan (incorporated herein by reference to Exhibit 10.43 of the registrant’s Quarterly Report on Form 10-Q for the quarter ended June 30, 2005, File No. 1-12387). + 10.1810.16 — Supplemental Pension Plan for Management (incorporated herein by reference to Exhibit 10.45 of the registrant’s Quarterly Report on Form 10-Q for the quarter ended June 30, 2005, File No. 1-12387). + 10.1910.17 — Amended and Restated Value Added (“TAVA”) Incentive Compensation Plan, effective January 1, 2006 (incorporated herein by reference to Exhibit 10.47 of the registrant’s Annual Report on Form 10-K for the year ended December 31, 2005, File No. 1-12387). + 10.2010.18 — Tenneco Inc. 2006 Long-Term Incentive Plan (incorporated herein by reference to Exhibit 99.1 of the registrant’s Current Report on Form 8-K, dated May 9, 2006). + 10.2110.19 — Form of Stock Option Agreement for employees under the Tenneco Inc. 2006 Long-Term Incentive Plan (incorporated herein by reference to Exhibit 99.3 of the registrant’s Current Report on Form 8-K, dated May 9, 2006). + 10.2210.20 — Form of First Amendment to the Tenneco Inc. Supplemental Pension Plan for Management (incorporated herein by reference to Exhibit 10.56 of the registrant’s Annual Report on Form 10-K for the year ended December 31, 2006, File No. 1-12387). + 10.2310.21 — Form of First Amendment to the Tenneco Inc. Supplemental Retirement Plan (incorporated herein by reference to Exhibit 10.57 of the registrant’s Annual Report on Form 10-K for the year ended December 31, 2006, File No. 1-12387). +10.24 —Letter Agreement dated January 5, 2007 between the registrant and Hari N. Nair (incorporated herein by reference to Exhibit 10.60 of the registrant’s Annual Report on Form 10-K for the year ended December 31, 2006, File No. 1-12387).Description+ 10.2510.22 — Letter Agreement between Tenneco Inc. and Gregg M. Sherrill (incorporated herein by reference to Exhibit 99.2 of the registrant’s Current Report on Form 8-K dated as of January 5, 2007, File No. 1-12387).+10.26—Letter Agreement between Tenneco Inc. and Gregg M. Sherrill, dated as of January 15, 2007 (incorporated herein by reference to Exhibit 99.1 of the registrant’s Current Report on Form 8-K dated as of January 15, 2007, File No. 1-12387).+10.27—Tenneco Inc. Change in Control Severance Benefit Plan for Key Executives, as Amended and Restated effective December 12, 2007 (incorporated herein by reference to Exhibit 10.61 of the registrant’s Annual Report on Form 10-K for the year ended December 31, 2008, File No. 1-12387). + 10.2810.23 — Letter Agreement dated January 5, 2007 between the registrant and Timothy E. Jackson (incorporated herein by reference to Exhibit 10.69 of the registrant’s Annual Report on Form 10-K for the year ended December 31, 2007, File No. 1-12387).+10.29—Excess Benefit Plan, including Supplements for Gregg M. Sherrill and Kenneth R. Trammell (incorporated herein by reference to Exhibit 10.65 of the registrant’s Annual Report on Form 10-K for the year ended December 31, 2008, File No. 1-12387).+10.30—Amendment No. 2 to Change in Control Severance Benefit Plan for Key Executives (incorporated herein by reference to Exhibit 10.66 of the registrant’s Annual Report on Form 10-K for the year ended December 31, 2008, File No. 1-12387). ExhibitNumberDescription+ 10.3110.24 — Incentive Deferral Plan, as Amended and Restated Effective as of January 1, 2008 (incorporated herein by reference to Exhibit 10.67 of the registrant’s Annual Report on Form 10-K for the year ended December 31, 2008, File No. 1-12387).+10.32—Code Section 409A Amendment to 2002 Long-Term Incentive Plan (incorporated herein by reference to Exhibit 10.68 of the registrant’s Annual Report on Form 10-K for the year ended December 31, 2008, File No. 1-12387). + 10.3310.25 — Code Section 409A Amendment to 2006 Long-Term Incentive Plan (incorporated herein by reference to Exhibit 10.69 of the registrant’s Annual Report on Form 10-K for the year ended December 31, 2008, File No. 1-12387). + 10.3410.26 — Code Section 409A to Excess Benefit Plan (incorporated herein by reference to Exhibit 10.70 of the registrant’s Annual Report on Form 10-K for the year ended December 31, 2008, File No. 1-12387).+10.35—Code Section 409A Amendment to Supplemental Retirement Plan (incorporated herein by reference to Exhibit 10.71 of the registrant’s Annual Report on Form 10-K for the year ended December 31, 2008, File No. 1-12387). + 10.3610.27 — Code Section 409A Amendment to Supplemental Pension Plan for Management (incorporated herein by reference to Exhibit 10.72 of the registrant’s Annual Report on Form 10-K for the year ended December 31, 2008, File No. 1-12387). + 10.3710.28 — Code Section 409A Amendment to Amended and Restated Value Added (“TAVA”) Incentive Compensation Plan (incorporated herein by reference to Exhibit 10.73 of the registrant’s Annual Report on Form 10-K for the year ended December 31, 2008, File No. 1-12387). + 10.3810.29 — Code Section 409A Amendment to Letter Agreement between the registrant and Gregg M. Sherrill (incorporated herein by reference to Exhibit 10.74 of the registrant’s Annual Report on Form 10-K for the year ended December 31, 2008, File No. 1-12387).+10.39—Code Section 409A Amendment to Letter Agreement between the registrant and Hari N. Nair (incorporated herein by reference to Exhibit 10.75 of the registrant’s Annual Report on Form 10-K for the year ended December 31, 2008, File No. 1-12387).+10.40—Code Section 409A Amendment to Letter Agreement between the registrant and Timothy E. Jackson (incorporated herein by reference to Exhibit 10.76 of the registrant’s Annual Report on Form 10-K for the year ended December 31, 2008, File No. 1-12387).+10.41—Tenneco Inc. 2006 Long-Term Incentive Plan (as amended and restated effective March 11, 2009) (incorporated herein by reference to Appendix A of the registrant’s proxy statement on Schedule 14A, filed with the Securities and Exchange Commission on March 31, 2009, File No. 1-12387). + 10.4210.30 — Amendment No. 2, effective January 15, 2010, to Amended and Restated Tenneco Value Added Incentive Compensation Plan (incorporated herein by reference to Exhibit 10.70 of the registrant’s Annual Report on Form 10-K for the year ended December 31, 2009, File No. 1-12387). + 10.4310.31 — Form of Tenneco Inc. Three Year Long-Term Performance Unit Award Agreement (incorporated herein by reference to Exhibit 10.1 of the registrant’s Current Report on Form 8-K dated as of March 15, 2010, File No. 1-12387). +10.32 — First Amendment dated December 18, 2009, to Tenneco Inc. Change in Control Severance Benefit Plan for Key Executives, as Amended and Restated effective December 12, 2007 (incorporated herein by reference to Exhibit 10.3 of the registrant’s Quarterly Report on Form 10-Q for the quarter ended March 31, 2011, File No. 1-12387).+10.33 — Form of Restricted Stock Award for Non-Employee Directors under Tenneco Inc. 2006 Long-Term Incentive Deferral Plan (incorporated herein by reference to Exhibit 10.7110.1 of the registrant’s Current Report on Form 8-K dated January 18, 2012, File No. 1-12387).+10.34 — Form of Non-Qualified Stock Option Agreement for Employees under Tenneco Inc. 2006 Long-Term Incentive Plan (incorporated herein by reference to Exhibit 10.3 of the registrant’s Current Report on Form 8-K dated January 18, 2012, File No. 1-12387). +10.35 — Letter Agreement between Tenneco Inc. and Gregg M. Sherrill (incorporated herein by reference to Exhibit 99.2 of the registrant's Current Report on Form 8-K dated as of January 5, 2007. File No. 1-12387). +10.36 — Letter Agreement between Tenneco Inc. and Gregg M. Sherrill, dated as of January 15, 2007 (incorporated herein by reference to Exhibit 99.1 of the registrant’s Current Report on Form 8-K dated as of January 15, 2007, File No. 1-12387). +10.37 — Code Section 409A Amendment to Letter Agreement between the registrant and Gregg M. Sherrill (incorporated herein by reference to Exhibit 10.74 of the registrant’s Annual Report on Form 10-K for the year ended December 31, 2009,2008, File No. 1-12387). 10.44+10.38 — General Manager Service Contract, dated as of March 1, 2007, between Heinrich Gillet GmbH and Josep Fornos (incorporated herein by reference from Exhibit 10.87 of the registrant’s Annual Report on Form 10-K for the year ended December 31, 2011, File No. 1-12387). +10.39 — Letter of Understanding, dated as of January 2012, between Tenneco Inc. and Josep Fornos. 10.40 — Third Amended and Restated Receivables Purchase Agreement, dated as of March 26, 2010, among Tenneco Automotive RSA Company, as Seller, Tenneco Automotive Operating Company Inc., as Servicer, Falcon Asset Securitization Company LLC and Liberty Street Funding LLC, as Conduits, the Committed Purchasers from time to time party thereto, JPMorgan Chase Bank, N.A., The Bank of Nova Scotia and Wells Fargo Bank, N.A., as Co-Agents and JPMorgan Chase Bank, N.A., as Administrative Agent (incorporated herein by reference to Exhibit 10.1 of the registrant’s Current Report on Form 8-K dated as of March 26, 2010, File No. 1-12387). 10.4510.41 — Intercreditor Agreement, dated as of March 26, 2010, among Tenneco Automotive RSA Company, Tenneco Automotive Operating Company Inc., JPMorgan Chase Bank, N.A. and Wells Fargo Bank, N.A. (incorporated herein by reference to Exhibit 10.2 of the registrant’s Current Report on Form 8-K dated as of March 26, 2010, File No. 1-12387). 10.4610.42 — Omnibus Amendment No. 4, dated as of March 26, 2010, to Receivables Sale Agreements, as amended (incorporated herein by reference to Exhibit 10.3 of the registrant’s Current Report on Form 8-K dated as of March 26, 2010, File No. 1-12387). 10.4710.43 — SLOT Receivables Purchase Agreement, dated as of March 26, 2010, among Tenneco Automotive RSA Company, as Seller, Tenneco Automotive Operating Company Inc., as Servicer, and Wells Fargo Bank, N.A., individually and as SLOT Agent (incorporated herein by reference to Exhibit 10.4 of the registrant’s Current Report on Form 8-K dated as of March 26, 2010, File No. 1-12387). 10.4810.44 — Fourth Amended and Restated Performance Undertaking, dated as of March 26, 2010, by the registrant in favor of Tenneco Automotive RSA Company (incorporated herein by reference to Exhibit 10.5 of the registrant’s Current Report on Form 8-K dated as of March 26, 2010, File No. 1-12387). +10.4910.45 — Form of Tenneco Inc. Three Year Long-Term Performance Unit Award Agreement (incorporated herein by reference to Exhibit 10.1 of the registrant’s Current Report on Form 8-K dated as of March 15, 2010, File No. 1-12387).+10.50—Form of Tenneco Inc. 2006 Long-Term Incentive Plan Restricted Stock Award Agreement (incorporated herein by reference to Exhibit 10.1 of the registrant’s Quarterly Report on Form 10-Q for the quarter ended September 30, 2010, File No. 1-12387).+10.51—Second Amendment to Tenneco Inc. Incentive Deferral Plan effective as of January 1, 2011 (incorporated herein by reference to Exhibit 10.1 of the registrant’s Quarterly Report on Form 10-Q for the quarter ended September 30, 2010, File No. 1-12387). 10.52—Amendment No. 1 to Third Amended and Restated Receivables Purchase Agreement, dated as of March 25, 2011, among Tenneco Automotive RSA Company, as Seller, Tenneco Automotive Operating Company Inc., as Servicer, Falcon Asset Securitization Company LLC and Liberty Street Funding LLC, as Conduits, the Committed Purchasers from time to time party thereto, JPMorgan Chase Bank, N.A., The Bank of Nova Scotia and Wells Fargo Bank, N.A., as Co-Agents and JPMorgan Chase Bank, N.A., as Administrative Agent (incorporated herein by reference from Exhibit 10.1 of the registrant’s Current Report on Form 8-K dated as of March 29, 2011, File No. 1-12387). 10.5310.46 — Amendment No. 1 to SLOT Receivables Purchase Agreement, dated as of March 25, 2011, among Tenneco Automotive RSA Company, as Seller, Tenneco Automotive Operating Company Inc. as Servicer, and Wells Fargo Bank, N.A., individually and as SLOT Agent (incorporated herein by reference from Exhibit 10.2 of the registrant’s Current Report on Form 8-K dated as of March 29, 2011, File No. 1-12387). +10.5410.47 — First Amendment to Tenneco Inc. Change in Control Severance Benefit Plan for Key Executives, as Amended and Restated effective December 12, 2007 (incorporated herein by reference to Exhibit 10.3 of the registrant’s Quarterly Report on Form 10-Q for the quarter ended March 31, 2011, File No. 1-12387).+10.55—Form of Restricted Stock Award for Non-Employee Directors under Tenneco Inc. 2006 Long-Term Incentive Plan (incorporated herein by reference to Exhibit 10.1 of the registrant’s Current Report on Form 8-K dated January 18, 2012, File No. 1-12387).+10.56—Form of Restricted Stock Award for Employees under Tenneco Inc. 2006 Long-Term Incentive Plan (incorporated herein by reference to Exhibit 10.2 of the registrant’s Current Report on Form 8-K dated January 18, 2012, File No. 1-12387).ExhibitNumberDescription +10.57—Form of Non-Qualified Stock Option Agreement for Employees under Tenneco Inc. 2006 Long-Term Incentive Plan (incorporated herein by reference to Exhibit 10.3 of the registrant’s Current Report on Form 8-K dated January 18, 2012, File No. 1-12387). +10.58—General Manager Service Contract, dated as of March 1, 2007, between Heinrich Gillet GmbH and Josep Fornos (incorporated herein by reference from Exhibit 10.87 of the registrant’s Annual Report on Form 10-K for the year ended December 31, 2011, File No. 1-12387). +10.59Letter of Understanding, dated as of December 2, 2010, between Tenneco Inc. and Josep Fornos (incorporated herein by reference from Exhibit 10.88 of the registrant’s Annual Report on Form 10-K for the year ended December 31, 2011, File No. 1-12387). 10.60—Amendment No. 2 to Third Amended and Restated Receivables Purchase Agreement, dated as of March 23, 2012 (incorporated herein by reference from Exhibit 10.1 of the registrant’s Current Report on Form 8-K dated as of March 26, 2012, File No. 1-12387). 10.6110.48 — Amendment No. 2 to SLOT Receivables Purchase Agreement, dated as of March 23, 2012 (incorporated herein by reference from Exhibit 10.2 of the registrant’s Current Report on Form 8-K dated as of March 26, 2012, File No. 1-12387). 1110.49— Omnibus Amendment No. 5 to Receivables Sale Agreements and Amendment No. 3 to Third Amended and Restated Receivables Purchase Agreement, dated March 22, 2013 (incorporated herein by reference from Exhibit 10.1 of the registrant’s Current Report on Form 8-K dated as of March 22, 2013, File No. 1-12387). 10.50 — Amendment No. 3 to SLOT Receivables Purchase Agreement, dated as of March 22, 2013 (incorporated herein by reference from Exhibit 10.2 of the registrant’s Current Report on Form 8-K dated as of March 22, 2013, File No. 1-12387). 10.51 — Amendment No. 4 to SLOT Receivables Purchase Agreement, dated May 22, 2013 (incorporated herein by reference from Exhibit 10.41of the registrant’s Current Report on Form 8-K dated as of May 28, 2013, File No. 1-12387). +10.52 — Tenneco Inc. Executive Bonus Plan (incorporated herein by reference from Exhibit 99.1 of the registrant’s Current Report on Form 8-K dated as of January 15, 2014, File No. 1-12387). +10.53 — Amended and Restated Tenneco Inc. 2006 Long-Term Incentive Plan (effective March 18, 2013) (incorporated by reference to Appendix A of the Company’s Proxy Statement on Schedule 14A, filed with the Securities and Exchange Commission on April 3, 2013). +10.54 — Form of Restricted Stock Award Agreement for Employees under Tenneco Inc. 2006 Long-Term Incentive Plan (awards after May 21, 2013) (incorporated herein by reference from Exhibit 10.3 of the registrant’s Current Report on Form 8-K dated as of May 21, 2013, File No. 1-12387). +10.55 — Form of Stock Option Award Agreement for Employees under Tenneco Inc. 2006 Long-Term Incentive Plan (awards after May 21, 2013) (incorporated herein by reference from Exhibit 10.4 of the registrant’s Current Report on Form 8-K dated as of May 21, 2013, File No. 1-12387). +10.56 — Form of Tenneco Inc. Long-Term Performance Unit Award Agreement under Tenneco Inc. 2006 Long-Term Incentive Plan (grants after January 14, 2014) (incorporated herein by reference from Exhibit 99.2 of the registrant’s Current Report on Form 8-K dated as of January 15, 2014, File No. 1-12387). Description 10.57 — Amendment No. 4 to Third Amended and Restated Receivables Purchase Agreement, dated as of March 21, 2014 (incorporated herein by reference to Exhibit 10.1 of the registrant's Current Report on Form 8-K dated March 21, 2014, File No. 1-12387). 10.58 — Amendment No. 5 to SLOT Receivables Purchase Agreement, dated March 21, 2014 (incorporated herein by reference to Exhibit 10.2 of the registrant's Current Report on Form 8-K dated March 21, 2014, File No. 1-12387). +10.59 — Offer Letter to Brian J. Kesseler dated January 6, 2015 (incorporated herein by reference to Exhibit 10.67 of the registrant's Annual Report on Form 10-K for the year ended December 31, 2014, File No. 1-12387). +10.60 — Tenneco Inc. Excess Benefit Plan (as amended and restated effective as of January 1, 2013) (incorporated by reference to Exhibit 10.5 of Tenneco Inc.'s Quarterly Report on Form 10-Q for the quarter ended June 30, 2013, File No. 1-12387). +10.61 — First Amendment to Amended and Restated Tenneco Inc. Excess Benefit Plan (amendment effective as of January 6, 2015) (incorporated by reference to Exhibit 10.5 of Tenneco Inc.'s Quarterly Report on Form 10-Q for the quarter ended March 31, 2015, File No. 1-12387). +10.62 — Second Amendment to Tenneco Inc. Change in Control Severance Benefit Plan for Key Executives (incorporated by reference to Exhibit 10.1 of registrant's Current Report on form 8-K dated April 28, 2015, File No. 1.12387). +10.63 — Form of Restricted Stock Award for Brian J. Kesseler (January 2015 replacement grant) under Tenneco Inc. 2006 Long-Term Incentive Plan (incorporated herein by reference to Exhibit 10.71 of the registrant's Annual Report on Form 10-K for the year ended December 31,2014, File No. 1-12387). 10.64 — Amendment No. 5 to Third Amended and Restated Receivables Purchase Agreement, dated as of March 20, 2015 (incorporated herein by reference to Exhibit 10.1 of the registrant's Current Report on Form 8-K dated March 20, 2016, File No. 1-12387). +10.65 — Amendment No. 6 to SLOT Receivables Purchase Agreement, dated as of March 20, 2015 (incorporated herein by reference to Exhibit 10.2 of the registrant's Current Report on Form 8-K dated March 20, 2015, File No. 1-12387). +10.66 — Tenneco Inc. Deferred Compensation Plan (as Amended and Restated Effective as of August 1, 2013) (incorporated by reference to Exhibit 10.6 of Tenneco Inc.'s Quarterly Report on Form 10-Q for the quarter ended June 30, 2013, File No. 1-12387). +10.67 — Tenneco Inc. Incentive Deferral Plan (as Amended and Restated Effective as of August 1, 2013) (incorporated by reference to Exhibit 10.7 of Tenneco Inc.'s Quarterly Report on Form 10-Q for the quarter ended June 30, 2013, File No. 1-12387). *+10.68 — Letter Agreement dated September 9, 2010 between the registrant and Enrique Orta. *+10.69 — Letter Agreement dated February 19, 2015 between the registrant and Enrique Orta. *+10.70 — Amendment dated July 14, 2015 to Letter Agreement dated February 19, 2015 between the registrant and Enrique Orta. 11 — None. *12*12 — Computation of Ratio of Earnings to Fixed Charges. 13 — None. 14 — Tenneco Inc. Code of Ethical Conduct for Financial Managers (incorporated herein by reference from Exhibit 99.3 to the registrant’s Annual Report on Form 10-K for the year ended December 31, 2002, File No. 1-12387). 16 — None. 18 — None. *21*21 — List of Subsidiaries of Tenneco Inc. 22 — None. *23.1*23.1 — Consent of PricewaterhouseCoopers LLP. *24*24.1 — Powers of Attorney. *31.1*31.1 — Certification of Gregg M. Sherrill under Section 302 of the Sarbanes-Oxley Act of 2002. *31.2*31.2 — Certification of Kenneth R. Trammell under Section 302 of the Sarbanes-Oxley Act of 2002. *32.1*32.1 — Certification of Gregg M. Sherrill and Kenneth R. Trammell under Section 906 of the Sarbanes-Oxley Act of 2002. 33 — None. —Description34 — None. 3435 — None. 3599 — None. 99100 — None. 100101 — None. 101—None. *101.INS — XBRL Instance Document. *101.SCH — XBRL Taxonomy Extension Schema Document. *101.CAL — XBRL Taxonomy Extension Calculation Linkbase Document. *101.DEF — XBRL Taxonomy Extension Definition Linkbase Document. *101.LAB — XBRL Taxonomy Extension Label Linkbase Document. *101.PRE — XBRL Taxonomy Extension Presentation Linkbase Document. * Filed herewith. + Indicates a management contract or compensatory plan or arrangement. TENNECO INC. By Gregg M. Sherrill Chairman and Chief Executive Officer 27, 201327, 2012.24, 2016. Gregg M. Sherrill Chairman and Chief Executive Officer and Director (principal executive officer) Gregg M. Sherrill /S/ KENNETH R. TRAMMELL Kenneth R. Trammell Kenneth R. Trammell * Paul D. Novas Vice President and Controller (principal accounting officer) John E. Kunz * Thomas C. Freyman Director Thomas C. Freyman * Dennis J. Letham Director Dennis J. Letham * Hari N. Nair Director James S. Metcalf * Roger B. Porter Director Roger B. Porter * David B. Price, Jr. Director David B. Price, Jr. * Paul T. Stecko Director Paul T. Stecko * Mitsunobu Takeuchi Director ** Director *BY: Roger J. Wood 151