UNITED STATES SECURITIES AND EXCHANGE COMMISSION
Washington, D.C. 20549
Form 10-K
(Mark One)
| þ | ANNUAL REPORT PURSUANT TO SECTION 13 OR 15(d) OF THE SECURITIES EXCHANGE ACT OF 1934 |
For the fiscal year ended December 31, 20122013
OR
| ¨ | TRANSITION REPORT PURSUANT TO SECTION 13 OR 15(d) OF THE SECURITIES EXCHANGE ACT OF 1934 |
For the transition period from to
Commission file number 001-33707
CONSTANT CONTACT, INC.
(Exact name of registrant as specified in its charter)
| Delaware | 04-3285398 | |
(State or other jurisdiction of incorporation or organization) | (I.R.S. Employer Identification No.) | |
1601 Trapelo Road, Third Floor Waltham, Massachusetts | 02451 | |
| (Address of principal executive offices) | (Zip code) | |
(781) 472-8100
(Registrant’s telephone number, including area code)
Securities registered pursuant to Section 12(b) of the Act:
Title of Class | Name of Exchange on Which Registered | |
| Common Stock, $.01 par value | NASDAQ Global Select Market |
Securities registered pursuant to Section 12(g) of the Act:
None.
Indicate by check mark if the registrant is a well-known seasoned issuer, as defined in Rule 405 of the Securities Act. Yes ¨þ No þ¨
Indicate by check mark if the registrant is not required to file reports pursuant to Section 13 or Section 15(d) of the Act. Yes ¨ No þ
Indicate by check mark whether the registrant: (1) has filed all reports required to be filed by Section 13 or 15(d) of the Securities Exchange Act of 1934 during the preceding 12 months (or for such shorter period that the registrant was required to file such reports), and (2) has been subject to such filing requirements for the past 90 days. Yes þ No ¨
Indicate by check mark whether the registrant has submitted electronically and posted on its corporate Web site, if any, every Interactive Data File required to be submitted and posted pursuant to Rule 405 of Regulation S-T during the preceding 12 months (or for such shorter period that the registrant was required to submit and post such files). Yes þ No ¨
Indicate by check mark if disclosure of delinquent filers pursuant to Item 405 of Regulation S-K is not contained herein, and will not be contained, to the best of the registrant’s knowledge, in definitive proxy or information statements incorporated by reference in Part III of this Form 10-K or any amendment to this Form 10-K. ¨
Indicate by check mark whether the registrant is a large accelerated filer, an accelerated filer, a non-accelerated filer, or a smaller reporting company. See the definitions of “large accelerated filer,” “accelerated filer” and “smaller reporting company” in Rule 12b-2 of the Exchange Act. (Check one):
Large accelerated filer | Accelerated filer | Non-accelerated filer ¨ | Smaller reporting company ¨ | |||
| (Do not check if a smaller reporting company) | ||||||
Indicate by check mark whether the registrant is a shell company (as defined in Rule 12b-2 of the Exchange Act). Yes ¨ No þ
The aggregate market value of the voting and non-voting common stock held by non-affiliates of the registrant as of June 29, 2012,28, 2013, the last business day of the registrant’s most recently completed second fiscal quarter, was $532,492,649$481,095,143 based upon the closing price reported for such date on the NASDAQ Global Select Market (assuming, for this purpose, that only the registrant’s directors and executive officers are deemed affiliates).
As of February 25, 2013,28, 2014, the registrant had 30,684,98431,291,381 shares of Common Stock, $0.01 par value per share, outstanding.
Portions of the registrant’s definitive proxy statement to be filed with the Securities and Exchange Commission for the registrant’s 20132014 annual meeting of stockholders are incorporated by reference into Items 10, 11, 12, 13 and 14 of Part III of this Annual Report on Form 10-K.
INDEX
Forward-Looking Statements
Matters discussed in this Annual Report on Form 10-K relating to future events or our future performance, including any discussion, express or implied, of our anticipated growth, operating results, liabilities and obligations, litigation, future earnings per share, product plans, market opportunity, and other plans and objectives, are “forward-looking statements” within the meaning of Section 27A of the Securities Act of 1933 and Section 21E of the Securities Exchange Act of 1934. These statements are often, but not always, identified by the words “believe”, “positioned”, “estimate”, “project”, “target”, “continue”, “intend”, “expect”, “future”, “anticipates”, “objectives”, and similar expressions that are not statements of historical fact. These statements are not guarantees of future events or future performance and involve certain risks, uncertainties and assumptions that are difficult to predict. Our actual results and timing of events could differ materially from those anticipated in these forward-looking statements as a result of certain factors, including, but not limited to, those set forth under Item 1A — “Risk Factors” and those included elsewhere in this Annual Report on Form 10-K and in our other public filings with the Securities and Exchange Commission. It is routine for internal projections and expectations to change as the year or each quarter in the year progresses, and therefore it should be clearly understood that all forward-looking statements and the internal projections, judgments and beliefs upon which we base our expectations included in this Annual Report on Form 10-K, other periodic reports or otherwise are made only as of the date made and may change. While we may elect to update forward-looking statements at some point in the future, we do not undertake any obligation to update any forward-looking statements whether as a result of new information, future events or otherwise.
References in this Annual Report on Form 10-K to “Constant Contact”, the “Company”, “we” or “us” mean Constant Contact, Inc. and our wholly-owned subsidiaries.
PART I
| ITEM 1. | BUSINESS |
Overview
Constant Contact is a leading provider of on-demand Engagement Marketing™online marketing tools that are designed for small organizations, including small businesses, associations and non-profits. Our tools include our email marketing, social media marketing, event marketing, local deals and survey products. In June 2012, we began offering a mobile storefront tool following our acquisition of SinglePlatform, Corp., or SinglePlatform. We seek to help our customers succeed by creating and growing their customer and member relationships through our easy-to-use products combined with education, support, KnowHow® and coaching. Engagement marketing is marketing to current customers, clients and fans to create interest through an ongoing dialog. By enabling sharing, endorsement and engagement across all channels, we believe small organizations will generate new and repeat business. Our engagementsuite of online marketing productstools, which include Email Marketing, EventSpot®, Social Campaigns™, SaveLocal™, SinglePlatform and Survey, enable our customers to launch and monitor marketing campaigns across multiple channels, including email, social media, events, local deals, online listings and surveys.
Our email marketing product allows small organizations to create, send and track professional and affordable permission-based email marketing campaigns. With these campaigns, weWe believe our customers build stronger relationships with their customers and members, expand their membership base and increase sales. We launched Social Campaigns™ in January 2012. Social Campaigns helps users create, publish, promote and run campaigns on Facebook® that offer promotions or content targeted toward those who “Like” them and to incent others to “Like” and share. EventSpotTM, our event marketing product, allows our customers to promote and manage events and create event homepages, track event registrations and collect online payments. During 2012, we also launched SaveLocalTM, an online tool that helps small businesses retain existing customers and attractprimary growth levers include (i) acquiring new customers, by offering local deals. In June 2012, we acquired SinglePlatform, a company that helps small businesses get discovered through web(ii) increasing our revenue per customer and mobile searches by providing a single place to update important business information, a “digital storefront”. SinglePlatform enables businesses to reach more than 200 million consumers across its extensive publishing network. Our online survey product enables(iii) improving our customers to easily create and send surveys and receive immediate and actionable feedback. We enable customers to expand the reach of their email and social campaigns, events, local deals and surveys by expanding their reach through Facebook, LinkedIn®, Twitter® and many other social platforms. NutshellMail™ is our free social media monitoring tool that allows our customers to receive and respond to updates on their social media networks. Through the acquisition of CardStar, Inc., or CardStar, in January 2012, we offer the CardStar® mobile phone application that allows consumers to easily manage loyalty, rewards and membership cards on a mobile phone.
As of December 31, 2012, we had approximately 555,000 unique paying customers. Our customers include various types of small organizations including retailers, restaurants, law and accounting firms, consultants, non-profits, religious organizations and alumni associations.
customer retention rates. We market our products and acquire customers through a variety of sources including online advertising, partner relationships, television and radio advertising, regional (i.e., local) initiatives, referrals and brand awareness. Our online advertising includes search engine marketing and advertising on online networks and other websites, including banner advertising. We have partner relationships with over 9,50010,000 local and national small business service providers. These partners refer customers to us through links on their websites and outbound promotions to their customers or allow us to market to their customers directly. Our television and radio advertising is designed to educate potential customers about our marketing solutions and raise awareness of our brand. Our regional initiatives include local seminars and local online advertising. We employ 2122 regional development directors across the U.S. and Canada and we have a marketing office in the United Kingdom. Additionally, we enhance our local reach through approximately 275 specially trained independent local experts that are integratedcollaborate with our regional development directors and who are trained in both engagementonline marketing best practices and our products. Together, our regional development directors and local experts presented to approximately 165,000over 180,000 small businesses and organizations in 2012.2013. A significant number of our new customers come to us from word-of-mouth referrals
from our existing customers and from the inclusion of a link to our website in the footer of substantially all of the over 45 billion emails sent by our customers. In 2013, our customers sent over 60 billion emails.
We sell our products through subscription arrangements priced and sold as separate products. Many of our customers purchase multiple products from us and our average monthly revenue for 2013 was $41.36 per customer. We continue to test pricing and product bundling. Bundled product offerings provide access to multiple products for one set monthly fee. We expect to offer a variety of packages that will contain different product combinations and pricing tiers. We believe, when used in 2012. We also believecombination, our general brand awareness, pressintegrated products provide customers with a unified online marketing platform and thought leadership initiativesthat by offering bundles, we will be able to drive increased product usage, increased revenue per customer and overall visibility generate interest in our products.higher retention rates.
As of December 31, 2013, we had approximately 595,000 unique paying customers. Our customers include various types of small organizations including retailers, restaurants, law and accounting firms, consultants, non-profits, religious organizations and alumni associations.
We were incorporated in Massachusetts in 1995 under the name Roving Software Incorporated. We reincorporated in Delaware in 2000 and changed our name to Constant Contact, Inc. in 2006. Our on-demand email marketing product was first offered in 2000.
Our principal executive offices are located at 1601 Trapelo Road, Waltham, Massachusetts 02451. Our telephone number is (781) 472-8100. Our website address iswww.constantcontact.com.We are not including the information contained on our website or any information that may be accessed by links on our website as part of, or incorporating it by reference into, this Annual Report on Form 10-K. Through a link on the Investor Relations section of our website, we make available our filings with the Securities and Exchange Commission, or SEC, after they are electronically filed with or furnished to the SEC. All such filings are available free of charge. These filings are also available, free of charge, atwww.sec.govor at the SEC’s Public Reference Room at 100 F Street, NE, Washington, DC 20549.
Market Opportunity
We believe our engagementintegrated suite of online marketing tools, including our on-demand email marketing, social media marketing, event marketing, local deals, mobile storefrontsonline listings and online survey products, provide significant benefits for small organizations. We believe online marketing is an effective way for smaller organizations to create new relationships and maintain and grow existing relationships.
Small organizations represent a large market opportunity both in the U.S and abroad. According to the most recently available estimates from the Small Business Administration and the National Center for Charitable Statistics, there are over 29 million registered small businesses and non-profits in the United States. We believe our products could potentially address the needs of many of these small organizations. We also believe opportunities exist to more aggressively market our products outside the U.S. Finally, small organizations face unique challenges when adopting online marketing, including unfamiliarity with online marketing tools, uncertainty with respect to the benefits of online marketing, lack of technical and marketing expertise, and limited budgets and time constraints. These constraints are highlighted during times of economic uncertainty. We have designed our engagementonline marketing platform and our approach to education, support and coaching to address these challenges.
Business StrengthsCompetitive Advantage
We believe that the following business strengths differentiate us from our competitors and contribute to our success:
| • | Brand Recognition and Reach. We believe the Constant Contact brand is widely recognized in the small business community. A |
| • | Integrated Product Offerings. Since launching our email marketing product in 2000, we have continued to expand our product offerings. We now offer social media marketing, event marketing, local deals, online listings and online survey products as well as CardStar®, a free mobile phone application that allows consumers to easily manage loyalty, rewards and membership cards on a mobile phone and NutshellMail™, a free social media monitoring tool. When used in combination, we believe our integrated products provide customers with a unified online marketing platform that enhances their ability to create, build and strengthen customer relationships. We continue to test new bundled product offerings that will allow our customers to have access to multiple products for one monthly fee. |
| • | Significant Base of Recurring Revenue. We benefit from a high level of customer loyalty. Our monthly retention rate of unique paying customers remains in our historical range of 97.8%, plus or minus 0.5%. On average, our customers stay with us and generate revenue for approximately 50 months. We believe this represents a strong level of engagement and provides us with a significant base of recurring revenue and visibility into future performance. |
| • | Attractive Customer Life-Time Value Model. We currently estimate a customer lifetime-value of approximately $950 per unique customer. We calculate customer lifetime-value by subtracting cost of goods sold and sales and marketing expense on a per-unit basis from estimated customer lifetime revenue (calculated by applying our historical retention rate to revenue per unique customer). |
| • | Solutions Tailored to Meet the Needs of Small Organizations. With millions of customer interactions each year by way of personal coaching and support, seminars, online tutorials, ongoing market research and customer surveys, we believe we have unique insights into the motivations and challenges facing small organizations. Our easy-to-use and affordable integrated suite of online marketing products, education, support, KnowHow and coaching are designed to help our customers succeed. |
| • |
|
|
|
|
Commitment to Delighting our Customers. We seek to delight our customers whenever possible. We do so through easy-to-use products, free unlimited support, KnowHow, coaching and education in the form of local seminars, webinars and tutorials. We believe that our commitment to delighting our customers and prospects drives our success. |
| • |
|
Software-as-a-Service (SaaS). We provide our products on an on-demand basis, meaning that our customers can access and use our products through a standard web and mobile browser. This enables our customers to quickly begin using our products with minimal up-front costs and limited technical expertise. It also allows us to deploy new applications and upgrades quickly and efficiently to our entire customer base. |
GrowthOur Strategy
Our growth strategy is driven by the following:
| • | Acquire New Customers. We |
| • | Increase Revenue |
| • | Retain our Customers. We continuously seek to improve customer retention rates. We study the attributes of customers we have retained and |
| • | Multi-Product Offering. We believe there is significant opportunity in bundling and packaging our products on a common |
| • | Expand our Partner Distribution Channel. We currently have partner relationships with over |
| • | Pursue Complementary Acquisitions. We have made complementary acquisitions in the past and we intend to continue to evaluate potential acquisitions of additional technologies or businesses to enhance our technology and our product offerings and to access new customers and markets. |
| • | Expand Internationally. We currently sell our products to customers in over 180 countries and territories, despite limited marketing efforts outside of the U.S. We have two regional development directors in Canada and a marketing office in the United Kingdom. We also offer certain customer support services in Spanish, including email marketing templates and webinars. We believe that opportunities exist to further expand our presence outside the U.S. |
Our Products and Services
Email Marketing
Our email marketing product allows customers to easily create, send and track professional-looking email campaigns. Our email marketingThe product provides customers with the following features:
|
|
|
|
|
|
|
|
|
For the year ended December 31, 2012, revenue from our email marketing product alone was approximately 85% of our total revenue.
Social Media
Social Campaigns
We launched Social Campaigns in January 2012. Social Campaigns allows usersincludes a campaign creation wizard that makes it easy to create publish, promote and runedit email campaigns on Facebookwith access to over 300 pre-designed email campaign templates that reflect a wide variety of themes and styles and over 15 million images through our relationship with Bigstock®, a subsidiary of Shutterstock, Inc. Our contact list growth and management tools include file and spreadsheet import functionality as well as software plug-ins to import contact lists from other applications. We also offer promotionsmarket leading free tools and applications that allow customers to add and update contacts, including adding contacts directly from a computer or content targeted toward those who “Like” them and to incent others to “Like” and share them. Social Campaigns can be promoted topoint of sale device, an iPhone® application with list building features, a “Join My Mailing List” application for a customer’s email list,website, blog and Facebook® page, and “text to existing Facebook fans, on LinkedInjoin” and “scan to Twitter followers. Social Campaigns enables small organizations to create professional looking pages on Facebookjoin” offerings for mobile devices. Delivery management tools are incorporated throughout our product and drive social media engagement through campaignsare designed to help grow their fan base, spark conversationmaintain our high deliverability rates. To improve the percentage of emails delivered, we work closely with Internet service providers, or ISPs, on spam prevention issues, which increases the likelihood that our customers’ emails will reach the inbox. Email tracking and generate social word of mouth.
Social Media Marketing
We have incorporated social media marketing features into all of our products. These featuresreporting mechanisms enable our customers to extendreview and analyze the reachoverall effectiveness of their emaila campaign by tracking and reporting aggregate and individual information about delivery, open rates and click-rates on links within a communication. Email campaigns events and surveys beyond their own contactscan be easily shared across multiple social media networks using our Simple Share and Tweet this Email and Tweet this Event tools.™. In addition, our customers may add social media links, such as links to Facebook pages and Twitter® feeds, as well as “Share” and “Like” buttons, to their emails to encourage recipients to share and events. The Social Stats feature provides easy access to social media analytics and our Social Share feature lets our customers publish their content to Facebook, Twitter, LinkedIn and otherconnect on social networks.
Social Media Monitoring With MyLibrary Plus, we enable customers to store and edit images, download stock images and create a hosted version of current and past email campaigns on our system and make them readily available to their constituents via a link on a customer’s website or on Facebook or Twitter.
NutshellMail,For the year ended December 31, 2013, revenue from our free social media monitoring tool, aggregates updates from mostemail marketing product alone was approximately 84% of the popular social media networking sites in an email that is sent to our customers at specified intervals. Supported sites include Facebook, Twitter, LinkedIn, Yelp®, MySpace®, YouTube®, foursquare® and Citysearch®.
Social Media Learning Tools
Our Social Media Quickstarter is a collection of simple guides to help our customers learn how to build online social connections in a fast and easy manner. Topics include a social media primer, sections dedicated to specific social network sites such as Facebook, Twitter, LinkedIn and YouTube, as well as topics on ratings and reviews, location based services, QR codes and integrating email and social media marketing.total revenue.
EventSpot
Our event marketing product allows our customers to promote and manage events, communicate with invitees and registrants, capture and track registrations and collect online payments. We make online registration quick and easy by offering convenient, customizable forms to capture names and email addresses and other company or personal information. Our product includes an event marketing product providescreation wizard, over 150 preformatted and customizable event templates and list management capabilities as well as a hosted event homepage that includes event details, special guests and integrated online maps. Links on the homepage bring visitors to the registration page. The homepage can also be used to share post-event photos, materials and presentations. Social media capabilities allow our customers with the following features:
|
|
|
|
|
|
|
Social Campaigns and Social Media
Our social media products include Social Campaigns™, which empowers customers to reach and engage users on Facebook to grow their fans and create social word-of-mouth through easy-to-create offers and promotions. For customers looking for more assistance, our SocialConcierge “Do-It-For-Me” offering assists customers in a range of services including setting up social media profiles, publishing posts and responding to comments and managing Social Campaigns and Facebook ads. To enable customers to monitor and manage their social media accounts and relationships, we offer NutshellMail, a free monitoring tool that aggregates social media activity and updates into an easy-to-read email digest that is delivered directly to a customer’s inbox at specified intervals.
We have incorporated social media features into our products. Our Simple Share feature makes it easy for customers to promote their campaigns across major social networks, including Facebook, Twitter and LinkedIn®. Social analytics enable customers to track shares of their campaigns and to identify which social channels are most effective.
We also offer a variety of social media guides, webinars, seminars and bootcamps to educate our customers on how to build and engage a responsive social media audience. Our SocialQuickstarter website offers a self-guided curriculum on social media theory, overviews of social networking platforms such as Facebook, Twitter, LinkedIn and YouTube®, and covers other topics such as ratings and reviews, location-based services, QR codes and best practices on how to implement email and social media into an integrated multi-channel marketing strategy.
SaveLocal
SaveLocal makes it quick and easy for our customers to retain existing customers and attract new customers by creating, running and managing local deals, and provides them with end-to-end control over their deals at an affordable price. Our customers control their deal structure by deciding what they wantWe also offer Digital Coupons, trackable and customizable digital coupons that when coupled with deals from SaveLocal give small businesses the ability to offer how many coupons they wantdiscount types mapped to selltheir particular goals and how long they want their deal to run. Our customers can generate new customers from their existing customers, who are given a bonus coupon for both buying the deal and sharing it on their social networks.
SinglePlatform
SinglePlatform provides our customers the power to manage all of their key online listingsobjectives from one place by helping them to create a content rich digital storefront which can include digital menus, photos, services, and featured products. Content is distributed across our network of over 100 publishers; increasing reach and helping small businesses get found online and via mobile sites. Digital menus can be posted on a customer’s Facebook page or website and announcements can be sent to fans and followers about special offers and events. We acquired SinglePlatform in June 2012. For a description of the acquisition and related risks, see Part II, Item 7, “Management’s Discussion and Analysis of Financial Condition and Results of Operations - Certain Trends and Uncertainties” and Note 4,Acquisitions, of the Notes to Consolidated Financial Statements included elsewhere in this Annual Report on Form 10-K.integrated resource.
Survey
Our online survey product enables our customers to survey their customers or members and analyze responses. By selecting one of our customizable templates and editing our template questions or entering their own questions, our customers can easily create a professionally formatted survey. Our survey product includes a survey creation wizard, over 90 different preformatted and customizable survey templates and list management capabilities. Our Social Share feature makes it easy for our customers to post surveys to Facebook, Twitter, LinkedIn and other social networking sites.
By incorporating a real-time Real-time reporting function, our survey product enables customers to analyze overall survey results and specific answers submitted by individual respondents. Our survey product includesrespondents and analytic features that enable our customers to segment results based on survey responses, easily edit filters for “slice and dice” analysis and view the results in intuitive, easy-to-understand graphical and data formats. Results
SinglePlatform
SinglePlatform provides our customers the power to manage all of their key online listings from one place by helping them to create a content rich digital storefront, which can be exported to a Microsoftinclude menus, photos, services, offers and featured products. Content is distributed across sites and mobile apps such as Yelp®, Urbanspoon®, Foursquare®, YellowPages®, WhitePages®, TripAdvisor® Exceland NYTimes® file for, as well as over 100 additional analysis. In addition, we offer anpublishers. SinglePlatform increases a merchant’s reach and helps small businesses get found online polling feature that enables our customers to create online polls for use on their websites and to view responses immediately.via mobile sites.
CardStar
In January 2012, we acquired CardStar a leading developer of mobile applications that extend the use of loyalty, rewards and membership cards and mobile coupons among consumers. The CardStar application consolidates loyalty, rewards and membership cards on smartphones, letting consumers use a single application rather than a series of physical cards. New features include location-based services, better management of loyalty cards, shopping lists and local offers. CardStar’s free mobile loyalty application currently has over threefour million registered users and is available on major mobile platforms, including iPhone, Android, and Blackberry®.
Customer Support
We provide free unlimited customer support to all customers and trialers of our products via phone, chat, email and social media. In the fourth quarter of 2012,2013, our customer support employees engaged with our customers and trialers through approximately 4,000 calls, chats, emails and social media interactions per day.over 1.5 million interactions. Our support teams are located at our headquarters in Waltham, Massachusetts and at our sales and support call center in Loveland, Colorado. We complement our customer support with free daily product tours offered via our website, a knowledge base of frequently asked questions and webinars that explain the benefits of engagementonline marketing.
We believe our customer support philosophy is best described as coaching with a personal touch. Our customer support representatives are trained to not just answer our customers’ questions but to understand the nature of the question and what the customer is trying to accomplish. By actively listening and engaging with the customer, we believe our support team not only provides assistance with troubleshooting but delivers incrementally more value to help our customers be successful.
Our compliance group is responsible for enforcing our permission and prohibited content policies. We work closely with customers who have higher than average spam complaint rates or bounced emails, and with customers whose emails are flagged by our system as possibly including prohibited content or spam, to assist them in complying with our policies. If we cannot resolve outstanding concerns, we terminate our agreement with the customer.
As of December 31, 2012,2013, we had 433424 employees working in our customer support organization. Our customer support organization includes customer support, customer operations, training and compliance.
Other Services
We also offer our customers the following services:
Custom Services. Although the majority of our customers select the “do-it-yourself” approach, we also offer custom services to customers who would like their email campaigns, event promotions or surveys prepared for them. Our custom service offerings range from a low-costbasic getting started service to custom campaign creation.
Training Programs. Our regional development directors and authorized local experts deliver free marketing best practices seminars with the goal of providing small businesses, non-profits and small organizations the confidence they need to use our products. We also offer a one-day paid workshopworkshops and webinars that providesprovide attendees with comprehensive training emphasizing the use of our products.product training.
Customers
We have maintained a consistent focus on small organizations. As of December 31, 2012,2013, we served a large and diverse group of approximately 555,000595,000 unique paying customers. This customer base is comprised of business-to-business users, business-to-consumer users and non-profits and associations. We serve a wide range of business-to-business customers, including law firms, accountants, marketing and public relations firms, recruiters, industrial products suppliers and independent consultants. They typically use our products to showcase their subject matter knowledge and educate their audiences by sending informational newsletters and announcements about their company or industry. We also serve a diverse base of business-to-consumer customers, including but not limited to on-and off-line retailers, restaurants, realtors, travel and tourism businesses, yoga studios and day spas. These customers typically use our products to find new customers and promote their offerings with the intent of generating regular, repeat business from their customers and prospects. Finally, we serve a variety of non-profits and associations, including religious organizations, charities, trade associations, alumni associations and other non-profits. They typically use our products to maintain regular communications with their members and inform them about news and events pertaining to their groups, as well as to drive event attendance, volunteer participation and fundraising efforts. We serve a wide spectrum of small organizations and estimate that approximately two-thirdseighty percent of our customers haveemploy 25 or fewer than ten employees. For the year ended December 31, 2012,2013, our average monthly revenue per customer was $40.22.$41.36. We have low customer concentration as our top 100 customers in 20122013 accounted for less than 1% of our total revenue. Customers in more than 180 countries and territories currently use our products. During 2012,2013, we generated approximately 10% of our revenue from countries outside of the U.S.; however significantly all of our long-lived assets were held in the U.S.
We measure customer satisfaction on a monthly basis by surveying our customers. Based on these surveys and our low customer attrition rate, we believe that our overall customer satisfaction isremains strong.
Sales and Marketing
Our sales and marketing efforts are designed to attract potential customers to our website, enroll them in a free trial, encourage them to engage with our products, convert them to paying customers, introduce and cross-sell our multiple integrated products and add-ons, encourage them to use our products effectively and retain them as ongoing customers. We employ sophisticated strategies to acquire our customers by using a variety of sources, including but not limited to, online advertising, partner relationships, television and radio advertising, regional initiatives, referrals and general brand awareness. We also invest in public relations and thought leadership to build our overall brand and visibility.
Customer Acquisition Sources
Television and Radio Advertising. Our television and radio advertising campaigns are designed to build awareness and distinguish the value of the Constant Contact brand and drive market awareness of our products.
Online Advertising. We advertise online through pay-per-click advertising with search engines, including Google, Yahoo! and Bing®, and banner advertising with online advertising networks and other websites likely to be frequented by small organizations.
Partners. We have relationships with over 9,50010,000 active partners who refer customers to us through links on their websites and outbound promotions to their customers. Our partners include solution providers, franchisors and other distribution partners, AppConnect® partners, strategic partners and affiliate partners. Solution providers, which include web developers, small business consultants, marketing consultants and social media consultants, are typically small business influencers who sell our products, provide implementation services and refer us to their customers. Franchisors and other distribution partners are typically larger organizations that want their affiliates (franchisees in the case of franchises) to use our products. AppConnect partners, which include companies offering software applications, point of sale solutions, web applications and small business accounting solutions, have software or technical solutions that are integrated with our products. We typically market our
products to their base of customers. Strategic partners are major companies with a focus on smaller businesses and non-profits who want to provide their customers with access to our products. Affiliate partners provide links to our website from their website. Most of our partners either share a percentage of the revenue, received by us, receive a discount on their customer accounts or receive a one-time referral fee. We promote many of our solution providers and AppConnect partners in our Constant Contact MarketPlace.
Word-of-Mouth Referrals. New customers frequently indicate that they learn about us from a current customer. We also offer our paying customers a referral incentive consisting of a $30 credit for them and for any customer they refer. The majority of referral customers do not use the incentive program.
Footer Click-Throughs. New customers also come to us by clicking on the Constant Contact link included in the footer of substantially all of the emails sent by our customers. In 2012,2013, our customers sent over 4560 billion emails.
Sales Efforts
Customer Marketing Coaches. As of December 31, 2012,2013, we employed a team of 151159 phone-based sales professionals who call U.S.-the U.S., Canadian-Canada- and the United Kingdom-based trial customersKingdom. They look to assist themtrialers in their initial use of our products and encourage conversion to a paid subscription.subscription or, in some cases, educate potential customers about our products. Our specialists have a deep understanding of the marketing goals, best practices and types of online marketing campaigns and offers that generate positive results.the best results for our customers. In addition to product knowledge, we offer our customers specialized advice to help make their campaigns successful.
Local Initiatives. As of December 31, 2012,2013, we employed a team of 2122 regional development directors who focus on educating small organizations on the benefits of our products in their local markets. These employees are located across the United States and in Canada and typically provide free local seminars to chambers of commerce and other small business groups about engagementonline marketing. We also enhance our local reach through approximately 275 authorized local experts that deliver seminars on our behalf.
Distance Learning. We offer free online webinars to prospects and customers on a wide variety of topics designed to educate them about the benefits of engagementonline marketing and guide them in the use of our products.
Other Initiatives
Press Relations and Thought Leadership. Leadership. We conduct a variety of public relations and thought leadership campaigns throughout the year. We seek to secure press coverage of company news and events, including product updates, new partnerships, and other corporate initiatives via press releases or media pitching on a regular basis. We also survey our customer base on a periodic basis to assess small business expectations, attitudes and challenges.challenges, and publish those results in an effort to secure media coverage. We publish the results and seek to get print and radio coverage of our results. We also publish engagementonline marketing email marketing, social media marketing, event marketing and survey best practices and advice through ourHints & Tipsnewsletters, and on our blog. In addition, in 2012,blog and via our CEO authoredEngagement Marketing: How Small Business Wins in a Socially Connected World, which was published by Wiley Publishing. These efforts enhance our brand awareness and industry leadership.social media channels.
Customer Cross-Sell. We work to understand the best time and methods to introduce our multiple products to our customers. These methods include in-product promotions, website promotions, email promotions, personal coaching and other methods. We target these cross promotions based upon trends, product usage patterns, industry and other factors.
Customer Retention. We analyze the reasons why customers leave us and attempttry to identify customersuse that are at risk.information to make changes to improve our retention rates. We coach our customers on the effective use of our products. In addition, our research has shown that customers who use more than one productof our products have higher retention rates; therefore, we encourage our customers to consider additional products and add-ons.
Vertical Marketing. We specifically develop marketing programs and target public relations efforts at certain vertical markets that have demonstrated an affinity for our products. We adjust our target vertical markets based on our existing customer base, market opportunity and overall value to our business.
Community. We maintain an online user community for both trial and paying customers with discussion boards, a resource center, member spotlights and other features.
Constant Contact Marketplace. The Constant Contact Marketplace offers one of the largest collections of apps, integrations, and marketing experts specifically to help small businesses and non-profits maximize their marketing efforts and is the only free, online resource exclusively focused on small businesses and non-profits looking for marketing tools and services. More than 100,000 small organizations have discovered mobile apps and social integrations through the Constant Contact Marketplace.
Small Business Organization Initiatives. We partner with chambers of commerce, small business development centers and SCORE chapters to offer our products, educational resources and knowledge base to their members. SCORE provides free expert business counseling services to small businesses. We typically offer the chamber, center or chapter a free account and discounts to their members.
Small Business Innovation Loft. In 2014, we announced the launch of the Small Business Innovation Loft, the home to a new small business innovation program designed to support entrepreneurs as they solve problems for small businesses through the development of new products, features, and services. Startups selected for the program will reside at a new SMB InnoLoft space at our headquarters in Waltham, Massachusetts and receive resources and mentorship to build their early-stage startups.
In the years ended December 31, 2013, 2012 2011 and 2010,2011, we spent approximately $111.4 million, $104.5 million $89.2 million and $78.9$89.2 million, respectively, on sales and marketing. Our sales and marketing expense as a percentage of revenue for the years ended December 31, 2013, 2012 and 2011 and 2010 was 42%39%, 42% and 45%42%, respectively. As of December 31, 2012,2013, we had 306352 employees working in our sales and marketing organization.
Technology and Operations
Our on-demand products use a central application and a single software code base (except for SinglePlatform which operates on a separate code base) with unique accounts for each customer. As a result, we are able to spread the cost of providing our products across our entire customer base. In addition, because we have one central application, we believe we are able to scale our business to meet increases in demand for our products. Scalability is achieved through advanced use of application partitioning to allow for horizontal scaling across multiple sets of applications. This structure enables individual application subsystems to scale independently as required by volume and usage.
Our production system hardware and the disaster recovery hardware for our production system, with the exception of SinglePlatform, are each co-located in third-party hosting facilities. One facility is located in Bedford, Massachusetts, owned and operated by Digital 55 Middlesex, LLC, an affiliate of Digital Realty Trust, Inc., or DRT, and it provides services to us under an agreement that will expire in December 2016 with two five-year extension options. The second facility is located in Santa Clara, California and is owned and operated by Digital Alfred, LLC, also an affiliate of Digital Realty Trust, Inc.DRT. The term of the agreement commencedwill expire in May 2011 for a period of six years2017 with two four-year extension options. Both hosting facilities provide around-the-clock security personnel, video surveillance and access controls, and are serviced by onsite electrical generators and fire detection and suppression systems. Both facilities also have multiple Tier 1 interconnects to the Internet.
We own all of the hardware deployed in support of our platform. We continuously monitor the performance and availability of our products. We have a highly available, scalable infrastructure that utilizes load-balanced web server pools, redundant interconnected network switches and firewalls, replicated databases, and fault-tolerant storage devices. Production data is backed up on a daily basis and stored in multiple locations to ensure transactional integrity and restoration capability.
We protect our customers’ data using security practices and technology solutions that are often unavailable to small organizations. We do not use our customers’ confidential information, including their contact lists, except in the delivery of our product, nor do we sell or rent this information.customers’ data.
Changes to our production environment are tracked and managed through a formal maintenance request process. Production hardware changes are handled in the same manner as software product releases and are first tested on a quality system, then verified in a staging environment, and finally deployed to the production system, which we generally seek to accomplish without system downtime. As of December 31, 2012,2013, we had 4853 employees working in our operations organization.
Research and Development
We have made substantial investments in research and development as a part of our strategy to continually improve the ease of use and technological scalability of our existing products as well as to develop new features and product offerings. Our engineering team adheres to a well-defined and managed software development lifecycle model. This model, which emphasizes the use of agile development practices, defines how we envision, plan, develop and test our products. Engineering is responsible for defining our technology and operations vision and executing on our product roadmaps. Our product strategy organization includes market analysts, product managers and user interface designers. This group also performs competitive and market analysis and oversees product pricing as well as systematic product usability testing. Engineering and product strategy work cooperatively to prioritize our research and development efforts by balancing our need for product enhancements, security and scalability.
Our research and development expense totaled approximately $45.6 million for 2013, $38.8 million for 2012 and $29.5 million for 2011 and $24.0 million for 2010.2011. Our research and development expense as a percentage of revenue for each of the years ended December 31, 2013, 2012 and 2011 and 2010 was 15%16%, 14%15% and 14%, respectively. As of December 31, 2012,2013, we had 240274 employees working in our engineering and product strategy organizations.
Competition
The market for vendors offering online marketing tools is fragmented, competitive and evolving. Few competitors offer multiple products and none offer our complete suite of engagementonline marketing tools for small organizations. We believe the following are the principal competitive factors in this market:
brand;
ease of use and effectiveness;
integrated solutions;
product functionality, performance and reliability;
customer support, coaching and education;
affordability; and
product scalability.
Each of our individual products faces competition from multiple competitors. Our email marketing product primarily competes with vendors focused on the small and medium-size business market, or SMB market. Some of the vendors who are focused on the SMB email market include: AWeber Systems, Inc., iContact Corporation, a subsidiary of Vocus, Inc., Protus, a subsidiary of j2 Global Communications, Inc. (Campaigner®), The Rocket Science Group LLC (MailChimp®), Vertical Response,VerticalResponse, Inc., a subsidiary of Deluxe Corporation, and VistaPrint N.V. These vendors typically charge a low monthly entry fee or a low fee per number of emails sent and, in some cases, they have a free offering. While we generally do not compete with vendors focusing on enterprise or larger customers, we may compete with them in the future. We may also face future competition in the email marketing market from new companies entering our market, which may include large, established companies. Our event marketing product competes with offerings by Eventbrite, Inc., Evite, LLC, a wholly-owned operating business of IAC/InterActiveCorp, Regonline, a division of The Active Network, Inc., and Cvent, Inc. Our Social Campaigns product competes with offerings by Offerpop Corporation, Pagemodo, a subsidiary of VistaPrint N.V., Vocus Social Media LLC doing business as North Social® and Wildfire Interactive, Inc. Our SaveLocal product competes with offerings by Groupon, Inc., LivingSocial, Inc., Amazon Local™Local™ and Googleoffers™Google Offers™. Our SinglePlatform product competes with offerings by Yext, Inc. and Locu Inc., a subsidiary of GoDaddy.com, LLC. Our survey product competes with offerings by Surveymonkey.com Corporation and Widgix, LLC doing business as SurveyGizmo®.
Barriers to entry in delivering online marketing point solutions for small organizations are relatively low, which allows new entrants to enter the market without significant impediments and larger, established companies to develop their own competitive products or acquire or establish cooperative relationships with our competitors. In addition, some of these companies may have significantly greater financial, technical, marketing and other resources than we do and may be able to devote greater resources to the development, promotion, sale and support of their products. These potential competitors may be in a stronger position to respond quickly to new technologies and may be able to undertake more extensive marketing campaigns. These competitors may have more extensive customer bases and broader customer relationships that they could leverage to obtain a significant portion of the market. In addition, these competitors may have longer operating histories and greater name recognition than we do. Moreover, if one or more of our competitors were to merge or partner with another of our competitors or a new market entrant, the change in competitive landscape could adversely affect our ability to compete effectively. Finally, one or more of these businesses could decide to offer competitive products at no cost or low cost in order to generate revenue as part of a larger product offering.
We believe our easy-to-use,brand, reach, scale, suite of on-line affordable and integrated products,marketing tools, education, KnowHow and coaching differentiate us from the competition.
Government Regulation
The Controlling the Assault of Non-Solicited Pornography and Marketing Act of 2003, or CAN-SPAM Act, establishes requirements in the U.S. for commercial email and specifies penalties for commercial email that violates the CAN-SPAM Act. In addition, the CAN-SPAM Act gives consumers the right to require emailers to stop sending them commercial email.
The CAN-SPAM Act covers email sent for the primary purpose of advertising or promoting a commercial product, service, or Internet website. The U.S. Federal Trade Commission, or the FTC, a federal consumer protection agency, is primarily responsible for enforcing the CAN-SPAM Act, and the U.S. Department of Justice, other federal agencies, State Attorneys General,state attorneys general, and ISPs also have authority to enforce certain of its provisions.
The CAN-SPAM Act’s main provisions include:
prohibiting false or misleading email header information;
prohibiting the use of deceptive subject lines;
ensuring that recipients may, for at least 30 days after an email is sent, opt out of receiving future commercial email messages from the sender, with the opt-out effective within 10 days of the request;
requiring that commercial email be identified as a solicitation or advertisement unless the recipient affirmatively assented to receiving the message; and
requiring that the sender include a valid postal address in the email message.
The CAN-SPAM Act also prohibits unlawful acquisition of email addresses, such as through directory harvesting, and transmission of commercial emails by unauthorized means, such as through relaying messages with the intent to deceive recipients as to the origin of such messages.
Violations of the CAN-SPAM Act’s provisions can result in criminal and civil penalties, including statutory penalties that can be based in part upon the number of emails sent, with enhanced penalties for commercial emailers who harvest email addresses, use dictionary attack patterns to generate email addresses, and/or relay emails through a network without permission.
The CAN-SPAM Act acknowledges that the Internet offers unique opportunities for the development and growth of frictionless commerce, and the CAN-SPAM Act was passed, in part, to enhance the likelihood that wanted commercial email messages would be received. We believe we are a leader in developing policies and practices affecting our industry and that our permission-based email marketing model and our anti-spam policy are compatible with current CAN-SPAM Act regulatory requirements. We are a founding member of the Email Sender and Provider Coalition, or ESPC, a cooperative industry organization founded to develop and implement industry-wide improvements in spam protection and solutions to prevent inadvertent blocking of legitimate commercial email. We maintain high standards that apply to all of our customers, including non-profits and political organizations, whether or not they are covered by the CAN-SPAM Act.
The CAN-SPAM Act preempts most state laws specific to email, except for common law trespass, contract, or tort laws, state laws specifically prohibiting falsity or deception in commercial email and state laws relating to fraud and computer crime. The scope of these exceptions, however, is not settled, and some states have adopted email regulations that, if upheld, could impose liabilities and compliance burdens on us and on our customers in addition to those imposed by the CAN-SPAM Act.
In addition, we may be subject to regulation by the FTC and each of the states under general consumer protection statutes prohibiting unfair or deceptive acts and practices. Certain areas of marketing activity, including email marketing and online advertising, are subject to specific statutes such as the CAN-SPAM Act discussed
above. These federal or state statutes and rules also effectively regulate online user’s privacy and data security, particularly in the e-commerce area where the FTC and state attorneys general actively investigate the policies and practices of online companies regarding the protection, sharing or use of personal information furnished by customers to the websites. To the extent our customers are small businesses or individuals, we may be subject to regulation and enforcement oversight in these areas.
Moreover, some foreign countries, including the countries of the European Union, Israel and Canada, have regulated or are in the process of regulating the distribution of commercial email and the online collection and disclosure of personal information. To the extent we conduct business operations in certain foreign countries, such as the United Kingdom and Canada, we may be subject directly to the laws in these countries. In addition, foreign governments may attempt to apply their laws extraterritorially or through treaties or other arrangements with U.S. governmental entities.
Our customers may be subject to the requirements of the CAN-SPAM Act, and/or other applicable state or foreign laws and regulations affecting email marketing. If our customers’ email campaigns are alleged to violate applicable email laws or regulations and we are deemed to be responsible for such violations, or if we were deemed to be directly subject to and in violation of these requirements, we could be exposed to liability.
Intellectual Property
Our intellectual property rights are important to our business. We rely on a combination of copyright, trade secret, trademark, patent and other rights in the United States and other jurisdictions, as well as confidentiality procedures and contractual provisions to protect our proprietary technology, processes and other intellectual property.
Others may develop products that are similar to our technology. We enter into confidentiality and other written agreements with our employees, consultants, partners and vendors, and through these and other written agreements, we attempt to control access to and distribution of our software, documentation and other proprietary technology and other information. These confidentiality and other written agreements, however, offer only limited protection, and we may not be able to enforce our rights under such agreements. Despite our efforts to protect our proprietary rights, third parties may, in an unauthorized manner, attempt to use, copy or otherwise obtain and market or distribute our intellectual property rights or technology or otherwise develop a product with the same functionality as our product. Policing unauthorized use of our products and intellectual property rights is difficult and nearly impossible on a worldwide basis. Therefore, we cannot be certain that the steps we have
taken or will take in the future will prevent misappropriations of our technology or intellectual property rights.
“Constant Contact®” is a registered trademark in the United States, Canada and in the European Union. We also hold trademarks and service marks identifying certain of our products or features of our products. We currently hold onetwo issued U.S. patentpatents and have twoone patent applicationsapplication pending in the U.S. Patent and Trademark office.
Employees
As of December 31, 2012,2013, we had 1,1621,235 employees. None of our employees is represented by a labor union. We have not experienced any work stoppages and believe that our relations with our employees are good.
Facilities
Our corporate headquarters, including our principal administrative, marketing, sales and support and research and development organizations, is located in Waltham, Massachusetts. We currently lease approximately 145,000190,000 square feet in this facility under a lease agreement, as amended, that expires in September 2022 with one ten-year extension option. We expect to occupy approximately 106,00061,000 additional square feet in this facility over the next threetwo years. As of December 31, 2012, 6942013, 752 of our employees were based in this facility. We also lease approximately 50,000 square feet of office space in Loveland, Colorado under a lease agreement that will expire in April 2019 with three three-year extension options. This facility is used for sales and support personnel and, as of December 31, 2012, 3162013, 280 employees were based in this location. We lease a small amount of general office space in Delray, Florida, San Francisco, California, New York, New York (two facilities) and London, England under lease agreements that expire at varying dates through 2017.2018. The facilities in California and Florida and one of the New York locations are used for research and development personnel. The other New York facility houses our SinglePlatform personnel and our London facility houses marketing personnel. As of December 31, 2012,2013, five employees were based in Florida, 1927 employees were based in California, 90135 employees were based in New York and three employees were based in London. If we require additional space, we believe that we will be able to obtain such space on acceptable, commercially reasonable terms.
| ITEM 1A. | RISK FACTORS |
Our business is subject to numerous risks. You should carefully consider the risks described below as well as other information provided to you in our Annual Report on Form 10-K, including information in the section of this document entitled “Forward-Looking Statements.” If any of the following risks actually occur, our business, financial condition or results of operations could be materially adversely affected, the value of our common stock could decline, and you may lose all or part of your investment. We caution you that the following important factors, among others, could cause our actual results to differ materially from those expressed in forward-looking statements made by us or on our behalf in filings with the SEC, press releases, communications with investors and oral statements. Any or all of our forward-looking statements in this Annual Report on Form 10-K and in any other public statements we make may turn out to be wrong. They can be affected by inaccurate assumptions we might make or by known or unknown risks and uncertainties. Many factors mentioned in the discussion below will be important in determining future results. Consequently, no forward-looking statement can be guaranteed. Actual future results may vary materially from those anticipated in forward-looking statements. We undertake no obligation to update any forward-looking statements, whether as a result of new information, future events or otherwise. You are advised, however, to consult any further disclosure we make in our reports filed with the SEC.
RISKS RELATED TO OUR BUSINESS AND INDUSTRY
If we are unable to attract new customers and retain existing customers, our business and results of operations will be affected adversely.
To succeed, we must continue to attract and retain a large number of customers. Over the last few years, there has been a decline in the number of new customers we have added on an annual basis. In 2011, we added fewer new customers than we added in 2010 and in 2012 we added fewer new customers then we added in either 2010 or 2011. We rely on a variety of methods to attract new customers, such as paying providers of online services,
search engines, directories and other websites to provide content, advertising banners and other links that direct customers to our website, television and radio advertising, the efforts of our partners and the inclusion of a link to our website in substantially all of our customers’ emails. In addition, we are committed to providing our customers with a high level of support. As a result, we believe many of our new customers are referred to us by existing customers. However, customers cancel their accounts for many reasons, including economic concerns, business failure or a perception that they do not use our productproducts effectively, the service is not a good value and that they can manage their online marketing efforts without our products. In some cases, we terminate an account because the customer fails to comply with our standard terms and conditions. As our customer base continues to grow, even if our customer retention rates remain the same on a percentage basis, the absolute number of customers we lose each month will increase. We must continually add new customers to replace customers whose accounts are cancelled or terminated, which may involve significantly higher marketing expenditures than we currently anticipate. If we are unable to use any of our
current marketing initiatives or the cost of such initiatives were to significantly increase or such initiatives or our efforts to satisfy our existing customers are not successful, we may not be able to attract new customers or retain existing customers on a cost-effective basis and, as a result, our business and results of operations would be affected adversely.
In addition, we continue to aggressievely test bundling and new pricing packages that will allow customers access to multiple products for a monthly fee. We expect to offer a variety of packages that will contain different product combinations and pricing tiers. These new packages may impact the number of customers we are able to attract to our service, the number of customers we are able to convert from trialers to paying customers and the amount such customers pay us for use of the products. To the extent that these packages lead to a decline in the number of customers paying for our products or a decline in revenue, our business and results of operations may be affected adversely.
Our business is substantially dependent on the market for email marketing services for small organizations.
We derive, and expect to continue to derive, a substantial portion of our revenue from our email marketing product for small organizations, including small businesses, associations and non-profits. For the year ended December 31, 2012,2013, our revenue from our email marketing product alone was approximately 85%84% of our total revenue. Widespread acceptance of email marketing among small organizations will continue to be critical to our future growth and success. There is no certainty regarding how the market for email marketing will continue to develop, or whether it will experience any significant contractions. Our ability to attract and retain customers will depend in part on our ability to make email marketing convenient, effective and affordable. If small organizations determine that email marketing does not sufficiently benefit them or utilize alternative or new electronic methods of communicating with their customers, existing customers may cancel their accounts and potential customers may decide not to adopt email marketing. If the market for email marketing services fails to continue to grow or grows more slowly than we currently anticipate, demand for our services may decline and our revenue would suffer.
Our growth strategy requires us to expand our product offerings beyond email marketing and this expansion may not be successful.
We have traditionally focused our business on providing our email marketing product for small organizations, but in the last few years we have significantly expanded our product offerings. In 2007, we introduced our survey product and our add-on email archive service that enables our customers to archive their past email campaigns. In 2009, we launched our event marketing product. Through our acquisition of Nutshell Mail, Inc., which we completed in May 2010, we now provide a tool for small organizations to monitor and engage with social media networks. In January 2012, we launched our Social Campaigns product which allows small businesses the ability to run multi-step, results-oriented campaigns on their social networks. Also, in January 2012, we announced the acquisition ofacquired CardStar, a leading developer of mobile applications that extend the use of loyalty, rewards and membership cards and mobile coupons among consumers. In February 2012, we announced the introduction ofintroduced our new SaveLocal product, which makes it quick and easy for our customers to create, run and manage local deals. In June 2012, we acquired SinglePlatform, Corp. or SinglePlatform, a company that helps small businessbusinesses get discovered through web and mobile searches by providing a single place to update relevant business information. Our efforts to introduce new products beyond our email marketing product or to offer a bundled offering of two or more of our products may not result in significant revenue growth, may not be complementary to our email marketing product, may not be timely, may divert management resources from our existing operations and require us to commit significant financial resources to an unproven business or product or may be confusing to our customers, any of which may harm our financial performance and impede our long-term growth strategy.
If the security of our customers’ confidential information stored in our systems is breached or otherwise subjected to unauthorized access, our reputation may be severely harmed, we may be exposed to liability and we may lose the ability to offer our customers a credit card payment option.
Our system stores our customers’ proprietary email contacts lists, credit card information and other critical data. Any accidental or willful security breaches or other unauthorized access could expose us to liability for the loss of such information, adverse regulatory action by federal and state governments, time-consuming and expensive litigation and other possible liabilities as well as negative publicity, which could severely damage our reputation. If security measures are breached because of third-party action, employee error, malfeasance or otherwise, or if design flaws in our software are exposed and exploited, and, as a result, a third party obtains unauthorized access to any of our customers’ data, our relationships with our customers will be severely damaged, and we could incur significant liability. Because techniques used to obtain unauthorized access or to sabotage systems change frequently and generally are not recognized until they are launched against a target, we and our third-party hosting facilities may be unable to anticipate these techniques or to implement adequate preventative measures. In addition, as we continue to grow our customer base and our brand becomes more widely known and recognized, we may become a more inviting target for third parties seeking to compromise our security systems.
The federal government and many states, including Massachusetts, have enacted laws requiring companies to notify individuals of data security breaches involving certain types of personal data. These mandatory disclosures regarding a security breach often lead to widespread negative publicity, which may cause our customers to lose confidence in the effectiveness of our data security measures. Any security breach, whether actual or perceived, would harm our reputation, and we could lose customers and fail to acquire new customers. In addition, failure to maintain compliance with the data protection policy standards adopted by the major credit card issuers may limit our ability to offer our customers a credit card payment option. Any loss of our ability to offer our customers a credit card payment option would harm our reputation and make our products less attractive to many small organizations by negatively impacting our customer experience and significantly increasing our administrative costs related to customer payment processing.
Our existing general liability insurance may not cover any, or cover only a portion of any, potential claims related to security breaches to which we are exposed or may not be adequate to indemnify us for all or any portion of liabilities that may be imposed. Any imposition of liability that is not covered by insurance or is in excess of insurance coverage would increase our operating expenses and reduce our net income.
U.S. federal legislation and the laws of many foreign countries impose certain obligations on the senders of commercial emails, which could minimize the effectiveness of our products, particularly our email marketing product, and establish financial penalties for non-compliance, which could increase the costs of our business.
The CAN-SPAM Act, establishes certain requirements for commercial email messages and specifies penalties for the transmission of commercial email messages that are intended to deceive the recipient as to source or content. The CAN-SPAM Act, among other things, obligates the sender of commercial emails to provide recipients with the ability to opt out of receiving future emails from the sender. In addition, some states have passed laws regulating commercial email practices that are significantly more punitive and difficult to comply with than the CAN-SPAM Act, particularly Utah and Michigan, which have enacted do-not-email registries listing minors who do not wish to receive unsolicited commercial email that markets certain covered content, such as adult or other harmful products. Some portions of these state laws may not be preempted by the CAN-SPAM Act. The ability of our customers’ constituents to opt out of receiving commercial emails may minimize the effectiveness of our products. Moreover, non-compliance with the CAN-SPAM Act carries significant financial penalties. If we were found to be in violation of the CAN-SPAM Act, applicable state laws not preempted by the CAN-SPAM Act, or foreign laws regulating the distribution of commercial email such as the laws of Canada and the United Kingdom, whether as a result of violations by our customers or if we were deemed to be directly subject to and in violation of these requirements, we could be required to pay penalties, which would adversely affect our financial performance and significantly harm our business, and our reputation would suffer. We also may be required to change one or more aspects of the way we operate our business, which could impair our ability to attract and retain customers or could increase our operating costs.
If the security of our customers’ confidential information stored in our systems is breached or otherwise subjected to unauthorized access, our reputation may be severely harmed, we may be exposed to liability and we may lose the ability to offer our customers a credit card payment option.
Our system stores our customers’ proprietary email distribution lists, credit card information and other critical data. Any accidental or willful security breaches or other unauthorized access could expose us to liability for the loss of such information, adverse regulatory action by federal and state governments, time-consuming and expensive litigation and other possible liabilities as well as negative publicity, which could severely damage our reputation. If security measures are breached because of third-party action, employee error, malfeasance or otherwise, or if design flaws in our software are exposed and exploited, and, as a result, a third party obtains unauthorized access to any of our customers’ data, our relationships with our customers will be severely damaged, and we could incur significant liability. Because techniques used to obtain unauthorized access or to sabotage systems change frequently and generally are not recognized until they are launched against a target, we and our third-party hosting facilities may be unable to anticipate these techniques or to implement adequate preventative measures. In addition, as we continue to grow our customer base and our brand becomes more widely known and recognized, we may become a more inviting target for third parties seeking to compromise our security systems.
Many states, including Massachusetts, have enacted laws requiring companies to notify individuals of data security breaches involving certain types of personal data. These mandatory disclosures regarding a security breach often lead to widespread negative publicity, which may cause our customers to lose confidence in the effectiveness of our data security measures. Any security breach, whether actual or perceived, would harm our reputation, and we could lose customers and fail to acquire new customers. In addition, if we fail to maintain our compliance with the data protection policy standards adopted by the major credit card issuers, we could lose our ability to offer our customers a credit card payment option. Any loss of our ability to offer our customers a credit card payment option would harm our reputation and make our products less attractive to many small organizations by negatively impacting our customer experience and significantly increasing our administrative costs related to customer payment processing.
Our existing general liability insurance may not cover any, or cover only a portion of any, potential claims related to security breaches to which we are exposed or may not be adequate to indemnify us for all or any portion of liabilities that may be imposed. Any imposition of liability that is not covered by insurance or is in excess of insurance coverage would increase our operating expenses and reduce our net income.
The market in which we participate is highly competitive and, if we do not compete effectively, our operating results could be harmed.
The market for our products is highly competitive and rapidly changing, and the barriers to entry are relatively low. With the introduction of new technologies and the influx of new entrants to the market, we expect competition to persist and intensify in the future, which could harm our ability to increase sales, limit customer attrition and maintain our prices.
Our principal email marketing competitors include providers of email marketing products for small to medium size businesses such as AWeber Systems, Inc., iContact Corporation, a subsidiary of Vocus, Inc., Protus, a subsidiary of j2 Global Communications, Inc. (Campaigner), The Rocket Science Group LLC (MailChimp), Vertical Response,VerticalResponse, Inc., a subsidiary of Deluxe Corporation, and Vistaprint N.V. These vendors typically charge a low monthly entry fee or a low fee per number of emails sent and, in some cases, they have a free offering. Competition could result in reduced sales, reduced margins or the failure of our email marketing product to achieve or maintain more widespread market acceptance, any of which could harm our business. In addition, there are a number of other vendors that are focused on providing email marketing products for larger organizations, including Alterian, Inc.,a subsidiary of SDL, plc, CheetahMail, Inc., a subsidiary of Experian Group Limited, ExactTarget, Inc., a subsidiary of Salesforce.com, Inc., Responsys Inc., and Eloqua Limited, subsidiaries of Oracle Corporation, Silverpop Systems Inc., Eloqua Limited, a subsidiary of Oracle Corporation, and StrongMail Systems, Inc. While we do not compete currently with vendors of email marketing products serving larger customers, we may compete with these providers in the future. Finally, in the future, our email marketing product may experience competition from Internet Service Providers, or ISPs, advertising and direct marketing agencies and other large established businesses, possessing large, existing customer bases, substantial financial resources and established distribution channels. If these companies decide to develop, market or resell competitive email marketing products, acquire one of our existing competitors or form a strategic alliance with one of our competitors, our ability to compete effectively could be significantly compromised and our operating results could be harmed. In addition, one or more of these entities could decide to offer a competitive email marketing product at no cost or low cost in order to generate revenue as part of a larger product offering.
Our other products also face intense competition. EventSpot, our event marketing product, competes with offerings by Eventbrite, Inc., Evite, LLC, a wholly-owned, operating business of IAC/InterActiveCorp, Regonline, a division of The Active Network, Inc., and Cvent, Inc. Our Social Campaigns product competes with offerings by Offerpop Corporation, Pagemodo, a subsidiary of VistaPrint N.V., Vocus Social Media LLC doing business as North Social and Wildfire Interactive, a subsidiary of Google Inc. Our survey product competes with similar offerings by Surveymonkey.com Corporation and Widgix, LLC doing business as SurveyGizmo. Our SaveLocal product competes with offerings by Groupon, Inc., LivingSocial, Inc., Amazon Local and Googleoffers. Our SinglePlatform product competes with offerings by Yext, Inc. and Locu Inc.Inc, a subsidiary of GoDaddy.com, LLC. In addition, our bundled product offerings could face competition from new competitors who are different from the companies we currently compete with on our individual products.
Our current and potential competitors may have significantly more financial, technical, marketing and other resources than we do and may be able to devote greater resources to the development, promotion, sale and support of their products. Our current and potential competitors may have more extensive customer bases and broader customer relationships than we have. In addition, these companies may have longer operating histories and greater name recognition than we have and may be able to bundle email marketing, event marketing or survey products with other products that have already gained widespread market acceptance and offer them at no cost or low cost. These competitors may be better able to respond quickly to new technologies and to undertake more extensive marketing campaigns. If we are unable to compete with such companies, the demand for our products could substantially decline.
Current economic conditions may further negatively affect the small business sector, which may cause our customers to terminate existing accounts with us or cause potential customers to fail to purchase our products, resulting in a decrease in our revenue and impairing our ability to operate profitably.
Our products are designed specifically for small organizations. These organizations frequently have limited budgets and are often resource and time-constrained and, as a result, may be more likely to be significantly affected by economic downturns than their larger, more established counterparts. We believe that small organizations continue to experience some amount of economic hardship. As a result, small organizations may choose to spend the limited funds that they have on items other than our products and may experience higher failure rates. Moreover, if small organizations experience economic distress, they may be unwilling or unable to expend time and financial resources on marketing, which would negatively affect the overall demand for our products, increase customer attrition and could cause our revenue to decline. There can be no assurance, therefore, that current economic conditions or worsening economic conditions, or a recurring recession, will not have a significant adverse impact on our operating and financial results.
Any significant disruption in service on our website or in our computer systems, or in our customer support services, could result in a loss of customers.
The satisfactory performance, reliability and availability of our technology and our underlying network infrastructure are critical to our operations, level of customer service, reputation and ability to attract new customers and retain existing customers. In providing our services, we rely on third-party hosting facilities, bandwidth providers, ISPs and mobile networks. Our production system hardware and the disaster recovery operations for our production system hardware are co-located in third-party hosting facilities. These facilities do not guarantee that our customers’ access to our products will be uninterrupted, error-free or secure. Our operations also depend on the ability of our third-party hosting facilities to protect their and our systems against damage or interruption from natural disasters, power or telecommunications failures, air quality, temperature, humidity and other environmental concerns, computer viruses or other attempts to harm our systems, criminal acts and similar events. In the event that our third-party hosting arrangements are terminated, or there is a lapse of service or damage to these facilities, we could experience interruptions in our service as well as delays and additional expense in arranging new facilities. In addition, our customer support services, which are located at our headquarters in Waltham, Massachusetts and at our sales and support office in Loveland, Colorado, would experience interruptions as a result of any disruption of electrical, phone or any other similar facility support services. Any interruptions or delays in access to our products or customer support, whether as a result of third-party error, our own error, natural disasters, security breaches or malicious actions, such as denial-of-service or similar attacks, whether accidental or willful, could harm our relationships with customers and our reputation. Also, in the event of damage or interruption, our insurance policies may not adequately compensate us for any losses that we may incur. These factors could damage our brand and reputation, divert our employees’ attention, reduce our revenue, subject us to liability and cause customers to cancel their accounts, any of which could adversely affect our business, financial condition and results of operations.
Our production disaster recovery system is located at one of our third-party hosting facilities. Our corporate disaster recovery system is located at our headquarters in Waltham, Massachusetts. Neither system provides real-time backup or has been tested under actual disaster conditions and neither system may have sufficient capacity to recover all data and services in the event of an outage. In the event of a disaster in which our production system hardware and the disaster recovery operations for our production system hardware are irreparably damaged or destroyed, we would experience interruptions in access to our products. Moreover, our headquarters and one of the third-party facilities that hosts our production system hardware are located within several miles of each other. As a result, any regional disaster could affect these locations equally. Any or all of these events could cause our customers to lose access to our products, which will harm our business and results of operations.
If a third party assertsThird parties have asserted, and may in the future assert, claims that we are infringing itstheir intellectual property, which, whether successful or not, it could subject us to costly and time-consuming litigation or require us to obtain expensive licenses, and our business may be adversely affected.
The software and Internet industries are characterized by the existence of a large number of patents, trademarks and copyrights and by frequent litigation based on allegations of infringement or other violations of intellectual property rights. Third parties, including so-called non-practicing entities, which are entities that have no operating business but exist purely as collectors of patents, have asserted, and in the future may assert, patent and other intellectual property infringement claims against us in the form of lawsuits, letters or other forms of communication. These claims, whether or not successful, could:
divert management’s attention;
result in costly and time-consuming litigation;
require us to enter into royalty or licensing agreements, which may not be available on acceptable terms, or at all;
in the case of open source software-related claims, require us to release our software code under the terms of an open source license; or
require us to redesign our software and services to avoid infringement.
As a result, any third-party intellectual property claims against us could increase our expenses and adversely affect our business. In addition, many of our agreements with our partners and others require us to indemnify them for third-party intellectual property infringement claims, which would increase the cost to us resulting from an adverse ruling on any such claim. Even if we have not infringed any third party’s intellectual property rights, we cannot be sure our legal defenses will be successful, and even if we are successful in defending against such claims, our legal defense could require significant financial resources and management time. Finally, if a third party successfully asserts a claim that our products infringe its proprietary rights, royalty or licensing agreements might not be available on terms we find acceptable or at all and we may be required to pay significant monetary damages to such third party.
We may be subject to time-consuming and costly litigation.
From time to time, we may be subject to various claims and lawsuits by partners, customers, or other parties arising in the ordinary course of business, including lawsuits alleging patent infringement. We are currently a party to the actions that are described in Part I, Item 3 “Legal Proceedings” included elsewhere in this Annual Report on Form 10-K. These matters can be time-consuming, divert management’s attention and resources, and cause us to incur significant expenses. Furthermore, the results of any of these actions may have a material adverse effect on our results of operations, financial condition and cash flows.
Current economic conditions may further negatively affect the small business sector, which may cause our customers to terminate existing accounts with us or cause potential customers to fail to purchase our products, resulting in a decrease in our revenue and impairing our ability to operate profitably.
Our products are designed specifically for small organizations. These organizations frequently have limited budgets and are often resource and time-constrained and, as a result, may be more likely to be significantly affected by economic downturns than their larger, more established counterparts. We believe that small organizations continue to experience some amount of economic hardship. As a result, small organizations may choose to spend the limited funds that they have on items other than our products and may experience higher failure rates. Moreover, if small organizations experience economic distress, they may be unwilling or unable to expend time and financial resources on marketing, which would negatively affect the overall demand for our products, increase customer attrition and could cause our revenue to decline. There can be no assurance, therefore, that current economic conditions or worsening economic conditions, or a recurring recession, will not have a significant adverse impact on our operating and financial results.
If the delivery of our customers’ emails is limited or blocked or our customers’ emails are directed to an alternate or “tabbed” section of the recipient’s inbox, customers may cancel their accounts.
ISPs can block emails from reaching their users. The implementation of new or more restrictive policies by ISPs may make it more difficult to deliver our customers’ emails. We continually improve our own technology and work closely with ISPs to maintain our deliverability rates. In addition, some ISPs have started to categorize as promotional or otherwise emails that originate from email service providers and, as a result, direct them to an alternate or “tabbed” section of the recipient’s inbox. If ISPs materially limit or halt the delivery of our customers’ emails, or if we fail to deliver our customers’ emails in a manner compatible with ISPs’ email handling or authentication technologies or other policies, thenor if the fees we charge foropen rates of our email marketing product may not be acceptedcustomers’ emails are negatively impacted by the market, andactions of ISPs to categorize emails, then customers may question the effectiveness of our products and cancel their accounts. This, in turn, could harm our business and financial performance.
If we fail to promote and maintain our brands in a cost-effective manner, we may lose market share and our revenue may decrease.
We believe that developing and maintaining awareness of the Constant Contact brands in a cost-effective manner is critical to our goal of achieving widespread acceptance of our engagementonline marketing platform and attracting new customers. Furthermore, we believe that the importance of brand recognition will increase as competition in our industry increases. Successful promotion of our brands will depend largely on the effectiveness of our marketing efforts and the effectiveness and affordability of our products for our target customer demographic. Historically, our efforts to build our brands have involved significant expense, and it is likely that our future marketing efforts
will require us to incur additional significant expenses. Such brand promotion activities may not yield increased revenue and, even if they do, any revenue increases may not offset the expenses we incur to promote our brands. If we fail to promote and maintain our brands successfully, or if we incur substantial expenses in an unsuccessful attempt to promote and maintain our brands, we may lose our existing customers to our competitors or be unable to attract new customers, which would cause our revenue to decrease.
We depend on search engines to attract a significant percentage of our customers, and if those search engines change their listings or our relationship with them deteriorates or terminates, we may be unable to attract new customers, which would adversely affect our business and results of operations.
Many of our customers located our website by clicking through on search results displayed by search engines such as Google, Yahoo! and Bing®, Yahoo® and Bing.. Search engines typically provide two types of search results, algorithmic and purchased listings. Algorithmic listings cannot be purchased, and instead are determined and displayed solely by a set of formulas designed by the search engine. Purchased listings can be purchased by advertisers in order to attract users to their websites. We rely on both algorithmic and purchased listings to attract a significant percentage of the customers we serve to our website. Search engines revise their algorithms from time to time in an attempt to optimize their search result listings. If search engines on which we rely for algorithmic listings modify their algorithms, this could result in fewer potential customers clicking through to our website, requiring us to resort to other costly resources to attempt to replace this traffic, which, in turn, could reduce our revenue and negatively impact our operating results, harming our business. If one or more search engines on which we rely for purchased listings modifies or terminates its relationship with us, our expenses could rise, or our revenue could decline and our business may suffer. The cost of purchased search listing advertising fluctuates and may increase as demand for these channels grows, and any such increases could negatively affect our financial results.
The success of our business depends on the continued growth and acceptance of email as a communications tool and the related expansion and reliability of the Internet infrastructure. If consumers do not continue to use email or alternative communications tools gain popularity, such as social media or text messaging, demand for our email marketing product may decline.
The future success of our business depends on the continued and widespread adoption of email as a primary means of communication. Security problems such as “viruses,” “worms” and other malicious programs or reliability issues arising from outages and damage to the Internet infrastructure could create the perception that email is not a safe and reliable means of communication, which would discourage businesses and consumers from using email. Use of email by businesses and consumers also depends on the ability of ISPs to prevent unsolicited bulk email, or “spam,” from overwhelming consumers’ inboxes. In recent years, ISPs have developed new technologies to filter unwanted messages before they reach users’ inboxes. In response, spammers have employed more sophisticated techniques to reach consumers’ inboxes. Although companies in the anti-spam industry have started to address the techniques used by spammers, if security problems become widespread or frequent or if ISPs cannot effectively control spam, the use of email as a means of communication may decline as consumers find alternative ways to communicate. In addition, if alternative communications tools, such as social media or text messaging, gain widespread acceptance, the need for email may lessen. Any decrease in the use of email would reduce demand for our email marketing product and harm our business.
Various private spam blacklists have in the past interfered with, and may in the future interfere with, the effectiveness of our products and our ability to conduct business.
We depend on email to market to and communicate with our customers, and our customers rely on email to communicate with their customers and members. Various private entities attempt to regulate the use of email for commercial solicitation. These entities often advocate standards of conduct or practice that significantly exceed current legal requirements and classify certain email solicitations that comply with current legal requirements as spam. Some of these entities maintain “blacklists” of companies and individuals, and the websites, ISPs and Internet protocol addresses associated with those entities or individuals that do not adhere to those standards of conduct or practices for commercial email solicitations that the blacklisting entity believes are appropriate. If a company’s Internet protocol addresses are listed by a blacklisting entity, emails sent from those addresses may be blocked if they are sent to any Internet domain or Internet address that subscribes to the blacklisting entity’s service or purchases its blacklist.
Some of our Internet protocol addresses currently are listed with one or more blacklisting entities and, in the future, our other Internet protocol addresses may also be listed with these and other blacklisting entities. There can be no guarantee that we will not continue to be blacklisted or that we will be able to successfully remove ourselves from those lists. Blacklisting of this type could interfere with our ability to market our products and services and communicate with our customers and could undermine the effectiveness of our customers’ marketing campaigns, all of which could have a material negative impact on our business and results of operations.
Our customers’ use of our products and website to transmit negative messages or website links to harmful applications in violation of our policies or otherwise could damage our reputation, and we may face liability for unauthorized, inaccurate or fraudulent information distributed via our products.
Our customers could use our products or website to transmit negative messages or website links to harmful applications, reproduce and distribute copyrighted material or the trademarks of others without permission, or report inaccurate or fraudulent data or information. Any such use of our products could damage our reputation and we could face claims for damages, copyright or trademark infringement, defamation, negligence or fraud. Moreover, our customers’ promotion of their products and services through our products may not comply with federal, state and foreign laws. We cannot predict whether our role in facilitating these activities would expose us to liability under these laws. Even if claims asserted against us do not result in liability, we may incur substantial costs in investigating and defending such claims. If we are found liable for our customers’ activities, we could be required to pay fines or penalties, redesign business methods or otherwise expend resources to remedy any damages caused by such actions and to avoid future liability.
Our customers’ use of our SaveLocal product may negatively impact our reputation and could subject us to legal and regulatory risks, each of which could harm our business and results of operations.
Our brand and reputation may be harmed by our customers’ use of our SaveLocal product. Any shortcomings of one or more of our SaveLocal customers, particularly with respect to an issue affecting the quality of the deal offered or the products or services sold or such customer’s fraudulent or deceptive conduct, may be attributed to us, potentially damaging our reputation and brand value, reducing our ability to attract new customers or retain our current customers and subjecting us to potential liability, thereby negatively affecting our results of operations.
The application of certain U.S. and international laws and regulations to SaveLocal deals and to our role in facilitating our customers’ offer of SaveLocal deals is uncertain. These include laws and regulations such as the Credit Card Accountability Responsibility and Disclosure Act of 2009, or the CARD Act, the laws of most states, which contain provisions governing product terms and conditions of gift cards, gift certificates, stored value or pre-paid cards or coupons, and unclaimed and abandoned property laws. These laws may include provisions prohibiting or limiting the use of expiration dates on gift cards or the amount of fees charged in connection with gift cards or requiring specific disclosures on or in connection with gift cards and the imposition of certain fees.
If we are required to alter our business practices as a result of any laws or regulations, our revenue could decrease, our costs could increase and our business could otherwise be harmed. In addition, the costs and expenses associated with defending any actions related to such additional laws and regulations and any payments of related penalties, judgments or settlements could adversely impact our financial results.
In addition, if any laws or regulations require that the face value of SaveLocal coupons have a minimum expiration period beyond the period desired by our SaveLocal customers for their promotional programs, or no expiration period, this may affect the willingness of our customers to use our SaveLocal product in jurisdictions where these laws apply.
Our business may be negatively impacted by seasonal trends.
Sales of our products are impacted by seasonality. The third calendar quarter hasSmall organizations are typically been our slowest quarter for customer growth because our prospective customers typically do not engage as much with theirless active during the summer months. Thus, we generate fewer new customers during the slower summer months. We typically increasethis time. As a result, we adjust our sales and marketing activities at the end of the third quarter and during the fourth quarter in anticipation of the holiday season.accordingly. If these seasonality trends change materially, our financial and operating results for any given quarter may be negatively impacted and may differ materially from results in prior quarterly periods. In addition, our recent acquisition of SinglePlatform may impact our historical seasonality trends.
If we fail to enhance our existing products, or develop new products or offer a bundle of our products that our customers and prospective customers find compelling, our products may become obsolete or less competitive and we could lose customers.
If we are unable to enhance our existing products successfully, including our current recent enhancements to our contact management functionality and our plans to update our editing environment, and improve our contact management functionality, or develop new products that keep pace with rapid technological developments and meet our customers’ needs, our business will be harmed. Creating and designing such enhancements and new products entails significant technical and business risks and requires substantial expenditures and lead-time, and there is no guarantee that such enhancements and new products will be completed in a timely fashion, nor is there any guarantee that any new product offerings will anticipate our customer’s needs or gain acceptance among our customers or in the broader market. In addition, such enhancements and new products may not be profitable for a number of years, if at all, and even if they are profitable, operating margins for new products may not be as high as the margins we have experienced historically. Our existing customers and prospective new customers may be dissatisfied with our enhancements to our existing products and may leave us or choose competing providers, or may not view any new product as complementary to our other product offerings and not purchase such additional products.
Similarly, if we offer a bundle of our products that our customers and prospective customers do not find compelling, our business will also be harmed. Creating, designing and marketing these packages (and converting our current customer base to these new packages) entails significant technical and business risks and requires substantial expenditures and lead-time, and there is no guarantee that such packages will anticipate our customers’ needs or gain acceptance among our customers or in the broader market.
If we cannot successfully enhance our existing services or develop new products or if we are not successful in implementing such enhancements and selling new products and/or new packages of our products to our customers, we could lose customers or have difficulty attracting new customers, which would adversely impact our financial performance.
Our relationships with our partners may not be as successful in generating new customers as we anticipate, which could adversely affect our ability to increase our customer base.
We maintain a network of different types of partners, some of whom refer customers to us through links on their websites and outbound promotion to their customers, resell our products and create integrations with our products. We have invested and will continue to invest in programs to enhance our partners’ effectiveness; however, these programs could require substantial investment while providing no assurance of return or incremental revenue. We also rely on some of our partners to create integrations with third-party applications and platforms used by our customers. If we fail to encourage our partners to create such integrations, demand for our products could decrease, which would harm our business and operating results. If we are unable to maintain our contractual relationships with existing partners or establish new contractual relationships with potential partners, we may experience delays and increased costs in adding customers, which could have a material adverse effect on us. The number of customers we are able to add through these relationships is dependent on the marketing
efforts of our partners over which we exercise very little control, and a significant decrease in the number of new customers generated through these relationships or failure of our investment in partner programs to be effective could adversely affect the size of our customer base and revenue.
Competition for employees in our industry is intense, and we may not be able to attract and retain the highly skilled employees whom we need to support our business.
Competition for highly skilled engineering and marketing personnel is intense and we continue to face difficulty identifying and hiring qualified personnel in certain areas of our business and in certain locations. We may not be able to hire and retain such personnel at compensation levels consistent with our existing compensation and salary structure. Many of the companies with which we compete for experienced employees have greater resources than we have and may be able to offer more attractive terms of employment. In particular, candidates making employment decisions, particularly in high-technology industries, often consider the value of any equity they may receive in connection with their employment. As a result, any significant volatility in the market price of our common stock including the recent decline in share value, may adversely affect our ability to attract or retain highly skilled engineering and marketing personnel.
In addition, we invest significant time and expense in training our employees, which increases their value to competitors who may seek to recruit them. If we fail to retain our employees, we could incur significant expenses in hiring and training their replacements and the quality of our services and our ability to serve our customers could diminish, resulting in a material adverse effect on our business.
The success of our SinglePlatform offering is based, in part, on the quality of the content provided by our SinglePlatform customers and our ability to maintain a strong network of publishers.
Our SinglePlatform customers provide us with current information about their business that we, in turn, provide to our network of electronic publishers, such asincluding but not limited to Yelp, foursquare, YP.com and Urbanspoon®.Urbanspoon. The success of the SinglePlatform offering depends, in part, on our ability to provide these publishers and their consumers with the information they seek, which in turn depends on the quantity and quality of the content provided by our SinglePlatform customers. For example, we may be unable to provide these publishers and their consumers with the information they seek if our customers do not contribute content that is helpful, reliable and up-to-date, or if they remove content they previously submitted. If our SinglePlatform product does not provide content that is helpful, reliable and up-to-date, our ability to maintain our current network of electronic publishers and sign up new publishers could be harmed. If we are unable to provide our electronic publishers and their consumers with the information they seek, or if they can find equivalent content on other services, they may stop or reduce their use of our product, which could negatively impact our ability to retain existing customers and obtain new customers and our business would be harmed.
If we fail to retain our key personnel, we may not be able to achieve our anticipated level of growth and our business could suffer.
Our future depends, in part, on our ability to attract and retain key personnel. Our future also depends on the continued contributions of our executive officers and other key technical and marketing personnel, each of whom would be difficult to replace. In particular, Gail F. Goodman, our Chairman, President and Chief Executive Officer, is critical to the management of our business and operations and the development of our strategic direction. The loss of the services of Ms. Goodman or other executive officers or key personnel and the process to replace any of our key personnel would involve significant time and expense, may take longer than anticipated and may significantly delay or prevent the achievement of our business objectives.
We rely on third-party computer hardware and software that may be difficult to replace or that could cause errors or failures of our service and that requires us to closely monitor our usage to ensure that we remain in compliance with any applicable licensing requirements.
We rely on computer hardware purchased and software licensed from third parties in order to offer our products, including hardware and software from such large vendors as International Business Machines Corporation, Dell
Computer Corporation, 3PAR Inc., a division of the Hewlett-Packard Company, Oracle Corporation, Juniper Networks, Inc., Cisco Systems, Inc., Ciena Corporation and EMC Corporation. This hardware and software may not continue to be available on commercially reasonable terms, or at all. If we lose the right to use any of this hardware or software or such hardware or software malfunctions, our customers could experience delays or be unable to access our services until we can obtain and integrate equivalent technology or repair the malfunctioning hardware or software. Any delays or failures associated with our services could upset our customers and harm our business. In addition, if we fail to remain in compliance with the licensing requirements related to any third-party computer hardware and software we use, we may be subject to unanticipated expenses, auditing costs, penalties and the loss of such hardware and software, all of which could have a material adverse effect on our financial condition and results of operations.
If we are unable to protect the confidentiality of our unpatented proprietary information, processes and know-how and trade secrets, the value of our technology and products could be adversely affected.
We rely heavily upon unpatented proprietary technology, processes and know-how and trade secrets. Although we try to protect this information in part by executing confidentiality agreements with our employees, consultants and third parties, such agreements may offer only limited protection and may be breached. Any unauthorized disclosure or dissemination of our proprietary technology, processes and know-how or our trade secrets, whether by breach of a confidentiality agreement or otherwise, may cause irreparable harm to our business, and we may not have adequate remedies for any such breach. In addition, our trade secrets may otherwise be independently developed by our competitors or other third parties. If we are unable to protect the confidentiality of our proprietary information, processes and know-how or our trade secrets are disclosed, the value of our technology and services could be adversely affected, which could negatively impact our business, financial condition and results of operations.
Our use of open source software could impose limitations on our ability to commercialize our products.
We incorporate open source software into our products. Although we monitor our use of open source software closely, the terms of many open source licenses to which we are subject have not been interpreted by United States or foreign courts, and there is a risk that such licenses could be construed in a manner that imposes unanticipated conditions or restrictions on our ability to commercialize our products. In such event, we could be required to seek licenses from third parties in order to continue offering our products, to re-engineer our products or to discontinue sales of our products, or to release our software code under the terms of an open source license, any of which could materially adversely affect our business. Given the nature of open source software, there is also a risk that third parties may assert copyright and other intellectual property infringement claims against us based on our use of certain open source software programs.
Our anticipated growth could strain our personnel resources and infrastructure, and if we are unable to implement appropriate controls and procedures to manage our anticipated growth, we may not be able to implement our business plan successfully.
We are currently experiencing a period of rapid growth in our headcount and operations, which has placed, and will continue to place, to the extent that we are able to sustain such growth, a significant strain on our management and our administrative, operational and financial reporting infrastructure. Our success will depend in part on the ability of our senior management to manage this expected growth effectively. To do so, we believe we will need to continue to hire, train and manage new employees as needed. If our new hires perform poorly, or if we are unsuccessful in hiring, training, managing and integrating these new employees, or if we are not successful in retaining our existing employees, our business may be harmed. To manage the expected growth of our operations and personnel, we will need to continue to improve our operational and financial controls and update our reporting procedures and systems. The expected addition of new employees and the capital investments that we anticipate will be necessary to manage our anticipated growth will increase our cost base,
which will make it more difficult for us to offset any future revenue shortfalls by reducing expenses in the short term. If we fail to manage our anticipated growth successfully, we will be unable to execute our business plan successfully.
Providing our products to customers outside the United States exposes us to risks inherent in international business.
Customers in more than 180 countries and territories currently use our products. InWe have two regional development directors in Canada and, in 2011, we opened a marketing office in the United Kingdom and weKingdom. We may continue to expand our international operations in the future. Accordingly, we are subject to risks and challenges that we would otherwise not face if we conducted our business only in the United States. The risks and challenges associated with providing our products to customers outside the United States include:
localization of our products, including translation into foreign languages and associated expenses;
laws and business practices favoring local competitors;
compliance with multiple, conflicting and changing governmental laws and regulations, including those relating to tax, email, privacy and data protection;
foreign currency fluctuations;
different pricing environments;
difficulties in staffing and maintaining foreign operations; and
regional economic and political conditions.
If we fail to meet these risks and challenges, we will be unable to execute our business plan and may be subject to fines and regulatory actions.
We have incurred net losses in the past and expect to incur net losses on a quarterly basis in the future.
We have incurred net losses in the past and expect to incur net losses on a quarterly basis in the future. We reported net income for 2012, 2011 and 2010, however, we experienced net losses in prior years and a net loss for the second quarter of 2012. While we expect to generate future profitability, we may experience net losses in future periods, particularly quarterly periods. In addition, we expect our operating expenses to increase as we continue to expand our operations. If our operating expenses exceed our expectations, our financial performance could be adversely affected.
Failure to maintain effective internal control over financial reporting and disclosure controls and procedures would have a material adverse effect on our business.
The Sarbanes-Oxley Act of 2002 requires, among other things, that we maintain effective internal control over financial reporting and disclosure controls and procedures. In order to comply with Section 404 of the Sarbanes-Oxley Act’s requirements relating to internal control over financial reporting, we incur substantial accounting expense and expend significant management time on compliance-related issues. We expect to continue to incur such expenses and expend such time in the future. If in the future we are not able to comply with the requirements of Section 404 in a timely manner, or if we or our independent registered public accounting firm identify deficiencies in our internal control over financial reporting that are deemed to be material weaknesses, the market price of our stock would likely decline and we could be subject to sanctions or investigations by the NASDAQ Stock Market, the SEC or other regulatory authorities, which would require additional financial and management resources.
Our ability to use net operating loss carry-forwards in the United States may be limited.
As of December 31, 2012,2013, we had net operating loss carry-forwards of $42.9$33.5 million for U.S. federal tax purposes and $1.1 million$849,000 for state tax purposes. These loss carry-forwards expire at varying dates between 2013
2014 and 2032.2033. To the extent available, we intend to use these net operating loss carry-forwards to reduce the corporate income tax liability associated with our operations. Section 382 of the Internal Revenue Code of 1986, as amended, generally imposes an annual limitation on the amount of net operating loss carry-forwards that may be used to offset taxable income when a corporation has undergone significant changes in stock ownership. While our analysis shows that our public stock offerings and prior private financings have not resulted in ownership changes that would limit our ability to utilize net operating loss carry-forwards, any subsequent ownership changes could result in such a limitation. To the extent our use of net operating loss carry-forwards is significantly limited, our income could be subject to corporate income tax earlier than it would if we were able to use net operating loss carry-forwards, which could have a negative effect on our financial results.
Our quarterly results may fluctuate and if we fail to meet the expectations of analysts or investors, our stock price could decline substantially.
Our quarterly operating results may fluctuate, and if we fail to meet or exceed the expectations of securities analysts or investors, the trading price of our common stock could decline. Some of the important factors that could cause our revenue and operating results to fluctuate from quarter to quarter include:
our ability to attract new customers, retain existing customers and satisfy our customers’ requirements;
general economic conditions;
average revenue per customer;
our cost to acquire new customers;
changes in our pricing policies;or product bundling;
our ability to expand our business;
our ability to execute successfully on our strategy;
new product and service introductions;
technical difficulties or interruptions in our services as a result of our actions or those of third parties;
the timing of additional investments in our hardware and software systems;
the seasonal trends in our business;
regulatory compliance costs;
costs associated with future acquisitions of technologies and businesses and our ability to successfully integrate these acquisitions; and
extraordinary expenses such as litigation or other dispute-related settlement payments.
Some of these factors are not within our control, and the occurrence of one or more of them may cause our operating results to vary widely. As such, we believe that quarter-to-quarter comparisons of our revenue and operating results may not be meaningful and should not be relied upon as an indication of future performance.
We may need additional capital in the future, which may not be available to us on favorable terms, or at all, and may dilute the ownership of our existing stockholders.
We have historically relied on outside financing and cash from operations to fund our operations, capital expenditures and growth. We may require additional capital from equity or debt financing in the future to:
fund our operations;
respond to competitive pressures;
take advantage of strategic opportunities, including more rapid expansion of our business or the acquisition of complementary products, technologies or businesses; and
develop new products or enhancements to existing products.
We may not be able to secure timely additional financing on favorable terms, or at all. The terms of any additional financing may place limits on our financial and operating flexibility. If we raise additional funds through issuances of equity, convertible debt securities or other securities convertible into equity, our existing stockholders could suffer significant dilution, and any new securities we issue could have rights, preferences and privileges senior to those of our common stock. If we are unable to obtain adequate financing or financing on terms satisfactory to us, if and when we require it, our ability to grow or support our business and to respond to business challenges could be significantly limited.
We may engage in future acquisitions that could disrupt our business, dilute stockholder value and harm our business, operating results or financial condition.
We have completed fourseveral acquisitions in the past three years, including our most recent acquisition of SinglePlatform in June 2012. We have, from time to time, evaluated other acquisition opportunities and may pursue acquisition opportunities in the future. Acquisitions involve numerous risks, including:
an inability to locate a suitable acquisition candidate or technology or acquire a desirable candidate or technology on favorable terms;
difficulties in integrating personnel and operations from the acquired business or acquired technology with our existing technology and products and in retaining and motivating key personnel from the acquired business;
disruptions in our ongoing operations and the diversion of our management’s attention from their day-to-day responsibilities associated with operating our business;
increases in our expenses that adversely impact our business, operating results and financial condition;
potential write-offs of acquired assets and increased amortization expense related to identifiable assets acquired; and
potentially dilutive issuances of equity securities or the incurrence of debt.
In addition, any acquisitions we complete may not ultimately strengthen our competitive position or achieve our goals, or such an acquisition may be viewed negatively by our customers, stockholders or the financial markets.
We may need additional capital in the future, which may not be available to us on favorable terms, or at all, and may dilute the ownership of our existing stockholders.
We have historically relied on cash from operations to fund our operations, capital expenditures and growth. We may require additional capital from equity or debt financing in the future to:
fund our operations;
respond to competitive pressures;
take advantage of strategic opportunities, including more rapid expansion of our business or the acquisition of complementary products, technologies or businesses; and
develop new products or enhancements to existing products.
We may not be able to secure timely additional financing on favorable terms, or at all. The terms of any additional financing may place limits on our financial and operating flexibility. If we raise additional funds through issuances of equity, convertible debt securities or other securities convertible into equity, our existing stockholders could suffer significant dilution, and any new securities we issue could have rights, preferences and privileges senior to those of our common stock. If we are unable to obtain adequate financing or financing on terms satisfactory to us, if and when we require it, our ability to grow or support our business and to respond to business challenges could be significantly limited.
RISKS RELATED TO THE OWNERSHIP OF OUR COMMON STOCK
The market price of our common stock has been and may continue to be volatile.
The trading price of our common stock has been and may continue to be highly volatile and could be subject to wide fluctuations in response to various factors. Some of the factors that may cause the market price of our common stock to fluctuate include:
fluctuations in our quarterly financial results or the quarterly financial results of companies perceived to be similar to us;
quarterly unique customer additions and customer retention rates;
changes in estimates of our financial results or recommendations by securities analysts;
changes in general economic, industry and market conditions;
failure of any of our products to achieve or maintain market acceptance;
changes in market valuations of similar companies;
success of competitive products;
our ability to successfully integrate acquisitions;
changes in our capital structure, such as future issuances of securities or the incurrence of debt;
announcements by us or our competitors of significant products, contracts, acquisitions or strategic alliances;
regulatory developments in the United States, foreign countries or both;
litigation involving our company, our general industry or both;
additions or departures of key personnel;
investors’ general perception of us; and
the total number of shares of our common stock that have been sold short.
In addition, if the market for technology stocks or the stock market in general experiences a loss of investor confidence, the trading price of our common stock could decline for reasons unrelated to our business, financial condition or results of operations. If any of the foregoing occurs, it could cause our stock price to fall and may expose us to class action lawsuitslitigation that, even if unsuccessful, could be costly to defend and a distraction to management.
If securities or industry analysts do not continue to publish research or publish inaccurate or unfavorable research about our business, our stock price and trading volume could decline.
The trading market for our common stock depends in part on the research and reports that securities or industry analysts publish about us or our business. We do not control these analysts. If one or more of the analysts who covers us downgrades our stock or publishes inaccurate or unfavorable research about our business, our stock price would likely decline. If one or more of these analysts ceases coverage of our company or fails to publish reports on us regularly, demand for our stock could decrease, which could cause our stock price and trading volume to decline.
Anti-takeover provisions in our charter documents and Delaware law could discourage, delay or prevent a change of control of our company and may affect the trading price of our common stock.
We are a Delaware corporation and the anti-takeover provisions of the Delaware General Corporation Law may discourage, delay or prevent a change of control by prohibiting us from engaging in a business combination with an interested stockholder for a period of three years after the person becomes an interested stockholder, even if a change of control would be beneficial to our existing stockholders. In addition, our restated certificate of incorporation and second amended and restated bylaws may discourage, delay or prevent a change in our management or control over us that stockholders may consider favorable. Among other things, our restated certificate of incorporation and second amended and restated bylaws:
authorize the issuance of “blank check” preferred stock that could be issued by our board of directors to impede or delay a takeover attempt;
establish a classified board of directors, as a result of which the successors to the directors whose terms have expired will be elected to serve from the time of election and qualification until the third annual meeting following their election;
require that directors only be removed from office for cause and only upon a supermajority stockholder vote;
provide that vacancies on our board of directors, including newly created directorships, may be filled only by a majority vote of directors then in office;
limit who may call special meetings of stockholders;
prohibit stockholder action by written consent, requiring all actions to be taken at a meeting of the stockholders; and
require supermajority stockholder voting to effect certain amendments to our restated certificate of incorporation and second amended and restated bylaws.
We do not currently intend to pay dividends on our common stock and, consequently, the ability to achieve a return on an investment in our common stock will depend on appreciation in the price of our common stock.
We do not expect to pay cash dividends on our common stock. Any future dividend payments are within the absolute discretion of our board of directors and will depend on, among other things, our results of operations, working capital requirements, capital expenditure requirements, financial condition, contractual restrictions, business opportunities, anticipated cash needs, provisions of applicable law and other factors that our board of directors may deem relevant. We may not generate sufficient cash from operations in the future to pay dividends on our common stock.
| ITEM 1B. | UNRESOLVED STAFF COMMENTS |
None.
| ITEM 2. | PROPERTIES |
We conduct our operations in leased facilities. We currently lease approximately 145,000190,000 square feet of office space in Waltham, Massachusetts pursuant to a lease agreement, as amended, that expires in September 2022 with one ten-year extension option. This facility serves as our corporate headquarters. The functions performed at our headquarters include finance, human resources, legal, marketing, sales, customer support, operations, product strategy and research and development. We expect to occupy approximately 106,00061,000 additional square feet of space in this facility over the next threetwo years.
In Loveland, Colorado, we lease approximately 50,000 square feet of office space under a lease agreement that will expire in April 2019 with three three-year extension options. This facility is used for sales and support personnel. We lease approximately 8,000 and 2,000 square feet of office space in San Francisco, California and Delray, Florida, respectively, pursuant to lease agreements that expire in 2017 and 2016, respectively, and approximately 14,00027,000 square feet of office space in two facilities in New York, New York pursuant to lease agreements that expire in 20142016 and 2016.2018. The facilities in California and Florida and one of the New York locations are used for research and development personnel. The other New York facility houses SinglePlatform.our SinglePlatform personnel. We also lease a small amount of office space in London pursuant to a lease agreement that expires in 2013,2014, which is used to house marketing personnel.
Our production system hardware and the disaster recovery hardware for our production system, with the exception of SinglePlatform, are currently co-located in third-party hosting facilities. One facility, located in Bedford, Massachusetts, is owned and operated by Digital 55 Middlesex, LLC, an affiliate of Digital Realty Trust, Inc.,DRT, which provides services to us under an agreement that expires in December 2016 with two five-year extension options. The other facility, located in Santa Clara, California, is owned and operated by Digital Alfred, LLC, also an affiliate of Digital Realty Trust.DRT. The agreement for the facility in Santa Clara commencedwill expire in May 2011 and has an initial term of six years2017 with two four-year extension options.
We believe that the total space available to us in the facilities under our current leases and third-party hosting arrangements or obtainable by us on commercially reasonable terms, will meet our needs for the foreseeable future.
For more information about our lease and third-party hosting commitments, see also Note 10,Commitments and Contingencies, of the Notes to our Consolidated Financial Statements, included elsewhere in this Annual Report on Form 10-K.
| ITEM 3. | LEGAL PROCEEDINGS |
On August 7, 2012, two former employees, on behalf of themselves and all other similarly situated individuals, or collectively, the FLSA Plaintiffs, filed a complaint in the U.S. District Court for the District of Massachusetts that named us as a defendant in a lawsuit. The complaint, which was served on us on August 9, 2012, allegesalleged that we violated the Fair Labor Standards Act and the Massachusetts overtime law with respect to certain of our current and former sales employees. The FLSA Plaintiffs’ complaint seekssought an award for damages in an unspecified amount. AWe participated in a court-sanctioned mediation session with an independent mediator is scheduled to occur in March 2013 and, during the three months ended March 31, 2013, we recorded an accrual of $820,000. In July 2013, we executed a settlement agreement with the FLSA Plaintiffs that would terminate the litigation and settle all pending claims against us in exchange for an aggregate payment of $800,000. The U.S. District Court approved the settlement and settlement payments were distributed to all FLSA Plaintiffs in the fourth quarter of 2013. This litigation isSee also Note 10,Commitments and Contingencies,of the Notes to Consolidated Financial Statements, included elsewhere in its very early stages. As a result, neither the ultimate outcome of this litigation nor an estimate of a probable loss or any reasonably possible losses can be assessed at this time. Nevertheless, we believe we have meritorious defenses and intend to defend the lawsuit vigorously.Annual Report on Form 10-K.
On September 24, 2012, RPost Holdings, Inc., RPost Communications Limited and RMail Limited, or collectively, RPost, filed a complaint in the U.S. District Court for the Eastern District of Texas that named us as a defendant in a lawsuit. The complaint, which was served on us on December 26, 2012, alleges that certain elements of our email marketing technology infringe five patents held by RPost. RPost seeks an award for damages in an unspecified amount and injunctive relief. On February 11, 2013, RPost amended its complaint to name five of our partners as defendants. Under our contractual agreements with these partners, we are obligated to indemnify them for claims related to patent infringement. We filed a motion to sever and stay the claims against our partners and multiple motions to dismiss the claims against us. In January 2014, the case was stayed pending the resolution of certain state court and bankruptcy actions involving RPost, to which we are not a party. RPost has asked the court to reconsider the order to stay the case. This litigation is in its very early stages. As a result, neither the ultimate outcome of this litigation nor an estimate of a probable loss or any reasonably possible losses can be assessed at this time. Nevertheless, we believe we have meritorious defenses to any claim of infringement and intend to defend the lawsuit vigorously.
On November 14, 2012, we filed a complaint in the U.S. District Court for the District of Delaware against Umbanet, Inc., or Umbanet, seeking a declaratory judgment that two patents held by Umbanet, or collectively, the Umbanet Patents, are not infringed by a customer’s use of our email marketing product and that such patents are invalid. We refer to this matter as the Delaware Case. We filed the Delaware Case in response to a complaint filed by Umbanet in the U.S. District Court for the District of New Jersey against one of our customers alleging that the customer’s use of our email marketing product infringed the Umbanet Patents. We refer to this matter as the New Jersey Case. Umbanet has filed a motion in the Delaware Case seeking to dismiss the complaint or, in the alternative, stay the case pending resolution of the New Jersey Case. We have filed a motion in the New Jersey Case seeking to stay the case pending resolution of the Delaware Case. TheseIn January 2014, the judge in the New Jersey
Case ordered that the case should proceed notwithstanding the pending Delaware case. This litigation matters areis in aits very early stage.stages. As a result, neither the ultimate outcome of these mattersthis matter nor an estimate of a probable loss or any reasonably possible losses can be assessed at this time. WeNevertheless, we believe that we have meritorious defenses to any claim of infringement and intend to pursue these mattersdefend the lawsuit vigorously.
On March 7, 2013, CreateAds LLC, or CreateAds, filed a complaint in the U.S. District Court for the District of Delaware that named us as a defendant in a lawsuit. The complaint, which was served on us on March 8, 2013, alleges that certain elements of our email marketing technology infringe a patent held by CreateAds. CreateAds seeks an award for damages in an unspecified amount and injunctive relief. We have filed a motion to dismiss the complaint. In February 2014, the case was stayed pending a decision by the United States Supreme Court in the appeal of a patent case with issues very similar to the ones pending in our motion to dismiss. Following the Supreme Court’s decision, which is expected in June 2014, the district court will decide our motion to dismiss the CreateAds complaint. This litigation matter is in its very early stages. As a result, neither the ultimate outcome of this matter nor an estimate of a probable loss or any reasonably possible losses can be assessed at this time. Nevertheless, we believe that we have meritorious defenses to any claim of infringement and intend to defend the lawsuit vigorously.
From time to time we may become subject to various other legal proceedings and claims, either asserted or unasserted, which arise in the ordinary course of our business. While the outcome of these other claims cannot be predicted with certainty, we do not believe that the outcome of any of these other legal matters will have a material adverse effect on the Company’sour results of operations, financial condition or financial condition.cash flows.
| ITEM 4. | MINE SAFETY DISCLOSURES |
Not applicable.
PART II
| ITEM 5. | MARKET FOR REGISTRANT’S COMMON EQUITY, RELATED STOCKHOLDER MATTERS AND ISSUER PURCHASES OF EQUITY SECURITIES |
Certain Information Regarding the Trading of Our Common Stock
Our common stock trades under the symbol “CTCT” on the NASDAQ Global Select Market. The following table sets forth, for the periods indicated, the high and low sale price per share of our common stock on the NASDAQ Global Select Market:
| High | Low | High | Low | |||||||||||||
2011: | ||||||||||||||||
First Quarter | $ | 36.13 | $ | 26.25 | ||||||||||||
Second Quarter | $ | 36.33 | $ | 21.59 | ||||||||||||
Third Quarter | $ | 25.97 | $ | 14.46 | ||||||||||||
Fourth Quarter | $ | 25.62 | $ | 15.85 | ||||||||||||
2012: | ||||||||||||||||
First Quarter | $ | 32.18 | $ | 21.49 | $ | 32.18 | $ | 21.49 | ||||||||
Second Quarter | $ | 30.88 | $ | 15.71 | $ | 30.88 | $ | 15.71 | ||||||||
Third Quarter | $ | 21.22 | $ | 15.66 | $ | 21.22 | $ | 15.66 | ||||||||
Fourth Quarter | $ | 18.56 | $ | 11.50 | $ | 18.56 | $ | 11.50 | ||||||||
2013: | ||||||||||||||||
First Quarter (through February 25, 2013) | $ | 16.06 | $ | 13.09 | ||||||||||||
First Quarter | $ | 16.06 | $ | 12.70 | ||||||||||||
Second Quarter | $ | 17.26 | $ | 11.75 | ||||||||||||
Third Quarter | $ | 24.05 | $ | 16.08 | ||||||||||||
Fourth Quarter | $ | 31.36 | $ | 22.35 | ||||||||||||
2014: | ||||||||||||||||
First Quarter (through February 28, 2014) | $ | 32.91 | $ | 24.82 | ||||||||||||
Holders of Our Common Stock
As of February 25, 2013,28, 2014, there were 4847 holders of record of shares of our common stock. This number does not include stockholders for whom shares are held in “nominee” or “street” name. While we are unable to estimate the actual number of beneficial holders of our common stock, we believe the number of beneficial holders is substantially higher than the number of holders of record of shares of our common stock.
Dividends; Equity Repurchases
We have never paid or declared any cash dividends on our common stock and do not anticipate paying any cash dividends in the foreseeable future. We currently intend to retain all future earnings, if any, for use in the operation of our business. Neither we nor any affiliated purchaser or anyone acting on behalfThe following is a summary of us made any purchases of sharesour repurchases of our common stock induring the fourth quarter of 2012.three month period ended December 31, 2013:
Period | Total Number of Shares Purchased | Average Price Paid per Share(1) | Total Number of Shares Purchased as Part of Publicly Announced Plans or Programs(2) | Approximate Dollar Value of Shares that May Yet Be Purchased Under the Plans or Programs(2) | ||||||||||||
October 1 to October 31, 2013 | 35,900 | $ | 23.31 | 35,900 | $ | 14,634,477 | ||||||||||
November 1 to November 30, 2013 | — | — | — | $ | 14,634,477 | |||||||||||
December 1 to December 31, 2013 | — | — | — | $ | 14,634,477 | (3) | ||||||||||
Total | 35,900 | $ | 23.31 | 35,900 | N/A(3) | |||||||||||
| (1) | Includes commissions, markups and expenses. |
| (2) | On April 25, 2013, we announced that our board of directors approved the repurchase of up to $20 million of our common stock through December 31, 2013. Repurchased shares are retired and resume the status of authorized but unissued shares of common stock. |
| (3) | As of December 31, 2013, the period to repurchase shares has ended and no more shares may be repurchased under this program. |
Recent Sales of Unregistered Securities
We did not sell any unregistered securities during the year ended December 31, 2012.2013.
Securities Authorized for Issuance Under Equity Compensation Plans
Information regarding our equity compensation plans and the securities authorized for issuance thereunder is set forth herein under Part III, Item 12 below.
Stock Performance Graph
The following stock performance graph compares the cumulative total return to stockholders for our common stock for the period from December 31, 20072008 through December 31, 20122013 against the cumulative total return of the NASDAQ Composite Index and the NASDAQ Computer and Data Processing Index.
The comparison assumes $100.00 was invested in our common stock, the NASDAQ Composite Index and the NASDAQ Computer and Data Processing Index and assumes reinvestment of dividends, if any. The stock performance shown on the graph below is not necessarily indicative of future price performance.
Cumulative Total Return for Periods Presented
Among Constant Contact, Inc., the NASDAQ Composite Index (Total Returns)
and the NASDAQ Computer and Data Processing Index
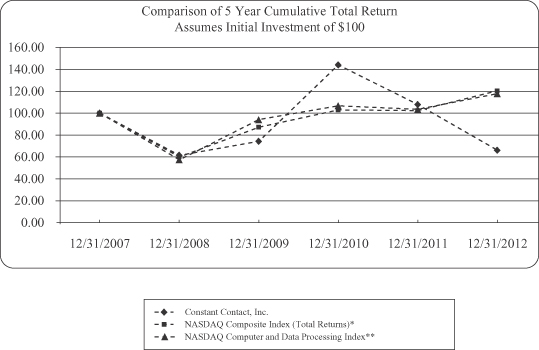
Chart is prepared by Zacks Investment Research, Inc. Used with permission. All rights reserved. Copyright 1980-20131980-2014
| * | Copyright NASDAQ OMX, Inc. Used with permission. All rights reserved. |
| ** | Calculated (or Derived) based from CRSP NASDAQ Computer and Data Processing, Center for Research in Security Prices (CRSP®), Graduate School of Business, The University of Chicago. Copyright |
This performance graph shall not be deemed “filed” for purposes of Section 18 of the Securities Exchange Act of 1934, as amended, or the Exchange Act, or incorporated by reference into any filing of under the Securities Act of 1933, as amended, or the Securities Act, except as shall be expressly set forth by specific reference in such filing.
| ITEM 6. | SELECTED FINANCIAL DATA |
The selected statements of operations data for the years ended December 31, 2013, 2012 2011 and 20102011 and the balance sheet data as of December 31, 20122013 and 20112012 have been derived from our audited consolidated financial statements, which are included elsewhere in this Annual Report on Form 10-K. The selected statements of operations data for the years ended December 31, 20092010 and 20082009 and the balance sheet data as of December 31, 2011, 2010 2009 and 20082009 have been derived from our audited consolidated financial statements, which are not included in this Annual Report on Form 10-K. The selected financial data set forth below should be read in
conjunction with “Management’s Discussion and Analysis of Financial Condition and Results of Operations” and our consolidated financial statements and related notes, included elsewhere in this Annual Report on Form 10-K. The historical results are not necessarily indicative of the results to be expected in any future period.
| Years Ended December 31, | Years Ended December 31, | |||||||||||||||||||||||||||||||||||||||
| 2012 | 2011 | 2010 | 2009 | 2008 | 2013 | 2012 | 2011 | 2010 | 2009 | |||||||||||||||||||||||||||||||
| (In thousands, except per share and customer data) | (In thousands, except per share and customer data) | |||||||||||||||||||||||||||||||||||||||
Statements of Operations Data: | ||||||||||||||||||||||||||||||||||||||||
Revenue | $ | 252,154 | $ | 214,420 | $ | 174,231 | $ | 129,061 | $ | 87,268 | $ | 285,383 | $ | 252,154 | $ | 214,420 | $ | 174,231 | $ | 129,061 | ||||||||||||||||||||
Cost of revenue(1) | 73,547 | 61,491 | 50,825 | 37,692 | 24,251 | 81,616 | 73,547 | 61,491 | 50,825 | 37,692 | ||||||||||||||||||||||||||||||
|
|
|
|
|
|
|
|
|
| |||||||||||||||||||||||||||||||
Gross profit | 178,607 | 152,929 | 123,406 | 91,369 | 63,017 | 203,767 | 178,607 | 152,929 | 123,406 | 91,369 | ||||||||||||||||||||||||||||||
|
|
|
|
|
|
|
|
|
| |||||||||||||||||||||||||||||||
Operating expenses(1): | ||||||||||||||||||||||||||||||||||||||||
Research and development | 38,787 | 29,478 | 23,985 | 18,367 | 15,123 | 45,567 | 38,787 | 29,478 | 23,985 | 18,367 | ||||||||||||||||||||||||||||||
Sales and marketing | 104,527 | 89,211 | 78,881 | 61,023 | 42,851 | 111,374 | 104,527 | 89,211 | 78,881 | 61,023 | ||||||||||||||||||||||||||||||
General and administrative | 31,132 | 23,979 | 17,625 | 13,749 | 9,508 | 38,531 | 31,132 | 23,979 | 17,625 | 13,749 | ||||||||||||||||||||||||||||||
Acquisition costs and other related charges | (11,355 | ) | 264 | 403 | — | — | — | (11,355 | ) | 264 | 403 | — | ||||||||||||||||||||||||||||
|
|
|
|
|
|
|
|
|
| |||||||||||||||||||||||||||||||
Total operating expenses | 163,091 | 142,932 | 120,894 | 93,139 | 67,482 | 195,472 | 163,091 | 142,932 | 120,894 | 93,139 | ||||||||||||||||||||||||||||||
|
|
|
|
|
|
|
|
|
| |||||||||||||||||||||||||||||||
Income (loss) from operations | 15,516 | 9,997 | 2,512 | (1,770 | ) | (4,465 | ) | 8,295 | 15,516 | 9,997 | 2,512 | (1,770 | ) | |||||||||||||||||||||||||||
Interest and other income (expense), net | 231 | 262 | 341 | 510 | 2,409 | 175 | 231 | 262 | 341 | 510 | ||||||||||||||||||||||||||||||
|
|
|
|
|
|
|
|
|
| |||||||||||||||||||||||||||||||
Income (loss) before income taxes | 15,747 | 10,259 | 2,853 | (1,260 | ) | (2,056 | ) | 8,470 | 15,747 | 10,259 | 2,853 | (1,260 | ) | |||||||||||||||||||||||||||
Income tax (expense) benefit | (2,991 | ) | 13,420 | 61 | — | — | (1,256 | ) | (3,181 | ) | 13,207 | 61 | — | |||||||||||||||||||||||||||
|
|
|
|
|
|
|
|
|
| |||||||||||||||||||||||||||||||
Net income (loss) | 12,756 | 23,679 | 2,914 | (1,260 | ) | (2,056 | ) | 7,214 | 12,566 | 23,466 | 2,914 | (1,260 | ) | |||||||||||||||||||||||||||
|
|
|
|
|
|
|
|
|
| |||||||||||||||||||||||||||||||
Net income (loss) per share: | ||||||||||||||||||||||||||||||||||||||||
Basic | $ | 0.42 | $ | 0.80 | $ | 0.10 | $ | (0.04 | ) | $ | (0.07 | ) | $ | 0.23 | $ | 0.41 | $ | 0.79 | $ | 0.10 | $ | (0.04 | ) | |||||||||||||||||
Diluted | $ | 0.41 | $ | 0.77 | $ | 0.10 | $ | (0.04 | ) | $ | (0.07 | ) | $ | 0.23 | $ | 0.41 | $ | 0.77 | $ | 0.10 | $ | (0.04 | ) | |||||||||||||||||
Weighted average shares outstanding used in computing per share amounts: | ||||||||||||||||||||||||||||||||||||||||
Basic | 30,386 | 29,566 | 28,765 | 28,253 | 27,879 | 30,730 | 30,386 | 29,566 | 28,765 | 28,253 | ||||||||||||||||||||||||||||||
Diluted | 31,003 | 30,671 | 29,945 | 28,253 | 27,879 | 31,356 | 31,003 | 30,671 | 29,945 | 28,253 | ||||||||||||||||||||||||||||||
Other Operating Data: | ||||||||||||||||||||||||||||||||||||||||
End of period number of unique customers | 555,000 | 500,000 | 435,000 | 350,000 | 255,000 | 595,000 | 555,000 | 500,000 | 435,000 | 350,000 | ||||||||||||||||||||||||||||||
| (1) | Amounts include stock-based compensation expense, as follows: |
| Years Ended December 31, | Years Ended December 31, | |||||||||||||||||||||||||||||||||||||||
| 2012 | 2011 | 2010 | 2009 | 2008 | 2013 | 2012 | 2011 | 2010 | 2009 | |||||||||||||||||||||||||||||||
| (In thousands) | (In thousands) | |||||||||||||||||||||||||||||||||||||||
Cost of revenue | $ | 1,758 | $ | 1,542 | $ | 1,124 | $ | 706 | $ | 354 | $ | 1,802 | $ | 1,758 | $ | 1,542 | $ | 1,124 | $ | 706 | ||||||||||||||||||||
Research and development | 3,733 | 3,221 | 2,491 | 1,150 | 737 | 3,359 | 3,733 | 3,221 | 2,491 | 1,150 | ||||||||||||||||||||||||||||||
Sales and marketing | 3,187 | 2,588 | 1,911 | 1,134 | 648 | 3,741 | 3,187 | 2,588 | 1,911 | 1,134 | ||||||||||||||||||||||||||||||
General and administrative | 5,596 | 4,357 | 3,026 | 2,094 | 1,117 | 5,829 | 5,596 | 4,357 | 3,026 | 2,094 | ||||||||||||||||||||||||||||||
|
|
|
|
|
|
|
|
|
| |||||||||||||||||||||||||||||||
| $ | 14,274 | $ | 11,708 | $ | 8,552 | $ | 5,084 | $ | 2,856 | $ | 14,731 | $ | 14,274 | $ | 11,708 | $ | 8,552 | $ | 5,084 | |||||||||||||||||||||
|
|
|
|
|
|
|
|
|
| |||||||||||||||||||||||||||||||
| (2) | Income tax (expense) benefit for the years ended December 31, 2012 and 2011 have been revised to correct prior period errors in our accounting for deferred income taxes associated with certain stock-based compensation awards. These revisions are described in detail in Note 2,Summary of Significant Accounting Policies,of the Notes to Consolidated Financial Statements, included elsewhere in this Annual Report on Form 10-K. |
| (3) | We define our end of period number of unique customers as the number of customers that we invoiced for one or more of our products during the last month of the period rounded to the nearest 5,000. |
| As of December 31, | ||||||||||||||||||||
| 2013 | 2012 | 2011 | 2010 | 2009 | ||||||||||||||||
| (In thousands) | ||||||||||||||||||||
Balance Sheet Data: | ||||||||||||||||||||
Cash, cash equivalents and marketable securities | $ | 123,201 | $ | 93,507 | $ | 140,112 | $ | 124,353 | $ | 113,102 | ||||||||||
Total assets(4) | 284,873 | 256,547 | 220,936 | 167,675 | 141,488 | |||||||||||||||
Deferred revenue | 35,256 | 32,700 | 28,983 | 25,103 | 20,341 | |||||||||||||||
Total stockholders’ equity | 229,871 | 202,867 | 170,480 | 126,122 | 104,968 | |||||||||||||||
Balance Sheet Data: Cash, cash equivalents and marketable securities Total assets Deferred revenue Total stockholders’ equity As of December 31, 2012 2011 2010 2009 2008 (In thousands) $ 93,507 $ 140,112 $ 124,353 $ 113,102 $ 107,175 257,262 221,378 167,675 141,488 127,142 32,700 28,983 25,103 20,341 15,052 203,582 170,922 126,122 104,968 99,990
| (4) | Deferred taxes as of December 31, 2012 and 2011 have been revised to correct prior period errors in our accounting for deferred income taxes associated with certain stock-based compensation awards. These revisions are described in detail in Note 2,Summary of Significant Accounting Policies,of the Notes to Consolidated Financial Statements, included elsewhere in this Annual Report on Form 10-K. |
| ITEM 7. | MANAGEMENT’S DISCUSSION AND ANALYSIS OF FINANCIAL CONDITION AND RESULTS OF OPERATIONS |
You should read the following discussion and analysis of our financial condition and results of operations together with our consolidated financial statements and the related notes and other financial information, included elsewhere in this Annual Report on Form 10-K. Some of the information contained in this discussion and analysis or set forth elsewhere in this Annual Report on Form 10-K, including information with respect to our plans and strategy for our business, includes forward-looking statements that involve risks and uncertainties. You should review the “Risk Factors” section of this Annual Report on Form 10-K for a discussion of important factors that could cause actual results to differ materially from the results described in or implied by the forward-looking statements contained in the following discussion and analysis.
Executive Overview
We are a leading provider of on-demand engagementonline marketing tools that are designed for small organizations, including businesses, associations and non-profits. We seek to help our customers succeed by creating and growing their customer and member relationships through our easy-to-use products combined with education, support, KnowHow and coaching. Our tools include our email marketing, social media marketing, event marketing, local deals, online listings and surveys, for small organizations, including small businesses, associations and non-profits. We also now offer a mobile storefront offering through the acquisition of SinglePlatform. We seek to help our customers succeed and have a long history of delivering affordable, easy-to-use products, support, KnowHow and coaching , all of which allow our customers to create and grow their customer relationships.survey products.
We market our products and acquire our customers through a variety of sources including online marketing, includingsuch as search engines and advertising on online networks and other websites, offline marketing through television and radio advertising, local seminars, relationships with our partners, referrals from our growing customer base, general brand awareness and the inclusion of a link to our website in the footer of substantially all of the emails sent by our customers.
We have grown rapidly since launching our first on-demand product in 2000. We ended 20122013 with approximately 555,000595,000 unique paying customers and had revenue for that year of $252$285 million.
Our business strategy focuses on expandingis to expand beyond email marketing to support aprovide an integrated multi-product strategy to drive highoffering that drives higher customer lifetime value.life-time value driven by improvements in average revenue per customer and retention. We believe increasing our customer’s lifetimelife-time value will be a key contributor to our continued success. To drive lifetimelife-time value, we willintend to continue to focus on acquiring and supporting customers in a cost-effective manner, increasing average revenue per customer through(through cross-selling, list size growth and increased product usagebundling of our products) and improving customer retention rates.
During 2012, we significantly expanded We continue to test pricing and product bundling. Bundled product offerings provide access to multiple products for one set monthly fee. We expect to offer a variety of packages that will contain different product combinations and pricing tiers. We believe, when used in combination, our product suite from threeintegrated products to six. We now haveprovide customers with a suite ofunified online marketing tools for small organizations including the following new products:platform and that by offering bundles, we will be able to achieve increased product usage, increased revenue per customer and higher retention rates.
Recent highlights include:
We launched Social CampaignsIntroduced our new contact management functionality and have been rolling out this functionality in January 2012. Social Campaignsa phased manner to all of our customers. This enhanced functionality enables our customers to have additional views of their contacts and allows usersthem to create, publish, promoterun targeted campaigns to specific segments of their contact list. It also allows customers to track and run campaigns on Facebook that offer promotions or content targeted toward those who “Like” themmanage engagement over time, across all of our different marketing campaign types and to incent others to “Like”build and share them.store contact lists without having a contact’s email address.
In January 2012, we acquired CardStar, Inc.,Introduced Digital Coupons, a leading developer of mobile applicationstrackable and customizable digital coupon that extendwhen coupled with deals from SaveLocal gives small businesses the use of loyalty, rewardsability to offer discount types mapped to their particular goals and membership cards and mobile coupons among consumers. The CardStar applicationobjectives from one integrated resource.
|
In February 2012, we launched SaveLocalLaunched several enhancements to our existing customers. SaveLocal, is an online tool that helps small businessesmobile marketing integration tools, including mobile email list building and location-aware text check-ins, as well as Android and iOS versions of our MyLibrary Plus application.
Rolled out our new in-product messaging center. We can now run local deals, gives merchants control of the dealtargeted marketing campaigns to customers, based on specific demographic and allows small businesses to incentivize social sharing to attract qualified new customers, and drive repeat business at an affordable price. In June 2012, we began offering SaveLocal to the broader market.behavioral characteristics.
| • | Announced new SinglePlatform opportunities. In April 2013, we announced that Yelp is part of our SinglePlatform network of publishers. In June |
Our products achieved
Announced a stock repurchase program in April 2013. Under the following milestonesrepurchase program, we were authorized to repurchase up to $20 million of our common stock through December 31, 2013. Shares could be repurchased from time to time in 2012:
Our email marketing product sent out more than 45 billion emails on behalfthe open market or privately negotiated transactions in accordance with applicable securities and stock exchange rules. Through December 31, 2013, we repurchased 285,900 shares of more than 500,000 email marketing customers;common stock at an average price of $18.77 per share for a total cost of $5.4 million. As of December 31, 2013, the stock repurchase program has ended.
Our EventSpot product managed more than 315,000 events for more than five million event registrants;
Our SinglePlatform digital storefronts had more than 100 million consumer views, with monthly views surpassing 20 million in December;
Our Social Campaigns product generated more than 120,000 users since its launch in February 2012; and
Our SaveLocal product launched more than 9,500 deals in 2012, with more than 20% of the deals purchased by new consumers.
Key Financial and Operating Metrics
In connection with the ongoing operation of our business, our management regularly reviews key financial and operating metrics. Given our growth strategy, we pay particular attention to customer life-time value, customer acquisition metrics, trialer growth, customer attrition, success in cross sellingcross-selling and growing customer list sizes, number of products per customer and average revenue per customer. We also consider other financial and operating metrics such as revenue, gross margin, expenses, customer satisfaction rates, average speed of answer for customer support calls, email deliverability rates and capital expenditures, among others. Management considers these financial and operating metrics critical to understanding and improving our business, reviewing our historical performance, benchmarking our performance versus other companies and identifying current and future trends, and for planning purposes.
In addition, we consider the following non-GAAP financial measures to be key indicators of our financial performance:
“adjusted EBITDA,” which we define as GAAP net income (loss) plusbefore income taxes, interest income and other income (expense), depreciation and amortization, and stock-based compensation, litigation contingency accrual and adjusted for contingent consideration adjustment and interest and other income (expense) and income taxes;adjustment;
“adjusted EBITDA margin,” which we define as adjusted EBITDA divided by revenue;
“non-GAAP net income,” which we define as GAAP net income (loss) plus stock-based compensation and adjusted for contingent consideration adjustment andbefore the non-cash portion of income taxes;taxes, stock-based compensation expense, litigation contingency accrual and contingent consideration adjustment; and
“free cash flow,” which we define as net cash flow from operating activities less acquisition of property and equipment.
We believe that these non-GAAP financial measures are useful to management and investors in evaluating our operating performance for the periods presented and provide a tool for evaluating our ongoing operations. These non-GAAP financial measures, however, are not a measure of financial performance under accounting principles generally accepted in the United States of America, or GAAP, and should not be considered a substitute for GAAP financial measures, including but not limited to net income (loss) or cash flows from operating, investing and financing activities and may not be comparable to similarly titled measures reported by other companies.
Certain Trends and Uncertainties
The following represents a summary of certain trends and uncertainties, which could have a significant impact on our financial condition and results of operations. This summary is not intended to be a complete list of potential trends and uncertainties that could impact our business in the long or short term. TheThis summary should be considered along with the factors set forth under Part I, Item 1A—“Risk Factors” and elsewhere in this Annual Report on Form 10-K.
We continue to closely monitor current economic conditions both in the U.S. and abroad, particularly as they impact small businesses, associations and non-profits. We believe that small organizations continue to experience some amount of economic hardship. If this economic hardship continues or worsens, our financial results could be adversely impacted.
Our long term strategy is substantially dependent on our ability to continue to generate interest in our existing products and to enhance, expand and expandintegrate our product offerings to serve the online marketing needs of small businesses, associations and non-profits. If we fail, our financial results could be adversely impacted.
| • | In connection with our acquisition of SinglePlatform, as of December 31, 2013, we |
We continue to test new bundled product offerings that will allow our customers to have access to multiple products for one monthly fee. Our efforts to offer product bundles may not result in significant revenue growth, may negatively impact trialer conversion rates and may be confusing to our customers, any of which may harm our financial performance and impede our long-term growth strategy.
We believe that given the size of our potential market and the relatively low barriers to entry, competition may increase. Increased competition could result from existing competitors, existing competitors that have been acquired by larger enterprises or new competitors that enter the market because of the potential opportunity. We will continue to closely monitor competitive activity and respond accordingly. Increased competition could have an adverse effect on our financial condition and results of operations.
From time to time, we may be subject to various claims and lawsuits by partners, customers, or other parties arising in the ordinary course of business, including lawsuits alleging patent infringement. We are currently a party to actions that are described in Part I, Item 3 “Legal Proceedings”, included elsewhere in this Annual Report on Form 10-K. These matters can be time-consuming, divert management’s attention and resources, and cause us to incur significant expenses. Furthermore, the results of any of these actions may have a material adverse effect on our operating results.
We believe that as we continue to grow revenue at expected rates, our cost of revenue and operating expenses, including sales and marketing, research and development and general and administrative expenses, while expected to decline on a percentage of revenue basis, will increase in absolute dollar amounts. For a description of the general trends we anticipate in various expense categories, see “Cost of Revenue and Operating Expenses” below.
Critical Accounting Policies
Our consolidated financial statements are prepared in accordance with accounting principles generally accepted in the United States. The preparation of our financial statements and related disclosures requires us to make estimates, assumptions and judgments that affect the reported amount of assets, liabilities, revenue, costs and expenses, and related disclosures. We believe that the estimates, assumptions and judgments involved in the accounting policies described below may have the greatest potential impact on our financial statements and, therefore, consider these to be our critical accounting policies. Accordingly, we evaluate our estimates and assumptions on an ongoing basis. Our actual results may differ from these estimates under different assumptions and conditions. See also Note 2,Summary of Significant Accounting Policies,of the Notes to Consolidated Financial Statements, included elsewhere in this Annual Report on Form 10-K for information about these critical accounting policies, as well as a description of our other significant accounting policies.
Revenue Recognition. We provide access to our products primarily through subscription arrangements whereby the customer is charged a fee for access for a defined term. Subscription arrangements include access to use our software via the Internet and support services, such as telephone, email and chat support. When there is evidence of an arrangement, the fee is fixed or determinable and collectability is deemed reasonably assured, we recognize revenue on a daily basis over the subscription period as the services are delivered. Delivery is considered to have commenced at the time the customer has paid for the products and has access to the account via a log-in and password. We also generate a small amount of revenue from our SaveLocal product by charging a fee to our customers based on the number of deals sold by our customers and the value of the successful deal. We recognize revenue from the fee charged when there is evidence of an arrangement, the fee is fixed or determinable and collectability is deemed reasonably assured. We also offer ancillary services to our customers related to our subscription-based products such as custom services and training. When sold together, revenue from custom services, training and our subscription products are accounted for separately based on vendor specific objective evidence of fair value of each of the services as those services have value on a standalone basis and do not involve a significant degree of risk or unique acceptance criteria. Revenue from custom services and training is recognized as the services are performed.
Income Taxes. Income taxes are provided for tax effects of transactions reported in the financial statements and consist of income taxes currently due plus deferred income taxes related to timing differences between the basis of certain assets and liabilities for financial statement and income tax reporting purposes. Deferred taxes are determined based on the difference between the financial statement and tax basis of assets and liabilities using enacted tax rates in effect in the years in which the differences are expected to reverse. A valuation allowance is provided if, based upon the weight of available evidence, it is more likely than not that some or all of the deferred tax assets will not be realized.
We account for uncertainty in income taxes recognized in our financial statements by applying a two-step process to determine the amount of tax benefit to be recognized. First, the tax position must be evaluated to determine the likelihood that it will be sustained upon external examination. If the tax position is deemed “more-likely-than-not” to be sustained, the tax position is then assessed to determine the amount of benefit to recognize in the financial statements. The amount of the benefit that may be recognized is the largest amount that has a greater than 50% likelihood of being realized upon ultimate settlement.
Goodwill and Acquired Intangible Assets. We record goodwill when consideration paid in a purchase acquisition exceeds the fair value of the net tangible assets and the identified intangible assets acquired. Goodwill is not amortized, but rather is tested for impairment annually or more frequently if facts and circumstances
warrant a review. We perform our assessment for impairment of goodwill on an annual basis and we have determined that there is a single reporting unit for the purpose of conducting this annual goodwill impairment assessment. For purposes of assessing potential impairment, we annually estimate the fair value of the reporting unit (based on our market capitalization) and compare this amount to the carrying value of the reporting unit (as reflected by our total stockholders’ equity). If we determine that the carrying value of the reporting unit exceeds its fair value, an impairment charge would be required. We completed our most recent annual impairment test of goodwill on November 30, 2012.2013. Based upon that evaluation, we determined that our goodwill was not impaired.
Intangible assets are recorded at their estimated fair values at the date of acquisition. We amortize acquired intangible assets over their estimated useful lives based on the pattern of consumption of the economic benefits or, if that pattern cannot be readily determined, on a straight-line basis.
Software and Website Development Costs. Relative to development costs of our on-demand products and website, we capitalize certain direct costs to develop functionality as well as certain upgrades and enhancements that are probable to result in additional functionality. The costs incurred in the preliminary stages of development are expensed as incurred. Once an application has reached the development stage, internal and external costs, if direct and incremental, are capitalized as part of property and equipment until the software is substantially complete and ready for its intended use. Once placed in use, capitalized software is amortized over a three-year period in the expense category to which the software relates.
Stock-Based Compensation. We value all stock-based compensation, including grants of stock options, restricted stock and restricted stock units, at fair value on the date of grant, and expense the fair value over the applicable service period. The straight-line method is applied to all awards with service and market conditions, while the graded vesting method is applied to all awards with both service and performance conditions.
We base the fair value of common stock on the quoted market price of our stock. The fair value of restricted stock and restricted stock units for awards with time-based and performance-based vesting conditions are based on the fair value of common stock on the date of grant. We value restricted stock units with market-based vesting criteria using a Monte Carlo simulation model. The number of awardsshares expected to be earned, based on achievement of the market condition, is factored into the grant date Monte Carlo valuation for the awards. The grant date fair value is not subsequently adjusted regardless of the eventual number of awardsshares that are earned based on the market condition.
The fair value of each stock option grant is estimated on the date of grant using the Black-Scholes option-pricing model. The expected term assumption is based on the “simplified method” for estimating the expected term for awards that qualify as “plain-vanilla” options. Expected volatility is based on historical volatility of the publicly traded stocks of a peer group of companies, inclusive of us, commencing October 2007. The risk-free interest rate is determined by reference to U.S. Treasury bond yields at or near the time of grant for time periods similar to the expected term of the award. The relevant data used to determine the value of the stock option grants is as follows:
| Years Ended December 31, | Years Ended December 31, | |||||||||||||||||||||||
| 2012 | 2011 | 2010 | 2013 | 2012 | 2011 | |||||||||||||||||||
Weighted average risk-free interest rate | 0.81 | % | 1.82 | % | 2.41 | % | 1.07 | % | 0.81 | % | 1.82 | % | ||||||||||||
Expected term (in years) | 4.6 | 5.5 | 6.1 | 4.6 | 4.6 | 5.5 | ||||||||||||||||||
Weighted average expected volatility | 53.58 | % | 52.15 | % | 52.17 | % | 51.14 | % | 53.58 | % | 52.15 | % | ||||||||||||
Expected dividends | 0 | % | 0 | % | 0 | % | 0 | % | 0 | % | 0 | % | ||||||||||||
These assumptions represented our best estimates, but the estimates involve inherent uncertainties and the application of our judgment. As a result, if factors change and we use significantly different assumptions or estimates, our stock-based compensation expense could be materially different. Authoritative guidance requires that we recognize compensation expense for only the portion of awards that are expected to vest. In developing a
forfeiture rate estimate, we have considered our historical experience to estimate pre-vesting forfeitures for awards with service conditions. For awards with performance conditions we estimate the probability that the performance condition will be met. If our actual forfeiture rate is materially different from the estimate, our stock-based compensation expense could be significantly different from what we have recorded in the current period. As of December 31, 2012,2013, we had $30.2$24.4 million of unrecognized compensation expense associated with outstanding equity awards, which is expected to be recognized over a weighted-average period of 2.512.54 years.
Fair Value of Financial Instruments
Certain assets and liabilities are carried at fair value under GAAP. Fair value is defined as the exchange price that would be received for an asset or paid to transfer a liability (an exit price) in the principal or most advantageous market for the asset or liability in an orderly transaction between market participants on the measurement date. Valuation techniques used to measure fair value must maximize the use of observable inputs and minimize the use of unobservable inputs. A fair value hierarchy based on three levels of inputs, of which the first two are considered observable and the last is considered unobservable, are used to measure fair value:
Level 1 — Quoted prices in active markets for identical assets or liabilities.
Level 2 — Inputs other than Level 1 that are observable, either directly or indirectly, such as quoted prices for similar assets or liabilities; quoted prices in markets that are not active; or other inputs that are observable or can be corroborated by observable market data for substantially the full term of the assets or liabilities.
Level 3 — Unobservable inputs that are supported by little or no market activity and that are significant to the fair value of the assets or liabilities. Unobservable inputs are developed based on the best information available, which might include our own data.
Sources of Revenue
We derive our revenue principally from subscription fees from our customers. Our revenue is driven primarily by the number of paying customers and the subscription fees for our products and is not concentrated within any one customer or group of customers. In 2012,2013, our top 100 customers accounted for less than 1% of our total revenue. We generally do not require our customers to commit to a contractual term; however, our customers are required to prepay for subscriptions on a monthly, semi-annual, or annual basis by providing a credit card or bank check. Fees are recorded initially as deferred revenue and then recognized as revenue on a daily basis over the prepaid subscription period. In February 2012, we launchedOur pricing for our SaveLocal product for which we chargeis a fee based on the number of deals sold by our customers and the value of the successful deal. We have not yet generated significant revenue from this product.
We also generate a small amount of revenue from ancillary services related to our products, which primarily consist of custom services and training through our experts program. Revenue generated from professional services and training accounted for approximately 1% of grosstotal revenue for each of the years ended December 31, 2013, 2012 2011 and 2010.2011.
Cost of Revenue and Operating Expenses
We allocate certain occupancy and general office related expenses, such as rent, utilities, office supplies and depreciation of general office assets to cost of revenue and operating expense categories based on headcount. As a result, an occupancy expense allocation is reflected as personnel related costs in cost of revenue and each operating expense category.
Cost of Revenue. Cost of revenue consists primarily of wages and benefits for software operations and customer support personnel, credit card processing fees, and depreciation and amortization, and maintenance and hosting of our software applications underlying our product offerings. We allocate a portion of customer support costs relating to assisting trial customers to sales and marketing expense.
The expenses related to our hosted software applications are affected by the number of customers who subscribe to our products and the complexity and redundancy of our software applications and hosting infrastructure. We expect cost of revenue to increase in absolute dollars as we expect to increase our number of customers but to decrease as a percentage of revenue over time as we gain efficiencies created by our expected revenue growth and cost savings.
Research and Development. Research and development expenses consist primarily of wages and benefits for product strategy and development personnel. We have focused our research and development efforts on improving ease of use, functionality and technological scalability of our existing products as well as on the development of new product offerings. We primarily expense research and development costs. However, direct development costs related to software enhancements that add functionality are capitalized and amortized over their useful life. We expect that on an annual basis research and development expenses will continue to increase both in absolute dollars and as a percentage of revenue due to our expanded investment in our product roadmap over the next twelve months.roadmap. Over the longer term we expect our research and development expenses to increase in absolute dollars but decrease as a percentage of revenue as we expect to grow our revenue at a faster rate.
Sales and Marketing. Sales and marketing expenses consist primarily of advertising and promotional costs, wages and benefits for sales and marketing personnel, partner referral fees, the portion of customer support costs that relate to assisting trial customers and amortization of sales and marketing relating intangible assets. Advertising costs consist primarily of pay-per-click advertising with search engines, other online and offline advertising media, including television and radio advertisements, as well as the costs to create and produce these advertisements. Advertising costs are expensed as incurred. Promotional costs consist primarily of public relations, memberships and event costs. Additionally, sales and marketing expenses include costs related to our efforts to retain our customers and to cross-sell and increase usage of our products. In order to continue to grow our business and brand and category awareness, we expect that we will continue to commit substantial resources to our sales and marketing efforts. As a result, we expect that on an annual basis, sales and marketing expenses will increase in absolute dollars, but continue to decrease as a percentage of revenue as we expect to continue to grow our revenue at a faster rate.
General and Administrative. General and administrative expenses consist primarily of wages and benefits for administrative, human resources, internal information technology support, finance, accounting and accountinganalytics personnel, professional fees, board compensation and expenses, certain taxes and other corporate expenses. In 2013, we also recorded litigation expense related to the settlement of a lawsuit and an accrual related to estimated personal property taxes. We expect that general and administrative expenses will increase in absolute dollars as we continue to add personnel in connection with the anticipated growth of our business and incur costs related to operating as a public company. Therefore, we expect that our general and administrative expenses will increase in absolute dollars,company but remain flat as a percentage of revenue over the next year. Over the longer term we expect our general and administrative expenses to declinedecrease as a percentage of revenue as we expect to continue to grow our revenue at a faster rate.
Acquisition Costs and Other Related Charges. Acquisition costs and other related charges include expenses associated with third-party professional services we utilize related to the evaluation and execution of successful acquisitions. Acquisition costs and other related charges in 2012 also includesinclude changes in the fair value of aour contingent consideration liability recorded as the result of the SinglePlatform acquisition. This liability was measured at fair value on the acquisition date, and until the liability is settled, it must be remeasured to fair value at each reporting period, with the changes included in our results of operations. We expect towill evaluate quarterly remeasurements of the fair value of this liability until it is settled at six-month intervals through June 2014.2014, the last settlement date. We may also continue to incur acquisition costs and other related charges in future periods if we complete additional acquisitions.
Results of Operations
The following table sets forth selected statements of operations data for each of the periods indicated as a percentage of total revenue.
| Years Ended December 31, | Years Ended December 31, | |||||||||||||||||||||||
| 2012 | 2011 | 2010 | 2013 | 2012 | 2011 | |||||||||||||||||||
Revenue | 100 | % | 100 | % | 100 | % | 100 | % | 100 | % | 100 | % | ||||||||||||
Cost of revenue | 29 | 29 | 29 | 29 | 29 | 29 | ||||||||||||||||||
|
|
|
|
|
| |||||||||||||||||||
Gross profit | 71 | 71 | 71 | 71 | 71 | 71 | ||||||||||||||||||
|
|
|
|
|
| |||||||||||||||||||
Operating expenses: | ||||||||||||||||||||||||
Research and development | 15 | 14 | 14 | 16 | 15 | 14 | ||||||||||||||||||
Sales and marketing | 42 | 42 | 45 | 39 | 42 | 42 | ||||||||||||||||||
General and administrative | 12 | 11 | 10 | 14 | 12 | 11 | ||||||||||||||||||
Acquisition costs and other related charges | (4 | ) | — | — | — | (4 | ) | — | ||||||||||||||||
|
|
|
|
|
| |||||||||||||||||||
Total operating expenses | 65 | 67 | 69 | 69 | 65 | 67 | ||||||||||||||||||
|
|
|
|
|
| |||||||||||||||||||
Income from operations | 6 | 4 | 2 | 2 | 6 | 4 | ||||||||||||||||||
Interest and other income (expense), net | — | — | — | — | — | — | ||||||||||||||||||
|
|
|
|
|
| |||||||||||||||||||
Income before income taxes | 6 | 4 | 2 | 2 | 6 | 4 | ||||||||||||||||||
Income tax (expense) benefit | (1 | ) | 6 | — | — | (1 | ) | 6 | ||||||||||||||||
|
|
|
|
|
| |||||||||||||||||||
Net income | 5 | % | 10 | % | 2 | % | 2 | % | 5 | % | 10 | % | ||||||||||||
|
|
|
|
|
| |||||||||||||||||||
Years Ended December 31, 2013, 2012 2011 and 20102011
Revenue
| Years Ended December 31, | 2012-2011 % Change | 2011-2010 % Change | ||||||||||||||||||
| 2012 | 2011 | 2010 | ||||||||||||||||||
| (dollars in thousands) | ||||||||||||||||||||
Revenue | $ | 252,154 | $ | 214,420 | $ | 174,231 | 18 | % | 23 | % | ||||||||||
| Years Ended December 31, | 2013-2012 % Change | 2012-2011 % Change | ||||||||||||||||||
| 2013 | 2012 | 2011 | ||||||||||||||||||
| (dollars in thousands) | ||||||||||||||||||||
Revenue | $ | 285,383 | $ | 252,154 | $ | 214,420 | 13 | % | 18 | % | ||||||||||
Revenue increased by $33.2 million from 2012 to 2013. The increase resulted primarily from an approximately 8% increase in the number of average monthly customers and an approximately 5% increase in average revenue per customer. The increase in average revenue per customer was primarily due to an increase in average customer list size, which increases the monthly amount invoiced to our email marketing customers, and to revenue from our SinglePlatform product, which has a higher monthly price than our other products. We expect our average revenue per customer to increase over time.
Revenue increased by $37.7 million from 2011 to 2012. The increase resulted primarily from an approximately 12% increase in the number of average monthly customers and an approximately 5% increase in average revenue per customer. The increase in average revenue per customer was primarily due to an increase in average customer list size and additional revenue from add-ons to our email marketing product and from our event marketing product. The increase in revenue from our event marketing product was primarily driven by a price increase implemented in September 2011 as well as an increase in the number of event marketing customers in 2012. We expect our average revenue per customer to increase over time.
Revenue increased by $40.2 million from 2010 to 2011. The increase resulted primarily from an approximately 19% increase in the number of average monthly customers and an approximately 4% increase in average revenue per customer. The increase in average revenue per customer was primarily due to an increase in average customer list size and additional revenue from add-ons to our email marketing product and from our event marketing product. The increase in revenue from our event marketing product was due to a price increase implemented in September 2011 as well as an increase in the number of event marketing customers in 2011.
Cost of Revenue
| Years Ended December 31, | 2012-2011 % Change | 2011-2010 % Change | Years Ended December 31, | 2013-2012 % Change | 2012-2011 % Change | |||||||||||||||||||||||||||||||||||
| 2012 | 2011 | 2010 | 2013 | 2012 | 2011 | |||||||||||||||||||||||||||||||||||
| (dollars in thousands) | (dollars in thousands) | |||||||||||||||||||||||||||||||||||||||
Cost of revenue | $ | 73,547 | $ | 61,491 | $ | 50,825 | 20 | % | 21 | % | $ | 81,616 | $ | 73,547 | $ | 61,491 | 11 | % | 20 | % | ||||||||||||||||||||
Percent of revenue | 29 | % | 29 | % | 29 | % | 29 | % | 29 | % | 29 | % | ||||||||||||||||||||||||||||
Cost of revenue increased by $8.1 million from 2012 to 2013 and was 29% of revenue for both years. The increase in absolute dollars resulted primarily from increased customer support personnel costs of $3.3 million to support our customer growth and increased number of products. Personnel costs in our operations group, which is responsible for managing our technology infrastructure, increased by $1.2 million. Depreciation, hosting and maintenance costs increased by $2.0 million as a result of scaling and adding capacity to our hosting infrastructure. Merchant card fees increased by $873,000 due to the higher volume of billing transactions.
Cost of revenue increased by $12.1 million from 2011 to 2012 and was 29% of revenue for both years. The increase in absolute dollars resulted primarily from increased customer support personnel costs of $5.6 million to support our customer growth and increased number of products and increased personnel costs of $1.4 million in our operations group to manage our technology infrastructure.group. Depreciation, hosting and maintenance costs increased by $3.9 million as a result of scaling and adding capacity to our hosting infrastructure inclusive of the effects of transitioning to a new third-party hosting facility in California in the third quarter of 2011.
Cost of revenue increased by $10.7 million from 2010 to 2011 and was 29% of revenue for both years. The increase in absolute dollars resulted primarily from increased customer support personnel costs of $5.7 million to support our customer growth. Depreciation, hosting and maintenance costs increased by $2.6 million as a result of scaling and adding capacity to our hosting infrastructure inclusive of the effects of transitioning to a new third-party hosting facility in California in the third quarter of 2011. We also incurred an additional $942,000 of expense related to customer promotional incentives that we offered and an additional $720,000 of expense related to higher credit card fees due to the higher volume of billing transactions.
Research and Development Expenses
| Years Ended December 31, | 2012-2011 % Change | 2011-2010 % Change | Years Ended December 31, | 2013-2012 % Change | 2012-2011 % Change | |||||||||||||||||||||||||||||||||||
| 2012 | 2011 | 2010 | 2013 | 2012 | 2011 | |||||||||||||||||||||||||||||||||||
| (dollars in thousands) | (dollars in thousands) | |||||||||||||||||||||||||||||||||||||||
Research and development expenses | $ | 38,787 | $ | 29,478 | $ | 23,985 | 32 | % | 23 | % | $ | 45,567 | $ | 38,787 | $ | 29,478 | 17 | % | 32 | % | ||||||||||||||||||||
Percent of revenue | 15 | % | 14 | % | 14 | % | 16 | % | 15 | % | 14 | % | ||||||||||||||||||||||||||||
Research and development expenses increased by $6.8 million from 2012 to 2013. The increase was primarily due to additional personnel costs of $4.8 million and additional consulting costs of $1.4 million as a result of our continued hiring of research and development employees and use of contractors, both to further develop and enhance our product offerings.
Research and development expenses increased by $9.3 million from 2011 to 2012. The increase in absolute dollars was primarily due to additional personnel related costs of $8.1 million and additional consulting costs of $925,000 as a result of our continued hiring of research and development employees and use of contractors, both to further develop and enhance our product offerings.
Research and development expenses increased by $5.5 million from 2010 to 2011. The increase in absolute dollars was primarily due to additional personnel related costs of $5.2 million and additional consulting costs of $311,000 as a result of our continued hiring of research and development employees and use of contractors to further develop and enhance our product offerings.
Sales and Marketing Expenses
| Years Ended December 31, | 2012-2011 % Change | 2011-2010 % Change | Years Ended December 31, | 2013-2012 % Change | 2012-2011 % Change | |||||||||||||||||||||||||||||||||||
| 2012 | 2011 | 2010 | 2013 | 2012 | 2011 | |||||||||||||||||||||||||||||||||||
| (dollars in thousands) | (dollars in thousands) | |||||||||||||||||||||||||||||||||||||||
Sales and marketing expenses | $ | 104,527 | $ | 89,211 | $ | 78,881 | 17 | % | 13 | % | $ | 111,374 | $ | 104,527 | $ | 89,211 | 7 | % | 17 | % | ||||||||||||||||||||
Percent of revenue | 42 | % | 42 | % | 45 | % | 39 | % | 42 | % | 42 | % | ||||||||||||||||||||||||||||
Sales and marketing expenses increased by $6.8 million from 2012 to 2013. The increase in absolute dollars was largely due to increased personnel costs of $3.0 million that resulted primarily from a full year of SinglePlatform personnel which accounted for a $4.8 million increase. This increase was partially offset by a decrease in salary and stock-based compensation expense during the period and a decrease in the allocation of occupancy and general corporate expenses to sales and marketing. A significant contribution to the decrease in salary and stock-based compensation was due to the departure of an executive within the group. The decrease in the allocation of occupancy and general corporate expenses was due to a decrease in sales and marketing wages as a percentage of total wages within our company. Advertising and promotional expenditures also increased by $3.0 million and partner referral fees increased by $854,000 as the number of new customers generated from our partners increased.
Sales and marketing expenses increased by $15.3 million from 2011 to 2012. The increase in absolute dollars was largely due to increased personnel related costs of $10.8 million that resulted primarily from adding
employees and increased consulting fees of $929,000, both to focus on customer acquisition, cross-selling to our customer base, partner efforts and enabling increased usage and better retention. SinglePlatform personnel accounted for $2.7 million of the increase in personnel related costs. Partner referral fees increased by $2.1 million as the number of new customers generated from our partners increased. We also incurred an increase in amortization of $833,000 related to the amortization of sales and marketing related intangibles resulting from our acquisitions.
Sales and marketing expenses increased by $10.3 million from 2010 to 2011. The increase in absolute dollars was largely due to increased personnel related costs of $5.9 million that resulted primarily from adding employees to focus on customer acquisition, cross-selling to our customer base, partner efforts and enabling increased usage and better retention. Partner referral fees increased by $2.3 million as the number of new customers generated from our partners increased. Additionally, advertising and promotional expenditures increased by $1.4 million.
General and Administrative Expenses
| Years Ended December 31, | 2012-2011 % Change | 2011-2010 % Change | Years Ended December 31, | 2013-2012 % Change | 2012-2011 % Change | |||||||||||||||||||||||||||||||||||
| 2012 | 2011 | 2010 | 2013 | 2012 | 2011 | |||||||||||||||||||||||||||||||||||
| (dollars in thousands) | (dollars in thousands) | |||||||||||||||||||||||||||||||||||||||
General and administrative expenses | $ | 31,132 | $ | 23,979 | �� | $ | 17,625 | 30 | % | 36 | % | $ | 38,531 | $ | 31,132 | $ | 23,979 | 24 | % | 30 | % | |||||||||||||||||||
Percent of revenue | 12 | % | 11 | % | 10 | % | 14 | % | 12 | % | 11 | % | ||||||||||||||||||||||||||||
General and administrative expenses increased by $7.4 million from 2012 to 2013. The increase in absolute dollars was primarily due to additional personnel costs of $4.9 million as a result of increasing the number of general and administrative employees to support our overall growth, including an increase in the number of employees focused on analytics and business intelligence. We also recorded litigation expense of $820,000 in 2013 due to the settlement of a lawsuit and professional service fees increased by $555,000 in 2013 primarily due to increased costs associated with our defense of certain legal matters. In 2013, we also recorded an expense of $483,000 related to an estimated property tax accrual.
General and administrative expenses increased by $7.2 million from 2011 to 2012. The increase in absolute dollars was primarily due to additional personnel related costs of $5.8 million as a result of increasing the number of general and administrative employees to support our overall growth and additional stock-based compensation expense resulting from an increase in equity awards and their related valuations. We also incurred an increase of approximately $1.5 million in consulting and professional services fees associated with the growth of our business.
General and administrative expenses increased by $6.4 million from 2010 to 2011. The increase in absolute dollars was primarily due to additional personnel related costs of $5.0 million as a result of increasing the number of general and administrative employees to support our overall growth and additional stock-based compensation expense resulting from an increase in equity awards and their related valuations. We also incurred an increase of approximately $1.0 million in consulting and professional services fees associated with the growth of our business.
Acquisition Costs and Other Related Charges
| Years Ended December 31, | 2012-2011 % Change | 2011-2010 % Change | ||||||||||||||||||
| 2012 | 2011 | 2010 | ||||||||||||||||||
| (dollars in thousands) | ||||||||||||||||||||
Acquisition Costs and Other Related Charges | $ | (11,355 | ) | $ | 264 | $ | 403 | (4401 | )% | (34 | )% | |||||||||
| Years Ended December 31, | 2013-2012 % Change | 2012-2011 % Change | ||||||||||||||||||
| 2013 | 2012 | 2011 | ||||||||||||||||||
| (dollars in thousands) | ||||||||||||||||||||
Acquisition Costs and Other Related Charges | $ | — | $ | (11,355 | ) | $ | 264 | 100 | % | (4401 | )% | |||||||||
There were no acquisition costs and other related charges in 2013. Acquisition costs and other related charges resulted in income of $11.4 million for 2012 and expenses of $264,000 for 2011. Transaction costs during 2012 were $797,000 related to the CardStar and SinglePlatform acquisitions. We also recorded an adjustment to decrease the fair value of the contingent consideration liability by $12.2 million in 2012 due to the remeasurement of the fair value of our contingent consideration liability.liability related to the SinglePlatform acquisition. As of December 31, 2012,2013, none of the first target date, the targettargets had not been met and no amounts werehave been paid. The decrease in the fair value of the liability resulted from reductions to the SinglePlatform revenue forecast scenarios. These forecast scenarios were decreased due tobased on SinglePlatform’s actual operating results and lower than forecasted productivity of its sales organization.
Acquisition costs and other related charges of $264,000 for 2011 and $403,000 for 2010 related to our acquisition of Bantam Networks, LLC, or Bantam Networks, in 2011 and NutshellMail, Inc., or NSM in 2010.2011.
Interest and Other Income (expense), net
| Years Ended December 31, | 2012-2011 % Change | 2011-2010 % Change | ||||||||||||||||||
| 2012 | 2011 | 2010 | ||||||||||||||||||
| (dollars in thousands) | ||||||||||||||||||||
Interest and other income (expense), net | $ | 231 | $ | 262 | $ | 341 | (12 | )% | (23 | )% | ||||||||||
| Years Ended December 31, | 2013-2012 % Change | 2012-2011 % Change | ||||||||||||||||||
| 2013 | 2012 | 2011 | ||||||||||||||||||
| (dollars in thousands) | ||||||||||||||||||||
Interest and other income (expense), net | $ | 175 | $ | 231 | $ | 262 | (24 | )% | (12 | )% | ||||||||||
Interest and other income (expense), net decreased by $56,000 from 2012 to 2013 due primarily to a decrease in interest earned on our investment portfolio as a result of lower average balances partially offset by an increase in foreign currency transaction gains.
Interest and other income (expense), net decreased by $31,000 from 2011 to 2012 due primarily to a decrease in interest earned on our investment portfolio as a result of lower balances and lower interest rates.
Interest and other income (expense), net decreased by $79,000 from 2010 to 2011 due primarily to the loss on the sale of equipment.
Income Tax (Expense) Benefit
| Years Ended December 31, | Years Ended December 31, | |||||||||||||||||||||||
| 2012 | 2011 | 2010 | 2013 | 2012 | 2011 | |||||||||||||||||||
| (dollars in thousands) | (dollars in thousands) | |||||||||||||||||||||||
Income Tax (Expense) Benefit | $ | (2,991 | ) | $ | 13,420 | $ | 61 | $ | (1,256 | ) | $ | (3,181 | ) | $ | 13,207 | |||||||||
Percent of income before income taxes | (19 | )% | 131 | % | 2 | % | (15 | )% | (20 | )% | 129 | % | ||||||||||||
We recorded an income tax expense of $3.0$1.3 million in 2013 based on our net income multiplied by our effective tax rate. Our effective tax rate varies from the statutory tax rate primarily due to the book expense related to incentive stock options, which is non-deductible for tax purposes, offset by federal and state research and development credits, which reduced our tax expense. The American Taxpayer Relief Act of 2012 was enacted on January 2, 2013 to reinstate the federal research and development credit from January 1, 2012, through December 31, 2013. As a result of the change in the tax law, we recognized a benefit of $1.3 million to income tax expense in the first quarter of 2013, the quarter in which the law was enacted for certain expenses we incurred in 2012.
We recorded an income tax expense of $3.2 million in 2012 based on our net income multiplied by our effective tax rate. Our effective tax rate varied from the statutory tax rate primarily due to the book expense related to incentive stock options, which is non-deductible for tax purposes, offset by the change in fair value of contingent consideration liability which was treated as a discrete item and state research and development credits, both of which reduced our tax expense.
The American Taxpayer Relief Act of 2012, or the Act, was enacted on January 2, 2013. The Act retroactively reinstates the federal research and development credit from January 1, 2012, through December 31, 2013. The effect of the change in the tax law related to 2012 is estimated to be $1.3 million, which will be recognized as a benefit to income tax expense in the first quarter of 2013, the quarter in which the law was enacted.
We recorded an income tax benefit of $13.4$13.2 million in 2011, primarily related to the release of our valuation allowance partially offset by state income tax expense. As of December 31, 2010, we provided a full valuation allowance related to our net deferred tax assets as we believed the objective and verifiable evidence of our historical pre-tax net losses outweighed the existing positive evidence regarding our ability to realize our deferred tax assets. During 2011, we reassessed the need for a valuation allowance against our net deferred tax assets and concluded that it was more likely than not that we would be able to realize our deferred tax assets primarily as a result of continued profitability and forecasted future results. Accordingly, in the fourth quarter of 2011, we released our valuation allowance related to our net deferred tax assets.
As a result Income tax (expense) benefit for the years ended December 31, 2012 and 2011 have been revised to correct prior period errors in our accounting for deferred income taxes associated with certain stock-based compensation awards. These revisions are described in detail in Note 2,Summary of Significant Accounting Policies,of the release of our valuation allowance weNotes to Consolidated Financial Statements, included elsewhere in this Annual Report on Form 10-K.
We expect our tax rate will increase in the future. However, we intend to use our net operating loss carry-forwards and tax credits, to the extent available, to reduce the corporate income tax liability associated with our operations.operating results.
We recorded an income tax benefit of $61,000 in 2010, primarily related to the partial release of our valuation allowance as a result of recording intangible assets related to the NSM acquisition partially offset by state income tax expense.
Liquidity and Capital Resources
During 2013, 2012 2011 and 2010,2011, we funded our operations with cash flows generated from operations. At December 31, 2012,2013, our principal sources of liquidity were cash and cash equivalents and marketable securities of $93.5$123 million.
The following table shows a summary of our cash flows for each of the years ended December 31, 2013, 2012 and 2011.
| Year Ended December 31, | ||||||||||||
| 2013 | 2012 | 2011 | ||||||||||
| (in thousands) | ||||||||||||
Cash provided by (used in): | ||||||||||||
Operating activities | $ | 43,058 | $ | 38,697 | $ | 41,654 | ||||||
Investing activities | $ | (34,646 | ) | $ | (26,005 | ) | $ | (33,972 | ) | |||
Financing activities | $ | 6,289 | $ | 5,493 | $ | 9,014 | ||||||
Net cash provided by operating activities was $38.7 million, $41.7 million and $25.0 million for
During the yearsyear ended December 31, 2012, 2011 and 2010, respectively. Income before income taxes increased2013, operating activities provided $43.1 million of cash. The cash flow provided by $5.5 million in 2012 as compared to 2011. However, the non-cash adjustments tooperating activities primarily resulted from our net income resulted in a decrease of $5.2$7.2 million, in 2012, primarily as a resultwell as from net non-cash charges of the change in the contingent consideration liability which generated non-cash income of $12.2 million$37.9 million. These amounts were partially offset by increasescash used to pay taxes for net settlement of equity awards of $1.6 million and cash used by changes in our operating assets and liabilities of $472,000. Our net non-cash expense items such ascharges in 2013 primarily consisted of $22.2 million of depreciation and amortization and stock based compensation. Additionally, the changes in working capital accounts generated only $2.4of our long-lived assets, $14.7 million of cash in 2012 as compared to $5.3 million in 2011. The improvement in cash flow from operations in 2011 as compared to 2010 was due primarily to income before income taxes of $10.3 million in 2011 as compared to income before income taxes of $2.9 million in 2010, an increase in the add-backs of non-cash expense items such as depreciation and amortization and stock-based compensation expense and a larger amountan $885,000 decrease in deferred tax assets. Net uses of cash generated from working capitalchanges in our operating assets and liabilities during the year ended December 31, 2013
consisted primarily of a $2.5 million increase in prepaid expenses and other current assets and a $1.4 million decrease in accounts payable, partially offset by a $2.6 million increase in 2011 as compared to 2010. Cashdeferred revenue and a $762,000 decrease in other assets. Our cash provided by operating activities has historically beenis generally affected by the amount of net income, before income taxes as we have historically not been a significant taxpayer, growth in prepaid subscriptions, changes in working capital accounts and the timing of rent paymentpayments and add-backs of non-cash expense items such as depreciation and amortization of long-lived assets, stock-based compensation expense and the change in deferred tax assets. Changes in our working capital accounts are generally driven by the timing of payments to our vendors.
During the year ended December 31, 2012, operating activities provided $38.7 million of cash. The cash flow provided by operating activities primarily resulted from our net income of $12.6 million, as well as from net non-cash charges of $24.3 million and cash provided by changes in our operating assets and liabilities of $2.4 million. Our net non-cash charges in 2012 primarily consisted of $19.0 million of depreciation and amortization of our long-lived assets, $14.3 million of stock-based compensation expense associated withand a $2.7 million decrease in deferred tax assets, partially offset by the decrease in the contingent consideration liability, which generated non-cash income of $12.2 million. Cash provided by changes in our operating assets and liabilities during the year ended December 31, 2012 consisted primarily of a $2.2 million decrease in prepaid expenses and other current assets and a $3.1 million increase in deferred revenue, partially offset by a $2.2 million decrease in accounts payable and accrued expenses and a $653,000 increase in other assets.
During the year ended December 31, 2011, operating activities provided $41.7 million of cash. The cash flow provided by operating activities primarily resulted from our net income of $23.5 million, as well as from net non-cash charges of $13.2 million and cash provided by changes in our operating assets and liabilities of $5.3 million. Our net non-cash charges in 2011 primarily consisted of $14.4 million of depreciation and amortization of our long-lived assets and $11.7 million of stock-based awards.compensation expense, partially offset by a $13.4 million increase in deferred tax assets, which generated non-cash income due to the release of the valuation allowance related to our deferred tax assets. Cash provided by changes in our operating assets and liabilities during the year ended December 31, 2011 consisted primarily of a $5.3 million increase in accounts payable and accrued expenses and a $3.9 million increase in deferred revenue, partially offset by a $2.5 million increase in prepaid expenses and other current assets and a $1.1 million increase in other assets.
Net cash used in investing activities
Net cash used in investing activities was $34.6 million, $26.0 million $34.0 million and $57.7$34.0 million for the years ended December 31, 2013, 2012 2011 and 2010,2011, respectively. Net cash used in investing activities consisted primarily of net cash paid to purchase property and equipment as well as cash paid to acquire businesses and intangible assets. Net cash used in investing activities is also affected by net settlements of marketable securities. In 2013, we used cash of $15.2 million as a result of the purchases of marketable securities partially offset by the proceeds from the sales and maturities of marketable securities. In 2012 and 2011, we generated net proceeds of $64.2 million and $338,000, respectively, as a result of the proceeds from sales and maturities of marketable securities being greater than cash used to purchase marketable securities. In 2010, we used cash of $38.3 million as a result of the purchases of marketable securities partially offset by proceeds from the sale and maturities of marketable securities. In 2012, we made two acquisitions. We acquired CardStar in January 2012 for a cash purchase price of $5.8 million and SinglePlatform in June 2012 for a cash payment of $62.5 million, net of cash acquired. In 2011, we completed the acquisition of substantially all of the assets of Bantam Networks for a cash payment of $15 million. We also used cash to purchase a small business and certain intangible assets. In 2010, we completed the acquisition of NSM, which included a payment of $2.2 million, net of cash received. Acquisition of property and equipment of $18.9 million, $21.9 million and $18.1 million in 2013, 2012 and $17.2 million in 2012, 2011, and 2010, respectively, consisted of the purchase of computer equipment for our operations and employees, equipment, furniture and leasehold improvements and the capitalization of certain software development costs. In 2011, we transitioned to a new third-party hosting facility in California. We made capital expenditures in all three years2011 and 2012 for equipment to be used in the new facility. In 2009,We continue to increase the amount of space we signed a new lease for our corporate headquarters that increased the square footage throughout the duration of the lease.headquarters. We increased the amount of space we occupied in 20122013 and 20102012 and acquired property and equipment to outfit the additional space. We also increased restricted cash by $550,000 in 2013 related to a lease amendment for our corporate headquarters. We made additional capital expenditures in 2013, 2012 2011 and 20102011 for equipment usedto increase capacity of our hosting infrastructure and to accommodate growth in our hosting infrastructure.business. During 2013, 2012 2011 and 2010,2011, we capitalized $7.4 million, $6.7 million $4.8 million and $3.5$4.8 million, respectively, of costs associated with the development of internal use software.
Net cash provided by financing activities
Net cash provided by financing activities was $6.3 million, $5.5 million $9.0 million and $5.7$9.0 million for the years ended December 31, 2013, 2012 2011 and 2010,2011, respectively. Net cash provided by financing activities for 2012, 2011 and 2010all three years consisted primarily of proceeds from stock issued pursuant to the exercise of stock options, proceeds received in connection with our employee stock purchase plan and to a lesser extent in 2011 and 2012 from the income tax benefit related to the exercise of stock options. In the second quarter of 2013, we initiated a repurchase program of up to $20 million of our common stock through December 31, 2013. We used cash of $5.4 million in 2013 to repurchase our common stock under this program.
As of December 31, 2012,2013, we had federal and state net operating loss carry-forwards of $42.9$33.5 million and $1.1 million,$849,000, respectively, which we intend to use to the extent available to offset payments of future federal and state income tax liabilities. If unused, our net operating loss carry-forwards expire at various dates through 20322033 for federal and 20172018 for state income tax purposes.
In 2013,2014, we anticipate capital expenditures of approximately 8% to 9% of revenue to support our future growth, which will consist primarily of hardware and software purchases, capitalization of internal use software and furniture and leasehold improvements related to additional office space.
Our future capital requirements may vary materially from those now planned and will depend on many factors, including, but not limited to, development of new products, market acceptance of our products, the levels of advertising and promotion required to launch additional products and improve our competitive position in the marketplace, the expansion of our sales, support and marketing organizations, the establishment of additional offices in the United States and worldwide and the building of infrastructure necessary to support our anticipated growth, the response of competitors to our products and our relationships with suppliers and clients. Since the introduction of our on-demand email marketing product in 2000, we have experienced increases in our expenditures consistent with the growth in our operations and personnel, and we anticipate that our expenditures will continue to increase on an absolute dollar basis in the future.
We believe that our current cash, cash equivalents and marketable securities and operating cash flows will be sufficient to meet our working capital and capital expenditure requirements for at least the next twelve months. Thereafter, we may need to raise additional funds through public or private financings or borrowings to fund our operations, develop or enhance products, to fund expansion, to respond to competitive pressures or to acquire complementary products, businesses or technologies. If required, additional financing may not be available on terms that are favorable to us, or at all. If we raise additional funds through the issuance of equity or convertible debt securities, the percentage ownership of our stockholders will be reduced and these securities might have rights, preferences and privileges senior to those of our current stockholders or we may be subject to covenants that restrict how we conduct our business. No assurance can be given that additional financing will be available or that, if available, such financing can be obtained on terms favorable to our stockholders and us.
During the last three years, inflation and changing prices have not had a material effect on our business. We are unable to predict whether inflation or changing prices will materially affect our business in the foreseeable future.
Off-Balance Sheet Arrangements
We do not engage in any off-balance sheet financing activities. We do not have any interest in entities referred to as variable interest entities, which include special purpose entities and other structured finance entities.
Contractual Obligations
We lease our headquarters in Waltham, Massachusetts under an operating lease that is effective through September 2022 with one ten-year extension option. The lease includes the space we are occupying nowcurrently as well as additional space that will be made available to us through the term of the lease. We lease office space in Colorado for a sales and support office under an operating lease that expires in April 2019 with three three-year extension options. We also lease small amounts of general office space in Florida, New York, California and the United Kingdom under lease agreements that expire at various dates through 2017.2018.
We have agreements with various vendors to provide specialized space and equipment and related services from which we host our software application. The agreements include payment commitments that expire at various dates through early 2017.
As of December 31, 2012,2013, we had issued both cancellable and non-cancellable purchase orders and entered into contractual commitments with various vendors totaling $15.8$16.5 million. This amount relates primarily to marketing programs and other non-marketing related goods and services to be delivered over the next twelve months.
The following table summarizes our contractual obligations at December 31, 2012,2013, and the effect such obligations are expected to have on our liquidity and cash flow in future periods.
| Total | Less than 1 Year | 1-3 Years | 3-5 Years | More than 5 Years | Total | Less than 1 Year | 1-3 Years | 3-5 Years | More than 5 Years | |||||||||||||||||||||||||||||||
| (In thousands) | (In thousands) | |||||||||||||||||||||||||||||||||||||||
Office lease obligations | $ | 82,123 | $ | 6,571 | $ | 16,341 | $ | 19,124 | $ | 40,087 | $ | 78,640 | $ | 8,354 | $ | 19,432 | $ | 19,900 | $ | 30,954 | ||||||||||||||||||||
Third-party hosting agreements | 15,819 | 3,841 | 7,358 | 4,620 | — | 12,590 | 3,828 | 7,987 | 775 | — | ||||||||||||||||||||||||||||||
Vendor commitments | 15,791 | 15,791 | — | — | — | 16,540 | 16,540 | — | — | — | ||||||||||||||||||||||||||||||
|
|
|
|
|
|
|
|
|
| |||||||||||||||||||||||||||||||
Total(1) | $ | 113,733 | $ | 26,203 | $ | 23,699 | $ | 23,744 | $ | 40,087 | $ | 107,770 | $ | 28,722 | $ | 27,419 | $ | 20,675 | $ | 30,954 | ||||||||||||||||||||
|
|
|
|
|
|
|
|
|
| |||||||||||||||||||||||||||||||
| (1) | As of December 31, | of December 31, 2013. |
ITEM 7A. QUANTITATIVE AND QUALITATIVE DISCLOSURES ABOUT MARKET RISK
Foreign Currency Exchange Risk. Significantly all of our revenue and expenses are denominated in U.S. dollars. Accordingly, our results of operations and cash flows are not subject to material fluctuations due to changes in foreign currency exchange rates. However, as we increase our operations in international markets we will become increasingly exposed to changes in currency exchange rates. The economic impact of currency exchange rate movements is often linked to variability in real growth, inflation, interest rates, governmental actions and other factors. These changes, if material, could cause us to adjust our financing and operating strategies.
Interest Rate Sensitivity. We had cash and cash equivalents and marketable securities of $93.5$123 million at December 31, 2012,2013, which consisted of cash, government securities, corporate and agency bonds, certificates of deposit, commercial paper and money market instruments. Interest income is sensitive to changes in the general level of interest rates; however, due to the nature of these investments, we do not believe that we have any material exposure to changes in the fair value of our investment portfolio as a result of changes in interest rates.
| ITEM 8. | FINANCIAL STATEMENTS AND SUPPLEMENTARY DATA |
Constant Contact, Inc.
Index to Consolidated Financial Statements
| Page(s) | ||||
| 50 | ||||
| 51 | ||||
| 52 | ||||
| 53 | ||||
| 54 | ||||
| 55 | ||||
| 56 | ||||
Report of Independent Registered Public Accounting Firm
To the Board of Directors and Stockholders of
Constant Contact, Inc.
In our opinion, the consolidated financial statements listed in the accompanying index present fairly, in all material respects, the financial position of Constant Contact, Inc. and its subsidiaries (the “Company”) at December 31, 20122013 and 2011,2012, and the results of their operations and their cash flows for each of the three years in the period ended December 31, 20122013 in conformity with accounting principles generally accepted in the United States of America. In our opinion, the Company maintained, in all material respects, effective internal control over financial reporting as of December 31, 2012,2013, based on criteria established inInternal Control - Control—Integrated Framework (1992 framework) issued by the Committee of Sponsoring Organizations of the Treadway Commission (COSO). The Company’s management is responsible for these financial statements, for maintaining effective internal control over financial reporting and for its assessment of the effectiveness of internal control over financial reporting, included in Management’s Annual Report on Internal Control over Financial Reporting appearing under item 9A. Our responsibility is to express opinions on these financial statements and on the Company’s internal control over financial reporting based on our integrated audits. We conducted our audits in accordance with the standards of the Public Company Accounting Oversight Board (United States). Those standards require that we plan and perform the audits to obtain reasonable assurance about whether the financial statements are free of material misstatement and whether effective internal control over financial reporting was maintained in all material respects. Our audits of the financial statements included examining, on a test basis, evidence supporting the amounts and disclosures in the financial statements, assessing the accounting principles used and significant estimates made by management, and evaluating the overall financial statement presentation. Our audit of internal control over financial reporting included obtaining an understanding of internal control over financial reporting, assessing the risk that a material weakness exists, and testing and evaluating the design and operating effectiveness of internal control based on the assessed risk. Our audits also included performing such other procedures as we considered necessary in the circumstances. We believe that our audits provide a reasonable basis for our opinions.
A company’s internal control over financial reporting is a process designed to provide reasonable assurance regarding the reliability of financial reporting and the preparation of financial statements for external purposes in accordance with generally accepted accounting principles. A company’s internal control over financial reporting includes those policies and procedures that (i) pertain to the maintenance of records that, in reasonable detail, accurately and fairly reflect the transactions and dispositions of the assets of the company; (ii) provide reasonable assurance that transactions are recorded as necessary to permit preparation of financial statements in accordance with generally accepted accounting principles, and that receipts and expenditures of the company are being made only in accordance with authorizations of management and directors of the company; and (iii) provide reasonable assurance regarding prevention or timely detection of unauthorized acquisition, use, or disposition of the company’s assets that could have a material effect on the financial statements.
Because of its inherent limitations, internal control over financial reporting may not prevent or detect misstatements. Also, projections of any evaluation of effectiveness to future periods are subject to the risk that controls may become inadequate because of changes in conditions, or that the degree of compliance with the policies or procedures may deteriorate.
/s/ PricewaterhouseCoopers LLP
Boston, Massachusetts
February 28, 2013March 5, 2014
Constant Contact, Inc.
| December 31, | December 31, | |||||||||||||||
| 2012 | 2011 | 2013 | 2012 | |||||||||||||
| (In thousands, except share and per share data) | (In thousands, except share and per share data) | |||||||||||||||
| ASSETS | ASSETS | ASSETS | ||||||||||||||
Current assets | ||||||||||||||||
Cash and cash equivalents | $ | 67,775 | $ | 49,589 | $ | 82,478 | $ | 67,775 | ||||||||
Marketable securities | 25,732 | 90,523 | 40,723 | 25,732 | ||||||||||||
Accounts receivable, net of allowance for doubtful accounts | 92 | 58 | 180 | 92 | ||||||||||||
Prepaid expenses and other current assets | 6,513 | 8,891 | 9,175 | 6,513 | ||||||||||||
|
|
|
| |||||||||||||
Total current assets | 100,112 | 149,061 | 132,556 | 100,112 | ||||||||||||
Property and equipment, net | 39,653 | 34,263 | 39,238 | 39,653 | ||||||||||||
Restricted cash | 750 | 750 | 1,300 | 750 | ||||||||||||
Goodwill | 95,505 | 18,935 | 95,505 | 95,505 | ||||||||||||
Acquired intangible assets, net | 6,758 | 3,046 | 4,355 | 6,758 | ||||||||||||
Deferred taxes | 11,377 | 12,960 | 9,574 | 10,662 | ||||||||||||
Other assets | 3,107 | 2,363 | 2,345 | 3,107 | ||||||||||||
|
|
|
| |||||||||||||
Total assets | $ | 257,262 | $ | 221,378 | $ | 284,873 | $ | 256,547 | ||||||||
|
|
|
| |||||||||||||
| LIABILITIES AND STOCKHOLDERS’ EQUITY | LIABILITIES AND STOCKHOLDERS’ EQUITY | LIABILITIES AND STOCKHOLDERS’ EQUITY | ||||||||||||||
Current liabilities | ||||||||||||||||
Accounts payable | $ | 8,167 | $ | 8,906 | $ | 6,783 | $ | 8,167 | ||||||||
Accrued expenses | 10,803 | 10,515 | 10,903 | 10,803 | ||||||||||||
Deferred revenue | 32,700 | 28,983 | 35,256 | 32,700 | ||||||||||||
|
|
|
| |||||||||||||
Total current liabilities | 51,670 | 48,404 | 52,942 | 51,670 | ||||||||||||
Other long-term liabilities | 2,010 | 2,052 | 2,060 | 2,010 | ||||||||||||
|
|
|
| |||||||||||||
Total liabilities | 53,680 | 50,456 | 55,002 | 53,680 | ||||||||||||
|
|
|
| |||||||||||||
Commitments and contingencies (Note 10) | ||||||||||||||||
Stockholders’ equity | ||||||||||||||||
Preferred stock; $0.01 par value; 5,000,000 shares authorized; no shares issued or outstanding at December 31, 2012 and 2011 | — | — | ||||||||||||||
Common stock; $0.01 par value; 100,000,000 shares authorized at December 31, 2012 and 2011; 30,651,375 and 30,110,895 shares issued and outstanding at December 31, 2012 and 2011, respectively | 307 | 301 | ||||||||||||||
Preferred stock; $0.01 par value; 5,000,000 shares authorized; no shares issued or outstanding at December 31, 2013 and 2012 | — | — | ||||||||||||||
Common stock; $0.01 par value; 100,000,000 shares authorized at December 31, 2013 and 2012; 31,203,585 and 30,651,375 shares issued and outstanding at December 31, 2013 and 2012, respectively | 312 | 307 | ||||||||||||||
Additional paid-in capital | 209,987 | 190,039 | 229,457 | 209,675 | ||||||||||||
Accumulated other comprehensive income | 11 | 61 | 14 | 11 | ||||||||||||
Accumulated deficit | (6,723 | ) | (19,479 | ) | ||||||||||||
Accumulated equity (deficit) | 88 | (7,126 | ) | |||||||||||||
|
|
|
| |||||||||||||
Total stockholders’ equity | 203,582 | 170,922 | 229,871 | 202,867 | ||||||||||||
|
|
|
| |||||||||||||
Total liabilities and stockholders’ equity | $ | 257,262 | $ | 221,378 | $ | 284,873 | $ | 256,547 | ||||||||
|
|
|
| |||||||||||||
The accompanying notes are an integral part of these consolidated financial statements.
Constant Contact, Inc.
Consolidated Statements of Operations
| Years Ended December 31, | Years Ended December 31, | |||||||||||||||||||||||
| 2012 | 2011 | 2010 | 2013 | 2012 | 2011 | |||||||||||||||||||
| (In thousands, except per share data) | (In thousands, except per share data) | |||||||||||||||||||||||
Revenue | $ | 252,154 | $ | 214,420 | $ | 174,231 | $ | 285,383 | $ | 252,154 | $ | 214,420 | ||||||||||||
Cost of revenue | 73,547 | 61,491 | 50,825 | 81,616 | 73,547 | 61,491 | ||||||||||||||||||
|
|
|
|
|
| |||||||||||||||||||
Gross profit | 178,607 | 152,929 | 123,406 | 203,767 | 178,607 | 152,929 | ||||||||||||||||||
|
|
|
|
|
| |||||||||||||||||||
Operating expenses: | ||||||||||||||||||||||||
Research and development | 38,787 | 29,478 | 23,985 | 45,567 | 38,787 | 29,478 | ||||||||||||||||||
Sales and marketing | 104,527 | 89,211 | 78,881 | 111,374 | 104,527 | 89,211 | ||||||||||||||||||
General and administrative | 31,132 | 23,979 | 17,625 | 38,531 | 31,132 | 23,979 | ||||||||||||||||||
Acquisition costs and other related charges | (11,355 | ) | 264 | 403 | — | (11,355 | ) | 264 | ||||||||||||||||
|
|
|
|
|
| |||||||||||||||||||
Total operating expenses | 163,091 | 142,932 | 120,894 | 195,472 | 163,091 | 142,932 | ||||||||||||||||||
|
|
|
|
|
| |||||||||||||||||||
Income from operations | 15,516 | 9,997 | 2,512 | 8,295 | 15,516 | 9,997 | ||||||||||||||||||
Interest income | 224 | 346 | 341 | 94 | 224 | 346 | ||||||||||||||||||
Other income (expense) | 7 | (84 | ) | — | ||||||||||||||||||||
Other income (expense), net | 81 | 7 | (84 | ) | ||||||||||||||||||||
|
|
|
|
|
| |||||||||||||||||||
Income before income taxes | 15,747 | 10,259 | 2,853 | 8,470 | 15,747 | 10,259 | ||||||||||||||||||
Income tax (expense) benefit | (2,991 | ) | 13,420 | 61 | (1,256 | ) | (3,181 | ) | 13,207 | |||||||||||||||
|
|
|
|
|
| |||||||||||||||||||
Net income | $ | 12,756 | $ | 23,679 | $ | 2,914 | $ | 7,214 | $ | 12,566 | $ | 23,466 | ||||||||||||
|
|
|
|
|
| |||||||||||||||||||
Net income per share: | ||||||||||||||||||||||||
Basic | $ | 0.42 | $ | 0.80 | $ | 0.10 | $ | 0.23 | $ | 0.41 | $ | 0.79 | ||||||||||||
Diluted | $ | 0.41 | $ | 0.77 | $ | 0.10 | $ | 0.23 | $ | 0.41 | $ | 0.77 | ||||||||||||
Weighted average shares outstanding used in computing per share amounts: | ||||||||||||||||||||||||
Basic | 30,386 | 29,566 | 28,765 | 30,730 | 30,386 | 29,566 | ||||||||||||||||||
Diluted | 31,003 | 30,671 | 29,945 | 31,356 | 31,003 | 30,671 | ||||||||||||||||||
The accompanying notes are an integral part of these consolidated financial statements.
Constant Contact, Inc.
Consolidated Statements of Comprehensive Income
| Years Ended December 31, | ||||||||||||
| 2012 | 2011 | 2010 | ||||||||||
| (In thousands) | ||||||||||||
Net income | $ | 12,756 | $ | 23,679 | $ | 2,914 | ||||||
|
|
|
|
|
| |||||||
Other comprehensive (loss) income: | ||||||||||||
Net unrealized (losses) gains on marketable securities, net of tax | (51 | ) | 60 | (16 | ) | |||||||
Reclassification adjustment for realized gains on available-for-sale securities included in net income | — | (13 | ) | (11 | ) | |||||||
Translation adjustment | 1 | 1 | — | |||||||||
|
|
|
|
|
| |||||||
Total other comprehensive (loss) income | (50 | ) | 48 | (27 | ) | |||||||
|
|
|
|
|
| |||||||
Comprehensive income | $ | 12,706 | $ | 23,727 | $ | 2,887 | ||||||
|
|
|
|
|
| |||||||
| Years Ended December 31, | ||||||||||||
| 2013 | 2012 | 2011 | ||||||||||
| (In thousands) | ||||||||||||
Net income | $ | 7,214 | $ | 12,566 | $ | 23,466 | ||||||
|
|
|
|
|
| |||||||
Other comprehensive income (loss): | ||||||||||||
Net unrealized gains (losses) on marketable securities, net of tax | (1 | ) | (51 | ) | 60 | |||||||
Reclassification adjustment for realized gains on available-for-sale securities included in net income | — | — | (13 | ) | ||||||||
Translation adjustment | 4 | 1 | 1 | |||||||||
|
|
|
|
|
| |||||||
Total other comprehensive income (loss) | 3 | (50 | ) | 48 | ||||||||
|
|
|
|
|
| |||||||
Comprehensive income | $ | 7,217 | $ | 12,516 | $ | 23,514 | ||||||
|
|
|
|
|
| |||||||
The accompanying notes are an integral part of these consolidated financial statements.
Constant Contact, Inc.
Consolidated Statements of Changes in Stockholders’ Equity
| Common Stock | Additional Paid-in Capital | Accumulated Other Comprehensive Income | Accumulated Deficit | Total Stockholders’ Equity |
Common Stock | Additional Paid-in Capital | Accumulated Other Comprehensive Income | Accumulated Deficit | Total Stockholders’ Equity | |||||||||||||||||||||||||||||||||||||||
| Shares | Amount | Shares | Amount | |||||||||||||||||||||||||||||||||||||||||||||
Balance at December 31, 2009 | 28,403,673 | 284 | 150,716 | 40 | (46,072 | ) | 104,968 | |||||||||||||||||||||||||||||||||||||||||
Issuance of common stock in connection with stock option exercises | 619,210 | 6 | 4,952 | 4,958 | ||||||||||||||||||||||||||||||||||||||||||||
Issuance of common stock in connection with acquisition of Nutshell Mail, Inc. | 165,523 | 2 | 3,601 | 3,603 | ||||||||||||||||||||||||||||||||||||||||||||
Issuance of restricted stock | 112,887 | 1 | (1 | ) | — | |||||||||||||||||||||||||||||||||||||||||||
Issuance of common stock in connection with employee stock purchase plan | 36,040 | — | 772 | 772 | ||||||||||||||||||||||||||||||||||||||||||||
Stock-based compensation expense | 8,934 | 8,934 | ||||||||||||||||||||||||||||||||||||||||||||||
Unrealized loss on available-for-sale securities | (16 | ) | (16 | ) | ||||||||||||||||||||||||||||||||||||||||||||
Reclassification adjustment for realized gains on available-for-sale securities included in net income | (11 | ) | (11 | ) | ||||||||||||||||||||||||||||||||||||||||||||
Net income | 2,914 | 2,914 | ||||||||||||||||||||||||||||||||||||||||||||||
|
|
|
|
|
| |||||||||||||||||||||||||||||||||||||||||||
Balance at December 31, 2010 | 29,337,333 | $ | 293 | $ | 168,974 | $ | 13 | $ | (43,158 | ) | $ | 126,122 | 29,337,333 | $ | 293 | $ | 168,974 | $ | 13 | $ | (43,158 | ) | $ | 126,122 | ||||||||||||||||||||||||
|
|
|
|
|
| |||||||||||||||||||||||||||||||||||||||||||
Issuance of common stock in connection with stock option exercises | 717,397 | 7 | 7,919 | 7,926 | 717,397 | 7 | 7,919 | 7,926 | ||||||||||||||||||||||||||||||||||||||||
Issuance of common stock pursuant to vesting of restricted stock units | 14,488 | — | (319 | ) | (319 | ) | 14,488 | — | (319 | ) | (319 | ) | ||||||||||||||||||||||||||||||||||||
Issuance of common stock in connection with employee stock purchase plan | 41,677 | 1 | 858 | 859 | 41,677 | 1 | 858 | 859 | ||||||||||||||||||||||||||||||||||||||||
Stock-based compensation expense | 12,378 | 12,378 | 12,378 | 12,378 | ||||||||||||||||||||||||||||||||||||||||||||
Income tax benefit from the exercise of stock options | 229 | 229 | ||||||||||||||||||||||||||||||||||||||||||||||
Unrealized gain on available-for-sale securities | 60 | 60 | 60 | 60 | ||||||||||||||||||||||||||||||||||||||||||||
Reclassification adjustment for realized gains on available-for-sale securities included in net income | (13 | ) | (13 | ) | (13 | ) | (13 | ) | ||||||||||||||||||||||||||||||||||||||||
Translation adjustment | 1 | 1 | 1 | 1 | ||||||||||||||||||||||||||||||||||||||||||||
Net income | 23,679 | 23,679 | 23,466 | 23,466 | ||||||||||||||||||||||||||||||||||||||||||||
|
|
|
|
|
|
|
|
|
|
|
| |||||||||||||||||||||||||||||||||||||
Balance at December 31, 2011 | 30,110,895 | $ | 301 | $ | 190,039 | $ | 61 | $ | (19,479 | ) | $ | 170,922 | 30,110,895 | $ | 301 | $ | 189,810 | $ | 61 | $ | (19,692 | ) | $ | 170,480 | ||||||||||||||||||||||||
|
|
|
|
|
| |||||||||||||||||||||||||||||||||||||||||||
Issuance of common stock in connection with stock option exercises | 415,136 | 4 | 4,351 | 4,355 | 415,136 | 4 | 4,351 | 4,355 | ||||||||||||||||||||||||||||||||||||||||
Issuance of common stock pursuant to vesting of restricted stock units | 47,263 | 1 | (598 | ) | (597 | ) | 47,263 | 1 | (597 | ) | (596 | ) | ||||||||||||||||||||||||||||||||||||
Issuance of common stock in connection with employee stock purchase plan | 78,081 | 1 | 1,052 | 1,053 | 78,081 | 1 | 1,052 | 1,053 | ||||||||||||||||||||||||||||||||||||||||
Stock-based compensation expense | 15,059 | 15,059 | 15,059 | 15,059 | ||||||||||||||||||||||||||||||||||||||||||||
Income tax benefit from the exercise of stock options | 84 | 84 | ||||||||||||||||||||||||||||||||||||||||||||||
Unrealized loss on available-for-sale securities | (51 | ) | (51 | ) | (51 | ) | (51 | ) | ||||||||||||||||||||||||||||||||||||||||
Translation adjustment | 1 | 1 | 1 | 1 | ||||||||||||||||||||||||||||||||||||||||||||
Net income | 12,756 | 12,756 | 12,566 | 12,566 | ||||||||||||||||||||||||||||||||||||||||||||
|
|
|
|
|
|
|
|
|
|
|
| |||||||||||||||||||||||||||||||||||||
Balance at December 31, 2012 | 30,651,375 | $ | 307 | $ | 209,987 | $ | 11 | $ | (6,723 | ) | $ | 203,582 | 30,651,375 | $ | 307 | $ | 209,675 | $ | 11 | $ | (7,126 | ) | $ | 202,867 | ||||||||||||||||||||||||
Issuance of common stock in connection with stock option exercises | 671,596 | 6 | 10,440 | 10,446 | ||||||||||||||||||||||||||||||||||||||||||||
Issuance of common stock pursuant to vesting of restricted stock units | 87,058 | 1 | (1,592 | ) | (1,591 | ) | ||||||||||||||||||||||||||||||||||||||||||
Issuance of common stock in connection with employee stock purchase plan | 79,456 | 1 | 1,088 | 1,089 | ||||||||||||||||||||||||||||||||||||||||||||
Repurchase and retirement of common stock | (285,900 | ) | (3 | ) | (5,363 | ) | (5,366 | ) | ||||||||||||||||||||||||||||||||||||||||
Stock-based compensation expense | 15,213 | 15,213 | ||||||||||||||||||||||||||||||||||||||||||||||
Income tax from the exercise of stock options | (4 | ) | (4 | ) | ||||||||||||||||||||||||||||||||||||||||||||
Unrealized loss on available-for-sale securities | (1 | ) | (1 | ) | ||||||||||||||||||||||||||||||||||||||||||||
Translation adjustment | 4 | 4 | ||||||||||||||||||||||||||||||||||||||||||||||
Net income | 7,214 | 7,214 | ||||||||||||||||||||||||||||||||||||||||||||||
|
|
|
|
|
|
|
|
|
|
|
| |||||||||||||||||||||||||||||||||||||
Balance at December 31, 2013 | 31,203,585 | $ | 312 | $ | 229,457 | $ | 14 | $ | 88 | $ | 229,871 | |||||||||||||||||||||||||||||||||||||
|
|
|
|
|
| |||||||||||||||||||||||||||||||||||||||||||
The accompanying notes are an integral part of these consolidated financial statements.
Constant Contact, Inc.
Consolidated Statements of Cash Flows
| Years Ended December 31, | Years Ended December 31, | |||||||||||||||||||||||
| 2012 | 2011 | 2010 | 2013 | 2012 | 2011 | |||||||||||||||||||
| (In thousands) | (In thousands) | |||||||||||||||||||||||
Cash flows from operating activities | ||||||||||||||||||||||||
Net income | $ | 12,756 | $ | 23,679 | $ | 2,914 | $ | 7,214 | $ | 12,566 | $ | 23,466 | ||||||||||||
Adjustments to reconcile net income to net cash provided by operating activities | ||||||||||||||||||||||||
Depreciation and amortization | 19,003 | 14,409 | 11,897 | 22,191 | 19,003 | 14,409 | ||||||||||||||||||
Amortization of premium on investments | 539 | 660 | 128 | 210 | 539 | 660 | ||||||||||||||||||
Stock-based compensation expense | 14,274 | 11,708 | 8,552 | 14,731 | 14,274 | 11,708 | ||||||||||||||||||
Provision for (Recovery of) bad debts | 11 | 3 | (2 | ) | ||||||||||||||||||||
Provision for bad debts | 14 | 11 | 3 | |||||||||||||||||||||
Gain on sales of marketable securities | — | (13 | ) | (11 | ) | — | — | (13 | ) | |||||||||||||||
Loss on sale of equipment | — | 79 | — | — | — | 79 | ||||||||||||||||||
Deferred taxes | 2,465 | (13,827 | ) | (180 | ) | 885 | 2,738 | (13,385 | ) | |||||||||||||||
Contingent consideration adjustment | (12,152 | ) | — | — | — | (12,152 | ) | — | ||||||||||||||||
Income tax benefit from the exercise of stock options | (123 | ) | (84 | ) | (229 | ) | ||||||||||||||||||
Taxes paid related to net share settlement of restricted stock units | (598 | ) | (319 | ) | — | (1,592 | ) | (597 | ) | (319 | ) | |||||||||||||
Changes in operating assets and liabilities, net of effects from acquisition: | ||||||||||||||||||||||||
Accounts receivable | 3 | (17 | ) | 11 | (102 | ) | 3 | (17 | ) | |||||||||||||||
Prepaid expenses and other current assets | 2,169 | (2,462 | ) | (2,130 | ) | (2,454 | ) | 2,169 | (2,462 | ) | ||||||||||||||
Other assets | (653 | ) | (1,149 | ) | (942 | ) | 762 | (653 | ) | (1,149 | ) | |||||||||||||
Accounts payable | (787 | ) | 1,462 | 1,638 | (1,384 | ) | (787 | ) | 1,462 | |||||||||||||||
Accrued expenses | (1,398 | ) | 3,791 | (709 | ) | 100 | (1,398 | ) | 3,791 | |||||||||||||||
Deferred revenue | 3,107 | 3,880 | 4,762 | 2,556 | 3,107 | 3,880 | ||||||||||||||||||
Other long-term liabilities | (42 | ) | (230 | ) | (880 | ) | 50 | (42 | ) | (230 | ) | |||||||||||||
|
|
|
|
|
| |||||||||||||||||||
Net cash provided by operating activities | 38,697 | 41,654 | 25,048 | 43,058 | 38,697 | 41,654 | ||||||||||||||||||
|
|
|
|
|
| |||||||||||||||||||
Cash flows from investing activities | ||||||||||||||||||||||||
Purchases of marketable securities | (40,254 | ) | (130,702 | ) | (147,525 | ) | (30,739 | ) | (40,254 | ) | (130,702 | ) | ||||||||||||
Proceeds from maturities of marketable securities | 59,867 | 46,313 | 87,195 | 11,534 | 59,867 | 46,313 | ||||||||||||||||||
Proceeds from sales of marketable securities | 44,600 | 84,727 | 22,005 | 4,000 | 44,600 | 84,727 | ||||||||||||||||||
Acquisition of businesses, net of cash acquired | (68,296 | ) | (15,600 | ) | (2,225 | ) | — | (68,296 | ) | (15,600 | ) | |||||||||||||
Proceeds from sale of equipment | — | 81 | — | — | — | 81 | ||||||||||||||||||
Purchases of intangible assets | — | (685 | ) | — | — | — | (685 | ) | ||||||||||||||||
Net increase in restricted cash | (550 | ) | — | — | ||||||||||||||||||||
Acquisition of property and equipment, including costs capitalized for development of internal use software | (21,922 | ) | (18,106 | ) | (17,158 | ) | (18,891 | ) | (21,922 | ) | (18,106 | ) | ||||||||||||
|
|
|
|
|
| |||||||||||||||||||
Net cash used in investing activities | (26,005 | ) | (33,972 | ) | (57,708 | ) | (34,646 | ) | (26,005 | ) | (33,972 | ) | ||||||||||||
|
|
|
|
|
| |||||||||||||||||||
Cash flows from financing activities | ||||||||||||||||||||||||
Proceeds from issuance of common stock pursuant to exercise of stock options | 4,356 | 7,926 | 4,958 | 10,447 | 4,356 | 7,926 | ||||||||||||||||||
Income tax benefit from the exercise of stock options | 84 | 229 | — | 119 | 84 | 229 | ||||||||||||||||||
Proceeds from issuance of common stock pursuant to employee stock purchase plan | 1,053 | 859 | 772 | 1,089 | 1,053 | 859 | ||||||||||||||||||
Repurchase of common stock | (5,366 | ) | — | — | ||||||||||||||||||||
|
|
|
|
|
| |||||||||||||||||||
Net cash provided by financing activities | 5,493 | 9,014 | 5,730 | 6,289 | 5,493 | 9,014 | ||||||||||||||||||
|
|
|
|
|
| |||||||||||||||||||
Effects of exchange rates on cash | 1 | 1 | — | 2 | 1 | 1 | ||||||||||||||||||
|
|
|
|
|
| |||||||||||||||||||
Net increase (decrease) in cash and cash equivalents | 18,186 | 16,697 | (26,930 | ) | ||||||||||||||||||||
Net increase in cash and cash equivalents | 14,703 | 18,186 | 16,697 | |||||||||||||||||||||
Cash and cash equivalents, beginning of year | 49,589 | 32,892 | 59,822 | 67,775 | 49,589 | 32,892 | ||||||||||||||||||
|
|
|
|
|
| |||||||||||||||||||
Cash and cash equivalents, end of year | $ | 67,775 | $ | 49,589 | $ | 32,892 | $ | 82,478 | $ | 67,775 | $ | 49,589 | ||||||||||||
|
|
|
|
|
| |||||||||||||||||||
Supplemental disclosure of cash flow information | ||||||||||||||||||||||||
Cash paid for income taxes | $ | 61 | $ | 324 | $ | 36 | $ | 523 | $ | 61 | $ | 324 | ||||||||||||
Supplemental disclosure of noncash investing and financing activities: | ||||||||||||||||||||||||
Issuance of common stock in connection with the acquisition of NutshellMail, Inc. | $ | — | $ | — | $ | 3,603 | ||||||||||||||||||
Capitalization of stock-based compensation | $ | 785 | $ | 670 | $ | 382 | $ | 482 | $ | 785 | $ | 670 | ||||||||||||
Fair value of contingent consideration recorded at the time of acquisition in accrued expenses and other long-term liabilities | $ | 12,152 | $ | — | $ | — | $ | — | $ | 12,152 | $ | — | ||||||||||||
The accompanying notes are an integral part of these consolidated financial statements.
Constant Contact, Inc.
Notes to Consolidated Financial Statements
(amounts in thousands, except share and per share amounts)
1. Nature of the Business
Constant Contact, Inc. (the “Company”) was incorporated as a Massachusetts corporation on August 25, 1995. The Companyin 1995 and was reincorporated in the State of Delaware in 2000. The Company provides on-demand emailis a leading provider of online marketing social media marketing, event marketing, local deals, a digital web and mobile storefront, and online survey products totools that are designed for small organizations, including small businesses, associations and non-profits primarily in the U.S.non-profits. The Company seeks to help customers succeed by creating and growing their customer and member relationships through easy-to-use products combined with education, support, KnowHow® and coaching. The Company’s emailsuite of online marketing product allowstools, which include Email Marketing, EventSpot®, Social Campaigns™, SaveLocal™, SinglePlatform and Survey, enable customers to create, sendlaunch and track emailmonitor marketing campaigns. The Company’s Social Campaigns™ product allows customers to create, publish, promote and run campaigns on Facebook®. EventSpotTM, the Company’s event marketing product, enables customers to promote and manage events, track event registrations and collect online payments. The Company’s online survey product enables customers to create and send surveys and analyze the responses. The Company’s SaveLocalTM product makes it quick and easy for customers to create, run and manage local deals. Social media marketing features in all of the Company’s products allow customers to easily manage and optimize their presence across multiple channels, including email, social media, networks. Through the acquisition of CardStar, Inc (“CardStar”), in January 2012, the Company now offers a mobile phone application which allows consumers to easily manage loyalty, rewardsevents, local deals, online listings and membership cards on a mobile phone. In June 2012, the Company acquired SinglePlatform, Corp. (“SinglePlatform”), a company that helps small businesses get discovered through web and mobile searches by providing a single place to update relevant business information.surveys. These products are designed for small organizationsmarketed and are marketedsold directly by the Company and through a wide variety of partners.partners primarily in the United States of America.
2. Summary of Significant Accounting Policies
Basis of Presentation
The accompanying consolidated financial statements include those of the Company and its subsidiaries, after elimination of all intercompany accounts and transactions. The accompanying consolidated financial statements have been prepared in conformity with accounting principles generally accepted in the United States of America (“GAAP”).
Revision of Prior Period Consolidated Financial Statements
During the fourth quarter of 2013, the Company identified certain prior period errors in income tax expense, which affected the years ended December 31, 2011 and 2012 as well as certain interim periods within those years and interim periods within the year ended December 31, 2013. The prior period errors in income tax expense relate to the Company’s accounting for deferred income taxes associated with certain stock-based compensation awards in accordance with Financial Accounting Standards Board (“FASB”) Accounting Standards Codification (“ASC”)Topic 718, Compensation — Stock Compensation. As a result of a detailed analysis performed by the Company, management determined that its deferred tax asset associated with stock-based compensation awards did not contemplate certain shortfalls on the exercise of stock options and vesting of restricted stock awards and, as such, the carrying amount of the deferred tax asset balances as of December 31, 2011 and December 31, 2012, certain interim periods within those years and interim periods in 2013 were overstated. In addition, the Company decided to revise the presentation of one other immaterial 2013 interim period error that overstated sales tax expense and that had been previously corrected in the Company’s consolidated financial statements in an interim reporting period other than the interim periods in which the error originated. There was no effect on annual consolidated financial statements for this error as the error and the error correction occurred within one annual period. The Company has reflected the correction of all identified prior period errors in the periods in which they originated (the “2013 Revision”) throughout this document.
In evaluating whether the Company’s previously issued consolidated financial statements were materially misstated, the Company considered the guidance in ASC Topic 250,Accounting Changes and Error Corrections, ASC Topic 250-10-S99-1,Assessing Materiality, and ASC Topic 250-10-S99-2,Considering the Effects of Prior Year Misstatements when Quantifying Misstatements in Current Year Financial Statements. The Company concluded that these errors were not material, individually or in the aggregate, to any of the prior reporting periods. However, if the entire correction was recorded in the fourth quarter of 2013, the cumulative amount would be material in the fourth quarter of 2013 and would have impacted comparisons to prior periods. As such,
the revisions for these corrections are reflected in the applicable prior periods within each of the consolidated financial statements and applicable footnotes (Note 7 and Note 11). The revisions for these corrections will be reflected in future filings containing such financial information.
The following tables present the effects of these prior period errors in the consolidated financial statements:
Impact of 2013 Revision to previously reported 2013 consolidated interim results (unaudited):
| Three Months Ended March 31, 2013 | Three Months Ended June 30, 2013 | Six Months Ended June 30, 2013 | ||||||||||||||||||||||
| As Previously Reported | As Revised | As Previously Reported | As Revised | As Previously Reported | As Revised | |||||||||||||||||||
| (unaudited) | ||||||||||||||||||||||||
Consolidated Statements of Operations and Comprehensive Income (Loss) | ||||||||||||||||||||||||
General and administrative | $ | 9,894 | $ | 9,840 | $ | 10,048 | $ | 9,925 | $ | 19,942 | $ | 19,765 | ||||||||||||
Total operating expenses | $ | 50,964 | $ | 50,910 | $ | 49,851 | $ | 49,728 | $ | 100,815 | $ | 100,638 | ||||||||||||
Income tax (expense) benefit | $ | 2,182 | $ | 1,988 | $ | 299 | $ | 118 | $ | 2,481 | $ | 2,106 | ||||||||||||
Net income (loss) | $ | (514 | ) | $ | (654 | ) | $ | 90 | $ | 32 | $ | (424 | ) | $ | (622 | ) | ||||||||
Net income (loss) per share — basic | $ | (0.02 | ) | $ | (0.02 | ) | $ | 0.00 | $ | 0.00 | $ | (0.01 | ) | $ | (0.02 | ) | ||||||||
Net income (loss) per share — diluted | $ | (0.02 | ) | $ | (0.02 | ) | $ | 0.00 | $ | 0.00 | $ | (0.01 | ) | $ | (0.02 | ) | ||||||||
Comprehensive income (loss) | $ | (515 | ) | $ | (655 | ) | $ | 87 | $ | 29 | $ | (428 | ) | $ | (626 | ) | ||||||||
| Three Months Ended September 30, 2013 | Nine Months Ended September 30, 2013 | |||||||||||||||
| As Previously Reported | As Revised | As Previously Reported | As Revised | |||||||||||||
(unaudited) | ||||||||||||||||
Consolidated Statements of Operations and Comprehensive Income (Loss) | ||||||||||||||||
General and administrative | $ | 9,136 | $ | 9,312 | $ | 29,078 | $ | 29,077 | ||||||||
Total operating expenses | $ | 45,877 | $ | 46,053 | $ | 146,692 | $ | 146,691 | ||||||||
Income tax (expense) benefit | $ | (2,215 | ) | $ | (2,321 | ) | $ | 266 | $ | (215 | ) | |||||
Net income (loss) | $ | 3,602 | $ | 3,320 | $ | 3,178 | $ | 2,698 | ||||||||
Net income (loss) per share — basic | $ | 0.12 | $ | 0.11 | $ | 0.10 | $ | 0.09 | ||||||||
Net income (loss) per share — diluted | $ | 0.11 | $ | 0.11 | $ | 0.10 | $ | 0.09 | ||||||||
Comprehensive income (loss) | $ | 3,612 | $ | 3,330 | $ | 3,184 | $ | 2,704 | ||||||||
Impact of 2013 Revision to previously reported 2012 consolidated interim results (unaudited):
| Three Months Ended March 31, 2012 | Three Months Ended June 30, 2012 | Six Months Ended June 30, 2012 | ||||||||||||||||||||||
| As Previously Reported | As Revised | As Previously Reported | As Revised | As Previously Reported | As Revised | |||||||||||||||||||
| (unaudited) | ||||||||||||||||||||||||
Consolidated Statements of Operations and Comprehensive Income (Loss) | ||||||||||||||||||||||||
Income tax (expense) benefit | $ | 561 | $ | 538 | $ | (118 | ) | $ | (128 | ) | $ | 443 | $ | 410 | ||||||||||
Net income (loss) | $ | 218 | $ | 195 | $ | (462 | ) | $ | (472 | ) | $ | (244 | ) | $ | (277 | ) | ||||||||
Net income (loss) per share — basic | $ | 0.01 | $ | 0.01 | $ | (0.02 | ) | $ | (0.02 | ) | $ | (0.01 | ) | $ | (0.01 | ) | ||||||||
Net income (loss) per share — diluted | $ | 0.01 | $ | 0.01 | $ | (0.02 | ) | $ | (0.02 | ) | $ | (0.01 | ) | $ | (0.01 | ) | ||||||||
Comprehensive income (loss) | $ | 198 | $ | 175 | $ | (485 | ) | $ | (495 | ) | $ | (287 | ) | $ | (320 | ) | ||||||||
Consolidated Statements of Operations and Comprehensive Income (Loss) Income tax (expense) benefit Net income (loss) Net income (loss) per share — basic Net income (loss) per share — diluted Comprehensive income (loss) Nine Months Ended
September 30, 2012 As Previously
Reported As Revised (unaudited) $ (1,535 ) $ (1,568 ) $ 6,377 $ 6,344 $ 0.21 $ 0.21 $ 0.21 $ 0.20 $ 6,338 $ 6,305
Impact of 2013 Revision to previously reported consolidated annual results for the years ended December 31, 2012 and 2011:
| Year Ended December 31, 2012 | Year Ended December 31, 2011 | |||||||||||||||
| As Previously Reported | As Revised | As Previously Reported | As Revised | |||||||||||||
Consolidated Statements of Operations and Comprehensive Income (Loss) | ||||||||||||||||
Income tax (expense) benefit | $ | (2,991 | ) | $ | (3,181 | ) | $ | 13,420 | $ | 13,207 | ||||||
Net income (loss) | $ | 12,756 | $ | 12,566 | $ | 23,679 | $ | 23,466 | ||||||||
Net income (loss) per share — basic | $ | 0.42 | $ | 0.41 | $ | 0.80 | $ | 0.79 | ||||||||
Net income (loss) per share — diluted | $ | 0.41 | $ | 0.41 | $ | 0.77 | $ | 0.77 | ||||||||
Comprehensive income | $ | 12,706 | $ | 12,516 | $ | 23,727 | $ | 23,514 | ||||||||
Consolidated Statements of Cash Flows | ||||||||||||||||
Net income | $ | 12,756 | $ | 12,566 | $ | 23,679 | $ | 23,466 | ||||||||
Deferred taxes | $ | 2,465 | $ | 2,738 | $ | (13,827 | ) | $ | (13,385 | ) | ||||||
Taxes paid related to net share settlement of equity awards | $ | (598 | ) | $ | (597 | ) | $ | (319 | ) | $ | (319 | ) | ||||
Impact of 2013 Revision to previously reported consolidated balance sheets as of December 31, 2012 and 2011:
| As of December 31, 2012 | As of December 31, 2011 | |||||||||||||||
| As previously reported | As revised | As previously reported | As revised | |||||||||||||
Deferred tax assets | $ | 11,377 | $ | 10,662 | $ | 12,960 | $ | 12,518 | ||||||||
Total assets | $ | 257,262 | $ | 256,547 | $ | 221,378 | $ | 220,936 | ||||||||
Additional paid-in capital | $ | 209,987 | $ | 209,675 | $ | 190,039 | $ | 189,810 | ||||||||
Accumulated deficit | $ | (6,723 | ) | $ | (7,126 | ) | $ | (19,479 | ) | $ | (19,692 | ) | ||||
Total stockholders’ equity | $ | 203,582 | $ | 202,867 | $ | 170,922 | $ | 170,480 | ||||||||
Total liabilities and stockholders’ equity | $ | 257,262 | $ | 256,547 | $ | 221,378 | $ | 220,936 | ||||||||
Use of Estimates
The preparation of financial statements in conformity with GAAP requires management to make estimates and assumptions that affect the reported amounts of assets and liabilities and the disclosure of contingent assets and liabilities at the date of the financial statements and the reported amounts of revenue and expenses during the reporting period. On an ongoing basis, management evaluates these estimates, judgments and assumptions, including those related to revenue recognition, stock-based compensation, goodwill and acquired intangible assets, capitalization of software and website development costs, contingent consideration liability and income taxes. The Company bases these estimates on historical and anticipated results and trends and on various other assumptions that the Company believes are reasonable under the circumstances, including assumptions as to future events. These estimates form the basis for making judgments about the carrying values of assets and liabilities and recorded revenue and expenses that are not readily apparent from other sources. Actual results could differ from these estimates.
Fair Value of Financial Instruments
Certain assets and liabilities are carried at fair value under GAAP. Fair value is defined as the exchange price that would be received for an asset or paid to transfer a liability (an exit price) in the principal or most advantageous market for the asset or liability in an orderly transaction between market participants on the measurement date.
Valuation techniques used to measure fair value must maximize the use of observable inputs and minimize the use of unobservable inputs. A fair value hierarchy based on three levels of inputs, of which the first two are considered observable and the last is considered unobservable, are used to measure fair value:
Level 1 — Quoted prices in active markets for identical assets or liabilities.
Level 2 — Inputs other than Level 1 that are observable, either directly or indirectly, such as quoted prices for similar assets or liabilities; quoted prices in markets that are not active; or other inputs that are observable or can be corroborated by observable market data for substantially the full term of the assets or liabilities.
Level 3 — Unobservable inputs that are supported by little or no market activity and that are significant to the fair value of the assets or liabilities.
Effective January 1, 2012, the Company adopted new guidance applicable to fair value measurements. This accounting guidance clarifies the application of certain existing fair value measurement guidance and expands the disclosures for fair value measurements that are estimated using significant unobservable (Level 3) inputs. Adoption of the new guidance did not have an effect on the Company’s consolidated financial statements.
During the years ended December 31, 2012, 2011 and 2010, there were no transfers between Level 1, Level 2 and Level 3.
The following tables present the Company’s fair value hierarchy for its assets which are measured at fair value on a recurring basis as of December 31, 20122013 and 2011:2012:
| Fair Value Measurements at December 31, 2012 Using | Fair Value Measurements at December 31, 2013 Using | |||||||||||||||||||||||||||||||
| Level 1 | Level 2 | Level 3 | Total | Level 1 | Level 2 | Level 3 | Total | |||||||||||||||||||||||||
Financial Assets: | ||||||||||||||||||||||||||||||||
Money Market Instruments | $ | 38,320 | $ | — | $ | — | $ | 38,320 | $ | 23,444 | $ | — | $ | — | $ | 23,444 | ||||||||||||||||
U.S. Treasury Notes | 10,158 | — | — | 10,158 | 27,035 | — | — | 27,035 | ||||||||||||||||||||||||
Corporate and Agency Bonds | — | 12,676 | — | 12,676 | — | 12,688 | — | 12,688 | ||||||||||||||||||||||||
Certificates of Deposit | — | 1,000 | — | 1,000 | ||||||||||||||||||||||||||||
Commercial Paper | — | 1,898 | — | 1,898 | — | 1,000 | — | 1,000 | ||||||||||||||||||||||||
|
|
|
|
|
|
|
| |||||||||||||||||||||||||
Total | $ | 48,478 | $ | 15,574 | $ | — | $ | 64,052 | $ | 50,479 | $ | 13,688 | $ | — | $ | 64,167 | ||||||||||||||||
|
|
|
|
|
|
|
| |||||||||||||||||||||||||
| Fair Value Measurements at December 31, 2011 Using | ||||||||||||||||||||||||||||||||
| Level 1 | Level 2 | Level 3 | Total | |||||||||||||||||||||||||||||
Financial Assets: | ||||||||||||||||||||||||||||||||
Money Market Instruments | $ | 12,778 | $ | — | $ | — | $ | 12,778 | ||||||||||||||||||||||||
U.S. Treasury Notes | 32,086 | — | — | 32,086 | ||||||||||||||||||||||||||||
Corporate and Agency Bonds | — | 55,440 | — | 55,440 | ||||||||||||||||||||||||||||
Certificates of Deposit | — | 999 | — | 999 | ||||||||||||||||||||||||||||
Commercial Paper | — | 1,998 | — | 1,998 | ||||||||||||||||||||||||||||
|
|
|
| |||||||||||||||||||||||||||||
Total | $ | 44,864 | $ | 58,437 | $ | — | $ | 103,301 | ||||||||||||||||||||||||
|
|
|
| |||||||||||||||||||||||||||||
The Company has revised its classification of certain marketable securities with a fair value of $58,437 as of December 31, 2011, from Level 1 measurements to Level 2 measurements to reflect the inputs used to price these securities as described above. The Company has concluded that this misclassification is immaterial to the Company’s financial statements for all prior periods presented.
Financial Assets: Money Market Instruments U.S. Treasury Notes Corporate and Agency Bonds Certificates of Deposit Commercial Paper Total Fair Value Measurements at December 31, 2012 Using Level 1 Level 2 Level 3 Total $ 38,320 $ — $ — $ 38,320 10,158 — — 10,158 — 12,676 — 12,676 — 1,000 — 1,000 — 1,898 — 1,898 $ 48,478 $ 15,574 $ — $ 64,052
The Company has a contingent consideration liability associated with the acquisition of SinglePlatform, Corp. (“SinglePlatform”), which has been assessed at $0 as of December 31, 20122013 (see Note 4). Contingent consideration is measured at fair value and is based on significant inputs not observable in the market, which represents a Level 3 measurement within the fair value hierarchy. The valuation of the contingent consideration liability uses assumptions and estimates to forecast a range of outcomes for the contingent consideration. The Company assesses these assumptions and estimates on a quarterly basis as additional data impacting the assumptions is obtained. Changes in the fair value of the contingent consideration liability related to updated assumptions and estimates are recognized within the consolidated statements of operations.
The significant unobservable inputs used in the fair value measurement of contingent consideration are the probabilities of successful achievement of the targeted revenues, the six month periods in which the revenues are expected to be achieved and the discount rate. Increases or decreases in any of the forecasted scenarios or probabilities of success would result in a higher or lower fair value measurement, respectively. Increases or decreases in the actual achievement of milestones in the relevant period as compared to the estimated achievement would result in a higher or lower fair value measurement, respectively.
The following table provides quantitative information associated with the fair value measurement of the Company’s Level 3 inputs as of the acquisition date of June 12, 2012:
Liability | Fair Value | Valuation Technique | Unobservable Inputs | Weighted Average | Fair Value | Valuation Technique | Unobservable Inputs | Weighted Average | ||||||||||||||||
Contingent consideration | $ | 12,152 | Income approach— discounted cash flow | Revenue earn-out—probability of low case (scenario) for total revenue. | 7.5 | % | $ | 12,152 | Income approach— discounted cash flow | Revenue earn-out — probability of low case (scenario) for total revenue. | 7.5 | % | ||||||||||||
| Revenue earn-out—probability of base case (scenario) for total revenue. | 30 | % | Revenue earn-out — probability of base case (scenario) for total revenue. | 30 | % | |||||||||||||||||||
| Revenue earn-out—probability of target case (scenario) for total revenue. | 62.5 | % | Revenue earn-out — probability of target case (scenario) for total revenue. | 62.5 | % | |||||||||||||||||||
| Discount rate for revenue earn-out | 5.3 | % | Discount rate for revenue earn-out | 5.3 | % | |||||||||||||||||||
As of December 31, 2012, the Company had revised its revenue forecasts inclusive of the three scenarios and none of the three revised revenue scenarios met the payout targets. Therefore, the fair value of the contingent consideration liability was estimated at $0.$0 as of December 31, 2012. The first three revenue targets were not met and the Company does not believe the final revenue target (measured as of June 30, 2014) will be met. Therefore, the estimated fair value of the contingent consideration remained at $0 as of December 31, 2013.
Changes in the fair value of the Level 3 contingent consideration liability associated with the acquisition were as follows:
| Contingent Consideration Liability | ||||
Balance at December 31, 2011 | $ | — | ||
Acquisition of SinglePlatform | 12,152 | |||
Change in fair value of contingent consideration liability, included in acquisition costs and other related charges in 2012 | (12,152 | ) | ||
|
| |||
Balance at December 31, 2012 and 2013 | $ | — | ||
|
| |||
The change in the fair value of the contingent consideration liability from the date of the SinglePlatform acquisition through December 31, 2012 resulted from reductions to the SinglePlatform revenue forecast scenarios. The revenue forecast scenarios were decreased due to SinglePlatform’s actual operating results and reduced productivity of its sales organization. As a result, the Company adjusted the fair value of the contingent consideration liability to $0 at December 31,organization during 2012.
Fair Value Option for Financial Assets and Financial Liabilities
Authoritative guidance allows companies to choose to measure many financial instruments and certain other items at fair value. The Company has elected not to apply the fair value option to any of its financial assets or liabilities.
Cash and Cash Equivalents
The Company considers all highly liquid investments with original maturities of three months or less at the time of acquisition to be cash equivalents. The Company also considers receivables related to customer credit card purchases of $2,509$2,901 and $3,916$2,509 at December 31, 20122013 and 2011,2012, respectively, to be equivalent to cash. Cash equivalents are stated at fair value.
Marketable Securities
The Company’s marketable securities are classified as available-for-sale and are carried at fair value with the unrealized gains and losses reported as a component of accumulated other comprehensive income in stockholders’ equity. Realized gains and losses and declines in value judged to be other than temporary are included as a component of interest and other income based on the specific identification method. Fair value is determined based on quoted market prices.
At December 31, 2012,2013, marketable securities by security type consisted of:
| Amortized Cost | Gross Unrealized Gains | Gross Unrealized Losses | Estimated Fair Value | Amortized Cost | Gross Unrealized Gains | Gross Unrealized Losses | Estimated Fair Value | |||||||||||||||||||||||||
U.S. Treasury Notes | $ | 10,138 | 20 | $ | — | $ | 10,158 | $ | 27,022 | 13 | $ | — | $ | 27,035 | ||||||||||||||||||
Corporate and Agency Bonds | 12,675 | 1 | — | 12,676 | 12,684 | 4 | — | 12,688 | ||||||||||||||||||||||||
Certificates of Deposit | 1,000 | — | — | 1,000 | ||||||||||||||||||||||||||||
Commercial Paper | 1,898 | — | — | 1,898 | 1,000 | — | — | 1,000 | ||||||||||||||||||||||||
|
|
|
|
|
|
|
| |||||||||||||||||||||||||
Total | $ | 25,711 | $ | 21 | $ | — | $ | 25,732 | $ | 40,706 | $ | 17 | $ | — | $ | 40,723 | ||||||||||||||||
|
|
|
|
|
|
|
| |||||||||||||||||||||||||
At December 31, 2012,2013, marketable securities consisted of investments that mature within one year with the exception of government treasuries and corporate and agency bonds with a fair value of $14,160,$23,318, which have maturities within two years.
At December 31, 2011,2012, marketable securities by security type consisted of:
| Amortized Cost | Gross Unrealized Gains | Gross Unrealized Losses | Estimated Fair Value | Amortized Cost | Gross Unrealized Gains | Gross Unrealized Losses | Estimated Fair Value | |||||||||||||||||||||||||
U.S. Treasury Notes | $ | 32,037 | 49 | $ | — | $ | 32,086 | $ | 10,138 | 20 | $ | — | $ | 10,158 | ||||||||||||||||||
Corporate and Agency Bonds | 55,428 | 13 | (1 | ) | 55,440 | 12,675 | 1 | — | 12,676 | |||||||||||||||||||||||
Certificates of Deposit | 1,000 | — | (1 | ) | 999 | 1,000 | — | — | 1,000 | |||||||||||||||||||||||
Commercial Paper | 1,998 | — | — | 1,998 | 1,898 | — | — | 1,898 | ||||||||||||||||||||||||
|
|
|
|
|
|
|
| |||||||||||||||||||||||||
Total | $ | 90,463 | $ | 62 | $ | (2 | ) | $ | 90,523 | $ | 25,711 | $ | 21 | $ | — | $ | 25,732 | |||||||||||||||
|
|
|
|
|
|
|
| |||||||||||||||||||||||||
Accounts Receivable
Management reviews accounts receivable on a periodic basis to determine if any receivables will potentially be uncollectible. The Company reserves for receivables that are determined to be uncollectible, if any, in its allowance for doubtful accounts. After the Company has exhausted all collection efforts, the outstanding receivable is written off against the allowance.
Concentration of Credit Risk and Significant Products and Customers
Financial instruments that potentially expose the Company to concentrations of credit risk consist primarily of cash, cash equivalents and marketable securities. At December 31, 20122013 and 2011,2012, the Company had substantially all cash balances at certain financial institutions without or in excess of federally insured limits,
however, the Company maintains its cash balances and custody of its marketable securities with accredited financial institutions. The Company does not believe that it is subject to unusual credit risk beyond the normal credit risk associated with commercial banking relationships.
For the years ended December 31, 2013, 2012 2011 and 2010,2011, revenue from the Company’s email marketing product alone as a percentage of total revenue was approximately 85%84%, 88%85% and 89%88%, respectively. No customer accounted for more than 10% of total revenue during these years.
Goodwill and Acquired Intangible Assets
The Company records goodwill when consideration paid in a business acquisition exceeds the fair value of the net tangible assets and the identified intangible assets acquired. Goodwill is not amortized, but rather is tested for impairment annually or more frequently if facts and circumstances warrant a review. The Company performs its annual assessment for impairment of goodwill on November 30th of each year and has determined that there is a single reporting unit for the purpose of conducting this annual goodwill impairment assessment. For purposes of assessing potential impairment, the Company annually estimates the fair value of the reporting unit (based on the Company’s market capitalization) and compares this amount to the carrying value of the reporting unit (as reflected by the Company’s total stockholders’ equity). If the Company determines that the carrying value of the reporting unit exceeds its fair value, an impairment charge would be required.
Effective January 1, 2012, the Company adopted new guidance that simplifies the goodwill impairment test. The amendment permits the Company to first assess qualitative factors to determine whether it is more likely than not that the fair value of a reporting unit is less than its carrying amount as a basis for determining whether it is necessary to perform the two-step goodwill impairment test described in the goodwill accounting standard. Adoption of the new guidance did not have an effect on the Company’s consolidated financial statements.
Intangible assets are recorded at their estimated fair values at the date of acquisition. The Company amortizes acquired intangible assets over their estimated useful lives based on the pattern of consumption of the economic benefits or, if that pattern cannot be readily determined, on a straight-line basis.
Property and Equipment
Property and equipment are recorded at cost and depreciated using the straight-line method over the estimated useful life of the assets or, where applicable and if shorter, over the lease term. Upon retirement or sale, the cost of assets disposed of and the related accumulated depreciation are eliminated from the accounts and any resulting gain or loss is credited or charged to the statement of operations. Repairs and maintenance costs are expensed as incurred.
Estimated useful lives of assets are as follows:
Computer equipment | 3 years | |
Software | 3 years | |
Furniture and fixtures | 5 years | |
Leasehold improvements | Shorter of life of lease or estimated useful life |
Long-Lived Assets
The Company reviews the carrying values of its long-lived assets for possible impairment when events or changes in circumstance indicate that the related carrying amount may not be recoverable. Undiscounted cash flows are compared to the carrying value and when required, impairment losses on assets to be held and used are recognized based on the excess of the asset’s carrying amount over the fair value of the asset. Long-lived assets to be disposed of are reported at the lower of carrying amount or fair value less cost to sell.
Revenue Recognition
The Company provides access to its products primarily through subscription arrangements whereby the customer is charged a fee for access for a defined term. Subscription arrangements include access to use the Company’s software via the Internet and support services, such as telephone, email and chat support. When there is evidence of an arrangement, the fee is fixed or determinable and collectability is deemed reasonably assured, the Company recognizes revenue on a daily basis over the subscription period as the services are delivered. Delivery is considered to have commenced at the time the customer has paid for the products and has access to the account via a log-in and password. The Company generates revenue from its SaveLocal product by charging a fee to its customers based on the number of deals sold by its customers and the value of the successful deal. The Company recognizes revenue from the fee charged when there is evidence of an arrangement, the fee is fixed or determinable and collectability is deemed reasonably assured. The Company also offers ancillary services to its customers related to its subscription-based products such as custom services and training. When sold together, revenue from custom services, training and subscription products are accounted for separately based on vendor specific objective evidence of fair value of each of the services as those services have value on a standalone basis and do not involve a significant degree of risk or unique acceptance criteria. Revenue from custom services and training is recognized as the services are performed.
Deferred Revenue
Deferred revenue consists of payments received in advance of delivery of the Company’s on-demand products described above and is recognized as the revenue recognition criteria are met. The Company’s customers generally pay for services in advance on a monthly, semiannual or annual basis.
Software and Website Development Costs
Research and development costs are expensed as incurred and primarily include salaries, fees to consultants, and other related costs. Relative to development costs of its on-demand products and website, the Company capitalizes certain direct costs to develop functionality as well as certain upgrades and enhancements that are probable to result in additional functionality. The costs incurred in the preliminary stages of development are expensed as incurred. Once an application has reached the development stage, internal and external costs, if direct and incremental, are capitalized as part of property and equipment until the software is substantially complete and ready for its intended use. Capitalized software is amortized over a three-year period in the expense category to which the software relates.
Foreign Currency Translation
The functional currency of the Company’s UK operations is deemed to be the British pound. Accordingly, the assets and liabilities of the Company’s UK subsidiary are translated into United States dollars using the period-end exchange rate, and income and expense items are translated using the average exchange rate during the period. Cumulative translation adjustments are reflected as a separate component of stockholders’ equity. Foreign currency transaction gains and losses are charged to Other income (expense), net and were not material to the Company’s operations.
Comprehensive Income
Comprehensive income includes net income, as well as other changes in stockholders’ equity that result from transactions and economic events other than those with stockholders. The Company’s only elements of other comprehensive income (loss) are unrealized gains and losses on available-for-sale securities and translation adjustments.
Effective January 1, 2012, the Company adopted new guidance applicable to comprehensive income. Under this guidance the Company has two options for presenting comprehensive income. The Company can present the
total of comprehensive income, the components of net income, and the components of other comprehensive income either in a single continuous statement of comprehensive income or in two separate but consecutive statements. This guidance eliminates the option to present the components of other comprehensive income as part of the statement of changes in stockholders’ equity. As the new guidance relates only to how comprehensive income is disclosed and does not change the items that must be reported as comprehensive income, adoption of the new guidance did not have an effect on the Company’s consolidated financial statements.
Segment Data
The Company manages its operations as a single segment for purposes of assessing performance and making operating decisions. Revenue is generated predominately in the U.S. and all significant assets are held in the U.S.
Net Income Per Share
Basic net income per share is computed by dividing net income by the weighted average number of unrestricted common shares outstanding for the period.
Diluted net income per share is computed by dividing net income by the sum of the weighted average number of unrestricted common shares outstanding during the period and the weighted average number of potential common shares from the assumed exercise of stock options and the vesting of shares of restricted common stock and restricted stock units using the “treasury stock” method when the effect is not anti-dilutive.
The following is a summary of the shares used in computing diluted net income per share:
| Years ended December 31, | Years ended December 31, | |||||||||||||||||||||||
| 2012 | 2011 | 2010 | 2013 | 2012 | 2011 | |||||||||||||||||||
| (in thousands) | (in thousands) | |||||||||||||||||||||||
Weighted average shares used in calculating basic net income per share | 30,386 | 29,566 | 28,765 | 30,730 | 30,386 | 29,566 | ||||||||||||||||||
Stock options | 581 | 1,075 | 1,167 | 524 | 581 | 1,075 | ||||||||||||||||||
Warrants | 1 | 1 | 1 | 1 | 1 | 1 | ||||||||||||||||||
Unvested restricted shares and restricted share units | 35 | 29 | 12 | |||||||||||||||||||||
Unvested restricted stock and restricted stock units | 101 | 35 | 29 | |||||||||||||||||||||
|
|
|
|
|
| |||||||||||||||||||
Shares used in computing diluted net income per share | 31,003 | 30,671 | 29,945 | 31,356 | 31,003 | 30,671 | ||||||||||||||||||
|
|
|
|
|
| |||||||||||||||||||
The Company excluded the following common stock equivalents from the computation of diluted net income per share because they had an anti-dilutive impact because the proceeds under the treasury stock method were in excess of the average fair market value for the period:
| Years ended December 31, | Years ended December 31, | |||||||||||||||||||||||
| 2012 | 2011 | 2010 | 2013 | 2012 | 2011 | |||||||||||||||||||
| (in thousands) | (in thousands) | |||||||||||||||||||||||
Options to purchase common stock | 3,342 | 2,145 | 1,833 | 3,586 | 3,342 | 2,145 | ||||||||||||||||||
Unvested restricted stock and restricted stock units | 110 | 37 | 6 | 176 | 110 | 37 | ||||||||||||||||||
|
|
|
|
|
| |||||||||||||||||||
Total options exercisable into common stock, restricted stock units issuable in common stock and restricted stock | 3,452 | 2,182 | 1,839 | 3,762 | 3,452 | 2,182 | ||||||||||||||||||
|
|
|
|
|
| |||||||||||||||||||
Advertising Expense
The Company expenses advertising as incurred. Advertising expense was $39,796, $35,350 $36,437 and $39,214$36,437 during the years ended December 31, 2013, 2012 and 2011, and 2010, respectively.
Accounting for Stock-Based Compensation
The Company values all stock-based compensation, including grants of stock options, restricted stock and restricted stock units, at fair value on the date of grant, and expenses the fair value over the applicable service period. The straight-line method is applied to all grants with service conditions, while the graded vesting method is applied to all grants with both service and performance conditions.
Income Taxes
Income taxes are provided for tax effects of transactions reported in the financial statements and consist of income taxes currently due plus deferred income taxes related to timing differences between the basis of certain assets and liabilities for financial statement and income tax reporting purposes. Deferred taxes are determined based on the difference between the financial statement and tax basis of assets and liabilities using enacted tax rates in effect in the years in which the differences are expected to reverse. A valuation allowance is provided if, based upon the weight of available evidence, it is more likely than not that some or all of the deferred tax assets will not be realized.
The Company accounts for uncertainty in income taxes recognized in the financial statements by applying a two-step process to determine the amount of tax benefit to be recognized. First, the tax position must be evaluated to determine the likelihood that it will be sustained upon external examination. If the tax position is deemed “more-likely-than-not” to be sustained, the tax position is then assessed to determine the amount of benefit to recognize in the financial statements. The amount of the benefit that may be recognized is the largest amount that has a greater than 50% likelihood of being realized upon ultimate settlement.
Reclassifications
Prior year transactions costs related to successful acquisitions have been reclassified from general and administrative expenses to acquisition costs and other related charges to conform to current period presentation. These reclassifications did not have an effect on the Company’s earnings.
3. Property and Equipment
Property and equipment consisted of the following:
| December 31, | December 31, | |||||||||||||||
| 2012 | 2011 | 2013 | 2012 | |||||||||||||
Computer equipment | $ | 44,794 | $ | 34,540 | $ | 52,059 | $ | 44,794 | ||||||||
Software | 35,011 | 25,251 | 43,377 | 35,011 | ||||||||||||
Furniture and fixtures | 7,499 | 6,368 | 8,599 | 7,499 | ||||||||||||
Leasehold improvements | 9,015 | 7,439 | 11,657 | 9,015 | ||||||||||||
|
|
|
| |||||||||||||
Total property and equipment | 96,319 | 73,598 | 115,692 | 96,319 | ||||||||||||
Less: Accumulated depreciation and amortization | 56,666 | 39,335 | 76,454 | 56,666 | ||||||||||||
|
|
|
| |||||||||||||
Property and equipment, net | $ | 39,653 | $ | 34,263 | $ | 39,238 | $ | 39,653 | ||||||||
|
|
|
| |||||||||||||
Depreciation and amortization expense was $19,788, $17,331 $14,076 and $11,708$14,076 for the years ended December 31, 2013, 2012 2011 and 2010,2011, respectively. During 2011, the Company disposed of and sold assets that had a gross book value of $5,019 and a net book value of $160 for proceeds of $81 for which the Company recognized a loss of $79. During 2010, the Company retired assets that had a gross book value of $1,827 and no net book value.
The Company capitalized costs associated with the development of internal use software of $7,411, $6,673 $4,790 and $3,516$4,790 included in Software line item above and recorded related amortization expense of $4,575, $3,383 and $2,477 and $1,885
(included(included in depreciation and amortization expense) during the years ended December 31, 2013, 2012 2011 and 2010,2011, respectively. The remaining net book value of capitalized software costs was $11,260$14,096 and $7,970$11,260 as of December 31, 20122013 and 2011,2012, respectively.
4. Acquisitions
NutshellMail
On May 21, 2010, the Company acquired by merger all of the outstanding capital stock of Nutshell Mail, Inc., a Delaware corporation (“NutshellMail”), in order to broaden the Company’s offerings related to social media. NutshellMail offers a free service that collects and organizes the latest messages and activity from social networks into an interactive email.
The aggregate purchase price was $5,972 including $2,369 of cash and 165,523 shares of common stock valued at $3,603. For financial reporting purposes, the fair value of the common stock issued was based on the closing market price of the Company’s common stock on May 21, 2010, the closing date of the acquisition.
The Company allocated the purchase price as follows:
Current assets, including cash of $144 | $ | 156 | ||
Developed technology | 970 | |||
Goodwill | 5,248 | |||
|
| |||
Total assets acquired | 6,374 | |||
Fair value of liabilities assumed | 402 | |||
|
| |||
Net assets acquired | $ | 5,972 | ||
|
|
The developed technology was valued using the cost-to-replace method. The estimated economic life of the developed technology is three years.
Goodwill was recognized for the excess purchase price over the fair value of the net assets acquired. Goodwill is primarily attributable to NutshellMail’s knowledge of social media and expertise in working with social media tools. Goodwill from the NutshellMail acquisition is included within the Company’s one reporting unit and included in the Company’s enterprise level annual review for impairment. Goodwill resulting from the acquisition of NutshellMail is not deductible for tax purposes.
Bantam Networks
On February 15, 2011, the Company acquired substantially all of the assets, excluding cash, of Bantam Networks, LLC, a Delaware limited liability company (“Bantam Networks”), for a cash purchase price of $15,000. Bantam Networks is a contact management and social customer relationship management (“CRM”) software provider. The Company purchased the assets of Bantam Networks in order to expand the CRM functionality of its products.
The Company allocated the purchase price as follows:
Developed technology | $ | 1,800 | ||
Goodwill | 13,200 | |||
|
| |||
Total assets acquired | $ | 15,000 | ||
|
|
The developed technology was valued using the cost to replace method. The estimated economic life of the developed technology is three years and amortization will commence once the software is ready for its intended
use. Goodwill was recognized for the excess purchase price over the fair value of the assets acquired. Goodwill is primarily attributable to Bantam Networks’ knowledge of CRM and expertise in working with contact management software. Goodwill from the Bantam Networks’ acquisition is included within the Company’s one reporting unit and is included in the Company’s enterprise-level annual review for impairment. Goodwill resulting from the acquisition of Bantam Networks is deductible for tax purposes.
The following table presents the pro forma results of the historical consolidated statements of operations of the Company and Bantam Networks for the yearsyear ended December 31, 2011, and 2010, giving effect to the merger as if it occurred on January 1, 2010:
| Years ended December 31, | ||||||||||||
| 2011 | 2010 | Year ended December 31, 2011 | ||||||||||
Pro forma revenue | $ | 214,420 | $ | 174,231 | $ | 214,420 | ||||||
Pro forma net income | $ | 23,552 | $ | 1,904 | $ | 23,552 | ||||||
The pro forma net income presented primarily includes adjustments to eliminate Bantam revenue and adjustments for amortization, interest income and income taxes. This pro forma information does not purport to indicate the results that would have actually been obtained had the acquisition been completed on the assumed date, or which may be realized in the future.
Coupon Redemption Technology
During the fourth quarter of 2011, the Company acquired substantially all of the assets of a small business engaged in the back-end administration of coupon redemptions in order to expand its product offerings and enhance its technology base. The total consideration for this acquisition was $600, paid in cash. In allocating the total purchase consideration for this acquisition based on estimated fair values, the Company recorded goodwill of $487 and identifiable intangible assets of $113. Goodwill is primarily attributable to the acquired business knowledge of coupon redemption and contact management and expertise in working in the small business market. Intangible assets acquired consisted of core and completed technology that was valued using the cost-to-replace method and has a useful life of three years. The acquisition was an asset acquisition and the goodwillGoodwill resulting from this transaction is deductible for tax purposes.
CardStar
On January 13, 2012, the Company acquired by merger all of the outstanding capital stock of CardStar for a cash purchase price of $5,750. CardStar is a leading developer of mobile applications that extend the use of loyalty, rewards and membership cards and mobile coupons among consumers. The Company purchased CardStar in order to accelerate its entrance into the mobile marketing and loyalty space.
The Company allocated the purchase price as follows:
Developed technology | $ | 624 | ||
Net deferred tax assets | 553 | |||
Goodwill | 4,573 | |||
|
| |||
Total assets acquired | $ | 5,750 | ||
|
|
The developed technology was valued using the cost to replace method and has an estimated economic life of three years.
Goodwill was recognized for the excess purchase price over the fair value of the assets acquired. Goodwill is primarily attributable to CardStar’s knowledge of mobile applications and coupons and loyalty, rewards and
membership cards. Goodwill from the CardStar acquisition is included within the Company’s one reporting unit and is included in the Company’s enterprise-level annual review for impairment. Goodwill resulting from the acquisition of CardStar is not deductible for tax purposes.
SinglePlatform
On June 12, 2012, the Company acquired by merger all of the outstanding capital stock of SinglePlatform. SinglePlatform provides small businesses a single place to update their business information and delivers that information across its publishing network. The Company purchased SinglePlatform in order to expand its product offerings and allow small organizations to engage their customers earlier in the customer lifecycle. The purchase price of $75,009 reflected a cash payment of $62,857 and a liability of $12,152 representing the fair value of contingent consideration of up to $30,000 payable to the former shareholders of SinglePlatform upon achievement by SinglePlatform of certain revenue targets. These revenue targets arewere to be measured in six month intervals from July 1, 2012 to June 30, 2014. If such targets are achieved, the consideration is payable in cash. Using a discounted cash flow method and a probability weighted estimate of future revenue, the Company recorded an estimated liability of $12,152 as of the acquisition date. The estimated undiscounted range of outcomes for the contingent consideration was $0 to $21,095 at the acquisition date. The first revenue target, assessed at December 31, 2012 was not met. Basedmet and, based on actual results and the impact to forecasted performance, the Company revised its revenue forecasts.forecasts in 2012. Under the revised forecasts, no contingent consideration payments willwere to be made. Accordingly, the Company recorded a reduction to expenses of $12,152 in 2012 relating to this remeasurement of the fair value of the contingent liability. The reduction is included in acquisition costs and other related charges in the Company’s consolidated statement of operations for the year ended December 31, 2012. As of December 31, 2013, the second and third revenue target were also not met. As of December 31, 2013, the Company continues to estimate that no contingent consideration payments will be made. The Company will continue to assess the probability that the last remaining revenue targetstarget will be met and at what level, and any subsequent changes in the estimated fair value of the liability will be reflected in earnings until the liability is fully settled.
The following table summarizes the purchase price for SinglePlatform and the allocation of the purchase price:
Purchase consideration: | ||||
Total cash paid, net of cash acquired | $ | 62,546 | ||
Cash acquired | 311 | |||
Fair value of contingent consideration | 12,152 | |||
|
| |||
Total purchase price consideration | $ | 75,009 | ||
|
|
Assets acquired and liabilities assumed: | ||||
Cash | $ | 311 | ||
Accounts receivable | 48 | |||
Prepaid expenses and other current assets | 60 | |||
Property and equipment | 14 | |||
Identifiable intangible assets | 4,760 | |||
Other assets | 91 | |||
Net deferred tax assets | 72 | |||
Goodwill | 71,997 | |||
|
| |||
Total assets acquired | 77,353 | |||
|
| |||
Accounts payable, accrued expenses and other current liabilities | (1,734 | ) | ||
Deferred revenue | (610 | ) | ||
|
| |||
Total liabilities assumed | (2,344 | ) | ||
|
| |||
Total allocation of purchase price consideration | $ | 75,009 | ||
|
|
The developed technology and the customer and publisher relationships were valued using the cost to replace method. The trade name was valued using the relief from royalty method. Acquired intangible assets are
amortized over their estimated useful lives based on the pattern of consumption of the economic benefits or, if that pattern cannot be readily determined, on a straight-line basis. The following table presents the estimated fair values and useful lives of identifiable intangible assets acquired:
| Amount | Weighted Average Useful Life | Amount | Weighted Average Useful Life | |||||||||||||
| (in years) | (in years) | |||||||||||||||
Developed technology | $ | 850 | 3 | $ | 850 | 3 | ||||||||||
Customer relationships | 2,630 | 3.75 | 2,630 | 3.75 | ||||||||||||
Publisher relationships | 710 | 5 | 710 | 5 | ||||||||||||
Trade name | 570 | 5 | 570 | 5 | ||||||||||||
|
| |||||||||||||||
Total identifiable intangible assets | $ | 4,760 | 3.95 | $ | 4,760 | 3.95 | ||||||||||
|
| |||||||||||||||
Goodwill was recognized for the excess purchase price over the fair value of the net assets acquired. Goodwill is primarily attributable to the workforce of the acquired business (which is not eligible for separate recognition as an identifiable intangible asset) and the expected synergistic benefits of being able to market SinglePlatform’s product to the Company’s customer base and being able to market the Company’s products to SinglePlatform’s customer base. Goodwill from the SinglePlatform acquisition is included within the Company’s one reporting unit and is included in the Company’s enterprise-level annual review for impairment. Goodwill resulting from the acquisition of SinglePlatform is not deductible for tax purposes.
The following table presents the pro forma results of the historical consolidated statements of operations of the Company and SinglePlatform for the years ended December 31, 2012 and 2011, giving effect to the merger as if it occurred on January 1, 2011:
| Years ended December 31, | Years ended December 31, | |||||||||||||||
| 2012 | 2011 | 2012 | 2011 | |||||||||||||
Pro forma revenue | $ | 252,618 | $ | 214,839 | $ | 252,618 | $ | 214,839 | ||||||||
Pro forma net income | 11,173 | $ | 21,039 | $ | 11,173 | $ | 21,039 | |||||||||
The pro forma net income presented primarily includes adjustments for amortization, elimination of transaction costs, interest income and income taxes. This pro forma information does not purport to indicate the results that would have actually been obtained had the acquisition been completed on the assumed date, or which may be realized in the future.
Transaction costs related to the acquisitions were $0, $797 $264 and $403$264 for the years ended December 31, 2013, 2012 2011 and 2010,2011, respectively, which the Company recorded as acquisition costs and other related charges. The operating expenses of the acquired entities have been included in the consolidated financial statements beginning on their respective acquisition dates but have not been disclosed as the Company does not account for the results of the acquired entities separate from its own results. The operations of CardStar prior to the acquisition were not material to the consolidated results of the Company.
5. Goodwill and Acquired Intangible Assets
The carrying amount of goodwill was $95,505 and $18,935 as of December 31, 20122013 and 2011, respectively.2012. Changes in goodwill related only to additional goodwill from the Company’s acquisitionacquisitions of businesses.
Changes in goodwill are as follows:
Balance, December 31, 2010 | $ | 5,248 | ||
Goodwill acquired during the year | 13,687 | |||
|
| |||
Balance, December 31, 2011 | 18,935 | |||
Goodwill acquired during the year | 76,570 | |||
|
| |||
Balance, December 31, 2012 | $ | 95,505 | ||
|
|
Balance, December 31, 2011 | 18,935 | |||
Goodwill acquired during 2012 | 76,570 | |||
|
| |||
Balance, December 31, 2012 and 2013 | $ | 95,505 | ||
|
|
Goodwill is not amortized, but instead is reviewed for impairment at least annually in the fourth quarter or more frequently when events and circumstances occur indicating that the recorded goodwill may be impaired. The Company considers its business to be one reporting unit for purposes of performing its goodwill impairment analysis. The Company completed its most recent annual impairment test of goodwill on November 30, 2012.2013. To date, the Company has had no impairments toof goodwill.
Intangible assets consist of the following:
| Estimated Useful Life | December 31, 2012 | December 31, 2011 | Estimated Useful Life | December 31, 2013 | December 31, 2012 | |||||||||||||||||||||||||||||||||||||||||||||||||||
| Gross Carrying Amount | Accumulated Amortization | Net Carrying Amount | Gross Carrying Amount | Accumulated Amortization | Net Carrying Amount | Gross Carrying Amount | Accumulated Amortization | Net Carrying Amount | Gross Carrying Amount | Accumulated Amortization | Net Carrying Amount | |||||||||||||||||||||||||||||||||||||||||||||
Developed technology | 3 years | $ | 4,357 | $ | 1,222 | $ | 3,135 | $ | 2,883 | $ | 513 | $ | 2,370 | 3 years | $ | 4,357 | $ | 2,336 | $ | 2,021 | $ | 4,357 | $ | 1,222 | $ | 3,135 | ||||||||||||||||||||||||||||||
Customer relationships | 3.75 years | 3,315 | 822 | 2,493 | 685 | 9 | 676 | 3.75 years | 3,315 | 1,855 | 1,460 | 3,315 | 822 | 2,493 | ||||||||||||||||||||||||||||||||||||||||||
Publisher relationships | 5 years | 710 | 83 | 627 | — | — | — | 5 years | 710 | 225 | 485 | 710 | 83 | 627 | ||||||||||||||||||||||||||||||||||||||||||
Trade name | 5 years | 570 | 67 | 503 | — | — | — | 5 years | 570 | 181 | 389 | 570 | 67 | 503 | ||||||||||||||||||||||||||||||||||||||||||
|
|
|
|
|
|
|
|
|
|
|
| |||||||||||||||||||||||||||||||||||||||||||||
| $ | 8,952 | $ | 2,194 | $ | 6,758 | $ | 3,568 | $ | 522 | $ | 3,046 | $ | 8,952 | $ | 4,597 | $ | 4,355 | $ | 8,952 | $ | 2,194 | $ | 6,758 | |||||||||||||||||||||||||||||||||
|
|
|
|
|
|
|
|
|
|
|
| |||||||||||||||||||||||||||||||||||||||||||||
The Company amortizes the intangible assets over the estimated useful lives noted above. For the developed technology and publisher relationship assets, as the pattern of consumption of the economic benefits of the intangible assets cannot be reliably determined, the Company amortizes these acquired intangible assets over their estimated useful lives on a straight-line basis. The Company also amortizes the trade name asset over its estimated useful life on a straight-line basis as the straight-line basis is not materially different than the pattern of consumption of economic benefit basis. Customer relationships are amortized over their useful life based on the pattern of consumption of economic benefit of the asset. Amortization commences once the asset has been placed in service.
Amortization expense for intangible assets was $2,403, $1,672 $333 and $189$333 for the years ended December 31, 2013, 2012 2011 and 2010,2011, respectively. Amortization of developed technology and publisher relationships is recorded within cost of revenue and the amortization of customer relationships and trade name is recorded within sales and marketing expense. Future estimated amortization expense for assets placed in service as of December 31, 20122013 is as follows:
2013 | $ | 1,953 | ||||||
2014 | 1,596 | 2,196 | ||||||
2015 | 983 | 1,583 | ||||||
2016 | 320 | 470 | ||||||
2017 | 106 | 106 | ||||||
|
| |||||||
Total | $ | 4,958 | $ | 4,355 | ||||
|
| |||||||
Amortization of developed technology totaling $1,800 as of December 31, 2012 has not yet commenced as the software is not yet ready for its intended use.
6. Stockholders’ Equity and Stock-Based Awards
Preferred Stock
The Company has authorized 5,000,000 shares of preferred stock, par value $0.01 per share, all of which is undesignated.
Common Stock
The Company has authorized 100,000,000 shares of common stock, par value $0.01 per share. Each share of common stock is entitled to one vote. The holders of common stock are also entitled to receive dividends whenever funds are legally available and when declared by the board of directors, subject to the prior rights of holders of all classes of preferred stock outstanding.
Share Repurchase Program
In the second quarter of 2013, the Board of Directors authorized the repurchase of up to $20,000 of the Company’s common stock through December 31, 2013. Under the authorization, shares could be repurchased from time to time in the open market or privately negotiated transactions in accordance with applicable securities and stock exchange rules. Through December 31, 2013, 285,900 shares of common stock were repurchased at an average price of $18.77 per share for a total cost of $5,366. As of December 31, 2013, the stock repurchase program has ended.
Stock-Based Awards
Stock Incentive Plan
The Company’s 2011 Stock Incentive Plan (the “2011 Plan”) permits the Company to make grants of incentive stock options, non-statutory stock options, restricted stock, restricted stock units, stock appreciation rights and other stock-based awards with a maximum term of seven years. These awards may be granted to the Company’s employees, officers, directors, consultants, and advisors. The Company reserved 4,200,000 shares of its common stock for issuance under the 2011 Plan. Additionally, per the terms of the 2011 Plan, shares of common stock previously reserved for issuance under the 2007 Stock Incentive Plan as well as shares reserved for outstanding awards under the 1999 Stock Option/Stock Issuance Plan for which the awards are cancelled, forfeited, repurchased or otherwise result in common stock not being issued will be added to the number of shares available for issuance under the 2011 Plan. Awards that are granted with a per share or per unit purchase price less than 100% of fair market value as of the date of grant (e.g., restricted stock and restricted stock unit awards) shall count towards the total number of shares reserved for issuance under the 2011 Plan on a two-for-one basis. As of December 31, 2012, 1,781,7682013, 1,166,039 shares of common stock were available for issuance under the 2011 Plan.
Inducement Award Plan
In June 2012, the Compensation Committee of the Board of Directors adopted the Constant Contact, Inc.The Company’s 2012 Inducement Award Plan (the “2012 Inducement Plan”). The 2012 Inducement Plan provides for the grant of nonstatutory stock options and restricted stock unit awards as an inducement to an individual’s entering into employment with Constant Contact or in connection with an acquisition. The Company may issue up to an aggregate of 257,780 shares of common stock pursuant to the 2012 Inducement Plan, subject to adjustment in the event of stock splits and other similar events. Shares issued under the 2012 Inducement Plan may consist in whole or in part of authorized but unissued shares or may be issued shares that the Company has reacquired (provided that open market purchases of shares using the proceeds from the exercise of awards do not increase the number of shares available for future grants). Options granted under the 2012 Inducement Plan must be granted at an exercise price that is not less than 100% of the fair market value of the common stock on the date of grant and may not be granted for a term in excess of seven years.
If an award granted under the 2012 Inducement Plan expires or is terminated, surrendered or canceled without having been fully exercised or is forfeited in whole or in part (including as the result of shares of common stock subject to such award being repurchased by the Company) or otherwise results in any common stock not being issued, the unused common stock covered by such award will become available for issuance pursuant to a new award under the 2012 Inducement Plan. As of December 31, 2012,2013, there were 8,30076,117 shares of common stock available for issuance under the 2012 Inducement Plan.
The Company applies the fair value recognition provisions for all stock-based awards granted or modified in accordance with authoritative guidance. Under this guidance the Company records compensation costs over the requisite service period of the award based on the grant-date fair value. The straight-line method is applied to all grants with service conditions, while the graded vesting method is applied to all grants with both service and performance conditions.
Stock Options
During the years ended December 31, 2013, 2012 2011 and 2010,2011, the Company granted 875,975, 1,549,932 1,787,525 and 1,313,3501,787,525 stock options, respectively, to certain employees and directors. The vesting of most of these awards is time-based and the restrictions typically lapse 25% after one year and quarterly thereafter for the next 36 months in the case of employees and 33% after one year and quarterly thereafter for the next 24 months in the case of directors.
Through December 31, 2012,2013, stock options were granted with exercise prices equal to the fair value of the Company’s common stock on the date of grant. The Company bases fair value of common stock on the quoted market price.
The fair value of each stock option grant was estimated on the date of grant using the Black-Scholes option-pricing model. Because the Company has a limited history of operating as a public company, the expected term assumption was based on the “simplified method” for estimating expected term for awards that qualify as “plain-vanilla” options. Expected volatility was based on historical volatility of the publicly traded stock of a peer group of companies, inclusive of the Company, commencing October 2007. The risk-free interest rate was determined by reference to U.S. Treasury bond yields at or near the time of grant for time periods similar to the expected term of the award. The relevant data used to determine the value of the stock option grants is as follows:
| Year Ended December 31, 2012 | Year Ended December 31, 2011 | Year Ended December 31, 2010 | Year Ended December 31, 2013 | Year Ended December 31, 2012 | Year Ended December 31, 2011 | |||||||||||||||||||
Weighted average risk-free interest rate | 0.81 | % | 1.82 | % | 2.41 | % | 1.07 | % | 0.81 | % | 1.82 | % | ||||||||||||
Expected term (in years) | 4.6 | 5.5 | 6.1 | 4.6 | 4.6 | 5.5 | ||||||||||||||||||
Weighted average expected volatility | 53.58 | % | 52.15 | % | 52.17 | % | 51.14 | % | 53.58 | % | 52.15 | % | ||||||||||||
Expected dividends | 0 | % | 0 | % | 0 | % | 0 | % | 0 | % | 0 | % | ||||||||||||
A summary of stock option activity is as follows:
| Number of Options | Weighted Average Exercise Price | Weighted Average Remaining Contractual Term (In Years) | Aggregate Intrinsic Value | Number of Options | Weighted Average Exercise Price | Weighted Average Remaining Contractual Term (In Years) | Aggregate Intrinsic Value | |||||||||||||||||||||||||
Balance at December 31, 2011 | 4,902,915 | $ | 18.95 | 7.85 | $ | 26,599 | ||||||||||||||||||||||||||
Balance at December 31, 2012 | 5,510,254 | $ | 19.84 | 6.35 | $ | 5,730 | ||||||||||||||||||||||||||
Granted | 1,549,932 | 21.37 | 875,975 | 16.64 | ||||||||||||||||||||||||||||
Exercised | (415,136 | ) | 10.49 | (671,596 | ) | 15.55 | ||||||||||||||||||||||||||
Forfeited | (527,457 | ) | 23.45 | (700,650 | ) | 21.58 | ||||||||||||||||||||||||||
|
| |||||||||||||||||||||||||||||||
Balance at December 31, 2012 | 5,510,254 | $ | 19.84 | 6.35 | $ | 5,730 | ||||||||||||||||||||||||||
Balance at December 31, 2013 | 5,013,983 | $ | 19.61 | 5.57 | $ | 57,469 | ||||||||||||||||||||||||||
|
| |||||||||||||||||||||||||||||||
Vested and expected to vest at December 31, 2012 | 5,021,234 | $ | 19.58 | 6.07 | $ | 5,649 | ||||||||||||||||||||||||||
Exercisable at December 31, 2012 | 2,706,418 | $ | 17.22 | 6.03 | $ | 5,258 | ||||||||||||||||||||||||||
Vested and expected to vest at December 31, 2013 | 4,571,135 | $ | 19.61 | 5.49 | $ | 52,394 | ||||||||||||||||||||||||||
Exercisable at December 31, 2013 | 2,877,961 | $ | 19.15 | 5.27 | $ | 34,317 | ||||||||||||||||||||||||||
The aggregate intrinsic value was calculated based on the positive differences between the market value of the Company’s common stock on December 31, 20112012 and 2012,2013, of $23.21$14.21 and $14.21$31.07 per share, respectively, and the exercise prices of the options.
The weighted average grant-dategrant date fair value of grants of stock options granted was $7.14, $9.55 $12.08 and $11.84$12.08 per share for the years ended December 31, 2013, 2012 2011 and 2010,2011, respectively.
The total intrinsic value of stock options exercised was $6,168, $6,530 $10,014 and $9,529$10,014 for the years ended December 31, 2013, 2012 and 2011, and 2010, respectively.
Restricted Stock
The Company’s stock incentive plans provide for the award of restricted stock and restricted stock units. The Company has granted restricted stock and restricted stock units that contain time-based and performance based vesting.
During 2010, the Company granted 112,887 shares of restricted stock that contained both time-based and performance-based vesting conditions. Time-based restrictions lapse over three years while the performance criterion was a two part performance goal, one of which was met in 2010 and the second of which has not yet been met.
The table below summarizes activity relating to restricted stock for 2012:2013:
| Shares | Weighted Average Grant Date Fair Value | Shares | Weighted Average Grant Date Fair Value | |||||||||||||
Unvested shares as of December 31, 2011 | 60,508 | $ | 21.17 | |||||||||||||
Unvested shares as of December 31, 2012 | 48,670 | $ | 21.17 | |||||||||||||
Restricted shares vested | (11,838 | ) | 21.17 | (15,784 | ) | 21.17 | ||||||||||
Restricted shares forfeited/cancelled | — | — | (32,886 | ) | 21.17 | |||||||||||
|
| |||||||||||||||
Unvested shares as of December 31, 2012 | 48,670 | $ | 21.17 | |||||||||||||
Unvested shares as of December 31, 2013 | — | $ | — | |||||||||||||
|
| |||||||||||||||
Restricted Stock Units
During 2013, 2012 2011 and 2010,2011, the Company granted 371,415, 718,930 181,677 and 157,669181,677 restricted stock units with a weighted average grant-date fair value of $22.63, $16.73 $25.86 and $22.60,$25.86, respectively. Upon vesting, the restricted stock units entitle the holder to one share of common stock for each restricted stock unit. All restricted stock units currently granted have been classified as equity instruments as their terms require settlement in shares. The aggregate intrinsic value of restricted stock units vested in 2013, 2012 and 2011 was $3,774, $1,485 and $794, respectively. No units vested in 2010. Of the unvested restricted share units outstanding as of December 31, 2012, 595,9582013, 522,046 are subject to time-based vesting, 194,302251,845 are subject to performance basedperformance-based vesting and 95,188128,648 are subject to market-based vesting conditions. As of December 31, 2012,2013, the Company estimates that 715,398598,497 shares of restricted stock units with an intrinsic value of $7,575$18,475 and a weighted average remaining contractual term of 1.541.43 years will ultimately vest. A description of restricted stock units and the valuation methodologies used to value them are described below:
Restricted stock units with time-based vesting conditions
Time-based vesting restrictions lapse over either a two- or four-year period.two to four years. Restricted stock units with time-based vesting conditions are valued on the grant date using the grant date market price of the underlying shares.
Restricted stock units with performance-based vesting conditions
In December 2012, the Company granted 152,302 restricted stock units whichthat vest upon the achievement of at least two years of service and a targeted revenue run rate of $500,000 (the “Revenue“2012 Revenue RSUs”). The 2012 Revenue RSUs will vest upon the achievement of both (i) a performance condition and (ii) a service condition. The performance condition will be satisfied if the Company achieves a specified quarterly revenue target over a specified measurement period. To satisfy the service condition, the employee must remain employed by the Company until the later of the applicable performance determination date and the second anniversary of the date of grant. The
number of 2012 Revenue RSUs that will vest upon the achievement of the performance condition and the service condition will vary based on when the performance condition is satisfied, from a maximum of 100% of the number of target shares to a threshold of 25% of the number of target shares with no vesting, absent certain circumstances in a change of control of the Company, if the targeted threshold is not achieved. If the revenue targets are not achieved by March 31, 2017, the 2012 Revenue RSUs will expire unvested.
In December 2013, the Company granted 102,803 restricted stock units that vest upon the achievement of at least three years of service and a targeted compound annual growth rate in revenue for the year ended December 31, 2016 (the “2013 Revenue RSUs”). The 2013 Revenue RSUs will vest upon the achievement of both (i) a performance condition and (ii) a service condition. The performance condition will be satisfied if the Company achieves a specified compound annual growth rate in revenue over the specified measurement period. To satisfy
the service condition, the employee must remain employed by the Company until the applicable performance determination date. The number of Revenue RSUs that will vest upon the achievement of the performance condition and the service condition will vary based on the actual compound annual growth rate in revenue, from a maximum of 125% of the number of target shares to a threshold of 50% of the number of target shares with no vesting, absent certain circumstances in a change of control of the Company, if the targeted threshold is not achieved. If the targets are not achieved by December 31, 2016, the 2013 Revenue RSUs will expire unvested.
Restricted stock units with performance-based vesting conditions are valued on the grant date using the grant date market price of the underlying shares.
At December 31, 2012, all2013, 224,645 of the 2012 Revenue RSUs granted in 2012and 2013 Revenue RSUs remain outstanding. At December 31, 2012,2013, the Company also had outstanding 42,00027,200 restricted stock units granted in prior years that contain performance basedperformance-based vesting criteria.
Restricted stock units with market-based vesting conditions
In December 2012, the Company granted 95,188 restricted stock units whichthat vest upon achievement of a Total Shareholder Returntotal shareholder return relative to a peer group target (the “TSR“2012 TSR units”) measured over a three-year period that commenced December 4, 2012. The number of 2012 TSR units that will vest upon achievement of the Total Shareholder Return target will vary based on the level of achievement from a maximum of 125% of the target shares, or 118,982, to a threshold of 50% of the target shares, or 47,594, with no vesting, absent certain circumstances in a change of control of the Company, if the threshold requirement is not achieved or the employee is no longer with the Company at the end of the three-year period. The 2012 TSR units are valued using a Monte Carlo simulation model. The number of awardsunits expected to be earned,vest, based on achievement of the 2012 TSR market condition, is factored into the grant date Monte Carlo valuation for the 2012 TSR unit.units. Compensation cost is recognized regardless of the eventual number of awardsunits that are earnedvest based on the market condition. Expected volatility was based on historical volatility of the publicly traded stock of athe peer group of companies, inclusive of the Company over the last three years. The risk-free interest rate was determined by reference to U.S. Treasury bond yields at or near the time of grant for three years.
In December 2013, the Company granted 52,498 restricted stock units that vest upon achievement of a total shareholder return relative to a peer group target (the “2013 TSR units”) measured over a three-year period that commenced December 3, 2013. The number of 2013 TSR units that will vest upon achievement of the target will vary based on the level of achievement from a maximum of 125% of the target shares, or 65,622, to a threshold of 50% of the target shares, or 26,249, with no vesting, absent certain circumstances in a change of control of the Company, if the threshold requirement is not achieved or the employee is no longer with the Company at the end of the three-year period. The 2013 TSR units are valued using a Monte Carlo simulation model. The number of units that are expected to vest, based on achievement of the 2013 TSR market condition, is factored into the grant date Monte Carlo valuation for the 2013 TSR units. Compensation cost is recognized regardless of the eventual number of units that vest based on the market condition. Expected volatility was based on historical volatility of the publicly traded stock of the peer group of companies, inclusive of the Company over the last three years. The risk-free interest rate was determined by reference to U.S. Treasury bond yields at or near the time of grant for three years.
The relevant assumptions used in the Monte Carlo simulation modelmodels include (but are not limited to) the following:
| ||||
| ||||
| ||||
| 2013 | 2012 | |||||||
Monte Carlo assumptions | ||||||||
Risk-free interest rate | 0.58% | 0.34% | ||||||
Volatility | 29.00% – 60.36% | 27.64% – 62.45% | ||||||
Compensation cost is recognized on a straight-line basis over the requisite service period. At December 31, 2012, all2013, 128,648 of the 2012 and 2013 TSR units granted in 2012 remain outstanding.
The table below summarizes activity relating to all restricted stock units:
| Number of Shares Underlying Restricted Units | Weighted Average Grant Date Fair Value | |||||||
Unvested as of December 31, 2011 | 278,653 | $ | 24.28 | |||||
Restricted units granted | 718,930 | 16.73 | ||||||
Restricted units vested | (77,995 | ) | 22.91 | |||||
Restricted units forfeited/cancelled | (34,140 | ) | 24.01 | |||||
|
| |||||||
Unvested as of December 31, 2012 | 885,448 | $ | 17.40 | |||||
|
| |||||||
Unvested as of December 31, 2012 Restricted units granted Restricted units vested Restricted units forfeited/cancelled Unvested as of December 31, 2013 Number of Shares
Underlying
Restricted Units Weighted
Average Grant
Date Fair Value 885,448 $ 17.40 371,415 22.63 (208,959 ) 21.37 (145,365 ) 17.49 902,539 $ 18.58
Stock Purchase Plan
The Company’s 2007 Employee Stock Purchase Plan, as amended (the “Purchase Plan”), became effective upon the completion of the Company’s initial public offering. Six-month offering periods begin on January 1 and July 1 of each year during which employees may elect to purchase shares of the Company’s common stock according to the terms of the offering. ThePrior to July 1, 2013, the per share purchase price for offerings during 2010, 2011 and 2012each offering was equal to 85% of the closing market price of the Company’s common stock at the end of the offering period. Stock based compensation was determined based on the discount of 15% from the per share market price on the last day of the offering period. Starting with the offering period that began on July 1, 2013, the per share purchase period. During 2010, 36,040 sharesprice for offerings is equal to the lesser of 85% of the closing market price of the Company’s common stock were purchased for total proceeds toon the Companyfirst day or last day of $772.the offering period. During 2011, 41,677 shares of common stock were purchased for total proceeds to the Company of $859. During 2012, 78,081 shares of common stock were purchased for total proceeds to the Company of $1,053. During 2013, 79,456 shares of common stock were purchased for total proceeds to the Company of $1,089. On May 22, 2013, the Company’s stockholders approved an amendment to the Purchase Plan that increased the number of shares of common stock available for issuance under the Purchase Plan by 350,000. As of December 31, 2012, 110,5912013, 381,135 shares of common stock were available for issuance to participating employees under the Purchase Plan.
Stock-Based Compensation
The Company recognized stock-based compensation expense on all awards in cost of revenue and operating expense categories as follows:
| Years Ended December 31, | Years Ended December 31, | |||||||||||||||||||||||
| 2012 | 2011 | 2010 | 2013 | 2012 | 2011 | |||||||||||||||||||
Cost of revenue | $ | 1,758 | $ | 1,542 | $ | 1,124 | $ | 1,802 | $ | 1,758 | $ | 1,542 | ||||||||||||
Research and development | 3,733 | 3,221 | 2,491 | 3,359 | 3,733 | 3,221 | ||||||||||||||||||
Sales and marketing | 3,187 | 2,588 | 1,911 | 3,741 | 3,187 | 2,588 | ||||||||||||||||||
General and administrative | 5,596 | 4,357 | 3,026 | 5,829 | 5,596 | 4,357 | ||||||||||||||||||
|
|
|
|
|
| |||||||||||||||||||
| $ | 14,274 | $ | 11,708 | $ | 8,552 | $ | 14,731 | $ | 14,274 | $ | 11,708 | |||||||||||||
|
|
|
|
|
| |||||||||||||||||||
The unrecognized compensation expense associated with outstanding stock options, restricted stock and restricted stock units at December 31, 20122013 was $30,230,$24,438, which is expected to be recognized over a weighted-average period of 2.512.54 years.
For the years ended December 31, 2013, 2012 2011 and 2010,2011, the Company recognized income tax benefits related to stock-based compensation expense of $5,507, $5,354 $4,386 and $0,$4,386, respectively, as a component in calculating its provision for income taxes.
Additionally, the Company capitalized $482, $785 $670 and $382$670 of stock-based compensation expense related to the development of internal use software included in Property and equipment for the years ended December 31, 2013, 2012 and 2011, and 2010, respectively.
7. Income Taxes
The components of income tax expense (benefit) consisted of the following:
| Years Ended December 31, | ||||||||||||
| 2012 | 2011 | 2010 | ||||||||||
| (in thousands) | ||||||||||||
Current income tax expense | ||||||||||||
Federal | $ | 52 | $ | — | $ | — | ||||||
State | 474 | 406 | 119 | |||||||||
|
|
|
|
|
| |||||||
Total current income tax expense | 526 | 406 | 119 | |||||||||
|
|
|
|
|
| |||||||
Deferred income tax expense (benefit) | ||||||||||||
Federal | 3,119 | (8,603 | ) | (154 | ) | |||||||
State | (654 | ) | (5,223 | ) | (26 | ) | ||||||
|
|
|
|
|
| |||||||
Total deferred income tax expense (benefit) | 2,465 | (13,826 | ) | (180 | ) | |||||||
|
|
|
|
|
| |||||||
Total income tax expense (benefit) | $ | 2,991 | $ | (13,420 | ) | $ | (61 | ) | ||||
Current income tax expense (benefit) Federal State Total current income tax expense Deferred income tax expense (benefit) Federal State Total deferred income tax expense (benefit) Total income tax expense (benefit) Years Ended
December 31, 2013 2012 2011 (in thousands) $ (76 ) $ 52 $ — 438 474 406 362 526 406 2,054 3,299 (8,402 ) (1,160 ) (644 ) (5,211 ) 894 2,655 (13,613 ) $ 1,256 $ 3,181 $ (13,207 )
A reconciliation of the Company’s effective tax rate to the statutory federal income tax rate is as follows:
| Years Ended December 31, | Years Ended December 31, | |||||||||||||||||||||||
| 2012 | 2011 | 2010 | 2013 | 2012 | 2011 | |||||||||||||||||||
Statutory rate | 35 | % | 35 | % | 34 | % | 35 | % | 35 | % | 35 | % | ||||||||||||
(Decrease) increase in deferred tax asset valuation allowance | — | (154 | ) | (36 | ) | |||||||||||||||||||
Decrease in deferred tax asset valuation allowance | — | — | (154 | ) | ||||||||||||||||||||
State taxes, net of federal benefit | 2 | 5 | 3 | 5 | 2 | 5 | ||||||||||||||||||
Impact of permanent differences | 3 | 2 | 3 | 3 | 3 | 2 | ||||||||||||||||||
Stock options | 10 | 13 | 33 | 18 | 11 | 15 | ||||||||||||||||||
Tax credits | (5 | ) | (17 | ) | (39 | ) | (49 | ) | (6 | ) | (17 | ) | ||||||||||||
Impact of change in effective state tax rates | — | (3 | ) | — | — | — | (3 | ) | ||||||||||||||||
Provision to return adjustments | 2 | (8 | ) | — | 4 | 2 | (8 | ) | ||||||||||||||||
Change in the fair value of contingent consideration liability | (27 | ) | — | — | — | (27 | ) | — | ||||||||||||||||
Other | (1 | ) | (4 | ) | — | (1 | ) | (1 | ) | (4 | ) | |||||||||||||
|
|
|
|
|
| |||||||||||||||||||
| 19 | % | (131 | )% | (2 | )% | 15 | % | 19 | % | (129 | )% | |||||||||||||
|
|
|
|
|
| |||||||||||||||||||
The Company had net deferred tax assets related to temporary differences and operating loss carry-forwards as follows:
| December 31, | December 31, | |||||||||||||||
| 2012 | 2011 | 2013 | 2012 | |||||||||||||
Deferred tax assets | ||||||||||||||||
Current: | ||||||||||||||||
Accrued expenses | $ | 609 | $ | 867 | $ | 803 | $ | 609 | ||||||||
|
|
|
| |||||||||||||
Total current | 609 | 867 | 803 | 609 | ||||||||||||
|
|
|
| |||||||||||||
Noncurrent: | ||||||||||||||||
Net operating loss carry-forwards | 6,235 | 9,526 | 167 | 5,520 | ||||||||||||
Research and development credit carry-forwards | 8,068 | 7,529 | 11,826 | 8,068 | ||||||||||||
Stock options | 6,121 | 4,023 | 7,080 | 6,121 | ||||||||||||
Other | 39 | — | 62 | 39 | ||||||||||||
|
|
|
| |||||||||||||
Total noncurrent | 20,463 | 21,078 | 19,135 | 19,748 | ||||||||||||
|
|
|
| |||||||||||||
Total deferred tax assets | 21,072 | 21,945 | 19,938 | 20,357 | ||||||||||||
|
|
|
| |||||||||||||
Deferred tax liabilities-non-current | ||||||||||||||||
Capitalized research and development | (5,663 | ) | (3,767 | ) | (7,868 | ) | (5,663 | ) | ||||||||
Fixed assets | (1,304 | ) | (3,989 | ) | (72 | ) | (1,304 | ) | ||||||||
Intangible assets | (2,120 | ) | (362 | ) | (1,621 | ) | (2,120 | ) | ||||||||
|
|
|
| |||||||||||||
Total deferred tax liabilities — non-current | (9,087 | ) | (8,118 | ) | (9,561 | ) | (9,087 | ) | ||||||||
|
|
|
| |||||||||||||
Net deferred tax assets | $ | 11,985 | $ | 13,827 | $ | 10,377 | $ | 11,270 | ||||||||
|
|
|
| |||||||||||||
The decreasechange in the valuation allowance for the year ended December 31, 2010 of $1,234 was attributable primarily to an increase in the Company’s deferred tax liabilities for capitalized research and development, fixed assets and intangible assets as well as a decrease in net operating loss carry-forwards, partially offset by the increase in research and development credit carry-forwards and stock options. During 2011, the Company reassessed the need for a valuation allowance against its deferred tax assets and concluded that it was more likely than not that it would be able to realize all of its deferred tax assets primarily as a result of continued
profitability, achievement of cumulative profitability and forecasted future earnings. Accordingly, in 2011 of $15,828 was due to the Company releasedrelease of the valuation allowance related to its deferred tax assets.in 2011. There waswere no changechanges to the valuation allowance for the yearyears ended December 31, 2012.2012 or 2013.
At December 31, 2012,2013, the Company had federal and state net operating loss carry-forwards of approximately $42,897$33,500 and $1,062,$849, respectively, which, if unused, expire at varying dates through 20322033 for federal income tax purposes and at varying dates through 2018 for state income tax purposes. At December 31, 2012, $25,0462013, $30,982 of federal net operating loss carry-forwards and $1,062$849 of state net operating loss carry-forwards relate to deductions for stock option compensation for which the associated tax benefit will be credited to additional paid-in capital when realized. This amount is tracked separately and not included in the Company’s deferred tax assets.
At December 31, 2012,2013, the Company had federal and state research and development credit carry-forwards of $4,397$7,475 and $4,433,$5,524, respectively, which, if unused, will expire at varying dates through 20322033 for federal income tax purposes and at varying dates through 20272028 for state income tax purposes. Additionally, the Company has $1,127$1,169 of Massachusetts investment tax credits, which, if unused, will expire at varying dates through 2014.2015.
The American Taxpayer Relief Act of 2012 (the “Act”) was enacted on January 2, 2013. The Act retroactively reinstatesreinstated the federal research and development credit from January 1, 2012, through December 31, 2013. As a result of the change in the tax law, the Company recognized a benefit of $1,324 to income tax expense in the first quarter of 2013, the quarter in which the law was enacted for certain expenses incurred in 2012.
The Company had not recorded any amounts for unrecognized tax benefits as of December 31, 2013, 2012 2011 or 2010.2011.
The Company’s policy is to record estimated interest and penalties related to the underpayment of income taxes as a component of its income tax provision. As of December 31, 20122013 and 2011,2012, the Company had no accrued interest or tax penalties recorded. The Company’s income tax return reporting periods since December 31, 20092010 are open to income tax audit examination by the federal and state tax authorities. In addition, because the Company has net operating loss carry-forwards, the Internal Revenue Service is permitted to audit earlier years and propose adjustments up to the amount of net operating loss generated in those years.
The Company has performed an analysis of its changes in ownership under Section 382 of the Internal Revenue Code of 1986, as amended (the “Code”), and has determined that any ownership changes which have occurred do not result in a permanent limitation on usage of the Company’s federal and state net operating losses.
8. Accrued Expenses
| December 31, | December 31, | |||||||||||||||
| 2012 | 2011 | 2013 | 2012 | |||||||||||||
Payroll and payroll related | $ | 3,800 | $ | 3,148 | $ | 4,106 | $ | 3,800 | ||||||||
Licensed software and maintenance | 1,627 | 1,197 | 1,197 | 1,627 | ||||||||||||
Marketing programs | 1,197 | 2,079 | 575 | 1,197 | ||||||||||||
Other accrued expenses | 4,179 | 4,091 | 5,025 | 4,179 | ||||||||||||
|
|
|
| |||||||||||||
| $ | 10,803 | $ | 10,515 | $ | 10,903 | $ | 10,803 | |||||||||
|
|
|
| |||||||||||||
9. 401(k) Savings Plan
The Company has a defined contribution savings plan under Section 401(k) of the Code. This plan covers substantially all employees who meet minimum age and service requirements and allows participants to defer a portion of their annual compensation on a pre-tax basis. Company contributions to the plan may be made at the discretion of the Board of Directors. The Company elected to make matching contributions for the plan years ending December 31, 2013, 2012 2011 and 20102011 at a rate of 100% of each employee’s contribution up to a maximum
matching contribution of 3% of the employee’s compensation and at a rate of 50% of each employee’s contribution in excess of 3% up to a maximum of 5% of the employee’s compensation.
The Company made matching contributions of an aggregate of $2,937, $2,457 $1,955 and $1,696$1,955 for the years ended December 31, 2013, 2012 2011 and 2010,2011, respectively.
10. Commitments and Contingencies
Office Leases
The Company has a lease for its headquarters space in Waltham, Massachusetts (the “Lease”) that wasis effective through September 30, 20152022 with one five-yearten-year extension option. The Lease included payment escalations and rent holidays. Additionally, the landlord was responsible for making certain improvements to the leasedincludes space at an agreed upon cost to the landlord. The cost of improvements that were agreed to between the Company and the landlordis currently occupying as well as space that were in excess of the original agreed upon improvements were billed to the Company as additional rent. This additional rent was included in the net calculation of lease incentives, so that rent expense per square foot is recognized on a straight-line basis over the remaining term of occupancy. In December, 2012, the Company amended the Lease to expand the amount of space under the Lease, to extend the term of the Lease through September 22, 2022 with one 10-year extension option and to amend certain terms and conditions of the Lease. The additional space will be made available at various points in time during the term, starting in 2013.term.
The Company leases office space for a sales and support office in Colorado under a lease agreement effective through April 2019 with three three-year extension options. The agreement contains certain lease incentives and payment escalations. The Company also leases small amounts of general office space in Florida, New York, California and the United Kingdom under lease agreements that expire at various dates through 2017.2018.
Lease incentives, payment escalations and rent holidays specified in the lease agreements are accrued or deferred as appropriate such that rent expense per square foot is recognized on a straight-line basis over the terms of occupancy.
At December 31, 2013 and 2012, the Company had both prepaid rent and accrued rent balances related to its office leases. The prepaid rent balance was $634 at December 31, 2013, of which $128 was included in prepaid expenses and other current assets and $506 was included in other assets. The accrued rent balance was $2,239 at December 31, 2013, of which $351 was included in accrued expenses and $1,888 was included in other long-term liabilities. The prepaid rent balance was $1,725 at December 31, 2012, of which $302 was included in prepaid expenses and other current assets and $1,423 was included in other assets. The accrued rent balance was $2,154 at December 31, 2012, of which $282 was included in accrued expenses and $1,872 was included in other long-term liabilities. At December 31, 2011, the Company had both prepaid rent and accrued rent balances related to its office leases. The prepaid rent balance was $1,192 at December 31, 2011, of which $429 was included in prepaid expenses and other current assets and $763 was included in other assets. The accrued rent balance was $2,292 at December 31, 2011, of which $264 was included in accrued expenses and $2,028 was included in other long-term liabilities.
Total rent expense under office leases was $8,149, $7,102 $6,163 and $5,037$6,163 for the years ended December 31, 2013, 2012 and 2011, and 2010, respectively.
As of December 31, 2012,2013, future minimum lease payments under noncancelable office leases are as follows:
2013 | $ | 6,571 | ||
2014 | 7,686 | |||
2015 | 8,655 | |||
2016 | 9,688 | |||
2017 | 9,436 | |||
Thereafter | 40,087 | |||
|
| |||
Total | $ | 82,123 | ||
|
|
2014 2015 2016 2017 2018 Thereafter Total $ 8,354 9,238 10,194 10,153 9,747 30,954 $ 78,640
Third-Party Hosting Agreements
The Company has agreements with two affiliated vendors to provide specialized space and equipment and related services from which the Company hosts its software applications.
Payment escalations and rent holidays specified in these agreements are accrued or deferred as appropriate such that rent expense per square foot is recognized on a straight-line basis over the terms of occupancy. At December 31, 2013 and 2012, the Company had both prepaid rent and accrued rent balances related to these agreements. At December 31, 2013, the Company had prepaid rent of $861, of which $360 was included in prepaid expenses and other current assets and $501 was included in other assets. The accrued rent balance of $173 was included in other long-term liabilities. At December 31, 2012, the Company had prepaid rent of $1,120, of which $259 was included in prepaid expenses and other current assets and $861 was included in other assets. The accrued rent balance wasof $138 which was included in other long-term liabilities.
Total rent expense under hosting agreements was $4,038, $4,073 $3,573 and $2,431$3,573 for the years ended December 31, 2013, 2012 2011 and 2010,2011, respectively.
The agreements include payment commitments that expire at various dates through mid-2017. As of December 31, 2012,2013, future minimum payments under the agreements are as follows:
2013 | $ | 3,841 | ||||||
2014 | 3,624 | $ | 3,828 | |||||
2015 | 3,734 | 3,938 | ||||||
2016 | 3,845 | 4,049 | ||||||
2017 | 775 | 775 | ||||||
|
| |||||||
Total | $ | 15,819 | $ | 12,590 | ||||
|
| |||||||
Vendor Commitments
As of December 31, 2012,2013, the Company had issued both cancellable and non-cancellable purchase orders to various vendors and entered into contractual commitments with various vendors totaling $15,791$16,540 related primarily to marketing programs and other non-marketing goods and services to be delivered during 2013.2014.
Letters of Credit and Restricted Cash
As of December 31, 2012, and 2011, the Company maintained a letter of credit totaling $750 for the benefit of the landlord of the Company’s corporate headquarters lease. The landlord can draw against the letter of credit in the event of default by the Company. The Company was required to maintain a cash balance of at least $750 as of December 31, 2012 and 2011, respectively, to secure the letter of credit. This amount was classified as restricted cash in the balance sheet at December 31, 2012 and 2011. In connection with thea lease amendment signed in December 2012, the Company agreed to increase the amount of the letter of credit to $1,300 on or before January 15, 2013. This increase was completed on January 15,in 2013. Additionally, the Company agreed to increase the amount of the letter of credit at future points to a maximum amount of $1,875 if certain financial tests have not been met. The Company was required to maintain a cash balance of at least $1,300 and $750 as of December 31, 2013 and 2012, respectively, to secure the letter of credit. These amounts were classified as restricted cash in the balance sheet at December 31, 2013 and 2012.
Contingent Consideration
The former shareholders of SinglePlatform arewere eligible to receive consideration of up to $30,000, which iswas contingent on the achievement of certain revenue targets within the period from July 1, 2012 to June 30, 2014, measured in six month intervals. If such conditions arewere achieved, the consideration iswould have been payable in cash. As of December 31, 2012,2013, the first targetthree targets had not been met. Additionally, the Company does not believe the other targetsfinal target will be met. Accordingly, the Company’s accrual for this contingency as of December 31, 2012 is2013 was $0.
Indemnification Obligations
The Company enters into standard indemnification agreements with the Company’s partners and certain other third parties in the ordinary course of business. Pursuant to these agreements, the Company indemnifies and agrees to reimburse the indemnified party for losses incurred by the indemnified party in connection with certain intellectual property infringement and other claims by any third party with respect to the Company’s business and technology. Based on historical information and information known as of December 31, 2012,2013, the Company does not expect it will incur any significant liabilities under these indemnification agreements.
Legal Matters
On August 7, 2012, two former employees, on behalf of themselves and all other similarly situated individuals (collectively, the “FLSA Plaintiffs”), filed a complaint in the U.S. District Court for the District of Massachusetts
that named the Company as a defendant in a lawsuit. The complaint, which was served on the Company on August 9, 2012, allegesalleged that the Company violated the Fair Labor Standards Act and the Massachusetts overtime law with respect to certain current and former sales employees. The FSLAFLSA Plaintiffs seeksought an award for damages in an unspecified amount. AThe Company and counsel for the FLSA Plaintiffs participated in a court-sanctioned mediation session with an independent mediator is scheduled to occur in March 2013.This litigation is in its very early stages. As a result, neither2013 and, during the ultimate outcome of this litigation nor an estimate of a probable loss or any reasonably possible losses can be assessed at this time. Nevertheless,three months ended March 31, 2013, the Company believesrecorded an accrual of $820. In July 2013, the Company and the FLSA Plaintiffs executed a settlement agreement that it has meritorious defenseswould terminate the litigation and intendssettle all pending claims against the Company in exchange for an aggregate payment of $800. The U.S. District Court approved the settlement and settlement payments were distributed to defend itself vigorously.all FLSA Plaintiffs in the fourth quarter of 2013.
On September 24, 2012, RPost Holdings, Inc., RPost Communications Limited and RMail Limited (collectively, “RPost”) filed a complaint in the U.S. District Court for the Eastern District of Texas that named the Company as a defendant in a lawsuit. The complaint, which was served on the Company on December 26, 2012, alleges that certain elements of the Company’s email marketing technology infringe five patents held by RPost. RPost seeks an award for damages in an unspecified amount and injunctive relief. On February 11, 2013, RPost amended its complaint to name five of the Company’s partners as defendants. Under the Company’s contractual agreements with these partners, the Company is obligated to indemnify them for claims related to patent infringement. The Company filed a motion to sever and stay the claims against its partners and multiple motions to dismiss the claims against the Company. In January 2014, the case was stayed pending the resolution of certain state court and bankruptcy court actions involving RPost, to which the Company is not a party. RPost has asked the court to reconsider the order to stay the case. This litigation is in its very early stages. As a result, neither the ultimate outcome of this litigation nor an estimate of a probable loss or any reasonably possible losses can be assessed at this time. TheNevertheless, the Company believes that it has meritorious defenses to any claim of infringement and intends to defend itself vigorously.
On November 14, 2012, the Company filed a complaint in the U.S. District Court for the District of Delaware against Umbanet, Inc. (“Umbanet”) seeking a declaratory judgment that two patents held by Umbanet (the “Umbanet Patents”) are not infringed by a customer’s use of the Company’s email marketing product and that such patents are invalid (the “Delaware Case”). The Company filed the Delaware Case in response to a complaint filed by Umbanet in the U.S. District Court for the District of New Jersey against one of the Company’s customers
alleging that the customer’s use of the Company’s email marketing product infringed the Umbanet Patents (the “New Jersey Case”). Umbanet has filed a motion in the Delaware Case seeking to dismiss the complaint or, in the alternative, stay the case pending resolution of the New Jersey Case. The Company filed a motion in the New Jersey Case seeking to stay the case pending resolution of the Delaware Case. In January 2014, the judge in the New Jersey Case ordered that the case should proceed notwithstanding the pending Delaware Case. These litigation matters are in a very early stage. As a result, neither the ultimate outcome of these matters nor an estimate of a probable loss or any reasonably possible losses can be assessed at this time. TheNevertheless, the Company believes that it has meritorious defenses to any claim of infringement and intends to pursue these matters vigorously.
On March 7, 2013, CreateAds LLC (“CreateAds”) filed a complaint in the U.S. District Court for the District of Delaware that named the Company as a defendant in a lawsuit. The complaint, which was served on the Company on March 8, 2013, alleges that certain elements of the Company’s email marketing technology infringe a patent held by CreateAds. CreateAds seeks an award for damages in an unspecified amount and injunctive relief. The Company filed a motion to dismiss the complaint. In February 2014, the case was stayed pending a decision by the United States Supreme Court in the appeal of a patent case with issues very similar to the ones pending in the Company’s motion to dismiss. Following the Supreme Court’s decision, which is expected in June 2014, the district court will decide the Company’s motion to dismiss the CreateAds complaint. This litigation is in its very early stages. As a result, neither the ultimate outcome of this matter nor an estimate of a probable loss or any reasonably possible losses can be assessed at this time. Nevertheless, the Company believes that it has meritorious defenses to any claim of infringement and intends to defend the lawsuit vigorously.
The Company is from time to time subject to various other legal proceedings and claims, either asserted or unasserted, which arise in the ordinary course of its business. While the outcome of these other claims cannot be predicted with certainty, management does not believe that the outcome of any of these other legal matters will have a material adverse effect on the Company’s results of operations or financial condition.
11. Quarterly Information (Unaudited)
| Three Months Ended | Three Months Ended | |||||||||||||||||||||||||||||||||||||||||||||||||||||||||||||||
| Dec. 31, 2012 | Sept. 30, 2012 | June 30, 2012 | March 31, 2012 | Dec. 31, 2011 | Sept. 30, 2011 | June 30, 2011 | March 31, 2011 | Dec. 31, 2013 | Sept. 30, 2013 | June 30, 2013 | March 31, 2013 | Dec. 31, 2012 | Sept. 30, 2012 | June 30, 2012 | March 31, 2012 | |||||||||||||||||||||||||||||||||||||||||||||||||
Statements of Operations Data: | ||||||||||||||||||||||||||||||||||||||||||||||||||||||||||||||||
Revenue | $ | 66,298 | $ | 63,846 | $ | 62,072 | $ | 59,938 | $ | 57,532 | $ | 54,346 | $ | 52,527 | $ | 50,015 | $ | 74,931 | $ | 72,039 | $ | 70,208 | $ | 68,205 | $ | 66,298 | $ | 63,846 | $ | 62,072 | $ | 59,938 | ||||||||||||||||||||||||||||||||
Gross profit | 47,506 | 45,124 | 43,638 | 42,339 | 41,636 | 38,667 | 37,294 | 35,332 | 54,279 | 51,561 | 49,630 | 48,297 | 47,506 | 45,124 | 43,638 | 42,339 | ||||||||||||||||||||||||||||||||||||||||||||||||
Income (loss) from operations(1) | 7,805 | 8,531 | (406 | ) | (414 | ) | 5,120 | 5,683 | 1,312 | (2,118 | ) | 5,498 | 5,508 | (98 | ) | (2,613 | ) | 7,805 | 8,531 | (406 | ) | (414 | ) | |||||||||||||||||||||||||||||||||||||||||
Net income (loss) | 6,379 | 6,621 | (462 | ) | 218 | 18,895 | 5,353 | 1,274 | (1,843 | ) | 4,516 | 3,320 | 32 | (654 | ) | 6,222 | 6,621 | (472 | ) | 195 | ||||||||||||||||||||||||||||||||||||||||||||
Basic net income (loss) per share | $ | 0.21 | $ | 0.22 | $ | (0.02 | ) | $ | 0.01 | $ | 0.63 | $ | 0.18 | $ | 0.04 | $ | (0.06 | ) | $ | 0.15 | $ | 0.11 | $ | 0.00 | $ | (0.02 | ) | $ | 0.20 | $ | 0.22 | $ | (0.02 | ) | $ | 0.01 | ||||||||||||||||||||||||||||
Diluted net income (loss) per share | $ | 0.21 | $ | 0.21 | $ | (0.02 | ) | $ | 0.01 | $ | 0.62 | $ | 0.18 | $ | 0.04 | $ | (0.06 | ) | $ | 0.14 | $ | 0.11 | $ | 0.00 | $ | (0.02 | ) | $ | 0.20 | $ | 0.21 | $ | (0.02 | ) | $ | 0.01 | ||||||||||||||||||||||||||||
| (1) | Comparability affected by a change (benefit) in the fair value of a contingent consideration liability of $6,094 and $6,058 in the third and fourth quarters of 2012, respectively. |
| ITEM 9. | CHANGES IN AND DISAGREEMENTS WITH ACCOUNTANTS ON ACCOUNTING AND FINANCIAL DISCLOSURE |
None.
| ITEM 9A. | CONTROLS AND PROCEDURES |
Limitations on Effectiveness of Controls and Procedures
In designing and evaluating our disclosure controls and procedures and internal control over financial reporting, management recognizes that any controls and procedures, no matter how well designed and operated, can provide only reasonable assurance of achieving their objectives. In addition, the design of disclosure controls and procedures and internal control over financial reporting must reflect the fact that there are resource constraints and that management is required to apply judgment in evaluating the benefits of possible controls and procedures relative to their costs.
Disclosure Controls and Procedures
Our management, with the participation of our chief executive officer and chief financial officer, evaluated the effectiveness of our disclosure controls and procedures as of December 31, 2012.2013. The term “disclosure controls and procedures,” as defined in Rules 13a-15(e) and 15d-15(e) under the Securities Exchange Act of 1934, as amended, or the Exchange Act, means controls and other procedures of a company that are designed to ensure that information required to be disclosed by a company in the reports that it files or submits under the Exchange Act is recorded, processed, summarized and reported, within the time periods specified in the Securities and Exchange Commission’s rules and forms. Disclosure controls and procedures include, without limitation, controls and procedures designed to ensure that information required to be disclosed by a company in the reports that it files or submits under the Exchange Act is accumulated and communicated to the company’s management, including its principal executive and principal financial officers or persons performing similar functions, as appropriate to allow timely decisions regarding required disclosure. Management recognizes that any controls and procedures, no matter how well designed and operated, can provide only reasonable assurance of achieving their objectives and management necessarily applies its judgment in evaluating the cost-benefit relationship of possible controls and procedures. Based on the evaluation of our disclosure controls and procedures as of December 31, 2012,2013, our chief executive officer and chief financial officer concluded that, as of such date, our disclosure controls and procedures were effective at the reasonable assurance level.
Management’s Annual Report on Internal Control Over Financial Reporting
Our management is responsible for establishing and maintaining adequate internal control over financial reporting. Internal control over financial reporting is defined in Rules 13a-15(f) and 15d-15(f) under the Exchange Act as a process designed by, or under the supervision of, our principal executive and principal financial officer and effected by our board of directors, management and other personnel, to provide reasonable assurance regarding the reliability of financial reporting and the preparation of financial statements for external purposes in accordance with generally accepted accounting principles and includes those policies and procedures that:
Pertain to the maintenance of records that in reasonable detail accurately and fairly reflect the transactions and dispositions of our assets;
Provide reasonable assurance that transactions are recorded as necessary to permit preparation of financial statements in accordance with generally accepted accounting principles, and that our receipts and expenditures are being made only in accordance with authorizations of our management and directors; and
Provide reasonable assurance regarding prevention or timely detection of unauthorized acquisition, use or disposition of our assets that could have a material effect on our financial statements.
Because of its inherent limitations, internal control over financial reporting may not prevent or detect misstatements. Also, projections of any evaluation of effectiveness to future periods are subject to the risk that controls may become inadequate because of changes in conditions, or that the degree of compliance with the policies or procedures may deteriorate.
Under the supervision and with the participation of management, including our principal executive and financial officers, we assessed our internal control over financial reporting as of December 31, 2012,2013, based on criteria for effective internal control over financial reporting established inInternal Control — Integrated Frameworkissued by the Committee of Sponsoring Organizations of the Treadway Commission (COSO) (1992 framework).
Based on this assessment, management concluded that we maintained effective internal control over financial reporting as of December 31, 20122013 based on the specified criteria.
The effectiveness of our internal control over financial reporting as of December 31, 20122013 has been audited by PricewaterhouseCoopers LLP, our independent registered public accounting firm, as stated in their report, which is included under Item 8 in this Annual Report on Form 10-K.
Changes in Internal Control Over Financial Reporting
No change in our internal control over financial reporting (as defined in Rules 13a-15(f) and 15d-15(f) under the Exchange Act) occurred during the quarter ended December 31, 20122013 that has materially affected, or is reasonably likely to materially affect, the Company’s internal control over financial reporting.
| ITEM 9B. | OTHER INFORMATION |
None.
PART III
| ITEM 10. | DIRECTORS, EXECUTIVE OFFICERS AND CORPORATE GOVERNANCE |
Information required by this item is incorporated by reference from the information in our proxy statement for the 20132014 Annual Meeting of Stockholders, which we will file with the Securities and Exchange Commission within 120 days of December 31, 2012.2013.
We have adopted a code of ethics, called the Code of Business Conduct and Ethics that applies to our officers, including our principal executive, financial and accounting officers, and our directors and employees. We have posted the Code of Business Conduct and Ethics on our website atwww.constantcontact.comunder the “Investor Relations — Corporate Governance” section of the website. We intend to make all required disclosures concerning any amendments to, or waivers from, the Code of Business Conduct and Ethics on our website.
| ITEM 11. | EXECUTIVE COMPENSATION |
Information required by this item is incorporated by reference from the information in our proxy statement for the 20132014 Annual Meeting of Stockholders, which we will file with the Securities and Exchange Commission within 120 days of December 31, 2012.2013.
| ITEM 12. | SECURITY OWNERSHIP OF CERTAIN BENEFICIAL OWNERS AND MANAGEMENT AND RELATED STOCKHOLDER MATTERS |
Information required by this item and from Part II, Item 5 of this Annual Report on Form 10-K is incorporated by reference from the information in our proxy statement for the 20132014 Annual Meeting of Stockholders, which we will file with the Securities and Exchange Commission within 120 days of December 31, 2012.2013.
| ITEM 13. | CERTAIN RELATIONSHIPS AND RELATED TRANSACTIONS, AND DIRECTOR INDEPENDENCE |
Information required by this item is incorporated by reference from the information in our proxy statement for the 20132014 Annual Meeting of Stockholders, which we will file with the Securities and Exchange Commission within 120 days of December 31, 2012.
| ITEM 14. | PRINCIPAL |
Information required by this item is incorporated by reference from the information in our proxy statement for the 20132014 Annual Meeting of Stockholders, which we will file with the Securities and Exchange Commission within 120 days of December 31, 2012.2013.
PART IV
| ITEM 15. | EXHIBITS AND FINANCIAL STATEMENT SCHEDULES |
(a) Financial Statements
For a list of the consolidated financial statements included herein, see Index to the Consolidated Financial Statements on page 49 of this Annual Report on Form 10-K, incorporated into this Item by reference.
(b) Exhibits
See Exhibit Index on page 85 of this Annual Report on Form 10-K, incorporated into this Item by reference.
(c) Financial Statement Schedules
No financial statement schedules have been submitted because they are not required or are not applicable or because the information required is included in the consolidated financial statements or the notes thereto.
Pursuant to the requirements of Section 13 or 15(d) of the Securities Exchange Act of 1934, the registrant has duly caused this report to be signed on its behalf by the undersigned, thereunto duly authorized.
| CONSTANT CONTACT, INC. | ||||||
| Date: | By: | /s/ Gail F. Goodman | ||||
| Gail F. Goodman | ||||||
| President and Chief Executive Officer | ||||||
Pursuant to the requirements of the Securities Exchange Act of 1934, this report has been signed below by the following persons on behalf of the registrant and in the capacities and on the dates indicated.
Signature | Title | Date | ||
/s/ Gail F. Goodman Gail F. Goodman | Chairman, President and Chief Executive Officer (Principal Executive Officer) | |||
/s/ Thomas Anderson Thomas Anderson | Director | |||
/s/ Robert P. Badavas Robert P. Badavas | Director | |||
/s/ John Campbell John Campbell | Director | |||
/s/ William S. Kaiser William S. Kaiser | Director | |||
/s/ Daniel T. H. Nye Daniel T. H. Nye | Director | |||
/s/ Sharon T. Rowlands Sharon T. Rowlands | Director | |||
/s/ Jay Herratti Jay Herratti | Director | |||
/s/ Harpreet S. Grewal Harpreet S. Grewal | Executive Vice President and Chief Financial Officer and Treasurer (Principal Financial and Accounting Officer) | |||
EXHIBIT INDEX
Exhibit | Description | Location | ||
| 3.1 | Restated Certificate of Incorporation of the Company. | Incorporated by reference to Exhibit 3.2 to the Company’s Registration Statement on Form S-1, as amended (Registration Number 333-144381), filed with the Securities and Exchange Commission, or SEC, on September 4, 2007. | ||
| 3.2 | Second Amended and Restated Bylaws of the Company. | Incorporated by reference to Exhibit 3.4 to the Company’s Registration Statement on Form S-1, as amended (Registration Number 333-144381), filed with the SEC on September 4, 2007. | ||
| 4.1 | Specimen Stock Certificate | Incorporated by reference to Exhibit 4.1 to the Company’s Registration Statement on Form S-1, as amended (Registration Number 333-144381), filed with the SEC on September 4, 2007. | ||
| 10.1# | 1999 Stock Option/Stock Issuance Plan, as amended. | Incorporated by reference to Exhibit 10.1 to the Company’s Registration Statement on Form S-1, as amended (Registration Number 333-144381), filed with the SEC on July 6, 2007. | ||
| 10.2# | Form of Non-Qualified Stock Option Agreement with Executive Officers under the 1999 Stock Option/Stock Issuance Plan. | Incorporated by reference to Exhibit 10.2 to the Company’s Registration Statement on Form S-1, as amended (Registration Number 333-144381), filed with the SEC on July 6, 2007. | ||
| 10.3# | Form of Non-Qualified Stock Option Agreement under the 1999 Stock Option/Stock Issuance Plan. | Incorporated by reference to Exhibit 10.3 to the Company’s Registration Statement on Form S-1, as amended (Registration Number 333-144381), filed with the SEC on July 6, 2007. | ||
| 10.4# | Constant Contact, Inc. 2007 Stock Incentive Plan. | Incorporated by reference to Exhibit 10.5 to the Company’s Registration Statement on Form S-1, as amended (Registration Number 333-144381), filed with the SEC on September 4, 2007. | ||
| 10.5# | Forms of Incentive Stock Option Agreements, under the 2007 Stock Incentive Plan. | Incorporated by reference to Exhibit 10.6 to the Company’s Registration Statement on Form S-1, as amended (Registration Number 333-144381), filed with the SEC on September 4, 2007. | ||
| 10.6# | Forms of Non-Qualified Stock Option Agreements, under the 2007 Stock Incentive Plan. | Incorporated by reference to Exhibit 10.7 to the Company’s Registration Statement on Form S-1, as amended (Registration Number 333-144381), filed with the SEC on September 4, 2007. | ||
| 10.7# | Constant Contact, Inc. 2007 Employee Stock Purchase Plan. | Incorporated by reference to Exhibit 10.8 to the Company’s Registration Statement on Form S-1, as amended (Registration Number 333-144381), filed with the SEC on September 4, 2007. | ||
| 10.8 | Form of Director and Officer Indemnification Agreement. | Incorporated by reference to Exhibit 10.13 to the Company’s Registration Statement on Form S-1, as amended (Registration Number 333-144381), filed with the SEC on September 4, 2007. | ||
| 10.9 | Form of Indemnification Agreement between the Company and certain entities that sold stock in the Company’s initial public offering. | Incorporated by reference to Exhibit 10.18 to the Company’s Registration Statement on Form S-1, as amended (Registration Number 333-144381), filed with the SEC on September 12, 2007. | ||
Exhibit | Description | Location | ||
| 10.10 | Lease, dated as of May 30, 2008, between the Company and | |||
| Incorporated by reference to Exhibit 10.2 to the Company’s Current Report on Form 8-K, filed with the SEC on June 4, 2008. | ||||
| Amendment No. 1 to the Constant Contact, Inc. 2007 Employee Stock Purchase Plan. | Incorporated by reference to Exhibit 10.4 to the Company’s Quarterly Report on Form 10-Q for the quarter ended June 30, 2008, filed with the SEC on August 13, 2008. | |||
| First Amendment to Lease, dated as of October 8, 2008, between the Company and McWhinney 409CC, LLC. | Incorporated by reference to Exhibit 10.1 to the Company’s Quarterly Report on Form 10-Q for the quarter ended September 30, 2008, filed with the SEC on November 7, 2008. | |||
| Loan and Security Agreement, dated February 27, 2003, as amended, between the Company and Silicon Valley Bank. | Incorporated by reference to Exhibit 10.17 to the Company’s Registration Statement on Form S-1, as amended (Registration Number 333-144381), filed with the SEC on July 6, 2007. | |||
| Lease, dated May 29, 2009, between the Company and Boston Properties Limited Partnership. | Incorporated by reference to Exhibit 10.1 to the Company’s Current Report on Form 8-K, filed with the SEC on June 4, 2009. | |||
| Amendment No. 2 to the Constant Contact, Inc. 2007 Employee Stock Purchase Plan. | Incorporated by reference to Exhibit 99.1 to the Company’s Current Report on Form 8-K, filed with the SEC on December 2, 2009. | |||
| First Amendment to Lease dated as of May 3, 2010 by and between BP Reservoir Place LLC (as successor-in-interest to Boston Properties Limited Partnership) and the Company. | Incorporated by reference to Exhibit 10.1 to the Company’s Quarterly Report on Form 10-Q for the quarter ended June 30, 2010, filed with the SEC on August 4, 2010. | |||
| Letter Agreement, dated as of May 25, 2010, between the Company and Harpreet S. Grewal. | Incorporated by reference to Exhibit 10.1 to the Company’s Current Report on Form 8-K, filed with the SEC on June 1, 2010. | |||
| Form of Executive Restricted Stock Unit Agreement (Time-Based Vesting) under the 2007 Stock Incentive Plan. | Incorporated by reference to Exhibit 10.2 to the Company’s Quarterly Report on Form 10-Q for the quarter ended September 30, 2010, filed with the SEC on November 3, 2010. | |||
| Restricted Stock Unit Agreement (Performance-Based Vesting) dated September 1, 2010 between the Company and Harpreet S. Grewal. | Incorporated by reference to Exhibit 10.3 to the Company’s Quarterly Report on Form 10-Q for the quarter ended September 30, 2010, filed with the SEC on November 3, 2010. | |||
| Second Amendment to Lease dated as of September 13, 2010 by and between BP Reservoir Place LLC (as successor-in-interest to Boston Properties Limited Partnership) and the Company. | Incorporated by reference to Exhibit 10.4 to the Company’s Quarterly Report on Form 10-Q for the quarter ended September 30, 2010, filed with the SEC on November 3, 2010. | |||
|
|
| ||
| Executive Severance Agreement, dated as of December 3, 2010, between the Company and Gail F. Goodman. | Incorporated by reference to Exhibit 10.2 to the Company’s Current Report on Form 8-K, filed with the SEC on December 6, 2010. | |||
Exhibit | Description | Location | ||
| Executive Severance Agreement, dated as of December 3, 2010, between the Company and Ellen M. Brezniak. | Incorporated by reference to Exhibit 10.3 to the Company’s Current Report on Form 8-K, filed with the SEC on December 6, 2010. | |||
| Executive Severance Agreement, dated as of December 3, 2010, between the Company and Harpreet S. Grewal. | Incorporated by reference to Exhibit 10.5 to the Company’s Current Report on Form 8-K, filed with the SEC on December 6, 2010. | |||
| Executive Severance Agreement, dated as of December 3, 2010, between the Company and Christopher M. Litster. | Incorporated by reference to Exhibit 10.9 to the Company’s Current Report on Form 8-K, filed with the SEC on December 6, 2010. | |||
| Executive Severance Agreement, dated as of December 3, 2010, between the Company and Robert P. Nault. | Incorporated by reference to Exhibit 10.10 to the Company’s Current Report on Form 8-K, filed with the SEC on December 6, 2010. | |||
| Executive Severance Agreement, dated as of December 3, 2010, between the Company and Robert D. Nicoson. | Incorporated by reference to Exhibit 10.11 to the Company’s Current Report on Form 8-K, filed with the SEC on December 6, 2010. | |||
| Turn Key Datacenter Lease dated as of December 31, 2010 between Digital Alfred, LLC and the Company. | Incorporated by reference to Exhibit 10.40 to the Company’s Annual Report on Form 10-K for the year ended December 31, 2010, filed with the SEC on March 9, 2011. | |||
| Datacenter Lease dated as of January 1, 2011 between Digital 55 Middlesex, LLC and the Company. | Incorporated by reference to Exhibit 10.41 to the Company’s Annual Report on Form 10-K for the year ended December 31, 2010, filed with the SEC on March 9, 2011. | |||
| Form of Performance Stock Option Agreement (Customer-Based), under the 2007 Stock Incentive Plan. | Incorporated by reference to Exhibit 10.43 to the Company’s Annual Report on Form 10-K for the year ended December 31, 2010, filed with the SEC on March 9, 2011. | |||
| Asset Purchase Agreement dated as of February 15, 2011 between the Company and Bantam Networks, LLC. | Incorporated by reference to Exhibit 2.1 to the Company’s Current Report on Form 8-K, filed with the SEC on February 16, 2011. | |||
|
|
| ||
| First Amendment to Turn Key Datacenter Lease dated as of March 1, 2011 between the Company and Digital Alfred, LLC. | Incorporated by reference to Exhibit 10.1 to the Company’s Quarterly Report on Form 10-Q for the quarter ended March 31, 2011, filed with the SEC on May 2, 2011. | |||
| Constant Contact, Inc. 2011 Stock Incentive Plan. | Incorporated by reference to Exhibit 99.1 to the Company’s Registration Statement on Form S-8 (File No. 333-174621), filed with the Securities and Exchange Commission on May 31, 2011. | |||
| Form of Incentive Stock Option Agreement (non-executive officers) under the 2011 Stock Incentive Plan. | Incorporated by reference to Exhibit 10.3 to the Company’s Quarterly Report on Form 10-Q for the quarter ended June 30, 2011, filed with the SEC on August 4, 2011. | |||
Exhibit | Description | Location | ||
| Form of Incentive Stock Option Agreement (executive officers) under the 2011 Stock Incentive Plan. | Incorporated by reference to Exhibit 10.2 to the Company’s Quarterly Report on Form 10-Q for the quarter ended June 30, 2011, filed with the SEC on August 4, 2011. | |||
| Form of Non-Statutory Stock Option Agreement (non-executive officers) under the 2011 Stock Incentive Plan. | Incorporated by reference to Exhibit 10.5 to the Company’s Quarterly Report on Form 10-Q for the quarter ended June 30, 2011, filed with the SEC on August 4, 2011. | |||
| Form of Non-Statutory Stock Option Agreement (executive officers) under the 2011 Stock Incentive Plan. | Incorporated by reference to Exhibit 10.4 to the Company’s Quarterly Report on Form 10-Q for the quarter ended June 30, 2011, filed with the SEC on August 4, 2011. | |||
| Form of Restricted Stock Unit Agreement (executive officers; time-based) under the 2011 Stock Incentive Plan. | Incorporated by reference to Exhibit 10.6 to the Company’s Quarterly Report on Form 10-Q for the quarter ended June 30, 2011, filed with the SEC on August 4, 2011. | |||
| Form of Non-Statutory Stock Option Agreement (directors; initial grant) under the 2011 Stock Incentive Plan. | Incorporated by reference to Exhibit 10.7 to the Company’s Quarterly Report on Form 10-Q for the quarter ended June 30, 2011, filed with the SEC on August 4, 2011. | |||
| Form of Non-Statutory Stock Option Agreement (directors; annual grant) under the 2011 Stock Incentive Plan. | Incorporated by reference to Exhibit 10.8 to the Company’s Quarterly Report on Form 10-Q for the quarter ended June 30, 2011, filed with the SEC on August 4, 2011. | |||
| Form of Non-Statutory Stock Option Agreement (directors; discretionary grant) under the 2011 Stock Incentive Plan. | Incorporated by reference to Exhibit 10.9 to the Company’s Quarterly Report on Form 10-Q for the quarter ended June 30, 2011, filed with the SEC on August 4, 2011. | |||
| Form of Restricted Stock Unit Agreement (non-executive officers; | Incorporated by reference to Exhibit 10.52 to the Company’s Annual Report on Form 10-K for the year ended December 31, 2011, filed with the SEC on February 28, 2012. | |||
| Letter Agreement dated March 24, 2011 between the Company and Rick Jensen. | Incorporated by reference to Exhibit 10.53 to the Company’s Annual Report on Form 10-K for the year ended December 31, 2011, filed with the SEC on February 28, 2012. | |||
| 10.43# | Executive Severance Agreement, dated as of May 2, 2011, between the Company and Rick Jensen. | Incorporated by reference to Exhibit 10.54 to the Company’s Annual Report on Form 10-K for the year ended December 31, 2011, filed with the SEC on February 28, 2012. | ||
| 10.44 | Second Amendment to Turn Key Datacenter Lease dated as of December 15, 2011 between the Company and Digital Alfred, LLC. | Incorporated by reference to Exhibit 10.55 to the Company’s Annual Report on Form 10-K for the year ended December 31, 2011, filed with the SEC on February 28, 2012. | ||
| 10.45# | Executive Severance Agreement, dated as of October 25, 2011, between the Company and David Gilbertson. | Incorporated by reference to Exhibit 10.56 to the Company’s Annual Report on Form 10-K for the year ended December 31, 2011, filed with the SEC on February 28, 2012. | ||
| 10.46# | Form of Restricted Stock Unit Agreement (executive officers; performance-based—SaveLocal) under the 2011 Stock Incentive Plan. | Incorporated by reference to Exhibit 10.57 to the Company’s Annual Report on Form 10-K for the year ended December 31, 2011, filed with the SEC on February 28, 2012. | ||
Exhibit | Description | Location | ||
| 10.47# | Executive Severance Agreement, dated as of | |||
| Incorporated by reference to Exhibit 10.58 to the Company’s Annual Report on Form 10-K for the year ended December 31, 2011, filed with the SEC on February 28, 2012. | ||||
| Form of Restricted Stock Unit Agreement (non-executive officers: time-based-transaction) under the 2011 Stock Incentive Plan. | Incorporated by reference to Exhibit 10.59 to the Company’s Annual Report on Form 10-K for the year ended December 31, 2011, filed with the SEC on February 28, 2012. | |||
| First Amendment to Datacenter Lease dated as of May 11, 2012 by and between Digital 55 Middlesex, LLC and the Company. | Incorporated by reference to Exhibit 10.1 to the Company’s Current Report on Form 8-K, filed with the SEC on May 17, 2012. | |||
| 55 Middlesex Turnpike Office Space Rider dated as of May 11, 2012 by and between Digital 55 Middlesex, LLC and the Company. | Incorporated by reference to Exhibit 10.2 to the Company’s Current Report on Form 8-K, filed with the SEC on May 17, 2012. | |||
| Constant Contact, Inc. 2012 Inducement Award Plan. | Incorporated by reference to Exhibit 99 to the Company’s Registration Statement on Form S-8 (File No. 333-182083), filed with the Securities and Exchange Commission on June 13, 2012. | |||
|
|
| ||
| Agreement and Plan of Merger, dated as of June 12, 2012, by and among the Company, Match Acquisition Corporation, SinglePlatform, Corp. and Shareholder Representative Services LLC, a Colorado limited liability company, solely in its capacity as Stockholder Representative. | Incorporated by reference to Exhibit 2.1 to the Company’s Current Report on Form 8-K, filed with the SEC on June 13, 2012. | |||
| Form of Stock Option Agreement under the Constant Contact 2012 Inducement Award Plan. | Incorporated by reference to Exhibit 10.2 to the Company’s Current Report on Form 8-K, filed with the SEC on June 13, 2012. | |||
| Form of Restricted Stock Unit Agreement under the Constant Contact, Inc. 2012 Inducement Award Plan for Wiley Cerilli. | Incorporated by reference to Exhibit 10.3 to the Company’s Current Report on Form 8-K, filed with the SEC on June 13, 2012. | |||
| Form of Restricted Stock Unit Agreement under the Constant Contact, Inc. 2012 Inducement Award Plan for Key Employees. | Incorporated by reference to Exhibit 10.4 to the Company’s Current Report on Form 8-K, filed with the SEC on June 13, 2012. | |||
| Lease and related Work Letter Agreement dated as of May 29, 2012 by and between the Company and Edward J. Conner. | Incorporated by reference to Exhibit 10.3 to the Company’s Quarterly Report on Form 10-Q for the quarter ended June 30, 2012, filed with the SEC on August 1, 2012. | |||
| Third Amendment to Lease dated as of April 1, 2012 by and between BP Reservoir Place LLC (as successor-in-interest to Boston Properties Limited Partnership) and the Company. | Incorporated by reference to Exhibit 10.8 to the Company’s Quarterly Report on Form 10-Q for the quarter ended June 30, 2012, filed with the SEC on August 1, 2012. | |||
Exhibit | Description | Location | ||
| Fourth Amendment to Lease dated as of December 27, 2012 by and between BP Reservoir Place LLC (as successor in interest to Boston Properties Limited Partnership) and the Company. | Incorporated by reference to Exhibit 10.1 to the Company’s Current Report on Form 8-K, filed with the SEC on January 3, 2013. | |||
| Executive Severance Agreement effective as of June 21, 2012 by and among the Company and Kenneth J. Surdan. | Incorporated by reference to Exhibit 10.2 to the Company’s Current Report on Form 8-K, filed with the SEC on January 3, 2013. | |||
Form of Restricted Stock Unit Agreement (for Executives) under the Constant Contact, Inc. 2011 Stock Incentive Plan (Performance-Based Vesting (Revenue); Double Trigger). | ||||
Incorporated by reference to Exhibit |
|
| ||
Form of Restricted Stock Unit Agreement (for Executives) under the Constant Contact, Inc. 2011 Stock Incentive Plan (Performance-Based Vesting (Total Shareholder Return); Double Trigger). | ||||
| Form of Nonstatutory Stock Option Agreement (for Executives) Granted Under the Constant Contact, Inc. 2011 Stock Incentive Plan (Double Trigger). | ||||
| Form of Incentive Stock Option Agreement (for Executives) Granted Under the Constant Contact, Inc. 2011 Stock Incentive Plan (Double Trigger). | ||||
Form of Restricted Stock Unit Agreement (for Employees) under the Constant Contact, Inc. 2011 Stock Incentive Plan (Time-Based Vesting; Alternate Version | ||||
Form of Restricted Stock Unit Agreement (for Employees) under the Constant Contact, Inc. 2011 Stock Incentive Plan (Time-Based Vesting; Alternate Version 2—Multiple Vest Dates). | Incorporated by reference to Exhibit 10.71 to the Company’s Annual Report on Form 10-K for the year ended December 31, 2012, filed with the SEC on February 28, 2013. | |||
| 10.66# | Constant Contact, Inc. 2013 Executive Cash Incentive Bonus Plan. | Incorporated by reference to Exhibit 10.72 to the Company’s Annual Report on Form 10-K for the year ended December 31, 2012, filed with the SEC on February 28, 2013. | ||
Exhibit | Description | Location | ||
| 10.67 | Agreement of Lease dated as of April 30, 2013 by and between Constant Contact, Inc. and Battery Commercial Associates LLC. | Incorporated by reference to Exhibit 10.1 to the Company’s Quarterly Report on Form 10-Q for the quarter ended June 30, 2013, filed with the SEC on July 31, 2013. | ||
| 10.68# | Form of Restricted Stock Unit Agreement (for Executives) under the Constant Contact, Inc. 2011 Stock Incentive Plan (Performance-Based Vesting (Revenue CAGR); Double Trigger). | Filed herewith. | ||
| Form of Restricted Stock Unit Agreement (for Executives) under the Constant Contact, Inc. 2011 Stock Incentive Plan (Performance-Based Vesting (Total Shareholder Return—2013); Double Trigger). | Filed herewith. | |||
| 10.70# | Form of Restricted Stock Unit Agreement (for Executives) under the Constant Contact, Inc. 2011 Stock Incentive Plan (Time-Based Vesting; Double Trigger). | Filed herewith. | ||
| 10.71# | Constant Contact, Inc. | Filed herewith. | ||
| 21.1 | Subsidiaries of the Company. | Filed herewith. | ||
| 23.1 | Consent of PricewaterhouseCoopers LLP. | Filed herewith. | ||
| 31.1 | Certification of Chief Executive Officer pursuant to Section 302 of the Sarbanes-Oxley Act of 2002. | Filed herewith. | ||
| 31.2 | Certification of Chief Financial Officer pursuant to Section 302 of the Sarbanes-Oxley Act of 2002. | Filed herewith. | ||
| 32.1* | Certification of Chief Executive Officer pursuant to 18 U.S.C. Section 1350, as adopted pursuant to Section 906 of the Sarbanes-Oxley Act of 2002. | Furnished herewith. | ||
|
|
| ||
| 32.2* | Certification of Chief Financial Officer pursuant to 18 U.S.C. Section 1350, as adopted pursuant to Section 906 of the Sarbanes-Oxley Act of 2002. | Furnished herewith. | ||
| XBRL Instance Document. | ||||
Exhibit | Description | Location | ||
| XBRL Taxonomy Extension Schema Document. | ||||
| XBRL Taxonomy Extension Calculation Linkbase Document. | ||||
| XBRL Taxonomy Extension Labels Linkbase Document. | ||||
| XBRL Taxonomy Extension Presentation Linkbase Document. | ||||
| XBRL Taxonomy Extension Definition Linkbase Document. | ||||
| # | Management contract or compensatory plan required to be filed as an exhibit pursuant to Item 15(b) of this Annual Report on Form 10-K. |
| * | This certification accompanies this Annual Report on Form 10-K pursuant to Section 906 of the Sarbanes-Oxley Act of 2002 and shall not be deemed filed by the Company for purposes of Section 18 of the Securities Exchange Act of 1934, as amended, or the Exchange Act, or otherwise subject to liability under that section. This certification shall not be deemed incorporated by reference in any filing under the Securities Act of 1933, as amended, or the |
92