UNITED STATES
SECURITIES AND EXCHANGE COMMISSION
Washington, D.C. 20549
FORM 10-K
ANNUAL REPORT PURSUANT TO SECTION 13 OR 15(d) OF THE
SECURITIES EXCHANGE ACT OF 1934
For the fiscal year ended December 31, 20122014
Commission File Number: 001-09305
STIFEL FINANCIAL CORP.
(Exact name of registrant as specified in its charter)
| Delaware | 43-1273600 | |
(State or other jurisdiction of incorporation or organization) | (I.R.S. Employer Identification No.) |
501 N.North Broadway, St. Louis, Missouri 63102-2188
(Address of principal executive offices and zip code)
(314) 342-2000
(Registrant’s telephone number, including area code)
Securities registered pursuant to Section 12(b) of the Act:
Title of Each Class | Name of Each Exchange on Which Registered | |
| Common Stock, $0.15 par value per share | New York Stock Exchange | |
| Chicago Stock Exchange | ||
| Preferred Stock Purchase Rights | New York Stock Exchange | |
| Chicago Stock Exchange | ||
| 5.375% Senior Notes Due 2022 | New York Stock Exchange |
Securities registered pursuant to Section 12(g) of the Act: None
Indicate by check mark if the registrant is a well-known seasoned issuer, as defined in Rule 405 of the Securities Act. Yes x No ¨
Indicate by check mark if the registrant is not required to file reports pursuant to Section 13 or Section 15(d) of the Exchange Act. Yes ¨ No x
Indicate by check mark whether the registrant (1) has filed all reports required to be filed by Section 13 or 15(d) of the Securities Exchange Act of 1934 (“the Exchange Act”) during the preceding 12 months (or for such shorter period that the registrant was required to file such reports), and (2) has been subject to such filing requirements for the past 90 days. Yes x No ¨
Indicate by check mark if disclosure of delinquent filers pursuant to Item 405 of Regulation S-K is not contained herein, and will not be contained, to the best of registrant’s knowledge, in definitive proxy or information statements incorporated by reference in Part III of this Form 10-K or any amendment to this Form 10-K. x
Indicate by check mark whether the registrant has submitted electronically and posted on its corporate Webweb site, if any, every Interactive Data File required to be submitted and posted pursuant to Rule 405 of Regulation S-T during the preceding 12 months (or for such shorter period that the registrant was required to submit and post such files). Yes x No ¨
Indicate by check mark whether the registrant is a large accelerated filer, an accelerated filer, a non-accelerated filer, or a smaller reporting company (as defined in Rule 12b-2 of the Exchange Act).
| Large accelerated filer | x | Accelerated filer | ¨ | |||
| Non-accelerated filer | ¨ (Do not check if smaller reporting company) | Smaller reporting company | ¨ | |||
Indicate by check mark whether the registrant is a shell company (as defined in Rule 12b-2 of the Exchange Act). Yes ¨ No x
The aggregate market value of the registrant’s common stock, $0.15 par value per share, held by non-affiliates of the registrant as of the close of business on June 30, 2012,2014, was $1.8$3.3 billion.(1) 1
The number of shares outstanding of the registrant’s common stock, $0.15 par value per share, as of the close of business on February 22, 2013,20, 2015, was 63,052,892.67,580,820.
In determining this amount, the registrant assumed that the executive officers and directors of the registrant are affiliates of the registrant. Such assumptions shall not be deemed to be conclusive for any other purposes. |
DOCUMENTS INCORPORATED BY REFERENCE
Portions of the Proxy Statement for the annual meeting of shareholders, to be filed within 120 days of our fiscal year ended December 31, 2012,2014, are incorporated by reference in Part III hereof.
STIFEL FINANCIAL CORP.
Item 1. | |||||||||
Item 1A. | |||||||||
Item 1B. | |||||||||
Item 2. | |||||||||
| |||||||||
| 28 | ||||||||
| 28 | ||||||||
Item 4. | 30 | ||||||||
| Part II | |||||||||
Item 5. | |||||||||
| 31 | ||||||||
Item 6. | 34 | ||||||||
Item 7. | Management’s Discussion and Analysis of Financial Condition and Results of Operations | ||||||||
Item 7A. | |||||||||
Item 8. | |||||||||
Item 9. | Changes in and Disagreements | ||||||||
Item 9A. | |||||||||
Item 9B. | |||||||||
Item 10. | |||||||||
Item 11. | |||||||||
Item 12. | Security Ownership of Certain Beneficial Owners and Management and Related Stockholder Matters | ||||||||
Item 13. | Certain Relationships and Related Transactions, and Director Independence | ||||||||
Item 14. | |||||||||
Item 15. | |||||||||
Certain statements in this report may be considered forward-looking. Statements that are not historical or current facts, including statements about beliefs and expectations, are forward-looking statements. These forward-looking statements cover, among other things, statements made about general economic, political, regulatory, and market conditions, the investment banking and brokerage industries, our objectives and results, and also may include our belief regarding the effect of various legal proceedings, management expectations, our liquidity and funding sources, counterparty credit risk, or other similar matters. Forward-looking statements involve inherent risks and uncertainties, and important factors could cause actual results to differ materially from those anticipated, including those factors discussed below under “Risk Factors” in Item 1A as well as those discussed in “External Factors Impacting Our Business” included in “Management’s Discussion and Analysis of Financial Condition and Results of Operations” in Part II, Item 7 of this report.
Because of these and other uncertainties, our actual future results may be materially different from the results indicated by these forward-looking statements. In addition, our past results of operations do not necessarily indicate our future results. We undertake no obligation to publicly release any revisions to the forward-looking statements or reflect events or circumstances after the date of this document.
Stifel Financial Corp. is a Delaware corporation and a financial holding company headquartered in St. Louis. We were organized in 1983. Our principal subsidiary is Stifel, Nicolaus & Company, Incorporated (“Stifel Nicolaus”Stifel”), a full-service retail and institutional brokeragewealth management and investment banking firm. Stifel Nicolaus is the successor to a partnership founded in 1890. Our other subsidiaries include Century Securities Associates, Inc. (“CSA”), an independent contractor broker-dealer firm; Keefe, Bruyette & Woods, Inc. (“KBW”), Miller Buckfire & Co. LLC (“Miller Buckfire”), De La Rosa & Co. (“De La Rosa”), and Merchant Capital, LLC (“Merchant”), broker-dealer firms; Stifel Nicolaus Europe Limited (“SNEL”) and Oriel Securities (“Oriel”), our European subsidiary; Stifel Nicolaus Canada, Inc. (“SN Canada”), our registered Canadian broker-dealer subsidiary;subsidiaries; Stifel Bank & Trust (“Stifel Bank”), a retail and commercial bank; 1919 Investment Counsel & Trust Company, National Association (“1919 Investment Counsel”) and Stifel Trust Company, N.A.National Association (“Stifel Trust”)., our trust companies; and 1919 Investment Counsel, LLC (“1919”) and Ziegler Capital Management, LLC (“ZCM”), asset management firms. Unless the context requires otherwise, the terms “the Company,” “our company,” “we,” and “our,” as used herein, refer to Stifel Financial Corp. and its subsidiaries.
With our century-olda 125-year operating history, we have built a diversified business serving private clients, institutional investors, and investment banking clients located across the country. Our principal activities are:
Private client services, including securities transaction and financial planning services;
Institutional equity and fixed income sales, trading and research, and municipal finance;
Investment banking services, including mergers and acquisitions, public offerings, and private placements; and
Retail and commercial banking, including personal and commercial lending programs.
Our core philosophy is based upon a tradition of trust, understanding, and studied advice. We attract and retain experienced professionals by fostering a culture of entrepreneurial, long-term thinking. We provide our private, institutional, and corporate clients quality, personalized service, with the theory that if we place clients’ needs first, both our clients and our company will prosper. Our unwavering client and employee focus have earned us a reputation as one of the nation’s leading brokeragewealth management and investment banking firms off Wall Street.firms.
We have grown our business both organically and through opportunistic acquisitions. Over the past several years, we have grown substantially, primarily by completing and successfully integrating a number of acquisitions, including our acquisition of the capital markets business of Legg Mason (“LM Capital Markets”) from Citigroup in December 2005 and the following acquisitions:
Ryan Beck Holdings, Inc. (“Ryan Beck”) and its wholly owned broker-dealer subsidiary, Ryan Beck & Company, Inc. – On February 28, 2007, we closed on the acquisition of Ryan Beck, a full-service brokerage and investment banking firm with a strong private client focus, from BankAtlantic Bancorp, Inc.
First Service Financial Company (“First Service”) and its wholly owned subsidiary, FirstService Bank– On April 2, 2007, we completed our acquisition of First Service, and its wholly owned subsidiary FirstService Bank, a St. Louis-based Missouri commercial bank. Upon consummation of the acquisition, we became a bank holding company and a financial holding company, subject to the supervision and regulation of The Board of Governors of the Federal Reserve System. Also, FirstService Bank converted its charter from a Missouri bank to a Missouri trust company and changed its name to “StifelFirst Service now operates as Stifel Bank & Trust.”
Butler, Wick & Co., Inc. (“Butler Wick”)– On December 31, 2008, we closed on the acquisition of Butler Wick, a privately held broker-dealer which specialized in providing financial advice to individuals, municipalities, and corporate clients.
UBS Financial Services Inc. (“UBS”)– During the third and fourth quarters of 2009, we acquired 56 branches from the UBS Wealth Management Americas branch network.
Thomas Weisel Partners Group, Inc. (“TWPG”)– On July 1, 2010, we acquired TWPG, an investment bank focused principally on the growth sectors of the economy, which generated revenues from three principal sources:including technology and health care. This acquisition expanded our investment banking brokerage, and asset management. The investment banking group was comprisedpresence on the west coast of two primary categories of services: corporate finance and strategic advisory. The brokerage group provides equity sales and trading services to institutional investors and offers brokerage and advisory services to high net worth individuals and corporate clients. The asset management group consists of private investment funds, public equity investment products, and distribution management.
Stone & Youngberg LLC (“Stone & Youngberg”)– On October 1, 2011, we acquired Stone & Youngberg, a leading financial services firm specializing in municipal finance and fixed income securities. Stone & Youngberg’s comprehensive institutional group expanded our public finance, institutional sales and trading, and bond underwriting, particularly in the Arizona and California markets, and expanded our Private Client Group.
Miller Buckfire & Co. LLC (“Miller Buckfire”)– On December 20, 2012, we acquired Miller Buckfire, an investment banking firm. Miller Buckfire provides a full range of investment banking advisory services, including financial restructuring, mergers and acquisitions, and debt and equity placements.
KBW Inc. (“KBW”)– On February 15, 2013, we acquired KBW, an investment banking firm with a leading independent authorityfocus in the banking, insurance, brokerage, asset management, mortgage banking, real estate, and specialty finance sectors. KBW maintainedmaintains industry-leading positions in research, corporate finance, mergers and acquisitions, as well as sales and trading in equities and debt securities of financial services companies.
Business Segments
We operate in the following segments: Global Wealth Management, Institutional Group, and Other. For a discussion of the financial results of our segments, see Item 7, “Management’s Discussion and Analysis of Financial Condition and Results of Operations – Segment Analysis.”
Narrative descriptionDescription of businessBusiness
As of December 31, 2012,2014, we employed 5,343over 6,200 associates, including 2,0412,103 financial advisors, of which 151138 are independent contractors. As of December 31, 2012,2014, through our broker-dealer subsidiaries, we provide securities-related financial services to approximately 1.3over 1.5 million client accounts of customers from the United States Canada, and Europe. Our customers include individuals, corporations, municipalities, and institutions. Although weWe have customers throughout the United States, our major geographic area of concentration is the Midwest and Mid-Atlantic regions, with a growing presence in the Northeast, Southeast,United Kingdom and Western United States.Europe. No single client accounts for a material percentage of any segment of our business. Our inventory, which we believe is of modest size and intended to turn over quickly, exists to facilitate order flow and support the investment strategies of our clients. Although we do not engage in significant proprietary trading for our own account, the inventory of securities held to facilitate customer trades and our market-making activities are sensitive to market movements. Furthermore, our balance sheet is highly liquid, without material holdings of securities that are difficult to value or remarket. We believe that our broad platform, fee-based revenues, and strong distribution network position us well to take advantage of current trends within the financial services sector.
GLOBAL WEALTH MANAGEMENT
We provide securities transaction, brokerage, and investment services to our clients through the consolidated Stifel Nicolaus branch system and through CSA. We have made significant investments in personnel and technology to grow the Private Client Group over the past ten years.
Consolidated Stifel Nicolaus Branch System
At December 31, 2012,2014, the Private Client Group had a network of 1,8901,965 financial advisors located in 307329 branch offices in 45 states and the District of Columbia. In addition, we have 151138 independent contractors.
Our financial advisors provide a broad range of investments and services to our clients, including financial planning services to our clients.services. We offer equity securities; taxable and tax-exempt fixed income securities, including municipal, corporate, and government agency securities; preferred stock; and unit investment trusts. We also offer a broad range of externally managed fee-based products. In addition, we offer insurance and annuity products and investment company shares through agreements with numerous third-party distributors. We encourage our financial advisors to pursue the products and services that best fit their clients’ needs and that they feel most comfortable recommending. Our private clients may choose from a traditional, commission-based structure or fee-based money management programs. In most cases, commissions are charged for sales of investment products to clients based on an established commission schedule. In certain cases, varying discounts may be given based on relevant client or trade factors determined by the financial advisor.
Our independent contractors provide the same types of financial products and services to its private clients as does Stifel Nicolaus.Stifel. Under their contractual arrangements, these independent contractors may also provide accounting services, real estate brokerage, insurance, or other business activities for their own account. However, all securities transactions must be transacted through CSA. Independent contractors are responsible for all of their direct costs and are paid a larger percentage of commissions to compensate them for their added expenses. CSA is an introducing broker-dealer and, as such, clears its transactions through Stifel Nicolaus.Stifel.
Customer Financing
Client securities transactions are effected on either a cash or margin basis. When securities are purchased on a margin basis, the customer deposits less than the full cost of the security in their account. We make a loan to the customer for the balance of the purchase price. Such loans are collateralized by the purchased securities. The amounts of the loans are subject to the margin requirements of Regulation T of the Board of Governors of the Federal Reserve System, Financial Industry Regulatory Authority, Inc. (“FINRA”) margin requirements, and our internal policies, which usually are more restrictive than Regulation T or FINRA requirements. In permitting customers to purchase securities on margin, we are subject to the risk of a market decline, which could reduce the value of our collateral below the amount of the customers’ indebtedness.
We offer securities-based lending through Stifel Bank, which allows clients to borrow money against the value of qualifying securities for any suitable purpose other than purchasing, trading, or carrying marketable
securities or refinancing margin debt. The loan requirements are subject to Regulation U of the Board of Governors of the Federal Reserve System (“Regulation U”) and our internal policies, which are typically more restrictive than Regulation U. We establish approved lines and advance rates against qualifying securities and monitor limits daily and, pursuant to such guidelines, require customers to deposit additional collateral or reduce debt positions, when necessary. Factors considered in the review of securities-based lending are the amount of the loan, the degree of concentrated or restricted positions, and the overall evaluation of the portfolio to ensure proper diversification, or, in the case of concentrated positions, appropriate liquidity of the underlying collateral or potential hedging strategies. Underlying collateral for securities-based loans is reviewed with respect to the liquidity of the proposed collateral positions, valuation of securities, historic trading range, volatility analysis, and an evaluation of industry concentrations.
Asset Management
The Asset Management segment includes the operations of ZCM, 1919 Investment Counsel, and Stifel Trust. Our asset management business offers specialized investment management solutions for institutions, private clients and investment advisors. Revenues for this segment are primarily generated by the investment advisory fees related to asset management services provided for individual and institutional investment portfolios, along with mutual funds. Investment advisory fees are earned on assets held in managed or non-discretionary asset-based programs. These fees are computed based on balances either at the beginning of the quarter, the end of the quarter, or average daily assets. Consistent with industry practice, fees from private client investment portfolios are typically based on asset values at the beginning of the period while institutional fees are typically based on asset values at the end of the period. Asset balances are impacted by both the performance of the market and sales and redemptions of client accounts/funds. Rising markets have historically had a positive impact on investment advisory fee revenues as existing accounts increase in value, and individuals and institutions may commit incremental funds in rising markets. No single client accounts for a material percentage of this segment’s total business.
Stifel Bank
In April 2007, we completed the acquisition of First Service, a St. Louis-based full-service bank, which now operates as Stifel Bank & Trust and is reported in the Global Wealth Management segment. Since the closing of the bank acquisition, we have grown retail and commercial bank assets from $145.6 million on acquisition date to $3.7$5.2 billion at December 31, 2012.2014. Through Stifel Bank, we offer retail and commercial banking services to private and corporate clients, including personal loan programs, such as fixed and variable mortgage loans, home equity lines of credit, personal loans, loans secured by CDs or savings, and securities-based loans, as well as commercial lending programs, such as small business loans, commercial real estate loans, lines of credit, credit cards, term loans, and inventory and receivables financing, in addition to other banking products. We believe Stifel Bank not only helps us serve our private clients more effectively by offering them a broader range of services, but also enables us to better utilize our private client cash balances.balances held on deposit at Stifel Bank, which is its primary source of funding.
Stifel Trust
During 2011, we received approval from the Office of the Comptroller of the Currency (“OCC”) to form a trust company. Stifel Trust provides a wide range of trust, investment, agency and custodial services for our individual and corporate clients.
INSTITUTIONAL GROUP
The Institutional Group segment includes research, equity and fixed income institutional sales and trading, investment banking, public finance, and syndicate, and consisted of 1,134over 1,550 employees at December 31, 2012.2014.
Research
Our research department consisted of 207over 290 analysts and support associates who publish research across multiple industry groups and provide our clients with timely, insightful, and actionable research, aimed at improving investment performance.
Institutional Sales and Trading
Our equity sales and trading team distributes our proprietary equity research products and communicates our investment recommendations to our client base of institutional investors, executes equity trades, sells the securities of companies for which we act as an underwriter, and makes a market in domestic securities. In our various sales and trading activities, we take a focused approach on servicingto serving our clients by maintaining inventory to facilitate order flow and support the investment strategies of our institutional fixed income clients, as opposed to seeking trading profits through proprietary trading. Located in various cities in the United States as well as Geneva, Zurich, London, Madrid, Toronto and Calgary,Madrid, our equity sales and trading team, consisting of 199over 295 professionals and support associates, services approximately 2,000over 2,200 clients globally.
The fixed income institutional sales and trading group consists of 255approximately 350 professionals and support associates and is comprised of taxable and tax-exempt sales departments. Our institutional sales and trading group executes trades in both tax-exempt and taxable products, with diversification across municipal, corporate, government agency, and mortgage-backed securities.
Investment Banking
Our investment banking activities include the provision of financial advisory services principally with respect to mergers and acquisitions and the execution of public offerings and private placements of debt and equity securities. The investment banking group, consisting of 289over 400 professionals and support associates, focuses on middle-market companies as well as on larger companies in targeted industries where we have particular expertise, which include real estate, financial services, healthcare, aerospace/defense and government services, telecommunications, transportation, energy, business services, consumer services, industrial, technology, and education.
Our public finance group, consisting of 108 professionals and support staff, acts as an underwriter and dealer in bonds issued by states, cities, and other political subdivisions and acts as manager or participant in offerings managed by other firms.
Syndicate
Our syndicate department coordinates marketing, distribution, pricing, and stabilization of our managed equity and debt offerings. In addition, the department coordinates our underwriting participations and selling group opportunities managed by other investment banking firms.
Public Finance
Our public finance group, consisting of over 120 professionals and support staff, acts as an underwriter and dealer in bonds issued by states, cities, and other political subdivisions and acts as manager or participant in offerings managed by other firms.
OTHER SEGMENT
The Other segment includes interest income from stock borrow activities, unallocated interest expense, interest income and gains and losses from investments held, compensation expense associated with the deferred compensation plan modification,expensing of restricted stock awards with no continuing service requirements as a result of acquisitions completed during 2014, and all unallocated overhead cost associated with the execution of orders; processing of securities transactions; custody of client securities; receipt, identification, and delivery of funds and securities; compliance with regulatory and legal requirements; internal financial accounting and controls; and general administration and acquisition charges. At December 31, 2012,2014, we employed 694over 835 persons in this segment.
BUSINESS CONTINUITY
We have developed a business continuity plan that is designed to permit continued operation of business criticalbusiness-critical functions in the event of disruptions to our St. Louis, Missouri headquarters facility. Several critical business applications are supported by our outside vendors who maintain backup capabilities. We periodically participate in testing these backup facilities. Likewise, the business functions that we run internally can be supported without the St. Louis headquarters through a combination of redundant computer facilities in other east and west coast data centers and from certain branch locations that can connect to our third-party securities processing vendor through its primary or redundant facilities. Systems have been designed so that we can route mission-critical processing activity to alternate locations, which can be staffed with relocated personnel as appropriate.
GROWTH STRATEGY
We believe our strategy for growth will allow us to increase our revenues and to expand our role with clients as a valued partner. In executing our growth strategy, we take advantage of the consolidation among mid-tier firms, which we believe provides us opportunities in our private client and capital markets businesses. We do not create specific growth or business plans for any particular type of acquisition, focus on specific firms, or geographic expansion, nor do we establish quantitative goals, such as intended numbers of new hires or new office openings; however, our corporate philosophy has always been to be in a position to take advantage of opportunities as they arise. We intend to pursue the following strategies with discipline:
| • | Further expand our private client footprint in the U.S. We have expanded the number of our private client branches from 39 at December 31, 1997 to |
| • | Further expand our institutional |
| • | Grow our investment banking business. By leveraging our industry expertise, our product knowledge, our research platform, our experienced associates, our capital markets strength, our middle-market focus, and our private client network, we intend to grow our investment banking business. |
| • | Focus on asset generation within our Stifel Bank operations and offer retail and commercial banking services to our clients. We believe the banking services provided through Stifel Bank strengthens our existing client relationships and helps us recruit financial advisors seeking to provide a full range of services to their private clients. We intend to increase the sale of banking products and services to our private and corporate clients. |
| • | Establishment of Stifel |
| • | Approach acquisition opportunities with discipline. Over the course of our operating history, we have demonstrated our ability to identify, effect, and integrate attractive acquisition opportunities. We believe the current environment and market dislocation will provide us with the ability to thoughtfully consider acquisitions on an opportunistic basis. |
COMPETITION
We compete with other securities firms, some of which offer their customers a broader range of brokerage services, have substantially greater resources, and may have greater operating efficiencies. In addition, we face increasing competition from other financial institutions, such as commercial banks, online service providers, and other companies offering financial services. The Financial Modernization Act, signed into law in late 1999, lifted restrictions on banks and insurance companies, permitting them to provide financial services once dominated by securities firms. In addition, recent consolidation in the financial services industry may lead to increased competition from larger, more diversified organizations.
WeAs we enter our 125th year in business, we continue to rely on the expertise acquired in our market area, over our 122-year history, our personnel, and our equity capital to operate in the competitive environment.
REGULATION
Financial Holding Company Regulation
Under U.S. law, we are a bank holding company that has elected to be a financial holding company under the Bank Holding Company Act of 1956, as amended (“BHCA”). Consequently, our company and its business activities are subject to the supervision, examination, and regulation of the Federal Reserve Board. The BHCA and other federal laws subject bank and financial holding companies to particular restrictions on the types of activities in which they may engage and to a range of supervisory requirements and activities, including regulatory enforcement actions for violations of laws and regulations. Supervision and regulation of bank holding companies, financial holding companies, and their subsidiaries are intended primarily for the protection of depositors and other clients of banking subsidiaries, the deposit insurance fund of the Federal Deposit Insurance Corporation (“FDIC”), and the banking system as a whole, but not for the protection of stockholders or other creditors.
As a financial holding company, we are permittedpermitted: (1) to engage in other activities that the Federal Reserve Board, working with the Secretary of the Treasury, determines to be financial in nature, incidental to an activity that is financial in nature, or complementary to a financial activity and that do not pose a substantial risk to the safety and soundness of depository institutions or the financial system generally, or (2) to acquire shares of companies engaged in such activities. We may not, however, directly or indirectly acquire the ownership or control of more than 5% of any class of voting shares, or substantially all of the assets, of a bank holding company or a bank without the prior approval of the Federal Reserve Board.
In order to maintain our status as a financial holding company, we must remain “well capitalized” and “well managed” under applicable regulations. Failure to meet one or more of the requirements would mean, depending on the requirements not met, that we could not undertake new activities, make acquisitions other than those permitted generally for bank holding companies, or continue certain activities.
Subsidiary Regulation
The securities industry in the United States is subject to extensive regulation under federal and state laws. The Securities and Exchange Commission (“SEC”) is the federal agency charged with the administration of the federal securities laws. Much of the regulation of broker-dealers, however, has been delegated to self-regulatory organizations (“SRO”), principally FINRA and the Municipal Securities Rulemaking Board, and securities exchanges. SROs adopt rules (which are subject to approval by the SEC) that govern the industry and conduct periodic examinations of member broker-dealers. Securities firms are also subject to regulation by state securities commissions in the states in which they are registered. A number of changes have been proposed to the rules and regulations that govern our securities business, and other rules and regulations have been adopted, which may result in changes in the way we conduct our business.
As a result of federal and state registration and SRO memberships, broker-dealers are subject to overlapping schemes of regulation that cover all aspects of their securities businesses. Such regulations cover matters including capital requirements; uses and safekeeping of clients’ funds; conduct of directors, officers, and employees; recordkeeping and reporting requirements; supervisory and organizational procedures intended to ensure compliance with securities laws and to prevent improper trading on material nonpublic information; employee-related matters, including qualification and licensing of supervisory and sales personnel; limitations on extensions of credit in securities transactions; clearance and settlement procedures; requirements for the registration, underwriting, sale, and distribution of securities; and rules of the SROs designed to promote high standards of commercial honor and just and equitable principles of trade. A particular focus of the applicable regulations concerns the relationship between broker-dealers and their customers. As a result, many aspects of
the broker-dealer customer relationship are subject to regulation, including, in some instances, “suitability” determinations as to certain customer transactions, limitations on the amounts that may be charged to customers, timing of proprietary trading in relation to customers’ trades, and disclosures to customers.
Additional legislation, changes in rules promulgated by the SEC and by SROs, and changes in the interpretation or enforcement of existing laws and rules often directly affect the method of operation and profitability of broker-dealers. The SEC and the SROs conduct regular examinations of our broker-dealer subsidiaries and also initiate targeted and other specific inquiries from time to time, which generally include the investigation of issues involving substantial portions of the securities industry. The SEC and the SROs may conduct administrative proceedings, which can result in censures, fines, suspension, or expulsion of a broker-dealer, its officers, or employees. The principal purpose of regulation and discipline of broker-dealers is the protection of customers and the securities markets rather than the protection of creditors and stockholders of broker-dealers.
The SEC is the federal agency charged with administration of the federal securities laws. Financial services firms are also subject to regulation by state securities commissions in those states in which they conduct business. The SEC recently adopted amendments, most of which were effective October 2013, to its financial responsibility rules, including changes to the net capital rule, the customer protection rule, the record-keeping rules and the notification rules applicable to our broker-dealer subsidiaries. We continue to evaluate the impact of these amendments on our broker-dealer subsidiaries; however, based on our current analyses, we do not believe they will have a material adverse effect on any of our broker-dealer subsidiaries.
Our U.S. broker-dealer subsidiaries are required by federal lawsubject to belong tothe Securities Investor Protection Act and are members of Securities Investors Protection Corporation (“SIPC”). When, whose primary function is to provide financial protection for the customers of failing brokerage firms. SIPC fund falls belowprovides protection for customers up to $500,000, of which a certain amount, members are required to pay annual assessments to replenish the reserves. If SIPC fund levels become inadequate, certainmaximum of our domestic broker-dealer subsidiaries$250,000 may be required to pay a special assessment.in cash.
Stifel Bank is a Missouri StateFederal Reserve member Bank, its deposits are insured by the FDIC up to the maximum authorized limit, and it is subject to regulation by the FDIC,Federal Reserve Bank, as well as by the Missouri Division of Finance.
Several of our wholly owned subsidiaries, including Missouri Valley Partners, Choice Financial Partners, Inc., Thomas Weisel Capital Management LLC, Thomas Weisel Asset Management LLC, Timberline AssetMontibus Capital Management LLC, and Thomas Weisel Global Growth Partners LLC, ZCM, and 1919 Investment Counsel, are registered as investment advisers with the SEC and, therefore, are subject to its regulation and oversight.
Stifel Trust isand 1919 are subject to regulation by the OCC. This regulation focuses on, among other things, ensuring the safety and soundness of Stifel Trust’s fiduciary services.
Non-U.S. Regulation
Our non-U.S. subsidiaries are subject to theapplicable laws and regulatory authoritiesregulations of the jurisdictions in which they operate. SN Canada, our registered Canadian broker-dealer subsidiary, is subject to regulation by the securities commissions of Ontario, Quebec, Alberta, British Columbia, Manitoba, Saskatchewan, New Brunswick, and Nova Scotia; is a member of the Investment Industry Regulatory Organization of Canada (“IIROC”); and is a participating organization of the Toronto Stock Exchange, a member of the TSX Venture Exchange, and a dealer with the Canadian National Stock Exchange.
The financial services industry in Canada is subject to comprehensive regulation under both federal and provincial laws. Securities commissions have been established in all provinces and territorial jurisdictions which are charged with the administration of securities laws. Investment dealers in Canada are also subject to regulation by SROs, which are responsible for the enforcement of, and conformity with, securities legislation for their members and have been granted the powers to prescribe their own rules of conduct and financial requirements of members.
SN Canada is required by the IIROC to belong to the Canadian Investors Protection Fund (“CIPF”), whose primary role is investor protection. The CIPF Board of Directors determines the fund size required to meet its coverage obligations and sets a quarterly assessment rate. The CIPF provides protection for securities and cash held in client accounts. This coverage does not protect against market fluctuations.
Our European subsidiary,subsidiaries, SNEL, isOriel, and Oriel Asset Management LLP (“Oriel Asset Management”), are subject to the regulatory supervision and requirements of the Financial ServicesConduct Authority (“FSA”FCA”) in the United Kingdom, and several UK securitiesboth SNEL and futures exchanges, includingOriel are members of the London Stock Exchange. The FSAFCA exercises broad supervisory and disciplinary powers that include the power to temporarily or permanently revoke authorization to conduct a regulated business upon breach of the relevant regulations, suspend registered employees,approved persons, and impose censures and fines (where applicable) on both regulated businesses and their regulated employees.approved persons. SNEL operates a representative officeoffices in Geneva, Switzerland and Zurich, Switzerland, and has a branch office in Madrid, Spain through pass-porting the FSA license to these European locations.Spain. In addition to the FSA,FCA, these offices are subject to the local regulations of their respective jurisdictions.
The Dodd-Frank Act
On July 21,The financial services industry in the U.S. is subject to extensive regulation under federal and state laws. During our fiscal year 2010, the U.S. government enacted financial services reform legislation known as the Dodd-Frank Wall Street Reform and& Consumer Protection Act (“Dodd-Frank Act”) was signed into law. The Dodd-Frank Act will have a broad impact on. Because of the financial services industrynature of our business and will impose significant new regulatory and compliance requirements, including the designation of certain financial companies as systemically significant, the imposition of increased capital, leverage, and liquidity requirements, and numerous other provisions designed to improve supervision and oversight of, and strengthen safety and soundness within, the financial services sector. Additionally,our business practices, we presently do not expect the Dodd-Frank Act to have a significant direct impact on our operations as a whole. However, because some of the implementing regulations have yet to be adopted by various regulatory agencies, the specific impact on some of our businesses remains uncertain.
In July 2013, the OCC, the Federal Reserve Board, and the FDIC released final United States Basel III regulatory capital rules implementing the global regulatory capital reforms of Basel III and certain changes required by the Dodd-Frank Act. The rule increases the quantity and quality of regulatory capital, establishes a new frameworkcapital conservation buffer, and makes selected changes to the calculation of authorityrisk-weighted assets. The rule becomes effective for us on January 1, 2015, subject to conduct systemic risk oversight withina transition period for several aspects of the financial system to be distributed among new and existing federal regulatory agencies,rule, including the Financial Stability Oversight Council,new minimum capital ratio requirements, the capital conservation buffer, and the regulatory capital adjustments and deductions. Based on our current analyses, we believe that our company and Stifel Bank would meet all capital adequacy requirements under the final rules. However, the increased capital requirements could restrict our ability to grow during favorable market conditions or require us to raise additional capital. As a result, our business, results of operations, financial condition, or prospects could be adversely affected. See Item 1A, “Risk Factors,” within this Form 10-K for more information.
In December 2013, U.S. regulators issued final regulations to implement the Volcker Rule. The Volcker Rule will, over time, prohibit “banking entities,” including our company and its affiliates, from engaging in certain prohibited “proprietary trading” activities, as defined in the Volcker Rule, subject to exemptions for underwriting, market-making-related activities, risk-mitigating hedging, and certain other activities. The Volcker Rule will also require banking entities to either restructure or unwind certain investments and relationships with “covered funds,” as defined in the Volcker Rule. Banking entities have until July 21, 2015, to bring all of their activities into conformance with the Volcker Rule, and until July 21, 2016, to bring all of their investments into conformance with the Volcker Rule, in each case, subject to possible extensions. A review of the most recent collateral information for each of our CLO holdings revealed only six positions with an aggregate value of $73.0 million have bond holdings in the collateral pool. However, approximately $10.0 million would not be subject to the “covered funds” restriction due to the CLO employing Rule 3a-7 for exemption from the Investment Company Act. Thus, the aggregate total of CLO holdings with bonds in the collateral pool that could be subject to divestiture absent any action to achieve compliance with the Volker Rule is $63.0 million. We expect that some form of remedy will be forthcoming. The Volcker Rule requires banking entities to establish comprehensive compliance programs designed to help ensure and monitor compliance with restrictions under the Volcker Rule.
In July 2011, pursuant to the Dodd-Frank Act, the Consumer Financial Protection Bureau (“CFPB”) began operations and was given rulemaking authority for a wide range of consumer protection laws that would apply to all banks and provide broad powers to supervise and enforce consumer protection laws.
Banks with total assets of $10 billion or less remain subject to the supervisory oversight of their primary federal banking agencies (for us, the Federal Reserve Board, the OCC, and the FDIC.
The following items provide a brief descriptionOCC) for purposes of certain provisionscompliance with the federal consumer financial laws. However, the CFPB has rule-writing authority for these laws as they apply to all providers of consumer financial products and services. It also has backup enforcement authorities for entities supervised by the Dodd-Frank Act thatfederal banking agencies. Further, the CFPB frequently works with federal banking agencies, and new CFPB standards and “best practices” are most relevantlikely to our company.
|
|
|
|
|
Manybe adopted by federal banking regulators and ultimately impact smaller banks regardless of the requirements of the Dodd-Frank Act will be implemented pursuant to regulations over the course of several monthstheir size or years. Given the uncertainty associated with future regulatory actions, the full impact such requirements will have on our company’s operations is unclear. The changes resulting from the Dodd-Frank Act may impact our profitability, require changes to certain of our business practices, impose upon us more stringent capital, liquidity and leverage requirements, and could adversely affect certain of our company’s business activities. These changes may also require us to invest significant management attention and resources to evaluate and make any changes necessary to comply with new requirements.primary regulator.
Capital Requirements
Our company, as a bank and financial holding company, is subject to regulation, including capital requirements, by the Federal Reserve. Stifel Bank is subject to various regulatory capital requirements administered by the FDICFederal Reserve and state banking authorities.the Missouri Division of Finance. Failure to meet minimum capital requirements can initiate certain mandatory and possibly additional discretionary actions by regulators that, if undertaken, could have a direct material effect on our company’s and Stifel Bank’s financial statements. Under capital adequacy guidelines and the regulatory framework for prompt corrective action, our company and Stifel Bank must meet specific capital guidelines that involve quantitative measures of assets, liabilities, and certain off-balance-sheetoff-balance sheet items as calculated under regulatory accounting practices. Our company’s and Stifel Bank’s capital amounts and classification are also subject to qualitative judgments by the regulators about components, risk weightings, and other factors. Quantitative measures established by regulation to ensure capital adequacy require our company and Stifel Bank to maintain minimum amounts and ratios of total and Tier 1 capital (as defined in the regulations) to risk-weighted assets (as defined), and Tier 1 capital (as defined) to average assets (as defined).
Our broker-dealer subsidiaries are subject to the Uniform Net Capital Rule (Rule 15c3-1) promulgated by the SEC. The Uniform Net Capital Rule is designed to measure the general financial integrity and liquidity of a broker-dealer and the minimum net capital deemed necessary to meet the broker-dealer’s continuing commitments to its customers and other broker-dealers. Broker-dealers may be prohibited from expanding their business and declaring cash dividends. A broker-dealer that fails to comply with the Uniform Net Capital Rule may be subject to disciplinary actions by the SEC and SROs, such as FINRA, including censures, fines, suspension, or expulsion. Our non-U.S. subsidiaries are subject to regulatory supervision and requirements of the authorities of the jurisdictions in which they operate.
For further discussion of our net capital requirements, see Item 7, “Management’s Discussion and Analysis of Financial Condition and Results of Operations – Liquidity and Capital Resources.”
Public Company Regulation
As a public company whose common stock is listed on the New York Stock Exchange (“NYSE”) and the Chicago Stock Exchange (“CHX”), we are subject to corporate governance requirements established by the SEC, NYSE, and CHX, as well as federal and state law. Under the Sarbanes-Oxley Act of 2002 (the “Act”), we are required to meet certain requirements regarding business dealings with members of the Board of Directors, the structure of our Audit and Compensation Committees, ethical standards for our senior financial officers, implementation of an internal control structure and procedures for financial reporting, and additional responsibilities regarding financial statements for our Chief Executive Officer and Chief Financial Officer and their assessment of our internal controls over financial reporting. Compliance with all aspects of the Act, particularly the provisions related to management’s assessment of internal controls, has imposed additional costs on our company, reflecting internal staff and management time, as well as additional audit fees since the Act went into effect.
Executive Officers
Information regarding our executive officers and their ages as of February 22, 2013, are20, 2015, is as follows:
Name | Age | Position(s) | ||
Ronald J. Kruszewski | Co-Chairman of the Board of Directors | |||
Thomas W. Weisel | Co-Chairman of the Board of Directors | |||
James M. Zemlyak | ||||
| ||||
| ||||
| ||||
Richard J. Himelfarb | Vice Chairman, Senior Vice President, and Director | |||
Thomas B. Michaud | 50 | Senior Vice President | ||
Thomas P. Mulroy | 53 | President, Co-Director of | ||
Victor J. Nesi | 54 | President, Co-Director of Institutional Group, and Director | ||
Ben A. Plotkin | 59 | Vice Chairman, Senior Vice President, and Director | ||
David M. Minnick | Senior Vice President and General Counsel | |||
| Senior Vice President and
| |||
| Senior Vice President and
| |||
| ||||
David D. Sliney | Senior Vice President |
Ronald J. Kruszewski has been President, Chief Executive Officer, and Director of our company and Stifel Nicolaus since September 1997 and Chairman of the Board of Directors of our company and Stifel Nicolaus since April 2001. Prior thereto, Mr. Kruszewski served as Managing Director and Chief Financial Officer of Baird Financial Corporation and Managing Director of Robert W. Baird & Co. Incorporated, a securities broker-dealer firm, from 1993 to September 1997.
Thomas W. Weisel was elected Co-Chairman of the Board of Directors of our company in August 2010 after the completion of the merger between our company and Thomas Weisel Partners Group, Inc. Prior thereto, Mr. Weisel served as Chairman and CEO of Thomas Weisel Partners Group, Inc., a firm he founded, from 1998 to June 2010. Prior to founding Thomas Weisel Partners, Mr. Weisel was a founder, in 1971, of Robertson, Coleman, Siebel & Weisel that became Montgomery Securities in 1978, where he was Chairman and CEO until September 1998. Mr. Weisel served as a Board Member of the Stanford Endowment from 2001 to 2009 and as an Advisory Board Member of Harvard Business School from 2007 to 2009. Mr. Weisel served as a director on the NASDAQ Stock Market board of directors from 2002 to 2006.
James M. Zemlyak was named to the Office of the President in June 2014. Mr. Zemlyak has been Senior Vice President, Chief Financial Officer and Director of our Companycompany and Stifel Nicolaus since February 1999. Mr. Zemlyak served as our Company’scompany’s Treasurer from February 1999 to January 2012. Mr. Zemlyak has been Chief Operating Officer of Stifel Nicolaus since August 2002 and Executive Vice President of Stifel Nicolaus since December 1, 2005. Mr. Zemlyak also served as Chief Financial Officer of Stifel Nicolaus from February 1999 to October 2006. Prior to joining our company, Mr. Zemlyak served as Managing Director and Chief Financial Officer of Baird Financial Corporation from 1997 to 1999 and Senior Vice President and Chief Financial Officer of Robert W. Baird & Co. Incorporated from 1994 to 1999.
Bernard N. Burkemperwas named Senior Vice President and Treasurer of our Company in January 2012. Mr. Burkemper has been Controller of our Company since April 1991 and Chief Financial Officer of Stifel Nicolaus since October 2006.
S. Chad Estepwas named Senior Vice President of our Company in January 2012. Mr. Estep has been Chief Compliance Officer of Stifel Nicolaus since December 2005. Mr. Estep joined Stifel Nicolaus as the Director of Internal Audit in April 2005 following the Company’s acquisition of certain assets from PowellJohnson, Inc. where Mr. Estep served as the Controller from October 2002 to December 2004. Mr. Estep was employed by A.G. Edwards & Sons, Inc. from 2000 to 2001 where he worked as a Financial Advisor. Mr. Estep worked at J.C. Bradford & Co. as the Financial and Regulatory Reporting Manager from 1998 to 2000.
Richard J. Himelfarbhas served as Senior Vice President and Director of our company and Executive Vice President and Director of Stifel Nicolaus since December 2005. Mr. Himelfarb was designated Chairman of Investment Banking in July 2009. Prior to that, Mr. Himelfarb served as Executive Vice President and Director of Investment Banking from December 2005 through July 2009. Prior to joining our company, Mr. Himelfarb served as a director of Legg Mason, Inc. from November 1983 and Legg Mason Wood Walker, Inc. from January 2005. Mr. Himelfarb was elected Executive Vice President of Legg Mason and Legg Mason Wood Walker, Inc. in July 1995, having previously served as Senior Vice President from November 1983.
Thomas B. Michaudwas elected to the Board of Directors of our company in February 2013 after the completion of the merger between our company and KBW, Inc. Mr. Michaud serves as Senior Vice President of the Companyour company and Chairman, Chief Executive Officer, and President of Keefe, Bruyette & Woods, Inc., one of our broker-dealer subsidiaries, since February 15, 2013. Prior thereto, Mr. Michaud served as the Chief Executive Officer and President of KBW, Inc. since October 2011 and aas Vice Chairman and director since its formation in August 2005. He previously served as Chief Operating Officer from August 2005 until October 2011. From 1994 until 2001, he was an elected member of the Representative Town Meeting of the Town of Greenwich, Connecticut. The Representative Town Meeting is the legislative body for the Town of Greenwich. He is also a member of the Board of Advisors of the Greenwich Chapter of the American Red Cross, a member of the board of directors of the Foreign Policy Association, a non-profit organization, and serves on the Middlebury College Capital Campaign Committee.
David M. Minnick has served as Senior Vice President and General Counsel of our company and Stifel Nicolaus since October 2004. Prior thereto, Mr. Minnick served as Vice President and Counsel for A.G. Edwards & Sons, Inc. from August 2002 through October 2004, Senior Regional Attorney for NASD Regulation, Inc. from November 2000 through July 2002, as an attorney in private law practice from September 1998 through November 2000, and as General Counsel and Managing Director of Morgan Keegan & Company, Inc. from October 1990 through August 1998.
Thomas P. Mulroy was named to the Office of the President in June 2014. Mr. Mulroy has served as Senior Vice President andCo-Director of our Institutional Group since July 2009. Mr. Mulroy has served as Director of our company and Executive Vice President and Director of Stifel Nicolaus since December 2005. Mr. Mulroy was named Co-Director of our Institutional Group in July 2009. Prior to that, Mr. Mulroy served as Director of Equity Capital Markets from December 2005 through July 2009. Mr. Mulroy has responsibility for institutional equity sales, trading, and research. Prior to joining our company, Mr. Mulroy was elected Executive Vice President of Legg Mason, Inc. in July 2002 and of Legg Mason Wood Walker, Inc. in November 2000. Mr. Mulroy became a Senior Vice President of Legg Mason, Inc. in July 2000 and Legg Mason Wood Walker, Inc. in August 1998.
Victor J. Nesi was named to the Office of the President in June 2014. Mr. Nesi has served as Senior Vice President, Director of Investment Banking and Co-Director of our Institutional Group since July 2009. Mr. Nesi has served as Director of our company since August 2009. Mr. Nesi has responsibility for corporate finance investment banking activities and is Co-Director of our Capital Markets segment. Mr. Nesi has more than 20 years of banking and private equity experience, most recently with Merrill Lynch, where he headed the global private equity business for the telecommunications and media industry. From 2005 to 2007, he directed Merrill Lynch’s investment banking group for the Americas region. Prior to joining Merrill Lynch in 1996, Mr. Nesi spent seven years as an investment banker at Salomon Brothers and Goldman Sachs.
Ben A. Plotkin has been Vice Chairman, Senior Vice President, and Director of our company since August 2007 and Executive Vice President of Stifel Nicolaus since February 2007. Mr. Plotkin also served as Chairman and Chief Executive Officer of Ryan Beck & Company, Inc. from 1997 until its acquisition by our company in 2007. Mr. Plotkin was elected Executive Vice President of Ryan Beck in 1990. Mr. Plotkin became a Senior Vice President of Ryan Beck in 1989 and was appointed First Vice President of Ryan Beck in December of 1987. Mr. Plotkin joined Ryan Beck in May of 1987 as a Director and Vice President in the Investment Banking Division.
David M. Minnick has served as Senior Vice President and General Counsel of our company and Stifel since October 2004. Prior thereto, Mr. Minnick served as Vice President and Counsel for A.G. Edwards & Sons, Inc. from August 2002 through October 2004, Senior Regional Attorney for NASD Regulation, Inc. from November 2000 through July 2002, as an attorney in private law practice from September 1998 through November 2000, and as General Counsel and Managing Director of Morgan Keegan & Company, Inc. from October 1990 through August 1998.
Mark P. Fisher has served as Senior Vice President and General Counsel since May 2014. From July 2010 until May 2014, Mr. Fisher was Senior Vice President of our company. Mr. Fisher served as General Counsel of Thomas Weisel Partners Group, Inc. from May 2005 until the merger between our company and Thomas Weisel Partners Group, Inc. in July 2010. From January 1998 until May 2005, Mr. Fisher practiced corporate and securities law at Sullivan & Cromwell LLP.
S. Chad Estep was named Senior Vice President of our company in January 2012. Mr. Estep has been Chief Compliance Officer of Stifel since December 2005. Mr. Estep joined Stifel as the Director of Internal Audit in April 2005 following our company’s acquisition of certain assets from PowellJohnson, Inc., where Mr. Estep served as the Controller from October 2002 to December 2004. Mr. Estep was employed by A.G. Edwards & Sons, Inc. from 2000 to 2001, where he worked as a Financial Advisor. Mr. Estep worked at J.C. Bradford & Co. as the Financial and Regulatory Reporting Manager from 1998 to 2000.
James M. Marischenhas served as Senior Vice President and Chief Risk Officer of our company since January 2014. Mr. Marischen has also served as Executive Vice President and Chief Financial Officer of Stifel Bank & Trust since February 2008. Prior to joining our company in 2008, Mr. Marischen worked in public accounting at KPMG LLP.
David D. Sliney has been a Senior Vice President of our company since May 2003. In 1997, Mr. Sliney began a Strategic Planning and Finance role with Stifel Nicolaus and has served as a Director of Stifel Nicolaus since May 2003. Mr. Sliney is also responsible for our company’s Operations and Technology departments. Mr. Sliney joined Stifel Nicolaus in 1992, and between 1992 and 1995, Mr. Sliney worked as a fixed income trader and later assumed responsibility for the firm’s Equity Syndicate Department.
AVAILABLE INFORMATION
Our internet address iswww.stifel.com. We make available, free of charge, through a link to the SEC web site, annual reports on Form 10-K, quarterly reports on Form 10-Q, current reports on Form 8-K, and amendments to reports filed or furnished pursuant to Sections 13(a) and 15(d) of the Securities Exchange Act of 1934, as amended, as well as proxy statements, as soon as reasonably practicable after we electronically file such material with, or furnish it to, the SEC.
Additionally, we make available on our web site under “Investor Relations – Corporate Governance,” and in print upon request of any shareholder to our Chief Financial Officer, a number of our corporate governance documents. These include: Executive Committee charter, Audit Committee charter, Compensation Committee charter, Risk Management/Corporate Governance Committee charter, Corporate Governance Guidelines, Complaint Reporting Process, and the Code of Ethics for Employees. Within the time period required by the SEC and the NYSE, we will post on our web site any modifications to any of the available documents. The information on our websiteweb site is not incorporated by reference into this report. Our Chief Financial Officer can be contacted at Stifel Financial Corp., One Financial Plaza, 501 N.North Broadway, St. Louis, Missouri 63102, telephone: (314) 342-2000.
| ITEM 1A. | RISK FACTORS |
In addition to the other information set forth in this report, you should carefully consider the following factors which could materially affect our business, financial condition, or future results of operations. Although the risks described below are those that management believes are the most significant, these are not the only risks facing our company. Additional risks and uncertainties not currently known to us or that we currently do not deem to be material also may materially affect our business, financial condition, or future results of operations. We may amend or supplement these risk factors from time to time in other reports we file with the SEC.
RISKS RELATED TO OUR BUSINESS AND INDUSTRY
Damage to our reputation could damage our businesses.
Maintaining our reputation is critical to our attracting and maintaining customers, investors, and employees. If we fail to deal with, or appear to fail to deal with, various issues that may give rise to reputational risk, we could significantly harm our business prospects. These issues include, but are not limited to, any of the risks discussed in this Item 1A, appropriately dealing with potential conflicts of interest, legal and regulatory requirements, ethical issues, money laundering, privacy, record keeping, sales and trading practices, failure to sell securities we have underwritten at the anticipated price levels, and the proper identification of the legal, reputational, credit, liquidity, and market risks inherent in our products. A failure to deliver appropriate standards of service and quality, or a failure or perceived failure to treat customers and clients fairly, can result in customer dissatisfaction, litigation, and heightened regulatory scrutiny, all of which can lead to lost revenue, higher operating costs, and harm to our reputation. Further, negative publicity regarding us, whether or not true, may also result in harm to our prospects.
We are affected by difficult domestic and international macroeconomic conditions that impact the global financial markets.
We are engaged in various financial services businesses. As such, we are generally affected by domestic and international macroeconomic and political conditions, including levels of economic output, interest and inflation rates, employment levels, consumer confidence levels, and fiscal and monetary policy. These conditions may directly and indirectly impact a number of factors in the global financial markets that may be detrimental to our operating results, including the levels of trading, investing, and origination activity in the securities markets, security valuations, the absolute and relative level and volatility of interest and currency rates, real estate values, the actual and perceived quality of issuers and borrowers, and the supply of and demand for loans and deposits.
DuringAt times over the last fiveseveral years, we have experienced operating cycles during generally weak and uncertain U.S. and global economic conditions, including lowerlow levels of economic output, artificially maintained levels of historically low interest rates, relatively high rates of unemployment, and significant uncertainty with regards to fiscal and monetary policy both domestically and abroad. These conditions have led to several factors in the global financial markets that havefrom time to time negatively impacted our net revenue and profitability. While select factors indicate signs of improvement, significant uncertainty remains. A period of sustained downturns and/or volatility in the securities markets, further reductions toprolonged continuation of the generalartificially low level of short termshort-term interest rates, a return to increased dislocations in the credit markets, reductions in the value of real estate, and other
negative market factors maycould significantly impair our revenues and profitability. We maycould experience a decline in commission revenue from a lower volume of trades we execute for our clients, a decline in fees from reduced portfolio values of securities managed on behalf of our clients, a reduction in revenue from the number and size of transactions in which we provide underwriting, financial advisory, and other services, increased credit provisions and charge-offs, losses sustained from our customerscustomers’ and market participantsparticipants’ failure to fulfill their settlement obligations, reduced net interest earnings, and other losses. These periods of reduced revenue and other losses maycould be accompanied by periods of reduced profitability, because certain of our expenses, including but not limited to our interest expense on debt, rent, facilities, and salary expenses, are fixed, and our ability to reduce them over short periods of time is limited.
In August 2011, the credit rating agency Standard & Poor’s (“S&P”) lowered its long term sovereign credit rating on the U.S. from AAA to AA+, while maintaining a negative outlook. The downgrade reflected S&P’s view that an August 2011 agreement of U.S. lawmakers regarding the debt ceiling fell short of what would be necessary to stabilize the U.S. government’s medium term debt dynamics. The two other major credit rating agencies did not downgrade their previously issued U.S. sovereign credit ratings. We have specific concerns relating to future or furtherFuture downgrades of the U.S. sovereign credit rating by one or more of the major credit rating agencies that could have material adverse impacts on financial markets and economic conditions in the U.S.United States and throughout the world and, in turn, could have a material adverse effect on our business, financial
condition, and liquidity. Because of
Concerns about the unprecedented nature of any negative credit rating actions with respect to U.S. government obligations, the ultimate impacts on global markets and our business, financial condition and liquidity are unpredictable and may not be immediately apparent.
Additionally, the negative impact on economic conditions and global markets from further European Union’s (“EU”) sovereign debt matters could adversely affect our business, financial condition and liquidity. Concerns about the EU sovereign debt havein recent years has caused uncertainty and disruption for financial markets globally, and continuedglobally. Continued uncertainties loom over the outcome the EU’s financial support programs, and the possibility exists that other EU member states may experience similar financial troubles.troubles in the future. Any negative impact on economic conditions and global markets from further EU sovereign debt matters could adversely affect our business, financial condition, and liquidity.
Our businesses and earnings are affected by the fiscal and other policies adopted by various regulatory authorities of the U.S.,United States, non-U.S. governments, and international agencies. The Fed regulates the supply of money and credit in the U.S.United States. Fed policies determine, in large part, the cost of funds for lending and investing and the return earned on those loans and investments. The market impact from such policies can also materially decrease the value of certain of our financial assets, most notably debt securities. Changes in Fed policies are beyond our control, and consequently, the impact of these changes on our activities and results of our operations are difficult to predict.
U.S. state and local governments also continue to struggle with budget pressures caused by the recent recession,ongoing less than optimal economic environment and ongoing concerns regarding municipal issuer credit quality. If these trends continue or worsen, investor concerns could potentially reduce the number and size of transactions in which we participate and, in turn, reduce investment banking revenues. In addition, such factors could adversely affect the value of the municipal securities we hold in our trading securities portfolio.
Declines in the real estate market over the past few years, along with high foreclosure rates and prolonged high unemployment rates, resulted in significant write-downs of asset values by financial institutions, including government-sponsored entities as well as commercial and investment banks. These write-downs, initially of mortgage-backed securities but spreading to credit default swaps and other derivative securities, in turn caused many financial institutions to seek additional capital, to merge with larger and stronger institutions and, in some cases, to fail.
Lack of liquidity or access to capital could impair our business and financial condition.
Maintaining an appropriate level of liquidity, or the amount of capital that is readily available for investment, spending, or to meet our contractual obligations is essential to our business. Our inability to maintain adequate levels of capital in the form of cash and readily available access to the credit and capital markets could have a significant negative effect on our financial condition. If liquidity from our broker-dealerbrokerage or bank subsidiaries arebanking operations is inadequate or unavailable, we may be required to scale back or curtail our operations, including limiting our efforts to recruit additional financial advisors andor selling assets at prices that may be less favorable to us. Some potential conditions that could negatively affect our liquidity include the inability of our subsidiaries to generate cash in the form of dividends from earnings, changes imposed by regulators to our liquidity or capital requirements in our subsidiaries that may prevent the upstream of dividends in the form of cash to the parent company, limited or no accessibility to credit markets for secured and unsecured borrowings within our primary broker-dealer subsidiary, accessibility to credit markets for secured borrowing and diminished access to the capital markets at the parentfor our company, and other commitments or restrictions on capital as a result of adverse legal settlements, judgments, or regulatory sanctions.
The availability of outside financing, including access to the credit and capital markets, depends on a variety of factors, such as conditions in the debt and equity markets, the general availability of credit, the volume of securities trading activity, the overall availability of credit to the financial services sector, and our credit rating. Our cost and availability of funding may be adversely affected by illiquid credit markets and wider credit spreads. Additionally, lenders may from time to time curtail, or even cease to provide, funding to borrowers as a result of any future concerns about the stability of the markets generally and the strength of counterparties specifically.
If our credit rating was downgraded, or if rating agencies indicate that a downgrade may occur, our business, financial position, and results of operations could be adversely affected, perceptions of our financial strength could be damaged, and as a result, adversely affect our relationships with clients. Such a reduction in our
credit rating could also adversely affect our liquidity and competitive position, increase our incremental borrowing costs, limit our access to the capital markets, trigger obligations under certain financial agreements, or decrease the number of investors, clients, and counterparties willing or permitted to do business with or lend to us, thereby curtailing our business operations and reducing profitability. As such, we may not be able to successfully obtain additional outside financing to fund our operations on favorable terms, or at all.
The impact of a credit rating downgrade to a level below investment grade would result in our breaching provisions in our credit agreements, and may result in a request for immediate payment.Furthermore, as a bank holding company, we may become subject to a prohibition or to limitations on our ability to repurchase our stock. The Federal Reserve and the SEC (via FINRA) have the authority, and under certain circumstances the duty, to prohibit or to limit the payment of dividends by the subsidiaries to us for the subsidiaries they supervise.
See Item 7, “Management’s Discussion and Analysis of Financial Condition and Results of Operations—Operations – Liquidity and Capital Resources,” in this Form 10-K for additional information on liquidity and how we manage our liquidity risk.
We may experience difficulties, unexpected costs and delays in integrating the KBW businesses, business models and cultures and we may not realize synergies, efficiencies or cost savings from the merger.
The success of our company following the completion of the merger may depend in large part on the ability to integrate the two companies’ businesses, business models and cultures. In particular, investment banking businesses depend to a large degree on the efforts and performance of individual employees whose efforts and performance may be affected by any difficulties in the integration of the businesses. In the process of integration, we may experience difficulties, unanticipated costs and delays. The challenges involved in the integration may include:
the necessity of addressing possible differences in corporate cultures and management philosophies;
retaining personnel from different companies and integrating them into a new business culture while maintaining their focus on providing consistent, high-quality client service;
integrating information technology systems and resources;
integrating accounting systems and adjusting internal controls to cover KBW’s operations;
unforeseen expenses or delays associated with the transaction;
performance shortfalls at one or both of the companies as a result of the diversion of management’s attention to the transaction; and
meeting the expectations of clients with respect to the integration.
The integration of certain operations following the transaction will take time and will require the dedication of significant management resources, which may temporarily distract management’s attention from the ongoing businesses of our company. Employee uncertainty and lack of focus during the integration process may also disrupt the businesses of our company.
It is possible that the integration process could result in the loss of key employees, diversion of each company’s management’s attention, the disruption or interruption of, or the loss of momentum in, each company’s ongoing business or inconsistencies in standards, controls, procedures and policies, any of which could adversely affect our company’s ability to maintain relationships with clients and employees or the ability to achieve the anticipated benefits of the transaction, or could reduce our company’s earnings or otherwise adversely affect the business and financial results of our company. In addition, the integration process may strain our company’s financial and managerial controls and reporting systems and procedures. This may result in the diversion of management and financial resources from our core business objectives.
Even if we are able to integrate the businesses and operations successfully, there can be no assurance that this integration will result in any synergies, efficiencies or cost savings or that any of these benefits will be achieved within a specific time frame. Any of these factors could adversely affect our company’s business and results of operations.
We are exposed to market risk.
We are, directly and indirectly, affected by changes in market conditions. Market risk generally represents the risk that values of assets and liabilities or revenues will be adversely affected by changes in market conditions. For example, changes in interest rates could adversely affect our net interest spread, the difference between the yield we earn on our assets and the interest rate we pay for deposits and other sources of funding, which, in turn, impacts our net interest income and earnings. Changes in interest rates could affect the interest earned on assets differently than interest paid on liabilities. In our brokerage operations, a rising interest rate environment generally results in our earning a larger net interest spread. Conversely, in those operations, a falling interest rate environment generally results in our earning a smaller net interest spread. If we are unable to effectively manage our interest rate risk, changes in interest rates could have a material adverse effect on our profitability.
Market risk is inherent in the financial instruments associated with our operations and activities, including loans, deposits, securities, short-term borrowings, corporate debt, trading account assets and liabilities, and derivatives. Market conditions that change from time to time, thereby exposing us to market risk, include fluctuations in interest rates, equity prices, relative exchange rates, and price deterioration or changes in value due to changes in market perception or actual credit quality of an issuer.
In addition, disruptions in the liquidity or transparency of the financial markets may result in our inability to sell, syndicate, or realize the value of security positions, thereby leading to increased concentrations. The inability to reduce our positions in specific securities may not only increase the market and credit risks associated with such positions, but also increase the level of risk-weighted assets on our balance sheet, thereby increasing capital requirements, which could adversely affecthave an adverse effect on our profitability.business, results of operations, financial condition, and liquidity.
See Item 7A, “Quantitative and Qualitative Disclosures aboutAbout Market Risk,” in this Form 10-K for additional information regarding our exposure to and approaches to managing market risk.
We are exposed to credit risk.
We are generally exposed to the risk that third parties that owe us money, securities, or other assets do not meet their performance obligations due to bankruptcy, lack of liquidity, operational failure, or other reasons.
We actively buy and sell securities from and to clients and counterparties in the normal course of our broker-dealer businesses, exposing us to credit risk. Although generally collateralized by the underlying security to the transaction, we still face the risk associated with changes in the market value of collateral through settlement date. We also hold certain securities and derivatives in our trading accounts. Deterioration in the actual or perceived credit quality of the underlying issuers of securities, or the non-performance of issuers and counterparties to certain derivative contracts, could result in trading losses.
We borrow securities from, and lend securities to, other broker-dealers, and may also enter into agreements to repurchase and agreements to resell securities as part of investing and financing activities. A sharp change in the security market values utilized in these transactions may result in losses if counterparties to these transactions fail to honor their commitments.
We manage the risk associated with these transactions by establishing and monitoring credit limits and by monitoring collateral and transaction levels daily. A significant deterioration in the credit quality of one of our counterparties could lead to concerns in the market about the credit quality of other counterparties in the same industry, thereby exacerbating our credit risk exposure. We may require counterparties to deposit additional collateral or substitute collateral pledged. In the case of aged securities failed to receive, we may, under industry regulations, purchase the underlying securities in the market and seek reimbursement for any losses from the counterparty.
Also, we permit our clients to purchase securities on margin. During periods of steep declines in securities prices, the value of the collateral securing client margin loans may fall below the amount of the purchaser’s indebtedness. If the clients are unable to provide additional collateral for these margin loans, we may incur losses on those margin transactions. This may cause us to incur additional expenses defending or pursuing claims or litigation related to counterparty or client defaults.
We deposit our cash in depository institutions as a means of maintaining the liquidity necessary to meet our operating needs, and we also facilitate the deposit of cash awaiting investment in depository institutions on behalf of our clients. A failure of a depository institution to return these deposits could severely impact our operating liquidity, could result in significant reputational damage, and adversely impact our financial performance.
We also incur credit risk by lending to businesses and individuals, including but not limited to, C&Icommercial and industrial loans, commercial and residential mortgage loans, home equity lines of credit, and margin and non-purpose loans collateralized by securities. We incur credit risk through our investments, which include mortgage backedmortgage-backed securities, collateralized mortgage obligations, auction rate securities, and other municipal securities.
The credit quality of Stifel Bank’s loans and investment portfolios can have a significant impact on earnings and overall financial performance. Our credit risk and credit losses can increase if our loans or investments are concentrated among borrowers or issuers engaged in the same or similar activities, industries, geographies, or to borrowers or issuers who, as a group, may be uniquely or disproportionately affected by economic or market conditions. The deterioration of an individually large exposure, for example due to a natural disaster, act of terrorism, severe weather event, or economic event, could lead to additional loan loss provisions and/or charges-offs,charge-offs, or credit impairment of our investments, and subsequently have a material impact on our net income and regulatory capital.
Declines in the real estate market or sustained economic downturns may cause us to write down the value of some of the loans in Stifel Bank’s portfolio, foreclose on certain real estate properties, or write down the value of some of our available-for-sale securities portfolio. Credit quality generally may also be affected by adverse changes in the financial performance or condition of our debtors or deterioration in the strength of the U.S. economy.
See Item 7A, “Quantitative and Qualitative Disclosures aboutAbout Market Risk,” in this Form 10-K for additional information regarding our exposure to and approaches to managing credit risk.
Our business depends on fees earned from the management of client accounts by our primary broker-dealer and asset management subsidiaries.
We have grown our asset management business in recent years, including with the acquisitions of ZCM in 2013 and 1919 Investment Counsel in 2014, which has increased the risks associated with this business relative to our overall operations. Asset management fees are primarily comprised of base management fees. Management fees are primarily based on assets under management. Assets under management balances are impacted by net inflow/outflow of client assets and market values. Below-market investment performance by our funds and portfolio managers could result in a loss of managed accounts and could result in reputational damage that might make it more difficult to attract new investors and thus further impact our business and financial condition. If we were to experience the loss of managed accounts, our fee revenue would decline. In addition, in periods of declining market values, our asset values under management may resultantly decline, which would negatively impact our fee revenues.
Our underwriting, market-making, trading, and other business activities place our capital at risk.
We may incur losses and be subject to reputational harm to the extent that, for any reason, we are unable to sell securities whichthat we have underwritten at the anticipated price levels. As an underwriter, we also are subject to heightened standards regarding liability for material misstatements or omissions in prospectuses and other
offering documents relating to offerings we underwrite. As a market maker,market-maker, we may own positions in specific securities, and these undiversified holdings concentrate the risk of market fluctuations and may result in greater losses than would be the case if our holdings were more diversified. In addition, we may incur losses as a result of proprietary positions we hold.
From time to time and as part of our underwriting processes, we may carry significant positions in securities of a single issuer or issuers engaged in a specific industry. Sudden changes in the value of these positions could impact our financial results.
We have made and may continue to make principal investments in private equity funds and other illiquid investments, which are typically private limited partnership interests and securities that are not publicly traded. There is risk that we may be unable to realize our investment objectives by sale or other disposition at attractive prices or that we may otherwise be unable to complete a desirable exit strategy. In particular, these risks could arise from changes in the financial condition or prospects of the portfolio companies in which investments are made, changes in economic conditions, or changes in laws, regulations, fiscal policies, or political conditions. It could take a substantial period of time to identify attractive investment opportunities and then to realize the cash value of such investments through resale. Even if a private equity investment proves to be profitable, it may be several years or longer before any profits can be realized in cash.
The soundness of other financial institutions and intermediaries affects us.
We face the risk of operational failure, termination, or capacity constraints of any of the clearing agents, exchanges, clearing houses, or other financial intermediaries that we use to facilitate our securities transactions. As a result of the consolidation over the years among clearing agents, exchanges, and clearing houses, our exposure to certain financial intermediaries has increased and could affect our ability to find adequate and cost-effective alternatives should the need arise. Any failure, termination, or constraint of these intermediaries could adversely affect our ability to execute transactions, serviceserve our clients, and manage our exposure to risk.
Our ability to engage in routine trading and funding transactions could be adversely affected by the actions and commercial soundness of other financial institutions. Financial services institutions are interrelated as a result of trading, clearing, funding, counterparty, or other relationships. We have exposure to many different industries and counterparties, and we routinely execute transactions with counterparties in the financial industry, including brokers and dealers, commercial banks, investment banks, mutual and hedge funds, and other institutional clients. Furthermore, although we do not hold any EU sovereign debt, we may do business with and be exposed to financial institutions that have been affected by the recent EU sovereign debt crisis.circumstances. As a result, defaults by, or even rumors or questions about the financial condition of, one or more financial services institutions, or the financial services industry generally, have historically led to market-wide liquidity problems and could lead to losses or defaults by us or by other institutions. Many of these transactions expose us to credit risk in the event of default of our counterparty or client. In addition, our credit risk may be exacerbated when the collateral held by us cannot be realized or is liquidated at prices not sufficient to recover the full amount of the loan or derivative exposure due us. Although we have not suffered any material or significant losses as a result of the failure of any financial counterparty, any such losses in the future may materially adversely affecthave a material adverse effect on our results of operations.
We have experienced increased pricing pressures in areas of our business, which may impair our future revenue and profitability.
In recent years, ourOur business has experiencedcontinues to experience increased pricing pressures on trading margins and commissions in fixed income and equity trading. In the fixed income market, regulatory requirements have resulted in greater price transparency, leading to increased price competition and decreased trading margins. In the equity market, we have experienced increased pricing pressure from institutional clients to reduce commissions, and this pressure has been augmented by the increased use of electronic and direct market access trading, which has created additional competitive downward pressure on trading margins. We believe that price competition and pricing pressures in these and other areas will continue as institutional investors continue to reduce the amounts they are willing to pay, including by reducing the number of brokerage firms they use, and some of our competitors seek to obtain market share by reducing fees, commissions, or margins.
Growth of our business could increase costs and regulatory risks.
Integrating acquired businesses, providing a platform for new businesses, and partnering with other firms involve a number of risks and present financial, managerial, and operational challenges. We may incur significant expenses in connection with further expansion of our existing businesses, or recruitment of financial advisors, or in connection with strategic acquisitions or investments, if and to the extent they arise
from time to time. Our overall profitability would be negatively affected if investments and expenses associated with such growth are not matched or exceeded by the revenues that are derived from such investment or growth.
Expansion may also create a need for additional compliance, documentation, risk management, and internal controlscontrol procedures, and often involves the hiring of additional personnel to monitor such procedures. To the extent such procedures are not adequate to appropriately monitor any new or expanded business, we could be exposed to a material loss or regulatory sanction.
Moreover, to the extent we pursue strategic acquisitions, we may be unable to complete such acquisitions on acceptable terms, or be unable to successfully integrate the operations of any acquired business into our existing business. Such acquisitions could be of significant size and/or complexity. This effort, together with difficulties we may encounter in integrating an acquired business, could have an adverse affecteffect on our business, financial condition, and results of operations. In addition, we may need to raise equity capital or borrow to finance such acquisitions, which could dilute our shareholders or increase our leverage. Any such borrowings might not be available on terms as favorable to us as our current borrowings, or perhaps at all.
The rapid growth of Stifel Bank may expose us to increased operational risk, credit risk, and sensitivity to market interest rates along with increased regulation, examinations, and supervision by regulators.
We have experienced rapid growth in the investment portfolio, which includes available-for-sale and held-to-maturity securities, and the loan portfolio of Stifel Bank, which is funded by customer deposits. Although our stock-secured loans are collateralized by assets held in brokerage accounts, we are exposed to some credit and operational risk associated with these loans. We describe some of the integration-related operational risks associated with our recent acquisitions above, which includes many of the same risks related to the growth of Stifel Bank. With the increase in deposits and resulting liquidity, we have been able to expand our investment portfolio, primarily with government agency securities. In addition, Stifel Bank has significantly grown its mortgage banking business. Although we believe we have conservative underwriting policies in place, there are inherent risks associated with the mortgage banking business. For further discussion of our segments, including our Stifel Bank reporting unit, see Item 7, “Management’s Discussion and Analysis of Financial Condition and Results of Operations – Segment Analysis.”
As a result of the high percentage of our assets and liabilities that are in the form of interest-bearing or interest-related instruments, we are more sensitive to changes in interest rates, in the shape of the yield curve, or in relative spreads between market interest rates.
The monetary, tax, and other policies of the government and its agencies, including the Federal Reserve, have a significant impact on interest rates and overall financial market performance. An important function of the Federal Reserve is to regulate the national supply of bank credit and market interest rates. The actions of the Federal Reserve influence the rates of interest that we charge on loans and that we pay on borrowings and interest-bearing deposits, which may also affect the value of our on-balance sheet and off-balance sheet financial instruments. We cannot predict the nature or timing of future changes in monetary, tax, and other policies or the effect that they may have on our activities and results of operations.
In addition, Stifel Bank is heavily regulated at the state and federal level. This regulation is to protect depositors, federal deposit insurance funds, consumers, and the banking system as a whole, but not our stockholders.shareholders. Federal and state regulations can significantly restrict our businesses, and we are subject to various regulatory actions, which could include fines, penalties, or other sanctions for violations of laws and regulatory rules if we are ultimately found to be out of compliance.
We may experience losses associated with mortgage repurchases and indemnification obligations.
Through Stifel Bank, in the normal course of business, we originate residential mortgage loans and sell them to investors. We are subject to the inherent risk associated with selling mortgage loans in the secondary market. We may be required to repurchase mortgage loans that have been sold to investors in the event there are breaches of certain representations and warranties contained within the sales agreements. We may be required to repurchase mortgage loans that were sold to investors in the event that there was inadequate underwriting or fraud, or in the event that the loans become delinquent shortly after they are originated. We also may be required to indemnify certain purchasers and others against losses they incur in the event of breaches of representations
and warranties and in various other circumstances, and the amount of such losses could exceed the repurchase amount of the related loans. Consequently, we may be exposed to credit risk associated with sold loans. There is no assurance that any such losses would not materially and adversely affect our business, financial condition, and results of operations.
We face intense competition.
We are engaged in intensely competitive businesses. We compete on the basis of a number of factors, including the quality of our financial advisors and associates, our products and services, pricing (such as execution pricing and fee levels), location, and reputation in relevant markets. Over time, there has been substantial consolidation and convergence among companies in the financial services industry, which has significantly increased the capital base and geographic reach of our competitors. See the section entitled “Competition” of Item 1 of this Form 10-K for additional information about our competitors.
We compete directly with national full-service broker-dealers, investment banking firms, and commercial banks, and to a lesser extent, with discount brokers and dealers and investment advisors. In addition, we face competition from more recent entrants into the market and increased use of alternative sales channels by other firms. We also compete indirectly for investment assets with insurance companies, real estate firms, hedge funds, and others. This competition could cause our business to suffer.
To remain competitive, our future success also depends, in part, on our ability to develop and enhance our products and services. In addition, the continued development of internet, networking, or telecommunication technologies or other technological changes could require us to incur substantial expenditures to enhance or adapt our services or infrastructure. An inability to develop new products and services, or enhance existing offerings, could have a material adverse effect on our profitability.
Our ability to attract and retain qualified financial advisors and other associates is critical to the continued success of our business.
Our ability to develop and retain our client base depends on the reputation, judgment, business generation capabilities, and skills of our employees and financial advisors. As such, to compete effectively, we must attract, retain, and motivate qualified associates, including successful financial advisors, investment bankers, trading professionals, portfolio managers, and other revenue producingrevenue-producing or specialized personnel. Competitive pressures we experience could have an adverse affecteffect on our business, results of operations, financial condition, and liquidity.
We compete directly with national full service broker-dealers, investment banking firms, and commercial banks, and to a lesser extent, with discount brokers and dealers and investment advisors. In addition, we face competition from more recent entrants into the market and increased use of alternative sales channels by other firms. Domesticfull-domestic commercial banks and investment banking boutique firms that have entered the broker-dealer business, and large international banks are now serving our markets as well. Legislative and regulatory initiatives which eased what were at one time restrictions on the sales of securities and underwriting activities by commercial banks have increased competition. We also compete indirectly for investment assets with insurance companies, real estate firms, hedge funds, and others. This increased competition could cause our business to suffer.
Competition for personnel within the financial services industry is intense. The cost of retaining skilled professionals in the financial services industry has escalated considerably. Employers in the industry are increasingly offering guaranteed contracts, upfront payments, and increased compensation. These can be important factors in a current employee’s decision to leave us as well as a prospective employee’s decision to join us. As competition for skilled professionals in the industry remains intense, we may have to devote significantly moresignificant resources to attracting and retaining qualified personnel. In particular, our financial results may be adversely affected by the costs we incur in connection with any upfront loans or other incentives we may offer to newly recruited financial advisors.advisors and other key personnel.
Moreover, companies in our industry whose employees accept positions with competitors frequently claim that those competitors have engaged in unfair hiring practices. We have been subject to several such claims in the past and may be subject to additional claims in the future as we seek to hire qualified personnel, some of whom may currently be working for our competitors. Some of these claims may result in material litigation. We could incur substantial costs in defending ourselves against these claims, regardless of their merits. Such claims could also discourage potential employees who currently work for our competitors from joining us.
To remain competitive, our future success also depends in part on our ability to develop and enhance our products and services. In addition, the continued development of internet, networking or telecommunication technologies or other technological changes could require us to incur substantial expenditures to enhance or adapt our services or infrastructure. An inability to develop new products and services, or enhance existing offerings, could have a material adverse effect on our profitability.
We are exposed to operational risk.
Our diverse operations are exposedexpose us to risk of loss resulting from inadequate or failed internal processes, people, and systems external events, including technological or from external events.connectivity failures either at the exchanges in which we do business or between our data centers, operations processing sites, or our branches. Our businesses depend on our ability to process and monitor, on a daily basis, a large number of complex transactions across numerous and diverse markets. The inability of our systems to accommodate an increasing volume of transactions could also constrain our ability to expand our businesses. Our financial, accounting, data processing, or other operating systems and facilities may fail to operate properly or become disabled as a result of events that are wholly or partially beyond our control, adversely affecting our ability to process these transactions or provide these services. Operational risk exists in every activity, function, or unit of our
business, and can take the form of internal or external fraud, employment and hiring practices, an error in meeting a professional obligation, or failure to meet corporate fiduciary standards,standards. It is not always possible to deter employee misconduct, and the precautions we take to detect and prevent this activity may not be effective in all cases. If our employees engage in misconduct, our businesses would be adversely affected. Operational risk also exists in the event of business disruption, or system failures, andor failed transaction processing. Also, increasingThird parties with which we do business could also be a source of operational risk, including with respect to breakdowns or failures of the systems or misconduct by the employees of such parties. In addition, as we change processes or introduce new products and services, we may not fully appreciate or identify new operational risks that may arise from such changes. Increasing use of automated technology has the potential to amplify risks from manual or system processing errors, including outsourced operations.
WhileOur business contingency plan in place is intended to ensure we have the ability to recover our critical business contingencyfunctions and supporting assets, including staff and technology, in the event of a business interruption. Despite the diligence we have applied to the development and testing of our plans, in place,due to unforeseen factors, our ability to conduct business may, in any case, be adversely affected by a disruption involving physical site access, catastrophic events, including weather relatedweather-related events, events involving electrical, environmental, or communications malfunctions, as well as events impacting services provided by others that we rely upon which could impact our employees or third parties with whom we conduct business.
See Item 7A, “Quantitative and Qualitative Disclosures aboutAbout Market Risk,” in this Form 10-K for additional information regarding our exposure to and approaches to managing operational risk.
Our businesses depend on technology.
Our businesses rely extensively on electronic data processing and communications systems. In addition to better serving clients, the effective use of technology increases efficiency and enables us to reduce costs. Adapting or developing our technology systems to meet new regulatory requirements, client needs, and competitive demands is critical for our business. Introduction of new technology presents challenges on a regular basis. There are significant technical and financial costs and risks in the development of new or enhanced applications, including the risk that we might be unable to effectively use new technologies or adapt our applications to emerging industry standards.
Our continued success will depend,depends, in part, upon our ability to successfully maintain and upgrade the capability of our systems, our ability to address the needs of our clients by using technology to provide products and services that satisfy their demands, and our ability to retain skilled information technology employees. Failure of our systems, which could result from events beyond our control, or an inability to effectively upgrade those systems or implement new technology-driven products or services, could result in financial losses, liability to clients, violations of applicable privacy and damage to our reputation.other laws, and regulatory sanctions.
Customer, public, and regulatory expectations regarding operational and information security have increased. Thus, our operational systems and infrastructure must continue to be safeguarded and monitored for potential failures, disruptions, and breakdowns. Our operations rely on the secure processing, storage, and transmission of confidential and other information in our computer systems and networks. Although to-datecyber security incidents among financial services firms are on the rise, to date, we have not experienced any material losses relating to cyber attackscyber-attacks or other information security breaches,breaches; however, there can be no assurance that we will not suffer such losses in the future. Notwithstanding that we take protective measures and endeavor to modify them as circumstances warrant, our computer systems, software, and networks may be vulnerable to human error, natural disasters, power loss, spam attacks, unauthorized access, distributed denial of service attacks, computer viruses, and other malicious code and other events that could have a security impact. If one or more of these events occur, this could jeopardize our, or our clients’ or counterparties’, confidential and other information processed, stored in, and transmitted through our computer systems and networks, or otherwise cause interruptions or malfunctions in our, our clients’, our counterparties’, or third parties’ operations. We may be required to expend significant additional resources to modify our protective measures, to investigate and remediate vulnerabilities or other exposures, or to make required notifications, and we may be subject to litigation and financial losses that are either not insured or are not fully covered through any insurance we maintain. A technological breakdown could also interfere with our ability to comply with financial reporting and other regulatory requirements, exposing us to potential disciplinary action by regulators.
Extraordinary trading volumes beyond reasonably foreseeable spikes in volumes could cause our computer systems to operate at an unacceptably slow speed or even fail. While we have made investments to maintain the reliability and scalability of our systems and addedmaintain hardware to address extraordinary volumes, there
can be no assurance that our systems will be sufficient to handle truly extraordinary and unforeseen circumstances. Systems failures and delays could occur and could cause, among other things, unanticipated disruptions in service to our clients or slower system response time, resulting in transactions not being processed as quickly as our clients desire, decreased levels forresulting in client service and client satisfactions and harm to our reputation.dissatisfaction.
See Item 7A, “Quantitative and Qualitative Disclosures aboutAbout Market Risk,” in this Form 10-K for additional information regarding our exposure to and approaches to managing these types of operational risk.
We are subjectexposed to risks of legal proceedings, which may result in significant losses to us that we cannot recover. Claimants in these proceedings may be customers, employees, or regulatory agencies, among others, seeking damages for mistakes, errors, negligence, or acts of fraud by our employees.
Many aspects of our business involve substantial risks of liability, arising fromin the normal course of business. Participants in the financial services industry face an increasing amount of litigation and arbitration proceedings. Dissatisfied clients regularly make claims against broker-dealers and their employees for, among others, negligence, fraud, unauthorized trading, suitability, churning, failure to supervise, breach of fiduciary duty, employee errors, intentional misconduct, unauthorized transactions by financial advisors or traders, improper recruiting activity, and failures in the processing of securities transactions. The riskrisks associated with potential litigation often may be difficult to assess or quantify, and the existence and magnitude of potential claims often remain unknown for substantial periods of time.
These types of claims expose us to the risk of significant loss. Acts of fraud are difficult to detect and deter, and while we believe our supervisory procedures are reasonably designed to detect and prevent violations of applicable laws, rules, and regulations, we cannot assure investors that our risk management procedures and controls will prevent losses from fraudulent activity. In our role as underwriter and selling agent, we may be liable if there are material misstatements or omissions of material information in prospectuses and other communications regarding underwritten offerings of securities. At any point in time, the aggregate amount of existing claims against us could be material. While we do not expect the outcome of any existing claims against us to have a material adverse impact on our business, financial condition, or results of operations, we cannot assure you that these types of proceedings will not materially and adversely affect our company. We do not carry insurance that would cover payments regarding these liabilities, except for insurance against certain fraudulent acts of our employees. In addition, our bylaws provide for the indemnification of our officers, directors, and employees to the maximum extent permitted under Delaware law. In the future, we may be the subject of indemnification assertions under these documents by our officers, directors, or employees who have or may become defendants in litigation. These claims for indemnification may subject us to substantial risks of potential liability.
In highly volatile markets, the volume of claims and amount of damages sought in litigation and regulatory proceedings against financial institutions has historically increased. These risks include potential liability under securities or other laws for alleged materially false or misleading statements made in connection with securities offerings and other transactions, issues related to the suitability of our investment advice based on our clients’ investment objectives (including auction rate securities), the inability to sell or redeem securities in a timely manner during adverse market conditions, contractual issues, employment claims, and potential liability for other advice we provide to participants in strategic transactions. Substantial legal liability could have a material adverse financial effect or cause us significant reputational harm, which, in turn, could seriously harm our business and our prospects.
In addition to the foregoing financial costs and risks associated with potential liability, the costs of defending individual litigation and claims continue to increase.increase over time. The amount of outside attorneys’ fees incurred in connection with the defense of litigation and claims could be substantial and might materially and adversely affect our results of operations as such fees occur.operations.
See Item 3, “Legal Proceedings”Proceedings,” in this Form 10-K for a discussion of our legal matters and Item 7A, “Quantitative and Qualitative Disclosures aboutAbout Market Risk,” in this Form 10-K for a discussion regarding our approach to managing legal risk.
The preparation of the consolidated financial statements requires the use of estimates that may vary from actual results, and new accounting standards could adversely affect future reported results.
The preparation of the consolidated financial statements in conformity with U.S. generally accepted accounting principles (“GAAP”) requires management to make estimates and assumptions that affect the reported amounts of assets and liabilities, disclosure of contingent assets and liabilities at the date of the consolidated financial statements, and the reported amounts of revenues and expenses during the reporting period. Such estimates and assumptions may require management to make difficult, subjective, and complex judgments about matters that are inherently uncertain.
Our financial instruments, including certain trading assets and liabilities, available for saleavailable-for-sale securities, investments, including ARS,Auction Rate Securities (“ARS”), certain loans, intangible assets, and private equity investments, among other items, require management to make a determination of their fair value in order to prepare our consolidated financial statements. Where quoted market prices are not available, we may
make fair value determinations based on internally developed models or other means, which ultimately rely to some degree on our judgment. Some of these instruments and other assets and liabilities may have no direct observable inputs, making their valuation particularly subjective, being based on significant estimation and judgment. In addition, sudden illiquidity in markets or declines in prices of certain securities may make it more difficult to value certain items, which may lead to the possibility that such valuations will be subject to further change or adjustment and could lead to declines in our earnings in subsequent periods.
Our accounting policies and methods are fundamental to how we record and report our financial condition and results of operations. From time to time, the Financial Accounting Standards Board (“FASB”) and the SEC change the financial accounting and reporting standards that govern the preparation of our financial statements. In addition, accounting standard setters and those who interpret the accounting standards may change or even reverse their previous interpretations or positions on how these standards should be applied. These changes can be hard to predict and can materially impact how we record and report our financial condition and results of operations. In some cases, we could be required to apply a new or revised standard retroactively, resulting in our restating prior period financial statements. For a further discussion of some of our significant accounting policies and standards, see the “Critical Accounting Estimates” discussion within Item 7, and Note 2 of the Notes to Consolidated Financial Statements, in this Form 10-K.
Our risk management and conflicts of interest policies and procedures may leave us exposed to unidentified or unanticipated risk.
We seek to manage, monitor, and control our operational, legal, and regulatory risk through operational and compliance reporting systems, internal controls, management review processes, and other mechanisms; however, there can be no assurance that our procedures will be fully effective. Further, our risk management methods may not effectively predict future risk exposures, which could be significantly greater than the historical measures indicate. In addition, some of our risk management methods are based on an evaluation of information regarding markets, clients, and other matters that are based on assumptions that may no longer be accurate. A failure to adequately manage our growth, or to effectively manage our risk, could materially and adversely affect our business and financial condition. Our risk management processes include addressing potential conflicts of interest that arise in our business. We have procedures and controls in place to address conflicts of interest. Management of potential conflicts of interest has become increasingly complex as we expand our business activities through more numerous transactions, obligations, and interests with and among our clients. The failure to adequately address, or the perceived failure to adequately address, conflicts of interest could affect our reputation, the willingness of clients to transact business with us, or give rise to litigation or regulatory actions. Therefore, there can be no assurance that conflicts of interest will not arise in the future that could cause material harm to us.
For more information on how we monitor and manage market and certain other risks, see Item 7A, “Quantitative and Qualitative Disclosures aboutAbout Market Risk,” in this Form 10-K.
We are exposed to risk from international markets.
We do business in other parts of the world and, as a result, are exposed to a number of risks, including economic, market, litigation, and regulatory risks, in non-U.S. markets. Our businesses and revenues derived from non-U.S. operations are subject to risk of loss from currency fluctuations, social or political instability, changes in governmental policies or policies of central banks, downgrades in the credit ratings of sovereign countries, expropriation, nationalization, confiscation of assets, and unfavorable legislative and political developments. Action or inaction in any of these operations, including failure to follow proper practices with respect to regulatory compliance and/or corporate governance, could harm our operations and/or our reputation. We also invest or trade in the securities of corporations located in non-U.S. jurisdictions. Revenues from the trading of non-U.S. securities also may be subject to negative fluctuations as a result of the above factors. The impact of these fluctuations could be magnified, because generally non-U.S. trading markets are smaller, less liquid, and more volatile than U.S. trading markets. Additionally, a political, economic, or financial disruption in a country or region could adversely impact our business and increase volatility in financial markets generally.
RISKS RELATED TO OUR REGULATORY ENVIRONMENT
Changes in regulations resulting from either the Dodd-Frank actAct or any new regulations may affect our businesses.
The market and economic conditions over the past fewseveral years have led to legislation and numerous and continuing proposals for changes in the regulation of the financial services industry, including significant additional legislation and regulation in the U.S. and abroad. The Dodd-Frank Act enacted sweeping changes in the supervision and regulation of the financial industry designed to provide for greater oversight of financial
industry participants, reduce risk in banking practices and in securities and derivatives trading, enhance public company corporate governance practices and executive compensation disclosures, and provide for greater protections to individual consumers and investors. Certain elements of the Dodd-Frank Act became effective immediately, while the details of manysome provisions areremain subject to additional studies and final rule writingimplementing regulations that are yet to be adopted by various applicable regulatory agencies. The ultimate impact that the Dodd-Frank Act will have on us, the financial industry, and the economy cannot be known until all such rules andimplementing regulations called for under the Dodd—FrankDodd-Frank Act have been finalized and implemented.
The Dodd-Frank Act may impact the manner in which we market our products and services, manage our business and its operations and interact with regulators, all of which, while not currently anticipated to, could materially impact our results of operations, financial condition, and liquidity. Certain provisions of the Dodd-Frank Act that have or may impact our business include, but are not limited to: the establishment of a fiduciary standard for broker-dealers, regulatory oversight of incentive compensation, the imposition of capital requirements on financial holding companies, and to a lesser extent, greater oversight over derivatives trading and restrictions on proprietary trading. There is also increased regulatory scrutiny (and related compliance costs) as we continue to grow and surpass certain thresholds outlined in the Dodd-Frank Act. These include but are not limited to Stifel Bank’s oversight by the CFPB.
Additionally, we are closely monitoring regulatory developments related to the “Volcker Rule.” Until the final regulations underIn addition, the Volcker Rule are adopted,provision of the precise definition of prohibited “proprietary trading”, the scope of any exceptions for market making and hedging, and the scope of permitted hedge fund and private equity fund activities remains uncertain. It is unclear under the proposed rules whether some portionDodd-Frank Act will have an impact on us, including potentially limiting various aspects of our market-making and risk mitigationbusiness. We are continuing our review of activities as currently conducted, will be required to be curtailed or will be otherwise adversely affected. In addition, the rules, if enacted as proposed, would prohibit certain securitization structures and would bar U.S. banking entities from sponsoring or investing in certain non-U.S. funds. Also, with respect to certain of our investments in illiquid private equity funds, should regulators not exercise their authority to permit us to hold such investments beyond the minimum statutory divestment period, we could incur substantial losses when we dispose of such investments, as wethat may be forcedaffected by the Volcker Rule, including our trading operations and asset management activities, and are taking steps to sell such investments at a substantial discount inestablish the secondary market as a result of both the constrained timing of such sales and the possibility that other financial institutions are likewise liquidating their investments at the same time. When the regulations are final, we will be in a positionnecessary compliance programs to complete a review of our relevant activities to make plans to implement compliancecomply with the Volcker Rule. Given the complexity of the new framework, the full impact of the Volcker Rule whichis still uncertain, and will likely not require full conformance until July 2014, subject to extensions. See Item 1, Business – Regulation,”ultimately depend on the interpretation and implementation by the five regulatory agencies responsible for additional information on how the Dodd-Frank Act may impact our company.its oversight.
To the extent the Dodd-Frank Act impacts the operations, financial condition, liquidity, and capital requirements of unaffiliated financial institutions with whom we transact business, those institutions may seek to pass on increased costs, reduce their capacity to transact, or otherwise present inefficiencies in their interactions with us.
A numberThe SEC adopted amendments, most of which were effective March 2014, to its financial responsibility rules, including changes have been proposed to the net capital rule, the customer protection rule, the record-keeping rules, and regulations that governthe notification rules applicable to our securities business,broker-dealer subsidiaries. These amended rules do not have a material adverse effect on any of our broker-dealer subsidiaries.
The Basel III capital standards will impose additional capital and other requirements on us that could decrease our competitiveness and profitability.
In July 2013, the OCC, the FRB, and the FDIC released final U.S. Basel III regulatory capital rules implementing the global regulatory capital reforms of Basel III and regulations have been adopted, which may result incertain changes inrequired by the way in whichDodd-Frank Act. The rule increases the quantity and quality of regulatory capital, establishes a capital conservation buffer, and makes selected changes to the calculation of risk-weighted assets. The rule became effective for us January 1, 2015, subject to a transition period for several aspects of the rule, including the new minimum capital ratio requirements, the capital conservation buffer, and the regulatory capital adjustments and deductions. Based on our current analyses, we conductbelieve that our business. These legislativecompany and regulatory initiativesStifel Bank would meet all capital adequacy requirements under the final rules. However, the increased capital requirements could restrict our ability to grow during favorable market conditions or require us to change certain of our business practices, imposeraise additional costs on us, limit the products that we offer,capital. As a result, in a loss of revenue, limit our competitiveness or our ability to pursue business opportunities, cause business disruptions, impact the value of assets that we hold, or otherwise adversely affect our business, results of operations, financial condition, or financial condition. The long-term impact of these initiatives on our business practices and revenues will depend upon the successful implementation of our strategies and competitors’ responses to such initiatives, all of which are difficult to predict. In addition, adverse publicity and damage to our reputation arising from the failure or perceived failureprospects could be adversely affected.
Failure to comply with legal, regulatory capital requirements primarily applicable to our company, Stifel Bank, or contractualour broker-dealer subsidiaries would significantly harm our business.
Our company and Stifel Bank are subject to various regulatory and capital requirements administered by the federal banking regulators. Under capital adequacy guidelines and the regulatory framework for prompt corrective action, our company and Stifel Bank must meet specific capital guidelines that involve quantitative measures of our company and Stifel Bank’s assets, liabilities, and certain off-balance sheet items as calculated under regulatory accounting practices. Our company’s and Stifel Bank’s capital amounts and classification are also subject to qualitative judgments by the regulators about components of our capital, risk weightings of assets, off-balance sheet transactions, and other factors. Quantitative measures established by regulation to ensure capital adequacy require our company and Stifel Bank to maintain minimum amounts and ratios of Total and Tier I Capital to risk-weighted assets and Tier I Capital to adjusted assets (as defined in the regulations). Failure to meet minimum capital requirements can trigger certain mandatory and possibly additional discretionary actions by regulators that, if undertaken, could affectharm either our company or Stifel Bank’s operations and our financial condition.
Additionally, as a holding company, we depend on dividends, distributions, and other payments from our subsidiaries to fund payments of our obligations, including, among others, debt service. We are subject to the SEC’s uniform net capital rule (Rule 15c3-1) and the net capital rule of FINRA, which may limit our ability to attractmake withdrawals of capital from our broker-dealer subsidiaries. The uniform net capital rule sets the minimum level of net capital a broker-dealer must maintain and retain clients.also requires that a portion of its assets be relatively liquid. FINRA may prohibit a member firm from expanding its business or paying cash dividends if resulting net capital falls below its requirements. Regulatory capital requirements applicable to some of our significant subsidiaries may impede access to funds our company needs to make payments on any such obligations.
See Note 20 of the Notes to Consolidated Financial Statements in this Form 10-K for further information on regulations and capital requirements.
We operate in a highly regulated industry in which future developments could adversely affect our business and financial condition.
The securities industry is subject to extensive regulation, and broker-dealers and investment advisors are subject to regulations covering all aspects of the securities business, including but not limited to, sales and trading methods, trade practices among broker-dealers, use and safekeeping of customers’ funds and securities, capital structure of securities firms, anti-money laundering efforts, record keeping, and the conduct of directors, officers, and employees. If laws or regulations are violated, we could be subject to one or more of the following: civil liability, criminal liability, sanctions which could include the revocation of our subsidiaries’ registrations as investment advisors or broker-dealers, the revocation of the licenses of our financial advisors, censures, fines, or a temporary suspension or permanent bar from conducting business. Any of those events could have a material adverse effect on our business, financial condition, and prospects.
We are subject to financial holding company regulatory reporting requirements, including the maintenance of certain risk-based regulatory capital levels that could impact various capital allocation decisions of one or more of our businesses. However, due to our strong current capital position, we do not anticipate that these capital level requirements will have any negative impact on our future business activities. See the section entitled “Business – Regulation” of Item 1 of this Form 10-K for additional information.
As a financial holding company, we are regulated by the Federal Reserve. Stifel Bank is also regulated by the FDIC.Federal Reserve and the Missouri Division of Finance. This oversight includes, but is not limited to, scrutiny with respect to affiliate transactions and compliance with consumer regulations. The economic and political environment over the past several years has caused increased focus on the regulation of the financial services industry, including many proposals for new rules. Any new rules issued by our regulators could affect us in substantial and unpredictable ways and could have an adverse effect on our business, financial condition, and results of operations. We also may be adversely affected as a result of changes in federal, state, or foreign tax laws, or by changes in the interpretation or enforcement of existing laws and regulations.
The SEC has proposed certain measures that would establish a new framework to replace the requirements of Rule 12b-1 under the Investment Company Act of 1940 with respect to how mutual funds collect and pay fees to cover the costs of selling and marketing their shares. Any adoption of such measures would be phased in over a number of years. These measures are neither final nor undergoing implementation throughout the financial services industry. The impact of changes such as those currently proposed cannot be predicted at this time. As this regulatory trend continues, it could adversely affect our operations and, in turn, our financial results.
Industry-wide, many asset management businesses have recently experienced a number of highly publicized regulatory inquiries, which have resulted in increased scrutiny within the industry and new rules and regulations for mutual funds, investment advisors, and broker-dealers. Some of our wholly owned subsidiaries are registered as an investment advisor with the SEC, and the regulatory scrutiny and rulemaking initiatives may result in an increase in operational and compliance costs or the assessment of significant fines or penalties against our asset management business, and may otherwise limit our ability to engage in certain activities. It is very difficult to determine the extent of the impact of any new laws, regulations, or initiatives that may be proposed, or whether any of the proposals will become law. Compliance with any new laws or regulations could make compliance more difficult and expensive and affect the manner in which we conduct business. Pursuant to the Dodd-Frank Act, the SEC was charged with considering whether broker-dealers should be subject to a standard of care similar to the fiduciary standard applicable to registered investment advisors. It is not clear whether the SEC will determine that a heightened standard of conduct should be applicable to broker-dealers; however, any such standard, if mandated, would likely require us to review our product and service offerings and result in changes to these, and require that we incur additional regulatory costs in order to ensure compliance.
See the section entitled “Business—“Business – Regulation” within Item 1 of this Form 10-K for additional information regarding our regulatory environment and Item 7A, “Quantitative and Qualitative Disclosures aboutAbout Market Risk,” in this Form 10-K regarding our approaches to managing regulatory risk. Regulatory actions brought against us may result in judgments, settlements, fines, penalties, or other results adverse to us, which could have a material adverse affecteffect on our business, financial condition, or results of operation.operations.
Failure to comply with regulatory capital requirements would significantly harm our business.
We are subject to the SEC’s uniform net capital rule (Rule 15c3-1) and the net capital rule of FINRA, which may limit our ability to make withdrawals of capital from our broker-dealer subsidiaries. The uniform net capital rule sets the minimum level of net capital a broker-dealer must maintain and also requires that a portion of its assets be relatively liquid. FINRA may prohibit a member firm from expanding its business or paying cash dividends if resulting net capital falls below its requirements. In addition, our Canada based broker-dealer subsidiary is subject to similar limitations under applicable regulation in that jurisdiction.
Our company and its bank subsidiary are subject to various regulatory and capital requirements administered by the federal banking regulators. Under capital adequacy guidelines and the regulatory framework for prompt corrective action, our company and its bank subsidiary must meet specific capital guidelines that involve quantitative measures of their assets, liabilities, and certain off-balance sheet items as calculated under regulatory accounting practices. Our company’s and its bank subsidiary’s capital amounts and classification are also subject to qualitative judgments by the regulators about components of our capital, risk weightings of assets, off-balance sheet transactions, and other factors. Quantitative measures established by regulation to ensure capital adequacy require our company and its bank subsidiary to maintain minimum amounts and ratios of Total and Tier I Capital to risk-weighted assets and Tier I Capital to adjusted assets (as defined in the regulations). Failure to meet minimum capital requirements can trigger certain mandatory and possibly additional discretionary, actions by regulators that, if undertaken, could harm operations and our financial condition.
Additionally, as a holding company, we depend on dividends, distributions and other payments from our subsidiaries to fund payments of our obligations including, among others, debt service. Regulatory capital requirements applicable to some of our significant subsidiaries may impede access to funds the holding company needs to make payments on any such obligations.
See Note 20 of the Notes to Consolidated Financial Statements in this Form 10-K for further information on regulations and capital requirements.
RISKS RELATED TO OUR COMMON STOCK
The market price of our common stock may continue to be volatile.
The market price of our common stock has been, and is likely to continue to be, volatile and subject to fluctuations. Stocks of financial institutions have, from time to time, experienced significant downward pressure in connection with economic conditions or events and may again experience such pressures in the future. Changes in the stock market generally or as it concerns our industry, as well as geopolitical, economic, and business factors unrelated to us, may also affect our stock price. Significant declines in the market price of our common stock or failure of the market price to increase could harm our ability to recruit and retain key employees, including those who have joined us from companies we have acquired, reduce our access to debt or equity capital, and otherwise harm our business or financial condition. In addition, we may not be able to use our common stock effectively as consideration in connection with future acquisitions.
Our current shareholders may experience dilution in their holdings if we issue additional shares of common stock as a result of future offerings or acquisitions where we use our common stock.
As part of our business strategy, we may seek opportunities for growth through strategic acquisitions in which we may consider issuing equity securities as part of the consideration. Additionally, we may obtain additional capital through the public sale of debt or equity securities. If we sell equity securities, the value of our common stock could experience dilution. Furthermore, these securities could have rights, preferences, and privileges more favorable than those of the common stock. Moreover, if we issue additional shares of common stock in connection with equity compensation, future acquisitions, or as a result of financing, an investor’s ownership interest in our company will be diluted.
The issuance of any additional shares of common stock or securities convertible into or exchangeable for common stock or that represent the right to receive common stock, or the exercise of such securities, could be substantially dilutive to holders of our common stock. Holders of our shares of common stock have no preemptive rights that entitle holders to purchase their pro rata share of any offering of shares of any class or series, and therefore, such sales or offerings could result in increased dilution to our shareholders. The market price of our common stock could decline as a result of sales or issuance of shares of our common stock or securities convertible into or exchangeable for common stock.
Provisions in our certificate of incorporation and bylaws and of Delaware law may prevent or delay an acquisition of our company, which could decrease the market value of our common stock.
Our articles of incorporation and bylaws and Delaware law contain provisions that are intended to deter abusive takeover tactics by making them unacceptably expensive to prospective acquirors and to encourage
prospective acquirors to negotiate with our board of directors rather than to attempt a hostile takeover. Delaware law also imposes some restrictions on mergers and other business combinations between us and any holder of 15% or more of our outstanding common stock. We believe these provisions protect our stockholdersshareholders from coercive or otherwise unfair takeover tactics by requiring potential acquirors to negotiate with our board of directors and by providing our board of directors with more time to assess any acquisition proposal. These provisions are not intended to make our company immune from takeovers. However, these provisions apply even if the offer may be considered beneficial by some stockholdersshareholders and could delay or prevent an acquisition that our board of directors determines is not in the best interests of our company and our stockholders.shareholders.
ITEM 1B. UNRESOLVED STAFF COMMENTS
None.
The following table sets forth the location, approximate square footage, and use of each of the principal properties used by our company during the year ended December 31, 2012.2014. We own our executive offices in St. Louis, Missouri. We lease or sublease a majority of these properties under operating leases. Such leases expire at various times through 2022. We have multiple sublease arrangements for approximately 20,000 square feet of office space in San Francisco, California, the terms of which expire at various times through 2015.2026.
Location | Approximate Square Footage | Use | ||||
St. Louis, Missouri | 434,000 | Headquarters and administrative offices of Stifel, | ||||
New York, New York | Global Wealth Management and Institutional Group | |||||
Baltimore, Maryland | Institutional Group operations and Administrative | |||||
Chicago, Illinois | 82,500 | Global Wealth Management and Institutional Group operations | ||||
San Francisco, California | Global Wealth Management and Institutional Group | |||||
Florham Park, New Jersey | Global Wealth Management and Institutional Group | |||||
| ||||||
|
We also maintain operations in 340367 leased offices in various locations throughout the United States and in certain foreign countries, primarily for our broker-dealer business. We lease 307329 private client offices, which are primarily concentrated in the Midwest and Mid-Atlantic regions with a growing presence in the Northeast, Southeast, and Western United States.offices. In addition, Stifel Bank leases several locationsone location for its administrative offices and operations. Our Institutional Group segment leases 3237 offices in the United States and certain foreign locations. We believe that, at the present time, the space available to us in the facilities under our current leases and co-location arrangements are suitable and adequate to meet our needs and that such facilities have sufficient productive capacity and are appropriately utilized.
Leases for the branch offices of CSA, our independent contractor firm, are the responsibility of the respective independent financial advisors. The Geneva and Madrid Institutional Group branch offices are the responsibility of the respective consultancies associated with SNEL.
See Note 18 of the Notes to Consolidated Financial Statements for further information regarding our lease obligations.
Our company and its subsidiaries are named in and subject to various proceedings and claims arising primarily from our securities business activities, including lawsuits, arbitration claims, class actions, and regulatory matters. Some of these claims seek substantial compensatory, punitive, or indeterminate damages. Our company and its subsidiaries are also involved in other reviews, investigations, and proceedings by governmental and self-regulatory organizations regarding our business, which may result in adverse judgments, settlements, fines, penalties, injunctions, and other relief. We are contesting the allegations in these claims, and we believe that there are meritorious defenses in each of these lawsuits, arbitrations, and regulatory investigations. In view of the number and diversity of claims against theour company, the number of jurisdictions in which litigation is pending, and the inherent difficulty of predicting the outcome of litigation and other claims, we cannot state with certainty what the eventual outcome of pending litigation or other claims will be.
We have established reserves for potential losses that are probable and reasonably estimable that may result from pending and potential legal actions, investigations, and regulatory proceedings. In many cases, however, it is inherently difficult to determine whether any loss is probable or even possible or to estimate the amount or range of any potential loss, particularly where proceedings may be in relatively early stages or where plaintiffs are seeking substantial or indeterminate damages. Matters frequently need to be more developed before a loss or range of loss can reasonably be estimated.
In our opinion, based on currently available information, review with outside legal counsel, and consideration of amounts provided for in our consolidated financial statements with respect to these matters, including the matters described below, the ultimate resolution of these matters will not have a material adverse impact on our financial position and results of operations. However, resolution of one or more of these matters may have a material effect on the results of operations in any future period, depending upon the ultimate resolution of those matters and depending upon the level of income for such period. For matters where a reserve has not been established and for which we believe a loss is reasonably possible, as well as for matters where a reserve has been recorded but for which an exposure to loss in excess of the amount accrued is reasonably possible, based on currently available information, we believe that such losses will not have a material effect on our consolidated financial statements.
SEC/Wisconsin Lawsuit
The SEC filed a civil lawsuit against our company in U.S. District Court for the Eastern District of Wisconsin on August 10, 2011. The action arises out of our role in investments made by five Southeastern Wisconsin school districts (the “school districts”) in transactions involving collateralized debt obligations (“CDOs”). TheseThis lawsuit relates to the same transactions that are described in more detail below in connection withthe subject of the civil lawsuit filed by the school districts.districts noted below. The SEC has asserted claims under Section 15c(1)(A), Section 10b, and Rule 10b-5 of the Exchange Act and Sections 17a(1), 17a(2), and 17a(3) of the Securities Act. The claims are based upon both alleged misrepresentations and omissions in connection with the sale of the CDOs to the school districts, as well as the allegedly unsuitable nature of the CDOs. On October 31, 2011,We have denied the substantive allegations of the SEC complaint, as amended, and asserted various affirmative defenses. The parties are currently taking written discovery and depositions, with all discovery scheduled to close in April 2015. After close of discovery, we filed a motion to dismissanticipate the action for failure to state a claim. The District Court granted in part and denied in part our motion to dismiss, and as a resultwill set the SEC has amended its complaint.case for trial. We believe, based upon currently available information and review with outside counsel, that we have meritorious defenses to the SEC’s lawsuit and intend to vigorously defend the SEC’s claims.
Wisconsin School Districts/RBC OPEB lawsuit
We were named in a civil lawsuit filed in the Circuit Court of Milwaukee, Wisconsin (the “Wisconsin State Court”) on September 29, 2008. The lawsuit was filed against our company, Stifel, Nicolaus, as well as Royal Bank of Canada Europe Ltd. (“RBC”), and certain other RBC entities (collectively the “RBC entities”of its affiliates (“RBC”) by the school districts and the individual trustees for other post-employment benefit (“OPEB”) trusts established by those school districts (collectively the “Plaintiffs”). This lawsuit relates to the same transactions that are the subject of the SEC action noted above. As we previously disclosed, weWe entered into a settlement of the Plaintiffs’ lawsuit against our company and Stifel in March 2012. The settlement provides the potential for the Plaintiffs to obtain significant additional damages from the RBC entities. The school districts are continuing their lawsuit against RBC, and we are pursuing claims against the RBC entities to recover payments we have made to the school districts and for amounts owed to the OPEB trusts. Subsequent to the settlement, RBC asserted claims against the school districts, and our company, and Stifel for fraud, negligent misrepresentation, strict liability misrepresentation, and information negligently provided for the guidance of others based upon our role in connection with the school districts’ purchase of the CDOs. RBC has also asserted claims against our companyStifel for civil conspiracy and conspiracy to injure inits business based upon our company’sthe settlement by Stifel with the school districts and pursuit of claims against RBC. We have filed our Answer, denying RBC’s claims, and discovery continues in the RBC entities.case. We believe we have meritorious legal and factual defenses to the claims asserted by RBC, and we intend to vigorously defend those claims.
TWP LLC FINRA Matter
On April 28, 2010, FINRA commenced an administrative proceeding against TWP involving a transaction undertaken by a former employee in which approximately $15.7 million of ARS were sold from a TWPG account to the accounts of three customers. FINRA alleged that TWP violated various NASD and FINRA rules, as well as Section 10(b) of the Securities Exchange Act and Rule 10b-5. TWP’s answer denied the substantive allegations and asserted various affirmative defenses. TWP repurchased the ARS at issue from the customers at par. FINRA sought fines and other relief against TWP and the former employee.
On November 8, 2011, the FINRA hearing panel fined TWP $0.2 million for not having adequate supervisory procedures governing principal transactions in violation of NASD rules and ordered TWP to pay certain administrative fees and costs. The FINRA hearing panel dismissed all other charges against TWP and the former employee. On February 15, 2013, the National Adjudicatory Council dismissed FINRA’s appeal, which affirmed the hearing panel’s decision as the final decision of FINRA.
EDC Bond Issuance Matter
OnIn January 16, 2012,2008, our company and Stifel Nicolaus were named as defendants in a suit filed in Wisconsin state court with respect to Stifel Nicolaus’ role aswas the initial purchaser inof a $50.0 million bond offering under Rule 144A in January 2008. The bonds were issued by the Lake of the Torches Economic Development Corporation (“EDC”) in connection, which is associated with certain new financing for the construction of a proposed new casino, as well as refinancing of indebtedness involving Lac Du Flambeau Band of Lake Superior Chippewa Indians (the(together with EDC, the “Tribe”). We then sold all of the bonds to LDF Acquisition LLC, a special purpose vehicle created by Saybrook Tax Exempt Investors LLC (collectively, “Saybrook”), who are alsowith Wells Fargo Bank, NA (“Wells Fargo”) as the indenture trustee for the bonds. In 2009, Saybrook and Wells Fargo brought an action in a Wisconsin federal court against the Tribe to enforce the bonds (the “2009 federal action”). The Wisconsin federal court declared, in relevant part, the Bond Indenture to be void ab initio, and the Seventh Circuit Court of Appeals affirmed but remanded the case for further proceedings as to enforceability of the other bond documents. In April 2012, Saybrook dismissed the 2009 federal action.
On January 16, 2012, Saybrook filed a new action in Wisconsin state court (the “State Action”), naming as defendants inour company, Stifel, the action, together withTribe, and the law firm of Godfrey & Kahn, S.C. (“G&K”) who, which served as both issuer’s counsel and bond counsel incounsel. Saybrook seeks enforcement of the transaction. In an action in federal court in Wisconsin relatedobligations under the bonds, a judgment for rescission, restitution (including the amounts paid by Saybrook for the bonds), and costs. Alternatively, if
Saybrook fails to the transaction, EDC was successful in its assertion that the bond indenture was void as an unapproved “management contract” under National Indian Gaming Commission regulations, and that accordingly the Tribe’s waiver of sovereign immunity contained in the indenture was void. After a remandrecover from the Seventh Circuit Court of Appeals,Tribe, Saybrook seeks to recover damages, costs, and attorneys’ fees from us and/or G&K. In the State Action, Saybrook asserts a new federal action continues regarding the validity of the bond documents other than the bond indenture, andclaim against our company for fraud under the Wisconsin Uniform Securities Law, and with respect to Stifel, Nicolaus are defendants in this new federal action.
Saybrook Tax Exempt Investors LLC, a qualified institutional buyer and the sole bondholder through its special purpose vehicle LDF Acquisition LLC (collectively, “Saybrook”), and Wells Fargo Bank, NA (“Wells Fargo”), indenture trustee for the bonds (collectively, “plaintiffs”), also brought a Wisconsin state court suit against EDC, our company and G&K, based on alleged misrepresentations about the enforceability of the indenture and the bonds and the waiver of sovereign immunity. The parties have agreed to stay the state court action until the federal court rules on whether it has jurisdiction over the new federal action. Saybrook is the plaintiff in the new federal action and in the state court action. The plaintiffs allege that G&K represented in various legal opinions issued in the transaction, as well as in other documents associated with the transaction, that (i) the bonds and indenture were legally enforceable obligations of EDC and (ii) EDC’s waivers of sovereign immunity were valid. The claims asserted against us are for breaches of implied warranties of validity and title, securities fraud and statutory misrepresentation under Wisconsin state law, and intentional and negligent misrepresentations relating to the validity of the bond documents and the Tribe’s waiver of itstheir sovereign immunity. To the extent EDC does not fully perform its obligations toimmunity waivers. Saybrook pursuant to the bonds, the plaintiffs seek a judgmentalso asserts claims against Stifel for rescission restitutionary damages, includingbased on alleged misrepresentation or mutual mistake.
We have answered the amounts paid byComplaint in the plaintiffs forState Action, denying the bonds,claims, and costs; alternatively,filed cross-claims against the plaintiffs seek to recover damages, costsTribe and attorneys’ fees from us. On May 2, 2012, we filed a motionG&K. The Tribe moved to dismiss all ofour cross-claim, but on November 6, 2014, the court denied that motion. The Tribe also moved to dismiss Saybrook’s claims alleged against our company and Stifel Nicolaus inthem on the new federalgrounds that the state court action. The case is currently stayed while the federal court considers whether it has jurisdiction over the lawsuit. If the federal court determines it does not have jurisdiction over them due to assertions that they have sovereign immunity from suit. On October 23, 2014, the state court denied the Tribe’s motion to dismiss Saybrook’s claims against the Tribe. The Tribe filed a petition for leave to appeal the non-final orders denying their motions to dismiss Stifel’s cross-claims and Saybrook’s claims. On January 30, 2015, the Wisconsin Court of Appeals denied the Tribe’s petition, thereby allowing the State Action to move forward against the Tribe. Additionally, G&K filed a cross-claim against us seeking contribution and alleging that if G&K is found negligent, then we, too, must have been negligent. We have answered G&K’s cross-claim, denying those allegations. Additionally, G&K filed a third-party complaint against Dentons US LLP. Written discovery is ongoing between all the parties in the State Action.
Additionally, on April 25, 2013, the Tribe filed a suit against Saybrook, our company, Stifel, G&K, and Wells Fargo in the Lac du Flambeau Tribal Court, seeking a declaration that all of the bond documents are void (the “Tribal Action”). Our motion to dismiss the Tribal Action was denied, and on August 27, 2013, we filed an Answer, denying the claims.
In response to the Tribal Action, on May 24, 2013, we, together with Saybrook, Wells Fargo, and G&K, also filed an action will continue in a Wisconsin state court. federal court (the “Federal Action”) seeking to enjoin the Tribal Action. On May 16, 2014, the Wisconsin federal court preliminarily enjoined the Tribal Parties from litigating the Tribal Action. The Tribal Parties have appealed the preliminary injunction to the Seventh Circuit Court of Appeals. In light of the Tribal Parties’ appeal, the Tribal Action is stayed pending the resolution of the appeal. The appeal has been fully briefed by the parties and is scheduled for oral argument before the Seventh Circuit Court of Appeals on April 9, 2015.
While there can be no assurance that we will be successful, based upon currently available information and review with outside counsel, we believe that we have meritorious legal and factual defenses to the matter, and we intend to vigorously defend the claims.
Lac Courte Orielles Tribal lawsuit
On December 13, 2012,substantive claims as well as the procedural attempt to move the litigation to the Lac Courte Oreilles Band of Lake Superior Chippewa Indians of Wisconsin (the “Tribe”) filed a civil lawsuit against Stifel Nicolaus in the Tribe’sdu Flambeau Tribal Court (the “Tribal Lawsuit”). In December 2006, the Tribe issued two series of taxable municipal bonds as a means of raising revenue to fund various projects (the “2006 Bond Transaction”), including the refinancing of two series of bonds the Tribe issued in 2003. The Complaint alleges that we undertook to advise the Tribe regarding its financing options in 2006 but failed to disclose certain information before the 2006 Bond Transaction. On February 19, 2013 we filed a declaratory judgment action seeking to establish jurisdiction of the Tribal Lawsuit in the United States District Court for the Western District of Wisconsin. On February 20, 2013, we filed a motion to dismiss the Tribal Lawsuit, challenging the jurisdiction of the Tribal Court. We believe, based upon currently available information and review with outside counsel, that we have meritorious defenses to the Tribe’s claims and intend to vigorously defend the allegations.
ITEM 4. MINE SAFTEY DISCLOSURES
Not applicable.
ITEM 5. MARKET FOR REGISTRANT’S COMMON EQUITY, RELATED STOCKHOLDER MATTERS, AND ISSUER PURCHASES OF EQUITY SECURITIES
Market Information
Our common stock is traded on the New York Stock Exchange and Chicago Stock Exchange under the symbol “SF.” The closing sale price of our common stock as reported on the New York Stock Exchange on February 22, 2013,20, 2015, was $38.04.$51.55. As of that date, our common stock was held by approximately 20,70028,200 shareholders. The following table sets forth for the periods indicated the high and low trades for our common stock:
| 2014 | 2013 | |||||||||||||||||||||||||||||||
| 2012 | 2011 | High | Low | High | Low | |||||||||||||||||||||||||||
| High | Low | High | Low | |||||||||||||||||||||||||||||
First quarter | $ | 39.84 | $ | 32.02 | $ | 49.94 | $ | 40.68 | $ | 51.59 | $ | 43.11 | $ | 39.72 | $ | 32.43 | ||||||||||||||||
Second quarter | $ | 38.65 | $ | 29.33 | $ | 48.91 | $ | 34.97 | $ | 50.66 | $ | 43.57 | $ | 36.90 | $ | 30.85 | ||||||||||||||||
Third quarter | $ | 36.44 | $ | 28.10 | $ | 40.44 | $ | 23.09 | $ | 49.74 | $ | 44.43 | $ | 43.13 | $ | 34.96 | ||||||||||||||||
Fourth quarter | $ | 35.18 | $ | 28.80 | $ | 34.50 | $ | 23.72 | $ | 52.15 | $ | 41.47 | $ | 48.13 | $ | 37.97 | ||||||||||||||||
We did not pay cash dividends during 20122014 or 2011 and do not anticipate paying cash dividends in the foreseeable future.2013. The payment of dividends on our common stock is subject to several factors, including operating results, financial requirements of our company, and the availability of funds from our subsidiaries. See Note 20 of the Notes to Consolidated Financial Statements for more information on the capital restrictions placed on our broker-dealer subsidiaries and Stifel Bank.
Securities Authorized for Issuance Under Equity Compensation Plans
Information about securities authorized for issuance under our equity compensation plans is contained in Item 12, – “Security Ownership of Certain Beneficial Owners and Management and Related Stockholder Matters.”
Issuer Purchases of Equity Securities
The following table sets forth information with respect toThere were no unregistered sales of equity securities during the quarter ended December 31, 2014. There were also no purchases made by or on behalf of Stifel Financial Corp.the Company. or any “affiliated purchaser” (as defined in Rule 10b-18(a)(3) under the Securities Exchange Act of 1934, as amended), of our common stock during the quarter ended December 31, 2012.2014.
| Total Number of Shares Purchased | Average Price Paid per Share | Total Number of Shares Purchased as Part of Publically Announced Plans | Maximum Number of Shares That May Yet be Purchased Under the Plan or Program | |||||||||||||||
October 1 – 31, 2012 | — | $ | — | — | 4,032,854 | |||||||||||||
November 1 – 30, 2012 | 75,000 | 29.56 | 75,000 | 3,957,854 | ||||||||||||||
December 1 – 31, 2012 | — | — | — | 3,957,854 | ||||||||||||||
|
|
|
|
|
| |||||||||||||
| 75,000 | $ | 29.56 | 75,000 | |||||||||||||||
|
|
|
|
|
| |||||||||||||
We have an ongoing authorization from the Board of Directors to repurchase our common stock in the open market or in negotiated transactions. At December 31, 2012,2014, the maximum number of shares that may yet be purchased under this plan was 4.03.5 million.
Stock Performance Graph
Five-Year Shareholder Return Comparison
The graph below compares the cumulative stockholder return on our common stock with the cumulative total return of a Peer Group Index, the Standard & Poor’s 500 Index (“S&P 500”), and the NYSE ARCA Securities Broker-Dealer Index for the five yearfive-year period ended December 31, 2012.2014. The AMEXNYSE ARCA Securities Broker-Dealer Index consists of twelve firms in the brokerage sector. The Broker-Dealer Index does not includeincludes our company. The stock price information shown on the graph below is not necessarily indicative of future price performance.
The material in this report is not deemed “filed” with the SEC and is not to be incorporated by reference into any filing under the Securities Act of 1933 or the Securities Exchange Act of 1934, whether made before or after the date hereof and irrespective of any general incorporation language in any such filings.
The following table and graph assume that $100.00 was invested on December 31, 2007,2009, in our common stock, the Peer Group Index, the S&P 500 Index, and the AMEXNYSE ARCA Securities Broker-Dealer Index, with reinvestment of dividends.
| 2008 | 2009 | 2010 | 2011 | 2012 | 2010 | 2011 | 2012 | 2013 | 2014 | |||||||||||||||||||||||||||||||
Stifel Financial Corp. | $ | 131 | $ | 169 | $ | 177 | $ | 137 | $ | 137 | $ | 105 | $ | 81 | $ | 81 | $ | 121 | $ | 129 | ||||||||||||||||||||
Peer Group | $ | 67 | $ | 96 | $ | 108 | $ | 81 | $ | 102 | $ | 97 | $ | 52 | $ | 71 | $ | 103 | $ | 113 | ||||||||||||||||||||
S&P 500 Index | $ | 63 | $ | 80 | $ | 92 | $ | 94 | $ | 109 | $ | 115 | $ | 117 | $ | 136 | $ | 180 | $ | 205 | ||||||||||||||||||||
AMEX Securities Broker-Dealer Index | $ | 37 | $ | 55 | $ | 59 | $ | 40 | $ | 45 | ||||||||||||||||||||||||||||||
NYSE ARCA Securities Broker-Dealer Index | $ | 106 | $ | 72 | $ | 82 | $ | 140 | $ | 161 | ||||||||||||||||||||||||||||||
*Compound Annual Growth Rate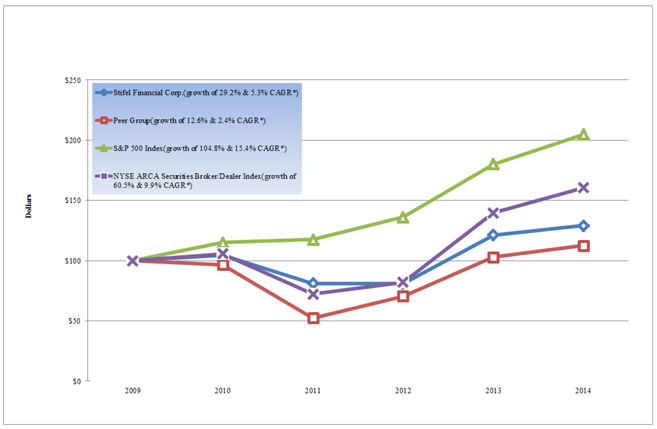
| * | Compound Annual Growth Rate |
The Peer Group Index consists of the following companies that serve the same markets as us and which compete with us in one or more markets:
FBR & Co. | Raymond James Financial, Inc. | |||
| SWS Group, Inc. | |||
JMP Group, Inc. | Stifel Financial Corp. | |||
| Piper Jaffray Companies | Morgan Stanley | ||
|
ITEM 6. SELECTED FINANCIAL DATA
The following selected consolidated financial data (presented in thousands, except per share amounts) is derived from our consolidated financial statements. This data should be read in conjunction with the consolidated financial statements and notes thereto and with Item 7, “Management’s Discussion and Analysis of Financial Condition and Results of Operations.”
| Year Ended December 31, | Year Ended December 31, | |||||||||||||||||||||||||||||||||||||||
| 2012 | 2011 | 2010 | 2009 | 2008 | 2014 | 2013 | 2012 | 2011 | 2010 | |||||||||||||||||||||||||||||||
Revenues: | ||||||||||||||||||||||||||||||||||||||||
Commissions | $ | 512,976 | $ | 561,081 | $ | 445,260 | $ | 345,520 | $ | 341,090 | $ | 674,418 | $ | 640,287 | $ | 518,803 | $ | 550,903 | $ | 440,291 | ||||||||||||||||||||
Principal transactions | 408,484 | 343,213 | 453,533 | 458,188 | 293,285 | 409,823 | 408,954 | 380,160 | 334,282 | 439,362 | ||||||||||||||||||||||||||||||
Investment banking | 286,585 | 199,584 | 218,104 | 125,807 | 83,710 | 578,689 | 457,736 | 292,686 | 195,506 | 229,241 | ||||||||||||||||||||||||||||||
Asset management and service fees | 257,981 | 228,834 | 193,159 | 117,357 | 122,773 | 386,001 | 305,639 | 257,981 | 228,831 | 193,159 | ||||||||||||||||||||||||||||||
Interest | 109,776 | 89,466 | 65,326 | 46,860 | 50,148 | 185,969 | 142,539 | 108,705 | 89,199 | 65,174 | ||||||||||||||||||||||||||||||
Other income/(loss) | 70,231 | 19,731 | 19,855 | 9,138 | (2,159 | ) | ||||||||||||||||||||||||||||||||||
Other income | 14,785 | 64,659 | 69,148 | 19,651 | 18,640 | |||||||||||||||||||||||||||||||||||
|
|
|
|
|
|
|
|
|
| |||||||||||||||||||||||||||||||
Total revenues | 1,646,033 | 1,441,909 | 1,395,237 | 1,102,870 | 888,847 | 2,249,685 | 2,019,814 | 1,627,483 | 1,418,372 | 1,385,867 | ||||||||||||||||||||||||||||||
|
|
|
|
| ||||||||||||||||||||||||||||||||||||
Interest expense | 33,383 | 25,347 | 13,211 | 12,234 | 18,510 | 41,261 | 46,368 | 33,370 | 25,304 | 13,189 | ||||||||||||||||||||||||||||||
|
|
|
|
|
|
|
|
|
| |||||||||||||||||||||||||||||||
Net revenues | 1,612,650 | 1,416,562 | 1,382,026 | 1,090,636 | 870,337 | 2,208,424 | 1,973,446 | 1,594,113 | 1,393,068 | 1,372,678 | ||||||||||||||||||||||||||||||
|
|
|
|
| ||||||||||||||||||||||||||||||||||||
|
|
|
|
| ||||||||||||||||||||||||||||||||||||
Non-interest expenses: | ||||||||||||||||||||||||||||||||||||||||
Compensation and benefits | 1,023,943 | 900,421 | 1,056,202 | 718,115 | 582,778 | 1,403,932 | 1,311,386 | 1,010,140 | 887,210 | 1,051,800 | ||||||||||||||||||||||||||||||
Occupancy and equipment rental | 130,247 | 121,929 | 115,742 | 89,741 | 67,984 | 169,040 | 158,268 | 128,365 | 119,944 | 114,784 | ||||||||||||||||||||||||||||||
Communications and office supplies | 80,941 | 75,589 | 69,929 | 54,745 | 45,621 | 106,926 | 99,726 | 79,406 | 74,037 | 69,406 | ||||||||||||||||||||||||||||||
Commissions and floor brokerage | 30,870 | 27,040 | 26,301 | 23,416 | 13,287 | 36,555 | 37,225 | 29,610 | 25,423 | 25,617 | ||||||||||||||||||||||||||||||
Other operating expenses | 120,777 | 152,975 | 114,081 | 84,205 | 68,898 | 201,177 | 181,612 | 116,845 | 148,305 | 112,529 | ||||||||||||||||||||||||||||||
|
|
|
|
|
|
|
|
|
| |||||||||||||||||||||||||||||||
Total non-interest expenses | 1,386,778 | 1,277,954 | 1,382,255 | 970,222 | 778,568 | 1,917,630 | 1,788,217 | 1,364,366 | 1,254,919 | 1,374,136 | ||||||||||||||||||||||||||||||
|
|
|
|
|
|
|
|
|
| |||||||||||||||||||||||||||||||
Income before income tax expense | 225,872 | 138,608 | (229 | ) | 120,414 | 91,769 | ||||||||||||||||||||||||||||||||||
Income from continuing operations before income tax expense | 290,794 | 185,229 | 229,747 | 138,149 | (1,458 | ) | ||||||||||||||||||||||||||||||||||
Provision for income taxes/(benefit) | 87,299 | 54,474 | (2,136 | ) | 44,616 | 36,267 | 111,664 | 12,322 | 84,451 | 53,880 | (2,508 | ) | ||||||||||||||||||||||||||||
|
|
|
|
| ||||||||||||||||||||||||||||||||||||
Income from continuing operations | 179,130 | $ | 172,907 | $ | 145,296 | $ | 84,269 | 1,050 | ||||||||||||||||||||||||||||||||
Discontinued operations: | ||||||||||||||||||||||||||||||||||||||||
Income/(loss) from discontinued operations, net of tax | (3,063 | ) | (10,894 | ) | (6,723 | ) | (135 | ) | 857 | |||||||||||||||||||||||||||||||
|
|
|
|
|
|
|
|
|
| |||||||||||||||||||||||||||||||
Net income | $ | 138,573 | $ | 84,134 | $ | 1,907 | $ | 75,798 | $ | 55,502 | $ | 176,067 | $ | 162,013 | $ | 138,573 | $ | 84,134 | $ | 1,907 | ||||||||||||||||||||
|
|
|
|
|
|
|
|
|
| |||||||||||||||||||||||||||||||
Earnings per common share: | ||||||||||||||||||||||||||||||||||||||||
Basic | $ | 2.59 | $ | 1.61 | $ | 0.04 | $ | 1.79 | $ | 1.54 | ||||||||||||||||||||||||||||||
Diluted | $ | 2.20 | $ | 1.33 | $ | 0.03 | $ | 1.56 | $ | 1.32 | ||||||||||||||||||||||||||||||
Weighted average number of common shares outstanding: | ||||||||||||||||||||||||||||||||||||||||
Earnings per basic common share: | ||||||||||||||||||||||||||||||||||||||||
Income from continuing operations | $ | 2.69 | $ | 2.72 | $ | 2.71 | $ | 1.61 | $ | 0.02 | ||||||||||||||||||||||||||||||
Income/(loss) from discontinued operations | (0.04 | ) | (0.17 | ) | (0.12 | ) | — | 0.02 | ||||||||||||||||||||||||||||||||
|
|
|
|
| ||||||||||||||||||||||||||||||||||||
Earnings per basic common share | $ | 2.65 | $ | 2.55 | $ | 2.59 | $ | 1.61 | $ | 0.04 | ||||||||||||||||||||||||||||||
Earnings per diluted common share: | ||||||||||||||||||||||||||||||||||||||||
Income from continuing operations | $ | 2.35 | $ | 2.35 | $ | 2.31 | $ | 1.34 | $ | 0.02 | ||||||||||||||||||||||||||||||
Income/(loss) from discontinued operations | (0.04 | ) | (0.15 | ) | (0.11 | ) | — | 0.01 | ||||||||||||||||||||||||||||||||
|
|
|
|
| ||||||||||||||||||||||||||||||||||||
Earnings per diluted common share | $ | 2.31 | $ | 2.20 | $ | 2.20 | $ | 1.34 | $ | 0.03 | ||||||||||||||||||||||||||||||
Weighted-average number of common shares outstanding: | ||||||||||||||||||||||||||||||||||||||||
Basic | 53,563 | 52,418 | 48,723 | 42,445 | 36,103 | 66,472 | 63,568 | 53,563 | 52,418 | 48,723 | ||||||||||||||||||||||||||||||
Diluted | 62,937 | 63,058 | 57,672 | 48,441 | 42,109 | 76,376 | 73,504 | 62,937 | 63,058 | 57,672 | ||||||||||||||||||||||||||||||
Financial Condition | ||||||||||||||||||||||||||||||||||||||||
Total assets | $ | 6,966,140 | $ | 4,951,900 | $ | 4,213,115 | $ | 3,167,356 | $ | 1,558,145 | $ | 9,518,151 | $ | 9,008,870 | $ | 6,966,140 | $ | 4,951,900 | $ | 4,213,115 | ||||||||||||||||||||
Long-term obligations | $ | 471,810 | $ | 89,457 | $ | 90,741 | $ | 101,979 | $ | 106,860 | $ | 707,500 | $ | 410,631 | $ | 471,810 | $ | 89,457 | $ | 90,741 | ||||||||||||||||||||
Shareholders’ equity | $ | 1,494,661 | $ | 1,302,105 | $ | 1,253,883 | $ | 873,446 | $ | 593,185 | $ | 2,322,038 | $ | 2,058,849 | $ | 1,494,661 | $ | 1,302,105 | $ | 1,253,883 | ||||||||||||||||||||
On March 7, 2011, our Board approved a 50% stock dividend, in the form of a three-for-two stock split, of our common stock payable on April 5, 2011, to shareholders of record as of March 22, 2011. All share and per share information has been retroactively adjusted to reflect the stock split.
Our Canadian subsidiary, Stifel Nicolaus Canada, Inc. (“SN Canada”) has ceased business operations as of September 30, 2013. The results of SN Canada, previously reported in the Institutional Group segment, are classified as discontinued operations for all periods presented.
The following items should be considered when comparing the data from year-to-year:year to year: 1) the acquisition of the UBS Acquired Locations during the third and fourth quarters of 2009; 2) the merger with TWPG on July 1, 2010; 3)2) the acceleration of our deferred compensation expense during 2010 as a result of the plan modification; 3) litigation-related expenses in 2011 associated with the civil lawsuit and related regulatory investigation in connection with the ongoing matter with five Southeastern Wisconsin school districts; 4) the acquisition of Stone & Youngberg on October 1, 2011; and 5) the realized and unrealized gains recognized on our investment in Knight Capital Group, Inc. during 2012.2012; 6) the merger with KBW on February 15, 2013; 7) the acquisitions of the U.S. institutional fixed income sales and trading business and the hiring of the European institutional fixed income sales and trading team from Knight Capital Group in July 2013; 8) the expensing of stock awards issued as retention as part of the acquisitions of the KBW and Knight Capital Fixed Income business during 2013; 9) the recognition of a U.S. tax benefit in connection with discontinuing the business operations of SN Canada during the third quarter of 2013; and 10) the acquisitions of De La Rosa, Oriel, and 1919 Investment Counsel during 2014 and the expensing of stock awards issued as retention as part of the Oriel and 1919 Investment Counsel acquisitions in 2014. See Item 7.7, “Management’s Discussion and Analysis of Financial Condition and Results of Operations,” made part hereof, for a discussion of these items and other items that may affect the comparability of data from year-to-year.year to year.
ITEM 7. MANAGEMENT’S DISCUSSION AND ANALYSIS OF FINANCIAL CONDITION AND RESULTS OF OPERATIONS
The following discussion of the financial condition and results of operations of our company should be read in conjunction with the Consolidated Financial Statements and Notes thereto included in this Annual Report on Form 10-K for the year ended December 31, 2012.2014.
Unless otherwise indicated, the terms “we,” “us,” “our,” or “our company” in this report refer to Stifel Financial Corp. and its wholly owned subsidiaries.
Executive Summary
We operate as a financial services and bank holding company. We have built a diversified business serving private clients, institutional investors, and investment banking clients located across the country. Our principal activities are: (i) private client services, including securities transaction and financial planning services; (ii) institutional equity and fixed income sales, trading, and research, and municipal finance; (iii) investment banking services, including mergers and acquisitions, public offerings, and private placements; and (iv) retail and commercial banking, including personal and commercial lending programs.
Our core philosophy is based upon a tradition of trust, understanding, and studied advice. We attract and retain experienced professionals by fostering a culture of entrepreneurial, long-term thinking. We provide our private, institutional, and corporate clients quality, personalized service, with the theory that if we place clients’ needs first, both our clients and our company will prosper. Our unwavering client and employee focus have earned us a reputation as one of the nation’s leading brokeragewealth management and investment banking firms off Wall Street.firms. We have grown our business both organically and through opportunistic acquisitions.
We plan to maintain our focus on revenue growth with a continued appreciation for the development of quality client relationships. Within our private client business, our efforts will be focused on recruiting experienced financial advisors with established client relationships. Within our capital markets business, our focus continues to be on providing quality client management and product diversification. In executing our growth strategy, we will continue to seek out opportunities that allow us to take advantage of the consolidation among middle-market firms, whereby allowing us to increase market share in our private client and institutional group businesses.
Stifel Financial Corp. (the “Parent”), through its wholly owned subsidiaries, principally Stifel, Nicolaus & Company, Incorporated (“Stifel Nicolaus”), Stifel Bank, & Trust (“Stifel Bank”), Stifel Nicolaus Europe Limited (“SNEL”), Century Securities Associates, Inc. (“CSA”),SNEL, CSA, KBW, Oriel, Miller Buckfire, De La Rosa, 1919 Investment Counsel, 1919, and Stifel Nicolaus Canada, Inc. (“SN Canada”),ZCM, is principally engaged in retail brokerage; securities trading; investment banking; investment advisory; retail, consumer, and commercial banking; and related financial services. We have offices throughout the United States two Canadian cities, and threein several European cities. Our major geographic area of concentration is the Midwest and Mid-Atlantic regions, with a growing presence in the Northeast, Southeast and Western United States. Our principal customers are individual investors, corporations, municipalities, and institutions.
We plan to maintain our focus on revenue growth with a continued focus on developing quality relationships with our clients. Within our private client business, our efforts will be focused on recruiting experienced financial advisors with established client relationships. Within our institutional group business, our focus continues to be on providing quality client management and product diversification. In executing our growth strategy, we take advantage of the consolidation among middle marketmiddle-market firms, which we believe provides us opportunities in our Global Wealth Management and Institutional Group businesses.
Our ability to attract and retain highly skilled and productive employees is critical to the success of our business. Accordingly, compensation and benefits comprise the largest component of our expenses, and our performance is dependent upon our ability to attract, develop, and retain highly skilled employees who are motivated and committed to providing the highest quality of service and guidance to our clients.
On April 3, 2014, we completed the acquisition of De La Rosa, a California-based public finance investment banking boutique. The addition of the De La Rosa team is expected to further strengthen our company’s position in a number of key underwriting markets in California.
On July 31, 2014 we completed the acquisition of Oriel, a London-based stockbroking and investment banking firm. The combination of our company and Oriel brought together more than 250 professionals, which created a significant middle-market investment banking group in London, with broad research coverage across most sectors of the economy, equity and debt sales and trading, and investment banking services.
On November 7, 2014, we completed the acquisition of 1919 Investment Counsel and 1919, an asset management and trust company that provides customized investment advisory and trust services, on a discretionary basis, to individuals, families, and institutions throughout the country.
On December 31, 2014, we acquired Merchant, a public finance investment banking firm headquartered in Montgomery, Alabama, which serves the Southeastern market. The strategic combination of Stifel and Merchant is expected to further strengthen our company’s position in several key underwriting markets in the Southeast.
On January 15, 2015 (the “redemption date”), we redeemed 100% of our company’s outstanding 6.70% Senior Notes due 2022. The redemption price was equal to the sum of the principal amount of the Notes outstanding and accrued and unpaid interest on the Notes up to, but not including, the redemption date.
On February 23, 2015, we entered into a definitive agreement to acquire Sterne Agee Group, Inc. (“Sterne Agee”), a financial services firm that offers comprehensive wealth management and investment services to a diverse client base, including corporations, municipalities, and individual investors. The transaction values Sterne Agee at approximately $150.0 million. The closing consideration will consist of a combination of our company’s common stock and cash. Depending on shareholder elections, the minimum amount of our company’s common stock issued at closing is 1.42 million shares and the maximum amount issued is 1.62 million shares. Accordingly, the cash consideration will range from approximately $77.0 million to $66.0 million. The merger is subject to approval by Sterne Agee shareholders and is subject to regulatory approvals and customary conditions. The merger is expected to close during the second quarter of 2015.
On February 23, 2015, we entered into a definitive agreement to acquire Sterne Agee Group, Inc. (“Sterne Agee”), a financial services firm that offers comprehensive wealth management and investment services to a diverse client base including corporations, municipalities and individual investors. The consideration received by Sterne Agee shareholders will consist of a combination of our company’s common stock, valued at $51.55 per share, and cash, and is subject to adjustments for tangible book value and an indemnity earn-out relating to various indemnification obligations of the equityholders. Giving effect to those adjustments and the earn-out, the value of the merger consideration to be received by the Sterne Agee equityholders is expected to be approximately $150.0 million. Sterne Agee equityholders will make stock/cash elections that will determine the final mix of consideration. Depending on those elections, we will issue at the closing of the Merger between a minimum of 1.42 million shares and a maximum of 1.62 million shares. The cash consideration payable to Sterne Agee equityholders under the Merger Agreement is expected to range from $77.0 million to $66.0 million. The merger is subject to approval by Sterne Agee shareholders, regulatory approvals and other, customary conditions. The Merger is expected to close during the second quarter of 2015.
Results for the year ended December 31, 20122014
For the year ended December 31, 2012, our2014, net revenues from continuing operations increased 13.8%11.9% to a record $1.61$2.21 billion compared to $1.42$1.97 billion during the comparable period in 2011, which represents our seventeenth consecutive annual increase in net revenues.2013. Net income, including continuing and discontinued operations, increased 64.7%8.7% to $138.6$176.1 million, or $2.31 per diluted common share, for the year ended December 31, 2012,2014, compared to $84.1$162.1 million, or $2.20 per diluted common share, in 2011.2013. Net income from continuing operations increased 3.6% to $179.1 million, or $2.35 per diluted common share, for the year ended December 31, 2014, compared to $172.9 million, or $2.35 per diluted common share, in 2013.
Our revenue growth for the year ended December 31, 2014, was primarily attributable to higher investment banking revenues as a result of strong public financeimproved M&A activity and improved M&Aincreased capital-raising revenues; increased principal transactions revenues as a result of strong fixed income trading volumes and tightening credit spreads; gains recognized on our investment in Knight Capital Group, Inc.; growth in asset management and service fees as a result of an increase in investment advisory revenues; andincreased assets under management; increased net interest revenues as a result of the growth of net interest-earning assets at Stifel Bank.Bank; and an increase in brokerage revenues. The increase in revenue growth over the comparable period in 2013 was offset by a decline in commissionother revenues. In addition, our revenue growth was positively impacted by the acquisitions of De La Rosa, Oriel, and 1919 Investment Counsel during 2014.
The results for the year ended December 31, 2011 include litigation-related2014, were impacted by certain non-recurring and merger-related expenses associated withprimarily related to the civil lawsuitacquisitions of De La Rosa, Oriel, and related regulatory investigation in1919 Investment Counsel.
The results from continuing operations for the year ended December 31, 2013, were significantly impacted by the expensing of stock awards issued as retention as part of the acquisitions of the KBW and Knight Capital Fixed Income business, and certain non-recurring and merger-related expenses.
In connection with discontinuing the ongoing matter with five Southeastern Wisconsin school districts and certain merger-related expenses.business operations of SN Canada during the third quarter of 2013, we realized a $58.2 million U.S. tax benefit due to a realized loss on our investment in SN Canada. The reduction in the financial statement carrying amount, which was recorded in 2008, became realizable for U.S. tax purposes in the foreseeable future as a result of our decision to exit the Canadian market. The tax benefit was the excess of the tax basis of our investment in the subsidiary over the financial statement carrying amount (the deductible outside basis difference).
External Factors Impacting ourOur Business
Performance in the financial services industry in which we operate is highly correlated to the overall strength of economic conditions and financial market activity. Overall market conditions are a product of many factors, which are beyond our control and mostly unpredictable. These factors may affect the financial decisions made by investors, including their level of participation in the financial markets. In turn, these decisions may affect our business results. With respect to financial market activity, our profitability is sensitive to a variety of factors, including the demand for investment banking services as reflected by the number and size of equity
and debt financings and merger and acquisition transactions, the volatility of the equity and fixed income markets, the level and shape of various yield curves, the volume and value of trading in securities, and the value of our customers’ assets under management. The municipal underwriting market is challenging as state and local governments reduce their debt levels. Investors are showing a lack of demand for longer-dated municipals and are reluctant to take on credit or liquidity risks. Investor confidence has been dampened by continued uncertainty surrounding the U.S. fiscal and debt ceiling, the debt concerns in Europe, and sluggish employment growth.
Our overall financial results continue to be highly and directly correlated to the direction and activity levels of the United States equity and fixed income markets. At December 30, 2012,31, 2014, the key indicators of the markets’ performance, the NASDAQ, S&P 500, and Dow Jones Industrial Average, S&P 500, and the NASDAQ closed 7.3%13.4%, 13.4%11.4%, and 15.9%7.5% higher than their December 31, 20112013, closing prices, respectively.
As a participant in the financial services industry, we are subject to complicated and extensive regulation of our business. The recent economic and political environment has led to legislative and regulatory initiatives, both enacted and proposed, that could substantially intensify the regulation of the financial services industry and may significantly impact us. On July 21, 2010, the Dodd-Frank Act was signed into law. The Dodd-Frank Act will have a broad impact on the financial services industry and will impose significant new regulatory and compliance requirements, including the designation of certain financial companies as systemically significant, the imposition of increased capital, leverage, and liquidity requirements, and numerous other provisions designed to improve supervision and oversight of, and strengthen safety and soundness within, the financial services sector. The expectation is that this new legislation will significantly restructure and increase regulation in the financial services industry, which could increase our cost of doing business, change certain business practices, and alter the competitive landscape.
RESULTS OF OPERATIONS
The following table presents consolidated financial information for the periods indicated(in thousands, except percentages):
| For the Year Ended December 31, | Percentage Change | As a Percentage of Net Revenues for the Year Ended December 31, | For the Year Ended December 31, | Percentage Change | As a Percentage of Net Revenues for the Year Ended December 31, | |||||||||||||||||||||||||||||||||||||||||||||||||||||||||||
| 2012 | 2011 | 2010 | 2012 vs. 2011 | 2011 vs. 2010 | 2012 | 2011 | 2010 | 2014 | 2013 | 2012 | 2014 vs. 2013 | 2013 vs. 2012 | 2014 | 2013 | 2012 | |||||||||||||||||||||||||||||||||||||||||||||||||
Revenues: | ||||||||||||||||||||||||||||||||||||||||||||||||||||||||||||||||
Commissions | $ | 512,976 | $ | 561,081 | $ | 445,260 | (8.6 | ) % | 26.0 | % | 31.8 | % | 39.6 | % | 32.2 | % | $ | 674,418 | $ | 640,287 | $ | 518,803 | 5.3 | 23.4 | 30.5 | % | 32.4 | % | 32.6 | % | ||||||||||||||||||||||||||||||||||
Principal transactions | 408,484 | 343,213 | 453,533 | 19.0 | (24.3 | ) | 25.3 | 24.2 | 32.8 | 409,823 | 408,954 | 380,160 | 0.2 | 7.6 | 18.6 | 20.7 | 23.8 | |||||||||||||||||||||||||||||||||||||||||||||||
Investment banking | 286,585 | 199,584 | 218,104 | 43.6 | (8.5 | ) | 17.8 | 14.1 | 15.8 | 578,689 | 457,736 | 292,686 | 26.4 | 56.4 | 26.2 | 23.2 | 18.4 | |||||||||||||||||||||||||||||||||||||||||||||||
Asset management and service fees | 257,981 | 228,834 | 193,159 | 12.7 | 18.5 | 16.0 | 16.2 | 14.0 | 386,001 | 305,639 | 257,981 | 26.3 | 18.5 | 17.5 | 15.5 | 16.2 | ||||||||||||||||||||||||||||||||||||||||||||||||
Interest | 109,776 | 89,466 | 65,326 | 22.7 | 37.0 | 6.8 | 6.3 | 4.7 | 185,969 | 142,539 | 108,705 | 30.5 | 31.1 | 8.4 | 7.2 | 6.8 | ||||||||||||||||||||||||||||||||||||||||||||||||
Other income | 70,231 | 19,731 | 19,855 | 255.9 | (0.6 | ) | 4.4 | 1.4 | 1.5 | 14,785 | 64,659 | 69,148 | (77.1 | ) | (6.5 | ) | 0.7 | 3.3 | 4.3 | |||||||||||||||||||||||||||||||||||||||||||||
|
|
|
|
|
|
|
|
|
|
|
|
|
|
|
| |||||||||||||||||||||||||||||||||||||||||||||||||
Total revenues | 1,646,033 | 1,441,909 | 1,395,237 | 14.2 | 3.3 | 102.1 | 101.8 | 101.0 | 2,249,685 | 2,019,814 | 1,627,483 | 11.4 | 24.1 | 101.9 | 102.3 | 102.1 | ||||||||||||||||||||||||||||||||||||||||||||||||
Interest expense | 33,383 | 25,347 | 13,211 | 31.7 | 91.9 | 2.1 | 1.8 | 1.0 | 41,261 | 46,368 | 33,370 | (11.0 | ) | 39.0 | 1.9 | 2.3 | 2.1 | |||||||||||||||||||||||||||||||||||||||||||||||
|
|
|
|
|
|
|
|
|
|
|
|
|
|
|
| |||||||||||||||||||||||||||||||||||||||||||||||||
Net revenues | 1,612,650 | 1,416,562 | 1,382,026 | 13.8 | 2.5 | 100.0 | 100.0 | 100.0 | 2,208,424 | 1,973,446 | 1,594,113 | 11.9 | 23.8 | 100.0 | 100.0 | 100.0 | ||||||||||||||||||||||||||||||||||||||||||||||||
|
|
|
|
|
|
|
|
|
|
|
|
|
|
|
| |||||||||||||||||||||||||||||||||||||||||||||||||
Non-interest expenses: | ||||||||||||||||||||||||||||||||||||||||||||||||||||||||||||||||
Compensation and benefits | 1,023,943 | 900,421 | 1,056,202 | 13.7 | (14.7 | ) | 63.5 | 63.6 | 76.4 | 1,403,932 | 1,311,386 | 1,010,140 | 7.1 | 29.8 | 63.6 | 66.5 | 63.4 | |||||||||||||||||||||||||||||||||||||||||||||||
Occupancy and equipment rental | 130,247 | 121,929 | 115,742 | 6.8 | 5.3 | 8.1 | 8.6 | 8.4 | 169,040 | 158,268 | 128,365 | 6.8 | 23.3 | 7.6 | 8.0 | 8.0 | ||||||||||||||||||||||||||||||||||||||||||||||||
Communication and office supplies | 80,941 | 75,589 | 69,929 | 7.1 | 8.1 | 5.0 | 5.3 | 5.1 | 106,926 | 99,726 | 79,406 | 7.2 | 25.6 | 4.8 | 5.0 | 5.0 | ||||||||||||||||||||||||||||||||||||||||||||||||
Commissions and floor brokerage | 30,870 | 27,040 | 26,301 | 14.2 | 2.8 | 1.9 | 1.9 | 1.9 | 36,555 | 37,225 | 29,610 | (1.8 | ) | 25.7 | 1.7 | 1.9 | 1.9 | |||||||||||||||||||||||||||||||||||||||||||||||
Other operating expenses | 120,777 | 152,975 | 114,081 | (21.0 | ) | 34.1 | 7.5 | 10.8 | 8.3 | 201,177 | 181,612 | 116,845 | 10.8 | 55.4 | 9.1 | 9.2 | 7.3 | |||||||||||||||||||||||||||||||||||||||||||||||
|
|
|
|
|
|
|
|
|
|
|
|
|
|
|
| |||||||||||||||||||||||||||||||||||||||||||||||||
Total non-interest expenses | 1,386,778 | 1,277,954 | 1,382,255 | 8.5 | (7.5 | ) | 86.0 | 90.2 | 100.1 | 1,917,630 | 1,788,217 | 1,364,366 | 7.2 | 31.1 | 86.8 | 90.6 | 85.6 | |||||||||||||||||||||||||||||||||||||||||||||||
|
|
|
|
|
|
|
|
|
|
|
|
|
|
|
| |||||||||||||||||||||||||||||||||||||||||||||||||
Income before income taxes | 225,872 | 138,608 | (229 | ) | 63.0 | * | 14.0 | 9.8 | (0.1 | ) | ||||||||||||||||||||||||||||||||||||||||||||||||||||||
Provision for income taxes/(benefit) | 87,299 | 54,474 | (2,136 | ) | 60.3 | * | 5.4 | 3.9 | (0.2 | ) | ||||||||||||||||||||||||||||||||||||||||||||||||||||||
Income from continuing operations before income taxes | 290,794 | 185,229 | 229,747 | 57.0 | (19.4 | ) | 13.2 | 9.4 | 14.4 | |||||||||||||||||||||||||||||||||||||||||||||||||||||||
Provision for income taxes | 111,664 | 12,322 | 84,451 | * | (85.4 | ) | 5.1 | 0.6 | 5.3 | |||||||||||||||||||||||||||||||||||||||||||||||||||||||
|
|
|
|
|
|
|
| |||||||||||||||||||||||||||||||||||||||||||||||||||||||||
Income from continuing operations | 179,130 | $ | 172,907 | $ | 145,296 | 3.6 | 19.0 | 8.1 | % | 8.8 | % | 9.1 | % | |||||||||||||||||||||||||||||||||||||||||||||||||||
Discontinued operations: | ||||||||||||||||||||||||||||||||||||||||||||||||||||||||||||||||
Loss from discontinued operations, net of tax | (3,063 | ) | (10,894 | ) | (6,723 | ) | 71.9 | 62.1 | (0.1 | ) | (0.5 | ) | (0.4 | ) | ||||||||||||||||||||||||||||||||||||||||||||||||||
|
|
|
|
|
|
|
|
|
|
|
|
|
|
|
| |||||||||||||||||||||||||||||||||||||||||||||||||
Net income | $ | 138,573 | $ | 84,134 | $ | 1,907 | 64.7 | % | * | % | 8.6 | % | 5.9 | % | 0.1 | % | $ | 176,067 | $ | 162,103 | $ | 138,573 | 8.7 | 16.9 | 8.0 | % | 8.3 | % | 8.7 | % | ||||||||||||||||||||||||||||||||||
|
|
|
|
|
|
|
|
|
|
|
|
|
|
|
| |||||||||||||||||||||||||||||||||||||||||||||||||
| * | Percentage not meaningful. |
NET REVENUES
The following table presents consolidated net revenues for the periods indicated(in thousands, except percentages):
| For the Year Ended December 31, | Percentage Change | For the Year Ended December 31, | Percentage Change | |||||||||||||||||||||||||||||||||||||
| 2012 | 2011 | 2010 | 2012 vs. 2011 | 2011 vs. 2010 | 2014 | 2013 | 2012 | 2014 vs. 2013 | 2013 vs. 2012 | |||||||||||||||||||||||||||||||
Revenues: | ||||||||||||||||||||||||||||||||||||||||
Commissions | $ | 512,976 | $ | 561,081 | $ | 445,260 | (8.6 | ) % | 26.0 | % | $ | 674,418 | $ | 640,287 | $ | 518,803 | 5.3 | % | 23.4 | % | ||||||||||||||||||||
Principal transactions | 408,484 | 343,213 | 453,533 | 19.0 | (24.3 | ) | 409,823 | 408,954 | 380,160 | 0.2 | 7.6 | |||||||||||||||||||||||||||||
Investment banking: | ||||||||||||||||||||||||||||||||||||||||
Capital raising | 190,502 | 124,648 | 135,898 | 52.8 | (8.3 | ) | 305,198 | 256,012 | 198,011 | 19.2 | 29.3 | |||||||||||||||||||||||||||||
Advisory | 96,083 | 74,936 | 82,206 | 28.2 | (8.8 | ) | 273,491 | 201,724 | 94,675 | 35.6 | 113.1 | |||||||||||||||||||||||||||||
|
|
|
|
|
|
|
|
| ||||||||||||||||||||||||||||||||
| 286,585 | 199,584 | 218,104 | 43.6 | (8.5 | ) | 578,689 | 457,736 | 292,686 | 26.4 | 56.4 | ||||||||||||||||||||||||||||||
Asset management and service fees | 257,981 | 228,834 | 193,159 | 12.7 | 18.5 | 386,001 | 305,639 | 257,981 | 26.3 | 18.5 | ||||||||||||||||||||||||||||||
Net interest | 76,393 | 64,119 | 52,115 | 19.1 | 23.0 | 144,708 | 96,171 | 75,335 | 50.5 | 27.7 | ||||||||||||||||||||||||||||||
Other income | 70,231 | 19,731 | 19,855 | 255.9 | (0.6 | ) | 14,785 | 64,659 | 69,148 | (77.1 | ) | (6.5 | ) | |||||||||||||||||||||||||||
|
|
|
|
|
|
|
|
| ||||||||||||||||||||||||||||||||
Total net revenues | $ | 1,612,650 | $ | 1,416,562 | $ | 1,382,026 | 13.8 | % | 2.5 | % | $ | 2,208,424 | $ | 1,973,446 | $ | 1,594,113 | 11.9 | % | 23.8 | % | ||||||||||||||||||||
|
|
|
|
|
|
|
|
|
| |||||||||||||||||||||||||||||||
Year Ended December 31, 20122014 Compared With Year Ended December 31, 20112013
Except as noted in the following discussion of variances, the underlying reasons for the increase in net revenuesrevenue can be attributed principally to the increased number of private client group offices and financial advisors in our Global Wealth Management segment and the increased number of revenue producers in our Institutional Group segment.segment, and the acquisitions of De La Rosa on April 3, 2014, Oriel on July 31, 2014, and 1919 Investment Counsel on November 7, 2014. The increaseresults of operations for De La Rosa, Oriel, and 1919 Investment Counsel are included in net revenues forour results prospectively from the year ended December 31, 2012 is attributable to the previously mentioned factors.date of their respective acquisitions.
Commissions– Commission revenues are primarily generated from agency transactions in OTC and listed equity securities, insurance products, and options. In addition, commission revenues also include distribution fees for promoting and distributing mutual funds.
For the year ended December 31, 2012,2014, commission revenues decreased 8.6%increased 5.3% to $513.0$674.4 million from $561.1$640.3 million in 2011.2013. The decrease in commission revenuesincrease is primarily attributable to a decreasean increase in OTC transactions from the comparable period in 2011.mutual fund and equity transactions.
Principal transactions – For the year ended December 31, 2012,2014, principal transactions revenues increased 19.0%0.2% to $408.5$409.8 million from $343.2$409.0 million in 2011.2013. The increase in principal transactions revenuesfrom 2013 is primarily attributable to improved fixed incomehigher institutional brokerage revenues as a result of strong trading volumes and improved credit spreads.higher volumes. The increase is also attributable to the revenues generated by the fixed income business acquired from Knight Capital in July 2013.
Investment banking–Investment banking revenues include: (i) capital raisingcapital-raising revenues representing fees earned from the underwriting of debt and equity securities, and (ii) strategic advisory fees related to corporate debt and equity offerings, municipal debt offerings, mergersmerger and acquisitions, private placements, and other investment banking advisory fees.
For the year ended December 31, 2012,2014, investment banking revenues increased 43.6%26.4%, to $286.6$578.7 million from $199.6$457.7 million in 2011.2013. The increase in investment banking revenues is primarily attributable to an increase in capital raising revenues, which is primarily attributable to improved equity capital markets, strong public finance activity aided by our acquisition of Stone & Youngberg in October 2011 and an increase in advisory fees as a result of an increase in M&A activity.and equity-capital raising revenues.
Capital raisingCapital-raising revenues increased 52.8%19.2% to $190.5$305.2 million for the year ended December 31, 20122014, from $124.6$256.0 million in 2011.
2013. For the year ended December 31, 2012, fixed income capital raising2014, equity capital-raising revenues increased 107.6%26.8% to $55.4$232.5 million from $26.6$183.3 million in 2011.2013. For the year ended December 31, 2012, equity capital raising increased 37.9% to $135.1 million from $98.0 million in 2011.2014, fixed income capital-raising revenues remained consistent with 2013 at $72.7 million.
Strategic advisory fees increased 28.2%35.6% to $96.1$273.5 million for the year ended December 31, 20122014, from $74.9$201.7 million in 2011.
Asset management and service fees–Asset management and service fees include fees for asset-based financial services provided to individuals and institutional clients. Investment advisory fees are charged based on the value of assets in fee-based accounts. Asset management and service fees are affected by changes in the balances of client assets due to market fluctuations and levels of net new client assets.
For the year ended December 31, 2012,2014, asset management and service fee revenues increased 12.7%26.3% to $258.0$386.0 million from $228.8$305.6 million in 2011.2013. The increase is primarily a result of an increase in the number and value of assets in fee-based accountsaccounts. See “Asset management and the number of managed accounts from December 31, 2011, as a result of market performance. See “Assets in fee-based accounts” includedservice fees” in the table in “Results of Operations – Global Wealth Management.”Management segment discussion for information on the changes in asset management and service fees revenues.
Other income–For the year ended December 31, 2012,2014, other income increased 255.9%decreased 77.1% to $70.2$14.8 million from $19.7$64.7 million in 2011.during 2013. Other income primarily includes investment gains, including gains on our private equity investments, and mortgage banking fee income. The increase in other income is primarily attributable to $39.0 million in realized and unrealized gains recognized on our investment in Knight Capital Group, Inc.loan originations fees from Stifel Bank.
Year Ended December 31, 20112013 Compared With Year Ended December 31, 20102012
Except as noted in the following discussion of variances, the underlying reasons for the increase in net revenuesrevenue can be attributed principally to the increased number of private client group offices and financial advisors in our Global Wealth Management segment and the increased number of revenue producers in our Institutional Group segment. The increase in net revenues for the year ended December 31, 2011 is attributable to the previously mentioned factorssegment and the acquisitionacquisitions of TWPGKBW, Inc. on February 15, 2013, Knight Capital Fixed Income business on July 1, 2010.2013, and Miller Buckfire on December 20, 2012. The operations of TWPG were integrated with Stifel Nicolaus immediately after the merger, therefore the results of operations for KBW, Inc., Knight Capital Fixed Income business, and Miller Buckfire are included in our results prospectively from the business, as acquired, does not exist as a discrete entity within our internal reporting structure.date of their respective acquisitions.
Commissions– Commission revenues are primarily generated from agency transactions in OTC and listed equity securities, insurance products and options. In addition, commission revenues also include distribution fees for promoting and distributing mutual funds.
For the year ended December 31, 2011,2013, commission revenues increased 26.0%23.4% to $561.1$640.3 million from $445.3$518.8 million in 2010.2012. The increase is primarily attributable to an increase in client assets and higher productivity.OTC transactions from the comparable period in 2012.
Principal transactions – For the year ended December 31, 2011,2013, principal transactions revenues decreased 24.3%increased 7.6% to $343.2$409.0 million from $453.5$380.2 million in 2010.2012. The decreaseincrease is primarily attributable to a declinean increase in equity and fixed income institutional brokerage revenues which was negatively impacted by the challenging market conditions present during throughout 2011.
In addition to the items impacting our commissions and principal transactions, as described above, a portion of the increase in commissions and corresponding decrease in principal transactions was attributable to a change in classification of certain equity trades that were recorded as principal transactions during the year ended December 31, 2010 that are now being recorded as commission revenues as a result of regulatory changes.higher trading volumes.
Asset management and service fees Investment banking–Asset management and service fees include fees for asset-based financial services provided to individuals and institutional clients. Investment advisory fees are charged based on the value of assets in fee-based accounts. Asset management and service fees are affected by changes in the balances of client assets due to market fluctuations and levels of net new client assets.
For the year ended December 31, 2011,2013, investment banking revenues increased 56.4%, to $457.7 million from $292.7 million in 2012. The increase was attributable to an increase in equity capital-raising revenues and an increase in strategic advisory fees. Our investment banking revenues were positively impacted by our acquisition of KBW, Inc. and Miller Buckfire.
Capital-raising revenues increased 29.3% to $256.0 million for the year ended December 31, 2013, from $198.0 million in 2012. During the year ended December 31, 2013, equity capital-raising revenues increased 49.8% to $183.3 million from $122.4 million in 2012. The increase is primarily attributable to improved equity capital markets during 2013. For the year ended December 31, 2013, fixed income capital-raising revenues decreased 3.9% to $72.7 million from $75.7 million in 2012. Fixed income capital-raising revenues were impacted by a decrease in the municipal bond origination business in 2013.
Strategic advisory fees increased 113.1% to $201.7 million for the year ended December 31, 2013, from $94.7 million in 2012. The increase is primarily attributable to an increase in the number of completed equity transactions over the comparable period in 2012.
Asset management and service fees– For the year ended December 31, 2013, asset management and service fee revenues increased 18.5% to $228.8$305.6 million from $193.2$258.0 million in 2010.2012. The increase is primarily a result of an increase in the number and value of assetsfee-based accounts. See “Asset management and service fees” in fee-based accounts and the number of managed accounts from December 31, 2010, as a result of market performance, offset by a reductionGlobal Wealth Management segment discussion for information on the changes in fees for money-fund balances due to the waiving of fees by certain fund managers. In addition, asset management and service fee revenues for the year ended December 31, 2011 were positively impacted by the addition of the TWPG asset management business starting on July 1, 2010. See “Assets in fee-based accounts” included in the table in “Results of Operations – Global Wealth Management.”fees revenues.
Investment banking Other income–Investment banking revenues include: (i) capital raising revenues representing fees earned from the underwriting of debt and equity securities, and (ii) strategic advisory fees related to corporate debt and equity offerings, municipal debt offerings, mergers and acquisitions, private placements and other investment banking advisory fees.
For the year ended December 31, 2011, investment banking revenues decreased 8.5%, to $199.6 million from $218.1 million in 2010. The decrease is primarily attributable to a decrease in capital raising and advisory fees as a result of the challenging market conditions that existed during 2011.
Capital raising revenues decreased 8.3% to $124.6 million for the year ended December 31, 2011 from $135.9 million in 2010.
For the year ended December 31, 2011, equity capital raising decreased 9.6% to $98.0 million from $108.4 million in 2010. For the year ended December 31, 2011, fixed income capital raising revenues decreased 2.9% to $26.6 million from $27.5 million in 2010.
Strategic advisory fees decreased 8.8% to $74.9 million for the year ended December 31, 2011 from $82.2 million in 2010.
Other income –For the year ended December 31, 2011,2013, other income decreased 0.6%6.5% to $19.7$64.7 million from $19.9$69.1 million in 2010. The decrease is primarily attributable to lower2012. Other income includes investment gainsgains/(losses) on our private equity investments, recognized during 2011, offset by an increase in mortgage banking fee income due togain on the increase inacquisition of Acacia Federal, and loan originations atfees from Stifel Bank.
NET INTEREST INCOME
The following tables present average balance data and operating interest revenue and expense data, as well as related interest yields for the periods indicated(in thousands, except rates):
| For the Year Ended | For the Year Ended | |||||||||||||||||||||||||||||||||||||||||||||||||||||||||||||||||||||||
| December 31, 2012 | December 31, 2011 | December 31, 2010 | December 31, 2014 | December 31, 2013 | December 31, 2012 | |||||||||||||||||||||||||||||||||||||||||||||||||||||||||||||||||||
| Average Balance | Interest Income/ Expense | Average Interest Rate | Average Balance | Interest Income/ Expense | Average Interest Rate | Average Balance | Interest Income/ Expense | Average Interest Rate | Average Balance | Interest Income/ Expense | Average Interest Rate | Average Balance | Interest Income/ Expense | Average Interest Rate | Average Balance | Interest Income/ Expense | Average Interest Rate | |||||||||||||||||||||||||||||||||||||||||||||||||||||||
Interest-earning assets: | ||||||||||||||||||||||||||||||||||||||||||||||||||||||||||||||||||||||||
Margin balances (Stifel Nicolaus) | $ | 488,899 | $ | 19,079 | 3.90 | % | $ | 456,208 | $ | 18,681 | 4.09 | % | $ | 385,040 | $ | 16,532 | 4.29 | % | ||||||||||||||||||||||||||||||||||||||||||||||||||||||
Margin balances (Stifel) | $ | 481,210 | $ | 19,095 | 3.97 | % | $ | 462,897 | $ | 18,222 | 3.94 | % | $ | 488,899 | $ | 19,079 | 3.90 | % | ||||||||||||||||||||||||||||||||||||||||||||||||||||||
Interest-earning assets (Stifel Bank) * | 2,867,628 | 74,864 | 2.60 | % | 1,937,683 | 56,970 | 2.94 | % | 1,293,339 | 35,146 | 2.72 | % | 4,912,382 | 143,146 | 2.91 | % | 4,224,407 | 101,489 | 2.42 | % | 2,867,628 | 74,864 | 2.60 | % | ||||||||||||||||||||||||||||||||||||||||||||||||
Other (Stifel Nicolaus) | 15,833 | 13,815 | 13,648 | |||||||||||||||||||||||||||||||||||||||||||||||||||||||||||||||||||||
Other (Stifel) | 23,728 | 22,828 | 14,762 | |||||||||||||||||||||||||||||||||||||||||||||||||||||||||||||||||||||
|
|
|
|
|
| |||||||||||||||||||||||||||||||||||||||||||||||||||||||||||||||||||
Total interest revenue | $ | 109,776 | $ | 89,466 | $ | 65,326 | ||||||||||||||||||||||||||||||||||||||||||||||||||||||||||||||||||
Total interest revenue | $ | 185,969 | $ | 142,539 | $ | 108,705 | ||||||||||||||||||||||||||||||||||||||||||||||||||||||||||||||||||
|
|
| ||||||||||||||||||||||||||||||||||||||||||||||||||||||||||||||||||||||
|
|
| ||||||||||||||||||||||||||||||||||||||||||||||||||||||||||||||||||||||
Interest-bearing liabilities: | ||||||||||||||||||||||||||||||||||||||||||||||||||||||||||||||||||||||||
Short-term borrowings (Stifel Nicolaus) | $ | 184,413 | $ | 2,029 | 1.10 | % | $ | 199,613 | $ | 2,296 | 1.15 | % | $ | 108,784 | $ | 1,102 | 1.01 | % | ||||||||||||||||||||||||||||||||||||||||||||||||||||||
Short-term borrowings (Stifel) | $ | 97,815 | $ | 1,092 | 1.12 | % | $ | 252,948 | $ | 3,176 | 1.26 | % | $ | 184,413 | $ | 2,029 | 1.10 | % | ||||||||||||||||||||||||||||||||||||||||||||||||||||||
Interest-bearing liabilities (Stifel Bank) * | 2,665,523 | 15,013 | 0.56 | % | 1,805,544 | 16,731 | 0.93 | % | 1,191,747 | 5,188 | 0.44 | % | 4,598,530 | 7,926 | 0.17 | % | 3,967,402 | 11,775 | 0.30 | % | 2,665,523 | 15,013 | 0.56 | % | ||||||||||||||||||||||||||||||||||||||||||||||||
Stock loan (Stifel Nicolaus) | 137,284 | 216 | 0.16 | % | 124,130 | 369 | 0.30 | % | 69,507 | 262 | 0.38 | % | ||||||||||||||||||||||||||||||||||||||||||||||||||||||||||||
Senior notes (Stifel Financial) | 168,989 | 12,431 | 7.36 | % | — | — | — | % | — | — | — | % | ||||||||||||||||||||||||||||||||||||||||||||||||||||||||||||
Stock loan (Stifel) | 45,758 | 76 | 0.17 | % | 91,194 | 152 | 0.17 | % | 137,284 | 216 | 0.16 | % | ||||||||||||||||||||||||||||||||||||||||||||||||||||||||||||
Senior notes (Stifel Financial Corp.) | 460,178 | 26,617 | 5.78 | % | 325,000 | 20,648 | 6.35 | % | 168,989 | 11,777 | 6.97 | % | ||||||||||||||||||||||||||||||||||||||||||||||||||||||||||||
Interest-bearing liabilities (Capital Trusts) | 82,500 | 2,956 | 3.58 | % | 82,500 | 3,929 | 4.76 | % | 82,500 | 5,077 | 6.15 | % | 82,500 | 1,687 | 2.04 | % | 82,500 | 1,729 | 2.10 | % | 82,500 | 2,956 | 3.58 | % | ||||||||||||||||||||||||||||||||||||||||||||||||
Other (Stifel Nicolaus) | 738 | 2,022 | 1,582 | |||||||||||||||||||||||||||||||||||||||||||||||||||||||||||||||||||||
Other (Stifel) | 3,863 | 8,888 | 1,379 | |||||||||||||||||||||||||||||||||||||||||||||||||||||||||||||||||||||
|
|
|
|
|
| |||||||||||||||||||||||||||||||||||||||||||||||||||||||||||||||||||
Total interest expense | $ | 33,383 | $ | 25,347 | $ | 13,211 | $ | 41,261 | $ | 46,368 | $ | 33,370 | ||||||||||||||||||||||||||||||||||||||||||||||||||||||||||||
|
|
|
|
|
| |||||||||||||||||||||||||||||||||||||||||||||||||||||||||||||||||||
Net interest income | $ | 76,393 | $ | 64,119 | $ | 52,115 | $ | 144,708 | $ | 96,171 | $ | 75,335 | ||||||||||||||||||||||||||||||||||||||||||||||||||||||||||||
|
|
|
|
|
| |||||||||||||||||||||||||||||||||||||||||||||||||||||||||||||||||||
| * | See Distribution of Assets, Liabilities, and Shareholders’ Equity; Interest Rates and Interest Rate Differential table included in “Results of Operations – Global Wealth Management” for additional information on Stifel Bank’s average balances and interest income and expense. |
Year Ended December 31, 20122014 Compared With Year Ended December 31, 20112013
Net interest income– Net interest income is the difference between interest earned on interest-earning assets and interest paid on funding sources. Net interest income is affected by changes in the volume and mix of these assets and liabilities, as well as by fluctuations in interest rates and portfolio management strategies. For the year ended December 31, 2012,2014, net interest income increased 19.1%50.5% to $76.4$144.7 million from $64.1$96.2 million in 2011.2013.
For the year ended December 31, 2012,2014, interest revenue increased 22.7%30.5% to $109.8$186.0 million from $89.5$142.5 million in 2011,2013, principally as a result of a $17.9$41.7 million increase in interest revenue generated from the growth in interest-earning assets of Stifel Bank. The average interest-earning assets of Stifel Bank increased to $2.9$4.9 billion during the year ended December 31, 20122014, compared to $1.9$4.2 billion in 2011during 2013 at weighted average interest rates of 2.60%2.91% and 2.94%2.42%, respectively.
For the year ended December 31, 2014, interest expense decreased 11.0% to $41.3 million from $46.4 million in 2013. The decrease is primarily attributable to a decline in interest expense paid on the interest-bearing liabilities of Stifel Bank and the payoff of our non-recourse debt during the fourth quarter of 2013, partially offset by the interest expense associated with our July 2014 issuance of $300.0 million of 4.250% senior notes.
Year Ended December 31, 2013 Compared With Year Ended December 31, 2012
Net interest income– For the year ended December 31, 2013, net interest income increased 27.7% to $96.2 million from $75.3 million in 2012.
For the year ended December 31, 2013, interest revenue increased 31.1% to $142.5 million from $108.7 million in 2012, principally as a result of a $26.6 million increase in revenue generated from the growth in interest-earning assets of Stifel Bank. The average interest-earning assets of Stifel Bank increased to $4.2 billion during the year ended December 31, 2013, compared to $2.9 billion in 2012 at average interest rates of 2.42% and 2.60%, respectively.
For the year ended December 31, 2013, interest expense increased 31.7%39.0% to $46.4 million from $33.4 million from $25.3 million in 2011.2012. The increase is primarily attributable to the interest expense associated with our $325.0 million senior notes, offset by a reduction in interest expense on $47.5December 2012 issuance of $150.0 million of our debentures to Stifel Financial Capital Trusts whose interest rates switched from fixed rate of 6.8% per year to a floating rate equal to the three-month LIBOR plus 1.85% per annum during 2012.
Year Ended December 31, 2011 Compared With Year Ended December 31, 2010
Net interest income –For the year ended December 31, 2011, net interest income increased to $64.1 million from $52.1 million in 2010.
For the year ended December 31, 2011, interest revenue increased 37.0% to $89.5 million from $65.3 million in 2010, principally as a result of an $21.8 million increase in interest revenue generated from the interest-earning assets of Stifel Bank and a $2.1 million increase in interest revenue from customer margin borrowing. The average interest-earning assets of Stifel Bank increased to $1.9 billion during the year ended December 31, 2011 compared to $1.3 billion in 2010 at weighted average interest rates of 2.94% and 2.72%, respectively. The average margin balances of Stifel Nicolaus increased to $456.2 million during the year ended December 31, 2011 compared to $385.0 million in 2010 at weighted average interest rates of 4.09% and 4.29%, respectively.
For the year ended December 31, 2011, interest expense increased 91.9% to $25.3 million from $13.2 million in 2010. The increase is primarily attributable to an increase in interest expense on interest-bearing liabilities of Stifel Bank and increased interest expense paid on borrowings from our unsecured line of credit during the year ended December 31, 2011, offset by a reduction in interest expense on the $35.0 million Cumulative Trust Preferred Security offered by Stifel Financial Capital Trust II whose interest rate switched from a fixed rate of 6.38% per year to a floating rate equal to the three-month London Interbank Offered Rate (“LIBOR”) plus 1.70% on an annual basis beginning on September 30, 2010. See “Net Interest Income” table above for more details. For a further discussion of interest expense see “Net Interest Income – Stifel Bank” below.
NON-INTEREST EXPENSES
The following table presents consolidated non-interest expenses for the periods indicated(in thousands, except percentages):
| For the Year Ended December 31, | Percentage Change | |||||||||||||||||||||||||||||||||||||||
| For the Year Ended December 31, | Percentage Change | 2014 | 2013 | 2012 | 2014 vs. 2013 | 2013 vs. 2012 | ||||||||||||||||||||||||||||||||||
| 2012 | 2011 | 2010 | 2012 vs. 2011 | 2011 vs. 2010 | ||||||||||||||||||||||||||||||||||||
Non-interest expenses: | ||||||||||||||||||||||||||||||||||||||||
Compensation and benefits | $ | 1,023,943 | $ | 900,421 | $ | 1,056,202 | 13.7 | % | (14.7 | ) % | $ | 1,403,932 | $ | 1,311,386 | $ | 1,010,140 | 7.1 | % | 29.8 | % | ||||||||||||||||||||
Occupancy and equipment rental | 130,247 | 121,929 | 115,742 | 6.8 | 5.3 | 169,040 | 158,268 | 128,365 | 6.8 | 23.3 | ||||||||||||||||||||||||||||||
Communications and office supplies | 80,941 | 75,589 | 69,929 | 7.1 | 8.1 | 106,926 | 99,726 | 79,406 | 7.2 | 25.6 | ||||||||||||||||||||||||||||||
Commissions and floor brokerage | 30,870 | 27,040 | 26,301 | 14.2 | 2.8 | 36,555 | 37,225 | 29,610 | (1.8 | ) | 25.7 | |||||||||||||||||||||||||||||
Other operating expenses | 120,777 | 152,975 | 114,081 | (21.0 | ) | 34.1 | 201,177 | 181,612 | 116,845 | 10.8 | 55.4 | |||||||||||||||||||||||||||||
|
|
|
|
|
|
|
|
|
| |||||||||||||||||||||||||||||||
Total non-interest expenses | $ | 1,386,778 | $ | 1,277,954 | $ | 1,382,255 | 8.5 | % | (7.5 | ) % | $ | 1,917,630 | $ | 1,788,217 | $ | 1,364,366 | 7.2 | % | 31.1 | % | ||||||||||||||||||||
|
|
|
|
|
|
|
|
|
| |||||||||||||||||||||||||||||||
Year Ended December 31, 20122014 Compared With Year Ended December 31, 20112013
Except as noted in the following discussion of variances, the underlying reasons for the increase in non-interest expenses can be attributed principally to our continued expansion, both organically and through our acquisitions, and increased administrative overhead to support the growth in our segments.
Compensation and benefits – Compensation and benefits expenses, which are the largest component of our expenses, include salaries, bonuses, transition pay, benefits, amortization of stock-based compensation, employment taxes, and other employee-related costs. A significant portion of compensation expense is comprised of production-based variable compensation, including discretionary bonuses, which fluctuates in proportion to the level of business activity, increasing with higher revenues and operating profits. Other compensation costs, including base salaries, stock-based compensation amortization, and benefits, are more fixed in nature.
For the year ended December 31, 2012,2014, compensation and benefits expense increased 13.7%, or $123.5 million,7.1% to $1.02$1.40 billion from $900.4 million$1.31 billion in 20112013. The increase in compensation and benefits expense is primarily attributableprincipally due to the following: 1) increased variable compensation as a result of increased revenue production and profitability; 2) increasedan increase in fixed compensation for the additional administrative support staff; and 3) additional incentive compensationincreased headcount.
Compensation and benefits expense for the year ended December 31, 2014, includes a non-cash charge of $17.9 million (pre-tax) related to the expensing of certain restricted stock awards granted to employees of Oriel and 1919 Investment Counsel at the respective closing dates of those acquisitions. There were no continuing service requirements associated with our investment in Knight Capital Group, Inc.;these restricted stock awards, and 4) an increase in deferred compensation expense as a resultaccordingly, they were expensed on the date of the acceleration of the vesting period for unit grants awarded to newly retirement-eligible employees during the first quarter of 2012.grant.
Compensation and benefits expense as a percentage of net revenues was 63.5% for the year ended December 31, 2012 compared to 63.6% for the year ended December 31, 2011.
For2014, compared to 66.5% for the year ended December 31, 2012,2013.
A portion of compensation and benefits expenses includes transition pay, principally in the form of upfront notes, signing bonuses, and retention awards in connection with our continuing expansion efforts, was $80.9of $104.2 million (5.0%(4.7% of net revenues), for the year ended December 31, 2014, compared to $70.9$91.5 million (5.0%(4.6% of net revenues) in 2011.2013. The upfront notes are amortized over a fivefive- to ten yearten-year period.
Occupancy and equipment rental –For the year ended December 31, 2012,2014, occupancy and equipment rental expense increased 6.8% to $130.2$169.0 million from $121.9$158.3 million during the year ended December 31, 2011.in 2013. The increase is primarily due to the increase in rent and depreciation expense due primarily to an increase in office locations. As of December 31, 2012,2014, we have 340367 locations compared to 320357 at December 31, 2011.2013.
Communications and office supplies – Communications expense includes costs for telecommunication and data transmission, primarily for obtaining third-party market data information. For the year ended December 31, 2012,2014, communications and office supplies expense increased 7.1%7.2% to $80.9$106.9 million from $75.6$99.7 million in 2011.2013. The increase is primarily attributable to increased telecommunications costs as a resultour growth from our acquisitions and the addition of the growth of the business.revenue producers and support staff.
Commissions and floor brokerage –For the year ended December 31, 2012,2014, commissions and floor brokerage expense increased 14.2%decreased 1.8% to $30.9$36.6 million from $27.0$37.2 million in 2011.2013. The increasedecrease is primarily attributable to the growth of the business.
Other operating expenses –Other operating expenses primarily include license and registration fees, litigation-related expenses, which consist of amounts we reserve and/or pay related topayout for legal and regulatory matters, travel and entertainment, promotional, expenses and expenses for professional services.service expenses.
For the year ended December 31, 2012, other operating expenses decreased 21.0% to $120.8 million from $153.0 million during the year ended December 31, 2011, which included $45.5 million of litigation-related expenses associated with the civil lawsuit and related regulatory investigation in connection with the ongoing matter with five Southeastern Wisconsin school districts. Excluding the litigation-related expenses2014, other operating expenses increased 12.3%10.8% to $201.2 million from 2011.
$181.6 million in 2013. The increase is primarily attributable to increased legal expenses, professional fees, conference expenses and travel and promotion expenses. Thean increase in legal expenses, is attributable to a number of factors, including costs to defend regulatory matters, customer claims, and industry recruiting claims. We are subject to various proceedings and claims arising primarily fromprofessional service fees in connection with our securities business activities, including lawsuits, arbitration claims, class actions,acquisition and regulatory matters.compliance enhancement measures, travel and promotion, and license fees.
Provision for income taxes –For the year ended December 31, 2012,2014, our provision for income taxes was $87.3$111.7 million, representing an effective tax rate of 38.6%38.4%, compared to $54.5$12.3 million in 2011,2013, representing an effective tax rate of 39.3%6.7%. The provision for income taxes for the year ended December 31, 2014, was impacted by the decrease in the valuation allowance related to certain state credits and foreign net operating losses that we have determined to be more likely than not realizable. The provision for income taxes for the year ended December 31, 2013, was impacted by the U.S. tax benefit arising out of our company’s investment in SN Canada.
Year Ended December 31, 20112013 Compared With Year Ended December 31, 20102012
Except as noted in the following discussion of variances, the underlying reasons for the increase in non-interest expenses can be attributed principally to our continued expansion, both organically and through our acquisitions of KBW, Inc. on February 15, 2013, the Knight Capital Fixed Income business on July 1, 2013, and Miller Buckfire on December 20, 2012, and increased administrative overhead to support the growth in our segments. The increases in non-interest expenses for the year ended December 31, 2011 is also attributable to the acquisition of TWPG on July 1, 2010.
Compensation and benefits – Compensation and benefits expenses, which are the largest component of our expenses, include salaries, bonuses, transition pay, benefits, amortization of stock-based compensation, employment taxes and other employee-related costs. A significant portion of compensation expense is comprised of production-based variable compensation, including discretionary bonuses, which fluctuates in proportion to the level of business activity, increasing with higher revenues and operating profits. Other compensation costs, including base salaries, stock-based compensation amortization, and benefits, are more fixed in nature.
For the year ended December 31, 2011, compensation and benefits expense decreased 14.7%, or $155.8 million, to $900.4 million from $1.1 billion in 2010, which included $186.3 million related to the modification of the company’s deferred compensation plan and merger-related expenses. Excluding the acceleration of deferred compensation expense and merger-related expenses,2013, compensation and benefits expense increased 3.3%29.8% to $1.31 billion from 2010.$1.01 billion in 2012. The increase is primarily attributableprincipally due to the following: 1) increased base salariesvariable compensation as a result of increased revenue production and profitability; 2) an increase in fixed compensation for the additional compensation expense fromadministrative support staff: and 3) the acquisitionexpensing of TWPG.
On the respective closing dates of the acquisitions of KBW, Inc. and the Knight Capital Fixed Income business, we granted restricted stock or restricted stock units to certain employees as retention. There are no continuing service requirements associated with these restricted stock awards, and accordingly, they were expensed on the date of grant. The expensing of the awards resulted in a non-cash charge (pre-tax) during the year ended December 31, 2013, of $50.7 million.
Compensation and benefits expense as a percentage of net revenues was 63.6%66.5% for the year ended December 31, 2011. Excluding the acceleration of deferred compensation expenses and merger-related expenses, compensation and benefits expense as a percentage of net revenues was 62.9%2013, compared to 63.4% for the year ended December 31, 2010.2012.
For the year ended December 31, 2011,Compensation and benefits expenses includes transition pay, principally in the form of upfront notes, signing bonuses, and retention awards in connection with our continuing expansion efforts, was $70.9of $91.5 million (5.0%(4.6% of net revenues), for the year ended December 31, 2013, compared to $79.8$73.1 million (5.8%(4.6% of net revenues) in 2010.2012. The upfront notes are amortized over a fivefive- to ten yearten-year period. The decrease in transition pay is primarily attributable to a reduction in unit amortization expense resulting from the modification of our deferred compensation plan in 2010.
Occupancy and equipment rental –For the year ended December 31, 2011,2013, occupancy and equipment rental expense increased 5.3%23.3% to $121.9$158.3 million from $115.7$128.4 million during the year ended December 31, 2010.in 2012. The increase is primarily due to the increase in rent and depreciation expense due primarily to an increase in office locations. As of December 31, 2011,2013, we have 320357 locations compared to 312338 at December 31, 2010.2012.
Communications and office supplies – Communications expense includes costs for telecommunication and data transmission, primarily for obtaining third-party market data information. For the year ended December 31, 2011,2013, communications and office supplies expense increased 8.1%25.6% to $75.6$99.7 million from $69.9$79.4 million in 2010. The increase is primarily attributable to increased telecommunications costs as a result of the growth of the business.2012.
Commissions and floor brokerage –For the year ended December 31, 2011,2013, commissions and floor brokerage expense increased 2.8%25.7% to $27.0$37.2 million from $26.3$29.6 million in 2010.2012. The increase is primarily attributable the growth of the business.
Other operating expenses –Other operating expenses primarily include license and registration fees, litigation-related expenses, which consist of amounts we reserve and/or pay out related to legal and regulatory matters, travel and entertainment, promotional expenses and expenses for professional services.
For the year ended December 31, 2011, other operating expenses increased 34.1% to $153.0 million from $114.1 million during the year ended December 31, 2010. The increase in other operating expenses over the prior year period is primarily attributable to an increase in litigation-relatedclearing fees as a result of an increase in trading activity.
Other operating expenses associated with– For the civil lawsuit and related regulatory investigation in connection with the ongoing matter with five Southeastern Wisconsin school districts. For a discussion of our legal matters, including the OPEB litigation, see Item 3, “Legal Proceedings.” Excluding the litigation-related expenses of $45.4 million in 2011 and the merger-related expenses of $8.7 million in 2010,year ended December 31, 2013, other operating expenses increased 2.1%55.4% to $181.6 million from 2010.
$116.8 million during in 2012. The increase is alsoprimarily attributable to increased legal expenses, professional fees, conference expenses and travel and promotion expenses. Thean increase in legal expenses, is attributable to a number of factors, including significant litigationtravel and regulatory matters,promotion, professional service fees in connection with our acquisitions, and an increase in the number of customer claims, as well as litigation costs to defend industry recruiting claims. We are subject to various proceedings and claims arising primarily from our securities business activities, including lawsuits, arbitration claims, class actions, and regulatory matters.subscriptions expenses.
Provision for income taxes – For the year ended December 31, 2011,2013, our provision for income taxes was $54.5$12.3 million, representing an effective tax rate of 39.3%6.7%, compared to a benefit of $2.1$84.5 million in 2010.2012, representing an effective tax rate of 36.8%. We realized a $58.2 million U.S. tax benefit due to a realized loss on our investment in SN Canada in connection with discontinuing the business operations of SN Canada during the third quarter of 2013. See Note 24 to our consolidated financial statements for further discussion of the provision for income taxes.
DISCONTINUED OPERATIONS
SN Canada ceased business operations as of September 30, 2013. The 2010 provision was impacted by state tax adjustments, a changeresults of SN Canada, previously reported in the valuation allowance, and an increase in the rate appliedInstitutional Group segment, are classified as discontinued operations for all periods presented.
| Year Ended December 31, | ||||||||||||
| (in thousands) | 2014 | 2013 | 2012 | |||||||||
Net revenues | $ | (121 | ) | $ | 11,794 | $ | 18,537 | |||||
Restructuring expense | 217 | 6,881 | — | |||||||||
Operating expenses | 3,924 | 15,697 | 22,412 | |||||||||
|
|
|
|
|
| |||||||
Total non-interest expenses | 4,141 | 22,578 | 22,412 | |||||||||
|
|
|
|
|
| |||||||
Income/(loss) from discontinued operations before income taxes | (4,262 | ) | (10,784 | ) | (3,875 | ) | ||||||
Income tax expense/(benefit) | (1,199 | ) | 110 | 2,848 | ||||||||
|
|
|
|
|
| |||||||
Loss from discontinued operations, net of tax | $ | (3,063 | ) | $ | (10,894 | ) | $ | (6,723 | ) | |||
|
|
|
|
|
| |||||||
See Note 4 to the Company’s deferred tax assets.our consolidated financial statements for further discussion of our discontinued operations.
SEGMENT ANALYSISPERFORMANCE FROM CONTINUING OPERATIONS
Our reportable segments include Global Wealth Management, Institutional Group, and Other.
Our Global Wealth Management segment consists of two businesses, the Private Client Group and Stifel Bank. The Private Client Group includes branch offices and independent contractor offices of our broker-dealer subsidiaries located throughout the United States, primarily in the Midwest and Mid-Atlantic regions with a growing presence in the Northeast, Southeast and Western United States. These branches provide securities brokerage services, including the sale of equities, mutual funds, fixed income products, and insurance, as well as offering banking products to their private clients through Stifel Bank, which provides residential, consumer, and commercial lending, as well as Federal Depository Insurance Corporation (“FDIC”)-insuredFDIC-insured deposit accounts to customers of our broker-dealer subsidiaries and to the general public.
The success of our Global Wealth Management segment is dependent upon the quality of our products, services, financial advisors, and support personnel, including our ability to attract, retain, and motivate a sufficient number of these associates. We face competition for qualified associates from major financial services companies, including other brokerage firms, insurance companies, banking institutions, and discount brokerage firms. Segment operating income and segment pre-tax operating margin are used to evaluate and measure segment performance by our management team in deciding how to allocate resources and in assessing performance.
The Institutional Group segment includes institutional sales and trading. It provides securities brokerage, trading, and research services to institutions with an emphasis on the sale of equity and fixed income products. This segment also includes the management of and participation in underwritings for both corporate and public finance (exclusive of sales credits generated through the private client group, which are included in the Global Wealth Management segment), merger and acquisition, and financial advisory services.
The success of our Institutional Group segment is dependent upon the quality of our personnel, the quality and selection of our investment products and services, pricing (such as execution pricing and fee levels), and reputation. Segment operating income and segment pre-tax operating margin are used to evaluate and measure segment performance by our management team in deciding how to allocate resources and in assessing performance.
The Other segment includes interest income from stock borrow activities, unallocated interest expense, interest income and gains and losses from investments held, and all unallocated overhead cost associated with the execution of orders; processing of securities transactions; custody of client securities; receipt, identification, and delivery of funds and securities; compliance with regulatory and legal requirements; internal financial accounting and controls; and general administration.
Results of Operations – Global Wealth Management
The following table presents consolidated financial information for the Global Wealth Management segment for the periods indicated(in thousands, except percentages):
| For the Year Ended December 31, | Percentage Change | As a Percentage of Net Revenues for the Year Ended December 31, | For the Year Ended December 31, | Percentage Change | As a Percentage of Net Revenues for the Year Ended December 31, | |||||||||||||||||||||||||||||||||||||||||||||||||||||||||||
| 2012 | 2011 | 2010 | 2012 vs. 2011 | 2011 vs. 2010 | 2012 | 2011 | 2010 | 2014 | 2013 | 2012 | 2014 vs. 2013 | 2013 vs. 2012 | 2014 | 2013 | 2012 | |||||||||||||||||||||||||||||||||||||||||||||||||
Revenues: | ||||||||||||||||||||||||||||||||||||||||||||||||||||||||||||||||
Commissions | $ | 361,884 | $ | 371,046 | $ | 321,541 | (2.5 | ) % | 15.4 | % | 36.4 | % | 40.9 | % | 38.2 | % | $ | 453,730 | $ | 428,610 | $ | 370,941 | 5.9 | % | 15.5 | % | 36.8 | % | 38.4 | % | 37.4 | % | ||||||||||||||||||||||||||||||||
Principal transactions | 228,221 | 209,962 | 239,851 | 8.7 | (12.5 | ) | 22.9 | 23.1 | 28.4 | 184,476 | 204,194 | 209,716 | (9.7 | ) | (2.6 | ) | 15.0 | 18.3 | 21.2 | |||||||||||||||||||||||||||||||||||||||||||||
Asset management and service fees | 257,257 | 228,045 | 192,073 | 12.8 | 18.7 | 25.9 | 25.1 | 22.8 | 385,182 | 304,541 | 257,257 | 26.5 | 18.4 | 31.2 | 27.3 | 25.9 | ||||||||||||||||||||||||||||||||||||||||||||||||
Interest | 97,091 | 79,083 | 54,543 | 22.8 | 45.0 | 9.8 | 8.7 | 6.5 | 166,402 | 122,413 | 97,048 | 35.9 | 26.1 | 13.5 | 10.9 | 9.8 | ||||||||||||||||||||||||||||||||||||||||||||||||
Investment banking | 45,254 | 20,475 | 22,768 | 121.0 | (10.1 | ) | 4.5 | 2.3 | 2.7 | 45,768 | 49,921 | 51,140 | (8.3 | ) | (2.4 | ) | 3.7 | 4.4 | 5.2 | |||||||||||||||||||||||||||||||||||||||||||||
Other income | 23,215 | 21,442 | 22,202 | 8.3 | (3.4 | ) | 2.3 | 2.3 | 2.6 | 8,801 | 25,165 | 23,215 | (65.0 | ) | 8.4 | 0.7 | 2.3 | 2.3 | ||||||||||||||||||||||||||||||||||||||||||||||
|
|
|
|
|
|
|
|
|
|
|
|
|
|
|
| |||||||||||||||||||||||||||||||||||||||||||||||||
Total revenues | 1,012,922 | 930,053 | 852,978 | 8.9 | 9.0 | 101.8 | 102.4 | 101.2 | 1,244,359 | 1,134,844 | 1,009,317 | 9.7 | 12.4 | 100.9 | 101.6 | 101.8 | ||||||||||||||||||||||||||||||||||||||||||||||||
Interest expense | 17,733 | 21,895 | 9,709 | (19.0 | ) | 125.5 | 1.8 | 2.4 | 1.2 | 11,708 | 17,665 | 17,720 | (33.7 | ) | (0.3 | ) | 0.9 | 1.6 | 1.8 | |||||||||||||||||||||||||||||||||||||||||||||
|
|
|
|
|
|
|
|
|
|
|
|
|
|
|
| |||||||||||||||||||||||||||||||||||||||||||||||||
Net revenues | 995,189 | 908,158 | 843,269 | 9.6 | 7.7 | 100.0 | 100.0 | 100.0 | 1,232,651 | 1,117,179 | 991,597 | 10.3 | 12.7 | 100.0 | 100.0 | 100.0 | ||||||||||||||||||||||||||||||||||||||||||||||||
|
|
|
|
|
|
|
|
|
|
|
|
|
|
|
| |||||||||||||||||||||||||||||||||||||||||||||||||
Non-interest expenses: | ||||||||||||||||||||||||||||||||||||||||||||||||||||||||||||||||
Compensation and benefits | 578,652 | 528,835 | 503,456 | 9.4 | 5.0 | 58.1 | 58.2 | 59.7 | 703,679 | 648,681 | 576,744 | 8.5 | 12.5 | 57.1 | 58.1 | 58.2 | ||||||||||||||||||||||||||||||||||||||||||||||||
Occupancy and equipment rental | 63,162 | 61,548 | 60,886 | 2.6 | 1.1 | 6.3 | 6.8 | 7.2 | 71,526 | 65,686 | 63,146 | 8.9 | 4.0 | 5.8 | 5.8 | 6.4 | ||||||||||||||||||||||||||||||||||||||||||||||||
Communication and office supplies | 36,217 | 34,170 | 31,356 | 6.0 | 9.0 | 3.6 | 3.8 | 3.7 | 38,779 | 36,897 | 36,105 | 5.1 | 2.2 | 3.2 | 3.3 | 3.6 | ||||||||||||||||||||||||||||||||||||||||||||||||
Commissions and floor brokerage | 12,999 | 11,729 | 12,126 | 10.8 | (3.3 | ) | 1.3 | 1.3 | 1.5 | 13,913 | 15,185 | 12,999 | (8.4 | ) | 16.8 | 1.1 | 1.4 | 1.3 | ||||||||||||||||||||||||||||||||||||||||||||||
Other operating expenses | 35,976 | 36,494 | 41,422 | (1.4 | ) | (11.9 | ) | 3.7 | 4.0 | 4.9 | 57,776 | 51,158 | 35,934 | 12.9 | 42.4 | 4.7 | 4.6 | 3.6 | ||||||||||||||||||||||||||||||||||||||||||||||
|
|
|
|
|
|
|
|
|
|
|
|
|
|
|
| |||||||||||||||||||||||||||||||||||||||||||||||||
Total non-interest expenses | 727,006 | 672,776 | 649,246 | 8.1 | 3.6 | 73.0 | 74.1 | 77.0 | 885,673 | 817,607 | 724,928 | 8.3 | 12.8 | 71.9 | 73.2 | 73.1 | ||||||||||||||||||||||||||||||||||||||||||||||||
|
|
|
|
|
|
|
|
|
|
|
|
|
|
|
| |||||||||||||||||||||||||||||||||||||||||||||||||
Income before income taxes | $ | 268,183 | $ | 235,382 | $ | 194,023 | 13.9 | % | 21.3 | % | 27.0 | % | 25.9 | % | 23.0 | % | $ | 346,978 | $ | 299,572 | $ | 266,669 | 15.8 | % | 12.3 | % | 28.1 | % | 26.8 | % | 26.9 | % | ||||||||||||||||||||||||||||||||
|
|
|
|
|
|
|
|
|
|
|
|
|
|
|
| |||||||||||||||||||||||||||||||||||||||||||||||||
| December 31, | ||||||||||||||||||||||||
| 2014 | 2013 | 2012 | ||||||||||||||||||||||
| December 31, 2012 | December 31, 2011 | December 31, 2010 | ||||||||||||||||||||||
Branch offices (actual) | 307 | 291 | 285 | 330 | 316 | 307 | ||||||||||||||||||
Financial advisors (actual) | 1,890 | 1,833 | 1,775 | 1,965 | 1,934 | 1,890 | ||||||||||||||||||
Independent contractors (actual) | 151 | 154 | 160 | 138 | 143 | 151 | ||||||||||||||||||
Assets in fee-based accounts: | ||||||||||||||||||||||||
Value (in thousands) | $ | 20,787,676 | $ | 18,415,613 | $ | 14,800,052 | ||||||||||||||||||
Number of accounts (actual) | 80,855 | 70,314 | 57,269 | |||||||||||||||||||||
Year Ended December 31, 20122014 Compared With Year Ended December 31, 20112013
NET REVENUES
For the year ended December 31, 2012,2014, Global Wealth Management net revenues increased 9.6%10.3% to a record $995.2 million$1.23 billion from $908.2 million$1.12 billion in 2011.2013. The increase in net revenues for the year ended December 31, 20122014, over 2013, is primarily attributable to growth in asset management and service fees; increased net interest revenues; and an increase in commission revenues. The increase in net revenues was partially offset by a decline in principal transaction revenues, other income, and investment banking revenues.
Commissions –For the year ended December 31, 2014, commission revenues increased 5.9% to $453.7 million from 2011$428.6 million in 2013. The increase is primarily attributable to an increase in agency transactions in equities, mutual funds, and insurance products, partially offset by lower trading volumes impacting the environment for both us and the industry.
Principal transactions – For the year ended December 31, 2014, principal transactions revenues decreased 9.7% to $184.5 million from $204.2 million in 2013. The decrease is primarily attributable to a decrease in fixed income products as a result of lower trading volumes and the current, low interest rate environment.
Asset management and service fees –For the year ended December 31, 2014, asset management and service fees increased 26.5% to $385.2 million from $304.5 million in 2013. The increase is primarily a result of an increase in assets under management in our fee-based accounts. Fee-based account revenues are billed in arrears based on values as of the prior period end. The value of assets in fee-based accounts at December 31, 2014 increased 20.4% to 34.9 billion from 29.0 billion at December 31, 2013, of which 52.9% is attributable to net inflows and 47.1% is attributable to market appreciation. The number of fee-based accounts at December 31, 2014, increased 15.4% from December 31, 2013.
Interest revenue –For the year ended December 31, 2014, interest revenue increased 35.9% to $166.4 million from $122.4 million in 2013. The increase is primarily due to the growth of the interest-earning assets of Stifel Bank. This growth is driven by an increase in the loan portfolio, which has higher yields and increased interest rates on our investment portfolio. See “Net Interest Income – Stifel Bank” below for a further discussion of the changes in net revenues.
Investment banking – Investment banking, which represents sales credits for investment banking underwritings, decreased 8.3% to $45.8 million for the year ended December 31, 2014, from $49.9 million in 2013. The decrease is primarily attributable to a decrease in corporate equity sales credits from 2013.
Other income –For the year ended December 31, 2014, other income decreased 65.0% to $8.8 million from $25.2 million 2013. The decrease from 2013 is primarily attributable to a decrease in mortgage fees from loan originations at Stifel Bank and investment losses.
Interest expense –For the year ended December 31, 2014, interest expense decreased 33.7% to $11.7 million from $17.7 million in 2013. The decrease is primarily attributable to lower interest expense on the interest-bearing liabilities of Stifel Bank, which is driven by the run-off of the time deposits from the Acacia Federal acquisition and amortization of the notional value of our interest rate derivatives.
NON-INTEREST EXPENSES
For the year ended December 31, 2014, Global Wealth Management non-interest expenses increased 8.3% to $885.7 million from $817.6 million in 2013.
The fluctuations in non-interest expenses, discussed below, were primarily attributable to the continued growth of our Private Client Group. As of December 31, 2014, we have 330 branch offices compared to 316 at December 31, 2013. In addition, since December 31, 2013, we have added 123 financial advisors and 332 support staff.
Compensation and benefits –For the year ended December 31, 2014, compensation and benefits expense increased 8.5% to $703.7 million from $648.7 million in 2013. The increase is principally due to increased variable compensation as a result of increased production due to the growth in financial advisors and fixed compensation for the additional administrative support staff. Compensation and benefits expense as a percentage of net revenues was 57.1% for the year ended December 31, 2014, compared to 58.1% in 2013.
A portion of compensation and benefits expenses includes transition pay, principally in the form of upfront notes, signing bonuses, and retention awards in connection with our continuing expansion efforts, of $65.5 million (5.3% of net revenues) for the year ended December 31, 2014, compared to $65.8 million (5.9% of net revenues) in 2013. The upfront notes are amortized over a five- to ten-year period.
Occupancy and equipment rental –For the year ended December 31, 2014, occupancy and equipment rental expense increased 8.9% to $71.5 million from $65.7 million in 2013. The increase is primarily due to the increase in office locations.
Communications and office supplies –For the year ended December 31, 2014, communications and office supplies expense increased 5.1% to $38.8 million from $36.9 million in 2013. The increase is primarily attributable to higher office supplies expense as a result of the continued expansion of the segment.
Commissions and floor brokerage –For the year ended December 31, 2014, commissions and floor brokerage expense decreased 8.4% to $13.9 million from $15.2 million in 2013. The decrease is primarily attributable to a decrease in clearing fees.
Other operating expenses –For the year ended December 31, 2014, other operating expenses increased 12.9% to $57.8 million from $51.2 million in 2013. The increase in other operating expenses is primarily attributable to an increase in legal expenses and professional service fees.
INCOME BEFORE INCOME TAXES
For the year ended December 31, 2014, income before income taxes increased 15.8% to $347.0 million from $299.6 million in 2013. Profit margins (income before income taxes as a percent of net revenues) were positively impacted by revenue growth.
Year Ended December 31, 2013 Compared With Year Ended December 31, 2012
NET REVENUES
For the year ended December 31, 2013, Global Wealth Management net revenues increased 12.7% to $1.12 billion from $991.6 million in 2012. The increase in net revenues for the year ended December 31, 2013 from 2012, is attributable to an increase in commission revenues; growth in asset management and service fees as a result of an increase in assets under management through market performance; higher investment banking revenues; increased principal transactions revenues as a result of strong trading volumesperformance and tightening credit spreads;increase in client assets; and increased net interest revenues as a result of the growth of net interest-earning assets at Stifel Bank, offset by a decline in commission revenues. The difficult market conditions have impacted the commission revenues derived from our retail clients during 2012.Bank.
Commissions –For the year ended December 31, 2012,2013, commission revenues decreased 2.5%increased 15.5% to $361.9$428.6 million from $371.0$370.9 million in 2011.2012. The decrease in commission revenuesincrease is primarily attributable to a decreasean increase in agency transactions primarilyin mutual funds, equities, and insurance products.
Principal transactions – For the year ended December 31, 2012,2013, principal transactions revenues increased 8.7%decreased 2.6% to $228.2$204.2 million from $210.0$209.7 million in 2011.2012. The increase in principal transactions revenuesdecrease is primarily attributable to increased volumes in fixed income products from 2011.lower trading volumes.
Asset management and service fees –For the year ended December 31, 2012,2013, asset management and service fees increased 12.8%18.4% to $304.5 million from $257.3 million from $228.0 million in 2011.2012. The increase in asset management and service fess is primarily a result of an increase in investment advisory revenues.assets under management in our fee-based accounts. The value of assets in fee-based accounts increased 12.9%23.8% from December 31, 2011,2012, of which approximately 32%47.3% is attributable to net inflows and approximately 68%52.7% is attributable to market appreciation. See “Assets inThe number of fee-based accounts” included in the table above for further details.accounts at December 31, 2013, increased 13.9% from December 31, 2012.
Interest revenue –For the year ended December 31, 2012,2013, interest revenue increased 22.8%26.1% to $97.1$122.4 million from $79.1$97.0 million in 2011.2012. The increase in interest revenue is primarily attributabledue to the growth of the interest-earning assets of Stifel Bank and increased interest rates on our investment portfolio. See “Distribution of Assets, Liabilities, and Shareholders’ Equity; Interest Rates and Interest Rate Differential”“Statistical Disclosure By Bank Holding Company” below for a further discussion of the changes in net interest income.income at Stifel Bank.
Investment banking –Investment banking which represents sales creditsdecreased 2.4% to $49.9 million for investment banking underwritings, increased 121.0% to $45.3 millionthe year ended December 31, 2013, from $20.5$51.1 million in 2011.2012. See “Investment banking” in the Institutional Group segment discussion for information on the changes in investment banking revenues.
Other income –For the year ended December 31, 2012,2013, other income increased 8.3%8.4% to $25.2 million from $23.2 million from $21.4 million in 2011.2012. The increase in other income is primarily attributable to an increase in investment gains on our private equity investments, the recognized gain on the acquisition of Acacia Federal, and an increase in mortgage banking fees due to the increase in loan originations and sales at Stifel Bank and an increase in investment gains from 2011.Bank.
Interest expense –For the year ended December 31, 2012,2013, interest expense decreased 19.0% toremained unchanged from 2012 at $17.7 million from $21.9 million in 2011. The decrease in interest expense is primarily attributable to a decrease in interest expense on the interest-bearing liabilities at Stifel Bank, as a result of lower interest rates.million.
NON-INTEREST EXPENSES
For the year ended December 31, 2012,2013, Global Wealth Management non-interest expenses increased 8.1%12.8% to $727.0$817.6 million from $672.8$724.9 million in 2011.2012.
The fluctuations in non-interest expenses, discussed below, were primarily attributable to the continued growth of our Private Client Group during 2012.Group. As of December 31, 2012,2013, we had 307have 316 branch offices compared to 291307 at December 31, 2011.2012. In addition, since December 31, 2011,2012, we have added 172135 financial advisors and 217243 support staff.
Compensation and benefits –For the year ended December 31, 2012,2013, compensation and benefits expense increased 9.4%12.5% to $578.7$648.7 million from $528.8$576.7 million in 2011. The increase in compensation and benefits expense is principally due to increased variable compensation as a result of increased production due to the growth in the number of financial advisors and fixed compensation for the additional administrative support staff.
Compensation and benefits expense as a percentage of net revenues decreased to 58.1% for the year ended December 31, 2012 compared to 58.2% in 2011. The decrease in compensation and benefits expense as a percent of net revenues is primarily attributable to the increase in net revenues.
Transition pay consists of upfront notes, which are amortized over a five—to ten-year period, signing bonuses and retention awards, and increased overhead in connection with our continued expansion efforts. Transition pay was $63.3 million (6.4% of net revenues) for the year ended December 31, 2012, compared to $58.3 million (6.4% of net revenues) in 2011.
Occupancy and equipment rental –For the year ended December 31, 2012, occupancy and equipment rental expense increased 2.6% to $63.2 million from $61.5 million in 2011. The increase is primarily due to the increase in rent and depreciation expense due primarily to an increase in branch offices.
Communications and office supplies –For the year ended December 31, 2012, communications and office supplies expense increased 6.0% to $36.2 million from $34.2 million in 2011. The increase is primarily attributable to increased telecommunications costs as a result of the growth of the business.
Commissions and floor brokerage –For the year ended December 31, 2012, commissions and floor brokerage expense increased 10.8% to $13.0 million from $11.7 million in 2011. The increase in commissions and floor brokerage expense is primarily attributable to costs associated with the conversion of customer accounts to a new omnibus platform during the first quarter of 2012, offset by lower clearing fees which are generally correlated with the decrease in commission revenues.
Other operating expenses –For the year ended December 31, 2012, other operating expenses decreased 1.4% to $36.0 million from $36.5 million in 2011. The decrease in other operating expenses is primarily attributable to a reduction in legal expenses and professional fees from 2011, offset by an increase in license and registration fees, and subscriptions as a result of the continued growth of the business.
INCOME BEFORE INCOME TAXES
For the year ended December 31, 2012, income before income taxes increased $32.8 million, or 13.9%, to $268.2 million from $235.4 million in 2011. Profit margins have improved as a result of the increase in revenue growth, improved productivity and a reduction in other operating expenses. The increase in profit margins is primarily attributable to the elimination of start-up costs and efficiencies gained at the new branches opened during 2011.
Year Ended December 31, 2011 Compared With Year Ended December 31, 2010
NET REVENUES
For the year ended December 31, 2011, Global Wealth Management net revenues increased 7.7% to a record $908.2 million from $843.3 million in 2010. The increase in net revenues for the year ended December 31, 2011 from 2010 is attributable to higher commission revenues as a result of increased client assets and higher productivity; increased net interest revenues as a result of the growth of net interest-earning assets at Stifel Bank; and growth in asset management and service fees as a result of an increase in assets under management through market performance. The increase in revenue growth was offset by a decline in principal transactions revenue as a result of lower trading volumes.
Commissions –For the year ended December 31, 2011, commission revenues increased 15.4% to $371.0 million from $321.5 million in 2010. The increase is primarily attributable to an increase in agency transactions in equities, mutual funds and insurance products, which is the direct result of an increase in the number of financial advisors, client assets and higher productivity.
Principal transactions – For the year ended December 31, 2011, principal transactions revenues decreased 12.5% to $210.0 million from $239.9 million in 2010. The decrease is primarily attributable to decreased principal transactions, primarily in corporate equity.
Asset management and service fees –For the year ended December 31, 2011, asset management and service fees increased 18.7% to $228.0 million from $192.1 million in 2010. The increase is primarily a result of a 16.8% increase in the value of assets in fee-based accounts from December 31, 2010 and a 20.7% increase in the number of managed accounts attributable principally to the continued growth of the private client group, offset by a reduction in fees for money-fund balances due to the waiving of fees by certain fund managers. In addition, asset management and service fee revenues for the year ended December 31, 2011 were positively impacted by the addition of the TWPG asset management business starting on July 1, 2010. See “Assets in fee-based accounts” included in the table above for further details.
Interest revenue –For the year ended December 31, 2011, interest revenue increased 45.0% to $79.1 million from $54.5 million in 2010. The increase is primarily due to the growth of the interest-earning assets of Stifel Bank. See “Distribution of Assets, Liabilities, and Shareholders’ Equity; Interest Rates and Interest Rate Differential” below for a further discussion of the changes in net interest income. The increase is also attributable to an increase in interest revenue from customer margin borrowing to finance trading activity.
Investment banking –Investment banking, which represents sales credits for investment banking underwritings, decreased 10.1% to $20.5 million from $22.8 million in 2010. See “Investment banking” in the Institutional Group segment discussion for information on the changes in net revenues.
Other income – For the year ended December 31, 2011, other income decreased 3.4% to $21.4 million from $22.2 million in 2010. The decrease is primarily attributable to lower investment gains recognized during 2011, offset by an increase in mortgage fees due to higher loan originations at Stifel Bank.
Interest expense –For the year ended December 31, 2011, interest expense increased 125.5% to $21.9 million from $9.7 million in 2010. The increase is primarily due to the growth of the interest-bearing liabilities of Stifel Bank. See “Distribution of Assets, Liabilities, and Shareholders’ Equity; Interest Rates and Interest Rate Differential” below for a further discussion of the changes in net interest income.
NON-INTEREST EXPENSES
For the year ended December 31, 2011, Global Wealth Management non-interest expenses increased 3.6% to $672.8 million from $649.2 million in 2010.
The fluctuations in non-interest expenses, discussed below, were primarily attributable to the continued growth of our Private Client Group during 2011. As of December 31, 2011, we had 291 branch offices compared to 285 at December 31, 2010. In addition, since December 31, 2010, we have added 339 financial advisors and support staff.
Compensation and benefits –For the year ended December 31, 2011, compensation and benefits expense increased 5.0% to $528.8 million from $503.5 million in 2010.2012. The increase is principally due to increased variable compensation as a result of increased production due to the growth in the number of financial advisors and fixed compensation for the additional administrative support staff, offset by the elimination of deferred compensation expense as a result of the modification to our deferred compensation plan, whereby we removed the service requirement during the third quarter of 2010.staff.
Compensation and benefits expense as a percentage of net revenues decreasedwas 58.1% for the year ended December 31, 2013, compared to 58.2% for the year ended December 31, 2011, compared to 59.7% in 2010. The decrease in compensation and benefits expense as a percent of net revenues is primarily attributable to the increase in net revenues and, to a lesser extent, the reduction in deferred compensation expense, offset by an increase in transition pay.2012.
Transition pay consistswas $65.8 million (5.9% of upfront notes, which are amortized over a five—net revenues) for the year ended December 31, 2013, compared to ten-year period, signing bonuses and retention awards, and increased overhead in connection with our continued expansion efforts. Transition pay was $58.3$63.1 million (6.4% of net revenues) for the year ended December 31, 2011, compared to $54.9 million (6.5% of net revenues) in 2010.2012.
Occupancy and equipment rental –For the year ended December 31, 2011,2013, occupancy and equipment rental expense increased 1.1%4.0% to $61.5$65.7 million from $60.9$63.1 million in 2010. The increase is primarily due to the increase in rent and depreciation expense due primarily to an increase in branch offices.2012.
Communications and office supplies –For the year ended December 31, 2011,2013, communications and office supplies expense increased 9.0%2.2% to $34.2$36.9 million from $31.4$36.1 million in 2010.2012. The increase is primarily attributable to increased telecommunications costs as a result of the growth of the business.an increase in financial advisors.
Commissions and floor brokerage –For the year ended December 31, 2011,2013, commissions and floor brokerage expense decreased 3.3%increased 16.8% to $11.7$15.2 million from $12.1$13.0 million in 2010.2012. The decrease wasincrease is primarily attributable to lower transaction volumes during 2011.an increase in trading activity.
Other operating expenses –For the year ended December 31, 2011,2013, other operating expenses decreased 11.9%increased 42.4% to $36.5$51.2 million from $41.4$35.9 million in 2010.2012. The decreaseincrease in other operating expenses is primarily attributable to a reductionan increase in legal expenses account transfer fees and travel from 2010.
INCOME BEFORE INCOME TAXES
For the year ended December 31, 2011,2013, income before income taxes increased $41.4 million, or 21.3%,12.3% to $235.4$299.6 million from $194.0$266.7 million in 2010. Profit margins have improved as a result of the increase in revenue, and reductions in deferred compensation expense and other operating expenses from 2010. The increase in profit margins is primarily attributable to the elimination of start-up costs and efficiencies gained at the new branches opened in 2010 and 2009.2012.
The information required by Securities Act Guide 3 –Statistical Disclosure byBy Bank Holding Company is presented below:
I. Distribution of Assets, Liabilities, and Shareholders’ Equity; Interest Rates and Interest Rate Differential
| I. | Distribution of Assets, Liabilities, and Shareholders’ Equity; Interest Rates and Interest Rate Differential |
The following tables present average balance data and operating interest revenue and expense data for Stifel Bank, as well as related interest yields for the periods indicated(in thousands, except rates):
| For the Year Ended | For the Year Ended | |||||||||||||||||||||||||||||||||||||||||||||||
| December 31, 2012 | December 31, 2011 | December 31, 2014 | December 31, 2013 | |||||||||||||||||||||||||||||||||||||||||||||
| Average Balance | Interest Income/ Expense | Average Interest Rate | Average Balance | Interest Income/ Expense | Average Interest Rate | Average Balance | Interest Income/ Expense | Average Interest Rate | Average Balance | Interest Income/ Expense | Average Interest Rate | |||||||||||||||||||||||||||||||||||||
Assets: | ||||||||||||||||||||||||||||||||||||||||||||||||
Federal funds sold | $ | 151,362 | $ | 364 | 0.24 | % | $ | 108,936 | $ | 258 | 0.24 | % | ||||||||||||||||||||||||||||||||||||
U.S. government agencies | — | — | — | 9,373 | 161 | 1.72 | ||||||||||||||||||||||||||||||||||||||||||
State and political subdivisions: | ||||||||||||||||||||||||||||||||||||||||||||||||
Interest bearing cash and federal funds sold | $ | 172,052 | $ | 420 | 0.24 | % | $ | 289,553 | $ | 726 | 0.25 | % | ||||||||||||||||||||||||||||||||||||
State and municipal securities: | ||||||||||||||||||||||||||||||||||||||||||||||||
Taxable | 119,696 | 5,202 | 4.35 | 79,290 | 3,915 | 4.94 | 8,403 | 512 | 6.09 | 113,111 | 3,938 | 3.48 | ||||||||||||||||||||||||||||||||||||
Non-taxable(1) | 9,277 | 252 | 2.72 | 2,943 | 99 | 3.36 | ||||||||||||||||||||||||||||||||||||||||||
Tax-exempt 1 | 77,395 | 3,706 | 4.79 | 74,947 | 1,735 | 2.32 | ||||||||||||||||||||||||||||||||||||||||||
Mortgage-backed securities | 757,890 | 19,260 | 2.54 | 769,317 | 22,780 | 2.96 | 1,373,446 | 36,248 | 2.64 | 1,248,829 | 28,685 | 2.30 | ||||||||||||||||||||||||||||||||||||
Corporate bonds | 524,572 | 12,253 | 2.34 | 326,451 | 8,629 | 2.64 | ||||||||||||||||||||||||||||||||||||||||||
Corporate fixed income securities | 470,790 | 10,157 | 2.16 | 549,711 | 12,177 | 2.22 | ||||||||||||||||||||||||||||||||||||||||||
Asset-backed securities | 431,030 | 8,858 | 2.06 | 68,980 | 1,577 | 2.29 | 966,022 | 20,903 | 2.16 | 740,426 | 15,590 | 2.11 | ||||||||||||||||||||||||||||||||||||
Federal Home Loan Bank (“FHLB”) and other capital stock | 2,850 | 40 | 1.40 | 2,557 | 56 | 2.19 | 8,090 | 32 | 0.40 | 4,198 | 30 | 0.71 | ||||||||||||||||||||||||||||||||||||
Loans(2) | 736,283 | 24,085 | 3.27 | 494,639 | 16,791 | 3.39 | ||||||||||||||||||||||||||||||||||||||||||
Loans 2 | 1,782,205 | 67,625 | 3.79 | 1,122,086 | 35,868 | 3.27 | ||||||||||||||||||||||||||||||||||||||||||
Loans held for sale | 134,668 | 4,550 | 3.38 | 75,197 | 2,704 | 3.60 | 53,979 | 3,543 | 6.56 | 81,546 | 2,740 | 3.36 | ||||||||||||||||||||||||||||||||||||
|
|
|
|
|
|
|
|
|
|
|
| |||||||||||||||||||||||||||||||||||||
Total interest-earning assets(3) | 2,867,628 | $ | 74,864 | 2.60 | % | 1,937,683 | $ | 56,970 | 2.94 | % | ||||||||||||||||||||||||||||||||||||||
Total interest-earning assets3 | 4,912,382 | $ | 143,146 | 2.91 | % | 4,224,407 | $ | 101,489 | 2.42 | % | ||||||||||||||||||||||||||||||||||||||
Cash and due from banks | 7,088 | 6,685 | 3,526 | 8,126 | ||||||||||||||||||||||||||||||||||||||||||||
Other non interest-earning assets | 73,521 | 50,747 | 143,356 | 66,195 | ||||||||||||||||||||||||||||||||||||||||||||
|
|
|
| |||||||||||||||||||||||||||||||||||||||||||||
Total assets | $ | 2,948,237 | $ | 1,995,115 | $ | 5,059,264 | $ | 4,298,728 | ||||||||||||||||||||||||||||||||||||||||
|
|
|
| |||||||||||||||||||||||||||||||||||||||||||||
Liabilities and stockholders’ equity: | ||||||||||||||||||||||||||||||||||||||||||||||||
Deposits: | ||||||||||||||||||||||||||||||||||||||||||||||||
Money market | $ | 2,606,605 | $ | 14,892 | 0.57 | % | $ | 1,767,724 | $ | 16,608 | 0.94 | % | $ | 4,419,699 | $ | 8,214 | 0.19 | % | $ | 3,844,984 | $ | 10,781 | 0.28 | % | ||||||||||||||||||||||||
Time deposits | 133,842 | (402 | ) | (0.30 | ) | 43,288 | 908 | 2.10 | ||||||||||||||||||||||||||||||||||||||||
Demand deposits | 49,869 | 63 | 0.13 | 30,885 | 44 | 0.14 | 63,158 | 33 | 0.05 | 72,091 | 45 | 0.06 | ||||||||||||||||||||||||||||||||||||
Time deposits | 1,546 | 44 | 2.86 | 2,521 | 62 | 2.46 | ||||||||||||||||||||||||||||||||||||||||||
Savings | 4,410 | 2 | 0.05 | 34 | — | — | 520 | — | — | 2,683 | 5 | 0.20 | ||||||||||||||||||||||||||||||||||||
FHLB advances | 3,093 | 12 | 0.38 | 4,380 | 17 | 0.39 | 27,534 | 81 | 0.29 | 4,356 | 36 | 0.81 | ||||||||||||||||||||||||||||||||||||
|
|
|
|
|
|
|
|
|
|
|
| |||||||||||||||||||||||||||||||||||||
Total interest-bearing liabilities(3) | 2,665,523 | 15,013 | 0.56 | 1,805,544 | $ | 16,731 | 0.93 | |||||||||||||||||||||||||||||||||||||||||
Total interest-bearing liabilities 3 | 4,644,753 | 7,926 | 0.17 | 3,967,402 | 11,775 | 0.30 | ||||||||||||||||||||||||||||||||||||||||||
Non interest-bearing deposits | 21,060 | 13,404 | 20,345 | 11,182 | ||||||||||||||||||||||||||||||||||||||||||||
Other non interest-bearing liabilities | 41,867 | 28,361 | 23,188 | 24,088 | ||||||||||||||||||||||||||||||||||||||||||||
|
|
|
| |||||||||||||||||||||||||||||||||||||||||||||
Total liabilities | 2,728,450 | 1,847,309 | 4,688,286 | 4,002,672 | ||||||||||||||||||||||||||||||||||||||||||||
Stockholders’ equity | 219,787 | 147,806 | 370,978 | 296,056 | ||||||||||||||||||||||||||||||||||||||||||||
|
|
|
| |||||||||||||||||||||||||||||||||||||||||||||
Total liabilities and stockholders’ equity | $ | 2,948,237 | $ | 1,995,115 | $ | 5,059,264 | $ | 4,298,728 | ||||||||||||||||||||||||||||||||||||||||
|
|
|
|
|
|
|
|
|
|
|
| |||||||||||||||||||||||||||||||||||||
Net interest margin | $ | 59,851 | 2.08 | % | $ | 40,239 | 2.08 | % | $ | 135,220 | 2.75 | % | $ | 89,714 | 2.14 | % | ||||||||||||||||||||||||||||||||
|
|
|
|
|
|
|
| |||||||||||||||||||||||||||||||||||||||||
Due to immaterial amount of income recognized on tax-exempt securities, yields were not calculated on a |
Loans on non-accrual status are included in average balances. |
See Net Interest Income table included in “Results of Operations” for additional information on our company’s average balances and operating interest and expenses. |
| For the Year Ended December 31, 2010 | For the Year Ended December 31, 2012 | |||||||||||||||||||||||
| Average Balance | Interest Income/ Expense | Average Interest Rate | Average Balance | Interest Income/ Expense | Average Interest Rate | |||||||||||||||||||
Assets: | ||||||||||||||||||||||||
Federal funds sold | $ | 148,533 | $ | 404 | 0.27 | % | $ | 151,362 | $ | 364 | 0.24 | % | ||||||||||||
U.S. government agencies | 56,796 | 609 | 1.07 | |||||||||||||||||||||
State and political subdivisions: | ||||||||||||||||||||||||
State and municipal securities: | ||||||||||||||||||||||||
Taxable | 20,819 | 1,031 | 4.95 | 119,696 | 5,202 | 4.35 | ||||||||||||||||||
Non-taxable(1) | 1,324 | 49 | 3.70 | |||||||||||||||||||||
Tax-exempt 1 | 9,277 | 252 | 2.72 | |||||||||||||||||||||
Mortgage-backed securities | 549,666 | 14,804 | 2.69 | 757,890 | 19,260 | 2.54 | ||||||||||||||||||
Corporate bonds | 57,606 | 2,254 | 3.91 | |||||||||||||||||||||
Corporate fixed income securities | 524,572 | 12,253 | 2.34 | |||||||||||||||||||||
Asset-backed securities | 11,450 | 320 | 2.79 | 431,030 | 8,858 | 2.06 | ||||||||||||||||||
FHLB and other capital stock | 1,272 | 27 | 2.12 | 2,850 | 40 | 1.40 | ||||||||||||||||||
Loans(2) | 364,811 | 12,347 | 3.38 | |||||||||||||||||||||
Loans 2 | 736,283 | 24,085 | 3.27 | |||||||||||||||||||||
Loans held for sale | 81,062 | 3,301 | 4.07 | 134,668 | 4,550 | 3.38 | ||||||||||||||||||
|
|
|
|
|
| |||||||||||||||||||
Total interest-earning assets(3) | 1,293,339 | $ | 35,146 | 2.72 | % | |||||||||||||||||||
Total interest-earning assets 3 | 2,867,628 | $ | 74,864 | 2.60 | % | |||||||||||||||||||
Cash and due from banks | 6,717 | 7,088 | ||||||||||||||||||||||
Other non interest-earning assets | 39,518 | 73,521 | ||||||||||||||||||||||
|
| |||||||||||||||||||||||
Total assets | $ | 1,339,574 | $ | 2,948,237 | ||||||||||||||||||||
| ||||||||||||||||||||||||
| ||||||||||||||||||||||||
Liabilities and stockholders’ equity: | ||||||||||||||||||||||||
Deposits: | ||||||||||||||||||||||||
Money market | $ | 1,162,749 | $ | 4,919 | 0.42 | % | $ | 2,606,605 | $ | 14,892 | 0.57 | % | ||||||||||||
Demand deposits | 20,568 | 31 | 0.15 | 1,546 | 44 | 2.86 | ||||||||||||||||||
Time deposits | 7,686 | 217 | 2.82 | 49,869 | 63 | 0.13 | ||||||||||||||||||
Savings | 92 | — | — | 4,410 | 2 | 0.05 | ||||||||||||||||||
FHLB advances | 652 | 21 | 3.22 | 3,093 | 12 | 0.38 | ||||||||||||||||||
|
|
|
|
|
| |||||||||||||||||||
Total interest-bearing liabilities(3) | 1,191,747 | $ | 5,188 | 0.44 | ||||||||||||||||||||
Total interest-bearing liabilities 3 | 2,665,523 | 15,013 | 0.56 | |||||||||||||||||||||
Non interest-bearing deposits | 18,192 | 21,060 | ||||||||||||||||||||||
Other non interest-bearing liabilities | 14,352 | 41,867 | ||||||||||||||||||||||
|
| |||||||||||||||||||||||
Total liabilities | 1,224,291 | 2,728,450 | ||||||||||||||||||||||
Stockholders’ equity | 115,283 | 219,787 | ||||||||||||||||||||||
|
| |||||||||||||||||||||||
Total liabilities and stockholders’ equity | $ | 1,339,574 | $ | 2,948,237 | ||||||||||||||||||||
|
|
|
|
|
| |||||||||||||||||||
Net interest margin | $ | 29,958 | 2.32 | % | $ | 59,851 | 2.08 | % | ||||||||||||||||
|
|
|
| |||||||||||||||||||||
Due to immaterial amount of income recognized on tax-exempt securities, yields were not calculated on a |
Loans on non-accrual status are included in average balances. |
See Net Interest Income table included in “Results of Operations” for additional information on our company’s average balances and operating interest and expenses. |
Net interest income – Net interest income is the difference between interest earned on interest-earning assets and interest paid on funding sources. Net interest income is affected by changes in the volume and mix of these assets and liabilities, as well as by fluctuations in interest rates and portfolio management strategies.
For the year ended December 31, 2014, interest revenue for Stifel Bank of $143.1 million was generated from weighted-average interest-earning assets of $4.91 billion at a weighted-average interest rate of 2.91%. For the year ended December 31, 2013, interest revenue for Stifel Bank of $101.5 million was generated from weighted-average interest-earning assets of $4.22 billion at a weighted-average interest rate of 2.42%. For the year ended December 31, 2012, interest revenue for Stifel Bank of $74.9 million was generated from weighted averageweighted-average interest-earning assets of $2.9$2.87 billion at a weighted averageweighted-average interest rate of 2.60%. For the year ended December 31, 2011, interest revenue of $57.0 million was generated from weighted average interest-earning assets of $1.9 billion at a weighted average interest rate of 2.94%. For the year ended December 31, 2010, interest revenue of $35.1 million was generated from weighted average interest-earning assets of $1.3 billion at a weighted average interest rate of 2.72%. Interest-earning assets principally consist of residential, consumer, and commercial loans, securities, and federal funds sold.
Interest expense represents interest on customer money market accounts, interest on time deposits, and other interest expense. The average balance of interest-bearing liabilities at Stifel Bank during the year ended December 31, 2014, was $4.64 billion at a weighted-average interest rate of 0.17%. The average balance of interest-bearing liabilities at Stifel Bank during the year ended December 31, 2013, was $3.97 billion at a weighted-average interest rate of 0.30%. The average balance of interest-bearing liabilities at Stifel Bank during the year ended December 31, 2012, was $2.7$2.67 billion at a weighted averageweighted-average interest rate of 0.56%. The average balance of interest-bearing liabilities during the year ended December 31, 2011 was $1.8 billion at a weighted average interest rate of 0.93%. The average balance of interest-bearing liabilities during the year ended December 31, 2010 was $1.2 billion at a weighted average interest rate of 0.44%.
The growth in Stifel Bank has been primarily funded by the growth in deposits associated with brokerage customers of Stifel Nicolaus.Stifel. At December 31, 2012,2014, the balance of Stifel Nicolaus brokerage customer deposits at Stifel Bank was $3.3$4.7 billion compared to $2.1$4.3 billion at December 31, 2011.2013.
The following table sets forth an analysis of the effect on net interest income of volume and rate changes for the periods indicated(in thousands):
| Year Ended December 31, 2012 Compared to Year Ended December 31, 2011 | Year Ended December 31, 2011 Compared to Year Ended December 31, 2010 | Year Ended December 31, 2014 Compared to Year Ended December 31, 2013 | Year Ended December 31, 2013 Compared to Year Ended December 31, 2012 | |||||||||||||||||||||||||||||||||||||||||||||
| Increase (decrease) due to: | Increase (decrease) due to: | Increase (decrease) due to: | Increase (decrease) due to: | |||||||||||||||||||||||||||||||||||||||||||||
| Volume | Rate | Total | Volume | Rate | Total | Volume | Rate | Total | Volume | Rate | Total | |||||||||||||||||||||||||||||||||||||
Interest income: | ||||||||||||||||||||||||||||||||||||||||||||||||
Federal funds sold | $ | 102 | $ | 4 | $ | 106 | $ | (98 | ) | $ | (48 | ) | $ | (146 | ) | $ | (287 | ) | �� | $ | (19 | ) | $ | (306 | ) | $ | 346 | $ | 16 | $ | 362 | |||||||||||||||||
U.S. government agencies | (80 | ) | (81 | ) | (161 | ) | (1,605 | ) | 1,157 | (448 | ) | |||||||||||||||||||||||||||||||||||||
State and political subdivisions: | ||||||||||||||||||||||||||||||||||||||||||||||||
State and municipal securities: | ||||||||||||||||||||||||||||||||||||||||||||||||
Taxable | 1,682 | (395 | ) | 1,287 | 2,887 | (3 | ) | 2,884 | (17,983 | ) | 14,557 | (3,426 | ) | (274 | ) | (990 | ) | (1,264 | ) | |||||||||||||||||||||||||||||
Non-taxable | 175 | (22 | ) | 153 | 54 | (4 | ) | 50 | ||||||||||||||||||||||||||||||||||||||||
Tax-exempt | 55 | 1,916 | 1,971 | 1,525 | (42 | ) | 1,483 | |||||||||||||||||||||||||||||||||||||||||
Mortgage-backed securities | (344 | ) | (3,176 | ) | (3,520 | ) | 6,387 | 1,589 | 7,976 | 1,997 | 5,566 | 7,563 | 11,421 | (1,996 | ) | 9,425 | ||||||||||||||||||||||||||||||||
Corporate bonds | 4,726 | (1,102 | ) | 3,624 | 6,851 | (476 | ) | 6,375 | ||||||||||||||||||||||||||||||||||||||||
Corporate fixed income securities | (1,692 | ) | (328 | ) | (2,020 | ) | 572 | (648 | ) | (76 | ) | |||||||||||||||||||||||||||||||||||||
Asset-backed securities | 7,424 | (143 | ) | 7,281 | 1,304 | (47 | ) | 1,257 | 4,870 | 443 | 5,313 | 6,510 | 222 | 6,732 | ||||||||||||||||||||||||||||||||||
FHLB and other capital stock | 8 | (24 | ) | (16 | ) | 28 | 1 | 29 | 19 | (17 | ) | 2 | 7 | (17 | ) | (10 | ) | |||||||||||||||||||||||||||||||
Loans | 7,927 | (633 | ) | 7,294 | 4,404 | 40 | 4,444 | 27,454 | 4,303 | 31,757 | 11,814 | (31 | ) | 11,783 | ||||||||||||||||||||||||||||||||||
Loans held for sale | 2,018 | (172 | ) | 1,846 | (224 | ) | (373 | ) | (597 | ) | (1,158 | ) | 1,961 | 803 | (1,785 | ) | (25 | ) | (1,810 | ) | ||||||||||||||||||||||||||||
|
|
|
|
|
|
|
|
|
|
|
| |||||||||||||||||||||||||||||||||||||
| $ | 23,638 | $ | (5,744 | ) | $ | 17,894 | $ | 19,988 | $ | 1,836 | $ | 21,824 | $ | 13,275 | $ | 28,382 | $ | 41,657 | $ | 30,136 | $ | (3,511 | ) | $ | 26,625 | |||||||||||||||||||||||
|
|
|
|
|
|
|
|
|
|
|
| |||||||||||||||||||||||||||||||||||||
Interest expense: | ||||||||||||||||||||||||||||||||||||||||||||||||
Deposits: | ||||||||||||||||||||||||||||||||||||||||||||||||
Money market | $ | 6,190 | $ | (7,906 | ) | $ | (1,716 | ) | $ | 3,493 | $ | 8,196 | $ | 11,689 | $ | 1,445 | $ | (4,012 | ) | $ | (2,567 | ) | $ | 5,336 | $ | (9,447 | ) | $ | (4,111 | ) | ||||||||||||||||||
Time deposits | 495 | (1,805 | ) | (1,310 | ) | 872 | (8 | ) | 864 | |||||||||||||||||||||||||||||||||||||||
Demand deposits | 25 | (6 | ) | 19 | 15 | (2 | ) | 13 | (9 | ) | (3 | ) | (12 | ) | 22 | (40 | ) | (18 | ) | |||||||||||||||||||||||||||||
Time deposits | (31 | ) | 13 | (18 | ) | (130 | ) | (25 | ) | (155 | ) | |||||||||||||||||||||||||||||||||||||
Savings | — | 2 | 2 | — | — | — | (2 | ) | (3 | ) | (5 | ) | 4 | (1 | ) | 3 | ||||||||||||||||||||||||||||||||
FHLB advances | (5 | ) | — | (5 | ) | 29 | (33 | ) | (4 | ) | 48 | (3 | ) | 45 | 2 | 22 | 24 | |||||||||||||||||||||||||||||||
|
|
|
|
|
|
|
|
|
|
|
| |||||||||||||||||||||||||||||||||||||
| $ | 6,179 | $ | (7,897 | ) | $ | (1,718 | ) | $ | 3,407 | $ | 8,136 | $ | 11,543 | $ | 1,977 | $ | (5,826 | ) | $ | (3,849 | ) | $ | 6,236 | $ | (9,474 | ) | $ | (3,238 | ) | |||||||||||||||||||
|
|
|
|
|
|
|
|
|
|
|
| |||||||||||||||||||||||||||||||||||||
Increases and decreases in interest revenue and interest expense result from changes in average balances (volume) of interest-earning bank assets and liabilities, as well as changes in average interest rates. The effect of changes in volume is determined by multiplying the change in volume by the previous year’s average yield/cost. Similarly, the effect of rate changes is calculated by multiplying the change in average yield/cost by the previous year’s volume. Changes applicable to both volume and rate have been allocated proportionately.
| II. | Investment Portfolio |
II. Investment Portfolio
The following tables provide a summary of the amortized cost and fair values of the available-for-sale and held-to-maturity securities for the periods indicated (in thousands):
| December 31, 2012 | December 31, 2014 | |||||||||||||||||||||||||||||||
| Amortized cost | Gross unrealized gains(1) | Gross unrealized losses(1) | Estimated fair value | Amortized Cost | Gross Unrealized Gains1 | Gross Unrealized Losses1 | Estimated Fair Value | |||||||||||||||||||||||||
Available-for-sale securities | ||||||||||||||||||||||||||||||||
U.S. government securities | $ | 1,114 | $ | 1 | $ | (2 | ) | $ | 1,113 | |||||||||||||||||||||||
U.S. government agency securities | $ | 1,613 | $ | 1 | $ | (4 | ) | $ | 1,610 | |||||||||||||||||||||||
State and municipal securities | 153,885 | 4,648 | (1,113 | ) | 157,420 | 76,518 | 20 | (2,137 | ) | 74,401 | ||||||||||||||||||||||
Mortgage-backed securities: | ||||||||||||||||||||||||||||||||
Agency | 676,861 | 8,140 | (153 | ) | 684,848 | 206,982 | 3,137 | (913 | ) | 209,206 | ||||||||||||||||||||||
Commercial | 255,255 | 5,902 | (183 | ) | 260,974 | 107,100 | 633 | (89 | ) | 107,644 | ||||||||||||||||||||||
Non-agency | 13,077 | 801 | — | 13,878 | 3,186 | 5 | (54 | ) | 3,137 | |||||||||||||||||||||||
Corporate fixed income securities | 474,338 | 7,590 | (1,746 | ) | 480,182 | 336,210 | 2,016 | (820 | ) | 337,406 | ||||||||||||||||||||||
Asset-backed securities | 26,572 | 378 | (197 | ) | 26,753 | 788,908 | 1,321 | (10,155 | ) | 780,074 | ||||||||||||||||||||||
|
|
|
|
|
|
|
| |||||||||||||||||||||||||
| $ | 1,601,102 | $ | 27,460 | $ | (3,394 | ) | $ | 1,625,168 | $ | 1,520,517 | $ | 7,133 | $ | (14,172 | ) | $ | 1,513,478 | |||||||||||||||
|
|
|
|
|
|
|
| |||||||||||||||||||||||||
Held-to-maturity securities(2) | ||||||||||||||||||||||||||||||||
Asset-backed securities | $ | 630,279 | $ | 9,364 | $ | (2,971 | ) | $ | 636,672 | |||||||||||||||||||||||
Corporate fixed income securities | 55,420 | 36 | (519 | ) | 54,937 | |||||||||||||||||||||||||||
Municipal auction rate securities | 22,309 | 1,376 | (20 | ) | 23,665 | |||||||||||||||||||||||||||
|
|
|
| |||||||||||||||||||||||||||||
| $ | 708,008 | $ | 10,776 | $ | (3,510 | ) | $ | 715,274 | ||||||||||||||||||||||||
|
|
|
| |||||||||||||||||||||||||||||
| December 31, 2011 | ||||||||||||||||||||||||||||||||
| Amortized cost | Gross unrealized gains(1) | Gross unrealized losses(1) | Estimated fair value | |||||||||||||||||||||||||||||
Available-for-sale securities | ||||||||||||||||||||||||||||||||
U.S. government securities | $ | 1,105 | $ | — | $ | (2 | ) | $ | 1,103 | |||||||||||||||||||||||
State and municipal securities | 82,256 | 4,979 | (303 | ) | 86,932 | |||||||||||||||||||||||||||
Held-to-maturity securities2 | ||||||||||||||||||||||||||||||||
Mortgage-backed securities: | ||||||||||||||||||||||||||||||||
Agency | 396,952 | 8,469 | (759 | ) | 404,662 | $ | 884,451 | $ | 32,926 | $ | (42 | ) | $ | 917,335 | ||||||||||||||||||
Commercial | 270,677 | 1,811 | (978 | ) | 271,510 | 59,462 | 2,257 | — | 61,719 | |||||||||||||||||||||||
Non-agency | 17,701 | 135 | (376 | ) | 17,460 | 1,081 | — | (17 | ) | 1,064 | ||||||||||||||||||||||
Asset-backed securities | 177,335 | 3,151 | (2,645 | ) | 177,841 | |||||||||||||||||||||||||||
Corporate fixed income securities | 409,503 | 2,108 | (5,626 | ) | 405,985 | 55,236 | 4 | (1,223 | ) | 54,017 | ||||||||||||||||||||||
Asset-backed securities | 26,011 | 548 | (70 | ) | 26,489 | |||||||||||||||||||||||||||
|
|
|
|
|
|
|
| |||||||||||||||||||||||||
| $ | 1,204,205 | $ | 18,050 | $ | (8,114 | ) | $ | 1,214,141 | $ | 1,177,565 | $ | 38,338 | $ | (3,927 | ) | $ | 1,211,976 | |||||||||||||||
|
|
|
|
|
|
|
| |||||||||||||||||||||||||
Held-to-maturity securities(2) | ||||||||||||||||||||||||||||||||
Asset-backed securities | $ | 122,148 | $ | 2,953 | $ | (3,138 | ) | $ | 121,963 | |||||||||||||||||||||||
Corporate fixed income securities | 55,544 | 56 | (2,016 | ) | 53,584 | |||||||||||||||||||||||||||
Municipal auction rate securities | 12,792 | 733 | (1 | ) | 13,524 | |||||||||||||||||||||||||||
|
|
|
| |||||||||||||||||||||||||||||
| $ | 190,484 | $ | 3,742 | $ | (5,155 | ) | $ | 189,071 | ||||||||||||||||||||||||
|
|
|
| |||||||||||||||||||||||||||||
| December 31, 2013 | ||||||||||||||||
| Amortized Cost | Gross Unrealized Gains1 | Gross Unrealized Losses1 | Estimated Fair Value | |||||||||||||
Available-for-sale securities | ||||||||||||||||
U.S. government agency securities | $ | 1,074 | $ | — | $ | (2 | ) | $ | 1,072 | |||||||
State and municipal securities | 96,475 | 739 | (6,537 | ) | 90,677 | |||||||||||
Mortgage-backed securities: | ||||||||||||||||
Agency | 184,533 | 2,859 | (3,405 | ) | 183,987 | |||||||||||
Commercial | 209,949 | 3,084 | (1,787 | ) | 211,246 | |||||||||||
Non-agency | 4,547 | 72 | — | 4,619 | ||||||||||||
Corporate fixed income securities | 496,385 | 4,769 | (2,838 | ) | 498,316 | |||||||||||
Asset-backed securities | 769,553 | 2,499 | (5,716 | ) | 766,336 | |||||||||||
|
|
|
|
|
|
|
| |||||||||
| $ | 1,762,516 | $ | 14,022 | $ | (20,285 | ) | $ | 1,756,253 | ||||||||
|
|
|
|
|
|
|
| |||||||||
Held-to-maturity securities2 | ||||||||||||||||
Mortgage-backed securities: | ||||||||||||||||
Agency | $ | 968,759 | $ | 1,156 | $ | (7,915 | ) | $ | 962,000 | |||||||
Commercial | 59,404 | — | (186 | ) | 59,218 | |||||||||||
Asset-backed securities | 228,623 | 6,157 | (2,774 | ) | 232,006 | |||||||||||
Corporate fixed income securities | 55,329 | 11 | (2,605 | ) | 52,735 | |||||||||||
|
|
|
|
|
|
|
| |||||||||
| $ | 1,312,115 | $ | 7,324 | $ | (13,480 | ) | $ | 1,305,959 | ||||||||
|
|
|
|
|
|
|
| |||||||||
Unrealized gains/(losses) related to available-for-sale securities are reported in other comprehensive income. |
Held-to-maturity securities are carried on the consolidated statements of financial condition at amortized cost, and the changes in the value of these securities, other than impairment charges, are not reported on the consolidated financial statements. |
| December 31, 2010 | December 31, 2012 | |||||||||||||||||||||||||||||||
| Amortized cost | Gross unrealized gains(1) | Gross unrealized losses(1) | Estimated fair value | Amortized Cost | Gross Unrealized Gains1 | Gross Unrealized Losses1 | Estimated Fair Value | |||||||||||||||||||||||||
Available-for-sale securities | ||||||||||||||||||||||||||||||||
U.S. government securities | $ | 24,972 | $ | 58 | $ | — | $ | 25,030 | ||||||||||||||||||||||||
U.S. government agency securities | $ | 1,114 | $ | 1 | $ | (2 | ) | $ | 1,113 | |||||||||||||||||||||||
State and municipal securities | 26,678 | 727 | (1,062 | ) | 26,343 | 153,885 | 4,648 | (1,113 | ) | 157,420 | ||||||||||||||||||||||
Mortgage-backed securities: | ||||||||||||||||||||||||||||||||
Agency | 692,922 | 6,938 | (2,697 | ) | 697,163 | 676,861 | 8,140 | (153 | ) | 684,848 | ||||||||||||||||||||||
Commercial | 66,912 | 1,212 | (128 | ) | 67,996 | 255,255 | 5,902 | (183 | ) | 260,974 | ||||||||||||||||||||||
Non-agency | 29,319 | 744 | (790 | ) | 29,273 | 13,077 | 801 | — | 13,878 | |||||||||||||||||||||||
Corporate fixed income securities | 153,523 | 1,705 | (327 | ) | 154,901 | 474,338 | 7,590 | (1,746 | ) | 480,182 | ||||||||||||||||||||||
Asset-backed securities | 11,331 | 677 | — | 12,008 | 26,572 | 378 | (197 | ) | 26,753 | |||||||||||||||||||||||
|
|
|
|
|
|
|
| |||||||||||||||||||||||||
| $ | 1,005,657 | $ | 12,061 | $ | (5,004 | ) | $ | 1,012,714 | $ | 1,601,102 | $ | 27,460 | $ | (3,394 | ) | $ | 1,625,168 | |||||||||||||||
|
|
|
|
|
|
|
| |||||||||||||||||||||||||
Held-to-maturity securities(2) | ||||||||||||||||||||||||||||||||
Held-to-maturity securities2 | ||||||||||||||||||||||||||||||||
Asset-backed securities | $ | 630,279 | $ | 9,364 | $ | (2,971 | ) | $ | 636,672 | |||||||||||||||||||||||
Corporate fixed income securities | 55,420 | 36 | (519 | ) | 54,937 | |||||||||||||||||||||||||||
Municipal auction rate securities | $ | 43,719 | $ | 3,803 | $ | (171 | ) | $ | 47,351 | 22,309 | 1,376 | (20 | ) | 23,665 | ||||||||||||||||||
Asset-backed securities | 8,921 | 198 | (3,486 | ) | 5,633 | |||||||||||||||||||||||||||
|
|
|
|
|
|
|
| |||||||||||||||||||||||||
| $ | 52,640 | $ | 4,001 | $ | (3,657 | ) | $ | 52,984 | $ | 708,008 | $ | 10,776 | $ | (3,510 | ) | $ | 715,274 | |||||||||||||||
|
|
|
|
|
|
|
| |||||||||||||||||||||||||
Unrealized gains/(losses) related to available-for-sale securities are reported in other comprehensive income. |
Held-to-maturity securities are carried on the consolidated statements of financial condition at amortized cost, and the changes in the value of these securities, other than impairment charges, are not reported on the consolidated financial statements. |
Other-Than-Temporary Impairment
We evaluate all securities in an unrealized loss position quarterly to assess whether the impairment is other-than-temporary. Our other-than-temporary impairment (“OTTI”) assessment is a subjective process requiring the use of judgments and assumptions. Accordingly, we consider a number of qualitative and quantitative criteria in our assessment, including the extent and duration of the impairment; recent events specific to the issuer and/or industry to which the issuer belongs; the payment structure of the security; external credit ratings and the failure of the issuer to make scheduled interest or principal payments; the value of underlying collateral; and current market conditions.
If we determine that impairment on our debt securities is other-than-temporary and we have made the decision to sell the security or it is more likely than not that we will be required to sell the security prior to recovery of its amortized cost basis, we recognize the entire portion of the impairment in earnings. If we have not made a decision to sell the security and we do not expect that we will be required to sell the security prior to recovery of the amortized cost basis, we recognize only the credit component of OTTI in earnings. The remaining unrealized loss due to factors other than credit, or the non-credit component, is recorded in accumulated other comprehensive loss. We determine the credit component based on the difference between the security’s amortized cost basis and the present value of its expected future cash flows, discounted based on the purchase yield. The non-credit component represents the difference between the security’s fair value and the present value of expected future cash flows. Based on the evaluation, we did not recognize any credit-related OTTI during the years ended December 31, 2014 and 2013, respectively. We recognized a credit-related OTTI of $0.6 million and $1.9 million in earnings for the yearsyear ended December 31, 2012 and 2011, respectively.2012.
We estimate the portion of loss attributable to credit using a discounted cash flow model. Key assumptions used in estimating the expected cash flows include default rates, loss severity, and prepayment rates. Assumptions used can vary widely based on the collateral underlying the securities and are influenced by factors such as collateral type, loan interest rate, geographical location of the borrower, and borrower characteristics.
We believe the gross unrealized losses related to all other securities of $3.4$14.2 million as of December 31, 20122014, are attributable to issuer specificissuer-specific credit spreads and changes in market interest rates and asset spreads. We, therefore, do not expect to incur any credit losses related to these securities. In addition, we have no intent to
sell these securities with unrealized losses, and it is not more likely than not that we will be required to sell these securities prior to recovery of the amortized cost. Accordingly, we have concluded that the impairment on these securities is not other-than-temporary.
The maturities and related weighted-average yields of available-for-sale and held-to-maturity securities at December 31, 2012,2014, are as follows(in thousands, except rates):
| Within 1 Year | 1-5 Years | 5-10 Years | After 10 Years | Total | Within 1 Year | 1-5 Years | 5-10 Years | After 10 Years | Total | |||||||||||||||||||||||||||||||
Available-for-sale:(1) | ||||||||||||||||||||||||||||||||||||||||
U.S. government securities | $ | 652 | $ | 461 | $ | — | $ | — | $ | 1,113 | ||||||||||||||||||||||||||||||
Available-for-sale: 1 | ||||||||||||||||||||||||||||||||||||||||
U.S. government agency securities | $ | 452 | $ | 1,158 | $ | — | $ | — | $ | 1,610 | ||||||||||||||||||||||||||||||
State and municipal securities | 278 | 2,009 | 504 | 154,629 | 157,420 | — | — | 1,655 | 72,746 | 74,401 | ||||||||||||||||||||||||||||||
Mortgage-backed securities: | ||||||||||||||||||||||||||||||||||||||||
Agency | — | — | 5,547 | 679,301 | 684,848 | — | — | 40,223 | 168,983 | 209,206 | ||||||||||||||||||||||||||||||
Commercial | — | — | 9,730 | 251,244 | 260,974 | — | — | 40,959 | 66,685 | 107,644 | ||||||||||||||||||||||||||||||
Non-agency | — | 378 | 1,720 | 11,780 | 13,878 | — | 122 | — | 3,015 | 3,137 | ||||||||||||||||||||||||||||||
Corporate fixed income securities | 105,010 | 345,416 | 29,756 | — | 480,182 | 131,980 | 163,407 | 42,019 | — | 337,406 | ||||||||||||||||||||||||||||||
Asset-backed securities | — | 12,336 | — | 14,417 | 26,753 | — | 4,999 | 254,620 | 520,455 | 780,074 | ||||||||||||||||||||||||||||||
|
|
|
|
|
|
|
|
|
| |||||||||||||||||||||||||||||||
| $ | 105,940 | $ | 360,600 | $ | 47,257 | $ | 1,111,371 | $ | 1,625,168 | $ | 132,432 | $ | 169,686 | $ | 379,476 | $ | 831,884 | $ | 1,513,478 | |||||||||||||||||||||
|
|
|
|
|
|
|
|
|
| |||||||||||||||||||||||||||||||
Held-to-Maturity: | ||||||||||||||||||||||||||||||||||||||||
Held-to-maturity: | ||||||||||||||||||||||||||||||||||||||||
Mortgage-backed securities: | ||||||||||||||||||||||||||||||||||||||||
Agency | $ | — | $ | — | $ | — | $ | 884,451 | $ | 884,451 | ||||||||||||||||||||||||||||||
Commercial | — | — | 59,462 | — | 59,462 | |||||||||||||||||||||||||||||||||||
Non-agency | — | — | — | 1,081 | 1,081 | |||||||||||||||||||||||||||||||||||
Asset-backed securities | $ | — | $ | 13,093 | $ | 211,481 | $ | 405,705 | $ | 630,279 | — | — | — | 177,335 | 177,335 | |||||||||||||||||||||||||
Corporate fixed income securities | — | 15,075 | 40,345 | — | 55,420 | 15,025 | 40,211 | — | — | 55,236 | ||||||||||||||||||||||||||||||
Municipal auction rate securities | — | — | — | 22,309 | 22,309 | |||||||||||||||||||||||||||||||||||
|
|
|
|
|
|
|
|
|
| |||||||||||||||||||||||||||||||
| $ | — | $ | 28,168 | $ | 251,826 | $ | 428,014 | $ | 708,008 | $ | 15,025 | $ | 40,211 | $ | 59,462 | $ | 1,062,867 | $ | 1,177,565 | |||||||||||||||||||||
|
|
|
|
|
|
|
|
|
| |||||||||||||||||||||||||||||||
Weighted-average yield(2) | 2.01 | % | 2.51 | % | 3.38 | % | 1.86 | % | 2.17 | % | ||||||||||||||||||||||||||||||
Weighted-average yield 2 | 2.02 | % | 2.02 | % | 2.25 | % | 2.10 | % | 2.11 | % | ||||||||||||||||||||||||||||||
Due to the immaterial amount of income recognized on tax-exempt securities, yields were not calculated on a tax equivalent basis. |
The weighted-average yield is computed using the expected maturity of each security weighted based on the amortized cost of each security. |
We did not hold securities from any single issuer that exceeded ten percent of our shareholders’ equity at December 31, 2012.2014.
| III. | Loan Portfolio |
III. Loan Portfolio
The following table presents the balance and associated percentage of each major loan category in Stifel Bank’s loan portfolio held for investment for the periods indicated(in thousands):
| As of December 31, | As of December 31, | |||||||||||||||||||||||||||||||||||||||
| 2012 | 2011 | 2010 | 2009 | 2008 | 2014 | 2013 | 2012 | 2011 | 2010 | |||||||||||||||||||||||||||||||
Commercial and industrial | $ | 896,853 | $ | 552,333 | $ | 300,034 | $ | 186,996 | $ | 41,965 | ||||||||||||||||||||||||||||||
Consumer | $ | 425,382 | $ | 371,399 | $ | 266,806 | $ | 227,436 | $ | 19,662 | 758,288 | 509,484 | 425,382 | 371,399 | 266,806 | |||||||||||||||||||||||||
Commercial and industrial | 300,034 | 186,996 | 41,965 | 11,294 | 27,538 | |||||||||||||||||||||||||||||||||||
Residential real estate | 65,657 | 51,755 | 49,550 | 52,086 | 58,778 | 432,646 | 372,789 | 65,657 | 51,755 | 49,550 | ||||||||||||||||||||||||||||||
Commercial real estate | 15,902 | 12,284 | 12,805 | 3,107 | 1,637 | |||||||||||||||||||||||||||||||||||
Home equity lines of credit | 19,531 | 24,086 | 30,966 | 33,369 | 28,612 | 12,945 | 16,327 | 19,531 | 24,086 | 30,966 | ||||||||||||||||||||||||||||||
Commercial real estate | 12,805 | 3,107 | 1,637 | 10,152 | 38,446 | |||||||||||||||||||||||||||||||||||
Construction and land | 510 | 514 | 524 | 952 | 13,968 | — | 490 | 510 | 514 | 524 | ||||||||||||||||||||||||||||||
|
|
|
|
|
|
|
|
|
| |||||||||||||||||||||||||||||||
| 823,919 | 637,857 | 391,448 | 335,289 | 187,004 | ||||||||||||||||||||||||||||||||||||
Total Gross loans | 2,116,634 | 1,463,707 | 823,919 | 637,857 | 391,448 | |||||||||||||||||||||||||||||||||||
Unamortized loan discount | (30,533 | ) | (45,100 | ) | — | — | — | |||||||||||||||||||||||||||||||||
Unamortized loan origination costs, net of loan fees | (1,207 | ) | (421 | ) | 392 | 1,556 | 591 | (1,631 | ) | (1,920 | ) | (1,207 | ) | (421 | ) | 392 | ||||||||||||||||||||||||
Loans in process | 1,370 | 4 | 233 | 14 | (3,878 | ) | 1,681 | 334 | 1,370 | 4 | 233 | |||||||||||||||||||||||||||||
Allowance for loan losses | (8,145 | ) | (5,300 | ) | (2,331 | ) | (1,702 | ) | (2,448 | ) | (20,731 | ) | (12,668 | ) | (8,145 | ) | (5,300 | ) | (2,331 | ) | ||||||||||||||||||||
|
|
|
|
|
|
|
|
|
| |||||||||||||||||||||||||||||||
| $ | 815,937 | $ | 632,140 | $ | 389,742 | $ | 335,157 | $ | 181,269 | $ | 2,065,420 | $ | 1,404,353 | $ | 815,937 | $ | 632,140 | $ | 389,742 | |||||||||||||||||||||
|
|
|
|
|
|
|
|
|
| |||||||||||||||||||||||||||||||
The maturities of the loan portfolio at December 31, 2012,2014, are as follows(in thousands):
Within 1 Year | 1-5 Years | Over 5 Years | Total | |||||||||||
| $38,254 | $ | 267,039 | $ | 518,626 | $ | 823,919 | ||||||||
| Within 1 Year | 1-5 Years | Over 5 Years | Total | |||||||||||
| $ | 20,802 | $ | 579,477 | $ | 1,516,355 | $ | 2,116,634 | |||||||
The sensitivity of loans with maturities in excess of one year at December 31, 2012,2014, is as follows(in thousands):
| 1-5 Years | Over 5 Years | Total | ||||||||||
Fixed rate loans | $ | 16,983 | $ | 24,596 | $ | 41,579 | ||||||
Variable or adjustable rate loans | 250,056 | 494,030 | 744,086 | |||||||||
|
|
|
|
|
| |||||||
| $ | 267,039 | $ | 518,626 | $ | 785,665 | |||||||
|
|
|
|
|
| |||||||
| 1-5 Years | Over 5 Years | Total | ||||||||||
Variable or adjustable rate loans | $ | 551,714 | $ | 1,503,164 | $ | 2,054,878 | ||||||
Fixed rate loans | 27,763 | 13,191 | 40,954 | |||||||||
|
|
|
|
|
| |||||||
| $ | 579,477 | $ | 1,516,355 | $ | 2,095,832 | |||||||
|
|
|
|
|
| |||||||
Changes in the allowance for loan losses at Stifel Bank were as follows (in thousands):
| Year Ended December 31, | Year Ended December 31, | |||||||||||||||||||||||||||||||||||||||
| 2012 | 2011 | 2010 | 2009 | 2008 | 2014 | 2013 | 2012 | 2011 | 2010 | |||||||||||||||||||||||||||||||
Allowance for loan losses, beginning of period | $ | 5,300 | $ | 2,331 | $ | 1,702 | $ | 2,448 | $ | 1,685 | $ | 12,668 | $ | 8,145 | $ | 5,300 | $ | 2,331 | $ | 1,702 | ||||||||||||||||||||
Provision for loan losses | 3,004 | 2,925 | 460 | 604 | 1,923 | 8,531 | 8,842 | 3,004 | 2,925 | 460 | ||||||||||||||||||||||||||||||
Charge-offs: | ||||||||||||||||||||||||||||||||||||||||
Commercial and industrial | (510 | ) | (3,864 | ) | — | — | — | |||||||||||||||||||||||||||||||||
Residential real estate | (254 | ) | (5 | ) | (216 | ) | (213 | ) | (414 | ) | — | (501 | ) | (254 | ) | (5 | ) | (216 | ) | |||||||||||||||||||||
Construction and land | — | — | — | (859 | ) | (493 | ) | |||||||||||||||||||||||||||||||||
Consumer | (16 | ) | — | — | — | — | ||||||||||||||||||||||||||||||||||
Commercial real estate | — | (5 | ) | — | (294 | ) | (253 | ) | — | — | — | (5 | ) | — | ||||||||||||||||||||||||||
Other | — | — | (2 | ) | (25 | ) | — | (5 | ) | (7 | ) | — | — | (2 | ) | |||||||||||||||||||||||||
|
|
|
|
|
|
|
|
|
| |||||||||||||||||||||||||||||||
Total charge-offs | (254 | ) | (10 | ) | (218 | ) | (1,391 | ) | (1,160 | ) | (531 | ) | (4,372 | ) | (254 | ) | (10 | ) | (218 | ) | ||||||||||||||||||||
Recoveries | 95 | 54 | 387 | 41 | — | 63 | 53 | 95 | 54 | 387 | ||||||||||||||||||||||||||||||
|
|
|
|
|
|
|
|
|
| |||||||||||||||||||||||||||||||
Allowance for loan losses, end of period | $ | 8,145 | $ | 5,300 | $ | 2,331 | $ | 1,702 | $ | 2,448 | $ | 20,731 | $ | 12,668 | $ | 8,145 | $ | 5,300 | $ | 2,331 | ||||||||||||||||||||
|
|
|
|
|
|
|
|
|
| |||||||||||||||||||||||||||||||
Net charge-offs to average bank loans outstanding, net | 0.02 | % | (0.01 | )% | (0.05 | )% | 0.58 | % | 0.64 | % | 0.03 | % | 0.40 | % | 0.02 | % | (0.01 | )% | (0.05 | )% | ||||||||||||||||||||
The following is a breakdown of the allowance for loan losses by type for the periods indicated(in thousands, except rates):
| December 31, 2012 | December 31, 2011 | December 31, 2014 | December 31, 2013 | |||||||||||||||||||||||||||||
| Balance | Percent(1) | Balance | Percent(1) | Balance | Percent 1 | Balance | Percent 1 | |||||||||||||||||||||||||
Commercial and industrial | $ | 5,450 | 36.4 | % | $ | 2,595 | 29.3 | % | $ | 16,609 | 42.4 | % | $ | 9,832 | 37.7 | % | ||||||||||||||||
Commercial real estate | 691 | 1.5 | 633 | 0.5 | ||||||||||||||||||||||||||||
Consumer | 647 | 51.6 | 510 | 58.2 | 1,255 | 35.8 | 892 | 34.8 | ||||||||||||||||||||||||
Residential real estate | 408 | 8.0 | 679 | 8.1 | 787 | 20.4 | 408 | 25.5 | ||||||||||||||||||||||||
Home equity lines of credit | 195 | 2.4 | — | — | 267 | 0.8 | 174 | 1.1 | ||||||||||||||||||||||||
Commercial real estate | 232 | 0.6 | 198 | 0.8 | ||||||||||||||||||||||||||||
Construction and land | 13 | 0.1 | — | — | — | — | 12 | — | ||||||||||||||||||||||||
Qualitative | 741 | — | 883 | 3.9 | 1,581 | — | 1,152 | — | ||||||||||||||||||||||||
|
|
|
|
|
|
|
| |||||||||||||||||||||||||
| $ | 8,145 | 100.0 | % | $ | 5,300 | 100.0 | % | $ | 20,731 | 100.0 | % | $ | 12,668 | 100.0 | % | |||||||||||||||||
|
|
|
| |||||||||||||||||||||||||||||
| December 31, 2010 | December 31, 2009 | |||||||||||||||||||||||||||||||
| Balance | Percent(1) | Balance | Percent(1) | |||||||||||||||||||||||||||||
Commercial and industrial | $ | 696 | 10.7 | % | $ | 321 | 3.4 | % | ||||||||||||||||||||||||
Residential real estate | 681 | 12.7 | 619 | 15.8 | ||||||||||||||||||||||||||||
Commercial real estate | 278 | 0.4 | 610 | 3.0 | ||||||||||||||||||||||||||||
Consumer | 288 | 68.2 | 152 | 77.8 | ||||||||||||||||||||||||||||
Qualitative | 388 | 8.0 | ��� | — | ||||||||||||||||||||||||||||
|
|
|
| |||||||||||||||||||||||||||||
| $ | 2,331 | 100.0 | % | $ | 1,702 | 100.0 | % | |||||||||||||||||||||||||
|
| |||||||||||||||||||||||||||||||
| December 31, 2012 | December 31, 2011 | |||||||||||||||
| Balance | Percent 1 | Balance | Percent 1 | |||||||||||||
Commercial and industrial | $ | 5,450 | 36.4 | % | $ | 2,595 | 29.3 | % | ||||||||
Commercial real estate | 691 | 1.5 | 633 | 0.5 | ||||||||||||
Consumer | 647 | 51.6 | 510 | 58.2 | ||||||||||||
Residential real estate | 408 | 8.0 | 679 | 8.1 | ||||||||||||
Home equity lines of credit | 195 | 2.4 | — | — | ||||||||||||
Construction and land | 13 | 0.1 | — | — | ||||||||||||
Qualitative | 741 | — | 883 | 3.9 | ||||||||||||
|
|
|
|
|
|
|
| |||||||||
| $ | 8,145 | 100.0 | % | $ | 5,300 | 100.0 | % | |||||||||
|
|
|
| |||||||||||||
Loan category as a percentage of total loan portfolio. |
| December 31, 2008 | December 31, 2010 | |||||||||||||||
| Balance | Percent (1) | Balance | Percent 1 | |||||||||||||
Commercial and industrial | $ | 646 | 14.7 | % | $ | 696 | 10.7 | % | ||||||||
Residential real estate | 584 | 44.8 | ||||||||||||||
Commercial real estate | 1,192 | 30.0 | 278 | 0.4 | ||||||||||||
Consumer | 26 | 10.5 | 288 | 68.2 | ||||||||||||
Residential real estate | 681 | 12.7 | ||||||||||||||
Home equity lines of credit | — | — | ||||||||||||||
Construction and land | — | — | ||||||||||||||
Qualitative | — | — | 388 | 8.0 | ||||||||||||
|
|
|
| |||||||||||||
| $ | 2,448 | 100.0 | % | $ | 2,331 | 100.0 | % | |||||||||
|
| |||||||||||||||
Loan category as a percentage of total loan portfolio. |
A loan is determined to be impaired usually when principal or interest becomes 90 days past due or when collection becomes uncertain. At the time a loan is determined to be impaired, the accrual of interest and amortization of deferred loan origination fees is discontinued (“non-accrual status”), and any accrued and unpaid interest income is reversed. At December 31, 2012,2014, we had $1.8$4.9 million of non-accrual loans, net of discounts, which included $1.6$1.0 million in troubled debt restructurings, for which there was a specific allowance of $0.6$0.3 million. At December 31, 2013, 2012, 2011, 2010, 2009 and 2008,2010, we had $1.5 million, $1.8 million, $2.5 million, $1.5 million, $1.9 million and $0.6$1.5 million of non-accrual loans, respectively, which included $0.4 million, $1.6 million, $0.3 million, $0.4 million and $0.5$0.4 million of trouble debt restructurings, respectively, for which there was a specific allowance of $0.2 million, $0.6 million, $0.2 million, $0.1$0.6 million, and $0.2 million, respectively. There were no troubled debt restructurings as of December 31, 2008.
The gross interest income related to impaired loans, which would have been recorded had these loans been current in accordance with their original terms, and the interest income recognized on these loans during the years ended December 31, 2014, 2013, 2012, 2011, 2010, 2009 and 2008,2010, were insignificant to the consolidated financial statements.
See the section entitled “Critical Accounting Policies and Estimates” herein regarding our policies for establishing loan loss reserves, including placing loans on non-accrual status.
V. Deposits
| V. | Deposits |
Deposits consist of money market and savings accounts, certificates of deposit, and demand deposits. The average balances of deposits and the associated weighted averageweighted-average interest rates for the periods indicated are as follows(in thousands, except percentages):
| Year Ended December 31, | Year Ended December 31, | |||||||||||||||||||||||||||||||||||||||||||||||
| 2012 | 2011 | 2010 | 2014 | 2013 | 2012 | |||||||||||||||||||||||||||||||||||||||||||
| Average Balance | Average Interest Rate | Average Balance | Average Interest Rate | Average Balance | Average Interest Rate | Average Balance | Average Interest Rate | Average Balance | Average Interest Rate | Average Balance | Average Interest Rate | |||||||||||||||||||||||||||||||||||||
Demand deposits (interest bearing) | $ | 2,656,474 | 0.56 | % | $ | 1,798,609 | 0.93 | % | $ | 1,183,317 | 0.42 | % | ||||||||||||||||||||||||||||||||||||
Demand deposits (interest-bearing) | $ | 4,473,104 | 0.05 | % | $ | 3,847,886 | 0.30 | % | $ | 2,656,474 | 0.56 | % | ||||||||||||||||||||||||||||||||||||
Certificates of deposit (time deposits) | $ | 1,546 | 2.86 | % | $ | 2,521 | 2.46 | % | $ | 7,686 | 2.82 | % | $ | 97,854 | 0.31 | % | $ | 43,288 | 2.10 | % | $ | 1,546 | 2.86 | % | ||||||||||||||||||||||||
Demand deposits (non-interest bearing) | $ | 21,060 | * | $ | 13,404 | * | $ | 18,192 | * | |||||||||||||||||||||||||||||||||||||||
Demand deposits (non-interest-bearing) | $ | 17,710 | * | $ | 69,189 | * | $ | 21,060 | * | |||||||||||||||||||||||||||||||||||||||
Savings accounts | $ | 4,410 | 0.05 | % | $ | 34 | — | % | $ | 92 | — | % | $ | 38 | 0.05 | % | $ | 2,683 | 0.20 | % | $ | 4,410 | 0.05 | % | ||||||||||||||||||||||||
| * | Not applicable. |
Scheduled maturities of certificates of deposit greater than $100,000 at December 31, 2012,2014, were as follows(in thousands):
| 0-3 Months | 3-6 Months | 6-12 Months | Over 12 Months | Total | ||||||||||||||||
| $ | — | $ | — | $ | 245 | $ | — | $ | 245 | |||||||||||
VI. Return on Equity and Assets
| Year Ended December 31, | ||||||||||||
| 2012 | 2011 | 2010 | ||||||||||
Return on assets (net income as a percentage of average total assets) | 2.24 | % | 1.78 | % | 0.05 | % | ||||||
Return on equity (net income as a percentage of average shareholders’ equity) | 9.83 | % | 6.54 | % | 0.18 | % | ||||||
Dividend payout ratio(1) | — | % | — | % | — | % | ||||||
Equity to assets ratio (average shareholders’ equity as a percentage of average total assets) | 22.86 | % | 27.22 | % | 29.16 | % | ||||||
| 0-3 Months | 3-6 Months | 6-12 Months | Over 12 Months | Total | ||||||||||||||
| $ | 12,089 | $ | 11,058 | $ | 10,637 | $ | 8,502 | $ | 42,286 | |||||||||
| VI. | Return on Equity and Assets |
| Year Ended December 31, | ||||||||||||
| 2014 | 2013 | 2012 | ||||||||||
Return on assets (net income as a percentage of average total assets) | 1.86 | % | 1.89 | % | 2.24 | % | ||||||
Return on equity (net income as a percentage of average shareholders’ equity) | 7.97 | % | 8.25 | % | 9.83 | % | ||||||
Dividend payout ratio 1 | — | % | — | % | — | % | ||||||
Equity to assets ratio (average shareholders’ equity as a percentage of average total assets) | 23.42 | % | 22.93 | % | 22.86 | % | ||||||
We did not declare or pay any dividends during |
| VII. | Short-Term Borrowings |
VII. Short-Term Borrowings
The following is a summary of our short-term borrowings for the periods indicated(in thousands, except rates):
Short-Term Borrowings | Stock Loan | |||||||
Year Ended December 31, 2012: | ||||||||
Amount outstanding at December 31, 2012 | $ | 304,700 | $ | 19,218 | ||||
Weighted average interest rate thereon | 1.14 | % | 0.24 | % | ||||
Maximum amount outstanding at any month-end | $ | 319,400 | $ | 175,662 | ||||
Average amount outstanding during the year | $ | 184,413 | $ | 137,284 | ||||
Weighted average interest rate thereon | 1.10 | % | 0.16 | % | ||||
|
|
|
| |||||
Year Ended December 31, 2011: | ||||||||
Amount outstanding at December 31, 2011 | $ | 199,400 | $ | 124,711 | ||||
Weighted average interest rate thereon | 1.17 | % | 0.17 | % | ||||
Maximum amount outstanding at any month-end | $ | 310,600 | $ | 176,210 | ||||
Average amount outstanding during the year | $ | 199,613 | $ | 124,130 | ||||
Weighted average interest rate thereon | 1.15 | % | 0.30 | % | ||||
|
|
|
| |||||
Year Ended December 31, 2010: | ||||||||
Amount outstanding at December 31, 2010 | $ | 109,600 | $ | 27,907 | ||||
Weighted average interest rate thereon | 1.05 | % | 0.26 | % | ||||
Maximum amount outstanding at any month-end | $ | 259,700 | $ | 101,580 | ||||
Average amount outstanding during the year | $ | 108,784 | $ | 69,507 | ||||
Weighted average interest rate thereon | 1.01 | % | 0.38 | % | ||||
|
|
|
| |||||
| Short-Term Borrowings | Stock Loan | |||||||
Year Ended December 31, 2014: | ||||||||
Amount outstanding at December 31, 2014 | $ | — | $ | 4,215 | ||||
Weighted-average interest rate thereon | — | % | nm | |||||
Maximum amount outstanding at any month-end | $ | 414,900 | $ | 79,164 | ||||
Average amount outstanding during the year | $ | 97,815 | $ | 45,758 | ||||
Weighted-average interest rate thereon | 1.12 | % | 0.17 | % | ||||
|
|
|
| |||||
Year Ended December 31, 2013: | ||||||||
Amount outstanding at December 31, 2013 | $ | 55,700 | $ | 40,101 | ||||
Weighted-average interest rate thereon | 1.22 | % | 0.16 | % | ||||
Maximum amount outstanding at any month-end | $ | 546,200 | $ | 176,771 | ||||
Average amount outstanding during the year | $ | 252,948 | $ | 91,194 | ||||
Weighted-average interest rate thereon | 1.26 | % | 0.17 | % | ||||
|
|
|
| |||||
Year Ended December 31, 2012: | ||||||||
Amount outstanding at December 31, 2012 | $ | 304,700 | $ | 19,218 | ||||
Weighted-average interest rate thereon | 1.14 | % | 0.24 | % | ||||
Maximum amount outstanding at any month-end | $ | 319,400 | $ | 175,662 | ||||
Average amount outstanding during the year | $ | 184,413 | $ | 137,284 | ||||
Weighted-average interest rate thereon | 1.10 | % | 0.16 | % | ||||
Results of Operations – Institutional Group
The following table presents consolidated financial information for the Institutional Group segment for the periods indicated(in thousands, except percentages):
| For the Year Ended December 31, | Percentage Change | As a Percentage of Net Revenues for the Year Ended December 31, | For the Year Ended December 31, | Percentage Change | As a Percentage of Net Revenues for the Year Ended December 31, | |||||||||||||||||||||||||||||||||||||||||||||||||||||||||||
| 2012 | 2011 | 2010 | 2012 vs. 2011 | 2011 vs. 2010 | 2012 | 2011 | 2010 | 2014 | 2013 | 2012 | 2014 vs. 2013 | 2013 vs. 2012 | 2014 | 2013 | 2012 | |||||||||||||||||||||||||||||||||||||||||||||||||
Revenues: | ||||||||||||||||||||||||||||||||||||||||||||||||||||||||||||||||
Commissions | $ | 151,093 | $ | 190,036 | $ | 123,719 | (20.5 | ) % | 53.6 | % | 24.4 | % | 37.4 | % | 22.8 | % | $ | 220,689 | $ | 211,678 | $ | 147,862 | 4.3 | % | 43.2 | % | 22.2 | % | 24.5 | % | 24.4 | % | ||||||||||||||||||||||||||||||||
Principal transactions | 180,263 | 133,251 | 217,770 | 35.3 | (38.8 | ) | 29.2 | 26.3 | 40.2 | 225,347 | 204,760 | 170,444 | 10.1 | 20.1 | 22.7 | 23.8 | 28.2 | |||||||||||||||||||||||||||||||||||||||||||||||
Advisory fees | 273,333 | 202,223 | 94,675 | 35.2 | 113.6 | 27.5 | 23.5 | 15.7 | ||||||||||||||||||||||||||||||||||||||||||||||||||||||||
Capital raising | 145,247 | 103,985 | 108,473 | 39.7 | (4.1 | ) | 23.5 | 20.5 | 20.0 | 259,587 | 205,591 | 146,871 | 26.3 | 40.0 | 26.1 | 23.9 | 24.3 | |||||||||||||||||||||||||||||||||||||||||||||||
Advisory | 96,084 | 75,123 | 83,425 | 27.9 | (10.0 | ) | 15.5 | 14.8 | 15.4 | |||||||||||||||||||||||||||||||||||||||||||||||||||||||
|
|
|
|
|
|
|
|
|
|
|
|
|
|
|
| |||||||||||||||||||||||||||||||||||||||||||||||||
Investment banking | 241,331 | 179,108 | 191,898 | 34.7 | (6.7 | ) | 39.0 | 35.3 | 35.4 | 532,920 | 407,814 | 241,546 | 30.7 | 68.8 | 53.6 | 47.4 | 40.0 | |||||||||||||||||||||||||||||||||||||||||||||||
Interest | 10,591 | 7,603 | 8,315 | 39.3 | (8.6 | ) | 1.7 | 1.5 | 1.5 | 21,801 | 18,544 | 9,737 | 17.6 | 90.4 | 2.2 | 2.2 | 1.6 | |||||||||||||||||||||||||||||||||||||||||||||||
Other income | 41,130 | 2,108 | 4,255 | * | (50.5 | ) | 6.6 | 0.4 | 0.8 | 2,205 | 30,876 | 41,151 | (92.9 | ) | (25.0 | ) | 0.2 | 3.6 | 6.8 | |||||||||||||||||||||||||||||||||||||||||||||
|
|
|
|
|
|
|
|
|
|
|
|
|
|
|
| |||||||||||||||||||||||||||||||||||||||||||||||||
Total revenues | 624,408 | 512,106 | 545,957 | 21.9 | (6.2 | ) | 100.9 | 100.9 | 100.7 | 1,002,962 | 873,672 | 610,740 | 14.8 | 43.1 | 100.9 | 101.5 | 101.0 | |||||||||||||||||||||||||||||||||||||||||||||||
Interest expense | 5,872 | 4,709 | 4,118 | 24.7 | 14.4 | 0.9 | 0.9 | 0.7 | 9,381 | 12,514 | 6,086 | (25.0 | ) | 105.6 | 0.9 | 1.5 | 1.0 | |||||||||||||||||||||||||||||||||||||||||||||||
|
|
|
|
|
|
|
|
|
|
|
|
|
|
|
| |||||||||||||||||||||||||||||||||||||||||||||||||
Net revenues | 618,536 | 507,397 | 541,839 | 21.9 | (6.4 | ) | 100.0 | 100.0 | 100.0 | 993,581 | 861,158 | 604,654 | 15.4 | 42.4 | 100.0 | 100.0 | 100.0 | |||||||||||||||||||||||||||||||||||||||||||||||
|
|
|
|
|
|
|
| |||||||||||||||||||||||||||||||||||||||||||||||||||||||||
|
|
|
|
|
|
|
| |||||||||||||||||||||||||||||||||||||||||||||||||||||||||
Non-interest expenses: | ||||||||||||||||||||||||||||||||||||||||||||||||||||||||||||||||
Compensation and benefits | 392,062 | 323,503 | 315,329 | 21.2 | 2.6 | 63.4 | 63.8 | 58.2 | 620,001 | 524,870 | 380,185 | 18.1 | 38.1 | 62.4 | 61.0 | 62.9 | ||||||||||||||||||||||||||||||||||||||||||||||||
Occupancy and equipment rental | 27,283 | 23,129 | 19,663 | 18.0 | 17.6 | 4.4 | 4.5 | 3.6 | 47,326 | 46,004 | 25,524 | 2.9 | 80.2 | 4.8 | 5.3 | 4.2 | ||||||||||||||||||||||||||||||||||||||||||||||||
Communication and office supplies | 32,744 | 29,944 | 23,725 | 9.4 | 26.2 | 5.3 | 5.9 | 4.4 | 55,670 | 48,378 | 31,331 | 15.1 | 54.4 | 5.6 | 5.6 | 5.2 | ||||||||||||||||||||||||||||||||||||||||||||||||
Commissions and floor brokerage | 17,871 | 15,310 | 14,402 | 16.7 | 6.3 | 2.9 | 3.0 | 2.7 | 22,642 | 22,039 | 16,611 | 2.7 | 32.7 | 2.3 | 2.6 | 2.7 | ||||||||||||||||||||||||||||||||||||||||||||||||
Other operating expenses | 52,409 | 52,242 | 39,185 | 0.3 | 33.3 | 8.5 | 10.3 | 7.2 | 95,037 | 76,978 | 49,516 | 23.5 | 55.5 | 9.5 | 8.9 | 8.2 | ||||||||||||||||||||||||||||||||||||||||||||||||
|
|
|
|
|
|
|
|
|
|
|
|
|
|
|
| |||||||||||||||||||||||||||||||||||||||||||||||||
Total non-interest expenses | 522,369 | 444,128 | 412,304 | 17.6 | 7.7 | 84.5 | 87.5 | 76.1 | 840,676 | 718,269 | 503,167 | 17.0 | 42.7 | 84.6 | 83.4 | 83.2 | ||||||||||||||||||||||||||||||||||||||||||||||||
|
|
|
|
|
|
|
|
|
|
|
|
|
|
|
| |||||||||||||||||||||||||||||||||||||||||||||||||
Income before income taxes | $ | 96,167 | $ | 63,269 | $ | 129,535 | 52.0 | % | (51.2 | )% | 15.5 | % | 12.5 | % | 23.9 | % | $ | 152,905 | $ | 142,889 | $ | 101,487 | 7.0 | % | 40.8 | % | 15.4 | % | 16.6 | % | 16.8 | % | ||||||||||||||||||||||||||||||||
|
|
|
|
|
|
|
|
|
|
|
|
|
|
|
| |||||||||||||||||||||||||||||||||||||||||||||||||
Year Ended December 31, 20122014 Compared With Year Ended December 31, 20112013
NET REVENUES
For the year ended December 31, 2012,2014, Institutional Group net revenues increased 21.9%15.4% to $618.5$993.6 million from $507.4$861.2 million in 2011.2013. The increase in net revenues isfor the year ended December 31, 2014, over 2013, was primarily attributable to (1) higher investment banking revenues as a result of an increase in fixed income capital raising revenues, which is primarily attributable to strong public finance activity and our acquisition of Stone & Youngberg in 2011; (2) increased advisory fees, as a resultimproved capital-raising revenues, and growth of improved M&A activity; (3) increased fixed income institutional brokerage revenues as a result of strong trading volumes and tightening credit spreads; and (4) gains recognized on our investment in Knight Capital Group, Inc. The increase was offset by a decrease in equity institutional brokerage revenues, which has been negatively impacted by the difficult market environment.revenues.
Commissions –For the year ended December 31, 2012,2014, commission revenues decreased 20.5%increased 4.3% to $151.1$220.7 million from $190.0$211.7 million in 2011.2013.
Principal transactions – For the year ended December 31, 2012,2014, principal transactions revenues increased 35.3%,10.1% to $180.3$225.3 million from $133.3$204.8 million in 2011.2013.
For the year ended December 31, 2012, fixed income institutional2014, equity brokerage revenues increased 19.5%9.2% to $169.0$249.8 million from $141.4$228.8 million in 2011.2013. The increase in fixed income institutional brokerage revenues is primarily attributable to improved fixed incomehigher trading volumes tighter credit spreads, and to our acquisitionas a result of Stone & Youngbergmarket volatility during the first half of 2014. This growth was negatively impacted during the third quarter of 2014 as a result of industry-wide declines in 2011.volume.
For the year ended December 31, 2012, equity institutional2014, fixed income brokerage revenues decreased 10.7%increased 4.5% to $162.4$196.2 million from $181.9$187.7 million during 2011.in 2013. The decrease in equity institutional brokerage revenuesincrease is primarily attributable to the challenging conditionsan improvement in fixed income trading volumes in the equity capital markets.first half of 2014, as a result of the acquisition of the fixed income business from Knight Capital in July 2013, offset by lower trading volumes in the third quarter of 2014 that impacted the industry.
Investment banking –For the year ended December 31, 2012,2014, investment banking revenues increased 34.7%30.7% to $241.3$532.9 million from $179.1$407.8 million in 2011.2013. The increase in investment banking revenues is primarily attributable to an increasehigher advisory fees and capital-raising revenues in fixed income capital raising revenues, advisory fee revenues, and equity capital raising revenues from 2011.
For the year ended December 31, 2012, capital raising revenues2014, strategic advisory fees increased 39.7%35.2% to $145.2$273.3 million from $104.0$202.2 million in 2011.
For the year ended December 31, 2012, fixed income capital raising revenues increased 121.6% to $58.7 million from $26.5 million in 2011. The increase in fixed income capital raising revenues is primarily attributable to an increase in the municipal bond origination business. For the year ended December 31, 2012, we were involved, as manager or co-manager, in 1,068 tax-exempt issues compared to 1,006 issues during 2011. The increase in the number of deals we were involved in during 2012 is primarily attributable to our acquisition of Stone & Youngberg in 2011.
For the year ended December 31, 2012, equity capital raising revenues increased 11.7% to $86.6 million from $77.5 million in 2011.2013. The increase is primarily attributable to an increase in capital raising activity during 2012. During the year ended December 31, 2012, we were involved, as manager or co-manager,number of completed advisory transactions and the aggregate transaction value over the comparable period in 170 equity underwritings compared to 123 equity underwritings during 2011.2013.
For the year ended December 31, 2012, strategic advisory fees2014, capital-raising revenues increased 27.9%26.3% to $96.1$259.6 million from $75.1$205.6 million in 2011.2013.
For the year ended December 31, 2014, equity capital-raising revenues increased 29.5% to $202.1 million from $156.1 million in 2013. The increase in strategic advisory fees iswas primarily attributable to an increase in the number of transactions over 2013.
For the year ended December 31, 2014, fixed income capital-raising revenues increased 16.1% to $57.5 million from $49.5 million in 2013. The increase is primarily attributable to the hiring of the European institutional fixed income sales and size of M&A transactions.trading team from Knight Capital Group, which was completed in July 2013, and De La Rosa, which closed on April 3, 2014, in addition to our investments over the past year in this business.
Other income –For the year ended December 31, 2012,2014, other income increased $39.0 milliondecreased 92.9% to $41.1$2.2 million from $2.1$30.9 million during the comparable period in 2011.2013. The increasedecrease in other income is primarily attributable a $39.0 million gainto gains recognized on our investment in Knight Capital Group, Inc. during 2012.2013.
NON-INTEREST EXPENSES
For the year ended December 31, 2012,2014, Institutional Group non-interest expenses increased 17.6%17.0% to $522.4$840.7 million from $444.1$718.3 million in 2011. The2013.
Unless specifically discussed below, the fluctuations in non-interest expenses were primarily attributable to the continued growth of our Institutional Group segment. We have added 226287 revenue producers and 62 support staff since December 31, 2011.2013. This growth is primarily attributable to the acquisitions of De La Rosa and Oriel during the year ended December 31, 2014.
Compensation and benefits –For the year ended December 31, 2012,2014, compensation and benefits expense increased 21.2%18.1% to $392.1$620.0 million from $323.5$524.9 million in 2011.2013. The increase is principally due to the growth of the business and fixed compensation for the additional administrative support staff. Compensation and benefits expense as a percentage of net revenues was 62.4% for the year ended December 31, 2014, compared to 61.0% in 2013.
Occupancy and equipment rental –For the year ended December 31, 2014, occupancy and equipment rental expense increased 2.9% to $47.3 million from $46.0 million in 2013. The increase is primarily due to the increase in office locations as a result of the growth of the business.
Communications and office supplies –For the year ended December 31, 2014, communications and office supplies expense increased 15.1% to $55.7 million from $48.4 million in 2013. The increase is primarily attributable to the growth of the business, which has resulted in an increase in communication and quote equipment.
Commissions and floor brokerage –For the year ended December 31, 2014, commissions and floor brokerage expense increased 2.7% to $22.6 million from $22.0 million in 2013. The increase is primarily attributable to the growth in trade execution costs from our flow business during the first half of 2014. This growth was negatively impacted during the second half of 2014 as a result of industry-wide declines in volumes.
Other operating expenses –For the year ended December 31, 2014, other operating expenses increased 23.5% to $95.0 million from $77.0 million in 2013. The increase is primarily attributable to an increase in legal expenses, professional service fees, and travel and promotion expenses.
INCOME BEFORE INCOME TAXES
For the year ended December 31, 2014, income before income taxes for the Institutional Group segment increased 7.0% to $152.9 million from $142.9 million in 2013. Profit margins (income before income taxes as a percentage of net revenues) have declined to 15.4% for the year ended December 31, 2014, from 16.6% in 2013 as a result of an increase in operating expenses.
Year Ended December 31, 2013 Compared With Year Ended December 31, 2012
NET REVENUES
For the year ended December 31, 2013, Institutional Group net revenues increased 42.4% to $861.2 million from $604.7 million in 2012. The increase in net revenues for the year ended December 31, 2013, over the comparable period in 2012, is primarily attributable to an increase in advisory fees, higher equity institutional brokerage revenues, an increase in equity capital-raising revenues, and higher fixed income institutional brokerage revenues.
The increase in net revenues was impacted by the following factors: 1) our merger with KBW, 2) the acquisition of the U.S. institutional fixed income sales and trading business and the hiring of the European institutional fixed income sales and trading team from Knight Capital Group, and 3) the acquisition of Miller Buckfire.
Commissions –For the year ended December 31, 2013, commission revenues increased 43.2% to $211.7 million from $147.9 million in 2012.
Principal transactions – For the year ended December 31, 2013, principal transactions revenues increased 20.1% to $204.8 million from $170.4 million in 2012.
For the year ended December 31, 2013, equity institutional brokerage revenues increased 54.1% to $228.8 million from $148.4 million in 2012. The increase is primarily attributable to an increase in trading activity as a result of market volatility.
For the year ended December 31, 2013, fixed income institutional brokerage revenues increased 10.5% to $187.7 million from $169.9 million in 2012. The increase is primarily attributable to an increase in fixed income trading volumes, which were positively impacted by the addition of sales and trading teams from Knight Capital Group.
Investment banking –For the year ended December 31, 2013, investment banking revenues increased 68.8% to $407.8 million from $241.5 million in 2012. The increase is attributable to an increase in advisory fee revenues over 2012. Our investment banking revenues were positively impacted by our acquisition of KBW, Inc. and Miller Buckfire.
For the year ended December 31, 2013, strategic advisory fees increased 113.6% to $202.2 million from $94.7 million in 2012. The increase is primarily attributable to an increase in the number of completed equity transactions and the aggregate transaction value over 2012.
For the year ended December 31, 2013, capital-raising revenues increased 40.0% to $205.6 million from $146.9 million in 2012.
For the year ended December 31, 2013, equity capital-raising revenues increased 66.4% to $156.0 million from $93.8 million in 2012. The increase was primarily attributable to an increase in the number of transactions over 2012. During the year ended December 31, 2013, we were involved, as manager or co-manager, in 326 equity underwritings compared to 170 equity underwritings during 2012.
For the year ended December 31, 2013, fixed income capital-raising revenues decreased 6.7% to $49.5 million from $53.1 million in 2012. The decrease for the year ended December 31, 2013, from 2012, is primarily attributable to a decrease in the municipal bond origination business.
Interest – For the year ended December 31, 2013, interest revenue increased 90.4% to $18.5 million from $9.7 million in 2012. The increase in interest revenue is primarily attributable to increased levels of inventory to support the growth of our fixed income sales and trading business.
Other income –For the year ended December 31, 2013, other income decreased 25.0% to $30.9 million from $41.2 million in 2012. The decrease in other income is primarily attributable to gains recognized on our investment in Knight Capital Group, Inc. during the third quarter of 2012, offset by gains recorded on the sale of certain aircraft and lease revenue from the operations of East Shore Aircraft LLC.
Interest expense –For the year ended December 31, 2013, interest expense increased 105.6% to $12.5 million from $6.1 million in 2012. The increase in interest expense is primarily attributable to increased inventory levels.
NON-INTEREST EXPENSES
For the year ended December 31, 2013, Institutional Group non-interest expenses increased 42.7% to $718.3 million from $503.2 million in 2012.
The increase in non-interest expenses was impacted by the following factors: 1) our merger with KBW, 2) the acquisition of the U.S. institutional fixed income sales and trading business and the hiring of the European institutional fixed income sales and trading team from Knight Capital Group, and 3) the acquisition of Miller Buckfire.
Compensation and benefits –For the year ended December 31, 2013, compensation and benefits expense increased 38.1% to $524.9 million from $380.2 million in 2012. The increase is primarilyprincipally due to increased compensation as a result of the growth of the business including the additional incentive compensation associated with our investment in Knight Capital Group, Inc., and fixed compensation for the additional administrative support staff.
Compensation and benefits expense as a percentage of net revenues was 63.4%61.0% for the year ended December 31, 20122013, compared to 63.8%62.9% for the year ended December 31, 2011.2012.
Occupancy and equipment rental –For the year ended December 31, 2012,2013, occupancy and equipment rental expense increased 18.0%80.2% to $27.3$46.0 million from $23.1$25.5 million in 2011.2012. The increase in occupancy and equipment rental expense is primarily attributabledue to the increase in rent expense due primarilyoffice locations from 32 at December 31, 2012, to an increase in office locations.40 at December 31, 2013.
Communications and office supplies –For the year ended December 31, 2012,2013, communications and office supplies expense increased 9.4%54.4% to $32.7$48.4 million from $29.9$31.3 million in 2011.2012. The increase in communications and office supplies expense is primarily attributable to an increase in communication and quote equipment as a result of the growth of the business.
Commissions and floor brokerage –For the year ended December 31, 2012,2013, commissions and floor brokerage expense increased 16.7%32.7% to $17.9$22.0 million from $15.3$16.6 million during the comparable period in 2011.2012. The increase in commissions and floor brokerage expense is primarily attributable to an increase in fixed income trading volumes over the comparable periods in 2011.
Other operating expenses –For the year ended December 31, 2012,2013, other operating expenses increased 0.3%55.5% to $52.4$77.0 million from $52.2$49.5 million in 2011.2012. The increase in other operating expenses is primarily attributable to an increase in licensetravel and registrationpromotion expenses, professional service fees, dues and subscriptions, as a result of the continued growth of the business, offset by a reduction in conference and travel expenses,merger-related legal expenses, and professional fees from the comparable periods in 2011.expenses.
INCOME BEFORE INCOME TAXES
For the year ended December 31, 2012,2013, income before income taxes for the Institutional Group segment increased 52.0%, or $32.9 million,40.8% to $96.2$142.9 million from $63.3$101.5 million in 2011.2012. Profit margins have improved(income before income taxes as a resultpercentage of the increase in revenue growth and improved productivity.
Year Ended December 31, 2011 Compared With Year Ended December 31, 2010
NET REVENUES
For the year ended December 31, 2011, Institutional Group net revenues decreased 6.4% to $507.4 million from $541.8 million in 2010. The decrease in net revenuesrevenues) for the year ended December 31, 2011 over the prior year is primarily attributable to the decline in fixed income institutional brokerage revenues and investment banking revenues, which have been negatively impacted by the challenging market conditions present throughout 2011.
Commissions –For the year ended December 31, 2011, commission revenues increased 53.6% to $190.0 million from $123.7 million in 2010.
Principal transactions – For the year ended December 31, 2011, principal transactions revenues decreased 38.8%, to $133.3 million from $217.8 million in 2010.
The increase in commissions and a corresponding decrease in principal transactions is primarily attributable to a change in classification of certain equity trades that were recorded as principal transactions during the year ended December 31, 2010 that are now being recorded as commission revenues as a result of regulatory changes.
For the year ended December 31, 2011, equity institutional brokerage revenues increased 5.1% to $181.9 million from $173.0 million during 2010.
Lower fixed income trading volumes led to a decline in institutional brokerage revenues from the comparable periods in 2010. For the year ended December 31, 2011, fixed income institutional brokerage revenues decreased 16.1% to $141.4 million from $168.5 million in 2010. The lower institutional brokerage revenues were offset by the increase in revenue as a result of our acquisition of Stone & Youngberg on October 1, 2011.
Investment banking –For the year ended December 31, 2011, investment banking revenues decreased 6.7% to $179.1 million from $191.9 million in 2010. The decrease is primarily attributable to a decrease in equity capital raising and advisory fees due to market volatility and uncertainty that curtailed capital markets activity during 2011.
For the year ended December 31, 2011, capital raising revenues decreased 4.1% to $104.0 million from $108.5 million in 2010.
For the year ended December 31, 2011, equity capital raising revenues decreased 11.3% to $77.5 million from $87.5 million in 2010. The decrease was primarily attributable to a decrease in the number of transactions from 2010. During the year ended December 31, 2011, we were involved, as manager or co-manager, in 123 equity underwritings compared to 149 equity underwritings during 2010.
For the year ended December 31, 2011, fixed income capital raising revenues increased 25.8% to $26.5 million from $21.0 million in 2010. The increase is primarily attributable to an increase in the municipal bond origination business and our acquisition of Stone & Youngberg on October 1, 2011. For the year ended December 31, 2011, we were involved, as manager or co-manager, in 588 tax-exempt issues compared to 564 issues during 2010.
For the year ended December 31, 2011, strategic advisory fees decreased 10.0% to $75.1 million from $83.4 million in 2010. The decrease is attributable to a decrease in the number of completed equity transactions and the aggregate transaction value over 2010.
Interest revenue –For the year ended December 31, 2011, interest revenue decreased 8.6% to $7.6 million from $8.3 million in 2010.
Other income –For the year ended December 31, 2011, other income decreased 50.5% to $2.1 million from $4.3 million during the comparable period in 2010. The decrease is primarily attributable to unrealized investment losses recognized during the quarter compared to unrealized investment gains during 2010.
Interest expense –For the year ended December 31, 2011, interest expense increased 14.4% to $4.7 million from $4.1 million in 2010. The increase is primarily attributable to increased levels of inventory and the related borrowing costs to fund our inventory purchases.
NON-INTEREST EXPENSES
For the year ended December 31, 2011, Institutional Group non-interest expenses increased 7.7% to $444.1 million from $412.3 million in 2010. The fluctuations in non-interest expenses were primarily attributable to the continued growth of our Institutional Group segment. We have added 261 revenue producers and support staff since December 31, 2010, including approximately 95 revenue producers and support staff from our acquisition of Stone & Youngberg.
Compensation and benefits –For the year ended December 31, 2011, compensation and benefits expense increased 2.6% to $323.5 million from $315.3 million in 2010. The increase is primarily attributable to increased base salaries and additional compensation expense resulting from the acquisition of TWPG.
Compensation and benefits expense as a percentage of net revenues was 63.8% for the year ended December 31, 2011 compared to 58.2% for the year ended December 31, 2010. The higher compensation ratio for the year ended December 31, 2011 was driven by the impact of increased fixed compensation costs on a reduced revenue base.
Occupancy and equipment rental – For the year ended December 31, 2011, occupancy and equipment rental expense increased 17.6% to $23.1 million from $19.7 million in 2010. The increase is primarily due to the increase in rent and depreciation expense as a result of the growth of the segment.
Communications and office supplies –For the year ended December 31, 2011, communications and office supplies expense increased 26.2% to $29.9 million from $23.7 million in 2010. The increase is primarily attributable to increased telecommunications costs as a result of the growth of the business
Commissions and floor brokerage –For the year ended December 31, 2011, commissions and floor brokerage expense increased 6.3% to $15.3 million from $14.4 million during the comparable period in 2010. The increase is primarily attributable to higher expenses associated with accessing electronic communications networks.
Other operating expenses –For the year ended December 31, 2011, other operating expenses increased 33.3% to $52.2 million from $39.2 million in 2010. The increase is primarily attributable to an increase in industry conference expenses, higher travel and promotion costs, and professional fees
INCOME BEFORE INCOME TAXES
For the year ended December 31, 2011, income before income taxes for the Institutional Group segment decreased 51.2% to $63.3 million from $129.5 million in 2010. Profit margins have diminished as a result of the increase in non-interest expenses. In addition, our margins2013, have been impacted by the declinean increase in fixed income institutional brokeragenet revenues, and investment banking revenues, which have been negatively impactedoffset by the challenging market conditions present throughout 2011.an increase in non-compensation operating expenses.
Results of Operations – Other Segment
The following table presents consolidated financial information for the Other segment for the periods presented(in thousands, except percentages):
| For the Year Ended December 31, | Percentage Change | For the Year Ended December 31, | Percentage Change | |||||||||||||||||||||||||||||||||||||
| 2012 | 2011 | 2010 | 2012 vs. 2011 | 2011 vs. 2010 | 2014 | 2013 | 2012 | 2014 vs. 2013 | 2013 vs. 2012 | |||||||||||||||||||||||||||||||
Net revenues | $ | (1,075 | ) | $ | 1,007 | $ | (3,082 | ) | (206.8 | )% | 132.7 | % | $ | (17,808 | ) | $ | (4,891 | ) | $ | (2,138 | ) | (264.1 | )% | (128.7 | )% | |||||||||||||||
Non-interest expenses: | ||||||||||||||||||||||||||||||||||||||||
Compensation and benefits | 53,229 | 48,084 | 237,417 | 10.7 | (79.7 | ) | 80,252 | 137,835 | 53,212 | (41.8 | ) | 159.0 | ||||||||||||||||||||||||||||
Other operating expenses | 84,174 | 112,966 | 83,288 | (25.5 | ) | 35.6 | 111,029 | 114,506 | 83,059 | (3.0 | ) | 37.9 | ||||||||||||||||||||||||||||
|
|
|
|
|
|
|
|
|
| |||||||||||||||||||||||||||||||
Total non-interest expenses | 137,403 | 161,050 | 320,705 | (14.7 | ) | (49.8 | ) | 191,281 | 252,341 | 136,271 | (24.2 | ) | 85.2 | |||||||||||||||||||||||||||
|
|
|
|
|
|
|
|
|
| |||||||||||||||||||||||||||||||
Loss before income taxes | $ | (138,478 | ) | $ | (160,043 | ) | $ | (323,787 | ) | (13.5 | )% | (50.6 | )% | $ | (209,089 | ) | $ | (257,232 | ) | $ | (138,409 | ) | 18.7 | % | (85.8 | )% | ||||||||||||||
|
|
|
|
|
|
|
|
|
| |||||||||||||||||||||||||||||||
Year Ended December 31, 20122014 Compared With Year Ended December 31, 20112013
Net revenues – For the year ended December 31, 2014, net revenues were negatively impacted by investment losses when compared to the prior year.
Compensation and benefits –For the year ended December 31, 2012, net revenues2014, compensation and benefits expense decreased $2.141.8% to $80.3 million from 2011. Net revenues primarily consist of rental income and investment gains, offset by interest expense associated with our senior notes. The decrease$137.8 million in net revenues is primarily attributable to an increase in interest expense as a result of the issuance of our senior notes in January 2012.2013.
Compensation and benefits – Forexpense for the year ended December 31, 2012, compensation and benefits expense increased 10.7% to $53.22014, includes a non-cash charge of $17.9 million from $48.1 million in 2011. The increase in compensation and benefits expense is primarily attributable(pre-tax) related to the following: 1) increased fixed compensation forexpensing of certain restricted stock awards granted to employees of Oriel and 1919 Investment Counsel at the additional administrative support staff;respective closing dates of those acquisitions. There were no continuing service requirements associated with these restricted stock awards, and 2) an increaseaccordingly, they were expensed on the date of grant. During the year ended December 31, 2013, the expense associated with the granting of certain restricted stock awards in deferred compensation expense as a result of the acceleration of the vesting period for unit grants awarded to newly retirement-eligible employees during the first quarter of 2012.conjunction with our acquisitions where there was no continuing service requirement was $50.7 million.
Other operating expenses –For the year ended December 31, 2012,2014, other operating expenses decreased 25.5%3.0% to $84.2$111.0 million from $113.0$114.5 million in 2011, which included $47.5 million related to litigation-related expenses associated with the civil lawsuit and related regulatory investigation in connection with the ongoing matter with five Southeastern Wisconsin school districts. Excluding these expenses other operating expenses for the year ended December 31, 2012 increased 28.7% over 2011. The increase in other operating expenses is primarily attributable to an increase in license and registration fees, professional fees, and subscriptions as a result of the continued growth of the business, offset by a reduction in legal expenses, and travel expenses from 2011.2013.
Year Ended December 31, 20112013 Compared With Year Ended December 31, 20102012
Net revenues –For the year ended December 31, 2011,2013, net revenues increased $4.1decreased $2.8 million from 2010. The increase in net2012. Net revenues is primarily attributable to lower investment losses recognized in 2011,for the year ended December 31, 2013, was negatively impacted by the interest expense associated with our December 2012 issuance of $150.0 million of 5.375% senior notes, offset by an increase in other-than temporary impairment charges. investment gains over the comparable period in 2012.
Compensation and benefits –For the year ended December 31, 2011 we recognized an impairment charge of $1.92013, compensation and benefits expense increased 159.0% to $137.8 million on our held-to-maturity investmentfrom $53.2 million in 2012. The increase is principally due to the following: 1) an other-than-temporary declineincrease in valuefixed compensation for the additional administrative support staff, and 2) the expensing of stock awards issued to employees as retention as part of the Knight Capital Fixed Income business transaction and the acquisition of KBW, Inc.
On the respective closing dates of the acquisitions of KBW, Inc. and the Knight Capital Fixed Income business, we granted restricted stock units to certain employees as retention. There are no continuing service requirements associated with these restricted stock awards, and accordingly, they were expensed on the date of grant, which resulted in a non-cash charge (pre-tax) during 2011.
Compensation and benefits – For the year ended December 31, 2011, compensation and benefits expense decreased 79.7% to $48.1 million from $237.4 million in 2010, which included $186.3 million related to the modification2013, of the company’s deferred compensation plan and merger-related expenses.$50.7 million.
Other operating expenses –For the year ended December 31, 2011,2013, other operating expenses increased 35.6%37.9% to $113.0$114.5 million from $83.3$83.1 million in 2010.2012. The increase in other operating expenses over the prior year period is primarily attributable to an increase in litigation-relatedoperating expenses (including merger-related expenses) associated with our acquisitions of the civil lawsuitKnight Capital Fixed Income business, KBW, Inc., and related regulatory investigation in connection with the ongoing matter with five Southeastern Wisconsin school districts. For a discussion of our legal matters, including the OPEB litigation, see Item 3, “Legal Proceedings.”Miller Buckfire.
In addition to the increase in litigation-related expenses described above, the increase was attributable to increased administrative support expense, rent, professional fees and legal expenses. The increase in legal expenses is attributable to a number of factors, including significant litigation and regulatory matters, and an increase in the number of customer claims, as well as litigation costs to defend industry recruiting claims. We are subject to various proceedings and claims arising primarily from our securities business activities, including lawsuits, arbitration claims, class actions, and regulatory matters.
Analysis of Financial Condition
Our company’s consolidated statements of financial condition consist primarily of cash and cash equivalents, receivables, trading inventory, bank loans, investments, goodwill, loans and advances to financial advisors, bank deposits, and payables. Total assets of $7.0$9.52 billion at December 31, 2012,2014, were up 40.7%5.7% over December 31, 2011.2013. The increase is primarily attributable to increases in (1)bank loans and the recognition of goodwill associated with our acquisitions of De La Rosa, Oriel, 1919 Investment Counsel, and Merchant, partially offset by a decrease in our investment portfolio, which consists of available-for-sale and held-to-maturity securities, (2) our trading inventory, (3) bank loans, (4) cash and cash equivalents, (5) increase in operating and direct financing leases as a result of our acquisition of East Shore; and (6) the recognition of goodwill associated with our acquisition of Miller Buckfire.securities. Our broker-dealer subsidiary’s gross assets and liabilities, including trading inventory, stock loan/borrow, receivables and payables from/to brokers, dealers, and clearing organizations and clients, fluctuate with our business levels and overall market conditions.
As of December 31, 2012,2014, our liabilities were comprised primarily of short-term borrowings of $304.7 million, senior notes of $325.0 million, non-recourse debt of $59.0$625.0 million, trust preferred securities of $82.5 million, deposits of $3.3$4.79 billion at Stifel Bank, and payables to customers of $295.5$321.5 million at our broker-dealer subsidiaries, as well as accounts payable and accrued expenses, and accrued employee compensation of $446.6$661.4 million. To meet our obligations to clients and operating needs, we had $403.9$689.8 million in cash and cash equivalents at December 31, 2012.2014. We also had client brokerage receivables of $487.8$483.9 million at Stifel Nicolaus and $1.0$2.19 billion in loans held for investment at Stifel Bank.
Cash Flow
Cash and cash equivalents increased $236.3decreased $26.8 million to $403.9$689.8 million at December 31, 2012,2014, from $167.7$716.6 million at December 31, 2011.2013. Operating activities used $264.3provided $250.3 million of cash primarily due to the net effect of non-cash items, net income recognized in 2014, and an increase in operating assets and a decrease in operating liabilities, offset by net income recognizedan increase in 2012 and the net effect of non-cash items.operating assets. Investing activities used cash of $1.2 $392.9
billion due to an increase in our loan portfolio purchases of our available-for-sale and held-to-maturity securities as part of ourthe investment strategy at Stifel Bank, the acquisitions, net of East Shore and Miller Buckfire,acquired cash, purchases of investment securities, and fixed asset purchases, partially offset by proceeds from the maturity of available-for-sale securities, sale of investments, and bank customer loan repayments. Financing activities provided cash of $1.7 billion principally$123.2 million primarily due to the proceeds from our $300.0 million senior note issuance in July 2014 and an increase in affiliated deposits, offset by a decrease in securities sold under agreements to repurchase and the proceeds received from the issuancesecurities loaned, and repayments of our senior notes and non-recourse debt, offset by repurchases of our common stock.short-term borrowings.
Liquidity and Capital Resources
The Company’s senior management establishes the liquidity and capital policies of the Company.our company. The Company’s senior management reviews business performance relative to these policies, monitors the availability of alternative sources of financing, and oversees the liquidity and interest rate sensitivity of the Company’sour company’s asset and liability position.
Our assets, consisting mainly of cash or assets readily convertible into cash, are our principal source of liquidity. The liquid nature of these assets provides for flexibility in managing and financing the projected operating needs of the business. These assets are financed primarily by our equity capital, corporate debt, debentures to trusts, client credit balances, short-term bank loans, proceeds from securities lending, and other payables. We currently finance our client accounts and firm trading positions through ordinary course borrowings at floating interest rates from various banks on a demand basis, securities lending, and repurchase agreements, with company-owned and client securities pledged as collateral. Changes in securities market volumes, related client borrowing demands, underwriting activity, and levels of securities inventory affect the amount of our financing requirements.
Our bank assets consist principally of available-for-sale and held-to-maturity securities, retained loans, and cash and cash equivalents. Stifel Bank’s current liquidity needs are generally met through deposits from bankbrokerage clients and equity capital. We monitor the liquidity of Stifel Bank daily to ensure its ability to meet customer deposit withdrawals, maintain reserve requirements, and support asset growth.
As of December 31, 2012,2014, we had $7.0$9.5 billion in assets, $4.1$5.0 billion of which consisted of cash or assets readily convertible into cash as follows(in thousands, except average days to conversion):
| December 31, | December 31, | Average | ||||||||||||||||||
| 2012 | 2011 | Avg. Conversion | 2014 | 2013 | Conversion | |||||||||||||||
Cash and cash equivalents | $ | 403,941 | $ | 167,671 | $ | 689,782 | $ | 716,560 | ||||||||||||
Receivables from brokers, dealers, and clearing organizations | 276,224 | 252,636 | 3 days | 651,074 | 381,122 | 3 days | ||||||||||||||
Securities purchased under agreements to resell | 158,695 | 75,455 | 1 day | 55,078 | 225,075 | 1 day | ||||||||||||||
Trading securities owned at fair value | 763,025 | 471,209 | 5 days | |||||||||||||||||
Financial instruments owned at fair value | 782,912 | 799,214 | 5 days | |||||||||||||||||
Available-for-sale securities at fair value | 1,625,168 | 1,202,141 | 3 days | 1,513,478 | 1,756,253 | 3 days | ||||||||||||||
Held-to-maturity securities at amortized cost | 708,008 | 190,484 | 10 days | 1,177,565 | 1,312,115 | 10 days | ||||||||||||||
Investments | 192,686 | 172,784 | 5 days | 131,425 | 117,028 | 5 days | ||||||||||||||
|
|
|
| |||||||||||||||||
Total cash and assets readily convertible to cash | $ | 4,127,747 | $ | 2,532,380 | $ | 5,001,314 | $ | 5,307,367 | ||||||||||||
|
|
|
| |||||||||||||||||
As of December 31, 20122014 and 2011,2013, the amount of collateral by asset class is as follows (in thousands):
| December 31, 2012 | December 31, 2011 | December 31, 2014 | December 31, 2013 | |||||||||||||||||||||||||||||
| Contractual | Contingent | Contractual | Contingent | Contractual | Contingent | Contractual | Contingent | |||||||||||||||||||||||||
Cash and cash equivalents | $ | 45,929 | $ | — | $ | 47,637 | $ | — | $ | 37,134 | $ | — | $ | 43,104 | $ | — | ||||||||||||||||
Trading securities owned at fair value | 140,346 | 607,586 | 80,176 | 393,888 | ||||||||||||||||||||||||||||
Financial instruments owned at fair value | 39,180 | 425,108 | 263,809 | 686,997 | ||||||||||||||||||||||||||||
Available-for-sale securities at fair value | — | 613,795 | — | 644,866 | — | 1,210,193 | — | 504,100 | ||||||||||||||||||||||||
Investments | — | 63,430 | — | 99,550 | — | 41,150 | — | 51,051 | ||||||||||||||||||||||||
|
|
|
|
|
|
|
| |||||||||||||||||||||||||
| $ | 186,275 | $ | 1,284,811 | $ | 127,813 | $ | 1,138,304 | $ | 76,314 | $ | 1,676,451 | $ | 306,913 | $ | 1,242,148 | |||||||||||||||||
|
|
|
|
|
|
|
| |||||||||||||||||||||||||
Capital Management
We have an ongoing authorization from the Board of Directors to repurchase our common stock in the open market or in negotiated transactions. At December 31, 2012,2014, the maximum number of shares that may yet be purchased under this plan was 4.03.5 million. We utilize the share repurchase program to manage our equity capital relative to the growth of our business and help to meet obligations under our employee benefit plans. We currently do not pay cash dividends on our common stock.
Liquidity Risk Management
Our businesses are diverse, and our liquidity needs are determined by many factors, including market movements, collateral requirements, and client commitments, all of which can change dramatically in a difficult funding environment. During a liquidity crisis, credit-sensitive funding, including unsecured debt and some types of secured financing agreements, may be unavailable, and the terms (e.g., interest rates, collateral provisions, and tenor) or availability of other types of secured financing may change. We manage liquidity risk by diversifying our funding sources across products and among individual counterparties within those products.
As a holding company, whereby all of our operations are conducted through our subsidiaries, our cash flow and our ability to service our debt, including the notes, depend upon the earnings of our subsidiaries. Our subsidiaries are separate and distinct legal entities. Our subsidiaries have no obligation to pay any amounts due on the notes or to provide us with funds to pay our obligations, whether by dividends, distributions, loans, or other payments.
Our liquidity requirements may change in the event we need to raise more funds than anticipated to increase inventory positions, support more rapid expansion, develop new or enhanced services and products, acquire technologies, or respond to other unanticipated liquidity requirements. We primarily rely on financing activities and distributions from our subsidiaries for funds to implement our business and growth strategies and repurchase our shares. Net capital rules, restrictions under our borrowing arrangements of our subsidiaries, as well as the earnings, financial condition, and cash requirements of our subsidiaries, may each limit distributions to us from our subsidiaries.
The availability of outside financing, including access to the capital markets and bank lending, depends on a variety of factors, such as market conditions, the general availability of credit, the volume of trading activities, the overall availability of credit to the financial services sector, and our credit rating. Our cost and availability
of funding may be adversely affected by illiquid credit markets and wider credit spreads. As a result of any future concerns about the stability of the markets generally and the strength of counterparties specifically, lenders may from time to time curtail, or even cease to provide, funding to borrowers.
Our liquidity management policies are designed to mitigate the potential risk that we may be unable to access adequate financing to service our financial obligations without material business impact. The principal elements of our liquidity management framework are: (a) daily monitoring of our liquidity needs at the holding company and significant subsidiary level;level, (b) stress testing the liquidity position atpositions of Stifel Bank;and Stifel Bank, and (c) diversification of our funding sources.
Monitoring of liquidity
–Senior management establishes our liquidity and capital policies. These policies include senior management’s review of shortshort- and long-term cash flow forecasts, review of monthly capital expenditures, the monitoring of the availability of alternative sources of financing, and the daily monitoring of liquidity in our significant subsidiaries. Our decisions on the allocation of capital to our business units consider, among other factors, projected profitability and cash flow, risk, and impact on future liquidity needs. Our treasury department assists in evaluating, monitoring, and controlling the impact that our business activities have on our financial condition, liquidity, and capital structure as well as maintains our relationships with various lenders. The objectives of these policies are to support the successful execution of our business strategies while ensuring ongoing and sufficient liquidity.
Liquidity stress testing (Firm-wide) – A liquidity stress test model is maintained by the Company that measures liquidity outflows across multiple scenarios at the major operating subsidiaries and details the corresponding impact to our holding company and the overall consolidated firm. Liquidity stress tests are utilized to ensure that current exposures are consistent with the Company’s established liquidity risk tolerance and, more specifically, to identify and quantify sources of potential liquidity strain. Further, the stress tests are utilized to analyze possible impacts on the Company’s cash flows, liquidity position, profitability, and solvency. The outflows are modeled over a 30-day liquidity stress timeframe and include the impact of idiosyncratic and macro-economic stress events.
The assumptions utilized in the Company’s liquidity stress tests include, but are not limited to, the following:
At December 31, 2014, the Company maintained sufficient liquidity to meet current and contingent funding obligations as modeled in its liquidity stress test model.
Liquidity stress testing (Stifel Bank)
–Stifel Bank performs twothree primary stress tests on its liquidity position. These stress tests are based on the following company-specific stresses: (1) the amount of deposit run-off that Stifel Bank could withstand over a one monthone-month period of time based on its on-balance sheet liquidity and available credit; andcredit, (2) Stifel Bank’s ability to fund operations if all available credit were to be drawn immediately, with no additional available credit.credit, and (3) Stifel Bank’s ability to fund operations under a regulatory prompt corrective action. The goal of these stress tests is to determine Stifel Bank’s ability to fund continuing operations under significant pressures on both assets and liabilities.
Under bothall stress tests, Stifel Bank considers cash and highly liquid investments as available to meet liquidity needs. In its analysis, Stifel Bank considers Agency MBS,mortgage-backed securities, Corporate Bonds, and CMBSCommercial mortgage-backed securities as highly liquid. In addition to being able to be readily financed at modest haircut levels, Stifel Bank estimates that each of the individual securities within each of the asset classes described above could be sold into the market and converted into cash within three business days under normal market conditions, assuming that the entire portfolio of a given asset class was not simultaneously liquidated. At December 31, 2012,2014, available cash and highly liquid investments comprised approximately 50%30% of Stifel Bank’s assets, which was well in excess of its internal target.
In addition to these stress tests, Stifel Bank management performs a daily liquidity review. The daily analysis provides Stifel Bank management with all major fluctuations in liquidity. The analysis also tracks the proportion of deposits that Stifel Bank is sweeping from its affiliated broker-dealer, Stifel Nicolaus.Stifel. On a monthly basis, liquidity key performance indicators and compliance with liquidity policy limits are reported to the Board of Directors. Stifel Bank has not violated any internal liquidity policy limits.
Funding Sources
The Company pursues a strategy of diversification of secured and unsecured funding sources (by product and by investor) and attempts to ensure that the tenor of the Company’s liabilities equals or exceeds the expected holding period of the assets being financed. The Company funds its balance sheet through diverse sources. These sources may include the Company’s equity capital, long-term debt, repurchase agreements, securities lending, deposits, committed and uncommitted credit facilities, FHLB advances, and federal funds agreements. At December 31, 2012,2014, we have $163.1$91.6 million of ARS. Any redemptions by issuers of the ARS will create liquidity during the period in which the redemption occurs. ARS redemptions have been at par, and we believe will continue to be at par.
Cash and Cash Equivalents.Equivalents –We held $403.9$689.8 million of cash and cash equivalents at December 31, 2012,2014, compared to $167.7$716.6 million at December 31, 2011.2013. Cash and cash equivalents provide immediate sources of funds to meet our liquidity needs.
Securities Available-for-Sale –.We held $1.6$1.51 billion in available-for-sale investment securities at December 31, 2012,2014, compared to $1.2$1.76 billion at December 31, 2011.2013. As of December 31, 2012,2014, the weighted averageweighted-average life of the investment securities portfolio was approximately 3.12.2 years. These investment securities provide increased liquidity and flexibility to support our company’s funding requirements.
We monitor the available-for-sale investment portfolio for other-than-temporary impairment based on a number of criteria, including the size of the unrealized loss position, the duration for which the security has been in a loss position, credit rating, the nature of the investments, and current market conditions. For debt securities, we also consider any intent to sell the security and the likelihood we will be required to sell the security before its anticipated recovery. We continually monitor the ratings of our security holdings and conduct regular reviews of our credit sensitivecredit-sensitive assets.
Deposits.Deposits –Deposits have become one of our largest funding sources. Deposits provide a stable, low-cost source of funds that we utilize to fund loan and asset growth and to diversify funding sources. We have continued to expand our deposit-gathering efforts through our existing private client network and through expansion. These channels offer a broad set of deposit products that include demand deposits, money market deposits, and certificates of deposit (“CDs”).
As of December 31, 2012,2014, we had $3.3$4.79 billion in deposits compared to $2.1$4.66 billion at December 31, 2011.2013. The growth in deposits is primarily attributable to the increase in brokerage deposits held by the bank. Our core deposits are comprised of non-interest-bearing deposits, money market deposit accounts, savings accounts, and CDs.
Short-term borrowings.borrowings –Our short-term financing is generally obtained through short-term bank line financing on an uncommitted, secured basis, short-term bank line financing on an unsecured basis, and securities lending arrangements. We borrow from various banks on a demand basis with company-owned and customer securities pledged as collateral. The value of customer-owned securities used as collateral is not reflected in the consolidated statements of financial condition. Our uncommitted secured lines of credit at December 31, 20122014, totaled $680.0$780.0 million with four banks and are dependent on having appropriate collateral, as determined by the bank agreements, to secure an advance under the line. The availability of our uncommitted lines areis subject to approval by the individual banks each time an advance is requested and may be denied. Our peak daily borrowing was $473.7$414.9 million during the year ended December 31, 2012.2014. There are no compensating balance requirements under these arrangements.
At December 31, 2012, short-term borrowings from banks were $304.7 million at an average rate of 1.14%, which were collateralized by company-owned securities valued at $530.7 million. At December 31, 2011, short-term borrowings from banks were $199.4 million at an average rate of 1.17%, which were collateralized by company-owned securities valued at $388.0 million. The average bank borrowing was $184.4 million, $199.6 million and $108.8 million for the years ended December 31, 2012, 2011 and 2010, respectively, at average daily interest rates of 1.10%, 1.15% and 1.01%, respectively.
At December 31, 2012 and 2011, Stifel Nicolaus had a stock loan balance of $19.2 million and $124.7 million, respectively, at average daily interest rates of 0.24% and 0.17%, respectively. The average outstanding securities lending arrangements utilized in financing activities were $137.3 million, $124.1 million and $69.5 million during the years ended December 31, 2012, 2011 and 2010, respectively, at average daily effective interest rates of 0.16%, 0.30% and 0.38%, respectively. Customer-owned securities were utilized in these arrangements.
Unsecured short-term borrowings.Our committed short-term bank line financing at December 31, 20122014, consisted of a $50.0$100.0 million committed revolving credit facility. The credit facility expires in December 2013.2017. The applicable interest rate under the revolving credit facility is calculated as a per annum rate equal to the higher of (i) the prime rate, (ii) the federal funds effective rate plus 0.50%, or (iii) one-month Eurocurrency rate plus 1.00%, as defined in the revolving credit facility. On JanuaryAt December 31, 2014, we were in compliance with all covenants.
At December 31, 2014, we had no short-term borrowings. At December 31, 2013, ourshort-term borrowings were $55.7 million at an average rate of 1.22%, which were collateralized by company-owned securities valued at $440.8 million. The average bank borrowing was $97.8 million, $252.9 million, and $184.4 million for the years ended December 31, 2014, 2013, and 2012, respectively, at average daily interest rates of 1.12%, 1.26%, and 1.10%, respectively.
The average outstanding securities lending arrangements utilized in financing activities were $45.8 million, $91.2 million, and $137.3 million during the years ended December 31, 2014, 2013, and 2012, respectively, at average daily effective interest rates of 0.17%, 0.17%, and 0.16%, respectively. Customer-owned securities were utilized in these arrangements.
Unsecured short-term borrowings –Our committed short-term bank line financing at December 31, 2014, consisted of a $100.0 million revolving credit facility. The credit facility expires in December 2017. The applicable interest rate under the revolving credit facility was amendedis calculated as a per annum rate equal to increase our line ofthe one-month Eurocurrency rate plus 1.00%, as defined in the revolving credit to $100.0 million.facility.
We can draw upon this line as long as certain restrictive covenants are maintained. Under our revolving credit facility, we are also required to maintain compliance with a minimum consolidated tangible net worth covenant, under which we are required to have at all times a consolidated tangible net worth, as defined, in the revolving credit facility, of not less than the greater of (x) $625.0 million or (y) 80% of the consolidated tangible net worth as of the last day of the previous fiscal year and a maximum consolidated total capitalization ratio covenant, under which we are required to have at all times a consolidated total capitalization ratio, as defined in the revolving credit facility, of not more than 25%. In addition, Stifel Nicolaus, our broker-dealer subsidiary, is required to maintain compliance with a minimum regulatory net capital covenant of not less than 10% of aggregate debits, as defined in the revolving credit facility.
defined. At December 31, 2012,2014, we had no advances on our revolving credit facility and were in compliance with all covenants. Our revolving credit facility contains customary events of default, including, without limitation, payment defaults, breaches of representations and warranties, covenant defaults, cross-defaults to similar obligations, certain events of bankruptcy and insolvency, and judgment defaults. In addition, Stifel, our broker-dealer subsidiary, is required to maintain compliance with a minimum regulatory net capital covenant of not less than 10% of aggregate debits, as defined in the revolving credit facility.
Federal Home Loan Bank Advances and other secured financing.financing –Stifel Bank has borrowing capacity with the Federal Home Loan Bank of $601.4 million$1.36 billion at December 31, 2012,2014, all of which was unused, and a $25.0 million federal funds agreement for the purpose of purchasing short-term funds should additional liquidity be needed. Stifel Bank receives overnight funds from excess cash held in Stifel Nicolaus brokerage accounts, which are deposited into a money market account. These balances totaled $3.3$4.70 billion at December 31, 2012.2014.
Public Offering of Senior Notes.Notes –On January 18, 2012, we issued $175.0 million principal amount of 6.70% Senior Notes due 2022 (the “notes”“Notes”). Interest on the notesNotes accrue from January 23, 2012, and will be paid quarterly in arrears on January 15, April 15, July 15, and October 15 of each year, commencing on April 15, 2012. The notesNotes will mature on January 15, 2022. We may redeemProceeds from the notes in whole or in partissuance of $169.3 million, after discounts, commissions, and expenses, were used for general corporate purposes. In January 2012, we received an initial credit rating from Standard & Poor’s Financial Services LLC of BBB-, along with a BBB- rating on or afterthe notes. We redeemed the 100% of the outstanding Notes on January 15, 2015, at our option, at a redemption price equal to 100% of their principal amount, plus accrued and unpaid interest to the date of redemption. Proceeds from the notes issuance of $169.3 million, after discounts, commissions and expenses, will be used for general corporate purposes. In January 2012, we received an initial credit rating from Standard & Poor’s Financial Services LLC of BBB-, along with a BBB—rating on the notes.
On December 18, 2012, we issued $150.0 million principal amount of 5.375% Senior Notes due 2022 (the “December 2012 Notes”). Interest on the December 2012 Notes accrue from December 21, 2012, and will be paid quarterly in arrears on January 15, April 15, July 15, and October 15 of each year, commencing on April 15, 2013. The December 2012 Notes will mature on December 31, 2022. We may redeem the December 2012 Notes in whole or in part on or after December 31, 2015, at our option, at a redemption price equal to 100% of their principal amount, plus accrued and unpaid interest to the date of redemption. Proceeds from the December 2012 Notes issuance of $146.1 million, after discounts, commissions, and expenses, will bewere used for general corporate purposes. In January 2013, we received a BBB—BBB- rating on the December 2012 Notes.
Non-Recourse Debt.On December 17, 2012,July 15, 2014, we issued $60.0sold in a registered underwritten public offering, $300.0 million in aggregate principal in non-recourse debt for the purposeamount of acquiring East Shore Aircraft LLC.4.250% senior notes due July 2024 (the “2014 Notes”). Interest on the non-recourse debt2014 Notes is payable monthly.semi-annually in arrears. We are requiredmay redeem the 2014 Notes in whole or in part, at our option, at a redemption price equal to redeem some of the non-recourse debt as each aircraft is sold at the various lease expiration dates. We will collect 100% of the monthly lease payments with approximately 65% allocated to paytheir principal amount, plus a “make-whole” premium and accrued and unpaid interest, first then principal on non-recourse debt. In addition, as each aircraft is sold at the various lease expiration dates a portion of the proceeds will be appliedif any, to the principal balancedate of redemption. Proceeds from the non-recourse debt.2014 Notes issuance of $295.3 million, after discounts, commissions, and expenses, were used for general corporate purposes. In July 2014, we received a BBB- rating on the 2014 Notes.
Credit Rating
We believe our current rating depends upon a number of factors, including industry dynamics, operating and economic environment, operating results, operating margins, earnings trends and volatility, balance sheet composition, liquidity and liquidity management, our capital structure, our overall risk management, business diversification, and our market share and competitive position in the markets in which we operate. Deteriorations in any of these factors could impact our credit rating. A reduction in our credit rating could adversely affect our liquidity and competitive position, increase our incremental borrowing costs, limit our access to the capital markets, or trigger our obligations under certain financial agreements. As such, we may not be able to successfully obtain additional outside financing to fund our operations on favorable terms, or at all.
We believe our existing assets, most of which are liquid in nature, together with the funds from operations, available informal short-term credit arrangements, and our ability to raise additional capital will provide sufficient resources to meet our present and anticipated financing needs.
Use of Capital Resources
TWP has entered into settlement and release agreements (“Settlement Agreements”) with certain customers, whereby it will purchase their ARS, at par, in exchange for a release from any future claims. At December 31, 2012, we estimate that TWP customers held $18.4 million par value of ARS, which may be repurchased over the next –On April 3, years. The amount estimated for repurchase assumes no issuer redemptions.
On March 19, 2012, we announced a settlement with five Wisconsin school districts in a lawsuit that the districts filed in 2008 over investments that were created by Royal Bank of Canada and purchased by the districts when we acted as the districts’ public finance investment banker. Under the terms of the settlement, we paid $13.0 million to the school districts and provided a standby letter of credit for an additional $9.5 million, to be paid when, among other conditions, we resolve a related case with the SEC. The settlement also provides the potential for the school districts to obtain significant additional damages.
On August 6, 2012, along with certain other investors, we entered into a Securities Purchase Agreement (the “Purchase Agreement”) with Knight Capital Group, Inc. (“Knight Capital”), pursuant to which, among other things, Knight Capital sold an aggregate of 400,000 shares of preferred stock, par value $0.01 per share (the “Preferred Stock”), in a private placement in exchange for aggregate cash consideration of $400.0 million. Pursuant to the Purchase Agreement, we purchased 30,000 shares of Preferred Stock in exchange for cash consideration of $30.0 million. Each share of Preferred Stock is convertible into 666.667 shares of common stock, $0.01 per share, of Knight Capital.
On November 5, 2012 Stifel Financial Corp. and KBW entered into a merger agreement for our company to acquire 100% of the outstanding shares of KBW common stock. Under the terms of the merger agreement, each share of common stock, including certain restricted stock, of KBW issued and outstanding immediately prior to the effective time of the merger will be cancelled and converted into the right to receive a combination of (i) cash consideration of $8.00 ($10.00 less the extraordinary dividend amount of $2.00) and (ii) stock consideration of 0.2143 a share of our common stock.
The merger closed on February 15, 2013. In conjunction with the close of the merger, we issued 6.7 million shares of common stock to holders of KBW common stock, issued 2.2 restricted awards to KBW employees, and paid $253.0 million in cash.
On December 20, 2012, we acquired 100% of the ordinary members’ partnership interests in Miller Buckfire & Co. LLC (“Miller Buckfire”), an investment banking firm. Miller Buckfire provides a full range of investment banking advisory services, including financial restructuring, mergers and acquisitions, and debt and equity placements. The aggregate consideration paid by us in the Miller Buckfire acquisition included $7.3 million in cash, our initial investment of $28.0 million and common stock with a fair value of $21.7 million.
On December 21, 2012,2014, we completed the acquisition of East Shore Aircraft LLC (“East Shore”De La Rosa, a California-based public finance investment banking boutique. The addition of the De La Rosa team is expected to further strengthen our company’s position in a number of key underwriting markets in California. We funded the purchase of De La Rosa with cash available from operations.
On July 31, 2014, we completed the acquisition of Oriel, a London-based stockbroking and investment banking firm. The combination of our company and Oriel brought together more than 250 professionals, which created a significant middle-market investment banking group in London, with broad research coverage across most sectors of the economy, equity and debt sales and trading, and investment banking services. Consideration for this acquisition consisted of cash available from operations and the Company’s common stock.
On November 7, 2014, we completed the acquisition of 1919 Investment Counsel, and 1919 an asset management and trust company that provides customized investment advisory and trust services, on a discretionary basis, to individuals, families, and institutions throughout the country. We funded the purchase of 1919 Investment Counsel, and 1919 with cash available from operations.
On December 31, 2014, we acquired Merchant, a public finance investment banking firm headquartered in Montgomery, Alabama, which serves the Southeastern market. The strategic combination of Stifel and Merchant is expected to further strengthen our company’s position in several key underwriting markets in the Southeast. Consideration for this acquisition consisted of cash available from operations and the Company’s common stock.
On January 15, 2015 (the “redemption date”). East Shore, we redeemed 100% of our company’s outstanding 6.70% Senior Notes due 2022. The redemption price was initially formedequal to the sum of the principal amount of the Notes outstanding and accrued and unpaid interest on the Notes up to, but not including, the redemption date.
On February 23, 2015, we entered into a definitive agreement to acquire fifteen Boeing 757-200 aircraft from United Air Lines,Sterne Agee Group, Inc. (“UAL”Sterne Agee”) in sale-leaseback transactions with UAL., a financial services firm that offers comprehensive wealth management and investment services to a diverse client base including corporations, municipalities and individual investors. The purchase priceconsideration received by Sterne Agee shareholders will consist of $112.9 million was financed through a combination of existingour company’s common stock, valued at $51.55 per share, and cash, and the issuance of non-recourse debt. We will collect 100%is subject to adjustments for tangible book value and an indemnity earn-out relating to various indemnification obligations of the monthly lease payments withequityholders. Giving effect to those adjustments and the earn-out, the value of the merger consideration to be received by the Sterne Agee equityholders is expected to be approximately 65% allocated to pay interest first then principal$150.0 million. Sterne Agee equityholders will make stock/cash elections that will determine the final mix of consideration. Depending on non-recourse debt. In addition, as each aircraft is soldthose elections, we will issue at the various lease expiration dates a portionclosing of the proceeds will be appliedMerger between a minimum of 1.42 million shares and a maximum of 1.62 million shares. The cash consideration payable to Sterne Agee equityholders under the principal balanceMerger Agreement is expected to range from $77.0 million to $66.0 million. The merger is subject to approval by Sterne Agee shareholders, regulatory approvals and other, customary conditions. The Merger is expected to close during the second quarter of the non-recourse debt. The acquired assets consisted primarily of direct financing leases and operating leases. The allocation of the purchase price based on the fair values of the assets acquired and liabilities assumed resulted in no goodwill or intangible assets being recorded.2015.
The following table summarizes the activity related to our company’s demand note receivable from January 1, 20112013 to December 31, 20122014(in (in thousands):
| December 31, | 2014 | 2013 | ||||||||||||||
| 2012 | 2011 | |||||||||||||||
Beginning balance | $ | 172,717 | $ | 181,357 | ||||||||||||
Beginning balance – January 1 | $ | 184,458 | $ | 179,284 | ||||||||||||
Notes issued – organic growth | 63,948 | 38,654 | 70,871 | 51,646 | ||||||||||||
Notes issued – acquisitions(1) | — | 7,830 | ||||||||||||||
Notes issued – acquisitions1 | 10,830 | 20,248 | ||||||||||||||
Amortization | (57,147 | ) | (55,923 | ) | (64,735 | ) | (64,930 | ) | ||||||||
Other | (234 | ) | 799 | (3,667 | ) | (1,790 | ) | |||||||||
|
|
|
| |||||||||||||
Ending balance | $ | 179,284 | $ | 172,717 | ||||||||||||
Ending balance – December 31 | $ | 197,757 | $ | 184,458 | ||||||||||||
|
|
|
| |||||||||||||
Notes issued in conjunction with the acquisitions of |
We have paid $63.9$70.9 million in the form of upfront notes to financial advisors for transition pay during the year ended December 31, 2012.2014. As we continue to take advantage of the opportunities created by market displacement and as competition for skilled professionals in the industry increases, we may decide to devote more significant resources to attracting and retaining qualified personnel. In addition, we have paid $10.8 million in the form of notes to associates of acquired companies for retention during the year ended December 31, 2014.
We utilize transition pay, principally in the form of upfront demand notes, to aid financial advisors, who have elected to join our firm, to supplement their lost compensation while transitioning their customers’ accounts to the Stifel platform. The initial value of the notes is determined primarily by the financial advisorsadvisors’ trailing production and assets under management. These notes are generally forgiven over a fivefive- to ten yearten-year period based on production. The future estimated amortization expense of the upfront notes, assuming current yearcurrent-year production levels and static growth for the years ended December 31, 2013, 2014, 2015, 2016, 2017, 2018, 2019, and thereafter are $51.1$52.8 million, $38.7$41.4 million, $28.9$30.3 million, $21.6$23.5 million, $14.4$16.9 million, and $21.1$26.7 million, respectively. These estimates could change if we continue to grow our business through expansion or experience increased production levels.
We maintain several incentive stock award plans that provide for the granting of stock options, stock appreciation rights, restricted stock, performance awards, and stock units to our employees. Historically, we have granted stock units to our employees as part of our retention program. A stock unit represents the right to receive a share of common stock from our company at a designated time in the future without cash payment by the employee and is issued in lieu of cash incentive, principally for deferred compensation and employee retention plans. The restricted stock units generally vest on an annual basis over the next threeone to eight years after issuance and are distributable, if vested,distributed at predetermined future specified dates.payable dates once vesting occurs. At December 31, 2012,2014, the total number of stock units outstanding was 15.518.4 million, of which 6.611.4 million were unvested. At December 31, 2012,2014, there was unrecognized compensation cost for stock units of $209.4$314.9 million, which is expected to be recognized over a weighted-average period of 3.22.6 years.
The future estimated compensation expense of the unvested units, assuming current year forfeiture levels and static growth for the years ended December 31, 2015, 2016, 2017, 2018, 2019, and thereafter are $83.1 million, $72.8 million, $60.4 million, $45.5 million, $23.9 million, and $29.2 million, respectively. These estimates could change if our forfeitures change from historical levels.
TWP has entered into settlement and release agreements (“Settlement Agreements”) with certain customers, whereby it will purchase their ARS, at par, in exchange for a release from any future claims. At December 31, 2014, we estimate that TWP customers held $15.2 million par value of ARS, which may be repurchased over the next year. The amount estimated for repurchase assumes no issuer redemptions.
Net Capital Requirements
–We operate in a highly regulated environment and are subject to capital requirements, which may limit distributions to our company from our subsidiaries. Distributions from our broker-dealer subsidiaries are subject to net capital rules. These subsidiaries have historically operated in excess of minimum net capital requirements. However, if distributions were to be limited in the future due to the failure of our subsidiaries to comply with the net capital rules or a change in the net capital rules, it could have a material and adverse affecteffect to our company by limiting our operations that require intensive use of capital, such as underwriting or trading activities, or limit our ability to implement our business and growth strategies, pay interest on and repay the principal of our debt, and/or repurchase our common stock. Our non broker-dealer
non-broker-dealer subsidiary, Stifel Bank, is also subject to various regulatory capital requirements administered by the federal banking agencies. Our broker-dealer subsidiaries and Stifel Bank have consistently operated in excess of their capital adequacy requirements.
At December 31, 2012,2014, Stifel Nicolaus had net capital of $411.2$369.6 million, which was 77.8%63.3% of aggregate debit items and $400.7$357.9 million in excess of its minimum required net capital. At December 31, 2012,2014, KBW’s, CSA’s, Merchant’s, and Miller Buckfire’s net capital exceeded the minimum net capital required under the SEC rule. At December 31, 2012,2014, SNEL’s, netOriel’s, and Keefe, Bruyette & Woods Limited’s (“KBW Limited”) capital and reserves waswere in excess of the financial resources requirement under the rules of the FSA.FCA. At December 31, 2012, SN Canada’s net capital and reserves was in excess of the financial resources requirement under the rules of the IIROC. At December 31, 2012,2014, Stifel Bank was considered well capitalized under the regulatory framework for prompt corrective action. See Note 20 of the Notes to Consolidated Financial Statements for details of our regulatory capital requirements.
Critical Accounting Policies and Estimates
In preparing our consolidated financial statements in accordance with U.S. generally accepted accounting principles and pursuant to the rules and regulations of the SEC, we make assumptions, judgments, and estimates that affect the reported amounts of assets, liabilities, revenues, and expenses, and related disclosures of contingent assets and liabilities. We base our assumptions, judgments, and estimates on historical experience and various other factors that we believe to be reasonable under the circumstances. Actual results could differ materially from these estimates under different assumptions or conditions. On a regular basis, we evaluate our assumptions, judgments, and estimates. We also discuss our critical accounting policies and estimates with the Audit Committee of the Board of Directors.
We believe that the assumptions, judgments, and estimates involved in the accounting policies described below have the greatest potential impact on our consolidated financial statements. These areas are key components of our results of operations and are based on complex rules that require us to make assumptions, judgments, and estimates, so we consider these to be our critical accounting policies. Historically, our assumptions, judgments, and estimates relative to our critical accounting policies and estimates have not differed materially from actual results.
For a full description of these and other accounting policies, see Note 2 of the Notes to Consolidated Financial Statements.
Valuation of Financial Instruments
We measure certain financial assets and liabilities at fair value on a recurring basis, including cash equivalents, trading securities owned, available-for-sale securities, investments, trading securities sold, but not yet purchased, and derivatives.
Trading securities owned and pledged and trading securities sold, but not yet purchased, are carried at fair value on the consolidated statements of financial condition, with unrealized gains and losses reflected on the consolidated statements of operations.
The fair value of a financial instrument is defined as the price that would be received to sell an asset or paid to transfer a liability in an orderly transaction between market participants at the measurement date, or an exit price. The degree of judgment used in measuring the fair value of financial instruments generally correlates to the level of pricing observability. Financial instruments with readily available active quoted prices or for which fair value can be measured from actively quoted prices in active markets generally have more pricing observability and less judgment used in measuring fair value. Conversely, financial instruments rarely traded or not quoted have less pricing observability and are measured at fair value using valuation models that require more judgment. Pricing observability is impacted by a number of factors, including the type of financial instrument, whether the financial instrument is new to the market and not yet established, the characteristics specific to the transaction, and overall market conditions generally.
When available, we use observable market prices, observable market parameters, or broker or dealer quotes (bid and ask prices) to derive the fair value of financial instruments. In the case of financial instruments transacted on recognized exchanges, the observable market prices represent quotations for completed transactions from the exchange on which the financial instrument is principally traded.
A substantial percentage of the fair value of our trading securities and other investments owned, trading securities pledged as collateral, and trading securities sold, but not yet purchased, are based on observable market prices, observable market parameters, or derived from broker or dealer prices. The availability of observable market prices and pricing parameters can vary from product to product. Where available,
observable market prices and pricing or market parameters in a product may be used to derive a price without requiring significant judgment. In certain markets, observable market prices or market parameters are not available for all products, and fair value is determined using techniques appropriate for each particular product. These techniques involve some degree of judgment.
For investments in illiquid or privately held securities that do not have readily determinable fair values, the determination of fair value requires us to estimate the value of the securities using the best information available. Among the factors we consider in determining the fair value of investments are the cost of the investment, terms and liquidity, developments since the acquisition of the investment, the sales price of recently issued securities, the financial condition and operating results of the issuer, earnings trends and consistency of operating cash flows, the long-term business potential of the issuer, the quoted market price of securities with similar quality and yield that are publicly traded, and other factors generally pertinent to the valuation of investments. In instances where a security is subject to transfer restrictions, the value of the security is based primarily on the quoted price of a similar security without restriction but may be reduced by an amount estimated to reflect such restrictions. The fair value of these investments is subject to a high degree of volatility and may be susceptible to significant fluctuation in the near term, and the differences could be material.
We have categorized our financial instruments measured at fair value into a three-level classification in accordance with Topic 820, “Fair Value Measurement and Disclosures.” Fair value measurements of financial instruments that use quoted prices in active markets for identical assets or liabilities are generally categorized as Level 1, and fair value measurements of financial instruments that have no direct observable levels are generally categorized as Level 3. All other fair value measurements of financial instruments that do not fall within the Level 1 or Level 3 classification are considered Level 2. The lowest level input that is significant to the fair value measurement of a financial instrument is used to categorize the instrument and reflects the judgment of management.
Level 3 financial instruments have little to no pricing observability as of the report date. These financial instruments do not have active two-way markets and are measured using management’s best estimate of fair value, where the inputs into the determination of fair value require significant management judgment or estimation. We have identified Level 3 financial instruments to include certain asset-backed securities, consisting
of collateral loan obligation securities, that have experienced low volumes of executed transactions, certain corporate bonds and equity securities where there was less frequent or nominal market activity, investments in private equity funds, and auction rate securities for which the market has been dislocated and largely ceased to function. Our Level 3 asset-backed securities are valued using cash flow models that utilize unobservable inputs. Level 3 corporate bonds are valued using prices from comparable securities. Equity securities with unobservable inputs are valued using management’s best estimate of fair value, where the inputs require significant management judgment. Auction rate securities are valued based upon our expectations of issuer redemptions and using internal models.
At December 31, 2012,2014, Level 3 assets for which we bear economic exposure were $206.8$168.5 million or 7.7%6.4% of the total assets measured at fair value. During the year ended December 31, 2012,2014, we recorded purchases of $87.0$15.2 million and sales and redemptions of $113.2$78.5 million of Level 3 assets. We transferred $4.7$8.4 million, net, out of Level 3 during the year ended December 31, 2012.2014. Our valuation adjustments (realized and unrealized) increased the value of our Level 3 assets by $3.1$8.1 million.
At December 31, 2011,2013, Level 3 assets for which we bear economic exposure were $234.6$232.0 million or 12.3%8.1% of the total assets measured at fair value. During the year ended December 31, 2011,2013, we recorded purchases of $287.7$78.0 million and sales and redemptions of $254.6$61.4 million of Level 3 assets. We transferred $21.8$0.8 million, net, intoout of Level 3 during the year ended December 31, 2011.2013. Our valuation adjustments (realized and unrealized) increased the value of our Level 3 assets by $6.2$9.4 million.
At December 31, 2012,2014, Level 3 assets included the following: $163.1$91.6 million of auction rate securities and $43.7$76.9 million of private equity, municipal securities, and other fixed income securities.
Investments in Partnerships
Investments in partnerships and other investments include our general and limited partnership interests in investment partnerships and direct investments in non-public companies. These interests are carried at estimated fair value. The net assets of investment partnerships consist primarily of investments in non-marketable securities. The underlying investments held by such partnerships and direct investments in non-public companies are valued based on estimated fair value ultimately determined by us in our capacity as
general partner or investor and, in the case of an investment in an unaffiliated investment partnership, are based on financial statements prepared by an unaffiliated general partner. Due to the inherent uncertainty of valuation, fair values of these non-marketable investments may differ from the values that would have been used had a ready market existed for these investments, and the differences could be material. Increases and decreases in estimated fair value are recorded based on underlying information of these non-public company investments, including third-party transactions evidencing a change in value, market comparables,comparable, operating cash flows and financial performance of the companies, trends within sectors and/or regions, underlying business models, expected exit timing and strategy, and specific rights or terms associated with the investment, such as conversion features and liquidation preferences. In cases where an estimate of fair value is determined based on financial statements prepared by an unaffiliated general partner, such financial statements are generally unaudited other than audited year-end financial statements. Upon receipt of audited financial statements from an investment partnership, we adjust the fair value of the investments to reflect the audited partnership results if they differ from initial estimates. We also perform procedures to evaluate fair value estimates provided by unaffiliated general partners. At December 31, 2012,2014, we had commitments to invest in affiliated and unaffiliated investment partnerships of $3.0$11.5 million. These commitments are generally called as investment opportunities are identified by the underlying partnerships. These commitments may be called in full at any time.
The investment partnerships in which we are general partner may allocate carried interest and make carried interest distributions, which represent an additional allocation of net realized and unrealized gains to the general partner if the partnerships’ investment performance reaches a threshold as defined in the respective partnership agreements. These allocations are recognized in revenue as realized and unrealized gains and losses on investments in partnerships. Our recognition of allocations of carried interest gains and losses from the investment partnerships in revenue is not adjusted to reflect expectations about future performance of the partnerships.
As the investment partnerships realize proceeds from the sale of their investments, they may make cash distributions as provided for in the partnership agreements. Distributions that result from carried interest may subsequently become subject to claw back if the fair value of private equity partnership assets subsequently decreases in fair value. To the extent these decreases in fair value and allocated losses exceed our capital account balance, a liability is recorded by us. These liabilities for claw back obligations are not required to be paid to the investment partnerships until the dissolution of such partnerships, and are only required to be paid if the cumulative amounts actually distributed exceed the amount due based on the cumulative operating results of the partnerships.
We earn fees from the investment partnerships that we manage or of which we are a general partner. Such management fees are generally based on the net assets or committed capital of the underlying partnerships. We have agreed, in certain cases, to waive management fees, in lieu of making a cash contribution, in satisfaction of our general partner investment commitments to the investment partnerships. In these cases, we generally recognize our management fee revenues at the time when we are allocated a special profit interest in realized gains from these partnerships.
Contingencies
We are involved in various pending and potential legal proceedings related to our business, including litigation, arbitration, and regulatory proceedings. Some of these matters involve claims for substantial amounts, including claims for punitive damages. We have, after consultation with outside legal counsel and consideration of facts currently known by management, recorded estimated losses in accordance with Topic 450 (“Topic 450”), “Contingencies,” to the extent that claims are probable of loss and the amount of the loss can be reasonably estimated. The determination of these reserve amounts requires us to use significant judgment, and our final liabilities may ultimately be materially different. This determination is inherently subjective, as it requires estimates that are subject to potentially significant revision as more information becomes available and due to subsequent events. In making these determinations, we consider many factors, including, but not limited to, the loss and damages sought by the plaintiff or claimant, the basis and validity of the claim, the likelihood of a successful defense against the claim, and the potential for, and magnitude of, damages or settlements from such pending and potential litigation and arbitration proceedings, and fines and penalties or orders from regulatory agencies. See Item 3, “Legal Proceedings,” in Part I of this report for information on our legal, regulatory, and arbitration proceedings.
Allowance for Loan Losses
We regularly review the loan portfolio and have established an allowance for loan losses for inherent losses estimated to have occurred in the loan portfolio through a provision for loan losses charged to income. In providing for the allowance for loan losses, we consider historical loss experience, the nature and volume of the loan portfolio, adverse situations that may affect the borrower’s ability to repay, estimated value of any underlying collateral, and prevailing economic conditions. This evaluation is inherently subjective, as it requires estimates that are susceptible to significant revision as more information becomes available.
A loan is considered impaired when, based on current information and events, it is probable that the scheduled payments of principal or interest when due, according to the contractual terms of the loan agreement, will not be collectible. Factors considered in determining impairment include payment status, collateral value, and the probability of collecting scheduled principal and interest payments when due. Loans that experience insignificant payment delays and payment shortfalls generally are not classified as impaired. We determine the significance of payment delays and payment shortfalls on a case-by-case basis, taking into consideration all of the circumstances surrounding the loan and the borrower, including the length of the delay, the reasons for the delay, the borrower’s prior payment record, and the amount of the shortfall in relation to the principal and interest owed.
Once a loan is determined to be impaired, when principal or interest becomes 90 days past due or when collection becomes uncertain, the accrual of interest and amortization of deferred loan origination fees is discontinued (“non-accrual status”), and any accrued and unpaid interest income is reversed. Loans placed on non-accrual status are returned to accrual status when all delinquent principal and interest payments are collected and the collectibility of future principal and interest payments is reasonably assured. Loan losses are charged against the allowance when we believe the uncollectibility of a loan balance is certain. Subsequent recoveries, if any, are credited to the allowance for loan lossloss.
Large groups of smaller balance homogenous loans are collectively evaluated for impairment. Accordingly, we do not separately identify individual consumer and residential loans for impairment measurements. Impairment is measured on a loan-by-loan basis for non-homogeneous loans, and a specific allowance is established for individual loans determined to be impaired. Impairment is measured by comparing the carrying value of the impaired loan to the present value of its expected cash flow discounted at the loan’s effective interest rate, the loan’s observable market price, or the fair value of the collateral if the loan is collateral dependent.
Derivative Instruments and Hedging Activities
Our derivative instruments are carried on the consolidated statement of financial condition at fair value. We utilize these derivative instruments to minimize significant unplanned fluctuations in earnings caused by interest rate volatility. Our company’s goal is to manage sensitivity to changes in rates by offsetting the repricing or maturity characteristics of certain assets and liabilities, thereby limiting the impact on earnings. The use of derivative instruments does expose our company to credit and market risk. We manage credit risk through strict counterparty credit risk limits and/or collateralization agreements. At inception, we determine if a derivative instrument meets the criteria for hedge accounting under Topic 815, “Derivatives and Hedging.” Ongoing effectiveness evaluations are made for instruments that are designated and qualify as hedges. If the derivative does not qualify for hedge accounting, no assessment of effectiveness is needed.
Income Taxes
The provision for income taxes and related tax reserves is based on our consideration of known liabilities and tax contingencies for multiple taxing authorities. Known liabilities are amounts that will appear on current tax returns, amounts that have been agreed to in revenue agent revisions as the result of examinations by the taxing authorities, and amounts that will follow from such examinations but affect years other than those being examined. Tax contingencies are liabilities that might arise from a successful challenge by the taxing authorities taking a contrary position or interpretation regarding the application of tax law to our tax return filings. Factors considered in estimating our liability are results of tax audits, historical experience, and consultation with tax attorneys and other experts.
Topic 740 (“Topic 740”), “Income Taxes,” clarifies the accounting for uncertainty in income taxes recognized in an entity’s financial statements and prescribed recognition threshold and measurement attributes for financial statement disclosure of tax positions taken or expected to be taken on a tax return. The impact of an uncertain income tax position on the income tax return must be recognized at the largest amount that is more-likely-than-notmore likely than not to be sustained upon audit by the relevant taxing authority. An uncertain income tax position
will not be recognized if it has less than a 50% likelihood of being sustained. Additionally, Topic 740 provides guidance on derecognition, classification, interest and penalties, accounting in interim periods, disclosure, and transition.
Goodwill and Intangible Assets
Under the provisions of Topic 805, “Business Combinations,” we record all assets and liabilities acquired in purchase acquisitions, including goodwill and other intangible assets, at fair value. Determining the fair value of assets and liabilities requires certain estimates. At December 31, 2012, we had goodwill of $419.4 million and intangible assets of $29.0 million.
In accordance with Topic 350, “Intangibles – Goodwill and Other,” indefinite-life intangible assets and goodwill are not amortized. Rather, they are subject to impairment testing on an annual basis, or more often if events or circumstances indicate there may be impairment. This test involves assigning tangible assets and liabilities as well as identified intangible assets and goodwill to reporting units and comparing the fair value of each reporting unit to its carrying amount. If the fair value is less than the carrying amount, a further test is required to measure the amount of the impairment. We have elected to test for goodwill impairment in the third quarter of each calendar year.
We test goodwill for impairment on an annual basis and on an interim basis when certain events or circumstances exist. We test for impairment at the reporting unit level, which is generally at the level of or one level below our company’s business segments. For both the annual and interim tests, we have the option to first assess qualitative factors to determine whether the existence of events or circumstances leads to a determination that it is more likely than not that the fair value of a reporting unit is less than its carrying amount. If, after assessing the totality of events or circumstances, we determine it is more likely than not that the fair value of a reporting unit is greater than its carrying amount, then performing the two-step impairment test is not required. However, if we conclude otherwise, we are then required to perform the first step of the two-step impairment test. Goodwill impairment is determined by comparing the estimated fair value of a reporting unit with its respective carrying value. If the estimated fair value exceeds the carrying value, goodwill at the reporting unit level is not deemed to be impaired. If the estimated fair value is below carrying value, however, further analysis is required to determine the amount of the impairment. Additionally, if the carrying value of a reporting unit is zero or a negative value and it is determined that it is more likely than not the goodwill is impaired, further analysis is required. The estimated fair values of the reporting units are derived based on valuation techniques we believe market participants would use for each of the reporting units. Our annual goodwill impairment testing was completed as of July 31, 2012,2014, with no impairment identified.
The goodwill impairment test requires us to make judgments in determining what assumptions to use in the calculation. Assumptions, judgments, and estimates about future cash flows and discount rates are complex and often subjective. They can be affected by a variety of factors, including, among others, economic trends and market conditions, changes in revenue growth trends or business strategies, unanticipated competition, discount rates, technology, or government regulations. In assessing the fair value of our reporting units, the volatile nature of the securities markets and industry requires us to consider the business and market cycle and assess the stage of the cycle in estimating the timing and extent of future cash flows. In addition to discounted cash flows, we consider other information, such as public market comparables and multiples of recent mergers and acquisitions of similar businesses. Although we believe the assumptions, judgments, and estimates we have made in the past have been reasonable and appropriate, different assumptions, judgments, and estimates could materially affect our reported financial results.
Identifiable intangible assets, which are amortized over their estimated useful lives, are tested for potential impairment whenever events or changes in circumstances suggest that the carrying value of an asset or asset group may not be fully recoverable.
Recent Accounting Pronouncements
See Note 2 of the Notes to Consolidated Financial Statements for information regarding the effect of new accounting pronouncements on our consolidated financial statements.
Off-Balance Sheet Arrangements
Information concerning our off-balance sheet arrangements is included in Note 2223 of the Notes to Consolidated Financial Statements. Such information is hereby incorporated by reference.
Dilution
As of December 31, 2012,2014, there were 248,765126,374 shares of our common stock issuable on outstanding options, with an average weightedaverage-weighted exercise price of $19.95,$31.61, and 15,474,67418,360,587 outstanding stock unit grants, with each unit representing the right to receive shares of our common stock at a designated time in the future. The restricted stock units generally vest on an annual basis over the next threeone to eight years after issuance and are distributable, if vested,distributed at predetermined future specified dates.payable dates once vesting occurs. Of the outstanding restricted stock unit awards, 8,923,7436,956,418 shares are currently vested and 6,550,93111,404,169 are unvested. Assuming vesting requirements are met, the Company anticipates that 3,114,0112,846,259 shares under these awards will be distributed in 2013, 1,773,0862015, 3,221,639 will be distributed in 2014, 1,277,2262016, 2,807,950 will be distributed in 2015,2017, and the balance of 9,310,3519,484,739 will be distributed thereafter.
An employee will realize income as a result of an award of stock units at the time shares are distributed in an amount equal to the fair market value of the shares at that time, and we are entitled to a corresponding tax deduction in the year of issuance. Unless an employee elects to satisfy the withholding in another manner, either by paying the amount in cash or by delivering shares of Stifel Financial Corp. common stock already owned by the individual for at least six months, we may satisfy tax withholding obligations on income associated with the grants by reducing the number of shares otherwise deliverable in connection with the awards, theawards. The reduction will be calculated based on a current market price of our common stock. Based on current tax law, we anticipate that the shares issued when the awards are paid to the employees will be reduced by approximately 35% to satisfy the minimum withholding obligations, so that approximately 65% of the total restricted stock units that are distributable in any particular year will be converted into issued and outstanding shares.
Contractual Obligations
The following table sets forth our contractual obligations to make future payments as of December 31, 20122014 (in thousands):
| Total | 2013 | 2014 | 2015 | 2016 | 2017 | Thereafter | ||||||||||||||||||||||
Senior notes(1) (2) | $ | 325,000 | $ | — | $ | — | $ | — | $ | — | $ | — | $ | 325,000 | ||||||||||||||
Interest on senior notes | 197,878 | 19,788 | 19,788 | 19,788 | 19,788 | 19,788 | 98,938 | |||||||||||||||||||||
Non-recourse debt(3) | 58,992 | 11,430 | 16,414 | 24,383 | 6,765 | — | — | |||||||||||||||||||||
Interest on non-recourse debt(3) | 7,943 | 3,618 | 2,687 | 1,502 | 136 | — | — | |||||||||||||||||||||
Debenture to Stifel Financial Capital Trust II(4) | 35,000 | $ | — | $ | — | $ | — | $ | — | $ | — | $ | 35,000 | |||||||||||||||
Interest on debenture(4) | 15,062 | 662 | 662 | 662 | 662 | 662 | 11,752 | |||||||||||||||||||||
Debenture to Stifel Financial Capital Trust III(5) | 35,000 | — | — | — | — | — | 35,000 | |||||||||||||||||||||
Interest on debenture(5) | 17,511 | 715 | 715 | 715 | 715 | 715 | 13,936 | |||||||||||||||||||||
Debenture to Stifel Financial Capital Trust IV(6) | 12,500 | — | — | — | — | — | 12,500 | |||||||||||||||||||||
Interest on debenture(6) | 6,253 | 255 | 255 | 255 | 255 | 255 | 4,978 | |||||||||||||||||||||
Operating leases | 238,691 | 53,830 | 47,927 | 41,043 | 32,814 | 23,696 | 39,381 | |||||||||||||||||||||
Commitments to extend credit – Stifel Bank(7) | 473,302 | 304,642 | 18,991 | 11,683 | 78,249 | 51,336 | 8,401 | |||||||||||||||||||||
ARS repurchase(8) | 18,400 | — | — | 18,400 | — | — | — | |||||||||||||||||||||
Earn-out to Stone & Youngberg LLC(9) | 42,000 | 12,882 | 20,118 | 9,000 | — | — | — | |||||||||||||||||||||
Commitments to fund partnership interests | 2,990 | 2,990 | — | — | — | — | — | |||||||||||||||||||||
Certificates of deposit | 630 | 427 | 203 | — | — | — | — | |||||||||||||||||||||
|
|
|
|
|
|
|
|
|
|
|
|
|
| |||||||||||||||
| $ | 1,487,152 | $ | 411,239 | $ | 127,760 | $ | 127,431 | $ | 139,384 | $ | 96,452 | $ | 584,886 | |||||||||||||||
|
|
|
|
|
|
|
|
|
|
|
|
|
| |||||||||||||||
| Total | 2015 | �� | 2016 | 2017 | 2018 | 2019 | Thereafter | |||||||||||||||||||||
Senior notes 1, 2, 3 | $ | 625,000 | $ | 175,000 | $ | — | $ | — | $ | — | $ | — | $ | 450,000 | ||||||||||||||
Interest on senior notes | 221,300 | 24,475 | 24,475 | 24,475 | 24,475 | 24,475 | 98,925 | |||||||||||||||||||||
Debenture to Stifel Financial Capital Trust II 4 | 35,000 | — | — | — | — | — | 35,000 | |||||||||||||||||||||
Interest on debenture 4 | 13,737 | 662 | 662 | 662 | 662 | 662 | 10,427 | |||||||||||||||||||||
Debenture to Stifel Financial Capital Trust III 5 | 35,000 | — | — | — | — | — | 35,000 | |||||||||||||||||||||
Interest on debenture 5 | 16,082 | 715 | 715 | 715 | 715 | 715 | 12,507 | |||||||||||||||||||||
Debenture to Stifel Financial Capital Trust IV 6 | 12,500 | — | — | — | — | — | 12,500 | |||||||||||||||||||||
Interest on debenture 5 | 5,743 | 255 | 255 | 255 | 255 | 255 | 4,468 | |||||||||||||||||||||
Operating leases | 479,758 | 78,683 | 72,041 | 62,201 | 53,670 | 48,172 | 164,991 | |||||||||||||||||||||
Commitments to extend credit – Stifel Bank 7 | 491,313 | 152,688 | 21,911 | 56,820 | 120,306 | 139,351 | 227 | |||||||||||||||||||||
ARS repurchase 8 | 15,175 | 15,175 | — | — | — | — | — | |||||||||||||||||||||
Installment and earn-out payments to Stone & Youngberg LLC 9 | 24,815 | 12,419 | 12,396 | — | — | — | — | |||||||||||||||||||||
Commitments to fund partnership interests | 11,515 | 11,515 | — | — | — | — | — | |||||||||||||||||||||
Commitments to fund BDCs | 20,632 | 20,632 | — | — | — | — | — | |||||||||||||||||||||
Certificates of deposit | 77,197 | 60,553 | 10,760 | 3,634 | 1,776 | 474 | — | |||||||||||||||||||||
|
|
|
|
|
|
|
|
|
|
|
|
|
| |||||||||||||||
| $ | 2,084,767 | $ | 552,772 | $ | 143,215 | $ | 148,762 | $ | 201,869 | $ | 214,104 | $ | 824,045 | |||||||||||||||
|
|
|
|
|
|
|
|
|
|
|
|
|
| |||||||||||||||
In January 2012, we sold in a registered underwritten public offering, $175.0 million in aggregate principal amount of 6.70% senior notes due January 2022. Interest on these senior notes is payable quarterly in arrears. On or after January 15, 2015, we may redeem some or all of the senior notes at any time at a redemption price equal to 100% of the principal amount of the notes being redeemed plus accrued interest thereon to the redemption date. On December 15, 2014, we announced our intention to redeem 100% of the outstanding senior notes on January 15, 2015. |
In December 2012, we sold in a registered underwritten public offering, $150.0 million in aggregate principal amount of 5.375% senior notes due December 2022. Interest on these senior notes is payable quarterly in arrears. On or after December 31, 2015, we may redeem some or all of the senior notes at any time at a redemption price equal to 100% of the principal amount of the notes being redeemed plus accrued interest thereon to the redemption date. |
|
Debenture to Stifel Financial Capital Trust II matures on September 30, 2035. The interest is payable at a floating interest rate equal to three-month London Interbank Offered Rate (“LIBOR”) plus 1.70% per annum. Thereafter, interest rate assumes no increase. |
Debenture to Stifel Financial Capital Trust III matures on June 6, 2037. The interest is payable at a floating interest rate equal to three-month LIBOR plus 1.85% per annum. Thereafter, interest rate assumes no increase. |
Debenture to Stifel Financial Capital Trust IV matures on September 6, 2037. The interest is payable at a floating interest rate equal to three-month LIBOR plus 1.85% per annum. Thereafter, interest rate assumes no increase. |
Commitments to extend credit include commitments to originate loans, outstanding standby letters of credit, and lines of credit which may expire without being funded and, as such, do not represent estimates of future cash flow. |
TWP has entered into settlement and release agreements with certain customers, whereby it will purchase auction rate securities, at par, no later than December 31, 2015. The amounts estimated for repurchase assume no issuer redemptions. Issuer redemptions have been at par, and we expect this to continue. |
Information concerning the Stone & Youngberg LLC transaction is included in Note 3 of the Notes to the Consolidated Financial Statements. Such information is hereby incorporated by reference. |
The amounts presented in the table above may not necessarily reflect our actual future cash funding requirements, because the actual timing of the future payments made may vary from the stated contractual obligation. In addition, due to the uncertainty with respect to the timing of future cash flows associated with our unrecognized tax benefits as of December 31, 2012,2014, we are unable to make reasonably reliable estimates of the period of cash settlement with the respective taxing authority. Therefore, $2.7$6.7 million of unrecognized tax benefits have been excluded from the contractual obligation table above. See Note 2324 to the consolidated financial statements for a discussion of income taxes.
ITEM 7A. QUANTITATIVE AND QUALITATIVE DISCLOSURES ABOUT MARKET RISK
Risk Management
Risks are an inherent part of our business and activities. Management of these risks is critical to our soundness and profitability. Risk management at our company is a multi-faceted process that requires communication, judgment, and knowledge of financial products and markets. Our senior management group takes an active role in the risk management process and requires specific administrative and business functions to assist in the identification, assessment, monitoring, and control of various risks. The principal risks involved in our business activities are: market (interest rates and equity prices), credit, operational, and regulatory and legal. We have adopted policies and procedures concerning risk management, and our Board of Directors, in exercising its oversight of management’s activities, conducts periodic reviews and discussions with management regarding the guidelines and policies governing the processes by which risk assessment and risk management are handled.
Market Risk
The potential for changes in the value of financial instruments owned by our company resulting from changes in interest rates and equity prices is referred to as “market risk.” Market risk is inherent to financial instruments, and accordingly, the scope of our market risk management procedures includes all market risk-sensitive financial instruments.
We trade tax-exempt and taxable debt obligations, including U.S. treasury bills, notes, and bonds; U.S. government agency and municipal notes and bonds; bank certificates of deposit; mortgage-backed securities; and corporate obligations. We are also an active market makermarket-maker in over-the-counter equity securities. In connection with these activities, we may maintain inventories in order to ensure availability and to facilitate customer transactions.
Changes in value of our financial instruments may result from fluctuations in interest rates, credit ratings, equity prices, and the correlation among these factors, along with the level of volatility.
We manage our trading businesses by product and have established trading departments that have responsibility for each product. The trading inventories are managed with a view toward facilitating client transactions, considering the risk and profitability of each inventory position. Position limits in trading inventory accounts are established and monitored on a daily basis. We monitor inventory levels and results of the trading departments, as well as inventory aging, pricing, concentration, and securities ratings.
We are also exposed to market risk based on our other investing activities. These investments consist of investments in private equity partnerships, start-up companies, venture capital investments, and zero coupon U.S. government securities and are included under the caption “Investments” on the consolidated statements of financial condition.
Interest Rate Risk
We are exposed to interest rate risk as a result of maintaining inventories of interest rate-sensitive financial instruments and from changes in the interest rates on our interest-earning assets (including client loans, stock borrow activities, investments, inventories, and resale agreements) and our funding sources (including client cash balances, stock lending activities, bank borrowings, and repurchase agreements), which finance these assets. The collateral underlying financial instruments at the broker-dealer is repriced daily, thus requiring collateral to be delivered as necessary. Interest rates on client balances and stock borrow and lending produce a positive spread to our company, with the rates generally fluctuating in parallel.
We manage our inventory exposure to interest rate risk by setting and monitoring limits and, where feasible, hedging with offsetting positions in securities with similar interest rate risk characteristics. While a significant portion of our securities inventories have contractual maturities in excess of five years, these inventories, on average, turn over several times per year.
Additionally, we monitor, on a daily basis, the Value-at-Risk (“VaR”) in our trading portfolios using a ten-day horizon and report VaR at a 99% confidence level. VaR is a statistical technique used to estimate the probability of portfolio losses based on the statistical analysis of historical price trends and volatility. This model assumes that historical changes in market conditions are representative of future changes, and trading losses on any given day could exceed the reported VaR by significant amounts in unusually volatile markets. Further, the model involves a number of assumptions and inputs. While we believe that the assumptions and inputs we use in our risk model are reasonable, different assumptions and inputs could produce materially different VaR estimates.
The following table sets forth the high, low, and daily average VaR for our trading portfolios during the year ended December 31, 2012,2014, and the daily VaR at December 31, 20122014 and 20112013(in (in thousands):
| Year Ended December 31, 2012 | VaR Calculation at December 31, | |||||||||||||||||||
| High | Low | Daily Average | 2012 | 2011 | ||||||||||||||||
Daily VaR | $ | 8,904 | $ | 1,172 | $ | 4,279 | $ | 4,653 | $ | 8,421 | ||||||||||
| Year Ended December 31, 2014 | VaR Calculation at December 31, | |||||||||||||||||||
| High | Low | Daily Average | 2014 | 2013 | ||||||||||||||||
Daily VaR | $ | 8,844 | $ | 2,072 | $ | 3,769 | $ | 3,340 | $ | 3,427 | ||||||||||
Stifel Bank’s interest rate risk is principally associated with changes in market interest rates related to residential, consumer, and commercial lending activities, as well as FDIC-insured deposit accounts to customers of our broker-dealer subsidiaries and to the general public.
Our primary emphasis in interest rate risk management for Stifel Bank is the matching of assets and liabilities of similar cash flow and repricing time frames. This matching of assets and liabilities reduces exposure to interest rate movements and aids in stabilizing positive interest spreads. Stifel Bank has established limits for acceptable interest rate risk and acceptable portfolio value risk. To ensure that Stifel Bank is within the limits established for net interest margin, an analysis of net interest margin based on various shifts in interest rates is prepared each quarter and presented to Stifel Bank’s Board of Directors. Stifel Bank utilizes a third-party model to analyze the available data.
The following table illustrates the estimated change in net interest margin at December 31, 2012,2014, based on shifts in interest rates of up to positive 200 basis points and negative 200 basis points:
Hypothetical change | Projected change in net interest margin | |||||
+200 | 31.1 | % | ||||
+100 | 14.0 | % | ||||
0 | 0.00 | % | ||||
-100 | n/a | |||||
-200 | n/a | |||||
|
| |||||
| Hypothetical Change in Interest Rates | Projected Change in Net Interest Margin | |||||
| +200 | 17.2 | % | ||||
| +100 | 8.3 | % | ||||
| 0 | 0.00 | % | ||||
| -100 | (3.3) | % | ||||
| -200 | (8.2) | % | ||||
The following GAP Analysis table indicates Stifel Bank’s interest rate sensitivity position at December 31, 20122014(in (in thousands):
| Repricing Opportunities | Repricing Opportunities | |||||||||||||||||||||||||||||||
| 0-6 Months | 7-12 Months | 1-5 Years | 5+ Years | 0-6 Months | 7-12 Months | 1-5 Years | 5+ Years | |||||||||||||||||||||||||
Interest-earning assets: | ||||||||||||||||||||||||||||||||
Loans | $ | 1,038,479 | $ | 15,531 | $ | 11,110 | $ | 5 | $ | 1,560,762 | $ | 522,296 | $ | 239,699 | $ | 24,168 | ||||||||||||||||
Securities | 1,110,215 | 212,602 | 867,688 | 118,125 | 1,341,032 | 150,927 | 740,427 | 480,696 | ||||||||||||||||||||||||
Interest-bearing cash | 219,878 | — | — | — | 119,362 | — | — | — | ||||||||||||||||||||||||
|
|
|
| |||||||||||||||||||||||||||||
|
|
|
| $ | 3,021,156 | $ | 673,223 | $ | 980,126 | $ | 504,864 | |||||||||||||||||||||
| $ | 2,368,572 | $ | 228,133 | $ | 878,798 | $ | 118,130 |
|
|
|
| |||||||||||||||||||||
|
|
|
| |||||||||||||||||||||||||||||
Interest-bearing liabilities: | ||||||||||||||||||||||||||||||||
Transaction accounts and savings | $ | 572,124 | $ | 543,056 | $ | 1,830,626 | $ | 406,973 | $ | 3,915,219 | $ | 158,818 | $ | 571,120 | $ | 65,357 | ||||||||||||||||
Certificates of deposit | 95 | 332 | 203 | — | 42,661 | 17,925 | 16,644 | — | ||||||||||||||||||||||||
Borrowings | — | — | — | 16,914 | — | — | — | 16,672 | ||||||||||||||||||||||||
|
|
|
|
|
|
|
| |||||||||||||||||||||||||
| $ | 572,219 | $ | 543,388 | $ | 1,830,829 | $ | 423,887 | $ | 3,957,880 | $ | 176,743 | $ | 587,764 | $ | 82,029 | |||||||||||||||||
|
|
|
|
|
|
|
| |||||||||||||||||||||||||
GAP | 1,796,353 | (315,255 | ) | (952,031 | ) | (305,757 | ) | (936,724 | ) | 496,480 | 392,362 | 422,835 | ||||||||||||||||||||
|
|
|
|
|
|
|
| |||||||||||||||||||||||||
Cumulative GAP | $ | 1,796,353 | $ | 1,481,098 | $ | 529,067 | $ | 223,310 | $ | (936,724 | ) | $ | (440,244 | ) | $ | (47,882 | ) | $ | 374,953 | |||||||||||||
|
|
|
|
|
|
|
| |||||||||||||||||||||||||
We maintain a risk management strategy that incorporates the use of derivative instruments to minimize significant unplanned fluctuations in earnings caused by interest rate volatility. Our goal is to manage sensitivity to changes in rates by hedging the maturity characteristics of Fed funds-based affiliated deposits, thereby limiting the impact on earnings. By using derivative instruments, we are exposed to credit and market risk on those derivative positions. We manage the market risk associated with interest rate contracts by establishing and monitoring limits as to the types and degree of risk that may be undertaken. Our interest rate hedging strategies may not work in all market environments and, as a result, may not be effective in mitigating interest rate risk.
Equity Price Risk
We are exposed to equity price risk as a consequence of making markets in equity securities. We attempt to reduce the risk of loss inherent in our inventory of equity securities by monitoring those security positions constantly throughout each day.
Our equity securities inventories are repriced on a regular basis, and there are no unrecorded gains or losses. Our activities as a dealer are client-driven, with the objective of meeting clients’ needs while earning a positive spread.
Credit Risk
We are engaged in various trading and brokerage activities, with the counterparties primarily being broker-dealers. In the event counterparties do not fulfill their obligations, we may be exposed to risk. The risk of default depends on the creditworthiness of the counterparty or issuer of the instrument. We manage this risk by imposing and monitoring position limits for each counterparty, monitoring trading counterparties, conducting regular credit reviews of financial counterparties, reviewing security concentrations, holding and marking to market collateral on certain transactions, and conducting business through clearing organizations, which guarantee performance.
Our client activities involve the execution, settlement, and financing of various transactions on behalf of our clients. Client activities are transacted on either a cash or margin basis. Credit exposure associated with our private client business consists primarily of customer margin accounts, which are monitored daily and are collateralized. We monitor exposure to industry sectors and individual securities and perform analyses on a regular basis in connection with our margin lending activities. We adjust our margin requirements if we believe our risk exposure is not appropriate based on market conditions.
We have accepted collateral in connection with resale agreements, securities borrowed transactions, and customer margin loans. Under many agreements, we are permitted to sell or repledge these securities held as collateral and use these securities to enter into securities lending arrangements or to deliver to counterparties to cover short positions. At December 31, 2012,2014, the fair value of securities accepted as collateral where we are permitted to sell or repledge the securities was $965.8 million,$1.2 billion and the fair value of the collateral that had been sold or repledged was $140.3$39.2 million.
By using derivative instruments, we are exposed to credit and market risk on those derivative positions. Credit risk is equal to the fair value gain in a derivative, if the counterparty fails to perform. When the fair value of a derivative contract is positive, this generally indicates that the counterparty owes our company and, therefore, creates a repayment risk for our company. When the fair value of a derivative contract is negative, we owe the counterparty and, therefore, have no repayment risk. We minimize the credit (or repayment) risk in derivative instruments by entering into transactions with high-quality counterparties that are reviewed periodically by senior management.
Stifel Bank extends credit to individual and commercial borrowers through a variety of loan products, including residential and commercial mortgage loans, home equity loans, construction loans, and non-real-estate commercial and consumer loans. Bank loans are generally collateralized by real estate, real property, or other assets of the borrower. Stifel Bank’s loan policy includes criteria to adequately underwrite, document, monitor, and manage credit risk. Underwriting requires reviewing and documenting the fundamental characteristics of credit, including character, capacity to service the debt, capital, conditions, and collateral. Benchmark capital and coverage ratios are utilized, which include liquidity, debt service coverage, credit, working capital, and capital to asset ratios. Lending limits are established to include individual, collective, committee, and board authority. Monitoring credit risk is accomplished through defined loan review procedures, including frequency and scope.
We are subject to concentration risk if we hold large positions, extend large loans to, or have large commitments with a single counterparty, borrower, or group of similar counterparties or borrowers (i.e., in the same industry). Securities purchased under agreements to resell consist of securities issued by the U.S. government or its agencies. Receivables from and payables to clients and stock borrow and lending activities, both with a large number of clients and counterparties, and any potential concentration isare carefully monitored. Stock borrow and lending activities are executed under master netting agreements, which gives our company right of offset in the event of counterparty default. Inventory and investment positions taken and commitments made, including underwritings, may involve exposure to individual issuers and businesses. We seek to limit this risk through careful review of counterparties and borrowers and the use of limits established by our senior management group, taking into consideration factors including the financial strength of the counterparty, the size of the position or commitment, the expected duration of the position or commitment, and other positions or commitments outstanding.
Operational Risk
Operational risk generally refers to the risk of loss resulting from our operations, including, but not limited to, improper or unauthorized execution and processing of transactions, deficiencies in our technology or financial operating systems, and inadequacies or breaches in our control processes. We operate different businesses in diverse markets and are reliant on the ability of our employees and systems to process a large number of transactions. These risks are less direct than credit and market risk, but managing them is critical, particularly in a rapidly changing environment with increasing transaction volumes. In the event of a breakdown or improper operation of systems or improper action by employees, we could suffer financial loss, regulatory sanctions, and damage to our reputation. In order to mitigate and control operational risk, we have developed and continue to enhance specific policies and procedures that are designed to identify and manage operational risk at appropriate levels throughout the organization and within such departments as Accounting, Operations, Information Technology, Legal, Compliance, and Internal Audit. These control mechanisms attempt to ensure that operational policies and procedures are being followed and that our various businesses are operating within established corporate policies and limits. Business continuity plans exist for critical systems, and redundancies are built into the systems as deemed appropriate.
Regulatory and Legal Risk
Legal risk includes the risk of large numbers of private client group customer claims for sales practice violations. While these claims may not be the result of any wrongdoing, we do, at a minimum, incur costs associated with investigating and defending against such claims. See further discussion on our legal reserves policy under “Critical Accounting Policies and Estimates” in Item 7, Part II and “Legal Proceedings” in Item 3, Part I of this report. In addition, we are subject to potentially sizable adverse legal judgments or arbitration awards, and fines, penalties, and other sanctions for non-compliance with applicable legal and regulatory requirements. We are generally subject to extensive regulation by the SEC, FINRA, and state securities regulators in the different jurisdictions in which we conduct business. As a bank holding company, we are subject to regulation by the Federal Reserve. Stifel Bank is subject to regulation by the FDIC. As a result, we are subject to a risk of loss resulting from failure to comply with banking laws. We have comprehensive
procedures addressing issues such as regulatory capital requirements, sales and trading practices, use of and safekeeping of
customer funds, the extension of credit, including margin loans, collection activities, money laundering, and record keeping. We act as an underwriter or selling group member in both equity and fixed income product offerings. Particularly whenWhen acting as lead or co-lead manager, we have potential legal exposure to claims relating to these securities offerings. To manage this exposure, a committee of senior executives review proposed underwriting commitments to assess the quality of the offering and the adequacy of due diligence investigation.
Effects of Inflation
Our assets are primarily monetary, consisting of cash, securities inventory, and receivables from customers and brokers and dealers. These monetary assets are generally liquid and turn over rapidly and, consequently, are not significantly affected by inflation. However, the rate of inflation affects various expenses of our company, such as employee compensation and benefits, communications and office supplies, and occupancy and equipment rental, which may not be readily recoverable in the price of services we offer to our clients. Further, to the extent inflation results in rising interest rates and has other adverse effects upon the securities markets, it may adversely affect our financial position and results of operations.
ITEM 8. FINANCIAL STATEMENTS AND SUPPLEMENTARY DATA
INDEX TO AUDITED CONSOLIDATED FINANCIAL STATEMENTS
Report of Independent Registered Public Accounting Firm
The Board of Directors and Shareholders of Stifel Financial Corp.
We have audited the accompanying consolidated statements of financial condition of Stifel Financial Corp. as of December 31, 20122014 and 2011,2013, and the related consolidated statements of operations and comprehensive income, changes in shareholders’ equity, and cash flows for each of the three years in the period ended December 31, 2012.2014. These financial statements are the responsibility of the Company’s management. Our responsibility is to express an opinion on these financial statements based on our audits.
We conducted our audits in accordance with the standards of the Public Company Accounting Oversight Board (United States). Those standards require that we plan and perform the audit to obtain reasonable assurance about whether the financial statements are free of material misstatement. An audit includes examining, on a test basis, evidence supporting the amounts and disclosures in the financial statements. An audit also includes assessing the accounting principles used and significant estimates made by management, as well as evaluating the overall financial statement presentation. We believe that our audits provide a reasonable basis for our opinion.
In our opinion, the financial statements referred to above present fairly, in all material respects, the consolidated financial position of Stifel Financial Corp. at December 31, 20122014 and 2011,2013, and the consolidated results of its operations and its cash flows for each of the three years in the period ended December 31, 2012,2014, in conformity with U.S. generally accepted accounting principles.
We also have audited, in accordance with the standards of the Public Company Accounting Oversight Board (United States), Stifel Financial Corp.’s internal control over financial reporting as of December 31, 2012,2014, based on criteria established in Internal Control-Integrated Framework issued by the Committee of Sponsoring Organizations of the Treadway Commission (2013 framework) and our report dated March 1, 2013,2, 2015, expressed an unqualified opinion thereon.
| /s/ Ernst & Young LLP |
Chicago, IllinoisNew York, New York
March 1, 20132, 2015
Consolidated Statements of Financial Condition
| December 31, | December 31, | |||||||||||||||
| (in thousands) | 2012 | 2011 | 2014 | 2013 | ||||||||||||
Assets | ||||||||||||||||
Cash and cash equivalents | $ | 403,941 | $ | 167,671 | $ | 689,782 | $ | 716,560 | ||||||||
Restricted cash | 4,414 | 6,883 | — | 4,268 | ||||||||||||
Cash segregated for regulatory purposes | 128,031 | 26 | 49,646 | 35 | ||||||||||||
Receivables: | ||||||||||||||||
Brokerage clients, net | 487,761 | 560,018 | 483,887 | 530,402 | ||||||||||||
Brokers, dealers, and clearing organizations | 276,224 | 252,636 | 651,074 | 381,122 | ||||||||||||
Securities purchased under agreements to resell | 158,695 | 75,455 | 55,078 | 225,075 | ||||||||||||
Trading securities owned, at fair value (includes securities pledged of $607,586 and $393,888, respectively) | 763,608 | 474,951 | ||||||||||||||
Financial instruments owned, at fair value (includes securities pledged of $425,108 and $686,997, respectively) | 786,855 | 801,494 | ||||||||||||||
Available-for-sale securities, at fair value | 1,625,168 | 1,214,141 | 1,513,478 | 1,756,253 | ||||||||||||
Held-to-maturity securities, at amortized cost | 708,008 | 190,484 | 1,177,565 | 1,312,115 | ||||||||||||
Loans held for sale | 214,531 | 131,754 | 121,939 | 109,110 | ||||||||||||
Bank loans, net of allowance | 815,937 | 632,140 | 2,065,420 | 1,404,353 | ||||||||||||
Other real estate owned | 373 | 708 | ||||||||||||||
Investments, at fair value | 236,434 | 239,208 | 210,255 | 217,228 | ||||||||||||
Fixed assets, net | 141,403 | 104,740 | 124,246 | 106,446 | ||||||||||||
Goodwill | 419,393 | 358,988 | 795,026 | 727,336 | ||||||||||||
Intangible assets, net | 28,967 | 33,863 | 54,563 | 49,889 | ||||||||||||
Loans and advances to financial advisors and other employees, net | 179,284 | 172,717 | 197,757 | 184,458 | ||||||||||||
Deferred tax assets, net | 124,576 | 177,803 | 258,142 | 243,554 | ||||||||||||
Other assets | 249,392 | 157,714 | 283,438 | 239,172 | ||||||||||||
|
|
|
| |||||||||||||
Total Assets | $ | 6,966,140 | $ | 4,951,900 | $ | 9,518,151 | $ | 9,008,870 | ||||||||
|
|
|
| |||||||||||||
See accompanying Notes to Consolidated Financial Statements.
STIFEL FINANCIAL CORP.
Consolidated Statements of Financial Condition (continued)
| December 31, | ||||||||
| (in thousands, except share and per share amounts) | 2014 | 2013 | ||||||
Liabilities and Shareholders’ Equity | ||||||||
Short-term borrowings from banks | $ | — | $ | 55,700 | ||||
Payables: | ||||||||
Brokerage clients | 321,496 | 318,942 | ||||||
Brokers, dealers, and clearing organizations | 14,023 | 58,135 | ||||||
Drafts | 75,198 | 74,710 | ||||||
Securities sold under agreements to repurchase | 39,180 | 263,809 | ||||||
Bank deposits | 4,790,081 | 4,663,323 | ||||||
Financial instruments sold, but not yet purchased, at fair value | 587,265 | 481,214 | ||||||
Accrued compensation | 359,050 | 337,589 | ||||||
Accounts payable and accrued expenses | 302,320 | 285,968 | ||||||
Senior notes | 625,000 | 325,000 | ||||||
Debentures to Stifel Financial Capital Trusts | 82,500 | 82,500 | ||||||
|
|
|
| |||||
| 7,196,113 | 6,946,890 | |||||||
Liabilities subordinated to claims of general creditors | — | 3,131 | ||||||
Shareholders’ Equity: | ||||||||
Preferred stock - $1 par value; authorized 3,000,000 shares; none issued | — | — | ||||||
Common stock - $0.15 par value; authorized 97,000,000 shares; issued 66,336,018 and 63,744,074 shares, respectively | 9,950 | 9,562 | ||||||
Additional paid-in-capital | 1,634,114 | 1,544,143 | ||||||
Retained earnings | 716,305 | 540,238 | ||||||
Accumulated other comprehensive income | (38,331 | ) | (35,030 | ) | ||||
|
|
|
| |||||
| 2,322,038 | 2,058,913 | |||||||
Treasury stock, at cost, 5 and 1,330 shares, respectively | — | (64 | ) | |||||
|
|
|
| |||||
| 2,322,038 | 2,058,849 | |||||||
|
|
|
| |||||
Total Liabilities and Shareholders’ Equity | $ | 9,518,151 | $ | 9,008,870 | ||||
|
|
|
| |||||
| December 31, | ||||||||
| (in thousands, except share and per share amounts) | 2012 | 2011 | ||||||
Liabilities and Shareholders’ Equity | ||||||||
Short-term borrowings from banks | $ | 304,700 | $ | 199,400 | ||||
Payables: | ||||||||
Brokerage clients | 295,509 | 245,886 | ||||||
Brokers, dealers, and clearing organizations | 33,211 | 139,911 | ||||||
Drafts | 90,433 | 75,901 | ||||||
Securities sold under agreements to repurchase | 140,346 | 80,176 | ||||||
Bank deposits | 3,346,133 | 2,071,738 | ||||||
Trading securities sold, but not yet purchased, at fair value | 319,742 | 266,833 | ||||||
Securities sold, but not yet purchased, at fair value | 22,966 | 19,223 | ||||||
Accrued compensation | 187,466 | 204,076 | ||||||
Accounts payable and accrued expenses | 259,163 | 257,194 | ||||||
Corporate debt | 383,992 | — | ||||||
Debentures to Stifel Financial Capital Trusts | 82,500 | 82,500 | ||||||
|
|
|
| |||||
| 5,466,161 | 3,642,838 | |||||||
Liabilities subordinated to claims of general creditors | 5,318 | 6,957 | ||||||
Shareholders’ Equity: | ||||||||
Preferred stock—$1 par value; authorized 3,000,000 shares; none issued | — | — | ||||||
Exchangeable common stock—$0.15 par value; issued 0 and 172,242 shares, respectively | — | 26 | ||||||
Common stock—$0.15 par value; authorized 97,000,000 shares; issued 54,967,858 and 53,547,774 shares, respectively | 8,245 | 8,032 | ||||||
Additional paid-in-capital | 1,100,137 | 1,078,743 | ||||||
Retained earnings | 383,970 | 277,195 | ||||||
Accumulated other comprehensive income/(loss) | 4,918 | (7,938 | ) | |||||
|
|
|
| |||||
| 1,497,270 | 1,356,058 | |||||||
Treasury stock, at cost, 77,577 and 1,769,096 shares, respectively | (2,505 | ) | (53,640 | ) | ||||
Unearned employee stock ownership plan shares, at cost, 24,405 and 73,215 shares, respectively | (104 | ) | (313 | ) | ||||
|
|
|
| |||||
| 1,494,661 | 1,302,105 | |||||||
|
|
|
| |||||
Total Liabilities and Shareholders’ Equity | $ | 6,966,140 | $ | 4,951,900 | ||||
|
|
|
| |||||
See accompanying Notes to Consolidated Financial Statements.
Consolidated Statements of Operations
| Year ended December 31, | Year Ended December 31, | |||||||||||||||||||||||
| (in thousands, except per share amounts) | 2012 | 2011 | 2010 | 2014 | 2013 | 2012 | ||||||||||||||||||
Revenues: | ||||||||||||||||||||||||
Commissions | $ | 512,976 | $ | 561,081 | $ | 445,260 | $ | 674,418 | $ | 640,287 | $ | 518,803 | ||||||||||||
Principal transactions | 408,484 | 343,213 | 453,533 | 409,823 | 408,954 | 380,160 | ||||||||||||||||||
Investment banking | 286,585 | 199,584 | 218,104 | 578,689 | 457,736 | 292,686 | ||||||||||||||||||
Asset management and service fees | 257,981 | 228,834 | 193,159 | 386,001 | 305,639 | 257,981 | ||||||||||||||||||
Interest | 109,776 | 89,466 | 65,326 | 185,969 | 142,539 | 108,705 | ||||||||||||||||||
Other income | 70,231 | 19,731 | 19,855 | 14,785 | 64,659 | 69,148 | ||||||||||||||||||
|
|
|
|
|
| |||||||||||||||||||
Total revenues | 1,646,033 | 1,441,909 | 1,395,237 | 2,249,685 | 2,019,814 | 1,627,483 | ||||||||||||||||||
Interest expense | 33,383 | 25,347 | 13,211 | 41,261 | 46,368 | 33,370 | ||||||||||||||||||
|
|
|
|
|
| |||||||||||||||||||
Net revenues | 1,612,650 | 1,416,562 | 1,382,026 | 2,208,424 | 1,973,446 | 1,594,113 | ||||||||||||||||||
|
|
|
|
|
| |||||||||||||||||||
Non-interest expenses: | ||||||||||||||||||||||||
Compensation and benefits | 1,023,943 | 900,421 | 1,056,202 | 1,403,932 | 1,311,386 | 1,010,140 | ||||||||||||||||||
Occupancy and equipment rental | 130,247 | 121,929 | 115,742 | 169,040 | 158,268 | 128,365 | ||||||||||||||||||
Communications and office supplies | 80,941 | 75,589 | 69,929 | 106,926 | 99,726 | 79,406 | ||||||||||||||||||
Commissions and floor brokerage | 30,870 | 27,040 | 26,301 | 36,555 | 37,225 | 29,610 | ||||||||||||||||||
Other operating expenses | 120,777 | 152,975 | 114,081 | 201,177 | 181,612 | 116,845 | ||||||||||||||||||
|
|
|
|
|
| |||||||||||||||||||
Total non-interest expenses | 1,386,778 | 1,277,954 | 1,382,255 | 1,917,630 | 1,788,217 | 1,364,366 | ||||||||||||||||||
Income/(loss) before income tax expense | 225,872 | 138,608 | (229 | ) | ||||||||||||||||||||
Provision for income taxes/(benefit) | 87,299 | 54,474 | (2,136 | ) | ||||||||||||||||||||
|
|
| ||||||||||||||||||||||
Income from continuing operations before income tax expense | 290,794 | 185,229 | 229,747 | |||||||||||||||||||||
Provision for income taxes | 111,664 | 12,322 | 84,451 | |||||||||||||||||||||
|
|
| ||||||||||||||||||||||
Income from continuing operations | $ | 179,130 | $ | 172,907 | $ | 145,296 | ||||||||||||||||||
Discontinued operations: | ||||||||||||||||||||||||
Loss from discontinued operations, net of tax | (3,063 | ) | (10,894 | ) | (6,723 | ) | ||||||||||||||||||
|
|
|
|
|
| |||||||||||||||||||
Net income | $ | 138,573 | $ | 84,134 | $ | 1,907 | $ | 176,067 | $ | 162,013 | $ | 138,573 | ||||||||||||
|
|
|
|
|
| |||||||||||||||||||
Earnings per common share: | ||||||||||||||||||||||||
Earnings per basic common share | ||||||||||||||||||||||||
Income from continuing operations | $ | 2.69 | $ | 2.72 | $ | 2.71 | ||||||||||||||||||
Loss from discontinued operations | (0.04 | ) | (0.17 | ) | (0.12 | ) | ||||||||||||||||||
|
|
| ||||||||||||||||||||||
Earnings per basic common share | $ | 2.65 | $ | 2.55 | $ | 2.59 | ||||||||||||||||||
Earnings per diluted common share | ||||||||||||||||||||||||
Income from continuing operations | $ | 2.35 | $ | 2.35 | $ | 2.31 | ||||||||||||||||||
Loss from discontinued operations | (0.04 | ) | (0.15 | ) | (0.11 | ) | ||||||||||||||||||
|
|
| ||||||||||||||||||||||
Earnings per diluted common share | $ | 2.31 | $ | 2.20 | $ | 2.20 | ||||||||||||||||||
Weighted-average number of common shares outstanding: | ||||||||||||||||||||||||
Basic | $ | 2.59 | $ | 1.61 | $ | 0.04 | 66,472 | 63,568 | 53,563 | |||||||||||||||
Diluted | $ | 2.20 | $ | 1.33 | $ | 0.03 | 76,376 | 73,504 | 62,937 | |||||||||||||||
Weighted average number of common shares outstanding: | ||||||||||||||||||||||||
Basic | 53,563 | 52,418 | 48,723 | |||||||||||||||||||||
Diluted | 62,937 | 63,058 | 57,672 | |||||||||||||||||||||
See accompanying Notes to Consolidated Financial Statements.
Consolidated Statements of Comprehensive Income
| Year ended December 31, | Year Ended December 31, | |||||||||||||||||||||||
| (in thousands) | 2012 | 2011 | 2010 | 2014 | 2013 | 2012 | ||||||||||||||||||
Net income | $ | 138,573 | $ | 84,134 | $ | 1,907 | $ | 176,067 | $ | 162,013 | $ | 138,573 | ||||||||||||
Other comprehensive income: | ||||||||||||||||||||||||
Unrealized gains on available-for-sale securities, net of tax | 8,684 | 2,103 | 3,132 | |||||||||||||||||||||
Unrealized gains/(losses) in cash flow hedging instruments, net of tax | 3,045 | (9,615 | ) | (5,793 | ) | |||||||||||||||||||
Changes in unrealized gains/(losses) on available-for-sale securities1, 2 | 1,838 | (48,528 | ) | 8,684 | ||||||||||||||||||||
Changes in unrealized gains on cash flow hedging instruments, net of tax3 | 2,141 | 6,917 | 3,045 | |||||||||||||||||||||
Foreign currency translation adjustment, net of tax | 1,127 | (807 | ) | 1,740 | (7,280 | ) | 1,663 | 1,127 | ||||||||||||||||
|
|
|
|
|
| |||||||||||||||||||
| 12,856 | (8,319 | ) | (921 | ) | (3,301 | ) | (39,948 | ) | 12,856 | |||||||||||||||
|
|
|
|
|
| |||||||||||||||||||
Comprehensive income | $ | 151,429 | $ | 75,815 | $ | 986 | $ | 172,766 | $ | 122,065 | $ | 151,429 | ||||||||||||
|
|
|
|
|
| |||||||||||||||||||
| 1 | Net of taxes of $1.1 million, $32.4 million, and $5.8 million for the years ended December 31, 2014, 2013, and 2012, respectively. |
| 2 | Amounts are net of reclassifications to earnings of realized gains of $2.3 million, $1.2 million, and $2.4 million for the years ended December 31, 2014, 2013, and 2012, respectively. |
| 3 | Amounts are net of reclassifications to earnings of losses of $6.1 million, $8.6 million, and $11.4 million for the years ended December 31, 2014, 2013, and 2012, respectively. |
See accompanying Notes to Consolidated Financial Statements.
Consolidated Statements of Changes in Shareholders’ Equity
| Common Stock | Additional Paid-In | Retained | Accumulated Other Comprehensive | Treasury Stock, at | Unearned Employee Stock Ownership | Common Stock | Additional Paid-In | Retained | Accumulated Other Comprehensive | Treasury Stock, At | Unearned Employee Stock Ownership | |||||||||||||||||||||||||||||||||||||||||||||||||||||
| (in thousands) | Shares | Amount | Capital | Earnings | Income/(Loss) | cost | Plan | Total | Shares | Amount | Capital | Earnings | Income/(Loss) | Cost | Plan | Total | ||||||||||||||||||||||||||||||||||||||||||||||||
Balance at December 31, 2009 | 45,583 | $ | 6,837 | $ | 621,664 | $ | 244,615 | $ | 1,302 | $ | (242 | ) | $ | (730 | ) | $ | 873,446 | |||||||||||||||||||||||||||||||||||||||||||||||
|
|
|
|
|
|
|
| |||||||||||||||||||||||||||||||||||||||||||||||||||||||||
Net income | — | — | — | 1,907 | — | — | — | 1,907 | ||||||||||||||||||||||||||||||||||||||||||||||||||||||||
Unrealized gain on securities, net of tax | — | — | — | — | 3,132 | — | — | 3,132 | ||||||||||||||||||||||||||||||||||||||||||||||||||||||||
Unrealized loss on cash flow hedging activities, net of tax | — | — | — | — | (5,793 | ) | — | — | (5,793 | ) | ||||||||||||||||||||||||||||||||||||||||||||||||||||||
Foreign currency translation adjustment, net of tax | — | — | — | — | 1,740 | — | — | 1,740 | ||||||||||||||||||||||||||||||||||||||||||||||||||||||||
| ||||||||||||||||||||||||||||||||||||||||||||||||||||||||||||||||
Purchase of treasury stock | — | — | — | — | — | (91,769 | ) | — | (91,769 | ) | ||||||||||||||||||||||||||||||||||||||||||||||||||||||
Employee stock ownership plan purchases | — | — | 1,446 | — | — | — | 209 | 1,655 | ||||||||||||||||||||||||||||||||||||||||||||||||||||||||
Issuance of stock for employee benefit plans | 735 | 111 | (35,669 | ) | (4,738 | ) | — | 16,558 | — | (23,738 | ) | |||||||||||||||||||||||||||||||||||||||||||||||||||||
Stock option exercises | 246 | 37 | 1,118 | (5,647 | ) | — | 4,916 | — | 424 | |||||||||||||||||||||||||||||||||||||||||||||||||||||||
Unit amortization | — | — | 204,096 | — | — | — | — | 204,096 | ||||||||||||||||||||||||||||||||||||||||||||||||||||||||
Excess tax benefit from stock-based compensation | — | — | 17,487 | — | — | — | — | 17,487 | ||||||||||||||||||||||||||||||||||||||||||||||||||||||||
Issuance of common stock for acquisitions | 6,655 | 998 | 272,528 | 33 | — | (2,274 | ) | — | 271,285 | |||||||||||||||||||||||||||||||||||||||||||||||||||||||
Warrant exercises | 501 | 75 | 118 | (3,755 | ) | — | 3,573 | — | 11 | |||||||||||||||||||||||||||||||||||||||||||||||||||||||
|
|
|
|
|
|
|
| |||||||||||||||||||||||||||||||||||||||||||||||||||||||||
Balance at December 31, 2010 | 53,720 | $ | 8,058 | $ | 1,082,788 | $ | 232,415 | $ | 381 | $ | (69,238 | ) | $ | (521 | ) | $ | 1,253,883 | |||||||||||||||||||||||||||||||||||||||||||||||
Balance at December 31, 2011 | 53,720 | $ | 8,058 | $ | 1,078,743 | $ | 277,195 | $ | (7,938 | ) | $ | (53,640 | ) | $ | (313 | ) | $ | 1,302,105 | ||||||||||||||||||||||||||||||||||||||||||||||
|
|
|
|
|
|
|
|
|
|
|
|
|
|
|
| |||||||||||||||||||||||||||||||||||||||||||||||||
Net income | — | — | — | 84,134 | — | — | — | 84,134 | — | — | — | 138,573 | — | — | — | 138,573 | ||||||||||||||||||||||||||||||||||||||||||||||||
Unrealized gain on securities, net of tax | — | — | — | — | 2,103 | — | — | 2,103 | — | — | — | — | 8,684 | — | — | 8,684 | ||||||||||||||||||||||||||||||||||||||||||||||||
Unrealized loss on cash flow hedging activities, net of tax | — | — | — | — | (9,615 | ) | — | — | (9,615 | ) | — | — | — | — | 3,045 | — | — | 3,045 | ||||||||||||||||||||||||||||||||||||||||||||||
Foreign currency translation adjustment, net of tax | — | — | — | — | (807 | ) | — | — | (807 | ) | — | — | — | — | 1,127 | — | — | 1,127 | ||||||||||||||||||||||||||||||||||||||||||||||
Purchase of treasury stock | — | — | — | — | — | (48,505 | ) | — | (48,505 | ) | — | — | — | — | — | (11,380 | ) | — | (11,380 | ) | ||||||||||||||||||||||||||||||||||||||||||||
Employee stock ownership plan purchases | — | — | 1,624 | — | — | — | 208 | 1,832 | — | — | 1,473 | — | — | — | 209 | 1,682 | ||||||||||||||||||||||||||||||||||||||||||||||||
Issuance of stock for employee benefit plans | — | — | (54,267 | ) | (39,354 | ) | — | 53,298 | — | (40,323 | ) | 281 | 42 | (59,357 | ) | (31,798 | ) | — | 53,350 | — | (37,763 | ) | ||||||||||||||||||||||||||||||||||||||||||
Stock option exercises | (3,055 | ) | — | 3,957 | — | 902 | 276 | 41 | (9,718 | ) | — | 8,044 | — | (1,633 | ) | |||||||||||||||||||||||||||||||||||||||||||||||||
Unit amortization | — | — | 27,538 | — | — | — | — | 27,538 | — | — | 51,207 | — | — | — | — | 51,207 | ||||||||||||||||||||||||||||||||||||||||||||||||
Excess tax benefit from stock-based compensation | — | — | 24,863 | — | — | — | — | 24,863 | — | — | 16,722 | — | — | — | — | 16,722 | ||||||||||||||||||||||||||||||||||||||||||||||||
Issuance of common stock for acquisitions | — | — | (722 | ) | — | — | 6,822 | — | 6,100 | 691 | 104 | 21,646 | — | — | — | — | 21,750 | |||||||||||||||||||||||||||||||||||||||||||||||
Warrant exercises | — | — | (26 | ) | — | — | 26 | — | — | — | — | (579 | ) | — | — | 1,121 | — | 542 | ||||||||||||||||||||||||||||||||||||||||||||||
|
|
|
|
|
|
|
|
|
|
|
|
|
|
|
| |||||||||||||||||||||||||||||||||||||||||||||||||
Balance at December 31, 2011 | 53,720 | $ | 8,058 | $ | 1,078,743 | $ | 277,195 | $ | (7,938 | ) | $ | (53,640 | ) | $ | (313 | ) | $ | 1,302,105 | ||||||||||||||||||||||||||||||||||||||||||||||
Balance at December 31, 2012 | 54,968 | $ | 8,245 | $ | 1,100,137 | $ | 383,970 | $ | 4,918 | $ | (2,505 | ) | $ | (104 | ) | $ | 1,494,661 | |||||||||||||||||||||||||||||||||||||||||||||||
|
|
|
|
|
|
|
|
|
|
|
|
|
|
|
| |||||||||||||||||||||||||||||||||||||||||||||||||
Net income | — | — | — | 162,013 | — | — | — | 162,013 | ||||||||||||||||||||||||||||||||||||||||||||||||||||||||
Unrealized gain on securities, net of tax | — | — | — | — | (48,528 | ) | — | — | (48,528 | ) | ||||||||||||||||||||||||||||||||||||||||||||||||||||||
Unrealized gain on cash flow hedging activities, net of tax | — | — | — | — | 6,917 | — | — | 6,917 | ||||||||||||||||||||||||||||||||||||||||||||||||||||||||
Foreign currency translation adjustment, net of tax | — | — | — | — | 1,663 | — | — | 1,663 | ||||||||||||||||||||||||||||||||||||||||||||||||||||||||
Purchase of treasury stock | — | — | — | — | — | (13,670 | ) | — | (13,670 | ) | ||||||||||||||||||||||||||||||||||||||||||||||||||||||
Employee stock ownership plan purchases | — | — | 715 | — | — | — | 104 | 819 | ||||||||||||||||||||||||||||||||||||||||||||||||||||||||
Issuance of stock for employee benefit plans | 1,774 | 266 | (68,897 | ) | (5,074 | ) | — | 13,913 | — | (59,792 | ) | |||||||||||||||||||||||||||||||||||||||||||||||||||||
Stock option exercises | 28 | 5 | (1,552 | ) | — | — | 2,198 | — | 651 | |||||||||||||||||||||||||||||||||||||||||||||||||||||||
Unit amortization | — | — | 148,215 | — | — | — | — | 148,215 | ||||||||||||||||||||||||||||||||||||||||||||||||||||||||
Excess tax benefit from stock-based compensation | — | — | 12,018 | — | — | — | — | 12,018 | ||||||||||||||||||||||||||||||||||||||||||||||||||||||||
Issuance of common stock for acquisitions | 6,887 | 1,033 | 264,033 | — | — | — | — | 265,066 | ||||||||||||||||||||||||||||||||||||||||||||||||||||||||
Issuance of restricted stock awards for acquisitions | — | — | 86,221 | — | — | — | — | 86,221 | ||||||||||||||||||||||||||||||||||||||||||||||||||||||||
Stone & Youngberg contingent earn-out | 87 | 13 | 3,253 | — | — | — | — | 3,266 | ||||||||||||||||||||||||||||||||||||||||||||||||||||||||
Other | — | — | — | (671 | ) | — | — | — | (671 | ) | ||||||||||||||||||||||||||||||||||||||||||||||||||||||
|
|
|
|
|
|
|
| |||||||||||||||||||||||||||||||||||||||||||||||||||||||||
Balance at December 31, 2013 | 63,744 | $ | 9,562 | $ | 1,544,143 | $ | 540,238 | $ | (35,030 | ) | $ | (64 | ) | $ | — | $ | 2,058,849 | |||||||||||||||||||||||||||||||||||||||||||||||
|
|
|
|
|
|
|
| |||||||||||||||||||||||||||||||||||||||||||||||||||||||||
See accompanying Notes to Consolidated Financial Statements.
STIFEL FINANCIAL CORP.
Consolidated Statements of Changes in Shareholders’ Equity (continued)
| Common Stock | Additional Paid-In | Retained | Accumulated Other Comprehensive | Treasury Stock, At | Unearned Employee Stock Ownership | |||||||||||||||||||||||||||
| (in thousands) | Shares | Amount | Capital | Earnings | Income/(Loss) | Cost | Plan | Total | ||||||||||||||||||||||||
Balance at December 31, 2013 | 63,744 | $ | 9,562 | $ | 1,544,143 | $ | 540,238 | $ | (35,030 | ) | $ | (64 | ) | $ | — | $ | 2,058,849 | |||||||||||||||
|
|
|
|
|
|
|
|
|
|
|
|
|
|
|
| |||||||||||||||||
Net income | — | — | — | 176,067 | — | — | — | 176,067 | ||||||||||||||||||||||||
Unrealized gain on securities, net of tax | — | — | — | — | 1,838 | — | — | 1,838 | ||||||||||||||||||||||||
Unrealized gain on cash flow hedging activities, net of tax | — | — | — | — | 2,141 | — | — | 2,141 | ||||||||||||||||||||||||
Foreign currency translation adjustment, net of tax | — | — | — | — | (7,280 | ) | — | — | (7,280 | ) | ||||||||||||||||||||||
Issuance of stock for employee benefit plans | 2,158 | 324 | (67,653 | ) | — | — | 64 | — | (67,265 | ) | ||||||||||||||||||||||
Stock option exercises | 33 | 4 | 312 | — | — | — | — | 316 | ||||||||||||||||||||||||
Unit amortization | — | — | 118,271 | — | — | — | — | 118,271 | ||||||||||||||||||||||||
Excess tax benefit from stock-based compensation | — | — | 19,858 | — | — | — | — | 19,858 | ||||||||||||||||||||||||
Issuance of common stock for acquisitions | 401 | 60 | 19,183 | — | — | — | — | 19,243 | ||||||||||||||||||||||||
|
|
|
|
|
|
|
|
|
|
|
|
|
|
|
| |||||||||||||||||
Balance at December 31, 2014 | 66,336 | $ | 9,950 | $ | 1,634,114 | $ | 716,305 | $ | (38,331 | ) | $ | — | $ | — | $ | 2,322,038 | ||||||||||||||||
|
|
|
|
|
|
|
|
|
|
|
|
|
|
|
| |||||||||||||||||
| Common Stock | Additional Paid-In | Retained | Accumulated Other Comprehensive | Treasury Stock, at | Unearned Employee Stock Ownership | |||||||||||||||||||||||||||
| (in thousands) | Shares | Amount | Capital | Earnings | Income/(Loss) | cost | Plan | Total | ||||||||||||||||||||||||
Balance at December 31, 2011 | 53,720 | $ | 8,058 | $ | 1,078,743 | $ | 277,195 | $ | (7,938 | ) | $ | (53,640 | ) | $ | (313 | ) | $ | 1,302,105 | ||||||||||||||
Net income | — | — | — | 138,573 | — | — | — | 138,573 | ||||||||||||||||||||||||
Unrealized gain on securities, net of tax | — | — | — | — | 8,684 | — | — | 8,684 | ||||||||||||||||||||||||
Unrealized gain on cash flow hedging activities, net of tax | — | — | — | — | 3,045 | — | — | 3,045 | ||||||||||||||||||||||||
Foreign currency translation adjustment, net of tax | — | — | — | — | 1,127 | — | — | 1,127 | ||||||||||||||||||||||||
Purchase of treasury stock | — | — | — | — | — | (11,380 | ) | — | (11,380 | ) | ||||||||||||||||||||||
Employee stock ownership plan purchases | — | — | 1,473 | — | — | — | 209 | 1,682 | ||||||||||||||||||||||||
Issuance of stock for employee benefit plans | 281 | 42 | (59,357 | ) | (31,798 | ) | — | 53,350 | — | (37,763 | ) | |||||||||||||||||||||
Stock option exercises | 276 | 41 | (9,718 | ) | — | 8,044 | — | (1,633 | ) | |||||||||||||||||||||||
Unit amortization | — | — | 51,207 | — | — | — | — | 51,207 | ||||||||||||||||||||||||
Excess tax benefit from stock-based compensation | — | — | 16,722 | — | — | — | — | 16,722 | ||||||||||||||||||||||||
Issuance of common stock for acquisitions | 691 | 104 | 21,646 | — | — | — | — | 21,750 | ||||||||||||||||||||||||
Warrant exercises | — | — | (579 | ) | — | — | 1,121 | — | 542 | |||||||||||||||||||||||
|
|
|
|
|
|
|
|
|
|
|
|
|
|
|
| |||||||||||||||||
Balance at December 31, 2012 | 54,968 | $ | 8,245 | $ | 1,100,137 | $ | 383,970 | $ | 4,918 | $ | (2,505 | ) | $ | (104 | ) | $ | 1,494,661 | |||||||||||||||
|
|
|
|
|
|
|
|
|
|
|
|
|
|
|
| |||||||||||||||||
See accompanying Notes to Consolidated Financial Statements.
Consolidated Statements of Cash Flows
| Year Ended December 31, | Year Ended December 31, | |||||||||||||||||||||||
| (in thousands) | 2012 | 2011 | 2010 | 2014 | 2013 | 2012 | ||||||||||||||||||
Cash Flows from Operating Activities: | ||||||||||||||||||||||||
Cash Flows From Operating Activities: | ||||||||||||||||||||||||
Net income | $ | 138,573 | $ | 84,134 | $ | 1,907 | $ | 176,067 | $ | 162,013 | $ | 138,573 | ||||||||||||
Adjustments to reconcile net income to net cash provided by/(used in) operating activities: | ||||||||||||||||||||||||
Depreciation and amortization | 30,066 | 28,267 | 23,843 | 29,280 | 33,988 | 30,066 | ||||||||||||||||||
Amortization of premium on available-for-sale securities | 16,153 | 12,782 | 8,552 | |||||||||||||||||||||
Amortization of loans and advances to financial advisors and other employees | 57,147 | 55,923 | 50,162 | 64,735 | 64,930 | 57,147 | ||||||||||||||||||
Amortization of premium on investment portfolio | 5,847 | 8,321 | 16,153 | |||||||||||||||||||||
Provision for loan losses and allowance for loans and advances to financial advisors and other employees | 3,457 | 2,243 | 123 | 9,713 | 10,618 | 3,457 | ||||||||||||||||||
Amortization of intangible assets | 4,896 | 5,311 | 5,518 | 12,366 | 12,131 | 4,896 | ||||||||||||||||||
Deferred income taxes | 45,519 | 25,764 | (54,213 | ) | 5,256 | (26,389 | ) | 45,519 | ||||||||||||||||
Excess tax benefits from stock-based compensation | (16,722 | ) | (24,863 | ) | (17,487 | ) | (19,858 | ) | (12,018 | ) | (16,722 | ) | ||||||||||||
Stock-based compensation | 40,747 | 26,411 | 190,731 | 94,006 | 137,447 | 40,747 | ||||||||||||||||||
(Gains)/losses on sale of investments | (45,434 | ) | 1,877 | (5,431 | ) | 22 | 13,319 | (45,434 | ) | |||||||||||||||
Gain on acquisition | — | (7,566 | ) | — | ||||||||||||||||||||
Other, net | (181 | ) | 841 | 3,622 | (9,778 | ) | (3,640 | ) | (181 | ) | ||||||||||||||
Decrease/(increase) in operating assets, net of assets acquired: | ||||||||||||||||||||||||
Cash segregated for regulatory purposes and restricted cash | (125,536 | ) | 5,982 | (6,004 | ) | (45,343 | ) | 128,142 | (125,536 | ) | ||||||||||||||
Receivables: | ||||||||||||||||||||||||
Brokerage clients | 72,220 | (82,210 | ) | (93,765 | ) | 58,917 | (42,627 | ) | 72,220 | |||||||||||||||
Brokers, dealers, and clearing organizations | (23,588 | ) | 18,395 | 63,132 | (263,391 | ) | (30,634 | ) | (23,588 | ) | ||||||||||||||
Securities purchased under agreements to resell | (83,240 | ) | 48,162 | 1,237 | 169,997 | (66,380 | ) | (83,240 | ) | |||||||||||||||
Trading securities owned, including those pledged | (288,657 | ) | (43,467 | ) | 25,316 | |||||||||||||||||||
Financial instruments owned, including those pledged | 26,280 | 70,053 | (288,657 | ) | ||||||||||||||||||||
Loans originated as held for sale | (1,603,074 | ) | (1,060,457 | ) | (1,130,528 | ) | (1,132,671 | ) | (1,275,647 | ) | (1,603,074 | ) | ||||||||||||
Proceeds from mortgages held for sale | 1,517,458 | 1,013,515 | 1,104,317 | 1,112,318 | 1,372,552 | 1,517,458 | ||||||||||||||||||
Loans and advances to financial advisors and other employees | (63,948 | ) | (46,426 | ) | (46,376 | ) | (79,216 | ) | (71,857 | ) | (63,948 | ) | ||||||||||||
Other assets | 8,476 | 14,842 | 22,473 | (2,509 | ) | 79,662 | 8,476 | |||||||||||||||||
Increase/(decrease) in operating liabilities, net of liabilities assumed: | ||||||||||||||||||||||||
Payables: | ||||||||||||||||||||||||
Brokerage clients | 49,623 | 33,244 | (2,241 | ) | 2,554 | 23,433 | 49,623 | |||||||||||||||||
Brokers, dealers, and clearing organizations | (1,492 | ) | (72,495 | ) | 13,251 | (8,198 | ) | 3,976 | (1,492 | ) | ||||||||||||||
Drafts | 14,532 | 2,653 | 6,284 | 488 | (15,723 | ) | 14,532 | |||||||||||||||||
Trading securities sold, but not yet purchased | 56,652 | 65,296 | (77,230 | ) | ||||||||||||||||||||
Financial instruments sold, but not yet purchased | 106,051 | 85,127 | 56,652 | |||||||||||||||||||||
Other liabilities and accrued expenses | (67,914 | ) | (70,310 | ) | 54,295 | (62,664 | ) | 48,988 | (67,914 | ) | ||||||||||||||
|
|
|
|
|
| |||||||||||||||||||
Net cash provided by/(used in) operating activities | $ | (264,267 | ) | $ | 45,414 | $ | 141,488 | $ | 250,269 | $ | 702,219 | $ | (264,267 | ) | ||||||||||
|
|
|
|
|
| |||||||||||||||||||
See accompanying Notes to Consolidated Financial Statements.
STIFEL FINANCIAL CORP.
Consolidated Statements of Cash Flows (continued)
| Year Ended December 31, | Year Ended December 31, | |||||||||||||||||||||||
| (in thousands) | 2012 | 2011 | 2010 | 2014 | 2013 | 2012 | ||||||||||||||||||
Cash Flows from Investing Activities: | ||||||||||||||||||||||||
Cash Flows From Investing Activities: | ||||||||||||||||||||||||
Proceeds from: | ||||||||||||||||||||||||
Maturities, calls, sales, and principal paydowns on available-for-sale securities | $ | 530,120 | $ | 654,958 | $ | 309,646 | ||||||||||||||||||
Maturities, calls, and principal paydowns on held-to-maturity securities | 15,464 | 9,450 | — | |||||||||||||||||||||
Maturities, calls, sales, and principal paydowns of available-for-sale securities | $ | 698,895 | $ | 435,827 | $ | 530,120 | ||||||||||||||||||
Calls and principal paydowns of held-to-maturity securities | 96,618 | 93,703 | 15,464 | |||||||||||||||||||||
Sale or maturity of investments | 105,077 | 76,263 | 105,703 | 60,428 | 90,265 | 105,077 | ||||||||||||||||||
Sale of bank branch | — | — | 13,905 | |||||||||||||||||||||
Sale of aircraft | — | 45,951 | — | |||||||||||||||||||||
Sale of other real estate owned | 221 | 929 | 2,099 | 131 | 373 | 221 | ||||||||||||||||||
Increase in bank loans, net | (180,115 | ) | (243,592 | ) | (55,214 | ) | (668,354 | ) | (249,018 | ) | (180,115 | ) | ||||||||||||
Payments for: | ||||||||||||||||||||||||
Purchase of available-for-sale securities | (945,343 | ) | (895,391 | ) | (747,376 | ) | (416,851 | ) | (1,314,290 | ) | (945,343 | ) | ||||||||||||
Purchase of held-to-maturity securities | (531,379 | ) | (119,960 | ) | (45,963 | ) | (7,959 | ) | (16,438 | ) | (531,379 | ) | ||||||||||||
Purchase of investments | (80,887 | ) | (119,720 | ) | (121,885 | ) | (48,834 | ) | (71,777 | ) | (80,887 | ) | ||||||||||||
Purchase of fixed assets | (18,837 | ) | (59,730 | ) | (27,736 | ) | (26,632 | ) | (32,278 | ) | (18,837 | ) | ||||||||||||
Acquisitions, net | (120,180 | ) | (18,817 | ) | (483 | ) | ||||||||||||||||||
Acquisitions, net of cash acquired | (80,378 | ) | (88,592 | ) | (120,180 | ) | ||||||||||||||||||
|
|
|
|
|
| |||||||||||||||||||
Net cash used in investing activities | (1,225,859 | ) | (715,610 | ) | (567,304 | ) | (392,936 | ) | (1,106,274 | ) | (1,225,859 | ) | ||||||||||||
|
|
|
|
|
| |||||||||||||||||||
Cash Flows from Financing Activities: | ||||||||||||||||||||||||
Net proceeds from short-term borrowings from banks | 105,300 | 89,800 | 18,800 | |||||||||||||||||||||
(Repayments of)/proceeds from short-term borrowings from banks | (55,700 | ) | (249,000 | ) | 105,300 | |||||||||||||||||||
Proceeds from issuance of senior notes, net | 316,380 | 295,638 | — | 316,380 | ||||||||||||||||||||
Proceeds from issuance of non-recourse debt, net | 58,992 | — | — | 58,992 | ||||||||||||||||||||
Increase/(decrease) in securities sold under agreements to repurchase | 60,170 | (29,419 | ) | (12,938 | ) | (224,629 | ) | 123,463 | 60,170 | |||||||||||||||
Increase in bank deposits, net | 1,274,395 | 448,170 | 593,977 | 126,758 | 881,794 | 1,274,395 | ||||||||||||||||||
Increase/(decrease) in securities loaned | (105,208 | ) | 97,537 | 11,158 | (35,914 | ) | 20,948 | (105,208 | ) | |||||||||||||||
Excess tax benefits from stock-based compensation | 16,722 | 24,863 | 17,487 | 19,858 | 12,018 | 16,722 | ||||||||||||||||||
Issuance of common stock | 41 | — | 865 | |||||||||||||||||||||
Issuance of common stock for stock option exercises | 317 | 650 | 11,603 | |||||||||||||||||||||
Repurchase of common stock | (11,380 | ) | (48,505 | ) | (91,769 | ) | — | (13,670 | ) | (11,380 | ) | |||||||||||||
Reissuance of treasury stock | 11,562 | 3,983 | 5,045 | |||||||||||||||||||||
Extinguishment of senior notes | — | — | (23,000 | ) | ||||||||||||||||||||
Repayments of Federal Home Loan Bank advances | — | — | (2,000 | ) | ||||||||||||||||||||
Repayment of non-recourse debt | — | (58,992 | ) | — | ||||||||||||||||||||
Extinguishment of subordinated debt | (1,639 | ) | (1,284 | ) | (1,840 | ) | (3,131 | ) | (2,187 | ) | (1,639 | ) | ||||||||||||
|
|
|
|
|
| |||||||||||||||||||
Net cash provided by financing activities | 1,725,335 | 585,145 | 515,785 | 123,197 | 715,024 | 1,725,335 | ||||||||||||||||||
|
|
|
|
|
| |||||||||||||||||||
Effect of exchange rate changes on cash | 1,061 | (807 | ) | 1,740 | (7,308 | ) | 1,650 | 1,061 | ||||||||||||||||
(Decrease)/increase in cash and cash equivalents | 236,270 | (85,858 | ) | 91,709 | ||||||||||||||||||||
Increase/(decrease) in cash and cash equivalents | (26,778 | ) | 312,619 | 236,270 | ||||||||||||||||||||
Cash and cash equivalents at beginning of year | 167,671 | 253,529 | 161,820 | 716,560 | 403,941 | 167,671 | ||||||||||||||||||
|
|
|
|
|
| |||||||||||||||||||
Cash and cash equivalents at end of year | $ | 403,941 | $ | 167,671 | $ | 253,529 | $ | 689,782 | $ | 716,560 | $ | 403,941 | ||||||||||||
|
|
|
|
|
| |||||||||||||||||||
See accompanying Notes to Consolidated Financial Statements.
STIFEL FINANCIAL CORP.
Consolidated Statements of Cash Flows (continued)
| Year Ended December 31, | ||||||||||||
| (in thousands) | 2014 | 2013 | 2012 | |||||||||
Supplemental disclosure of cash flow information: | ||||||||||||
Cash paid for interest | $ | 40,471 | $ | 46,360 | $ | 29,064 | ||||||
Cash paid for income taxes, net of refunds | 107,009 | 5,803 | 4,630 | |||||||||
Noncash investing and financing activities: | ||||||||||||
Unit grants, net of forfeitures | $ | 190,003 | $ | 228,230 | $ | 145,563 | ||||||
Issuance of common stock for acquisitions | 19,183 | 265,066 | 21,750 | |||||||||
Stone & Youngberg contingent earn-out | — | 3,266 | — | |||||||||
| Year Ended December 31, | ||||||||||||
| (in thousands) | 2012 | 2011 | 2010 | |||||||||
Supplemental disclosure of cash flow information: | ||||||||||||
Cash paid for interest | $ | 29,064 | $ | 25,209 | $ | 13,104 | ||||||
Cash paid for income taxes, net of refunds | 4,630 | 5,547 | 54,984 | |||||||||
Noncash investing and financing activities: | ||||||||||||
Unit grants, net of forfeitures | $ | 145,563 | $ | 138,203 | $ | 157,546 | ||||||
Issuance of common stock for acquisitions | 21,750 | 6,100 | 271,285 | |||||||||
See accompanying Notes to Consolidated Financial Statements.
Notes to Consolidated Financial Statements
NOTE 1 – Nature of Operations and Basis of Presentation
Nature of Operations
Stifel Financial Corp. (the “Parent”), through its wholly owned subsidiaries, principally Stifel, Nicolaus & Company, Incorporated (“Stifel Nicolaus”Stifel”), Stifel Bank & Trust (“Stifel Bank”), Stifel Nicolaus Europe Limited (“SNEL”), Century Securities Associates, Inc. (“CSA”), Stifel Nicolaus Canada,Keefe, Bruyette & Woods, Inc. (“SN Canada”KBW”) and, Oriel Securities (“Oriel”), Miller Buckfire & Co. LLC (“Miller Buckfire”), De La Rosa & Co. (“De La Rosa”), 1919 Investment Counsel & Trust Co., National Association (“1919 Investment Counsel”), and Ziegler Capital Management, LLC (“ZCM”), is principally engaged in retail brokerage; securities trading; investment banking; investment advisory; retail, consumer, and commercial banking; and related financial services. We have offices throughout the United States two Canadian cities, and threeseveral European cities. Our major geographic area of concentration is throughout the Midwest and Mid-Atlantic regions,United States, with a growing presence in the Northeast, SoutheastUnited Kingdom and Western United States.Europe. Our company’s principal customers are individual investors, corporations, municipalities, and institutions.
Our Canadian subsidiary, Stifel Nicolaus Canada, Inc. (“SN Canada”) ceased business operations as of September 30, 2013. The results of SN Canada, previously reported in the Institutional Group segment, are classified as discontinued operations for all periods presented. See Note 4 to our consolidated financial statements for further discussion of our discontinued operations.
Basis of Presentation
The consolidated financial statements include Stifel Financial Corp. and its wholly owned subsidiaries, principally Stifel Nicolaus and Stifel Bank. All material intercompany balances and transactions have been eliminated. Unless otherwise indicated, the terms “we,” “us,” “our,” or “our company” in this report refer to Stifel Financial Corp. and its wholly owned subsidiaries.
The accompanying consolidated financial statements have been prepared in conformity with U.S. generally accepted accounting principles, which require management to make certain estimates and assumptions that affect the reported amounts. We consider significant estimates, which are most susceptible to change and impacted significantly by judgments, assumptions, and estimates, to be: valuation of financial instruments and investments in partnerships;partnerships, accrual for contingencies;contingencies, allowance for loan losses;losses, derivative instruments and hedging activities;activities, fair value of goodwill and intangible assets;assets, provision for income taxes and related tax reserves;reserves, and forfeitures associated with stock-based compensation. Actual results could differ from those estimates.
On March 7, 2011, our Board approved a 50% stock dividend, in the form of a three-for-two stock split, of our common stock payable on April 5, 2011 to shareholders of record as of March 22, 2011. All share and per share information has been retroactively adjusted to reflect the stock split.
Certain amounts from prior periods have been reclassified to conform to the current period’s presentation. The effect of these reclassifications on our company’s previously reported consolidated financial statements was not material.
Consolidation Policies
The consolidated financial statements include the accounts of Stifel Financial Corp. and its subsidiaries. We also have investments or interests in other entities for which we must evaluate whether to consolidate by determining whether we have a controlling financial interest or are considered to be the primary beneficiary. In determining whether to consolidate these entities, we evaluate whether the entity is a voting interest entity or a variable interest entity (“VIE”).
Voting Interest Entity. Voting interest entities are entities that have (i) total equity investment at risk sufficient to fund expected future operations independently, and (ii) equity holders who have the obligation to absorb losses or receive residual returns and the right to make decisions about the entity’s activities. We consolidate voting interest entities when we determine that there is a controlling financial interest, usually ownership of all, or a majority of, the voting interest.
Variable Interest Entity. VIEs are entities that lack one or more of the characteristics of a voting interest entity. We are required to consolidate certain VIEs in which we have the power to direct the activities of the entity and the obligation to absorb significant losses or receive significant benefits. In other cases, we
consolidate VIEs when we are deemed to be the primary beneficiary. The primary beneficiary is defined as the entity that has a variable interest, or a combination of variable interests, that maintains control and receives benefits or will absorb losses that are not pro rata with its ownership interests.
The determination as to whether an entity is a VIE is based on the structure and nature of the entity. We also consider other characteristics, such as the ability to influence the decision-making relative to the entity’s activities and how the entity is financed. With the exception of entities eligible for the deferral codified in Financial Accounting Standards Board (“FASB”) Accounting Standards Update (“ASU”) No. 2010-10, “Consolidation: Amendments for Certain Investment Funds” (“ASU 2010-10”) (generally asset managers and investment companies), ASC 810 states that a controlling financial interest in an entity is present when an enterprise has a variable interest, or combination of variable interests, that have both the power to direct the activities of the entity that most significantly impact the entity’s economic performance and the obligation to absorb losses of the entity or the rights to receive benefits from the entity that could potentially be significant to the entity.
Entities meeting the deferral provision defined by ASU 2010-10 are evaluated under the historical VIE guidance. Under the historical guidance, a controlling financial interest in an entity is present when an enterprise has a variable interest, or combination of variable interests, that will absorb a majority of the entity’s expected losses, receive a majority of the entity’s expected residual returns, or both. The enterprise with a controlling financial interest, known as the primary beneficiary, consolidates the VIE.
We determine whether we are the primary beneficiary of a VIE by first performing a qualitative analysis of the VIE’s control structure, expected benefits and losses, and expected residual returns. This analysis includes a review of, among other factors, the VIE’s capital structure, contractual terms, which interests create or absorb benefits or losses, variability, related party relationships, and the design of the VIE. Where a qualitative analysis is not conclusive, we perform a quantitative analysis. We reassess our initial evaluation of an entity as a VIE and our initial determination of whether we are the primary beneficiary of a VIE upon the occurrence of certain reconsideration events. See Note 2728 for additional information on VIEs.
NOTE 2 – Summary of Significant Accounting Policies
Cash and Cash Equivalents
We consider money market mutual funds and highly liquid investments with original maturities of three months or less that are not restricted or segregated to be cash equivalents. Cash and cash equivalents include money market mutual funds, deposits with banks, certificates of deposit, and federal funds sold. Cash and cash equivalents also include balances that Stifel Bank maintains at the Federal Reserve Bank.
Restricted Cash
Restricted cash consists of cash used as collateral for letters of credit related to certain lease commitments.
Cash Segregated for Regulatory Purposes
Our broker-dealer subsidiaries are subject to Rule 15c3-3 under the Securities Exchange Act of 1934, which requires our company to maintain cash or qualified securities in a segregated reserve accountaccounts for the exclusive benefit of its clients. In accordance with Rule 15c3-3, our company has portions of its cash segregated for the exclusive benefit of clients at December 31, 2012.2014.
Brokerage Client Receivables, netNet
Brokerage client receivables include receivables of our company’s broker-dealer subsidiaries, which represent amounts due on cash and margin transactions and are generally collateralized by securities owned by clients. Brokerage client receivables, primarily consisting of floating-rate loans collateralized by customer-owned securities, are charged interest at rates similar to other such loans made throughout the industry. The receivables are reported at their outstanding principal balance net of allowance for doubtful accounts. When a brokerage client receivable is considered to be impaired, the amount of the impairment is generally measured based on the fair value of the securities acting as collateral, which is measured based on current prices from independent sources, such as listed market prices or broker-dealer price quotations. Securities owned by customers, including those that collateralize margin or other similar transactions, are not reflected in the consolidated statements of financial condition.
Securities Borrowed and Securities Loaned
Securities borrowed require our company to deliver cash to the lender in exchange for securities and are included in receivables from brokers, dealers, and clearing organizations in the consolidated statements of financial condition. For securities loaned, we generally receive collateral in the form of cash in an amount equal toin excess of the market value of securities loaned. Securities loaned are included in payables to brokers, dealers, and clearing organizations in the consolidated statements of financial condition. We monitor the market value of securities borrowed and loaned on a daily basis, with additional collateral obtained or refunded as necessary. Fees received or paid are recorded in interest revenue or interest expense.
Substantially all of these transactions are executed under master netting agreements, which gives us right of offset in the event of counterparty default; however, such receivables and payables with the same counterparty are not set-off in the consolidated statements of financial condition.
Securities Purchased Under Agreements to Resell and Repurchase Agreements
Securities purchased under agreements to resell (“resale agreements”) are collateralized financing transactions that are recorded at their contractual amounts plus accrued interest. We obtain control of collateral with a market value equal to or in excess of the principal amount loaned and accrued interest under resale agreements. As of December 31, 2012, we have entered into these agreements with one major financial institution. These agreements are short-term in nature and are collateralized by U.S. government agency securities. We value collateral on a daily basis, with additional collateral obtained when necessary to minimize the risk associated with this activity.
Securities sold under agreements to repurchase (“repurchase agreements”) are collateralized financing transactions that are recorded at their contractual amounts plus accrued interest. We make delivery of securities sold under agreements to repurchase and monitor the value of collateral on a daily basis. When necessary, we will deliver additional collateral.
Financial Instruments
We measure certain financial assets and liabilities at fair value on a recurring basis, including cash equivalents, trading securitiesfinancial instruments owned, available-for-sale securities, investments, trading securitiesfinancial instruments sold, but not yet purchased, and derivatives. Other than those separately discussed in the notes to the consolidated financial statements, the remaining financial instruments are generally short-term in nature, and their carrying values approximate fair value.
The fair value of a financial instrument is defined as the price that would be received to sell an asset or paid to transfer a liability (i.e., “the exit price”) in an orderly transaction between market participants at the measurement date. We have categorized our financial instruments measured at fair value into a three-level classification in accordance with Topic 820, “Fair Value Measurement and Disclosures,” which established a hierarchy for inputs used in measuring fair value that maximizes the use of observable inputs and minimizes the use of unobservable inputs by requiring that the most observable inputs be used when available. Observable inputs are inputs that market participants would use in pricing the asset or liability developed based on market data obtained from independent sources. Unobservable inputs reflect our assumptions that market participants would use in pricing the asset or liability developed based on the best information available in the circumstances. The hierarchy is broken down into three levels based on the transparency of inputs as follows:
Level 1 – Quoted prices (unadjusted) are available in active markets for identical assets or liabilities as of the measurement date. A quoted price for an identical asset or liability in an active market provides the most reliable fair value measurement, because it is directly observable to the market.
Level 2 – Pricing inputs are other than quoted prices in active markets, which are either directly or indirectly observable as of the measurement date. The nature of these financial instruments includeincludes instruments for which quoted prices are available but traded less frequently, derivative instruments whose fair value have been derived using a model where inputs to the model are directly observable in the market, or can be derived principally from or corroborated by observable market data, and instruments that are fair valued using other financial instruments, the parameters of which can be directly observed.
Level 3 – Instruments that have little to no pricing observability as of the measurement date. These financial instruments do not have two-way markets and are measured using management’s best estimate of fair value, where the inputs into the determination of fair value require significant management judgment or estimation.
Valuation of Financial Instruments
When available, we use observable market prices, observable market parameters, or broker or dealer prices (bid and ask prices) to derive the fair value of financial instruments. In the case of financial instruments transacted on recognized exchanges, the observable market prices represent quotations for completed transactions from the exchange on which the financial instrument is principally traded.
A substantial percentage of the fair value of our trading securitiesfinancial instruments owned, available-for-sale securities, investments, and trading securitiesfinancial instruments sold, but not yet purchased, are based on observable market prices, observable market parameters, or derived from broker or dealer prices. The availability of observable market prices and pricing parameters can vary from product to product. Where available, observable market prices and pricing or market parameters in a product may be used to derive a price without requiring significant judgment. In certain markets, observable market prices or market parameters are not available for all products, and fair value is determined using techniques appropriate for each particular product. These techniques involve some degree of judgment.
For investments in illiquid or privately held securities that do not have readily determinable fair values, the determination of fair value requires us to estimate the value of the securities using the best information available. Among the factors we consider in determining the fair value of investments are the cost of the investment, terms and liquidity, developments since the acquisition of the investment, the sales price of recently issued securities, the financial condition and operating results of the issuer, earnings trends and consistency of operating cash flows, the long-term business potential of the issuer, the quoted market price of securities with similar quality and yield that are publicly traded, and other factors generally pertinent to the valuation of investments. In instances where a security is subject to transfer restrictions, the value of the security is based primarily on the quoted price of a similar security without restriction but may be reduced by an amount estimated to reflect such restrictions. The fair value of these investments is subject to a high degree of volatility and may be susceptible to significant fluctuation in the near term, and the differences could be material.
The degree of judgment used in measuring the fair value of financial instruments generally correlates to the level of pricing observability. Pricing observability is impacted by a number of factors, including the type of financial instrument, whether the financial instrument is new to the market and not yet established, and the
characteristics specific to the transaction. Financial instruments with readily available active quoted prices for which fair value can be measured from actively quoted prices generally will have a higher degree of pricing observability and a lesser degree of judgment used in measuring fair value. Conversely, financial instruments rarely traded or not quoted will generally have less, or no, pricing observability and a higher degree of judgment used in measuring fair value. See Note 6 for additional information on how we value our financial instruments.
Available-for-Sale and Held-to-Maturity Securities
Securities available for sale include U.S. government agency securities; state and municipal securities; agency, non-agency, and commercial mortgage-backed securities; corporate fixed income securities; and asset-backed securities.
Securities held to maturity are recorded at amortized cost based on our company’s positive intent and ability to hold these securities to maturity. Securities held to maturity include agency and commercial mortgage-backed securities, asset-backed securities, consisting of collateralized loan obligation securities and ARS, and corporate fixed income securities.
We evaluate all securities in an unrealized loss position quarterly to assess whether the impairment is other-than-temporary on a quarterly basis. Our other-than-temporary impairment (“OTTI”) assessment is a subjective process requiring the use of judgments and assumptions. Accordingly, we consider a number of qualitative and quantitative criteria in our assessment, including the extent and duration of the impairment, recent events specific to the issuer and/or industry to which the issuer belongs, the payment structure of the security, external credit ratings and the failure of the issuer to make scheduled interest or principal payments, the value of underlying collateral, current market conditions, and our company’s ability and intent to hold the investment until its value recovers or the securities mature. We may determine that the decline in fair value of an investment is other-than-temporary if our analysis of these factors indicates that we will not recover our investment in the securities.
If we determine that impairment on our debt securities is other-than-temporary and we have made the decision to sell the security or it is more likely than not that we will be required to sell the security prior to recovery of
its amortized cost basis, we recognize the entire portion of the impairment in earnings. If we have not made a decision to sell the security and we do not expect that we will be required to sell the security prior to recovery of the amortized cost basis, we recognize only the credit component of OTTI in other income in the consolidated statements of operations. The remaining unrealized loss due to factors other than credit, or the non-credit component, is recorded in accumulated other comprehensive loss. We determine the credit component based on the difference between the security’s amortized cost basis and the present value of its expected future cash flows, discounted based on the purchase yield. The non-credit component represents the difference between the security’s fair value and the present value of expected future cash flows.
We estimate the portion of loss attributable to credit using a discounted cash flow model. Key assumptions used in estimating the expected cash flows include default rates, loss severity, and prepayment rates. Assumptions used can vary widely based on the collateral underlying the securities and are influenced by factors such as collateral type, loan interest rate, geographical location of the borrower, and borrower characteristics.
Unrealized gains and losses on our available-for-sale securities are reported, net of taxes, in accumulated other comprehensive income included in shareholders’ equity. Amortization of premiums and accretion of discounts are recorded as interest income using the interest method. Realized gains and losses from sales of securities available for sale are determined on a specific identification basis and are included in other revenue in the consolidated statements of operations in the period they are sold.
Loan Classification
We classify loans based on our investment strategy and management’s assessment of our intent and ability to hold loans for the foreseeable future or until maturity. Management’s intent and ability with respect to certain loans may change from time to time depending on a number of factors, including economic, liquidity, and capital conditions. The accounting and measurement framework for loans differs depending on the loan classification. The classification criteria and accounting and measurement framework for bank loans and loans held for sale are described below.
Bank Loans and Allowance for Loan Losses
Bank loans consist of commercial and residential mortgage loans, home equity loans, stock-secured loans, construction loans, and commercial and industrial and consumer loans originated by Stifel Bank. Bank loans include those loans that management has the intent and ability to hold and are recorded at outstanding principal adjusted for any charge-offs, allowance for loan losses, deferred origination fees and costs, and purchased discounts. Loan origination costs, net of fees, are deferred and recognized over the contractual life of the loan as an adjustment of yield using the interest method. Bank loans are generally collateralized by real estate, real property, marketable securities, or other assets of the borrower. Interest income is recognized using the effective interest rate method, which is based upon the respective interest rates and the average daily asset balance. Discount accretion is recognized using the effective interest rate method, which is based upon the respective interest rate and expected lives of loans.
We regularly review the loan portfolio and have established an allowance for loan losses for inherent losses estimated to have occurred in the loan portfolio through a provision for loan losses charged to other operating expenses in the consolidated statements of operations. In providing for the allowance for loan losses, we consider historical loss experience, the nature and volume of the loan portfolio, adverse situations that may affect the borrower’s ability to repay, estimated value of any underlying collateral, and prevailing economic conditions. This evaluation is inherently subjective, as it requires estimates that are susceptible to significant revision as more information becomes available.
Loans Held for Sale
Loans that we intend to sell or for which we do not have the ability and intent to hold for the foreseeable future are classified as held for sale. Loans held for sale consist of fixed-rate and adjustable-rate residential real estate mortgage loans intended for sale. Loans held for sale are stated at lower of cost or market value. Declines in market value below cost and any gains or losses on the sale of these assets are recognized in other revenues in the consolidated statements of operations. Market value is determined based on prevailing market prices for loans with similar characteristics or on sale contract prices. Deferred fees and costs related to these loans are not amortized but are recognized as part of the cost basis of the loan at the time it is sold. Because loans held for sale are reported at lower of cost or market value, an allowance for loan losses is not established for loans held for sale.
Impaired Loans
A loan is considered impaired when, based on current information and events, it is probable that the scheduled payments of principal or interest when due according to the contractual terms of the loan agreement will not be collectible. Factors considered in determining impairment include payment status, collateral value, and the probability of collecting scheduled principal and interest payments when due. Loans that experience insignificant payment delays and payment shortfalls generally are not classified as impaired. We determine the significance of payment delays and payment shortfalls on a case-by-case basis, taking into consideration all of the circumstances surrounding the loan and the borrower, including the length of the delay, the reasons for the delay, the borrower’s prior payment record, and the amount of the shortfall in relation to the principal and interest owed.
Once a loan is determined to be impaired, when principal or interest becomes 90 days past due or when collection becomes uncertain, the accrual of interest and amortization of deferred loan origination fees is discontinued (“non-accrual status”) and any accrued and unpaid interest income is reversed. Loans placed on non-accrual status are returned to accrual status when all delinquent principal and interest payments are collected and the collectibility of future principal and interest payments is reasonably assured. Loan losses are charged against the allowance when we believe the uncollectibility of a loan balance is certain. Subsequent recoveries, if any, are credited to the allowance for loan losses.
Large groups of smaller balance homogenous loans are collectively evaluated for impairment. Accordingly, we do not separately identify individual consumer and residential loans for impairment measurements. Impairment is measured on a loan-by-loan basis for non-homogeneous loans, and a specific allowance is established for individual loans determined to be impaired. Impairment is measured by comparing the carrying value of the impaired loan to the present value of its expected cash flow discounted at the loan’s effective interest rate, the loan’s observable market price, or the fair value of the collateral if the loan is collateral dependent.
Investments
Our broker-dealer subsidiaries report changes in fair value of marketable and non-marketable securities in other income in the consolidated statements of operations. The fair value of marketable investments is generally based on either quoted market or dealer prices. The fair value of non-marketable securities is based on management’s estimate using the best information available, which generally consists of quoted market prices for similar securities and internally developed discounted cash flow models.
Investments in the consolidated statements of financial condition contain investments in securities that are marketable and securities that are not readily marketable. These investments are not included in our broker-dealer trading inventory or available-for-sale or held-to-maturity portfolios and represent the acquiring and disposing of debt or equity instruments for our benefit.
Fixed Assets
Office equipment is depreciated on an accelerated basis over the estimated useful life of the asset of two to seven years. Leasehold improvements are amortized on a straight-line basis over the lesser of the estimated useful life of the asset or the term of the lease. Buildings and building improvements are amortized on a straight-line basis over the estimated useful life of the asset of three to thirty-nine years. Depreciation expense is recorded in occupancy and equipment rental expense in the consolidated statements of operations. Office equipment, leasehold improvements, and property are stated at cost net of accumulated depreciation and amortization in the consolidated statements of financial condition. Office equipment is reviewed for impairment whenever events or changes in circumstances indicate that the carrying amount of such assets may not be recoverable.
Goodwill and Intangible Assets
Goodwill represents the cost of acquired businesses in excess of the fair value of the related net assets acquired. We test goodwill for impairment on an annual basis and on an interim basis when certain events or circumstances exist. We test for impairment at the reporting unit level, which is generally at the level of or one level below our company’s business segments. For both the annual and interim tests, we have the option to first assess qualitative factors to determine whether the existence of events or circumstances leads to a determination that it is more likely than not that the fair value of a reporting unit is less than its carrying amount. If, after assessing the totality of events or circumstances, we determine it is more likely than not that the fair value of a reporting unit is greater than its carrying amount, then performing the two-step impairment
test is not required. However, if we conclude otherwise, we are then required to perform the first step of the two-step impairment test. Goodwill impairment is determined by comparing the estimated fair value of a reporting unit with its respective carrying value. If the estimated fair value exceeds the carrying value, goodwill at the reporting unit level is not deemed to be impaired. If the estimated fair value is below carrying value, however, further analysis is required to determine the amount of the impairment. Additionally, if the carrying value of a reporting unit is zero or a negative value and it is determined that it is more likely than not the goodwill is impaired, further analysis is required. The estimated fair values of the reporting units are derived based on valuation techniques we believe market participants would use for each of the reporting units. We have elected July 31 as our annual impairment testing date.
Identifiable intangible assets, which are amortized over their estimated useful lives, are tested for potential impairment whenever events or changes in circumstances suggest that the carrying value of an asset or asset group may not be fully recoverable.
Loans and Advances
We offer transition pay, principally in the form of upfront loans, to financial advisors and certain key revenue producers as part of our company’s overall growth strategy. These loans are generally forgiven by a charge to compensation and benefits over a five- to ten-year period if the individual satisfies certain conditions, usually based on continued employment and certain performance standards. We monitor and compare individual financial advisor production to each loan issued to ensure future recoverability. If the individual leaves before the term of the loan expires or fails to meet certain performance standards, the individual is required to repay the balance. In determining the allowance for doubtful receivables from former employees, management considers the facts and circumstances surrounding each receivable, including the amount of the unforgiven balance, the reasons for the terminated employment relationship, and the former employees’ overall financial situation.
Derivative Instruments and Hedging Activities
We recognize all of our derivative instruments at fair value as either assets or liabilities in the consolidated statements of financial condition. These instruments are recorded in other assets or accounts payable and accrued expenses in the consolidated statements of financial condition and in the operating section of the consolidated statements of cash flows as increases or decreases of other assets and accounts payable and accrued expenses. Our company’s policy is not to offset fair value amounts recognized for derivative instruments and fair value amounts recognized for the right to reclaim cash collateral or the obligation to return cash collateral arising from derivative instruments recognized at fair value executed with the same counterparty under master netting arrangements. The accounting for changes in the fair value (i.e., gains and losses) of a derivative instrument depends on whether it has been designated and qualifies as part of a hedging relationship and, further, on the type of hedging relationship. For those derivative instruments that are designated and qualify as hedging instruments under Topic 815, “Derivatives and Hedging,” we must also designate the hedging instrument or transaction, based upon the exposure being hedged.
For derivative instruments that are designated and qualify as cash flow hedges (i.e., hedging the exposure to variability in expected future cash flows that is attributable to a particular risk), the effective portion of the gain or loss on the derivative instrument is reported as a component of accumulated other comprehensive income, net of tax, and reclassified into earnings in the same period or periods during which the hedged transaction affects earnings. The remaining gain or loss on the derivative instrument in excess of the cumulative change in the present value of future cash flows of the hedged item, if any, is recognized in current earnings during the period of change. We do not use derivatives for trading or speculative purposes and, at December 31, 2014, do not have any derivatives that are not designated in qualifying cash flow hedging relationships. See Note 15 for additional details.
Revenue Recognition
Customer securities transactions are recorded on a settlement date basis, with related commission revenues and expenses recorded on a trade date basis. Commission revenues are recorded as the amount charged to the customer, which, in certain cases, may include varying discounts. Principal securities transactions are recorded on a trade date basis. We typically distribute our proprietary equity research products to our client base of institutional investors at no charge. These proprietary equity research products are accounted for as a cost of doing business.
Investment banking revenues, which include underwriting fees, management fees, advisory fees, and sales credits earned in connection with the distribution of the underwritten securities, are recorded when services for
the transactions are completed under the terms of each engagement. Expenses associated with such transactions are deferred until the related revenue is recognized or the engagement is otherwise concluded. Investment banking revenues are presented net of related unreimbursed expenses. Expenses related to investment banking deals not completed are recognized as non-interest expenses in the consolidated statements of operations. For the periods presented, there were no significant expenses recognized for incomplete transactions. We have not recognized any incentive income that is subject to contingent repayments.
Asset management and service fees are recorded when earned, based on the period-end assets in the accounts, and consist of customer account service fees, per account fees (such as IRA fees), and wrap fees on managed accounts.
We earn fees from the investment partnerships that we manage or of which we are a general partner. Such management fees are generally based on the net assets or committed capital of the underlying partnerships. We have agreed, in certain cases, to waive management fees, in lieu of making a cash contribution, in satisfaction of our general partner investment commitments to the investment partnerships. In these cases, we generally recognize our management fee revenues at the time when we are allocated a special profit interest in realized gains from these partnerships.
Operating Leases
We lease office space and equipment under operating leases. We recognize rent expense related to these operating leases on a straight-line basis over the lease term. The lease term commences on the earlier of the date when we become legally obligated for the rent payments or the date on which we take possession of the property. For tenant improvement allowances and rent holidays, we record a deferred rent liability in accounts payable and accrued expenses in the consolidated statements of financial condition and amortize the deferred rent over the lease term as a reduction to occupancy and equipment rental expense in the consolidated statements of operations.
Income Taxes
We compute income taxes using the asset and liability method, under which deferred income taxes are provided for the temporary differences between the financial statement carrying amounts and the tax basis of our company’s assets and liabilities. We establish a valuation allowance for deferred tax assets if it is more likely than not that these items will either expire before we are able to realize their benefits, or that future deductibility is uncertain.
We recognize the tax benefit from an uncertain tax position only if it is more likely than not that the tax position will be sustained on examination by the taxing authorities, based on the technical merits of the position. The tax benefits recognized in the consolidated financial statements from such a position are measured based on the largest benefit that has a greater than 50% likelihood of being realized upon ultimate settlement. We recognize interest and penalties related to uncertain tax positions in provision for income taxes/(benefit) in the consolidated statements of operations. See Note 24 for further information regarding income taxes.
Foreign Currency Translation
We consolidate our foreign subsidiaries, which have designated their local currency as their functional currency. Assets and liabilities of these foreign subsidiaries are translated at year-end rates of exchange. Revenues and expenses are translated at an average rate for the period. In accordance with Financial Accounting Standards Board (“FASB”) Accounting Standards Codification Topic 830, “Foreign Currency Matters,” gains or losses resulting from translating foreign currency financial statements are reflected in accumulated other comprehensive income, a separate component of shareholders’ equity. Gains or losses resulting from foreign currency transactions are included in net income.
Recently Adopted Accounting Guidance
Discontinued Operations
In April 2014, the FASB issued ASU No. 2014-08, “Presentation of Financial Statements (Topic 205) and Property, Plant, and Equipment (Topic 360): Reporting Discontinued Operations and Disclosures of Disposals of Components of an Entity”(“ASU 2014-08”), amending FASB ASC Topic 205-20, “Discontinued Operations” (“ASC 205-20”). The amended guidance changes the criteria for reporting discontinued operations and requires new disclosures. ASU 2014-08 is effective for annual and interim periods beginning on or after December 15, 2014, and will be applied prospectively. We are currently evaluating the impact the new guidance will have on our consolidated financial statements.
Revenue Recognition
In May 2014, the FASB issued ASU No. 2014-09, “Revenue from Contracts with Customers (Topic 606)” (“ASU 2014-09”), which supersedes current revenue recognition guidance, including most industry-specific guidance. ASU 2014-09 requires a company to recognize revenue when it transfers promised goods or services to customers in an amount that reflects the consideration to which the company expects to be entitled in exchange for those goods and services. The guidance also requires additional disclosures regarding the nature, amount, timing and uncertainty of revenue that is recognized. The guidance allows for either retrospective application to all periods presented or a modified retrospective approach, where the guidance would only be applied to existing contracts in effect at the adoption date and new contracts going forward. ASU 2014-09 is effective for annual and interim periods beginning after December 15, 2016. Early adoption is not permitted. We are currently evaluating the impact the new guidance will have on our consolidated financial statements.
Repurchase Agreements
In June 2014, the FASB issued ASU No. 2014-11, “Transfers and Servicing (Topic 860): Repurchase-to-Maturity Transactions, Repurchase Financings, and Disclosures” (“ASU 2014-11”), amending FASB Accounting Standards Codification Topic 860, “Transfers and Servicing.” The amended guidance changes the accounting for repurchase-to-maturity transactions and repurchase financing arrangements. The guidance also requires new disclosures for certain transfers accounted for as sales and collateral supporting transactions that are accounted for as secured borrowings. ASU 2014-11 is effective for annual and interim periods beginning after December 15, 2014, except for the disclosures related to secured borrowings, which are effective for annual periods beginning after December 15, 2014, and for interim periods beginning after March 15, 2015. The adoption of ASU 2014-11 is not expected to have a material impact on the Company’s results of operations or financial position, but may impact the Company’s disclosures.
Pushdown Accounting
In November 2014, the FASB issued ASU 2014-17, “Business Combinations (Topic 805): Pushdown Accounting,” to provide companies with the option to apply pushdown accounting in their separate financial statements upon occurrence of an event in which an acquirer obtains control of the acquired entity. The election to apply pushdown accounting can be made either in the period in which the change of control occurred, or in a subsequent period. If the election is made in a subsequent period, the application of this guidance would be considered a change in accounting principle. The amendments in this ASU are effective as of November 18, 2014. The adoption will not have a significant impact on the Company’s consolidated financial statements.
Consolidation
In February 2015, the Financial Accounting Standards Board (“FASB”) issued Accounting Standards Update (“ASU”) No. 2015-02, “Consolidation (Topic 810): Amendments to the Consolidation Analysis” (“ASU 2015-02”). ASU 2015-02 amends ASC 810 through targeted changes to the consolidation guidance for legal entities such as limited partnerships, limited liability corporations, and securitization structures. It is effective for annual and interim periods beginning after December 15, 2015. Early adoption is permitted. We are currently evaluating the impact of the amended guidance on our consolidated financial statements.
Merchant Capital, LLC
On December 31, 2014, we acquired Merchant, a public finance investment banking firm headquartered in Montgomery, Alabama, which serves the Southeastern market. The strategic combination of our company and Merchant is expected to further strengthen our company’s position in several key underwriting markets in the Southeast.
The acquisition was accounted for under the acquisition method of accounting in accordance with ASC 805 (“Topic 805”), “Business Combinations.” Accordingly, goodwill was measured as the excess of the acquisition-date fair value of the consideration transferred over the amount of acquisition-date identifiable assets acquired net of assumed liabilities. We recorded $15.0 million of goodwill as an asset in the consolidated statement of financial condition, which has been allocated to our company’s Institutional Group segment. The allocation of the purchase price is preliminary and will be finalized upon completion of the analysis of the fair values of the net assets of Merchant on December 31, 2014, and the identified intangible assets. The final goodwill and intangible assets recorded on the consolidated statement of financial condition
may differ from that reflected herein as a result of future measurement period adjustments. In management’s opinion, the goodwill represents the value expected from the synergies created through the operational enhancement benefits that will result from the integration of Merchant’s business and the reputation and expertise of Merchant in the public finance space within the investment banking sector.
Pro forma information is not presented, because the acquisition is not considered to be material, as defined by the Securities and Exchange Commission (the “SEC”). The results of operations of Merchant have been included in our results prospectively from the date of acquisition.
1919 Investment Counsel & Trust Co., National Association
On November 7, 2014, we completed the acquisition of 1919 Investment Counsel, and 1919 an asset management firm and trust company that provides customized investment advisory and trust services, on a discretionary basis, to individuals, families, and institutions throughout the country.
The acquisition was accounted for under the acquisition method of accounting in accordance with ASC 805 (“Topic 805”), “Business Combinations.” Accordingly, goodwill was measured as the excess of the acquisition-date fair value of the consideration transferred over the amount of acquisition-date identifiable assets acquired net of assumed liabilities. We recorded $13.8 million of goodwill as an asset in the consolidated statement of financial condition, which has been allocated to our company’s Global Wealth Management segment. The allocation of the purchase price is preliminary and will be finalized upon completion of the analysis of the fair values of the net assets of 1919 Investment Counsel on November 7, 2014, and the identified intangible assets.
Identifiable intangible assets purchased by our company consisted of customer relationships with estimated acquisition-date fair value of $6.7 million.
The final goodwill and intangible assets recorded on the consolidated statement of financial condition may differ from that reflected herein as a result of future measurement period adjustments. In management’s opinion, the goodwill represents the value expected from the synergies created through the operational enhancement benefits that will result from the integration of 1919 Investment Counsel’s business and the reputation and expertise of 1919 Investment Counsel in the asset management sector and as a trust company.
On November 7, 2014, certain employees were granted restricted stock or restricted stock units of our company as retention. The fair value of the awards issued as retention was $11.2 million. There are no continuing service requirements associated with these restricted stock units, and accordingly, they were expensed at date of grant. This charge is included in compensation and benefits in the consolidated statement of operations for the year ended December 31, 2014. In addition, we have paid $10.8 million in the form of notes to associates for retention. These notes will be forgiven by a charge to compensation and benefits over a five- to ten-year period if the individual satisfies certain conditions, usually based on continued employment and certain performance standards.
Pro forma information is not presented, because the acquisition is not considered to be material, as defined by the SEC. The results of operations of 1919 Investment Counsel have been included in our results prospectively from the date of acquisition.
Oriel Securities
On July 31, 2014, we completed the acquisition of Oriel, a London-based stockbroking and investment banking firm. The combination of our company and Oriel has created a significant middle-market investment banking group in London, with broad research coverage across most sectors of the economy, equity and debt sales and trading, and investment banking services.
The acquisition was accounted for under the acquisition method of accounting in accordance with ASC 805 (“Topic 805”), “Business Combinations.” Accordingly, goodwill was measured as the excess of the acquisition-date fair value of the consideration transferred over the amount of acquisition-date identifiable assets acquired net of assumed liabilities. We recorded $18.7 million of goodwill as an asset in the consolidated statement of financial condition, which has been allocated to our company’s Institutional Group segment. The allocation of the purchase price is preliminary and will be finalized upon completion of the analysis of the fair values of the net assets of Oriel on July 31, 2014, and identifiable intangible assets. Identifiable intangible assets purchased by our company consisted of trade name and non-compete agreements with estimated acquisition-date fair values of $1.9 million and $1.4 million, respectively.
The final goodwill and intangible assets recorded on the consolidated statement of financial condition may differ from that reflected herein as a result of future measurement period adjustments. In management’s opinion, the goodwill represents the value expected from the synergies created through the operational enhancement benefits that will result from the integration of Oriel’s business and the reputation and expertise of Oriel in the investment banking sector in the United Kingdom.
On July 31, 2014, certain employees were granted restricted stock or restricted stock units of our company as retention. The fair value of the awards issued as retention was $6.8 million. There are no continuing service requirements associated with these restricted stock units, and accordingly, they were expensed at date of grant. This charge is included in compensation and benefits in the consolidated statement of operations for the year ended December 31, 2014.
Pro forma information is not presented, because the acquisition is not considered to be material, as defined by the SEC. The results of operations of Oriel have been included in our results prospectively from the date of acquisition.
De La Rosa & Co.
On April 3, 2014, we acquired De La Rosa, a California-based public finance investment banking boutique. The addition of the De La Rosa team is expected to further strengthen our company’s position in a number of key underwriting markets in California.
The acquisition was accounted for under the acquisition method of accounting in accordance with ASC 805 (“Topic 805”), “Business Combinations.” Accordingly, goodwill was measured as the excess of the acquisition-date fair value of the consideration transferred over the amount of acquisition-date identifiable assets acquired net of assumed liabilities. We recorded $17.4 million of goodwill as an asset in the consolidated statement of financial condition, which has been allocated to our company’s Institutional Group segment. The allocation of the purchase price is preliminary and will be finalized upon completion of the analysis of the fair values of the net assets of De La Rosa on April 3, 2014, and identifiable intangible assets. Identifiable intangible assets purchased by our company consisted of customer relationships and trade name with estimated acquisition-date fair values of $0.2 million and $1.8 million, respectively.
The final goodwill and intangible assets recorded on the consolidated statement of financial condition may differ from that reflected herein as a result of future measurement period adjustments. In management’s opinion, the goodwill represents the value expected from the synergies created through the operational enhancement benefits that will result from the integration of De La Rosa’s business and the reputation and expertise of De La Rosa in the investment banking sector.
Pro forma information is not presented, because the acquisition is not considered to be material, as defined by the SEC. The results of operations of De La Rosa have been included in our results prospectively from the date of acquisition.
Acacia Federal Savings Bank (“Acacia Federal”)
On October 31, 2013, Stifel Bank completed its acquisition of Acacia Federal Savings Bank, a federally chartered savings institution with one retail branch.
Under the agreement, we acquired approximately $337.1 million of loans and $180.4 million of other assets (primarily cash and due from banks and investment securities). In addition, we assumed approximately $435.4 million of deposits and $10.0 million of other liabilities. Assets acquired and liabilities assumed were recorded at fair value in accordance with ASC 805, “Business Combinations.” The fair values for loans were estimated using discounted cash flow analyses using interest rates currently being offered for loans with similar terms. This value was reduced by an estimate of probable losses and the credit risk associated with the loans. The fair values of deposits were estimated by discounting cash flows using interest rates currently being offered on deposits with similar maturities.
We recognized a $7.6 million bargain purchase gain during the year ended December 31, 2013, which is included in other income in the consolidated statements of operations.
Pro forma information is not presented, because the acquisition is not considered to be material, as defined by the SEC. The results of operations of Acacia Federal have been included in our results prospectively from the date of acquisition.
Ziegler Capital Management, LLC
On November 30, 2013, we acquired ZCM, an asset management firm that provides investment solutions for institutions, mutual fund sub-advisory clients, municipalities, pension plans, Taft-Hartley plans, and individual investors.
The acquisition was accounted for under the acquisition method of accounting in accordance with ASC 805 (“Topic 805”), “Business Combinations.” Accordingly, goodwill was measured as the excess of the acquisition-date fair value of the consideration transferred over the amount of acquisition-date identifiable assets acquired net of assumed liabilities. We recorded $6.8 million of goodwill as an asset in the consolidated statement of financial condition, which has been allocated to our company’s Global Wealth Management segment.
Identifiable intangible assets purchased by our company consisted of customer relationships and trade name with estimated acquisition-date fair values of $3.4 million and $0.1 million, respectively.
In management’s opinion, the goodwill represents the value expected from the synergies created through the operational enhancement benefits that will result from the integration of ZCM’s business and the reputation and expertise of ZCM in the asset management sector.
Pro forma information is not presented, because the acquisition is not considered to be material, as defined by the SEC. The results of operations of ZCM have been included in our results prospectively from the date of acquisition.
KBW, Inc.
On February 15, 2013, we completed the purchase of all of the outstanding shares of common stock of KBW, Inc. (“KBW, Inc.”), a full-service investment bank specializing in the financial services industry based in New York, New York. The purchase was completed pursuant to the merger agreement dated November 5, 2012. Under the terms of the merger agreement, each share of common stock, including certain restricted stock, of KBW, Inc. issued and outstanding immediately prior to the effective time of the merger was cancelled and converted into the right to receive a combination of (i) cash consideration of $8.00 ($10.00 less the extraordinary dividend amount of $2.00) and (ii) stock consideration of 0.2143 a share of our common stock.
In conjunction with the close of the merger, we issued 6.7 million shares of common stock to holders of KBW, Inc. common stock, issued 2.2 million restricted stock awards to KBW, Inc. employees, and paid $253.0 million in cash.
The acquisition was accounted for under the acquisition method of accounting in accordance with Topic 805, “Business Combinations.” Accordingly, goodwill was measured as the excess of the acquisition-date fair value of the consideration transferred over the amount of acquisition-date identifiable assets acquired net of assumed liabilities. We recorded $288.3 million of goodwill as an asset in the consolidated statement of financial condition, which has been allocated to our company’s Institutional Group segment. In management’s opinion, the goodwill represents the value expected from the synergies created through the operational enhancement benefits that will result from the integration of KBW, Inc.’s business and the reputation and expertise of KBW, Inc. in the financial services sector. Identifiable intangible assets purchased by our company consisted of customer relationships, trade name, and investment banking backlog with acquisition-date fair values of $11.0 million, $9.0 million, and $4.0 million, respectively.
Under Topic 805, merger-related transaction costs (such as advisory, legal, valuation, and other professional fees) are not included as components of consideration transferred but are accounted for as expenses in the periods in which the costs are incurred. Transaction costs of $9.8 million were incurred during the year ended December 31, 2013, and are included in other operating expenses in the consolidated statement of operations.
In addition, on February 15, 2013, certain employees were granted restricted stock or restricted stock units of our company as retention. The fair value of the awards issued as retention was $30.6 million. There are no continuing service requirements associated with these restricted stock units, and accordingly, they were expensed at date of grant. This charge is included in compensation and benefits in the consolidated statement of operations for the year ended December 31, 2013.
The following unaudited pro forma financial information presents the combined results of operations as if the merger had occurred on January 1, 2012. The pro forma financial information does not reflect the costs of any integration activities. The pro forma results include estimates and assumptions, which management believes are reasonable. The unaudited pro forma financial information below is a descriptionnot necessarily indicative of either future results of operations or results that might have been achieved had KBW, Inc. been combined with us as of the valuation techniques usedbeginning of 2012.
| (000s except per share amounts, unaudited) | 2012 | |||
Total net revenues | $ | 1,857,913 | ||
Net income | 112,531 | |||
Income per share: | ||||
Basic | $ | 1.86 | ||
Diluted | $ | 1.56 | ||
Stone & Youngberg LLC
On October 1, 2011, we acquired Stone & Youngberg, a leading financial services firm specializing in municipal finance and fixed income securities. The purchase consideration consisted of cash, a portion paid at closing and $24.0 million to be paid in installments over the next three years, and common stock. In addition, we may be required to pay a contingent earn-out over a five-year period after the closing, which is capped at $25.0 million, based upon revenue goals, as established in the purchase agreement.
We recognized a liability for estimated earn-out payments over the five-year period. Additionally, we recognized a liability for the installment payments to be made over the next year. The liability for the estimated installment payments and earn-out payments were $8.0 million and $16.8 million, respectively, at December 31, 2014. These liabilities are included in accounts payable and accrued expenses in the consolidated statements of financial condition.
NOTE 4 – Discontinued Operations
The components of discontinued operations are as follows(in thousands):
| Year Ended December 31, | ||||||||||||
| 2014 | 2013 | 2012 | ||||||||||
Net revenues | $ | (121 | ) | $ | 11,794 | $ | 18,537 | |||||
Restructuring expense | 217 | 6,881 | — | |||||||||
Operating expenses | 3,924 | 15,697 | 22,412 | |||||||||
|
|
|
|
|
| |||||||
Total non-interest expenses | 4,141 | 22,578 | 22,412 | |||||||||
Loss from discontinued operations before income taxes | (4,262 | ) | (10,784 | ) | (3,875 | ) | ||||||
Income tax expense/(benefit) | (1,199 | ) | 110 | 2,848 | ||||||||
|
|
|
|
|
| |||||||
Loss from discontinued operations, net of tax | $ | (3,063 | ) | $ | (10,894 | ) | $ | (6,723 | ) | |||
|
|
|
|
|
| |||||||
NOTE 5 – Receivables From and Payables to Brokers, Dealers, and Clearing Organizations
Amounts receivable from brokers, dealers, and clearing organizations at December 31, 2014 and 2013, included(in thousands):
| December 31, | ||||||||
| 2014 | 2013 | |||||||
Deposits paid for securities borrowed | $ | 445,542 | $ | 227,640 | ||||
Receivable from clearing organizations | 198,079 | 125,538 | ||||||
Securities failed to deliver | 7,453 | 27,944 | ||||||
|
|
|
| |||||
| $ | 651,074 | $ | 381,122 | |||||
|
|
|
| |||||
Amounts payable to brokers, dealers, and clearing organizations at December 31, 2014 and 2013, included(in thousands):
| December 31, | ||||||||
| 2014 | 2013 | |||||||
Securities failed to receive | $ | 7,365 | $ | 7,411 | ||||
Deposits received from securities loaned | 4,215 | 40,101 | ||||||
Payable to clearing organizations | 2,443 | 10,623 | ||||||
|
|
|
| |||||
| $ | 14,023 | $ | 58,135 | |||||
|
|
|
| |||||
Deposits paid for securities borrowed approximate the market value of the securities. Securities failed to deliver and receive represent the contract value of securities that have not been delivered or received on settlement date.
NOTE 6 – Fair Value Measurements
We measure certain financial assets and liabilities at fair value on a recurring basis:basis, including cash equivalents, financial instruments owned, available-for-sale securities, investments, financial instruments sold, but not yet purchased, and derivatives.
We generally utilize third-party pricing services to value Level 1 and Level 2 available-for-sale investment securities, as well as certain derivatives designated as cash flow hedges. We review the methodologies and assumptions used by the third-party pricing services and evaluate the values provided, principally by comparison with other available market quotes for similar instruments and/or analysis based on internal models using available third-party market data. We may occasionally adjust certain values provided by the third-party pricing service when we believe, as the result of our review, that the adjusted price most appropriately reflects the fair value of the particular security.
Following are descriptions of the valuation methodologies and key inputs used to measure financial assets and liabilities recorded at fair value. The descriptions include an indication of the level of the fair value hierarchy in which the assets or liabilities are classified.
Cash EquivalentsBank Loans and Allowance for Loan Losses
Cash equivalentsBank loans consist of commercial and residential mortgage loans, home equity loans, stock-secured loans, construction loans, and commercial and industrial and consumer loans originated by Stifel Bank. Bank loans include money market mutual fundsthose loans that management has the intent and highly liquid investments with original maturitiesability to hold and are recorded at outstanding principal adjusted for any charge-offs, allowance for loan losses, deferred origination fees and costs, and purchased discounts. Loan origination costs, net of three monthsfees, are deferred and recognized over the contractual life of the loan as an adjustment of yield using the interest method. Bank loans are generally collateralized by real estate, real property, marketable securities, or less. Actively traded money market funds are measured at their netother assets of the borrower. Interest income is recognized using the effective interest rate method, which is based upon the respective interest rates and the average daily asset value,balance. Discount accretion is recognized using the effective interest rate method, which approximates fair value,is based upon the respective interest rate and classified as Level 1.expected lives of loans.
Trading SecuritiesWe regularly review the loan portfolio and Available-for-Sale Securities
When available,have established an allowance for loan losses for inherent losses estimated to have occurred in the fairloan portfolio through a provision for loan losses charged to other operating expenses in the consolidated statements of operations. In providing for the allowance for loan losses, we consider historical loss experience, the nature and volume of the loan portfolio, adverse situations that may affect the borrower’s ability to repay, estimated value of financial instrumentsany underlying collateral, and prevailing economic conditions. This evaluation is inherently subjective, as it requires estimates that are based on quoted prices (unadjusted) in active markets and reported in Level 1. Level 1 financial instruments include highly liquid instruments with quoted prices (unadjusted), suchsusceptible to significant revision as equities listed in active markets, certain corporate obligations, and U.S. treasury securities.more information becomes available.
If quoted prices are not available, fair values are obtained from pricing services, broker quotes,Loans Held for Sale
Loans that we intend to sell or other model-based valuation techniques with observable inputs, such as the present value of estimated cash flows and reported as Level 2. The nature of these financial instruments include instruments for which quoted prices are available but traded less frequently, instruments whose fair value have been derived using a model where inputs to the model are directly observable in the market, or can be derived principally from or corroborated by observable market data, and instruments that are fair valued using other financial instruments, the parameters of which can be directly observed. Level 2 financial instruments generally include U.S. government securities, mortgage-backed securities, corporate obligations infrequently traded, certain government and municipal obligations, asset-backed securities, and certain equity securities not actively traded.
We have identified Level 3 financial instruments to include certain corporate obligations with unobservable pricing inputs, airplane trust certificates, and certain municipal obligations, which include auction rate securities (“ARS”). Level 3 financial instruments have little to no pricing observability as of the report date. These financial instrumentswe do not have active two-way marketsthe ability and are measured using management’s best estimate of fair value, whereintent to hold for the inputs into the determination of fair value require significant management judgment or estimation. ARS are valued based upon our expectations of issuer redemptions and using internal discounted cash flow models that utilize unobservable inputs.
Investments
Investments in certain public companies, mutual funds and U.S. treasury securities are valued based on quoted prices (unadjusted) in active markets and reported in Level 1. Investments in certain private equity securities and partnerships with unobservable inputs and ARS for which the market has been dislocated and largely ceased to function are reported as Level 3 assets. Investments in certain equity securities with unobservable inputs are valued using management’s best estimate of fair value, where the inputs require significant management judgment. ARS are valued based upon our expectations of issuer redemptions and are evaluated using internal models.
Investments in partnerships and other investments include our general and limited partnership interests in investment partnerships and direct investments in non-public companies. The net assets of investment partnerships consist primarily of investments in non-marketable securities. The underlying investments held by such partnerships and direct investments in non-public companies are valued based on the estimated fair value ultimately determined by us in our capacity as general partner or investor and, in the case of an investment in an unaffiliated investment partnership, are based on financial statements prepared by an unaffiliated general partner.
The valuation of these investments requires significant management judgment due to the absence of quoted market prices, inherent lack of liquidity, and long-term nature of these assets. As a result, these values cannot be determined with precision and the calculated fair value estimates may not be realizable in a current sale or immediate settlement of the instrument.
Trading Securities Sold, But Not Yet Purchased
Trading securities sold but not purchased are recorded at fair value based on quoted prices in active markets and other observable market data are reported as Level 1. Trading securities sold but not yet purchased include highly liquid instruments with quoted prices such as certain U.S. treasury securities, corporate bonds, and equities listed in active markets.
If quoted prices are not available, fair values are obtained from pricing services, broker quotes, or other model-based valuation techniques with observable inputs such as the present value of estimated cash flows and reported as Level 2. The nature of these financial instruments include instruments for which quoted prices are available but traded less frequently, instruments whose fair value have been derived using a model where inputs to the model are directly observable in the market, or can be derived principally from or corroborated by observable market data, and instruments that are fair valued using other financial instruments, the parameters of which can be directly observed. Level 2 financial instruments generally include certain U.S. government agency securities, certain equity securities not actively traded, certain corporate bonds, and certain municipal securities.
Derivatives
Derivatives are valued using quoted market prices when available or pricing models based on the net present value of estimatedforeseeable future cash flows. The valuation models used require market observable inputs, including contractual terms, market prices, yield curves, credit curves, and measures of volatility. The derivatives are classified as Level 2 and the measurements are used to value interest rate swaps.
Available-for-Sale Securities
Securities availableheld for sale. Loans held for sale include U.S. agency notes; stateconsist of fixed-rate and municipal securities; U.S. agency, non-agency,adjustable-rate residential real estate mortgage loans intended for sale. Loans held for sale are stated at lower of cost or market value. Declines in market value below cost and commercial mortgage-backed securities; corporate debt securities; auction-rate securities (“ARS”);any gains or losses on the sale of these assets are recognized in other revenues in the consolidated statements of operations. Market value is determined based on prevailing market prices for loans with similar characteristics or on sale contract prices. Deferred fees and asset-backed securities. We evaluatecosts related to these securities for other-than-temporary impairment (“OTTI”) on a quarterly basis. If we determine other-than-temporary impairment exists,loans are not amortized but are recognized as part of the cost basis of the securityloan at the time it is adjustedsold. Because loans held for sale are reported at lower of cost or market value, an allowance for loan losses is not established for loans held for sale.
Impaired Loans
A loan is considered impaired when, based on current information and events, it is probable that the scheduled payments of principal or interest when due according to the then-current fair value, with a corresponding loss recognized in current earnings.contractual terms of the loan agreement will not be collectible. Factors we considerconsidered in determining whether an impairment is other-than-temporaryinclude payment status, collateral value, and the probability of collecting scheduled principal and interest payments when due. Loans that experience insignificant payment delays and payment shortfalls generally are not classified as impaired. We determine the significance of payment delays and payment shortfalls on a case-by-case basis, taking into consideration all of the circumstances surrounding the loan and the borrower, including the length of timethe delay, the reasons for the delay, the borrower’s prior payment record, and extentthe amount of the impairment,shortfall in relation to the credit ratingprincipal and interest owed.
Once a loan is determined to be impaired, when principal or interest becomes 90 days past due or when collection becomes uncertain, the accrual of the securitiesinterest and amortization of deferred loan origination fees is discontinued (“non-accrual status”) and any accrued and unpaid interest income is reversed. Loans placed on non-accrual status are returned to accrual status when all delinquent principal and interest payments are collected and the issuer, whethercollectibility of future principal and interest payments is reasonably assured. Loan losses are charged against the issuer continues to make the contractual cash payments, whetherallowance when we believe the issuer willuncollectibility of a loan balance is certain. Subsequent recoveries, if any, are credited to the allowance for loan losses.
Large groups of smaller balance homogenous loans are collectively evaluated for impairment. Accordingly, we do not separately identify individual consumer and residential loans for impairment measurements. Impairment is measured on a loan-by-loan basis for non-homogeneous loans, and a specific allowance is established for individual loans determined to be ableimpaired. Impairment is measured by comparing the carrying value of the impaired loan to continue to make the contractual payments untilpresent value of its expected cash flow discounted at the value recoversloan’s effective interest rate, the loan’s observable market price, or the securities mature, and our company’s ability and intent to holdfair value of the investment until its value recovers orcollateral if the securities mature. We may determine that the declineloan is collateral dependent.
Investments
Our broker-dealer subsidiaries report changes in fair value of an investment is other-than-temporary if our analysis of these factors indicates that we will not recover our investment in the securities.
Unrealized gainsmarketable and losses are reported, net of taxes, in accumulated other comprehensive income included in shareholders’ equity. Amortization of premiums and accretion of discounts are recorded as interest income using the interest method. Realized gains and losses from sales ofnon-marketable securities available for sale are determined on a specific identification basis and are included in other revenueincome in the consolidated statements of operationsoperations. The fair value of marketable investments is generally based on either quoted market or dealer prices. The fair value of non-marketable securities is based on management’s estimate using the best information available, which generally consists of quoted market prices for similar securities and internally developed discounted cash flow models.
Investments in the period theyconsolidated statements of financial condition contain investments in securities that are sold.marketable and securities that are not readily marketable. These investments are not included in our broker-dealer trading inventory or available-for-sale or held-to-maturity portfolios and represent the acquiring and disposing of debt or equity instruments for our benefit.
Held-to-Maturity SecuritiesFixed Assets
Securities heldOffice equipment is depreciated on an accelerated basis over the estimated useful life of the asset of two to maturityseven years. Leasehold improvements are amortized on a straight-line basis over the lesser of the estimated useful life of the asset or the term of the lease. Buildings and building improvements are amortized on a straight-line basis over the estimated useful life of the asset of three to thirty-nine years. Depreciation expense is recorded in occupancy and equipment rental expense in the consolidated statements of operations. Office equipment, leasehold improvements, and property are stated at amortized cost basednet of accumulated depreciation and amortization in the consolidated statements of financial condition. Office equipment is reviewed for impairment whenever events or changes in circumstances indicate that the carrying amount of such assets may not be recoverable.
Goodwill and Intangible Assets
Goodwill represents the cost of acquired businesses in excess of the fair value of the related net assets acquired. We test goodwill for impairment on an annual basis and on an interim basis when certain events or circumstances exist. We test for impairment at the reporting unit level, which is generally at the level of or one level below our company’s positive intentbusiness segments. For both the annual and ability to hold these securities to maturity. Securities held to maturity include asset-backed securities, consisting of collateralized loan obligation securities and ARS. We evaluate these securities for OTTI on a quarterly basis.
If we determine that impairment on our debt securities is other-than-temporary andinterim tests, we have made the decisionoption to sellfirst assess qualitative factors to determine whether the securityexistence of events or circumstances leads to a determination that it is more likely than not that the fair value of a reporting unit is less than its carrying amount. If, after assessing the totality of events or circumstances, we will bedetermine it is more likely than not that the fair value of a reporting unit is greater than its carrying amount, then performing the two-step impairment
test is not required. However, if we conclude otherwise, we are then required to sellperform the security priorfirst step of the two-step impairment test. Goodwill impairment is determined by comparing the estimated fair value of a reporting unit with its respective carrying value. If the estimated fair value exceeds the carrying value, goodwill at the reporting unit level is not deemed to recoverybe impaired. If the estimated fair value is below carrying value, however, further analysis is required to determine the amount of itsthe impairment. Additionally, if the carrying value of a reporting unit is zero or a negative value and it is determined that it is more likely than not the goodwill is impaired, further analysis is required. The estimated fair values of the reporting units are derived based on valuation techniques we believe market participants would use for each of the reporting units. We have elected July 31 as our annual impairment testing date.
Identifiable intangible assets, which are amortized cost basis,over their estimated useful lives, are tested for potential impairment whenever events or changes in circumstances suggest that the carrying value of an asset or asset group may not be fully recoverable.
Loans and Advances
We offer transition pay, principally in the form of upfront loans, to financial advisors and certain key revenue producers as part of our company’s overall growth strategy. These loans are generally forgiven by a charge to compensation and benefits over a five- to ten-year period if the individual satisfies certain conditions, usually based on continued employment and certain performance standards. We monitor and compare individual financial advisor production to each loan issued to ensure future recoverability. If the individual leaves before the term of the loan expires or fails to meet certain performance standards, the individual is required to repay the balance. In determining the allowance for doubtful receivables from former employees, management considers the facts and circumstances surrounding each receivable, including the amount of the unforgiven balance, the reasons for the terminated employment relationship, and the former employees’ overall financial situation.
Derivative Instruments and Hedging Activities
We recognize all of our derivative instruments at fair value as either assets or liabilities in the consolidated statements of financial condition. These instruments are recorded in other assets or accounts payable and accrued expenses in the consolidated statements of financial condition and in the operating section of the consolidated statements of cash flows as increases or decreases of other assets and accounts payable and accrued expenses. Our company’s policy is not to offset fair value amounts recognized for derivative instruments and fair value amounts recognized for the right to reclaim cash collateral or the obligation to return cash collateral arising from derivative instruments recognized at fair value executed with the same counterparty under master netting arrangements. The accounting for changes in the fair value (i.e., gains and losses) of a derivative instrument depends on whether it has been designated and qualifies as part of a hedging relationship and, further, on the type of hedging relationship. For those derivative instruments that are designated and qualify as hedging instruments under Topic 815, “Derivatives and Hedging,” we recognizemust also designate the entirehedging instrument or transaction, based upon the exposure being hedged.
For derivative instruments that are designated and qualify as cash flow hedges (i.e., hedging the exposure to variability in expected future cash flows that is attributable to a particular risk), the effective portion of the impairment in earnings. If we have not madegain or loss on the derivative instrument is reported as a decision to sell the security and we do not expect that we will be required to sell the security prior to recovery of the amortized cost basis, we recognize only the credit component of OTTIaccumulated other comprehensive income, net of tax, and reclassified into earnings in the same period or periods during which the hedged transaction affects earnings. The remaining unrealizedgain or loss dueon the derivative instrument in excess of the cumulative change in the present value of future cash flows of the hedged item, if any, is recognized in current earnings during the period of change. We do not use derivatives for trading or speculative purposes and, at December 31, 2014, do not have any derivatives that are not designated in qualifying cash flow hedging relationships. See Note 15 for additional details.
Revenue Recognition
Customer securities transactions are recorded on a settlement date basis, with related commission revenues and expenses recorded on a trade date basis. Commission revenues are recorded as the amount charged to factors other than credit,the customer, which, in certain cases, may include varying discounts. Principal securities transactions are recorded on a trade date basis. We typically distribute our proprietary equity research products to our client base of institutional investors at no charge. These proprietary equity research products are accounted for as a cost of doing business.
Investment banking revenues, which include underwriting fees, management fees, advisory fees, and sales credits earned in connection with the distribution of the underwritten securities, are recorded when services for
the transactions are completed under the terms of each engagement. Expenses associated with such transactions are deferred until the related revenue is recognized or the non-credit component,engagement is otherwise concluded. Investment banking revenues are presented net of related unreimbursed expenses. Expenses related to investment banking deals not completed are recognized as non-interest expenses in the consolidated statements of operations. For the periods presented, there were no significant expenses recognized for incomplete transactions. We have not recognized any incentive income that is subject to contingent repayments.
Asset management and service fees are recorded when earned, based on the period-end assets in the accounts, and consist of customer account service fees, per account fees (such as IRA fees), and wrap fees on managed accounts.
We earn fees from the investment partnerships that we manage or of which we are a general partner. Such management fees are generally based on the net assets or committed capital of the underlying partnerships. We have agreed, in certain cases, to waive management fees, in lieu of making a cash contribution, in satisfaction of our general partner investment commitments to the investment partnerships. In these cases, we generally recognize our management fee revenues at the time when we are allocated a special profit interest in realized gains from these partnerships.
Operating Leases
We lease office space and equipment under operating leases. We recognize rent expense related to these operating leases on a straight-line basis over the lease term. The lease term commences on the earlier of the date when we become legally obligated for the rent payments or the date on which we take possession of the property. For tenant improvement allowances and rent holidays, we record a deferred rent liability in accounts payable and accrued expenses in the consolidated statements of financial condition and amortize the deferred rent over the lease term as a reduction to occupancy and equipment rental expense in the consolidated statements of operations.
Income Taxes
We compute income taxes using the asset and liability method, under which deferred income taxes are provided for the temporary differences between the financial statement carrying amounts and the tax basis of our company’s assets and liabilities. We establish a valuation allowance for deferred tax assets if it is more likely than not that these items will either expire before we are able to realize their benefits, or that future deductibility is uncertain.
We recognize the tax benefit from an uncertain tax position only if it is more likely than not that the tax position will be sustained on examination by the taxing authorities, based on the technical merits of the position. The tax benefits recognized in the consolidated financial statements from such a position are measured based on the largest benefit that has a greater than 50% likelihood of being realized upon ultimate settlement. We recognize interest and penalties related to uncertain tax positions in provision for income taxes/(benefit) in the consolidated statements of operations. See Note 24 for further information regarding income taxes.
Foreign Currency Translation
We consolidate our foreign subsidiaries, which have designated their local currency as their functional currency. Assets and liabilities of these foreign subsidiaries are translated at year-end rates of exchange. Revenues and expenses are translated at an average rate for the period. In accordance with Financial Accounting Standards Board (“FASB”) Accounting Standards Codification Topic 830, “Foreign Currency Matters,” gains or losses resulting from translating foreign currency financial statements are reflected in accumulated other comprehensive income/(loss)income, a separate component of shareholders’ equity. Gains or losses resulting from foreign currency transactions are included in net income.
Recently Adopted Accounting Guidance
Discontinued Operations
In April 2014, the FASB issued ASU No. 2014-08, “Presentation of Financial Statements (Topic 205) and Property, Plant, and Equipment (Topic 360): Reporting Discontinued Operations and Disclosures of Disposals of Components of an Entity”(“ASU 2014-08”), amending FASB ASC Topic 205-20, “Discontinued Operations” (“ASC 205-20”). The amended guidance changes the criteria for reporting discontinued operations and requires new disclosures. ASU 2014-08 is effective for annual and interim periods beginning on or after December 15, 2014, and will be applied prospectively. We determineare currently evaluating the credit componentimpact the new guidance will have on our consolidated financial statements.
Revenue Recognition
In May 2014, the FASB issued ASU No. 2014-09, “Revenue from Contracts with Customers (Topic 606)” (“ASU 2014-09”), which supersedes current revenue recognition guidance, including most industry-specific guidance. ASU 2014-09 requires a company to recognize revenue when it transfers promised goods or services to customers in an amount that reflects the consideration to which the company expects to be entitled in exchange for those goods and services. The guidance also requires additional disclosures regarding the nature, amount, timing and uncertainty of revenue that is recognized. The guidance allows for either retrospective application to all periods presented or a modified retrospective approach, where the guidance would only be applied to existing contracts in effect at the adoption date and new contracts going forward. ASU 2014-09 is effective for annual and interim periods beginning after December 15, 2016. Early adoption is not permitted. We are currently evaluating the impact the new guidance will have on our consolidated financial statements.
Repurchase Agreements
In June 2014, the FASB issued ASU No. 2014-11, “Transfers and Servicing (Topic 860): Repurchase-to-Maturity Transactions, Repurchase Financings, and Disclosures” (“ASU 2014-11”), amending FASB Accounting Standards Codification Topic 860, “Transfers and Servicing.” The amended guidance changes the accounting for repurchase-to-maturity transactions and repurchase financing arrangements. The guidance also requires new disclosures for certain transfers accounted for as sales and collateral supporting transactions that are accounted for as secured borrowings. ASU 2014-11 is effective for annual and interim periods beginning after December 15, 2014, except for the disclosures related to secured borrowings, which are effective for annual periods beginning after December 15, 2014, and for interim periods beginning after March 15, 2015. The adoption of ASU 2014-11 is not expected to have a material impact on the Company’s results of operations or financial position, but may impact the Company’s disclosures.
Pushdown Accounting
In November 2014, the FASB issued ASU 2014-17, “Business Combinations (Topic 805): Pushdown Accounting,” to provide companies with the option to apply pushdown accounting in their separate financial statements upon occurrence of an event in which an acquirer obtains control of the acquired entity. The election to apply pushdown accounting can be made either in the period in which the change of control occurred, or in a subsequent period. If the election is made in a subsequent period, the application of this guidance would be considered a change in accounting principle. The amendments in this ASU are effective as of November 18, 2014. The adoption will not have a significant impact on the Company’s consolidated financial statements.
Consolidation
In February 2015, the Financial Accounting Standards Board (“FASB”) issued Accounting Standards Update (“ASU”) No. 2015-02, “Consolidation (Topic 810): Amendments to the Consolidation Analysis” (“ASU 2015-02”). ASU 2015-02 amends ASC 810 through targeted changes to the consolidation guidance for legal entities such as limited partnerships, limited liability corporations, and securitization structures. It is effective for annual and interim periods beginning after December 15, 2015. Early adoption is permitted. We are currently evaluating the impact of the amended guidance on our consolidated financial statements.
Merchant Capital, LLC
On December 31, 2014, we acquired Merchant, a public finance investment banking firm headquartered in Montgomery, Alabama, which serves the Southeastern market. The strategic combination of our company and Merchant is expected to further strengthen our company’s position in several key underwriting markets in the Southeast.
The acquisition was accounted for under the acquisition method of accounting in accordance with ASC 805 (“Topic 805”), “Business Combinations.” Accordingly, goodwill was measured as the excess of the acquisition-date fair value of the consideration transferred over the amount of acquisition-date identifiable assets acquired net of assumed liabilities. We recorded $15.0 million of goodwill as an asset in the consolidated statement of financial condition, which has been allocated to our company’s Institutional Group segment. The allocation of the purchase price is preliminary and will be finalized upon completion of the analysis of the fair values of the net assets of Merchant on December 31, 2014, and the identified intangible assets. The final goodwill and intangible assets recorded on the consolidated statement of financial condition
may differ from that reflected herein as a result of future measurement period adjustments. In management’s opinion, the goodwill represents the value expected from the synergies created through the operational enhancement benefits that will result from the integration of Merchant’s business and the reputation and expertise of Merchant in the public finance space within the investment banking sector.
Pro forma information is not presented, because the acquisition is not considered to be material, as defined by the Securities and Exchange Commission (the “SEC”). The results of operations of Merchant have been included in our results prospectively from the date of acquisition.
1919 Investment Counsel & Trust Co., National Association
On November 7, 2014, we completed the acquisition of 1919 Investment Counsel, and 1919 an asset management firm and trust company that provides customized investment advisory and trust services, on a discretionary basis, to individuals, families, and institutions throughout the country.
The acquisition was accounted for under the acquisition method of accounting in accordance with ASC 805 (“Topic 805”), “Business Combinations.” Accordingly, goodwill was measured as the excess of the acquisition-date fair value of the consideration transferred over the amount of acquisition-date identifiable assets acquired net of assumed liabilities. We recorded $13.8 million of goodwill as an asset in the consolidated statement of financial condition, which has been allocated to our company’s Global Wealth Management segment. The allocation of the purchase price is preliminary and will be finalized upon completion of the analysis of the fair values of the net assets of 1919 Investment Counsel on November 7, 2014, and the identified intangible assets.
Identifiable intangible assets purchased by our company consisted of customer relationships with estimated acquisition-date fair value of $6.7 million.
The final goodwill and intangible assets recorded on the consolidated statement of financial condition may differ from that reflected herein as a result of future measurement period adjustments. In management’s opinion, the goodwill represents the value expected from the synergies created through the operational enhancement benefits that will result from the integration of 1919 Investment Counsel’s business and the reputation and expertise of 1919 Investment Counsel in the asset management sector and as a trust company.
On November 7, 2014, certain employees were granted restricted stock or restricted stock units of our company as retention. The fair value of the awards issued as retention was $11.2 million. There are no continuing service requirements associated with these restricted stock units, and accordingly, they were expensed at date of grant. This charge is included in compensation and benefits in the consolidated statement of operations for the year ended December 31, 2014. In addition, we have paid $10.8 million in the form of notes to associates for retention. These notes will be forgiven by a charge to compensation and benefits over a five- to ten-year period if the individual satisfies certain conditions, usually based on continued employment and certain performance standards.
Pro forma information is not presented, because the difference betweenacquisition is not considered to be material, as defined by the security’s amortized cost basisSEC. The results of operations of 1919 Investment Counsel have been included in our results prospectively from the date of acquisition.
Oriel Securities
On July 31, 2014, we completed the acquisition of Oriel, a London-based stockbroking and investment banking firm. The combination of our company and Oriel has created a significant middle-market investment banking group in London, with broad research coverage across most sectors of the economy, equity and debt sales and trading, and investment banking services.
The acquisition was accounted for under the acquisition method of accounting in accordance with ASC 805 (“Topic 805”), “Business Combinations.” Accordingly, goodwill was measured as the excess of the acquisition-date fair value of the consideration transferred over the amount of acquisition-date identifiable assets acquired net of assumed liabilities. We recorded $18.7 million of goodwill as an asset in the consolidated statement of financial condition, which has been allocated to our company’s Institutional Group segment. The allocation of the purchase price is preliminary and will be finalized upon completion of the analysis of the fair values of the net assets of Oriel on July 31, 2014, and identifiable intangible assets. Identifiable intangible assets purchased by our company consisted of trade name and non-compete agreements with estimated acquisition-date fair values of $1.9 million and $1.4 million, respectively.
The final goodwill and intangible assets recorded on the consolidated statement of financial condition may differ from that reflected herein as a result of future measurement period adjustments. In management’s opinion, the goodwill represents the value expected from the synergies created through the operational enhancement benefits that will result from the integration of Oriel’s business and the presentreputation and expertise of Oriel in the investment banking sector in the United Kingdom.
On July 31, 2014, certain employees were granted restricted stock or restricted stock units of our company as retention. The fair value of its expected future cash flows, discounted based on the purchase yield. The non-credit component representsawards issued as retention was $6.8 million. There are no continuing service requirements associated with these restricted stock units, and accordingly, they were expensed at date of grant. This charge is included in compensation and benefits in the difference between the security’s fair value and the present valueconsolidated statement of expected future cash flows.
Loan Classification
We classify loans as based on our investment strategy and management’s assessment of our intent and ability to hold loansoperations for the foreseeable future or until maturity. Management’s intent and ability with respectyear ended December 31, 2014.
Pro forma information is not presented, because the acquisition is not considered to certain loans may changebe material, as defined by the SEC. The results of operations of Oriel have been included in our results prospectively from timethe date of acquisition.
De La Rosa & Co.
On April 3, 2014, we acquired De La Rosa, a California-based public finance investment banking boutique. The addition of the De La Rosa team is expected to time depending onfurther strengthen our company’s position in a number of factors, including economic, liquiditykey underwriting markets in California.
The acquisition was accounted for under the acquisition method of accounting in accordance with ASC 805 (“Topic 805”), “Business Combinations.” Accordingly, goodwill was measured as the excess of the acquisition-date fair value of the consideration transferred over the amount of acquisition-date identifiable assets acquired net of assumed liabilities. We recorded $17.4 million of goodwill as an asset in the consolidated statement of financial condition, which has been allocated to our company’s Institutional Group segment. The allocation of the purchase price is preliminary and capital conditions. will be finalized upon completion of the analysis of the fair values of the net assets of De La Rosa on April 3, 2014, and identifiable intangible assets. Identifiable intangible assets purchased by our company consisted of customer relationships and trade name with estimated acquisition-date fair values of $0.2 million and $1.8 million, respectively.
The accountingfinal goodwill and intangible assets recorded on the consolidated statement of financial condition may differ from that reflected herein as a result of future measurement frameworkperiod adjustments. In management’s opinion, the goodwill represents the value expected from the synergies created through the operational enhancement benefits that will result from the integration of De La Rosa’s business and the reputation and expertise of De La Rosa in the investment banking sector.
Pro forma information is not presented, because the acquisition is not considered to be material, as defined by the SEC. The results of operations of De La Rosa have been included in our results prospectively from the date of acquisition.
Acacia Federal Savings Bank (“Acacia Federal”)
On October 31, 2013, Stifel Bank completed its acquisition of Acacia Federal Savings Bank, a federally chartered savings institution with one retail branch.
Under the agreement, we acquired approximately $337.1 million of loans and $180.4 million of other assets (primarily cash and due from banks and investment securities). In addition, we assumed approximately $435.4 million of deposits and $10.0 million of other liabilities. Assets acquired and liabilities assumed were recorded at fair value in accordance with ASC 805, “Business Combinations.” The fair values for loans differs dependingwere estimated using discounted cash flow analyses using interest rates currently being offered for loans with similar terms. This value was reduced by an estimate of probable losses and the credit risk associated with the loans. The fair values of deposits were estimated by discounting cash flows using interest rates currently being offered on deposits with similar maturities.
We recognized a $7.6 million bargain purchase gain during the loan classification.year ended December 31, 2013, which is included in other income in the consolidated statements of operations.
Pro forma information is not presented, because the acquisition is not considered to be material, as defined by the SEC. The classification criteriaresults of operations of Acacia Federal have been included in our results prospectively from the date of acquisition.
Ziegler Capital Management, LLC
On November 30, 2013, we acquired ZCM, an asset management firm that provides investment solutions for institutions, mutual fund sub-advisory clients, municipalities, pension plans, Taft-Hartley plans, and accounting and measurement framework for bank loans and loans held for sale are described below.individual investors.
The acquisition was accounted for under the acquisition method of accounting in accordance with ASC 805 (“Topic 805”), “Business Combinations.” Accordingly, goodwill was measured as the excess of the acquisition-date fair value of the consideration transferred over the amount of acquisition-date identifiable assets acquired net of assumed liabilities. We recorded $6.8 million of goodwill as an asset in the consolidated statement of financial condition, which has been allocated to our company’s Global Wealth Management segment.
Identifiable intangible assets purchased by our company consisted of customer relationships and trade name with estimated acquisition-date fair values of $3.4 million and $0.1 million, respectively.
In management’s opinion, the goodwill represents the value expected from the synergies created through the operational enhancement benefits that will result from the integration of ZCM’s business and the reputation and expertise of ZCM in the asset management sector.
Pro forma information is not presented, because the acquisition is not considered to be material, as defined by the SEC. The results of operations of ZCM have been included in our results prospectively from the date of acquisition.
KBW, Inc.
On February 15, 2013, we completed the purchase of all of the outstanding shares of common stock of KBW, Inc. (“KBW, Inc.”), a full-service investment bank specializing in the financial services industry based in New York, New York. The purchase was completed pursuant to the merger agreement dated November 5, 2012. Under the terms of the merger agreement, each share of common stock, including certain restricted stock, of KBW, Inc. issued and outstanding immediately prior to the effective time of the merger was cancelled and converted into the right to receive a combination of (i) cash consideration of $8.00 ($10.00 less the extraordinary dividend amount of $2.00) and (ii) stock consideration of 0.2143 a share of our common stock.
In conjunction with the close of the merger, we issued 6.7 million shares of common stock to holders of KBW, Inc. common stock, issued 2.2 million restricted stock awards to KBW, Inc. employees, and paid $253.0 million in cash.
The acquisition was accounted for under the acquisition method of accounting in accordance with Topic 805, “Business Combinations.” Accordingly, goodwill was measured as the excess of the acquisition-date fair value of the consideration transferred over the amount of acquisition-date identifiable assets acquired net of assumed liabilities. We recorded $288.3 million of goodwill as an asset in the consolidated statement of financial condition, which has been allocated to our company’s Institutional Group segment. In management’s opinion, the goodwill represents the value expected from the synergies created through the operational enhancement benefits that will result from the integration of KBW, Inc.’s business and the reputation and expertise of KBW, Inc. in the financial services sector. Identifiable intangible assets purchased by our company consisted of customer relationships, trade name, and investment banking backlog with acquisition-date fair values of $11.0 million, $9.0 million, and $4.0 million, respectively.
Under Topic 805, merger-related transaction costs (such as advisory, legal, valuation, and other professional fees) are not included as components of consideration transferred but are accounted for as expenses in the periods in which the costs are incurred. Transaction costs of $9.8 million were incurred during the year ended December 31, 2013, and are included in other operating expenses in the consolidated statement of operations.
In addition, on February 15, 2013, certain employees were granted restricted stock or restricted stock units of our company as retention. The fair value of the awards issued as retention was $30.6 million. There are no continuing service requirements associated with these restricted stock units, and accordingly, they were expensed at date of grant. This charge is included in compensation and benefits in the consolidated statement of operations for the year ended December 31, 2013.
The following unaudited pro forma financial information presents the combined results of operations as if the merger had occurred on January 1, 2012. The pro forma financial information does not reflect the costs of any integration activities. The pro forma results include estimates and assumptions, which management believes are reasonable. The unaudited pro forma financial information below is not necessarily indicative of either future results of operations or results that might have been achieved had KBW, Inc. been combined with us as of the beginning of 2012.
| (000s except per share amounts, unaudited) | 2012 | |||
Total net revenues | $ | 1,857,913 | ||
Net income | 112,531 | |||
Income per share: | ||||
Basic | $ | 1.86 | ||
Diluted | $ | 1.56 | ||
Stone & Youngberg LLC
On October 1, 2011, we acquired Stone & Youngberg, a leading financial services firm specializing in municipal finance and fixed income securities. The purchase consideration consisted of cash, a portion paid at closing and $24.0 million to be paid in installments over the next three years, and common stock. In addition, we may be required to pay a contingent earn-out over a five-year period after the closing, which is capped at $25.0 million, based upon revenue goals, as established in the purchase agreement.
We recognized a liability for estimated earn-out payments over the five-year period. Additionally, we recognized a liability for the installment payments to be made over the next year. The liability for the estimated installment payments and earn-out payments were $8.0 million and $16.8 million, respectively, at December 31, 2014. These liabilities are included in accounts payable and accrued expenses in the consolidated statements of financial condition.
NOTE 4 – Discontinued Operations
The components of discontinued operations are as follows(in thousands):
| Year Ended December 31, | ||||||||||||
| 2014 | 2013 | 2012 | ||||||||||
Net revenues | $ | (121 | ) | $ | 11,794 | $ | 18,537 | |||||
Restructuring expense | 217 | 6,881 | — | |||||||||
Operating expenses | 3,924 | 15,697 | 22,412 | |||||||||
|
|
|
|
|
| |||||||
Total non-interest expenses | 4,141 | 22,578 | 22,412 | |||||||||
Loss from discontinued operations before income taxes | (4,262 | ) | (10,784 | ) | (3,875 | ) | ||||||
Income tax expense/(benefit) | (1,199 | ) | 110 | 2,848 | ||||||||
|
|
|
|
|
| |||||||
Loss from discontinued operations, net of tax | $ | (3,063 | ) | $ | (10,894 | ) | $ | (6,723 | ) | |||
|
|
|
|
|
| |||||||
NOTE 5 – Receivables From and Payables to Brokers, Dealers, and Clearing Organizations
Amounts receivable from brokers, dealers, and clearing organizations at December 31, 2014 and 2013, included(in thousands):
| December 31, | ||||||||
| 2014 | 2013 | |||||||
Deposits paid for securities borrowed | $ | 445,542 | $ | 227,640 | ||||
Receivable from clearing organizations | 198,079 | 125,538 | ||||||
Securities failed to deliver | 7,453 | 27,944 | ||||||
|
|
|
| |||||
| $ | 651,074 | $ | 381,122 | |||||
|
|
|
| |||||
Amounts payable to brokers, dealers, and clearing organizations at December 31, 2014 and 2013, included(in thousands):
| December 31, | ||||||||
| 2014 | 2013 | |||||||
Securities failed to receive | $ | 7,365 | $ | 7,411 | ||||
Deposits received from securities loaned | 4,215 | 40,101 | ||||||
Payable to clearing organizations | 2,443 | 10,623 | ||||||
|
|
|
| |||||
| $ | 14,023 | $ | 58,135 | |||||
|
|
|
| |||||
Deposits paid for securities borrowed approximate the market value of the securities. Securities failed to deliver and receive represent the contract value of securities that have not been delivered or received on settlement date.
NOTE 6 – Fair Value Measurements
We measure certain financial assets and liabilities at fair value on a recurring basis, including cash equivalents, financial instruments owned, available-for-sale securities, investments, financial instruments sold, but not yet purchased, and derivatives.
We generally utilize third-party pricing services to value Level 1 and Level 2 available-for-sale investment securities, as well as certain derivatives designated as cash flow hedges. We review the methodologies and assumptions used by the third-party pricing services and evaluate the values provided, principally by comparison with other available market quotes for similar instruments and/or analysis based on internal models using available third-party market data. We may occasionally adjust certain values provided by the third-party pricing service when we believe, as the result of our review, that the adjusted price most appropriately reflects the fair value of the particular security.
Following are descriptions of the valuation methodologies and key inputs used to measure financial assets and liabilities recorded at fair value. The descriptions include an indication of the level of the fair value hierarchy in which the assets or liabilities are classified.
Bank Loans and Allowance for Loan Losses
Bank loans consist of commercial and residential mortgage loans, home equity loans, stock securedstock-secured loans, construction loans, and commercial and industrial and consumer loans originated by Stifel Bank. Bank loans include those loans that management has the intent and ability to hold and are recorded at outstanding principal adjusted for any charge-offs, allowance for loan losses, and deferred origination fees and costs.costs, and purchased discounts. Loan origination costs, net of fees, are deferred and recognized over the contractual life of the loan as an adjustment of yield using the interest method. Bank loans are generally collateralized by real estate, real property, marketable securities, or other assets of the borrower. Interest income is recognized using the effective interest rate method, which is based upon the respective interest rates and the average daily asset balance. Discount accretion is recognized using the effective interest rate method, which is based upon the respective interest rate and expected lives of loans.
We regularly review the loan portfolio and have established an allowance for loan losses for inherent losses estimated to have occurred in the loan portfolio through a provision for loan losses charged to income.other operating expenses in the consolidated statements of operations. In providing for the allowance for loan losses, we consider historical loss experience, the nature and volume of the loan portfolio, adverse situations that may affect the borrower’s ability to repay, estimated value of any underlying collateral, and prevailing economic conditions. This evaluation is inherently subjective, as it requires estimates that are susceptible to significant revision as more information becomes available.
Loans Held for Sale
Loans that we intend to sell or for which we do not have the ability and intent to hold for the foreseeable future are classified as held for sale. Loans held for sale consist of fixed-rate and adjustable-rate residential real estate mortgage loans intended for sale. Loans held for sale are stated at lower of cost or market value. Declines in market value below cost and any gains or losses on the sale of these assets are recognized in other revenues in the consolidated statements of operations. Market value is determined based on prevailing market prices for loans with similar characteristics or on sale contract prices. Deferred fees and costs related to these loans are not amortized but are recognized as part of the cost basis of the loan at the time it is sold. Because loans held for sale are reported at lower of cost or market value, an allowance for loan losses is not established for loans held for sale.
Impaired Loans
A loan is considered impaired when, based on current information and events, it is probable that the scheduled payments of principal or interest when due according to the contractual terms of the loan agreement will not be collectible. Factors considered in determining impairment include payment status, collateral value, and the probability of collecting scheduled principal and interest payments when due. Loans that experience insignificant payment delays and payment shortfalls generally are not classified as impaired. We determine the significance of payment delays and payment shortfalls on a case-by-case basis, taking into consideration all of the circumstances surrounding the loan and the borrower, including the length of the delay, the reasons for the delay, the borrower’s prior payment record, and the amount of the shortfall in relation to the principal and interest owed.
Once a loan is determined to be impaired, when principal or interest becomes 90 days past due or when collection becomes uncertain, the accrual of interest and amortization of deferred loan origination fees is discontinued (“non-accrual status”), and any accrued and unpaid interest income is reversed. Loans placed on non-accrual status are returned to accrual status when all delinquent principal and interest payments are collected and the collectibility of future principal and interest payments is reasonably assured. Loan losses are charged against the allowance when we believe the uncollectibility of a loan balance is certain. Subsequent recoveries, if any, are credited to the allowance for loan losslosses.
Large groups of smaller balance homogenous loans are collectively evaluated for impairment. Accordingly, we do not separately identify individual consumer and residential loans for impairment measurements. Impairment is measured on a loan-by-loan basis for non-homogeneous loans, and a specific allowance is established for individual loans determined to be impaired. Impairment is measured by comparing the carrying value of the impaired loan to the present value of its expected cash flow discounted at the loan’s effective interest rate, the loan’s observable market price, or the fair value of the collateral if the loan is collateral dependent.
Other Real Estate Owned
Assets acquired through, or in lieu of, loan foreclosure by Stifel Bank are held for sale and initially recorded at fair value, less estimated cost to sell, at the date of foreclosure, establishing a new cost basis. Subsequent to foreclosure, valuations are periodically performed and the assets are carried at the lower of carrying amount or fair value less cost to sell. These valuations are performed by a third-party appraisal firm. Revenue and expense from operations and changes in the valuation allowance are included in other income or other operating expense in the consolidated statements of operations.
Investments
Our broker-dealer subsidiaries report changes in fair value of marketable and non-marketable securities through current period earnings based on guidance provided byin other income in the AICPA Audit and Accounting Guide, “Brokers and Dealers in Securities.”consolidated statements of operations. The fair value of marketable investments is generally based on either quoted market or dealer prices. The fair value of non-marketable securities is based on management’s estimate using the best information available, which generally consists of quoted market prices for similar securities and internally developed discounted cash flow models.
Investments in the consolidated statements of financial condition contain investments in securities that are marketable and securities that are not readily marketable. These investments are not included in our broker-dealer trading inventory or available-for-sale or held-to-maturity portfolios and represent the acquiring and disposing of debt or equity instruments for our benefit.
Fixed Assets
Office equipment is depreciated on an accelerated basis over the estimated useful life of the asset of two to seven years. Leasehold improvements are amortized on a straight-line basis over the lesser of the estimated useful life of the asset or the term of the lease. Buildings and building improvements are amortized on a straight-line basis over the estimated useful life of the asset of three to thirty-nine years. Depreciation expense is recorded in occupancy and equipment rental expense in the consolidated statements of operations. Office equipment, leasehold improvements, and property are stated at cost net of accumulated depreciation and amortization.amortization in the consolidated statements of financial condition. Office equipment is reviewed for impairment whenever events or changes in circumstances indicate that the carrying amount of such assets may not be recoverable.
Goodwill and Intangible Assets
Goodwill represents the cost of acquired businesses in excess of the fair value of the related net assets acquired. We test goodwill for impairment on an annual basis and on an interim basis when certain events or circumstances exist. We test for impairment at the reporting unit level, which is generally at the level of or one level below our company’s business segments. For both the annual and interim tests, we have the option to first assess qualitative factors to determine whether the existence of events or circumstances leads to a determination that it is more likely than not that the fair value of a reporting unit is less than its carrying amount. If, after assessing the totality of events or circumstances, we determine it is more likely than not that the fair value of a reporting unit is greater than its carrying amount, then performing the two-step impairment
test is not required. However, if we conclude otherwise, we are then required to perform the first step of the two-step impairment test. Goodwill impairment is determined by comparing the estimated fair value of a reporting unit with its respective carrying value. If the estimated fair value exceeds the carrying value, goodwill at the reporting unit level is not deemed to be impaired. If the estimated fair value is below carrying value, however, further analysis is required to determine the amount of the impairment. Additionally, if the carrying value of a reporting unit is zero or a negative value and it is determined that it is more likely than not the goodwill is impaired, further analysis is required. The estimated fair values of the reporting units are derived based on valuation techniques we believe market participants would use for each of the reporting units. We have elected July 31 as our annual impairment testing date.
Identifiable intangible assets, which are amortized over their estimated useful lives, are tested for potential impairment whenever events or changes in circumstances suggest that the carrying value of an asset or asset group may not be fully recoverable.
Loans and Advances
We offer transition pay, principally in the form of upfront loans, to financial advisors and certain key revenue producers as part of our company’s overall growth strategy. These loans are generally forgiven by a charge to compensation and benefits over a five—five- to ten-year period if the individual satisfies certain conditions, usually based on continued employment and certain performance standards. We monitor and compare individual financial advisor production to each loan issued to ensure future recoverability. If the individual leaves before the term of the loan expires or fails to meet certain performance standards, the individual is required to repay the balance. In determining the allowance for doubtful receivables from former employees, management considers the facts and circumstances surrounding each receivable, including the amount of the unforgiven balance, the reasons for the terminated employment relationship, and the former employees’ overall financial positions.situation.
Securities Sold Under Agreements to Repurchase
Securities sold under agreements to repurchase (“repurchase agreements”) are collateralized financing transactions that are recorded at their contractual amounts plus accrued interest. We make delivery of securities sold under agreements to repurchase and monitor the value of collateral on a daily basis. When necessary, we will deliver additional collateral.
Derivative Instruments and Hedging Activities
We recognize all of our derivative instruments at fair value as either assets or liabilities in the consolidated statements of financial condition. These instruments are recorded in other assets or accounts payable and accrued expenses in the consolidated statements of financial condition and in the operating section of the consolidated statements of cash flows as increases or decreases of other assets and accounts payable and accrued expenses. Our company’s policy is not to offset fair value amounts recognized for derivative instruments and fair value amounts recognized for the right to reclaim cash collateral or the obligation to return cash collateral arising from derivative instruments recognized at fair value executed with the same counterparty under master netting arrangements. The accounting for changes in the fair value (i.e., gains and losses) of a derivative instrument depends on whether it has been designated and qualifies as part of a hedging relationship and, further, on the type of hedging relationship. For those derivative instruments that are designated and qualify as hedging instruments under Topic 815, “Derivatives and Hedging,” we must also designate the hedging instrument or transaction, based upon the exposure being hedged.
For derivative instruments that are designated and qualify as cash flow hedges (i.e., hedging the exposure to variability in expected future cash flows that is attributable to a particular risk), the effective portion of the gain or loss on the derivative instrument is reported as a component of accumulated other comprehensive income, net of tax, and reclassified into earnings in the same period or periods during which the hedged transaction affects earnings. The remaining gain or loss on the derivative instrument in excess of the cumulative change in the present value of future cash flows of the hedged item, if any, is recognized in current earnings during the period of change. We do not use derivatives for trading or speculative purposes and, at December 31, 2012,2014, do not have any derivatives that are not designated in qualifying cash flow hedging relationships. See Note 15 for additional details.
Revenue Recognition
Customer securities transactions are recorded on a settlement date basis, with related commission revenues and expenses recorded on a trade date basis. Commission revenues are recorded as the amount charged to the customer, which, in certain cases, may include varying discounts. Principal securities transactions are recorded on a trade date basis. We typically distribute our proprietary equity research products to our client base of institutional investors at no charge. These proprietary equity research products are accounted for as a cost of doing business.
Investment banking revenues, which include underwriting fees, management fees, advisory fees, and sales credits earned in connection with the distribution of the underwritten securities, are recorded when services for
the transactions are completed under the terms of each engagement. Expenses associated with such transactions are deferred until the related revenue is recognized or the engagement is otherwise concluded. Investment banking revenues are presented net of related unreimbursed expenses. Expenses related to investment banking deals not completed are recognized as non-interest expenses in the consolidated statements of operations. For the periods presented, there were no significant expenses recognized for incomplete transactions. We have not recognized any incentive income that is subject to contingent repayments.
Asset management and service fees are recorded when earned, based on the period-end assets in the accounts, and consist of customer account service fees, per account fees (such as IRA fees), and wrap fees on managed accounts.
We earn fees from the investment partnerships that we manage or of which we are a general partner. Such management fees are generally based on the net assets or committed capital of the underlying partnerships. We have agreed, in certain cases, to waive management fees, in lieu of making a cash contribution, in satisfaction of our general partner investment commitments to the investment partnerships. In these cases, we generally recognize our management fee revenues at the time when we are allocated a special profit interest in realized gains from these partnerships.
Direct Financing and Operating Leases
The net investment in direct financing leases resulting from our acquisition of East Shore Aircraft LLC (“East Shore”) is included in other assets in the consolidated balance sheets and consists of the present values of the sum of the future minimum lease payments and estimated residual value of the leased assets. Revenue consists of interest earned on the net investment and is recognized over the lease term as a constant percentage return thereon. The net investment in property on operating leases is included in fixed assets in the consolidated balance sheets. Depreciation is recognized, on the straight-line basis, over the lease term to the estimated residual value. Operating lease revenue is recorded on a straight-line basis and is recognized over the lease term in other income. Estimated residual values are established at lease inception utilizing contract terms, past customer experience, and general market data and are reviewed and adjusted, if necessary, on an annual basis. See Note 3 – Acquisitions further details.
We have a net investment in direct financing leases of $53.7 million at December 31, 2012, which is included in other assets in the consolidated balance sheets. This net investment includes unearned income of $43.7 million at December 31, 2012. We did not have an investment in direct financing leases at December 31, 2011. The future lease rental payments due from United Air Lines, Inc. (“UAL”) at December 31, 2012, totaled $54.4 million and were as follows: $16.2 million in 2013, $15.5 million in 2014, $14.9 million in 2015, $5.4 million in 2016 and $2.4 million in 2017.
We lease office space and equipment under operating leases. We recognize rent expense related to these operating leases on a straight-line basis over the lease term. The lease term commences on the earlier of the date when we become legally obligated for the rent payments or the date on which we take possession of the property. For tenant improvement allowances and rent holidays, we record a deferred rent liability in accounts payable and accrued expenses in the consolidated statements of financial condition and amortize the deferred rent over the lease term as a reduction to occupancy and equipment rental expense in the consolidated statements of operations.
Income Taxes
We compute income taxes using the asset and liability method, under which deferred income taxes are provided for the temporary differences between the financial statement carrying amounts and the tax basis of our company’s assets and liabilities. We establish a valuation allowance for deferred tax assets if it is more likely than not that these items will either expire before we are able to realize their benefits, or that future deductibility is uncertain.
We recognize the tax benefit from an uncertain tax position only if it is more likely than not that the tax position will be sustained on examination by the taxing authorities, based on the technical merits of the position. The tax benefits recognized in the consolidated financial statements from such a position are measured based on the largest benefit that has a greater than 50% likelihood of being realized upon ultimate settlement. We recognize interest and penalties related to uncertain tax positions in provision for income taxes/(benefit) in the consolidated statements of operations. See Note 2324 for further information regarding income taxes.
Foreign Currency Translation
We consolidate our foreign subsidiaries, which have designated their local currency as their functional currency. Assets and liabilities of these foreign subsidiaries are translated at year-end rates of exchange, and revenuesexchange. Revenues and expenses are translated at an average rate for the period. In accordance with Financial Accounting Standards Board (“FASB”) Accounting Standards Codification Topic 830, “Foreign Currency Matters,” gains or losses resulting from translating foreign currency financial statements are reflected in accumulated other comprehensive income, a separate component of shareholders’ equity. Gains or losses resulting from foreign currency transactions are included in net income.
Recently Adopted Accounting Guidance
Goodwill Impairment TestingDiscontinued Operations
In September 2011,April 2014, the FASB issued UpdateASU No. 2011-08 2014-08, “Presentation of Financial Statements (Topic 205) and Property, Plant, and Equipment (Topic 360): Reporting Discontinued Operations and Disclosures of Disposals of Components of an Entity”(“Testing GoodwillASU 2014-08”), amending FASB ASC Topic 205-20, “Discontinued Operations” (“ASC 205-20”). The amended guidance changes the criteria for Impairment,” which amends Topic 350 “Intangibles – Goodwillreporting discontinued operations and Other.” This update permits entities to make a qualitative assessment of whether it is more likely than not that a reporting unit’s fair value is less than its carrying amount before applying the two-step goodwill impairment test. If an entity concludes that it is not more likely than not that the fair value of a reporting unit is less than its carrying amount, it would not be required to perform the two-step impairment test for that reporting unit. This updaterequires new disclosures. ASU 2014-08 is effective for annual and interim goodwill impairment tests performed for fiscal years beginning after December 15, 2011 (January 1, 2012 for our company), with early adoption permitted. The adoption of the new guidance did not have a material impact on our consolidated financial statements.
Comprehensive Income
In June 2011, the FASB issued Update No. 2011-05, “Comprehensive Income (Topic 220): Presentation of Comprehensive Income” (“Update No. 2011-05”), which allows for the presentation of total comprehensive income, the components of net income, and the components of other comprehensive income either in a single continuous statement of comprehensive income or in two separate but consecutive statements. In addition, the guidance eliminates the option of presenting the components of other comprehensive income as part of the statement of changes in stockholders’ equity. This guidance is effective for interim and annual reporting periods beginning after December 15, 2011 (January 1, 2012 for our company). While the adoption impacted where we disclose the components of other comprehensive income in our consolidated financial statements, it did not otherwise have an impact on our consolidated financial statements.
In December 2011, the FASB issued Update No. 2011-12, “Deferral of the Effective Date for Amendments to the Presentation of Reclassifications of Items Out of Accumulated Other Comprehensive Income in Accounting Standards Update No. 2011-05” (“Update No. 2011-12”), which deferred the requirement to present on the face of the financial statements reclassification adjustments for items that are reclassified from other comprehensive income to net income while the FASB further deliberates this aspect of the proposal. The amendments contained in Update No. 2011-05 do not change the items that must be reported in other comprehensive income or when an item of other comprehensive income must be reclassified to net income. Update No. 2011-05, as amended by Update No. 2011-12, became effective for us on January 1, 2012. Although the adoption of this new guidance did not have a material impact on our accounting for comprehensive income, it did impact our presentation of the components of comprehensive income by eliminating the historical practice of showing these items within our consolidated financial statements.
Fair Value of Financial Instruments
In May 2011, the FASB issued Update No. 2011-04, “Fair Value Measurement (Topic 820): Amendments to Achieve Common Fair Value Measurement and Disclosure Requirements in U.S. GAAP and IFRSs” (“Update No. 2011-04”), which generally aligns the principals of measuring fair value and for disclosing information about fair value measurements with International Financial Reporting Standards. This guidance is effective for interim and annual reporting periods beginning after December 15, 2011 (January 1, 2012 for our company). Other than requiring additional disclosures regarding fair value measurements, the adoption of this new guidance did not have an impact on our consolidated financial statements. See Note 6—Fair Value Measurements.
Reconsideration of Effective Control for Repurchase Agreements
In April 2011, the FASB issued Update No. 2011-03, “Transfers and Servicing (Topic 860): Reconsideration of Effective Control for Repurchase Agreements,” which removes the requirement to consider whether sufficient collateral is held when determining whether to account for repurchase agreements and other agreements that both entitle and obligate the transferor to repurchase or redeem financial assets before their maturity as sales or as secured financings. This guidance is effective for interim and annual reporting periods beginning on or after December 15, 2011 (January 1, 2012 for our company). The adoption of this new guidance did not have a material impact on our consolidated financial statements.
Recently Issued Accounting Guidance
Indefinite-Lived Assets Impairment Testing
In July 2012, the FASB issued Update No. 2012-02,“Testing Indefinite-Lived Intangible Assets for Impairment,” which permits entities to make a qualitative assessment of whether it is more likely than not that an indefinite-lived asset is impaired. If an entity concludes that it is more likely than not that the fair value of an indefinite-lived intangible asset is less than its carrying amount, it would not2014, and will be required to perform a quantitative assessment. The update also allows an entity the option to bypass the qualitative assessment for any indefinite-lived intangible asset in any period and proceed directly to performing the quantitative impairment test. This guidance is effective for annual and interim impairment tests performed for fiscal years beginning after September 15, 2012 (January 1, 2013 for our company) with early adoption permitted. The adoption of this new guidance will not have a material impact on our consolidated financial statements.
Disclosures about Offsetting Assets and Liabilities
In December 2011, the FASB issued Update No. 2011-11,“Disclosures about Offsetting Assets and Liabilities” (“Update No. 2011-11”), which enhance disclosures by requiring improved information about financial and derivative instruments that are either 1) offset (netting assets and liabilities) in accordance with Topic 210 “Balance Sheet,” and Topic 815, “Derivatives and Hedging or 2) subject to an enforceable master netting arrangement or similar agreement. This guidance is effective for interim and annual reporting periods beginning on or after January 1, 2013 (January 1, 2013 for our company), and requires retrospective disclosures for comparative periods presented.applied prospectively. We are currently evaluating the impact the new guidance will have on our consolidated financial statements.
Revenue Recognition In January 2013,May 2014, the FASB issued UpdateASU No. 2013-01,“Clarifying2014-09, “Revenue from Contracts with Customers (Topic 606)” (“ASU 2014-09”), which supersedes current revenue recognition guidance, including most industry-specific guidance. ASU 2014-09 requires a company to recognize revenue when it transfers promised goods or services to customers in an amount that reflects the Scopeconsideration to which the company expects to be entitled in exchange for those goods and services. The guidance also requires additional disclosures regarding the nature, amount, timing and uncertainty of Disclosures about Offsetting Assetsrevenue that is recognized. The guidance allows for either retrospective application to all periods presented or a modified retrospective approach, where the guidance would only be applied to existing contracts in effect at the adoption date and Liabilities,”which clarifies the scope of Update No. 2011-11 to include derivatives accounted for in accordance with Topic 815,“Derivatives and Hedging”, including bifurcated embedded derivatives, repurchase agreements and reverse repurchase agreements, and securities borrowing and securities lending transactions that are either offset or subject to an enforceable master netting arrangement or similar agreement. This guidancenew contracts going forward. ASU 2014-09 is effective for interimannual and annual reportinginterim periods beginning on or after January 1, 2013 (January 1, 2013 for our company), and requires retrospective disclosures for comparative periods presented.December 15, 2016. Early adoption is not permitted. We are currently evaluating the impact the new guidance will have on our consolidated financial statements.
Comprehensive IncomeRepurchase Agreements
In February 2013,June 2014, the FASB issued UpdateASU No. 2013-02, “Reporting of Amounts Reclassified Out of Accumulated Other Comprehensive Income2014-11, “Transfers and Servicing (Topic 860): Repurchase-to-Maturity Transactions, Repurchase Financings, and Disclosures” (“ASU 2014-11”), amending FASB Accounting Standards Codification Topic 860, “Transfers and Servicing.”which require an entity to provide information about The amended guidance changes the amounts reclassified out of accumulated other comprehensive income by component. In addition, an entity is required to present, either on the face of the statement where net income is presented or in the notes, significant amounts reclassified out of accumulated other comprehensive income by the respective line items of net income but only if the amount reclassified is required under U.S. GAAP to be reclassified to net income in its entirety in the same reporting period. For other amountsaccounting for repurchase-to-maturity transactions and repurchase financing arrangements. The guidance also requires new disclosures for certain transfers accounted for as sales and collateral supporting transactions that are not required under U.S. GAAP to be reclassified in their entirety to net income, an entity is required to cross-reference to other disclosures required under U.S. GAAP that provide additional detail about those amounts. This guidanceaccounted for as secured borrowings. ASU 2014-11 is effective for interimannual and annual reportinginterim periods beginning after December 15, 2012 (January 1, 20132014, except for our company)the disclosures related to secured borrowings, which are effective for annual periods beginning after December 15, 2014, and for interim periods beginning after March 15, 2015. The adoption of ASU 2014-11 is not expected to have a material impact on the Company’s results of operations or financial position, but may impact the Company’s disclosures.
Pushdown Accounting
In November 2014, the FASB issued ASU 2014-17, “Business Combinations (Topic 805): Pushdown Accounting,” to provide companies with the option to apply pushdown accounting in their separate financial statements upon occurrence of an event in which an acquirer obtains control of the acquired entity. The election to apply pushdown accounting can be made either in the period in which the change of control occurred, or in a subsequent period. If the election is made in a subsequent period, the application of this guidance would be considered a change in accounting principle. The amendments in this ASU are effective as of November 18, 2014. The adoption will not have a significant impact on the Company’s consolidated financial statements.
Consolidation
In February 2015, the Financial Accounting Standards Board (“FASB”) issued Accounting Standards Update (“ASU”) No. 2015-02, “Consolidation (Topic 810): Amendments to the Consolidation Analysis” (“ASU 2015-02”). ASU 2015-02 amends ASC 810 through targeted changes to the consolidation guidance for legal entities such as limited partnerships, limited liability corporations, and securitization structures. It is effective for annual and interim periods beginning after December 15, 2015. Early adoption is permitted. We are currently evaluating the impact of the newamended guidance will have on our consolidated financial statements.
Miller Buckfire & Co.Merchant Capital, LLC
On December 20, 2012,31, 2014, we acquired 100% of the ordinary members’ partnership interests in Miller Buckfire & Co. LLC (“Miller Buckfire”), anMerchant, a public finance investment banking firm. Miller Buckfire provides a full rangefirm headquartered in Montgomery, Alabama, which serves the Southeastern market. The strategic combination of investment banking advisory services, including financial restructuring, mergersour company and acquisitions, and debt and equity placements.
The aggregate consideration paid by usMerchant is expected to further strengthen our company’s position in several key underwriting markets in the Miller Buckfire acquisition included $7.3 million in cash, our initial investment of $28.0 million and common stock with a fair value of $21.7 million. The fair value of the common stock was determined using the market price of our common stock on the acquisition date. The acquisition of Miller Buckfire enables us to efficiently provide capital markets and investment banking services to clients with special financing needs, such as those historically provided by Miller Buckfire.
The acquisition was accounted for under the acquisition method of accounting in accordance with ASC 805 (“Topic 805 “Business Combinations.805”), “Business Combinations.” Accordingly, goodwill was measured as the excess of the acquisition-date fair value of the consideration transferred over the fair valueamount of acquisition-date identifiable assets acquired net of assumed liabilities. We recorded $57.7$15.0 million of goodwill as an asset in the consolidated statement of financial condition, which has been allocated to our company’s Institutional Group reporting segment. The allocation of the purchase price is preliminary and will be finalized upon completion of the analysis of the fair values of the net assets of Miller Buckfire as ofMerchant on December 20, 201231, 2014, and the identified intangible assets. The final goodwill and intangible assets recorded on the consolidated statement of financial condition
may differ from that reflected herein as a result of future measurement period adjustments and the recording of identified intangible assets.adjustments. In management’s opinion, the goodwill represents the value expected from the synergies created through the operational enhancement benefits that will result from the integration of Miller Buckfire’sMerchant’s business and the reputation and expertise of Miller BuckfireMerchant in the public finance space within the investment banking business. Goodwill will be deductible for federal income tax purposes.sector.
Pro forma information is not presented, because the acquisition is not considered to be material, as defined by the Securities and Exchange Commission (the “SEC”). The results of operations of Miller BuckfireMerchant have been included in our results prospectively from the date of acquisition.
East Shore Aircraft LLC1919 Investment Counsel & Trust Co., National Association
On December 21, 2012,November 7, 2014, we completed the acquisition of East Shore. East Shore was initially formed1919 Investment Counsel, and 1919 an asset management firm and trust company that provides customized investment advisory and trust services, on a discretionary basis, to acquire fifteen Boeing 757-200 aircraft from UAL in sale-leaseback transactions with UAL. The purchase price of $112.9 million was financed through a combination of existing cashindividuals, families, and institutions throughout the issuance of non-recourse debt. We will collect 100% of the monthly lease payments with approximately 65% allocated to pay interest first then principal on non-recourse debt. In addition, as each aircraft is sold at the various lease expiration dates a portion of the proceeds will be applied to the principal balance of the non-recourse debt.country.
The acquired assets consisted primarily of direct financing leases and operating leases. The purchaseacquisition was accounted for under the acquisition method of accounting in accordance with ASC 805 (“Topic 805.805”), “Business Combinations.” Accordingly, goodwill was measured as the purchase price wasexcess of the acquisition-date fair value of the consideration transferred over the amount of acquisition-date identifiable assets acquired net of assumed liabilities. We recorded $13.8 million of goodwill as an asset in the consolidated statement of financial condition, which has been allocated to the acquired assets and liabilities assumed based on their estimated fair values as of the acquisition date.our company’s Global Wealth Management segment. The allocation of the purchase price based onis preliminary and will be finalized upon completion of the analysis of the fair values of the net assets acquiredof 1919 Investment Counsel on November 7, 2014, and liabilities assumed resulted in no goodwill orthe identified intangible assets.
Identifiable intangible assets being recorded.purchased by our company consisted of customer relationships with estimated acquisition-date fair value of $6.7 million.
The final goodwill and intangible assets recorded on the consolidated statement of financial condition may differ from that reflected herein as a result of future measurement period adjustments. In management’s opinion, the goodwill represents the value expected from the synergies created through the operational enhancement benefits that will result from the integration of 1919 Investment Counsel’s business and the reputation and expertise of 1919 Investment Counsel in the asset management sector and as a trust company.
On November 7, 2014, certain employees were granted restricted stock or restricted stock units of our company as retention. The fair value of the awards issued as retention was $11.2 million. There are no continuing service requirements associated with these restricted stock units, and accordingly, they were expensed at date of grant. This charge is included in compensation and benefits in the consolidated statement of operations for the year ended December 31, 2014. In addition, we have paid $10.8 million in the form of notes to associates for retention. These notes will be forgiven by a charge to compensation and benefits over a five- to ten-year period if the individual satisfies certain conditions, usually based on continued employment and certain performance standards.
Pro forma information is not presented, because the acquisition is not considered to be material, as defined by the SEC. The results of operations of East Shore1919 Investment Counsel have been included in our results prospectively from the date of acquisition.
Oriel Securities
On July 31, 2014, we completed the acquisition of Oriel, a London-based stockbroking and investment banking firm. The combination of our company and Oriel has created a significant middle-market investment banking group in London, with broad research coverage across most sectors of the economy, equity and debt sales and trading, and investment banking services.
The acquisition was accounted for under the acquisition method of accounting in accordance with ASC 805 (“Topic 805”), “Business Combinations.” Accordingly, goodwill was measured as the excess of the acquisition-date fair value of the consideration transferred over the amount of acquisition-date identifiable assets acquired net of assumed liabilities. We recorded $18.7 million of goodwill as an asset in the consolidated statement of financial condition, which has been allocated to our company’s Institutional Group segment. The allocation of the purchase price is preliminary and will be finalized upon completion of the analysis of the fair values of the net assets of Oriel on July 31, 2014, and identifiable intangible assets. Identifiable intangible assets purchased by our company consisted of trade name and non-compete agreements with estimated acquisition-date fair values of $1.9 million and $1.4 million, respectively.
The final goodwill and intangible assets recorded on the consolidated statement of financial condition may differ from that reflected herein as a result of future measurement period adjustments. In management’s opinion, the goodwill represents the value expected from the synergies created through the operational enhancement benefits that will result from the integration of Oriel’s business and the reputation and expertise of Oriel in the investment banking sector in the United Kingdom.
On July 31, 2014, certain employees were granted restricted stock or restricted stock units of our company as retention. The fair value of the awards issued as retention was $6.8 million. There are no continuing service requirements associated with these restricted stock units, and accordingly, they were expensed at date of grant. This charge is included in compensation and benefits in the consolidated statement of operations for the year ended December 31, 2014.
Pro forma information is not presented, because the acquisition is not considered to be material, as defined by the SEC. The results of operations of Oriel have been included in our results prospectively from the date of acquisition.
De La Rosa & Co.
On April 3, 2014, we acquired De La Rosa, a California-based public finance investment banking boutique. The addition of the De La Rosa team is expected to further strengthen our company’s position in a number of key underwriting markets in California.
The acquisition was accounted for under the acquisition method of accounting in accordance with ASC 805 (“Topic 805”), “Business Combinations.” Accordingly, goodwill was measured as the excess of the acquisition-date fair value of the consideration transferred over the amount of acquisition-date identifiable assets acquired net of assumed liabilities. We recorded $17.4 million of goodwill as an asset in the consolidated statement of financial condition, which has been allocated to our company’s Institutional Group segment. The allocation of the purchase price is preliminary and will be finalized upon completion of the analysis of the fair values of the net assets of De La Rosa on April 3, 2014, and identifiable intangible assets. Identifiable intangible assets purchased by our company consisted of customer relationships and trade name with estimated acquisition-date fair values of $0.2 million and $1.8 million, respectively.
The final goodwill and intangible assets recorded on the consolidated statement of financial condition may differ from that reflected herein as a result of future measurement period adjustments. In management’s opinion, the goodwill represents the value expected from the synergies created through the operational enhancement benefits that will result from the integration of De La Rosa’s business and the reputation and expertise of De La Rosa in the investment banking sector.
Pro forma information is not presented, because the acquisition is not considered to be material, as defined by the SEC. The results of operations of De La Rosa have been included in our results prospectively from the date of acquisition.
Acacia Federal Savings Bank (“Acacia Federal”)
On October 31, 2013, Stifel Bank completed its acquisition of Acacia Federal Savings Bank, a federally chartered savings institution with one retail branch.
Under the agreement, we acquired approximately $337.1 million of loans and $180.4 million of other assets (primarily cash and due from banks and investment securities). In addition, we assumed approximately $435.4 million of deposits and $10.0 million of other liabilities. Assets acquired and liabilities assumed were recorded at fair value in accordance with ASC 805, “Business Combinations.” The fair values for loans were estimated using discounted cash flow analyses using interest rates currently being offered for loans with similar terms. This value was reduced by an estimate of probable losses and the credit risk associated with the loans. The fair values of deposits were estimated by discounting cash flows using interest rates currently being offered on deposits with similar maturities.
We recognized a $7.6 million bargain purchase gain during the year ended December 31, 2013, which is included in other income in the consolidated statements of operations.
Pro forma information is not presented, because the acquisition is not considered to be material, as defined by the SEC. The results of operations of Acacia Federal have been included in our results prospectively from the date of acquisition.
Ziegler Capital Management, LLC
On November 30, 2013, we acquired ZCM, an asset management firm that provides investment solutions for institutions, mutual fund sub-advisory clients, municipalities, pension plans, Taft-Hartley plans, and individual investors.
The acquisition was accounted for under the acquisition method of accounting in accordance with ASC 805 (“Topic 805”), “Business Combinations.” Accordingly, goodwill was measured as the excess of the acquisition-date fair value of the consideration transferred over the amount of acquisition-date identifiable assets acquired net of assumed liabilities. We recorded $6.8 million of goodwill as an asset in the consolidated statement of financial condition, which has been allocated to our company’s Global Wealth Management segment.
Identifiable intangible assets purchased by our company consisted of customer relationships and trade name with estimated acquisition-date fair values of $3.4 million and $0.1 million, respectively.
In management’s opinion, the goodwill represents the value expected from the synergies created through the operational enhancement benefits that will result from the integration of ZCM’s business and the reputation and expertise of ZCM in the asset management sector.
Pro forma information is not presented, because the acquisition is not considered to be material, as defined by the SEC. The results of operations of ZCM have been included in our results prospectively from the date of acquisition.
KBW, Inc.
On February 15, 2013, we completed the purchase of all of the outstanding shares of common stock of KBW, Inc. (“KBW, Inc.”), a full-service investment bank specializing in the financial services industry based in New York, New York. The purchase was completed pursuant to the merger agreement dated November 5, 2012. Under the terms of the merger agreement, each share of common stock, including certain restricted stock, of KBW, Inc. issued and outstanding immediately prior to the effective time of the merger was cancelled and converted into the right to receive a combination of (i) cash consideration of $8.00 ($10.00 less the extraordinary dividend amount of $2.00) and (ii) stock consideration of 0.2143 a share of our common stock.
In conjunction with the close of the merger, we issued 6.7 million shares of common stock to holders of KBW, Inc. common stock, issued 2.2 million restricted stock awards to KBW, Inc. employees, and paid $253.0 million in cash.
The acquisition was accounted for under the acquisition method of accounting in accordance with Topic 805, “Business Combinations.” Accordingly, goodwill was measured as the excess of the acquisition-date fair value of the consideration transferred over the amount of acquisition-date identifiable assets acquired net of assumed liabilities. We recorded $288.3 million of goodwill as an asset in the consolidated statement of financial condition, which has been allocated to our company’s Institutional Group segment. In management’s opinion, the goodwill represents the value expected from the synergies created through the operational enhancement benefits that will result from the integration of KBW, Inc.’s business and the reputation and expertise of KBW, Inc. in the financial services sector. Identifiable intangible assets purchased by our company consisted of customer relationships, trade name, and investment banking backlog with acquisition-date fair values of $11.0 million, $9.0 million, and $4.0 million, respectively.
Under Topic 805, merger-related transaction costs (such as advisory, legal, valuation, and other professional fees) are not included as components of consideration transferred but are accounted for as expenses in the periods in which the costs are incurred. Transaction costs of $9.8 million were incurred during the year ended December 31, 2013, and are included in other operating expenses in the consolidated statement of operations.
In addition, on February 15, 2013, certain employees were granted restricted stock or restricted stock units of our company as retention. The fair value of the awards issued as retention was $30.6 million. There are no continuing service requirements associated with these restricted stock units, and accordingly, they were expensed at date of grant. This charge is included in compensation and benefits in the consolidated statement of operations for the year ended December 31, 2013.
The following unaudited pro forma financial information presents the combined results of operations as if the merger had occurred on January 1, 2012. The pro forma financial information does not reflect the costs of any integration activities. The pro forma results include estimates and assumptions, which management believes are reasonable. The unaudited pro forma financial information below is not necessarily indicative of either future results of operations or results that might have been achieved had KBW, Inc. been combined with us as of the beginning of 2012.
| (000s except per share amounts, unaudited) | 2012 | |||
Total net revenues | $ | 1,857,913 | ||
Net income | 112,531 | |||
Income per share: | ||||
Basic | $ | 1.86 | ||
Diluted | $ | 1.56 | ||
Stone & Youngberg LLC
On October 1, 2011, we acquired Stone & Youngberg, a leading financial services firm specializing in municipal finance and fixed income securities. The purchase consideration consisted of cash, a portion paid at closing and $24.0 million to be paid in installments over the next three years, and common stock. In addition, we may be required to pay a contingent earn-out over a five yearfive-year period after the closing, which is capped at $25.0 million, based upon revenue goals, as established in the purchase agreement.
The fair value of the common stock was determined using the market price of our common stock on the acquisition date. Stone & Youngberg’s comprehensive institutional group expanded our public finance, institutional sales and trading and bond underwriting, particularly in the Arizona and California markets, and expanded our Private Client Group.
We recognized a liability of $23.5 million for estimated earn-out payments over the five-year period. Additionally, we recognized a liability for the installment payments to be made over the next three years. In December 2012, we paid the first of three installment payments of $7.0 million.year. The liability for the estimated installment payments was $17.0and earn-out payments were $8.0 million and $16.8 million, respectively, at December 31, 2012.2014. These liabilities are included in accounts payable and accrued expenses in the consolidated statements of financial condition.
Thomas Weisel Partners Group, Inc.
On July 1, 2010, we completed the purchase of all the outstanding shares of common stock of TWPG, an investment banking firm based in San Francisco, California. The purchase was completed pursuant to the merger agreement dated April 25, 2010. We issued shares of common stock, including exchangeable shares, to holders of TWPG common stock and restricted stock units to employees of TWPG as consideration for the merger. The fair value of the common stock and restricted stock units was determined using the market price of our common stock on the date of the merger.
The following unaudited pro forma financial information presents the combined results of operations as if the merger had occurred on January 1, 2010. Pro forma results have been prepared by adjusting our historical results to include TWPG’s results of operations adjusted for the following changes: amortization expense adjusted as a result of acquisition-date fair value adjustments to intangible assets; interest expense adjusted for revised debt structures; and the income tax effect of applying our statutory tax rates to TWPG’s results. However, the information does not reflect the costs of any integration activities. The pro forma results include estimates and assumptions, which management believes are reasonable. The unaudited pro forma financial information below is not necessarily indicative of either future results of operations or results that might have been achieved had TWPG been combined with us as of the beginning of 2010.
| (000s, except per share amounts, unaudited) | 2010 | |||
Total net revenues | $ | 1,472,905 | ||
Net loss | (66,809 | ) | ||
Loss per share: | ||||
Basic | (1.38 | ) | ||
Diluted | (1.38 | ) | ||
UBS Wealth Management Americas Branch Network
On March 23, 2009, we announced that Stifel Nicolaus had entered into a definitive agreement with UBS Financial Services Inc. (“UBS”) to acquire certain specified branches from the UBS Wealth Management Americas branch network. As subsequently amended, we agreed to acquire 56 branches from UBS in four separate closings pursuant to this agreement. We completed the closings on the following dates: August 14, 2009, September 11, 2009, September 25, 2009, and October 16, 2009.
A contingent earn-out payment was payable over the two-year period following the closing based on the performance of the UBS financial advisors who joined Stifel Nicolaus. We recognized a liability of $9.7 million for estimated earn-out payments over the two-year period. The liability is included in accounts payable and accrued expenses in the consolidated statements of financial condition at December 31, 2011. The final earn-out payment of $ 9.2 million was made during the first quarter of 2012.
NOTE 4 –Sale of Bank Branch– Discontinued Operations
On April 30, 2010, Stifel Bank completed the sale of certain assets and the transfer of certain liabilities of Stifel Bank’s branch office, which resulted in a pre-tax loss of $0.4 million. As a result of the transaction, we sold $31.4 million of loans as well as certain other assets, including the building and office equipment of $0.7 million, and the buyer assumed $17.6 million of deposits.
The branch sale was not classified ascomponents of discontinued operations are as Stifel Bank has ongoing banking operations follows(in this market.thousands):
| Year Ended December 31, | ||||||||||||
| 2014 | 2013 | 2012 | ||||||||||
Net revenues | $ | (121 | ) | $ | 11,794 | $ | 18,537 | |||||
Restructuring expense | 217 | 6,881 | — | |||||||||
Operating expenses | 3,924 | 15,697 | 22,412 | |||||||||
|
|
|
|
|
| |||||||
Total non-interest expenses | 4,141 | 22,578 | 22,412 | |||||||||
Loss from discontinued operations before income taxes | (4,262 | ) | (10,784 | ) | (3,875 | ) | ||||||
Income tax expense/(benefit) | (1,199 | ) | 110 | 2,848 | ||||||||
|
|
|
|
|
| |||||||
Loss from discontinued operations, net of tax | $ | (3,063 | ) | $ | (10,894 | ) | $ | (6,723 | ) | |||
|
|
|
|
|
| |||||||
NOTE 5 – Receivables From and Payables to Brokers, Dealers, and Clearing Organizations
Amounts receivable from brokers, dealers, and clearing organizations at December 31, 20122014 and 2011,2013, included(in thousands):
| December 31, | December 31, | |||||||||||||||
| 2012 | 2011 | 2014 | 2013 | |||||||||||||
Deposits paid for securities borrowed | $ | 153,819 | $ | 193,509 | $ | 445,542 | $ | 227,640 | ||||||||
Receivable from clearing organizations | 115,996 | 43,642 | 198,079 | 125,538 | ||||||||||||
Securities failed to deliver | 6,409 | 15,485 | 7,453 | 27,944 | ||||||||||||
|
|
|
| |||||||||||||
| $ | 276,224 | $ | 252,636 | $ | 651,074 | $ | 381,122 | |||||||||
|
|
|
| |||||||||||||
Amounts payable to brokers, dealers, and clearing organizations at December 31, 20122014 and 2011,2013, included(in thousands):
| December 31, | December 31, | |||||||||||||||
| 2012 | 2011 | 2014 | 2013 | |||||||||||||
Securities failed to receive | $ | 7,365 | $ | 7,411 | ||||||||||||
Deposits received from securities loaned | $ | 19,218 | $ | 124,711 | 4,215 | 40,101 | ||||||||||
Payable to clearing organizations | 9,246 | 3,984 | 2,443 | 10,623 | ||||||||||||
Securities failed to receive | 4,747 | 11,216 | ||||||||||||||
|
|
|
| |||||||||||||
| $ | 33,211 | $ | 139,911 | $ | 14,023 | $ | 58,135 | |||||||||
|
|
|
| |||||||||||||
Deposits paid for securities borrowed approximate the market value of the securities. Securities failed to deliver and receive represent the contract value of securities that have not been delivered or received on settlement date.
NOTE 6 – Fair Value Measurements
We measure certain financial assets and liabilities at fair value on a recurring basis, including cash equivalents, trading securitiesfinancial instruments owned, available-for-sale securities, investments, trading securities sold, but not yet purchased, securitiesfinancial instruments sold, but not yet purchased, and derivatives.
The degree of judgment used in measuring the fair value of financial instruments generally correlates to the level of pricing observability. Pricing observability is impacted by a number of factors, including the type of financial instrument, whether the financial instrument is new to the market and not yet established, and the characteristics specific to the transaction. Financial instruments with readily available active quoted prices for which fair value can be measured from actively quoted prices generally will have a higher degree of pricing observability and a lesser degree of judgment used in measuring fair value. Conversely, financial instruments rarely traded or not quoted will generally have less, or no, pricing observability and a higher degree of judgment used in measuring fair value.
We generally utilize third-party pricing services to value Level 1 and Level 2 available-for-sale investment securities, as well as certain derivatives designated as cash flow hedges. We review the methodologies and assumptions used by the third-party pricing services and evaluate the values provided, principally by comparison with other available market quotes for similar instruments and/or analysis based on internal models using available third-party market data. We may occasionally adjust certain values provided by the third-party pricing service when we believe, as the result of our review, that the adjusted price most appropriately reflects the fair value of the particular security.
Following are descriptions of the valuation methodologies and key inputs used to measure financial assets and liabilities recorded at fair value. The descriptions include an indication of the level of the fair value hierarchy in which the assets or liabilities are classified.
Cash and Cash Equivalents
Cash equivalents include highly liquid investments with original maturities of three months or less. Due to their short-term nature, the carrying amount of these instruments approximates the estimated fair value. Actively traded money market funds are measured at their reported net asset value, which approximates fair value. As such, we classify the estimated fair value of these instruments as Level 1.
Financial Instruments (Trading securitiesOwned and available-for-sale securities)Available-For-Sale Securities
When available, the fair value of financial instruments areis based on quoted prices in active markets and reported in Level 1. Level 1 financial instruments include highly liquid instruments with quoted prices, such as equitiesequity securities listed in active markets, certain corporate obligations,fixed income securities, mortgage-backed securities, and U.S. treasurygovernment securities.
If quoted prices are not available for identical instruments, fair values are obtained from pricing services, broker quotes, or other model-based valuation techniques with observable inputs, such as the present value of estimated cash flows, and reported as Level 2. The nature of these financial instruments include instruments for which quoted prices are available but traded less frequently, instruments whose fair value havehas been derived using a model where inputs to the model are directly observable in the market, or can be derived principally from or corroborated by
observable market data, and instruments that are fair valued using other financial instruments, the parameters of which can be directly observed. Level 2 financial instruments generally include U.S. government securities, mortgage-backed securities, corporate obligations infrequently traded, certain government and municipal obligations, asset-backed securities, and certain equity securities not actively traded.
Securities classified as Level 3, of which the substantial majority is auction rate securities (“ARS”), represent securities in less liquid markets requiring significant management assumptions when determining fair value. Due to the lack of a robust secondary auction-rate securities market with active fair value indicators, fair value for all periods presented was determined using an income approach based on an internally developed discounted cash flow model. In addition to ARS, we have classified certain corporate obligations with unobservable pricing inputs and airplane trust certificates as Level 3. The methods used to value these securities are the same as the methods used to value ARS, discussed above.
Investments
Investments carried at fair value include ARS, investments in mutual funds, U.S. treasury securities, investments in public companies, private equity securities, partnerships, and warrants of public or private companies.
Investments in certain public companies, mutual funds and U.S. treasury securities are valued based on quoted prices in active markets and reported in Level 1. The fair value of our investment in the preferred stock of Knight Capital Corp. was derived using a model where inputs to the model are directly observable in the market, or can be derived principally from or corroborated by observable market data, and is classifiedinstruments that are fair valued using other financial instruments, the parameters of which can be directly observed. Level 2 financial instruments include U.S. government agency securities, mortgage-backed securities, corporate fixed income securities infrequently traded, state and municipal securities,asset-backed securities, and equity securities not actively traded.
We have identified Level 3 financial instruments to include certain corporate fixed income securities with unobservable pricing inputs and certain state and municipal securities, which include auction rate securities (“ARS”). Level 3 financial instruments have little to no pricing observability as Level 2.of the report date. These financial instruments do not have active two-way markets and are measured using management’s best estimate of fair value, where the inputs into the determination of fair value require significant management judgment or estimation. ARS are valued based upon our expectations of issuer redemptions and using internal discounted cash flow models that utilize unobservable inputs.
Investments
Investments carried at fair value primarily include corporate equity securities, ARS, investments in certainmutual funds, U.S. government securities, and investments in public companies, private equity securities, and partnerships, with unobservable inputswhich are classified as other in the following tables.
Corporate equity securities, mutual funds, and U.S. government securities are valued based on quoted prices in active markets and reported in Level 1.
ARS for which the market has been dislocated and largely ceased to function are reported as Level 3 assets. The methods used to value ARS are discussed above.
Investments in partnerships and other investments include our general and limited partnership interests in investment partnerships and direct investments in non-public companies. The net assets of investment partnerships consist primarily of investments in non-marketable securities. The value of these investments is at risk to changes in equity markets, general economic conditions, and a variety of other factors. We estimate fair value for private equity investments based on our percentage ownership in the net asset value of the entire fund, as reported by the fund or on behalf of the fund, after indication that the fund adheres to applicable fair value measurement guidance.
The valuation of these investments requires significant management judgment due to the absence of quoted market prices, inherent lack of liquidity, and long-term nature of these assets. As a result, these values cannot be determined with precision, and the calculated fair value estimates may not be realizable in a current sale or immediate settlement of the instrument.
For those funds where the net asset value is not reported by the fund, we derive the fair value of the fund by estimating the fair value of each underlying investment in the fund. In addition to using qualitative information about each underlying investment, as provided by the fund, we give consideration to information pertinent to the specific nature of the debt or equity investment, such as relevant market conditions, offering prices, operating results, financial conditions, exit strategy, and other qualitative information, as available. The lack of an independent source to validate fair value estimates, including the impact of future capital calls and transfer restrictions, is an inherent limitation in the valuation process. Commitments to fund additional investments in nonmarketable equity securities recorded at fair value were $3.0$11.5 million and $4.0$12.4 million at December 31, 20122014 and 2011,2013, respectively.
SecuritiesFinancial Instruments Sold, But Not Yet Purchased
Equity securities that are valuedFinancial instruments sold, but not purchased, recorded at fair value based on quoted prices in active markets and other observable market data include highly liquid instruments with quoted prices, such as U.S. government securities, corporate fixed income securities, and equity securities listed in active markets, which are reported inas Level 1.
If quoted prices are not available, fair values are obtained from pricing services, broker quotes, or other model-based valuation techniques with observable inputs, such as the present value of estimated cash flows, and reported as Level 2. The nature of these financial instruments include instruments for which quoted prices are available but traded less frequently, instruments whose fair value has been derived using a model where inputs to the model are directly observable in the market, or can be derived principally from or corroborated by observable market data, and instruments that are fair valued using other financial instruments, the parameters of which can be directly observed. Level 2 financial instruments include U.S. government agency securities, mortgage-backed securities not actively traded, and corporate fixed income securities.
Derivatives
Derivatives are valued using quoted market prices for identical instruments when available or pricing models based on the net present value of estimated future cash flows. The valuation models used require market observable inputs, including contractual terms, market prices, yield curves, credit curves, and measures of volatility. We manage credit risk for our derivative positions on a counterparty-by-counterparty basis and calculate credit valuation adjustments, included in the fair value of these instruments, on the basis of our relationships at the counterparty portfolio/master netting agreement level. These credit valuation adjustments are determined by applying a credit spread for the counterparty to the total expected exposure of the derivative after considering collateral and other master netting arrangements. We have classified our interest rate swaps as Level 2.
Assets and liabilities measured at fair value on a recurring basis as of December 31, 2012 and 20112014, are presented below:
| December 31, 2012 | December 31, 2014 | |||||||||||||||||||||||||||||||
| Total | Level 1 | Level 2 | Level 3 | Total | Level 1 | Level 2 | Level 3 | |||||||||||||||||||||||||
Assets: | ||||||||||||||||||||||||||||||||
Cash equivalents | $ | 72,596 | $ | 72,596 | $ | — | $ | — | $ | 122,875 | $ | 122,875 | $ | — | $ | — | ||||||||||||||||
Trading securities owned: | ||||||||||||||||||||||||||||||||
Financial instruments owned: | ||||||||||||||||||||||||||||||||
U.S. government securities | 58,992 | 58,992 | — | — | ||||||||||||||||||||||||||||
U.S. government agency securities | 123,758 | — | 123,758 | — | 101,439 | — | 101,439 | — | ||||||||||||||||||||||||
U.S. government securities | 3,573 | 3,573 | — | — | ||||||||||||||||||||||||||||
Mortgage-backed securities: | ||||||||||||||||||||||||||||||||
Agency | 159,057 | — | 159,057 | — | ||||||||||||||||||||||||||||
Non-agency | 13,366 | 189 | 12,371 | 806 | ||||||||||||||||||||||||||||
Corporate securities: | ||||||||||||||||||||||||||||||||
Fixed income securities | 396,878 | 66,795 | 329,500 | 583 | 245,909 | 75,236 | 168,680 | 1,993 | ||||||||||||||||||||||||
Equity securities | 35,472 | 33,650 | 1,822 | — | 77,548 | 76,316 | 88 | 1,144 | ||||||||||||||||||||||||
State and municipal securities | 203,927 | — | 203,927 | — | 130,544 | — | 130,544 | — | ||||||||||||||||||||||||
|
|
|
|
|
|
|
| |||||||||||||||||||||||||
Total trading securities owned | 763,608 | 104,018 | 659,007 | 583 | ||||||||||||||||||||||||||||
Total financial instruments owned | 786,855 | 210,733 | 572,179 | 3,943 | ||||||||||||||||||||||||||||
Available-for-sale securities: | ||||||||||||||||||||||||||||||||
U.S. government agency securities | 1,113 | — | 1,113 | — | 1,610 | — | 1,610 | — | ||||||||||||||||||||||||
State and municipal securities | 157,420 | — | 66,933 | 90,487 | 74,401 | — | 74,401 | — | ||||||||||||||||||||||||
Mortgage-backed securities: | ||||||||||||||||||||||||||||||||
Agency | 684,848 | — | 684,848 | — | 209,206 | — | 209,206 | — | ||||||||||||||||||||||||
Commercial | 260,974 | — | 260,974 | — | 107,644 | — | 107,644 | — | ||||||||||||||||||||||||
Non-agency | 13,878 | — | 13,878 | — | 3,137 | — | 3,137 | — | ||||||||||||||||||||||||
Corporate fixed income securities | 480,182 | 263,017 | 217,165 | — | 337,406 | 50,892 | 286,514 | — | ||||||||||||||||||||||||
Asset-backed securities | 26,753 | — | 26,753 | — | 780,074 | — | 736,029 | 44,045 | ||||||||||||||||||||||||
|
|
|
|
|
|
|
| |||||||||||||||||||||||||
Total available-for-sale securities | 1,625,168 | 263,017 | 1,271,664 | 90,487 | 1,513,478 | 50,892 | 1,418,541 | 44,045 | ||||||||||||||||||||||||
Investments: | ||||||||||||||||||||||||||||||||
Corporate equity securities | 32,162 | 32,162 | — | — | 59,203 | 35,123 | 24,080 | — | ||||||||||||||||||||||||
Corporate preferred securities | 56,970 | — | 56,970 | — | ||||||||||||||||||||||||||||
Mutual funds | 18,021 | 18,021 | — | — | 18,144 | 18,144 | — | — | ||||||||||||||||||||||||
U.S. government securities | 7,069 | 7,069 | — | — | 6,555 | 104 | 6,451 | — | ||||||||||||||||||||||||
Auction rate securities: | ||||||||||||||||||||||||||||||||
Equity securities | 64,397 | — | — | 64,397 | 46,197 | — | — | 46,197 | ||||||||||||||||||||||||
Municipal securities | 14,067 | — | — | 14,067 | 1,326 | — | — | 1,326 | ||||||||||||||||||||||||
Other | 43,748 | 1,620 | 4,831 | 37,297 | ||||||||||||||||||||||||||||
Other1 | 78,830 | 1,283 | 4,557 | 72,990 | ||||||||||||||||||||||||||||
|
|
|
|
|
|
|
| |||||||||||||||||||||||||
Total investments | 236,434 | 58,872 | 61,801 | 115,761 | 210,255 | 54,654 | 35,088 | 120,513 | ||||||||||||||||||||||||
|
|
|
|
|
|
|
| |||||||||||||||||||||||||
| $ | 2,697,806 | $ | 498,503 | $ | 1,992,472 | $ | 206,831 | $ | 2,633,463 | $ | 439,154 | 2,025,808 | $ | 168,501 | ||||||||||||||||||
|
|
|
|
|
|
|
| |||||||||||||||||||||||||
Liabilities: | ||||||||||||||||||||||||||||||||
Trading securities sold, but not yet purchased: | ||||||||||||||||||||||||||||||||
U.S. government securities | $ | 162,661 | $ | 162,661 | $ | — | $ | — | ||||||||||||||||||||||||
U.S. government agency securities | 15 | — | 15 | — | ||||||||||||||||||||||||||||
Corporate securities: | ||||||||||||||||||||||||||||||||
Fixed income securities | 150,698 | 46,274 | 104,424 | — | ||||||||||||||||||||||||||||
Equity securities | 6,281 | 5,936 | 345 | — | ||||||||||||||||||||||||||||
State and municipal securities | 87 | — | 87 | — | ||||||||||||||||||||||||||||
|
|
|
| |||||||||||||||||||||||||||||
Total trading securities sold, but not yet purchased | 319,742 | 214,871 | 104,871 | — | ||||||||||||||||||||||||||||
Securities sold, but not yet purchased | 22,966 | 22,966 | — | — | ||||||||||||||||||||||||||||
Derivative contracts(1) | 19,934 | — | 19,934 | — | ||||||||||||||||||||||||||||
|
|
|
| |||||||||||||||||||||||||||||
| $ | 362,642 | $ | 237,837 | $ | 124,805 | $ | — | |||||||||||||||||||||||||
|
|
|
| |||||||||||||||||||||||||||||
| Includes $42.1 million of partnership interests, $16.4 million of private company investments, and $14.3 million of private equity and other investments. |
Liabilities: Financial instruments sold, but not yet purchased: U.S. government securities U.S. government agency securities Mortgage-backed securities: Agency Non-agency Corporate securities: Fixed income securities Equity securities Total financial instruments sold, but not yet purchased Derivative contracts2 December 31, 2014 Total Level 1 Level 2 Level 3 $ 146,592 $ 146,592 $ — $ — 10,029 — 10,029 — 28,067 — 28,067 — 4,556 401 4,155 — 293,008 17,116 275,892 — 105,013 105,013 — — 587,265 269,122 318,143 — 5,641 — 5,641 — $ 592,906 $ 269,122 $ 323,784 $ —
| 2 | Included in accounts payable and accrued expenses in the consolidated statements of financial condition. |
Assets: Cash equivalents Trading securities owned: U.S. government agency securities U.S. government securities Corporate securities: Fixed income securities Equity securities State and municipal securities Total trading securities owned Available-for-sale securities: U.S. government agency securities State and municipal securities Mortgage-backed securities: Agency Commercial Non-agency Corporate fixed income securities Asset-backed securities Total available-for-sale securities Investments: Corporate equity securities Mutual funds Auction rate securities: Equity securities Municipal securities Other Total investments Liabilities: Trading securities sold, but not yet purchased: U.S. government securities U.S. government agency securities Corporate securities: Fixed income securities Equity securities State and municipal securities Total trading securities sold, but not yet purchased Securities sold, but not yet purchased Derivative contracts(1) December 31, 2011 Total Level 1 Level 2 Level 3 $ 14,156 $ 14,156 $ — $ — 66,424 — 66,424 — 32,845 32,845 — — 244,535 31,398 209,395 3,742 19,859 19,506 353 — 111,288 — 111,288 — 474,951 83,749 387,460 3,742 1,103 — 1,103 — 86,932 — 20,036 66,896 404,662 — 404,662 — 271,510 — 271,510 — 17,460 — 17,460 — 405,985 153,855 240,130 12,000 26,489 — 26,489 — 1,214,141 153,855 981,390 78,896 23,921 23,921 — — 33,958 33,958 — — 103,176 — — 103,176 11,729 — — 11,729 38,424 1,055 336 37,033 211,208 58,934 336 151,938 $ 1,914,456 $ 310,694 $ 1,369,186 $ 234,576 $ 109,776 $ 109,776 $ — $ — 954 — 954 — 149,460 74,719 74,741 — 6,060 6,019 41 — 583 — 583 — 266,833 190,514 76,319 — 19,223 19,223 — — 24,877 — 24,877 — $ 310,933 $ 209,737 $ 101,196 $ —
Assets and liabilities measured at fair value on a recurring basis as of December 31, 2013, are presented below:
| December 31, 2013 | ||||||||||||||||
| Total | Level 1 | Level 2 | Level 3 | |||||||||||||
Assets: | ||||||||||||||||
Cash equivalents | $ | 78,163 | $ | 78,163 | $ | — | $ | — | ||||||||
Financial instruments owned: | ||||||||||||||||
U.S. government securities | 10,594 | 10,594 | — | — | ||||||||||||
U.S. government agency securities | 80,835 | 307 | 80,528 | — | ||||||||||||
Mortgage-backed securities: | ||||||||||||||||
Agency | 267,933 | — | 267,933 | — | ||||||||||||
Non-agency | 22,570 | — | 22,570 | — | ||||||||||||
Corporate securities: | ||||||||||||||||
Fixed income securities | 201,579 | 23,106 | 176,434 | 2,039 | ||||||||||||
Equity securities | 76,709 | 76,462 | 6 | 241 | ||||||||||||
State and municipal securities | 141,274 | — | 141,274 | — | ||||||||||||
|
|
|
|
|
|
|
| |||||||||
Total financial instruments owned | 801,494 | 110,469 | 688,745 | 2,280 | ||||||||||||
Available-for-sale securities: | ||||||||||||||||
U.S. government agency securities | 1,072 | — | 1,072 | — | ||||||||||||
State and municipal securities | 90,677 | — | 84,477 | 6,200 | ||||||||||||
Mortgage-backed securities: | ||||||||||||||||
Agency | 183,987 | — | 183,987 | — | ||||||||||||
Commercial | 211,246 | — | 211,246 | — | ||||||||||||
Non-agency | 4,619 | — | 4,619 | — | ||||||||||||
Corporate fixed income securities | 498,316 | 83,655 | 414,661 | — | ||||||||||||
Asset-backed securities | 766,336 | — | 708,258 | 58,078 | ||||||||||||
|
|
|
|
|
|
|
| |||||||||
Total available-for-sale securities | 1,756,253 | 83,655 | 1,608,320 | 64,278 | ||||||||||||
Investments: | ||||||||||||||||
Corporate equity securities | 32,402 | 32,402 | — | — | ||||||||||||
Mutual funds | 16,994 | 16,994 | — | — | ||||||||||||
Auction rate securities: | ||||||||||||||||
Equity securities | 56,693 | — | — | 56,693 | ||||||||||||
Municipal securities | 10,939 | — | — | 10,939 | ||||||||||||
Other1 | 100,200 | 10 | 2,422 | 97,768 | ||||||||||||
|
|
|
|
|
|
|
| |||||||||
Total investments | 217,228 | 49,406 | 2,422 | 165,400 | ||||||||||||
|
|
|
|
|
|
|
| |||||||||
| $ | 2,853,138 | $ | 321,693 | $ | 2,299,487 | $ | 231,958 | |||||||||
|
|
|
|
|
|
|
| |||||||||
Liabilities: | ||||||||||||||||
Financial instruments sold, but not yet purchased: | ||||||||||||||||
U.S. government securities | $ | 253,221 | $ | 253,221 | $ | — | $ | — | ||||||||
Agency mortgage-backed securities | 37,201 | — | 37,201 | — | ||||||||||||
Corporate securities: | ||||||||||||||||
Fixed income securities | 100,745 | 17,857 | 82,888 | — | ||||||||||||
Equity securities | 90,015 | 86,933 | 3,082 | — | ||||||||||||
State and municipal securities | 32 | — | 32 | — | ||||||||||||
|
|
|
|
|
|
|
| |||||||||
Total financial instruments sold, but not yet purchased | 481.214 | 358,011 | 123,203 | — | ||||||||||||
Derivative contracts2 | 9,349 | — | 9,349 | — | ||||||||||||
|
|
|
|
|
|
|
| |||||||||
| $ | 490,563 | $ | 358,011 | $ | 132,552 | $ | — | |||||||||
|
|
|
|
|
|
|
| |||||||||
| Includes $56.0 million of partnership interests, $22.5 million of private company investments, and $19.2 million of private equity and other investments. |
Included in accounts payable and accrued expenses in the consolidated statements of financial condition. |
The following table summarizes the changes in fair value carrying values associated with Level 3 financial instruments during the years ended December 31, 20122014 and 20112013(in (in thousands):
| Year Ended December 31, 2012 | Year Ended December 31, 2014 | |||||||||||||||||||||||||||||||||||||||
| Available-for-sale securities | Investments | Financial instruments owned | Available- for-sale securities | |||||||||||||||||||||||||||||||||||||
| Corporate Fixed Income Securities(1) | State & Municipal Securities | Corporate Fixed Income Securities | Auction Rate Securities – Equity | Auction Rate Securities – Municipal | Other | Mortgage- Backed Securities – Non-Agency | Corporate Fixed Income Securities | Equity Securities | State & Municipal Securities | |||||||||||||||||||||||||||||||
Balance at December 31, 2011 | $ | 3,742 | $ | 66,896 | $ | 12,000 | $ | 103,176 | $ | 11,729 | $ | 37,033 | ||||||||||||||||||||||||||||
|
|
|
|
|
| |||||||||||||||||||||||||||||||||||
Balance at December 31, 2013 | $ | — | $ | 2,039 | $ | 241 | $ | 6,200 | ||||||||||||||||||||||||||||||||
Unrealized gains/(losses): | ||||||||||||||||||||||||||||||||||||||||
Included in changes in net assets (2) | 42 | — | — | 21 | (207 | ) | 2,290 | |||||||||||||||||||||||||||||||||
Included in OCI(3) | — | (1,779 | ) | — | — | — | — | |||||||||||||||||||||||||||||||||
Realized gains(2) | 282 | 230 | — | — | — | 2,267 | ||||||||||||||||||||||||||||||||||
Included in changes in net assets 2 | (127 | ) | (445 | ) | (494 | ) | — | |||||||||||||||||||||||||||||||||
Included in OCI3 | — | — | — | 62 | ||||||||||||||||||||||||||||||||||||
Realized gains/(losses) 2 | 13 | (1,320 | ) | 4,965 | — | |||||||||||||||||||||||||||||||||||
Purchases | 27,337 | 47,840 | — | 3,400 | 6,750 | 1,672 | — | 8,549 | 1,394 | — | ||||||||||||||||||||||||||||||
Sales | (25,663 | ) | — | — | — | — | (5,965 | ) | — | (5,783 | ) | (5,205 | ) | — | ||||||||||||||||||||||||||
Redemptions | (443 | ) | (22,700 | ) | (12,000 | ) | (42,200 | ) | (4,205 | ) | — | (44 | ) | (88 | ) | — | — | |||||||||||||||||||||||
Transfers: | ||||||||||||||||||||||||||||||||||||||||
Into Level 3 | 2,687 | — | — | — | — | — | 964 | — | 243 | — | ||||||||||||||||||||||||||||||
Out of Level 3 | (7,401 | ) | — | — | — | — | — | — | (959 | ) | — | (6,262 | ) | |||||||||||||||||||||||||||
|
|
|
|
|
|
|
|
|
| |||||||||||||||||||||||||||||||
Net change | (3,159 | ) | 23,591 | (12,000 | ) | (38,779 | ) | 2,338 | 264 | 806 | (46 | ) | 903 | (6,200 | ) | |||||||||||||||||||||||||
|
|
|
|
|
|
|
|
|
| |||||||||||||||||||||||||||||||
Balance at December 31, 2012 | $ | 583 | $ | 90,487 | $ | — | $ | 64,397 | $ | 14,067 | $ | 37,297 | ||||||||||||||||||||||||||||
Balance at December 31, 2014 | $ | 806 | $ | 1,993 | $ | 1,144 | $ | — | ||||||||||||||||||||||||||||||||
|
|
|
|
|
|
|
|
|
| |||||||||||||||||||||||||||||||
| Year Ended December 31, 2014 | ||||||||||||||||||||||||||||||||||||||||
| Available- for-sale securities | Investments | |||||||||||||||||||||||||||||||||||||||
| Asset- Backed Securities | Auction Rate Securities – Equity | Auction Rate Securities – Municipal | Other1 | |||||||||||||||||||||||||||||||||||||
Balance at December 31, 2013 | $ | 58,078 | $ | 56,693 | $ | 10,939 | $ | 97,768 | ||||||||||||||||||||||||||||||||
Unrealized gains/(losses): | ||||||||||||||||||||||||||||||||||||||||
Included in changes in net assets 2 | — | 604 | 688 | (18 | ) | |||||||||||||||||||||||||||||||||||
Included in OCI3 | (530 | ) | — | — | ||||||||||||||||||||||||||||||||||||
Realized gains2 | 1,322 | — | — | 3,412 | ||||||||||||||||||||||||||||||||||||
Purchases | — | 25 | 1,650 | 3,630 | ||||||||||||||||||||||||||||||||||||
Sales | (4,825 | ) | (1,725 | ) | (10,324 | ) | (25,030 | ) | ||||||||||||||||||||||||||||||||
Redemptions | (10,000 | ) | (9,400 | ) | (1,627 | ) | (4,413 | ) | ||||||||||||||||||||||||||||||||
Transfers: | ||||||||||||||||||||||||||||||||||||||||
Into Level 3 | — | — | — | 1,524 | ||||||||||||||||||||||||||||||||||||
Out of Level 3 | — | — | — | (3,883 | ) | |||||||||||||||||||||||||||||||||||
|
|
|
| |||||||||||||||||||||||||||||||||||||
Net change | (14,033 | ) | (10,496 | ) | (9,613 | ) | (24,778 | ) | ||||||||||||||||||||||||||||||||
|
|
|
| |||||||||||||||||||||||||||||||||||||
Balance at December 31, 2014 | $ | 44,045 | $ | 46,197 | $ | 1,326 | $ | 72,990 | ||||||||||||||||||||||||||||||||
|
|
|
| |||||||||||||||||||||||||||||||||||||
|
Realized and unrealized gains/(losses) related to |
Unrealized gains/(losses) related to available-for-sale securities are reported in accumulated other comprehensive loss in the consolidated statements of financial condition. |
| Year Ended December 31, 2011 | Year Ended December 31, 2013 | |||||||||||||||||||||||||||||||||||||||||||
| Financial Assets | Financial Liabilities | Financial instruments owned | Available-for-sale securities | |||||||||||||||||||||||||||||||||||||||||
| Available-for-sale | Investments | Corporate Fixed Income Securities | Equity Securities | State & Municipal Securities | Asset- Backed Securities | |||||||||||||||||||||||||||||||||||||||
| Corporate Fixed Income Securities(1) | State and Municipal Securities | Corporate Fixed Income Securities | Auction Rate Securities – Equity | Auction Rate Securities – Municipal | Other | Corporate Fixed Income Securities (2) | ||||||||||||||||||||||||||||||||||||||
Balance at December 31, 2010 | $ | 40,243 | $ | 11,436 | $ | — | $ | 76,826 | $ | 6,533 | $ | 38,502 | $ | 4,685 | ||||||||||||||||||||||||||||||
|
|
|
|
|
|
| ||||||||||||||||||||||||||||||||||||||
Balance at December 31, 2012 | $ | 583 | $ | — | $ | 90,487 | $ | — | ||||||||||||||||||||||||||||||||||||
Unrealized gains/(losses): | ||||||||||||||||||||||||||||||||||||||||||||
Included in changes in net assets (3) | (288 | ) | — | — | (600 | ) | (189 | ) | 4,078 | — | ||||||||||||||||||||||||||||||||||
Included in OCI(4) | — | 3,085 | — | — | — | — | — | |||||||||||||||||||||||||||||||||||||
Realized gains/(losses)(3) | 371 | 881 | — | — | — | (1,126 | ) | (52 | ) | |||||||||||||||||||||||||||||||||||
Included in changes in net assets 2 | 779 | 1,333 | — | — | ||||||||||||||||||||||||||||||||||||||||
Included in OCI3 | — | — | (1,822 | ) | (233 | ) | ||||||||||||||||||||||||||||||||||||||
Realized gains2 | 281 | — | 2,053 | — | ||||||||||||||||||||||||||||||||||||||||
Purchases | 169,152 | 48,974 | 12,000 | 45,625 | 10,135 | 1,776 | 6,663 | 10,261 | 11,717 | 5,000 | — | |||||||||||||||||||||||||||||||||
Sales | (198,636 | ) | (24,126 | ) | — | — | (2,900 | ) | — | (11,296 | ) | (6,888 | ) | (208 | ) | — | — | |||||||||||||||||||||||||||
Redemptions | (871 | ) | (1,125 | ) | — | (18,675 | ) | (1,850 | ) | (6,437 | ) | — | (1,349 | ) | — | (32,000 | ) | — | ||||||||||||||||||||||||||
Transfers: | ||||||||||||||||||||||||||||||||||||||||||||
Into Level 3 | 35 | 27,854 | — | — | — | 240 | — | 139 | — | 6,201 | 58,311 | |||||||||||||||||||||||||||||||||
Out of Level 3 | (6,264 | ) | (83 | ) | — | — | — | — | — | (1,767 | ) | (12,601 | ) | (63,719 | ) | — | ||||||||||||||||||||||||||||
|
|
|
|
|
|
|
|
|
|
| ||||||||||||||||||||||||||||||||||
Net change | (36,501 | ) | 55,460 | 12,000 | 26,350 | 5,196 | (1,469 | ) | (4,685 | ) | 1,456 | 241 | (84,287 | ) | 58,078 | |||||||||||||||||||||||||||||
|
|
|
|
|
|
|
|
|
|
| ||||||||||||||||||||||||||||||||||
Balance at December 31, 2011 | $ | 3,742 | $ | 66,896 | $ | 12,000 | $ | 103,176 | $ | 11,729 | $ | 37,033 | $ | — | ||||||||||||||||||||||||||||||
Balance at December 31, 2013 | $ | 2,039 | $ | 241 | $ | 6,200 | $ | 58,078 | ||||||||||||||||||||||||||||||||||||
|
|
|
|
|
|
|
|
|
|
| ||||||||||||||||||||||||||||||||||
| Year Ended December 31, 2013 | ||||||||||||
| Investments | ||||||||||||
| Auction Rate Securities – Equity | Auction Rate Securities – Municipal | Other1 | ||||||||||
Balance at December 31, 2012 | $ | 64,397 | $ | 14,067 | $ | 37,297 | ||||||
Unrealized gains/(losses): | ||||||||||||
Included in changes in net assets 2 | 571 | 75 | 6,328 | |||||||||
Included in OCI3 | — | — | — | |||||||||
Realized gains2 | — | — | 13 | |||||||||
Purchases | 75 | — | 50,914 | |||||||||
Sales | — | — | (6,801 | ) | ||||||||
Redemptions | (8,350 | ) | (3,203 | ) | (2,584 | ) | ||||||
Transfers: | ||||||||||||
Into Level 3 | — | — | 12,601 | |||||||||
Out of Level 3 | — | — | — | |||||||||
|
|
|
|
|
| |||||||
Net change | (7,704 | ) | (3,128 | ) | 60,471 | |||||||
|
|
|
|
|
| |||||||
Balance at December 31, 2013 | $ | 56,693 | $ | 10,939 | $ | 97,768 | ||||||
|
|
|
|
|
| |||||||
|
|
Realized and unrealized gains/(losses) related to |
Unrealized gains/(losses) related to available-for-sale securities are reported in accumulated other comprehensive loss in the consolidated statements of financial condition. |
The results included in the table above are only a component of the overall investment strategies of our company. The table above does not present Level 1 or Level 2 valued assets or liabilities. The changes to our company’s Level 3 classified instruments were principally a result of: unrealized gains and losses and redemptions of ARS at par during the year ended December 31, 2012.2014. During the year ended December 31, 2013, financial instruments owned and investments acquired as part of the KBW merger that are classified as Level 3 totaled $54.1 million. The changes in unrealized gains/(losses) recorded in earnings for the year ended December 31, 20122014, relating to Level 3 assets still held at December 31, 20122014, were immaterial.
The following table summarizes quantitative information related to the significant unobservable inputs utilized in our company’s Level 3 recurring fair value measurements as of December 31, 2012.2014.
| Valuation technique | Unobservable input | Range | Weighted average | |||||||
Available-for-sale securities: | ||||||||||
| Discounted cash flow | Discount rate | 8.2 | % | ||||||
| Workout period | 3.9 years | |||||||||
Investments: | ||||||||||
Auction rate securities: | ||||||||||
Equity securities | Discounted cash flow | Discount rate | 5.9 | % | ||||||
| Workout period | 1 | 2.3 years | ||||||||
Municipal securities | Discounted cash flow | Discount rate | 0.5% | 6.7 | % | |||||
| Workout period | 1 | 2.9 years | ||||||||
Other | ||||||||||
Investments in partnerships | Market approach | Revenue multiple | 2.9 | |||||||
| EBITDA multiple | 12.3 | |||||||||
Private equity investments | Market approach | Revenue multiple | 0.5 | 1.4 | ||||||
| EBITDA multiple | 6.7 | |||||||||
The fair value of certain Level 3 assets was determined using various methodologies, as appropriate, including NAVsnet asset values (“NAVs”) of underlying investments, third-party pricing vendors, broker quotes, and market and income approaches. These inputs are evaluated for reasonableness through various procedures, including due diligence reviews of third-party pricing vendors, variance analyses, consideration of current market environment, and other analytical procedures.
The fair value for our auction-rateauction rate securities was determined using an income approach based on an internally developed discounted cash flow model. The discounted cash flow model utilizes two significant unobservable inputs: discount rate and workout period. The discount rate was calculated using credit spreads of the underlying collateral or similar securities. The workout period was based on an assessment of publicly available information on efforts to re-establish functioning markets for these securities and our company’s own redemption experience. Significant increases in any of these inputs in isolation would result in a significantly lower fair value. On an on-goingongoing basis, management verifies the fair value by reviewing the appropriateness of the discounted cash flow model and its significant inputs.
General and limited partnership interests in investment partnerships totaled $21.5$42.1 million and $56.0 million at December 31, 2012.2014 and 2013, respectively. The general and limited partnership interests in investment partnerships were primarily valued based upon NAVs received from third-party fund managers. The various partnerships are investment companies, which record their underlying investments at fair value based on fair value policies established by management of the underlying fund. Fair value policies at the underlying fund generally require the funds to utilize pricing/valuation information, including independent appraisals, fromthird-party sources. However, in some instances, current valuation information for illiquid securities or securities in markets that are not active may not be available from any third-party source or fund management may conclude that the valuations that are available fromthird-party sources are not reliable. In these instances, fund management may perform model-based analytical valuations that may be used as an input to value these investments.
Direct investments in private equity companies totaled $13.5$21.2 million and $8.2 million at December 31, 2012.2014 and 2013, respectively. Direct investments in private equity companies may be valued using the market approach or the income approach, or a combination thereof, and were valued based on an assessment of each
underlying investment, incorporating evaluation of additional significant third-party financing, changes in valuations of comparable peer companies,
the business environment of the companies, market indices, assumptions relating to appropriate risk adjustments for nonperformance, and legal restrictions on disposition, among other factors. The fair value derived from the methods used are evaluated and weighted, as appropriate, considering the reasonableness of the range of values indicated. Under the market approach, fair value may be determined by reference to multiples of market-comparable companies or transactions, including earnings before interest, taxes, depreciation, and amortization (“EBITDA”) multiples. Under the income approach, fair value may be determined by discounting the cash flows to a single present amount using current market expectations about those future amounts. Unobservable inputs used in a discounted cash flow model may include projections of operating performance generally covering a five-year period and a terminal value of the private equity direct investment. For securities utilizing the discounted cash flow valuation technique, a significant increase (decrease) in the discount rate, risk premium, or discount for lack of marketability in isolation could result in a significantly lower (higher) fair value measurement. For securities utilizing the market comparable companies valuation technique, a significant increase (decrease) in the EBITDA multiple in isolation could result in a significantly higher (lower) fair value measurement.
Transfers Within the Fair Value Hierarchy
We assess our financial instruments on a quarterly basis to determine the appropriate classification within the fair value hierarchy. Transfers between fair value classifications occur when there are changes in pricing observability levels. Transfers of financial instruments among the levels are deemed to occur at the beginning of the reporting period. There were $12.8$15.0 million of transfers of financial assets from Level 2 to Level 1 during the year ended December 31, 20122014, primarily related to tax-exempt and equity securities for which market trades were observed that provided transparency into the valuation of these assets. There were $23.3$11.5 million of transfers of financial assets from Level 1 to Level 2 during the year ended December 31, 20122014, primarily related totax-exempt and equity securities for which there were low volumes of recent trade activity observed. There were $7.4 million of transfers of financial assets from Level 3 to Level 2 during the year ended December 31, 2012 related to corporate fixed income securities for which market trades were observed that provided transparency into the valuation of these assets. There were $2.7 million of transfers of financial assets into Level 3 during the year ended December 31, 20122014. We reclassified $1.0 million of fixed income securities that were classified as Level 3 to mortgage-backed securities during the year ended December 31, 2014. The remaining transfers into Level 3 related to corporate fixed incomeequity securities and other investments for which there were low volumes of recent trade activity observed. There were $11.1 million of transfers of financial assets out of Level 3 during the year ended December 31, 2014, primarily related to municipal securities and other investments for market trades were observed that provided transparency into the valuation of these assets.
Fair Value of Financial Instruments
The following reflects the fair value of financial instruments as of December 31, 20122014 and 2011,2013, whether or not recognized in the consolidated statements of financial condition at fair value(in thousands).
| December 31, 2012 | December 31, 2011 | December 31, 2014 | December 31, 2013 | |||||||||||||||||||||||||||||
| Carrying value | Estimated fair value | Carrying value | Estimated fair value | Carrying Value | Estimated Fair Value | Carrying Value | Estimated Fair Value | |||||||||||||||||||||||||
Financial assets: | ||||||||||||||||||||||||||||||||
Cash and cash equivalents | $ | 403,941 | $ | 403,941 | $ | 167,671 | $ | 167,671 | $ | 689,782 | $ | 689,782 | $ | 716,560 | $ | 716,560 | ||||||||||||||||
Restricted cash | 4,414 | 4,414 | 6,883 | 6,883 | — | — | 4,268 | 4,268 | ||||||||||||||||||||||||
Cash segregated for regulatory purposes | 128,031 | 128,031 | 26 | 26 | 49,646 | 49,646 | 35 | 35 | ||||||||||||||||||||||||
Securities purchased under agreements to resell | 158,695 | 158,695 | 75,455 | 75,455 | 55,078 | 55,078 | 225,075 | 225,075 | ||||||||||||||||||||||||
Trading securities owned | 763,608 | 763,608 | 474,951 | 474,951 | ||||||||||||||||||||||||||||
Financial instruments owned | 786,855 | 786,855 | 801,494 | 801,494 | ||||||||||||||||||||||||||||
Available-for-sale securities | 1,625,168 | 1,625,168 | 1,214,141 | 1,214,141 | 1,513,478 | 1,513,478 | 1,756,253 | 1,756,253 | ||||||||||||||||||||||||
Held-to-maturity securities | 708,008 | 715,274 | 190,484 | 189,071 | 1,177,565 | 1,211,976 | 1,312,115 | 1,305,959 | ||||||||||||||||||||||||
Loans held for sale | 214,531 | 214,531 | 131,754 | 131,754 | 121,939 | 121,939 | 109,110 | 109,110 | ||||||||||||||||||||||||
Bank loans | 815,937 | 834,188 | 632,140 | 639,341 | 2,065,420 | 2,086,864 | 1,404,353 | 1,420,068 | ||||||||||||||||||||||||
Investments | 236,434 | 236,434 | 239,208 | 239,208 | 210,255 | 210,255 | 217,228 | 217,228 | ||||||||||||||||||||||||
Financial liabilities: | ||||||||||||||||||||||||||||||||
Securities sold under agreements to repurchase | $ | 140,346 | $ | 140,346 | $ | 80,176 | $ | 80,176 | $ | 39,180 | $ | 39,180 | $ | 263,809 | $ | 263,809 | ||||||||||||||||
Bank deposits | 3,346,133 | 3,368,643 | 2,071,738 | 2,067,324 | 4,790,081 | 4,246,214 | 4,663,323 | 4,072,038 | ||||||||||||||||||||||||
Trading securities sold, but not yet purchased | 319,742 | 319,742 | 266,833 | 266,833 | ||||||||||||||||||||||||||||
Securities sold, but not yet purchased | 22,966 | 22,966 | 19,223 | 19,223 | ||||||||||||||||||||||||||||
Derivative contracts(1) | 19,934 | 19,934 | 24,877 | 24,877 | ||||||||||||||||||||||||||||
Senior notes(2) | 325,000 | 338,475 | — | — | ||||||||||||||||||||||||||||
Non-recourse debt(2) | 58,992 | 58,992 | — | — | ||||||||||||||||||||||||||||
Financial instruments sold, but not yet purchased | 587,265 | 587,265 | 481,214 | 481,214 | ||||||||||||||||||||||||||||
Derivative contracts1 | 5,641 | 5,641 | 9,349 | 9,349 | ||||||||||||||||||||||||||||
Senior notes | 625,000 | 638,690 | 325,000 | 328,635 | ||||||||||||||||||||||||||||
Debentures to Stifel Financial Capital Trusts | 82,500 | 66,545 | 82,500 | 67,594 | 82,500 | 76,714 | 82,500 | 72,201 | ||||||||||||||||||||||||
Liabilities subordinated to claims of general creditors | 5,318 | 5,204 | 6,957 | 6,671 | — | — | 3,131 | 3,122 | ||||||||||||||||||||||||
Included in accounts payable and accrued expenses in the consolidated statements of financial condition. |
|
The following table presents the estimated fair values of financial instruments not measured at fair value on a recurring basis(in thousands):
| December 31, 2012(1) | December 31, 2014 | |||||||||||||||||||||||||||||||
| Total | Level 1 | Level 2 | Level 3 | Total | Level 1 | Level 2 | Level 3 | |||||||||||||||||||||||||
Financial assets: | ||||||||||||||||||||||||||||||||
Cash | $ | 331,345 | $ | 331,345 | $ | — | $ | — | $ | 566,907 | $ | 566,907 | $ | — | $ | — | ||||||||||||||||
Restricted cash | 4,414 | 4,414 | — | — | 49,646 | 49,646 | — | — | ||||||||||||||||||||||||
Cash segregated for regulatory purposes | 128,031 | 128,031 | — | — | ||||||||||||||||||||||||||||
Securities purchased under agreements to resell | 158,695 | 154,688 | 4,007 | — | 55,078 | 44,996 | 10,082 | — | ||||||||||||||||||||||||
Held-to-maturity securities | 715,274 | — | 487,775 | 227,499 | 1,211,976 | — | 969,913 | 242,063 | ||||||||||||||||||||||||
Loans held for sale | 214,531 | — | 214,531 | — | 121,939 | — | 121,939 | — | ||||||||||||||||||||||||
Bank loans | 834,188 | — | 834,188 | — | 2,086,864 | — | 2,086,864 | — | ||||||||||||||||||||||||
Financial liabilities: | ||||||||||||||||||||||||||||||||
Securities sold under agreements to repurchase | $ | 140,346 | $ | 140,346 | $ | — | $ | — | $ | 39,180 | $ | 39,180 | $ | — | $ | — | ||||||||||||||||
Bank deposits | 3,368,643 | — | 3,368,643 | — | 4,246,214 | — | 4,246,214 | — | ||||||||||||||||||||||||
Senior notes | 338,475 | 338,475 | — | — | 638,690 | 638,690 | — | — | ||||||||||||||||||||||||
Non-recourse debt | 58,992 | — | 58,992 | — | ||||||||||||||||||||||||||||
Debentures to Stifel Financial Capital Trusts | 66,545 | — | — | 66,545 | 76,714 | — | — | 76,714 | ||||||||||||||||||||||||
Liabilities subordinated to claims of general creditors | 5,204 | — | — | 5,204 | ||||||||||||||||||||||||||||
|
| December 31, 2013 | ||||||||||||||||
| Total | Level 1 | Level 2 | Level 3 | |||||||||||||
Financial assets: | ||||||||||||||||
Cash | $ | 638,397 | $ | 638,397 | $ | — | $ | — | ||||||||
Restricted cash | 4,268 | 4,268 | — | — | ||||||||||||
Cash segregated for regulatory purposes | 35 | 35 | — | — | ||||||||||||
Securities purchased under agreements to resell | 225,075 | 225,075 | — | — | ||||||||||||
Held-to-maturity securities | 1,305,959 | — | 1,073,953 | 232,006 | ||||||||||||
Loans held for sale | 109,110 | — | 109,110 | — | ||||||||||||
Bank loans | 1,420,068 | — | 1,420,068 | — | ||||||||||||
Financial liabilities: | ||||||||||||||||
Securities sold under agreements to repurchase | $ | 263,809 | $ | 747 | $ | 263,062 | $ | — | ||||||||
Bank deposits | 4,072,038 | — | 4,072,038 | — | ||||||||||||
Senior notes | 328,635 | 328,635 | — | — | ||||||||||||
Debentures to Stifel Financial Capital Trusts | 72,201 | — | — | 72,201 | ||||||||||||
Liabilities subordinated to claims of general creditors | 3,122 | — | — | 3,122 | ||||||||||||
The following, as supplemented by the discussion above, describes the valuation techniques used in estimating the fair value of our financial instruments as of December 31, 20122014 and 2011.2013.
Financial Assets
Securities Purchased Under Agreements to Resell
Securities purchased under agreements to resell are collateralized financing transactions that are recorded at their contractual amounts plus accrued interest. The carrying values at December 31, 20122014 and 20112013 approximate fair value due to thetheir short-term nature.
Held-to-Maturity Securities
Securities held to maturity are recorded at amortized cost based on our company’s positive intent and ability to hold these securities to maturity. Securities held to maturity include asset-backed securities, consisting of corporate obligations, collateralized debt obligation securities, and ARS. The estimated fair value, included in the above table, is determined using several factors; however, primary weight is given to discounted cash flow modeling techniques that incorporated an estimated discount rate based upon recent observable debt security issuances with similar characteristics.
Loans Held for Sale
Loans held for sale consist of fixed-rate and adjustable-rate residential real estate mortgage loans intended for sale. Loans held for sale are stated at lower of cost or fair value. Fair value is determined based on prevailing market prices for loans with similar characteristics or on sale contract prices.
Bank Loans
The fair values of mortgage loans and commercial loans were estimated using a discounted cash flow method, a form of the income approach. Discount rates were determined considering rates at which similar portfolios of loans would be made under current conditions and considering liquidity spreads applicable to each loan portfolio based on the secondary market.
Financial Liabilities
Securities Sold Under Agreements to Repurchase
Securities sold under agreements to repurchase are collateralized financing transactions that are recorded at their contractual amounts plus accrued interest. The carrying values at December 31, 20122014 and 20112013 approximate fair value due to the short-term nature.
Bank Deposits
The fair value for demand deposits is equal to the amount payable on demand at the reporting date (that is, their carrying amounts). The carrying amounts of variable-rate money-market and savings accounts approximate their fair values at the reporting date as these are short-term in nature. The fair value of other interest-bearing deposits, including certificates of deposit,deposits, demand deposits, savings, and checking accounts, was calculated by discounting the future cash flows using discount rates based on the expected current market rates forreplacement cost of funding of similar products with similar remainingstructures and terms.
Senior Notes
The fair value of our senior notes is estimated based upon quoted market prices.
Non-recourse debt
The carrying value of our non-recourse debt approximates fair value due at December 31, 2012.
Debentures to Stifel Financial Capital Trusts
The fair value of our trust preferred securities is based on the discounted value of contractual cash flows. We have assumed a discount rate based on the coupon achieved in our 6.7%5.375% senior notes due 2022.
Liabilities Subordinated to Claims of General Creditors
The fair value of subordinated debt was measured using the interest rates commensurate with borrowings of similar terms.
These fair value disclosures represent our best estimates based on relevant market information and information about the financial instruments. Fair value estimates are based on judgments regarding future expected losses, current economic conditions, risk characteristics of the various instruments, and other factors. These estimates are subjective in nature and involve uncertainties and matters of significant judgment and, therefore, cannot be determined with precision. Changes in the above methodologies and assumptions could significantly affect the estimates.
NOTE 7 – Trading SecuritiesFinancial Instruments Owned and Trading SecuritiesFinancial Instruments Sold, But Not Yet Purchased
The components of trading securitiesfinancial instruments owned and trading securitiesfinancial instruments sold, but not yet purchased, at December 31, 20122014 and 2011,2013 are as follows(in thousands):
| December 31, | December 31, | |||||||||||||||
| 2012 | 2011 | 2014 | 2013 | |||||||||||||
Trading securities owned: | ||||||||||||||||
Financial instruments owned: | ||||||||||||||||
U.S. government securities | $ | 58,992 | $ | 10,594 | ||||||||||||
U.S. government agency securities | $ | 123,758 | $ | 66,424 | 101,439 | 80,835 | ||||||||||
U.S. government securities | 3,573 | 32,845 | ||||||||||||||
Mortgage-backed securities: | ||||||||||||||||
Agency | 159,057 | 267,933 | ||||||||||||||
Non-agency | 13,366 | 22,570 | ||||||||||||||
Corporate securities: | ||||||||||||||||
Fixed income securities | 396,878 | 244,535 | 245,909 | 201,579 | ||||||||||||
Equity securities | 35,472 | 19,859 | 77,548 | 76,709 | ||||||||||||
State and municipal securities | 203,927 | 111,288 | 130,544 | 141,274 | ||||||||||||
|
|
|
| |||||||||||||
| $ | 763,608 | $ | 474,951 | $ | 786,855 | $ | 801,494 | |||||||||
|
|
|
| |||||||||||||
Trading securities sold, but not yet purchased: | ||||||||||||||||
Financial instruments sold, but not yet purchased: | ||||||||||||||||
U.S. government securities | $ | 162,661 | $ | 109,776 | $ | 146,592 | $ | 253,221 | ||||||||
U.S. government agency securities | 15 | 954 | 10,029 | — | ||||||||||||
Mortgage-backed securities: | ||||||||||||||||
Agency | 28,067 | 37,201 | ||||||||||||||
Non-agency | 4,556 | — | ||||||||||||||
Corporate securities: | ||||||||||||||||
Fixed income securities | 150,698 | 149,460 | 293,008 | 100,745 | ||||||||||||
Equity securities | 6,281 | 6,060 | 105,013 | 90,015 | ||||||||||||
State and municipal securities | 87 | 583 | — | 32 | ||||||||||||
|
|
|
| |||||||||||||
| $ | 319,742 | $ | 266,833 | $ | 587,265 | $ | 481,214 | |||||||||
|
|
|
| |||||||||||||
At December 31, 20122014 and 2011, trading securities2013, financial instruments owned in the amount of $607.6$425.1 million and $393.9$687.0 million, respectively, were pledged as collateral for our repurchase agreements and short-term borrowings.
Trading securitiesFinancial instruments sold, but not yet purchased, represent obligations of our company to deliver the specified security at the contracted price, thereby creating a liability to purchase the security in the market at prevailing prices in future periods. We are obligated to acquire the securities sold short at prevailing market prices in future periods, which may exceed the amount reflected in the consolidated statements of financial condition.
NOTE 8 – Available-for-Sale and Held-to-Maturity Securities
The following tables provide a summary of the amortized cost and fair values of the available-for-sale securities and held-to-maturity securities at December 31, 20122014 and 20112013(in (in thousands):
| December 31, 2012 | ||||||||||||||||
| Amortized cost | Gross unrealized gains(1) | Gross unrealized losses(1) | Estimated fair value | |||||||||||||
Available-for-sale securities | ||||||||||||||||
U.S. government agency securities | $ | 1,114 | $ | 1 | $ | (2 | ) | $ | 1,113 | |||||||
State and municipal securities | 153,885 | 4,648 | (1,113 | ) | 157,420 | |||||||||||
Mortgage-backed securities: | ||||||||||||||||
Agency | 676,861 | 8,140 | (153 | ) | 684,848 | |||||||||||
Commercial | 255,255 | 5,902 | (183 | ) | 260,974 | |||||||||||
Non-agency | 13,077 | 801 | — | 13,878 | ||||||||||||
Corporate fixed income securities | 474,338 | 7,590 | (1,746 | ) | 480,182 | |||||||||||
Asset-backed securities | 26,572 | 378 | (197 | ) | 26,753 | |||||||||||
|
|
|
|
|
|
|
| |||||||||
| $ | 1,601,102 | $ | 27,460 | $ | (3,394 | ) | $ | 1,625,168 | ||||||||
|
|
|
|
|
|
|
| |||||||||
Held-to-maturity securities(2) | ||||||||||||||||
Asset-backed securities | $ | 630,279 | $ | 9,364 | $ | (2,971 | ) | $ | 636,672 | |||||||
Corporate fixed income securities | 55,420 | 36 | (519 | ) | 54,937 | |||||||||||
Municipal auction rate securities | 22,309 | 1,376 | (20 | ) | 23,665 | |||||||||||
|
|
|
|
|
|
|
| |||||||||
| $ | 708,008 | $ | 10,776 | $ | (3,510 | ) | $ | 715,274 | ||||||||
|
|
|
|
|
|
|
| |||||||||
| December 31, 2011 | December 31, 2014 | |||||||||||||||||||||||||||||||
| Amortized cost | Gross unrealized gains(1) | Gross unrealized losses(1) | Estimated fair value | Amortized Cost | Gross Unrealized Gains1 | Gross Unrealized Losses1 | Estimated Fair Value | |||||||||||||||||||||||||
Available-for-sale securities | ||||||||||||||||||||||||||||||||
U.S. government agency securities | $ | 1,105 | $ | — | $ | (2 | ) | $ | 1,103 | $ | 1,613 | $ | 1 | $ | (4 | ) | $ | 1,610 | ||||||||||||||
State and municipal securities | 82,256 | 4,979 | (303 | ) | 86,932 | 76,518 | 20 | (2,137 | ) | 74,401 | ||||||||||||||||||||||
Mortgage-backed securities: | ||||||||||||||||||||||||||||||||
Agency | 396,952 | 8,469 | (759 | ) | 404,662 | 206,982 | 3,137 | (913 | ) | 209,206 | ||||||||||||||||||||||
Commercial | 270,677 | 1,811 | (978 | ) | 271,510 | 107,100 | 633 | (89 | ) | 107,644 | ||||||||||||||||||||||
Non-agency | 17,701 | 135 | (376 | ) | 17,460 | 3,186 | 5 | (54 | ) | 3,137 | ||||||||||||||||||||||
Corporate fixed income securities | 409,503 | 2,108 | (5,626 | ) | 405,985 | 336,210 | 2,016 | (820 | ) | 337,406 | ||||||||||||||||||||||
Asset-backed securities | 26,011 | 548 | (70 | ) | 26,489 | 788,908 | 1,321 | (10,155 | ) | 780,074 | ||||||||||||||||||||||
|
|
|
|
|
|
|
| |||||||||||||||||||||||||
| $ | 1,204,205 | $ | 18,050 | $ | (8,114 | ) | $ | 1,214,141 | $ | 1,520,517 | $ | 7,133 | $ | (14,172 | ) | $ | 1,513,478 | |||||||||||||||
|
|
|
|
|
|
|
| |||||||||||||||||||||||||
Held-to-maturity securities(2) | ||||||||||||||||||||||||||||||||
Held-to-maturity securities2 | ||||||||||||||||||||||||||||||||
Mortgage-backed securities: | ||||||||||||||||||||||||||||||||
Agency | $ | 884,451 | $ | 32,926 | $ | (42 | ) | $ | 917,335 | |||||||||||||||||||||||
Commercial | 59,462 | 2,257 | — | 61,719 | ||||||||||||||||||||||||||||
Non-agency | 1,081 | — | (17 | ) | 1,064 | |||||||||||||||||||||||||||
Asset-backed securities | $ | 122,148 | $ | 2,953 | $ | (3,138 | ) | $ | 121,963 | 177,335 | 3,151 | (2,645 | ) | 177,841 | ||||||||||||||||||
Corporate fixed income securities | 55,544 | 56 | (2,016 | ) | 53,584 | 55,236 | 4 | (1,223 | ) | 54,017 | ||||||||||||||||||||||
Municipal auction rate securities | 12,792 | 733 | (1 | ) | 13,524 | |||||||||||||||||||||||||||
|
|
|
|
|
|
|
| |||||||||||||||||||||||||
| $ | 190,484 | $ | 3,742 | $ | (5,155 | ) | $ | 189,071 | $ | 1,177,565 | $ | 38,338 | $ | (3,927 | ) | $ | 1,211,976 | |||||||||||||||
|
|
|
|
|
|
| �� |
| ||||||||||||||||||||||||
| December 31, 2013 | ||||||||||||||||||||||||||||||||
| Amortized Cost | Gross Unrealized Gains1 | Gross Unrealized Losses1 | Estimated Fair Value | |||||||||||||||||||||||||||||
Available-for-sale securities | ||||||||||||||||||||||||||||||||
U.S. government agency securities | $ | 1,074 | $ | — | $ | (2 | ) | $ | 1,072 | |||||||||||||||||||||||
State and municipal securities | 96,475 | 739 | (6,537 | ) | 90,677 | |||||||||||||||||||||||||||
Mortgage-backed securities: | ||||||||||||||||||||||||||||||||
Agency | 184,533 | 2,859 | (3,405 | ) | 183,987 | |||||||||||||||||||||||||||
Commercial | 209,949 | 3,084 | (1,787 | ) | 211,246 | |||||||||||||||||||||||||||
Non-agency | 4,547 | 72 | — | 4,619 | ||||||||||||||||||||||||||||
Corporate fixed income securities | 496,385 | 4,769 | (2,838 | ) | 498,316 | |||||||||||||||||||||||||||
Asset-backed securities | 769,553 | 2,499 | (5,716 | ) | 766,336 | |||||||||||||||||||||||||||
|
|
|
| |||||||||||||||||||||||||||||
| $ | 1,762,516 | $ | 14,022 | $ | (20,285 | ) | $ | 1,756,253 | ||||||||||||||||||||||||
|
|
|
| |||||||||||||||||||||||||||||
Held-to-maturity securities2 | ||||||||||||||||||||||||||||||||
Mortgage-backed securities: | ||||||||||||||||||||||||||||||||
Agency | $ | 968,759 | $ | 1,156 | $ | (7,915 | ) | $ | 962,000 | |||||||||||||||||||||||
Commercial | 59,404 | — | (186 | ) | 59,218 | |||||||||||||||||||||||||||
Asset-backed securities | 228,623 | 6,157 | (2,774 | ) | 232,006 | |||||||||||||||||||||||||||
Corporate fixed income securities | 55,329 | 11 | (2,605 | ) | 52,735 | |||||||||||||||||||||||||||
|
|
|
| |||||||||||||||||||||||||||||
| $ | 1,312,115 | $ | 7,324 | $ | (13,480 | ) | $ | 1,305,959 | ||||||||||||||||||||||||
|
|
|
| |||||||||||||||||||||||||||||
Unrealized gains/(losses) related to available-for-sale securities are reported in accumulated other comprehensive |
Held-to-maturity securities are carried in the consolidated statements of financial condition at amortized cost, and the changes in the value of these securities, other than impairment charges, are not reported on the consolidated financial statements. |
During the year ended December 31, 2013, we transferred $1.1 billion of mortgage-backed securities from our available-for-sale portfolio to the held-to-maturity category, reflecting our company’s intent to hold those securities to maturity. During the year ended December 31, 2013, we transferred $387.5 million from our held-to-maturity portfolio to the available-for-sale category as certain CLO investments may become non-compliant under the provisions of the new Volcker Rule, which could require us to sell them before maturity.
For the years ended December 31, 20122014, 2013, and 2011,2012, we received proceeds of $250.2$300.3 million, $197.5 million, and $362.1$250.2 million, respectively, from the sale of available-for-sale securities, which resulted in realized gains of $3.7 million, $2.0 million, and $3.8 million, and $7.9 million, respectively. For the year ended December 31, 2010, proceeds from the sales of available-for-sale securities and the resulting realized gains and losses were immaterial.
During the years ended December 31, 20122014 and 2011,2013, unrealized gains, net of deferred taxes, of $8.7$1.8 million and $2.1$48.5 million, respectively, were recorded in accumulated other comprehensive income/(loss) in the consolidated statements of financial condition.
During the second quarteryear ended December 31, 2012, unrealized gains, net of 2011, we determined that we no longer haddeferred taxes, of $8.7 million were recorded in accumulated other comprehensive income/(loss) in the intent to hold $32.9 millionconsolidated statements of held-to-maturity securities to maturity. As a result, we reclassified $27.9 million carrying value of municipal auction rate securities from held-to-maturity to available-for-sale and recorded an unrealized loss of $5.0 million at the date of transfer.financial condition.
The table below summarizes the amortized cost and fair values of debt securities by contractual maturity(in thousands). Expected maturities may differ significantly from contractual maturities, as issuers may have the right to call or prepay obligations with or without call or prepayment penalties.
| December 31, 2012 | December 31, 2014 | |||||||||||||||||||||||||||||||
| Available-for-sale securities | Held-to-maturity securities | Available-for-sale securities | Held-to-maturity securities | |||||||||||||||||||||||||||||
| Amortized cost | Estimated fair value | Amortized cost | Estimated fair value | Amortized Cost | Estimated Fair Value | Amortized Cost | Estimated Fair Value | |||||||||||||||||||||||||
Debt securities | ||||||||||||||||||||||||||||||||
Within one year | $ | 105,259 | $ | 105,940 | $ | — | $ | — | $ | 132,004 | $ | 132,432 | $ | 15,025 | $ | 15,027 | ||||||||||||||||
After one year through three years | 309,394 | 314,753 | 15,075 | 15,111 | 46,937 | 47,253 | — | — | ||||||||||||||||||||||||
After three years through five years | 45,566 | 45,469 | 13,093 | 13,179 | 121,655 | 122,311 | 40,211 | 38,991 | ||||||||||||||||||||||||
After five years through ten years | 29,947 | 30,260 | 251,826 | 252,275 | 299,752 | 298,294 | — | — | ||||||||||||||||||||||||
After ten years | 165,743 | 169,046 | 428,014 | 434,709 | 602,901 | 593,201 | 177,335 | 177,840 | ||||||||||||||||||||||||
Mortgage-backed securities | ||||||||||||||||||||||||||||||||
After three years through five years | 369 | 378 | — | — | ||||||||||||||||||||||||||||
Within one year | — | — | — | — | ||||||||||||||||||||||||||||
After one year through three years | 120 | 122 | — | — | ||||||||||||||||||||||||||||
After five years through ten years | 16,246 | 16,997 | — | — | 78,994 | 81,182 | 59,462 | 61,719 | ||||||||||||||||||||||||
After ten years | 928,578 | 942,325 | — | — | 238,154 | 238,683 | 885,532 | 918,399 | ||||||||||||||||||||||||
|
|
|
|
|
|
|
| |||||||||||||||||||||||||
| $ | 1,601,102 | $ | 1,625,168 | $ | 708,008 | $ | 715,274 | $ | 1,520,517 | $ | 1,513,478 | $ | 1,177,565 | $ | 1,211,976 | |||||||||||||||||
|
|
|
|
|
|
|
| |||||||||||||||||||||||||
The maturities of our available-for-sale (fair value) and held-to-maturity (amortized cost) securities at December 31, 2014, are as follows (in thousands):
| Within 1 Year | 1-5 Years | 5-10 Years | After 10 Years | Total | ||||||||||||||||
Available-for-sale: 1 | ||||||||||||||||||||
U.S. government agency securities | $ | 452 | $ | 1,158 | $ | — | $ | — | $ | 1,610 | ||||||||||
State and municipal securities | — | — | 1,655 | 72,746 | 74,401 | |||||||||||||||
Mortgage-backed securities: | ||||||||||||||||||||
Agency | — | — | 40,223 | 168,983 | 209,206 | |||||||||||||||
Commercial | — | — | 40,959 | 66,685 | 107,644 | |||||||||||||||
Non-agency | — | 122 | — | 3,015 | 3,137 | |||||||||||||||
Corporate fixed income securities | 131,980 | 163,407 | 42,019 | — | 337,406 | |||||||||||||||
Asset-backed securities | — | 4,999 | 254,620 | 520,455 | 780,074 | |||||||||||||||
|
|
|
|
|
|
|
|
|
| |||||||||||
| $ | 132,432 | $ | 169,686 | $ | 379,476 | $ | 831,884 | $ | 1,513,478 | |||||||||||
|
|
|
|
|
|
|
|
|
| |||||||||||
Held-to-maturity: | ||||||||||||||||||||
Mortgage-backed securities: | ||||||||||||||||||||
Agency | $ | — | $ | — | $ | — | $ | 884,451 | $ | 884,451 | ||||||||||
Commercial | — | — | 59,462 | — | 59,462 | |||||||||||||||
Non-agency | — | — | — | 1,081 | 1,081 | |||||||||||||||
Asset-backed securities | — | — | — | 177,335 | 177,335 | |||||||||||||||
Corporate fixed income securities | 15,025 | 40,211 | — | — | 55,236 | |||||||||||||||
|
|
|
|
|
|
|
|
|
| |||||||||||
| $ | 15,025 | $ | 40,211 | $ | 59,462 | $ | 1,062,867 | $ | 1,177,565 | |||||||||||
|
|
|
|
|
|
|
|
|
| |||||||||||
| 1 | Due to the immaterial amount of income recognized on tax-exempt securities, yields were not calculated on a tax-equivalent basis. |
At December 31, 20122014 and 2011,2013, securities of $613.8 million$1.2 billion and $644.9$505.5 million, respectively, were pledged at the Federal Home Loan Bank as collateral for borrowings and letters of credit obtained to secure public deposits.
The following table is a summary ofshows the amount of gross unrealized losses and the estimated fair value of the Company’s investment securities with unrealized losses, aggregated by investment category and length of time that the available-for-saleindividual investment securities have been in ancontinuous unrealized loss positionpositions, at December 31, 20122014(in (in thousands):
| Less than 12 months | 12 months or more | Total | Less than 12 months | 12 months or more | Total | |||||||||||||||||||||||||||||||||||||||||||
| Gross unrealized losses | Estimated fair value | Gross unrealized losses | Estimated fair value | Gross unrealized losses | Estimated fair value | Gross Unrealized Losses | Estimated Fair Value | Gross Unrealized Losses | Estimated Fair Value | Gross Unrealized Losses | Estimated Fair Value | |||||||||||||||||||||||||||||||||||||
Available-for-sale securities | ||||||||||||||||||||||||||||||||||||||||||||||||
U.S. government securities | $ | (2 | ) | $ | 108 | $ | — | $ | — | $ | (2 | ) | $ | 108 | $ | (4 | ) | $ | 987 | $ | — | $ | — | $ | (4 | ) | $ | 987 | ||||||||||||||||||||
State and municipal securities | (852 | ) | 67,189 | (261 | ) | 7,538 | (1,113 | ) | 74,727 | (6 | ) | 2,957 | (2,131 | ) | 65,294 | (2,137 | ) | 68,251 | ||||||||||||||||||||||||||||||
Mortgage-backed securities: | ||||||||||||||||||||||||||||||||||||||||||||||||
Agency | (153 | ) | 106,112 | — | — | (153 | ) | 106,112 | (238 | ) | 38,453 | (675 | ) | 46,533 | (913 | ) | 84,986 | |||||||||||||||||||||||||||||||
Commercial | (96 | ) | 18,324 | (87 | ) | 21,391 | (183 | ) | 39,715 | (7 | ) | 4,893 | (82 | ) | 10,043 | (89 | ) | 14,936 | ||||||||||||||||||||||||||||||
Non-agency | (54 | ) | 2,888 | — | — | (54 | ) | 2,888 | ||||||||||||||||||||||||||||||||||||||||
Corporate fixed income securities | (940 | ) | 49,423 | (806 | ) | 34,164 | (1,746 | ) | 83,587 | (80 | ) | 33,940 | (740 | ) | 65,003 | (820 | ) | 98,943 | ||||||||||||||||||||||||||||||
Asset-backed securities | — | — | (197 | ) | 14,417 | (197 | ) | 14,417 | (4,447 | ) | 389,422 | (5,708 | ) | 221,361 | (10,155 | ) | 610,783 | |||||||||||||||||||||||||||||||
|
|
|
|
|
|
|
|
|
|
|
| |||||||||||||||||||||||||||||||||||||
| $ | (2,043 | ) | $ | 241,156 | $ | (1,351 | ) | $ | 77,510 | $ | (3,394 | ) | $ | 318,666 | $ | (4,836 | ) | $ | 473,540 | $ | (9,336 | ) | $ | 408,234 | $ | (14,172 | ) | $ | 881,774 | |||||||||||||||||||
|
|
|
|
|
|
|
|
|
|
|
| |||||||||||||||||||||||||||||||||||||
Held-to-maturity securities | ||||||||||||||||||||||||||||||||||||||||||||||||
Mortgage-backed securities: | ||||||||||||||||||||||||||||||||||||||||||||||||
Agency | $ | (42 | ) | $ | 2,994 | $ | — | $ | — | $ | (42 | ) | 2,994 | |||||||||||||||||||||||||||||||||||
Non-agency | (17 | ) | 1,064 | — | — | (17 | ) | 1,064 | ||||||||||||||||||||||||||||||||||||||||
Asset-backed securities | (220 | ) | 22,677 | (2,425 | ) | 55,494 | (2,645 | ) | 78,171 | |||||||||||||||||||||||||||||||||||||||
Corporate fixed income securities | — | — | (1,223 | ) | 49,016 | (1,223 | ) | 49,016 | ||||||||||||||||||||||||||||||||||||||||
|
|
|
|
|
| |||||||||||||||||||||||||||||||||||||||||||
| $ | (279 | ) | $ | 26,735 | $ | (3,648 | ) | $ | 104,510 | $ | (3,927 | ) | $ | 131,245 | ||||||||||||||||||||||||||||||||||
|
|
|
|
|
| |||||||||||||||||||||||||||||||||||||||||||
The gross unrealized losses on our available-for-sale securities of $3.4 million as ofAt December 31, 2012 relate2014, the amortized cost of 100 securities classified as available for sale exceeded fair value by $14.2 million, of which $9.3 million related to 39 individual securities.
Certain investmentsinvestment securities that had been in the available-for-sale portfolio at December 31, 2012, are reported in the consolidated statements of financial condition at an amount less than their amortized cost.a loss position for 12 months or longer. The total fair value of these investments at December 31, 2012,2014, was $318.7$881.8 million, which was 19.6%58.3% of our available-for-sale investment portfolio. The amortized cost basis of these investments was $322.1 million at
At December 31, 2012.2014, the carrying value of 22 securities held to maturity exceeded fair value by $3.9 million, of which $3.6 million related to securities held to maturity that have been in a loss position for 12 months or longer. As discussed in more detail below, we conduct periodic reviews of all securities with unrealized losses to assess whether the impairment is other-than-temporary.
Other-Than-Temporary Impairment
We evaluate all securities in an unrealized loss position quarterly to assess whether the impairment is other-than-temporary. Our other-than-temporary impairment (“OTTI”) assessment is a subjective process requiring the use of judgments and assumptions. Accordingly, we consider a number of qualitativeThere was no credit-related OTTI recognized during the years ended December 31, 2014 and quantitative criteria in our assessment, including the extent and duration of the impairment; recent events specific to the issuer and/or industry to which the issuer belongs; the payment structure of the security; external credit ratings and the failure of the issuer to make scheduled interest or principal payments; the value of underlying collateral; and current market conditions.
If we determine that impairment on our debt securities is other-than-temporary and we have made the decision to sell the security or it is more likely than not that we will be required to sell the security prior to recovery of its amortized cost basis, we recognize the entire portion of the impairment in earnings. If we have not made a decision to sell the security and we do not expect that we will be required to sell the security prior to recovery of the amortized cost basis, we recognize only the credit component of OTTI in earnings. The remaining unrealized loss due to factors other than credit, or the non-credit component, is recorded in accumulated other comprehensive loss. We determine the credit component based on the difference between the security’s amortized cost basis and the present value of its expected future cash flows, discounted based on the purchase yield. The non-credit component represents the difference between the security’s fair value and the present value of expected future cash flows.2013. Based on the evaluation, we recognized a credit-related OTTI of $0.6 million and $1.9 million in earnings for the yearsyear ended December 31, 2012 and 2011, respectively.
We estimate the portion of loss attributable to credit using a discounted cash flow model. Key assumptions used in estimating the expected cash flows include default rates, loss severity and prepayment rates. Assumptions used can vary widely based on the collateral underlying the securities and are influenced by factors such as collateral type, loan interest rate, geographical location of the borrower, and borrower characteristics.2012.
We believe the gross unrealized losses related to all other securities of $3.4$14.2 million as of December 31, 20122014, are attributable to issuer specificissuer-specific credit spreads and changes in market interest rates and asset spreads. We, therefore, do not expect to incur any credit losses related to these securities. In addition, we have no intent to sell these securities with unrealized losses, and it is not more likely than not that we will be required to sell these securities prior to recovery of the amortized cost. No OTTI charge was recorded in 2014 related to these securities. Accordingly, we have concluded that the impairment on these securities is not other-than-temporary.
The following table presents the balance and associated percentage of each major loan category in our loan portfolio at December 31, 20122014 and 20112013(in (in thousands, except percentages):
| December 31, 2012 | December 31, 2011 | December 31, 2014 | December 31, 2013 | |||||||||||||||||||||||||||||
| Balance | Percent | Balance | Percent | Balance | Percent | Balance | Percent | |||||||||||||||||||||||||
Consumer(1) | $ | 425,382 | 51.6 | % | $ | 371,399 | 58.2 | % | ||||||||||||||||||||||||
Commercial and industrial | 300,034 | 36.4 | 186,996 | 29.3 | $ | 896,853 | 42.4 | % | $ | 552,333 | 37.7 | % | ||||||||||||||||||||
Consumer1 | 758,288 | 35.8 | 509,484 | 34.8 | ||||||||||||||||||||||||||||
Residential real estate | 65,657 | 8.0 | 51,755 | 8.1 | 432,646 | 20.4 | 372,789 | 25.5 | ||||||||||||||||||||||||
Commercial real estate | 15,902 | 0.8 | 12,284 | 0.8 | ||||||||||||||||||||||||||||
Home equity lines of credit | 19,531 | 2.4 | 24,086 | 3.8 | 12,945 | 0.6 | 16,327 | 1.1 | ||||||||||||||||||||||||
Commercial real estate | 12,805 | 1.5 | 3,107 | 0.5 | ||||||||||||||||||||||||||||
Construction and land | 510 | 0.1 | 514 | 0.1 | — | — | 490 | 0.1 | ||||||||||||||||||||||||
|
|
|
|
|
|
|
| |||||||||||||||||||||||||
| 823,919 | 100.0 | % | 637,857 | 100.0 | % | 2,116,634 | 100.0 | % | 1,463,707 | 100.0 | % | |||||||||||||||||||||
Unamortized loan fees, net of origination costs | (1,207 | ) | (421 | ) | ||||||||||||||||||||||||||||
Unamortized loan discount | (30,533 | ) | (45,100 | ) | ||||||||||||||||||||||||||||
Unamortized loan fees, net of loan fees | (1,631 | ) | (1,920 | ) | ||||||||||||||||||||||||||||
Loans in process | 1,370 | 4 | 1,681 | 334 | ||||||||||||||||||||||||||||
Allowance for loan losses | (8,145 | ) | (5,300 | ) | (20,731 | ) | (12,668 | ) | ||||||||||||||||||||||||
|
|
|
| |||||||||||||||||||||||||||||
| $ | 815,937 | $ | 632,140 | $ | 2,065,420 | $ | 1,404,353 | |||||||||||||||||||||||||
|
|
|
| |||||||||||||||||||||||||||||
Includes securities-based loans of |
Changes in the allowance for loan losses for the periods presented were as follows (in thousands):
| Year Ended December 31, | Year Ended December 31, | |||||||||||||||||||||||
| 2012 | 2011 | 2010 | 2014 | 2013 | 2012 | |||||||||||||||||||
Allowance for loan losses, beginning of period | $ | 5,300 | $ | 2,331 | $ | 1,702 | $ | 12,668 | $ | 8,145 | $ | 5,300 | ||||||||||||
|
|
| ||||||||||||||||||||||
Provision for loan losses | 3,004 | 2,925 | 460 | 8,531 | 8,842 | 3,004 | ||||||||||||||||||
Charge-offs: | ||||||||||||||||||||||||
Commercial and industrial | (510 | ) | (3,864 | ) | — | |||||||||||||||||||
Residential real estate | (254 | ) | (5 | ) | (216 | ) | — | (501 | ) | (254 | ) | |||||||||||||
Commercial real estate | — | (5 | ) | — | ||||||||||||||||||||
Consumer | (16 | ) | — | — | ||||||||||||||||||||
Other | — | — | (2 | ) | (5 | ) | (7 | ) | — | |||||||||||||||
|
|
|
|
|
| |||||||||||||||||||
Total charge-offs | (254 | ) | (10 | ) | (218 | ) | (531 | ) | (4,372 | ) | (254 | ) | ||||||||||||
Recoveries | 95 | 54 | 387 | 63 | 53 | 95 | ||||||||||||||||||
|
|
|
|
|
| |||||||||||||||||||
Allowance for loan losses, end of period | $ | 8,145 | $ | 5,300 | $ | 2,331 | $ | 20,731 | $ | 12,668 | $ | 8,145 | ||||||||||||
|
|
|
|
|
| |||||||||||||||||||
A loan is determined to be impaired when principal or interest becomes 90 days past due or when collection becomes uncertain. At the time a loan is determined to be impaired, the accrual of interest and amortization of deferred loan origination fees is discontinued (“non-accrual status”), and any accrued and unpaid interest income is reversed. At December 31, 2012,2014, we had $1.8$4.9 million ofnon-accrual loans, net of discounts, which included $1.6$1.0 million in troubled debt restructurings, for which there was a specific allowance of $0.6$0.3 million. At December 31, 2011,2013, we had $2.5$1.5 million of non-accrual loans, net of discounts, which included $0.3$0.4 million of troublein troubled debt restructurings, for which there was a specific allowance of $0.6$0.2 million. The gross interest income related to impaired loans, which would have been recorded had these loans been current in accordance with their original terms, and the interest income recognized on these loans during the years ended December 31, 2012, 20112014, 2013, and 2010,2012, were insignificant to the consolidated financial statements.
Credit Quality
We closely monitor economic conditions and loan performance trends to manage and evaluate our exposure to credit risk. Trends in delinquency ratios are an indicator, among other considerations, of credit risk within our loan portfolios. The level of nonperforming assets represents another indicator of the potential for future credit losses. Accordingly, key metrics we track and use in evaluating the credit quality of our loan portfolio include delinquency and nonperforming asset rates, as well as charge-off rates and our internal risk ratings of the loan portfolio. In general, we are a secured lender. At December 31, 20122014 and 2011, approximately 96%2013, 95.8% and 95%96.8% of our loan portfolio was collateralized, respectively. Collateral is required in accordance with the normal credit evaluation process based upon the creditworthiness of the customer and the credit risk associated with the particular transaction.
The following is a breakdown of the allowance for loan losses by type for as of December 31, 20122014 and 20112013(in (in thousands, except rates):
| December 31, 2012 | December 31, 2011 | December 31, 2014 | December 31, 2013 | |||||||||||||||||||||||||||||
| Balance | Percent(1) | Balance | Percent(1) | Balance | Percent 1 | Balance | Percent 1 | |||||||||||||||||||||||||
Commercial and industrial | $ | 5,450 | 36.4 | % | $ | 2,595 | 29.3 | % | $ | 16,609 | 42.4 | % | $ | 9,832 | 37.7 | % | ||||||||||||||||
Commercial real estate | 691 | 1.5 | 633 | 0.5 | ||||||||||||||||||||||||||||
Consumer | 647 | 51.6 | 510 | 58.2 | 1,255 | 35.8 | 892 | 34.8 | ||||||||||||||||||||||||
Residential real estate | 408 | 8.0 | 679 | 8.1 | 787 | 20.4 | 408 | 25.5 | ||||||||||||||||||||||||
Home equity lines of credit | 195 | 2.4 | — | — | 267 | 0.8 | 174 | 1.1 | ||||||||||||||||||||||||
Commercial real estate | 232 | 0.6 | 198 | 0.8 | ||||||||||||||||||||||||||||
Construction and land | 13 | 0.1 | — | — | — | — | 12 | 0.1 | ||||||||||||||||||||||||
Qualitative | 741 | — | 883 | 3.9 | 1,581 | — | 1,152 | — | ||||||||||||||||||||||||
|
|
|
|
|
|
|
| |||||||||||||||||||||||||
| $ | 8,145 | 100.0 | % | $ | 5,300 | 100.0 | % | $ | 20,731 | 100.0 | % | $ | 12,668 | 100.0 | % | |||||||||||||||||
|
|
|
|
|
| |||||||||||||||||||||||||||
Loan category as a percentage of total loan portfolio. |
At December 31, 20122014 and 2011,2013, Stifel Bank had loans outstanding to its executive officers, directors, and their affiliates in the amount of $0.6 million and $0.8$0.6 million, respectively, and loans outstanding to other Stifel Financial Corp. executive officers, directors, and their affiliates in the amount of $7.2$5.3 million and $4.3$5.9 million, respectively. Such loans and other extensions of credit were made in the ordinary course of business and were made on substantially the same terms (including interest rates and collateral requirements) as those prevailing at the time for comparable transactions with other persons.
At December 31, 20122014 and 2011,2013, we had mortgage loans held for sale of $214.5$121.9 million and $131.8$109.1 million, respectively. For the years ended December 31, 2012, 20112014, 2013, and 2010,2012, we recognized gains of $13.8$7.4 million, $9.7$11.3 million, and $8.3$13.8 million, respectively, from the sale of originated loans, net of fees and costs.
The following is a summary of fixed assets as of December 31, 20122014 and 20112013 (in thousands):
| December 31, | December 31, | |||||||||||||||
| 2012 | 2011 | 2014 | 2013 | |||||||||||||
Furniture and equipment | $ | 157,974 | $ | 147,210 | $ | 194,521 | $ | 174,976 | ||||||||
Building and leasehold improvements | 82,234 | 77,192 | 124,390 | 101,840 | ||||||||||||
Property on operating leases | 46,500 | — | ||||||||||||||
|
|
|
| |||||||||||||
Total | 286,708 | 224,402 | ||||||||||||||
| 318,911 | 276,816 | |||||||||||||||
Less accumulated depreciation and amortization | (145,305 | ) | (119,662 | ) | (194,665 | ) | (170,370 | ) | ||||||||
|
|
|
| |||||||||||||
| $ | 141,403 | $ | 104,740 | $ | 124,246 | $ | 106,446 | |||||||||
|
|
|
| |||||||||||||
For the years ended December 31, 2012, 20112014, 2013, and 2010,2012, depreciation and amortization of furniture and equipment, and leasehold improvements totaled $29.3 million, $34.0 million, and $30.1 million, $28.3 million and $23.8 million, respectively.
As a result of the East Shore acquisition, we lease seven aircraft under operating leases. The future minimum lease payments from UAL required under operating leases at December 31, 2012 were as follows: $12.9 million in 2013, $10.4 million in 2014, $5.3 million in 2015, $1.9 million in 2016 and $1.4 million in 2017.
We test goodwill for impairment on an annual basis and on an interim basis when certain events or circumstances exist. We test for impairment at the reporting unit level, which is generally at the level of or one level below our company’s business segments. For both the annual and interim tests, we have the option to first assess qualitative factors to determine whether the existence of events or circumstances leads to a determination that it is more likely than not that the fair value of a reporting unit is less than its carrying amount. If after assessing the totality of events or circumstances, we determine it is more likely than not that the fair value of a
reporting unit is greater than its carrying amount, then performing the two-step impairment test is not required. However, if we conclude otherwise, we are then required to perform the first step of the two-step impairment test. Goodwill impairment is determined by comparing the estimated fair value of a reporting unit with its respective carrying value. If the estimated fair value exceeds the carrying value, goodwill at the reporting unit level is not deemed to be impaired. If the estimated fair value is below carrying value, however, further analysis is required to determine the amount of the impairment. Additionally, if the carrying value of a reporting unit is zero or a negative value and it is determined that it is more likely than not the goodwill is impaired, further analysis is required. The estimated fair values of the reporting units are derived based on valuation techniques we believe market participants would use for each of the reporting units. Our annual goodwill impairment testing was completed as of July 31, 2012,2014, with no impairment identified.
The carrying amount of goodwill and intangible assets attributable to each of our reporting segments is presented in the following table(in thousands):
| December 31, 2011 | Net additions | Impairment losses | December 31, 2012 | December 31, 2013 | Net Additions | Impairment Losses | December 31, 2014 | |||||||||||||||||||||||||
Goodwill | ||||||||||||||||||||||||||||||||
Global Wealth Management | $ | 143,828 | $ | 549 | $ | — | $ | 144,377 | $ | 161,358 | $ | 15,813 | $ | — | $ | 177,171 | ||||||||||||||||
Institutional Group | 215,160 | 59,856 | — | 275,016 | 565,978 | 51,877 | — | 617,855 | ||||||||||||||||||||||||
|
|
|
|
|
|
|
| |||||||||||||||||||||||||
| $ | 358,988 | $ | 60,405 | $ | — | $ | 419,393 | $ | 727,336 | $ | 67,690 | $ | — | $ | 795,026 | |||||||||||||||||
|
|
|
|
|
|
|
| |||||||||||||||||||||||||
| December 31, 2011 | Net additions | Amortization | December 31, 2012 | December 31, 2013 | Net Additions | Amortization | December 31, 2014 | |||||||||||||||||||||||||
Intangible assets | ||||||||||||||||||||||||||||||||
Global Wealth Management | $ | 18,819 | $ | — | $ | (2,442 | ) | $ | 16,377 | $ | 19,394 | $ | 11,790 | $ | (7,681 | ) | $ | 23,503 | ||||||||||||||
Institutional Group | 15,044 | — | (2,454 | ) | 12,590 | 30,495 | 5,250 | (4,685 | ) | 31,060 | ||||||||||||||||||||||
|
|
|
|
|
|
|
| |||||||||||||||||||||||||
| $ | 33,863 | $ | — | $ | (4,896 | ) | $ | 28,967 | $ | 49,889 | $ | 17,040 | $ | (12,366 | ) | $ | 54,563 | |||||||||||||||
|
|
|
|
|
|
|
| |||||||||||||||||||||||||
The adjustments to goodwill and intangible assets during the year ended December 31, 20122014, are primarily attributable to our acquisitions of Miller BuckfireDe La Rosa, Oriel, 1919 Investment Counsel, and Stone & Youngberg.Merchant. The allocation of the purchase price of Miller Buckfirefor these acquisitions is preliminary and will be finalized upon completion of the analysis of the fair values of the net assets of Miller Buckfireeach respective acquisition as of the respective acquisition datedates and the identified intangible assets. The final goodwill recorded on the consolidated statement of financial condition may differ from that reflected herein as a result of future measurement period adjustments and the recording of identified intangible assets. See Note 3 in the notes to our consolidated financial statements for additional information regarding our acquisition of Miller Buckfire.acquisitions.
Amortizable intangible assets consist of acquired customer relationships, trade name, and investment banking backlog, and non-compete agreements that are amortized over their contractual or determined useful lives. Intangible assets subject to amortization as of December 31, 20122014 and 20112013 were as follows(in thousands):
| December 31, 2012 | December 31, 2011 | December 31, 2014 | December 31, 2013 | |||||||||||||||||||||||||||||
| Gross carrying value | Accumulated amortization | Gross carrying value | Accumulated amortization | Gross Carrying Value | Accumulated Amortization | Gross Carrying Value | Accumulated Amortization | |||||||||||||||||||||||||
Customer relationships | $ | 40,166 | $ | 18,648 | $ | 40,166 | $ | 14,827 | $ | 63,661 | $ | 29,636 | $ | 51,166 | $ | 24,034 | ||||||||||||||||
Trade name | 9,442 | 2,023 | 9,442 | 1,011 | 21,423 | 5,322 | 18,442 | 3,585 | ||||||||||||||||||||||||
Investment banking backlog | 2,250 | 2,220 | 2,250 | 2,157 | 7,388 | 7,388 | 7,388 | 6,871 | ||||||||||||||||||||||||
Core deposits | 5,447 | 4,657 | 5,447 | 182 | ||||||||||||||||||||||||||||
Non-compete agreements | 1,484 | 120 | — | — | ||||||||||||||||||||||||||||
|
|
|
|
|
|
|
| |||||||||||||||||||||||||
| $ | 51,858 | $ | 22,891 | $ | 51,858 | $ | 17,995 | $ | 99,403 | $ | 47,123 | $ | 82,443 | $ | 34,672 | |||||||||||||||||
|
|
|
|
|
|
|
| |||||||||||||||||||||||||
Amortization expense related to intangible assets was $4.9$12.3 million, $5.3$11.8 million, and $5.5$4.9 million for the years ended December 31, 2012, 20112014, 2013, and 2010,2012, respectively.
The weighted-average remaining lives of the following intangible assets at December 31, 20122014, are: customer relationships, 6.15.4 years; core deposits, 2.8 years; trade name, 11.4 years; and trade name, 7.3non-compete agreements, 2.7 years. The investment banking backlog will be amortized over their estimated lives, which we expect to be within the next 12 months. As of December 31, 2012,2014, we expect amortization expense in future periods to be as follows(in thousands):
Fiscal year | ||||||||
2013 | $ | 4,339 | ||||||
2014 | 3,856 | |||||||
2015 | 3,129 | $ | 7,896 | |||||
2016 | 2,829 | 6,504 | ||||||
2017 | 2,447 | 5,931 | ||||||
2018 | 5,443 | |||||||
2019 | 5,237 | |||||||
Thereafter | 12,367 | 21,269 | ||||||
|
| |||||||
| $ | 28,967 | $ | 52,280 | |||||
|
| |||||||
NOTE 12 – Short-Term Borrowings
Our short-term financing is generally obtained through short-term bank line financing on an uncommitted, secured basis, committed short-term bank line financing on an unsecured basis, and securities lending arrangements. We borrow from various banks on a demand basis with company-owned and customer securities pledged as collateral. The value of customer-owned securities used as collateral is not reflected in the consolidated statements of financial condition. Our uncommitted secured lines of credit at December 31, 20122014, totaled $680.0$780.0 million with four banks and are dependent on having appropriate collateral, as determined by the bank agreements, to secure an advance under the line. The availability of our uncommitted lines areis subject to approval by the individual banks each time an advance is requested and may be denied. Our peak daily borrowing was $473.7$414.9 million during the year ended December 31, 2012.2014. There are no compensating balance requirements under these arrangements.
Our committed short-term bank line financing at December 31, 20122014, consisted of a $50.0$100.0 million revolving credit facility. The credit facility expires in December 2013.2017. The applicable interest rate under the revolving credit facility is calculated as a per annum rate equal to the higher of (i) the prime rate, (ii) the federal funds effective rate plus 0.50%, or (iii) one-month Eurocurrency rate plus 1.00%, as defined in the revolving credit facility. At December 31, 2012,2014, we had no advances on our revolving credit facility and were in compliance with all covenants.
At December 31, 2012,2014, we had no short-term borrowings. At December 31, 2013, short-term borrowings from banks were $304.7$55.7 million at an average rate of 1.14%1.22%, which were collateralized by company-owned securities valued at $530.7 million. At December 31, 2011, short-term borrowings from banks were $199.4 million at an average rate of 1.17%, which were collateralized by company-owned securities valued at $388.0$440.8 million. The average bank borrowing was $184.4$97.8 million, $199.6$252.9 million, and $108.8$184.4 million for the years ended December 31, 2012, 20112014, 2013, and 2010,2012, respectively, at average daily interest rates of 1.10%1.12%, 1.15%1.26%, and 1.01%1.10%, respectively.
At December 31, 2012 and 2011, Stifel Nicolaus had a stock loan balance of $19.2 million and $124.7 million, respectively, at average daily interest rates of 0.24% and 0.17%, respectively. The average outstanding securities lending arrangements utilized in financing activities were $137.3$45.8 million, $124.1$91.2 million, and $69.5$137.3 million during the years ended December 31, 2012, 20112014, 2013, and 2010,2012, respectively, at average daily effective interest rates of 0.16%0.17%, 0.30%0.17%, and 0.38%0.16%, respectively. Customer-owned securities were utilized in these arrangements.
NOTE 13 – Corporate DebtSenior Notes
The following table summarizes our corporate debtsenior notes as of December 31, 20122014 and 20112013 (in thousands):
| December 31, | ||||||||
| 2012 | 2011 | |||||||
6.70% senior notes, due 2022(1) | $ | 175,000 | $ | — | ||||
5.375% senior notes, due 2022(2) | 150,000 | — | ||||||
Non-recourse debt, 6.75%, due 2016(3) | 58,992 | — | ||||||
|
|
|
| |||||
| $ | 383,992 | $ | — | |||||
|
|
|
| |||||
| December 31, | ||||||||
| 2014 | 2013 | |||||||
6.70% senior notes, due 20221 | $ | 175,000 | $ | 175,000 | ||||
5.375% senior notes, due 20222 | 150,000 | 150,000 | ||||||
4.250% senior notes, due 20243 | 300,000 | — | ||||||
|
|
|
| |||||
| $ | 625,000 | $ | 325,000 | |||||
|
|
|
| |||||
| In January 2012, we sold in a registered underwritten public offering, $175.0 million in aggregate principal amount of 6.70% senior notes due January 2022. Interest on these senior notes is payable quarterly in arrears. On or after January 15, 2015, we may redeem some or all of the senior notes at any time at a redemption price equal to 100% of the principal amount of the notes being redeemed plus accrued interest thereon to the redemption date. On December 15, 2014, the Company announced that it would redeem 100% of its outstanding 6.70% senior notes on January 15, 2015. |
| In December 2012, we sold in a registered underwritten public offering, $150.0 million in aggregate principal amount of 5.375% senior notes due December 2022. Interest on these senior notes is payable quarterly in arrears. On or after December 31, 2015, we may redeem some or all of the senior notes at any time at a redemption price equal to 100% of the principal amount of the notes being redeemed plus accrued interest thereon to the redemption date. |
Our corporate debt maturessenior notes mature as follows, based upon its contractual terms:
| Non-recourse debt | Senior notes | |||||||||||
2013 | $ | 11,430 | — | |||||||||
2014 | 16,414 | — | ||||||||||
2015 | 24,383 | — | 175,000 | |||||||||
2016 | 6,765 | — | — | |||||||||
2017 | — | — | — | |||||||||
2018 | — | |||||||||||
2019 | — | |||||||||||
Thereafter | — | 325,000 | 450,000 | |||||||||
|
|
| ||||||||||
| $ | 58,992 | 325,000 | 625,000 | |||||||||
|
|
| ||||||||||
Deposits consist of money market and savings accounts, certificates of deposit, and demand deposits. Deposits at December 31, 20122014 and 20112013 were as follows(in thousands):
| December 31, | December 31, | |||||||||||||||
| 2012 | 2011 | 2014 | 2013 | |||||||||||||
Money market and savings accounts | $ | 3,271,929 | $ | 2,024,568 | $ | 4,600,757 | $ | 4,310,223 | ||||||||
Demand deposits (interest-bearing) | 64,926 | 29,509 | 101,652 | 93,684 | ||||||||||||
Certificates of deposit | 77,197 | 241,481 | ||||||||||||||
Demand deposits (non-interest-bearing) | 8,648 | 15,691 | 10,475 | 17,935 | ||||||||||||
Certificates of deposit | 630 | 1,970 | ||||||||||||||
|
|
|
| |||||||||||||
| $ | 3,346,133 | $ | 2,071,738 | $ | 4,790,081 | $ | 4,663,323 | |||||||||
|
|
|
| |||||||||||||
The weighted averageweighted-average interest rate on deposits was 0.1%0.19% and 0.2%0.07% at December 31, 20122014 and 2011,2013, respectively.
Scheduled maturities of certificates of deposit at December 31, 20122014 and 20112013 were as follows(in thousands):
| December 31, | December 31, | |||||||||||||||
| 2012 | 2011 | 2014 | 2013 | |||||||||||||
Certificates of deposit, less than $100: | ||||||||||||||||
Within one year | $ | 182 | $ | 794 | $ | 26,769 | $ | 82,115 | ||||||||
One to three years | 203 | 240 | 6,874 | 34,694 | ||||||||||||
Three to five years | 1,268 | 3,701 | ||||||||||||||
Over five years | — | 66 | ||||||||||||||
|
| |||||||||||||||
|
| $ | 34,911 | $ | 120,576 | |||||||||||
| $ | 385 | $ | 1,034 |
|
| |||||||||||
|
| |||||||||||||||
Certificates of deposit, $100 and greater: | ||||||||||||||||
Within one year | $ | 245 | $ | 656 | $ | 33,784 | $ | 75,577 | ||||||||
One to three years | — | 280 | 7,520 | 41,756 | ||||||||||||
Three to five years | 723 | 3,336 | ||||||||||||||
Over five years | 259 | 236 | ||||||||||||||
|
|
|
| |||||||||||||
| 245 | 936 | 42,286 | 120,905 | |||||||||||||
|
|
|
| |||||||||||||
| $ | 630 | $ | 1,970 | $ | 77,197 | $ | 241,481 | |||||||||
|
|
|
| |||||||||||||
At December 31, 20122014 and 2011,2013, the amount of deposits includes related party deposits, primarily brokerage customers’ deposits from Stifel Nicolaus of $3.3$4.7 billion and $2.1$4.3 billion, respectively, and interest-bearing and time deposits of executive officers, directors, and their affiliates of $0.2$0.3 million and $0.6$0.4 million, respectively. Such deposits were made in the ordinary course of business and were made on substantially the same terms (including interest rates) as those prevailing at the time for comparable transactions with other persons.
NOTE 15 – Derivative Instruments and Hedging Activities
We use interest rate swaps as part of our interest rate risk management strategy. Interest rate swaps generally involve the exchange of fixed and variable rate interest payments between two parties, based on a common notional principal amount and maturity date with no exchange of underlying principal amounts. Interest rate swaps designated as cash flow hedges involve the receipt of variable amounts from a counterparty in exchange for our company making fixed payments. Our policy is not to offset fair value amounts recognized for derivative instruments and fair value amounts recognized for the right to reclaim cash collateral or the obligation to return cash collateral arising from derivative instruments recognized at fair value executed with the same counterparty under master netting arrangements.
The following table provides the notional values and fair values of our derivative instruments as of December 31, 20122014 and 20112013(in (in thousands):
| December 31, 2012 | December 31, 2014 | |||||||||||||||||||||||||||||||||||
| Asset derivatives | Liability derivatives | Asset Derivatives | Liability Derivatives | |||||||||||||||||||||||||||||||||
| Notional value | Balance sheet location | Positive fair value | Balance sheet location | Negative fair value | Notional Value | Balance Sheet Location | Positive Fair Value | Balance Sheet Location | Negative Fair Value | |||||||||||||||||||||||||||
Derivatives designated as hedging instruments under Topic 815: | ||||||||||||||||||||||||||||||||||||
Cash flow interest rate contracts | $ | 550,127 | Other assets | $ | — | Accounts payable and accrued expenses | $ | (19,934 | ) | $ | 272,967 | Other assets | $ | — | Accounts payable and accrued expenses | $ | (5,641 | ) | ||||||||||||||||||
| December 31, 2011 | December 31, 2013 | |||||||||||||||||||||||||||||||||||
| Asset derivatives | Liability derivatives | Asset Derivatives | Liability Derivatives | |||||||||||||||||||||||||||||||||
| Notional value | Balance sheet location | Positive fair value | Balance sheet location | Negative fair value | Notional Value | Balance Sheet Location | Positive Fair Value | Balance Sheet Location | Negative Fair Value | |||||||||||||||||||||||||||
Derivatives designated as hedging instruments under Topic 815: | ||||||||||||||||||||||||||||||||||||
Cash flow interest rate contracts | $ | 761,907 | Other assets | $ | — | Accounts payable and accrued expenses | $ | (24,877 | ) | $ | 386,212 | Other assets | $ | — | Accounts payable and accrued expenses | $ | (9,349 | ) | ||||||||||||||||||
Cash Flow Hedges
We have entered into interest rate swap agreements that effectively modify our exposure to interest rate risk by converting floating rate debt to a fixed rate debt over the next ten years.
Any unrealized gains or losses related to cash flow hedging instruments are reclassified from accumulated other comprehensive loss into earnings in the same period the hedged forecasted transaction affects earnings and are recorded in interest expense on the accompanying consolidated statements of operations. The ineffective portion of the cash flow hedging instruments is recorded in other income or other operating expense. There was no ineffectivenessThe loss recognized during the year ended December 31, 2012.2014, related to ineffectiveness was insignificant.
Amounts reported in accumulated other comprehensive loss related to derivatives will be reclassified to interest expense as interest payments are made on our variable rate deposits. During the next twelve months, we estimate that $8.5$3.8 million will be reclassified as an increase to interest expense.
The following table shows the effect of our company’s derivative instruments in the consolidated statements of operations for the years ended December 31, 2012, 20112014, 2013, and 20102012(in (in thousands):
| Year Ended December 31, 2012 | Year Ended December 31, 2014 | |||||||||||||||||||||||||||||||
| (Gain)/Loss recognized in OCI (effectiveness) | Location of loss reclassified from OCI into income | Loss reclassified from OCI into income | Location of loss recognized in OCI (ineffectiveness) | Loss recognized due to ineffectiveness | Gain/(Loss) Recognized in OCI (Effectiveness) | Location of Loss Reclassified From OCI Into Income | Loss Reclassified From OCI Into Income | Location of Loss Recognized in OCI (Ineffectiveness) | Loss Recognized Due to Ineffectiveness | |||||||||||||||||||||||
Cash flow interest rate contracts | $ | 6,485 | Interest expense | $ | 11,428 | None | $ | — | $ | (2,576 | ) | Interest expense | $ | 6,068 | None | $ | — | |||||||||||||||
| Year Ended December 31, 2011 | Year Ended December 31, 2013 | |||||||||||||||||||||||||||||||
| (Gain)/Loss recognized in OCI (effectiveness) | Location of loss reclassified from OCI into income | Loss reclassified from OCI into income | Location of loss recognized in OCI (ineffectiveness) | Loss recognized due to ineffectiveness | Gain/(Loss) Recognized in OCI (Effectiveness) | Location of Loss Reclassified From OCI Into Income | Loss Reclassified From OCI Into Income | Location of Loss Recognized in OCI (Ineffectiveness) | Loss Recognized Due to Ineffectiveness | |||||||||||||||||||||||
Cash flow interest rate contracts | $ | 29,567 | Interest expense | $ | 13,949 | None | $ | — | $ | 2,644 | Interest expense | $ | 8,593 | None | $ | — | ||||||||||||||||
| Year Ended December 31, 2010 | Year Ended December 31, 2012 | |||||||||||||||||||||||||||||||
| (Gain)/Loss recognized in OCI (effectiveness) | Location of loss reclassified from OCI into income | Loss reclassified from OCI into income | Location of loss recognized in OCI (ineffectiveness) | Loss recognized due to ineffectiveness | Gain/(Loss) Recognized in OCI (Effectiveness) | Location of Loss Reclassified From OCI Into Income | Loss Reclassified From OCI Into Income | Location of Loss Recognized in OCI (Ineffectiveness) | Loss Recognized Due to Ineffectiveness | |||||||||||||||||||||||
Cash flow interest rate contracts | $ | 12,411 | Interest expense | $ | 3,073 | None | $ | — | $ | (6,485 | ) | Interest expense | $ | 11,428 | None | $ | — | |||||||||||||||
We maintain a risk management strategy that incorporates the use of derivative instruments to minimize significant unplanned fluctuations in earnings caused by interest rate volatility. Our goal is to manage sensitivity to changes in rates by hedging the maturity characteristics of variable rate affiliated deposits, thereby limiting the impact on earnings. By using derivative instruments, we are exposed to credit and market risk on those derivative positions. We manage the market risk associated with interest rate contracts by establishing and monitoring limits as to the types and degree of risk that may be undertaken. Credit risk is equal to the extent of the fair value gain in a derivative if the counterparty fails to perform. When the fair value of a derivative contract is positive, this generally indicates that the counterparty owes our company and, therefore, creates a repayment risk for our company. When the fair value of a derivative contract is negative, we owe the counterparty and, therefore, have no repayment risk. See Note 6 in the notes to our consolidated financial statements for further discussion on how we determine the fair value of our financial instruments. We minimize the credit (or repayment) risk in derivative instruments by entering into transactions with high-quality counterparties that are reviewed periodically by senior management.
Credit Risk-Related Contingency Features
We have agreements with our derivative counterparties containing provisions where if we default on any of our indebtedness, including default where repayment of the indebtedness has not been accelerated by the lender, then we could also be declared in default on our derivative obligations.
We have agreements with certain of our derivative counterparties that contain provisions where if our shareholders’ equity declines below a specified threshold or if we fail to maintain a specified minimum shareholders’ equity, then we could be declared in default on our derivative obligations.
Certain of our agreements with our derivative counterparties contain provisions where if a specified event or condition occurs that materially changes our creditworthiness in an adverse manner, we may be required to fully collateralize our obligations under the derivative instrument.
Regulatory Capital-Related Contingency Features
Certain of our derivative instruments contain provisions that require us to maintain our capital adequacy requirements. If we were to lose our status as “adequately capitalized,” we would be in violation of those provisions, and the counterparties of the derivative instruments could request immediate payment or demand immediate and ongoing full overnight collateralization on derivative instruments in net liability positions.
As of December 31, 2012,2014, the fair value of derivatives in a net liability position, which includes accrued interest but excludes any adjustment for nonperformance risk, related to these agreements was $20.8$5.6 million (termination value). We have minimum collateral posting thresholds with certain of our derivative counterparties and have posted cash collateral of $28.9$13.9 million against our obligations under these agreements. If we had breached any of these provisions at December 31, 2012,2014, we would have been required to settle our obligations under the agreements at the termination value.
Counterparty Risk
In the event of counterparty default, our economic loss may be higher than the uncollateralized exposure of our derivatives if we were not able to replace the defaulted derivatives in a timely fashion. We monitor the risk that our uncollateralized exposure to each of our counterparties for interest rate swaps will increase under certain adverse market conditions by performing periodic market stress tests. These tests evaluate the potential additional uncollateralized exposure we would have to each of these derivative counterparties assuming changes in the level of market rates over a brief time period.
NOTE 16 –Debentures to Stifel Financial Capital Trusts
The following table summarizes our debentures to Stifel Financial Capital Trusts as of December 31, 20122014 and 20112013 (in thousands):
| December 31, | ||||||||
| 2012 | 2011 | |||||||
Debenture to Stifel Financial Capital Trust II(1) | $ | 35,000 | $ | 35,000 | ||||
Debenture to Stifel Financial Capital Trust III(2) | 35,000 | 35,000 | ||||||
Debenture to Stifel Financial Capital Trust IV(3) | 12,500 | 12,500 | ||||||
|
|
|
| |||||
| $ | 82,500 | $ | 82,500 | |||||
|
|
|
| |||||
| December 31, | ||||||||
| 2014 | 2013 | |||||||
Debenture to Stifel Financial Capital Trust II1 | $ | 35,000 | $ | 35,000 | ||||
Debenture to Stifel Financial Capital Trust III2 | 35,000 | 35,000 | ||||||
Debenture to Stifel Financial Capital Trust IV3 | 12,500 | 12,500 | ||||||
|
|
|
| |||||
| $ | 82,500 | $ | 82,500 | |||||
|
|
|
| |||||
| On August 12, 2005, we completed a private placement of $35.0 million of 6.38% Cumulative Trust Preferred Securities. The trust preferred securities were offered by Stifel Financial Capital Trust II (the “Trust II”), a non-consolidated wholly owned subsidiary of our company. The trust preferred securities mature on September 30, 2035, but may be redeemed by our company, and in turn, the Trust II would call the debenture beginning September 30, 2010. The Trust II requires quarterly distributions of interest to the holders of the trust preferred securities. Distributions will be payable at a floating interest rate equal to three-month London Interbank Offered Rate (“LIBOR”) plus 1.70% per annum. |
On March 30, 2007, we completed a private placement of $35.0 million of 6.79% Cumulative Trust Preferred Securities. The trust preferred securities were offered by Stifel Financial Capital Trust III (the “Trust III”), a non-consolidated wholly owned subsidiary of our company. The trust preferred securities |
| mature on June 6, 2037, but may be redeemed by our company, and in turn, Trust III would call the debenture beginning June 6, 2012. Trust III requires quarterly distributions of interest to the holders of the trust preferred securities. Distributions will be payable at a floating interest rate equal to three-month LIBOR plus 1.85% per annum. |
| On June 28, 2007, we completed a private placement of $35.0 million of 6.78% Cumulative Trust Preferred Securities. The trust preferred securities were offered by Stifel Financial Capital Trust IV (the “Trust IV”), a non-consolidated wholly owned subsidiary of our company. The trust preferred securities mature on September 6, 2037, but may be redeemed by our company, and in turn, Trust IV would call the debenture beginning September 6, 2012. Trust IV requires quarterly distributions of interest to the holders of the trust preferred securities. Distributions will be payable at a floating interest rate equal to three-month LIBOR plus 1.85% per annum. |
NOTE 17 – Disclosures About Offsetting Assets and Liabilities The following table provides information about financial assets and derivative assets that are subject to SubordinatedClaims of General Creditors
Stifel Nicolaus maintains a deferred compensation plan for its financial advisors who achieve certain levels of production, whereby a certain percentage of their earnings are deferred as defined by the plan, a portion of which is deferred in stock units and the balance into optional investment choices. We obtained approval from Financial Industry Regulatory Authority, Inc. (“FINRA”) and its predecessor, the New York Stock Exchange, to subordinate the liability for future payments for the portion of compensation that is not deferred in stock units. Required annual payments,offset as of December 31, 2012, are as follows2014 and 2013(in (in thousands):
Distribution – January 31, | Plan year | Total | ||||||
2013 | 2007 | 2,187 | ||||||
2014 | 2008 | 3,131 | ||||||
|
| |||||||
| $ | 5,318 | |||||||
|
| |||||||
| Gross amounts not offset in the Statement of Financial Condition | ||||||||||||||||||||||||
| Gross Amounts of Recognized Assets | Gross Amounts Offset in the Statement of Financial Condition | Net Amounts Presented in the Statement of Financial Condition | Financial Instruments | Collateral Received | Net Amount | |||||||||||||||||||
As of December 31, 2014: | ||||||||||||||||||||||||
Securities borrowing1 | $ | 445,542 | $ | — | $ | 445,542 | $ | — | $ | (431,301 | ) | $ | 14,241 | |||||||||||
Reverse repurchase agreements2 | 55,078 | $ | — | 55,078 | — | (54,955 | ) | 123 | ||||||||||||||||
|
|
|
|
|
|
|
|
|
|
|
| |||||||||||||
| $ | 500,620 | $ | — | $ | 500,620 | $ | — | $ | (486,256 | ) | $ | 14,364 | ||||||||||||
|
|
|
|
|
|
|
|
|
|
|
| |||||||||||||
As of December 31, 2013: | ||||||||||||||||||||||||
Securities borrowing1 | $ | 227,640 | $ | — | $ | 227,640 | $ | — | $ | (219,992 | ) | $ | 7,648 | |||||||||||
Reverse repurchase agreements2 | 225,075 | — | 225,075 | — | (224,566 | ) | 509 | |||||||||||||||||
|
|
|
|
|
|
|
|
|
|
|
| |||||||||||||
| $ | 452,715 | $ | — | $ | 452,715 | $ | — | $ | (444,558 | ) | $ | 8,157 | ||||||||||||
|
|
|
|
|
|
|
|
|
|
|
| |||||||||||||
| 1 | Securities borrowing transactions are included in receivables from brokers, dealers, and clearing organizations on the consolidated statements of financial condition. See Note 5 in the notes to consolidated financial statements for additional information on receivables from brokers, dealers, and clearing organizations. |
| 2 | Collateral received includes securities received by our company from the counterparty. These securities are not included on the consolidated statements of financial condition unless there is an event of default. |
The subordinatedfollowing table provides information about financial liabilities and derivative liabilities that are subject to cash subordination agreements approved by FINRA and, therefore, are included in our computation of net capital under the SEC’s Uniform Net Capital Rule. We have estimated the fair value of the liability to be $5.2 millionoffset as of December 31, 2012.2014 and 2013 (in thousands):
| Gross amounts not offset in the Statement of Financial Condition | ||||||||||||||||||||||||
| Gross Amounts of Recognized Liabilities | Gross Amounts Offset in the Statement of Financial Condition | Net Amounts Presented in the Statement of Financial Condition | Financial Instruments | Collateral Pledged | Net Amount | |||||||||||||||||||
As of December 31, 2014: | ||||||||||||||||||||||||
Securities lending3 | $ | (4,215 | ) | $ | — | $ | (4,215 | ) | $ | — | $ | 3,892 | $ | (323 | ) | |||||||||
Repurchase agreements4 | (39,180 | ) | — | (39,180 | ) | — | 39,089 | (91 | ) | |||||||||||||||
Cash flow interest rate contracts | (5,641 | ) | — | (5,641 | ) | — | 5,641 | — | ||||||||||||||||
|
|
|
|
|
|
|
|
|
|
|
| |||||||||||||
| $ | (49,036 | ) | $ | — | $ | (49,036 | ) | $ | — | $ | 48,622 | $ | (414 | ) | ||||||||||
|
|
|
|
|
|
|
|
|
|
|
| |||||||||||||
As of December 31, 2013: | ||||||||||||||||||||||||
Securities lending3 | $ | (40,101 | ) | $ | — | $ | (40,101 | ) | $ | — | $ | 38,900 | $ | (1,201 | ) | |||||||||
Repurchase agreements4 | (263,809 | ) | — | (263,809 | ) | — | 273,413 | 9,604 | ||||||||||||||||
Cash flow interest rate contracts | (9,349 | ) | — | (9,349 | ) | — | 9,349 | — | ||||||||||||||||
|
|
|
|
|
|
|
|
|
|
|
| |||||||||||||
| $ | (313,259 | ) | $ | — | $ | (313,259 | ) | $ | — | $ | 321,662 | $ | 8,403 | |||||||||||
|
|
|
|
|
|
|
|
|
|
|
| |||||||||||||
| 3 | Securities lending transactions are included in payables to brokers, dealers, and clearing organizations on the consolidated statements of financial condition. See Note 5 in the notes to consolidated financial statements for additional information on payables to brokers, dealers, and clearing organizations. |
| 4 | Collateral pledged includes the fair value of securities pledged by our company to the counter party. These securities are included on the consolidated statements of financial condition unless we default. |
NOTE 18 – Commitments, Guarantees, and Contingencies
Broker-Dealer Commitments and Guarantees
In the normal course of business, we enter into underwriting commitments. Settlement of transactions relating to such underwriting commitments, which were open at December 31, 2012,2014, had no material effect on the consolidated financial statements.
In connection with margin deposit requirements of The Options Clearing Corporation, we pledged customer-owned securities valued at $109.7$62.3 million to satisfy the minimum margin deposit requirement of $52.2 million at December 31, 2012.2014.
In connection with margin deposit requirements of the National Securities Clearing Corporation, we deposited $17.0$23.2 million in cash at December 31, 2012, which satisfiedto satisfy the minimum margin deposit requirements of $13.2 million.requirement at December 31, 2014.
We also provide guarantees to securities clearinghouses and exchanges under their standard membership agreement, which requires members to guarantee the performance of other members. Under the agreement, if another member becomes unable to satisfy its obligations to the clearinghouse, other members would be required to meet shortfalls. Our liability under these agreements is not quantifiable and may exceed the cash and securities we have posted as collateral. However, the potential requirement for us to make payments under these arrangements is considered remote. Accordingly, no liability has been recognized for these arrangements.
Thomas Weisel Partners LLC (“TWP”) has entered into settlement and release agreements (“Settlement Agreements”) with certain customers, whereby it will purchase their ARS, at par, in exchange for a release from any future claims. At December 31, 2012,2014, we estimate that TWP customers held $18.4$15.2 million par value of ARS, which may be repurchased over the next 3 years.year. The amount estimated for repurchase assumes no issuer redemptions.
We have recorded a liability for our estimated exposure to the repurchase plan based upon a net present value calculation, which is subject to change and future events, including redemptions. ARS redemptions have been at par, and we believe will continue to be at par over the remaining repurchase period. Future periods’ results may be affected by changes in estimated redemption rates or changes in the fair value of ARS.
Other Commitments
In the ordinary course of business, Stifel Bank has commitments to extend credit in the form of commitments to originate loans, standby letters of credit, and lines of credit. See Note 2223 in the notes to our consolidated financial statements for further details.
We have committed capital to certain entities, and these commitments generally have no specified call dates. We had $32.1 million of commitments outstanding at December 31, 2014, of which $20.6 million relate to commitments to certain strategic relationships with Business Development Corporations.
Concentration of Credit Risk
We provide investment, capital-raising, and related services to a diverse group of domestic customers, including governments, corporations, and institutional and individual investors. Our exposure to credit risk associated with the non-performance of customers in fulfilling their contractual obligations pursuant to securities transactions can be directly impacted by volatile securities markets, credit markets, and regulatory changes. This exposure is measured on an individual customer basis and on a group basis for customers that share similar attributes. To reduce the potential for risk concentrations, counterparty credit limits have been implemented for certain products and are continually monitored in light of changing customer and market conditions. As of December 31, 20122014 and 2011,2013, we did not have significant concentrations of credit risk with any one customer or counterparty, or any group of customers or counterparties.
Operating Leases and Purchase Obligations
Future minimum commitments under non-cancelable operating leases at December 31, 20122014, are as follows(in thousands):
2013 | $ | 53,830 | ||||||
2014 | 47,927 | |||||||
2015 | 41,043 | $ | 78,683 | |||||
2016 | 32,814 | 72,041 | ||||||
2017 | 23,696 | 62,201 | ||||||
2018 | 53,670 | |||||||
2019 | 48,172 | |||||||
Thereafter | 39,381 | 164,991 | ||||||
|
| |||||||
| $ | 238,691 | $ | 479,758 | |||||
|
| |||||||
Certain leases contain provisions for renewal options and escalation clauses based on increases in certain costs incurred by the lessor. We amortize office lease incentives and rent escalation on a straight-line basis over the life of the lease. Rent expense for the years ended December 31, 2014, 2013, and 2012 2011 and 2010 was $60.0$83.5 million, $58.6$79.8 million, and $53.9$60.0 million, net of sublease income of $0.5 million, $1.9 million and $1.2 million, respectively.income.
NoteNOTE 19 – Legal Proceedings
Our company and its subsidiaries are named in and subject to various proceedings and claims arising primarily from our securities business activities, including lawsuits, arbitration claims, class actions, and regulatory matters. Some of these claims seek substantial compensatory, punitive, or indeterminate damages. Our company and its subsidiaries are also involved in other reviews, investigations, and proceedings by governmental and self-regulatory organizations regarding our business, which may result in adverse judgments, settlements, fines, penalties, injunctions, and other relief. We are contesting the allegations in these claims, and we believe that there are meritorious defenses in each of these lawsuits, arbitrations, and regulatory investigations. In view of the number and diversity of claims against theour company, the number of jurisdictions in which litigation is pending, and the inherent difficulty of predicting the outcome of litigation and other claims, we cannot state with certainty what the eventual outcome of pending litigation or other claims will be.
We have established reserves for potential losses that are probable and reasonably estimable that may result from pending and potential legal actions, investigations, and regulatory proceedings. In many cases, however, it is inherently difficult to determine whether any loss is probable or even possible or to estimate the amount or
range of any potential loss, particularly where proceedings may be in relatively early stages or where plaintiffs are seeking substantial or indeterminate damages. Matters frequently need to be more developed before a loss or range of loss can reasonably be estimated.
In our opinion, based on currently available information, review with outside legal counsel, and consideration of amounts provided for in our consolidated financial statements with respect to these matters, including the matters described below, the ultimate resolution of these matters will not have a material adverse impact on our financial position and results of operations. However, resolution of one or more of these matters may have a material effect on the results of operations in any future period, depending upon the ultimate resolution of those matters and depending upon the level of income for such period. For matters where a reserve has not been established and for which we believe a loss is reasonably possible, as well as for matters where a reserve has been recorded but for which an exposure to loss in excess of the amount accrued is reasonably possible, based on currently available information, we believe that such losses will not have a material effect on our consolidated financial statements.
SEC/Wisconsin Lawsuit
The SEC filed a civil lawsuit against our company in U.S. District Court for the Eastern District of Wisconsin on August 10, 2011. The action arises out of our role in investments made by five Southeastern Wisconsin school districts (the “school districts”) in transactions involving collateralized debt obligations (“CDOs”). TheseThis lawsuit relates to the same transactions that are described in more detail below in connection withthe subject of the civil lawsuit filed by the school districts.districts noted below. The SEC has asserted claims under Section 15c(1)(A), Section 10b, and Rule 10b-5 of the Exchange Act and Sections 17a(1), 17a(2), and 17a(3) of the Securities Act. The claims are based upon both alleged misrepresentations and omissions in connection with the sale of the CDOs to the school districts, as well as the allegedly unsuitable nature of the CDOs. On October 31, 2011,We have denied the substantive allegations of the SEC complaint, as amended, and asserted various affirmative defenses. The parties are currently taking written discovery and depositions, with all discovery scheduled to close in April 2015. After close of discovery, we filed a motion to dismissanticipate the action for failure to state a claim. The District Court granted in part and denied in part our motion to dismiss, and as a resultwill set the SEC has amended its complaint.case for trial. We believe, based upon currently available information and review with outside counsel, that we have meritorious defenses to the SEC’s lawsuit and intend to vigorously defend the SEC’s claims.
Wisconsin School Districts/RBC OPEB lawsuit
We were named in a civil lawsuit filed in the Circuit Court of Milwaukee, Wisconsin (the “Wisconsin State Court”) on September 29, 2008. The lawsuit was filed against our company, Stifel, Nicolaus, as well as Royal Bank of Canada Europe Ltd. (“RBC”), and certain other RBC entities (collectively the “RBC entities”of its affiliates (“RBC”) by the school districts and the individual trustees for other post-employment benefit (“OPEB”) trusts established by those school districts (collectively the “Plaintiffs”). This lawsuit relates to the same transactions that are the subject of the SEC action noted above. As we previously disclosed, weWe entered into a settlement of the Plaintiffs’ lawsuit against our company and Stifel in March 2012. The settlement provides the potential for the Plaintiffs to obtain significant additional damages from the RBC entities. The school districts are continuing their lawsuit against RBC, and we are pursuing claims against the RBC entities to recover payments we have made to the school districts and for amounts owed to the OPEB trusts. Subsequent to the settlement, RBC asserted claims against the school districts, and our company, and Stifel for fraud, negligent misrepresentation, strict liability misrepresentation, and information negligently provided for the guidance of others based upon our role in connection with the school districts’ purchase of the CDOs. RBC has also asserted claims against our companyStifel for civil conspiracy and conspiracy to injure inits business based upon our company’sthe settlement by Stifel with the school districts and pursuit of claims against RBC. We have filed our Answer, denying RBC’s claims, and discovery continues in the RBC entities.case. We believe we have meritorious legal and factual defenses to the claims asserted by RBC and we intend to vigorously defend those claims.
TWP LLC FINRA Matter
On April 28, 2010, FINRA commenced an administrative proceeding against TWP involving a transaction undertaken by a former employee in which approximately $15.7 million of ARS were sold from a TWPG account to the accounts of three customers. FINRA alleged that TWP violated various NASD and FINRA rules, as well as Section 10(b) of the Securities Exchange Act and Rule 10b-5. TWP’s answer denied the substantive allegations and asserted various affirmative defenses. TWP repurchased the ARS at issue from the customers at par. FINRA sought fines and other relief against TWP and the former employee.
On November 8, 2011, the FINRA hearing panel fined TWP $0.2 million for not having adequate supervisory procedures governing principal transactions in violation of NASD rules and ordered TWP to pay certain administrative fees and costs. The FINRA hearing panel dismissed all other charges against TWP and the former employee. On February 15, 2013, the National Adjudicatory Council dismissed FINRA’s appeal, which affirmed the hearing panel’s decision as the final decision of FINRA.
EDC Bond Issuance Matter
OnIn January 16, 2012,2008, our company and Stifel Nicolaus were named as defendants in a suit filed in Wisconsin state court with respect to Stifel Nicolaus’ role aswas the initial purchaser inof a $50.0 million bond offering under Rule 144A in January 2008. The bonds were issued by the Lake of the Torches Economic Development Corporation (“EDC”) in connection, which is associated with certain new financing for the construction of a proposed new casino, as well as refinancing of indebtedness involving Lac Du Flambeau Band of Lake Superior Chippewa Indians (the(together with EDC, the “Tribe”). We then sold all of the bonds to LDF Acquisition LLC, a special purpose vehicle created by Saybrook Tax Exempt Investors LLC (collectively, “Saybrook”), who are alsowith Wells Fargo Bank, NA (“Wells Fargo”) as the indenture trustee for the bonds. In 2009, Saybrook and Wells Fargo brought an action in a Wisconsin federal court against the Tribe to enforce the bonds (the “2009 federal action”). The Wisconsin federal court declared, in relevant part, the Bond Indenture to be void ab initio, and the Seventh Circuit Court of Appeals affirmed but remanded the case for further proceedings as to enforceability of the other bond documents. In April 2012, Saybrook dismissed the 2009 federal action.
On January 16, 2012, Saybrook filed a new action in Wisconsin state court (the “State Action”), naming as defendants inour company, Stifel, the action, together withTribe, and the law firm of Godfrey & Kahn, S.C. (“G&K”) who, which served as both issuer’s counsel and bond counsel incounsel. Saybrook seeks enforcement of the transaction. In an action in federal court in Wisconsin relatedobligations under the bonds, a judgment for rescission, restitution (including the amounts paid by Saybrook for the bonds), and costs. Alternatively, if Saybrook fails to the transaction, EDC was successful in its assertion that the bond indenture was void as an unapproved “management contract” under National Indian Gaming Commission regulations, and that accordingly the Tribe’s waiver of sovereign immunity contained in the indenture was void. After a remandrecover from the Seventh Circuit Court of Appeals,Tribe, Saybrook seeks to recover damages, costs, and attorneys’ fees from us and/or G&K. In the State Action, Saybrook asserts a new federal action continues regarding the validity of the bond documents other than the bond indenture, andclaim against our company for fraud under the Wisconsin Uniform Securities Law, and with respect to Stifel, Nicolaus are defendants in this new federal action.
Saybrook Tax Exempt Investors LLC, a qualified institutional buyer and the sole bondholder through its special purpose vehicle LDF Acquisition LLC (collectively, “Saybrook”), and Wells Fargo Bank, NA (“Wells Fargo”), indenture trustee for the bonds (collectively, “plaintiffs”), also brought a Wisconsin state court suit against EDC, our company and G&K, based on alleged misrepresentations about the enforceability of the indenture and the bonds and the waiver of sovereign immunity. The parties have agreed to stay the state court action until the federal court rules on whether it has jurisdiction over the new federal action. Saybrook is the plaintiff in the new federal action and in the state court action. The plaintiffs allege that G&K represented in various legal opinions issued in the transaction, as well as in other documents associated with the transaction, that (i) the bonds and indenture were legally enforceable obligations of EDC and (ii) EDC’s waivers of sovereign immunity were valid. The claims asserted against us are for breaches of implied warranties of validity and title, securities fraud and statutory misrepresentation under Wisconsin state law, and intentional and negligent misrepresentations relating to the validity of the bond documents and the Tribe’s waiver of itstheir sovereign immunity. To the extent EDC does not fully perform its obligations toimmunity waivers. Saybrook pursuant to the bonds, the plaintiffs seek a judgmentalso asserts claims against Stifel for rescission restitutionary damages, includingbased on alleged misrepresentation or mutual mistake.
We have answered the amounts paid byComplaint in the plaintiffs forState Action, denying the bonds,claims, and costs; alternatively,filed cross-claims against the plaintiffs seek to recover damages, costsTribe and attorneys’ fees from us. On May 2, 2012, we filed a motionG&K. The Tribe moved to dismiss all ofour cross-claim, but on November 6, 2014, the court denied that motion. The Tribe also moved to dismiss Saybrook’s claims alleged against our company and Stifel Nicolaus inthem on the new federalgrounds that the state court action. The case is currently stayed while the federal court considers whether it has jurisdiction over the lawsuit. If the federal court determines it does not have jurisdiction over them due to assertions that they have sovereign immunity from suit. On October 23, 2014, the state court denied the Tribe’s motion to dismiss Saybrook’s claims against the Tribe. The Tribe filed a petition for leave to appeal the non-final orders denying their motions to dismiss Stifel’scross-claims and Saybrook’s claims. On January 30, 2015, the Wisconsin Court of Appeals denied the Tribe’s petition, thereby allowing the State Action to move forward against the Tribe. Additionally, G&K filed a cross-claim against us seeking contribution and alleging that if G&K is found negligent, then we, too, must have been negligent. We have answered G&K’s cross-claim, denying those allegations. Additionally, G&K filed a third-party complaint against Dentons US LLP. Written discovery is ongoing between all the parties in the State Action.
Additionally, on April 25, 2013, the Tribe filed a suit against Saybrook, our company, Stifel, G&K, and Wells Fargo in the Lac du Flambeau Tribal Court, seeking a declaration that all of the bond documents are void (the “Tribal Action”). Our motion to dismiss the Tribal Action was denied, and on August 27, 2013 we filed an Answer, denying the claims.
In response to the Tribal Action, on May 24, 2013, we, together with Saybrook, Wells Fargo, and G&K, also filed an action will continue in a Wisconsin state court. federal court (the “Federal Action”) seeking to enjoin the Tribal Action. On May 16, 2014 the Wisconsin federal court preliminarily enjoined the Tribal Parties from litigating the Tribal Action. The Tribal Parties have appealed the preliminary injunction to the Seventh Circuit Court of Appeals. In light of the Tribal Parties’ appeal, the Tribal Action is stayed pending the resolution of the appeal. The appeal has been fully briefed by the parties and is scheduled for oral argument before the Seventh Circuit Court of Appeals on April 9, 2015.
While there can be no assurance that we will be successful, based upon currently available information and review with outside counsel, we believe that we have meritorious legal and factual defenses to the matter, and we intend to vigorously defend the claims.
Lac Courte Orielles Tribal lawsuit
On December 13, 2012,substantive claims as well as the procedural attempt to move the litigation to the Lac Courte Oreilles Band of Lake Superior Chippewa Indians of Wisconsin (the “Tribe”) filed a civil lawsuit against Stifel Nicolaus in the Tribe’sdu Flambeau Tribal Court (the “Tribal Lawsuit”). In December 2006, the Tribe issued two series of taxable municipal bonds as a means of raising revenue to fund various projects (the “2006 Bond Transaction”), including the refinancing of two series of bonds the Tribe issued in 2003. The Complaint alleges that we undertook to advise the Tribe regarding its financing options in 2006 but failed to disclose certain information before the 2006 Bond Transaction. On February 19, 2013 we filed a declaratory judgment action seeking to establish jurisdiction of the Tribal Lawsuit in the United States District Court for the Western District of Wisconsin. On February 20, 2013, we filed a motion to dismiss the Tribal Lawsuit, challenging the jurisdiction of the Tribal Court. We believe, based upon currently available information and review with outside counsel, that we have meritorious defenses to the Tribe’s claims and intend to vigorously defend the allegations.
NOTE 20 – Regulatory Capital Requirements
We operate in a highly regulated environment and are subject to capital requirements, which may limit distributions to our company from its subsidiaries. Distributions from our broker-dealer subsidiaries are subject to net capital rules. A broker-dealer that fails to comply with the SEC’s Uniform Net Capital Rule (Rule 15c3-1) may be subject to disciplinary actions by the SEC and self-regulatory organizations, such as FINRA, including censures, fines, suspension, or expulsion. Stifel Nicolaus has chosen to calculate its net capital under the alternative method, which prescribes that their net capital shall not be less than the greater of $1.0 million or two percent of aggregate debit balances (primarily receivables from customers) computed in accordance
with the SEC’s Customer Protection Rule (Rule 15c3-3). KBW, CSA, calculates itsMerchant, and Miller Buckfire calculate their net capital under the aggregate indebtedness method, whereby itstheir aggregate indebtedness may not be greater than fifteen times itstheir net capital (as defined).
At December 31, 2012,2014, Stifel Nicolaus had net capital of $411.2$369.6 million, which was 77.8%63.3% of aggregate debit items and $400.7$357.9 million in excess of its minimum required net capital. At December 31, 2012,2014, KBW’s, CSA’s, Merchant’s, and Miller Buckfire’s net capital exceeded the minimum net capital required under the SEC rule.
Our international subsidiary,subsidiaries, SNEL, isOriel, and KBW Limited, are subject to the regulatory supervision and requirements of the Financial ServicesConduct Authority (“FSA”FCA”) in the United Kingdom. At December 31, 2012,2014, SNEL’s, Oriel’s, and KBW Limited’s capital and reserves were in excess of the financial resources requirement under the rules of the FSA.
Our Canadian subsidiary, SN Canada, is subject to the regulatory supervision and requirements of the Investment Industry Regulatory Organization of Canada (“IIROC”). At December 31, 2012, SN Canada’s net capital and reserves were in excess of the financial resources requirement under the rules of the IIROC.FCA.
Our company, as a bank holding company, and Stifel Bank are subject to various regulatory capital requirements administered by the Federal and state banking agencies. Failure to meet minimum capital requirements can initiate certain mandatory and possibly additional discretionary actions by regulators that, if undertaken, could have a direct material effect on our company’s and Stifel Bank’s financial results. Under capital adequacy guidelines and the regulatory framework for prompt corrective action, our company and Stifel Bank must meet specific capital guidelines that involve quantitative measures of our assets, liabilities, and certain off-balance-sheetoff-balance sheet items as calculated under regulatory accounting practices. Our company’s and Stifel Bank’s capital amounts and classification are also subject to qualitative judgments by the regulators about components, risk weightings, and other factors.
Quantitative measures established by regulation to ensure capital adequacy require our company, as a bank holding company, and Stifel Bank to maintain minimum amounts and ratios of total and Tier 1 capital (as defined in the regulations) to risk-weighted assets (as defined), and Tier 1 capital to average assets (as defined). To be categorized as “well capitalized,” our company and Stifel Bank must maintain total risk-based, Tier 1 risk-based, and Tier 1 leverage ratios as set forth in the tables below(in thousands, except ratios).
Stifel Financial Corp. – Federal Reserve Capital Amounts
December 31, 20122014
| Actual | For Capital Adequacy Purposes | To Be Well Capitalized Under Prompt Corrective Action Provisions | Actual | For Capital Adequacy Purposes | To Be Well Capitalized Under Prompt Corrective Action Provisions | |||||||||||||||||||||||||||||||||||||||||||
| Amount | Ratio | Amount | Ratio | Amount | Ratio | Amount | Ratio | Amount | Ratio | Amount | Ratio | |||||||||||||||||||||||||||||||||||||
Total capital to risk-weighted assets | $ | 1,073,676 | 27.0 | % | $ | 317,804 | 8.0 | % | $ | 397,255 | 10.0 | % | $ | 1,406,221 | 25.4 | % | $ | 443,234 | 8.0 | % | $ | 554,043 | 10.0 | % | ||||||||||||||||||||||||
Tier 1 capital to risk-weighted assets | 1,065,531 | 26.8 | 158,902 | 4.0 | 238,353 | 6.0 | 1,385,351 | 25.0 | 221,617 | 4.0 | 332,426 | 6.0 | ||||||||||||||||||||||||||||||||||||
Tier 1 capital to adjusted average total assets | 1,065,531 | 17.7 | 241,210 | 4.0 | 301,513 | 5.0 | 1,385,351 | 16.5 | 336,160 | 4.0 | 420,200 | 5.0 | ||||||||||||||||||||||||||||||||||||
Stifel Bank – Federal Reserve Capital Amounts
December 31, 20122014
| Actual | For Capital Adequacy Purposes | To Be Well Capitalized Under Prompt Corrective Action Provisions | Actual | For Capital Adequacy Purposes | To Be Well Capitalized Under Prompt Corrective Action Provisions | |||||||||||||||||||||||||||||||||||||||||||
| Amount | Ratio | Amount | Ratio | Amount | Ratio | Amount | Ratio | Amount | Ratio | Amount | Ratio | |||||||||||||||||||||||||||||||||||||
Total capital to risk-weighted assets | $ | 256,352 | 12.0 | % | $ | 171,471 | 8.0 | % | $ | 214,339 | 10.0 | % | $ | 443,727 | 13.6 | % | $ | 261,881 | 8.0 | % | $ | 327,351 | 10.0 | % | ||||||||||||||||||||||||
Tier 1 capital to risk-weighted assets | 248,207 | 11.6 | 85,736 | 4.0 | 128,603 | 6.0 | 422,996 | 12.9 | 130,940 | 4.0 | 196,410 | 6.0 | ||||||||||||||||||||||||||||||||||||
Tier 1 capital to adjusted average total assets | 248,207 | 7.3 | 136,257 | 4.0 | 170,322 | 5.0 | 422,996 | 8.3 | 203,940 | 4.0 | 254,925 | 5.0 | ||||||||||||||||||||||||||||||||||||
NOTE 21 – Interest Income and Interest Expense The components of interest income and interest expense are as follows(in thousands): Interest income: Investment securities Bank loans, net of unearned income Margin balances Other Interest expense: Senior notes Bank deposits Other NOTE 22 –Employee Incentive, Deferred Compensation, and Retirement Plans Year Ended December 31, 2014 2013 2012 $ 71,526 $ 62,155 $ 45,946 71,167 38,608 28,595 19,095 18,222 19,079 24,181 23,554 15,085 $ 185,969 $ 142,539 $ 108,705 $ 26,617 $ 20,648 $ 11,777 7,926 11,775 15,013 6,718 13,945 6,580 $ 41,261 $ 46,368 $ 33,370
We maintain several incentive stock award plans that provide for the granting of stock options, stock appreciation rights, restricted stock, performance awards, and stock units to our employees. We are permitted to issue new shares under all stock award plans approved by shareholders or to reissue our treasury shares. Awards under our company’s incentive stock award plans are granted at market value at the date of grant. The awards generally vest ratably over a three- to eight-year vesting period. Options expire ten years from the date of grant.
All stock-based compensation plans are administered by the Compensation Committee of the Board of Directors (“Compensation Committee”), which has the authority to interpret the plans, determine to whom awards may be granted under the plans, and determine the terms of each award. According to these plans, we are authorized to grant an additional 7.73.6 million and 5.1 million shares at December 31, 2012.2014 and 2013, respectively.
Stock-based compensation expense included in compensation and benefits expense in the consolidated statements of operations for our company’s incentive stock award plans was $51.4$118.4 million, $29.5$131.8 million, and $203.8$51.4 million for the years ended December 31, 2012, 20112014, 2013, and 2010,2012, respectively. The tax benefit related to stock-based compensation recognized in shareholders’ equity was $16.7$19.9 million, $24.9$12.0 million, and $17.5$16.7 million for the years ended December 31, 2012, 20112014, 2013, and 2010,2012, respectively.
Modification of Deferred Compensation Plan
On August 3, 2010, the Compensation Committee approved the modificationclosing dates of the existing Stifel Nicolaus Wealth Accumulation Plan (the “SWAP Plan”) to align the requirements for vesting with thatacquisition of the TWPG deferred compensation plan, whereby forfeiture would not result from an event of termination, except termination for cause, provided that the employee does not compete with our company or violate non-solicitation provisions during the remaining termOriel and 1919 Investment Counsel, we granted restricted stock units to certain employees as retention. The fair value of the award. This action accelerated the non-cash compensation expenseawards issued as retention was $17.9 million. There are no continuing service requirements associated with all outstanding deferred compensation awards asthese restricted stock units, and accordingly, they were expensed at date of August 9, 2010, resulting in agrant. This charge of $179.5 million (pre-tax), which is included in compensation and benefits expense in the consolidated statementsstatement of operations.operations for the year ended December 31, 2014.
Under the provisionsOn closing date of the modified SWAP Plan, future deferred compensation awards toour acquisition of KBW, Inc., certain employees will continue to be subject to continued serviceof KBW, Inc. and employment requirements with the grant dateour company were granted restricted stock or restricted stock units of Stifel as retention. The fair value of the awards amortizedissued as compensation expense over the required service period, which is typically three to eight years; however, participants who wish to leave our company and whose awards have not met theretention was $30.6 million. There are no continuing service requirements associated with these restricted stock units, and accordingly, they were expensed at date of grant. This charge is included in compensation and benefits in the consolidated statement of operations for vesting at that time may seek the approvalyear ended December 31, 2013.
On the closing date of the SWAP Plan’s administrative committee to receive those awards. Upon receipt of approval, the employee’s awards will continue to vest over the remaining service periodacquisition of the award provided that the employee executes a non-compete, non-solicitation agreement, which will be effective over the remaining termKnight Capital Fixed Income business, we granted restricted stock units to certain employees as retention. The fair value of the award. The removalawards issued as retention was $20.1 million. There are no continuing service requirements associated with these restricted stock units, and accordingly, they were expensed at date of grant. This charge is included in compensation and benefits in the service requirement by the administrative committee will result in a non-cash compensation chargeconsolidated statement of operations for the unvested portion at the time of the approval.year ended December 31, 2013.
Stock Options
We have substantially eliminated the use of stock options as a form of compensation. During the year ended December 31, 2012,2014, no options were granted.
A summary of option activity under the plans as of December 31, 2012,2014, and changes during the year then ended is presented below(in thousands, except exercise price and contractual terms):
| Options | Weighted- average exercise price | Weighted- average remaining contractual term | Aggregate intrinsic value | Options | Weighted- average exercise price | Weighted- average remaining contractual term | Aggregate intrinsic value | |||||||||||||||||||||||||
Outstanding December 31, 2011 | 983 | $ | 9.38 | |||||||||||||||||||||||||||||
Outstanding December 31, 2013 | 160 | $ | 26.99 | |||||||||||||||||||||||||||||
Granted | — | — | — | — | ||||||||||||||||||||||||||||
Exercised | (727 | ) | 5.74 | 34 | 48.10 | |||||||||||||||||||||||||||
Forfeited | — | — | — | — | ||||||||||||||||||||||||||||
Expired | (7 | ) | 11.60 | — | — | |||||||||||||||||||||||||||
|
|
|
|
|
|
|
| |||||||||||||||||||||||||
Outstanding December 31, 2012 | 249 | $ | 19.95 | 2.78 | $ | 4,126 | ||||||||||||||||||||||||||
Outstanding December 31, 2014 | 126 | $ | 31.61 | 2.08 | $ | 3,256 | ||||||||||||||||||||||||||
|
|
|
|
|
|
|
| |||||||||||||||||||||||||
At December 31, 2012,2014, all outstanding options were exercisable. The total intrinsic value of options exercised during the years ended December 31, 2014, 2013, and 2012 2011, and 2010 was $19.2$1.6 million, $3.7$2.8 million, and $13.9 million, respectively. At December 31, 2011, all outstanding options were exercisable. The fair value of options vested during the years ended December 31, 2011, and 2010 was $0.7 million and $2.9$19.2 million, respectively. Cash proceeds from the exercise of stock options were $4.2$0.3 million, $1.4$3.6 million, and $2.0$4.2 million, for the years ended December 31, 2012, 2011,2014, 2013, and 2010,2012, respectively. Tax benefits realized from the exercise of stock options for the years ended December 31, 2014, 2013, and 2012 2011,were $0.5 million, $1.1 million, and 2010 were $7.5 million, $1.4 million and $5.7 million, respectively.
Stock Units
A stock unit represents the right to receive a share of common stock from our company at a designated time in the future without cash payment by the employee and is issued in lieu of cash incentive, principally for deferred compensation and employee retention plans. The restricted stock units vest on an annual basis over the next three to eight years and are distributable, if vested, at future specified dates. At December 31, 2012,2014, the total number of stock units outstanding was 15.518.4 million, of which 6.611.4 million were unvested.
A summary of unvested stock unit activity under the plans as of December 31, 2012,2014, and changes during the year then ended is presented below(in thousands, except weighted-average fair value):
| Stock Units | Weighted- average grant date fair value | Stock Units | Weighted- average grant date fair value | |||||||||||||
Unvested December 31, 2011 | 3,764 | 39.12 | ||||||||||||||
Unvested December 31, 2013 | 8,844 | 36.63 | ||||||||||||||
Granted | 4,300 | 34.01 | 4,151 | 46.82 | ||||||||||||
Vested | (1,490 | ) | 32.95 | (1,028 | ) | 47.01 | ||||||||||
Cancelled | (23 | ) | 40.59 | (563 | ) | 39.62 | ||||||||||
|
| |||||||||||||||
Unvested December 31, 2012 | 6,551 | 36.62 | ||||||||||||||
Unvested December 31, 2014 | 11,404 | 39.70 | ||||||||||||||
|
| |||||||||||||||
At December 31, 2012,2014, there was unrecognized compensation cost for stock units of $209.4$314.9 million, which is expected to be recognized over a weighted-average period of 3.22.6 years.
Deferred Compensation Plans
The Stifel Nicolaus Wealth Accumulation Plan (the “SWAP Plan”) is provided to certain revenue producers, officers, and key administrative employees, whereby a certain percentage of their incentive compensation is deferred as defined by the Plan into company stock units with a 25% matching contribution by our company.units. Participants may elect to defer up to an additional 15% of their incentive compensation with a 25% matching contribution. Units generally vest over a three—three- to seven-year period and are distributable upon vesting or at future specified dates. Deferred compensation costs are amortized on a straight-line basis over the vesting period. Elective deferrals are 100% vested. As of December 31, 2012, there were 15.3 million units outstanding under the SWAP Plan.
Additionally, the SWAP Plan allows Stifel Nicolaus’Stifel’s financial advisors who achieve certain levels of production the option to defer a certain percentage of their gross commissions. As stipulated by the SWAP Plan, the financial
advisors have the option to: 1) defer 4% of their gross commissions into company stock units with a 25% matching contribution or 2) defer 2% of their gross commissions into company stock units & up to 2% in mutual funds, whichof their gross commissions that will earn a return based on the performance of index mutual funds as designated by our company or a fixed income option. The mutual fundsecond deferral option does not include a company match. Financial advisors may elect to defer an additional 1% of gross commissions into company stock units with a 25% matching contribution. Financial advisors have no ownership in the mutual funds. Included in the investments in the consolidated statements of financial condition are investments in mutual funds of $18.0$18.1 million and $34.0$17.0 million at December 31, 20122014 and 2011,2013, respectively, that were purchased by our company to economically hedge, on an after-tax basis, its liability to the financial advisors who choose to base the performance of their return on the index mutual fund option. At December 31, 20122014 and 2011,2013, the deferred compensation liability related to the mutual fund option of $16.6$15.7 million and $24.5$14.3 million, respectively, is included in accrued compensation in the consolidated statements of financial condition.
In addition, certain financial advisors, upon joining our company, may receive company stock units in lieu of transition cash payments. Deferred compensation related to these awards generally vests over a five—five- to eight-year period. Deferred compensation costs are amortized on a straight-line basis over the deferral period.
Profit Sharing and Employee Stock Ownership Plans
We have an internally leveraged employee stock ownership plan (“ESOP”) in which qualified employees of our company, as defined in the ESOP, participate. We make annual contributions to the ESOP in an amount determined by the Compensation Committee on behalf of all eligible employees based upon the relationship of individual compensation to total compensation.
The ESOP shares were initially pledged as collateral for its debt. As the debt is repaid, shares are released from collateral and allocated to active participants. The remaining collateral shares are reported as a reduction to paid-in capital in equity. As shares are committed to be released, we report compensation expense equal to the current market value of the shares.
Compensation expense of $1.7 million, $1.7 million, and $1.7 million relating to the ESOP was recorded for the years ended December 31, 2012, 2011 and 2010, respectively. The ESOP trust owned 732,106 and 722,233 shares of common stock at December 31, 2012 and 2011, respectively. At December 31, 2012 and 2011, there were 24,405 and 73,215 shares held as collateral with a fair value of $0.8 million and $2.3 million, respectively.
Retirement Plans
Eligible employees of our company who have met certain service requirements may participate in the Stifel Nicolaus Profit Sharing 401(k) Plan (the “Profit Sharing Plan”). We may match certain employee contributions or make additional contributions to the Profit Sharing Plan at our discretion. Our contributions to the Profit Sharing Plan were $3.7$4.9 million, $3.6$6.4 million, and $3.3$3.7 million for the years ended December 31, 2012, 2011,2014, 2013, and 2010,2012, respectively.
We had an internally leveraged employee stock ownership plan (“ESOP”) in which qualified employees of our company, as defined in the ESOP, participated. We made annual contributions to the ESOP in an amount determined by the Compensation Committee on behalf of all eligible employees based upon the relationship of individual compensation to total compensation. The Employee Stock Ownership Plan was terminated by our company during the year ended December 31, 2013. Compensation expense of $0.4 million and $1.7 million relating to the ESOP was recorded for the years ended December 31, 2013 and 2012, respectively.
NOTE 2223 – Off-Balance Sheet Credit Risk
In the normal course of business, we execute, settle, and finance customer and proprietary securities transactions. These activities expose our company to off-balance sheet risk in the event that customers or other parties fail to satisfy their obligations.
In accordance with industry practice, securities transactions generally settle within three business days after trade date. Should a customer or broker fail to deliver cash or securities as agreed, we may be required to purchase or sell securities at unfavorable market prices.
We borrow and lend securities to facilitate the settlement process and finance transactions, utilizing customer margin securities held as collateral. We monitor the adequacy of collateral levels on a daily basis. We periodically borrow from banks on a collateralized basis, utilizing firm and customer margin securities in compliance with SEC rules. Should the counterparty fail to return customer securities pledged, we are subject to the risk of acquiring the securities at prevailing market prices in order to satisfy our customer obligations. We control our exposure to credit risk by continually monitoring our counterparties’ positions, and where deemed necessary, we may require a deposit of additional collateral and/or a reduction or diversification of positions. Our company sells securities it does not currently own (short sales) and is obligated to subsequently purchase such securities at prevailing market prices. We are exposed to risk of loss if securities prices increase prior to closing the transactions. We control our exposure to price risk from short sales through daily review and setting position and trading limits.
We manage our risks associated with the aforementioned transactions through position and credit limits and the continuous monitoring of collateral. Additional collateral is required from customers and other counterparties when appropriate.
We have accepted collateral in connection with resale agreements, securities borrowed transactions, and customer margin loans. Under many agreements, we are permitted to sell or repledge these securities held as collateral and use these securities to enter into securities lending arrangements or to deliver to counterparties to cover short positions. At December 31, 20122014 and 2011,2013, the fair value of securities accepted as collateral where we are permitted to sell or repledge the securities was $965.8 million$1.2 billion and $1.0$1.2 billion, respectively, and the fair value of the collateral that had been sold or repledged was $140.3$39.2 million $80.2and $263.8 million, respectively.
We enter into interest rate derivative contracts to manage exposures that arise from business activities that result in the receipt or payment of future known and uncertain cash amounts, the value of which are determined by interest rates. Our derivative financial instruments are principally used to manage differences in the amount, timing, and duration of our known or expected cash payments related to certain variable-rate affiliated deposits. Interest rate swaps designated as cash flow hedges involve the receipt of variable-rate amounts from a counterparty in exchange for us making fixed-rate payments. Our interest rate hedging strategies may not work in all market environments and, as a result, may not be effective in mitigating interest rate risk.
Derivatives’ notional contract amounts are not reflected as assets or liabilities in the consolidated statements of financial condition. Rather, the market or fair value of the derivative transactions are reported in the consolidated statements of financial condition as other assets or accounts payable and accrued expenses, as applicable.
For a complete discussion of our activities related to derivative instruments, see Note 15 in the notes to our consolidated financial statements.
In the ordinary course of business, Stifel Bank has commitments to originate loans, standby letters of credit, and lines of credit. Commitments to originate loans are agreements to lend to a customer as long as there is no violation of any condition established by the contract. These commitments generally have fixed expiration dates or other termination clauses and may require payment of a fee. Since a portion of the commitments may expire without being drawn upon, the total commitment amounts do not necessarily represent future cash commitments. Each customer’s creditworthiness is evaluated on a case-by-case basis. The amount of collateral obtained, if necessary, is based on the credit evaluation of the counterparty. Collateral held varies, but may include accounts receivable, inventory, property, plant and equipment, commercial real estate, and residential real estate.
At December 31, 20122014 and 2011,2013, Stifel Bank had outstanding commitments to originate loans aggregating $241.5$122.8 million and $141.0$66.8 million, respectively. The commitments extended over varying periods of time, with all commitments at December 31, 20122014, scheduled to be disbursed in the following three months.
Through Stifel Bank, in the normal course of business, we originate residential mortgage loans and sell them to investors. We may be required to repurchase mortgage loans that have been sold to investors in the event there are breaches of certain representations and warranties contained within the sales agreements. We may be required to repurchase mortgage loans that were sold to investors in the event that there was inadequate underwriting or fraud, or in the event that the loans become delinquent shortly after they are originated. We also may be required to indemnify certain purchasers and others against losses they incur in the event of breaches of representations and warranties and in various other circumstances, and the amount of such losses could exceed the repurchase amount of the related loans. Consequently, we may be exposed to credit risk associated with sold loans.
Standby letters of credit are irrevocable conditional commitments issued by Stifel Bank to guarantee the performance of a customer to a third party. Financial standby letters of credit are primarily issued to support public and private borrowing arrangements, including commercial paper, bond financing, and similar transactions. Performance standby letters of credit are issued to guarantee performance of certain customers under non-financial contractual obligations. The credit risk involved in issuing standby letters of credit is essentially the same as that involved in extending loans to customers. Should Stifel Bank be obligated to perform under the standby letters of credit, it may seek recourse from the customer for reimbursement of amounts paid. At December 31, 20122014 and 2011,2013, Stifel Bank had outstanding letters of credit totaling $10.5$10.4 million and $9.2$5.1 million, respectively. OneA majority of the standby letters of credit has an expiration of December 16, 2013. All of the remaining standby letters of credit commitments at December 31, 20122014, have expiration terms that are less than one year.
Lines of credit are agreements to lend to a customer as long as there is no violation of any condition established in the contract. Lines of credit generally have fixed expiration dates. Stifel Bank uses the same credit policies in granting lines of credit as it does for on-balance sheet instruments. At December 31, 20122014 and 2011,2013, Stifel Bank had granted unused lines of credit to commercial and consumer borrowers aggregating $220.1$358.1 million and $102.4$282.0 million, respectively.
The provision for income taxes/(benefit)taxes consists of the following(in thousands):
| Year Ended December 31, | ||||||||||||
| 2012 | 2011 | 2010 | ||||||||||
Current taxes: | ||||||||||||
Federal | $ | 32,111 | $ | 20,847 | $ | 35,998 | ||||||
State | 9,199 | 6,416 | 9,647 | |||||||||
Foreign | 121 | (127 | ) | (19 | ) | |||||||
|
|
|
|
|
| |||||||
| 41,431 | 27,136 | 45,626 | ||||||||||
|
|
|
|
|
| |||||||
Deferred taxes: | ||||||||||||
Federal | 35,072 | 20,262 | (36,965 | ) | ||||||||
State | 8,498 | 5,958 | (11,821 | ) | ||||||||
Foreign | 2,298 | 1,118 | 1,024 | |||||||||
|
|
|
|
|
| |||||||
| 45,868 | 27,338 | (47,762 | ) | |||||||||
|
|
|
|
|
| |||||||
Provision for income taxes/(benefit) | $ | 87,299 | $ | 54,474 | $ | (2,136 | ) | |||||
|
|
|
|
|
| |||||||
Current taxes: Federal State Foreign Deferred taxes: Federal State Foreign Provision for income taxes Year Ended December 31, 2014 2013 2012 $ 100,262 $ 26,695 $ 32,111 21,835 9,954 9,199 (1,831 ) 365 (174 ) 120,266 37,014 41,136 (275 ) (20,724 ) 35,072 (8,064 ) (2,000 ) 8,498 (263 ) (1,968 ) (255 ) (8,602 ) (24,692 ) 43,315 $ 111,664 $ 12,322 $ 84,451
Reconciliation of the statutory federal income tax rate with our company’s effective income tax rate is as follows:
| Year Ended December 31, | Year Ended December 31, | |||||||||||||||||||||||
| 2012 | 2011 | 2010 | 2014 | 2013 | 2012 | |||||||||||||||||||
Statutory rate | $ | 79,055 | $ | 48,512 | $ | (80 | ) | $ | 101,778 | $ | 64,831 | $ | 80,413 | |||||||||||
State income taxes, net of federal income tax | 11,766 | 7,288 | (845 | ) | 14,860 | 11,433 | 11,766 | |||||||||||||||||
Change in valuation allowance | 3,760 | (4,180 | ) | (767 | ) | (2,433 | ) | 1,659 | (55 | ) | ||||||||||||||
Provision to return | (2,956 | ) | (3,003 | ) | (1,790 | ) | ||||||||||||||||||
Investment in subsidiary | — | (58,153 | ) | — | ||||||||||||||||||||
Non-taxable book gain | — | (2,647 | ) | — | ||||||||||||||||||||
Revaluation of deferred taxes | (8,788 | ) | 1,685 | — | — | (2,290 | ) | (6,600 | ) | |||||||||||||||
Other, net | 1,506 | 1,169 | (444 | ) | 415 | 492 | 777 | |||||||||||||||||
|
|
|
|
|
| |||||||||||||||||||
| $ | 87,299 | $ | 54,474 | $ | (2,136 | ) | $ | 111,664 | $ | 12,322 | $ | 84,451 | ||||||||||||
|
|
|
|
|
| |||||||||||||||||||
Tax effect of temporary differences and carryforwards that comprise significant portions of deferred tax assets and liabilities(in thousands):
| December 31, | December 31, | |||||||||||||||
| 2012 | 2011 | 2014 | 2013 | |||||||||||||
Deferred tax assets: | ||||||||||||||||
Deferred compensation | $ | 116,770 | $ | 128,515 | $ | 161,972 | $ | 163,411 | ||||||||
Net operating loss carryforwards | 50,251 | 53,325 | ||||||||||||||
Accrued expenses | 32,555 | 26,359 | 37,673 | 45,210 | ||||||||||||
Net operating loss carryforwards | 29,061 | 28,432 | ||||||||||||||
Unrealized loss on investments | 35,855 | 30,211 | ||||||||||||||
Depreciation | 5,472 | — | 13,306 | 11,537 | ||||||||||||
Receivable reserves | 3,956 | 2,488 | 10,595 | 6,010 | ||||||||||||
Investment and jobs creation credit | 2,057 | 2,081 | 350 | 1,627 | ||||||||||||
Unrealized loss on investments | — | 11,396 | ||||||||||||||
Other | 164 | 513 | ||||||||||||||
|
|
|
| |||||||||||||
Total deferred tax assets | 190,035 | 199,784 | 310,002 | 311,331 | ||||||||||||
Valuation allowance | (5,608 | ) | (2,231 | ) | (7,385 | ) | (9,854 | ) | ||||||||
|
|
|
| |||||||||||||
| 184,427 | 197,553 | 302,617 | 301,477 | |||||||||||||
|
|
|
| |||||||||||||
Deferred tax liabilities: | ||||||||||||||||
Goodwill and other intangibles | (24,346 | ) | (25,826 | ) | ||||||||||||
Change in accounting method | (32,806 | ) | — | (12,270 | ) | (21,852 | ) | |||||||||
Goodwill and other intangibles | (15,605 | ) | (14,249 | ) | ||||||||||||
Unrealized gain on investments | (7,175 | ) | — | |||||||||||||
Prepaid expenses | (4,265 | ) | (2,382 | ) | (3,602 | ) | (4,938 | ) | ||||||||
Depreciation | — | (3,119 | ) | |||||||||||||
Other | (4,257 | ) | (5,307 | ) | ||||||||||||
|
|
|
| |||||||||||||
| (59,851 | ) | (19,750 | ) | (44,475 | ) | (57,923 | ) | |||||||||
|
|
|
| |||||||||||||
Net deferred tax asset | $ | 124,576 | $ | 177,803 | $ | 258,142 | $ | 243,554 | ||||||||
|
|
|
| |||||||||||||
Our net deferred tax asset at December 31, 20122014, includes net operating loss and tax credit carryforwards of $107.0$288.3 million and $2.1 million, respectively that expire between 20132015 and 2027.2024. A valuation allowance is recorded to the extent that it is more likely than not that any portion of the deferred tax asset will not be realized. The valuation allowance was increaseddecreased by $3.4$2.5 million to adjust the tax benefit of certain state tax credits and foreign net operating loss carryforwards to the amountlosses that we have determined is more likely than not to be realized.realizable. We believe the realization of the remaining net deferred tax asset of $124.6$258.1 million is more likely than not based on the ability to carry back losses against prior year taxable income and expectations of future taxable income.
The current tax payable, included in accounts payable and accrued expenses, is $11.9$24.7 million and $30.1 million as of December 31, 2012. As of December 31, 2011, our current tax receivable was $10.0 million2014 and included in other assets.2013, respectively.
We have recorded income tax expense at U.S. tax rates on all profits, except for undistributed profits of our foreign subsidiaries that are considered indefinitely reinvested. Determination of the amount of unrecognized deferred tax liability related to indefinitely reinvested profits is not feasible. If management’s intentions or U.S. tax laws change in the future, there may be a significant impact on the provision for income taxes to record a change in the tax liability in the period the change occurs.
Uncertain Tax Positions
As of December 31, 20122014 and 2011,2013, we had $1.8$5.5 million and $3.1$5.2 million, respectively, of gross unrecognized tax benefits, all of which, if recognized, would impact the effective tax rate. We recognize interest and penalties related to uncertain tax positions in provision for income taxes/(benefits) in the consolidated statements of operations. As of December 31, 20122014 and 2011,2013, we had accrued interest and penalties of $1.0$1.2 million and $1.0 million, respectively, before benefit of federal tax deduction, included in accounts payable and accrued expenses on our consolidated statements of financial condition. The amount of interest and penalties recognized on our consolidated statements of operations for the years ended December 31, 2012, 20112014, 2013, and 20102012 was not significant.
The following table summarizes the activity related to our company’s unrecognized tax benefits from January 1, 20102012 to December 31, 20122014(in (in thousands):
| Year Ended December 31, | Year Ended December 31, | |||||||||||||||||||||||
| 2012 | 2011 | 2010 | 2014 | 2013 | 2012 | |||||||||||||||||||
Beginning balance | $ | 3,091 | $ | 3,138 | $ | 2,046 | $ | 5,158 | $ | 1,750 | $ | 3,091 | ||||||||||||
Increase related to prior year tax positions | 440 | 21 | 1,907 | 627 | 3,044 | 440 | ||||||||||||||||||
Decrease related to prior year tax positions | (881 | ) | (1,075 | ) | (586 | ) | (443 | ) | (40 | ) | (881 | ) | ||||||||||||
Increase related to current year tax positions | — | 1,260 | 35 | 294 | 133 | — | ||||||||||||||||||
Decrease related to settlements with taxing authorities | (900 | ) | (253 | ) | — | (126 | ) | (6,086 | ) | (900 | ) | |||||||||||||
Decrease related to lapsing of statute of limitations | — | — | (264 | ) | — | (356 | ) | — | ||||||||||||||||
Increase related to business acquisitions | — | 6,713 | — | |||||||||||||||||||||
|
|
|
|
|
| |||||||||||||||||||
Ending balance | $ | 1,750 | $ | 3,091 | $ | 3,138 | $ | 5,510 | $ | 5,158 | $ | 1,750 | ||||||||||||
|
|
|
|
|
| |||||||||||||||||||
We file income tax returns with the U.S. federal jurisdiction, various states, and certain foreign jurisdictions. We are not subject to U.S. federal, certain state and local, or non-U.S. income tax examination by tax authorities for taxable years before 2007. Certain state returns are not subject to examination by tax authorities for taxable years before 2002.2010.
There is a reasonable possibility that the unrecognized tax benefits will change within the next 12 months as a result of the expiration of various statutes of limitations or for the resolution of U.S. federal and state examinations, but we do not expect this change to be material to the consolidated financial statements.
We currently operate through the following three business segments: Global Wealth Management, Institutional Group, and various corporate activities combined in the Other segment.
Our Global Wealth Management segment consists of two businesses, the Private Client Group and Stifel Bank. The Private Client Group includes branch offices and independent contractor offices of our broker-dealer subsidiaries located throughout the United States, primarily in the Midwest and Mid-Atlantic regions with a growing presence in the Northeast, Southeast, and Western United States. These branches provide securities brokerage services, including the sale of equities, mutual funds, fixed income products, and insurance, as well as offering banking products to their clients through Stifel Bank. Stifel Bank segment provides residential, consumer, and commercial lending, as well as FDIC-insured deposit accounts to customers of our broker-dealer subsidiaries and to the general public.
The Institutional Group segment includes institutional sales and trading. It provides securities brokerage, trading, and research services to institutions, with an emphasis on the sale of equity and fixed income products. This segment also includes the management of and participation in underwritings for both corporate and public finance (exclusive of sales credits generated through the private client group, which are included in the Global Wealth Management segment), merger and acquisition, and financial advisory services.
The Other segment includes certain corporate activities of our company.
Information concerning operations in these segments of business for the years ended December 31, 2012, 20112014, 2013, and 20102012 is as follows(in thousands):
| Year Ended December 31, | Year Ended December 31, | |||||||||||||||||||||||
| 2012 | 2011 | 2010 | 2014 | 2013 | 2012 | |||||||||||||||||||
Net revenues:(1) | ||||||||||||||||||||||||
Net revenues:1 | ||||||||||||||||||||||||
Global Wealth Management | $ | 995,189 | $ | 908,158 | $ | 843,269 | $ | 1,232,651 | $ | 1,117,179 | $ | 991,597 | ||||||||||||
Institutional Group | 618,536 | 507,397 | 541,839 | 993,581 | 861,158 | 604,654 | ||||||||||||||||||
Other | (1,075 | ) | 1,007 | (3,082 | ) | (17,808 | ) | (4,891 | ) | (2,138 | ) | |||||||||||||
|
|
|
|
|
| |||||||||||||||||||
| $ | 1,612,650 | $ | 1,416,562 | $ | 1,382,026 | $ | 2,208,424 | $ | 1,973,446 | $ | 1,594,113 | |||||||||||||
|
|
|
|
|
| |||||||||||||||||||
Income/(loss) before income taxes: | ||||||||||||||||||||||||
Income/(loss) from continuing operations before income taxes: | ||||||||||||||||||||||||
Global Wealth Management | $ | 268,183 | 235,382 | 194,023 | $ | 346,978 | 299,572 | 266,669 | ||||||||||||||||
Institutional Group | 96,167 | 63,269 | 129,535 | 152,905 | 142,889 | 101,487 | ||||||||||||||||||
Other | (138,478 | ) | (160,043 | ) | (323,787 | ) | (209,089 | ) | (257,232 | ) | (138,409 | ) | ||||||||||||
|
|
|
|
|
| |||||||||||||||||||
| $ | 225,872 | $ | 138,608 | $ | (229 | ) | $ | 290,794 | $ | 185,229 | $ | 229,747 | ||||||||||||
|
|
|
|
|
| |||||||||||||||||||
No individual client accounted for more than 10 percent of total net revenues for the years ended December 31, |
The following table presents our company’s total assets on a segment basis at December 31, 20122014 and 20112013(in (in thousands):
| December 31, | December 31, | |||||||||||||||
| 2012 | 2011 | 2014 | 2013 | |||||||||||||
Global Wealth Management | $ | 5,116,487 | $ | 3,637,069 | $ | 5,816,284 | $ | 5,505,076 | ||||||||
Institutional Group | 1,447,484 | 1,028,948 | 3,476,592 | 3,290,573 | ||||||||||||
Other | 402,169 | 285,883 | 225,275 | 213,221 | ||||||||||||
|
|
|
| |||||||||||||
| $ | 6,966,140 | $ | 4,951,900 | $ | 9,518,151 | $ | 9,008,870 | |||||||||
|
|
|
| |||||||||||||
We have operations in the United States, Canada, United Kingdom, and Europe. Our company’s foreign operations are conducted through its wholly owned subsidiaries, SNEL, Oriel, and SN Canada.KBW Limited. Substantially all long-lived assets are located in the United States.
Revenues, classified by the major geographic areas in which they are earned for the years ended December 31, 2012, 20112014, 2013, and 2010,2012, were as follows(in thousands):
| Year Ended December 31, | Year Ended December 31, | |||||||||||||||||||||||
| 2012 | 2011 | 2010 | 2014 | 2013 | 2012 | |||||||||||||||||||
Net revenues: | ||||||||||||||||||||||||
United States | $ | 1,571,051 | $ | 1,361,899 | $ | 1,340,727 | $ | 2,082,876 | $ | 1,894,300 | $ | 1,561,665 | ||||||||||||
Canada | 18,813 | 23,422 | 10,739 | |||||||||||||||||||||
United Kingdom | 13,503 | 21,945 | 20,479 | 113,943 | 67,394 | 23,140 | ||||||||||||||||||
Other European | 9,283 | 9,296 | 10,081 | 11,605 | 11,752 | 9,308 | ||||||||||||||||||
|
|
|
|
|
| |||||||||||||||||||
| $ | 1,612,650 | $ | 1,416,562 | $ | 1,382,026 | $ | 2,208,424 | $ | 1,973,446 | $ | 1,594,113 | |||||||||||||
|
|
|
|
|
| |||||||||||||||||||
NOTE 2526 – Earnings Per Share (“EPS”)
Basic EPS is computed by dividing earnings available to common shareholders by the weighted-average number of common shares outstanding. Diluted EPS reflects the potential dilution that could occur if securities or other contracts to issue common stock were exercised or converted into common stock or resulted in the issuance of common stock that then shared in the earnings of the entity. Diluted earnings per share include dilutive stock options and stock units under the treasury stock method.
The following table sets forth the computation of basic and diluted earnings per share for the years ended December 31, 2012, 20112014, 2013, and 20102012(in (in thousands, except per share data):
| Year Ended December 31, | Year Ended December 31, | |||||||||||||||||||||||
| (in thousands, except per share amounts) | 2014 | 2013 | 2012 | |||||||||||||||||||||
Income from continuing operations | $ | 179,130 | $ | 172,907 | $ | 145,296 | ||||||||||||||||||
Loss from discontinued operations, net of tax | (3,063 | ) | (10,894 | ) | (6,723 | ) | ||||||||||||||||||
| 2012 | 2011 | 2010 |
|
|
| |||||||||||||||||||
Net income | $ | 138,573 | $ | 84,134 | $ | 1,907 | $ | 176,067 | $ | 162,013 | $ | 138,573 | ||||||||||||
|
|
| ||||||||||||||||||||||
Shares for basic and diluted calculation: | ||||||||||||||||||||||||
Average shares used in basic computation | 53,563 | 52,418 | 48,723 | 66,472 | 63,568 | 53,563 | ||||||||||||||||||
Dilutive effect of stock options and units(1) | 9,374 | 10,640 | 8,949 | |||||||||||||||||||||
Dilutive effect of stock options and units1 | 9,904 | 9,936 | 9,374 | |||||||||||||||||||||
|
|
|
|
|
| |||||||||||||||||||
Average shares used in diluted computation | 62,937 | 63,058 | 57,672 | 76,376 | 73,504 | 62,937 | ||||||||||||||||||
Net income per share: | ||||||||||||||||||||||||
Basic | $ | 2.59 | $ | 1.61 | $ | 0.04 | ||||||||||||||||||
Diluted(1) | $ | 2.20 | $ | 1.33 | $ | 0.03 | ||||||||||||||||||
Earnings per basic common share | ||||||||||||||||||||||||
Income from continuing operations | $ | 2.69 | $ | 2.72 | $ | 2.71 | ||||||||||||||||||
Loss from discontinued operations | (0.04 | ) | (0.17 | ) | (0.12 | ) | ||||||||||||||||||
|
|
| ||||||||||||||||||||||
Earnings per basic common share | $ | 2.65 | $ | 2.55 | $ | 2.59 | ||||||||||||||||||
Earnings per diluted common share | ||||||||||||||||||||||||
Income from continuing operations | $ | 2.35 | $ | 2.35 | $ | 2.31 | ||||||||||||||||||
Loss from discontinued operations | (0.04 | ) | (0.15 | ) | (0.11 | ) | ||||||||||||||||||
|
|
| ||||||||||||||||||||||
Earnings per diluted common share | $ | 2.31 | $ | 2.20 | $ | 2.20 | ||||||||||||||||||
Diluted earnings per share is computed on the basis of the |
For the years ended December 31, 2012, 20112014, 2013, and 2010,2012, the anti-dilutive effect from restricted stock units was immaterial.
NOTE 2627 – Shareholders’ Equity
Share Repurchase Program
We have an ongoing authorization from the Board of Directors to repurchase our common stock in the open market or in negotiated transactions. At December 31, 2012,2014, the maximum number of shares that may yet be purchased under this plan was 4.03.5 million. The repurchase program has no expiration date. These purchases may be made on the open market or in privately negotiated transactions, depending upon market conditions and other factors. Repurchased shares may be used to meet obligations under our employee benefit plans and for general corporate purposes. There were no share repurchases during the year ended December 31, 2014. During the years ended December 31, 2012, 20112013 and 2010,2012, we repurchased $11.4 million, $48.5$13.7 million and $91.8$11.4 million, or 0.4 million 1.7 million, and 3.00.4 million shares, respectively, using existing Board authorizations at an average price of $30.35, $28.12,$31.75 and $31.02$30.35 per share, respectively, to meet obligations under our company’s employee benefit plans and for general corporate purposes.
Issuance of Shares
During the year ended December 31, 2014, we issued 2.6 million shares. During the years ended December 31, 2012, 20112013 and 2010,2012, we issued 2.3 million, 1.78.8 million and 8.12.3 million shares, respectively, which included the reissuance of 2.1 million, 1.70.5 million and 0.82.1 million shares from treasury, respectively. Share issuances during the year ended December 31, 2014, were primarily a result of the vesting and exercise transactions under our incentive stock award plans and shares issued as part of the purchase consideration in our acquisition of Oriel and Merchant.
Share issuances during the year ended December 31, 2013, were primarily a result of the vesting and exercise transactions under our incentive stock award plans and shares issued as part of the purchase consideration in our acquisition of KBW, Inc and ZCM. Share issuances during the year ended December 31, 2012, were primarily a result of the vesting and exercise transactions under our incentive stock award plans, the exercise of warrants that were issued as part of the Ryan Beck acquisition, and shares issued as part of the purchase consideration in our acquisition of Miller Buckfire. Share issuances during the year ended December 31, 2011 were primarily a result of the vesting and exercise transactions under our incentive stock award plans and the acquisition of Stone & Youngberg. Share issuances during the year ended December 31, 2010 were primarily for the purchase of TWPG, the exercise of warrants that were issued as part of the Ryan Beck acquisition, and for vesting and exercise transactions under our incentive stock award plans. See Note 3 in the notes to our consolidated financial statements for additional information regarding our acquisitions. We issued 0.2 million new shares during the year ended December 31, 2012. There were no new shares issued during the year ended December 31, 2011. We issued 1.0 million new shares during the year ended December 31, 2010.
As partial consideration of the purchase price of Ryan Beck, we issued shares of common stock and five-year immediately exercisable warrants to purchase up to 1.13 million shares of our common stock at an exercise price of $16.00 per share. There were no warrants outstanding at December 31, 2012. At December 31, 2011, there were 34,328 warrants outstanding to purchase shares of our common stock at an exercise price of $16.00.
On October 1, 2011, we acquired Stone & Youngberg. As part of the purchase consideration, at the close of the acquisition, we issued 0.2 million shares of our common stock. The shares were issued from treasury.
On December 20, 2012, we acquired Miller Buckfire. As part of the purchase consideration, at the close of the acquisition, we issued 0.1 million shares of our common stock.
On February 15, 2013, we issued 6.7 million shares related to the purchase of KBW, Inc. See Note 3 in the notes to consolidated financial statements for additional information regarding our acquisitions.
On November 30, 2013, we issued 0.1 million shares related to the purchase of ZCM. See Note 3 in the notes to consolidated financial statements for additional information regarding our acquisitions.
On July 31, 2014, we issued 0.3 million shares related to the purchase of Oriel. See Note 3 in the notes to consolidated financial statements for additional information regarding our acquisitions.
On December 31, 2014, we issued 0.1 million shares related to the purchase of Merchant. See Note 3 in the notes to consolidated financial statements for additional information regarding our acquisitions.
NOTE 2728 – Variable Interest Entities
The determination as to whether an entity is a VIE is based on the structure and nature of the entity. We also consider other characteristics, such as the ability to influence the decision-making relative to the entity’s activities and how the entity is financed. The determination as to whether we must consolidate a VIE based on whether we are the primary beneficiary for certain entities. The primary beneficiary determination is based on a qualitative analysis of the VIE’s expected losses and expected residual returns. This analysis includes a review of, among other factors, the VIE’s capital structure, contractual terms, which interests create or absorb variability, related party relationships, and the design of the VIE. For other entities, the determination as to whether we must consolidate the VIE is based on an analysis of the power to direct the activities of the VIE as well as the obligation to absorb losses or benefits that could potentially be significant to the entity. Where qualitative analyses are not conclusive, we perform a quantitative analysis. Our company’s involvement with VIEs is limited to entities used as investment vehicles and private equity funds, the establishment of Stifel Financial Capital Trusts, and our issuance of a convertible promissory note.
We have formed several non-consolidated investment funds with third-party investors that are typically organized as limited liability companies (“LLCs”) or limited partnerships. These partnerships and LLCs have assets of approximately $241.8$260.5 million at December 31, 2012.2014. For those funds where we act as the general partner, our company’s economic interest is generally limited to management fee arrangements as stipulated by the fund operating agreements. We have generally provided the third-party investors with rights to terminate the funds or to remove us as the general partner. Management fee revenue earned by our company was insignificant during the years ended December 31, 2012, 20112014, 2013, and 2010.2012. In addition, our direct investment interest in these entities is insignificant at December 31, 20122014 and 2011.2013.
Thomas Weisel Capital Management LLC, a subsidiary of our company, acts as the general partner of a series of investment funds in venture capital and fund of funds and manages investment funds that are active buyers of secondary interests in private equity funds, as well as portfolios of direct interests in venture-backed companies. These partnerships have combined assets of approximately $246.8$272.4 million at December 31, 2012.2014. We hold variable interests in these funds as a result of our company’s rights to receive management fees. Our company’s investment in and additional capital commitments to the private equity funds are also considered variable interests. The additional capital commitments are subject to call at a later date and are limited in amount. Our exposure to loss is limited to our investments in, advances and commitments to, and receivables due from these funds, and that exposure is $1.4 millioninsignificant at December 31, 2012.2014. Management fee revenue earned by our company was insignificant during the years ended December 31, 2012, 20112014, 2013, and 2010.2012.
For the entities noted above that were determined to be VIEs, we have concluded that we are not the primary beneficiary, and therefore, we are not required to consolidate these entities. Additionally, for certain other entities, we reviewed other relevant accounting guidance, which states the general partner in a limited partnership is presumed to control that limited partnership. The presumption may be overcome if the limited partners have either: (1) the substantive ability to dissolve the limited partnership or otherwise remove the general partner without cause, or (2) substantive participating rights, which provide the limited partners with the ability to effectively participate in significant decisions that would be expected to be made in the ordinary course of the limited partnership’s business and thereby preclude the general partner from exercising unilateral control over the partnership. If the criteria are not met, the consolidation of the partnership or limited liability company is required. Based on our evaluation of these entities, we determined that these entities do not require consolidation.
Debenture to Stifel Financial Capital Trusts
We have completed private placements of cumulative trust preferred securities through Stifel Financial Capital Trust II, Stifel Financial Capital Trust III, and Stifel Financial Capital Trust IV (collectively, the “Trusts”).
The Trusts are non-consolidated wholly owned business trust subsidiaries of our company and were established for the limited purpose of issuing trust securities to third parties and lending the proceeds to our company.
The trust preferred securities represent an indirect interest in junior subordinated debentures purchased from our company by the Trusts, and we effectively provide for the full and unconditional guarantee of the securities issued by the Trusts. We make timely payments of interest to the Trusts as required by contractual obligations, which are sufficient to cover payments due on the securities issued by the Trusts, and believe that it is unlikely that any circumstances would occur that would make it necessary for our company to make payments related to these Trusts other than those required under the terms of the debenture agreements and the trust preferred securities agreements. The Trusts were determined to be VIEs because the holders of the equity investment at risk do not have adequate decision-making ability over the Trust’s activities. Our investment in the Trusts is not a variable interest, because equity interests are variable interests only to the extent that the investment is considered to be at risk. Because our investment was funded by the Trusts, it is not considered to be at risk.
Interest in FSI Group, LLC (“FSI”)
We have provided financing of $18.0 million in the form of a convertible promissory note to FSI, a limited liability company specializing in investing in banks, thrifts, insurance companies, and other financial services firms. In February 2013, the convertible promissory note was amended and restated. The convertible promissory note matures in April 2018; however, FSI has three five-year extension options. The note is convertible at our election into a 49.9% interest in FSI at any timeonly after the third anniversary or during the defined conversion period.last extension option. The convertible promissory note has a minimum coupon rate equal to 10%8% per annum plus additional interest related to certain defined cash flows of the business, not to exceed 18% per annum. As we do not hold the power to direct the activities of FSI nor to absorb a majority of the expected losses, or receive a majority of the expected benefits, it was determined that we are not required to consolidate this entity.
Our company’s exposure to loss is limited to the carrying value of the note with FSI at December 31, 2012,2014, of $18.0 million, which is included in other assets in the consolidated statements of financial condition. Our company had no liabilities related to this entity at December 31, 2012.2014. We have the discretion to make additional capital contributions. We have not provided financial or other support to FSI that we were not previously contractually required to provide as of December 31, 2012.2014. Our company’s involvement with FSI has not had a material effect on our consolidated financial position, operations, or cash flows.
We evaluate subsequent events that have occurred after the balance sheet date but before the financial statements are issued. There are two types of subsequent events: (1) recognized, or those that provide additional evidence about conditions that existed at the date of the balance sheet, including the estimates inherent in the process of preparing financial statements, and (2) non-recognized, or those that provide evidence about conditions that did not exist at the date of the balance sheet but arose after that date. Based on the evaluation, we did not identify any recognized subsequent events that would have required adjustment to the consolidated financial statements; however, we identified the following non-recognized subsequent event:events:
Redemption of 6.70% Senior Notes
On January 15, 2015 (the “redemption date”), we redeemed 100% of our company’s outstanding 6.70% Senior Notes due 2022. The redemption price was equal to the sum of the principal amount of the Notes outstanding and accrued and unpaid interest on the Notes up to, but not including, the redemption date.
Acquisition of KBW,Sterne Agee Group, Inc.
On November 5, 2012 Stifel Financial Corp. and KBW, Inc. (“KBW”)February 23, 2015, we entered into a mergerdefinitive agreement for our company to acquire 100%Sterne Agee Group, Inc. (“Sterne Agee”), a financial services firm that offers comprehensive wealth management and investment services to a diverse client base including corporations, municipalities and individual investors. The consideration received by Sterne Agee shareholders will consist of a combination of our company’s common stock, valued at $51.55 per share, and cash, and is subject to adjustments for tangible book value and an indemnity earn-out relating to various indemnification obligations of the outstanding shares of KBW common stock. Underequityholders. Giving effect to those adjustments and the termsearn-out, the value of the merger agreement, each shareconsideration to be received by the Sterne Agee equityholders is expected to be approximately $150.0 million. Sterne Agee equityholders will make stock/cash elections that will determine the final mix of common stock, including certain restricted stock, of KBW issued and outstanding immediately prior toconsideration. Depending on those elections, we will issue at the effective timeclosing of the merger will be cancelledMerger between a minimum of 1.42 million shares and converted into the right to receive a combinationmaximum of (i)1.62 million shares. The cash consideration of $8.00 ($10.00 lesspayable to Sterne Agee equityholders under the extraordinary dividend amount of $2.00) and (ii) stock consideration of 0.2143 a share of our common stock.
Merger Agreement is expected to range from $77.0 million to $66.0 million. The merger closed on February 15, 2013. In conjunction withis subject to approval by Sterne Agee shareholders, regulatory approvals and other, customary conditions. The Merger is expected to close during the closesecond quarter of the merger, we issued 6.7 million shares of common stock to holders of KBW common stock, issued 2.2 million restricted awards to KBW employees, and paid $253.0 million in cash.2015.
The preliminary excess purchase price over net assets acquired is as follows (in thousands):
Cash paid to KBW shareholders | $ | 253,039 | ||
Common stock issued to KBW shareholders | 262,653 | |||
Fair value of outstanding KBW restricted awards exchanged for Stifel restricted awards | 51,732 | |||
|
| |||
Purchase price to be allocated | 567,424 | |||
Net assets acquired | 305,275 | |||
|
| |||
Estimated excess purchase price over acquired net assets | $ | 262,149 | ||
|
|
This acquisition is being accounted for under the acquisition method of accounting in accordance with Topic 805. Accordingly, the purchase price will be allocated to the acquired assets and liabilities assumed based on their estimated fair values as of the acquisition date. The excess of purchase price over the net assets acquired will be allocated between goodwill and intangible assets. The allocation of the purchase price is preliminary and will be finalized upon completion of the analysis of the fair values of the net assets acquired and any potential identifiable intangible assets. Goodwill and identifiable intangibles will be allocated to the Institutional Group segment upon the completion of the purchase price allocation. The acquisition of KBW provides us with an opportunity to grow our business and become a market leader in the financial services sector.
Under Topic 805, merger-related transaction costs (such as advisory, legal, valuation and other professional fees) are not included as components of consideration transferred but are accounted for as expenses in the periods in which the costs are incurred. During the year ended December 31, 2012, we incurred $1.4 million in transaction costs.
The following unaudited pro forma financial information presents the combined results of operations as if the merger had occurred on January 1, 2010. The pro forma financial information does not reflect the costs of any integration activities. The pro forma results include estimates and assumptions, which management believes are reasonable. The unaudited pro forma financial information below is not necessarily indicative of either future results of operations or results that might have been achieved had KBW been combined with us as of the beginning of 2010.
| (000s, except per share amounts, unaudited) | 2012 | 2011 | 2010 | |||||||||
Total net revenues | $ | 1,857,913 | $ | 1,680,056 | $ | 1,806,779 | ||||||
Net income | 112,531 | 52,468 | 28,535 | |||||||||
Income per share: | ||||||||||||
Basic | $ | 1.86 | $ | 0.89 | $ | 0.51 | ||||||
Diluted | $ | 1.56 | $ | 0.73 | $ | 0.43 | ||||||
NOTE 2930 – Quarterly Financial Information (Unaudited)
| (in thousands, except per share data) | 1st Quarter | 2nd Quarter | 3rd Quarter | 4th Quarter | ||||||||||||||||||||||||||||
Year Ended December 31, 2012: | ||||||||||||||||||||||||||||||||
| (in thousands, except per share amounts) | 1st Quarter | 2nd Quarter | 3rd Quarter | 4th Quarter | ||||||||||||||||||||||||||||
Year Ended December 31, 2014: | ||||||||||||||||||||||||||||||||
Total revenues | $ | 409,343 | $ | 384,264 | $ | 425,992 | $ | 426,434 | $ | 555,377 | $ | 568,989 | $ | 534,683 | $ | 590,636 | ||||||||||||||||
Interest expense | 9,010 | 9,857 | 5,912 | 8,604 | 8,631 | 8,842 | 11,228 | 12,560 | ||||||||||||||||||||||||
Net revenues | 400,333 | 374,407 | 420,080 | 417,830 | 546,746 | 560,147 | 523,455 | 578,076 | ||||||||||||||||||||||||
Non-interest expense | 341,079 | 330,533 | 358,403 | 356,763 | ||||||||||||||||||||||||||||
Income before income taxes | 59,254 | 43,874 | 61,677 | 61,067 | ||||||||||||||||||||||||||||
Total non-interest expenses | 468,618 | 482,624 | 457,689 | 508,698 | ||||||||||||||||||||||||||||
Income from continuing operations before income tax expense | 78,128 | 77,523 | 65,766 | 69,378 | ||||||||||||||||||||||||||||
Provision for income taxes | 30,155 | 31,946 | 25,673 | 23,890 | ||||||||||||||||||||||||||||
Income from continuing operations | 47,973 | 45,577 | 40,093 | 45,488 | ||||||||||||||||||||||||||||
Loss from discontinued operations, net of tax | (591 | ) | (1,976 | ) | (190 | ) | (306 | ) | ||||||||||||||||||||||||
Net income | $ | 34,773 | $ | 26,136 | $ | 37,710 | $ | 39,954 | $ | 47,382 | $ | 43,601 | $ | 39,903 | $ | 45,182 | ||||||||||||||||
Earnings per common share: | ||||||||||||||||||||||||||||||||
Earnings per basic common share | ||||||||||||||||||||||||||||||||
Income from continuing operations | $ | 0.73 | $ | 0.69 | $ | 0.60 | $ | 0.67 | ||||||||||||||||||||||||
Loss from discontinued operations | (0.01 | ) | (0.03 | ) | — | — | ||||||||||||||||||||||||||
|
|
|
| |||||||||||||||||||||||||||||
Earnings per basic common share | $ | 0.72 | $ | 0.66 | $ | 0.60 | $ | 0.67 | ||||||||||||||||||||||||
Earnings per diluted common share | ||||||||||||||||||||||||||||||||
Income from continuing operations | $ | 0.63 | $ | 0.60 | $ | 0.52 | $ | 0.59 | ||||||||||||||||||||||||
Loss from discontinued operations | — | (0.02 | ) | — | (0.01 | ) | ||||||||||||||||||||||||||
|
|
|
| |||||||||||||||||||||||||||||
Earnings per diluted common share | $ | 0.63 | $ | 0.58 | $ | 0.52 | $ | 0.58 | ||||||||||||||||||||||||
Weighted-average number of common shares outstanding: | ||||||||||||||||||||||||||||||||
Basic | $ | 0.65 | $ | 0.49 | $ | 0.70 | $ | 0.74 | 66,037 | 66,302 | 66,691 | 66,851 | ||||||||||||||||||||
Diluted | $ | 0.55 | $ | 0.42 | $ | 0.60 | $ | 0.63 | 75,691 | 75,641 | 76,681 | 77,540 | ||||||||||||||||||||
| 1st Quarter | 2nd Quarter | 3rd Quarter | 4th Quarter | |||||||||||||||||||||||||||||
Year Ended December 31, 2011: | ||||||||||||||||||||||||||||||||
| (in thousands, except per share amounts) | 1st Quarter | 2nd Quarter | 3rd Quarter | 4th Quarter | ||||||||||||||||||||||||||||
Year Ended December 31, 2013: | ||||||||||||||||||||||||||||||||
Total revenues | $ | 372,855 | $ | 365,240 | $ | 340,520 | $ | 363,294 | $ | 449,173 | $ | 506,312 | $ | 490,174 | $ | 574,156 | ||||||||||||||||
Interest expense | 6,242 | 6,383 | 6,306 | 6,416 | 10,569 | 12,634 | 11,535 | 11,630 | ||||||||||||||||||||||||
Net revenues | 366,613 | 358,857 | 334,214 | 356,878 | 438,604 | 493,678 | 478,639 | 562,526 | ||||||||||||||||||||||||
Non-interest expense | 315,929 | 354,982 | 295,191 | 311,852 | ||||||||||||||||||||||||||||
Income before income taxes | 50,684 | 3,875 | 39,023 | 45,026 | ||||||||||||||||||||||||||||
Total non-interest expenses | 414,946 | 441,103 | 447,631 | 484,537 | ||||||||||||||||||||||||||||
Income from continuing operations before income tax expense | 23,658 | 52,575 | 31,008 | 77,989 | ||||||||||||||||||||||||||||
Provision for income taxes | 8,722 | 21,659 | (43,921 | ) | 25,863 | |||||||||||||||||||||||||||
Income from continuing operations | 14,936 | 30,916 | 74,929 | 52,126 | ||||||||||||||||||||||||||||
Income/(loss) from discontinued operations, net of tax | (317 | ) | (1,481 | ) | (5,239 | ) | (3,857 | ) | ||||||||||||||||||||||||
Net income | $ | 31,398 | $ | 3,416 | $ | 22,304 | $ | 27,016 | $ | 14,619 | $ | 29,435 | $ | 69,690 | $ | 48,269 | ||||||||||||||||
Earnings per common share: | ||||||||||||||||||||||||||||||||
Earnings per basic common share | ||||||||||||||||||||||||||||||||
Income from continuing operations | $ | 0.25 | $ | 0.48 | $ | 1.16 | $ | 0.80 | ||||||||||||||||||||||||
Loss from discontinued operations | (0.01 | ) | (0.02 | ) | (0.08 | ) | (0.06 | ) | ||||||||||||||||||||||||
|
|
|
| |||||||||||||||||||||||||||||
Earnings per basic common share | $ | 0.24 | $ | 0.46 | $ | 1.08 | $ | 0.74 | ||||||||||||||||||||||||
Earnings per diluted common share | ||||||||||||||||||||||||||||||||
Income from continuing operations | $ | 0.22 | $ | 0.42 | $ | 1.00 | $ | 0.69 | ||||||||||||||||||||||||
Loss from discontinued operations | (0.01 | ) | (0.02 | ) | (0.07 | ) | (0.05 | ) | ||||||||||||||||||||||||
|
|
|
| |||||||||||||||||||||||||||||
Earnings per diluted common share | $ | 0.21 | $ | 0.40 | $ | 0.93 | $ | 0.64 | ||||||||||||||||||||||||
Weighted-average number of common shares outstanding: | ||||||||||||||||||||||||||||||||
Basic | $ | 0.60 | $ | 0.06 | $ | 0.43 | $ | 0.52 | 60,054 | 64,505 | 64,706 | 64,859 | ||||||||||||||||||||
Diluted | $ | 0.50 | $ | 0.05 | $ | 0.35 | $ | 0.43 | 69,189 | 74,090 | 75,191 | 75,495 | ||||||||||||||||||||
ITEM 9. CHANGES IN AND DISAGREEMENTS WITH ACCOUNTANTS ON ACCOUNTING AND FINANCIAL DISCLOSURE
None
ITEM 9A. CONTROLS AND PROCEDURES
Conclusion Regarding the Effectiveness of Disclosure Controls and Procedures
As of the end of the period covered by this report, an evaluation was carried out by the management of Stifel Financial Corp., with the participation of our Chief Executive Officer and Chief Financial Officer, of the effectiveness of our disclosure controls and procedures (as defined in Rule 13a-15(e) under the Securities Exchange Act of 1934). Based upon that evaluation, our Chief Executive Officer and Chief Financial Officer concluded that these disclosure controls and procedures were effective as of the end of the period covered by this report. In addition, no change in our internal control over financial reporting (as defined in Rule 13a-15(f) under the Securities Exchange Act of 1934) occurred during the fourth quarter of our fiscal year ended December 31, 2012,2014, that has materially affected, or is reasonably likely to materially affect, our internal control over financial reporting.
Management’s Report on Internal Control Over Financial Reporting
Management of Stifel Financial Corp., together with its consolidated subsidiaries, is responsible for establishing and maintaining adequate internal control over financial reporting. Our company’s internal control over financial reporting is a process designed under the supervision of our principal executive and principal financial officers to provide reasonable assurance regarding the reliability of financial reporting and the preparation of our consolidated financial statements for external purposes in accordance with U.S. generally accepted accounting principles. All internal control systems, no matter how well designed, have inherent limitations. Therefore, even those systems determined to be effective can provide only reasonable assurance with respect to financial statement preparation and presentation.
As of December 31, 2012, we conducted an assessment ofManagement has assessed the effectiveness of our company’s internal control over financial reporting based on the framework established in Internal Control – Integrated Framework issued by the Committee of Sponsoring Organizations of the Treadway Commission (COSO). Based on this assessment, we have determined that our company’s internal control over financial reporting as of December 31, 2012, was2014. In making this assessment, management used the criteria set forth by the Committee of Sponsoring Organizations of the Treadway Commission (COSO) inInternal Control — Integrated Framework (2013).
Based on management’s assessment and those criteria, we conclude that, as of December 31, 2014, our company’s internal control over financial reporting is effective.
Our internal control over financial reporting includes those policies and procedures that pertain to the maintenance of records that, in reasonable detail, accurately and fairly reflect the transactions and dispositions of the assets; provide reasonable assurances that transactions are recorded as necessary to permit preparation of financial statements in accordance with U.S. generally accepted accounting principles, and that receipts and expenditures are being made only in accordance with authorizations of management and directors of our company; and provide reasonable assurance regarding prevention or timely detection of unauthorized acquisition, use, or disposition of our company’s assets that could have a material effect on our consolidated financial statements.
Our company’s internal control over financial reporting as of December 31, 2012,2014, has been audited by Ernst & Young LLP, an independent registered public accounting firm, as stated in their report appearing on the following page, which expresses an unqualified opinion on the effectiveness of our company’s internal control over financial reporting as of December 31, 2012.2014.
Report of Independent Registered Public Accounting Firm on Internal Control Over Financial Reporting
The Board of Directors and Shareholders of Stifel Financial Corp.
We have audited Stifel Financial Corp.’s internal control over financial reporting as of December 31, 2012,2014, based on criteria established in Internal Control—Control – Integrated Framework issued by the Committee of Sponsoring Organizations of the Treadway Commission (2013 framework) (the COSO criteria). Stifel Financial Corp.’s management is responsible for maintaining effective internal control over financial reporting, and for its assessment of the effectiveness of internal control over financial reporting included in the accompanying Management’s Report on Internal Control Over Financial Reporting. Our responsibility is to express an opinion on the company’s internal control over financial reporting based on our audit.
We conducted our audit in accordance with the standards of the Public Company Accounting Oversight Board (United States). Those standards require that we plan and perform the audit to obtain reasonable assurance about whether effective internal control over financial reporting was maintained in all material respects. Our audit included obtaining an understanding of internal control over financial reporting, assessing the risk that a material weakness exists, testing and evaluating the design and operating effectiveness of internal control based on the assessed risk, and performing such other procedures as we considered necessary in the circumstances. We believe that our audit provides a reasonable basis for our opinion.
A company’s internal control over financial reporting is a process designed to provide reasonable assurance regarding the reliability of financial reporting and the preparation of financial statements for external purposes in accordance with generally accepted accounting principles. A company’s internal control over financial reporting includes those policies and procedures thatthat: (1) pertain to the maintenance of records that, in reasonable detail, accurately and fairly reflect the transactions and dispositions of the assets of the company; (2) provide reasonable assurance that transactions are recorded as necessary to permit preparation of financial statements in accordance with generally accepted accounting principles, and that receipts and expenditures of the company are being made only in accordance with authorizations of management and directors of the company; and (3) provide reasonable assurance regarding prevention or timely detection of unauthorized acquisition, use, or disposition of the company’s assets that could have a material effect on the financial statements.
Because of its inherent limitations, internal control over financial reporting may not prevent or detect misstatements. Also, projections of any evaluation of effectiveness to future periods are subject to the risk that controls may become inadequate because of changes in conditions, or that the degree of compliance with the policies or procedures may deteriorate.
In our opinion, Stifel Financial Corp. maintained, in all material respects, effective internal control over financial reporting as of December 31, 2012,2014, based on the COSO criteria.
We also have audited, in accordance with the standards of the Public Company Accounting Oversight Board (United States), the consolidated statements of financial condition of Stifel Financial Corp. as of December 31, 20122014 and 2011,2013, and the related consolidated statements of operations and comprehensive income, changes in shareholders’ equity, and cash flows for each of the three years in the period ended December 31, 2012,2014, and our report dated March 1, 2013,2, 2015, expressed an unqualified opinion thereon.
/s/ Ernst & Young LLP
| /s/ Ernst & Young LLP |
Chicago, IllinoisNew York, New York
March 1, 20132, 2015
None
ITEM 10. DIRECTORS, EXECUTIVE OFFICERS, AND CORPORATE GOVERNANCE
Information regarding our Board of Directors and committees, our Corporate Governance, compliance with Section 16(a) of the Securities Exchange Act of 1934, and procedures by which stockholdersshareholders may recommend nominees to our Board of Directors is contained in our Proxy Statement for the 20122015 Annual Meeting of StockholdersShareholders to be filed with the SEC within 120 days after our fiscal year-end, which information is incorporated herein by reference.
Information regarding the executive officers is contained in Part 1, Item 1, “Executive Officers of the Registrant,” hereof. There is no family relationship between any of the directors or named executive officers.
Under Section 303A.12 (a) NYSE Listed Company Manual, the CEO certification was submitted to the NYSE after the 20112014 Annual Meeting of Stockholders.Shareholders.
ITEM 11. EXECUTIVE COMPENSATION
Information regarding compensation of certain executive officers and directors (“Executive Compensation”), as well as “Compensation Committee Interlocks and Insider Participation” and “Compensation Committee Report” is contained in our Proxy Statement for the 20122015 Annual Meeting of StockholdersShareholders to be filed with the SEC within 120 days after our fiscal year-end, which information is incorporated herein by reference.
ITEM 12. SECURITY OWNERSHIP OF CERTAIN BENEFICIAL OWNERS AND MANAGEMENT AND RELATED STOCKHOLDER MATTERS
Securities authorized for issuance under equity compensation plans
The following table provides information as of December 31, 2012,2014, with respect to the shares of our common stock that may be issued under our existing equity compensation plans.
| Plan category | Number of securities to be issued upon exercise of outstanding options and units | Weighted-average exercise price of outstanding options and units | Number of securities remaining available for future issuance under equity compensation plans | Number of securities to be issued upon exercise of outstanding options and units | Weighted-average exercise price of outstanding options and units | Number of securities remaining available for future issuance under equity compensation plans | ||||||||||||||||||
Equity compensation plans approved by the shareholders | 15,668,503 | $ | 30.75 | 7,700,474 | 18,432,025 | $ | 36.84 | 3,633,292 | ||||||||||||||||
Equity compensation plans not approved by the shareholders | 54,936 | $ | — | 54,936 | — | |||||||||||||||||||
|
|
|
|
|
| |||||||||||||||||||
| 15,723,439 | $ | 30.65 | 7,700,474 | 18,486,961 | $ | 36.84 | 3,633,292 | |||||||||||||||||
|
|
|
|
|
| |||||||||||||||||||
On December 31, 2012,2014, the total number of securities to be issued upon exercise of options and units consisted of 248,765126,374 options and 15,474,67418,360,587 units, for a total of 15,723,43918,486,961 shares. The equity compensation plans approved by the stockholdersour shareholders contained 193,82971,438 options and 15,474,67418,360,587 units, for a total of 15,668,50318,432,025 shares. The equity compensation plan not approved by the stockholdersour shareholders contained 54,936 options, for a total of 54,936 shares.
Equity compensation plans approved by stockholdersshareholders
The total options granted as of December 31, 2012,2014, for equity compensation plans approved by the stockholdersshareholders consists of 166,98259,738 shares subject to options granted under the 2001 Incentive Stock Plan and 26,84711,700 shares subject to options granted under the Equity Incentive Plan for Non-Employee Directors.
The total units granted as of December 31, 2012,2014, for equity compensation plans approved by the stockholdersshareholders consists of 14,920,66817,923,021 shares that are subject to stock units granted under the 2001 Incentive Stock Plan, 376,167232,665 under the 2007 Incentive Stock Plan, and 177,839204,901 shares that are subject to stock units granted under the Equity Incentive Plan for Non-Employee Directors.
As of December 31, 2012,2014, the remaining shares available for future grants or awards under equity compensation plans approved by the stockholdersshareholders consist of 6,487,3953,293,386 shares under the 2001 Incentive Stock Plan, 910,387127,306 under the 2007 Incentive Stock Plan, and 302,692212,600 shares under the Equity Incentive Plan for Non-Employee Directors, for a total of 7,700,4743,633,292 shares.
Equity compensation plans not approved by stockholdersshareholders
Equity compensation plans not approved by the stockholdersshareholders as of December 31, 2012,2014, include 54,936 shares that are subject to stock options granted to the former directors of TWPG in exchange for the options they held prior to the merger. There were no shares reserved for future grants or awards under this plan as of December 31, 2012.2014.
Security ownership of certain beneficial owners
Information regarding security ownership of certain beneficial owners is contained in “Ownership of Certain Beneficial Owners,” included in our Proxy Statement for the 20122015 Annual Meeting of StockholdersShareholders to be filed with the SEC within 120 days after our fiscal year-end, which information is incorporated herein by reference.
Security ownership of management
Information regarding security ownership of certain beneficial owners and management is contained in “Ownership of Directors, Nominees, and Executive Officers,” included in our Proxy Statement for the 20122015 Annual Meeting of StockholdersShareholders to be filed with the SEC within 120 days after our fiscal year-end, which information is incorporated herein by reference.
ITEM 13. CERTAIN RELATIONSHIPS AND RELATED TRANSACTIONS, AND DIRECTOR INDEPENDENCE
Information regarding certain relationships and related transactions and director independence is contained in “Certain Relationships and Related Transactions,” and “Director Independence” included in our Proxy Statement for the 20122015 Annual Meeting of StockholdersShareholders to be filed with the SEC within 120 days after our fiscal year-end, which information is incorporated herein by reference.
ITEM 14. PRINCIPAL ACCOUNTING FEES AND SERVICES
Information regarding principal accounting fees and services is contained in “Ratification of Appointment of Independent Registered Public Accounting Firm,” included in our Proxy Statement for the 20122015 Annual Meeting of StockholdersShareholders to be filed with the SEC within 120 days after our fiscal year-end, which information is incorporated herein by reference.
ITEM 15. EXHIBITS AND FINANCIAL STATEMENT SCHEDULES
| Financial Statements |
The following financial statements are included in Item 8, “Financial Statements and Supplementary Data,” and incorporated by reference hereto:
2. Financial Statement Schedules
| 2. | Financial Statement Schedules |
All schedules are omitted, since the required information is either not applicable, not deemed material, or is shown in the respective financial statements or in the notes thereto.
| (b) | Exhibits |
A list of the exhibits to this Annual Report on Form 10-K is set forth on the Exhibit Index immediately preceding such exhibits and is incorporated herein by reference.
EXHIBIT INDEX
STIFEL FINANCIAL CORP.
ANNUAL REPORT ON FORM 10-K
YEAR ENDED DECEMBER 31, 20122014
Exhibit No. | Description | |||
| 3. | 1 | Restated Certificate of Incorporation, as amended, filed with the Secretary of State of Delaware on June 3, 2009, incorporated herein by reference to Exhibit 4.1 to Stifel Financial Corp.’s Registration Statement on Form S-8 (Registration File No. 333-160523) filed on July 10, 2009. | ||
| 2 | Stifel Financial Corp. Amended and Restated By-Laws, incorporated herein by reference to Exhibit 3. (b)(1) to Stifel Financial Corp.’s Annual Report on Form 10-K for fiscal year ended July 30, 1993. | |||
| 3 | Certificate of Designations, Preferences, and Rights of the Special Voting Preferred Stock, incorporated herein by reference to Exhibit 3.1 to Stifel Financial Corp.’s Current Report on Form 8-K filed on July 1, 2010. | |||
| 10. | 1 | Form of Indemnification Agreement with directors dated as of June 30, 1987, incorporated herein by reference to Exhibit 10.2 to Stifel Financial Corp.’s Current Report on Form 8-K (date of earliest event reported – June 22, 1987) filed July 14, 1987. | ||
| 2 | Stifel Financial Corp. Dividend Reinvestment and Stock Purchase Plan, incorporated herein by reference to Stifel Financial Corp.’s Registration Statement on Form S-3 (Registration File No. 33-53699) filed May 18, 1994. | |||
| 3(a) | Employment Letter with Ronald J. Kruszewski, incorporated herein by reference to Exhibit 10.(l) to Stifel Financial Corp.’s Annual Report on Form 10-K for the year ended December 31, 1997. * | |||
| 3(b) | Employment Agreement with Richard Himelfarb dated September 6, 2005, incorporated herein by reference to Exhibit 10.(p) to Stifel Financial Corp.’s Annual Report on Form 10-K/A Amendment No. 1 for the year ended December 31, 2005, filed on January 26, 2007. * | |||
| 3(c) | Employment Agreement with Thomas Mulroy dated September 7, 2005, incorporated herein by reference to Exhibit 10.(q) to Stifel Financial Corp.’s Annual Report on Form 10-K/A Amendment No. 1 for the year ended December 31, 2005, filed on January 26, 2007. * | |||
| 3(d) | Employment Agreement with Victor Nesi dated June 25, 2009, incorporated herein by reference to Exhibit 10.(EE) to Stifel Financial Corp.’s Annual Report on Form 10-K for the year ended December 31, 2009, filed on February 26, 2010. * | |||
Exhibit No. | Description | |||
|
| |||
| ||||
| Stock Unit Agreement with Ronald J. Kruszewski, incorporated herein by reference to Exhibit 10.(j)(2) to Stifel Financial Corp.’s Annual Report on Form 10-K for the year ended December 31, 1998. * | ||||
|
| |||
| Stock Unit Agreement with James M. Zemlyak dated January 11, 2000, incorporated herein by reference to Exhibit 10.(s) to Stifel Financial Corp.’s Annual Report on Form 10-K / A Amendment No. 1 for the year ended December 31, 2001, filed on April 9, 2002. * | ||||
| Stifel Financial Corp. 1999 Executive Incentive Performance Plan, incorporated herein by reference to Annex B of Stifel Financial Corp.’s Proxy Statement for the 1999 Annual Meeting of | ||||
| 6 | Stifel Financial Corp. Equity Incentive Plan for Non-Employee Directors, incorporated herein by reference to Stifel Financial Corp.’s Registration Statement on Form S-8 (Registration File No. 333-52694) filed December 22, 2000. * | |||
| 7 | Stifel Financial Corp. Equity Incentive Plan for Non-Employee Directors, as restated and amended, incorporated by reference to Annex A of Stifel Financial Corp.’s Definitive Proxy Statement for the 2008 Annual Meeting of Shareholders filed on April 29, 2008. * | |||
| 8 | Stifel | |||
| 9(a) | Stifel Financial Corp. 2001 Incentive Plan, incorporated herein by reference to Stifel Financial Corp.’s Registration Statement on Form S-8 (Registration File No. 333-82328) filed February 7, 2002. * | |||
| 9(b) | Stifel Financial Corp. 2001 Incentive Plan Amendment No. 1, incorporated herein by reference to Stifel Financial Corp.’s Registration Statement on Form S-8 (Registration File No. 333-105756) filed June 2, 2003. * | |||
| 9(c) | Stifel Financial Corp. 2001 Incentive Plan Amendment No. 2, incorporated herein by reference to Stifel Financial Corp.’s Registration Statement on Form S-8 (Registration File No. 333-140662) filed February 13, 2007. * | |||
| 9(d) | Stifel Financial Corp. 2001 Incentive Stock Plan, as restated and amended, incorporated herein by reference to Annex B to the Stifel Financial Corp.’s Definitive Proxy Statement for the 2008 Annual Meeting of Shareholders filed on April 29, 2008. * | |||
| 9(e) | Stifel Financial Corp. 2001 Incentive Stock Plan (2011 Restatement), as amended, incorporated herein by reference to Exhibit 10.1 to Stifel Financial Corp.’s Current Report on Form 8-K (date of earliest event reported June 21, 2011) filed on June 22, 2011. * | |||
| 10 | Stifel Financial Corp. 2003 Employee Stock Purchase Plan, incorporated herein by reference to Stifel Financial Corp.’s Registration Statement on Form S-8 (Registration File No. 333-100414) filed October 8, 2002. * | |||
| 11 | Stifel Financial Corp. 2010 Executive Incentive Plan, incorporated herein by reference to Appendix A to Stifel Financial Corp.’s Definitive Proxy Statement for the 2010 Annual Meeting of Shareholders filed on February 26, 2010. * | |||
| 12(a) | Stifel, Nicolaus & Company, Incorporated Wealth Accumulation Plan, incorporated herein by reference to Stifel Financial Corp.’s Registration Statement on Form S-8 (Registration File No. 333-60506) filed May 9, 2001. * | |||
Exhibit No. | Description | |||
| 12(b) | Stifel, Nicolaus & Company, Incorporated Wealth Accumulation Plan Amendment No. 1, incorporated herein by reference to Stifel Financial Corp.’s Registration Statement on Form S-8 (Registration File No. 333-105759) filed June 2, 2003. * | |||
|
| |||
| First Amendment to Stifel, Nicolaus & Company, Incorporated Wealth Accumulation Plan 2010 Restated, incorporated herein by reference to Exhibit 10.1 to Stifel Financial Corp.’s Current Report on Form 8-K filed on August 9, 2010. * | ||||
| Amendment No.1 to Merger Agreement by and among Stifel Financial Corp. and | ||||
| Asset Purchase Agreement dated | ||||
| Amendment No. 1 to Asset Purchase Agreement, dated | ||||
| 14(c) | Amendment No. 2 to Asset Purchase Agreement, dated June 1, 2009, by and between Stifel, Nicolaus & Company, Incorporated and UBS Financial Services, Inc., incorporated herein by reference to Exhibit 10 (aa) to Stifel Financial Corp.’s Quarterly Report on Form 10-Q for the quarterly period ended September 30, 2009, filed on November 9, 2009. | |||
| 14(d) | Amendment No. 3 to Asset Purchase Agreement, dated August 12, 2009, by and between Stifel, Nicolaus & Company, Incorporated and UBS Financial Services, Inc., incorporated herein by reference to Exhibit 2.1 to Stifel Financial Corp.’s Current Report on Form 8-K (date of earliest event reported August 12, 2009) filed on August 18, 2009. | |||
| 14(e) | Amendment No. 4 to Asset Purchase Agreement, dated September 11, 2009, by and between Stifel, Nicolaus & Company, Incorporated and UBS Financial Services, Inc. incorporated herein by reference to Exhibit 10 (cc) to Stifel Financial Corp.’s Quarterly Report on Form 10-Q for the quarterly period ended September 30, 2009, filed on November 9, 2009. | |||
| 11. | Computation of Per Share Earnings is set forth in Note 26 of Notes to Consolidated Financial Statements included in this Form 10-K. | |||
| 21.1 | List of Subsidiaries of Stifel Financial Corp., filed herewith. | |||
| 23.1 | Consent of Independent Registered Public Accounting Firm, filed herewith. | |||
| Rule 13a-14(a) Certification of Chief Executive Officer. | ||||
| Rule 13a-14(a) Certification of Chief Financial Officer. | ||||
| 32.1 | Section 1350 Certification of Chief Executive Officer. ** | |||
Exhibit No. | Description | |||
| 32.2. | Section 1350 Certification of Chief Financial Officer. ** | |||
|
| |||
| Interactive Data Files Pursuant to Rule 405 of Regulation S-T: (i) Consolidated Statements of Financial Condition as of December 31, | ||||
| * | Management contract or compensatory plan or arrangement. |
| ** | The certifications attached as Exhibits 32.1 and 32.2 |
Pursuant to the requirements of Section 13 or 15(d) of the Securities Exchange Act of 1934, the registrant has duly caused this report to be signed on its behalf by the undersigned, thereunto duly authorized on March 1, 2013.2, 2015.
STIFEL FINANCIAL CORP.
/s/ Ronald J. Kruszewski | ||
| Ronald J. Kruszewski | ||
Chairman of the Board, Chief Executive Officer, and Director |
Pursuant to the requirements of the Securities Exchange Act of 1934, this report has been signed below by the following persons on behalf of the registrant and in the capacities indicated on March 1, 2013.2, 2015.
/s/ Ronald J. Kruszewski | Chairman of the Board, | ||||
Ronald J. Kruszewski | |||||
/s/ James M. Zemlyak | President, Chief Financial | ||||
James M. Zemlyak | |||||
/s/ Bruce A. Beda | Director | ||||
Bruce A. Beda | |||||
/s/ Michael W. Brown | Director | ||||
Michael W. Brown | |||||
/s/ Charles A. Dill | Director | ||||
Charles A. Dill | |||||
/s/ John P. Dubinsky | Director | ||||
John P. Dubinsky | |||||
/s/ Robert E. Grady | Director | ||||
Robert E. Grady | |||||
/s/ Frederick O. Hanser | Director | ||||
Frederick O. Hanser | |||||
/s/ Richard J. Himelfarb | Director | ||||
Richard J. Himelfarb | |||||
/s/ Alton F. Irby III | Director | ||||
| |||||
| |||||
| Alton F. Irby III | ||||
/s/ Thomas B. Michaud | Director | ||||
Thomas B. Michaud | |||||
/s/ Thomas P. Mulroy | Director | ||||
Thomas P. Mulroy | |||||
/s/ Victor J. Nesi | Director | ||||
Victor J. Nesi | |||||
/s/ James M. Oates | Director | ||||
James M. Oates | |||||
/s/ Ben A. Plotkin | Director | ||||
Ben A. Plotkin | |||||
/s/ Thomas W. Weisel | |||||
| Chairman of the Board and Director | ||||
| Thomas W. Weisel | |||||
/s/ Kelvin R. Westbrook | Director | ||||
Kelvin R. Westbrook | |||||
/s/ Michael J. Zimmerman | Director | ||||
Michael J. Zimmerman | |||||
156163