| x | ANNUAL REPORT PURSUANT TO SECTION 13 OR 15(d) OF THE SECURITIES EXCHANGE ACT OF 1934 |
| For the fiscal year ended December 31, 2014 | |
For the fiscal year ended December 31, 2012
| ¨ | TRANSITION REPORT PURSUANT TO SECTION 13 OR 15(d) OF THE SECURITIES EXCHANGE ACT OF 1934 |
For the transition period from to | |
For the transition period fromto
| Virginia | 54-1497771 | |
|
| |
| 23225 | |
| (Address of principal executive offices) | (Zip Code) | |
Title of Each Class | Name of Each Exchange on Which Registered | |
| Common Stock | New York Stock Exchange | |
| Preferred Stock Purchase Rights | New York Stock Exchange | |
| Large accelerated filer | x | Accelerated filer | ||||
| Non-accelerated filer | ¨ (Do not check if a smaller reporting company) | Smaller reporting company | ¨ | |||
$585,612,317*
| * | In determining this figure, an aggregate of |
By leveraging the combination of film capabilities and its patented microstructure technology, Bright View offers optical management products for a wide range of applications, including lighting, signage and durable goods. page 5. Major Markets End-Uses Electrical Building and construction: Nonresidential Residential Distribution Transportation Consumer durables Machinery and equipment Electrical Total Tredegar’s consolidated net sales (sales less freight) from continuing operations, respectively. Intellectual Property. New acquisitions, such as the October 2011 acquisition of Terphane Holdings LLC (“Terphane”) and the October 2012 acquisition of AACOA, can provide meaningful opportunities to grow the Company’s business and improve profitability. Acquired businesses may not achieve expected levels of revenue, profit or productivity, or otherwise perform as expected. Acquisitions involve special risks, including, without limitation, diversion of management’s time and attention from existing businesses, the potential assumption of unanticipated liabilities and contingencies and potential difficulties in integrating acquired businesses and achieving anticipated operational improvements. While the Company’s strategy is to acquire businesses that will improve its competitiveness and profitability, acquisitions may not be successful or accretive to earnings. industry cross-cycle growth. Locations in the U.S. Locations in the U.S. 2014. First quarter Second quarter Third quarter Fourth quarter $21.65. 2014. Years Ended December 31 Results of Operations (a): Sales Other income (expense), net Cost of goods sold Freight Selling, general & administrative expenses Research and development expenses Amortization of intangibles Interest expense Asset impairments and costs associated with exit and disposal activities Goodwill impairment charge Income from continuing operations before income taxes Income taxes Income (loss) from continuing operations (a) Discontinued operations, net of tax (a) Net income (loss) Diluted earnings (loss) per share (a): Continuing operations Discontinued operations Net income (loss) 18. Years Ended December 31 Share Data: Equity per share Cash dividends declared per share Weighted average common shares outstanding during the period Shares used to compute diluted earnings (loss) per share during the period Shares outstanding at end of period Closing market price per share: High Low End of year Total return to shareholders (h) Financial Position: Total assets Cash and cash equivalents Debt Shareholders’ equity (net book value) Equity market capitalization (i) Segment Film Products Aluminum Extrusions Total net sales Add back freight Sales as shown in Consolidated Statements of Income Segment Film Products Aluminum Extrusions AFBS (formerly Therics) Subtotal General corporate Cash and cash equivalents Identifiable assets from continuing operations Discontinued operations (a): Total 18. Segment Film Products: Ongoing operations Plant shutdowns, asset impairments, restructurings and other Aluminum Extrusions: Ongoing operations Plant shutdowns, asset impairments, restructurings and other Goodwill impairment charge AFBS (formerly Therics): Gain on sale of investments in Theken Spine and Therics, LLC Total Interest income Interest expense Gain on sale of corporate assets Gain (loss) on investment accounted for under the fair value method Stock option-based compensation costs Corporate expenses, net Income from continuing operations before income taxes Income taxes Income (loss) from continuing operations Income (loss) from discontinued operations, net of tax (a) Net income (loss) 18. Segment Film Products Aluminum Extrusions Subtotal General corporate Total continuing operations Discontinued operations (a): Total Segment Film Products Aluminum Extrusions Subtotal General corporate Capital expenditures for continuing operations Discontinued operations (a): Total capital expenditures Investments Total 18. 37. (In thousands, except percentages) Sales volume (pounds) Net sales Operating profit from ongoing operations approximately $0.7 million in 2014 and $0.5 million in 2013. increase shareholder value. (In thousands, except percentages) Sales volume (pounds) Net sales Operating profit from ongoing operations fabricated components. the prior year includes one-time, construction-related expense of approximately $0.6 million associated with the automotive press project at the Company’s manufacturing facility in Newnan, Georgia. The remaining portion of the change in operating profit from ongoing operations in 2014 compared to 2013 is primarily related to favorable pricing from value-added services. 2015. $0.4 million in 2013. 2013. 28. 2013). 2 inputs, including investments by other investors. Subsequent to the last round of financing, and until the next round of financing, Adjustments to the estimated fair value of this investment will be made in the period upon which such changes can be quantified. 2011. the Company. performance-based incentive costs. A fourth quarter charge of A fourth quarter charge of $0.7 million ($0.4 million after taxes), a third quarter charge of $75,000 ($46,000 after taxes) and a second quarter charge of $0.2 million ($0.1 million after taxes) Kentland, Indiana. matters were adjusted in 2014, resulting in income from discontinued operations of $0.9 million ($0.9 million after taxes). 19. 2013. Average debt outstanding and interest rates were as follows: (In Millions) Floating-rate debt with interest charged on a rollover basis at one-month LIBOR plus a credit spread: Average outstanding debt balance Average interest rate Fixed-rate and other debt: Average outstanding debt balance Average interest rate Total debt: Average outstanding debt balance Average interest rate administrative expenses. A fourth quarter charge of A matters. 19. (In Millions) Floating-rate debt with interest charged on a rollover basis at one-month LIBOR plus a credit spread: Average outstanding debt balance Average interest rate Fixed-rate and other debt: Average outstanding debt balance Average interest rate Total debt: Average outstanding debt balance Average interest rate Accounts and other receivables increased Accounts and other receivables in Film Products Accounts and other receivables in Aluminum Extrusions increased by $9.0 million primarily due to Inventories increased Inventories in Film Products increased by approximately Inventories in Aluminum Extrusions increased by approximately Goodwill and other intangibles Accounts payable increased by Accounts payable in Film Products increased by Accounts payable in Aluminum Extrusions increased by Accrued expenses Other noncurrent liabilities increased by Net deferred income tax liabilities in excess of assets (In Thousands) Net capitalization: Cash and cash equivalents Debt: $350 million revolving credit agreement maturing April 23, 2017 Other debt Total debt Debt net of cash and cash equivalents Shareholders’ equity Net capitalization Indebtedness as defined in revolving credit agreement: Total debt Face value of letters of credit Other Indebtedness Pricing Under Revolving Credit Agreement (Basis Points) Indebtedness-to-Adjusted > 2.0x but <= 3.0x > 1.0x but <=2.0x <= 1.0x The Company has historically had indebtedness-to-adjusted EBITDA ratios of less than 2.0x. Computations of adjusted EBITDA and adjusted EBIT as defined in revolving credit agreement for the twelve months ended December 31, 2012: Net income Plus: After-tax losses related to discontinued operations Total income tax expense for continuing operations Interest expense Depreciation and amortization expense for continuing operations All non-cash losses and expenses, plus cash losses and expenses not to exceed $10,000, for continuing operations that are classified as unusual, extraordinary or which are related to plant shutdowns, asset impairments and/or restructurings (cash-related of $4,047) Charges related to stock option grants and awards accounted for under the fair value-based method Losses related to the application of the equity method of accounting Losses related to adjustments in the estimated fair value of assets accounted for under the fair value method of accounting Minus: After-tax income related to discontinued operations Total income tax benefits for continuing operations Interest income All non-cash gains and income, plus cash gains and income in excess of $10,000, for continuing operations that are classified as unusual, extraordinary or which are related to plant shutdowns, asset impairments and/or restructurings Income related to changes in estimates for stock option grants and awards accounted for under the fair value-based method Income related to the application of the equity method of accounting Income related to adjustments in the estimated fair value of assets accounted for under the fair value method of accounting Plus cash dividends declared on investments accounted for under the equity method of accounting Plus or minus, as applicable, pro forma EBITDA adjustments associated with acquisitions and asset dispositions Adjusted EBITDA as defined in revolving credit agreement Less: Depreciation and amortization expense for continuing operations (including pro forma for acquisitions and asset dispositions) Adjusted EBIT as defined in revolving credit agreement Shareholders’ equity at December 31, 2012 as defined in revolving credit agreement Computations of leverage and interest coverage ratios as defined in revolving credit agreement at December 31, 2012: Leverage ratio (indebtedness-to-adjusted EBITDA) Interest coverage ratio (adjusted EBIT-to-interest expense) Most restrictive covenants as defined in revolving credit agreement: Maximum permitted aggregate amount of dividends that can be paid by Tredegar during the term of the revolving credit agreement ($100,000 plus 50% of net income generated beginning January 1, 2012) Minimum adjusted shareholders’ equity permitted ($320,000 plus 50% of net income generated, to the extent positive, beginning January 1, 2012) Maximum leverage ratio permitted: Minimum interest coverage ratio permitted (In Millions) Debt: Principal payments Estimated interest expense Estimated contributions required(1) : Defined benefit plans Other postretirement benefits Capital expenditure commitments(2) Operating leases Utility contracts Estimated obligations relating to uncertain tax positions(3) Other(4) Total it competes. Canada Europe Latin America Asia Total % exposure to foreign markets Film Products is generally able to match the currency of its sales and costs for its remaining product lines. adjustments related to inventories accounted for under the last-in, first-out method (“LIFO”) was a negative $0.3 million in 2013 compared to 2012. Identifiable assets in Film Products increased to currencies for operations outside the U.S., and a reduction in inventory balances.. required to support operations. production costs. Pertain to the maintenance of records that, in reasonable detail, accurately and fairly reflect the transactions and dispositions of our assets; Provide reasonable assurance that transactions are recorded as necessary to permit preparation of financial statements in accordance with U.S. generally accepted accounting principles, and that our receipts and expenditures are being made only in accordance with authorization of our management and directors; and Provide reasonable assurance regarding prevention or timely detection of unauthorized acquisition, use or disposition of our assets that could have a material effect on the consolidated financial statements. 44. Name Title Nancy M. Taylor A. Brent King Kevin A. O’Leary Mary Jane Hellyar.Ms. Hellyar was elected Vice President of the Company and President of Tredegar Film Products Corporation on September 24, 2012. Ms. Hellyar served as Chief Executive Officer of TechnoCorp Energy OLED from September 2009 until returning to retirement in September 2010. She served as President of Eastman Kodak Company’s Film Photofinishing and Entertainment Group from September 2005 until retiring from Kodak in June 2009. Column (c) Plan Category Equity compensation plans approved by security holders Equity compensation plans not approved by security holders Total Information on accounting fees and services to be included in the Proxy Statement under the heading “Audit Fees;” and Information on the Audit Committee’s procedures for pre-approving certain audit and non-audit services to be included in the Proxy Statement under the heading “Board Meetings, Meetings of Non-Management Directors and Board Committees—Audit Committee Matters.” Consolidated Balance Sheets as of December 31, Consolidated Statements of Income for the Years Ended December 31, Consolidated Statements of Cash Flows for the Years Ended December 31, 86-88. 2, 2015 December 31 Assets Current assets: Cash and cash equivalents Accounts and other receivables, net of allowance for doubtful accounts and sales returns of $3,552 in 2012 and $3,539 in 2011 Income taxes recoverable Inventories Deferred income taxes Prepaid expenses and other Current assets of discontinued operation Total current assets Property, plant and equipment, at cost: Land and land improvements Buildings Machinery and equipment Total property, plant and equipment Less accumulated depreciation Net property, plant and equipment Goodwill and other intangibles Other assets and deferred charges Noncurrent assets of discontinued operation Total assets Liabilities and Shareholders’ Equity Current liabilities: Accounts payable Accrued expenses Current liabilities of discontinued operation Total current liabilities Long-term debt Deferred income taxes Other noncurrent liabilities Noncurrent liabilities of discontinued operation Total liabilities Commitments and contingencies (Notes 16 and 19) Shareholders’ equity: Common stock (no par value): Authorized 150,000,000 shares; Issued and outstanding—32,069,370 shares in 2012 and 32,057,281 in 2011 (including restricted stock) Common stock held in trust for savings restoration plan (64,654 shares in 2012 and 61,577 in 2011) Accumulated other comprehensive income (loss): Foreign currency translation adjustment Gain (loss) on derivative financial instruments Pension and other postretirement benefit adjustments Retained earnings Total shareholders’ equity Total liabilities and shareholders’ equity Years Ended December 31 Revenues and other: Sales Other income (expense), net Costs and expenses: Cost of goods sold Freight Selling, general and administrative Research and development Amortization of intangibles Interest expense Asset impairments and costs associated with exit and disposal activities Total Income from continuing operations before income taxes Income taxes Income from continuing operations Income (loss) from discontinued operations, net of tax Net income Earnings (loss) per share: Basic: Continuing operations Discontinued operations Net income Diluted: Continuing operations Discontinued operations Net income (LOSS) Years Ended December 31 Net income Other comprehensive income (loss): Foreign currency translation adjustment: Unrealized foreign currency translation adjustment net of tax of $897 in 2012 and tax benefit of $505 in 2011 and $1,443 in 2010) Reclassification adjustment of foreign currency translation gain included in income (net of tax of $1,497 in 2011) Derivative financial instruments adjustment (net of tax of $818 in 2012, a tax benefit of $423 in 2011 and $287 in 2010) Pension & other post-retirement benefit adjustments Net gains or losses and prior service costs (net of tax benefit of $11,145 in 2012, $20,032 in 2011 and $2,135 in 2010) Amortization of prior service costs and net gains or losses (net of tax of $3,749 in 2012, $2,232 in 2011 and $1,732 in 2010) Other comprehensive income (loss) Comprehensive income (loss) Years Ended December 31 Cash flows from operating activities: Net income Adjustments for noncash items: Depreciation Amortization of intangibles Deferred income taxes Accrued pension and postretirement benefits (Gain) loss on an investment accounted for under the fair value method (Gain) loss on sale of assets Loss on asset impairments Changes in assets and liabilities, net of effects of acquisitions and divestitures: Accounts and notes receivables Inventories Income taxes recoverable Prepaid expenses and other Accounts payable and accrued expenses Other, net Net cash provided by operating activities Cash flows from investing activities: Acquisitions, net of cash acquired Capital expenditures Net proceeds from the sale of Fallings Springs, LLC Proceeds from the sale of assets and other Net cash used in investing activities Cash flows from financing activities: Borrowings Debt principal payments and financing costs Dividends paid Repurchases of Tredegar common stock Proceeds from exercise of stock options and other Net cash provided by (used in) financing activities Effect of exchange rate changes on cash Increase (decrease) in cash and cash equivalents Cash and cash equivalents at beginning of period Cash and cash equivalents at end of period Supplemental cash flow information: Interest payments Income tax payments (refunds), net Balance January 1, 2010 Net income Foreign currency translation adjustment Derivative financial instruments adjustment (net of tax benefit of $287) Net gains or losses and prior service costs (net of tax benefit of $2,135) Amortization of prior service costs and net gains or losses (net of tax of $1,732) Cash dividends declared ($.16 per share) Stock-based compensation expense Issued upon exercise of stock options (including related income tax of $204) & other Repurchases of Tredegar common stock Tredegar common stock purchased by trust for savings restoration plan Balance December 31, 2010 Net income Foreign currency translation adjustment Derivative financial instruments adjustment Net gains or losses and prior service costs (net of tax benefit of $20,032) Amortization of prior service costs and net gains or losses (net of tax of $2,232) Cash dividends declared ($.18 per share) Stock-based compensation expense Issued upon exercise of stock options (including related income tax benefit of $76) & other Tredegar common stock purchased by trust for savings restoration plan Balance December 31, 2011 Net income Foreign currency translation adjustment Derivative financial instruments adjustment (net of tax of $818) Net gains or losses and prior service costs (net of tax benefit of $11,145) Amortization of prior service costs and net gains or losses (net of tax of $3,749) Cash dividends declared ($.96 per share) Stock-based compensation expense Issued upon exercise of stock options (including related income tax benefit of $144) & other Shares received from the sale of Falling Springs, LLC Tredegar common stock purchased by trust for savings restoration plan Balance December 31, 2012 respectively. 2014. Weighted average shares outstanding used to compute basic earnings per share Incremental shares attributable to stock options and restricted stock Shares used to compute diluted earnings per share in 2012. Dividend yield Weighted average volatility percentage Weighted average risk-free interest rate Holding period (years): Officers Management Weighted average excercise price at date of grant (also weighted average market price at date of grant): Officers Management Stock options granted (number of shares): Officers Management Total Estimated weighted average fair value of options per share at date of grant: Officers Management Total estimated fair value of stock options granted (in thousands) (In Thousands) Accounts receivable Inventories Property, plant & equipment Identifiable intangible assets: Customer relationships Trade names Proprietary technology Noncompete agreements Other assets (current & noncurrent) Trade payables & accrued expenses Total identifiable net assets Purchase price, net of cash received Goodwill Identifiable Intangible Asset Customer relationships Proprietary technology Trade names Noncompete agreements Terphane operates manufacturing facilities in Cabo de Santo Agostinho, Brazil and Bloomfield, New York. It is a producer of thin polyester films in Latin America with a growing presence in strategic niches in the U.S. (In Thousands, Except Per Share Data) Sales Income from continuing operations Earnings per share from continuing operations: Basic Diluted Adjustment for additional depreciation and amortization expense associated with the adjustments to property, plant and equipment, and intangible assets associated with purchase accounting; Additional interest expense and financing fees associated with borrowing arrangements used to fund the Adjustments to eliminate transactions-related expenses associated with the October Adjustments for the estimated net income tax benefit associated with the previously described adjustments; and Adjustments to income tax expense for AACOA as it had previously elected to be treated as an S-Corp for federal income tax purposes. notably a favorable adjustment to the timing and amount of anticipated cash flows derived from updated marketing research; the passage of time as anticipated cash flows associated with achieving product development commercialization milestones are discounted at 55% for their high degree of risk; and a reduction in the weighted average cost of capital used to discount cash flows in (In Thousands) Assets: Cash & cash equivalents Other current assets Other long-term assets Identifiable intangibles assets Total assets Revenues & Expenses: Revenues Expenses and other, net Income tax (expense) benefit Net income (loss) Net Sales (In Thousands) Film Products Aluminum Extrusions Total net sales Add back freight Sales as shown in consolidated statements of income Operating Profit (In Thousands) Film Products: Ongoing operations Plant shutdowns, asset impairments, restructurings and other (a) Aluminum Extrusions: Ongoing operations Plant shutdowns, asset impairments, restructurings and other (a) Total Interest income Interest expense Gain (loss) on investment accounted for under the fair value method (a) Stock option-based compensation expense Corporate expenses, net (a) Income from continuing operations before income taxes Income taxes (a) Income from continuing operations Income (loss) from discontinued operations (a) Net income (loss) (In Thousands) Film Products Aluminum Extrusions Subtotal General corporate (b) Cash and cash equivalents (d) Continuing operations Discontinued operations Total (In Thousands) Film Products Aluminum Extrusions Subtotal General corporate Continuing operations Discontinued operations Total (In Thousands) United States Exports from the United States to: Asia Canada Europe Latin America Operations outside the United States: Brazil The Netherlands Hungary China India Italy Total (c) Identifiable Assets by Geographic Area (d) (In Thousands) United States (b) Operations outside the United States: Brazil The Netherlands China Hungary India General corporate (b) Cash and cash equivalents (d) Continuing operations Discontinued operations Total (In Thousands) Film Products: Personal care materials Flexible packaging films Surface protection films Polyethylene overwrap and polypropylene films Films for other markets Subtotal Aluminum Extrusions: Nonresidential building & construction Residential building & construction Distribution Consumer durables Transportation Machinery & equipment Electrical Other Subtotal Total (In Thousands) Trade, less allowance for doubtful accounts and sales returns of $3,552 in 2012 and $3,539 in 2011 Other Total (In Thousands) Balance, beginning of year Charges to expense Recoveries Write-offs Foreign exchange and other Balance, end of year (In Thousands) Finished goods Work-in-process Raw materials Stores, supplies and other Total (In Thousands) Goodwill Other identifiable intangibles Customer relationships (cost basis of $37,400 in 2012 and $32,600 in 2011) Proprietary technology (cost basis of $21,516 in 2012 and $18,116 in 2011) Tradenames Non-compete agreements (cost basis of $4,302 in 2012 and $2,702 in 2011) Total carrying value of other intangibles Total carrying value of goodwill and other intangibles (In Thousands) Net carrying value of goodwill, beginning of year Acquisitions Increase (decrease) due to foreign currency translation Net carrying value of goodwill, end of year Year 2013 2014 2015 2016 2017 2013. (In Thousands) Derivatives Designated as Hedging Instruments Asset derivatives: Aluminum futures contracts Liability derivatives: Aluminum futures contracts Derivatives Not Designated as Hedging Instruments Asset derivatives: Aluminum futures contracts Liability derivatives: Aluminum futures contracts 2013: (In Thousands) Derivatives Designated as Hedging Instruments Asset derivatives: Years Ended December 31, Amount of pre-tax gain (loss) recognized in other comprehensive income Location of gain (loss) reclassified from accumulated other comprehensive income into net income (effective portion) Amount of pre-tax gain (loss) reclassified from accumulated other comprehensive income to net income (effective portion) (In Thousands) Payrolls, related taxes and medical and other benefits Vacation Contractual indemnification claims (see note 3) Incentive compensation Taxes other than federal income and payroll Deferred revenue Workers’ compensation and disabilities Other Total (In Thousands) Balance at January 1, 2010 2010: Charges Cash spent Charged against assets Balance at December 31, 2010 2011: Charges Cash spent Charged against assets Balance at December 31, 2011 2012: Charges Cash spent Charged against assets Balance at December 31, 2012 Pricing Under Credit Revolving Agreement (Basis Points) Indebtedness-to-Adjusted EBITDA Ratio > 2.0x but <= 3.0x > 1.0x but <=2.0x <= 1.0x Maximum indebtedness-to-adjusted EBITDA of 3.0x; Minimum adjusted EBIT-to-interest expense of 2.5x; Maximum aggregate distributions to shareholders over the term of the Credit Agreement of $100 million plus, beginning with the fiscal quarter ended March 31, 2012, 50% of net income; and Minimum shareholders’ equity (as defined in the Credit Agreement) at any point during the term of the Credit Agreement of at least $320 million increased on a cumulative basis at the end of each fiscal quarter, beginning with the fiscal quarter ended March 31, 2012, by an amount equal to 50% of net income (to the extent positive). Debt Due and Outstanding at December 31, 2011 (In Thousands) Year Due 2013 2014 2015 2016 2017 Total Tredegar’s Common Stock. Each Right Outstanding at January 1, 2010 Granted Forfeited and Expired Exercised Outstanding at December 31, 2010 Granted Forfeited and Expired Exercised Outstanding at December 31, 2011 Granted Forfeited and Expired Exercised Outstanding at December 31, 2012 Aggregate Intrinsic Value (In Thousands) Aggregate Intrinsic Value (In Thousands) 2014: Outstanding at January 1, 2010 Granted Vested Forfeited Outstanding at December 31, 2010 Granted Vested Forfeited Outstanding at December 31, 2011 Granted Vested Forfeited Outstanding at December 31, 2012 2014: 2014. Beginning in 2014, with the exception of plan participants at two of the Company’s U.S. manufacturing facilities, the plan no longer accrues benefits associated with crediting employees for service, thereby freezing all future benefits under the plan. (In Thousands) Change in benefit obligation: Benefit obligation, beginning of year Service cost Interest cost Effect of actuarial (gains) losses related to the following: Discount rate change Retirement rate assumptions and mortality table adjustments Retiree medical participation rate change Other Benefits paid Benefit obligation, end of year Change in plan assets: Plan assets at fair value, beginning of year Actual return on plan assets Employer contributions Benefits paid Plan assets at fair value, end of year Funded status of the plans Amounts recognized in the consolidated balance sheets: Prepaid benefit cost Accrued benefit liability Net amount recognized 2013: (In Thousands, Except Percentages) Weighted-average assumptions used to determine benefit obligations: Discount rate Rate of compensation increases Weighted-average assumptions used to determine net periodic benefit cost: Discount rate Rate of compensation increases Expected long-term return on plan assets Components of net periodic benefit cost: Service cost Interest cost Expected return on plan assets Amortization of prior service costs and gains or losses Settlement/curtailment Net periodic benefit cost At December 31, not impact the post-retirement obligation. (In Thousands) 2013 2014 2015 2016 2017 2018—2022 (In Thousands) Prior service cost (benefit) Net actuarial (gain) loss (In Thousands) Prior service cost (benefit) Net actuarial (gain) loss Pension plans related to continuing operations: Fixed income securities Large/mid-capitalization equity securities Small-capitalization equity securities International and emerging market equity securities Total equity securities Private equity and hedge funds Other assets Total for continuing operations Pension plans related to continuing operations: Fixed income securities Large/mid-capitalization equity securities Small-capitalization equity securities International and emerging market equity securities Total equity securities Private equity and hedge funds Other assets Total for continuing operations 2015. December 31, 2012 Large/mid-capitalization equity securities Small-capitalization equity securities International and emerging market equity securities Fixed income securities Private equity and hedge funds Other assets Total plan assets at fair value Contracts with insurance companies Total plan assets, December 31, 2012 December 31, 2011 Large/mid-capitalization equity securities Small-capitalization equity securities International and emerging market equity securities Fixed income securities Private equity and hedge funds Other assets Total plan assets at fair value Contracts with insurance companies Total plan assets, December 31, 2011 (In Thousands) Balance at January 1, 2011 Purchases Sales Distributions Actual return on plan assets still held at year end Transfers in and/or out of Level 3 Balance at December 31, 2011 Purchases Sales Distributions Actual return on plan assets still held at year end Transfers in and/or out of Level 3 Balance at December 31, 2012 The The savings plan includes immediate vesting for active employees of past matching contributions as well as future matching contributions when made (compared with the previous 5-year graded vesting) and automatic enrollment at 3% of base pay unless the employee opts out or elects a different percentage. Year 2013 2014 2015 2016 2017 Remainder Total (In Thousands) Income from continuing operations before income taxes: Domestic Foreign Total Current income taxes: Federal State Foreign Total Deferred income taxes: Federal State Foreign Total Total income taxes Income tax expense at federal statutory rate Valuation allowance for capital loss carry-forwards State taxes, net of federal income tax benefit Unremitted earnings from foreign operations Non-deductible expenses Non-deductible acquisition expenses Write-off of tax receivable from indemnification Research and development tax credit Deduction for divestiture of subsidiary stock Valuation allowance for foreign operating loss carry-forwards Reversal of income tax contingency accruals and tax settlements Changes in estimates related to prior year tax provision Domestic Production Activities Deduction Foreign rate differences Tax incentive Other Effective income tax rate (In Thousands) Deferred tax liabilities: Amortization of goodwill Depreciation Foreign currency translation gain adjustment Derivative financial instruments Total deferred tax liabilities Deferred tax assets: Pensions Employee benefits Excess capital losses and book/tax basis differences on investments Asset write-offs, divestitures and environmental accruals Inventory Tax benefit on state and foreign NOL and credit carryforwards Allowance for doubtful accounts and sales returns Timing adjustment for unrecognized tax benefits on uncertain tax positions, including portion relating to interest and penalties Derivative financial instruments Other Deferred tax assets before valuation allowance Less: Valuation allowance Total deferred tax assets Net deferred tax liability Included in the balance sheet: Noncurrent deferred tax liabilities in excess of assets Current deferred tax assets in excess of liabilities Net deferred tax liability at December 31, 2013. (In Thousands) Balance at beginning of period Increase (decrease) due to tax positions taken in: Current period Prior period Increase (decrease) due to settlements with taxing authorities Reductions due to lapse of statute of limitations Balance at end of period (In Thousands) Gross unrecognized tax benefits on uncertain tax positions (reflected in current income tax and other noncurrent liability accounts in the balance sheet) Deferred income tax assets related to unrecognized tax benefits on uncertain tax positions (reflected in deferred income tax accounts in the balance sheet) Net unrecognized tax benefits on uncertain tax positions, which would impact the effective tax rate if recognized Interest and penalties accrued on deductions taken relating to uncertain tax positions (approximately $(300), $200 and $(400) reflected in income tax expense in the income statement in 2012, 2011 and 2010, respectively, with the balance shown in current income tax and other noncurrent liability accounts in the balance sheet) Related deferred income tax assets recognized on interest and penalties Interest and penalties accrued on uncertain tax positions net of related deferred income tax benefits, which would impact the effective tax rate if recognized Total net unrecognized tax benefits on uncertain tax positions reflected in the balance sheet, which would impact the effective tax rate if recognized positions. A fourth quarter charge of $0.9 million ($0.5 million after taxes), a third quarter charge of $0.8 million ($0.5 million after taxes), a second quarter charge of $1.0 million ($0.7 million after taxes) and a first quarter charge of $0.9 million ($0.5 million after taxes) associated with the shutdown of the aluminum extrusions manufacturing facility in Kentland, Indiana, which includes accelerated depreciation for property, plant and equipment of $2.4 million (included in “Cost of goods sold” in the consolidated statements of income), severance and other employee related expenses of $1.2 million and other shutdown-related charges of $2.3 million, partially offset by adjustments to inventories accounted for under the LIFO method of $1.5 million (included in “Cost of goods sold” in the consolidated statements of income) and gains on the sale of equipment of $0.8 million (included in “Other income (expense), net” in the consolidated statements of income); A fourth quarter gain of $1.3 million ($0.7 million after taxes) in Film Products (included in “Other income (expense), net” in the consolidated statements of income) associated with an insurance recovery on idle equipment that was destroyed in a fire at an outside warehouse; A fourth quarter charge of $0.9 million ($0.6 million after taxes) and a third quarter charge of $0.3 million ($0.2 million after taxes) for acquisition-related expenses (included in “Selling, general and administrative expenses” in the consolidated statements of income) associated with the acquisition of AACOA by Aluminum Extrusions (see discussion below for further detail); A fourth quarter charge of $0.1 million ($0.1 million after taxes), a third quarter charge of $0.1 million ($0.1 million after taxes), a second quarter charge of $0.6 million ($0.4 million after taxes) and a first quarter charge of $0.3 million ($0.2 million after taxes) for integration-related expenses (included in “Selling, general and administrative expenses” in the consolidated statements of income) associated with the Film Products acquisition of Terphane; A fourth quarter gain of $1.1 million ($0.6 million after taxes) related to the sale of assets associated with a previously shutdown film products manufacturing facility in LaGrange, Georgia; A second quarter charge of $0.8 million ($0.5 million after taxes) for asset impairments associated with a previously shutdown film products manufacturing facility in LaGrange, Georgia; A fourth quarter charge of $0.2 million ($0.1 million after taxes) and a second quarter charge of $0.1 million ($46,000 after taxes) in Film Products and a first quarter charge of $0.2 million ($0.1 million after taxes) in Aluminum Extrusions for severance and other employee-related costs in connection with restructurings; A fourth quarter charge of $0.2 million ($0.2 million after taxes) for asset impairments in Film Products; A fourth quarter charge of $0.2 million ($0.1 million after taxes) for integration-related expenses (included in “Selling, general and administrative expenses” in the consolidated statements of income) associated with the Aluminum Extrusions’ acquisition of AACOA; A fourth quarter charge of $0.1 million ($49,000 after taxes) related to expected future environmental costs at In December 2014, the U.S. International Trade Commission voted to revoke the anti-dumping duty order on imported PET films from Brazil. The revocation, as a result of the vote by the International Trade Commission, was effective as of November 2013. On February 20, 2015, certain U.S. producers of PET Film filed a summons with the U.S. Court of International Trade to appeal the determination by the U.S. International Trade Commission. 2012 Sales Gross profit Income from continuing operations Income (loss) from discontinued operations Net income Earnings (loss) per share: Basic Continuing operations Discontinued operations Net income Diluted Continuing operations Discontinued operations Net income Shares used to compute earnings (loss) per share: Basic Diluted 2011 Sales Gross profit Income from continuing operations Income (loss) from discontinued operations Net income (loss) Earnings (loss) per share: Basic Continuing operations Discontinued operations Net income (loss) Diluted Continuing operations Discontinued operations Net income (loss) Shares used to compute earnings (loss) per share: Basic Diluted President, Chief Executive Officer and Director /s/ Vice President, Chief Financial Officer and Treasurer /s/ Corporate Controller and Assistant Treasurer /s/ Chairman of the Board of Directors Vice Chairman of the Board of Directors ( /s/ /s/20132015 Annual Meeting of Shareholders (the “Proxy Statement”) are incorporated by reference into Part III of this Form 10-K.20122014*Items 11, 13 and 14 and portions of Items 10 and 12 are incorporated by reference from the Proxy Statement. Item 1. BUSINESS and, The Netherlands, Hungary, China, Brazil and India. In October 2011, Film Products acquired Terphane Holdings LLC (“Terphane”), further expanding our films business in Latin America and the U.S. Film Products competes in all of its markets on the basis of product innovation, quality, price and service.• TM™, ComfortQuiltTM™, ComfortAireTM™, ComfortFeelTM™, SoftAireTM™ and FreshFeelTM™ brand names);• TM™, FabriFlexTM, StretchTabTM™, FlexAireTM™ and FlexFeelTM™ brand names); and• ,and AquiDry PlusTM and AquiSoftTM™ brand names.2012, 20112014, 2013 and 2010,2012, personal care productsmaterials accounted for approximately 38%34%, 45%36% and 50%38% of Tredegar’s consolidated net sales (sales less freight) from continuing operations, respectively.In 2012, flexibleFlexible packaging films accounted for approximately 12%, 14% and 16% of Tredegar’s consolidated net sales from continuing operations. Tredegar did not offer these films until the fourth quarter of 2011, so flexible packaging films only accounted for approximately 4% of consolidated net sales from continuing operations in 2011.2014, 2013 and 2012, respectively.singlesingle- and multi-layer surface protection films sold under the UltraMask®, ForceField™ and ForceField PEARLTM™ brand names. These films are used in high technologyhigh-technology applications, most notably protecting high-value components of flat panel displays used in televisions, monitors, notebooks, smart phones, tablets, e-readers and digital signage, during the manufacturing and transportation process. In 2012, 20112014, 2013 and 2010,2012, surface protection films accounted for approximately 8%10%, 9%10% and 12%8% of Tredegar’s consolidated net sales from continuing operations, respectively.an emphasis on packagingoverwrap for bathroom tissue and paper products. Thesetowels as these products provide our customers with thin-gauge films that are readily printable and convertible on conventional processing equipment. Film Products sells these overwrap films in a highly competitive environment, contending with other commodity-based films. Film Products also manufactures polypropylene films for packaging applications. Major end uses for polyethylenevarious industrial applications, including tape and polypropylene films include overwrap for bathroom tissue and paper towels as well as retort pouches.automotive protection.By leveraging the combination of film capabilities and our patented microstructure technology, we are able to offer optical management products for a wide range of applications, including lighting, signage and durable goods.The operations of Bright View Technologies Corporation (“Bright View”) were incorporated into, a Film Products effective January 1, 2012 to better leverage efforts to produce films for new market segments. Bright Viewsubsidiary, is a developer and producer of high-value microstructure-based optical films for the LED (light-emitting diode) and fluorescent lighting markets.% of Film Products Net Sales by Market Segment * 2014 2013 2012 Personal care materials 55 % 55 % 53 % Flexible packaging films 20 % 20 % 23 % Surface protection films 16 % 15 % 11 % Polyethylene overwrap & polypropylene films 8 % 9 % 10 % Films for other markets 1 % 1 % 3 % Total 100 % 100 % 100 % * See previous discussion by market segment for comparison of net sales to the Company’s consolidated net sales for material market segments for each of the years presented. resins,resins. Purified Terephthalic Acidterephthalic acid (“PTA”) and Mono-ethylene Glycolmonoethylene glycol (“MEG”), which are the primary raw materials used by Film Products to produce the polyester resins utilized in PET films. Prospectively, Film Products will purchase additional polyester resins directly from suppliers.prices. We believeprices, and Film Products believes that there will be an adequate supply of these raw materialspolyethylene, polypropylene, and polyester resins as well as PTA and MEG in the foreseeable future. Film Products also buys polypropylene-based nonwoven fabrics based on the resins previously noted and styrenic block copolymers, and we believeit believes there will be an adequate supply of these raw materials in the foreseeable future.Customers. Film Products sells to many branded product producers throughout the world. Its largest customer is The Procter & Gamble Company (“P&G”). Net sales to P&G totaled $221 million in 2014, $262 million in 2013 and $264 million in 2012 $280 million in 2011 and $273 million in 2010 (these amounts include film sold to third parties that converted the film into materials used with products manufactured by P&G). had a successful long-term relationship based on cooperation, product innovation and continuous process improvement. The loss or significant reduction in sales associatedFor additional information on the relationship with P&G, would have a material adverse effectsee “Item 1A. Risk Factors” beginning on our business.distribution, transportation, electrical,automotive, consumer durables, and machinery and equipment, electrical and distribution markets. Aluminum Extrusions manufactures mill (unfinished), anodized (coated) and painted and fabricated aluminum extrusions for sale directly to fabricators and distributors, and it competes primarily on the basis of product quality, service and price. Sales are made primarily in the U.S., principally east of the Rocky Mountains.OurThe acquisition of AACOA allows usAluminum Extrusions to add fabrication capabilities to Aluminum Extrusions’ currentits array of products and services while providing AACOA with large press capabilities and enhanced geographic sales coverage in a variety of end-use markets. Residential & nonresidential construction WindowsBuilding & construction - nonresidential Commercial windows and doors, pre-engineered structures, wall panels, partitions and interior enclosures, ducts, louvers and vents, curtain walls, storefronts and entrances, walkway covers, bus shelters,ducts, louvers and vents, office wall panels, partitions and interior enclosures, acoustical walls and ceilings, point of purchase displays showerand pre-engineered structuresBuilding & construction - residential Shower and tub enclosures, railingsrailing and support systems, venetian blinds, acoustical ceilings and walls, swimming pools and storm shuttersTransportationFurniture, pleasure boats, refrigerators and freezers, appliances and sporting goods Machinery & equipment Material handling equipment, conveyors and conveying systems, industrial modular assemblies and medical equipment Automotive Automotive and light truck products,structural components, spare parts, after-market automotive accessories, travel trailers and recreation vehiclesDistribution (metal service centers specializing in stock and release programs and custom fabrications to small manufacturers) StandardVarious custom profiles (rod,including storm shutters, pleasure boat accessories, theater set structures and various standard profiles (including rod, bar, tube and pipe), hurricane shutters, pleasure boat accessories, theatre set structures and other applicationsConsumer durables Refrigerators and freezers, office and institutional furniture, serving carts and pleasure boats Lighting fixtures, (LED housings and heat sinks), solar panels, electronic apparatus and rigid and flexible conduitsMachinery & equipmentMaterial handling equipment, conveyors and conveying systems, hospital patient lifts, office machines and industrial erector sets volume from continuing operations by market segment over the last three years is shown below:% 2014 2013 2012 Building and construction: Nonresidential 58 % 58 % 67 % Residential 6 % 7 % 10 % Consumer durables 13 % 13 % 5 % Machinery & equipment 8 % 7 % 4 % Automotive 6 % 6 % 5 % Distribution 5 % 4 % 6 % Electrical 4 % 5 % 3 % Total 100 % 100 % 100 % * Includes net sales for AACOA subsequent to being acquired on October 1, 2012. Aluminum Extrusions Sales Volumeby Market Segment (Continuing Operations) * 2012 2011 2010 70 % 70 % 68 % 9 12 14 5 6 5 5 6 8 5 2 2 4 2 1 2 2 2 100 % 100 % 100 % *Includes sales volumes for AACOA for the fourth quarter of 2012 (subsequent to accquisition).Aluminum Extrusions closed its manufacturing facility in Kentland, Indiana in the third quarter of 2012. The plant, whose core market was residential construction, previously employed 146 people.We believe there will be anAluminum Extrusions believes that it has adequate long-term supply ofagreements for aluminum and other required raw materials and supplies in the foreseeable future.In February 2010, we added a newAs previously noted, theThe operations of Bright View were incorporated into Film Products effective January 1, 2012 to better leverage efforts to produce films for new market segments. Prior year balances for Bright View have been reclassified to Film Products to conform with the current year presentation.develops, ownsdeveloped, owned and operatesoperated multiple mitigation banks. Through the establishment of perpetual easements to restore, enhance and preserve wetlands, streams or other protected environmental resources, these mitigation banks createcreated saleable credits that arewere used by the purchaser of credits to offset the negative environmental impacts from private and public development projects. On November 20, 2012, wethe Company sold ourits membership interests in Falling Springs to Arc Ventures, LC, a Virginia limited liability company affiliated with John D. Gottwald, a member of Tredegar’s Board of Directors, for cash and stock proceeds of $16.6 million. The corresponding loss on sale of $3.1 million and the results of operations related to Falling Springs have been classified as discontinued operations for all periods presented. With the sale of Falling Springs, there is no longer an Other segment to report.GeneralWe considerTredegar considers patents, licenses and trademarks to be of significance forsignificant to Film Products. We routinely apply for patents on significant developments in these businesses. As of December 31, 2012,2014, Film Products held 342273 issued patents (108(81 of which are issued in the U.S.) and 117122 trademarks (19(14 of which are issued in the U.S.). Aluminum Extrusions held one U.S. patent and three U.S. trademark registrations. OurThese patents have remaining terms ranging from 1 to 20 years. WeTredegar also havehas licenses under patents owned by third parties.2012, 20112014, 2013 and 20102012 was primarily related to Film Products. As of December 31, 2012, Film Products has technical centers in Bloomfield, New York; Cabo de Santo Agostinho, Brazil;Durham, North Carolina; Richmond, Virginia; Morrisville, North Carolina; and Terre Haute, Indiana. R&D spending was approximately $12.1 million in 2014, $12.7 million in 2013 and $13.2 million in 2012, $13.2 million in 2011 and $13.6 million in 2010.2012.ourthe operations in Film Products. Overall backlog for continuing operations in Aluminum Extrusions at December 31, 20122014 increased by approximately 77%54% compared with December 31, 2011, with approximately half of this increase being attributed to the addition of AACOA. Demand for extruded aluminum shapes continued to improve in 2012.2013. Volume for Aluminum Extrusions, which we believeit believes is cyclical in nature, was 153.8 million pounds in 2014, 143.7 million pounds in 2013 and 114.8 million pounds in 2012, 108.0 million pounds in 2011 and 94.9 million pounds in 2010.2012.ourthe Company’s domestic operations are or may be subject include, among others, the Clean Water Act, the Clean Air Act, the Resource Conservation and Recovery Act, the Occupational Safety and Health Act, the National Environmental Policy Act, the Toxic Substances Control Act, the Comprehensive Environmental Response, Compensation and Liability Act (“CERCLA”), all as amended, regulations promulgated under these acts, and any other federal, state or local laws or regulations governing environmental matters. Compliance with these laws is an important consideration for us because we useTredegar uses hazardous materials in some of ourits operations, we areis a generator of hazardous waste, and wastewater from ourthe Company’s operations is discharged to various types of wastewater management systems. Under CERCLA and other laws, weTredegar may be subject to financial exposure for costs associated with waste management and disposal, even if wethe Company fully complycomplies with applicable environmental laws.ourthe Company’s manufacturing operations result in emissions or GHG and are subject to the current GHG regulations. ComplianceThe Company’s compliance with these regulations has yet to require significant expenditures. The cost of compliance with any future GHG legislation or regulations is not presently determinable, but it isTredegar does not anticipatedanticipate compliance to have a material adverse effect on ourits financial condition or results of operations based on information currently available.we conductit conducts business.2012, we believe2014, the Company believes that we wereit was in substantial compliance with all applicable environmental laws, regulations and permits in the U.S. and other countries where we conductit conducts business. Environmental standards tend to become more stringent over time. In order to maintain substantial compliance with such standards, wethe Company may be required to incur additional expenditures, the amounts and timing of which are not presently determinable but which could be significant, in constructing new facilities or in modifying existing facilities. Furthermore, our failure to comply with current or future laws and regulations could subject usTredegar to substantial penalties, fines, costs and expenses.2012.2014.Our Tredegar’s Internet address iswww.tredegar.com. We makeThe Company makes available, free of charge through ourits website, ourits annual report on Form 10-K, quarterly reports on Form 10-Q, current reports on Form 8-K and amendments to those reports filed or furnished pursuant to Section 13(a) or 15(d) of the Securities Exchange Act of 1934, as amended, as soon as reasonably practicable after such documents are electronically filed with, or furnished to, the Securities and Exchange Commission (“SEC”). Information filed electronically with the SEC can be accessed on its website atwww.sec.gov. In addition, ourthe Company’s Corporate Governance Guidelines, Code of Conduct and the charters of ourthe Audit, Executive Compensation, Strategic Finance and Nominating and Governance Committees are available on ourTredegar’s website and are available in print, without charge, to any shareholder upon request by contacting Tredegar’s Corporate Secretary at 1100 Boulders Parkway, Richmond, Virginia 23225. The information on or that can be accessed through ourthe Company’s website is not, and shall not be deemed to be, a part of this report or incorporated into other filings we makeit makes with the SEC.Item 1A. RISK FACTORS ourthe Company’s businesses and our consolidated financial condition and liquidity. The following risk factors should be considered, in addition to the other information included in this Annual Report on Form 10-K for the year ended December 31, 20122014 (“Form 10-K”), when evaluating Tredegar and ourits businesses:GeneralTredegar may not be able to successfully execute its acquisition strategy.•Our performance is influenced by costs incurred by our operating companies, including, for example, the cost of raw materials and energy. These costs include, without limitation, the cost of resin, PTA and MEG (the raw materials on which Film Products primarily depends), aluminum (the raw material on which Aluminum Extrusions primarily depends), natural gas (the principal fuel necessary for Aluminum Extrusions’ plants to operate), electricity and diesel fuel. Resin, aluminum and natural gas prices are extremely volatile as shown in the charts on pages 35-36. We attempt to mitigate the effects of increased costs through price increases and contractual pass-through provisions, but there are no assurances that higher prices can effectively be passed through to our customers or that we will be able to offset fully or on a timely basis the effects of higher raw material and energy costs through price increases or pass-through arrangements. Further, our cost control efforts may not be sufficient to offset any additional future declines in revenue or increases in raw material, energy or other costs.•Tredegar and its customers operate in highly competitive markets. Tredegar and its businesses compete on product innovation, quality, price and service, and our businesses and their customers operate in highly competitive markets. Global market conditions continue to exacerbate our exposure to margin compression due to competitive forces, especially as certain products move into the later stages of their product life cycles. We attempt to mitigate the effects of this trend through cost saving measures and manufacturing efficiency initiatives, but these efforts may not be sufficient to offset the impact of margin compression as a result of competitive pressure.•Tredegar may not be able to successfully execute its acquisition strategy.New acquisitions, such as our October 2011 acquisition of Terphane and our October 2012 acquisition of AACOA, can provide meaningful opportunities to grow our business and improve profitability. Acquired businesses may not achieve expected levels of revenue, profit or productivity, or otherwise perform as we expect. Acquisitions involve special risks,including, without limitation, diversion of management’s time and attention from our existing businesses, the potential assumption of unanticipated liabilities and contingencies and potential difficulties in integrating acquired businesses and achieving anticipated operational improvements. While our strategy is to acquire businesses that will improve our competitiveness and profitability, acquisitions may not be successful or accretive to earnings.•Noncompliance with any of the covenants in our $350 million credit facility could result in all debt under the agreement outstanding at such time becoming due and limiting our borrowing capacity, which could have a material adverse effect on our financial condition and liquidity. The credit agreement governing our revolving credit facility contains restrictions and financial covenants that could restrict our operational and financial flexibility. Our failure to comply with these covenants could result in an event of default, which if not cured or waived, would result in all outstanding debt under the credit facility at such time becoming due, which could have a material adverse effect on our financial condition and liquidity. Renegotiation of the covenant(s) through an amendment to our revolving credit facility may effectively cure the noncompliance, but may have a negative effect on our consolidated financial condition or liquidity depending upon how the amended covenant is renegotiated.•Loss of certain key officers or employees could adversely affect our businesses. We depend on our senior executive officers and other key personnel to run our businesses. The loss of any of these officers or other key personnel could have a material adverse effect on our operations. Competition for qualified employees among companies that rely heavily on engineering and technology is intense, and the loss of qualified employees or an inability to attract, retain and motivate highly skilled employees required for the operation and expansion of our businesses could hinder our ability to improve manufacturing operations, conduct research activities successfully and develop marketable products.•Tredegar is subject to increased credit risk that is inherent with economic uncertainty and efforts to increase market share as we attempt to broaden our customer base. In the event of the deterioration of operating cash flows or diminished borrowing capacity of our customers, the collection of trade receivable balances may be delayed or deemed unlikely. The operations of our customers for Aluminum Extrusions generally follow the cycles within the economy, resulting in greater credit risk from diminished operating cash flows and higher bankruptcy rates when the economy is deteriorating or in recession. In addition, Film Products’ credit risk exposure could increase as efforts to expand its business may lead to a broader, more diverse customer base.•Tredegar is subject to various environmental laws and regulations and could become exposed to material liabilities and costs associated with such laws.We are subject to various environmental obligations and could become subject to additional obligations in the future. In the case of known potential liabilities, it is management’s judgment that the resolution of ongoing and/or pending environmental remediation obligations is not expected to have a material adverse effect on our consolidated financial condition or liquidity. In any given period or periods, however, it is possible such obligations or matters could have a material adverse effect on the results of operations. Changes in environmental laws and regulations, or their application, including, but not limited to, those relating to global climate change, could subject us to significant additional capital expenditures and operating expenses. Moreover, future developments in federal, state, local and international environmental laws and regulations are difficult to predict. Environmental laws have become and are expected to continue to become increasingly strict. As a result, we will be subject to new environmental laws and regulations. However, any such changes are uncertain and, therefore, it is not possible for us to predict with certainty the amount of additional capital expenditures or operating expenses that could be necessary for compliance with respect to any such changes.•Tredegar could be required to make additional cash contributions to its defined benefit (pension) plan.We sponsor a pension plan that covers certain hourly and salaried employees in the U.S. Recent economic trends have resulted in a significant reduction in interest rates and plan asset investment returns. Cash contribution requirements for the pension plan are sensitive to changes in these market factors. We expect that we will be required to make a cash contribution of approximately $0.2 million to our underfunded pension plan in 2013, and we may be required to make additional cash contributions in future periods if current trends in interest rates continue, volatility in investment returns on plan assets persist or if our plan asset investment returns lag market performance.•An information technology system failure may adversely affect our business. We rely on information technology systems to transact our businesses. An information technology system failure due to computer viruses, internal or external security breaches, power interruptions, hardware failures, fire, natural disasters, human error, or other causes could disrupt our operations and prevent us from being able to process transactions with our customers, operate our manufacturing facilities, and properly report those transactions in a timely manner. A significant, protracted information technology system failure may result in a material adverse effect on our financial condition, results of operations, or cash flows.•Material disruptions at one of our major manufacturing facilities could negatively impact our financial results.We believe our facilities are operated in compliance with applicable local laws and regulations and that we have implemented measures to minimize the risks of disruption at our facilities. A material disruption in one of our operating locations could negatively impact production and our financial results. Such a disruption could be a result of any number of events, including but not limited to: an equipment failure with repairs requiring long lead times, labor stoppages or shortages, utility disruptions, constraints on the supply or delivery of critical raw materials, and severe weather conditions.•An inability to renegotiate one of our collective bargaining agreements could adversely affect our financial results.Some of our employees are represented by labor unions under various collective bargaining agreements with varying durations and expiration dates. Tredegar may not be able to satisfactorily renegotiate collective bargaining agreements when they expire, which could result in strikes or work stoppages or higher labor costs. In addition, existing collective bargaining agreements may not prevent a strike or work stoppage at our facilities in the future. Any such work stoppages (or potential work stoppages) could negatively impact our ability to manufacture our products and adversely affect results of operations.•Our investments (primarily $7.5 million of investments in Intelliject and a $3.6 million net investment in Harbinger) have high risk. The value of our investment in a specialty pharmaceutical company, Intelliject, Inc. (“Intelliject”), can fluctuate, primarily as a result of its ability to meet its developmental and commercialization milestones within an anticipated time frame. Intelliject received approval from the U.S. Food and Drug Administration for its first product in 2012, with market launch of the product in the first quarter of 2013. As Intelliject continues to invest in its product pipeline, it may require additional rounds of financing to have the opportunity to complete product pipeline development and bring its technology to market, which may never occur. The estimated fair value of our investment was $33.7 million at December 31, 2012.Harbinger”Harbinger Fund”) is a private investment fund, and an investment in the fund involves risk and is subject to limitations on withdrawal. The amount of future installments of withdrawal proceeds is uncertain, and the timing of such payments is not known.ourthe Company’s interests in either investment. As a result, weTredegar may be required to bear the risk of ourits investment in Intellijectkaléo and the Harbinger Fund for an indefinite period of time.• sales associated with one customer, P&G. P&G comprised approximately 31% of Tredegar’s consolidated net sales from continuing operations in 2012, 36% in 2011 and 38% in 2010. The loss or significant reduction of sales associated with P&G would have a material adverse effect on our business. Other P&G-related factors that could adversely affect our business include, by way of example, (i) failure by P&G to achieve success or maintain share in markets in which P&G sells products containing our materials, (ii) operational decisions by P&G that result in component substitution, inventory reductions and similar changes, (iii) delays in P&G rolling out products utilizing new technologies developed by us and (iv) P&G rolling out products utilizing technologies developed by others that replace our business with P&G. While we have undertaken efforts to expand our customer base, there can be no assurance that such efforts will be successful, or that they will offset any delay or loss of sales and profits associated with P&G.•Growth of Film Products depends on our ability to develop and deliver new products at competitive prices. Personal care materials, surface protection films and polyethylene overwrap and polypropylene films are now being made with a variety of new materials and the overall cycle for changing materials has accelerated. While we have substantial technological resources, there can be no assurance that our new products can be brought to market successfully, or if brought to market successfully, at the same level of profitability and market share of replaced films. A shift in customer preferences away from our technologies, our inability to develop and deliver new profitable products, or delayed acceptance of our new products in domestic or foreign markets, could have a material adverse effect on our business, results of operations and cash flows. In the long term, growth will depend on our ability to provide innovative materials at a price that meets our customers’ needs.•Failure of our customers, who are subject to cyclical downturns, to achieve success or maintain market share could adversely impact sales and operating margins. Our products serve as components for various consumer products sold worldwide. Our customers’ ability to successfully develop, manufacture and market their products is integral to our success. In addition, many of our customers are in industries that are cyclical in nature and sensitive to changes in general economic conditions. Downturns in the businesses that use our products can adversely affect our sales and operating margins.•Continued growth in Film Products’ sale of protective film products is not assured.A shift in our customers’ preference to new or different products or new technology that displaces the need for protective films that currently utilize our surface protection applications could have a material adverse effect on our sales of protective films. Surface protection films accounted for approximately 8%, 9% and 12% of Tredegar’s consolidated net sales from continuing operations in 2012, 2011 and 2010, respectively. Unanticipated changes in the demand for our customers’ products, a decline in the rate of growth for flat panel displays or improvements in the durability of flat panel displays could have a material adverse effect on protective film sales.•Our substantial international operations subject us to risks of doing business in countries outside the U.S., which could adversely affect our business, financial condition and results of operations. Risks inherent in international operations include the following, by way of example: changes in general economic conditions or governmental policies, potential difficulty enforcing agreements and intellectual property rights, modifications in foreign tax laws and incentives, staffing and managing widespread operations and the challenges of complying with a wide variety of laws and regulations, restrictions on international trade or investment, restrictions on the repatriation of income, fluctuations in exchange rates, imposition of additional taxes on our income generated outside the U.S., nationalization of private enterprises and unexpected adverse changes in international laws and regulatory requirements. In addition, while expanding operations into emerging foreign markets provides greater opportunities for growth, there are certain operating risks, as previously noted.•Our inability to protect our intellectual property rights or our infringement of the intellectual property rights of others could have a material adverse impact on Film Products.Film Products operates in an industry where our significant customers and competitors have substantial intellectual property portfolios. The continued success of this business depends on our ability not only to protect our own technologies and trade secrets, but also to develop and sell new products that do not infringe upon existing patents or threaten existing customer relationships. An unfavorable outcome in any intellectual property litigation or similar proceeding could have a materially adverse effect on the financial condition and results of operations in Film Products.•U.S. and global economic conditions could have an adverse effect on the operating results of some or all of our operations.As Films Products expands its business into new products and geographic regions, operating results and our financial condition could become more sensitive to changes in macroeconomic conditions, including fluctuations in exchange rates. Sales associated with new products and regions tend to more closely follow the cycles within the economy. Cost reductions and productivity improvements may not be sufficient to offset the adverse effects on profitability from lower customer demand in an economic downturn. Therefore, as such product offerings become a greater part of the film products business, our operating results and financial condition may be adversely impacted by seasonal slowdowns, cyclical downturns in the economy or changes in foreign currency rates.•An unstable economic environment could have a disruptive impact on our supply chain. Certain raw materials used in manufacturing our products are available from a single supplier, and we may not be able to quickly or inexpensively re-source to another supplier. The risk of damage or disruption to our supply chain has been exacerbated as different suppliers have consolidated their product portfolios or experienced financial distress. Failure to take adequate steps to effectively manage such events, which are intensified when a product is sourced from a single supplier or location, could adversely affect our business and results of operations, as well as require additional resources to restore our supply chain.Aluminum Extrusions•Sales volume and profitability of Aluminum Extrusions is cyclical and highly dependent on economic conditions of end-use markets in the U.S., particularly in the construction sector. Our end-use markets can be subject to seasonal slowdowns. Because of the high degree of operating leverage inherent in our operations (generally constant fixed costs until full capacity utilization is achieved), the percentage drop in operating profits in a cyclical downturn will likely exceed the percentage drop in volume. Any benefits associated with cost reductions and productivity improvements may not be sufficient to offset the adverse effects on profitability from pricing and margin pressure and higher bad debts (including a greater chance of loss associated with defaults on fixed-price forward sales contracts with our customers) that usually accompany a downturn. In addition, higher energy costs can further reduce profits unless offset by price increases or cost reductions and productivity improvements.Although our sales associated with one customer, P&G. P&G comprised approximately 24% of Tredegar’s consolidated net sales from continuing operations in 2014, 28% in 2013 and 31% in 2012. The loss or significant reduction of sales associated with P&G could have a material adverse effect on the Company’s business. Other P&G-related factors that could adversely affect the business include, by way of example, (i) failure by P&G to achieve success or maintain share in markets in which P&G sells products containing Film Products’ materials, (ii) operational decisions by P&G that result in component substitution, inventory reductions and similar changes, (iii) delays in P&G rolling out products utilizing new technologies developed by Film Products and (iv) P&G rolling out products utilizing technologies developed by others that replace Film Products’ business with P&G. While Film Products has undertaken efforts to expand its customer base, there can be no assurance that such efforts will be successful, or that they will offset any delay or loss of sales and profits associated with P&G.improveda material adverse effect on the business, results of operations and cash flows. In the long term, growth will depend on Film Products’ ability to provide innovative products at a price that meets the customers’ needs.thereimports into Brazil, primarily from Asia, represented an increasing portion of the Brazilian flexible packaging films market. The Brazilian government currently applies anti-dumping duties on PET films imported from the UAE, Mexico, and Turkey, and these protective tariffs may be extended to other countries in Asia and the Middle East in the near future. In the absence of these anti-dumping duties, some suppliers may choose to sell excess inventory in Brazil, especially when markets for PET films in Europe and Asia are saturated. Additional supply in the Brazilian market could have a material adverse impact on pricing, thereby creating margin compression that Film Products may not be able to offset with cost savings measures and/or manufacturing efficiency initiatives. An inability to extend and/or expand anti-dumping duties on PET films in Brazil could have a material adverse effect on the operating results of Film Products.uncertainty surroundingcyclical and highly dependent on economic conditions of end-use markets in the extentU.S., particularly in the construction sector. Aluminum Extrusions’ end-use markets can be subject to seasonal slowdowns. Because of the high degree of operating leverage inherent in its operations (generally constant fixed costs until full capacity utilization is achieved), the percentage drop in operating profits in a cyclical downturn will likely exceed the percentage drop in volume. Any benefits associated with cost reductions and timingproductivity improvements may not be sufficient to offset the adverse effects on profitability from pricing and margin pressure and higher bad debts (including a greater chance of loss associated with customers defaulting on fixed-price forward sales contracts) that usually accompany a full recoverydownturn. In addition, higher energy costs can further reduce profits unless offset by price increases or cost reductions and productivity improvements.sector. Therefore,distribution, automotive and other transportation, machinery and equipment, electrical and consumer durables. No single customer exceeds 3% of Aluminum Extrusions’ net sales. Due to the extent and timingdiverse customer mix across many end-use markets, the Company believes the industry generally tracks the real growth of the recovery of sales volumesoverall economy. Future success and profits for Aluminum Extrusions is uncertain, especially since there can be a lagprospects depend on its ability to retain existing customers and participate in the recovery of its end-use markets in comparison to the overall economic recovery.•The markets for our products are highly competitive with product quality, service, delivery performance and price being the principal competitive factors. Aluminum Extrusions has approximately 1,200 customers that are in a variety of end-use markets within the broad categories of building and construction, distribution, transportation, machinery and equipment, electrical and consumer durables. No single customer exceeds 5% of Aluminum Extrusions’ net sales. Due to the diverse customer mix across many end-use markets, we believe the industry generally tracks the real growth of the overall economy. Future success and prospects depend on our ability to retain existing customers and participate in overall industry cross-cycle growth.ourits end-use markets. Conversely, during an economic slowdown, excess industry capacity often drives increased pricing pressure in many end-use markets as competitors protect their position with key customers. Because the business is susceptible to these changing economic conditions, Aluminum Extrusions targets complex, customized, service-intensive business with more challenging requirements in order to differentiate itself from competitors that focus on higher volume, standard extrusion applications.the past,previous years, imports into the U.S., primarily from China, represented an increasing portion of the U.S. aluminum extrusion market. However, followingdue to an affirmative determination by the U.S. International Trade Commission in April 2011 that asserted that dumped and subsidized imports of aluminum extrusion from China are a cause of material injury tounfairly and negatively impacted the domestic industry, the U.S. Department of Commerce has applied duties to these imported products. As a result, aluminum extrusion imports from China have decreased significantly. While the risk to the domestic industry has been abated for the time being, these protective duties are scheduled to expire in 2016. There are ongoing efforts continuewithin the U.S. aluminum extrusions industry to addressextend these protective duties. An unfavorable outcome could have a material adverse effect on the challenges and circumvention issues that remain.operating results of Aluminum Extrusions.Item 1B. UNRESOLVED STAFF COMMENTS Item 2. PROPERTIES ourthe Company’s operations are owned, and none of the owned property is subject to an encumbrance that is considered to be material to ourits consolidated operations. We considerTredegar considers the plants,manufacturing facilities, warehouses and other properties and assets ownedthat it owns or leased by usleases to be in generally good condition.We believe Capacity utilization at its various manufacturing facilities can vary with product mix and normal fluctuations in sales levels. The Company believes that theits manufacturing facilities have sufficient capacity of our plants is adequate to meet our immediate needs. Our plants generally have operated at approximately 40-95% of capacity during 2012. Ourits current production requirements. Tredegar’s corporate headquarters, which is leased, is located at 1100 Boulders Parkway, Richmond, Virginia 23225.Our Locations Outside the U.S. Principal Operations (technical center andproduction facility)(technical center andproduction facility)Lake Zurich, IllinoisMorrisville, North CarolinaGuangzhou, ChinaKerkrade, The Netherlands(technical center and productionfacility) ( leased)Pune, IndiaRétság, HungaryPottsville, PennsylvaniaRed Springs, North Carolina (leased)Richmond, Virginia (technical center) (leased)Terre Haute, Indiana(technical center andproduction facility)São Paulo, BrazilShanghai, ChinaAluminum Extrusions Principal Operations Production of aluminum extrusions, fabrication and finishing Item 3. LEGAL PROCEEDINGS Item 4. MINE SAFETY DISCLOSURES Item 5. MARKET FOR TREDEGAR’S COMMON EQUITY, RELATED STOCKHOLDER MATTERS AND ISSUER PURCHASES OF EQUITY SECURITIES OurWe haveThe Company has no preferred stock outstanding. There were 32,069,37032,422,082 shares of common stock held by 2,5132,343 shareholders of record on December 31, 2012.ourTredegar’s common stock by quarter for the past two years. 2012 2011 High Low High Low $ 26.29 $ 19.13 $ 21.58 $ 18.23 20.51 13.49 22.87 16.97 18.95 13.50 20.35 14.15 20.42 16.54 23.00 13.92 2014 2013 High Low High Low First quarter $ 28.45 $ 22.48 $ 30.70 $ 21.06 Second quarter 25.08 19.65 30.16 24.23 Third quarter 24.07 18.41 30.73 22.22 Fourth quarter 22.49 16.76 29.74 23.86 ourTredegar’s common stock on February 22, 201320, 2015 was $25.65.We haveWeDuring the past three years, the Company paid quarterly dividends as follows:4the final three quarters of 2014; 1•/27 cents per share in the first twoquarter of 2014 and each of the quarters of 2012 and 2013; We We paid a quarterly dividend of 4 1/2 cents per share in 2011, and 4 cents per share in 2010.ourthe Company’s revolving credit agreement and other such considerations as the Board deems relevant. See Note 11 beginning on page 6867 for the restrictions contained in ourthe Company’s revolving credit agreement related to minimum shareholders’ equity required and aggregate dividends permitted.weTredegar announced that ourits Board of Directors approved a share repurchase program whereby management is authorized at its discretion to purchase, in the open market or in privately negotiated transactions, up to 5 million shares of Tredegar’sthe Company’s outstanding common stock. The authorization has no time limit. WeTredegar did not repurchase any shares in the open market or otherwise in 2014, 2013 and 2012 or 2011 under this standing authorization. We repurchased approximately 2.1 millionThe maximum number of shares in 2010 of our common stock in the open marketremaining under this standing authorization was 1,732,003 at an average price of $16.54 per share.WeDecember 31, 2014.ourthe Company’s divestiture of Falling Springs. Shares received from the sale of Falling Springs do not represent shares repurchased under the current approved share repurchase program.2012.2014. Tredegar is part of both the S&P SmallCap 600 Index and Russell 2000 Index.
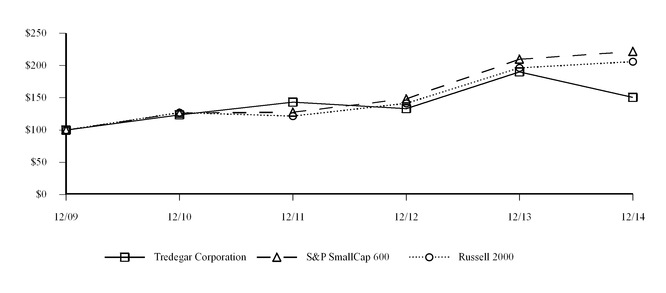
Copyright© 2015 Russell Investment Group. All rights reserved.ourthe Company’s common stock:250 Royall StreetCanton, MA 02021E-mail: web.queries@computershare.comWe doTredegar does not generate or distribute quarterly reports to its shareholders. Information on quarterly results can be obtained from ourthe Company’s website. In addition, we fileTredegar files quarterly, annual and other information electronically with the SEC, which can be accessed on its website atwww.sec.gov.Legal CounselIndependent Registered Public Accounting FirmHunton & Williams LLPPricewaterhouseCoopers LLPRichmond, VirginiaRichmond, VirginiaItem 6. SELECTED FINANCIAL DATA 14-1913-18 present certain selected financial and segment information for the five years ended December 31, 2012. 2012 2011 2010 2009 2008 (In Thousands, Except Per-Share Data) $ 882,188 $ 794,420 $ 738,200 $ 648,613 $ 883,899 18,119 (c) 3,213 (d) (1,182 )(e) 8,464 (f) 10,341 (g) 900,307 797,633 737,018 657,077 894,240 712,660 (c) 654,087 (d) 594,987 (e) 516,933 (f) 739,721 (g) 24,846 18,488 17,812 16,085 20,782 73,717 (c) 67,808 (d) 67,729 60,481 58,699 13,162 13,219 13,625 11,856 11,005 5,806 1,399 466 120 123 3,590 1,926 1,136 783 2,393 5,022 (c) 1,917 (d) 773 (e) 2,950 (f) 12,390 (g) — — — 30,559 (b) — 838,803 758,844 696,528 639,767 845,113 61,504 38,789 40,490 17,310 49,127 18,319 (c) 10,244 (d) 13,649 (e) 18,663 (f) 19,486 (g) 43,185 28,545 26,841 (1,353 ) 29,641 (14,934 )(a) (3,690 )(a) 186 — (705 )(a) $ 28,251 $ 24,855 $ 27,027 $ (1,353 ) $ 28,936 $ 1.34 $ .89 $ .82 $ (.04 ) $ .87 (.46 ) (.12 ) .01 — (.02 ) $ .88 $ .77 $ .83 $ (.04 ) $ .85 Years Ended December 31 2014 2013 2012 2011 2010 (In Thousands, Except Per-Share Data) Results of Operations (a): Sales $ 951,826 $ 959,346 $ 882,188 $ 794,420 $ 738,200 Other income (expense), net (6,697 ) 1,776 (c) 18,119 (d) 3,213 (e) (1,182 ) (f) 945,129 961,122 900,307 797,633 737,018 Cost of goods sold 778,113 784,675 (c) 712,660 (d) 654,087 (e) 594,987 (f) Freight 28,793 28,625 24,846 18,488 17,812 Selling, general & administrative expenses 69,526 71,195 (c) 73,717 (d) 67,808 (e) 67,729 Research and development expenses 12,147 12,669 13,162 13,219 13,625 Amortization of intangibles 5,395 6,744 5,806 1,399 466 Interest expense 2,713 2,870 3,590 1,926 1,136 Asset impairments and costs associated with exit and disposal activities 3,026 1,412 (c) 5,022 (d) 1,917 (e) 773 (f) 899,713 908,190 838,803 758,844 696,528 Income from continuing operations before income taxes 45,416 52,932 61,504 38,789 40,490 Income taxes 9,387 16,995 (c) 18,319 (d) 10,244 (e) 13,649 (f) Income from continuing operations (a) 36,029 35,937 43,185 28,545 26,841 Income (loss) from discontinued operations, net of tax (a) 850 (13,990 ) (a) (14,934 ) (a) (3,690 ) (a) 186 (a) Net income $ 36,879 $ 21,947 $ 28,251 $ 24,855 $ 27,027 Diluted earnings (loss) per share (a): Continuing operations $ 1.11 $ 1.10 $ 1.34 $ 0.89 $ 0.82 Discontinued operations 0.02 (a) (0.43 ) (a) (0.46 ) (a) (0.12 ) (a) 0.01 (a) Net income $ 1.13 $ 0.67 $ 0.88 $ 0.77 $ 0.83 19. 2012 2011 2010 2009 2008 (In Thousands, Except Per-Share Data) $ 11.61 $ 12.38 $ 13.10 $ 12.66 $ 12.40 .96 (k) .18 .16 .16 .16 32,032 31,932 32,292 33,861 33,977 32,193 32,213 32,572 33,861 34,194 32,069 32,057 31,883 33,888 33,910 $ 26.29 $ 23.00 $ 20.19 $ 18.68 $ 20.59 13.49 13.92 14.93 12.79 11.41 20.42 22.22 19.38 15.82 18.18 (3.8 )% 15.6 % 23.5 % (12.1 )% 14.1 % $ 783,165 $ 780,610 $ 580,342 $ 596,279 $ 610,632 48,822 68,939 73,191 90,663 45,975 128,000 125,000 450 1,163 22,702 372,252 396,907 417,546 429,072 420,416 654,857 712,307 617,893 536,108 616,484 SEGMENT TABLESTredegar Corporation and SubsidiariesNet Sales (j) 2012 2011 2010 2009 2008 (In Thousands) $ 611,877 $ 535,540 $ 520,749 $ 455,007 $ 522,839 245,465 240,392 199,639 177,521 340,278 857,342 775,932 720,388 632,528 863,117 24,846 18,488 17,812 16,085 20,782 $ 882,188 $ 794,420 $ 738,200 $ 648,613 $ 883,899 Identifiable Assets 2012 2011 2010 2009 2008 (In Thousands) $ 551,842 $ 574,571 $ 368,853 $ 371,639 $ 399,895 129,279 78,661 81,731 82,429 112,259 — — 583 1,147 1,629 681,121 653,232 451,167 455,215 513,783 53,222 40,917 41,833 50,401 50,874 48,822 68,939 73,191 90,663 45,975 783,165 763,088 566,191 596,279 610,632 — 17,522 14,151 — — $ 783,165 $ 780,610 $ 580,342 $ 596,279 $ 610,632 Years Ended December 31 2014 2013 2012 2011 2010 (In Thousands, Except Per-Share Data) Share Data: Equity per share $ 11.47 $ 12.46 $ 11.61 $ 12.38 $ 13.10 Cash dividends declared per share 0.34 0.28 0.96 (j) 0.18 0.16 Weighted average common shares outstanding during the period 32,302 32,172 32,032 31,932 32,292 Shares used to compute diluted earnings (loss) per share during the period 32,554 32,599 32,193 32,213 32,572 Shares outstanding at end of period 32,422 32,305 32,069 32,057 31,883 Closing market price per share: High $ 28.45 $ 30.73 $ 26.29 $ 23.00 $ 20.19 Low 16.76 21.06 13.49 13.92 14.93 End of year 22.49 $ 28.81 20.42 22.22 19.38 Total return to shareholders (g) (20.8 )% 42.5 % (3.8 )% 15.6 % 23.5 % Financial Position: Total assets $ 788,626 $ 793,008 $ 783,165 $ 780,610 $ 580,342 Cash and cash equivalents 50,056 52,617 48,822 68,939 73,191 Debt 137,250 139,000 128,000 125,000 450 Shareholders’ equity (net book value) 372,029 402,664 372,252 396,907 417,546 Equity market capitalization (h) 729,173 930,711 654,857 712,307 617,893 19.Operating Profit 2012 2011 2010 2009 2008 (In Thousands) $ 69,950 $ 59,493 $ 66,718 $ 64,379 $ 53,914 (109 )(c) (6,807 )(d) (758 )(e) (1,846 )(f) (11,297 )(g) 9,037 3,457 (4,154 ) (6,494 ) 10,132 (5,427 )(c) 58 (d) 493 (e) (639 )(f) (687 )(g) — — — (30,559 )(b) — — — — 1,968 (f) 1,499 (g) 73,451 56,201 62,299 26,809 53,561 418 1,023 709 806 1,006 3,590 1,926 1,136 783 2,393 — — — 404 1,001 16,100 (c) 1,600 (d) (2,200 )(e) 5,100 (f) 5,600 (g) 1,432 1,940 2,064 1,692 782 23,443 (c) 16,169 (d) 17,118 13,334 8,866 61,504 38,789 40,490 17,310 49,127 18,319 (c) 10,244 (d) 13,649 (e) 18,663 (f) 19,486 (g) 43,185 28,545 26,841 (1,353 ) 29,641 (14,934 )(a) (3,690 )(a) 186 (a) — (705 )(a) $ 28,251 $ 24,855 $ 27,027 $ (1,353 ) $ 28,936 Net Sales (i) 2014 2013 2012 2011 2010 (In Thousands) Film Products $ 578,687 $ 621,239 $ 611,877 $ 535,540 $ 520,749 Aluminum Extrusions 344,346 309,482 245,465 240,392 199,639 Total net sales 923,033 930,721 857,342 775,932 720,388 Add back freight 28,793 28,625 24,846 18,488 17,812 Sales as shown in Consolidated Statements of Income $ 951,826 $ 959,346 $ 882,188 �� $ 794,420 $ 738,200 Identifiable Assets 2014 2013 2012 2011 2010 (In Thousands) Film Products $ 546,210 $ 556,873 $ 551,842 $ 574,571 $ 368,853 Aluminum Extrusions 143,328 134,928 129,279 78,661 81,731 AFBS (formerly Therics) — — — — 583 Subtotal 689,538 691,801 681,121 653,232 451,167 General corporate 49,032 48,590 53,222 40,917 41,833 Cash and cash equivalents 50,056 52,617 48,822 68,939 73,191 Identifiable assets from continuing operations 788,626 793,008 783,165 763,088 566,191 Discontinued operations (a): — — — 17,522 14,151 Total $ 788,626 $ 793,008 $ 783,165 $ 780,610 $ 580,342 19.Depreciation and Amortization 2012 2011 2010 2009 2008 (In Thousands) $ 39,202 $ 36,315 $ 34,448 $ 32,360 $ 34,588 9,984 8,333 9,054 7,566 8,018 49,186 44,648 43,502 39,926 42,606 73 75 74 71 70 49,259 44,723 43,576 39,997 42,676 10 12 12 — 515 $ 49,269 $ 44,735 $ 43,588 $ 39,997 $ 43,191 Capital Expenditures and Investments 2012 2011 2010 2009 2008 (In Thousands) $ 30,484 $ 13,107 $ 15,839 $ 11,487 $ 11,135 2,332 2,697 4,339 22,530 9,692 32,816 15,804 20,178 34,017 20,827 436 76 236 125 78 33,252 15,880 20,414 34,142 20,905 — — 4 — 39 33,252 15,880 20,418 34,142 20,944 — — — — 5,391 $ 33,252 $ 15,880 $ 20,418 $ 34,142 $ 26,335 Operating Profit 2014 2013 2012 2011 2010 (In Thousands) Film Products: Ongoing operations $ 58,054 $ 70,966 $ 69,950 $ 59,493 $ 66,718 Plant shutdowns, asset impairments, restructurings and other (12,827 ) (671 ) (c) (109 ) (d) (6,807 ) (e) (758 ) (f) Aluminum Extrusions: Ongoing operations 25,664 18,291 9,037 3,457 (4,154 ) Plant shutdowns, asset impairments, restructurings and other (976 ) (2,748 ) (c) (5,427 ) (d) 58 (e) 493 (f) Total 69,915 85,838 73,451 56,201 62,299 Interest income 588 594 418 1,023 709 Interest expense 2,713 2,870 3,590 1,926 1,136 Gain (loss) on investment accounted for under the fair value method 2,000 3,400 (c) 16,100 (d) 1,600 (e) (2,200 ) (f) Gain on sale of investment property 1,208 (b) — — — — Unrealized loss on investment property — 1,018 (c) — — — Stock option-based compensation expense 1,272 1,155 1,432 1,940 2,064 Corporate expenses, net 24,310 31,857 (c) 23,443 (d) 16,169 (e) 17,118 Income from continuing operations before income taxes 45,416 52,932 61,504 38,789 40,490 Income taxes 9,387 16,995 (c) 18,319 (d) 10,244 (e) 13,649 (f) Income from continuing operations 36,029 35,937 43,185 28,545 26,841 Income (loss) from discontinued operations, net of tax (a) 850 (13,990 ) (a) (14,934 ) (a) (3,690 ) (a) 186 (a) Net income $ 36,879 $ 21,947 $ 28,251 $ 24,855 $ 27,027 19.Depreciation and Amortization 2014 2013 2012 2011 2010 (In Thousands) Film Products $ 30,730 $ 35,332 $ 39,202 $ 36,315 $ 34,448 Aluminum Extrusions 9,974 9,202 9,984 8,333 9,054 Subtotal 40,704 44,534 49,186 44,648 43,502 General corporate 114 121 73 75 74 Total continuing operations 40,818 44,655 49,259 44,723 43,576 Discontinued operations (a): — — 10 12 12 Total depreciation and amortization expense $ 40,818 $ 44,655 $ 49,269 $ 44,735 $ 43,588 Capital Expenditures 2014 2013 2012 2011 2010 (In Thousands) Film Products $ 38,806 $ 64,867 $ 30,484 $ 13,107 $ 15,839 Aluminum Extrusions 6,092 14,742 2,332 2,697 4,339 Subtotal 44,898 79,609 32,816 15,804 20,178 General corporate — 52 436 76 236 Capital expenditures for continuing operations 44,898 79,661 33,252 15,880 20,414 Discontinued operations (a): — — — — 4 Total capital expenditures $ 44,898 $ 79,661 $ 33,252 15,880 20,418 (a) On November 20, 2012, weTredegar sold ourits membership interests in Falling Springs. All historical results for this business have been reflected in discontinued operations. In 2012, discontinued operations also includes an after-tax loss of $2.0 million from the sale of Falling Springs in addition to operating results through the closing date. In 2012, 2011 and 2010, net income of $0.5 million, $0.7 million and $0.2 million, respectively, have been reclassified to discontinued operations. On February 12, 2008, weTredegar sold ourits aluminum extrusions business in Canada. All historical results for this business have been reflected as discontinued operations. In 2014, accruals for indemnifications under the purchase agreement were adjusted, resulting in income from discontinued operations of $0.9 million. In 2013, 2012 and 2011, discontinuneddiscontinued operations include after-tax charges of $14.0 million and $13.4 million and $4.4 million, respectively, to accrue for indemnifications under the purchase agreement related to environmental matters. In 2008, discontinued operations(b) Plant shutdowns, asset impairments, restructurings and other for 2014 include an after-tax lossa charge of $10.0 million (included in “Other income (expense), net” in the consolidated statements of income) associated with the one-time, lump sum license payment to 3M after the Company settled all litigation issues associated with a patent infringement complaint; charges of $2.3 million for severance and other employee-related costs in connection with restructurings in Film Products ($2.3 million) and Aluminum Extrusions ($31,000); charges of $0.9 million related to expected future environmental costs at the aluminum extrusions manufacturing facility in Newnan, Georgia (included in “Cost of goods sold” in the consolidated statement of income); charges of $0.7 million associated with the shutdown of the film products manufacturing facility in Red Springs, North Carolina, which includes severance and other employee-related costs of $0.4 million and asset impairment and other shutdown-related charges of $0.3 million; gain of $0.1 million related to the sale of previously shutdown film products manufacturing facility in LaGrange, Georgia (included in “Other income (expense), net” in the consolidated statements of income); and charges of $54,000 associated with the shutdown of the aluminum extrusions manufacturing facility in Kentland, Indiana. The unrealized gain on the Company’s investment in kaléo of $2.0 million; the unrealized loss on the Company’s investment in Harbinger of $0.8 million and the gain on sale on a portion the Company’s investment property in additionAlleghany and Bath County, Virginia was $1.2 million in 2014 are included in “Other income (expense), net” in the consolidated statements of income. Income taxes from continuing operations in 2014 includes the recognition of a tax benefit for a portion of the Company’s capital loss carryforwards of $4.9 million. These capital loss carryforwards were previously offset by a valuation allowance associated with expected limitations on the utilization of these assumed capital losses. As a result of changes in the underlying basis of certain foreign subsidiaries, income taxes from continuing operations in 2014 also included an adjustment of $2.2 million to operating results through the closing date.reverse previously accrued deferred tax liabilities arising from foreign currency translation adjustments.(b)A goodwill impairment(c) Plant shutdowns, asset impairments, restructurings and other for 2013 include a charge of $30.6$1.7 million ($30.6related to expected future environmental costs at the aluminum extrusions manufacturing facility in Newnan, Georgia (included in “Cost of goods sold” in the consolidated statement of income); charges of $0.6 million after taxes) was recognizedassociated with the shutdown of the Company’s aluminum extrusions manufacturing facility in Kentland, Indiana; charges of $0.5 million associated with the shutdown of the film products manufacturing facility in Red Springs, North Carolina, which includes severance and other employee-related costs of $0.3 million and asset impairment charges of $0.2 million; charges of $0.4 million for severance and other employee-related costs in connection with restructurings in Aluminum Extrusions upon completion($0.3 million) and Film Products ($0.1 million); charges of $0.2 million for integration-related expenses and other nonrecurring transactions (included in “Selling, general and administrative expenses” in the consolidated statements of income) associated with the acquisition of AACOA by Aluminum Extrusions; and a loss of $0.1 million related to the sale of previously impaired machinery and equipment at the Company’s film products manufacturing facility in Shanghai, China (included in “Other income (expense), net” in the consolidated statements of income). The unrealized gain on the Company’s investment in kaléo of $3.4 million, the unrealized loss on the Company’s investment in Harbinger of $0.4 million and the unrealized loss on the Company’s investment property in Alleghany and Bath County, Virginia of $1.0 million in 2013 are included in “Other income (expense), net” in the consolidated statements of income. Income taxes for 2013 include the recognition of an impairment analysis performed asadditional valuation allowance of March 31, 2009. The non-cash charge resulted from$0.4 million related to the estimated adverse impactexpected limitations on the business unit’s fair valueutilization of possible futureassumed capital losses and the uncertainty of the amount and timing of an economic recovery.on certain investments.(c)(d) Plant shutdowns, asset impairments, restructurings and other for 2012 include a net charge of $3.6 million associated with the shutdown of ourthe Company’s aluminum extrusions manufacturing facility in Kentland, Indiana, which included accelerated depreciation for property and equipment of $2.4 million (included in “Cost of goods sold” in the consolidated statement of income), severance and other employee-related costs of $1.2 million and other shutdown-related charges of $2.3 million, partially offset by adjustments to inventories accounted for under the last-in, first-out method of $1.5 million (included in “Cost of goods sold” in the consolidated statementstatements of income) and gains of $0.8 million (included in “Other income (expense), net” in the consolidated statements of income); a gain of $1.3 million in Film Products (included in “Other income (expense), net” in the consolidated statements of income) associated with an insurance recovery on idle equipment that was destroyed in a fire at an outside warehouse; charges of $1.3 million for acquisition-related expenses (included in “Selling, general and administrative expenses in the consolidated statements of income) associated with the acquisition of AACOA by Aluminum Extrusions; charges of $1.1 million for integration-related expenses and other nonrecurring transactions (included in “Selling, general and administrative expenses” in the consolidated statements of income) associated with the acquisition of Terphane by Film Products; gain of $1.1 million (included in “Other income (expense), net” in the consolidated statements of income) on the sale of assets associated with a previously shutdown film products manufacturing facility in LaGrange, Georgia; losses of $0.8 million for asset impairments associated with a previously shutdown film products manufacturing facility in LaGrange, Georgia; charges of $0.5 million for severance and other employee-related costs in connection with restructurings in Film Products ($0.3 million) and Aluminum Extrusions ($0.2 million); charges of $0.2 million for asset impairments in Film Products; charges of $0.2 million for integration-related expenses and other nonrecurring transactions (included in “Selling, general and administrative expenses” in the consolidated statements of income) associated with the acquisition of AACOA by Aluminum Extrusions; charges of $0.1 million associated with purchase accounting adjustments made to the value of inventory sold by Aluminum Extrusions after its acquisition of AACOA; and a charge of $0.1 million (included in “Costs of goods sold” in the consolidated statementstatements of income) related to adjustments ofexpected future environmental costs expected to be incurred by Aluminum Extrusions.at the aluminum extrusions manufacturing facility in Newnan, Georgia (included in “Cost of goods sold” in the consolidated statement of income). The unrealized gain fromon the write-up of anCompany’s investment accounted for under the fair value methodin kaléo of $16.1 million and the unrealized loss on ourthe Company’s investment in Harbinger of $1.1 million in 2012 are included in “Other income (expense), net” in the consolidated statements of income. Income taxes for 2012 include the recognition of an additional valuation allowance of $1.3 million related to the expected limitations on the utilization of assumed capital losses on certain investments.(d)(e) Plant shutdowns, asset impairments, restructurings and other for 2011 include charges of $4.8 million for acquisition-related expenses (included in “Selling, general and administrative expenses” in the consolidated statements of income) associated with the acquisition of Terphane by Film Products; charges of $1.4 million for asset impairments in Films Products; a gain of $1.0 million on the disposition of ourthe film products business in Roccamontepiano, Italy (included in “Other income (expense), net” in the consolidated statements of income), which includes the recognition of previously unrecognized foreign currency translation gains of $4.3 million that were associated with the business; charges of $0.7 million associated with purchase accounting adjustments made to the value of inventory sold by Films Products after its purchase of Terphane (included in “Cost of goods sold” in the consolidated statements of income); charges of $0.5 million for severance and other employee related costs in connection with restructurings in Film Products; charges of $0.4 million for integration-related expenses (included in “Selling, general and administrative expenses” in the consolidated statements of income) associated with the acquisition of Terphane by Film Products; and gains of $0.1 million associated with Aluminum Extrusions for timing differences between the recognition of realized losses on aluminum futures contracts and related revenues from the delayed fulfillment by customers of fixed-price forward purchase commitments (included in “Cost of goods sold” in the consolidated statements of income). The unrealized gain fromon the write-up of anCompany’s investment accounted for under the fair value methodin kaléo of $1.6 million and the unrealized loss on ourthe Company’s investment in Harbinger of $0.6 million in 2011 are included in “Other income (expense), net” in the consolidated statements of income.(e)(f) Plant shutdowns, asset impairments, restructurings and other for 2010 include gains of $0.9 million associated with Aluminum Extrusions for timing differences between the recognition of realized losses on aluminum futures contracts and related revenues from the delayed fulfillment by customers of fixed-price forward purchase commitments (included in “Cost of goods sold” in the consolidated statements of income); asset impairment charges of $0.6 million related to Films Products; a charge of $0.4 million related to expected future environmental costs at the aluminum extrusions manufacturing facility in Newnan, Georgia (included in “Cost of goods sold” in the consolidated statements of income); charges of $0.2 million for severance and other employee-related costs in connection with restructurings in Film Products; a gain of $0.1 million on the sale of previously impaired equipment (included in “Other income (loss), net” in the consolidated statements of income) at the film products manufacturing facility in Pottsville, Pennsylvania; and losses of $0.1 million on the disposal of equipment (included in “Other income (expense), net” in the consolidated statements of income) from a previously shutdown film products manufacturing facility in LaGrange, Georgia. The unrealized loss fromon the write-down of anCompany’s investment accounted for under the fair value methodin kaléo of $2.2 million in 2010 is included in “Other income (expense), net” in the consolidated statementstatements of income. Income taxes in 2010 include the recognition of an additional valuation allowance of $0.2 million related to the expected limitations on the utilization of assumed capital losses on certain investments.(f)Plant shutdowns, asset impairments, restructurings and other for 2009 include a charge of $2.1 million for severance and other employee related costs in connection with restructurings for Film Products ($1.3 million), Aluminum Extrusions ($0.4 million) and corporate headquarters ($0.4 million, included in “Corporate expenses, net” in the operating profit by segment table); an asset impairment charge of $1.0 million in Films Products; losses of $1.0 million associated with Aluminum Extrusions for timing differences between the recognition of realized losses on aluminum futures contracts and related revenues from the delayed fulfillment by customers of fixed-price forward purchase commitments (included in “Cost of goods sold” in the consolidated statements of income); a gain of $0.6 million related to the sale of land at our aluminum extrusions facility in Newnan, Georgia (included in “Other income (expense), net” in the consolidated statements of income); a gain of $0.3 million on the sale of equipment (included in “Other income (expense), net” in the consolidated statements of income) from a previously shutdown film products manufacturing facility in LaGrange, Georgia; a gain of $0.2 million on the sale of a previously shutdown aluminum extrusions manufacturing facility in El Campo, Texas (included in “Other income (expense), net” in the consolidated statements of income); a gain of $0.1 million related to the reversal to income of certain inventory impairment accruals in Film Products; and a net charge of $0.1 million (included in “Costs of goods sold” in the consolidated statement of income) related to adjustments of future environmental costs expected to be incurred by Aluminum Extrusions. The gain from the write-up of an investment accounted for under the fair value method of $5.1 million in 2009 is included in “Other income (expense), net” in the consolidated statement of income. The gain on sale of investments in Theken Spine and Therics, LLC, which is also included in “Other income (expense), net” in the consolidated statement of income, includes the receipt of a contractual earn-out payment of $1.8 million and a post-closing contractual adjustment of $0.2 million. AFBS Inc. (formerly Therics, Inc.) received these investments in 2005, when substantially all of the assets of AFBS, Inc., a wholly owned subsidiary of Tredegar, were sold or assigned to a newly created limited liability company, Therics, LLC, controlled and managed by an individual not affiliated with Tredegar. Income taxes in 2009 include the recognition of an additional valuation allowance of $2.1 million related to the expected limitations on the utilization of assumed capital losses on certain investments.(g) Plant shutdowns, asset impairments, restructurings and other for 2008 include an asset impairment charge of $9.7 million for Film Products; a charge of $2.7 million for severance and other employee related costs in connection with restructurings for Film Products ($2.2 million) and Aluminum Extrusions ($0.5 million); a gain of $0.6 million from the sale of land rights and related improvements at the film products facility in Shanghai, China (included in “Other income (expense), net” in the consolidated statement of income); and a $0.2 million charge related to expected future environmental costs at the aluminum extrusions facility in Newnan, Georgia (included in “Cost of goods sold” in the consolidated statements of income). The gain of $1.5 million from the sale of our investments in Theken Spine and Therics, LLC is included in “Other income (expense), net” in the consolidated statements of income. The gain from the write-up of an investment accounted for under the fair value method of $5.6 million in 2008 is included in “Other income (expense), net” in the consolidated statements of income. Income taxes in 2008 includes the reversal of a valuation allowance recognized in the third quarter of 2007 of $1.1 million that originally related to expected limitations on the utilization of assumed capital losses on certain investments.(h)Total return to shareholders is defined as the change in stock price during the year plus dividends per share, divided by the stock price at the beginning of the year. (i)(h) Equity market capitalization is the closing market price per share for the period multiplied by the shares outstanding at the end of the period. (j)(i) Net sales represent gross sales less freight. Net sales is the measure used by the chief operating decision maker of each segment for purposes of assessing performance. (k)(j) In addition to quarterly dividends of 4 1/2 cents per share in the the first and second quarters and 6 cents per share in the third and fourth quarters of 2012, there was a special one-time dividend of 75 cents per share paid to shareholders in December 2012.Item 7. MANAGEMENT’S DISCUSSION AND ANALYSIS OF FINANCIAL CONDITION AND RESULTS OF OPERATIONS we useTredegar uses the words “believe,” “estimate,” “anticipate,” “expect,” “project,” “likely,” “may” and similar expressions, we doit does so to identify forward-looking statements. Such statements are based on our then current expectations at the time of the filing and are subject to a number of risks and uncertainties that could cause actual results to differ materially from those addressed in the forward-looking statements. It is possible that our actual results and financial condition may differ, possibly materially, from the anticipated results and financial condition indicated in these forward-looking statements. For risks and important factors that could cause actual results to differ from expectations, refer to the reports that we filethe Company files with or provideprovides to the SEC from time-to-time, including the risks and important factors set forth in “Risk Factors” in Part I, Item 1A of this Form 10-K. Readers are urged to review and consider carefully the disclosures Tredegar makes in the reports Tredegar files with or furnishes to the SEC. Tredegar does not undertake, and expressly disclaims any duty, to update any forward-looking statement to reflect any change in management’s expectations or any change in conditions, assumptions or circumstances on which such statements are based. primarily a manufacturer of plastic films and aluminum extrusions. Descriptions of all of ourthe Company’s businesses are provided on pages 1-9.$882.2$951.8 million in 20122014 compared to $794.4$959.3 million in 2011.2013. Income from continuing operations was $43.2$36.0 million ($1.341.11 per diluted share) in 2012,2014, compared with $28.5$35.9 million (89 cents($1.10 per diluted share) in 2011.2013. Losses associated with plant shutdowns, assetsasset impairments and restructurings and gains and losses on the sale of assets, gains or losses on investments accounted for under the fair value method and other items are described in results of continuing operations beginning on page 25. The business segment review begins on page 38. Year Ended
December 31 Favorable/
(Unfavorable) 2012 2011 % Change 270,265 218,727 23.6 % $ 611,877 $ 535,540 14.3 % $ 69,950 $ 59,493 17.6 % The improvement in operating results for Film Products in 2012 was primarily driven by higher volumes in flexible packaging films as a result of our acquisition of Terphane on October 24, 2011. (In thousands, except percentages) 2014 2013 % Change Sales volume (pounds) 247,267 270,463 (8.6 )% Net sales $ 578,687 $ 621,239 (6.8 )% Operating profit from ongoing operations $ 58,054 $ 70,966 (18.2 )% (sales less freight) for Terphane were $138.0 million in 2012 compared to $28.3 million in 2011. The impact on operating profit from ongoing operations directly attributable to the acquisition of Terphane was $19.1 million in 2012, which includes amortization expense of $5.1 million. In 2011, operating profit from ongoing operations attributed to the addition of Terphane was approximately $3.0 million, which included $0.9 million in one-time reimbursements for custom duties and $0.9 million of amortization expense.As noted above, net sales for 2012 increased2014 decreased in comparison to 20112013, primarily due to the acquisition of Terphane. Higher net sales from the addition of Terphane were primarily offset by lower volumes in the other product lines of approximately $18.7 million, the unfavorable change in the U.S. dollar value of currencies for operations outside the U.S. of approximately $10.1 million and a decrease in average selling prices of approximately $4.6 million. Lower net sales volumes are primarily related to lower volumes for personal care materials and polyethylene overwrap films, partially offset by improved performance in surface protection films in the fourth quarter of 2012. The decrease in the average selling prices in 2012 compared to 2011 can be primarily attributed to pricing pressures.The increase in operating profit from ongoing operations in 2012 compared to 2011 is primarily due to the acquisition of Terphane, partially offset by lower volumes and compressed margins for personal care materials and the unfavorable impact of the change in the U.S. dollar value of currencies for operations outside the U.S. Excluding the impact of the acquisition of Terphane, lowerLower volumes in Film Products had an unfavorable impact of approximately $4.8$39.6 million on net sales, as lost business related to certain babycare elastic laminate films sold in 2012 compared to 2011.North America accounted for approximately $33.9 million of this change. Net sales in Film Products were also impacted by reduced sales volumes for polyethylene overwrap and surface protection films, partially offset by higher volumes for other personal care materials. Lower volumes in surface protection films were primarily related to customer inventory corrections in 2014 and a minor loss of market share in a lower-tier film due to competitive pricing pressures. Average selling prices were favorably impacted by the contractual pass-through of certain costs, primarily an increase in average resin prices, in 2014. The impact of contractual pass-throughs was offset by competitive pricing pressures in flexible packaging films and personal care materials were partially mitigated by higher sales volumes for surface protection films.materials. The change in the U.S. dollar value of currencies for operations outside the U.S. had an unfavorable impact on net sales in 2014 of approximately $1.4$2.6 million.2012comparison to 2013. The previously noted loss of babycare elastic laminate film volumes had an estimated unfavorable impact on operating profit from ongoing operations of approximately $7.0 million in 2014 compared to 2011.2013. The loss of this business is expected to negatively impact operating profit from ongoing operations by approximately $2 million in 2015. Lower volumes noted above and changes in$0.5of approximately $0.1 million in 20122014 compared to a negative $0.8of approximately $2.1 million in 2011.Effective January 1, 2012, the operations of Bright View were incorporated into2013.leverage researchP&G due to its consolidation of suppliers for its North American product needs. Net sales for this domestic product line were $17.1 million in 2014 and development efforts$50.9 million in 2013. The total impact of the loss of this business with P&G on operating results will not be fully realized until 2015, and accelerate new product development. Prior year balances for Bright View have been reclassifiedwhen realized, it is expected to negatively impact operating profit from ongoing operations on an annual basis by approximately $9 million. P&G remains an important customer to Film Products, and Film Products does not expect the loss of the elastic laminate volumes in North America to conformimpact other business or initiatives underway with P&G. The loss of this business resulted in the current year presentation. Operating losses for Bright Viewshutdown of the film products’ manufacturing facility in 2012Red Springs, North Carolina, a leased facility that was dedicated solely to this product line. Charges incurred related to the shutdown of the Red Springs manufacturing facility, which primarily consisted of severance and other employee-related costs, were consistent with 2011 at $3.8 million.$30.5$38.8 million in 20122014 compared to $13.1$64.9 million in 2011, which2013. Capital expenditures in 2014 and 2013 included approximately $19.6$17 million in capital expendituresand $41 million, respectively, for athe project that willto expand our capacity at theFilm Products’ manufacturing facility in Cabo de Santo Agostinho, Brazil. The additional capacity from this project, which will primarily serve flexible packaging films customers in Latin America, became available for commercial production at the end of the third quarter of 2014, and production volumes started to ramp-up in the fourth quarter of 2014. Film Products currently estimates that capital expenditures will be approximately $80$31 million in 2015, which includes approximately $15 million for routine capital expenditures required to support operations. Depreciation expense was $27.0 million in 2014 and $30.4 million in 2013, which includesand is projected to be approximately $49$27 million for thein 2015. Amortization expense was $3.8 million in 2014 and $4.9 million in 2013, and is projected to be approximately $4 million in 2015.expansion project in Brazil. This multi-year project will significantly increase capacity in Brazil and primarily serveserving flexible packaging films customers in Latin America. Depreciation expense was $33.9 million in 2012America became available for commercial production at the end of the third quarter of 2014. In addition, capacity expansion projects for surface protection film and $34.9 million in 2011, and is projectedpersonal care materials are expected to be completed in the first half of 2015.$32 million7% through 2018, Film Products expects global supply-demand dynamics to improve in 2013.Aluminum ExtrusionsOn October 1, 2012, The William L. Bonnell Company acquired 100% ownership of AACOA. The purchase price, net of cash acquired, of $54.6 million was primarily funded using financing secured from our existing $350 million revolving credit facility. AACOA operates production facilities in Elkhart, Indiana and Niles, Michigan, andthe coming years.primary markets include consumer durables, machinery and equipment and transportation. The acquisitionstrategy, Film Products will add fabrication capabilities to Aluminum Extrusions’ current array ofleverage new products and services while providing AACOA with large press capabilitiesadded capacity to create long-term growth and enhanced geographic sales coverage in a variety of end-use markets. Year Ended
December 31 Favorable/
(Unfavorable) 2012 2011 % Change 114,845 107,997 6.3 % $ 245,465 $ 240,392 2.1 % $ 9,037 $ 3,457 161.4 % (In thousands, except percentages) 2014 2013 % Change Sales volume (pounds) 153,843 143,684 7.1 % Net sales $ 344,346 $ 309,482 11.3 % Operating profit from ongoing operations $ 25,664 $ 18,291 40.3 % 20122014 increased versus 20112013 primarily due to the acquisitionhigher sales volumes and an increase in average selling prices. Higher sales volumes had a favorable impact of AACOA, partially offset by a decreaseapproximately $18.5 million in 2014. The increase in average selling prices, driven by lower aluminum prices and lower volume resulting from the shutdown of the Kentland facility. AACOA, which was acquiredhad a positive impact on October 1, 2012, had net sales of $19.5approximately $16.4 million, can be attributed to inflationary price increases, higher average aluminum costs and favorable changes in product mix due to a higher percentage of painted and anodized finished products as well as an increase in the fourth quartersales of 2012. Excluding the impact of the acquisition of AACOA and the Kentland plant shutdown, sales volume in 2012 increased 0.6% in comparison to 2011.20122014 versus 2011 due2013, primarily as a result of an improved product mix, higher volumes, the favorable impact of manufacturing efficiencies and reduced selling, general and administrative expenses. Higher sales volumes and improved product mix had a favorable impact of approximately $5.3 million in comparison to the prior year. Despite unanticipated utility, distribution and manufacturing costs as a result of adverse weather conditions in the first quarter of 2014, improved profitabilitymargins from the shutdown of our Kentland manufacturing facility, better pricing, lower energy costsefficiencies and the acquisition of AACOA. AACOA hadreduced selling, general and administrative expenses increased operating profit from ongoing operations ofby approximately $0.8 million for the fourth quarter of 2012, which included amortization expense of $0.5$1.4 million.Aluminum Extrusions closed its manufacturing facility in Kentland, Indiana in August 2012. The plant, whose core market was residential construction, previously employed 146 people. Charges associated with the Kentland shutdown were $3.6 million in 2012, and included accelerated depreciation on property, plant and equipment of approximately $2.4 million, severance and other employee-related costs of approximately $1.2 million and other shutdown-related charges of $2.3 million, partially offset by an adjustment for inventories accounted for under the last-in, first-out (“LIFO”) method of $1.5 million and gains on the sale of equipment of $0.8 million. Other shutdown-related costs are primarily comprised of equipment transfers, environmental assessments, estimated remediation costs, and other miscellaneous plant shutdown charges. Estimated cash expenditures for shutdown-related activities that are expected to be recognized in 2013 are approximately $1 million. The shutdown of our Kentland manufacturing facility had a favorable impact on operating profit from ongoing operations of approximately $2.5 million in 2012 compared to 2011. Starting in 2013, we estimate that on an annual basis the closure of Kentland will have a positive impact of approximately $4-5 million on segment In addition, operating profit from ongoing operations in future periods.$2.3$6.1 million in 20122014 compared with $2.7$14.7 million in 2011.2013. Capital expenditures are projected to bein 2014 and 2013 include approximately $19$2.8 million in 2013, which includes approximately $15and $11.5 million, respectively, for an 18-montha project that will expand ouradded capacity at the manufacturing facility in Newnan, Georgia. This additional capacity will primarily serveserves the automotive industry. Capital expenditures are projected to be approximately $10 million in 2015, which includes approximately $5 million for routine capital expenditures required to support operations. Depreciation expense was $9.5 million in 2012 compared with $8.3 million in 2011,2014 compared with $7.4 million in 2013, and is projected to be approximately $7$9 million in 2013. Higher depreciation2015. Amortization expense in 2012 is primarily related to approximately $2.4was $1.6 million in accelerated depreciation on property, plant2014 and equipment at$1.8 million in 2013, and is projected to be approximately $1 million in 2015.Kentland manufacturing facility.OtherThe Other segment was previously comprisedCompany is optimistic about the expected growth trends for this market in 2015. Operating results in 2014 benefited from an improved product mix and increased demand for anodized products. Aluminum Extrusions is currently in the process of Bright Viewexpanding and Falling Springs, LLC (“Falling Springs”). Falling Springs develops, owns and operates multiple mitigation banks.upgrading its anodizing capacity to satisfy the strong demand for finished extrusions. As previously noted,discussed, additional capacity dedicated to the operationsautomotive industry came on-line in 2014, and Aluminum Extrusions expects the ramp-up of Bright View were incorporated into Film Productsthe associated production volumes to accelerate in 2012,2015. The Company believes that the combination of improving nonresidential building and all prior year balancesconstruction volumes and market diversification efforts position Aluminum Extrusions for Bright View have been reclassified to Film Products to conform with the current year presentationOn November 20, 2012, Tredegar Real Estate Holdings, Inc., a wholly owned subsidiary of Tredegar, sold its membership interestscontinued growth in Falling Springs to Arc Ventures, LC for cash and stock proceeds totaling $16.6 million. Arc Ventures, LC is a Virginia limited liability company affiliated with John D. Gottwald, a member of our Board of Directors. The purchase price paid to Tredegar was comprised of cash of $12.8 million and 209,576 shares of common stock of Tredegar owned by Arc Ventures, LC. The corresponding loss on sale of $3.1 million, which includes transaction-related expenses of $0.5 million, and the results of operations related to Falling Springs have been classified as discontinued operations for all periods presented.$8.1$6.7 million in 2012, an unfavorable2014, a favorable change of $5.8$7.0 million from pension expense recognized in 2011.2013. Most of the change is reflected in “Corporate expenses, net” in the segment operating profit table presented on page 17. We16. The Company contributed approximately $2.3$2.8 million to ourits pension plans in 2012.2014. Minimum required contributions to our pension plans in 20132015 are expected to be $0.2 million as interest rates and expected long-term plan asset investment returns declined in recent years.$2.4 million. Pension expense in 2013 is estimated at $13.3 million.to be $12.3 million in 2015. Corporate expenses, net increaseddecreased in 20122014 in comparison to 20112013 primarily due to the higherreduction in pension expenses noted above, lower stock-based employee benefit costs and a reduction in performance incentive accruals, partially offset by the timing of certain non-recurring corporate expenditures. Corporate expenses, net included costs of $0.9 million and $1.4 million related to responding to a Schedule 13D filed with the SEC by certain shareholders in 2014 and 2013, respectively. Corporate expenses, net also includedourthe Company’s investment in the Harbinger of $1.1 million, certain acquisition-related expensesCapital Partners Special Situations Fund, L.P. (“Harbinger Fund”) of $0.8 million in 2014 and higher performance-based incentive compensation of $0.6 million.$3.6$2.7 million in 20122014 in comparison to $1.9$2.9 million in 2011 as a result of an increase in the average borrowings under our revolving credit facility. Additional borrowings under our revolving credit facility were used to finance a portion of the purchase prices for the acquisition of Terphane in the fourth quarter of 2011 and the acquisition of AACOA in the fourth quarter of 2012. used to compute income taxes from continuing operations was 29.8%20.7% in 20122014 compared with 26.4%32.1% in 2011.2013. Income taxes from continuing operations in 20122014 included the recognition of a tax benefit for a portion of the Company’s capital loss carryforwards of $4.9 million. These capital loss carryforwards were previously offset by a valuation allowance associated with expected limitations on the utilization of these assumed capital losses. As a result of changes in the underlying basis of certain foreign subsidiaries, income taxes from continuing operations in 2014 also included an adjustment of $2.2 million to reverse previously accrued deferred tax liabilities arising from changes in tax basis due to foreign currency translation adjustments and unremitted earnings. Income taxes from continuing operations in 2013 primarily reflect the benefit of current year foreign tax incentives, and income taxes for continuing operations in 2011 primarily reflect the recognition of estimated tax benefits from the divestiture of the film products business in Italy, partially offset by thenondeductible acquisition-related expenses associated with the acquisition impact of Terphane by Film Products.adjustments for tax contingency matters. Significant differences between the effective tax rate for continuing operations and the U.S. federal statutory rate for 20122014 and 20112013 are further detailed in the effective income tax rate reconciliation provided in Note 17 beginning on page 76.Our$128.0$137.3 million in excess of cash and cash equivalents of $48.8$50.1 million) at December 31, 20122014 was $79.2$87.2 million, compared to a net debt balance (total debt of $125.0$139.0 million in excess of cash and cash equivalents of $68.9$52.6 million) at December 31, 20112013 of $56.1$86.4 million. Net debt, a financial measure that is not calculated or presented in accordance with U.S. generally accepted accounting principles (“U.S. GAAP”), is not intended to represent debt as defined by U.S. GAAP, but is utilized by management in evaluating financial leverage and equity valuation. We believeThe Company believes that investors also may find net debt helpful for the same purposes. Consolidated net capitalization and other credit measures are provided in the financial condition section beginning on page 29.we makethe Company makes a number of estimates and assumptions relating to the reporting of results of operations and financial position in the preparation of financial statements in conformity with U.S. GAAP. Actual results could differ significantly from those estimates under different assumptions and conditions. We believeThe Company believes the following discussion addresses ourits critical accounting policies. These policies require management to exercise judgments that are often difficult, subjective and complex due to the necessity of estimating the effect of matters that are inherently uncertain.We assess ourwe dothe Company does not believe the carrying value of the long-lived assetasset(s) will be recoverable. WeTredegar also reassessreassesses the useful lives of ourits long-lived assets based on changes in ourthe business and technologies.We assessThe Company assesses goodwill for impairment when events or circumstances indicate that the carrying value may not be recoverable, or, at a minimum, on an annual basis (December 1st of each year). OurThe reporting units in Film Products include, but are not limited to, Polyethylene and Polypropylene Films and PET Films. As of December 31, 2012,2014, each of the previously identified reporting units in Film Products was carrying a goodwill balance. We haveThere are two reporting units in Aluminum Extrusions, AACOA and Bonnell. All goodwill in Aluminum Extrusions is associated with the AACOA reporting unit.we estimatethe Company estimates fair value using discounted cash flow analysis and comparative enterprise value-to-EBITDA (earnings before interest, taxes, depreciation and amortization) multiples. These calculations require usmanagement to make assumptions regarding estimated future cash flows, discount rates and other factors to determine if an impairment exists. If these estimates or their related assumptions change in the future, wethe Company may be required to record additional impairment charges.wethe Company recorded asset impairment losses for continuing operations of $1.0 million in 2012 $1.4 million(none in 20112014 and $0.6 million in 2010.weTredegar made an aggregate investment of $7.5 million in kaléo (formerly Intelliject, Inc.), a privately held specialty pharmaceutical company. This investment is accounted for under the fair value method. At the time of ourthe initial investment, wethe Company elected the fair value option over the equity method of accounting since ourits investment objectives were similar to those of venture capitalists, which typically do not have controlling financial2012, our2014, Tredegar’s ownership interest was approximately 20% on a fully diluted basis.We discloseourits investments, we believeTredegar believes that the amount weit paid for ourits ownership interest and liquidation preferences was based on Levelwe believethe Company believes fair value estimates are based upon Level 3 inputs since there is no secondary market for ourTredegar’s ownership interest. In addition, Intelliject had no product sales as of December 31, 2012. Their first product launched in the first quarter of 2013. Accordingly, after the latest financing and until the next round of financing or any other significant financial transaction, fair value estimates will primarily be based on assumptions relating to meeting product development and commercialization milestones, cash flow projections (projections of development and commercialization milestone payments, sales, costs, expenses, capital expenditures and working capital investment) and discounting of these factors for the high degree of risk.20122014 and 2011,2013, the fair value of ourthe Company’s investment (the carrying value included in “Other assets and deferred charges” in ourthe consolidated balance sheet) was $33.7$39.1 million and $17.6$37.1 million, respectively. The fair market valuation of ourTredegar’s interest in Intellijectkaléo is sensitive to changes in the weighted average cost of capital used to discount cash flow projections for the high degree of risk associated with meeting development and commercialization milestones as anticipated. At December 31, 2012,2014, the effect of a 500 basis point decrease in the weighted average cost of capital assumption would have further increased the fair value of ourthe Company’s interest in Intellijectkaléo by approximately $6 million, and a 500 basis point increase in the weighted average cost of capital assumption would have decreased the fair value of ourthe Company’s interest by approximately $5$6 million. Any future changes in the estimated fair value of our ownership interest will likely be attributed to a new round of financing, a merger or initial public offering or adjustments to the timing or magnitude of cash flows associated with development and commercialization milestones. Adjustments to the estimated fair value of our investment will be made in the period upon which such changes can be quantified.We sponsorourits continuing operations that have resulted in varying amounts of net pension income or expense, as developed from actuarial valuations. Inherent in these valuations are key assumptions including discount rates, expected return on plan assets and rate of future compensation increases. We areThe Company is required to consider current market conditions, including changes in interest rates and plan asset investment returns, in determining these assumptions. Actuarial assumptions may differ materially from actual results due to changing market and economic conditions, higher or lower withdrawal rates or longer or shorter life spans of participants. These differences may result in a significant impact to the amount of net pension income or expense recorded in future periods.ourthe pension liability increases as the discount rate decreases and vice versa. The weighted average discount rate utilized was 4.17% at the end of 2014, 4.99% at the end of 2013 and 4.21% at the end of 2012, 4.95% at the end of 2011 and 5.45% at the end of 2010, with changes between periods due to changes in market interest rates. Based on plan changes announced in 2006, payPay for active participants of the plan was frozen as of December 31, 2007. Beginning in the first quarter of 2014, with the exception of plan participants at two of the Company’s U.S. manufacturing facilities, the plan will no longer accrue benefits associated with crediting employees for service, thereby freezing all future benefits under the plan.our plan assets, which is primarily affected by the change in fair value of plan assets, current year contributions and current year payments to participants, was 4.1% in 2014, 11.2% in 2013 and 8.9% in 2012, a negative 5.1% in 2011, and 11.4% in 2010. Our2012. The expected long-term return on plan assets relating to continuing operations, which is estimated by asset class and generally based on inflation-adjusted historical returns, volatilities, risk premiums and managed asset premiums, werewas 7.75% in 2014 and 2013, 8.0% in 2012 and 8.25% infrom 2009 to 2011 and 8.5% from 2004 to 2008. We anticipate2011. The Company anticipates that ourits expected long-term return on plan assets will be 7.75%7.5% for 2013.2015. See page 73 for more information on expected long-term return on plan assets and asset mix.2019 for further discussion regarding the financial impact of ourthe Company’s pension plans.we review ourTredegar reviews its judgments regarding uncertain tax positions and the likelihood that the benefits of a deferred tax asset will be realized. As circumstances change, we reflectthe Company reflects in earnings any adjustments to unrecognized benefits for uncertain tax positions and valuation allowances for deferred tax assets. we had unrecognized tax benefits on uncertain tax positions of $0.9were $3.3 million, $1.0$2.2 million and $1.1$0.9 million as of December 31, 2012, 20112014, 2013 and 2010,2012, respectively. Tax payments resulting from the successful challenge by the taxing authority on uncertain tax positions taken by usTredegar would possibly result in the payment of interest and penalties. Accordingly, wethe Company also accrueaccrues for possible interest and penalties on uncertain tax positions. The balance of accrued interest and penalties on deductions taken relating to uncertain tax positions was approximately $0.1$0.3 million, $0.4$0.2 million and $0.1 million$60,000 at December 31, 2012, 20112014, 2013 and 2010,2012, respectively ($37,000, $0.20.2 million, $96,000 and $0.1 million,$37,000, respectively, net of corresponding federal and state income tax benefits). Accruals for possible interest and penalties on uncertain tax positions are reflected in income tax expense for financial reporting purposes.andor one of its subsidiaries, filefiles income tax returns in the U.S., federal jurisdiction, various states and jurisdictions outside the U.S. Except for refund claims and amended returns, the Internal Revenue Service (“IRS”) has provided written confirmation that they do not plan to make any additional changes to our U.S. consolidated tax returns for the years prior to 2010, although the federal statute of limitations was extended through December 31, 2013 for the tax years 2006-2009. With few exceptions, Tredegar and its subsidiaries areis no longer subject to U.S. federal, state or non-U.S. income tax examinations by tax authorities for years before 2009.20122014 and 2011, we had2013, valuation allowances relating to deferred tax assets of $18.6were $14.6 million and $12.4$20.0 million, respectively. For more information on deferred income tax assets and liabilities, see Note 17 of the notes to financial statements beginning on page 76.July 2012,April 2014, the Financial Accounting Standards Board (“FASB”) issued updateda revised standard that changes current guidance for testing indefinite-lived intangible assetsdiscontinued operations. Under the revised standard, to be a discontinued operation, a component or group of components must represent a strategic shift that has (or will have) a major effect on an entity’s operations and financial results. Failure to eliminate significant continuing cash flows of or involvement with a disposed component from an entity’s ongoing operations after a disposal no longer precludes presentation as a discontinued operation. Expanded disclosures for impairment.discontinued operations under the revised standard will also include more details about earnings and balance sheet accounts, total operating and investing cash flows and cash flows resulting from continuing involvement. New disclosures are also required for disposals of individually significant components that do not qualify as discontinued operations. The new guidance is to be applied prospectively to all new disposals of components and new classifications as held for sale for annual reporting periods beginning after December 15, 2014, with early adoption permitted. The Company will implement this revised standard as transactions and events warrant.providescontains principles that an entity will apply to direct the measurement of revenue and timing of when it is recognized. The core principle of the guidance is that the recognition of revenue should depict the transfer of promised goods or services to customers in an amount that reflects the consideration to which an entity expects to be entitled in exchange for those goods and services. To achieve that core principle, an entity will utilize a principle-based five-step approach model. The converged standard also includes more robust disclosure requirements which will require entities to provide sufficient information to enable users of financial statements to understand the nature, amount, timing and uncertainty of revenue and cash flows arising from contracts with an optioncustomers. The amendments in this revised standard are effective for annual reporting periods beginning after December 15, 2016, including interim periods within that reporting period. Early adoption is not permitted. The converged standard can be adopted either retrospectively or through the use of a practical expedient. The Company is still assessing the impact of this new guidance.performeliminate the concept of development stage entities and all related specified presentation and reporting requirements under U.S. GAAP. In addition, the amended standard eliminated the scope exception for development stage entities when evaluating the sufficiency of equity at risk for a “qualitative” assessmentvariable interest entity (“VIE”), thereby changing consolidation conclusions in some situations. Except for the elimination of the scope exception for development stage entities when evaluating the sufficiency of equity at risk for a VIE, the revised guidance is effective for annual reporting periods beginning after December 15, 2014, including interim periods within that reporting period. The amendments to determine whether further testing is necessary when performing anthe consolidation guidance are effective for annual impairment assessment for indefinite-lived intangible assets other than goodwill. Thisreporting periods beginning after December 15, 2015, including interim periods within that reporting period. The new standard is comparablenot expected to impact the Company.guidance finalized last yearperiod(s) for goodwill impairment testing. An entity can still choose to bypasswhich the qualitative assessment for any indefinite-lived intangible asset in any period and proceed directly to the quantitative impairment test.requisite service has already been rendered. The revisedamended standard is effective for annual and interim impairment tests performed for fiscal yearsreporting periods beginning after SeptemberDecember 15, 2012. We do2015, including interim periods within that reporting period. Early adoption is permitted. The new standard is not expectexpected to impact the Company.this FASB accountingare both unusual and infrequent in nature will no longer be separately reported net of tax after continuing operations. The existing requirement to separately present items that are of an unusual nature or occur infrequently on a pre-tax basis within income from continuing operations has been retained and expanded to include items that are both unusual and infrequent. The standard will have a materialis effective for periods beginning after December 15, 2015. Early adoption is permitted, but only as of the beginning of the fiscal year of adoption. The new standard is not expected to impact on our financial statements and disclosures.201220112013Revenues.Sales in 2012 increased2014 decreased by 11.0%0.8% compared with 20112013 due to lower sales in Film Products, partially offset by higher sales in both Film Products and Aluminum Extrusions. Net sales increased 14.3%(sales less freight) decreased 6.8% in Film Products primarily due to the acquisition of Terphane, partially offset by lower volumes inand the remaining product lines,unfavorable impact of the unfavorable change in the U.S. dollar value of currencies for operations outside the U.S. and a decrease in average selling prices. Net sales increased 2.1%11.3% in Aluminum Extrusions primarily due to the acquisition of AACOA, partially offset by a decreasehigher sales volumes and an increase in average selling prices driven by lowervarious factors, primarily including inflationary price increases, higher average aluminum pricescosts and lower volumes resulting from the shutdownfavorable changes in product mix due to a higher percentage of the Kentland facility.painted and anodized finished products as well as an increase in fabricated components. For more information on net sales and volume, see the executive summary beginning on page 20.19.were 16.4%was 15.2% in 20122014 and 15.3%15.2% in 2011.2013. Gross profit as a percentage of sales was favorably impacted by lower pension expenses in 2014 compared to 2013. As previously noted, most of the impact of lower pension expense is not allocated to Film Products and Aluminum Extrusions. The gross profit margin in Film Products, was relatively flat primarilywhich does not include lower pension expenses, decreased due to lower volumes, competitive pricing pressures and higher manufacturing costs, partially offset by the favorable impact of the acquisition of Terphane and the lagchange in the pass-throughU.S. dollar value of higher resin costs, offset by lower volumes and margin compression, primarily in personal care materials. Grosscurrencies for operations outside the U.S. The gross profit margin in Aluminum Extrusions, which does not include lower pension expenses, increased primarily as a result of improved profitability from the shutdown of our Kentlandproduct mix, higher volumes, additional manufacturing facility, betterefficiencies and improved pricing and lower energy costs.on value-added services. For more information on operating costs and expenses, see the executive summary beginning on page 20.19.9.8%8.6% in 2012,2014, which decreased from 10.2%8.7% in 2011.2013. The decrease in selling, general and administrative and R&D expenses as a percentage of sales can be primarily attributed to higher salesthe reduction of selling, general and administrative costs in Aluminum Extrusions and lower acquisition-related expenditures in 2012. Acquisition-related expenses were $2.0 million in 2012 compared to $4.8 million in 2011.20122014 totaled $5.5$13.8 million ($3.69.3 million loss after taxes) and included: fourth quarter charge of $0.9 million ($0.5 million after taxes), a third quarter charge of $0.8 million ($0.5 million after taxes), a second quarter charge of $1.0$10.0 million ($0.7 ($6.8 million after taxes) and a first quarter charge of $0.9 million ($0.5 million after taxes) associated with a one-time, lump sum license payment to the shutdown of3M Company (“3M”) after the aluminum extrusions manufacturing facility in Kentland, Indiana, which includes accelerated depreciation for property, plant and equipment of $2.4 million (included in “Cost of goods sold” in the consolidated statements of income), severance and other employee-related expenses of $1.2 million and other shutdown-related charges of $2.3 million, partially offset by adjustments to inventories accounted for under the LIFO method of $1.5 million (included in “Cost of goods sold” in the consolidated statements of income) and gains on the sale of equipment of $0.8 millionCompany settled all litigation issues associated with a patent infringement complaint (included in “Other income (expense), net” in the consolidated statements of income);A fourth quarter gain of $1.3 million ($0.7 million after taxes) in Film Products (included in “Other income (expense), net” in the consolidated statements of income) associated with an insurance recoveryincome; see Note 19 for additional detail on idle equipment that was destroyed in a fire at an outside warehouse;$0.9$0.5 million ($0.6 million after taxes) and a third quarter charge of $0.3 million ($0.2 million after taxes) for acquisition-related expenses (included in “Selling, general and administrative expenses” in the consolidated statements of income) associated with the acquisition of AACOA by Aluminum Extrusions;A fourth quarter charge of $0.1 million ($0.10.3 million after taxes), a third quarter charge of $0.1$0.4 million ($0.10.2 million after taxes), a second quarter charge of $0.6 million ($0.4 million after taxes) and a first quarter charge of $0.3 million ($0.2 million after taxes) for integration-related expenses (included in “Selling, general and administrative expenses” in the consolidated statements of income) associated with the Film Products acquisition of Terphane;A fourth quarter gain of $1.1 million ($0.6 million after taxes) related to the sale of a previously shutdown film products manufacturing facility in LaGrange, Georgia;A second quarter charge of $0.8 million ($0.5 million after taxes) for asset impairmentsin Film Products and a third quarter charge of $31,000 ($18,000 after taxes) in Aluminum Extrusions associated with a previously shutdown film products manufacturing facility in LaGrange, Georgia;and a second quarter charge of $0.1 million ($46,000 after taxes) in Film Products and a first quarter charge of $0.2 million ($0.1 million after taxes) in Aluminum Extrusions for severance and other employee-related costs in connection with restructurings;A fourth quarter charge of $0.2 million ($0.2 million after taxes) for asset impairments in Film Products;A fourth quarter charge of $0.2 million ($0.1 million after taxes) for integration-related expenses (included in “Selling, general and administrative expenses” in the consolidated statements of income) associated with the Aluminum Extrusions’ acquisition of AACOA;A fourth quarter charge of $0.1 million ($0.1 million after taxes) associated with purchase accounting adjustments made to the value of inventory sold by Aluminum Extrusions after its acquisition of AACOA (included in “Cost of goods sold” in the consolidated statements of income; see discussion that follows for additional detail); andA fourth quarter charge of $0.1 million ($49,000 after taxes) related to expected future environmental costs at ourthe aluminum extrusions manufacturing facility in Newnan, Georgia (included in “Cost of goods sold” in the consolidated statements of income).Business combination accounting principles under U.S. GAAP require that we adjust the inventory acquired in the acquisition of AACOA to fair value at the date of acquisition. In particular, finished goods inventory acquired was adjusted to reflect the cost of manufacturing plus a portion of the expected profit margin. The acquired inventory was sold in the2012. We believe that the adjustment included in “Costpreviously accrued severance and other employee-related costs of goods sold” in the fourth quarter of 2012 should be removed by investors as a means to determine profit and margins from ongoing operations, which reflect the operating trends of the acquired business.As previously noted, on November 20, 2012, we sold Falling Springs to Arc Ventures, LC. The corresponding loss on sale of $3.1$0.1 million ($2.063,000 after taxes) and a third quarter charge of $37,000 ($23,000 after taxes), a second quarter charge of $0.3 million ($0.2 million after taxes), which includes transaction-related expenses and a first quarter charge of $0.5 million ($0.3 million after taxes) associated with the shutdown of the film products manufacturing facility in Red Springs, North Carolina, which includes net severance and the resultsother employee-related costs of operations$0.4 million and asset impairment and other shutdown-related charges of $0.3 million;Falling Springs (netthe sale of a previously shutdown film products manufacturing facility in LaGrange, Georgia (included in “Other income (expense), net” in the consolidated statements of $0.5 millionincome); and2012) have been classified as discontinued operations.weTredegar sold ourits aluminum extrusions business in Canada for approximately $25.0 million to an affiliate of H.I.G. Capital. All historical results for this business have been reflected as discontinued operations. In 2012, an accrual of $13.4 million ($13.4 million after taxes) was madeAccruals for indemnifications under the purchase agreement related to environmental matters.20122014 include an unrealized gain fromon the write-up of ourCompany’s investment in Intellijectkaléo (included in “Other income (expense), net” in the consolidated statements of $16.1income) of $2.0 million ($10.21.0 million after taxes; see further discussion beginning on page 23)22). An unrealized loss on ourthe Company’s investment in the Harbinger Fund (included in “Other income (expense), net” in the consolidated statements of $1.1income and “Corporate expenses, net” in the statement of net sales and operating profit by segment) of $0.8 million ($0.70.4 million after taxes) was recorded in 20122014 as a result of a reduction in the fair value of ourthe investment that is not expected to be temporary. The Company realized a gain on the sale of a portion of its investment property in Alleghany and Bath Counties, Virginia (included in “Other income (expense), net” in the consolidated statements of income) of $1.2 million ($0.8 million after taxes) in 2014. For more information on costs and expenses, see the executive summary beginning on page 20.Expense.Expense. Interest income, which is included in “Other income (expense), net” in the consolidated statements of income, was $0.4$0.6 million in 2012,2014, compared to $1.0$0.6 million in 2011. Our2013. The Company’s policy permits investment of excess cash in marketable securities that have the highest credit ratings and maturities of less than one year with the primary objectives being safety of principal and liquidity.$3.6$2.7 million in 2012,2014, compared to $1.9$2.9 million for 2011. In October 2011, we borrowed $125 million under our revolving credit agreement to help fund the acquisition of Terphane. In October 2012, we borrowed an additional $51 million under our revolving credit facility to fund the acquisition of AACOA. 2012 2011 $ 112.1 $ 23.6 2.1 % 2.3 % $ — $ 0.3 n/a 4.3 % $ 112.1 $ 23.9 2.1 % 2.3 % (In Millions) 2014 2013 Floating-rate debt with interest charged on a rollover basis at one-month LIBOR plus a credit spread: Average outstanding debt balance $ 136.5 $ 133.5 Average interest rate 2.0 % 1.9 % Fixed-rate and other debt: Average outstanding debt balance $ — $ — Average interest rate n/a n/a Total debt: Average outstanding debt balance $ 136.5 $ 133.5 Average interest rate 2.0 % 1.9 % used to compute income taxes from continuing operations was 29.8%20.7% in 20122014 compared with 26.4%32.1% in 2011.2013. Income taxes from continuing operations in 20122014 included the recognition of a tax benefit for a portion of the Company’s capital loss carryforwards of $4.9 million. These capital loss carryforwards were previously offset by a valuation allowance associated with expected limitations on the utilization of these assumed capital losses. As a result of changes in the underlying basis of certain foreign subsidiaries, income taxes from continuing operations in 2014 also included an adjustment of $2.2 million to reverse previously accrued deferred tax liabilities arising from changes in tax basis due to foreign currency translation adjustments and unremitted earnings. Income taxes from continuing operations in 2013 primarily reflect the benefit of current year foreign tax incentives. Income taxes for continuing operations in 2011 reflect the recognition of estimated tax benefits from the divestiture of the film products business in Italy,incentives, partially offset by nondeductible acquisition-related expenses associated with the acquisitionimpact of Terphane by Film Products.adjustments for tax contingency matters. Factors impacting ourthe effective tax rate for 20122014 and 20112013 are further detailed in the effective income tax rate reconciliation provided in Note 17 beginning on page 76.201120102012Revenues.Sales in 20112013 increased by 7.6%8.7% compared with 20102012 due to higher sales in both Film Products and Aluminum Extrusions. Net sales (sales less freight) increased 2.8%1.5% in Film Products primarily due to the acquisition of Terphanehigher volumes, improved product mix and an increase in average selling prices from the pass-through of higher average resin prices, partially offset by lower volume in surface protection films and personal care materials. Net sales increased 20.4% in Aluminum Extrusions due to higher sales volume in most markets and an increase in average selling prices driven by higher aluminum prices.Operating Costs and Expenses. Consolidated gross profit as a percentage of sales was 15.3% in 2011 and 17.0% in 2010. The gross profit margin in Film Products decreased primarily due to lower volumes in personal care materials and surface protection films, partially offset by the estimated favorable impact of the quarterly lag in the pass-through of changes in average resin costs, additional operating profits generated from the acquisition of Terphane, improved manufacturing efficiencies in 2011 and the change in the U.S. dollar value of currencies for operations outside the U.S., partially offset by the negative impact of lower average selling prices. Net sales increased 26.1% in Aluminum Extrusions primarily due to the impact of the acquisition of AACOA, which was acquired on October 1, 2012. For more information on net sales and volume, see the executive summary beginning on page 19.as a resultdue to higher average prices from additional value-added services, the impact of the acquisition of AACOA and lower fixed costs from the shutdown of our manufacturing facility in Kentland, Indiana, partially offset by higher sales volumes noted above.maintenance and production costs. For more information on operating costs and expenses, see the executive summary beginning on page 19.10.2%8.7% in 2011,2013, which decreased from 11.0%9.8% in 2010.2012. The decrease in selling, general and administrative and R&D expenses as a percentage of sales can be primarily attributed to lower depreciation and acquisition-related expenses and the cost reduction efforts in 2011timing of certain legal and lower performance-based incentive accruals, partially offset by higher acquisition-related expenditures in 2011.20112013 totaled $6.8$3.4 million ($0.32.2 million gain after taxes) and included:$2.5$1.5 million ($2.20.9 million after taxes), a third quarter charge of $0.1 million ($62,000 after taxes) and a second quarter charge of $85,000 ($53,000 after taxes) related to expected future environmental costs at the aluminum extrusions manufacturing facility in Newnan, Georgia (included in “Cost of goods sold” in the consolidated statements of income);$2.3$0.2 million ($2.283,000 after taxes) associated with the shutdown of the film products manufacturing facility in Red Springs, North Carolina, which includes severance and other employee related costs of $0.3 million and asset impairments of $0.2 million;acquisition-relatedintegration-related expenses and other non-recurring transactions (included in “Selling, general and administrative expenses” in the consolidated statements of income) associated with the Film Products acquisition of Terphane;AACOA by Aluminum Extrusions; andfourthsecond quarter chargeloss of $0.6 million$91,000 ($0.4 million91,000 after taxes) related to the sale of previously impaired machinery and a second quarter charge of $0.8 million ($0.5 million after taxes) for asset impairments in Film Products;A third quarter gain of $1.0 million ($6.6 million after taxes) onequipment at the divestiture of our film products subsidiarymanufacturing facility in Roccamontepiano, ItalyShanghai, China (included in “Other income (expense), net” in the consolidated statements of income), which includes the recognition.previously unrealized foreign currency translation gainsH.I.G. Capital. All historical results for this business have been reflected as discontinued operations. In 2013, accruals of $4.3$14.0 million that were associated with the business;A fourth quarter charge of $0.7 million ($0.514.0 million after taxes) associated with purchase accounting adjustments made to the value of inventory sold by Film Products after its acquisition of Terphane (included in “Cost of goods sold” in the consolidated statements of income; see discussion that follows for additional detail);A fourth quarter charge of $0.1 million ($39,000 after taxes), a third quarter charge of $0.2 million ($0.1 million after taxes) and a second quarter charge of $0.3 million ($0.2 million after taxes) for severance and other employee-related costs in connection with restructurings in Film Products;A fourth quarter charge of $0.4 million ($0.3 million after taxes) for integration-related expenses (included in “Selling, general and administrative expenses” in the consolidated statements of income) associated with the Film Products acquisition of Terphane; andA fourth quarter benefit of $39,000 ($24,000 after taxes), a third quarter charge of $43,000 ($27,000 after taxes), a second quarter benefit of $0.1 million ($0.1 million after taxes), and a first quarter charge of $32,000 ($20,000 after taxes) for timing differences between the recognition of realized losses on aluminum futures contracts and related revenues from the delayed fulfillment by customers of fixed-price forward purchase commitments (included in “Cost of goods sold” in the consolidated statements of income).Business combination accounting principles under U.S. GAAP require that we adjust the inventory acquired in the acquisition of Terphane to fair value at the date of acquisition. In particular, finished goods inventory acquired was adjusted to reflect the cost of manufacturing plus a portion of the expected profit margin. The acquired inventory was sold in the fourth quarter of 2011. We believe that the adjustment included in “Cost of goods sold” in the fourth quarter of 2011 should be removed by investors as a means to determine profit and margins from ongoing operations, which reflect the operating trends of the acquired business.The results of operations related to Falling Springs (net income of $0.7 million in 2011 and $0.2 million in 2010) have been classified as discontinued operations as a result of our divestiture of Fallings Springs in November 2012. In 2011, an accrual of $4.4 million ($4.4 million after taxes) waswere made for indemnifications under the purchase agreement associated with the 2008 sale of our aluminum extrusions business in Canada. These contractual indemnifications were related to environmental matters associated with our former aluminum extrusions operations in Canada.20112013 include an unrealized gain fromon the write-up of ourCompany’s investment in Intellijectkaléo (included in “Other income (expense), net” in the consolidated statements of $1.6income) of $3.4 million ($1.02.2 million after taxes; see further discussion beginning on page 23)22). An unrealized loss on ourthe Company’s investment in the Harbinger Fund (included in “Other income (expense), net” in the consolidated statements of $0.6income and “Corporate expenses, net” in the statement of net sales and operating profit by0.40.3 million after taxes) was recorded in 20112013 as a result of a reduction in the fair value of ourthe investment that is not expected to be temporary. The Company also recorded an unrealized loss on its investment property in Alleghany and Bath County, Virginia of $1.0 million ($0.6 million after taxes) in the second quarter of 2013 as a result of a reduction in the estimated fair value of the investment that was not expected to be temporary. For more information on costs and expenses, see the executive summary beginning on page 20.$1.0$0.6 million in 2011,2013, compared to $0.7$0.4 million in 2010. Our2012. The Company’s policy permits investment of excess cash in marketable securities that have the highest credit ratings and maturities of less than one year with the primary objectives being safety of principal and liquidity.$1.9$2.9 million in 2011,2013, compared to $1.1$3.6 million for 2010. In October 2011, we borrowed $125 million2012. Interest expense was lower in 2013 as a result of a decrease in the average interest rate on borrowings under ourthe Company’s revolving credit agreement to help fund the acquisition of Terphane.facility. Average debt outstanding and interest rates were as follows: 2011 2010 $ 23.6 $ — 2.3 % n/a $ 0.3 $ 0.9 4.3 % 4.0 % $ 23.9 $ 0.9 2.3 % 4.0 % (In Millions) 2013 2012 Floating-rate debt with interest charged on a rollover basis at one-month LIBOR plus a credit spread: Average outstanding debt balance $ 133.5 $ 112.1 Average interest rate 1.9 % 2.1 % Fixed-rate and other debt: Average outstanding debt balance $ — $ — Average interest rate n/a n/a Total debt: Average outstanding debt balance $ 133.5 $ 112.1 Average interest rate 1.9 % 2.1 % was 26.4%increased in 20112013 compared with 33.7% in 2010 primarily asto 2012 due to a result of the recognition of estimated tax benefits related to the 2011 divestiture of our film products subsidiary in Italy, partially offset by the effect on income taxes from the reduction in 2010 of the estimated value of a dividend receivedbenefit from a foreign subsidiary and the impact of non-deductible acquisition-related expenses in 2011 associated with the acquisition of Terphane by Film Products.tax incentives. Factors impacting ourthe effective tax rate for 20112013 and 20102012 are further detailed in the effective income tax rate reconciliation provided in Note 17 beginning on page 76. The impact of the change in the estimated value of a dividend received from a foreign subsidiary is reflected in “Changes in estimates related to prior year tax provision” in the effective income tax rate reconciliation.20112013 to December 31, 20122014 are summarized below:$2.5$14.1 million (2.5%(14.2%).decreasedincreased by $6.8$5.1 million due mainly to the timing of cash receipts.the addition of balances from the acquisition of AACOAhigher sales. DSO was approximately 45.3 days in 2014 and the timing of cash receipts.Other receivables increased47.1 days in corporate by approximately $0.3 million due to contractual amounts due from Arc Ventures, LC from the sale of Falling Springs.$13.4$3.6 million (21.8%(5.2%).$7.9$0.8 million primarily due to the timing of shipments.$5.5$2.8 million primarily due toas a result of new capacity at the addition of balances from the acquisition of AACOA.$3.8$12.6 million (1.5%(4.5%) due primarily to depreciation of $43.5$35.4 million and a change in the value of the U.S. dollar relative to foreign currencies (a decrease of approximately $6.0$17.6 million) and asset impairments and property disposals of approximately $2.7 million,, partially offset by capital expenditures of $33.3 million and property and equipment added from the acquisition of AACOA of $15.1$44.9 million.increaseddecreased by $17.7$11.2 million (7.9%(4.9%) primarily due to balances added from the acquisition of AACOA, partially offset by amortization expense of $5.8$5.4 million and changes in the value of the U.S. dollar relative to foreign currencies (decrease of approximately $5.4 million). Identifiable intangible assets and goodwill associated with the acquisition were $14.6 million and $14.3 million, respectively.$9.2$11.3 million (12.6%(13.7%).$2.2$2.5 million primarily due to the timing of payments.$7.3$9.0 million, primarily due to the addition ofhigher inventory balances from the acquisition of AACOA and the timing of payments.Accounts payable decreased DPO was approximately 48.0 days in corporate by $0.3 million due to the normal volatility associated with the timing of payments.increaseddecreased by $1.6$10.1 million (4.0%(24.0%) from December 31, 2011 primarily due2013. The decrease is related to various factors, including lower accruals for contractual indemnifications associated with the additionsale of balances from the acquisitionCompany’s aluminum extrusions business in Canada, lower accruals for performance incentives and other employee benefits and the timing of AACOA.$25.7$58.4 million (35.8%(105.3%) due primarily to the change in the funded status of ourthe Company’s defined benefit plans. As of December 31, 2012,2014, the funded status of ourthe defined benefit pension plan was a net liability of $83.3$96.4 million compared with $57.8$42.5 million as of December 31, 2011,2013, and the liability associated with ourthe other post-employment benefits plan was $8.9 million as of December 31, 2012 compared to $8.4 million as of December 31, 2011.increaseddecreased by $8.5$34.8 million primarily due to numerous changes between years in the balance of the components shown in the December 31, 20122014 and 20112013 schedule of deferred income tax assets and liabilities provided in Note 17 beginning on page 76. Income taxes recoverable increased by $0.3The Company had an income tax receivable of $0.9 million at December 31, 2014 compared to a payable of $0.1 million at December 31, 2013. The change is primarily due to the timing of tax payments.ourthe Company’s revolving credit agreement as of December 31, 20122014 were as follows:Net Capitalization and Indebtedness as of December 31, 2012 $ 48,822 128,000 — 128,000 79,178 372,252 $ 451,430 $ 128,000 4,532 156 $ 132,688 Net Capitalization and Indebtedness as of December 31, 2014 Net capitalization: Cash and cash equivalents $ 50,056 Debt: $350 million revolving credit agreement maturing April 23, 2017 137,250 Other debt — Total debt 137,250 Debt net of cash and cash equivalents 87,194 Shareholders’ equity 372,029 Net capitalization $ 459,223 Indebtedness as defined in revolving credit agreement: Total debt $ 137,250 Face value of letters of credit 2,884 Other 230 Indebtedness $ 140,364 $199$155 million was available to borrow at December 31, 20122014 based on the most restrictive covenants. The credit spread and commitment fees charged on the unused amount under the revolving credit agreement at various indebtedness-to-adjusted EBITDA levels are as follows:
EBITDA Ratio Credit Spread
Over LIBOR Commitment
Fee 200 35 175 30 150 25 Pricing Under Revolving Credit Agreement (Basis Points) Indebtedness-to-Adjusted EBITDA Ratio > 2.0x but <= 3.0x 200 35 > 1.0x but <=2.0x 175 30 <= 1.0x 150 25 2012,2014, the interest rate on debt borrowed under the revolving credit agreement was priced at one-month LIBOR plus the applicable credit spread of 150175 basis points. Market exposure related to changes in one-month LIBOR (assuming that the applicable credit spread remains at 150175 basis points) would not be material to ourthe consolidated financial results.wethe Company be unable to obtain a waiver from the lenders. Renegotiation of the covenant(s) through an amendment to the credit agreement may effectively cure the noncompliance, but may have an effect on financial condition or liquidity depending upon how the amended covenant is renegotiated.Computations of Adjusted EBITDA, Adjusted EBIT, Leverage Ratio andInterest Coverage Ratio as Defined in the Credit Agreement Along with Related MostRestrictive CovenantsAs of and for the Twelve Months Ended December Computations of Adjusted EBITDA, Adjusted EBIT, Leverage Ratio and Interest Coverage Ratio as Defined in the Credit Agreement Along with Related Most Restrictive Covenants As of and for the Twelve Months Ended December 31, 2014 (In Thousands) Computations of adjusted EBITDA and adjusted EBIT as defined in revolving credit agreement for the twelve months ended December 31, 2014: Net income $ 36,879 Plus: After-tax losses related to discontinued operations — Total income tax expense for continuing operations 9,387 Interest expense 2,713 Depreciation and amortization expense for continuing operations 40,818 All non-cash losses and expenses, plus cash losses and expenses not to exceed $10,000, for continuing operations that are classified as unusual, extraordinary or which are related to plant shutdowns, asset impairments and/or restructurings (cash-related of $10,000) 10,993 Charges related to stock option grants and awards accounted for under the fair value-based method 1,272 Losses related to the application of the equity method of accounting — Losses related to adjustments in the estimated fair value of assets accounted for under the fair value method of accounting — Minus: After-tax income related to discontinued operations (850 ) Total income tax benefits for continuing operations — Interest income (588 ) All non-cash gains and income, plus cash gains and income in excess of $10,000, for continuing operations that are classified as unusual, extraordinary or which are related to plant shutdowns, asset impairments and/or restructurings — Income related to changes in estimates for stock option grants and awards accounted for under the fair value-based method — Income related to the application of the equity method of accounting — Income related to adjustments in the estimated fair value of assets accounted for under the fair value method of accounting (2,000 ) Plus cash dividends declared on investments accounted for under the equity method of accounting — Plus or minus, as applicable, pro forma EBITDA adjustments associated with acquisitions and asset dispositions — Adjusted EBITDA as defined in revolving credit agreement 98,624 Less: Depreciation and amortization expense for continuing operations (including pro forma for acquisitions and asset dispositions) (40,818 ) Adjusted EBIT as defined in revolving credit agreement $ 57,806 Shareholders’ equity at December 31, 2014 as defined in revolving credit agreement $ 384,938 Computations of leverage and interest coverage ratios as defined in revolving credit agreement at December 31, 2014: Leverage ratio (indebtedness-to-adjusted EBITDA) 1.42x Interest coverage ratio (adjusted EBIT-to-interest expense) 21.31x Most restrictive covenants as defined in revolving credit agreement: Maximum permitted aggregate amount of dividends that can be paid by Tredegar during the term of the revolving credit agreement ($100,000 plus 50% of net income generated beginning January 1, 2012) $ 143,539 Minimum adjusted shareholders’ equity permitted ($320,000 plus 50% of net income generated, to the extent positive, beginning January 1, 2012) $ 363,539 Maximum leverage ratio permitted: 3.00x Minimum interest coverage ratio permitted 2.50x 2012 (In Thousands) $ 28,251 14,934 18,319 3,590 49,259 6,379 1,432 — — — — (418 ) (1,514 ) — — (16,100 ) — 6,339 110,471 (52,184 ) $ 58,287 385,051 1.20x 16.24x $ 114,126 $ 334,126 3.00x 2.50x We are Payments Due by Period 2013 2014 2015 2016 2017 Remainder Total $ — $ — $ — $ — $ 128.0 $ — $ 128.0 2.6 2.6 2.6 2.6 .8 — 11.2 .2 6.4 10.8 11.8 9.1 7.7 46.0 .5 .5 .5 .5 .5 6.4 8.9 16.4 — — — — — 16.4 2.1 2.0 1.3 1.2 1.2 1.1 8.9 4.6 3.0 — — — — 7.6 — — — — — 1.0 1.0 1.6 1.2 1.4 — — — 4.2 $ 28.0 $ 15.7 $ 16.6 $ 16.1 $ 139.6 $ 16.2 $ 232.2 Payments Due by Period (In Millions) 2015 2016 2017 2018 2019 Remainder Total Debt: Principal payments $ — $ — $ 137.3 $ — $ — $ — $ 137.3 Estimated interest expense 2.7 2.7 0.8 — — — 6.2 Defined benefit plans 2.4 5.9 5.0 12.2 11.8 50.6 87.9 Other postretirement benefits 0.5 0.5 0.5 0.5 0.5 5.9 8.4 Capital expenditure commitments 4.9 — — — — — 4.9 Operating leases 2.4 1.9 1.9 1.8 0.7 1.3 10.0 — — — — — 2.8 2.8 1.8 0.3 — — — — 2.1 Total $ 14.7 $ 11.3 $ 145.5 $ 14.5 $ 13.0 $ 60.6 $ 259.6 (1) Estimated minimum required contributions for defined benefit plans and benefit payments for other postretirement plans are based on actuarial estimates using current assumptions for discount rates, long-term rate of return on plan assets, rate of compensation increases and health care cost trends. The expected defined benefit plan contribution estimates for 20132015 through 20222024 were determined under provisions of the Pension Protection Act of 2006 using the preliminary assumptions chosen by Tredegar for the 20132015 plan year. Tredegar has determined that it is not practicable to present defined benefit contributions and other postretirement benefit payments beyond 2022.2024.(2)Represents contractual obligations for plant construction and purchases of real property and equipment. In February 2012, Film Products signed contracts associated with our multi-year capacity expansion project in Brazil that resulted in future contractual commitments of approximately $14 million in 2013.(3)(2)Amounts for which reasonable estimates about the timing of payments cannot be made are included in the remainder column. (4)(3) Includes contractual severance, the expected contingent earnout from ourthe purchase of the assets of Bright View, and other miscellaneous contractual arrangements.We believe that existing borrowing availability, our current cash balances and our cash flow from operations will be sufficient to satisfy our working capital, capital expenditure and dividend requirements for the foreseeable future. At December 31, 2012, we had cash and cash equivalents of $48.8 million, including funds held in locations outside the U.S. of $28.6 million. We accrue U.S. federal income taxes on unremitted earnings of all foreign subsidiaries except Terphane Ltda. (a subsidiary of Film Products). Deferred U.S. federal income taxes have not been provided on the undistributed earnings for Terphane Ltda. because of our intent to permanently reinvest these earnings. The cumulative amount of untaxed earnings was $23.0 million at December 31, 2012.we enterthe Company enters into transactions with third parties in connection with the sale of assets or businesses in which we agreeit agrees to indemnify the buyers or third parties involved in the transaction, or the sellers or third parties involved in the transaction agree to indemnify us,Tredegar, for certain liabilities or risks related to the assets or business. Also, in the ordinary course of our business, wethe Company may enter into agreements with third parties for the sale of goods or services that may contain indemnification provisions. In the event that an indemnification claim is asserted, liability for indemnification would be subject to an assessment of the underlying facts and circumstances under the terms of the applicable agreement. Further, any indemnification payments may be limited or barred by a monetary cap, a time limitation, or a deductible or basket. For these reasons, we arethe Company is unable to estimate the maximum potential amount of the potential future liability under the indemnity provisions of these agreements. We do,Tredegar does, however, accrue for losses for any known contingent liability, including those that may arise from indemnification provisions, when future payment is probable and the amount is reasonably estimable. We discloseThe Company discloses contingent liabilities if the probability of loss is reasonably possible and material.Shareholders’ Equity2012, we2014, Tredegar had 32,069,370cash and cash equivalents of $50.1 million, including funds held in locations outside the U.S. of $40.5 million. The Company accrues U.S. federal income taxes to the extent permitted under U.S. GAAP on unremitted earnings of all foreign subsidiaries except Terphane Ltda. (a subsidiary of Film Products). Deferred U.S. federal income taxes have not been provided on the undistributed earnings for Terphane Ltda. because of the Company’s intent to permanently reinvest these earnings. Because of the accumulation of significant losses related to foreign currency translations at Terphane Ltda., there were no unrecorded deferred tax liabilities at December 31, 2014 associated with the U.S. federal income taxes and foreign withholding taxes on undistributed earnings indefinitely invested outside the U.S. The Company believes that existing borrowing availability, current cash balances and cash flow from operations will be sufficient to satisfy working capital, capital expenditure and dividend requirements for at least the next twelve months.$654.9$729.2 million, compared with 32,057,28132,305,145 shares of common stock outstanding and a total market capitalization of $712.3$930.7 million at December 31, 2011.We2013.ourthe divestiture of Falling Springs.We Tredegar did not repurchase any shares on the open market in 2014, 2013 or 2012 or 2011 under ourits approved share repurchase program.49.48. Cash flows for discontinued operations have not been separately disclosed in the consolidated statements of cash flows.$82.6$51.2 million in 20122014 compared with $71.8$76.7 million in 2011.2013. The increasedecrease is due primarily to normal volatility of working capital components (see the assets and liabilities section beginning on page 2928 for discussion of changes in working capital).2012 compared with $195.2 million2012. Cash used in 2011.investing activities in 2013 primarily consists of capital expenditures ($79.7 million). Cash used in investing activities in 2012 primarily includesconsists of the acquisition of AACOA ($54.6 million) and capital expenditures ($33.3 million), partially offset by net cash proceeds received from the sale of Falling Springs ($12.1 million).inby financing activities was $26.7$5.3 million in 2012,2013, which is primarily due to the one-time dividend of $24.0 million in December 2012 andnet borrowings on the payment of regular quarterly dividends of $6.8 million (4 1/2 cents per share per quarter in the first and second quarters and 6 cents per share in the third and fourth quarters). Net borrowings against ourCompany’s revolving credit facility were $3.0of $11.0 million in 2012.Cash provided by operating activities was $71.8 million in 2011 compared with $46.4 million in 2010. The increase is due primarily to normal volatilityand the proceeds from the exercise of working capital components.Cash used in investing activities was $195.2 million in 2011 compared with $22.2 million in 2010. Cash used in investing activities in 2011 primarily includes the purchase of Terphane ($181.0 million)stock options and capital expenditures ($15.9 million).Net cash flow provided inother financing activities was $120.4of approximately $3.3 million, in 2011, which is primarily due to borrowings of $125 million to fund the purchase of Terphane, partially offset by the payment of regular quarterly dividends of $5.8$9.0 million (4 1/2(28 cents per share per quarter)share).polypropylenepolyester resin prices, Terephtalic Acid (“PTA”) and Monoethylene Glycol (“MEG”) prices, aluminum ingot and scrap prices, energy prices, foreign currencies and emerging markets. See the assets and liabilities section beginning on page 2928 regarding interest rate exposures related to borrowings under the revolving credit agreement.ourits casting furnaces). There is no assurance of ourthe Company’s ability to pass through higher raw material and energy costs to ourits customers.2019 and the business segment review beginning on page 3837 for discussion regarding the impact of the lag in the pass-through of resin price changes.Film Products)polyethylene film products) is shown in the chart below.
Resinbelow: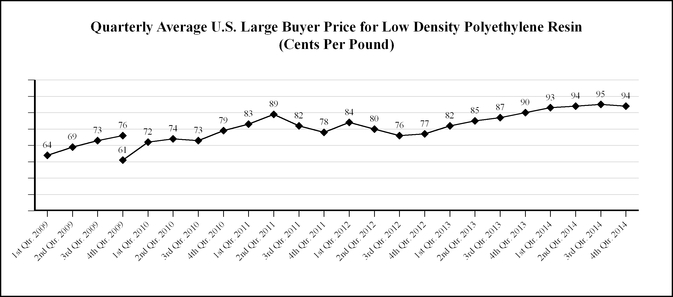
Source: Quarterly averages computed by Tredegar using monthly data provided by Chemical Data Inc. (“CDI”). In January 2010, CDI reflected a 15 cents per pound non-market adjustment based on their estimate of the growth of discounts over the 2005 to 2009 period. The 4th quarter 2009 average rate of 61 cents per pound is shown on a pro forma basis as if the non-market adjustment was made in October 2009. 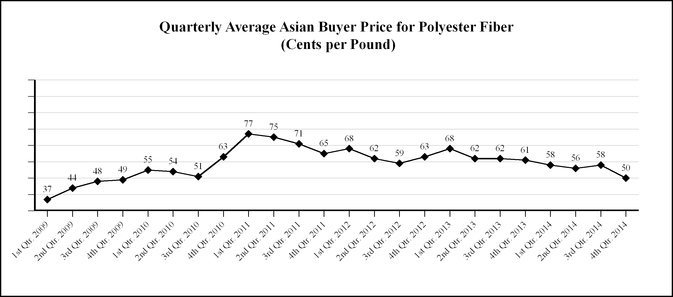
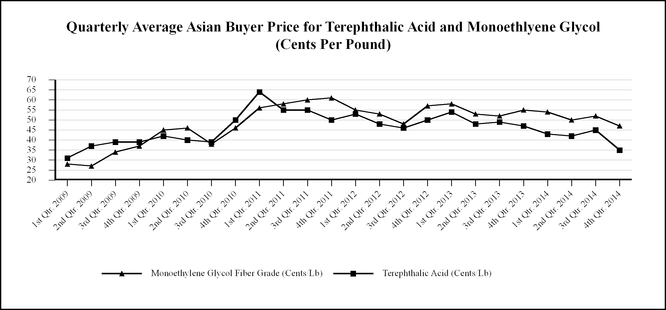
Source: Quarterly averages computed by Tredegar using monthly data from CMAI Global Index data. 2019 and the business segment review on page 3837 for more information). Pricing on the remainder of ourthe Film Products business is based upon raw material costs and supply/supply and demand dynamics within the markets that we compete.The volatility of average quarterly prices of PTA and MEG (raw materials for Film Products) is shown in the chart below:
we enterAluminum Extrusions enters into fixed-price forward sales contracts with certain customers for the sale of fixed quantities of aluminum extrusions at scheduled intervals. In order to hedge ourits exposure to aluminum price volatility (see the chart below) under these fixed-price arrangements, which generally have a duration of not more than 12 months, we enterthe Company enters into a combination of forward purchase commitments and futures contracts to acquire or hedge aluminum, based on the scheduled deliveries. See Note 9 beginning on page 65 for more information. The volatility of quarterly average aluminum prices is shown in the chart below.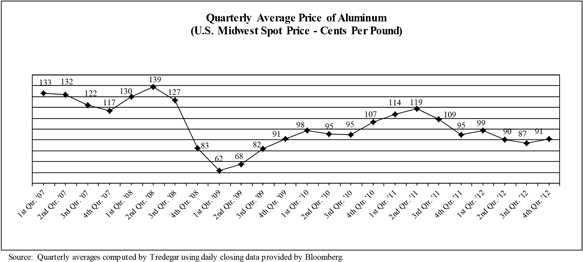
Inbelow: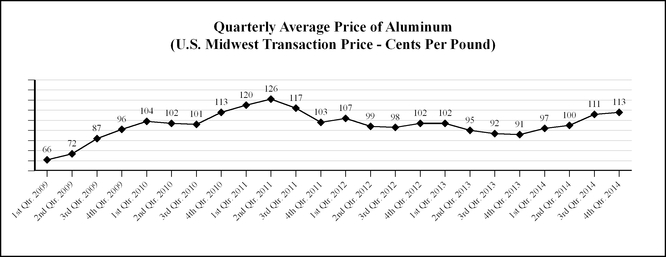
Source: Quarterly averages computed by Tredegar using daily Midwest average prices provided by Platts. we hedge from time-to-timehedges a portion of ourits exposure to natural gas price volatility by entering into fixed-price forward purchase contracts with ourits natural gas suppliers. We estimateThe Company estimates that, in an unhedged situation, every $1 per mmBtu per month change in the market price of natural gas has a $75,000an $85,000 impact on the continuing monthly operating profit for our U.S. operations in Aluminum Extrusions. We haveThere is an energy surcharge for our aluminum extrusions businessAluminum Extrusions in the U.S. that is applied when the previous quarter’s NYMEX natural gas average settlement price is in excess of $8.85 per mmBtu. The volatility of quarterly average natural gas prices is shown in the chart below.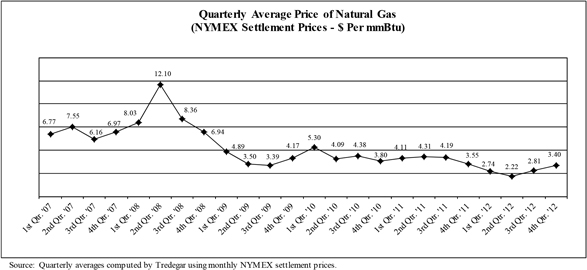
We sellbelow: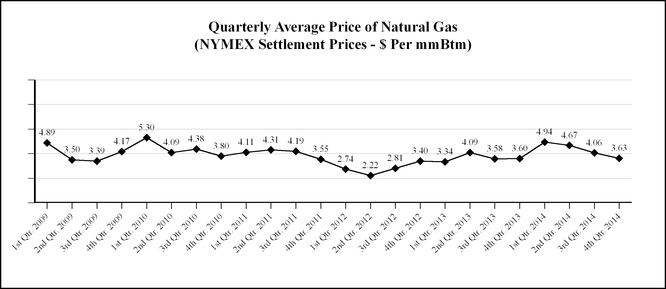
Source: Quarterly averages computed by Tredegar using monthly NYMEX settlement prices. ourits foreign operations and through exports from U.S. plants. The percentage of sales and total assets for ongoingcontinuing operations related to foreign markets for 2012, 20112014, 2013 and 20102012 are as follows:Tredegar Corporation—Continuing Ongoing OperationsPercentage of Net Sales and Total Assets Related to Foreign Markets 2012 2011 2010 % of Total % Total
Assets -
Foreign
Oper-
ations * % of Total % Total
Assets -
Foreign
Oper-
ations * % of Total % Total
Assets -
Foreign
Oper-
ations * Net Sales * Net Sales * Net Sales * Exports
From
U.S. Foreign
Oper-
ations Exports
From
U.S. Foreign
Oper-
ations Exports
From
U.S. Foreign
Oper-
ations 5 — — 6 — — 7 — — 1 13 7 1 16 7 1 16 15 — 14 23 1 6 24 — 3 2 7 4 4 7 4 4 10 5 7 13 31 34 15 26 35 18 24 24 2014 2013 2012 % of Total % of Total % of Total Net Sales * Net Sales * Net Sales * Canada 5 — — 5 — — 5 — — Europe 1 12 5 1 12 6 1 13 7 Latin America — 11 27 — 12 24 — 14 23 Asia 8 4 4 9 4 4 7 4 4 Total % exposure to foreign markets 14 27 36 15 28 34 13 31 34 * The percentages for foreign markets are relative to Tredegar’s total net sales and total assets from ongoing operations(consolidated net sales and total assets from continuing operations excluding cash and cash equivalents).operations.We attemptourits products in the same currency and generally view the volatility of foreign currencies (see trends for the Euro, Brazilian Real and Chinese Yuan in the chart below)on page 37) and emerging markets, and the corresponding impact on earnings and cash flow, as part of the overall risk of operating in a global environment. Exports from the U.S. are generally denominated in U.S. Dollars. OurThe Company’s foreign currency exposure on income from continuing foreign operations relates to the Euro, the Chinese Yuan, the Hungarian Forint, the Brazilian Real and the Indian Rupee.In Film Products, where we are primarily able to match the currency of our sales and costs, we estimate that the change in value of foreign currencies relative to the U.S. Dollar had a negative impact on operating profit from ongoing operations of approximately $1.4 million in 2012 compared to 2011, a positive impact on operating profit from ongoing operations of approximately $1.8 million in 2011 compared with 2010, a negative impact of approximately $1.3 million in 2010 compared with 2009.we price ourFilm Products prices its products in U.S. Dollars, and key raw materials are also priced in U.S. Dollars. However, certain production costs, such as conversion costs and other fixed costs, are priced in Brazilian Real, which exposes our operating margins to some currency exposure. In general, when the U.S. Dollar is strengthening versus the Brazilian Real, operating results will benefit from relatively lower costs, and when the U.S. Dollar is weakening
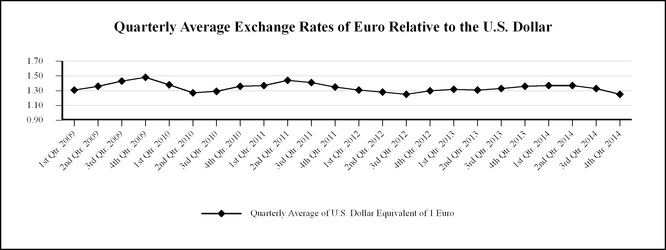
Source: Quarterly averages computed by Tredegar using daily closing data provided by Bloomberg. 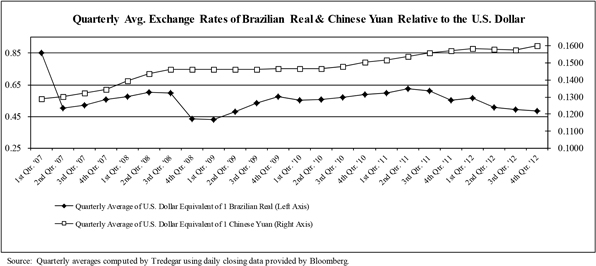
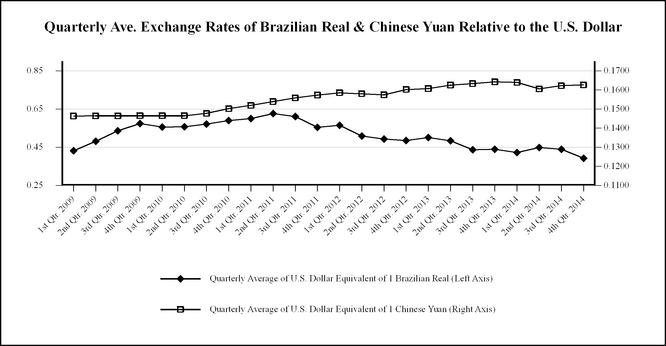
Source: Quarterly averages computed by Tredegar using daily closing data provided by Bloomberg. 2019 for the discussion of net sales (sales less freight) in Film Products in 20122014 compared with 2011.2013.$535.5$621.2 million in 2011,2013, an increase of 2.8%1.5% from $520.7$611.9 million in 2010.2012. Volume decreasedincreased to 218.7270.5 million pounds in 20112013 from 221.2270.3 million pounds in 2010.2012. Net sales in 20112013 increased compared to 20102012 primarily due to the acquisition of Terphanehigher volumes, improved product mix and an increase in average selling prices from the pass-through of higher average resin prices, partially offset by lower volume in surface protection films and personal care materials.The slowdown in end-user demand for large-sized LCD panels, particularly in the high-end segment, negatively impacted the volumes of our surface protection films. In addition, reduced consumer demand for applications that utilize our premium personal care films also contributed to the reduction in sales volume. Terphane generated net sales of $28.3 million subsequent to its acquisition in October 2011.Operating Profit. See the executive summary beginning on page 20 for the discussion of operating profit in Film Products in 2012 compared with 2011.Operating profit from ongoing operations was $59.5 million in 2011, a decrease of 10.8% compared with $66.7 million in 2010. Operating profit from ongoing operations decreased in 2011 compared to 2010 due to the lower sales volumes in surface protection materials and personal care films. The impact of lower volumes was partially offset by a reduction in the unfavorable impact of the lag in the pass-through of higher resin costs, additional operating profits generated by the acquisition of Terphane, cost reduction efforts and improved manufacturing efficiencies in 2011, and favorable changeschange in the U.S. dollar value of currencies for operations outside the U.S., partially offset by the negative impact of lower average selling prices. Higher sales volumes and improved product mix in Film Products had a favorable impact of approximately $14.5 million in 2013 compared to 2012. Higher volumes in surface protection films and personal care materials were partially offset by lower volumes in flexible packaging films, polyethylene overwrap films and films for other markets. The estimated change in average selling prices, net of cost pass-throughs, had an unfavorable impact on net sales of $6.6 million. Average selling prices decreased primarily due to competitive pressures in flexible packaging and polyethylene overwrap films, partially offset by the favorable impact of the lagcontractual pass-through of certain costs, such as higher average resin prices. The change in the pass-through of changes in average resin costs was a negative $0.8 million in 2011 and a negative $6.4 million in 2010. The estimated favorable impact from U.S. dollar value of currencies for operations outside the U.S. was $1.8had a favorable impact on net sales of approximately $1.7 million in 20112013 compared to 2012.2010. Terphane2013.$3.0lower depreciation and the timing of legal expenses.acquisition date through December 31, 2011, which included $0.9quarterly lag in the pass-through of average resin costs was approximately a negative $2.1 million of amortization expense and $0.9in 2013 compared to a negative $0.5 million of one-time reimbursementsin 2012. The net impact on operating profit from ongoing operations for customs duties.$551.8$546.2 million at December 31, 2012,2014, from $574.6$556.9 million at December 31, 2011,2013, primarily due primarily to the depreciation oflower property, plant and equipment and amortizationintangible asset balances as a result of identifiable intangible assets,changes in the value of the U.S. dollar relative to foreign currencies, partially offset by current year capital expenditures. See the assets and liabilities section beginning on page 29 for further discussion on changes in assets and liabilities.$574.6$556.9 million at December 31, 2011,2013, from $368.9$551.8 million at December 31, 2010,2012, primarily due to higher property, plant and equipment balances as a result of higher current year capital expenditures, partially offset by lower intangible asset balances, primarily due to current year amortization expense and the acquisitionchange in the U.S. dollar value of Terphane.2012, $36.3 million in 2011 and $34.4 million in 2010. The increase in depreciation2012. Depreciation and amortization expense decreased in 2012 compared with 2011 is primarily related to the acquisition of Terphane ($10.2 million in 20122014 compared to $2.1 million2013 and in 2011), partially offset by lower depreciation expense2013 compared to 2012 as certain assets becomingbecame fully depreciated. The increase in depreciation and amortization in 2011 compared to 2010 is related to the acquisition of Terphane. We estimateCompany estimates depreciation and amortization expense for Film Products will be approximately $37$31 million in 2013.2015 as additional depreciation from recent capacity expansion projects will be offset by reductions from certain assets becoming fully depreciated.2012, $13.1 million in 2011 and $15.8 million in 2010.2012. Capital expenditures in 2014, 2013 and 2012 include approximately $19.6$17 million, $41 million and $20 million, respectively, for the project to expand capacity at ourthe manufacturing facility in Cabo de Santo Agosthino, Brazil. Capital expenditures in 2011 primarily included the normal replacement of machinery2014 also include capacity expansion projects in China, Brazil and equipment.India. Capital expenditures in 2010 included the construction of our new manufacturing facility in India as well as capital spending to support growth initiatives. Capital expenditures in 20132015 are estimated to be approximately $80$31 million, which includes approximately $49$15 million infor routine capital expenditures for a project that will expand capacity at our manufacturing facility in Cabo de Santo Agosthino, Brazil.2019 for the discussion of net sales (sales less freight) and operating profit from ongoing operations of Aluminum Extrusions in 20122014 compared with 2011.2013.$240.4$309.5 million in 2011,2013, an increase of 20.4%26.1% from $199.6$245.5 million in 2010. 2012. The increase in net sales can be primarily attributed to the addition of AACOA, which was acquired on October 1, 2012. Net sales associated with AACOA were $88.1 million in 2013 compared to $19.5 million subsequent to the acquisition in 2012. Excluding the impact of its acquisition of AACOA and the shutdown of the manufacturing facility in Kentland, Indiana, volume was relatively flat in 2013. More than half of the volume that was produced at the Kentland manufacturing facility has been transferred to Aluminum Extrusions’ remaining facilities.$3.5$18.3 million in 2013, a positive change of $7.7$9.3 million from operating lossesprofit from ongoing operations of $4.2$9.0 million in 2010. Volume was 108.0 million pounds in 2011 compared to 94.9 million pounds in 2010.The increase in net sales was due to higher volumes and an increase in average selling prices driven by higher average aluminum costs. Sales volume increased 13.8% in 2011 compared to 2010 as we developed new customer opportunities and were able to support key customers who continue to demonstrate strength in a difficult business environment. The improvement in results2012. Operating profit from ongoing operations increased primarily as a result of the addition of AACOA and cost savings associated with the 2012 shutdown of the Kentland manufacturing facility. The impact on operating profit from ongoing operations directly attributable to the acquisition of AACOA, including synergies, was approximately $4.8 million in 2011 reflects2013. The shutdown of the Kentland manufacturing facility had a favorable impact on operating profit from ongoing operations of approximately $2.3 million in 2013 compared to 2012.volumes.2012, $78.7 million at December 31, 2011 and $81.7 million at December 31, 2010. The increase2012. Identifiable assets increased in identifiable assets between December 31, 2011 and December 31, 2012 can be primarily attributed to the acquisition of AACOA. The decrease of $3.0 million at the end of 20112014 compared to 2010 is mainly2013 primarily due to depreciationhigher accounts receivable balances as a result of higher sales in 2014. Identifiable assets increased in 2013 compared to 2012 primarily due to higher property, plant and equipment and lowerbalances as a result of higher current year capital expenditures in 2011.expenditures.2012, $8.32014, $9.2 million in 20112013 and $9.1$10.0 million in 2010. The increase2012. Depreciation expense increased in 2014 versus 2013 primarily due to recent capital expenditures. Depreciation expense decreased in 2013 versus 2012 comparedprimarily due to 2011 is primarily attributed to approximately $2.4 million in accelerated depreciation on property, plant and equipment associated with shutdown ofat the Kentland manufacturing facility and impact of the acquisition of AACOA ($1.0approximately $2.4 million in additional depreciation and amortization expense in the fourth quarter of 2012), partially offset by certain assets becoming fully depreciated and lower than normal capital expenditures in 2012, 2011 and the second half of 2010.2012. The decrease between 2011 compared to 2010 is primarily attributed to certain assets becoming fully depreciated and lower than normal capital expenditures in 2011 and the second half of 2010. We estimateCompany estimates depreciation and amortization expense for Aluminum Extrusions to be approximately $8.5$10 million in 2013.2015.2012, $2.7 million in 2011 and $4.3 million in 2010.2012. Capital expenditures are estimated to bein 2014 and 2013 include approximately $19$2.8 million in 2013, which includes approximately $15and $11.5 million, respectively, for an 18-montha project that will expand ouradded capacity at the manufacturing facility in Newnan, Georgia. This additional capacity will primarily serveserves the automotive industry. Capital expenditures are estimated to be approximately $10 million in 2015, which includes approximately $5 million for routine capital expenditures required to support operations.Item 7A. QUANTITATIVE AND QUALITATIVE DISCLOSURES ABOUT MARKET RISK 3433 in Management’s Discussion and Analysis of Financial Condition and Results of Operations.Item 8. FINANCIAL STATEMENTS AND SUPPLEMENTARY DATA Item 9. CHANGES IN AND DISAGREEMENTS WITH ACCOUNTANTS ON ACCOUNTING AND FINANCIAL DISCLOSURE Item 9A. CONTROLS AND PROCEDURES weTredegar carried out an evaluation, with the participation of ourits management, including ourits principal executive officer and principal financial officer, of the effectiveness of our disclosure controls and procedures (as defined under Rule 13a-15(e) under the Exchange Act) as of the end of the period covered by this report. Based upon that evaluation, ourthe principal executive officer and principal financial officer concluded that ourthe Company’s disclosure controls and procedures are effective to ensure that information required to be disclosed by usTredegar in the reports that we fileit files or submitsubmits under the Exchange Act, is recorded, processed, summarized and reported, within the time periods specified in the SEC’s rules and forms, and that such information is accumulated and communicated to our management, including ourthe principal executive officer and principal financial officer, as appropriate, to allow timely decisions regarding required disclosure.Ourto Tredegar’s management and board of directors regarding the reliability of financial reporting and the preparation and fair presentation of published financial statements in accordance with U.S. generally accepted accounting principles and includes policies and procedures that:mayis not preventintended to provide absolute assurance that a misstatement of the Company’s consolidated financial statements would be prevented or detect misstatements.detected. Also, projections of any evaluation of effectiveness to future periods are subject to the risk that controls may become inadequate because of changes in conditions, or that the degree of compliance with the policies or procedures may deteriorate.Control—Control - Integrated Framework 2013 issued by the Committee of Sponsoring Organizations of the Treadway Commission. In conducting its assessment of the effectiveness of our internal controls over financial reporting, management excluded its acquisition of AACOA, Inc., which was acquired by Tredegar on October 1, 2012 and is included in Tredegar’s 2012 consolidated financial statements and constituted less than 8% of consolidated total assets and less than 3% of consolidated total sales for the year then ended.Commission (“COSO”). Based on theirthis evaluation under the framework inInternal Control — Integrated Framework 2013, ourTredegar’s management concluded that ourthe Company’s internal control over financial reporting was effective as of December 31, 2012.2014.ourTredegar’s internal control over financial reporting as of December 31, 20122014 has been audited by PricewaterhouseCoopers LLP, an independent registered public accounting firm, as stated in their report which is included on page 45.ourTredegar’s internal control over financial reporting during the quarter ended December 31, 2012,2014, that has materially affected, or is reasonably likely to materially affect, ourits internal control over financial reporting.Item 9B. OTHER INFORMATION Item 10. DIRECTORS, EXECUTIVE OFFICERS AND CORPORATE GOVERNANCE ourthe Proxy Statement under the headings “Election of Directors” and “Tredegar’s Board of Directors” is incorporated herein by reference.ourthe Company’s executive officers: Age 55 53 President and Chief Executive Officer Duncan A. Crowdis 61 60President, The William L. Bonnell Company, Inc. and Corporate Vice PresidentMary Jane Hellyar59 President, Tredegar Film Products Corporation and Corporate Vice President 46 44 Vice President, General Counsel and Corporate Secretary 56 54 Vice President, Chief Financial Officer and Treasurer Larry J. Scott62Vice President, AuditFilmsFilm Products Corporation and Executive Vice President. She was elected Executive Vice President effective January 1, 2009. She was elected President of Tredegar Film Products Corporation effective April 5, 2005. She was elected Senior Vice President effective November 1, 2004. Ms. Taylor served as Senior Vice President, Strategy and Special Projects from November 1, 2004 until April 5, 2005.Duncan A. Crowdis.As the Company has previously announced, Mr. Crowdis intends to retire effective June 1, 2013. Mr. Crowdis was elected Vice President of the Company effective January 1, 2009. Mr. Crowdis was elected President of The William L. Bonnell Company, Inc. on June 13, 2005, and continues to serve in such capacity. Mr. Crowdis served as Plant Manager of The William L. Bonnell Company, Inc. from March 2005 until June 2005. He previously served as Chief Process Officer of The William L. Bonnell Company, Inc. from December 2002 until March 2005.2008, the date that he joined Tredegar.2008. From October 2005 until October 2008, he served as General Counsel at Hilb Rogal & Hobbs Company. Mr. King was Vice President and Assistant Secretary for Hilb Rogal & Hobbs Company from October 2001 to October 2008. He served as Associate General Counsel for Hilb Rogal & Hobbs Company from October 2001 to October 2005.Larry J. Scott. Mr. Scott was elected Vice President, Audit, on May 24, 2000.We haveTredegar has adopted a Code of Conduct that applies to all of ourits directors, officers and employees (including ourits chief executive officer, chief financial officer and principal accounting officer) and have posted the Code of Conduct on ourits website. All amendments to or waivers from any provision of ourthe Company’s Code of Conduct applicable to the chief executive officer, chief financial officer and principal accounting officer will be disclosed on ourthe Company’s website. OurThe Internet address iswww.tredegar.com. The information on or that can be accessed through ourTredegar’s website is not, and shall not be deemed to be, a part of this report or incorporated into other filings we makethe Company makes with the SEC.Item 11. EXECUTIVE COMPENSATION Item 12. 2012. Column (a) Column (b) Number of Securities
to be Issued Upon
Exercise of
Outstanding Options,
Warrants and Rights Weighted Average
Exercise Price of
Outstanding Options,
Warrants and Rights Number of Securities
Remaining Available for
Future Issuance Under
Equity Compensation Plans,
Excluding Securities
Reflected in Column (a) *1,312,400 $ 17.81 2,607,001 — — — 1,312,400 $ 17.81 2,607,001 Column (a) Column (b) Column (c) Plan Category Weighted Average Exercise Price of Outstanding Options, Warrants and Rights Equity compensation plans approved by security holders 1,481,891 $ 19.59 2,198,235 Equity compensation plans not approved by security holders — — — Total 1,481,891 $ 19.59 2,198,235 * Includes performance stock units that give the holder the right to receive shares of Tredegar common stock upon the satisfaction of certain performance criteria. Item 13. CERTAIN RELATIONSHIPS AND RELATED TRANSACTIONS, AND DIRECTOR INDEPENDENCE Item 14. PRINCIPAL ACCOUNTING FEES AND SERVICES Item 15. EXHIBITS AND FINANCIAL STATEMENT SCHEDULES (a) List of documents filed as a part of the report: (1) Financial statements: Page 45Financial Statements: Financial Statements:20122014 and 2011462012, 20112014, 2013 and 2010472012 482012, 20112014, 2013 and 2010492012 5051-84(2) Financial statement schedules: (3) Exhibits: 91-93.REPORT OF INDEPENDENT REGISTERED PUBLIC ACCOUNTING FIRM20122014 and 2011,2013, and the results of their operations and their cash flows for each of the three years in the period ended December 31, 2012 2014in conformity with accounting principles generally accepted in the United States of America. Also in our opinion, the Company maintained, in all material respects, effective internal control over financial reporting as of December 31, 2012,2014, based on criteria established inInternal Control—Control - Integrated Framework (2013) issued by the Committee of Sponsoring Organizations of the Treadway Commission (“COSO”)(COSO). The Company’sCompany's management is responsible for these financial statements, for maintaining effective internal control over financial reporting and for its assessment of the effectiveness of internal control over financial reporting, included in “Management’s Report on Internal Control Over Financial Reporting” appearing under Item 9A. Our responsibility is to express opinions on these financial statements and on the Company’sCompany's internal control over financial reporting based on our integrated audits. We conducted our audits in accordance with the standards of the Public Company Accounting Oversight Board (United States). Those standards require that we plan and perform the audits to obtain reasonable assurance about whether the financial statements are free of material misstatement and whether effective internal control over financial reporting was maintained in all material respects. Our audits of the financial statements included examining, on a test basis, evidence supporting the amounts and disclosures in the financial statements, assessing the accounting principles used and significant estimates made by management, and evaluating the overall financial statement presentation. Our audit of internal control over financial reporting included obtaining an understanding of internal control over financial reporting, assessing the risk that a material weakness exists, and testing and evaluating the design and operating effectiveness of internal control based on the assessed risk. Our audits also included performing such other procedures as we considered necessary in the circumstances. We believe that our audits provide a reasonable basis for our opinions.As described in “Management’s Report on Internal Control Over Financial Reporting”, management has excluded AACOA, Inc. (“AACOA”) from its assessment of internal control over financial reporting as of December 31, 2012 because they were acquired by the Company in a business combination during 2012. We have also excluded AACOA from our audit of internal controls over financial reporting. AACOA is a wholly-owned business whose total assets and revenues represent approximately 8% and 2%, respectively of the related consolidated financial statement amounts as of and for the year ended December 31, 2012.1, 2013 2012 2011 (In Thousands, Except Share Data) $ 48,822 $ 68,939 100,237 97,785 2,886 2,592 74,670 61,290 5,614 7,133 6,780 7,780 — 343 239,009 245,862 12,537 19,118 110,961 106,237 625,655 620,360 749,153 745,715 495,736 488,464 253,417 257,251 241,180 223,432 49,559 36,886 — 17,179 $ 783,165 $ 780,610 $ 82,067 $ 72,884 42,514 40,888 — 1,967 124,581 115,739 128,000 125,000 60,773 70,769 97,559 71,834 — 361 410,913 383,703 15,195 14,357 (1,401 ) (1,343 ) 131 11,693 993 (406 ) (103,471 ) (90,672 ) 460,805 463,278 372,252 396,907 $ 783,165 $ 780,610 December 31 2014 2013 (In Thousands, Except Share Data) Assets Current assets: Cash and cash equivalents $ 50,056 $ 52,617 Accounts and other receivables, net of allowance for doubtful accounts and sales returns of $2,610 in 2014 and $3,327 in 2013 113,341 99,246 Income taxes recoverable 877 — Inventories 74,308 70,663 Deferred income taxes 8,877 5,628 Prepaid expenses and other 8,283 6,353 Total current assets 255,742 234,507 Property, plant and equipment, at cost: Land and land improvements 11,814 12,093 Buildings 135,015 109,125 Machinery and equipment 643,793 677,621 Total property, plant and equipment 790,622 798,839 Less accumulated depreciation (520,665 ) (516,279 ) Net property, plant and equipment 269,957 282,560 Goodwill and other intangibles 215,129 226,300 Other assets and deferred charges 47,798 49,641 Total assets $ 788,626 $ 793,008 Liabilities and Shareholders’ Equity Current liabilities: Accounts payable $ 94,131 $ 82,795 Accrued expenses 32,049 42,158 Income taxes payable — 114 Total current liabilities 126,180 125,067 Long-term debt 137,250 139,000 Deferred income taxes 39,255 70,795 Other noncurrent liabilities 113,912 55,482 Total liabilities 416,597 390,344 Commitments and contingencies (Notes 3, 16 and 19) Shareholders’ equity: Common stock (no par value): Authorized 150,000,000 shares; Issued and outstanding—32,422,082 shares in 2014 and 32,305,145 in 2013 (including restricted stock) 24,364 20,641 Common stock held in trust for savings restoration plan (66,255 shares in 2014 and 65,332 in 2013) (1,440 ) (1,418 ) Accumulated other comprehensive income (loss): Foreign currency translation adjustment (47,270 ) (19,205 ) Gain (loss) on derivative financial instruments 656 765 Pension and other postretirement benefit adjustments (103,581 ) (71,848 ) Retained earnings 499,300 473,729 Total shareholders’ equity 372,029 402,664 Total liabilities and shareholders’ equity $ 788,626 $ 793,008 2012 2011 2010 (In Thousands, Except Per-Share Data) $ 882,188 $ 794,420 $ 738,200 18,119 3,213 (1,182 ) 900,307 797,633 737,018 712,660 654,087 594,987 24,846 18,488 17,812 73,717 67,808 67,729 13,162 13,219 13,625 5,806 1,399 466 3,590 1,926 1,136 5,022 1,917 773 838,803 758,844 696,528 61,504 38,789 40,490 18,319 10,244 13,649 43,185 28,545 26,841 (14,934 ) (3,690 ) 186 $ 28,251 $ 24,855 $ 27,027 $ 1.35 $ .89 $ .83 (.47 ) (.12 ) .01 $ .88 $ .77 $ .84 $ 1.34 $ .89 $ .82 (.46 ) (.12 ) .01 $ .88 $ .77 $ .83 Years Ended December 31 2014 2013 2012 (In Thousands, Except Per-Share Data) Revenues and other: Sales $ 951,826 $ 959,346 $ 882,188 Other income (expense), net (6,697 ) 1,776 18,119 945,129 961,122 900,307 Costs and expenses: Cost of goods sold 778,113 784,675 712,660 Freight 28,793 28,625 24,846 Selling, general and administrative 69,526 71,195 73,717 Research and development 12,147 12,669 13,162 Amortization of intangibles 5,395 6,744 5,806 Interest expense 2,713 2,870 3,590 Asset impairments and costs associated with exit and disposal activities 3,026 1,412 5,022 Total 899,713 908,190 838,803 Income from continuing operations before income taxes 45,416 52,932 61,504 Income taxes 9,387 16,995 18,319 Income from continuing operations 36,029 35,937 43,185 Income (loss) from discontinued operations, net of tax 850 (13,990 ) (14,934 ) Net income $ 36,879 $ 21,947 $ 28,251 Earnings (loss) per share: Basic: Continuing operations $ 1.12 $ 1.12 $ 1.35 Discontinued operations 0.02 (0.44 ) (0.47 ) Net income $ 1.14 $ 0.68 $ 0.88 Diluted: Continuing operations $ 1.11 $ 1.10 $ 1.34 Discontinued operations 0.02 (0.43 ) (0.46 ) Net income $ 1.13 $ 0.67 $ 0.88 2012 2011 2010 (In Thousands, Except Per-Share Data) $ 28,251 $ 24,855 $ 27,027 (11,562 ) (9,098 ) (2,678 ) — (2,781 ) — 1,399 (686 ) (478 ) (19,285 ) (34,664 ) (2,838 ) 6,486 3,863 2,995 (22,962 ) (43,366 ) (2,999 ) $ 5,289 $ (18,511 ) $ 24,028 Years Ended December 31 2014 2013 2012 (In Thousands, Except Per-Share Data) Net income $ 36,879 $ 21,947 $ 28,251 Other comprehensive income (loss): Unrealized foreign currency translation adjustment (net of tax benefit of $2,396 in 2014, tax of $233 in 2013 and tax of $897 in 2012) (28,065 ) (19,336 ) (11,562 ) Derivative financial instruments adjustment (net of tax benefit of $112 in 2014, tax benefit of $133 in 2013 and tax of $818 in 2012) (109 ) (228 ) 1,399 Pension & other post-retirement benefit adjustments Net gains (losses) and prior service costs (net of tax benefit of $22,445 in 2014, tax of $13,231 in 2013 and tax benefit of $11,145 in 2012) (38,730 ) 22,203 (19,285 ) Amortization of prior service costs and net gains or losses (net of tax of $3,582 in 2014, tax of $5,398 in 2013 and tax of $3,749 in 2012) 6,997 9,420 6,486 Other comprehensive income (loss) (59,907 ) 12,059 (22,962 ) Comprehensive income (loss) $ (23,028 ) $ 34,006 $ 5,289 2012 2011 2010 (In Thousands) $ 28,251 $ 24,855 $ 27,027 43,463 43,336 43,122 5,806 1,399 466 (762 ) 2,108 (6,392 ) 8,311 2,481 1,125 (16,100 ) (1,600 ) 2,200 1,219 (653 ) (15 ) 2,185 1,376 608 9,454 (4,737 ) (10,981 ) (9,913 ) 2,410 (7,717 ) 3,193 (1,254 ) (2,627 ) 1,883 (271 ) (969 ) 9,105 (282 ) 2,942 (3,509 ) 2,597 (2,380 ) 82,586 71,765 46,409 (57,936 ) (180,975 ) (5,500 ) (33,252 ) (15,880 ) (20,418 ) 12,071 — — 3,557 1,622 3,768 (75,560 ) (195,233 ) (22,150 ) 93,250 125,000 — (91,604 ) (89 ) (2,815 ) (30,782 ) (5,761 ) (5,141 ) — — (35,141 ) 2,400 1,242 980 (26,736 ) 120,392 (42,117 ) (407 ) (1,176 ) 386 (20,117 ) (4,252 ) (17,472 ) 68,939 73,191 90,663 $ 48,822 $ 68,939 $ 73,191 $ 2,992 $ 1,966 $ 911 14,721 8,594 23,539 Years Ended December 31 2014 2013 2012 (In Thousands) Cash flows from operating activities: Net income $ 36,879 $ 21,947 $ 28,251 Adjustments for noncash items: Depreciation 35,423 37,911 43,463 Amortization of intangibles 5,395 6,744 5,806 Deferred income taxes (11,489 ) (5,268 ) (762 ) Accrued pension and postretirement benefits 6,974 13,911 8,311 (Gain) loss on an investment accounted for under the fair value method (2,000 ) (3,400 ) (16,100 ) Loss on asset impairments 993 1,639 2,185 (Gain) loss on sale of assets (1,031 ) — 1,219 Changes in assets and liabilities, net of effects of acquisitions and divestitures: Accounts and notes receivables (18,696 ) (1,763 ) 9,454 Inventories (8,803 ) 1,727 (9,913 ) Income taxes recoverable/payable (906 ) 3,063 3,193 Prepaid expenses and other 496 (651 ) 1,883 Accounts payable and accrued expenses 5,554 3,043 9,105 Other, net 2,446 (2,188 ) (3,509 ) Net cash provided by operating activities 51,235 76,715 82,586 Cash flows from investing activities: Capital expenditures (44,898 ) (79,661 ) (33,252 ) Acquisitions, net of cash acquired — 561 (57,936 ) Net proceeds from the sale of investment property (2014) and Fallings Springs, LLC (2013 & 2012) 4,500 306 12,071 Proceeds from the sale of assets and other 2,125 1,190 3,557 Net cash used in investing activities (38,273 ) (77,604 ) (75,560 ) Cash flows from financing activities: Borrowings 116,000 87,000 93,250 Debt principal payments and financing costs (117,779 ) (76,000 ) (91,604 ) Dividends paid (11,007 ) (9,040 ) (30,782 ) Proceeds from exercise of stock options and other 410 3,317 2,400 Net cash provided by (used in) financing activities (12,376 ) 5,277 (26,736 ) Effect of exchange rate changes on cash (3,147 ) (593 ) (407 ) Increase (decrease) in cash and cash equivalents (2,561 ) 3,795 (20,117 ) Cash and cash equivalents at beginning of period 52,617 48,822 68,939 Cash and cash equivalents at end of period $ 50,056 $ 52,617 $ 48,822 Supplemental cash flow information: Interest payments $ 3,320 $ 2,583 $ 2,992 Income tax payments (refunds), net 20,890 19,480 14,721 Accumulated Other Comprehensive
Income (Loss) Common Stock Retained Trust for
Savings
Restora- Foreign
Currency
Trans- Gain
(Loss) on
Derivative
Financial Pension &
Other Post-
retirement
Benefit Total
Share-
holders’ Shares Amount Earnings tion Plan lation Instruments Adjust. Equity (In Thousands, Except Share and Per-Share Data) 33,887,550 $ 41,137 $ 422,277 $ (1,322 ) $ 26,250 $ 758 $ (60,028 ) $ 429,072 — — 27,027 — — — — 27,027
(net of tax benefit of $1,443) — — — — (2,678 ) — — (2,678 ) — — — — — (478 ) — (478 ) — — — — — — (2,838 ) (2,838 ) — — — — — — 2,995 2,995 — — (5,141 ) — — — — (5,141 ) 55,298 3,952 — — — — — 3,952 65,225 776 — — — — — 776 (2,124,900 ) (35,141 ) — — — — — (35,141 ) — — 10 (10 ) — — — — 31,883,173 10,724 444,173 (1,332 ) 23,572 280 (59,871 ) 417,546 — — 24,855 — — — — 24,855
(net of tax benefit of $2,002) — — — — (11,879 ) — — (11,879 )
(net of tax benefit of $423) — — — — — (686 ) — (686 ) — — — — — — (34,664 ) (34,664 ) — — — — — — 3,863 3,863 — — (5,761 ) — — — — (5,761 ) 119,698 2,897 — — — — — 2,897 54,410 736 — — — — — 736 — — 11 (11 ) — — — — 32,057,281 14,357 463,278 (1,343 ) 11,693 (406 ) (90,672 ) 396,907 — — 28,251 — — — — 28,251
(net of tax of $897) — — — — 11,562 — — 11,562 — — — — — 1,399 — 1,399 — — — — — — (19,285 ) (19,285 ) — — — — — — 6,486 6,486 — — (30,782 ) (30,782 ) 78,299 2,516 — — — — — 2,516 143,366 2,031 — — — — — 2,031 (209,576 ) (3,709 ) — — — — — (3,709 ) — — 58 (58 ) — — — — 32,069,370 $ 15,195 $ 460,805 $ (1,401 ) $ 131 $ 993 $ (103,471 ) $ 372,252 Accumulated Other Comprehensive Income (Loss) Common Stock Trust for Savings Restora-tion Plan (In Thousands, Except Share and Per-Share Data) Shares Amount Balance at January 1, 2012 32,057,281 $ 14,357 $ 463,278 $ (1,343 ) $ 11,693 $ (406 ) $ (90,672 ) $ 396,907 Net income — — 28,251 — — — — 28,251 Foreign currency translation adjustment (net of tax of $897) — — — — (11,562 ) — — (11,562 ) Derivative financial instruments adjustment (net of tax of $818) — — — — — 1,399 — 1,399 Net gains or losses and prior service costs (net of tax benefit of $11,145) — — — — — — (19,285 ) (19,285 ) Amortization of prior service costs and net gains or losses (net of tax of $3,749) — — — — — — 6,486 6,486 Cash dividends declared ($0.96 per share) — — (30,782 ) — — — — (30,782 ) Stock-based compensation expense 78,299 2,516 — — — — — 2,516 Issued upon exercise of stock options (including related income tax benefit of $144) & other 143,366 2,031 — — — — — 2,031 Shares received from the sale of Falling Springs, LLC (209,576 ) (3,709 ) — — — — — (3,709 ) Tredegar common stock purchased by trust for savings restoration plan — — 58 (58 ) — — — — Balance at December 31, 2012 32,069,370 15,195 460,805 (1,401 ) 131 993 (103,471 ) 372,252 Net income — — 21,947 — — — — 21,947 Foreign currency translation adjustment (net of tax of $233) — — — — (19,336 ) — — (19,336 ) Derivative financial instruments adjustment (net of tax benefit of $133) — — — — — (228 ) — (228 ) Net gains or losses and prior service costs (net of tax of $13,231) — — — — — — 22,203 22,203 Amortization of prior service costs and net gains or losses (net of tax of $5,398) — — — — — — 9,420 9,420 Cash dividends declared ($0.28 per share) — — (9,040 ) (9,040 ) Stock-based compensation expense 72,125 2,572 — — — — — 2,572 Issued upon exercise of stock options (including related income tax benefit of $188) & other 163,650 2,874 — — — — — 2,874 Tredegar common stock purchased by trust for savings restoration plan — — 17 (17 ) — — — — Balance at December 31, 2013 32,305,145 20,641 473,729 (1,418 ) (19,205 ) 765 (71,848 ) 402,664 Net income — — 36,879 — — — — 36,879 Foreign currency translation adjustment (net of tax benefit of $2,396) — — — — (28,065 ) — — (28,065 ) Derivative financial instruments adjustment (net of tax benefit of $112) — — — — — (109 ) — (109 ) Net gains or losses and prior service costs (net of tax benefit of $22,445) — — — — — — (38,730 ) (38,730 ) Amortization of prior service costs and net gains or losses (net of tax of $3,582) — — — — — — 6,997 6,997 Cash dividends declared ($0.34 per share) — — (11,007 ) — — — — (11,007 ) Stock-based compensation expense 85,129 3,224 — — — — — 3,224 Shareholder Rights Plan redemption — — (323 ) — — — — (323 ) Issued upon exercise of stock options (including related income tax benefit of $3) & other 31,808 499 — — — — — 499 Tredegar common stock purchased by trust for savings restoration plan — 22 (22 ) — — — — Balance at December 31, 2014 32,422,082 $ 24,364 $ 499,300 $ (1,440 ) $ (47,270 ) $ 656 $ (103,581 ) $ 372,029 11 SUMMARY OF SIGNIFICANT ACCOUNTING POLICIES weTredegar sold ourits aluminum extrusions business in Canada, and on November 20, 2012, wethe Company sold ourits mitigation banking business, Falling Springs, LLC (“Falling Springs”). All historical results for these businesses have been reflected as discontinued operations in these financial statements; however, cash flows for discontinued operations have not been separately disclosed in the consolidated statements of cash flows. See Note 3 regarding discontinued operations.usTredegar to make estimates and assumptions that affect the reported amounts of revenues, expenses, assets and liabilities and disclosure of contingent assets and liabilities at the date of the financial statements. Actual results could differ from those estimates.We haveThere are no operating subsidiaries located outside the U.S. where the U.S. Dollar is the functional currency.not materiala loss of $1.5 million in 2012, 20112014, a loss of $0.4 million in 2013 and 2010.a gain of $16,000 in 2012. These amounts do not include the effects between reporting periods that exchange rate changes have on income of ourthe locations outside the U.S. that result from translation into U.S. Dollars.20122014 and 2011,2013, Tredegar had cash and cash equivalents of $48.8$50.1 million and $68.9$52.6 million, respectively, including funds held in locations outside the U.S. of $28.6$40.5 million and $42.3$38.6 million, respectively.Ourouran assessment of probable losses taking into account past due amounts, customer credit profile, historical experience and current economic conditions. Other receivables include value-added taxes related to certain foreign subsidiaries and other miscellaneous receivables due within one year.were not materialwas $1.1 million, $0.9 million and $0.2 million in 2014, 2013 and 2012, 2011 and 2010.whichthat, except for certain isolated exceptions, range from 105 to 2540 years for buildings and land improvements and 2 to 1520 years for machinery and equipment. The average depreciation period for machinery and equipment is approximately 10 years in Film Products and for the continuing operations of Aluminum Extrusions.We account The Company accounts for ourits investments in private entities where ourits voting ownership is less than or equal to 50% based on the facts and circumstances surrounding the investment. WeInvestments are required to accountbe accounted for investments under the consolidation method in situations where we areTredegar is the primary beneficiary of a variable interest entity. The primary beneficiary is the party that has a controlling financial interest in a variable interest entity. We areThe Company is deemed to have a controlling financial interest if we haveit has (i) the power to direct activities of the variable interest entity that most significantly impact its economic performance and (ii) the obligation to absorb losses or the right to receive benefits from the variable interest entity that could potentially be significant to its operations.we arethe Company is not deemed to be the primary beneficiary in an investment in a variable interest entity then we selectit selects either: (i) the fair value method or (ii) either (a) the cost method if we doit does not have significant influence over operating and financial policies of the investee or (b) the equity method if we doit does have significant influence.We assessThe Company assesses goodwill for impairment when events or circumstances indicate that the carrying value may not be recoverable, or, at a minimum, on an annual basis (December 1st of each year). OurThe Company’s significant reporting units in Film Products include Polyethylene and Polypropylene Films and PET Films. We haveThere are two reporting units in Aluminum Extrusions, Bonnell Aluminum and AACOA. All goodwill in Aluminum Extrusions is associated with the AACOA reporting unit. Each of ourthese reporting units has separately identifiable operating net assets (operating assets including goodwill and intangible assets net of operating liabilities).We estimateourits reporting units using discounted cash flow analysis and comparative enterprise value-to-EBITDA (earnings before interest, taxes, depreciation and amortization) multiples. The goodwill of Polyethylene and Polypropylene Films reporting unit was tested for impairment at the annual testing date, with the estimated fair value of this reporting unit substantially exceeding the carrying value of its net assets. The goodwill of PET Films reporting unit was also tested for impairment at December 1, 2012,2014, with the estimated fair value of this reporting unit exceeding the carrying value of its net assets by approximately 23%31%. The goodwill of AAOCAAACOA is associated with the October 2012 acquisition of AACOA, Inc. (“AACOA”), and carrying value of its net assets approximate the estimated fair value of this reporting unit exceeded the carrying value of its net assets by approximately 63% at December 1, 2012.We review The Company reviews long-lived assets for possible impairment when events indicate that an impairment may exist. For assets to bethat are held and used in operations, if events indicate that an asset may be impaired, we estimatethe Company estimates the future unlevered pre-tax cash flows expected to result from the use of the asset and its eventual disposition. Assets are grouped for this purpose at the lowest level for which there are identifiable and independent cash flows. If the sum of these undiscounted pre-tax cash flows is less than the carrying amount of the asset, an impairment loss is calculated. Measurement of the impairment loss is the amount by which the carrying amount exceeds the estimated fair value of the asset group.We recognizeThe Company recognizes the funded status of ourits pension and other postretirement plans in the accompanying consolidated balance sheets. OurTredegar’s policy is to fund ourits pension plans at amounts not less than the minimum requirements of the Employee Retirement Income Security Act (“ERISA”) of 1974 and to fund postretirement benefits other than pensions when claims are incurred.provided onrecorded for the undistributed earnings for Terphane Ltda. (a subsidiary of Film Products) because of ourthe Company’s intent to permanently reinvest these earnings. The cumulative amountBecause of untaxed earnings was $23.0 millionthe accumulation of significant losses related to foreign currency translations at Terphane Ltda. as of December 31, 2012. We accrue2014, there were no unrecorded deferred tax liabilities associated with the U.S. federal income taxes and foreign withholding taxes on undistributed earnings indefinitely invested outside the U.S. The Company accrues U.S. federal income taxes to the extent permitted under U.S. GAAP on unremitted earnings of all other foreign subsidiaries.we determinethe Company determines that it is more likely than not that the position will be sustained, based on the technical merits of the position, if the taxing authority examines the position and the dispute is litigated. This determination is made on the basis of all the facts, circumstances and information available as of the reporting date. 2012 2011 2010 32,032,343 31,931,962 32,291,556 160,233 281,212 280,565 32,192,576 32,213,174 32,572,121 2014 2013 2012 Weighted average shares outstanding used to compute basic earnings per share 32,302,108 32,171,751 32,032,343 Incremental shares attributable to stock options and restricted stock 251,746 427,528 160,233 Shares used to compute diluted earnings per share 32,553,854 32,599,279 32,192,576 During 2012, 2011 and 2010, theThe average out-of-the-money options to purchase shares that were excluded from the calculation of incremental shares attributable to stock options and restricted stock waswere 320,849 in 2014, 31,167 in 2013 and 632,050 293,704 and 324,558, respectively.ourthe closing stock price on that date.2012, 20112014, 2013 and 20102012 are as follows: 2012 2011 2010 .9 % .9 % .9 % 48.7 % 46.4 % 46.6 % 1.0 % 2.5 % 2.7 % 6.0 6.0 6.0 5.0 5.0 5.0 $ 19.30 $ 19.84 $ 17.18 19.40 19.73 17.13 2014 2013 2012 Dividend yield 1.3 % 1.1 % 0.9 % Weighted average volatility percentage 43.5 % 48.3 % 48.7 % Weighted average risk-free interest rate 2.0 % 1.1 % 1.0 % Holding period (years): Officers 6.0 6.0 6.0 Management 5.0 5.0 5.0 Weighted average exercise price at date of grant (also weighted average market price at date of grant): Officers $ 22.49 $ 24.84 $ 19.30 Management 22.33 25.10 19.40 our common stock at the date of grant, which we believethe Company believes is a reasonable estimate of the expected yield during the holding period. We calculateThe expected volatility is based on the historical volatility of ourTredegar’s common stock using a sequential period of historical data equal to the expected holding period of the option. We haveThe Company has no reason to believe that future volatility for this period is likely to differ from the past. The assumed risk-free interest rate is based on observed interest rates (zero coupon U.S. Treasury debt securities) appropriate for the expected holding period. The expected holding period and forfeiture assumptions are based on historical experience. Estimated forfeiture assumptions are reviewed through the vesting period. Adjustments are made if actual forfeitures differ from previous estimates. The cumulative effect of a change in estimated forfeitures is recognized in the period of the change.2012, 20112014, 2013 and 2010,2012, and related estimated fair value at the date of grant, are as follows: 2012 2011 2010 99,600 140,500 190,000 82,500 95,300 126,000 182,100 235,800 316,000 $ 8.07 $ 8.55 $ 7.47 7.81 8.03 7.00 $ 1,449 $ 1,966 $ 2,301 2014 2013 2012 Stock options granted (number of shares): Officers 87,820 94,400 99,600 Management 93,656 90,300 82,500 Total 181,476 184,700 182,100 Estimated weighted average fair value of options per share at date of grant: Officers $ 9.21 $ 10.37 $ 8.07 Management 7.60 9.65 7.31 Total estimated fair value of stock options granted (in thousands) $ 1,521 $ 1,850 $ 1,449 We use Tredegar uses derivative financial instruments for the purpose of hedging aluminum price volatility and currency exchange rate exposures that exist as part of transactions associated with our ongoing business operations. OurThe Company’s derivative financial instruments are designated as and qualify as cash flow hedges and are recognized in the accompanying balance sheet at fair value. A change in the fair value of the derivative that is highly effective as and that is designated and qualifies as a cash flow hedge is recorded in other comprehensive income. Gains and losses reported in other comprehensive income (loss) are reclassified to earnings in the periods in which earnings are affected by the variability of cash flows of the hedged transaction. Such gains and losses are reported on the same line as the underlying hedged item, and the cash flows related to financial instruments are classified in the consolidated statements of cash flows in a manner consistent with those of the transactions being hedged. Any hedge ineffectiveness (which represents the amount by which the changes in the fair value of the derivative exceed the variability in the cash flows of the forecasted transaction) is recorded in current period earnings. The amount of gains and losses recognized for hedge ineffectiveness were not material in 2012, 20112014, 2013 and 2010.2012.Ourweit formally document all relationships between hedging instruments and hedged items, as well as ourits risk management objective and strategy for undertaking various hedge transactions. WeThe Company also formally assessassesses (both at the hedge’s inception and on an ongoing basis) whether the derivatives that are used in hedging transactions have been highly effective in offsetting changes in the fair value or cash flows of hedged items and whether thosewe discontinuethe Company discontinues hedge accounting prospectively.we doTredegar does not engage in speculative or leveraged transactions, nor do wedoes it hold or issue financial instruments for trading purposes. Additional disclosure of ourthe utilization of derivative hedging instruments is included in Note 9.(In Thousands) Foreign currency translation adjustment Gain (loss) on derivative financial instruments Pension and other post-retirement benefit adjustments Total Beginning balance, January 1, 2014 $ (19,205 ) $ 765 $ (71,848 ) $ (90,288 ) Other comprehensive income (loss) before reclassifications (28,065 ) 294 (38,730 ) (66,501 ) Amounts reclassified from accumulated other comprehensive income (loss) — (403 ) 6,997 6,594 Net other comprehensive income (loss) - current period (28,065 ) (109 ) (31,733 ) (59,907 ) Ending balance, December 31, 2014 $ (47,270 ) $ 656 $ (103,581 ) $ (150,195 ) (In Thousands) Foreign currency translation adjustment Gain (loss) on derivative financial instruments Pension and other post-retirement benefit adjustments Total Beginning balance, January 1, 2013 $ 131 $ 993 $ (103,471 ) $ (102,347 ) Other comprehensive income (loss) before reclassifications (19,336 ) (590 ) 22,203 2,277 Amounts reclassified from accumulated other comprehensive income (loss) — 362 9,420 9,782 Net other comprehensive income (loss) - current period (19,336 ) (228 ) 31,623 12,059 Ending balance, December 31, 2013 $ (19,205 ) $ 765 $ (71,848 ) $ (90,288 ) (In Thousands) Amount reclassified from other comprehensive income Location of gain (loss) reclassified from accumulated other comprehensive income to net income Gain (loss) on derivative financial instruments: Aluminum future contracts, before taxes $ 631 Cost of sales Foreign currency forward contracts, before taxes 16 Cost of sales Total, before taxes 647 Income tax expense (benefit) 244 Income taxes Total, net of tax $ 403 Amortization of pension and other post-retirement benefits: Actuarial gain (loss) and prior service costs, before taxes $ (10,579 ) (a) Income tax expense (benefit) (3,582 ) Income taxes Total, net of tax $ (6,997 ) (a) This component of accumulated other comprehensive income is included in the computation of net periodic pension cost (see Note 14 for additional detail). (In Thousands) Amount reclassified from other comprehensive income Location of gain (loss) reclassified from accumulated other comprehensive income to net income Gain (loss) on derivative financial instruments: Aluminum future contracts, before taxes $ (583 ) Cost of sales Foreign currency forward contracts, before taxes — Total, before taxes (583 ) Income tax expense (benefit) (221 ) Income taxes Total, net of tax $ (362 ) Amortization of pension and other post-retirement benefits: Actuarial gain (loss) and prior service costs, before taxes $ (14,818 ) (a) Income tax expense (benefit) (5,398 ) Income taxes Total, net of tax $ (9,420 ) (a) This component of accumulated other comprehensive income is included in the computation of net periodic pension cost (see Note 14 for additional detail). July 2012,April 2014, the Financial Accounting Standards Board (“FASB”) issued updateda revised standard that changes current guidance for testing indefinite-lived intangible assetsdiscontinued operations. Under the revised standard, to be a discontinued operation, a component or group of components must represent a strategic shift that has (or will have) a major effect on an entity’s operations and financial results. Failure to eliminate significant continuing cash flows of or involvement with a disposed component from an entity’s ongoing operations after a disposal no longer precludes presentation as a discontinued operation. Expanded disclosures for impairment.discontinued operations under the revised standard will also include more details about earnings and balance sheet accounts, total operating and investing cash flows and cash flows resulting from continuing involvement. New disclosures are also required for disposals of individually significant components that do not qualify as discontinued operations. The new guidance is to be applied prospectively to all new disposals of components and new classifications as held for sale for annual reporting periods beginning after December 15, 2014, with early adoption permitted. The Company will implement this revised standard as transactions and events warrant.providescontains principles that an entity will apply to direct the measurement ofan optioncustomers. The amendments in this revised standard are effective for annual reporting periods beginning after December 15, 2016, including interim periods within that reporting period. Early adoption is not permitted. The converged standard can be adopted either retrospectively or through the use of a practical expedient. The Company is still assessing the impact of this new guidance.performeliminate the concept of development stage entities and all related specified presentation and reporting requirements under U.S. GAAP. In addition, the amended standard eliminated the scope exception for development stage entities when evaluating the sufficiency of equity at risk for a “qualitative” assessmentvariable interest entity (“VIE”), thereby changing consolidation conclusions in some situations. Except for the elimination of the scope exception for development stage entities when evaluating the sufficiency of equity at risk for a VIE, the revised guidance is effective for annual reporting periods beginning after December 15, 2014, including interim periods within that reporting period. The amendments to determine whether further testing is necessary when performing anthe consolidation guidance are effective for annual impairment assessment for indefinite-lived intangible assets other than goodwill. Thisreporting periods beginning after December 15, 2015, including interim periods within that reporting period. The new standard is comparablenot expected to impact the Company.guidance finalized last yearperiod(s) for goodwill impairment testing. An entity can still choose to bypasswhich the qualitative assessment for any indefinite-lived intangible asset in any period and proceed directly to the quantitative impairment test.requisite service has already been rendered. The revisedamended standard is effective for annual and interim impairment tests performed for fiscal yearsreporting periods beginning after SeptemberDecember 15, 2012. We do2015, including interim periods within that reporting period. Early adoption is permitted. The new standard is not expectexpected to impact the Company.this FASB accountingare both unusual and infrequent in nature will no longer be separately reported net of tax after continuing operations. The existing requirement to separately present items that are of an unusual nature or occur infrequently on a pre-tax basis within income from continuing operations has been retained and expanded to include items that are both unusual and infrequent. The standard will have a materialis effective for periods beginning after December 15, 2015. Early adoption is permitted, but only as of the beginning of the fiscal year of adoption. The new standard is not expected to impact on our financial statements and disclosures.the Company.22 ACQUISITIONS will addadded fabrication capabilities to Aluminum Extrusions’ current array of products and services while providing AACOA with large press capabilities and enhanced geographic sales coverage in a variety of end-use markets.$54.6 million.$54.1 million, which includes $0.6 million that was received from the seller in 2013. The purchase price was funded using financing secured from ourthe Company’s existing $350 million revolving credit facility. preliminary valuation of the fair value of tangible and intangible assets acquired (net of cash acquired) and liabilities assumed, the preliminary estimated purchase price allocation iswas as follows: $ 12,477 4,708 15,116 4,800 4,800 3,400 1,600 42 (6,574 ) 40,369 54,625 $ 14,256 (In Thousands) Accounts receivable $ 12,477 Inventories 4,708 Property, plant & equipment 15,116 Identifiable intangible assets: Customer relationships 4,800 Trade names 4,800 Proprietary technology 3,400 Noncompete agreements 1,600 Other assets (current & noncurrent) 42 Trade payables & accrued expenses (6,574 ) Total identifiable net assets 40,369 Purchase price, net of cash received 54,065 Goodwill $ 13,696 Useful Life (Yrs) 10 6-10 Indefinite 2 The final purchase price continues to be subject to certain post-closing contractual adjustments. If information becomes available that would indicate adjustments are required to the purchase price or the purchase price allocation prior to the end of the measurement period for finalizing the purchase price allocation, such adjustments will be included in the purchase price allocation retrospectively. Polyester films have specialized properties, such as heat resistance and barrier protection, that make them uniquely suited for the fast-growing flexible packaging market. We expect that the acquisition of Terphane will allow us to extend our product offerings into adjacent specialty films markets and to expand in Latin America.have beenwere resolved in 2012.2012, which resulted in a payment to the seller of $3.3 million. Adjustments to the purchase price were made retrospectively as if the accounting had been completed on the acquisition date. Upon completing these post-closing adjustments, which were primarily related to working capital transferred, the total purchase price (net of cash acquired) was $182.7 million. The purchase price was funded using available cash (net of cash received) of approximately $57.7 million and financing of $125 million secured from Tredegar’s former revolving credit facility.Based upon management’s valuation of the fair value of tangible and intangible assets acquired (net of cash acquired) and liabilities assumed, the final estimated purchase price allocation is as follows:(In Thousands)Accounts receivable$14,321Inventories23,437Property, plant & equipment86,963Identifiable intangible assets:Customer relationships32,600Proprietary technology14,700Trade names9,400Noncompete agreements2,300Other assets (current & noncurrent)3,680Trade payables(17,471) Other liabilities (current & noncurrent)(12,216) Deferred taxes(38,167) Total identifiable net assets119,547Purchase price, net of cash received182,761Goodwill$63,214None of the goodwill or other intangible assets will be deductible for tax purposes. Intangible assets acquired in the purchase of Terphane are being amortized over the following periods:Identifiable Intangible AssetUseful Life (Yrs)Customer relationships12Proprietary technology10Trade namesIndefiniteNoncompete agreements2 For the year ended December 31, 2012 and 2011, the consolidated results of operations included sales of $143.3 million and $29.2 million, respectively, and net income from continuing operations of $17.4 million and $2.0 million, respectively, related to Terphane.ourits consolidated revenues and earnings as if the acquisitionsacquisition of Terphane and AACOA had been consummated on January 1, 2011.2012. The pro forma results are not necessarily indicative of ourthe Company’s consolidated revenues and earnings if the acquisition and related borrowing had been consummated on January 1, 2011.2012. Supplemental unaudited pro forma results for the yearsyear ended December 31, 2012 and 2011 are as follows: 2012 2011 $ 946,594 $ 1,009,601 44,816 43,407 $ 1.40 $ 1.36 1.39 1.35 (In Thousands, Except Per Share Data) 2012 Sales $ 946,594 Income from continuing operations 44,816 Earnings per share from continuing operations: Basic $ 1.40 Diluted 1.39 2011:2012:acquisitionsacquisition of Terphane and AACOA and the elimination of historical interest expense associated with historical borrowings of Terphane and AACOA that were not assumed by Tredegar;2011 acquisition of Terphane and the October 2012 acquisition of AACOA;Adjustments related to the elimination of foreign currency remeasurement gains associated with long-term borrowings of Terphane that were not assumed by Tredegar;On February 3, 2010, we purchased the assets of Bright View Technologies Corporation (“Bright View”) for $5.5 million. Bright View is a developer and producer of high-value microstructure-based optical films for the LED (light emitting diode) and fluorescent lighting markets. The primary identifiable intangible assets purchased in the transaction were patented and unpatented technology, which are being amortized over a weighted average period of 12 years.33 DISCONTINUED OPERATIONS ourTredegar’s Board of Directors. The purchase price was comprised of $12.8 million of cash and 209,576 shares of common stock of Tredegar owned by Arc Ventures, LC. The corresponding loss on sale of $3.1 million, which includes transaction-related expenses of $0.5 million, and the results of operations related to Falling Springs have been classified as discontinued operations for all periods presented. For the yearsyear ended December 31, 2012, 2011 and 2010, sales of $3.2 million $3.2 million and $2.3 million, respectively, have been reclassified to discontinued operations, and net income of $0.5 million $0.7 million and $0.2 million havehas been reclassified to discontinued operations in 2012, 2011 and 2010, respectively.2012. Falling Springs was formerly a component of the Other segment.wethe Company sold ourits aluminum extrusions business in Canada for approximately $25.0 million to an affiliate of H.I.G. Capital. In 20122014, accruals for indemnifications under the purchase agreement related to environmental matters were adjusted, resulting in income from discontinued operations of $0.9 million ($0.9 million net of tax). In 2013 and 2011,2012, accruals of $14.0 million ($14.0 million net of tax) and $13.4 million ($13.4 million net of tax) and $4.4 million ($4.4 million net of tax), respectively, were made for indemnifications under the purchase agreement related to environmental matters.Allas well as the assets and liabilities included in the historical statements of positionsincluding any subsequent adjustments for contractual indemnifications, have been reflected as discontinued operations; however, cash flows for discontinued operations have not been separately disclosed in the consolidated statements of cash flows.44 INVESTMENTS weTredegar made an aggregate investment of $7.5 million in Intelliject,kaleo, Inc. (“Intelliject”kaléo”), a privately held specialty pharmaceutical company.company formerly known as Intelliject, seeksInc. The mission of kaléo is to set a new standard in drug/device combination pharmaceuticalslife-saving personal medical products designed to enable superior treatment outcomes, improved cost effectiveness and intuitive patient administration. OurThe Company’s ownership interest on a fully diluted basis is approximately 20%, and the investment is accounted for under the fair value method. At the time of ourthe initial investment, wethe Company elected the fair value option over the equity method of accounting since ourits investment objectives were similar to those of venture capitalists, which typically do not have controlling financial interests. WeThe Company recognized a net unrealized gain of $2.0 million ($1.0 million after taxes) in 2014 that primarily related to favorable adjustments in the fair value for the passage of time as anticipated cash flows associated with achieving product development and commercialization milestones were discounted at 45% for their high degree of risk and the impact of reducing the weighted average cost of capital used to discount cash flow projections after kaléo commercialized a second product, partially offset by unfavorable adjustments in the fair value due to a reassessment of the amount and timing of estimated cash flows associated with kaléo’s commercialized products.in 2012 attributed to various factors, most notably:ourthe first-quarter valuation in the first quarter to reflect the completion of certain process testing and a reassessment of the risk associated with the timing for obtaining final marketing approval from the U.S. Food and Drug Administration (“FDA”) for the company’s first product.We recognized an unrealized gain of $1.6 million ($1.0 million after taxes) in 2011 attributed to the appreciation of our interest upon changes in the market dynamics and pricing associated with an upcoming product introduction and the addition of projects to the product pipeline. In 2010, we recognized an unrealized loss of $2.2 million ($1.4 million after taxes) for the estimated changes in the fair value of our investment after Intelliject, which had its new drug application to the FDA accepted for review during the fourth quarter, reassessed its projected timeframe for obtaining final marketing approval from the FDA. Unrealized gains (losses) associated with this investment are included in “Other income (expense), net” in the consolidated statements of income and separately stated in the segment operating profit table in Note 5.20122014 and 2011,2013, the estimated fair value of ourthe Company’s investment (included in “Other assets and deferred charges” in the consolidated balance sheets) was $33.7$39.1 million and $17.6$37.1 million, respectively. Subsequent to ourits most recent investment (December 15, 2008), and until the next round of financing, we believethe Company believes fair value estimates are based upon Level 3 inputs since there is no secondary market for ourits ownership interest. In addition, Intelliject did not have any product sales as of December 31, 2012. Their first product launched in the first quarter of 2013. Accordingly, until the next round of financing or any other significant financial transaction, value estimates will primarily be based on assumptions relating to meeting product development and commercialization milestones, cash flow projections (projections of development and commercialization milestone payments, sales, costs, expenses, capital expenditures and working capital investment) and discounting of these factors for thetheir high degree of risk. As a result, any future changes in the estimated fair value of our ownership interest will likely be attributed to a new round of financing, a merger or initial public offering or adjustments to the timing or magnitude of cash flows associated with development and commercialization milestones. If Intellijectkaléo does not meet its development and commercialization milestones and there are indications that the amount or timing of its projected cash flows or related risks are unfavorable versus ourthe most recent valuation, or a new round of financing or other significant financial transaction indicates a lower enterprise value, then ourthe Company’s estimate of the fair value of ourits ownership interest in the companykaléo is likely to decline. Adjustments to the estimated fair value of ourthis investment will be made in the period upon which such changes can be quantified.ourTredegar’s interest in Intellijectkaléo is sensitive to changes in the weighted average cost of capital used to discount cash flow projections for the high degree of risk associated with meeting development and commercialization milestones as anticipated. The weighted average cost of capital used in the fair market valuation of ourthe Company’s interest in Intellijectkaléo was 45% and 55% at December 31, 20122014 and 60% at December 31, 2011.2013, respectively. In 2014, the weighted average cost of capital used to discount cash flow projections was decreased to reflect lower product risk after the U.S. Food and Drug Administration’s approval of kaléo’s naloxone auto-injector for emergency treatment of known or suspected opioid overdoses and reduced funding risk subsequent to kaléo securing new debt financing, both of which occurred in April 2014. At December 31, 2012,2014, the effect of a 500 basis point decrease in the weighted average cost of capital assumption would have further increased the fair value of ourTredegar’s interest in Intellijectkaléo by approximately $6 million, and a 500 basis point increase in the weighted average cost of capital assumption would have decreased the fair value of ourthe Company’s interest by approximately $5$6 million.wethe Company not elected to account for ourits investment under the fair value method, weit would have been required to use the equity method of accounting. The condensed balance sheets for Intellijectkaléo at December 31, 20122014 and 20112013 and related condensed statements of operations for the last three years ended December 31, 2012,2014, that were reported to us by Intelliject,kaléo, are provided below: December 31, December 31, 2012 2011 2012 2011 Liabilities & Equity: $ 53,288 $ 9,625 Current liabilities $ 13,405 $ 1,185 686 4,894 Non-current liabilities 1,449 738 4,278 691 Long term debt, net of discount 14,696 — 2,152 1,868 Redeemable preferred stock 20,995 20,017 Equity 9,859 (4,862 ) $ 60,404 $ 17,078 Total liabilities & equity $ 60,404 $ 17,078 2012 2011 2010 $ 38,179 $ 8,839 $ 29,099 (13,073 ) (10,474 ) (10,426 ) (9,642 ) 927 (6,584 ) $ 15,464 $ (708 ) $ 12,089 December 31, December 31, (In Thousands) 2014 2013 2014 2013 Assets: Liabilities & Equity: Cash & short-term investments $ 117,589 $ 33,560 Long-term debt, net of discount, current portion $ — $ 5,414 Restricted cash 14,498 — Other current liabilities 8,123 4,845 Other current assets 17,916 5,682 Other noncurrent liabilities 1,247 3,098 Property & equipment 10,824 10,559 Long-term debt, net of discount 149,471 9,372 Patents 2,702 2,433 Redeemable preferred stock 22,946 21,970 Other long-term assets 2,857 445 Equity (15,401 ) 7,980 Total assets $ 166,386 $ 52,679 Total liabilities & equity $ 166,386 $ 52,679 2014 2013 2012 Revenues & Expenses: Revenues $ 21,156 $ 15,305 $ 38,179 Cost of goods sold (3,801 ) — — Expenses and other, net (a) (48,447 ) (18,631 ) (13,073 ) Income tax (expense) benefit 8,100 1,586 (9,642 ) Net income (loss) $ (22,992 ) $ (1,740 ) $ 15,464 Intellijectkaléo as of December 31, 20122014 and 20112013 and for the years ended December 31, 2012, 20112014, 2013 and 20102012 have been included as an exhibit to ourthe Company’s Annual Report on Form 10-K for the year ended December 31, 20122014 filed with the Securities and Exchange Commission.weTredegar invested $10.0 million in Harbinger Capital Partners Special Situations Fund, L.P. (“Harbinger”(the “Harbinger Fund”), a private investment fund that is subject to limitations on withdrawal. There is no secondary market for interests in the fund. OurThe Company’s investment in the Harbinger Fund, which represents less than 2% of its total partnership capital, is accounted for under the cost method. We recorded unrealizedUnrealized losses on the Company’s investment in the Harbinger Fund (included in “Other income (expense), net” in the consolidated statements of income) were $0.8 million ($0.4 million after taxes), $0.4 million ($0.3 million after taxes) and $1.1 million ($0.7 million after taxes) in 2014, 2013 and $0.6 million ($0.4 million after taxes) on our investment in Harbinger in 2012, and 2011, respectively, as a result of a reduction in the estimated fair value of ourthe investment that is not expected to be temporary. The December 31, 20122014 and 20112013 carrying value in the consolidated balance sheets (included in “Other assets and deferred charges”) was $3.6$1.8 million and $5.2$2.8 million, respectively. The carrying value at December 31, 20122014 reflected Tredegar’s cost basis in its investment in Harbinger, net of total withdrawal proceeds received and unrealized losses. Withdrawal proceeds were $0.2 million in 2014, $0.4 million in 2013 and $0.5 million in 2012 and $0.6 million in 2011.2012. The timing and amount of future installments of withdrawal proceeds was not known as of December 31, 2012.2014. There were no realized gains or losses associated with ourthe investment in the Harbinger Fund in 2012, 20112014, 2013 and 2010.2012. Gains on ourthe Company’s investment in the Harbinger Fund, if any, will be recognized when the amounts expected to be collected from our withdrawal from the investment are known, which will likely be when cash in excess of ourthe remaining carrying value is received. Losses will be recognized if management believes it is probable that future withdrawal proceeds will not exceed the remaining carrying value.55 BUSINESS SEGMENTS OurInBeginning in February 2010, wethe Company started reporting an additional segment, Other, comprised of the start-up operations of Bright View and Falling Springs. Effective January 1, 2012, the operations and results of Bright View were incorporated into Film Products to leverage research and development efforts and accelerate new product development. Prior year balances for Bright View have been reclassified to Film Products to conform with the current year presentation. As discussed in Note 3, Falling Springs was divested in the fourth quarter ofNovember 2012. All historical results for this business have been reflected as discontinued operations. With the sale of Falling Springs, there is no longer an Other segment to report.2012, $280.3 million in 2011 and $273.1 million in 2010.2012. These amounts include plastic film sold to others that convert the film into materials used with products manufactured by P&G. 2012 2011 2010 $ 611,877 $ 535,540 $ 520,749 245,465 240,392 199,639 857,342 775,932 720,388 24,846 18,488 17,812 $ 882,188 $ 794,420 $ 738,200 2012 2011 2010 $ 69,950 $ 59,493 $ 66,718 (109 ) (6,807 ) (758 ) 9,037 3,457 (4,154 ) (5,427 ) 58 493 73,451 56,201 62,299 418 1,023 709 3,590 1,926 1,136 16,100 1,600 (2,200 ) 1,432 1,940 2,064 23,443 16,169 17,118 61,504 38,789 40,490 18,319 10,244 13,649 43,185 28,545 26,841 (14,934 ) (3,690 ) 186 $ 28,251 $ 24,855 $ 27,027 Net Sales (In Thousands) 2014 2013 2012 Film Products $ 578,687 $ 621,239 $ 611,877 Aluminum Extrusions 344,346 309,482 245,465 Total net sales 923,033 930,721 857,342 Add back freight 28,793 28,625 24,846 Sales as shown in consolidated statements of income $ 951,826 $ 959,346 $ 882,188 Operating Profit (In Thousands) 2014 2013 2012 Film Products: Ongoing operations $ 58,054 $ 70,966 $ 69,950 Plant shutdowns, asset impairments, restructurings and other (a) (12,827 ) (671 ) (109 ) Aluminum Extrusions: Ongoing operations 25,664 18,291 9,037 Plant shutdowns, asset impairments, restructurings and other (a) (976 ) (2,748 ) (5,427 ) Total 69,915 85,838 73,451 Interest income 588 594 418 Interest expense 2,713 2,870 3,590 Gain on investment accounted for under the fair value method (a) 2,000 3,400 16,100 Gain on sale of investment property (a) 1,208 — — Unrealized loss on investment property (a) — 1,018 — Stock option-based compensation expense 1,272 1,155 1,432 Corporate expenses, net (a) 24,310 31,857 23,443 Income from continuing operations before income taxes 45,416 52,932 61,504 Income taxes (a) 9,387 16,995 18,319 Income from continuing operations 36,029 35,937 43,185 Income (loss) from discontinued operations (a) 850 (13,990 ) (14,934 ) Net income $ 36,879 $ 21,947 $ 28,251 Identifiable Assets (In Thousands) 2014 2013 Film Products $ 546,210 $ 556,873 Aluminum Extrusions 143,328 134,928 Subtotal 689,538 691,801 General corporate (b) 49,032 48,590 Cash and cash equivalents (d) 50,056 52,617 Total $ 788,626 $ 793,008 Depreciation and Amortization Capital Expenditures (In Thousands) 2014 2013 2012 2014 2013 2012 Film Products $ 30,730 $ 35,332 $ 39,202 $ 38,806 $ 64,867 $ 30,484 Aluminum Extrusions 9,974 9,202 9,984 6,092 14,742 2,332 Subtotal 40,704 44,534 49,186 44,898 79,609 32,816 General corporate 114 121 73 — 52 436 Continuing operations 40,818 44,655 49,259 44,898 79,661 33,252 Discontinued operations — — 10 — — — Total $ 40,818 $ 44,655 $ 49,269 $ 44,898 $ 79,661 $ 33,252 Net Sales by Geographic Area (d) (In Thousands) 2014 2013 2012 United States $ 542,395 $ 534,346 $ 480,041 Exports from the United States to: Asia 72,597 82,235 57,639 Canada 47,391 46,481 46,948 Europe 10,874 6,984 5,186 Latin America 3,116 3,505 3,145 Operations outside the United States: Brazil 97,954 109,415 121,373 The Netherlands 74,329 68,471 67,758 Hungary 39,457 43,482 41,285 China 26,109 28,702 30,636 India 8,811 7,100 3,331 Total (c) $ 923,033 $ 930,721 $ 857,342 (In Thousands) 2014 2013 2014 2013 United States (b) $ 409,272 $ 419,234 $ 115,189 $ 141,444 Operations outside the United States: Brazil 212,186 191,415 119,066 99,956 The Netherlands 23,729 32,156 9,117 14,172 China 23,037 25,165 14,141 14,430 Hungary 13,440 17,681 5,829 7,461 India 7,874 6,150 5,575 4,007 General corporate (b) 49,032 48,590 1,040 1,090 Cash and cash equivalents (d) 50,056 52,617 n/a n/a Total $ 788,626 $ 793,008 $ 269,957 $ 282,560 Net Sales by Product Group (In Thousands) 2014 2013 2012 Film Products: Personal care materials $ 317,080 $ 339,559 $ 327,161 Flexible packaging films 114,348 125,712 138,028 Surface protection films 90,129 90,182 69,627 Polyethylene overwrap and polypropylene films 44,263 56,590 63,796 Films for other markets 12,867 9,196 13,265 Subtotal 578,687 621,239 611,877 Aluminum Extrusions: Nonresidential building & construction 200,707 179,437 165,159 Consumer durables 44,897 39,565 12,259 Machinery & equipment 26,907 21,936 8,773 Automotive 22,272 19,919 11,757 Residential building & construction 21,470 22,055 23,555 Distribution 15,318 13,115 15,227 Electrical 12,775 13,455 8,735 Subtotal 344,346 309,482 245,465 Total $ 923,033 $ 930,721 $ 857,342 (a) See Notes 1, 3, 4 and 18 for more information on losses associated with plant shutdowns, asset impairments and restructurings, unusual items, gains or losses from sale of assets, gains or losses on an investment accounted for under the fair value method and other items. (b) We recognize in theThe balance sheets include the funded status of each of ourthe Company’s defined benefit pension and other postretirement plans. The funded status of ourthe Company’s defined benefit pension plan was a net liability of $83.3 million, $57.8$96.4 million and $8.3$42.5 million in “Other noncurrent liabilities” as of December 31, 2012, 20112014 and 2010.2013, respectively. See Note 14 for more information on ourthe Company’s pension and other postretirement plans.(c) The difference between total consolidated sales as reported in the consolidated statements of income and segment, geographic and geographicproduct group net sales reported in this note is freight of $28.8 million in 2014, $28.6 million in 2013 and $24.8 million in 2012, $18.5 million in 2011 and $17.8 million in 2010.2012.(d) Information on exports and foreign operations are provided on the nextprevious page. Cash and cash equivalents includes funds held in locations outside the U.S. of $28.6 million, $42.3$40.5 million and $35.7$38.6 million at December 31, 2012, 20112014 and 2010,2013, respectively. Export sales relate almost entirely to Film Products. Operations outside the U.S. in The Netherlands, Hungary, China, Italy (sold in 2011), Brazil and India also relate to Film Products. Sales from our locations in The Netherlands Hungary and ItalyHungary are primarily to customers located in Europe. Sales from our locations in China (Guangzhou and Shanghai) are primarily to customers located in China, but also include other customers in Asia. Sales activity at the new film products manufacturing facility in India were not significant in 2011.Identifiable Assets 2012 2011 $ 551,842 $ 574,571 129,279 78,661 681,121 653,232 53,222 40,917 48,822 68,939 783,165 763,088 — 17,522 $ 783,165 $ 780,610 Depreciation and Amortization Capital Expenditures 2012 2011 2010 2012 2011 2010 $ 39,202 $ 36,315 $ 34,448 $ 30,484 $ 13,107 $ 15,839 9,984 8,333 9,054 2,332 2,697 4,339 49,186 44,648 43,502 32,816 15,804 20,178 73 75 74 436 76 236 49,259 44,723 43,576 33,252 15,880 20,414 10 12 12 — — 4 $ 49,269 $ 44,735 $ 43,588 $ 33,252 $ 15,880 $ 20,418 Net Sales by Geographic Area (d) 2012 2011 2010 $ 480,041 $ 462,479 $ 414,617 57,639 56,050 68,818 46,948 49,428 50,534 5,186 6,171 8,572 3,145 4,413 2,684 121,373 43,528 24,302 67,758 80,509 81,945 41,285 33,824 23,645 30,636 32,740 35,999 3,331 — — — 6,790 9,272 $ 857,342 $ 775,932 $ 720,388 Property, Plant & Equipment,
Net by Geographic Area (d) 2012 2011 2012 2011 $ 412,822 $ 369,173 $ 126,072 $ 119,650 181,663 191,695 77,723 80,992 37,076 40,973 19,443 24,850 25,167 28,469 16,584 18,931 17,887 16,480 7,782 7,326 6,506 6,442 4,653 4,705 53,222 40,917 1,160 797 48,822 68,939 n/a n/a 783,165 763,088 253,417 257,251 — 17,522 — 23 $ 783,165 $ 780,610 $ 253,417 $ 257,274 See footnotes on prior page and a reconciliation of net sales to sales as shown in the consolidated statements of income.Net Sales by Product Group 2012 2011 2010 $ 327,161 $ 352,376 $ 358,597 138,028 28,256 — 69,627 69,452 85,451 63,796 67,282 61,148 13,265 18,174 15,553 611,877 535,540 520,749 165,159 166,229 134,467 23,555 31,444 29,554 15,227 14,700 9,793 12,259 4,784 3,532 11,757 13,176 15,058 8,773 5,665 2,571 6,140 4,394 4,664 2,595 — — 245,465 240,392 199,639 $ 857,342 $ 775,932 $ 720,388 See footnotes on prior pages and a reconciliation of net sales to sales as shown in the consolidated statements of income.66 ACCOUNTS AND OTHER RECEIVABLES receivablereceivables consist of the following: 2012 2011 $ 96,686 $ 95,470 3,551 2,315 $ 100,237 $ 97,785 (In Thousands) 2014 2013 Trade, less allowance for doubtful accounts and sales returns of $2,610 in 2014 and $3,327 in 2013 $ 106,093 $ 94,684 Other 7,248 4,562 Total $ 113,341 $ 99,246 20122014 is as follows: 2012 2011 2010 $ 3,539 $ 5,286 $ 5,299 1,589 1,525 1,779 (1,076 ) (1,489 ) (1,633 ) (588 ) (2,508 ) (25 ) 88 725 (134 ) $ 3,552 $ 3,539 $ 5,286 (In Thousands) 2014 2013 2012 Balance, beginning of year $ 3,327 $ 3,552 $ 3,539 Charges to expense 1,344 1,874 1,589 Recoveries (1,654 ) (1,760 ) (1,076 ) Write-offs (153 ) (285 ) (588 ) Foreign exchange and other (254 ) (54 ) 88 Balance, end of year $ 2,610 $ 3,327 $ 3,552 77 INVENTORIES 2012 2011 $ 16,138 $ 11,103 7,451 6,874 28,758 24,148 22,323 19,165 $ 74,670 $ 61,290 (In Thousands) 2014 2013 Finished goods $ 17,559 $ 14,953 Work-in-process 10,089 7,750 Raw materials 25,227 24,477 Stores, supplies and other 21,433 23,483 Total $ 74,308 $ 70,663 $10.9$12.2 million at December 31, 20122014 and $12.1$10.0 million at December 31, 2011,2013, which are below replacement costs by approximately $20.5$18.3 million at December 31, 20122014 and $20.2$15.8 million at December 31, 2011.2013. During 2012, 20112014, 2013 and 2010,2012, certain inventories accounted for on a LIFO basis declined, which resulted in cost of goods sold being stated at below current replacement costs, by approximately $1.0 million in Film Products in 2014, $0.9 million in Film Products in 2013 and $2.7 million in 2012 ($1.1 million in Film Products and $1.6 million in Aluminum Extrusions), $1.1 million in Film Products in 2011 and $2.6 million in 2010 ($0.9 million in Film Products and $1.7 million in Aluminum Extrusions).88 GOODWILL AND OTHER INTANGIBLE ASSETS 20122014 and 2011,2013, and related amortization periods for continuing operations are as follows: 2012 2011 Amortization Periods $ 177,181 $ 165,372 Not amortized 31,163 30,850 10-12 years 17,145 16,042 Not more than 15 years 13,332 9,049 Indefinite life 2,359 2,119 2 years 63,999 58,060 $ 241,180 $ 223,432 (In Thousands) 2014 2013 Amortization Periods Goodwill $ 169,687 $ 172,788 Not amortized Other identifiable intangibles: Customer relationships (cost basis of $29,117 in 2014 and $31,357 in 2013) 21,620 25,962 10-12 years Proprietary technology (cost basis of $18,228 in 2014 and $18,851 in 2013) 11,824 14,356 Not more than 15 years Trade names 11,998 12,594 Indefinite life Non-compete agreements (cost basis of $4,154 in 2014 and 2013) — 600 2 years Total carrying value of other intangibles 45,442 53,512 Total carrying value of goodwill and other intangibles $ 215,129 $ 226,300 20122014 is as follows: 2012 2011 2010 $ 165,372 $ 103,639 $ 104,290 14,256 63,214 — (2,447 ) (1,481 ) (651 ) $ 177,181 $ 165,372 $ 103,639 Based on the severity of the economic downturn and its impact on the sales volumes of our aluminum extrusions business, the resulting operating loss in the first quarter of 2009, possible future losses and the uncertainty in the amount and timing of an economic recovery, a goodwill impairment charge of $30.6 million ($30.6 million after taxes) was recognized in Aluminum Extrusions in 2009. (In Thousands) 2014 2013 2012 Net carrying value of goodwill, beginning of year $ 172,788 $ 176,620 $ 165,372 Acquisitions — — 13,695 Increase (decrease) due to foreign currency translation (3,101 ) (3,832 ) (2,447 ) Net carrying value of goodwill, end of year $ 169,687 $ 172,788 $ 176,620 2012,2014, the goodwill balance was $162.9$156.0 million for Film Products and $14.3$13.7 million for Aluminum Extrusions. Amount
(In Thousands) $ 6,786 5,628 4,903 4,891 4,891 Year 2015 $ 4,741 2016 4,702 2017 4,702 2018 4,702 2019 4,568 99 FINANCIAL INSTRUMENTS We useOurThese derivative financial instruments are designated as and qualify as cash flow hedges and are recognized in the consolidated balance sheet at fair value. The fair value of derivative instruments recorded on the consolidated balance sheets are based upon Level 2 inputs. If individual derivative instruments with the same counterparty can be settled on a net basis, we recordthe Company records the corresponding derivative fair values as a net asset or net liability.we enterAluminum Extrusions enters into fixed-price forward sales contracts with certain customers for the future sale of fixed quantities of aluminum extrusions at scheduled intervals. In order to hedge our margin exposure created from the fixing of future sales prices relative to volatile raw material (aluminum) costs, we enterAluminum Extrusions enters into a combination of forward purchase commitments and futures contracts to acquire or hedge aluminum, based on the scheduled purchases for the firm sales commitments. The fixed-price firm sales commitments and related hedging instruments generally have durations of not more than 12 months, and the notional amount of aluminum futures contracts that hedged future purchases of aluminum to meet fixed-price forward sales contract obligations was $6.2$8.6 million (6.7(7.8 million pounds of aluminum) at December 31, 20122014 and $10.8$8.0 million (11.0(8.4 million pounds of aluminum) at December 31, 2011.20122014 and 2011: December 31, 2012 December 31, 2011 Balance Sheet
Account Fair
Value Balance Sheet
Account Fair
Value Prepaid expenses and other $ 226 Accrued expenses $ 21 Prepaid expenses and other $ 88 Accrued expenses $ 677 $ — Accrued expenses $ 18 $ — Accrued expenses $ 18 December 31, 2014 December 31, 2013 (In Thousands) Derivatives Designated as Hedging Instruments Accrued expenses $ 82 Accrued expenses $ 31 Accrued expenses $ (318 ) Accrued expenses $ (178 ) Derivatives Not Designated as Hedging Instruments Accrued expenses $ 7 Accrued expenses $ — Accrued expenses $ (7 ) Accrued expenses $ — Net asset (liability) $ (236 ) $ (147 ) usAluminum Extrusions for any losses on the related aluminum futures and/or forward purchase contracts through the date of cancellation. The offsetting asset and liability positions for derivatives not designated as hedging instruments included in the table above are associated with the unwinding of aluminum futures contracts that relatedue to such cancellations.We haveourits multi-year capacity expansion project at ourthe film products manufacturing facility in Cabo de Santo Agostinho, Brazil. We are usingThe Company used fixed rate Euro forward contracts with various settlement dates through November 2013February 2014 to hedge exchange rate exposure on these obligations. WeThe Company had fixed rate forward contracts with outstanding notional amounts of €9.9€2.1 million as of December 31, 20122013 (none at December 31, 2011)2014).2012 (none at December 31, 2011): December 31, 2012 Balance Sheet
Account Fair
Value
Foreign currency forward contracts Prepaid expenses
and other $ 948 We receive2014 and 2013: December 31, 2014 December 31, 2013 (In Thousands) Derivatives Designated as Hedging Instruments $ — $ 47 Net asset (liability) $ — $ 47 ourits operations in Europe. From time to time we useTredegar uses zero-cost collar currency options to hedge a portion of ourits exposure to changes in cash flows due to variability in U.S. Dollar and Euro exchange rates. There were no outstanding notional amounts on these collars at December 31, 20122014 and 20112013 as there were no derivatives outstanding related to the hedging of royalty payments with currency options.ourthe Company’s forward purchase commitments are major aluminum brokers and suppliers, and the counterparties to our aluminum futures contracts are major financial institutions. Fixed-price forward sales contracts are only made available to ourthe best and most credit-worthy customers. The counterparties to ourTredegar’s foreign currency futures and zero-cost collar contracts are major financial institutions.2012, 2011,2014, 2013, and 20102012 is summarized in the tables below:(In Thousands) Cash Flow Derivative Hedges Aluminum Futures Contracts Foreign Currency Forwards and Options 2012 2011 2010 2012 2011 2010 $ (232 ) $ (802 ) $ (102 ) $ 1,421 $ — $ (284 )
Cost of
sales
Cost of
sales
Cost of
sales
Selling,
general and
admin. exp.
$ (1,026 ) $ 308 $ 641 $ — $ — $ (271 ) (In Thousands) Cash Flow Derivative Hedges Aluminum Futures Contracts Foreign Currency Forwards and Options Years Ended December 31, 2014 2013 2012 2014 2013 2012 Amount of pre-tax gain (loss) recognized in other comprehensive income $ 542 $ (868 ) $ (232 ) $ (120 ) $ (77 ) $ 1,421 Location of gain (loss) reclassified from accumulated other comprehensive income into net income (effective portion) Cost of
sales Amount of pre-tax gain (loss) reclassified from accumulated other comprehensive income to net income (effective portion) $ 631 $ (583 ) $ (1,026 ) $ 16 $ — $ — 2012, 20112014, 2013 and 2010.2012. For the years ended December 31, 2012, 20112014, 2013 and 2010,2012, unrealized net losses from hedges that were discontinued were not significant. As of December 31, 2012, we expect $0.12014, the Company expects $0.2 million of unrealized after-tax gainslosses on derivative instruments reported in accumulated other comprehensive income to be reclassified to earnings within the next 12 months.1010 ACCRUED EXPENSES 2012 2011 $ 7,088 $ 4,700 6,124 6,864 4,316 4,740 3,840 3,003 3,056 3,350 2,564 1,863 2,457 2,599 13,069 13,769 $ 42,514 $ 40,888 (In Thousands) 2014 2013 Vacation $ 7,266 $ 7,077 Payrolls, related taxes and medical and other benefits 4,119 5,679 Incentive compensation 3,803 4,148 Workers’ compensation and disabilities 3,007 2,753 Accrued utilities 2,186 2,494 Taxes other than federal income and payroll 841 2,153 Contractual indemnification claims (see note 3) — 2,604 Other 10,827 15,250 Total $ 32,049 $ 42,158 20122014 is as follows: Severance Long-Lived
Asset
Impairments Other (a) Total $ 823 $ — $ 3,158 $ 3,981 165 608 — 773 (751 ) — (1,565 ) (2,316 ) — (608 ) — (608 ) 237 — 1,593 1,830 541 1,367 — 1,908 (581 ) (1,593 ) (2,174 ) — (1,367 ) — (1,367 ) 197 — — 197 1,562 1,077 2,255 4,894 (1,463 ) (1,670 ) (3,133 ) — (1,077 ) — (1,077 ) $ 296 $ — $ 585 $ 881 (In Thousands) Severance Asset Impairments Other (a) Total Balance at January 1, 2012 $ 197 $ — $ — $ 197 For the year ended December 31, 2012: Charges 1,562 1,077 2,255 4,894 Cash spend (1,463 ) — (1,670 ) (3,133 ) Charges against assets — (1,077 ) — (1,077 ) Balance at December 31, 2012 296 — 585 881 For the year ended December 31, 2013: Charges 671 172 569 1,412 Cash spend (636 ) — (798 ) (1,434 ) Charges against assets — (172 ) — (172 ) Balance at December 31, 2013 331 — 356 687 For the year ended December 31, 2014: Charges 2,668 227 131 3,026 Cash spend (2,753 ) — (286 ) (3,039 ) Charges against assets — (227 ) — (227 ) Balance at December 31, 2014 $ 246 $ — $ 201 $ 447 (a) Other includes primarily accrued losses on a sub-lease at a facility in Princeton, New Jersey and other shutdown-related costs associated with the shutdown of ourthe Company’s aluminum extrusions manaufacturingmanufacturing facility in Kentland, Indiana.1111 DEBT AND CREDIT AGREEMENTS weTredegar entered into a $350 million five-year, unsecured revolving credit facility (the “Credit Agreement”), with an option to increase that amount by an additional $75 million. The Credit Agreement replaced ourthe previous $300 million four-year, unsecured revolving credit facility that was due to expire on June 21, 2014. In connection with the refinancing, wethe Company borrowed $102 million under the Credit Agreement, which was used, together with available cash on hand, to repay all indebtedness under ourthe previous revolving credit facility. Credit Spread
Over LIBOR Commitment
Fee 200 35 175 30 150 25 Pricing Under Credit Revolving Agreement (Basis Points) Indebtedness-to-Adjusted EBITDA Ratio > 2.0x but <= 3.0x 200 35 > 1.0x but <=2.0x 175 30 <= 1.0x 150 25 2012,2014, the interest cost on debt borrowed under the Credit Agreement was priced at one-month LIBOR plus the applicable credit spread of 150175 basis points.2012,2014, based upon the most restrictive covenants within the Credit Agreement, available credit under the Credit Agreement was approximately $199$155 million. Total debt due and outstanding at December 31, 20122014 is summarized below: Credit
Agreement Other Total Debt
Due $ — $ — $ — — — — — — — — — — 128,000 — 128,000 $ 128,000 $ — $ 128,000 We believe we wereYear Due Other 2015 $ — $ — $ — 2016 — — — 2017 137,250 — 137,250 2018 — — — 2019 — — — Total $ 137,250 $ — $ 137,250 ourits debt covenants as of December 31, 2012.2014. Noncompliance with any of the debt covenants may have a material adverse effect on financial condition or liquidity in the event such noncompliance cannot be cured or should wethe Company be unable to obtain a waiver from the lenders. Renegotiation of the covenant through an amendment to the Credit Agreement may effectively cure the noncompliance, but may have an effect on financial condition or liquidity depending upon how the covenant is renegotiated.1212 SHAREHOLDER RIGHTS AGREEMENT anthe Second Amended and Restated Rights Agreement (the “Rights Agreement”), dated as of June 30, 2009,November 18, 2013, with Computershare Investor Services,Trust Company, N.A., as Rights Agent, (essentially renewing and extending our Rights Agreement, dated as of June 30, 1999), as amended, one purchase right is attendant(a “Right”) was attached to each outstanding share of our common stock (“Right”). All Rights outstanding under the previous Rights Plan remain outstanding under the Amended and Restated Rights Agreement.entitlesentitled the registered holder to purchase from Tredegar one one-hundredth of a share of Tredegar’s Series A Participating Cumulative Preferred Stock Series A (the “Preferred Stock”), at an exercise price of $150, subject to adjustment (the “Purchase Price”). TheUnless otherwise noted in the Rights willAgreement, the Rights would have become exercisable, if not earlier redeemed, only if a person or group (i) acquires 15%beneficial ownership of 20% or more of the outstanding shares of our common stock (thereby becomingthe Company’s Common Stock or (ii) commences, or publicly discloses an “Acquiring Person”)intention to commence, a tender offer or announces a tenderexchange offer that would result in beneficial ownership by a person or group of 15%20% or more of our common stock. Any action bythe outstanding shares of the Company’s Common Stock (in each case thereby becoming an “Acquiring Person”). person or group whose beneficial ownership was reported on Amendment No. 4redemption price of $.01 per Right to be paid in cash to shareholders of record as of the Schedule 13D filed with respect to Tredegarclose of business on March 20, 1997, cannot cause3, 2014, with the payment date of such person or groupredemption price to become an Acquiring Person and thereby cause the Rights to become exercisable.Each holder of a Right, upon the occurrence of certain events, will become entitled to receive, upon exercise andbe on March 7, 2014. The corresponding redemption payment of the Purchase Price, Preferred Stock (or$0.3 million was made in certain circumstances, cash, property or other securities of Tredegar or a potential acquirer) having a value equal to twice the amount of the Purchase Price.The Rights are scheduled to expire on June 30, 2019.1313 STOCK OPTION AND STOCK AWARD PLANS We havewe havethe Company has one other equity incentive plan under which there are options that remain outstanding, but no future grants can be made. Prior to 2012, employee options ordinarily vestvested two years from the date of grant. Employee options granted in 2012 and thereafter ordinarily vest over a four yearfour-year period, with a quarter of the options granted vesting on each year on the grant date anniversary. The option plans also permit the grant of stock appreciation rights (“SARs”), stock, restricted stock, stock unit awards and incentive awards. Restricted stock grants ordinarily vest three years from the date of grant based upon continued employment and/or the achievement of certain performance targets. No SARs have been granted since 1992 and none are currently outstanding. our stock options outstanding at December 31, 2012, 20112014, 2013 and 2010,2012, and changes during those years, is presented below: Option Exercise Price/Share Number of
Options Range Weighted
Average 796,175 $ 13.95 to $ 19.52 $ 16.29 316,000 16.66 to 17.54 17.15 (29,325 ) 13.95 to 18.12 16.37 (65,575 ) 13.95 to 15.80 15.04 1,017,275 13.95 to 19.52 16.64 235,800 16.87 to 19.84 19.79 (51,800 ) 13.95 to 19.84 16.78 (79,775 ) 13.95 to 18.12 15.11 1,121,500 14.06 to 19.84 17.40 182,100 18.51 to 19.40 19.34 (50,300 ) 15.80 to 19.84 19.34 (176,600 ) 14.72 to 18.12 16.33 1,076,700 $ 14.06 to $ 19.84 $ 17.81 Option Exercise Price/Share Range Outstanding at January 1, 2012 1,121,500 $ 14.06 to $ 19.84 $ 17.40 Granted 182,100 18.51 to 19.40 19.34 Forfeited and Expired (50,300 ) 15.80 to 19.84 19.34 Exercised (176,600 ) 14.72 to 18.12 16.33 Outstanding at December 31, 2012 1,076,700 14.06 to 19.84 17.81 Granted 184,700 24.84 to 30.01 24.97 Forfeited and Expired (34,000 ) 15.11 to 24.84 21.10 Exercised (180,600 ) 14.27 to 19.84 17.32 Outstanding at December 31, 2013 1,046,800 14.06 to 30.01 19.06 Granted 181,476 19.84 to 22.49 22.41 Forfeited and Expired (22,581 ) 15.80 to 24.84 21.42 Exercised (41,575 ) 15.80 to 19.84 17.55 Outstanding at December 31, 2014 1,164,120 $ 14.06 to $ 30.01 $ 19.59 2012: Options Outstanding at
December 31, 2012 Options Exercisable at
December 31, 2012 Weighted Average Range of
Exercise Prices Shares Remaining
Contract-
ual Life
(Years) Exercise
Price Shares Weighted
Average
Exercise
Price $ — to $ 15.00 35,500 2.9 $ 14.20 $ 221 35,500 $ 14.20 $ 221 15.01 to 17.00 218,800 3.5 15.79 1,013 217,000 15.78 1,006 17.01 to 20.00 822,400 5.0 18.51 1,572 462,300 17.66 1,276 Total 1,076,700 4.7 $ 17.81 $ 2,806 714,800 $ 16.92 $ 2,503 Weighted Average Aggregate Intrinsic Value
(In Thousands) Shares Remaining Contractual Life (Years) Shares $ — to $ 15.00 26,000 0.9 $ 14.06 $ 219 26,000 $ 14.06 $ 219 15.01 to 17.50 314,500 1.2 16.53 1,873 314,500 16.53 1,873 17.51 to 20.00 488,870 3.3 19.03 1,693 417,550 18.97 1,470 20.01 to 25.00 330,250 8.7 23.61 — 40,875 24.84 — 25.01 to 30.01 4,500 8.6 30.01 — 1,125 30.01 — Total 1,164,120 4.2 $ 19.59 $ 3,785 800,050 $ 18.17 $ 3,562 2012: Non-vested Restricted Stock Maximum Non-vested Restricted
Stock Units Issuable Upon Satis-
faction of Certain Performance Criteria Number
of Shares Wgtd. Ave.
Grant Date
Fair Value/Sh. Grant Date
Fair Value
(In Thousands) Number
of Shares Wgtd. Ave.
Grant Date
Fair Value/Sh. Grant Date
Fair Value
(In Thousands) 45,750 $ 17.70 $ 810 72,175 $ 17.64 $ 1,273 56,717 17.23 977 82,750 16.83 1,393 (8,284 ) 17.84 (148 ) — — — (333 ) 18.12 (6 ) (4,000 ) 17.10 (68 ) 93,850 17.40 1,633 150,925 17.21 2,598 51,360 19.42 997 88,900 19.32 1,718 (18,060 ) 17.20 (311 ) (66,925 ) 17.68 (1,183 ) (1,000 ) 17.13 (17 ) (87,900 ) 16.93 (1,488 ) 126,150 18.25 2,302 85,000 19.35 1,645 94,949 19.06 1,810 87,200 18.79 1,638 (60,357 ) 18.01 (1,087 ) — — — (16,842 ) 18.82 (317 ) (80,400 ) 19.31 (1,553 ) 143,900 $ 18.82 $ 2,708 91,800 $ 18.85 $ 1,730 Non-vested Restricted Stock Maximum Non-vested Restricted Stock Units Issuable Upon Satisfaction of Certain Performance Criteria Weighted Avg. Grant Date Fair Value/Share Weighted Avg. Grant Date Fair Value/Share Outstanding at January 1, 2012 126,150 $ 18.25 $ 2,302 85,000 $ 19.35 $ 1,645 Granted 94,949 19.06 1,810 87,200 18.79 1,638 Vested (60,357 ) 18.01 (1,087 ) — — — Forfeited (16,842 ) 18.82 (317 ) (80,400 ) 19.31 (1,553 ) Outstanding at December 31, 2012 143,900 18.82 2,708 91,800 18.85 1,730 Granted 93,425 25.45 2,378 77,200 27.82 2,148 Vested (58,175 ) 20.15 (1,172 ) — — — Forfeited (21,300 ) 20.70 (441 ) (36,700 ) 19.83 (728 ) Outstanding at December 31, 2013 157,850 22.00 3,473 132,300 23.81 3,150 Granted 95,707 22.18 2,123 59,675 21.54 1,285 Vested (54,921 ) 20.73 (1,139 ) — — — Forfeited (10,578 ) 21.76 (230 ) (62,262 ) 19.18 (1,194 ) Outstanding at December 31, 2014 188,058 $ 22.48 $ 4,227 129,713 $ 24.99 $ 3,241 2012, $0.4 million in 2011 and $0.2 million in 2010.2012. The grant-date fair value of stock option-based awards vested was $0.7 million in 2014, $1.7 million in 2013 and $2.1 million in 2012, $1.9 million in 2011 and $1.9 million in 2010.2012. As of December 31, 2012,2014, there was unrecognized compensation cost of $0.8$1.3 million related to stock option-based awards and $1.3$2.3 million related to non-vested restricted stock and other stock-based awards. This cost is expected to be recognized over the remaining weighted average period of 0.91.4 years for stock option-based awards and 1.61.4 years for non-vested restricted stock and other stock-based awards.714,800800,050 at December 31, 20122014 and 600,400769,825 shares at December 31, 2011.2013. Stock options available for grant totaled 2,607,0012,198,235 shares at December 31, 2012.1414 RETIREMENT PLANS AND OTHER POSTRETIREMENT BENEFITS We sponsormostcertain current and former employees. The plans for salaried and hourly employees currently in effect are based on a formula using the participant’s years of service and compensation or using the participant’s years of service and a dollar amount. The plan is closed to new participants, and based on plan changes announced in 2006, pay for active participants of the plan was frozen as of December 31, 2007.we providethe Company provides postretirement life insurance and health care benefits for certain groups of employees. Tredegar and retirees share in the cost of postretirement health care benefits, with employees hired on or before January 1, 1993, receiving a fixed subsidy to cover a portion of their health care premiums. WeThe Company eliminated prescription drug coverage for Medicare-eligible retirees as of January 1, 2006. Consequently, we areTredegar is not eligible for any federal subsidies.20122014 and 2011,2013, and reconcile the funded status to prepaid or accrued cost at December 31, 20122014 and 2011: Pension Benefits Other Post-
Retirement Benefits 2012 2011 2012 2011 $ 272,436 $ 247,969 $ 8,422 $ 7,350 3,657 3,361 58 54 13,084 13,024 385 395 26,843 16,986 549 414 — 6,314 — (52 ) — — — 449 (1,372 ) (3,399 ) (243 ) 122 (12,363 ) (11,819 ) (292 ) (310 ) $ 302,285 $ 272,436 $ 8,879 $ 8,422 $ 214,647 $ 239,706 $ — $ — 14,455 (13,413 ) — — 2,296 173 292 310 (12,363 ) (11,819 ) (292 ) (310 ) $ 219,035 $ 214,647 $ — $ — $ (83,250 ) $ (57,789 ) $ (8,879 ) $ (8,422 ) $ — $ — $ — $ — (83,250 ) (57,789 ) (8,879 ) (8,422 ) $ (83,250 ) $ (57,789 ) $ (8,879 ) $ (8,422 ) Pension Benefits (In Thousands) 2014 2013 2014 2013 Change in benefit obligation: Benefit obligation, beginning of year $ 275,166 $ 302,285 $ 7,858 $ 8,879 Service cost 869 3,754 43 58 Interest cost 13,397 12,338 387 345 Effect of actuarial (gains) losses related to the following: Discount rate change 32,089 (26,848 ) 732 (746 ) Retirement rate assumptions and mortality table adjustments 17,331 (144 ) (131 ) — Retiree medical participation rate change — — (390 ) — Other 490 (3,058 ) 218 (382 ) Plan participant contributions — — 681 683 Benefits paid (13,916 ) (13,161 ) (1,026 ) (979 ) Benefit obligation, end of year $ 325,426 $ 275,166 $ 8,372 $ 7,858 Change in plan assets: Plan assets at fair value, beginning of year $ 232,705 $ 219,035 $ — $ — Actual return on plan assets 7,466 21,657 — — Employer contributions 2,762 5,174 345 296 Plan participant contributions — — 681 683 Benefits paid (13,916 ) (13,161 ) (1,026 ) (979 ) Plan assets at fair value, end of year $ 229,017 $ 232,705 $ — $ — Funded status of the plans $ (96,409 ) $ (42,461 ) $ (8,372 ) $ (7,858 ) Amounts recognized in the consolidated balance sheets: Accrued expenses (current) $ 130 $ — $ 456 $ — Other noncurrent liabilities 96,279 42,461 7,916 7,858 Net amount recognized $ 96,409 $ 42,461 $ 8,372 $ 7,858 Pension Benefits Other Post-
Retirement Benefits 2012 2011 2010 2012 2011 2010 4.21 % 4.95 % 5.45 % 4.10 % 4.90 % 5.35 % n/a n/a n/a n/a n/a n/a 4.95 % 5.45 % 5.70 % 4.90 % 5.35 % 5.75 % n/a n/a n/a n/a n/a n/a 7.75 % 8.00 % 8.25 % n/a n/a n/a $ (3,657 ) $ (3,361 ) $ (3,315 ) $ (58 ) $ (54 ) $ (76 ) (13,084 ) (13,024 ) (13,071 ) (385 ) (395 ) (467 ) 19,108 20,448 20,530 — — — (10,377 ) (6,359 ) (4,806 ) 241 264 79 (99 ) — — — — — $ (8,109 ) $ (2,296 ) $ (662 ) $ (202 ) $ (185 ) $ (464 ) Pension Benefits (In Thousands, Except Percentages) 2014 2013 2012 2014 2013 2012 Weighted-average assumptions used to determine benefit obligations: Discount rate 4.17 % 4.99 % 4.21 % 4.11 % 4.88 % 4.10 % Weighted-average assumptions used to determine net periodic benefit cost: Discount rate 4.99 % 4.21 % 4.95 % 4.88 % 4.10 % 4.90 % Expected long-term return on plan assets 7.75 % 7.75 % 8.00 % n/a n/a n/a Components of net periodic benefit cost: Service cost $ 869 $ 3,754 $ 3,657 $ 43 $ 58 $ 58 Interest cost 13,397 12,338 13,084 387 345 385 Expected return on plan assets (18,301 ) (17,430 ) (19,108 ) — — — Amortization of prior service costs and gains or losses 10,688 15,028 10,377 (190 ) (210 ) (241 ) Settlement/curtailment 81 28 99 — — — Net periodic benefit cost $ 6,734 $ 13,718 $ 8,109 $ 240 $ 193 $ 202 Pension and other postretirement liabilities for continuing operations of $92.1 million and $66.2 million are included in “Other noncurrent liabilities” in the consolidated balance sheets at December 31, 2012 and 2011, respectively. The amount of ourthe accumulated benefit obligation is the same as ourthe projected benefit obligation.2012,2014, the effect of a 1% change in the health care cost trend rate assumptions would be immaterial.2018-20222020-2024 are as follows: Pension
Benefits Other
Post-
Retirement
Benefits $ 13,797 $ 474 14,559 492 15,316 507 15,883 522 16,442 530 89,505 2,731 (In Thousands) 2015 $ 15,282 $ 456 2016 15,932 471 2017 16,527 480 2018 17,004 489 2019 17,555 494 2020—2024 93,535 2,511 2012, 20112014, 2013 and 20102012 before related deferred income taxes in accumulated other comprehensive income consist of: Pension Other Post-
Retirement 2012 2011 2010 2012 2011 2010 $ (887 ) $ (1,890 ) $ (2,966 ) $ — $ — $ — 167,009 148,364 102,037 (855 ) (1,401 ) (2,598 ) Pension Other Post-Retirement (In Thousands) 2014 2013 2012 2014 2013 2012 Prior service cost (benefit) $ 87 $ 270 $ (887 ) $ — $ — $ — Net actuarial (gain) loss 166,678 116,519 167,009 (1,154 ) (1,773 ) (855 ) 20132015 are as follows: Pension Other Post-
Retirement $ (1,184 ) $ — 15,943 (162 ) (In Thousands) Pension Prior service cost (benefit) $ 24 $ — Net actuarial (gain) loss 16,107 (160 ) 2012, 20112014, 2013 and 20102012 are as follows: % Composition of Plan Assets
at December 31, 2012 2011 2010 14.7 % 9.7 % 1.9 % 10.9 15.9 22.3 5.4 6.2 6.7 10.0 14.3 21.6 26.3 36.4 50.6 50.0 41.8 42.7 9.0 12.1 4.8 100.0 % 100.0 % 100.0 % Our 2014 2013 2012 Pension plans related to continuing operations: Fixed income securities 14.5 % 14.0 % 14.7 % Large/mid-capitalization equity securities 13.7 13.8 10.9 Small-capitalization equity securities 4.3 4.8 5.4 International and emerging market equity securities 11.0 11.7 10.0 Total equity securities 29.0 30.3 26.3 Private equity and hedge funds 51.2 48.3 50.0 Other assets 5.3 7.4 9.0 Total for continuing operations 100.0 % 100.0 % 100.0 % isused to determine its benefit obligation at December 31, 2014 are as follows: Target %
Composition of
Plan Assets * Expected
Long-term
Return % 32.0 % 5.5 % 10.0 9.0 4.0 10.2 13.0 9.9 27.0 9.6 41.0 8.4 — — 100.0 % 7.8 % Target % Composition of Plan Assets * Expected Long-term Return % Pension plans related to continuing operations: Fixed income securities 32.0 % 5.5 % Large/mid-capitalization equity securities 10.0 8.8 Small-capitalization equity securities 4.0 9.9 International and emerging market equity securities 13.0 9.8 Total equity securities 27.0 9.4 Private equity and hedge funds 41.0 7.8 Total for continuing operations 100.0 % 7.5 % Target percentages for the composition of plan assets represents a neutral position within the approved range of allocations for such assets. OurThe Company’s primary investment objective is to maximize total return with a strong emphasis on the preservation of capital. We believecapital, and it believes that over the long termlong-term a diversified portfolio of fixed income securities, equity securities, hedge funds and private equity funds has a better risk-return profile than fixed income securities alone. The average remaining duration of benefit payments for ourthe pension plans is about 1312.7 years. We expect ourThe Company expects its required contributions to be approximately $0.2$2.4 million in 2013.ourthe Company’s pension plans are provided by third parties not affiliated with Tredegar. At December 31, 2012,2014 and 2013, the pension plan assets are categorized by level within the fair value measurement hierarchy as follows:(In Thousands) Total Quoted Prices
in Active
Markets for
Identical Assets
(Level 1) Signficant
Other
Observable
Inputs
(Level 2) Significant
Unobservable
Inputs
(Level 3) $ 23,845 $ 23,845 $ — $ — 11,914 11,914 — — 21,827 8,814 13,013 — 32,150 18,080 14,070 — 109,690 — 101,334 8,356 10,256 10,256 — — $ 209,682 $ 72,909 $ 128,417 $ 8,356 9,353 $ 219,035 $ 34,095 $ 31,490 $ 2,605 $ — 13,281 13,281 — — 30,611 30,611 — — 20,895 10,960 9,935 — 89,620 — 82,628 6,992 16,899 11,899 5,000 — $ 205,401 $ 98,241 $ 100,168 $ 6,992 9,246 $ 214,647 (In Thousands) Total Balances at December 31, 2014: Large/mid-capitalization equity securities $ 31,401 $ 31,401 $ — $ — Small-capitalization equity securities 9,827 9,827 — — International and emerging market equity securities 25,224 11,471 13,753 — Fixed income securities 33,281 12,661 20,620 — Private equity and hedge funds 117,276 — 106,201 11,075 Other assets 1,741 1,741 — — Total plan assets at fair value $ 218,750 $ 67,101 $ 140,574 $ 11,075 Contracts with insurance companies 10,267 Total plan assets, December 31, 2014 $ 229,017 Balances at December 31, 2013: Large/mid-capitalization equity securities $ 32,134 $ 32,134 $ — $ — Small-capitalization equity securities 11,063 11,063 — — International and emerging market equity securities 27,271 13,488 13,783 — Fixed income securities 32,601 17,770 14,831 — Private equity and hedge funds 112,345 — 103,531 8,814 Other assets 7,871 7,871 — — Total plan assets at fair value $ 223,285 $ 82,326 $ 132,145 $ 8,814 Contracts with insurance companies 9,420 Total plan assets, December 31, 2013 $ 232,705 20112013 to December 31, 20122014 are as follows: Private equity and
hedge funds $ 8,042 2,554 (663 ) (2,673 ) (268 ) — $ 6,992 3,767 — (2,094 ) (309 ) — $ 8,356 We(In Thousands) Balance at January 1, 2013 $ 8,356 Purchases 2,864 Sales — Distributions (2,567 ) Actual return on plan assets still held at year end 161 Transfers in and/or out of Level 3 — Balance at December 31, 2013 $ 8,814 Purchases 4,142 Sales — Distributions (2,088 ) Actual return on plan assets still held at year end 207 Transfers in and/or out of Level 3 — Balance at December 31, 2014 $ 11,075 havehas a non-qualified supplemental pension plan covering certain employees. Effective December 31, 2005, further participation in this plan was terminated and benefit accruals for existing participants were frozen. The plan was designed to restore all or a part of the pension benefits that would have been payable to designated participants from ourthe principal pension plans if it were not for limitations imposed by income tax regulations. The projected benefit obligation relating to this unfunded plan was $2.8$2.4 million at December 31, 20122014 and $2.6$2.4 million at December 31, 2011.2013. Pension expense recognized for this plan was $0.1 million in 2012,2014, $0.1 million in 20112013 and $0.2$0.1 million in 2010.2012. This information has been included in the preceding pension benefit tables.10181 employees at our filmsthe Company’s film products manufacturing facility in Kerkrade, The Netherlands are covered by a collective bargaining agreement that includes participation in a multi-employer pension plan. Pension expense recognized for participation in this plan, which is equal to required contributions, was $0.5 million in 2012, $0.62014, $0.5 million in 20112013 and $0.6$0.5 million in 2010.2012. This information has been excluded from the preceding pension benefit tables.1515 SAVINGS PLAN We havecompanyCompany makes matching contributions to the savings plan of $1 for every $1 of employee contribution. The maximum matching contribution is 6% of base pay for 2007-2009 andcurrently 5% of base pay thereafter.Wehavehas a non-qualified plan that restores matching benefits for employees suspended from the savings plan due to certain limitations imposed by income tax regulations. Charges recognized for these plans were $1.6 million in 2014, $2.6 million in 2013 and $2.5 million in 2012, $2.5 million in 2011 and $2.6 million in 2010. Our2012. The Company’s liability under the restoration plan was $1.6$1.7 million at December 31, 20122014 (consisting of 78,61574,190 phantom shares of common stock) and $1.6$2.2 million at December 31, 20112013 (consisting of 70,58875,726 phantom shares of common stock) and valued at the closing market price on those dates.ourthe Company’s common stock in 1998 for $0.2 million and 46,671 shares of ourits common stock in 1997 for $1.0 million, as a partial hedge against the phantom shares held in the restoration plan. There have been no shares purchased since 1997 except for re-invested dividends. The cost of the shares held by the Trust is shown as a reduction to shareholders’ equity in the consolidated balance sheets.1616 RENTAL EXPENSE AND CONTRACTUAL COMMITMENTS 2012, $3.22014, $3.4 million in 20112013 and $2.9$3.6 million in 2010.2012. Rental commitments under all non-cancelable operating leases for continuing operations as of December 31, 2012,2014, are as follows: Amount
(In Thousands) $ 2,156 1,968 1,297 1,198 1,208 1,100 $ 8,927 Year 2015 $ 2,379 2016 1,908 2017 1,870 2018 1,787 2019 657 Remainder 1,327 Total $ 9,928 $16.4$4.9 million at December 31, 2012. Film Products has various contractual commitments of approximately $14 million in 2013 associated with our multi-year capacity expansion project in Cabo de Santo Agostinho.2014.1717 INCOME TAXES 2012 2011 2010 $ 35,488 $ 29,491 $ 30,430 26,016 9,298 10,060 $ 61,504 $ 38,789 $ 40,490 $ 10,905 $ 2,958 $ 14,329 796 639 1,409 7,372 4,500 4,308 19,073 8,097 20,046 1,212 3,243 (6,225 ) 163 (211 ) (771 ) (2,129 ) (885 ) 599 (754 ) 2,147 (6,397 ) $ 18,319 $ 10,244 $ 13,649 (In Thousands) 2014 2013 2012 Income from continuing operations before income taxes: Domestic $ 38,402 $ 37,380 $ 35,488 Foreign 7,014 15,552 26,016 Total $ 45,416 $ 52,932 $ 61,504 Current income taxes: Federal $ 14,568 $ 15,988 $ 10,905 State 2,178 1,416 796 Foreign 4,102 4,737 7,372 Total 20,848 22,141 19,073 Deferred income taxes: Federal (9,530 ) (2,933 ) 1,212 State (417 ) (852 ) 163 Foreign (1,514 ) (1,361 ) (2,129 ) Total (11,461 ) (5,146 ) (754 ) Total income taxes $ 9,387 $ 16,995 $ 18,319 Percent of Income Before Income
Taxes for Continuing Operations 2012 2011 2010 35.0 35.0 35.0 1.9 .9 .5 1.1 1.7 .9 .6 1.8 1.3 .3 .8 .3 — 3.5 — — — 1.8 — (1.0 ) (.8 ) — (15.3 ) — (.1 ) 1.4 1.3 (.5 ) .3 .6 (.5 ) (.1 ) (4.1 ) (.6 ) — (1.1 ) (.6 ) (.7 ) (1.8 ) (7.0 ) (1.8 ) — .2 (.1 ) (.2 ) 29.8 26.4 33.7 2014 2013 2012 Income tax expense at federal statutory rate 35.0 35.0 35.0 State taxes, net of federal income tax benefit 2.2 0.1 1.1 Tax contingency accruals and tax settlements 2.0 2.0 (0.5 ) Non-deductible expenses 0.9 0.6 0.3 Foreign rate differences (0.1 ) (0.7 ) (0.6 ) Tax incentive (0.1 ) (4.7 ) (7.0 ) Valuation allowance for foreign operating loss carry-forwards (0.4 ) 0.5 (0.1 ) Research and development tax credit (0.6 ) (0.4 ) — Domestic Production Activities Deduction (1.9 ) (1.4 ) (0.6 ) Changes in estimates related to prior year tax provision (2.3 ) (0.6 ) (0.5 ) Unremitted earnings from foreign operations (3.8 ) 0.9 0.6 Valuation allowance for capital loss carry-forwards (10.2 ) 0.8 1.9 Other — — 0.2 Effective income tax rate for continuing operations 20.7 32.1 29.8 iswas the beneficiary of certain income tax incentives that allowallowed for a reduction in the statutory Brazilian federal income tax rate levied on the operating profit of its products. These incentives produce a current tax rate of 15.25% for Terphane Ltda. (6.25% of income tax and 9.0% social contribution on income). The current incentives will expireexpired at the end of 2014, but we anticipate2014. The Company anticipates that weit will qualify for additional incentives that will extend beyond 2014.2014, but future benefits will not be recorded until the amount and extent of these incentives are more fully known. The benefit from the tax incentives was $51,000 (0 cents per share), $2.5 million (8 cents per share) and $4.3 million (13 cents per share) in 2014, 2013 and $0.7 million (2 cents per share) in 2012, and 2011, respectively.20122014 and 2011,2013, are as follows: 2012 2011 $ 47,956 $ 48,407 34,110 40,754 8,795 8,638 568 — 91,429 97,799 30,488 21,169 10,532 9,841 4,923 5,514 3,234 3,177 2,086 2,439 1,676 1,898 756 919 236 360 — 249 974 1,024 54,905 46,590 18,635 12,427 36,270 34,163 $ 55,159 $ 63,636 $ 60,773 $ 70,769 5,614 7,133 $ 55,159 $ 63,636 (In Thousands) 2014 2013 Deferred tax liabilities: Amortization of goodwill and other intangibles $ 45,696 $ 46,738 Depreciation 27,550 29,994 Foreign currency translation gain adjustment 4,233 8,620 Derivative financial instruments 316 432 Total deferred tax liabilities 77,795 85,784 Deferred tax assets: Pensions 34,214 14,813 Employee benefits 11,597 11,124 Inventory 6,221 2,292 Excess capital losses and book/tax basis differences on investments 3,282 4,316 Tax benefit on state and foreign NOL and credit carryforwards 2,967 1,871 Asset write-offs, divestitures and environmental accruals 1,593 3,734 Timing adjustment for unrecognized tax benefits on uncertain tax positions, including portion relating to interest and penalties 842 600 Allowance for doubtful accounts 479 639 Other 799 1,247 Deferred tax assets before valuation allowance 61,994 40,636 Less: Valuation allowance 14,577 20,019 Total deferred tax assets 47,417 20,617 Net deferred tax liability $ 30,378 $ 65,167 Included in the balance sheet: Noncurrent deferred tax liabilities in excess of assets $ 39,255 $ 70,795 Current deferred tax assets in excess of liabilities 8,877 5,628 Net deferred tax liability $ 30,378 $ 65,167 we believethe Company believes that it is more likely than not that future taxable income will exceed future tax deductible amounts thereby resulting in the realization of deferred tax assets. The Company has estimated gross state and foreign tax credits and net operating loss carryforwards of $3.0 million at December 31, 2014, which primarily expire at different points over the next 5 to 8 years. A valuation allowance of $1.3$2.8 million at December 31, 20122014 and 2011,$1.7 million at December 31, 2013, respectively, is providedrecorded against the tax benefit on state and foreign tax credits and net operating loss carryforwards for possible future tax benefits on domestic state and foreign operating losses generated by certain foreign and domestic subsidiaries that may not be recoverable in the carry-forwardcarryforward period. In addition, theThe valuation allowance for excess capital losses from investments and other related items was increaseddecreased from $9.3$16.4 million at December 31, 20112013 to $15.5$11.4 million at December 31, 20122014 due to changes in the relative amounts of capital gains and losses generated during the year. The amount of the deferred tax asset considered realizable, however, could be adjusted in the near term if estimates of the fair value of certain investments during the carryforward period change. Tredegar continues to evaluate opportunities to utilize capital loss carryforwards prior to their expiration at various dates in the future. As circumstances and ewe believethe Company believes it is more likely than not that the deferred tax asset will not be realized increased from $1.8was $0.4 million in 2011 toat December 31, 2014 and $1.9 million in 2012.ourthe Company’s unrecognized uncertain tax positions since January 1, 2010,2012, is shown below: Years Ended December 31, 2012 2011 2010 $ 1,025 $ 1,065 $ 996 432 185 184 (21 ) 10 493 (398 ) — (375 ) (128 ) (235 ) (233 ) $ 910 $ 1,025 $ 1,065 Years Ended December 31, (In Thousands) 2014 2013 2012 Balance at beginning of period $ 2,239 $ 910 $ 1,025 Increase (decrease) due to tax positions taken in: Current period 619 643 432 Prior period 397 686 (21 ) Increase (decrease) due to settlements with taxing authorities — — (398 ) Reductions due to lapse of statute of limitations — — (128 ) Balance at end of period $ 3,255 $ 2,239 $ 910 our unrecognized uncertain tax positions since January 1, 20102012 is summarized below: Years Ended December 31, 2012 2011 2010 $ 910 $ 1,025 $ 1,065 (212 ) (219 ) (234 ) 698 806 831 60 373 125 (23 ) (141 ) (46 ) 37 232 79 $ 735 $ 1,038 $ 910 We claimed an ordinary loss on the write-off Years Ended December 31, (In Thousands) 2014 2013 2012 Gross unrecognized tax benefits on uncertain tax positions (reflected in current income tax and other noncurrent liability accounts in the balance sheet) $ 3,255 $ 2,239 $ 910 Deferred income tax assets related to unrecognized tax benefits on uncertain tax positions (reflected in deferred income tax accounts in the balance sheet) (726 ) (540 ) (212 ) Net unrecognized tax benefits on uncertain tax positions, which would impact the effective tax rate if recognized 2,529 1,699 698 Interest and penalties accrued on deductions taken relating to uncertain tax positions (approximately $150, $100 and $(300) reflected in income tax expense in the income statement in 2014, 2013 and 2012, respectively, with the balance shown in current income tax and other noncurrent liability accounts in the balance sheet) 310 156 60 Related deferred income tax assets recognized on interest and penalties (116 ) (60 ) (23 ) Interest and penalties accrued on uncertain tax positions net of related deferred income tax benefits, which would impact the effective tax rate if recognized 194 96 37 Total net unrecognized tax benefits on uncertain tax positions reflected in the balance sheet, which would impact the effective tax rate if recognized $ 2,723 $ 1,795 $ 735 our investment in our aluminum extrusions operations in Canada (sold in February 2008) on our 2008 consolidated tax return (included in discontinued operations in the consolidated statement of income in 2007). During an audit, the IRS challenged the ordinary nature of the loss, asserting that the loss should be re-characterized as capital in nature. Had the IRS prevailed in final, non-appealable determinations, it is possible that the matter would have resulted in additional tax payments of up to $12 million, plus any interest and penalties. Prior to issuing a Notice of Deficiency, however, the IRS revised their audit report to allow the ordinary loss treatment to stand. The audit findings have been confirmed by the IRS Joint Committee review, and we expect no further challenge on this issue.Tredegar and its subsidiaries, filefiles income tax returns in the U.S., federal jurisdiction, various states and jurisdictions outside the U.S. Except for refund claims and amended returns, the IRS has provided written confirmation that they do not plan to make any additional changes to our U.S. consolidated tax returns for the years prior to 2010, although the federal statute of limitations was extended for the tax years 2006-2009 through December 31, 2013. With few exceptions, Tredegar and its subsidiaries areis no longer subject to U.S. federal, state or non-U.S. income tax examinations by tax authorities for years before 2009. We believe2011. The Company anticipates that it is reasonably possible thata state income tax audit may settle within the next 12 months, which could result in the recognition of up to approximately $0.1$1.4 million of the balance of unrecognized state tax positions may be recognized within the next twelve months as a result of a lapse of the statute of limitations.1818 LOSSES ASSOCIATED WITH PLANT SHUTDOWNS, ASSET IMPAIRMENTS AND RESTRUCTURINGS, UNUSUAL ITEMS, GAINS FROM SALE OF ASSETS AND OTHER ITEMS ourthe aluminum extrusions manufacturing facility in Newnan, Georgia (included in “Cost of goods sold” in the consolidated statements of income).Acquisitions-relatedAcquisition-related expenses of $0.8 million were recorded to “Corporate expenses, net” in the segmentstatement of net sales and operating profit tableby segment in Note 5 during the first and second quarters of 2012, and as noted above, acquisitions-related expenses of $1.2 million were recorded to “Losses associated with plant shutdowns, asset impairments, restructurings and other charges” for Aluminum Extrusions in the segmentstatement of net sales and operating profit tableby segment in Note 5 during the third and fourth quarters of 2012.ourthe Company’s investment in Intellijectkaléo of $16.1 million ($10.2 million after taxes), which is accounted for under the fair value method. An unrealized loss on ourthe Company’s investment in the Harbinger Fund of $1.1 million ($0.7 million after taxes) was recorded in 2012 as a result of a reduction in the fair value of ourthe investment that is not expected to be temporary. See Note 4 for additional information on investments.The estimated fair value of machinery and equipment that was evaluated for impairment was primarily based on our estimates of the proceeds that we would receive if and/or when assets are sold. Our estimates of the remaining fair value for the related machinery and equipment were based on both Level 2 and 3 inputs as defined under U.S. GAAP.We estimate that chargesCharges incurred related to the shutdown will bewere approximately $4.5 million, and includeincluded accelerated depreciation on property, plant and equipment of approximately $2.4 million, severance and other employee-related charges of approximately $1.2 million and other shutdown-related costs of approximately $1 million. Other shutdown-related costs are primarily comprised of equipment transfers and plant shutdown charges, partially offset by adjustment for inventories accounted for under the LIFO method. Most of these shutdown charges, which include cash expenditures of approximately $3.5 million, are expected to bewere recognized over ana period of 18 month period.Losses associated with plant shutdowns, asset impairments, restructurings and othermonths. for continuing operations in 2011 (as shown in the segment operating profit table in Note 5) totaled $6.8 million ($0.3 million gain after taxes), and unless otherwise noted below, are also included in “Asset impairments and costs associated with exit and disposal activities” in the consolidated statements of income. Results in 2011 included:A fourth quarter charge of $2.5 million ($2.2 million after taxes) and a third quarter charge of $2.3 million ($2.2 million after taxes) for acquisition-related expenses (included in “Selling, general and administrative expenses” in the consolidated statements of income) associated with the Film Products acquisition of Terphane;A fourth quarter charge of $0.6 million ($0.4 million after taxes) and a second quarter charge of $0.8 million ($0.5 million after taxes) for asset impairments in Film Products;A third quarter gain of $1.0 million ($6.6 million after taxes) on the divestiture of our film products business in Roccamontepiano, Italy (included in “Other income (expense), net” in the consolidated statements of income), which includes the recognition of previously unrealized foreign currency translation gains of $4.3 million that were associated with the business;A fourth quarter charge of $0.7 million ($0.5 million after taxes) associated with purchase accounting adjustments made to the value of inventory sold by Film Products after its purchase of Terphane (included in “Cost of goods sold” in the consolidated statements of income);A fourth quarter charge of $0.1 million ($39,000 after taxes), a third quarter charge of $0.2 million ($0.1 million after taxes) and a second quarter charge of $0.3 million ($0.2 million after taxes) for severance and other employee-related costs in connection with restructurings in Film Products;A fourth quarter charge of $0.4 million ($0.3 million after taxes) for integration-related expenses (included in “Selling, general and administrative expenses” in the consolidated statements of income) associated with the Film Products acquisition of Terphane; andA fourth quarter benefit of $39,000 ($24,000 after taxes), a third quarter charge of $43,000 ($27,000 after taxes), a second quarter benefit of $0.1 million ($0.1 million after taxes), and a first quarter charge of $32,000 ($20,000 after taxes) for timing differences between the recognition of realized losses on aluminum futures contracts and related revenues from the delayed fulfillment by customers of fixed-price forward purchase commitments (included in “Cost of goods sold” in the consolidated statements of income).Results in 2011 include an unrealized gain from the write-up of our investment in Intelliject of $1.6 million ($1.0 million after taxes), which is accounted for under the fair value method. An unrealized loss on our investment in Harbinger of $0.6 million ($0.4 million after taxes) was recorded in 2011 as a result of a reduction in the fair value of our investment that is not expected to be temporary. See Note 4 for additional information on investments.The estimated fair value of machinery and equipment that was evaluated for impairment was primarily based on our estimates of the proceeds that we would receive if and/or when assets are sold. Our estimates of the remaining fair value for the related machinery and equipment were based on both Level 2 and 3 inputs as defined under U.S. GAAP.Losses associated with plant shutdowns, asset impairments, restructurings and other charges for continuing operations in 2010 (as shown in the segment operating profit table in Note 5) totaled $0.3 million ($0.3 million after taxes), and unless otherwise noted below, are also included in “Asset impairments and costs associated with exit and disposal activities” in the consolidated statements of income. Results in 2010 included:A fourth quarter benefit of $0.4 million ($0.3 million after taxes), a third quarter benefit of $14,000 ($9,000 after taxes), a second quarter benefit of $23,000 ($14,000 after taxes), and a first quarter benefit of $0.4 million ($0.3 million after taxes) for timing differences between the recognition of realized losses on aluminum futures contracts and related revenues from the delayed fulfillment by customers of fixed-price forward purchase commitments (included in “Cost of goods sold” in the consolidated statements of income);Fourth quarter charges of $0.3 million ($0.2 million after taxes) and a second quarter charge of $0.3 million ($0.3 million after taxes) for an asset impairment in Film Products;A fourth quarter charge of $0.4 million ($0.2 million after taxes) related to expected future environmental costs at our aluminum extrusions manufacturing facility in Newnan, Georgia (included in “Cost of goods sold” in the consolidated statements of income);A third quarter charge of $0.1 million ($0.1 million after taxes) and a first quarter charge of $0.1 million ($35,000 after taxes) for severance and other employee-related costs in connection with restructurings in Film Products;A second quarter gain of $0.1 million ($0.1 million after taxes) related to the sale of previously impaired equipment (included in “Other income (expense), net” in the consolidated statements of income) at our film products manufacturing facility in Pottsville, Pennsylvania; andA second quarter loss of $44,000 ($26,000 after taxes) and a first quarter loss of $0.1 million ($36,000 after taxes) on the disposal of equipment (included in “Other income (expense), net” in the consolidated statements of income) from a previously shutdown films manufacturing facility in LaGrange, Georgia.Results in 2010 include an unrealized loss from the write-down of our investment in Intellject of $2.2 million ($1.4 million after taxes), which is accounted for under the fair value method. See Note 4 for additional information on investments.The impairment charges in Film Products were recognized to write down the machinery and equipment to the lower of their carrying value or estimated fair value. The estimated fair value of machinery and equipment that was evaluated for impairment was primarily based on our estimates of the proceeds that wethe Company would receive if and/or when assets are sold. Our estimatesEstimates of the remaining fair value for the related machinery and equipment were based on both Level 2 and 3 inputs as defined under U.S generally accepted accounting principles.1919 CONTINGENCIES We arewe havethe Company has determined the nature and scope of any required environmental remediation activity, estimates of cleanup costs have been obtained and accrued. As weefforts continue efforts to maintain compliance with applicable environmental laws and regulations, additional contingencies may be identified. If additional contingencies are identified, ourthe Company’s practice is to determine the nature and scope of those contingencies, obtain and accrue estimates of the cost of remediation, and perform remediation. We doThe Company does not believe that additional costs that could arise from those activities will have a material adverse effect on ourits financial position. However, those costs could have a material adverse effect on quarterly or annual operating results at that time.We arewe deemed relevant, we believethe Company believes that we haveit has sufficiently accrued for probable losses and that the actions will not have a material adverse effect on ourits financial position. However, the resolution of the actions in a future period could have a material adverse effect on quarterly or annual operating results at that time.we enterthe Company enters into transactions with third parties in connection with the sale of assets or businesses in which we agreeit agrees to indemnify the buyers or third parties involved in the transaction, or in which the sellers or third parties involved in the transaction agree to indemnify us,Tredegar, for certain liabilities or risks related to the assets or business. Also, in the ordinary course of ourits business, wethe Company may enter into agreements with third parties for the sale of goods or services that may contain indemnification provisions. In the event that an indemnification claim is asserted, liability for indemnification would be subject to an assessment of the underlying facts and circumstances under the terms of the applicable agreement. Further, any indemnification payments may be limited or barred by a monetary cap, a time limitation, or a deductible or basket. For these reasons, we areTredegar is unable to estimate the maximum potential amount of the potential future liability under the indemnity provisions of these agreements. We do,The Company does, however, accrue for losses for any known contingent liability, including those that may arise from indemnification provisions, when future payment is probable and the amount isWe discloseThe Company discloses contingent liabilities if the probability of loss is reasonably possible and material.we wereTredegar was notified by U.S. Customs and Border Protection (“U.S. Customs”) that certain film products exported by Terphane to the U.S. since November 6, 2008 could be subject to duties associated with an antidumpinganti-dumping duty order on imported PET films from Brazil. WeThe Company contested the applicability of these antidumpinganti-dumping duties to the films exported by Terphane, and we filed a request was filed with the U.S. Department of Commerce (“Commerce”) for clarification about whether the film products at issue are within the scope of the antidumpinganti-dumping duty order. On January 8, 2013, Commerce issued a scope ruling confirming that the films are not subject to the order, provided that Terphane can establish to the satisfaction of U.S. Customs that the performance enhancing layer on those films is greater than 0.00001 inches thick. The films at issue are manufactured to specifications that exceed that threshold. On February 6, 2013, certain U.S. producers of PET film filed a summons with the U.S. Court of International Trade to appeal the scope ruling from Commerce. If U.S. Customs ultimately were to require the collection of antidumpinganti-dumping duties because Commerce’s scope ruling was overturned on appeal, or otherwise, indemnifications for related liabilities are specifically provided for under the Purchase Agreement.2020 SELECTED QUARTERLY FINANCIAL DATA First
Quarter Second
Quarter Third
Quarter Fourth
Quarter $ 216,643 $ 215,859 $ 216,648 $ 233,038 35,450 33,435 38,087 37,710 7,737 7,388 14,210 13,850 (4,739 ) (35 ) (6,783 ) (3,377 ) $ 2,998 $ 7,353 $ 7,427 $ 10,473 $ .24 $ .23 $ .44 $ .43 (.15 ) — (.21 ) (.10 ) $ .09 $ .23 $ .23 $ .33 $ .24 $ .23 $ .44 $ .43 (.15 ) — (.21 ) (.10 ) $ .09 $ .23 $ .23 $ .33 32,010 32,051 32,052 32,016 32,393 32,101 32,101 32,176 $ 191,520 $ 200,674 $ 201,184 $ 201,042 29,665 28,858 32,108 31,214 6,796 6,027 12,241 3,481 (128 ) (324 ) 495 (3,733 ) $ 6,668 $ 5,703 $ 12,736 $ (252 ) $ .21 $ .19 $ .38 $ .11 — (.01 ) .02 (.12 ) $ .21 $ .18 $ .40 $ (.01 ) $ .21 $ .19 $ .38 $ .11 — (.01 ) .02 (.12 ) $ .21 $ .18 $ .40 $ (.01 ) 31,854 31,946 31,952 31,975 32,262 32,205 32,060 32,328 For the year ended December 31, 2014 Sales $ 235,213 $ 236,965 $ 240,429 $ 239,219 Gross profit 37,749 38,480 34,582 34,109 Income from continuing operations 8,479 3,752 10,745 13,054 Income (loss) from discontinued operations — — 850 — Net income $ 8,479 $ 3,752 $ 11,595 $ 13,054 Earnings (loss) per share: Basic Continuing operations $ 0.26 $ 0.12 $ 0.33 $ 0.40 Discontinued operations — — 0.03 — Net income $ 0.26 $ 0.12 $ 0.36 $ 0.40 Diluted Continuing operations $ 0.26 $ 0.11 $ 0.33 $ 0.40 Discontinued operations — — 0.03 — Net income $ 0.26 $ 0.11 $ 0.36 $ 0.40 Shares used to compute earnings (loss) per share: Basic 32,242 32,312 32,319 32,335 Diluted 32,621 32,641 32,507 32,449 For the year ended December 31, 2013 Sales $ 241,526 $ 243,530 $ 243,194 $ 231,096 Gross profit 36,836 37,540 37,253 34,417 Income from continuing operations 9,517 9,590 7,428 9,402 Income (loss) from discontinued operations (5,240 ) (8,300 ) (450 ) — Net income (loss) $ 4,277 $ 1,290 $ 6,978 $ 9,402 Earnings (loss) per share: Basic Continuing operations $ 0.30 $ 0.30 $ 0.23 $ 0.29 Discontinued operations (0.16 ) (0.26 ) (0.01 ) — Net income (loss) $ 0.14 $ 0.04 $ 0.22 $ 0.29 Diluted Continuing operations $ 0.29 $ 0.29 $ 0.23 $ 0.29 Discontinued operations (0.16 ) (0.25 ) (0.02 ) — Net income (loss) $ 0.13 $ 0.04 $ 0.21 $ 0.29 Shares used to compute earnings (loss) per share: Basic 32,076 32,187 32,201 32,222 Diluted 32,480 32,635 32,658 32,622 TREDEGAR CORPORATION(Registrant)Dated: March 1, 2013 Dated: March 2, 2015 By /s/ Nancy M. Taylor Nancy M. Taylor President and Chief Executive Officer 1, 2013.2, 2015.Signature TitleSignature Title /s/ Nancy M. Taylor (Nancy M. Taylor) (Nancy M. Taylor) (Principal Executive Officer) Kevin A. O’Leary (Kevin A. O’Leary) (Kevin A. O’Leary) (Principal Financial Officer) Frasier W. Brickhouse, II (Frasier W. Brickhouse, II) (Frasier W. Brickhouse, II) (Principal Accounting Officer) R. Gregory Williams (R. Gregory Williams) (R. Gregory Williams) /s/ William M. Gottwald (William M. Gottwald) /s/ Austin Brockenbrough, III Austin Brockenbrough, III) DirectorDonald T. Cowles Director (Donald T. Cowles) Director/s/ George C. Freeman, III (George C. Freeman, III) Director/s/ /s/ John D. GottwaldDirector (John D. Gottwald) Director/s/ Richard L. Morrill (Richard L. Morrill) Director/s/ /s/ George A. NewbillDirector (George A. Newbill) DirectorKenneth R. Newsome Director (Kenneth R. Newsome) /s/ Gregory A. Pratt Director (Gregory A. Pratt) /s/ Thomas G. Slater,Snead, Jr.Director (Thomas G. Slater,Snead, Jr.) /s/ Carl E. Tack, III Director (Carl E. Tack, III) 2.1 Stock Purchase Agreement, made as of October 1, 2012, by and among The William L. Bonnell Company, Inc., AACOA, Inc., the shareholders of AACOA, Inc., and Daniel G. Formsma, as the representative of the shareholders of AACOA, Inc. (filed as Exhibit 2.1 to Tredegar Corporation’s (“Tredegar’s”) Current Report on Form 8-K (File No. 1-10258), filed on October 3, 2012, and incorporated herein by reference). (Schedules and exhibits have been omitted pursuant to Item 601(b)(2) of Regulation S-K. Tredegar agrees to furnish supplementally to the Securities and Exchange Commission a copy of any omitted exhibit or schedule upon request) 2.2 Membership Interest Purchase Agreement, dated as of October 14, 2011, by and among TAC Holdings, LLC, Gaucho Holdings B.V. and Tredegar Film Products Corporation (filed as Exhibit 2.1 to Tredegar’s Current Report on Form 8-K (File No. 1-10258), filed on October 19, 2011, and incorporated herein by reference). (Schedules and exhibits have been omitted pursuant to Item 601(b)(2) of Regulation S-K. Tredegar agrees to furnish supplementally to the Securities and Exchange Commission a copy of any omitted exhibit or schedule upon request) 3.1 Amended and Restated Articles of Incorporation of Tredegar (filed as Exhibit 3.1 to Tredegar’s Annual Report on Form 10-K (File No. 1-10258) for the year ended December 31, 2004, and incorporated herein by reference) 3.1.1 Articles of Amendment to Amended and Restated Articles of Incorporation of Tredegar, as of May 24, 2013 (filed as Exhibit 3.1 to Tredegar’s Current Report on Form 8-K (File No. 1-10258), filed on May 29, 2013 and incorporated herein by reference 3.2 Amended and Restated Bylaws of Tredegar (filed as Exhibit 3.2 to Tredegar’s Current Report on Form 8-K (File No. 1-10258), filed on May 27, 2011,20, 2014, and incorporated herein by reference)3.3 Articles of Amendment (filed as Exhibit 3.3 to Tredegar’s Annual Report on Form 10-K (File No. 1-10258) for the year ended December 31, 2004, and incorporated herein by reference) 4.1 Form of Common Stock Certificate (filed as Exhibit 4.1 to Tredegar’s Annual Report on Form 10-K (File No. 1-10258) for the year ended December 31, 2004, and incorporated herein by reference) 4.2 Second Amended and Restated Rights Agreement, dated as of June 30, 2009,November 18, 2013, by and between Tredegar and National City Bank, as Rights Agent (filed as Exhibit 1 to Amendment No. 2 to Tredegar’s Registration Statement on Form 8-A/A (File No. 1-10258) filed on July 1, 2009, and incorporated herein by reference)4.2.1Amendment to Amended and Restated Rights Agreement, dated as of June 30, 2009, between Tredegar and Computershare Trust Company, N.A., as Rights Agent (filed as Exhibit 21 to Amendment No. 34 to Tredegar’s Registration Statement on Form 8-A/A (File No. 1-10258) filed on September 2, 2011,November 19, 2013, and incorporated herein by reference)4.2.2 Amendment No. 2 to Amended and Restated Rights Agreement, dated as of June 30, 2009, between Tredegar and Computershare Trust Company, N.A., as Rights Agent (filed as Exhibit 3 to Amendment No. 3 to Tredegar’s Registration Statement on Form 8-A/A (File No. 1-10258) filed on September 2, 2011, and incorporated herein by reference)4.3 Credit Agreement, dated as of April 23, 2012, among Tredegar Corporation, as borrower, the lenders named therein, JPMorgan Chase Bank, N.A., as administrative agent, SunTrust Bank, as syndication agent, and Citizens Bank of Pennsylvania, HSBC Bank USA, National Association, PNC Bank, National Association, and U.S. Bank National Association, as co-documentation agents (filed as Exhibit 4.1 to Tredegar’s Current Report on Form 8-K (File No. 1-10258), filed on April 26, 2012, and incorporated herein by reference) 4.3.1 Guaranty, dated as of April 23, 2012, by and among the subsidiaries of Tredegar Corporation listed on the signature pages thereto in favor of JPMorgan Chase Bank, N.A., as administrative agent, for the ratable benefit of the Holders of Guaranteed Obligations (filed as Exhibit 4.2 to Tredegar’s Current Report on Form 8-K (File No. 1-10258), filed on April 26, 2012, and incorporated herein by reference) 4.4 Credit Agreement, dated as of June 21, 2010, among Tredegar, as borrower, the lenders named therein, JPMorgan Chase Bank, N.A., as administrative agent, SunTrust Bank, as syndication agent, and Bank of America, N.A., HSBC Bank USA, National Association and U.S. Bank National Association, as co-documentation agents (filed as Exhibit 4.3 to Tredegar’s Current Report on Form 8-K (File No. 1-10258), filed on June 22, 2010, and incorporated herein by reference) 10.1 Reorganization and Distribution Agreement, dated as of June 1, 1989, between Tredegar and Ethyl Corporation (filed as Exhibit 10.1 to Tredegar’s Annual Report on Form 10-K (File No. 1-10258) for the year ended December 31, 2004, and incorporated herein by reference) *10.2 Employee Benefits Agreement, dated as of June 1, 1989, between Tredegar and Ethyl Corporation (filed as Exhibit 10.2 to Tredegar’s Annual Report on Form 10-K (File No. 1-10258) for the year ended December 31, 2004, and incorporated herein by reference) 10.3 Tax Sharing Agreement, dated as of June 1, 1989, between Tredegar and Ethyl Corporation (filed as Exhibit 10.3 to Tredegar’s Annual Report on Form 10-K (File No. 1-10258) for the year ended December 31, 2004, and incorporated herein by reference) 10.4 Indemnification Agreement, dated as of June 1, 1989, between Tredegar and Ethyl Corporation (filed as Exhibit 10.4 to Tredegar’s Annual Report on Form 10-K (File No. 1-10258) for the year ended December 31, 2004, and incorporated herein by reference) *10.5 Tredegar Industries, Inc. Retirement Benefit Restoration Plan (filed as Exhibit 10.7 to Tredegar’s Annual Report on Form 10-K (File No. 1-10258) for the year ended December 31, 2004, and incorporated herein by reference) *10.5.1 Amendment to the Tredegar Industries, Inc. Retirement Benefit Restoration Plan (filed as Exhibit 10.7.1 to Tredegar’s Annual Report on Form 10-K (File No. 1-10258) for the year ended December 31, 2004, and incorporated herein by reference) *10.6 Tredegar Industries, Inc. Savings Plan Benefit Restoration Plan (filed as Exhibit 10.810.6 to Tredegar’s Annual Report on Form 10-K (File No. 1-10258) for the year ended December 31, 2004,2013, and incorporated herein by reference)*10.6.1 Resolutions of the Executive Committee of the Board of Directors of Tredegar Corporation adopted on December 28, 2004 (effective as of December 31, 2004) amending the Tredegar Corporation Retirement Savings Plan Benefit Restoration Plan (filed as Exhibit 10.9.1 to Tredegar’s Current Report on Form 8-K (File No. 1-10258), filed on December 30, 2004, and incorporated herein by reference) *10.7 Tredegar Amended and Restated Incentive Plan (filed as Exhibit 10.9 to Tredegar’s Annual Report on Form 10-K (File No. 1-10258) for the year ended December 31, 2005, and incorporated herein by reference) *10.8 Tredegar 2004 Equity Incentive Plan as Amended and Restated Effective March 27, 2009 (filed as Annex 1 to Tredegar’s Definitive Proxy Statement on Schedule 14A (File No. 1-10258) filed on April 14, 2009 and incorporated herein by reference) *10.9 Transfer Agreement, by and between Therics,AFBS, Inc. and Therics, LLC, dated as of June 30, 2005 (filed as Exhibit 10.17 to Tredegar’s Current Report on Form 8-K (File No. 1-10258), filed on July 1, 2005, and incorporated herein by reference)10.10 Intellectual Property Transfer Agreement, by and between Therics,AFBS, Inc. and Therics, LLC, dated as of June 30, 2005 (filed as Exhibit 10.18 to Tredegar’s Current Report on Form 8-K (File No. 1-10258), filed on July 1, 2005, and incorporated herein by reference)10.11 Unit Purchase Agreement, by and between Therics, Inc., Therics,AFBS, LLC and Randall R. Theken, dated as of June 30, 2005 (filed as Exhibit 10.19 to Tredegar’s Current Report on Form 8-K (File No. 1-10258), filed on July 1, 2005, and incorporated herein by reference)10.12 Payment Agreement, by and between Therics,AFBS, Inc. and Therics, LLC, dated as of June 30, 2005 (filed as Exhibit 10.20 to Tredegar’s Current Report on Form 8-K (File No. 1-10258), filed on July 1, 2005, and incorporated herein by reference)*10.13 Form of Notice of Stock Award and Stock Award Terms and Conditions (filed as Exhibit 10.2 to Tredegar’s Current Report on Form 8-K (File No. 1-10258), filed on April 3, 2014, and incorporated herein by reference) *10.14 Form of Notice of Stock Unit Award and Stock Unit Award Terms and Conditions (filed as Exhibit 10.1 to Tredegar’s Current Report on Form 8-K (File No. 1-10258), filed on February 16, 2011,April 3, 2014, and incorporated herein by reference)*10.14 Form of Notice of Stock Unit Award and Stock Unit Award Terms and Conditions (filed as Exhibit 10.2 to Tredegar’s Current Report on Form 8-K (File No. 1-10258), filed on February 16, 2011, and incorporated herein by reference)*10.15 Form of Notice of Nonstatutory Stock Option Grant and Nonstatutory Stock Option Terms and Conditions (filed as Exhibit 10.3 to Tredegar’s Current Report on Form 8-K (File No. 1-10258), filed on February 16, 2011,April 3, 2014, and incorporated herein by reference)*10.16 FormAmended and Restated Severance Agreement, effective as of Notice of Stock AwardFebruary 3, 2014, between Tredegar and Stock Award Terms and ConditionsNancy M. Taylor (filed as Exhibit 10.1810.1 to Tredegar’s Current Report on Form 8-K (File No. 1-10258), filed February 19, 2009,10, 2014, and incorporated herein by reference)*10.17 SeveranceConsulting Agreement, effective as of January 31, 2010,dated May 21, 2013, between Tredegar and Nancy M. Taylor (filed as Exhibit 10.19 to Tredegar’s Current Report on Form 8-K (File No. 1-10258), filed March 5, 2010, and incorporated herein by reference)*10.18Form of Notice of Stock Unit Award and Stock Unit Award Terms and ConditionsDuncan A. Crowdis (filed as Exhibit 10.1 to Tredegar’s Current Report on Form 8-K (File No. 1-10258), filed on March 5, 2012,May 22, 2013, and incorporated herein by reference)*10.18 Amended and Restated Severance Agreement, effective February 3, 2014, between the Company and Kevin A. O’Leary (filed as Exhibit 10.3 to Tredegar’s Current Report on Form 8-K (File No. 1-10258), filed on February 10, 2014, and incorporated herein by reference) *10.19 Amended and Restated Severance Agreement, effective February 3, 2014, between the Company and A. Brent King (filed as Exhibit 10.4 to Tredegar’s Current Report on Form 8-K (File No. 1-10258), filed on February 10, 2014, and incorporated herein by reference) Form of Notice of Stock Award*10.20 Amended and Stock Award TermsRestated Severance Agreement, effective February 3, 2014, between the Company and ConditionsMary Jane Hellyar (filed as Exhibit 10.2 to Tredegar’s Current Report on Form 8-K (File No. 1-10258), filed on March 5, 2012,February 10, 2014, and incorporated herein by reference)+*10.21 Summary of Director Compensation for Fiscal 2014 *10.2010.22FormAgreement, dated as of Notice of Nonstatutory Stock Option GrantFebruary 19, 2014, by and Nonstatutory Stock Option Termsamoung Tredegar Corporation, John D. Gottwald, William M. Gottwald and ConditionsFloyd D. Gottwald, Jr. (filed as Exhibit 10.310.1 to to Tredegar’s Current Report on Form 8-K (File No. 1-10258), filed on March 5, 2012,February 20, 2014, and incorporated herein by reference)10.21 Consulting Agreement, dated March 28, 2012, between the Company and MOMO Partners LLC and Monica Moretti (filed as Exhibit 10.1 to Tredegar’s Current Report on Form 8-K (File No. 1-10258), filed on March 29, 2012, and incorporated herein by reference)*10.22Change in Control Severance Agreement, effective March 23, 2012, between the Company and Kevin A. O’Leary (filed as Exhibit 10.2 to Tredegar’s Current Report on Form 8-K (File No. 1-10258), filed on March 29, 2012, and incorporated herein by reference)*10.23Change in Control Severance Agreement, effective March 23, 2012, between the Company and A. Brent King (filed as Exhibit 10.3 to Tredegar’s Current Report on Form 8-K (File No. 1-10258), filed on March 29, 2012, and incorporated herein by reference)*10.24Change in Control Severance Agreement, effective September 24, 2012, between the Company and Mary Jane Hellyar (filed as Exhibit 10.1 to Tredegar’s Current Report on Form 8-K (File No. 1-10258), filed on September 24, 2012, and incorporated herein by reference)+*10.25Summary of Director Compensation for Fiscal 2012+21 Subsidiaries of Tredegar +23.1 Consent of PriceWaterhouseCoopers,PricewaterhouseCoopers, LLC, Independent Registered Public Accounting Firm+23.2 Consent of Dixon Hughes Goodman LLP, Independent Registered Public Accounting FirmAuditors+31.1 Certification of Nancy M. Taylor, President and Chief Executive Officer of Tredegar Corporation, pursuant to Rules 13a-14(a) and 15d-14(a) promulgated under the Securities Exchange Act of 1934, as adopted pursuant to Section 302 of the Sarbanes-Oxley Act of 2002 +31.2 Certification of Kevin A. O’Leary, Vice President, Chief Financial Officer and Treasurer (Principal Financial Officer) of Tredegar Corporation, pursuant to Rules 13a-14(a) and 15d-14(a) promulgated under the Securities Exchange Act of 1934, as adopted pursuant to Section 302 of the Sarbanes-Oxley Act of 2002 +32.1 Certification of Nancy M. Taylor, President and Chief Executive Officer of Tredegar Corporation, pursuant to 18 U.S.C. Section 1350, as adopted pursuant to Section 906 of the Sarbanes-Oxley Act of 2002 +32.2 Certification of Kevin A. O’Leary, Vice President, Chief Financial Officer and Treasurer (Principal Financial Officer) of Tredegar Corporation, pursuant to 18 U.S.C. Section 1350, as adopted pursuant to Section 906 of the Sarbanes-Oxley Act of 2002 +99 Intelliject,kaléo, Inc., separate financial statements and Report of Independent Registered Accounting Firm+101 XBRL Instance Document and Related Items * Denotes compensatory plans or arrangements or management contracts. + Filed herewith