Table of Contents

UNITED STATES

SECURITIES AND EXCHANGE COMMISSION

WASHINGTON, D.C.DC 20549

FORM 10-K

(Mark One)

x
þANNUAL REPORT PURSUANT TO SECTION 13 OR 15(d) OF THE SECURITIES EXCHANGE ACT OF 1934

For the fiscal year ended December 30, 201227, 2015

OR

¨
oTRANSITION REPORT PURSUANT TO SECTION 13 OR 15(d) OF THE SECURITIES EXCHANGE ACT OF 1934

For the transition period fromto

Commission file number: 1-35065

TORNIER001-35065

WRIGHT MEDICAL GROUP N.V.

(Exact name of registrant as specified in its charter)

The Netherlands 98-0509600

(State or other jurisdiction
of

incorporation or organization)

 
(I.R.S. Employer
Identification No.)
Fred. Roeskestraat 123
Prins Bernhardplein 200
1097 JB Amsterdam, The Netherlands
 
None
(Zip code)
1076 EE Amsterdam, The NetherlandsNone
(Address of principal executive offices)Principal Executive Offices) (Zip Code)

Registrant’s telephone number, including area code: (+31)20 675 4002

Securities registered pursuant to Section 12(b) of the Act:Act

:

Title of each class


Name of each exchange on which registered

Ordinary shares, par value €0.03 per share Nasdaq Stock Market LLC
(NASDAQ Global Select Market)Market
Contingent Value RightsNASDAQ Stock Market LLC

Securities registered pursuant to Section 12(g) of the Act: None

Indicate by check mark if the registrant is a well-known seasoned issuer, as defined in Rule 405 of the Securities Act. ¨þ Yes xo No

Indicate by check mark if the registrant is not required to file reports pursuant to Section 13 or Section 15(d) of the Act. ¨o Yes xþ No

Indicate by check mark whether the registrant (1) has filed all reports required to be filed by Section 13 or 15(d) of the Securities Exchange Act of 1934 during the preceding 12 months (or for such shorter period that the registrant was required to file such reports), and (2) has been subject to such filing requirements for the past 90 days.     xþ Yes ¨o No

Indicate by check mark whether the registrant has submitted electronically and posted on its corporate Web site,Website, if any, every Interactive Data File required to be submitted and posted pursuant to Rule 405 of Regulation S-T (§232.405 of this chapter) during the preceding 12 months (or for such shorter period that the registrant was required to submit and post such files). xþ Yes ¨o No

Indicate by check mark if disclosure of delinquent filers pursuant to Item 405 of Regulation S-K (§ 229.405 of this chapter)229.405) is not contained herein, and will not be contained, to the best of registrant’s knowledge, in definitive proxy or information statements incorporated by reference in Part III of this Form 10-K or any amendment to this Form 10-K. xþ

Indicate by check mark whether the registrant is a large accelerated filer, an accelerated filer, a non-accelerated filer, or a smaller reporting company. See definitions of “large accelerated filer,” “accelerated filer,” and “smaller reporting company” in Rule 12b-2 of the Exchange Act.

(Check (Check one):

Large accelerated filerþ
 ¨
Accelerated filer o
 Accelerated
Non-accelerated filero
 x
Smaller reporting company o
Non-accelerated filer ¨  (Do(Do not check if a smaller reporting company) Smaller reporting company¨

Indicate by check mark whether the registrant is a shell company (as defined in Rule 12b-2 of the Exchange Act). ¨o Yes xþ No

The aggregate market value of the ordinary shares held by non-affiliates of the registrant on July 1, 2012June 28, 2015 was $341.6$932.7 million based on the closing sale price of the ordinary shares on that date, as reported by the NASDAQ Global Select Market. For purposes of the foregoing calculation only, the registrant has assumed that all executive officers and directors of the registrant, and their affiliated entities, are affiliates.

As of February 24, 201310, 2016, there were 41,740,444102,708,047 ordinary shares outstanding.

DOCUMENTS INCORPORATED BY REFERENCE

None

None.


1

TORNIER

Table of Contents

WRIGHT MEDICAL GROUP N.V.

ANNUAL REPORT ON FORM 10-K

Table of Contents

 Page
Page 

Part I

Item 1.

Business

5 

20
 
Item 1B.

47 
Item 2.

Properties

47 
Item 3.

47
Item 4.

Mine Safety Disclosures

47
Part II
Item 5.

Market for Registrant’s Common Equity, Related StockholderShareholder Matters and Issuer Purchases of Equity SecuritiesSecurities.

48

Selected Financial DataData.

50

Management’s Discussion and Analysis of Financial Condition and Results of OperationsOperations.

Quantitative and Qualitative Disclosures About Market RiskRisk.

67

Financial Statements and Supplementary DataData.

69

Changes in and Disagreements Withwith Accountants on Accounting and Financial DisclosureDisclosure.

100
 
Item 9A.

100 
Item 9B.

Other Information

100 
Item 10.

Directors, Executive Officers and Corporate GovernanceGovernance.

102

109

Security Ownership of Certain Beneficial Owners and Management and Related Stockholder MattersShareholder Matters.

143

Certain Relationships and Related Transactions, and Director IndependenceIndependence.

145

Principal Accounting Fees and ServicesServices.

 147 
Item 15.

Exhibits, Financial Statement Schedules

149 
  
152
EX-10.42 
EX-10.43
EX-10.48
 EX-12.1
 EX-21.1
 EX-23.1
 EX-31.1
 EX-31.2
 EX-32.1
 EX-101 INSTANCE DOCUMENT
 EX-101 SCHEMA DOCUMENT
 EX-101 CALCULATION LINKBASE DOCUMENT
 EX-101 LABELS LINKBASE DOCUMENT
 EX-101 PRESENTATION LINKBASE DOCUMENT
 EX-101 DEFINITION LINKBASE DOCUMENT

On January 28, 2011, Tornier B.V., a private company with limited liability (besloten vennootschap met beperkte aansprakelijkheid) changed its legal form by converting to Tornier N.V., a public company with limited liability (naamloze vennootschap). This is referred to as the “conversion” in this report.

References to “Tornier,” “Company,” “we,” “our” or “us” in this report refer to Tornier B.V. and its subsidiaries prior to the conversion and to Tornier N.V. and its subsidiaries upon and after the conversion, unless the context otherwise requires.

This report contains references to, among others, our trademarks Aequalis®, Affiniti®, Ascend®, Ascend Flex™, BioFiber®, Piton®, Salto Talaris®, Simpliciti™, and Tornier®. All other trademarks or trade names referred to in this report are the property


2

Table of their respective owners.

Our fiscal year-end always falls on the Sunday nearest to December 31. References in this report to a particular year generally refer to the applicable fiscal year. Accordingly, references to “2012” or “the year ended December 30, 2012” mean the fiscal year ended December 30, 2012.

Contents


SPECIAL NOTE REGARDING FORWARD-LOOKING STATEMENTS


This reportAnnual Report on Form 10-K contains “forward-looking statements” within the meaning of the Private Securities Litigation Reform Act of 1995, Section 27A of the Securities Act of 1933, as amended (Securities Act), and Section 21E of the Securities Exchange Act of 1934, as amended. Allamended (Exchange Act), and that are subject to the safe harbor created by those sections. These statements reflect management's current knowledge, assumptions, beliefs, estimates, and expectations and express management's current view of future performance, results, and trends. Forward looking statements may be identified by their use of terms such as anticipate, believe, could, estimate, expect, intend, may, plan, predict, project, will, and other thansimilar terms. Forward-looking statements are subject to a number of historical fact includedrisks and uncertainties that could cause actual results to materially differ from those described in the forward-looking statements. The reader should not place undue reliance on forward-looking statements. Such statements are made as of the date of this report, and we undertake no obligation to update such statements after this date. Risks and uncertainties that address activities, events or developments that we expect, believe or anticipate will or may occurcould cause our actual results to materially differ from those described in the future are forward-looking statements are discussed in our filings with the U.S. Securities and Exchange Commission (SEC) (including those described in "Part I. Item 1A. Risk Factors" of this report). By way of example and without implied limitation, such risks and uncertainties include:

future actions of the SEC, the United States Attorney’s office, the U.S. Food and Drug Administration (FDA), the Department of Health and Human Services, or other U.S. or foreign government authorities, including those resulting from increased scrutiny under the U.S. Foreign Corrupt Practices Act and similar laws, that could delay, limit, or suspend our development, manufacturing, commercialization, and sale of products, or result in particular,seizures, injunctions, monetary sanctions, or criminal or civil liabilities;
risks associated with the statements about our plans, objectives, strategiesrecently completed merger between Tornier N.V. (Tornier or legacy Tornier) and prospects regarding, among other things,Wright Medical Group, Inc. (WMG or legacy Wright), including the failure to realize intended benefits and anticipated synergies and cost-savings from the transaction or delay in realization thereof; cash costs associated with the transaction which may negatively impact our financial condition, operating results, and business. We have identified some of these forward-looking statements with words like “believe,” “may,” “will,” “should,” “could,” “expect,” “intend,” “plan,” “predict,” “anticipate,” “estimate”cash flow; our businesses may not be combined successfully, or “continue” other words and terms of similar meaning and the use of future dates. These forward-looking statements are based on current expectations about future events affecting us and are subjectsuch combination may take longer, be more difficult, time-consuming or costly to uncertainties and factors relating to our operationsaccomplish than expected; and business environment, alldisruption after the transaction, including adverse effects on employee retention, our sales and distribution channel, especially in light of which are difficult to predictanticipated territory transitions, and many of which are beyond our control and could cause our actual results to differ materially from those matters expressed or implied by our forward-looking statements. Forward-looking statements (including oral representations) are only predictions or statements of current plans and can be affected by inaccurate assumptions we might make or by known or unknown risks and uncertainties, including, among other things, on business relationships with third parties;
risks associated with:

our historywith the recently completed divestiture of operating lossesthe U.S. rights to certain of legacy Tornier's ankle and negative cash flow;

silastic toe replacement products;

our recent acquisitionliability for product liability claims on hip/knee (OrthoRecon) products sold by legacy Wright prior to the divestiture of OrthoHelix Surgical Designs, Inc., and risks related thereto, including our inability to integrate successfully our commercial organizations, including in particular our distribution and sales representative arrangements, and our the OrthoRecon business;

failure to realize the anticipated benefits and synergiesfrom previous acquisitions or from the divestiture of the OrthoRecon business;
adverse outcomes in existing product liability litigation;
new product liability claims;
inadequate insurance coverage;
copycat claims against our modular hip systems resulting from a competitor’s recall of its modular hip product;
the ability of a creditor of any one particular entity within our corporate structure to reach the assets of the other entities within our business and operating results;

corporate structure not liable for the underlying claims of the one particular entity, despite our reliance oncorporate structure which is intended to ring-fence liabilities;

failure to obtain anticipated commercial sales of our independent sales agencies and distributors to sell our products and the effect on our business and operating results of agency and distributor changes or transitions to direct selling models in certain geographies, including most recently in Canada, Belgium and Luxembourg andAUGMENT® Bone Graft in the United States, and possible ramificationsStates;
challenges to our intellectual property rights or inability to defend our products against the intellectual property rights of such changes and transitionsothers;
loss of key suppliers;
failures of, interruptions to, or unauthorized tampering with, our information technology systems;
failure or delay in obtaining FDA or other regulatory approvals for our products;
the potentially negative effect of our ongoing compliance enhancements on our businessrelationships with customers and operating results;

our recently completed facilities consolidation and its effect on our businessability to deliver timely and operating results;

effective medical education, clinical studies, and new products;

continuing weaknessthe possibility of private securities litigation or shareholder derivative suits;

insufficient demand for and market acceptance of our new and existing products;
recently enacted healthcare laws and changes in the global economy, which has been and may continue to be exacerbated by austerity measures taken by several countries, and automatic and discretionary governmental spending cuts,product reimbursements, which could reducegenerate downward pressure on our product pricing;
potentially burdensome tax measures;
lack of suitable business development opportunities;
inability to capitalize on business development opportunities;
product quality or patient safety issues;
geographic and product mix impact on our sales;

3


inability to retain key sales representatives, independent distributors, and other personnel or to attract new talent;
inventory reductions or fluctuations in buying patterns by wholesalers or distributors;
ability to generate sufficient cash flow to satisfy our capital requirements, including future milestone payments, and existing debt, including the availabilityconversion features of our convertible senior notes, or affordabilityrefinance our existing debt as it matures;
ability to raise additional financing when needed and on favorable terms;
the negative impact of private insurance or Medicare or other governmental reimbursement or may affect patient decision to undergo elective procedures,the commercial and could otherwise adversely affectcredit environment on us, our businesscustomers, and operating results;

our suppliers;

deriving a significant portion of our revenues from operations in certain geographic markets that are subject to political, economic, and social instability, including in particular France, and risks and uncertainties involved in launching our products in certain new geographic markets, including in particular Japan and China;

markets;

disruption and turmoil in global credit and financial markets, which may be exacerbated by the inability of certain countries to continue to service their sovereign debt obligations;

fluctuations in foreign currency exchange rates;

changes in our senior management, including our recent Chief Executive Officer and Chief Financial Officer changes;

our credit agreement, senior secured term loans and revolving credit facility and risks related thereto;

not successfully developing and marketing new products and technologies and implementing our business strategy;

not successfully competing against our existing or potential competitors and the effect of significant recent consolidations amongst our competitors;

the reliance of our business plan on certain market assumptions;

our reliance on sales of our upper extremity joints and trauma products, which generate a significant portion of our revenue;

our private label manufacturers failing to provide us with sufficient supply of their products, or failing to meet appropriate quality requirements;

our inability to timely manufacture products or instrument sets to meet demand;

our plans to bring the manufacturing of certain of our products in-house and possible disruptions we may experience in connection with such transition;

our plans to increase our gross margins by taking certain actions designed to do so;

the loss of key suppliers, which may result in our inability to meet customer orders for our products in a timely manner or within our budget;

our patents and other intellectual property rights not adequately protecting our products or alleged claims of patent infringement by us, which may result in our loss of market share to our competitors and increased expenses;

the incurrence of significant expenditures of resources to maintain relatively high levels of inventory, which could reduce our cash flows and increase the risk of inventory obsolescence, which could harm our operating results;

our inability to access our revolving credit facility or raise capital when needed, which could force us to delay, reduce, eliminate or abandon our commercialization efforts or product development programs;

restrictive affirmative financial and other covenants in our credit agreement that may limit our operating flexibility;

consolidation in the healthcare industry that could lead to demands for price concessions or the exclusion of some suppliers from certain of our markets, which could have an adverse effect on our business, financial condition, or operating results;

our clinical trials and their results and our reliance on third parties to conduct them;

regulatory clearances or approvals and the extensive regulatory requirements to which we are subject;

the compliance of our products with the laws and regulations of the countries in which they are marketed, which compliance may be costly and time-consuming;

the use, misuse or off-label use of our products that may harm our image in the marketplace or result in injuries that may lead to product liability suits, which could be costly to our business or result in governmental sanctions;

and

healthcare reform legislation, including the excise tax on U.S. sales of certain medical devices,pending and its future implementation, possible additional legislation, regulation and other governmental pressure in the United States and globally, which may affect utilization, pricing, reimbursement, taxation and rebate policies of governmental agencies and private payors,litigation, which could have an adverse effect on our business, financial condition, or operating results; and

results.

pending and future litigation.


For more information regarding these and other uncertainties and factors that could cause our actual results to differ materially from what we have anticipated in our forward-looking statements or otherwise could materially adversely affect our business, financial condition, or operating results, see “Part I —Part I. Item 1A. Risk Factors”.Factors” of this report. The risks and uncertainties described above and in the “Part I —Part I. Item 1A. Risk Factors” sectionFactors of this report are not exclusive and further information concerning us and our business, including factors that potentially could materially affect our financial results or condition, may emerge from time to time. We assume no obligation to update, amend, or clarify forward-looking statements to reflect actual results or changes in factors or assumptions affecting such forward-looking statements. We advise you, however, to consult any further disclosures we make on related subjects in our future annual reportsAnnual Reports on Form 10-K, quarterly reportsQuarterly Reports on Form 10-Q and current reportsCurrent Reports on Form 8-K we file with or furnish to the Securities and Exchange Commission.

SEC.


4


PART I


Item 1. Business

Business.

Overview

We are

Wright Medical Group N.V. (Wright or we) is a global medical device company focused on surgeons that treat musculoskeletal injuriesextremities and disordersbiologics products. We are committed to delivering innovative, value-added solutions improving quality of life for patients worldwide and are a recognized leader of surgical solutions for the shoulder,upper extremities (shoulder, elbow, wrist hand, ankle and foot. We refer to these surgeons as extremity specialists. We sell to this extremity specialist customer base a broad line of joint replacement, trauma, sports medicinehand), lower extremities (foot and biologic products to treat extremity joints. Our motto of “specialists serving specialists” encompasses this focus. In certain international markets, we also offer joint replacement products for the hip and knee. We currently sell approximately 100 product lines in approximately 40 countries.

We have had a tradition of innovation, intense focus on surgeon education and commitment to advancement of orthopaedic technology since our founding over 70 years ago in France by René Tornier. Our history includes the introduction of the porous orthopaedic hip implant, the application of the Morse taper, which is a reliable means of joining modular orthopaedic implants, and, more recently, the introduction of the stemless shoulder both in Europe and in a U.S. clinical trial. This track record of innovation over the decades stems from our close collaboration with leading orthopaedic surgeons and thought leaders throughout the world.

In 2006, an investor group led by Warburg Pincus (Bermuda) Private Equity IX, L.P. recognized Tornier’s reputation for innovation and its strong extremity joint portfolio as a platform upon which they could build a global company focused on the rapidly evolving upper and lower extremity specialties. The investor group contributed capital resources and a management team with a track record of success in the orthopaedic industry in an effort to expand our product offerings in extremities and accelerate our growth. In 2011, we became a U.S. public reporting company to provide additional access to capital and accelerate our plans to become the market leader in extremities. Since 2006, we have:

created an extremity specialist focused sales channel in the United States primarily focused on our products;

enhanced and broadened our global market leading portfolio of shoulder and ankle joint implants;

significantly expanded our foot and ankle offering with the acquisition of OrthoHelix Surgical Designs, Inc. (OrthoHelix), with specialty implantable screw and plate systems for the repair of small bone fractures and deformities in the foot and ankle;

entered the sports medicineankle) and biologics markets, through acquisitionsthree of the fastest growing segments in orthopaedics. We market our products in over 50 countries worldwide.

On October 1, 2015, we became Wright Medical Group N.V. following the merger of Wright Medical Group, Inc. (WMG or legacy Wright) with Tornier N.V. (Tornier or legacy Tornier). The combined company leverages the global strengths of both product brands as a pure-play extremities and licensing agreements andbiologics business. We believe our leadership will be further enhanced by the portfolio through internal development;

improved our hiprecent U.S. Food and kneeDrug Administration (FDA) premarket approval of AUGMENT® Bone Graft, a biologic solution that adds additional depth to one of the most comprehensive extremities product offerings, helpingportfolios in the industry, as well as provides a platform technology for future new product development. The highly complementary nature of legacy Wright’s and legacy Tornier’s businesses has given us gain market share internationally;significant diversity and

significantly increased investment in research scale across a range of geographies and development and expanded business development activities to build a pipeline of innovative new technologies.

product categories. We believe we are differentiated in the marketplace by our strategic focus on extremities and biologics, our full portfolio of upper and lower extremityextremities and biologics products, our extremity-focused sales organization and our strategic focus on extremities. We further believe that wespecialized and focused sales organization.

Our global corporate headquarters are well positioned to benefit fromlocated in Amsterdam, the opportunities in the extremity products marketplace as we are among the global leaders in the shoulder and ankle joint replacement markets and also the foot and ankle trauma market with our recent acquisition of OrthoHelix.Netherlands. We also have expandedsignificant operations located in Memphis, Tennessee (U.S. headquarters, research and development, sales and marketing administration, and administrative activities); Bloomington, Minnesota (upper extremities sales and marketing); Arlington, Tennessee (manufacturing and warehousing operations); Grenoble, France (manufacturing and research and development); and Macroom, Ireland (manufacturing). In addition, we have local sales and distribution offices in Canada, Australia, Asia, and throughout Europe. For purposes of this report, references to "international" or "foreign" relate to non-U.S. matters while references to "domestic" relate to U.S. matters.
Upon completion of the merger between legacy Wright and legacy Tornier (the Wright/Tornier merger or merger), Robert J. Palmisano, former President and Chief Executive Officer (CEO) of legacy Wright, became President and CEO of the combined company. David H. Mowry, former President and CEO of legacy Tornier, became Executive Vice President and Chief Operating Officer, and Lance A. Berry, former Senior Vice President (SVP) and Chief Financial Officer (CFO) of legacy Wright, became SVP and CFO. Our board of directors is comprised of five representatives from legacy Wright’s board of directors and five representatives from legacy Tornier’s board of directors, including Mr. Palmisano and Mr. Mowry. Immediately upon completion of the merger, legacy Wright shareholders owned approximately 52% of the combined company and legacy Tornier shareholders owned approximately 48%. In connection with the merger, the trading symbol for our technology baseordinary shares changed from “TRNX” to “WMGI.” Because of these and product offering to include: new joint replacement products based on new materials; improved trauma products based on innovative designs;other facts and proprietary biologic materialscircumstances, the merger has been accounted for soft tissue repair. Inas a “reverse acquisition” under generally acceptable accounting principles in the United States (US GAAP), and as such, legacy Wright is considered the acquiring entity for accounting purposes.Therefore, legacy Wright’s historical results of operations replaced legacy Tornier’s historical results of operations for all periods prior to the merger. References in this section and certain other sections of Part I of this report to "we," "our" and "us" refer to Wright Medical Group N.V. and its subsidiaries after the Wright/Tornier merger and Wright Medical Group, Inc. and its subsidiaries before the merger.
For the year ended December 27, 2015, we had net sales of $415 million and a net loss from continuing operations of $299 million. As of December 27, 2015 we had total assets of $2,090 million. Subsequent to the completion of the Wright/Tornier merger, our management began managing our operations as one reportable segment, orthopaedic products, which includes the design, manufacture, marketing, and sales of extremities and biologics products. Detailed information on our net sales by product category and our net sales and long-lived assets by geographic region can be found in Note 19 to our consolidated financial statements contained in “Item 8. Financial Statements and Supplementary Data.”


1


Orthopaedic Industry
The total worldwide orthopaedic industry is estimated at approximately $37.5 billion in 2015. Six multinational companies currently dominate the largest orthopaedic market, weindustry, each with approximately $2 billion or more in annual sales. The size of these companies often allows them to concentrate their marketing and research and development efforts on products they believe that our “specialists serving specialists” market approach is strategically aligned with what we believewill have a relatively high minimum threshold level of sales. As a result, there is an ongoing trendopportunity for a mid-sized orthopaedic company, such as Wright, to focus on less contested, higher-growth sectors of the orthopaedic market.
We have focused our efforts into growing our position in the higher-growth extremities and biologics markets. We believe a more active and aging patient population with higher expectations regarding “quality of life,” an increasing global awareness of extremities and biologics solutions, improved clinical outcomes as a result of the use of such products, and technological advances resulting in specific designs for such products that simplify procedures and address unmet needs for early interventions, and the growing need for revisions and revision related solutions will drive the market for extremities and biologics products.
The extremities market is one of the fastest growing market segments within orthopaedics, with annual growth rates of 7-10%. We believe the extremities market will continue to grow by approximately 7-10% annually. We currently estimate the market for all surgical products used by extremities-focused surgeons to specialize in certain parts of the anatomy or certain types of procedures.

Our principal products are organized in four major categories: upper extremity joints and trauma, lower extremity joints and trauma, sports medicine and biologics, and large joints and other. Our upper extremity joints and trauma products include joint replacement and bone fixation devices for the shoulder, hand, wrist and elbow. Our lower extremity joints and trauma products, which include our OrthoHelix portfolio, include joint replacement and bone fixation devices for the foot and ankle. Our sports medicine and biologics product category includes products used across several anatomic sites to mechanically repair tissue-to-tissue or tissue-to-bone injuries,be over $3 billion in the case of sports medicine, or to support or induce remodeling and regeneration of tendons and ligaments, in the case of biologics. Our large joints and other products include hip and knee joint replacement implants and ancillary products.

Our Business Strategies

Our goal is to achieve global leadershipUnited States. We believe major trends in the extremities market which we believe will require focusinclude procedure-specific and execution in the following key strategic elements:

Leveraging our “specialists serving specialists” strategy: We believe our focus on and dedication to extremity specialists enables us to better understand and address the clinical needs of these surgeons. We believe that extremity specialists, who have emerged as a significant constituency in orthopaedics only in the last 10 to 15 years, have been underserved in terms of new technology and also inefficiently served by the current marketplace. We offer a comprehensive portfolio of extremity products, which has been further strengthened with our acquisition of OrthoHelix, and also serve our customers through a sales channel that is primarily dedicated to extremities, which we believe provides us with a significant competitive advantage, because our sales agencies and their representatives have both the knowledge and desire to comprehensively meet the needs of extremity specialists and their patients, without competing priorities. In 2013, we intend to further focus our channel to individually support and address the needs of upper extremity and lower extremity specialists. For example, in the U.S., we are pursuing dedicated sales representation aligned to upper and lower extremity specialists through leveraging the Tornier and OrthoHelix existing distribution channels, along with direct sales channels in certain markets.

Introducing new products and technologies to address more of our extremity specialists’ clinical needs: Our goal is to continue to introduce new technologies for extremity joints that improve patient outcomes and thereby continue to expand our market opportunity and share. In addition, through our acquisition of OrthoHelix, we believe that we can leverage our strong arthroplasty position to further expand our opportunities in bone repair, thereby offering a more comprehensive foot and ankle portfolio. Since 2006, we have significantly increased our investment in research and development to accelerate the pace of new product introduction and with our acquisition of OrthoHelix in 2012, have expanded our capabilities. We have also been active in gaining access to new technologies through external partnerships, licensing agreements and acquisitions. We believe that our reputation for effective collaboration with industry thought leaders as well as our track record of effective new product development and introductions will allow us to continue to gain access to new ideas and technologies early in their development.

Expanding our international business: We face a wide range of market dynamics that require our distribution channels to address both our local market positions and local market requirements. For example, in France, which is a more developed extremities market and where we have a diversified extremities, hip and knee business, we have two direct sales organizations. One is focused on products for upper extremities, and the other focused on hip and knee replacements and products for lower extremities. In other European markets, we utilize a combination of direct and distributor strategies that have evolved to support our expanding extremity business and also to support our knee and hip market positions. In international markets where the extremity market segment is relatively underdeveloped, the same sales channel may sell our hip and knee product portfolios and extremity joint products, which provides these sales channels sufficient product breadth and economic scale. We plan on expanding our international business by continuing to adapt our distribution channels to the unique characteristics of individual markets, which has included conversions to direct sales organizations in certain geographies. In addition, once we receive the necessary regulatory approvals, we will begin to introduce the innovative OrthoHelix product portfolio into select international markets and leverage our existing sales and distribution channels.

Advancing scientific and clinical education:We believe our specialty focus, commitment to product innovation and culture of scientific advancement attract both thought leaders and up-and-coming surgeon specialists who share these values. We actively involve these specialists in the development of world-class training and education programs and encourage ongoing scientific study of our products. Specific initiatives include the Tornier Master’s Courses in shoulder and ankle joint replacement, The Fellows and Chief Residents Courses, and a number of clinical concepts courses. We also maintain a registry that many of our customers utilize to study and report on the outcomes of procedures in which our extremity products have been used. We believe our commitment to science and education also enables us to reach surgeons early in their careers and provide them access to a level of training in extremities that we believe is not easily accessible through traditional orthopaedic training.

Our Surgeon Customers

We estimate that there are over 80,000 orthopaedic and over 9,000 podiatric surgeons worldwide who specialize in surgical treatment of the musculoskeletal system, including bones, joints and soft tissues such as tendons and ligaments. In the United States and certain other developed markets, there has been a trend over the past two decades for these surgeons to specialize in certain parts of the anatomy or certain types of procedures. We believe that the trend toward specialization has been supported by the expansion of specialist professional societiesanatomy-specific devices, locking plates, and an increase in the number of fellowship programs. We focus on the following orthopaedic specialist groups:

total ankle replacement or arthroplasty procedures.

Upper Extremity Specialists: Upper extremity specialists perform joint replacementextremities reconstruction involves implanting devices to replace, reconstruct, or fixate injured or diseased joints and trauma and soft tissue repair procedures forbones in the shoulder, elbow, wrist, and hand. It is estimated that approximately 60% of the upper extremities market is in total shoulder replacement or arthroplasty implants. We believe the evolution of this specialty has been driven by the unique requirements of these joints due to the relative importance of soft tissue to joint function and the increased complexity and breadth of technology available for use in these procedures. For this reason, in addition to joint replacement and trauma products, upper extremity specialists utilize a broad range of sports and biologic products. We believe upper extremity specialists now perform the majority of shoulder joint replacements that were previously performed by reconstructive and general orthopaedic surgeons.

Lower Extremity Specialists: Lower extremity specialists perform a wide range of joint replacement, trauma, reconstruction and soft tissue repair procedures for the foot and ankle. This specialist group principally consists of orthopaedic surgeons who have received fellowship or other specialized training. Additionally, Doctors of Podiatric Medicine with special surgical training may perform certain foot and ankle surgical proceduresmajor trends in the United States, Canada and the United Kingdom.

Sports Medicine Specialists:Sports medicine specialists are surgeons who useupper extremities market include minimally invasive surgical techniques, including arthroscopy, for thefracture repair of soft tissues. Arthroscopy is a minimally invasive surgical technique in which a surgeon creates several small incisions at the surgery site; inserts a fiber optic scope with a miniature video camera as well as surgical instruments through the incisionsdevices and next-generation joint arthroplasty systems.

Lower extremities reconstruction involves implanting devices to visualize, accessreplace, reconstruct, or fixate injured or diseased joints and conduct the procedure; and uses a video monitor to view the surgery itself. The sports medicine specialty is not just limited to treatment of athletes, but rather to all patients with orthopaedic soft tissue injuries or disease. The most common extremities sports medicine procedures are Achilles tendon repairs and rotator cuff repairs in the shoulder.

Reconstructive and General Orthopaedic Surgeons: Reconstructive and general orthopaedic surgeons are important customers for us in selected European countries and other international markets. In these markets, orthopaedic surgeons may treat multiple areas of bone and joint disease and trauma, and commonly perform procedures involving extremity joints as well as hip and knee joint replacement. For these target customers, we are able to provide not only our broad product categories for extremity joint procedures, but also our hip and knee joint replacement products.

Our Target Markets

We compete on a worldwide basis providing upper and lower extremity specialist surgeons a wide range of products from several major segments of the orthopaedic market, including extremity joints, sports medicine, biologics and trauma. In addition, we compete in the hip and knee segments of certain international markets where we have a strong legacy presence such as in France, where participation in the local hip and knee market is important to our distributor partners, and in other international markets, where the market for our extremity focused products is still small.

We believe our addressable portion of the market will grow at a faster rate than the overall orthopaedic market due to the introduction of new technologies with improved clinical outcomes, a growing number of extremity specialists, the aging of the general population and the desire for people to remain physically active as they grow older. Overviews of the major orthopaedic markets in which we compete, as well as our targeted participation in those markets, are as follows:

Extremity Joints: The extremity joint market includes implantable devices used for the replacement of shoulder, elbow, hand, and foot and ankle joints. We believe this market has been under-served and underdeveloped by major orthopaedic companies, which have generally focused on the much larger hip, knee and spine markets. As a result, the growth of the extremity joint market is still benefiting from market-expanding design and materials technologies and from growth in the number of upper and lower extremity specialists. We believe that we are a leader in both the shoulder and ankle joint replacement portions of this market based upon revenue.

Sports Medicine: Sports medicine refers to the repair of soft tissue injuries that often occur when people are engaged in physical activity, but that also result from age-related wear and tear. We believe market growth has been driven by both new technology and the continued acceptance of minimally invasive surgical techniques. The most common sports medicine procedures are Achilles tendon repairs and rotator cuff repairs in the shoulder. The primary sports medicine products include capital equipment and related disposables as well as bone anchors, which are implantable devices used to attach soft tissue to bone, sutures, or thread for soft tissue, and handheld instruments. We estimate that our products currently address only a portion of the sports medicine market, primarily bone anchors and other products utilized for rotator cuff repairs. The total sports medicine market also includes capital or powered equipment and related disposables, but we do not have any product offerings in these areas.

Biologics:Biologics refer to products, both biologic and synthetic, that are utilized to stimulate hard and soft tissue healing following surgery for a wide range of orthopaedic injuries or disorders. We believe market growth is being driven by the application of an expanding biotechnology knowledge base to the development of products that can improve clinical

outcomes by inducing tissue healing and regeneration. The primary product categories in the total biologics market are bone grafting materials, cell therapy systems, including growth factors, and tendon and ligament grafts. We currently offer tendon and ligament graft and scaffold products for extremities and platelet concentration systems.

Trauma: The trauma market includes devices that are used to treat fractures, joint dislocations, severe arthritis and deformities that result from either acute injuries or chronic wear and tear. The major products in the trauma market include metal plates, screws, pins, wires and external fixation devices used to hold fractured bone fragments together until they heal properly. These devices are also utilized in the treatment of a wide range of non-traumatic surgical procedures, especiallybones in the foot and ankle. AsA large segment of the lower extremities market has transitioned from external casting performedis comprised of plating and screw systems for reconstructing and fusing joints or repairing bones after traumatic injury. We believe major trends in the emergency room,lower extremities market include the use of external fixation devices in diabetic patients, total ankle arthroplasty, advanced tissue fixation devices, and biologics. According to internal fixation performed on a scheduled basis in the operating room, our extremity specialist customers have expanded their role in treating trauma injuries. Our acquisition of OrthoHelix has significantly strengthened our product portfolio so thatvarious customer and market surveys, we are better able to address this importanta market segment.

Knee Joints:Knee joint replacements are performed for patients who have developed an arthritic condition that compromises the joints’ articulating surfaces (articulating surfaces are bone segments connected by a joint). The knee joint replacement system has multiple components including a femoral component, a tibial component and a patella component (knee cap). We currently provide a broad line of knee joint replacement productsleader in selected international geographies. We do not currently address the knee joint market in the United States.

Hip Joints:Hip joint replacements are performed for patients who have suffered a femoral fracture or suffer from severe arthritis or other conditions that have led to the degradation of the articular cartilage or bone structure residing between the femoral head and the acetabulum (hip socket). The hip joint replacement system generally includes both femoral and acetabular components. We currently provide a broad line of hip joint replacement products in selected international geographies. We do not currently address the hip joint market in the United States.

Our Product Portfolio

We offer a broad product line designed to meet the needs of our extremity specialists and their patients. Although the industry traditionally organizes the orthopaedic market based on the mechanical features of the products, we organize our product categories in a way that aligns with the types of surgeons who use them. Therefore, we distinguish upper extremity joints and trauma from lower extremity joints and trauma, as opposed to viewing joint implants and trauma products as distinct product categories. Along these lines, our product offering is as follows:

Product category

Target addressable geography

Upper extremity joints and traumaUnited States and International
Lower extremity joints and traumaUnited States and International
Sports medicine and biologicsUnited States and International
Large joints and otherSelected International Markets

See Fiscal Year Comparisons contained in the Management’s Discussion and Analysis of Financial Condition and Results of Operations section of this report for a three-year revenue history by product category.

Upper Extremity Joints and Trauma

The upper extremity joints and trauma product category includes joint implants and bone fixation devices for the shoulder, hand, wrist and elbow. Our global revenue from this category for the year ended December 30, 2012 was $175.2 million, or 63% of total revenue, which represents growth of 7% over the prior year.

Shoulder Joint Replacement and Trauma Implants: We expect the shoulder to continue to be the largest and most important product category for us for the foreseeable future. Our shoulder joint implants are used to treat painful shoulder conditions due to arthritis, irreparable rotator cuff tendon tears, bone disease, fractured humeral heads or failed previous shoulder replacement surgery. Our products are designed for the following:

Our total joint replacement products have two components—a humeral implant consisting of a metal stem attached to a metal head, and a plastic implant for the glenoid (shoulder socket). Together, these two components mimic the function of a natural shoulder joint.

Our hemi joint replacement products replace only the humeral head and allow it to articulate against the native glenoid.

Our reversed implants are used in arthritic patients lacking rotator cuff function. The components are different from a traditional “total” shoulder in that the humeral implant has the plastic socket and the glenoid has the

metal head. This design has the biomechanical impact of shifting the pivot point of the joint away from the body centerline and giving the deltoid muscles a mechanical advantage to enable the patient to elevate the arm.

Our convertible implants are modular implants that can be converted from a total or hemi joint replacement to a reversed implant at a later date if the patient requires it.

Our resurfacing implants are designed to minimize bone resection to preserve bone, which may benefit more active or younger patients with shoulder arthritis.

Trauma devices, such as plates, screws and nails, are non-articulating implants used to help stabilize fractures of the humerus.

Hand, Wrist and Elbow Joint Replacement and Trauma Implants: We offer joint replacement products that are used to treat arthritis in the hand, wrist and elbow. In addition, we offer trauma products including plates, screws and pins, to treat fractures of the hand, wrist and elbow. One of our distinctive product offerings for these smaller, non-load bearing joints are implants made from a biocompatible material called pyrolytic carbon (pyrocarbon), which has low joint surface friction and a high resistance to wear. We offer a wide range of pyrocarbon implants internationally and have begun to introduce some of these products into the United States.

Lower Extremity Joints and Trauma

Our global revenue from lower extremity joints and trauma for the year ended December 30, 2012 was $34.1 million, 12% of total revenue, which represents growth of 31% over the prior year. This included approximately $7.8 million of incremental revenue from our acquisition of OrthoHelix, which was completed on October 4, 2012.

Ankle Joint Implants: Ankle arthritis is a painful condition that can be treated by fusing the ankle joint with plates or screws or by replacing the joint with an articulating multi-component implant. These joint implants may be mobile bearing, in which the plastic component is free to slide relative to the metal bearing surfaces, or fixed bearing, in which this component is constrained. We offer mobile bearing implants outside the United States and precision bearing implants globally, which are highly anatomic fixed bearing implants.

Foot and Ankle Joint and Trauma Implants: Our products include a broad range of anatomically designed plates, screws and nails. These “trauma” products are used to stabilize and heal fractured bones, correct deformities and fuse arthritic joints of the foot and ankle.

Other Foot and Ankle Joint and Trauma Implants: In addition to ankle joints, we offer a range of implants made of various materials to partially or fully replace the joints of the toes and correct deformities such as flatfoot.

Sports Medicine and Biologics

Our revenue from sports medicine and biologics for the year ended December 30, 2012 was $15.5 million, or 6% of total revenue, which represents growth of 5% over the prior year.

Sports Medicine: The sports medicine product category includes products used across several anatomic sites to mechanically repair tissue-to-tissue or tissue-to-bone injuries. Because of its close relationship to shoulder joint replacement, the sports medicine market is of critical strategic importance to us. Rotator cuff repair is the largest sub-segment in the sports medicine market. Other procedures relevant to extremities include shoulder instability treatment, Achilles tendon repair and soft tissue reconstruction of the foot and ankle surgical products. New technologies have been introduced into the lower extremities market in recent years, including next-generation total ankle replacement systems. Many of these technologies currently have low levels of market penetration. We believe that market adoption of total ankle replacement, which currently represents approximately 6% of the U.S. foot and several other soft tissue repair procedures.

Biologics: ankle device market, will result in significant future growth in the lower extremities market.

The field of biologics employs tissue engineering and regenerative medicine technologies focused on remodeling and regeneration of tendons, ligaments, bone, and cartilage. Biologic products use both biological tissue-based and synthetic materials to allow the body to regenerate damaged or diseased bone and to repair damaged or diseased soft tissue. These products aid the body’s natural regenerative capabilities to heal itself, minimizing or delaying the need for invasive implant surgery. Biologic products provide a lower morbidity solution to “autografting,” a procedure that involves harvesting a patient’s own bone or soft tissue and transplanting it to a different site. Following an autografting procedure, the patient typically has pain, and at times, complications result at the harvest site after surgery. Biologically or synthetically derived soft tissue grafts and scaffolds are used to treat soft tissue injuresinjuries and are complementary to many sports medicine applications, including rotator cuff tendon repair and Achilles tendon repair. Hard tissue biologics products are used in many bone fusion or trauma cases where healing potential may be compromised and additional biologic factors are desired to enhance healing, where the surgeon needs additional bone, stock and does not want to harvest a bone graft from another surgical site or in cases where the surgeon wishes to use materials that are naturally incorporated by the body over time. We estimate that the worldwide orthobiologics market to be over $3.5 billion, and with annual growth rates of 3-5%. Three multinational companies currently dominate the orthobiologics industry.
The newest addition to our biologics product portfolio is AUGMENT® Bone Graft, which is based on recombinant human platelet-derived growth factor (rhPDGF-BB), a synthetic copy of one of the body’s principal healing agents. We obtained FDA approval of AUGMENT® Bone Graft in the United States for ankle and/or hindfoot fusion indications during the third quarter of 2015. We estimate the U.S. market opportunity for AUGMENT® Bone Graft for ankle and/or hindfoot fusion indications to be approximately $300 million. The main competitors for AUGMENT® Bone Graft are autologous bone grafts, allograft, and synthetic bone growth substitutes. Autologous bone grafts, which account for a significant portion of total graft volume, are taken directly from the patient. This generally necessitates an additional procedure to obtain the graft, which in turn creates added expense, and increased pain and recovery time. Allografts, which are currently the second most commonly used bone grafts, are taken from human cadavers and processed by either bone banks or commercial firms. Although an

2


obvious advantage to allografts is the fact that a second-site harvesting operation is not required, they carry a slight risk of transmitting pathogens and can also cause immune system reactions. Synthetic grafts are derived from numerous materials, including polymers, bovine collagen, and coral.
Product Portfolio
We offer a broad product portfolio of over 160 extremities products and 20 biologics products that are designed to provide solutions to our surgeon customers, with the goal of improving clinical outcomes and the “quality of life” for their patients. Our product portfolio consists of the following product categories:
Upper extremities, which include joint implants and bone fixation devices for the shoulder, elbow, wrist, and hand;
Lower extremities, which include joint implants and bone fixation devices for the foot and ankle;
Biologics, which include products used to support treatment of damaged or diseased bone, tendons, and soft tissues or to stimulate bone growth;
Sports medicine and other, which include products used across several anatomic sites to mechanically repair tissue-to-tissue or tissue-to-bone injuries and other ancillary products; and
Large joints, which include hip and knee replacement implants.

Upper Extremities
The upper extremities product category includes joint implants and bone fixation devices for the shoulder, elbow, wrist, and hand. Our global net sales from this product category was $84 million or 20% of total net sales for the year ended December 27, 2015 and $27 million or 9% of total net sales for the year ended December 31, 2014. Our net sales in upper extremities increased significantly as a result of the Wright/Tornier merger. We expect 2016 upper extremity sales to continue to increase compared to 2015 as a result of the broad shoulder product portfolio which we acquired from legacy Tornier.
Our shoulder products are used to treat painful shoulder conditions due to arthritis, irreparable rotator cuff tendon tears, bone disease, fractured humeral heads, or failed previous shoulder replacement surgery. Our shoulder products include the following:
Total Shoulder Joint Replacement. Our total shoulder joint replacement products have two components-a humeral implant consisting of a metal stem or base attached to a metal head, and a plastic implant for the glenoid (shoulder socket). Together, these two components mimic the function of a natural shoulder joint. Our total shoulder joint replacement products include the AEQUALIS ASCEND®, AEQUALIS® PRIMARY™, AEQUALIS® PERFORM™ and SIMPLICITI® shoulder systems. The SIMPLICITI® is the first minimally invasive, ultra-short stem total shoulder that has been available in certain international markets for a couple of years, but was commercially launched by Tornier on a limited focused basis in the United States late in the second quarter of 2015, after receipt of FDA 510(k) clearance in March 2015. During the third quarter of 2015, the SIMPLICITI® shoulder system became widely available in the United States. We believe SIMPLICITI® allows us to expand the market to include younger patients that historically have deferred these procedures. Our recently introduced BLUEPRINT™ 3D Planning Software can be used with our AEQUALIS® PERFORM™ Glenoid System to assist surgeons in accurately positioning the glenoid implant and replicating the pre-operative surgical plan.
Hemi Shoulder Joint Replacement. Our hemi shoulder joint replacement products replace only the humeral head and allow it to articulate against the native glenoid. These products include our PYC HUMERAL HEAD™ and INSPYRE™. PYC stands for pyrocarbon, which is a biocompatible material that has low joint surface friction and a high resistance to wear. The PYC HUMERAL HEAD™ is currently available in certain international markets. In the third quarter of 2015, Tornier received FDA approval for its investigational device exemption to conduct a clinical trial in the U.S. for the Tornier AEQUALIS® PyroCarbon Humeral Head and began enrolling patients in the fourth quarter of 2015. This single arm study will enroll and implant 157 patients from up to 20 centers across the United States and will evaluate the safety and effectiveness of the device in patients with a primary diagnosis of partial shoulder replacement or hemi-arthroplasty. The study design uses a primary endpoint that is measured at two years.
Reversed Shoulder Joint Replacement. Our reversed shoulder joint replacement products are used in arthritic patients lacking rotator cuff function. The components are different from a traditional “total” shoulder in that the humeral implant has the plastic socket and the glenoid has the metal head. This design has the biomechanical impact of shifting the pivot point of the joint away from the body centerline and recruiting the deltoid muscles to enable the patient to elevate the arm. Our reversed joint replacement products include the AEQUALIS® REVERSED II™ shoulder.

3


Convertible Shoulder Joint Replacement. Our convertible shoulder joint replacement products are modular implants that can be converted from a total or hemi shoulder implant to a reversed implant at a later date if the patient requires it. Our convertible joint replacement products include the AEQUALIS ASCEND® FLEX™ convertible shoulder system, which provides anatomic and reversed options within a single system and offers precise intra-operative implant-to-patient fit and easy conversion to reversed if necessary.
Shoulder Resurfacing Implants. An option for some patients is shoulder resurfacing where the damaged humeral head is sculpted to receive a metal “cap” that fits onto the bone, functioning as a new, smooth humeral head. This procedure can be less invasive than a total shoulder replacement. Our shoulder resurfacing implants are designed to preserve bone, which may benefit more active or younger patients with shoulder arthritis. Our resurfacing implants include the AEQUALIS® RESURFACING HEAD™.
Shoulder Trauma Devices. Our shoulder trauma devices, such as plates, pins, screws, and nails, are non-articulating implants used to help stabilize fractures of the humerus. Our shoulder trauma products include the AEQUALIS® IM NAIL™, AEQUALIS® PROXMILA HUMERAL PLATE™, AEQUALIS® FRACTURE™ shoulder and AEQUALIS® REVERSED FRACTURE™ shoulder.
In addition to our shoulder products, our upper extremities product portfolio consist of implants, plates, pins, screws, and nails that are used to treat the elbow, wrist, and hand, and include the following:
Total Elbow and Radial Head Replacement. Our total elbow and radial head replacement products address the need for modularity in the anatomically highly-variable joint of the elbow and give surgeons the ability to reproduce the natural flexion/extension axis and restore natural kinematics of the elbow. Our total elbow replacement products include our LATITUDE® EV™ total elbow prosthesis. Our radial head replacement products include our EVOLVE® modular radial head device, which is a market leading radial head prosthesis that provides different combinations of heads and stems allowing the surgeon to choose implant heads and stems to accommodate the unpredictable anatomy of each patient.
Elbow Fracture Repair. We have several plating and screw products designed to repair a fractured elbow. Our radial head plating systems and screws are for surgeons who wish to repair rather than replace a damaged radial head and include our EVOLVE® TRIAD™ fixation system. Our EVOLVE® Elbow Plating System addresses fractures of the distal humerus and proximal ulna. Composed of polished stainless steel, this system was designed to accurately match the patient anatomy to reduce the need for intra-operative bending while providing a low profile design to minimize post-operative irritation. Both of these products and several of our other products incorporate our ORTHOLOC® 3Di Polyaxial Locking Technology to enable optimal screw placement and stability.
Wrist Fracture Repair. We have several plating and screw products designed to repair a fractured wrist. Our MICRONAIL® II Intramedullary Distal Radius System is a next-generation minimally invasive treatment for distal radius fractures that provides immediate fracture stabilization with minimal soft tissue disruption. Also, as the nail is implanted within the bone, it has no external profile on top of the bone, thereby reducing the potential for tendon irritation or rupture, which is an appreciable problem with conventional plates designed to lie on top of the bone. In addition, our RAYHACK® system is comprised of a series of precision cutting guides and procedure-specific plates for ulnar and radial shortening procedures and the surgical treatment of radial malunions and Keinbock’s Disease.
Hand Fixation. Our hand fixation products include our FUSEFORCE® Hand Fixation System, which is a shape-memory compression-ready fixation system that can be used in fixation for fractures, fusions, or osteotomies of the bones in the hand.
Thumb and Finger Joint Replacement. Our Swanson finger joints are used in finger joint replacement for patients suffering from rheumatoid arthritis of the hand. With nearly 45 years of clinical success, Swanson digit implants are a foundation in our upper extremities business and are used by a loyal base of hand surgeons worldwide. Our ORTHOSPHERE® implants are used in thumb joint replacement procedures.

Lower Extremities
The lower extremities product category includes joint implants and bone fusion and fixation devices, including plates, pins, screws, and nails, for the foot and ankle. Our global net sales from this product category for the year ended December 27, 2015 was $238 million or 58% of total net sales as compared to $196 million or 66% of total net sales for the year ended December 31, 2014.

4


We are a recognized leader in the United States for foot and ankle surgical products. Our lower extremities product portfolio includes:
Total Ankle Joint Replacement. Total ankle joint replacement, also known as total ankle arthroplasty, is a surgical procedure that orthopaedic surgeons use to treat ankle arthritis. Our total ankle joint replacement products include implants for the ankle that involve replacing the joint with an articulating multi-component implant. These joint implants may be mobile bearing, in which the plastic component is free to slide relative to the metal bearing surfaces, or fixed bearing, in which this component is constrained. Our INBONE® Total Ankle Systems, including our third-generation INBONE® II Total Ankle System, are modular prostheses that allow the surgeon to tailor the fixation stems for the tibial and talar components in order to maximize stability of the implant. The INBONE® II Total Ankle System is the only ankle replacement that offers surgeons multiple implant options with different articular geometry. Our INFINITY® Total Ankle System is the newest addition to our total ankle replacement portfolio and features a distinctive talar resurfacing option for preservation of talar bone. The combination and interchangeability of both the INBONE® and INFINITY® systems provide the surgeon with an implant continuum of care concept, allowing the surgeon to address a more bone conserving implant option with INFINITY® all the way to addressing a more complex ankle deformity with INBONE®. Our INBONE® and INFINITY® Total Ankle Systems can be used with our PROPHECY® Preoperative Navigation Guides, which combine computer imaging with a patient’s CT scan, and are designed to provide alignment accuracy while reducing surgical steps. We expect to begin limited physician testing of our most recent total ankle replacement product, the INVISION™ Total Ankle Revision System, in 2016.
Ankle Fusion. We have several products used in ankle fusion procedures, which fuse together the tibia, fibula, and talus bones into one bone, and are intended to treat painful, end-stage arthritis in the ankle joint. These products include our ORTHOLOC® 3Di Ankle Fusion System, which legacy Wright launched with great success in July 2013, and VALOR® TTC fusion nail.
Ankle Fixation and Fracture Repair. We sell a broad range of anatomically designed plates, screws, and nails used to stabilize and heal fractured ankle bones, including our ORTHOLOC® 3Di Ankle Fracture System, which is a comprehensive single-tray ankle fracture solution designed to address a wide range of fracture types by providing the surgeon with multiple anatomically-contoured plates and a comprehensive set of instrumentation.
Foot Fusion. We have several products used in foot fusion procedures, which fuse together three bones in the back of the foot into one bone and are used to treat a wide range of conditions, including arthritis, flat feet, rheumatoid arthritis, and previous injuries, such as fractures caused by wear and tear to bones and cartilage. Our foot fusion products include our ORTHOLOC® 3Di Midfoot Plating System and VALOR® TTC fusion nail.
Foot Fixation and Fracture Repair. Our foot fixation and fracture repair products include plates, screws, and nails used to stabilize and heal foot deformities and fractures. Our CHARLOTTE® CLAW® Compression Plate is the first ever locking compression plate designed for corrective foot surgeries. Our next-generation CLAW® II Compression Plating System expands our plate and screw offering by introducing anatomic plates specifically designed for fusions of the midfoot, and the CLAW® II Polyaxial Compression Plating System incorporates variable-angle locking screw technology and our ORTHOLOC® 3Di Reconstruction Plating System utilizes our 3Di polyaxial locking technology. In July 2014, we further expanded the ORTHOLOC® 3Di portfolio with the launch of the flatfoot module. This innovative plating solution is designed to bring speed, precision, and reproducibility to several difficult flatfoot procedures. Our SALVATION™ limb salvage portfolio, which is designed to address the unique demands of advanced midfoot reconstruction, is expected to be commercially launched in the first half of 2016. Other foot products include the MAXLOCK®, MINIMAX LOCK™ and MINIMAX LOCK EXTREME™ plate and screw systems, BIOFOAM® Wedge System, SIDEKICK® line of external fixators, BIOARCH® Subtalar Arthroereisis Implant, MDI Metatarsal Resurfacing Implant, TENFUSE® Nail Allograft, and Total Compression Plate System.
Hammertoe Correction. Hammertoe is a contracture (bending) of one or both joints of the second, third, fourth, or fifth (little) toes. Our hammertoe correction products include the PRO-TOE® VO Hammertoe Fixation System, MITOE™, PHALINX® Hammertoe Fixation System, Cannulink Intraosseous Fixation System (IFS), and TENFUSE® PIP Hammertoe Allograft.
Toe Joint Replacement. We also sell our Swanson line of toe joint replacement products.

Biologics
The biologics product category includes a broad line of biologic products that are used to support treatment of damaged or diseased bone, tendons, and soft tissues and other biological solutions for surgeons and their patients or to stimulate bone growth. These products focus on supporting biological musculoskeletal repair by utilizing synthetic and human tissue-based materials. Our biologic products are primarily used in extremities-related procedures as well as in trauma-induced voids of the long bones and some spine procedures. Internationally, we offer a bone graft product incorporating antibiotic

5


delivery. Our global net sales from this product category for the year ended December 27, 2015 was $70 million or 17% of total net sales compared to $66 million or 22% of total net sales for the year ended December 31, 2014.
Our biologics products include the following:
AUGMENT® Bone Graft. The newest addition to our biologics product portfolio is AUGMENT® Bone Graft. Our AUGMENT® Bone Graft product line is based on recombinant human platelet-derived growth factor (rhPDGF-BB), a synthetic copy of one of the body’s principal healing agents. We obtained FDA approval of AUGMENT® Bone Graft for ankle and/or hindfoot fusion indications in the United States during third quarter of 2015. Prior to FDA approval, this product was available for sale in Canada for foot and ankle fusion indications and in Australia and New Zealand for hindfoot and ankle fusion indications. We acquired the AUGMENT® Bone Graft product line from BioMimetic Therapeutics, Inc. (BioMimetic) in March 2013.
Hard Tissue Repair. Our other bone or hard tissue repair products include our PRO-DENSE® Injectable Regenerative Graft, which is currently the only injectable bone graft on the market. It is a composite graft of surgical grade calcium sulfate and calcium phosphate, and in animal studies, has demonstrated excellent bone regenerative characteristics, forming new bone that is over three times stronger than the natural surrounding bone at the 13-week time point. Beyond 13 weeks, the regenerated bone gradually remodels to natural bone strength. Our PRO-STIM® injectable inductive graft is built on the PRO-DENSE® material platform, but adds demineralized bone matrix (DBM), and has demonstrated accelerated healing compared to autograft in contrastpre-clinical testing. Our other hard tissue repair products, including our IGNITE® Power Mix Injectable Stimulus, FUSIONFLEX™ demineralized moldable scaffold, ALLOMATRIX® injectable bone graft putty, OSTEOSET® bone graft substitute, MIIG® Injectable Graft, CANCELLO-PURE® bone wedge line, ALLOPURE® allograft bone wedge line and OSTEOCURE™ Resorbable Bead Kits.
Soft Tissue Repair. Our soft tissue repair products include our GRAFTJACKET® Regenerative Tissue Matrix, which is a human-derived soft tissue graft designed for augmentation of tendon and ligament repairs, such as those of the rotator cuff in the shoulder and Achilles tendon in the foot and ankle. GRAFTJACKET® Maxforce Extreme is our thickest GRAFTJACKET® matrix, which provides excellent suture holding power for augmenting challenging tendon and ligament repairs. We procure our GRAFTJACKET® product through an exclusive distribution agreement that expires December 31, 2018. Other soft tissue repair products include our CONEXA™ Reconstructive Tissue Matrix, ACTISHIELD™ and ACTISHIELD™ CF Amniotic Barrier Membranes, VIAFLOW™ and VIAFLOW™ C Flowable Placental Tissue Matrices, BIOFIBER® biologic absorbable scaffold products, and PHANTOM FIBER™ high strength, resorbable suture products.

Sports Medicine and Other
The sports medicine and other product category includes products used across several anatomic sites to traditional metallic-basedmechanically repair tissue-to-tissue or tissue-to-bone injuries and other ancillary products. Because of its close relationship to extremities joint replacement and bone fixation, our sports medicine portfolio is comprised of products used to complement our upper and lower extremities product portfolios, providing surgeons a variety of products that may require later removal.

We have a robust pipelinebe used in upper and lower extremities surgical procedures. Our global net sales from this product category for the year ended December 27, 2015 was $13 million or 3% of biologics products under development and are actively pursuing new product additions. We have in-licensed biologic materials such as BioFiber, an advanced high-strength resorbable polymer fiber produced using recombinant DNA technology as well as our F2A peptide, a synthetic versiontotal net sales compared to $10 million or 3% of total net sales for the natural human FGF-2 growth factor.

year ended December 31, 2014.

Large Joints and Other

The large joints and other product category includes hip and knee joint replacement implants and ancillary products.implants. Hip and knee joint replacementsreplacement products are used to treat patients with painful arthritis in these larger joints.joints and to treat femoral fracture patients. We offer these products in France and select international geographies. Our global revenuenet sales from large joints and other productsthis product category for the year ended December 30, 201227, 2015 was $52.6$10 million, or 19%2% of total revenue, and was a result of the Wright/Tornier merger.
On January 9, 2014, legacy Wright completed the sale of its hip/knee (OrthoRecon) business to MicroPort Scientific Corporation (MicroPort) for approximately $283 million in cash. The agreement with MicroPort requires legacy Wright, as between it and MicroPort, to retain responsibility for product liability claims on OrthoRecon products sold prior to closing, and for any resulting settlements, judgments, or other costs, which represents a declinecould be significant. The financial results of the OrthoRecon business have been reflected within discontinued operations for all periods presented. See Note 4 to our consolidated financial statements contained in revenue of 7% over the prior year. This decline was primarily dueItem. 8. Financial Statements and Supplementary Data” for further information regarding this sale and our discontinued operations relating to the impact of foreign currency exchange rate fluctuationsOrthoRecon business and revenue decreases in certain Western European countries due primarilysee Note 16 to austerity measures. We generated nearly all of our revenue from this category outside of the United States, and a substantial majority of this revenue in France.

We have continued to innovate in this area so that we may maintain or grow market share in select international markets where the extremity markets have not yet reached a size to permit the type of channel focus that we have in the United States or where extremities specialization is not as prevalent as in the United States. consolidated financial statements for further information regarding outstanding litigation involving our former OrthoRecon products.

We currently have no plans to actively market our large joint implants in the United States.


6


Sales, Marketing, and Distribution

Medical Education

Our sales and marketing efforts are focused primarily on orthopaedic, trauma, and podiatric surgeons. Orthopaedic surgeons focused on the extremities in many instances have completed upper or lower extremities fellowship programs. We offer surgeon-to-surgeon education on our products using surgeon advisors in an instructional capacity. We have developed our distribution channels to serve the needs of our customers, primarily extremity specialistcontractual relationships with these surgeon advisors, who help us train other surgeons in the United Statessafe and a mixeffective use of extremity specialistour products and generalhelp other surgeons perfect new surgical techniques. Together with these surgeon advisors, we provide surgeons extensive “hands on” orthopaedic training and education, including upper and lower extremities fellowships and masters courses that are not easily accessible through traditional medical training programs. We also offer clinical symposia and seminars, and publish advertisements and the results of clinical studies in industry publications. We believe that our history of innovation and focus on quality and improving clinical outcomes and “quality of life” for patients, along with our training programs, allow us to reach surgeons early in their careers and provide on-going value, which includes experiencing the clinical benefits of our products.
Due to the nature of specialized training surrounding podiatric and orthopaedic surgeons focused on extremities and biologics, our target market is well defined. Historically, surgeons are the primary decision-makers in international markets. orthopaedic device purchases. While we market our broad portfolio of products to surgeons, our revenue is generated from sales of our products to healthcare institutions and stocking distributors.
United States
In the United States, we have a broad offeringmarket and sell our full product portfolio, other than our products for the hip or knee, which we refer to as “large joints”. As of joint replacement and repair, sports and biologic products targeting extremity specialists through, historically, a single distribution channel, with variations based upon individual territories. As we integrate OrthoHelix, we plan to organizeDecember 27, 2015, our sales channels to focus on upper extremities and lower extremities to allow us to increase our selling opportunitiesdistribution system in the United States consisted of 65 geographic sales territories that are staffed by improving our overall procedure coverage, leveraging our entire product portfolio, and accessing new specialists and accounts. Internationally, we utilize several distribution approaches depending on individual market requirements. We utilize458 direct sales organizations in several mature European marketsrepresentatives and Australia,30 independent sales agencies or distributors. These sales representatives and independent sales agencies for most other international markets. In France, we have twoand distributors are generally aligned to selling either our upper extremities products or lower extremities products, but, in some cases, certain agencies or direct sales forces, one handlingrepresentatives sell products from both our upper extremity focused products and one handling our lower extremity focused products and our hip and knee portfolios. In emerging international geographies where extremity markets are still undeveloped, we utilize independent distributors who carry both our extremity-focused and our hip and knee portfolios.

United States

In the United States, we sell upper extremity joints and trauma, lower extremity joints and trauma, sports medicine and biologics products. We do not actively market hip or knee replacement joints in the United States, although we have FDA clearance for selected large joint products. We have historically sold our products through a single distribution channel, with variations based upon individual territories. As we integrate OrthoHelix, in 2013 we plan to organize our sales channels to focus on upper extremities and lower extremities to allow us to increase our selling opportunities by improving our overall procedure coverage, leveraging our entire product portfolio, and accessing new specialists and accounts.portfolios in their territories. Our U.S. sales force consists of a network of approximately 65 independent commission-based sales agencies, and 4 direct sales organizations in certain territories. We believe a significant portion of our independent sales agencies’ commission revenue is generated by sales of our products. Our success depends largely upon our ability to motivate these sales agenciesrepresentatives, and their representatives to sell our products. Additionally, we depend on their sales and service expertise and relationships with the surgeons in the marketplace. Our independent sales agencies are not obligated to renew their contracts with us, may devote insufficient sales efforts to our products or may focus their sales efforts on other products that produce greater commissions for them. A failure to maintain our existing relationships with our independent sales agencies, and their representatives could have an adverse effect on our operations. We do not control our independent sales agencies and they may not be successful in implementing our marketing plans. As we begin to create focused upper extremity and lower extremity sales channels, and as we make other changes and transitions in our independent sales agency arrangements, our U.S. business may experience disruption due to these factors, but we believe that this strategy will be a significant competitive advantage longer term. Our field sales leadership team consists of five area sales directors from our legacy Tornier organization and three from our OrthoHelix organization, along with a team of upper and lower extremity technical specialists, to support our independent sales agencies and direct sales organizations and to drive focus, accountable performance, business leadership and technical expertise amongst our sales force. During the course of the year, we host numerousdistributors are provided opportunities for product training throughout the United States.year. We generated $156.8 million, or 56%, ofalso have working relationships with healthcare dealers, including group purchasing organizations, healthcare organizations, and integrated distribution networks. We believe our total revenuesuccess in the United States during the year ended December 30, 2012.

every market sector is dependent upon having a robust and compelling product offering, and equally as important, a dedicated, highly trained, focused sales organization to service our customers. We plan to continue to strategically focus on and invest in building a competitively superior U.S. sales organization by training and certifying our sales representatives on our innovative product portfolio, continuing to develop and implement strong performance management practices, and enhancing sales productivity.

International

We

Internationally, we sell our full product portfolio, including products for upper and lower extremities, biologics, sports medicine and biologicsother, and large joints, in select international markets. As we receivejoints. We utilize several distribution approaches that are tailored to the required regulatory approvals, we will begin to selectively introduce

the OrthoHelix product portfolio into these markets. We believe our full rangeneeds and requirements of hip and knee products enable us to more effectively and efficiently service these markets where procedure or anatomic specialization is not as prevalent as in the United States and where extremities, sports medicine and biologics markets have not yet reached a size to permit the degree of channel focus we have in the United States.each individual market. Our international sales and distribution system currently consists of 1311 direct sales offices and approximately 3090 distributors that sell our products in approximately 40over 50 countries. Our largest international market is France, where weWe have a direct sales force of approximately 30 direct sales representatives. We also havesubsidiaries with direct sales offices and corporate subsidiaries in several countries, including Germany, Italy, Switzerland, the Netherlands, the United Kingdom, France, Germany, Italy, Denmark, Australia,Netherlands, Canada, Japan, and CanadaAustralia that employ direct sales employees, Additional European countries, as well asand in some cases, use independent sales representatives to sell our products in their respective markets. Our products are sold in other countries in Europe, Asia, Africa, and Latin America and Asia, are served byusing stocking distribution partners. Stocking distributors who purchase products directly from us for resale to their local customers, with product ownership generally passing to the distributor upon shipment. As part

Manufacturing, Facilities, and Quality
We utilize a combination of our strategy to grow internationally, we have selectively converted from distributors to direct sales representation in certain countries, as we did in the United Kingdom and Denmark in 2009, Belgium, Luxembourg and Japan in 2012 and Canada in 2013. We intend to focus on expanding our presence in underserved countries, such as China, where we signed an agreement in 2010 with Weigao for the exclusive distribution of our shoulder, hip and knee products for a four-year term. In our agreement with Weigao, purchase quotas and prices are set at the end of each year and the agreement may be terminated prior to its expiration in 2014 upon breach by either party, including Weigao’s failure to meet the purchase quota.

We generated $120.8 million, or 44%, or our total revenue in international markets outside of the United States during the year ended December 30, 2012. Our total revenue in France was $52.7 million in 2012, $55.4 million in 2011 and $47.3 million in 2010. Our total revenue in the Netherlands was $5.3 million in 2012, $5.0 million in 2011 and $4.1 million in 2010.

Research and Development

We are committed to a strong research and development program. Our research and development expenses were $22.5 million, $19.8 million and $17.9 million in 2012, 2011 and 2010, respectively. As of December 30, 2012, we had a research and development staff of over 130 people, or 14% of total employees, principally located in Montbonnot, France and Warsaw, Indiana, with additional staff in Grenoble, France; Medina, Ohio; and San Diego, California

We have dedicated internal product development teams focused on continuous innovation and introduction of new products for extremity joint replacements, extremity joint trauma, soft tissue repair and large joint replacement. We also have an active business development team that seeks to in-license development-stage products, which our internal team assists in bringing to market. Our internal research and development teams work closely with external research and development consultantsmanufacturing and a global network of leading surgeon inventorsqualified outsourced manufacturing partners to ensure we have broad access to best-in-class ideasproduce our products and technology to drive our product development pipeline.

Manufacturing and Supply

surgical instrumentation. We manufacture substantially all of our internally-sourced products at three sites includingin four locations: Arlington, Tennessee; Montbonnot, andFrance; Grenoble, FranceFrance; and Macroom, Ireland. We lease the manufacturing facility in Arlington, Tennessee from the Industrial Development Board of the Town of Arlington. Our internal manufacturing operations are focused on product quality, continuous improvement, and efficiency. Our internal manufacturing operations have been practicing lean manufacturing concepts for many years with a philosophy focused on high productivity, flexibility, and capacity optimization. Our operations in France have a long history and deep experience with orthopaedic manufacturing and innovationprocess innovation. Additionally, we believe we are the only company to have vertically integrated operations for the manufacturing of pyrocarbon orthopaedic products. We believe that this capability gives us a competitive advantage in design for manufacturing and prototyping of this innovative material.


7


We outsource products to our manufacturing partners when it provides us with cost efficiency, expertise, flexibility, and instances where we have invested in facilities upgradesneed additional capacity. A significant portion of our lower extremities products and surgical instrumentation is produced to both expand our capabilities and establish incremental lean cellular manufacturing practices. Our Ireland location has been practicing lean cellular manufacturing conceptsspecifications by qualified subcontractors who serve medical device companies. We intend to look for many years with a philosophy focused on continuous operational improvement and optimization. In additionopportunities to optimize our internal manufacturing capabilities,capacity and insource manufacturing where we also use several outsource manufacturing partnersbelieve it makes sense to produce our products. These partners provide us with flexibilitydo so.
We maintain a comprehensive quality system that is certified to the European standards ISO 9001 and capacity in our manufacturing operations. We continually evaluateISO 13485 and to the potential to in-source products currently purchased from outside vendors to internal production. Over time, we plan to conduct similar evaluations on our OrthoHelix product portfolio as it is currently completely outsourced to third party manufacturers.Canadian Medical Devices Conformity Assessment System (CMDCAS). We are continuously working on productaccredited by the American Association of Tissue Banks (AATB) and process improvement projectshave registrations with the FDA as a medical device establishment and as a tissue establishment. These certifications and registrations require periodic audits and inspections by various global regulatory entities to optimizedetermine if we have systems in place to ensure our manufacturingproducts are safe and effective for their intended use and that we are compliant with applicable regulatory requirements. Our quality system exists so that management has the proper oversight, designs are evaluated and tested, production processes are established and decrease product costsmaintained, and monitoring activities are in place to ensure products are safe, effective, and manufactured according to our specifications. Consequently, our quality system provides the way for us to ensure we design and build quality into our products while meeting global requirements. We are committed to meet or exceed customer needs as we strive to improve our profitability and cash flow. We believe that our manufacturing facilities and external vendor relationships will support our potential capacity needs for the foreseeable future.

patient outcomes.

Supply
We use a diverse and broad range of raw materials in the manufacturing of our products. We purchase all of our raw materials and select components used in the manufacturing of our products from external suppliers. In addition, we purchase some supplies from single or limited number of sources for reasons of proprietary know-how, quality assurance, sole source availability, cost-effectiveness, or constraints resulting from regulatory requirements. For example, we rely on one supplier for raw materials and select components in several of our products, including Poco Graphite, Inc., which supplies graphite for pyrocarbon on a purchase order basis; Heymark Metals Ltd., which supplies Cobalt Chrome used in certain of our hip, shoulder and elbow products on a purchase order basis; and CeramTec Group, which supplies ceramic for ceramic heads for hips on a purchase order basis.

We believe we are the only vertically integrated manufacturer of pyrocarbon orthopaedic products with production equipment to enable production of larger-sized implants. While we rely on an external supplier to supply us with surgical grade substrate material, we control the remaining pyrocarbon manufacturing process, which we believe gives us a competitive advantage in design for manufacturing and prototyping of this innovative material.

We work closely with our suppliers to ensure continuity of supply while maintaining high quality and reliability. To

We rely on one supplier for the silicone elastomer used in certain of our extremities products. We are aware of only two suppliers of silicone elastomer to the medical device industry for permanent implant usage. For certain biologic products, we depend on one supplier of demineralized bone matrix and cancellous bone matrix. We rely on one supplier for our GRAFTJACKET® family of soft tissue repair and graft containment products. We believe we maintain adequate stock from these suppliers to meet market demand. We currently rely on one supplier for a key component of our AUGMENT® Bone Graft. In December 2013, this supplier notified us of its intent to terminate the supply agreement at the end of the current term, which was December 2014. Our supplier was contractually required to meet our supply requirements until the termination date, we have not experienced any significant difficultyand to use commercially reasonable efforts to assist us in locatingidentifying a new supplier and obtainingsupport the materials necessarytransfer of technology and supporting documentation to fulfillproduce this component. Our transition to a new supplier is well underway with full cooperation from the current as well as the new supplier. We believe the current supplier has produced sufficient product to more than meet our production requirements.

needs for the interim period until a new supplier is brought on line.

Some of our products are provided by suppliers under private-label distribution agreements. Under these agreements, the supplier generally retains the intellectual property and exclusive manufacturing rights. The supplier private labels the products under the Tornier brandour brands for sale in certain fields of use and geographic territories. These agreements may be subject to minimum purchase or sales obligations.

Our private-label distribution agreements expire between this yearobligations and 2015 and are renewable under certain conditions or by mutual agreement. These agreements are terminable by either party upon notice and such agreements include some or all of the following provisions allowing for termination under certain circumstances: (i) either party’s uncured material breach of the terms and conditions of the agreement; (ii) either party filing for bankruptcy, being bankrupt or becoming insolvent, suspending payments, dissolving or ceasing commercial activity; (iii) our inability to meet market development milestones and ongoing sales targets; (iv) termination without cause, provided that payments are made to the distributor; (v) a merger or acquisition of one of the parties by a third party; (vi) the enactment of a government law or regulation that restricts either party’s right to terminate or renew the contract or invalidates any provision of the agreement or (vii) the occurrence of a “force majeure,” including natural disaster, explosion or war.

notice. Our private-label distribution agreements do not, individually or in the aggregate, represent a material portion of our business and we are not substantially dependent on them.

Our business, and the orthopaedic industry in general, is capital intensive, particularly as it relates to inventory levels and surgical instrumentation. Our business requires a significant level of inventory driven by our global footprint, the requirement to provide products within a short period of time, and the number of different sizes of many of our products. In addition, we must maintain a significant investment in surgical instrumentation as we provide these instruments to healthcare facilities and surgeons for their use to facilitate the implantation of our products.
Competition

Competition in the orthopaedic device industry is intense and is characterized by extensive research efforts and rapid technological progress. Competitors include major and mid-sized companies in the orthopaedic and biologics industries, as well as academic institutions and other public and private research organizations that continue to conduct research, seek patent protection, and establish arrangements for commercializing products that will compete with our products.

8


The market for orthopaedic devices is highly competitive and subject to rapid and profound technological change. Our currently marketed products are, and any future products we commercialize will be, subject to intense competition. We believe that the principalprimary competitive factors in our marketsfacing us include price, quality, innovative design and technical capability, clinical results, breadth of product features and design,line, scale of operations, distribution capabilities, brand reputation, and strong customer service. OneOur ability to compete is affected by our ability to accomplish the following:
Develop new products and innovative technologies;
Obtain and maintain regulatory clearances or approvals and reimbursement for our products;
Manufacture and sell our products cost-effectively;
Meet all relevant quality standards for our products and their markets;
Respond to competitive pressures specific to each of our geographic markets, including our ability to enforce non-compete agreements;
Protect the proprietary technology of our products and manufacturing processes;
Market and promote our products;
Continue to maintain a high level of medical education for our surgeons on our products;
Attract and retain qualified scientific, management and sales employees and focused sales representatives; and
Support our technology with clinically relevant studies.

Research and Development
Realizing that new product offerings are a key factors to our future success, will be our ability to continue to introduce new products and improve existing products and technologies. In addition, we are committed to following the AdvaMed and Eucomed guidelines and codes of ethics in our interactions with customers and other healthcare professionals globally.

We face competition from large diversified orthopaedic manufacturers, such as DePuy Orthopaedics, Inc., a Johnson & Johnson subsidiary, Biomet, Inc., Zimmer Corporation, and Stryker Corporation, and established mid-sized orthopaedic manufacturers, such as Arthrex, Inc., Wright Medical Group, Inc. and ArthroCare Corporation. Many of the companies developing or marketing competitive orthopaedic products enjoy several competitive advantages, including:

greater financial and human resources for product development and sales and marketing;

greater name recognition;

established relationships with surgeons, hospitals and third-party payors;

broader product lines and the ability to offer rebates or bundle products to offer greater discounts or incentives to gain a competitive advantage;

established sales and marketing and distribution networks; and

more experience in conductingstrong research and development manufacturing, preparing regulatory submissionsprogram. The intent of our program is to develop new extremities and obtaining regulatory clearances or approvals for products.

biologics products and expand our current product offerings and the markets in which they are offered. Our research and development teams are organized and aligned with our product marketing teams and are focused on improving clinical outcomes by designing innovative, clinically differentiated products with improved ease-of-use and by developing new product features and enhanced surgical techniques that can be leveraged across a broader base of surgeon customers. Our internal research and development teams work closely with external research and development consultants and a global network of physicians and medical personnel in hospitals and universities to ensure we have broad access to best-in-class ideas and technologies to drive our product development pipeline. We also compete against smaller, entrepreneurial companieshave an active business development team that actively evaluates novel technologies and development stage products. In addition, our clinical and regulatory departments are devoted to verifying the safety and efficacy of our products according to regulatory standards enforced by the FDA and other international regulatory bodies. Our research and development expenses totaled $39.9 million, $25.0 million and $20.3 million in 2015, 2014 and 2013, respectively. Our research and development activities are principally located in Arlington, Tennessee; Montbonnot, France; and Warsaw, Indiana, with niche product lines. Our competitors may increase theiradditional staff in Grenoble, France; and Bloomington, Minnesota.

In the extremities area, our research and development activities focus on building upon our already comprehensive portfolio of surgical solutions for extremities focused surgeons, including procedure and anatomy specific products. With the ultimate goal of addressing unmet clinical needs, we often pursue multiple product solutions for a particular application in order to offer surgeons the ability either to use their preferred procedural technique or to provide options and flexibility in the surgical setting with the understanding that one solution does not work for every case.
In the biologics area, we have research and development projects underway that are designed to provide differentiation of our advanced materials in the marketplace. We are particularly focused on the integration of our biologic product platforms into extremities market, which isprocedures and potential new applications for our primary strategic focus. Our competitors may develop and patent processes or products earlier than we can, obtain regulatory clearances or approvals for competing products more rapidly than we can or develop more effective or less expensive products or technologies that render our technology or products obsolete or non-competitive. We also compete with other organizations in recruiting and retaining qualified scientific and management personnel, as well as in acquiring technologies complementary to our products or advantageous to our business. If our competitors are more successful than us in these matters, we may be unable to compete successfully against our existing and future competitors.

AUGMENT® Bone Graft.

Intellectual Property

Patents, trade secrets, know-how, and other proprietary rights are important to the continued success of our business. We also rely uponcurrently own or have licenses to use more than 1,500 patents and pending patent applications throughout the world. We seek to aggressively protect technology, inventions, and improvements that we consider important through the use of patents and trade secrets know-how, continuing technological innovationin the United States and licensing opportunities to developsignificant foreign markets. We manufacture and maintain our competitive position. We protect our proprietary rights through a variety of methods, including confidentiality agreementsmarket products under both patents and proprietary informationlicense agreements with vendors, employees, consultantsother parties. These patents and others who maylicense agreements have accessa defined life and expire from time to proprietary information.

Although we believetime. We are not materially dependent on any one or more of our patents. In addition to patents, are valuable, our knowledge and experience, our creative product development, and marketing staff and our trade secret information, with respect to manufacturing processes, materials and product design, have been equallyare as important as our patents in maintaining our proprietary product lines. As a condition of employment,

Although we generally require employeesbelieve that, in the aggregate, our patents are valuable, and patent protection is beneficial to execute a confidentiality agreement relatingour business and competitive positioning, our patent protection will not necessarily deter or prevent competitors from attempting to proprietary information and assigning patent rights to us. We cannotdevelop similar products. There can be assuredno assurances that our patents will provide competitive advantages for our products or that our competitors will not challenge or circumvent these rights. In addition, we cannotthere can be assuredno assurances that the United States Patent and Trademark Office or USPTO,(USPTO) or foreign patent offices will issue any of our pending patent applications. The USPTO and

9


foreign patent offices also may rejectdeny or require a significant narrowing of the claims in our pending patent applications affectingand the patents issuing from the pending patentsuch applications. Any patents issuing from ourthe pending patent applications may not provide us with significant commercial protection. We could incur substantial costs in proceedings before the USPTO or foreign patent offices, including opposition and other post-grant proceedings. These proceedings could result in adverse decisions as to the validitypatentability, priority of our inventions.inventions, and the narrowing or invalidation of claims in issued patents. Additionally, the laws of some of the countries in which our products are or may be sold may not protect our products and intellectual property to the same extent as the laws in the United States or at all.

While we do not believe that any of our products infringe any valid claims of patents or other proprietary rights held by third parties,others, we cannotare currently subject to patent infringement litigation and there can be assuredno assurances that we do not infringe upon any patents or other proprietary rights held by third parties.them. If our products were found to infringe upon any proprietary right of a thirdanother party, we could be required to pay significant damages or license fees to the thirdsuch party and/or cease production, marketing, and distribution of those products. Litigation also may be necessary to defend infringement claims of third parties or to enforce patent rights we hold or to protect trade secrets or techniques we own.

The Leahy-Smith America Invents Act, or the Leahy-Smith Act, which was adopted in September 2011, includes a number of significant changes to U.S. patent law, including provisions that affect the way patent applications will be prosecuted and may also affect patent litigation. Under the Leahy-Smith Act, the U.S. will transition from a “first-to-invent” system to a “first-to-file” system for patent applications filed on or after March 16, 2013. The USPTO is currently developing regulations and procedures to govern administration of the Leahy-Smith Act, and many of the substantive changes to patent law associated with the Leahy-Smith Act have recently become effective. Accordingly, it is not clear what, if any, impact the Leahy-Smith Act will have on the operation of our business.

We also rely on trade secrets and other unpatented proprietary technology. We cannotThere can be assuredno assurances that we can meaningfully protect our rights in our unpatented proprietary technology or that others will not independently develop substantially equivalent proprietary products or processes or otherwise gain access to our proprietary technology.
We seek to protect our trade secretsproprietary rights through a variety of methods. As a condition of employment, we generally require employees to execute an agreement relating to the confidential nature of and company ownership of proprietary know-how,information and assigning intellectual property rights to us. We generally require confidentiality agreements with vendors, consultants, and others who may have access to proprietary information. We generally limit access to our facilities and review the release of company information in part, withadvance of public disclosure. There can be no assurances, however, that confidentiality agreements with employees, vendors, and consultants. We cannot be assured, however, that the agreementsconsultants will not be breached, that we will have adequate remedies for any breach would be available, or that our competitors will not discover or independently develop our trade secrets.

Regulatory Matters

FDA Litigation also may be necessary to protect trade secrets or techniques we own.

Government Regulation

Both before

We are subject to varying degrees of government regulation in the countries in which we conduct business. In some countries, such as the United States, Europe, Canada, and after approval or clearance our productsJapan, government regulation is significant and, product candidateswe believe there is a general trend toward increased and more stringent regulation throughout the world. As a manufacturer and marketer of medical devices, we are subject to extensive regulation. Inregulation by the U.S. Food and Drug Administration, other federal governmental agencies, and state agencies in the United States we are regulated byand similar foreign governmental authorities in countries located outside the FDA underUnited States. These regulations generally govern the U.S. Federal Food, Drugintroduction of new medical devices; the observance of certain standards with respect to the design, manufacture, testing, labeling, promotion, and Cosmetic Act,sales of the devices; the maintenance of certain records; the ability to track devices; the reporting of potential product defects; the import and export of devices; as well as other regulatory bodies. Thesematters. In addition, as a participant in the healthcare industry, we are also subject to various other U.S. federal, state, and foreign laws.
On September 29, 2010, Wright Medical Technology, Inc. (WMT) entered into a five-year Corporate Integrity Agreement (CIA) with the Office of the Inspector General of the United States Department of Health and Human Services (OIG-HHS). The CIA was filed as Exhibit 10.2 to legacy Wright's Current Report on Form 8-K filed on September 30, 2010. The CIA expired on September 29, 2015 and on January 27, 2016, we received notification from the OIG-HHS that the term of the CIA has concluded. While the term of the CIA has concluded, our failure to continue to maintain compliance with U.S. healthcare laws, regulations govern, amongand other things,requirements in the following activities in which wefuture could expose us to significant liability, including, but not limited to, exclusion from federal healthcare program participation, including Medicaid and our contract manufacturers, contract testing laboratoriesMedicare, potential prosecution, civil and suppliers are involved:

product development;

product testing;

product clinical trial compliance;

product manufacturing;

product labeling;

product safety;

product safety reporting;

product storage;

product market clearancecriminal fines or approval;

product modifications;

product advertisingpenalties, as well as additional litigation cost and promotion;

expense.

product import and export; and


product sales and distribution.

FailureWe strive to comply with regulatory requirements governing our products and operations and to conduct our affairs in an ethical manner. This practice is reflected in our Code of Business Conduct, various other compliance policies and through the Federal Food, Drugresponsibility of the nominating, corporate governance and Cosmetic Actcompliance committee of our board of directors, which oversees our corporate compliance program and compliance with legal and regulatory requirements as well as our ethical standards and policies. We devote significant time, effort, and expense to addressing the extensive government and regulatory requirements applicable to our business. Such regulatory requirements are subject to change and we cannot predict the effect, if any, that these changes might have on our business, financial condition, and results of operations. Governmental regulatory actions against us could result in among other things, warning letters, civil penalties, delays in approving or refusal to approve a product, candidate, productthe recall productor seizure interruption of our products, suspension or revocation of the authority necessary for the production operating restrictions, suspension on withdrawalor sale of product approval, injunctions orour products, litigation expense, and


10


civil and criminal prosecution.

FDA Approval or Clearancepenalties against us and our officers and employees. If we fail to comply with these regulatory requirements, our business, financial condition, and results of Medical Devices

operations could be harmed.


United States
In the United States, our products are strictly regulated by the FDA under the U.S. Food, Drug and Cosmetic Act (FDC Act). Some of our products are also regulated by state agencies. FDA regulations and the requirements of the FDC Act affect the pre-clinical and clinical testing, design, manufacture, safety, efficacy, labeling, storage, recordkeeping, advertising, and promotion of our medical devicesdevice products. Our tissue-based products are subject to varying degreesFDA regulations, the National Organ Transplant Act (NOTA), and various state agency regulations. We are an accredited member of regulatory controlthe American Association of Tissue Banks and are classified in onean FDA-registered tissue establishment, which includes the packaging, processing, storage, labeling, and distribution of three classes depending on risktissue products regulated as medical devices and the extentstorage and distribution of controlstissue products regulated solely as human cell and tissue products. In addition, we maintain tissue bank licenses in Florida, Maryland, New York, California, and Oregon.
Generally, before we can market a new medical device, marketing clearance from the FDA determines are necessary to reasonably ensure their safety and efficacy. These classifications generally require the following:

Class I: general controls, such as labeling and adherence to quality system regulations;

Class II: general controls,must be obtained through either a premarket notification (510(k)) and special controls such as performance standards, patient registries and post-market surveillance; and

Class III: general controls andunder Section 510(k) of the FDC Act or the approval of a de novo or premarket approval or a PMA.

(PMA) application. Most of our new products fall intoare FDA classificationscleared through the 510(k) premarket notification process. The FDA typically grants a 510(k) clearance if the applicant can establish that require the submissiondevice is substantially equivalent to a predicate device. It usually takes about three months from the date of a premarket notification (510(k))510(k) submission to the FDA. In theobtain clearance, but it may take longer, particularly if a clinical trial is required. The FDA may find that a 510(k) process, the FDA reviews a premarket notification and determines whether a proposed device is “substantially equivalent” to a previously cleared 510(k) devicenot appropriate or a device that was in commercial distribution before May 28, 1976, for which the FDAsubstantial equivalence has not yet called for the submission of been shown and, as a result, require a de novo or PMA application.

PMA applications referredmust be supported by valid scientific evidence to as a “predicate” device. In making this determination,demonstrate the FDA compares the proposed device to the predicate device. If the two devices are comparable in intended use and safety and effectiveness of the device, may be cleared for marketing. 510(k) submissions generally include, among other things,typically including the results of human clinical trials, bench tests, and laboratory and animal studies. The PMA application must also contain a complete description of the device and its manufacturing, device labeling, medical devicescomponents, and a detailed description of the methods, facilities, and controls used to whichmanufacture the device is substantially equivalent, safety and biocompatibility information anddevice. In addition, the results of performance testing. In some cases, a 510(k) submission must include data from human clinical studies. Marketing may commence only whenthe proposed labeling and any training materials. The PMA application process is expensive and generally takes significantly longer than the 510(k) process. Additionally, the FDA issues a clearance letter findingmay never approve the proposed device to be substantially equivalent to the predicate. After a device receives 510(k) clearance, any product modification that could significantly affect the safety or effectiveness of the product, or any product modification that would constitute a significant change in intended use, requires a new 510(k) clearance. If the device would no longer be substantially equivalent, it would require a PMA. If the FDA determines that the product does not qualify for 510(k) clearance, then the company must submit and the FDA must approve a PMA before marketing can begin.

Other devices we may develop and market may be classified as Class III for which the FDA has implemented stringent clinical investigation and PMA requirements. The PMA process would require us to provide clinical and laboratory data that establishes that the new medical device is safe and effective in an absolute sense as opposed to in a comparative sense as with a 501(k). Information about the device and its components, device design, manufacturing and labeling, among other information, must also be included in the PMA.application. As part of the PMA application review process, the FDA generally will typically inspectconduct an inspection of the manufacturer’s facilities forto ensure compliance with applicable quality system regulation (QSR)regulatory requirements, which governinclude quality control testing, documentation control, documentation and other aspects of quality assurance with respect to manufacturing. The FDA will approve the new device for commercial distribution if it determines that the data and information in the PMA constitute valid scientific evidence and that there is reasonable assurance that the device is safe and effective for its intended use(s). Theprocedures. A PMA can include post-approval conditions including, among other things, restrictions on labeling, promotion, sale and distribution, data reporting (surveillance), or requirements to do additional clinical studies post-approval. Even after approval of a PMA, the FDA must grant subsequent approvals for a new PMA or a PMA supplement is required to authorize certain modifications to the device, its labeling, or its manufacturing process.

All of our devices marketed in the United States have been listed, cleared or approved by the FDA. Some low-risk medical devices do not require FDA review and approval or clearance prior to commercial distribution, but are subject to

FDA regulations and must be listed with the FDA. The FDA has the authority to: halt the distribution of certain medical devices; detain or seize adulterated or misbranded medical devices; or order the repair, replacement of or refund the costs of such devices. There are also requirements of state, local and foreign governments that we must comply with in the manufacture and marketing of our products. For example, some jurisdictions require compliance with the Pharmaceutical Research and Manufacturers of America’s Code on Interactions with Healthcare Professionals or its equivalent. Laws and regulations and the interpretation of those laws and regulations may change in the future. We cannot foresee what affect, if any, such changes may have on us.

Specifically, FDA plans to issue new guides on several important topics in 2013. First, the interpretation and application of regulation regarding the custom device exemption has been a topic that both manufacturers and FDA have regarded with interest over recent years. FDA has taken action in the form of issuing 483’s to manufacturers that have applied the custom device exemption in a manner that FDA interprets to be in conflict with law. Tornier makes use of the custom device exemption in some limited circumstances, and in a manner Tornier believes to be in compliance with law. FDA plans to issue new guidance in 2013 that could affect the way we deliver these products to customers.

FDA has also informed medical device manufacturers of new policies to be enacted in 2013 that could affect the ability to gain clearance for new products. Specifically, FDA will adopt through agency guidance new practices related to the acceptance of 510(k) applications which could place a high standard on data and evidence provided to the FDA. In addition, the FDA has expanded the pre-IDE process, encouraging manufacturers to request a meeting where 510k applications can be reviewed prior to submission. Finally, FDA has informed industry that a previous policy regarding questions and responses 510k applications will become more restricted, allowing fewer opportunities to respond to questions prior to automatic designation of devices to PMA.

Clinical Trials

One or more clinical trials aremay be required to support a 510(k) application or a de novo submission and almost always are required to support a PMA application and are sometimes required to support a 510(k) submission.application. Clinical trials of unapproved or uncleared medical devices or devices being studied for uses for which they are not approved or cleared (investigational devices) must be conducted in compliance with FDA requirements. If an investigationalhuman clinical trials of a medical device could poseare required and the device presents a significant risk, to patients, the sponsor companyof the trial must submit an application forfile an investigational device exemption or IDE, to the FDA(IDE) application prior to initiation of thecommencing human clinical study. Antrials. The IDE application must be supported by appropriate data, such astypically including the results of animal andand/or laboratory test results, showing that ittesting. If the IDE application is safe to test the device in humans and that the testing protocol is scientifically sound. The IDE will automatically become effective 30 days after receiptapproved by the FDA unlessand one or more institutional review boards (IRBs), human clinical trials may begin at a specific number of institutional investigational sites with the specific number of patients approved by the FDA. If the device presents a non-significant risk to the patient, a sponsor may begin the clinical trial after obtaining approval for the trial by one or more IRBs without separate approval from the FDA. Submission of an IDE does not give assurance that the FDA notifieswill approve the companyIDE. If an IDE is approved, there can be no assurance the FDA will determine that the investigationdata derived from the trials support the safety and effectiveness of the device or warrant the continuation of clinical trials. An IDE supplement must be submitted to and approved by the FDA before a sponsor or investigator may not begin. In addition, clinical trialsmake a change to the investigational plan in such a way that may affect its scientific soundness, study indication, or the rights, safety or welfare of investigational devices may not begin until an institutional review board, or IRB, has approved the study.

human subjects. During the trial, the sponsor must comply with the FDA’s IDE requirements including, for example, for investigator selection, trial monitoring, adverse event reporting, and recordkeeping. The investigators must obtain patient informed consent, rigorously follow the investigational plan and trial protocol, control the disposition of investigational devices, and comply with reporting and recordkeeping requirements. We, the FDA and the IRB at each institution at which a clinical trial is being conducted may suspend a clinical trial at any time for various reasons, including a belief that the subjects are being exposed to an unacceptable risk. During the approval or clearance process, the FDA typically inspects the records relating to the conductWe are currently conducting a few clinical trials.


11


After a device is cleared or approved for marketing, numerous and pervasive regulatory requirements continue to apply.apply and we continue to be subject to inspection by the FDA to determine our compliance with these requirements, as do our suppliers, contract manufacturers, and contract testing laboratories. These requirements include, but are not limited to:

among others, the QSR regulation,following:

Quality System regulations, which governs,govern, among other things, how manufacturers design, test, manufacture, modify, label, exercise quality control over and document manufacturing of their products;

Part 11 compliance with FDA required records of documents in your quality system defined as “in scope”;

labeling and claims regulations, which require that promotion is truthful, not misleading, fairly balanced and provide adequate directions for use and that all claims are substantiated, and also prohibit the promotion of products for unapproved or “off-label” uses and impose other restrictions on labeling;

FDA guidance of off-label dissemination of information and responding to unsolicited requests for information;

the Medical Device Reporting (MDR) regulation, which requires reporting to the FDA certain adverse experiences associated with use of the product;

our products;

complaint handling regulations designed to track, monitor, and resolve complaints related to our products;

Part 806 reporting of certain corrections, removals, enhancements, and recalls of products;

complying with federal law and regulations requiring Unique Device Identifiers (UDI) on devices and also requiring the submission of certain information about each device to FDA’s Global Unique Device Identification Database (GUDID); and
in some cases, ongoing monitoring and tracking of our products’ performance and periodic reporting to the FDA of such performance results;results.

The FDA has statutory authority to regulate allograft-based products, processing, and

materials. The FDA and other international regulatory agencies have been working to establish more comprehensive regulatory frameworks for allograft-based tissue-containing products, which are principally derived from human cadaveric tissue. The framework developed by the FDA establishes risk-based criteria for determining whether a particular human tissue-based product will be classified as human tissue, a medical device, or a biologic drug requiring premarket clearance or approval. All tissue-based products are subject to extensive FDA regulation, including establishment registration requirements, product listing requirements, good tissue practice requirements for manufacturing, and screening requirements that ensure that diseases are not transmitted to tissue recipients. The FDA has also proposed extensive additional requirements that address sub-contracted tissue services, tracking to the recipient/patient, and donor records review. If a tissue-based product is considered human tissue, the FDA requirements focus on preventing the introduction, transmission, and spread of communicable diseases to recipients. Neither clinical data nor review of safety and efficacy is required before the tissue can be marketed. However, if the tissue is considered a medical device or a biologic drug, then FDA clearance or approval is required.


The FDA and international regulatory authorities periodically inspect us and our third-party manufacturers for compliance with applicable regulatory requirements. These requirements include labeling regulations, manufacturing regulations, quality system regulations, regulations governing unapproved or off-label uses, and medical device regulations. Medical device regulations require a manufacturer to report to the FDA serious adverse events or certain types of malfunctions involving its products.

We are subject to various U.S. federal and state laws concerning healthcare fraud and abuse, including anti-kickback and false claims laws, and other matters. The U.S. federal Anti-Kickback Statute (and similar state laws) prohibits certain illegal remuneration to physicians and other health care providers that may financially bias prescription decisions and result in an over-utilization of goods and services reimbursed by the federal government. The U.S. federal False Claims Act (and similar state laws) prohibits conduct on the part of a manufacturer which may cause or induce an inappropriate reimbursement for devices reimbursed by the federal government. We are also subject to the U.S. federal Physician Payments Sunshine Payment Act and various state laws on reporting remunerative relationships with health carehealthcare customers.

We continue These laws impact the kinds of financial arrangements we may have with hospitals, surgeons or other potential purchasers of our products. They particularly impact how we structure our sales offerings, including discount practices, customer support, education and training programs, physician consulting, research grants and other arrangements. These laws are administered by, among others, the U.S. Department of Justice, the Office of Inspector General of the Department of Health and Human Services and state attorneys general. Many of these agencies have increased their enforcement activities with respect to medical device manufacturers in recent years. If our operations are found to be in violation of these laws, we may be subject to inspectionpenalties, including potentially significant criminal, civil and/or administrative penalties, damages, fines, disgorgement, exclusion from participation in government healthcare programs, contractual damages, reputational harm, administrative burdens, diminished profits and future earnings, and the curtailment or restructuring of our operations.

We are also subject to data privacy and security regulation by both the U.S. federal government and the states in which we conduct our business. Health Insurance Portability and Accountability Act of 1996 (HIPAA), as amended by the Health Information Technology for Economic and Clinical Health Act (HITECH), and their respective implementing regulations,

12


imposes specified requirements relating to the privacy, security and transmission of individually identifiable health information. Among other things, HITECH makes HIPAA’s security standards directly applicable to business associates, defined as service providers of covered entities that create, receive, maintain, or transmit protected health information in connection with providing a service for or on behalf of a covered entity. HITECH also created four new tiers of civil monetary penalties and gave state attorneys general new authority to file civil actions for damages or injunctions in federal courts to enforce the federal HIPAA laws and seek attorneys’ fees and costs associated with pursuing federal civil actions. In addition, many state laws govern the privacy and security of health information in certain circumstances, many of which differ from HIPAA and each other in significant ways and may not have the same effect.
The FDA, to determine our compliancein cooperation with U.S. Customs and Border Protection, administers controls over the import of medical devices into the United States. The U.S. Customs and Border Protection imposes its own regulatory requirements as doon the import of our suppliers, contract manufacturersproducts, including inspection and contract testing laboratories.

In January 2013, our OrthoHelix facility located in Medina, Ohio waspossible sanctions for noncompliance. We are also subject to a routine FDA inspection. The inspection resulted inforeign trade controls administered by certain U.S. government agencies, including the issuanceBureau of a Form FDA-483 listing four inspectional observations. The FDA’s observations related to our documentationIndustry and Security within the Commerce Department and the Office of corrective and preventative actions, procedures for receiving, reviewing and evaluating complaints, procedures to control product that does not conform to specified requirements and procedures to ensure that all purchased or otherwise received product and services conform to specified requirements. We believeForeign Assets Control within the Treasury Department.

International
Outside the United States, we have corrected all four of these observations.

International Regulation

We are subject to regulations and product registration requirementsgovernment regulation in many foreignthe countries in which we mayoperate and sell our products, including in the areas of:

design, development,products. We must comply with extensive regulations governing product approvals, product safety, quality, manufacturing, and testing;

product standards;

product safety;

product safety reporting;

marketing, sales and distribution;

packaging and storage requirements;

labeling requirements;

content and language of instructions for use;

clinical trials;

record keeping procedures;

advertising and promotion;

recalls and field corrective actions;

post-market surveillance, including reporting of deaths or serious injuries and malfunctions that, if they werereimbursement processes in order to recur, could lead to death or serious injury;

import and export restrictions; and

tariff regulations, duties and tax requirements

registration for reimbursement

necessity of testing performed in country by distributors for licenses.

The time required to obtain clearance required by foreign countries may be longer or shorter than that required for FDA clearance, and requirements for licensing a product in a foreign country may differ significantly from FDA requirements.

In many of the foreign countries in which we market our products we are subject to local regulations affecting, among other things, design and product standards, packaging requirements and labeling requirements. Manyin all major foreign markets. Although many of the regulations applicable to our devices and products in these countries are similar to those of the FDA.

InFDA, these regulations vary significantly from country to country and with respect to the EEA,nature of the particular medical device. The time required to obtain foreign approvals to market our products may be longer or shorter than the time required in the United States, and requirements for such approvals may differ from FDA requirements.

To market our product devices in the member countries of the European Union, we are required to comply with the essential requirementsEuropean Medical Device Directives and to obtain CE mark certification. CE mark certification is the European symbol of adherence to quality assurance standards and compliance with applicable European Medical Device Directives. Under the EUEuropean Medical DevicesDevice Directives, (Council Directive 93/42/EEC of 14 June 1993 concerningall medical devices as amended, and Council Directive 90/385/EEC of 20 June 2009 relating to active implantable medical devices, as amended). Compliance with these requirements entitles us to affix themust qualify for CE conformity mark to our medical devices, without which they cannot be commercialized in the EEA. In order to demonstrate compliance with the essential requirements andmarking. To obtain the right to affix the CE conformity mark we must undergo a conformity assessment procedure, which varies according to the type of medical device and its classification. Except for low-risk medical devices (Class I), where the manufacturer can issue an EC Declaration of Conformity based on a self-assessment of the conformity of its products with the essential requirements of the Medical Devices Directives, a conformity assessment procedure requires the intervention of a Notified Body, which is an organization accredited by a Member State of the EEA to conduct conformity assessments. The Notified Body would typically audit and examine the quality system for the manufacture, design and final inspection of our devices before issuing a certification demonstrating compliance with the essential requirements. Based on this certification we can draw up an EC Declaration of Conformity, which allows usauthorization to affix the CE mark to one of our products.

Tornier anticipates that revised regulation of medical devices will be made applicable in 2014. We expect this revised regulationproducts, a recognized European Notified Body must assess our quality systems and the product’s conformity to include further controls and requirements on the following activities:

High level of request for premarket clinical evidence for high risk devices

Increased scrutiny of technical files for class IIb devices

Monitoring of notified bodies, by independent auditors

Increase requirements regarding vigilance and product traceability (specifically related to labeling requirements)

Increased regulation for non-traditional roles such as importer and distributor.

U.S. Anti-Kickback and False Claims Laws

In the United States, there are federal and state anti-kickback laws that prohibit the payment or receipt of kickbacks, bribes or other remuneration intended to induce the purchase or recommendation of healthcare products and services. Violations of these laws can lead to civil and criminal penalties, including exclusion from participation in federal healthcare programs. These laws are potentially applicable to manufacturers of products regulated by the FDA, such as us, and hospitals, physicians and other potential purchasers of such products.

In particular, the federal Anti-Kickback Law prohibits persons from knowingly and willfully soliciting, receiving, offering or providing remuneration, directly or indirectly, to induce either the referral of an individual, or the furnishing, recommending, or arranging for a good or service, for which payment may be made under a federal healthcare program such as the Medicare and Medicaid programs. The definition of “remuneration” has been broadly interpreted to include anything of value, including for example, gifts, discounts, the furnishing of supplies or equipment, credit arrangements, payments of cash, waivers of payments, ownership interests and providing anything at less than its fair market value. In addition, the recently enacted Patient Protection and Affordable Care Act, as amended by the Health Care and Education Affordability Reconciliation Act, collectively, the PPACA, among other things, amends the intent requirement of the federal anti-kickback and criminal healthcare fraud statutes. A person or entity no longer needs to have actual knowledge of this statute or specific intent to violate it. In addition, the PPACA provides that the government may assert that a claim including items or services resulting from a violation of the federal anti-kickback statute constitutes a false or fraudulent claim for purposes of the false claim statutes. The lack of uniform interpretation of the Anti-Kickback Law makes compliance with the law difficult. The

penalties for violating the Anti-Kickback Law can be severe. These sanctions include criminal penalties and civil sanctions, including fines, imprisonment and possible exclusion from participation in federal healthcare programs.

Recognizing that the Anti-Kickback Law is broad and may technically prohibit many innocuous or beneficial arrangements within the healthcare industry, the U.S. Department of Health and Human Services issued regulations in July1991, which the Department has referred to as “safe harbors.” These safe harbor regulations set forth certain provisions which, if met in form and substance, will assure medical device manufacturers, healthcare providers and other parties that they will not be prosecuted under the federal Anti-Kickback law. Additional safe harbor provisions providing similar protections have been published intermittently since 1991. Our arrangements with physicians, hospitals and other persons or entities who are in a position to refer may not fully meet the stringent criteria specified in the various safe harbors. Although full compliance with these provisions ensures against prosecution under the federal Anti-Kickback Law, the failure of a transaction or arrangement to fit within a specific safe harbor does not necessarily mean that the transaction or arrangement is illegal or that prosecution under the federal Anti-Kickback law will be pursued. Even though we continuously strive to comply with the requirements of the Anti-Kickback Law, liability under the Anti-Kickback Law may still arise because of the intentions or actions of the parties with whom we do business, including our independent distributors. While weEuropean Medical Device Directives. We are not aware of any such intentions or actions, we have only limited knowledge regarding the intentions or actions underlying those arrangements. Conduct and business arrangements that do not fully satisfy one of these safe harbor provisions may result in increased scrutiny by government enforcement authorities.

The U.S. False Claims Act was enacted in 1865 during the Civil Warsubject to address government suppliers who would submit false claims for payment to the government. So if the government ordered and paid for a shipment of 5,000 blankets, guns or vials of medicine and only received 3,750 of each, the claim for payment was fraudulent. The Congress passed the False Claims Act (FCA) to address this issue and it is a civil statute that is today applied mostly to purchasesinspection by the Department of Defense andNotified Bodies for health care reimbursement. It is designed to penalize individuals who would seek reimbursement where none or a lesser amount is due. It cancompliance with these requirements. We also be turned into a criminal prosecution if the government pursues mail and wire fraud in the furtherance of the acts alleged to be false claims. For example, if a company were to illegally promote for an off-label use leading to an off-label prescription and an inappropriate reimbursement, that could trigger the FCA. In addition, the FCA seeks to prevent miscoding, stretched coding, the use of inappropriate modifiers, or seeking reimbursement for an inappropriate care setting (e.g. in-patient versus outpatient), or other forms of improper reimbursement. A company can be exposed to liability for the inappropriate provision of reimbursement services, reimbursement advice or promoting the inappropriate use of codes.

The PPACA also includes new reporting and disclosure requirements on device and drug manufacturers for any “transfer of value” made or distributed to physicians, healthcare providers or hospitals, which are scheduled to become effective March 31, 2013 (known as the “Physician Sunshine Payment Act”). These provisions require, among other things, extensive tracking and maintenance of databases regarding the disclosure of relationships and payments to physicians, healthcare providers and hospitals. In addition, certain states have recently passed or are considering legislation restricting our interactions with health care providers and/or requiring disclosure of many payments to them. Failurerequired to comply with these new trackingregulations of other countries in which our products are sold, such as obtaining Ministry of Health Labor and reportingWelfare approval in Japan, Health Protection Branch approval in Canada and Therapeutic Goods Administration approval in Australia.

Our manufacturing facilities are subject to environmental health and safety laws could subject usand regulations, including those relating to significant civil monetary penalties.

Other provisionsthe use, registration, handling, storage, disposal, recycling and human exposure to hazardous materials and discharges of state and federal law provide civil and criminal penalties for presenting, or causing to be presented, to third-party payors for reimbursement, claims that are false or fraudulent, or that are for items or services that were not provided as claimed. Although our business is structured to comply with these and other applicable laws, it is possible that some of our business practicessubstances in the future could beair, water and land. For example, in France, requirements known as the Installations Classées pour la Protection de l’Environnement regime provide for specific environmental standards related to industrial operations such as noise, water treatment, air quality, and energy consumption. In Ireland, our manufacturing facilities are likewise subject to scrutinylocal environmental regulations, such as related to water pollution and challengewater quality, which are administered by federal or state enforcement officials under these laws. This type of challenge could have a material adverse effect on our business, financial condition and results of operations.

Many of these policies and regulations also apply to jurisdictionsthe Environmental Protection Agency.

Our operations in countries outside the USA. Specifically,United States are subject to various other laws such as those regarding recordkeeping and privacy; laws regarding sanctioned countries, entities and persons; customs and import-export, and laws regarding transactions in foreign countries. We are also subject to the Physician Sunshine PaymentU.S. Foreign Corrupt Practices Act, is expectedwhich generally prohibits covered entities and their intermediaries from engaging in bribery or making other prohibited payments to be implemented in 2013 regardingforeign officials for the transparencypurpose of payments from industry to healthcare practitioners.

obtaining or retaining business or other benefits, as well as similar anti-corruption laws of other countries, such as the UK Bribery Act.

Third-Party Coverage and Reimbursement

We anticipate that sales

Sales volumes and prices of our products will depend in large part on the availability of coverage and reimbursement from third-party payors. Third-party payors include governmental programs such as U.S. Medicare and Medicaid, private insurance plans, and workers’ compensation plans. These third-party payors may deny coverage or reimbursement for a product or therapyprocedure if they determine that the product or therapyprocedure was not medically appropriate or necessary. The third-partyThird-party payors also may place limitations on the types of physicians that can perform specific types of procedures.procedures or the care setting in which the procedure is performed, i.e., out-patient or in-hospital. Also, third-party payors are increasingly auditing and challenging the prices charged for medical products and services.services with concern for upcoding, miscoding, using inappropriate modifiers, or

13


billing for inappropriate care settings. Some third-party payors must also approve coverage for new or innovative devices or therapiesprocedures before they will reimburse

healthcare providers who use the products or therapies. Even though a new product may have been cleared for commercial distribution by the FDA, we may find limited demand for the deviceproduct until reimbursement approval has been obtained from governmental and private third-party payors.

In the United States, a uniform policy of coverage does not exist across all third-party payors relative to payment of claims for all products. Therefore, coverage and payment can be quite different from payor to payor, and from one region of the country to another. This is also true for foreign countries in that coverage and payment systems vary from country to country. Coverage also depends on our ability to demonstrate the short-term and long-term clinical effectiveness, and cost-effectiveness of our products. These supportive data are obtained from surgeon clinical experience, clinical trials, and literature reviews. We pursue and present these results at major scientific and medical meetings, and publish them in respected, peer-reviewed medical journals because data and evidence that can support coverage and payment are important to the successful commercialization and market access of our products.

The Centers for Medicare & Medicaid Services or CMS,(CMS), the agency responsible for administering the Medicare program, sets coverage and reimbursement policies for the Medicare program in the United States. CMS policies may alter coverage and payment related to our product portfolioproducts in the future. These changes may occur as the result of national coverage determinations issued by CMS or as the result of local coverage determinations by contractors under contract with CMS to review and make coverage and payment decisions. Medicaid programs are funded by both U.S. federal and state governments, may vary from state to state and from year to year and will likely play an even larger role in healthcare funding pursuant to the PPACA.

under recently enacted healthcare legislation. A key component in ensuring whether the appropriate payment amount is received for physician and other services, including those procedures using our products, is the existence of a Current Procedural Terminology or CPT,(CPT) code. To receive payment, health carehealthcare practitioners must submit claims to insurers using these codes for payment for medical services. CPT codes are assigned, maintained and annually updated by the American Medical Association and its CPT Editorial Board. If the CPT codes that apply to the procedures performed using our products are changed, reimbursement for performances of these procedures may be adversely affected.

In the United States, some insured individuals enroll in managed care programs, which monitor and often require pre-approval of the services that a member will receive. Some managed care programs pay their providers on a per capita (patient) basis, which puts the providers at financial risk for the services provided to their patients by paying these providers a predetermined payment per member per month and, consequently, may limit the willingness of these providers to use our products.

We believe that the overall escalating cost of medical products and services being paid for by the governmentgovernments and private health insurance has led to, and will continue to lead to, increased pressures on the healthcare and medical device industry to reduce the costs of products and services. All third-party reimbursement programsThird-party payors are developing increasingly sophisticated methods of controlling healthcare costs through healthcare reform legislation and measures including, government-managed healthcare systems, health technology assessments, coverage with evidence development processes, quality initiatives, pay-for-performance, comparative effectiveness research, prospective reimbursement, and capitation programs, group purchasing, redesign of benefits,benefit offerings, requiring pre-approvals and second opinions prior to major surgery,procedures, careful review of bills, encouragement of healthier lifestyles and other preventative services, and exploration of more cost- effectivecost-effective methods of delivering healthcare. All of these types of programs can potentially impact market access for, and pricing structures of our products, which in turn, can impact our future sales. There can be no assurance that third-party reimbursement and coverage will be available or adequate, or that current and future legislation, regulation or reimbursement policies of third-party payors will not adversely affect the demand for our products or our ability to sell theseour products on a profitable basis. The unavailability or inadequacy of third-party payor coverage or reimbursement could have a material adverse effect on our business, operating results, and financial condition.

In international markets,

Outside the United States, reimbursement and healthcare payment systems vary significantly by country, and many countries have instituted price ceilings on specific product lines and procedures. We believe we have received increased requests for clinical data for the support of registration and reimbursement outside the United States. We have increasingly experienced local, product specific reimbursement law being applied as an overlay to medical device regulation, which has provided an additional layer of clearance requirement. Specifically, Australia requires that clinical data for clearance and reimbursement be in the form of prospective, multi-center studies, a high bar not previously applied. In addition, in France, certain innovative devices (such as some of our products made from pyrolytic carbon), have been identified as needing to provide clinical evidence to support a “mark-specific” reimbursement. There can be no assuranceassurances that procedures using our products will be considered medically reasonable and necessary for a specific indication, that our products will be considered cost-effective by third-party payors, that an adequate level of reimbursement will be available, or that the third-party payors’ reimbursement policies will not adversely affect our ability to sell our products profitably.
Environmental
Our operations and properties are subject to extensive U.S. federal, state, local, and foreign environmental protection and health and safety laws and regulations. These laws and regulations govern, among other things, the generation, storage, handling, use, and transportation of hazardous materials and the handling and disposal of hazardous waste generated at our facilities. Under such laws and regulations, we are required to obtain permits from governmental authorities for some of our operations. If we violate or fail to comply with these laws, regulations or permits, we could be fined or otherwise sanctioned

14


by regulators. Under some environmental laws and regulations, we could also be held responsible for all of the costs relating to any contamination at our past or present facilities and at third-party waste disposal sites. We perceived continuing increase in request for clinical data for the supportbelieve our costs of registrationcomplying with current and reimbursement outside the USfuture environmental laws, regulations and Europe. Morepermits and more, local, product specific reimbursement law is applied as an overlayour liabilities arising from past or future releases of, or exposure to, medical device regulation, which has provided an additional layerhazardous substances will not materially adversely affect our business, results of clearance requirement. Specifically, Australia now requires clinical data for clearance and reimbursementoperations, or financial condition, although there can be no assurances of this.
Seasonality
We traditionally experience lower sales volumes in the formthird quarter than throughout the rest of prospective, multi-center studies,the year as many of our products are used in elective procedures, which generally decline during June, July, and August. This typically results in our selling, general and administrative expenses and research and development expenses as a high bar not previously applied.percentage of our net sales that are higher during third quarter than throughout the rest of the year. In addition, our first quarter selling, general and administrative expenses include additional expenses that we incur in France, certainconnection with the annual meeting held by the American College of Foot and Ankle Surgeons (ACFAS) and the American Academy of Orthopaedic Surgeons (AAOS). During these three-day events, we display our most recent and innovative devices (such as some made from pyrolytic carbon from Tornier), have been identified as needingproducts.
Backlog
The time period between the placement of an order for our products and shipment is generally short. As such, we do not consider our backlog of firm orders to provide clinical evidencebe material to support a “mark-specific” reimbursement.

an understanding of our business.

Employees

As of December 30, 2012,27, 2015, we had 916 employees, including 344 in manufacturing and operations, 132 in research and development and2,295 employees. We believe that we have a good relationship with our employees.
Available Information
We are a public company with limited liability (naamloze vennootschap) organized under the remaining in sales, marketing and related administrative support. Of our 916 worldwide employees, 295 employees were located in the United States and 621 employees were located outsidelaws of the United States, primarilyNetherlands. We were initially formed as a private company with limited liability (besloten vennootschap) in France and Ireland.

Financial Information about Geographical Areas

See Note 13 to our consolidated financial statements for information regarding our revenues and long-lived assets by geographic area.

Available Information

2006. Our principal executive offices are located at Fred. Roeskestraat 123, 1076 EEPrins Bernhardplein 200, 1097 JB Amsterdam, Thethe Netherlands. Our telephone number at this address is (+ 31) 20 577 1177.675-4002. Our agent for service of process in the United States is CT Corporation, 1209 Orange St.,Street, Wilmington, Delaware 19801. Our corporate website is located at www.tornier.com.www.wright.com. The information contained on our website or connected to our website is not incorporated by reference into and should not be considered part of this report.

We make available, free of charge and through our Internet web site,corporate website, our annual reportsAnnual Reports on Form 10-K, quarterly reportsQuarterly Reports on Form 10-Q, current reportsCurrent Reports on Form 8-K, and any amendments to any such reports filed or furnished pursuant to Section 13(a) or 15(d) of the Securities Exchange Act of 1934, as amended, as soon as reasonably practicable after wethey are electronically file such materialfiled with or furnish itfurnished to the Securities and Exchange Commission.


15


Item 1A. Risk Factors.

We are affected by risks specific to us as well as factors that affect all businesses operating in a global market. The following is a discussionIn addition to the other information set forth in this report, careful consideration should be taken of the specific risks thatfactors described below, which could materially adversely affect our business, financial condition or operating results:

results. The risk factors described below may relate solely to one or more of the legal entities contained in our corporate structure and may not necessarily apply to Wright Medical Group N.V. or one or more of the other legal entities contained in our corporate structure.

Risks Related to the Recently Completed Wright/Tornier Merger
We may be unable to successfully integrate our operations or realize the anticipated cost savings, net sales and other potential benefits of our recently completed merger in a timely manner or at all. As a result, the value of our ordinary shares may be adversely affected.
The success of the recently completed merger between legacy Wright and legacy Tornier will depend, in part, on our ability to achieve the anticipated cost savings, net sales, and other potential benefits of the merger. Achieving the anticipated potential benefits of the merger will depend in part upon whether we are able to integrate our operations in an efficient and effective manner and whether we are able to effectively coordinate sales and marketing efforts to communicate our capabilities and coordinate our sales organizations to sell our combined products. The integration process may not be completed smoothly or successfully. The necessity of coordinating geographically separated organizations, systems, and facilities and addressing possible differences in business backgrounds, corporate cultures, and management philosophies may increase the difficulties of integration. We operate numerous systems, including those involving management information, purchasing, accounting and finance, sales, billing, payroll, employee benefits, and regulatory compliance. We may also have inconsistencies in standards, controls, procedures or policies that could affect our ability to maintain relationships with customers and employees or to achieve the anticipated benefits of the merger. We may have difficulty in integrating our commercial organizations, including in particular distribution and sales representative arrangements, some of which will undergo territory transitions during the next several quarters. The integration of certain operations requires the dedication of significant management resources, which may temporarily distract management’s attention from our day-to-day business. Employee uncertainty and lack of focus during the integration process may also disrupt our business. Any inability of our management to integrate successfully our operations or to do so within a longer time frame than expected could have a material adverse effect on our business and operating results. The integration also may result in material unanticipated problems, expenses, liabilities, competitive responses, and loss of customer relationships. Even if the operations of our businesses are integrated successfully, we may not be able to realize the full benefits of the merger, including the anticipated operating and cost synergies, sales and growth opportunities or long-term strategic benefits of the merger, within the expected timeframe or at all. In addition, we expect to incur significant integration and restructuring expenses to realize synergies. However, many of the expenses that will be incurred are, by their nature, difficult to estimate accurately. These expenses could, particularly in the near term, exceed the savings that we expect to achieve from elimination of duplicative expenses and the realization of economies of scale and cost savings. Although we expect that the realization of efficiencies related to the integration of the businesses may offset incremental transaction, merger-related, and restructuring costs over time, we cannot give any assurance that this net benefit will be achieved in the near term, or at all. An inability to realize the full extent of, or any of, the anticipated benefits of the merger, as well as any delays encountered in the integration process, could have an adverse effect on our business and operating results, which may affect the value of our ordinary shares.
Our Businessfuture success also will depend in part upon our ability to retain key employees. Competition for qualified personnel can be very intense. In addition, key employees may depart because of issues relating to the uncertainty or difficulty of integration or a desire not to remain with our company. Accordingly, no assurances can be given that we will retain key employees.
Our future results will suffer if we do not effectively manage our expanded operations as a result of the merger.
As a result of the merger, the size of our business has increased significantly. Our future success depends, in part, upon our ability to manage this expanded business, which may pose substantial challenges for our management, including challenges related to the management and Our Industry

monitoring of new operations and associated increased costs and complexity. There can be no assurances that we will be successful or that we will realize the expected operating efficiencies, cost savings, and other benefits currently anticipated from the merger.

In addition, effective internal controls are necessary for us to provide reliable and accurate financial reports and to effectively prevent fraud. The integration of combined or acquired businesses is likely to result in our systems and controls becoming increasingly complex and more difficult to manage. We devote significant resources and time to comply with the

16


internal control over financial reporting requirements of the Sarbanes-Oxley Act of 2002. However, we cannot be certain that these measures will ensure that we design, implement, and maintain adequate control over our financial processes and reporting in the future, especially in the context of acquisitions of other businesses. We are in the process of integrating the internal controls of legacy Tornier into our internal controls. The report of our management on our internal control over financial reporting and the attestation report of our independent registered public accounting firm on our internal control over financial reporting included in this report excludes the internal control of legacy Tornier. Any difficulties in the assimilation of legacy Tornier’s business into our control system could harm our operating results or cause us to fail to meet our financial reporting obligations. Inferior internal controls could also cause investors to lose confidence in our reported financial information, which could have a negative effect on the trading price of our ordinary shares and our access to capital.
Efforts to integrate our Corporate Compliance Programs require the cooperation of many individuals and will likely require substantial investment and divert a significant amount of future time and resources from our other business activities.
We are committed to a robust Corporate Compliance Program. In furtherance of this strategic objective, we have devoted a significant amount of time and resources since the completion of the merger to integrate the Corporate Compliance Programs of legacy Wright and legacy Tornier. This has required, and will continue to require, a significant amount of time and resources from our financial, human resources, and compliance personnel, as well as all of our employees. Successful integration of our Corporate Compliance Programs requires the full and sustained cooperation of all of our employees, distributors, and sales agents, as well as the healthcare professionals with whom we interact. These efforts require significant expenses and investments. We also may encounter inefficiencies in the integration of our compliance programs, including delays in medical education, research and development projects, and clinical studies, which may unfavorably impact our business and relationships with customers. If we fail to integrate successfully the Corporate Compliance Programs of legacy Wright and legacy Tornier, our business and operating results may be adversely affected.
In connection with the accounting for the merger, we recorded a significant amount of goodwill and other intangible assets, which if the acquired business does not perform well, may be subject to future impairment, which would harm our operating results.
In connection with the accounting for the merger, we recorded a significant amount of goodwill and other intangible assets. As of December 27, 2015, we had $876 million in goodwill and $257 million in intangible assets. As part of the Wright/Tornier merger, we recorded $683.3 million in goodwill and $200.8 million in other intangible assets. Under US GAAP, we must assess, at least annually and potentially more frequently, whether the value of our goodwill and other indefinite-lived intangible assets have been impaired. Amortizing intangible assets will be assessed for impairment in the event of an impairment indicator. A decrease in the long-term economic outlook and future cash flows of the legacy Tornier business that we acquired could significantly impact asset values and potentially result in the impairment of intangible assets, including goodwill. If the operating performance of the legacy Tornier business significantly decreases, competing or alternative technologies emerge, or if market conditions or future cash flow estimates decline, we could be required, under current US GAAP, to record a non-cash charge to operating earnings for the amount of the impairment. Any write-off of a material portion of our unamortized intangible assets would negatively affect our results of operations.
We have incurred and expect to continue to incur significant transaction and integration-related costs in connection with the merger and the integration of our operations.
We have incurred and expect to continue to incur a number of non-recurring costs associated with the merger and integrating our operations. The substantial majority of non-recurring expenses resulting from the merger will be comprised of transaction costs related to the merger, employment-related costs, and facilities and systems consolidation costs. Although we expect that the elimination of duplicative costs, as well as the realization of other efficiencies related to the integration of our businesses should allow us to offset incremental transaction and integration-related costs over time, this net benefit may not be achieved in the near term, or at all.
Risk Related to our Business
We have a history of operating losses and negative cash flow and may never achieve or sustain profitability.

We have a history of operating losses and at December 30, 2012,27, 2015, we had an accumulated deficit of $235.7$774 million. Our ability to achieve profitability will be influenced by many factors, including, among others, the success of our recently completed Wright/Tornier merger; the extent and duration of our future operating losses,losses; the level and timing of future revenuenet sales and expenditures,expenditures; development, commercialization and market acceptance of new products,products; the results and scope of ongoing research and development projects,projects; competing technologies and market developments anddevelopments; regulatory requirements and delays.delays; and

17


pending litigation. As a result, we may continue to incur operating losses for the foreseeable future. These losses will continue to have an adverse impact on our shareholders’ equity, and we may never achieve or sustain profitability.

We anticipate significant sales during 2016 and in future years from our AUGMENT® Bone Graft product. If we do not successfully develop and market new products and technologies and implementare wrong, our business strategy, our business andfuture operating results, maycash flows, and prospects could be adversely affected.

We may not be able to successfully implement our business strategy. To implement our business strategy we need to, among other things, develop and introduce new extremity joint products, find new applications for and improve our existing products, properly identify and anticipate our surgeons’ and their patients’ needs, obtain regulatory clearances or approvals for new products and applications and educate surgeons about the clinical and cost benefits of our products.

We are continually engaged in product development and improvement programs, and we expect new products to account for a significant portion of our future growth. If we do not continue to introduce new products and technologies, or if those products and technologies are not accepted, we may not be successful. Moreover, research and development efforts may require a substantial investment of time and resources before we are adequately able to determine the commercial viability of a new product, technology, material or innovation. Demand for our products also could change in ways we may not anticipate due to evolving customer needs, changing demographics, slow industry growth rates, evolving surgical philosophies and evolving industry standards, among others. Additionally, our competitors’ new products and technologies may precede our products to market, may be more effective or less expensive than our products or may render our products obsolete. Our new products and technologies also could render our existing products obsolete and thus adversely affect sales of our existing products.

Our targeted surgeons practice in areas such as shoulder, upper extremities, lower extremities, sports medicine and reconstructive and general orthopaedics, and our strategy of focusing exclusively on these surgeons may not be successful. In

The newest addition we are seeking to increase our international revenue and will need to increase our worldwide direct sales force and enter into distribution agreements with third parties in order to do so. All of this may result in additional or different foreign regulatory requirements, with which we may not be able to comply. Moreover, even if we successfully implement our business strategy, our operating results may not improve. We may decide to alter or discontinue aspects of our business strategy and may adopt different strategies due to business or competitive factors.

We rely on our distributors, independent sales agencies and their representatives to market and sell our products in certain territories. A failure to maintain our existing relationships with or changes and transitions with respect to our distributors, independent sales agencies and their representatives could have an adverse effectbiologics product portfolio is AUGMENT® Bone Graft, which is based on our operating results.

Inrecombinant human platelet-derived growth factor (rhPDGF-BB), a synthetic copy of one of the United States, we sell our products primarily through a sales channel consistingbody’s principal healing agents. We obtained FDA approval of mostly independent commission-based sales agencies, which utilize several sales representatives, with some direct sales organizations in certain territories. Internationally, we utilize several distribution approaches depending on the individual market requirements, including direct sales organizations in the largest European markets, Australia and Japan and independent distributors for most other international markets. Our distributors and sales agencies do not sell our products exclusively and may offer similar products from other orthopaedic companies. In 2012, no individual distributor or sales agency accounted for more than 7% of our global revenue. Our success depends largely upon our ability to motivate our distributors and sales agencies to sell our products. Additionally, we depend on their sales and service expertise and relationships with the surgeons in the marketplace. We also rely upon their compliance with federal laws and regulations such as with the advertising and promotion regulations under the federal Food, Drug and Cosmetic Act, the Anti-kickback Statute, the False Claims Act, the Physician Sunshine Payments Act and other applicable state laws. Our distributors and independent sales agencies may terminate their contracts with us, may devote insufficient sales efforts to our products or may focus their sales efforts on other products that produce greater commissions for them. If our relationship with any of our distributors or sales agencies terminated, we could enter into agreements with existing distributors and sales agencies to take on the related sales, contract with new distributors and new sales agencies, or hire direct sales representatives or a combination of these options. A failure to maintain our existing relationships with or changes and transitions with respect to our distributors and independent sales agencies and their representatives could have an adverse effect on our operations and operating results. We do not control our distributors or independent sales agencies and they may not be successful in implementing our marketing plans.

During 2012, we terminated our sales relationships with a few independent sales agenciesAUGMENT® Bone Graft in the United States that were not performingfor ankle and/or hindfoot fusion indications during third quarter of 2015. AUGMENT® Bone Graft is currently available for sale as an alternative to our expectations. This resultedautograft in some disruption in our United States sales channel and adversely affected our revenues during 2012. During 2013, we may terminate our sales relationships with additional independent sales agencies and some of our distributors that are not performing to our expectations and it is possible that such actions will result in further disruption in our United States sales channel, disruption in certain countries outside the United States and adversely affect our revenues and other operating results during 2013. It is also possible that we may become subject to litigation and incur future charges and cash expenditures in connection with such independent sales agency and distributor changes and transitions, which charges and cash expenditures would adversely affect our operating results.

In November 2012, Douglas W. Kohrs, our former President and Chief Executive Officer, resigned as a director, officer and employee of Tornier. Mr. Kohrs had built strong relationships with several of our key physicians, customers, distributors, sales representatives and employees. Accordingly, this change in our senior management may adversely affect our relationships with these individuals and have a material adverse effect on our business.

Our recently completed facilities consolidation initiative may not result in anticipated operational efficiencies, expense savings and other benefits and could have an unintended adverse impact on our business.

We recently implemented a facilities consolidation initiative pursuant to which we consolidated a number of our facilities in France, Ireland and the United States. The facilities consolidation initiative was driven by our strategy to drive operational productivity and to realize operating costs savings beginning in 2013. Under the initiative, we consolidated our Dunmanway, Ireland manufacturing facility into our Macroom, Ireland manufacturing facility and our St. Ismier, France manufacturing facility into our existing Montbonnot, France manufacturing facility. We also leased a new facility located in Bloomington, Minnesota to use as our U.S. business headquarters and consolidated our Minneapolis-based marketing, training, regulatory, clinical, supply chain and corporate functions with our Stafford, Texas-based distribution operations. In connection with the facilities consolidation, we recorded pre-tax charges, comprised of one-time employee termination costs; facility closure, moving and related expenses; fixed asset write-offs net of anticipated proceeds from the sale of facilities in Stafford, Texas and Dunmanway, Ireland; and other miscellaneous related charges during 2012, aggregating in $6.4 million of expense for 2012. Since the facilities consolidation is complete, we do not expect to record any significant additional expense related to the facilities consolidation during 2013. Although we continue to believe that the facilities consolidation will result in anticipated operational efficiencies, expense savings and other benefits that we believe should positively impact our business and operating results beginning in 2013, we may be incorrect. If the facilities consolidation results in unanticipated expenses and charges, including litigation expenses, and has unintended impacts on our business, including in particular our new product development efforts, or if does not produce the anticipated operational efficiencies, expense savings and other benefits, we may disappoint investors and it is possible that further restructuring activities might become necessary, resulting in additional future charges.

We may be unable to compete successfully against our existing or potential competitors, in which case our revenue and operating results may be negatively affected and we may not grow.

The market for orthopaedic devices is highly competitive and subject to rapid and profound technological change. Our success depends, in part, on our ability to maintain a competitive position in the development of technologies and products for use by our customers. We face competition from large diversified orthopaedic manufacturers, such as DePuy

Orthopaedics, Inc., a Johnson & Johnson subsidiary, Zimmer Corporation and Stryker Corporation, and established mid-sized orthopaedic manufacturers, such as Arthrex, Inc., Wright Medical Group, Inc. and ArthroCare Corporation. Many of the companies developing or marketing competitive orthopaedic products enjoy several competitive advantages, including:

greater financial and human resources for product development and sales and marketing;

greater name recognition;

established relationships with surgeons, hospitals and third-party payors;

broader product lines and the ability to offer rebates or bundle products to offer greater discounts or incentives to gain a competitive advantage;

established sales and marketing and distribution networks; and

more experience in conducting research and development, manufacturing, preparing regulatory submissions and obtaining regulatory clearances or approvals for products.

We also compete against smaller, entrepreneurial companies with niche product lines. Our competitors may increase their focus on the extremities market, which is our primary strategic focus. Our competitors may develop and patent processes or products earlier than us, obtain regulatory clearances or approvals for competing products more rapidly than us and develop more effective or less expensive products or technologies that render our technology or products obsolete or non-competitive. We also compete with other organizations in recruiting and retaining qualified scientific and management personnel, as well as in acquiring technologies and technology licenses complementary to our products or advantageous to our business. If our competitors are more successful than us in these matters, we may be unable to compete successfully against our existing or future competitors.

We derive a significant portion of our revenue from operations in international markets that are subject to political, economic and social instability.

We derive a significant portion of our revenue from operations in international markets. Our international distribution system consists of 12 direct sales offices and approximately 30 distribution partners, who sell in approximately 40 countries. Most of these countries are, to some degree, subject to political, economic and social instability. For the year ended December 30, 2012, approximately 44% of our revenue was derived from our international operations, including 19% of our revenue from France. In 2012, we opened a direct sales office in Japan and we intend to further expand our international operations into key markets, such as Brazil and China. Our international sales operations expose us and our representatives, agents and distributors to risks inherent in operating in foreign jurisdictions. These risks include:

the imposition of additional U.S. and foreign governmental controls or regulations on orthopaedic implants and biologics products;

the imposition of costly and lengthy new export and import license requirements;

the imposition of U.S. or international sanctions against a country, company, person or entity with whom we do business that would restrict or prohibit continued business with that country, company, person or entity;

economic instability, including the European sovereign debt crisis and the austerity measures taken and to be taken by certain countries in response to such crisis, and the currency risk between the U.S. dollar and foreign currencies in our target markets;

the imposition of restrictions on the activities of foreign agents, representatives and distributors;

scrutiny of foreign tax authorities, which could result in significant fines, penalties and additional taxes being imposed upon us;

a shortage of high-quality international salespeople and distributors;

loss of any key personnel who possess proprietary knowledge or are otherwise important to our success in international markets;

changes in third-party reimbursement policies that may require some of the patients who receive our products to directly absorb medical costs or that may require us to sell our products at lower prices;

unexpected changes in foreign regulatory requirements;

differing local product preferences and product requirements;

changes in tariffs and other trade restrictions;

work stoppages or strikes in the healthcare industry;

difficulties in enforcing and defending intellectual property rights;

foreign exchange controls that might prevent us from repatriating cash earned in countries outside the Netherlands;

complex data privacy requirements and labor relations laws; and

exposure to different legal and political standards.

Not only are we subject to the laws of other jurisdictions, we also are subject to U.S. laws governing our activities in foreign countries, including various import-export laws, customs and import laws, anti-boycott laws and embargoes. For example, the FDA Export Reform and Enhancement Act of 1996 requires that, when exporting medical devices from the United States for saleankle and/or hindfoot fusion indications, in a foreign country, depending onCanada for foot and ankle fusion indications and in Australia and New Zealand for hindfoot and ankle fusion indications. We anticipate significant sales during 2016 and in future years from our AUGMENT® Bone Graft product. If we are wrong, our future operating results, cash flows, and prospects could be adversely affected. We acquired the type ofAUGMENT® Bone Graft product being exported, the regulatory status of the productline from BioMimetic Therapeutics, Inc. (BioMimetic) in March 2013 and the country to which the device is exported, we must ensure, among other things, that the device is produced in accordance with the specifications of the foreign purchaser; not in conflict with the laws of the country to which it is intended for export; labeled for export; and not offered for sale domestically. In addition, we must maintain records relevant to product export and, if requested by the foreign government, obtain a certificate of exportability. In some instances, prior notification to or approval from the FDA is required prior to export. The FDA can delay or deny export authorization if all applicable requirements are not satisfied. Imports of approved medical devices into the United States also are subject to requirements including registrationfuture milestone payments to the holders of establishment, listingthe contingent value rights issued in connection with that transaction. Therefore, even if we achieve significant sales of devices, manufacturingAUGMENT® Bone Graft, these sales will be offset in accordance with the quality system regulation, medical device reporting of adverse events, and premarket notification 510(k) clearance or premarket approval, or PMA, among others and if applicable. If our business activities were determined to violatepart by these laws, regulations or rules, we could suffer serious consequences.

In addition, a portion of our international revenue is made through distributors. As a result, we are dependent upon the financial health of our distributors. milestone payment obligations.


We are also dependent upon their compliance with foreign laws and the U.S. Foreign Corrupt Practices Act, or the FCPA, as it relatessubject to certain “facilitating” payments made to those employed by or acting on behalf of a foreignsubstantial government in the procurement, sale and prescription of medical devices. If a distributor were to go out of business, it would take substantial time, cost and resources to find a suitable replacement and the products held by such distributor may not be returned to us or to a subsequent distributor in a timely manner or at all.

Any material decrease in our foreign revenue may negatively affect our profitability. We generate our international revenue primarily in Europe, where healthcare regulation and reimbursement for orthopaedic medical devices vary significantly from country to country. This changing environment could adversely affect our ability to sell our products in some European countries. In addition, many of the economies in Europe have undergone recessions which have threatened their ability to service their sovereign debt obligations. Several of these countries have implemented austerity measures, which have adversely affected our sales and may continue to adversely affect our sales.

Disruption and turmoil in global credit and financial markets, which may be exacerbated by the inability of certain countries to continue to service their sovereign debt obligations and certain austerity measures countries have implemented, and the possible negative implications of such events to the global economy, may negatively impact our business, operating results and financial condition.

A substantial portion of our revenue outside the United States is generated in Europe, including in particular France. The credit ratings of several European countries and the possibility that certain European Union member states will default on their debt obligations have contributed to significant uncertainty about the stability of global credit and financial markets. The credit and economic conditions within certain European Union countries in particular, including France, Greece, Ireland, Italy, Portugal and Spain, have contributed to the instability in global credit and financial markets. The possibility that such EU member states will default on their debt obligations, the continued uncertainty regarding international and the European Union’s financial support programs and the possibility that other EU member states may experience similar financial troubles could further disrupt global credit and financial markets. While the ultimate outcome of these events cannot be predicted, it is possible that such events could have a negative effect on the global economy as a whole, and our business, operating results and financial condition, in particular. For example, if the European sovereign debt crisis continues or worsens, the negative implications to the global economy and us could be significant. Since a significant amount of our trade receivables are with hospitals that are dependent upon governmental health care systems in many countries, repayment of such receivables is dependent upon the financial stability of the economies of those countries. A deterioration of economic conditions in such countries may increase the average length of time it takes for us to collect on our outstanding accounts receivable in these countries or even our ability to collect such receivables.

In addition, if the European sovereign debt crisis continues or worsens, the value of the Euro could deteriorate or lead to the re-introduction of individual currencies in one or more Eurozone countries, or, in more extreme circumstances, the possible dissolution of the Euro currency entirely, all of which could negatively impact our business, operating results and financial condition in light of our substantial operations in and revenues derived from customers in the European Union. Should the Euro dissolve entirely, the legal and contractual consequences for holders of Euro-denominated obligations would be determined by laws in effect at such time. These potential developments, or market perceptions concerning these and related issues, could adversely affect the value of our Euro-denominated assets and obligations. In addition, concerns over the effect of this financial crisis on financial institutions in Europe and globally could lead to tightening of the credit and

financial markets, which could negatively impact the ability of companies to borrow money from their existing lenders, obtain credit from other sources or raise financing to fund their operations. This could negatively impact our customers’ ability to purchase our products, our suppliers’ ability to provide us with materials and components and our ability, if needed, to finance our operations on commercially reasonable terms, or at all. We believe that European governmental austerity policies have reduced and may continue to reduce the amount of money available to purchase medical products, including our products. These austerity measures could negatively impact overall procedure volumes and result in increased pricing pressure for our products and the products of our competitors. Any or all of these events, as well as any additional austerity measures that may be taken which, among other things, could result in decreased utilization, pricing and reimbursement, could negatively impact our business, operating results and financial condition.

Weakness in the global economy is likely to adversely affect our business until an economic recovery is underway.

Many of our products are used in procedures covered by private insurance, and some of these procedures may be considered elective. We believe the global economic downturn may reduce the availability or affordability of private insurance or may affect patient decisions to undergo elective procedures. If current economic conditions do not continue to recover or worsen, we expect that increasing levels of unemployment and pressures to contain healthcare costs could adversely affect the global growth rate of procedure volume, which could have a material adverse effect on our revenuebusiness.

The production and operating results.

Fluctuationsmarketing of our products and our ongoing research and development, pre-clinical testing, and clinical trial activities are subject to extensive regulation and review by numerous governmental authorities both in the United States and abroad. U.S. and foreign currency ratesregulations govern the testing, marketing, and registration of new medical devices, in addition to regulating manufacturing practices, reporting, labeling, relationships with healthcare professionals, and recordkeeping procedures. The regulatory process requires significant time, effort, and expenditures to bring our products to market, and we cannot be assured that any of our products will be approved. Our failure to comply with applicable regulatory requirements could result in declines ingovernmental authorities:

imposing fines and penalties on us;
preventing us from manufacturing or selling our reported revenueproducts;
bringing civil or criminal charges against us and earnings.

A substantial portionour officers and employees;

delaying the introduction of our revenue outsidenew products into the market;
recalling or seizing our products; or
withdrawing or denying approvals or clearances for our products.

Even if regulatory approval or clearance of a product is granted, this could result in limitations on the uses for which the product may be labeled and promoted. Further, for a marketed product, its manufacturer, such manufacturer’s suppliers, and manufacturing facilities are subject to periodic review and inspection. Subsequent discovery of problems with a product, manufacturer, or facility may result in restrictions on the product, manufacturer or facility, including withdrawal of the product from the market or other enforcement actions. Our products can only be marketed in accordance with their approved labeling. If we were to promote the use of our products in an “off-label” manner, we and our directors, officers and employees, would be subject to civil and criminal sanctions.
We are subject to various U.S. federal and state and foreign laws concerning healthcare fraud and abuse, including false claims laws, anti-kickback laws and physician self-referral laws. Violations of these laws can result in criminal and/or civil punishment, including fines, imprisonment and, in the United States, exclusion from participation in government healthcare programs. Greater scrutiny of marketing practices in our industry has resulted in numerous government investigations by various government authorities and this industry-wide enforcement activity is expected to continue. If a governmental authority were to determine that we do not comply with these laws and regulations, then we and our directors, officers and employees could be subject to criminal and civil penalties, including exclusion from participation in U.S. federal healthcare reimbursement programs.
In order to market our devices in the member countries of the European Union, we are required to comply with the European Medical Devices Directive and obtain CE mark certification. CE mark certification is the European symbol of adherence to quality assurance standards and compliance with applicable European Medical Device Directives. Under the European Medical Devices Directive, all medical devices including active implants must qualify for CE marking. Our failure to comply with the European Medical Devices Directive could result in our loss of CE mark certification which would harm our business.

18


Although legacy Wright divested the hip/knee (OrthoRecon) business, legacy Wright remains responsible, as between it and MicroPort, for liability claims on OrthoRecon products sold prior to closing, and might still be sued on products sold after closing.
Although OrthoRecon product liability expenses are accounted for under our discontinued operations, the agreement between Wright Medical Group, Inc. (WMG) and MicroPort requires that legacy Wright, as between it and MicroPort, retain responsibility for product liability claims on OrthoRecon products sold prior to closing, and for any resulting settlements, judgments, or other costs. Moreover, even though MicroPort, as between it and legacy Wright, is responsible for liability claims on post-closing sales, there can be no assurance we will not be named as a defendant in a lawsuit relating to such post-closing sales, or that MicroPort will have adequate resources to exonerate legacy Wright from any resulting expenses or liabilities.
We may never realize the expected benefits from the Wright/Tornier merger, the divestiture of the OrthoRecon business, and our strategy to become a profitable, high-growth, pure-play medical technology company, and command the market valuation typically accorded such companies.
The Wright/Tornier merger and the divestiture of the OrthoRecon business are part of our strategy to transform ourselves into a profitable, high-growth, pure-play medical technology company, and command the market valuation typically accorded such companies. If we are unable to achieve our growth and profitability objectives due to competition, lack of acceptance of our products, failure to gain regulatory approvals, or other risks as described in this section or other sections of this report, or due to other events, we will not be successful in transforming our business and will not be accorded the market valuation we seek. Moreover, the OrthoRecon business generated substantial revenue and cash flow, which we have not replaced. While over time we expect to replace the OrthoRecon revenue and cash flow by accelerating higher margin revenue streams from extremities and biologic products, especially in Europelight of the Wright/Tornier merger, there is still a risk we will be unable to replace the revenue and cash flow that the OrthoRecon business generated, or that the cost of such will be higher than expected. If we are unable to achieve our profit and growth objectives, such failure will be exacerbated by the loss of revenue and cash flow generated by the OrthoRecon business, and could result in a decline in our stock price.
We may never realize the expected benefits of our strategic business combinations or acquisition transactions.
In addition to developing new products and growing our business internally, we have sought to grow through business combinations and acquisitions of complementary businesses. Examples include, in addition to the recently completed Wright/Tornier merger, legacy Wright's acquisition of BioMimetic in early 2013, as well as its more recent acquisitions of Biotech International in November 2013, Solana Surgical, LLC in January 2014, and OrthoPro, L.L.C. in February 2014, and legacy Tornier’s acquisition of OrthoHelix Surgical Designs, Inc. in 2012. Business combinations and acquiring new businesses involve a myriad of risks. Whenever new businesses are combined or acquired, there is a risk we may fail to realize some or all of the anticipated benefits of the transaction. This can occur if integration of the businesses proves to be more complicated than planned, resulting in failure to realize operational synergies and/or failure to mitigate operational dis-synergies, diversion of management attention, and loss of key personnel. It can also occur if the combined or acquired business fails to meet our net sales projections, exposes us to unexpected liabilities, or if our pre-acquisition due diligence fails to uncover issues that negatively affect the value or cost structure of the acquired enterprise. Although we carefully plan our business combinations and acquisitions, there can be no assurances that these and other countriesrisks will not prevent us from realizing the expected benefits of these transactions.
Product liability lawsuits could harm our business and adversely affect our operating results or results from discontinued operations and financial condition if adverse outcomes exceed our product liability insurance coverage.
The manufacture and sale of medical devices expose us to significant risk of product liability claims. We are currently defendants in Latin Americaa number of product liability matters, including those relating to the OrthoRecon business, which legacy Wright divested to MicroPort in 2014. Legacy Wright remains responsible, as between it and AsiaMicroPort, for claims associated with products sold before divesting the OrthoRecon business to MicroPort.
We have been named as a defendant, in some cases with multiple other defendants, in lawsuits in which it is alleged that as yet unspecified defects in the design, manufacture, or labeling of certain metal-on-metal hip replacement products rendered the products defective. The pre-trial management of certain of these claims has been consolidated in the federal court system, in the United States District Court for the Northern District of Georgia under multi-district litigation and certain other claims by the Judicial Counsel Coordinated Proceedings in state court in Los Angeles County, California. As of January 30, 2016, there were 1,126 such lawsuits pending in the multi-district federal court proceeding and consolidated California state court proceeding, and an additional 22 cases pending in various state courts. We have also entered into 893 so called "tolling

19


agreements" with potential claimants who have not yet filed suit. There are also 56 non-U.S. lawsuits presently pending. We believe we have data that supports the efficacy and safety of the metal-on-metal hip replacement systems, and have been vigorously defending these cases. While continuing to dispute liability, we have been participating in court-supervised mediation in the multi-district federal court litigation presently pending in the Northern District of Georgia and defending ourself in a consolidated California state court proceeding.
Claims for personal injury have also been made against us associated with fractures of legacy Wright's PROFEMUR® long titanium modular neck product. We believe that the overall fracture rate for the product is low and the fractures appear, at least in part, to relate to patient demographics, and have been vigorously defending these matters. While continuing to dispute liability, we have been open to settling these claims in circumstances where we believe the amounts are denominatedsettlement amount is reasonable relative to the risk and expense of litigation.
Our material product liability litigation is discussed in currencies other than the U.S. dollar. For purposes of preparingNote 16 to our consolidated financial statements these amountsin "Item 8. Financial Statements and Supplementary Data" of this report. These matters are converted into U.S. dollars, the value of which varies with currency exchange rate fluctuations. For revenuesubject to many uncertainties and outcomes are not denominated in U.S. dollars, if there is an increase in the valuepredictable. Regardless of the U.S. dollar relativeoutcome of these matters, legal defenses are costly. We have incurred and expect to continue to incur substantial legal expenses in connection with the specified foreign currency, we will receive less in U.S. dollars than before the increase in the exchange rate, whichdefense of these matters. We could negatively impact our operating results. Although we address currency risk management through regular operating and financing activities, and more recently through hedging activities, those actions may not prove to be fully effective, and hedging activities involve additional risks.

Our business plan relies on assumptions about the market forincur significant liabilities associated with adverse outcomes that exceed our products liability insurance coverage, which if incorrect, maycould adversely affect our revenue.

We believe thatoperating results or results from discontinued operations and financial condition. The ultimate cost to us with respect to product liability claims could be materially different than the agingamount of the general populationcurrent estimates and increasingly active lifestyles will continueaccruals and that these trends will increasecould have a material adverse effect on our financial position, operating results or results from discontinued operations, and cash flows.

In the need for our products.future, we may be subject to additional product liability claims. We anticipate that the market for our extremity productsalso could experience a material design or manufacturing failure in particular will continue to grow. The actual demand for our products, however, could differ materially from our projected demand if our assumptions regarding these trends and acceptance of our products by the medical community prove to be incorrecta quality system failure, other safety issues, or do not materialize, or if non-surgical treatments gain more widespread acceptance asheightened regulatory scrutiny that would warrant a viable alternative to our orthopaedic implants.

Our upper extremity joints and trauma products, including in particular our shoulder products, generate a significant portion of our revenue. Accordingly, if revenue of these products were to decline, our operating results would be adversely affected.

Our upper extremity joints and trauma products, which includes joint implants and bone fixation devices for the shoulder, hand, wrist and elbow, generate a significant portion of our revenue. During the year ended December 30, 2012, our upper extremity joints and trauma products generated approximately 63% of our revenue. We expect the shoulder to continue to be the largest and most important product category for us for the foreseeable future. A decline in revenue from these products as a result of increased competition, regulatory matters, intellectual property matters or any other reason would negatively impact our operating results.

We obtain some of our products through private-label distribution agreements that subject us to minimum performance and other criteria. Our failure to satisfy those criteria could cause us to lose those rights of distribution.

We have entered into private-label distribution agreements with manufacturersrecall of some of our products. These manufacturers brandProduct liability lawsuits and claims, safety alerts and product recalls, regardless of their ultimate outcome, could result in decreased demand for our products, accordinginjury to our specifications,reputation, significant litigation and other costs, substantial monetary awards to or costly settlements with patients, product recalls, loss of revenue, and the inability to commercialize new products or product candidates, and otherwise have a material adverse effect on our business and reputation and on our ability to attract and retain customers.

Our existing product liability insurance coverage may be inadequate to protect us from any liabilities we might incur.
If the product liability claims brought against us involve uninsured liabilities or result in liabilities that exceed our insurance coverage, our business, financial condition, and operating results could be materially and adversely affected. Further, such product liability matters may negatively impact our ability to obtain insurance coverage or cost-effective insurance coverage in future periods. We are presently in litigation with certain insurance carriers concerning the amount of coverage available to satisfy potential liabilities associated with the metal-on-metal hip claims against us. An unfavorable outcome in this litigation could have an adverse effect on our financial condition and results from discontinued operations if we ultimately are subject to liabilities associated with these claims that exceed coverage amounts not in dispute. In addition, on September 29, 2015, we received notice that the third insurance carrier in the tower for product liability insurance coverage relating to personal injury claims associated with fractures of legacy Wright's PROFEMUR® long titanium modular neck product (Modular Neck Claims) has asserted that the terms and conditions identified in its reservation of rights will preclude coverage for the Modular Neck Claims. We strongly dispute the carrier’s position and, in accordance with the dispute resolution provisions of the policy, have initiated an arbitration proceeding in London, England seeking payment of these funds. We continue to believe our contracts with our insurance carriers are enforceable for these claims; however, we would be responsible for any amounts that our insurance carriers do not cover or for the amount by which ultimate losses exceed the amount of our third-party insurance coverage. An unfavorable outcome in this matter could have an adverse effect on our financial condition and results from discontinued operations if we ultimately are subject to liabilities associated with these claims that exceed coverage amounts not in dispute.

MicroPort’s recall of certain sizes of its cobalt chrome modular neck devices due to alleged fractures could result in additional product liability claims against us and have resulted in an indemnification claim by MicroPort. Although we have contested these claims, adverse outcomes could harm our business and adversely affect our results from discontinued operations and financial condition.
In August 2015, MicroPort announced the voluntary recall of certain sizes of its PROFEMUR® Long Cobalt Chrome Modular Neck devices manufactured from June 15, 2009 to July 22, 2015. Because MicroPort did not acquire the OrthoRecon business until January 2014, many of the recalled devices were sold by legacy Wright prior to the acquisition by MicroPort. Under the asset purchase agreement with MicroPort, legacy Wright retained responsibility, as between it and MicroPort, for claims for personal injury relating to sales of these products prior to the acquisition. We were not consulted by MicroPort in

20


connection with its recall, and we maypresently are aware of only four lawsuits alleging personal injury related to cobalt chrome neck fractures (two in the United States and two outside the United States). However, if the number of product liability claims alleging personal injury from fractures of cobalt chrome modular necks we sold prior to the MicroPort transaction were to become significant, this could have exclusive rightsan adverse effect on our results from discontinued operations and financial condition. In addition, MicroPort filed a lawsuit against us seeking indemnification against losses arising from its recall and from the alleged fractures. We vigorously deny MicroPort’s claims; however, there can be no assurance we will be successful in certain fieldsdefending against them. An adverse outcome in this litigation could adversely affect our results from discontinued operations and financial condition.
A competitor’s recall of useits modular hip systems, and territoriesthe liability claims and adverse publicity which ensued, could generate copycat claims against modular hip systems legacy Wright sold.
On July 6, 2012, Stryker Corporation announced the voluntary recall of its Rejuvenate Modular and ABG II modular neck hip stems citing risks including the potential for fretting and/or corrosion at or about the modular neck junction. Although Stryker’s recalled modular neck hip stems differ in design and material from the PROFEMUR® modular neck systems legacy Wright sold before divestiture of the OrthoRecon business, we have previously noted the risk that Stryker’s recall and the resultant publicity could negatively impact sales of modular neck systems of other manufacturers, including the PROFEMUR® system, and that Stryker’s action has increased industry focus on the safety of cobalt chrome modular neck products. We have carefully monitored the clinical performance of the PROFEMUR® modular neck hip system, which combine a cobalt chrome modular neck and a titanium stem. With over 33,000 units sold since this version was introduced in 2009, and an extremely low complaint rate, we remain confident in the safety and efficacy of this product. Nevertheless, in light of Stryker’s recall, the resulting product liability claims to sellwhich it has been subject, and the general negative publicity surrounding “metal-on-metal” articulating surfaces (which do not involve modular hip stems), there remains a risk that, even in the absence of clinical evidence, claims for personal injury relating to sales of these products subject to minimum purchase, sales or other performance criteria. Though these agreements do not individually or inbefore divestiture of the aggregate represent a material portion of ourOrthoRecon business if we do not meet these performance criteria, or fail to renew these agreements, we may lose exclusivity in a field of use or territory or cease to have any rights to these products,could increase, which could have an adverse effect on our revenue. Furthermore, some of these manufacturers

may be smaller, undercapitalized companies that may not have sufficient resources to continue operations or to continue to supply us sufficient product without additional access to capital.

If our private-label manufacturers fail to provide us with sufficient supply of their products, or if their supply fails to meet appropriate quality requirements, our business could suffer.

Our private-label manufacturers are sole source suppliers of the products we purchase from them. Given the specialized nature of the products they provide, we may not be able to locate or establish additional or replacement manufacturers of these products. Moreover, these private-label manufacturers typically own the intellectual property associated with their products, and even if we could find a replacement manufacturer for the product, we may not have sufficient rights to enable the replacement party to manufacture the product. While we have entered into agreements with our private-label manufacturers that we believe will provide us sufficient quantities of products, we cannot assure you that they will do so, or that any products they do provide us will not contain defects in quality. Our private-label manufacturing agreements have terms expiring between this year and 2015 and are renewable under certain conditions or by mutual agreement. The agreements also include some or all of the following provisions allowing for termination under certain circumstances: (i) either party’s uncured material breach of the terms and conditions of the agreement, (ii) either party filing for bankruptcy, being bankrupt or becoming insolvent, suspending payments, dissolving or ceasing commercial activity, (iii) our inability to meet market development milestones and ongoing sales targets, (iv) termination without cause, provided that payments are made to the distributor, (v) a merger or acquisition of one of the parties by a third party, (vi) the enactment of a government law or regulation that restricts either party’s right to terminate or renew the contract or invalidates any provision of the agreement or (vii) the occurrence of a “force majeure,” including natural disaster, explosion or war.

We also rely on these private-label manufacturers to comply with the regulations of the FDA, the competent authorities of the Member States of the European Economic Area, or EEA, or foreign regulatory authorities and their failure to comply with strictly enforced regulatory requirements could expose us to regulatory action including warning letters, product recalls, termination of distribution, product seizures or civil penalties. Any quality control problems that we experience with respect to products manufactured by our private-label manufacturers, any inability by us to provide our customers with sufficient supply of products or any investigations or enforcement actions by the FDA, the competent authorities of the Member States of the EEA or other foreign regulatory authorities could adversely affect our reputation or commercialization of our products and adversely and materially affect our business and operating results.

We intend to continue to bring in-house the manufacturing of certain of our products that are currently manufactured by third parties. Should we encounter difficulties in manufacturing these or other products, it could adversely affect our business.

We intend to continue our initiative to bring in-house the manufacturing of certain of our products, including in particular our Ascend and Simpliciti shoulder products. The technology and the manufacturing process for our shoulder products is highly complex, involving a large number of unique parts, and we may encounter difficulties in manufacturing these products in-house. There is no assurance that we will be able to meet the volume and quality requirements associated with our shoulder products. In addition, other products that we choose to bring in-house could encounter similar difficulties. Manufacturing and product quality issues may also arise as we increase the scale of our production. If our products do not consistently meet our customers’ performance expectations, our reputation may be harmed, and we may be unable to generate sufficient revenue to become profitable. Any delay or inability in bringing in-house the manufacturing of our products could diminish our ability to sell our products, which could result in lost revenue and seriously harm our business, financial condition and results from discontinued operations since legacy Wright retained responsibility, as between it and MicroPort, for these claims.

Although we believe the use of corporate entities in our corporate structure will preclude creditors of any one particular entity within our corporate structure from reaching the assets of the other entities within our corporate structure not liable for the underlying claims of the one particular entity, there is a risk that, despite our corporate structure, creditors could be successful in piercing the corporate veil and reaching the assets of such other entities, which could have an adverse effect on us and our operating results.

results, results from discontinued operations, and financial condition.

We maintain separate legal entities within our overall corporate structure. We believe our ring-fenced structure with separate legal entities should preclude any corporate veil-piercing, alter ego, control person, or other similar claims by creditors of any one particular entity within our corporate structure from reaching the assets of the other entities within our corporate structure to satisfy claims of the one particular entity. However, if a court were to disagree and allow a creditor to pierce the corporate veil and reach the assets of such other entities within our corporate structure, despite such entities not being liable for the underlying claims, it could have a material adverse effect on us and our operating results, results from discontinued operations, and financial condition.

Failure to comply with the U.S. Foreign Corrupt Practices Act or other anticorruption laws could subject us to, among other things, penalties and legal expenses that could harm our reputation and have a material adverse effect on our business, operating results and financial conditioncondition.
Our international operations expose us to legal and operating results.

regulatory risks. These risks include the risk that our international distributors could engage in conduct violative of U.S. or local laws, including the U.S. Foreign Corrupt Practices Act (FCPA). Our U.S. operations, including those of our U.S. based subsidiary, Tornier, Inc.,operating subsidiaries, are currently subject to the U.S. Foreign Corrupt Practices Act. We are required to comply with the FCPA, which generally prohibits covered entities and their intermediaries from engaging in bribery or making other prohibited payments to foreign officials for the purpose of obtaining or retaining business or other benefits. In addition, the FCPA imposes accounting standards and requirements on publicly tradedpublicly-traded U.S. corporations and their foreign affiliates, which are intended to prevent the diversion of corporate funds to the payment of bribes and other improper payments, and to prevent the establishment of “off books” slush funds from which such improper payments can be made. We also are currently subject to similar anticorruptionanti-corruption legislation implemented in Europe under the Organization for Economic Co-operation and Development’s Convention on Combating Bribery of Foreign Public Officials in International Business Transactions. We either operate or plan to operate in a number of jurisdictions that pose a high risk of potential violations of the FCPA and other anticorruptionanti-corruption laws, such as China and Brazil,

and we utilize a number of third-party sales representatives for whose actions we could be held liable under the FCPA. We inform our personnel and third-party sales representatives of the requirements of the FCPA and other anticorruptionanti-corruption laws, including, but not limited to their reporting requirements. We also have developed and will continue to develop and implement systems for formalizing


21


contracting processes, performing due diligence on agents, and improving our recordkeeping and auditing practices regarding these regulations. However, there is no guarantee that our employees, third-party sales representatives, or other agents have not or will not engage in conduct undetected by our processes and for which we might be held responsible under the FCPA or other anticorruptionanti-corruption laws.

Failure to comply with the FCPA or other anti-corruption laws could subject us to, among other things, penalties and legal expenses that could harm our reputation and have a material adverse effect on our business, financial condition, and operating results.

If our employees, third-party sales representatives, or other agents are found to have engaged in such practices, we could suffer severe penalties, including criminal and civil penalties, disgorgement, and other remedial measures, including further changes or enhancements to our procedures, policies and controls, as well as potential personnel changes and disciplinary actions. TheRecent investigations of companies in our industry by the SEC is currentlyand the U.S. Department of Justice have focused on potential FCPA violations in connection with the midstsale of conducting an informal investigation of numerous medical device companies over potential violations of the FCPA. Although we do notdevices in foreign countries. We believe we have compliance systems, which enable us to prevent these behaviors. However, if despite our efforts we are currently anot successful in mitigating these risks, we could become the target anyof enforcement actions by U.S. or local authorities. Any investigation of any potential violations of the FCPA or other anticorruptionanti-corruption laws by U.S. or foreign authorities also could have ana material adverse impacteffect on our business, operating results, and financial condition and operating results.

condition.

Certain foreign companies, including some of our competitors, are not subject to prohibitions as strict as those under the FCPA or, even if subjected to strict prohibitions, such prohibitions may be laxly enforced in practice. If our competitors engage in corruption, extortion, bribery, pay-offs, theft, or other fraudulent practices, they may receive preferential treatment from personnel of some companies, giving our competitors an advantage in securing business, or from government officials, who might give them priority in obtaining new licenses, which would put us at a disadvantage.

A significant portion of our product sales are made through independent distributors and sales agents who we do not control.
A significant portion of our product sales are made through independent sales representatives and distributors. Because the independent distributor often controls the customer relationships within its territory (and, in certain countries outside the United States, the regulatory relationship), there is a risk that if our relationship with the distributor ends, our relationship with the customer will be lost (and, in certain countries outside the United States, that we could experience delays in amending or transferring our product registrations). Also, because we do not control a distributor’s field sales agents, there is a risk we will be unable to ensure that our sales processes, compliance, and other priorities will be consistently communicated and executed by the distributor. If we fail to maintain relationships with our key distributors, or fail to ensure that our distributors adhere to our sales processes, compliance, and other priorities, this could have an adverse effect on our operations. In the past, we have experienced turnover within our independent distributor organization. This adversely affected our short-term financial results as we transitioned to direct sales employees or new independent representatives. In addition, legacy Tornier recently transitioned to direct selling models in certain geographies and recently transitioned its U.S. sales channel towards focusing separately on upper and lower extremities products. While we believe these transitions were managed effectively and position us to leverage our sales force and broad portfolio, there is a risk that these or future transitions could have a greater adverse effect on our operations than we have previously experienced or anticipate. Further, the legacy independent distributors and sales agents of Wright and Tornier may decide not to renew or may decide to seek to terminate, change and/or renegotiate their relationships with us as a result of the merger. A loss of a significant number of our distributors or agents could have a material adverse effect on our business and results of operations.
In addition, our success is partially dependent upon our ability to retain and motivate our distributors, independent sales agencies, and their representatives to sell our products in certain territories. They may not be successful in implementing our marketing plans. Some of our distributors and independent sales agencies do not sell our products exclusively and may offer similar products from other orthopaedic companies. Our distributors and independent sales agencies may terminate their contracts with us, may devote insufficient sales efforts to our products, or may focus their sales efforts on other products that produce greater commissions for them, which could have an adverse effect on our operations and operating results.
Allegations of wrongdoing by the United States Department of Justice and Office of the Inspector General of the United States Department of Health and Human Services and related publicity could lead to further governmental investigations or actions by other third parties.
As a result of the allegations of wrongdoing made by the United States Attorney’s Office for the District of New Jersey and the publicity surrounding legacy Wright's settlement with the United States Department of Justice and OIG-HHS, and amendments to the Deferred Prosecution Agreement and Corporate Integrity Agreement, other governmental agencies, including state authorities, could conduct investigations or institute proceedings that are not precluded by the terms of settlements reflected in the Deferred Prosecution Agreement and the CIA. In August 2012, legacy Wright received a subpoena

22


from the United States Attorney’s Office for the Western District of Tennessee requesting records and documentation relating to the PROFEMUR® series of hip replacement devices for the period from January 1, 2000 to August 2, 2012. These interactions with the authorities could increase our exposure to lawsuits by potential whistleblowers, including under the U.S. Federal False Claims Act, based on new theories or allegations arising from the allegations made by the United States Attorney’s Office for the District of New Jersey. The costs of defending or resolving any such investigations or proceedings could have a material adverse effect on our financial condition, operating results and cash flows.
If we lose any existing or future intellectual property lawsuits, a court could require us to pay significant damages or prevent us from selling our products.
The medical device industry is litigious with respect to patents and other intellectual property rights. Companies in the medical device industry have used intellectual property litigation to gain a competitive advantage.
We are party to claims and lawsuits involving patents or other intellectual property. Legal proceedings, regardless of the outcome, could drain our financial resources and divert the time and effort of our management. If we lose one of these proceedings, a court, or a similar foreign governing body, could require us to pay significant damages to third parties, indemnify third parties from loss, require us to seek licenses from third parties, pay ongoing royalties, redesign our products, or prevent us from manufacturing, using or selling our products. In addition to being costly, protracted litigation to defend or prosecute our intellectual property rights could result in our customers or potential customers deferring or limiting their purchase or use of the affected products until resolution of the litigation.
If our patents and other intellectual property rights do not adequately protect our products, we may lose market share to our competitors and be unable to operate our business profitably.
We rely on patents, trade secrets, copyrights, know-how, trademarks, license agreements, and contractual provisions to establish our intellectual property rights and protect our products. These legal means, however, afford only limited protection and may not completely protect our rights. In addition, we cannot be assured that any of our pending patent applications will issue. The U.S. Patent and Trademark Office may deny or require a significant narrowing of the claims in its pending patent applications and the patents issuing from such applications. Any patents issuing from the pending patent applications may not provide us with significant commercial protection. We could incur substantial costs in proceedings before the U.S. Patent and Trademark Office. These proceedings could result in adverse decisions as to the priority of our inventions and the narrowing or invalidation of claims in issued patents. In addition, the laws of some of the countries in which our products are or may be sold may not protect our intellectual property to the same extent as U.S. laws or at all. We also may be unable to protect our rights in trade secrets and unpatented proprietary technology in these countries.
In addition, we hold licenses from third parties that are necessary to utilize certain technologies used in the design and manufacturing of some of our products. The loss of such licenses would prevent us from manufacturing, marketing, and selling these products, which could harm our business. If we, or the other parties from whom we would license intellectual property, fail to obtain and maintain adequate patent or other intellectual property protection for intellectual property used in our products, or if any protection is reduced or eliminated, others could use the intellectual property used in our products, resulting in harm to our competitive business position.
We seek to protect our trade secrets, know-how, and other unpatented proprietary technology, in part, with confidentiality agreements with our employees, independent distributors, and consultants. We cannot be assured, however, that the agreements will not be breached, adequate remedies for any breach would be available, or our trade secrets, know-how, and other unpatented proprietary technology will not otherwise become known to or independently developed by our competitors.
If we lose one of our key suppliers, we may be unable to meet customer orders for our products in a timely manner or within our budget.

budget, which could adversely affect our sales and operating results.

We usehave relied on a limited number of suppliers for raw materials and selectthe components that we need to manufactureused in our products. These suppliers must provide the materialsOur reconstructive joint devices are produced from various surgical grades of titanium, cobalt chrome, stainless steel, various grades of high-density polyethylenes and components to our standards for us to meet our quality and regulatory requirements.ceramics. We obtain some key raw materials and select components from a single source or a limited number of sources. For example, we relyhave relied on one supplier for raw materials and select components in several of our products, including Poco Graphite, Inc., which supplies graphite for our pyrocarbon products; CeramTec AG, or CeramTec, which supplies ceramic for ceramic heads for hips; and Heymark Metals Ltd., which supplies Cobalt Chrome used in certain of our hip, shoulder and elbow products. Establishing additional or replacement suppliers for these components, and obtaining regulatory clearances or approvals that may result from adding or replacing suppliers, could take a substantial amount of time, result in increased costs and impair our ability to produce our products, which would adversely impact our business and operating results. We do not have contracts with our sole source suppliers (other than a Quality Assurance Agreement and Secrecy Agreement with CeramTec, which only relate to quality and confidentiality obligations of the parties and do not govern the purchase and receipt of CeramTec products) and instead rely on purchase orders. As a result, those suppliers may elect not to supply us with product or to supply us with less product than we need, and we will have limited rights to cause them to do otherwise. In addition,a certain grade of cobalt chrome alloy, one supplier for the silicone elastomer used in some of our extremities products, one supplier for our pyrocarbon products, and one supplier to provide a key ingredient of AUGMENT® Bone Graft. The manufacture of our products is highly exacting and complex, and our business could suffer if a sole source supply arrangement is unexpectedly terminated or interrupted, and we are unable to obtain an acceptable new source of supply in a timely fashion.

23


In December 2013, we received written notice from Novartis of its intent to terminate, effective December 1, 2015, the exclusive supply agreement under which we acquirepurchase from third parties, are highly technical and areNovartis purified bulk recombinant human platelet-derived growth factor (rhPDGF-BB), which is a key component of AUGMENT® Bone Graft. Our supplier was contractually required to meet exacting specifications,our supply requirements until the termination date, and any quality control problems that we experienceto use commercially reasonable efforts to assist us in identifying a new supplier and support the transfer of technology and supporting documentation to produce this component. Our transition to a new supplier is well underway with respect tofull cooperation from the products supplied by third parties could adversely and materially affect our reputation or commercialization of our products and adversely and materially affect our business, operating results and prospects. Furthermore, some of these suppliers are smaller companies. To the extent that any of these suppliers are, or become, undercapitalized and do not otherwise have sufficient resources to continue operations or to supply us sufficient product without additional access to capital, such a failure could adversely affect our business. We also may have difficulty obtaining similar components from other suppliers that are acceptable to the FDA, the competent authorities or notified bodies of the Member States of the EEA, or foreign regulatory authorities and the failure of our suppliers to comply with strictly enforced regulatory requirements could expose us to regulatory action including warning letters, product recalls, termination of distribution, product seizures or civil penalties. Furthermore, since many of these suppliers are located outside of the United States, we are subject to foreign export laws and U.S. import and customs regulations, which complicate and could delay shipments of components to us. For example, all foreign importers of medical devices are required to meet applicable FDA requirements, including registration of establishment, listing of devices, manufacturing in accordance with the quality system regulation, medical device reporting of adverse events, and premarket notification 510(k) clearance or PMA, if applicable. In addition, all imported medical devices also must meet Bureau of Customs and Border Protection requirements. While it is our policy to maintain sufficient inventory of materials and components so that our production will not be significantly disrupted even if a particular component or material is not available for a period of time, we remain at risk that we will not be able to qualify new components or materials quickly enough to prevent a disruption if one or more of our suppliers ceases production of important components or materials.

Sales volumes may fluctuate depending on the season and our operating results may fluctuate over the course of the year.

Our business is seasonal in nature. Historically, demand for our products has been the lowest in our third quarter as a result of the European holiday schedule during the summer months. We have experienced and expect to continue to experience meaningful variability in our revenue and gross profit among quarters,current as well as within each quarter,the new supplier. We believe the current supplier has produced sufficient product to meet our production needs for the interim period until a new supplier is brought on line.

Our biologic product line includes a single sourced supplier for our GRAFTJACKET® family of soft tissue repair and graft containment products. In addition, certain biologic products depend upon a single supplier as a result of a number of factors, including, among other things:

the numberour source for demineralized bone matrix (DBM) and mix of products sold in the quartercancellous bone matrix (CBM), and the geographies in which they are sold;

the demand for, and pricing of, our products and the products of our competitors;

the timing of orany failure to obtain DBM and CBM from this source in a timely manner will deplete levels of on-hand raw materials inventory and could interfere with our ability to process and distribute allograft products. We rely on a single not-for-profit tissue bank to meet all of our DBM and CBM order requirements, a key component in the allograft products we currently produce, market, and distribute. In addition, we rely on a single supplier of soft tissue graft for BIOTAPE® XM.

We cannot be sure that our supply of DBM, CBM and soft tissue graft for BIOTAPE® XM will continue to be available at current levels or will be sufficient to meet our needs, or that future suppliers of DBM, CBM, and soft tissue graft for BIOTAPE® XM will be free from FDA regulatory clearances or approvals for products;

costs, benefits and timing of new product introductions;

the level of competition;

the timing and extent of promotional pricing or volume discounts;

changes in average selling prices;

the availability and cost of components and materials;

the number of selling days;

fluctuations in foreign currency exchange rates

the timing of patients’ use ofaction impacting their calendar year medical insurance deductibles; and

impairment and other special charges.

If product liability lawsuits are brought against us, our business may be harmed.

The manufacture and sale of orthopaedic medical devices exposes us to significant risk of product liability claims. In the past, we have hadDBM, CBM and soft tissue graft for BIOTAPE® XM. As there are a small number of product liability claims relatingsuppliers, if we cannot continue to obtain DBM, CBM, and soft tissue graft for BIOTAPE® XM from our products, none of which either individually, orcurrent sources in the aggregate, have resulted in a material negative impact onvolumes sufficient to meet our business. In the future, we may be subject to additional product liability claims, some of which may have a negative impact on our business. Such claims could divert our management from pursuing our business strategy and may be costly to defend. Regardless of the merit or eventual outcome, product liability claims may result in:

decreased demand for our products;

injury to our reputation;

significant litigation costs;

substantial monetary awards to or costly settlements with patients;

product recalls;

loss of revenue; and

the inability to commercialize new products or product candidates.

Our existing product liability insurance coverage may be inadequate to protect us from any liabilities we might incur. If a product liability claim or series of claims is brought against us for uninsured liabilities or in excess of our insurance coverage, our business and operating results could suffer. In addition, a recall of some of our products, whether or not the result of a product liability claim, could result in significant costs and loss of customers.

In addition,needs, we may not be able to maintain insurance coveragelocate replacement sources of DBM, CBM, and soft tissue graft for BIOTAPE® XM on commercially reasonable terms, if at a reasonable cost or in sufficient amounts or scope to protect us against losses. Any claims against us, regardless of their merit,all. This could severely harminterrupt our financial condition, strain our management and other resources andbusiness, which could adversely affect our sales.

Suppliers of raw materials and components may decide, or eliminatebe required, for reasons beyond our control to cease supplying raw materials and components to us. FDA regulations may require additional testing of any raw materials or components from new suppliers prior to our use of these materials or components, and in the prospects for commercialization or salescase of a productdevice with a PMA application, we may be required to obtain prior FDA permission, either of which could delay or product candidate which is the subjectprevent our access to or use of any such claim.

Our inabilityraw materials or components.

We are dependent on various information technology systems, and failures of, interruptions to, maintain adequate working relationships with external research and development consultants and surgeonsor unauthorized tampering of those systems could have a negative impactmaterial adverse effect on our business.
We rely extensively on information technology systems to conduct business. These systems include, but are not limited to, ordering and managing materials from suppliers, converting materials to finished products, shipping products to customers, processing transactions, summarizing and reporting results of operations, complying with regulatory, legal or tax requirements, and providing data security and other processes necessary to manage our business. Legacy Tornier recently implemented a new enterprise resource planning system (ERP) across its significant operating locations. As a result of this recent implementation and the recently completed Wright/Tornier merger, we may experience difficulties in our business operations, or difficulties in operating our business under the ERP, either of which could disrupt our operations, including our ability to markettimely ship and sell new products.

We maintain professional working relationships with external researchtrack product orders, project inventory requirements, manage our supply chain, and development consultantsotherwise adequately service our customers, and leading surgeons and medical personnel in hospitals and universities who assist in product research and development and training. We continuelead to emphasize the development of proprietary products and product improvements to complement and expand our existing product lines. It is possible that U.S. federal and state laws requiring us to disclose payments or other transfers of value, such as free gifts or meals, to physiciansincreased costs and other healthcare providers could have a chilling effect on these relationships with individuals or entities that may, among other things, want to avoid public scrutiny of their financial relationships with us. Ifdifficulties. In the event we are unable to maintain these relationships, our ability to develop and sell new and improved

products could decrease, and our future operating results could be unfavorably affected.

In November 2012, Douglas W. Kohrs, our former President and Chief Executive Officer, resignedexperience significant disruptions as a director, officerresult of the ERP implementation or otherwise, we may not be able to fix our systems in an efficient and employee of Tornier. Mr. Kohrs had built strong relationships with severaltimely manner. Accordingly, such events may disrupt or reduce the efficiency of our key research and development consultants and surgeons and medical personnel in hospitals and universities who assist in product research and development and training. Accordingly, this change in our senior management may adversely affect our relationships with these individualsentire operations and have a material adverse effect on our business.

We incur significant expendituresoperating results and cash flows. In addition, if our systems are damaged or cease to function properly due to any number of resourcescauses, ranging from catastrophic events to maintain relatively high levels of inventorypower outages to security breaches, and instruments, which can reduce our cash flows.

As a result of the need to maintain substantial levels of inventory and instruments, we are subject to the risk of obsolescence. The nature of our business requires us to maintain a substantial level of inventory and instruments. For example, our total consolidated inventory balance was $86.7 million at December 30, 2012 and our total consolidated instrument balance was $51.4 million at December 30, 2012. In order to marketcontinuity plans do not effectively we often must maintain and bring our customers instrument kits, back-up products and products of different sizes. In the event that a substantial portion of our inventory becomes obsolete, it could have a material adverse effect on our earnings and cash flows due to the resulting costs associated with the inventory impairment charges and costs required to replace such inventory.

Our recent acquisition of OrthoHelix and any additional acquisitions and efforts to acquire and integrate other companies or product lines could adversely affect our operations and financial results.

On October 4, 2012, we acquired OrthoHelix, a privately-held company focused on developing and marketing specialty implantable screw and plate systems for the repair of small bone fractures and deformities predominantly in the foot and ankle. In addition,compensate timely, we may pursue additional acquisitions of other companies or product lines. A successful acquisition depends onsuffer interruptions in our ability to identify, negotiate, complete and integrate such acquisition and to obtain any necessary financing. With respect to our recent acquisition of OrthoHelix and any future acquisitions, we may experience:

difficulties in integrating OrthoHelix and its personnel and products, as well as the personnel and products of any other acquired companies, into our existing business;

difficulties in integrating OrthoHelix’s and Tornier’s commercial organizations, including in particular distribution and sales representative arrangements;

difficulties or delays in realizing the anticipated benefits of our acquisition of OrthoHelix or any additional acquired companies and their products;

diversion of our management’s time and attention from other business concerns;

challenges due to limited or no direct prior experience in new markets or countries we may enter;

the potential loss of key employees, including in particular sales and research and development personnel, of our company, OrthoHelix or any other business we may acquire;

the potential loss of key customers, distributors, representatives, vendors and other business partners who choose not to do business with our company post-acquisition;

inability to effectively coordinate sales and marketing efforts to communicate our capabilities post-acquisition and coordinate sales organizations to sell our combined products;

inability to successfully develop new products and services on a timely basis that address our new market opportunities post-acquisition;

inability to compete effectively against companies already serving the broader market opportunities expected to be available to us post-acquisition;

difficulties in the assimilation of different corporate cultures, practices and sales and distribution methodologies, as well as in the assimilation and retention of geographically dispersed, decentralized operations and personnel;

unanticipated costs, litigation and other contingent liabilities;

incurrence of acquisition and integration related costs, accounting charges, or amortization costs for acquired intangible assets;

potential write-down of goodwill, acquired intangible assets and/or deferred tax assets;

additional legal, financial and accounting challenges and complexities in areas such as intellectual property, tax planning, cash management and financial reporting and

any unforeseen compliance risks and accompanying financial and reputational exposure/loss not uncovered in the due diligence process and which are imputed to Tornier such as compliance with federal laws and

regulations the advertising and promotion regulations under the federal Food, Drug and Cosmetic Act, the Anti-kickback Statute, the False Claims Act, the Physician Sunshine Payments Act and other applicable state laws.

In addition, we may have to incur debt or issue equity securities to pay for any future acquisition, the issuance of which could involve restrictive covenants or be dilutive to our existing shareholders. Acquisitions also could materially impair our operating results by requiring us to amortize acquired assets. For example, as a result of our acquisition of OrthoHelix, we incurred additional indebtedness, including two senior secured term loans in the aggregate principal amount of $115.0 million. The proceeds of the term loans were used to fund our acquisition of OrthoHelix and retire certain then existing indebtedness.

In addition, effective internal controls are necessary for us to provide reliable and accurate financial reports and to effectively prevent fraud. The integration of acquired businesses is likely to result in our systems and controls becoming increasingly complex and more difficult to manage. We devote significant resources and time to comply with the internal control over financial reporting requirements of the Sarbanes-Oxley Act of 2002. However, we cannot be certain that these measures will ensure that we design, implement and maintain adequate control over our financial processes and reporting in the future, especially in the context of acquisitions of other businesses. Any difficulties in the assimilation of acquired businesses into our control system could harm our operating results or cause us to fail to meet our financial reporting obligations. Inferior internal controls could also cause investors to lose confidence in our reported financial information, which could have a negative effect on the trading price of our stock and our access to capital.

All of the risks described above may be exacerbated if we effect multiple acquisitions during a short period of time.

If we do not achieve the contemplated benefits of our acquisition of OrthoHelix, our business and financial condition may be materially impaired.

We may not achieve the desired benefits from our recent acquisition of OrthoHelix. For any of the reasons described above and elsewhere in this report and even if we are able to successfully operate OrthoHelix within our company, we may not be able to realize the revenue and other synergies and growth that we anticipate from the acquisition in the time frame that we currently expect, and the costs of achieving these benefits may be higher than what we currently expect, because of a number of risks, including, but not limited to:

the possibility that the acquisition may not further our business strategy as we expected;

the possibility that we may not be able to expand the reach and customer base for OrthoHelix’s products as expected;

the possibility that we may not be able to expand the reach and customer base for our products as expected; and

the fact that the acquisition will substantially expand our lower extremity joints and trauma business, and we may not experience anticipated growth in that market.

As a result of these risks, the OrthoHelix acquisition may not contribute to our earnings as expected, we may not achieve expected revenue synergies or our return on invested capital targets when expected, or at all, and we may not achieve the other anticipated strategic and financial benefits of the transaction.

We have experienced recently certain changes in our senior management which could cause certain key employees to depart because of difficulties with change or a desire not to remain with our company. If we cannot retain our key personnel, we may not be able to manage and operate successfully, and we may not be able to meet our strategic objectives.

In November 2012, Douglas W. Kohrs, our former President and Chief Executive Officer, resigned as a director, officer and employee of Tornier. Mr. Kohrs had built strong relationships with several of our key employees and other personnel. On November 12, 2012, we appointed David H. Mowry as Interim President and Chief Executive Officer, and in February 2013, Mr. Mowry was appointed President and Chief Executive Officer on a non-interim basis. In September 2012, our Chief Financial Officer joined Tornier after the former Global Chief Financial Officer resigned in July 2012. Our future success depends, in large part, upon our ability to retain and motivate our management team and key managerial, scientific, sales and technical personnel. Key personnel may depart because of difficulties with change or a desire not to remain with our company. Any unanticipated loss or interruption of services of our management team and our key personnel could significantly reduce our ability to meet our strategic objectives because it may not be possible for us to find appropriate replacement personnel should the need arise. We compete for such personnel with other companies, academic institutions, governmental entities and other organizations. There is no guarantee that we will be successful in retaining our current personnel or in hiring or retaining qualified personnel in the future. Loss of key personnel or the inability to hire or retain

qualified personnel in the future could have a material adverse effect on our ability to operate successfully. Further, any inability on our part to enforce non-compete arrangements related to key personnel who have left the company could have a material adverse effect on our business.

operations.

Fluctuations in insurance cost and availability could adversely affect our profitability or our risk management profile.

We hold a number of insurance policies, including product liability insurance, directors’ and officers’ liability insurance, property insurance, and workers’ compensation insurance. If the costs of maintaining adequate insurance coverage should increase significantly in the future, our operating results could be materially adversely affected.impacted. Likewise, if any of our current insurance coverage should become unavailable to us or become economically impractical, we would be required to operate our business without indemnity from commercial insurance providers.

If a natural or man-made disaster, including as a result


24

Table of climate change or weather, adversely affects our manufacturing facilities or distribution channels, we could be unable to manufacture or distribute our products for a substantial amount of time and our revenue could decline.

We principally rely on three manufacturing facilities, two of which are in France and one of which is in Ireland. The facilities and the manufacturing equipment we use to produce our products would be difficult to replace and could require substantial lead-time to repair or replace. For example, the machinery associated with our manufacturing of pyrocarbon in one of our French facilities is highly specialized and would take substantial lead-time and resources to replace. We also maintain a facility in Bloomington, Minnesota, and a warehouse in Montbonnot, France, both of which contain large amounts of our inventory. Our facilities, warehouses or distribution channels may be affected by natural or man-made disasters. Further, such may be exacerbated by climate change, as some scientists have concluded that climate change could result in the increased severity of and perhaps more frequent occurrence of extreme weather patterns. For example, in the event of a tornado at one of our warehouses, we may lose substantial amounts of inventory that would be difficult to replace. In the event our facilities, warehouses or distribution channels are affected by a disaster, we would be forced to rely on, among others, third-party manufacturers and alternative warehouse space and distribution channels, which may or may not be available, and our revenue could decline. Although we believe we possess adequate insurance for damageContents


Modifications to our property and the disruption of our business from casualties, such insurance may not be sufficient to cover all of our potential losses and may not continue to be available to us on acceptable terms or at all.

We may be unable to raise capital when needed, which would force us to delay, reduce, eliminate or abandon our commercialization efforts or product development programs.

There is no guarantee that our anticipated cash flow from operations will be sufficient to meet all of our cash requirements. We intend to continue to make investments to support our business growth andmarketed devices may require additional funds to:

expand the commercialization of our products;

fund our operations and clinical trials;

continue our research and development;

defend, in litigation or otherwise, any claims that we infringe third-party patents or other intellectual property rights and enforce our patent and other intellectual property rights;

commercialize our new products, if any such products receive regulatory clearance or approval for commercial sale; and

acquire companies and in-license products or intellectual property.

We believe that our cash and cash equivalents balance of $31.1 million as of December 30, 2012, anticipated cash receipts generated from revenue of our products and available credit under our $30.0 million senior secured revolving credit facility, will be sufficient to meet our anticipated cash requirements for 2013. However, our future funding requirements will depend on many factors, including:

market acceptance of our products;

the scope, rate of progress and cost of our clinical trials;

the cost of our research and development activities;

the cost of filing and prosecuting patent applications and defending and enforcing our patent and other intellectual property rights;

the cost of defending, in litigation or otherwise, any claims that we infringe third-party patent or other intellectual property rights;

the cost of defending any claims of product liability, or other claims against us, such as contract liabilities;

the cost and timing of additional regulatory clearances or approvals;

the cost and timing of expanding our sales, marketing and distribution capabilities;

the cost and timing of expanding our product offering inventories;

our ability to collect amounts receivable from customers;

the effect of competing technological and market developments; and

the extent to which we acquire or invest in additional businesses, products and technologies, although we currently have no commitments or agreements relating to any of these types of transactions.

In the event that we would require additional working capital to fund future operations, we could seek to acquire that through additional equity or debt financing arrangements which may or may not be available on favorable terms at such time. If we raise additional funds by issuing equity securities, our shareholders may experience dilution. Debt financing, if available, may involve covenants restricting our operations or our ability to incur additional debt, in addition to those under our existing credit facilities. Any debt financing or additional equity that we raise may contain terms that are not favorable to us or our shareholders. If we do not have, or are not able to obtain, sufficient funds, we may have to delay development or commercialization of our products or license to third parties the rights to commercialize products or technologies that we would otherwise seek to commercialize. We also may have to reduce marketing, customer support or other resources devoted to our products or cease operations.

Any lack of borrowing availability under our credit facility and our potential inability to obtain replacement sources of credit could materially affect our operations and financial condition.

Although we currently have available credit under our $30.0 million senior secured revolving credit facility, our ability to draw on our credit facility may be limited by outstanding letters of credit or by operating and financial covenants under our the credit agreement. There can be no assurances that we will continue to have access to credit if our operating and financial performance do not satisfy these covenants. If we do not satisfy these criteria, and if we are unable to secure necessary waivers or other amendments from the lenders of our credit facility, we will not have access to this credit.

Both the $30.0 million revolving credit facility and the aggregate $115.0 million of term loans under our credit agreement are secured by all of our assets (subject to certain exceptions) and except to the extent otherwise permitted under the terms of our credit agreement, our assets cannot be pledged as security for other indebtedness. These limits on our ability to offer collateral to other sources of financing could limit our ability to obtain other financing which could materially affect our operations and financial condition.

Although we believe that our anticipated operating cash flows, on-hand cash levels and access to credit will give us the ability to meet our financing needs for at least the next 12 months, there can be no assurance that they will do so. Any lack of borrowing availability under our revolving credit facility and our potential inability to obtain replacement sources of credit could materially affect our operations and financial condition.

We are leveraged financially, which could adversely affect our ability to adjust our business to respond to competitive pressures and to obtain sufficient funds to satisfy our future research and development needs, to protect and enforce our intellectual property and other needs.

We have significant indebtedness. In connection with our acquisition of OrthoHelix, we obtained senior secured term loans in the aggregate principal amount of $115.0 million and a senior secured $30.0 million revolving line of credit. The degree to which we are leveraged could have important consequences, including, but not limited to, the following:

our ability to obtain additional financing in the future for working capital, capital expenditures, acquisitions, litigation, general corporate or other purposes may be limited;

a substantial portion of our cash flows from operations in the future will be dedicated to the payment of principal and interest on our indebtedness, including the requirement that certain excess cash flows and certain net proceeds of asset dispositions (including from condemnation or casualty) and certain new indebtedness be applied to prepayment of our senior secured terms loans; and

we may be more vulnerable to economic downturns, less able to withstand competitive pressures and less flexible in responding to changing business and economic conditions.

A failure to comply with the covenants and other provisions of our credit agreement could result in events of default under such agreement, which could require the immediate repayment of our outstanding indebtedness. If we are at any time unable to generate sufficient cash flows from operations to service our indebtedness when payment is due, we may be required to attempt to renegotiate the terms of the agreements relating to the indebtedness, seek to refinance all or a portion of the indebtedness or obtain additional financing. There can be no assurance that we will be able to successfully renegotiate such terms, that any such refinancing would be possible or that any additional financing could be obtained on terms that are favorable or acceptable to us.

Our credit agreement contains restrictive covenants that may limit our operating flexibility.

The agreement relating to our senior secured term loans and senior secured revolving credit facility contains operating covenants limiting our ability to transfer or dispose of assets, merge with or acquire other companies, make investments, pay dividends, incur additional indebtedness and liens, make capital expenditures and conduct transactions with affiliates, and financial covenants requiring us to meet certain financial ratios. We, therefore, may not be able to engage in any of the foregoing transactions or in any that would cause us to breach these financial covenants until our current debt obligations are paid in full or we obtain the consent of the lenders. There is no guarantee that we will be able to generate sufficient cash flow or revenue to meet these operating and financial covenants or pay the principal and interest on our debt. Furthermore, there is no guarantee that future working capital, borrowings or equity financing will be available to repay or refinance any such debt.

As a result of our acquisition of OrthoHelix, we may be required to make future earn-out payments of up to an aggregate of $20.0 million based upon our sales of lower extremity joints and trauma products during fiscal years 2013 and 2014, which payments may affect our liquidity and our operating results.

In connection with our recent acquisition of OrthoHelix, we agreed to made additional earn-out payments of up to an aggregate of $20.0 million in cash based upon our sales of lower extremity joints and trauma products during fiscal years 2013 and 2014. A portion of the earn-out payments will be subject to certain rights of set-off for post-closing indemnification obligations of OrthoHelix’s equity holders. If we are required to make these payments, particularly at a time when we are experiencing financial difficulty, our liquidity, operating results and financial condition may be adversely affected.

Our operating results could be negatively impacted by future changes in the allocation of income to each of the entities through which we operate and to each of the income tax jurisdictions in which we operate.

We operate through multiple entities and in multiple income tax jurisdictions with different income tax rates both inside and outside the United States and the Netherlands. Accordingly, our management must determine the appropriate allocation of income to each such entity and each of these jurisdictions. Income tax audits associated with the allocation of this income and other complex issues, including inventory transfer pricing and cost sharing and product royalty arrangements, may require an extended period of time to resolve and may result in income tax adjustments if changes to the income allocation are required. Since income tax adjustments in certain jurisdictions can be significant, our future operating results could be negatively impacted by settlement of these matters.

Future changes in technology or market conditions could result in adjustments to our recorded asset balance for intangible assets, including goodwill, resulting in additional charges that could significantly impact our operating results.

Our consolidated balance sheet includes significant intangible assets, including $239.8 million in goodwill and $126.6 million in other acquired intangible assets, together representing 56% of our total assets. The determination of related estimated useful lives and whether these assets are impaired involves significant judgments. Our ability to accurately predict future cash flows related to these intangible assets may be adversely affected by unforeseen and uncontrollable events. In the highly competitive medical device industry, new technologies could impair the value of our intangible assets if they create market conditions that adversely affect the competitiveness of our products. We test our goodwill for impairment in the fourth quarter of each year, but we also test goodwill and other intangible assets for impairment at any time when there is a change in circumstances that indicates that the carrying value of these assets may be impaired. Any future determination that these assets are carried at greater than their fair value could result in substantial non-cash impairment charges, which could significantly impact our reported operating results.

If reimbursement from third-party payors for our products becomes inadequate, surgeons and patients may be reluctant to use our products and our revenue may decline.

In the United States, healthcare providers who purchase our products generally rely on third-party payors,

principally federal Medicare, state Medicaid and private health insurance plans, to pay for all or a portion of the cost of joint reconstructive procedures and products utilized in those procedures. We may be unable to sell our products on a profitable basis if third-party payors deny coverage or reduce their current levels of reimbursement. Our revenue depends largely on governmental healthcare programs and private health insurers reimbursing patients’ medical expenses. As part of the Budget Control Act passed in August 2011 to extend the federal debt limit and reduce government spending, $1.2 trillion in automatic spending cuts (known as sequestration) over the next decade are due to go into effect, beginning in 2013, in the absence of further legislative action. Half of the automatic reductions would come from lowering the caps imposed on non-defense discretionary spending and cutting domestic entitlement programs, including reductions in payments to Medicare providers. Any such reductions in government healthcare spending could result in reduced demand for our products or additional pricing pressure.

To contain costs of new technologies, third-party payors are increasingly scrutinizing new treatment modalities by requiring extensive evidence of clinical outcomes and cost-effectiveness. Currently, we are aware of several private insurers who have issued policies that classify procedures using our Salto Talaris Prosthesis and Conical Subtalar Implants as experimental or investigational and denied coverage and reimbursement for such procedures. Surgeons, hospitals and other healthcare providers may not purchase our products if they do not receive satisfactory reimbursement from these third-party payors for the cost of the procedures using our products. Payors continue to review their coverage policies carefully for existing and new therapies and can, without notice, deny coverage for treatments that include the use of our products. If we are not successful in reversing existing non-coverage policies or other private insurers issue similar policies, this could have a material adverse effect on our business and operations.

In addition, some healthcare providers in the United States have adopted or are considering a managed care system in which the providers contract to provide comprehensive healthcare for a fixed cost per person. Healthcare providers may attempt to control costs by authorizing fewer elective surgical procedures, including joint reconstructive surgeries, or by requiring the use of the least expensive implant available. Additionally, there is a significant likelihood of reform of the U.S. healthcare system, and changes in reimbursement policies or healthcare cost containment initiatives that limit or restrict reimbursement for our products may cause our revenue to decline.

If adequate levels of reimbursement from third-party payors outside of the United States are not obtained, international revenue of our products may decline. Outside of the United States, reimbursement systems vary significantly by country. Many foreign markets have government-managed healthcare systems that govern reimbursement for orthopaedic medical devices and procedures. Additionally, some foreign reimbursement systems provide for limited payments in a given period and therefore result in extended payment periods.

Consolidation in the healthcare industry could lead to demands for price concessions or to the exclusion of some suppliers from certain of our markets, which could have an adverse effect on our business, financial condition or operating results.

Because healthcare costs have risen significantly over the past decade, numerous initiatives and reforms initiated by legislators, regulators and third-party payors to curb these costs have resulted in a consolidation trend in the healthcare industry to create new companies with greater market power, including hospitals. As the healthcare industry consolidates, competition to provide products and services to industry participants has become and will continue to become more intense. This in turn has resulted and likely will continue to result in greater pricing pressures and the exclusion of certain suppliers from important market segments as group purchasing organizations, independent delivery networks and large single accounts continue to use their market power to consolidate purchasing decisions for some of our customers. We expect that market demand, government regulation, third-party reimbursement policies and societal pressures will continue to change the worldwide healthcare industry, resulting in further business consolidations and alliances among our customers, which may reduce competition, exert further downward pressure on the prices of our products and may adversely impact our business, financial condition or operating results.

If we experience significant disruptions in our information technology systems, our business may be adversely affected.

We depend on our information technology systems for the efficient functioning of our business, including accounting, data storage, purchasing and inventory management. Currently, we have a non-interconnected information technology system; however, we have undertaken planning for the implementation of an upgrade of our systems, which could include the implementation of a new global enterprise resource planning system (ERP). We expect that this upgrade will take two to three years to implement; however, when complete it should enable management to better and more efficiently conduct our operations and gather, analyze, and assess information across all of our business and geographic locations. This upgrade will require the investment of significant human and financial resources. We may experience difficulties in implementing this upgrade in our business operations, or difficulties in operating our business under this upgrade, either of which could disrupt our operations, including our ability to timely ship and track product orders, project inventory

requirements, manage our supply chain, and otherwise adequately service our customers, and lead to increased costs and other difficulties. In the event we experience significant disruptions as a result of this implementation of an upgraded information technology system, we may not be able to fix our systems in an efficient and timely manner. Accordingly, such events may disrupt or reduce the efficiency of our entire operation and have a material adverse effect on our operating results and cash flows.

Risks Related to Regulatory Environment

The sale of our products is subject toFDA regulatory clearances or approvals and our business is subject to extensive regulatory requirements. If we fail to maintain regulatory clearances and approvals, or are unable to obtain, or experience significant delays in obtaining, FDA clearances or approvals for our future products or product enhancements, our ability to commercially distribute and market these products could suffer.

Our medical device products and operations are subject to extensive regulation by the FDA and various other federal, state and foreign governmental authorities, such as those of the European Union and the competent authorities of the Member States of the EEA. Government regulation of medical devices is meant to assure their safety and effectiveness, and includes regulation of, among other things:

design, development and manufacturing;

testing, labeling, packaging, content and language of instructions for use, and storage;

clinical trials;

product safety;

premarket clearance and approval;

marketing, sales and distribution;

advertising and promotion;

recordkeeping procedures;

recalls and field corrective actions;

post-market surveillance, including reporting of deaths or serious injuries and malfunctions that, if they were to recur, could lead to death or serious injury; and

product import and export.

Before a new medical device, or a new use of, or claim for, an existing product can be marketed in the United States, it must first receive either premarket clearance under Section 510(k) of the Federal Food, Drug and Cosmetic Act, or FDCA, ade novo approval or a PMA, from the FDA, unless an exemption applies. In the 510(k) clearance process, the FDA must determine that the proposed device is “substantially equivalent” to a device legally on the market, known as a “predicate” device, with respect to intended use, technology and safety and effectiveness to clear the proposed device for marketing. Clinical data is sometimes required to support substantial equivalence. Thede novo path is reserved for devices that are deemed by FDA to be Class II moderate risk devices for which there is no predicate device to which one can claim “substantial equivalence” as with a 510(k). These devices typically require more information for approval and take longer than a 510(k), but require less data and a shorter time period than a PMA approval. A device, once approved under thede novo path, becomes a 510(k) predicate for future devices seeking to call it a “predicate.” The PMA pathway requires an applicant to demonstrate the safety and effectiveness of the device for its intended use based, in part, on extensive data including, but not limited to, technical, preclinical, clinical trial, manufacturing and labeling data. The PMA process is typically required for devices that are deemed to pose the greatest risk, such as life-sustaining, life-supporting or implantable devices. Products that are approved through a PMA application generally need FDA approval before they can be modified. Similarly, some modifications made to products cleared through a 510(k) may require a new 510(k). Both the 510(k) and PMA processes can be expensive and lengthy and entail significant user fees, unless exempt. The FDA’s 510(k) clearance process usually takes from six to 18 months, but may take longer. The PMA pathway is much more costly and uncertain than the 510(k) clearance process and it generally takes from one to five years, or even longer, from the time the application is filed with the FDA until an approval is obtained. The process of obtaining regulatory clearances or approvals to market a medical device can be costly and time-consuming, and we may not be able to obtain these clearances or approvals on a timely basis, if at all.

Most of our currently commercialized products have received premarket clearances under Section 510(k) of the FDCA. If the FDA requires us to go through a lengthier, more rigorous examination for future products or modifications to existing products than we had expected, our product introductions or modifications could be delayed or canceled, which could cause our revenue to decline. In addition, the FDA may determine that future products will require the more costly, lengthy and uncertainde novo or PMA processes. Although we do not currently market any devices underde novo or PMA,

we cannot assure you that the FDA will not demand that we obtain a PMA prior to marketing or that we will be able to obtain the 510(k) clearances with respect to future products.

The FDA can delay, limit or deny clearance or approval of a device for many reasons, including:

we may not be able to demonstrate to the FDA’s satisfaction that our products are safe and effective for their intended users;

the data from our pre-clinical studies and clinical trials may be insufficient to support clearance or approval, where required;

the manufacturing process or facilities we use may not meet applicable requirements; and

changes in FDA clearance or approval policies or the adoption of new regulations may require additional data.

Any delay in, or failure to receive or maintain, clearances or approvals for our products under development could prevent us from generating revenue from these products or achieving profitability. Additionally, the FDA and other governmental authorities have broad enforcement powers. Our failure to comply with applicable regulatory requirements could lead governmental authorities or a court to take action against us, including:

issuing untitled (notice of violation) letters or public warning letters to us;

imposing fines and penalties on us;

obtaining an injunction preventing us from manufacturing or selling our products;

seizing products to prevent sale or transport;

bringing civil or criminal charges against us;

recalling our products;

detaining our products at U.S. Customs;

delaying the introduction of our products into the market;

delaying pending requests for clearance or approval of new uses or modifications to our existing products; or

withdrawing or denying approvals or clearances for our products.

If we fail to obtain and maintain regulatory clearances or approvals, our ability to sell our products and generate revenue will be materially harmed.

Outside of the United States, our medical devices must comply with the laws and regulations of the foreign countries in which they are marketed, and compliance may be costly and time-consuming.

To market and sell our product in countries outside the United States, we must seek and obtain regulatory approvals, certifications or registrations and comply with the laws and regulations of those countries. These laws and regulations, including the requirements for approvals, certifications or registrations and the time required for regulatory review, vary from country to country. Obtaining and maintaining foreign regulatory approvals, certifications or registrations are expensive, and we cannot be certain that we will receive regulatory approvals, certifications or registrations in any foreign country in which we plan to market our products. If we fail to obtain or maintain regulatory approvals, certifications or registrations in any foreign country in which we plan to market our products, our ability to generate revenue will be harmed.

In particular, in the EEA, which is composed of the 27 Member States of the EU plus Liechtenstein, Norway and Iceland, our medical devices must comply with the essential requirements of the EU Medical Devices Directives (Council Directive 93/42/EEC of 14 June 1993 concerning medical devices, as amended, and Council Directive 90/385/EEC of 20 June 2009 relating to active implantable medical devices, as amended). Compliance with these requirements entitles us to affix the CE conformity mark to our medical devices, without which they cannot be marketed in the EEA.

Further, the advertising and promotion of our products is subject to EEA Member States laws implementing Directive 93/42/EEC concerning Medical Devices, or the EU Medical Devices Directive, Directive 2006/114/EC concerning misleading and comparative advertising, and Directive 2005/29/EC on unfair commercial practices, as well as other EEA Member State legislation governing the advertising and promotion of medical devices. These laws may limit or restrict the advertising and promotion of our products to the general public and may impose limitations on our promotional activities with healthcare professionals.

Modifications to our marketed products may require new 510(k) clearances or PMAs, or may require us to cease marketing or recall the modified productsdevices until such additional clearances or approvals are obtained.

The FDA requires device manufacturers to make a determination of whether or not a modification to a cleared and commercialized medical device requires a new approval or clearance. However, the FDA can review a manufacturer’s decision not to submit for additional approvals or clearances. Any modification to a 510(k)-clearedan FDA approved or cleared device that couldwould significantly affect its safety or efficacy or that would constitute a major change in its intended use technology, materials, packaging and certain manufacturing processes, maywould require a new PMA or 510(k) clearance and could be considered misbranded if the modified device is commercialized and such additional approval or possibly, a PMA. The FDA requires every manufacturer to make the determination regarding the need for a new 510(k) clearance or PMA in the first instance, but the FDA may (and often does) review the manufacturer’s decision. The FDA maywas not agree with a manufacturer’s decision regarding whether a new clearance or approval is necessary for a modification, and may retroactively require the manufacturer to submit a premarket notification requesting 510(k) clearance or an application for PMA.obtained. We have made modifications to our products in the past and may make additional modifications in the future that we believe do not or will not require additional clearances or approvals. No assurance can be givencannot assure you that the FDA wouldwill agree with any of our decisions not to seek approvals or clearances for particular device modifications or that we will be successful in obtaining additional approvals or 510(k) clearances for modifications.
We obtained 510(k) premarket clearance for certain devices we market or marketed in the United States. We have subsequently modified some of those devices or device labeling since obtaining 510(k) clearance under the view that these modifications did not significantly affect the safety or PMA.efficacy of the device, and did not require new approvals or clearances. If the FDA disagrees with our decisions and requires us to obtain additional premarket approvals or 510(k) clearances for any modifications to our products and we fail to obtain such approvals or clearances or fail to secure approvals or clearances in a timely manner, we may be required to cease manufacturing and marketing andthe modified device or to recall thesuch modified device until we obtain a new 510(k)FDA approval or clearance or PMA, our business, financial condition, operating results and future growth prospects could be materially adversely affected. Further, our products couldwe may be subject to recallsignificant regulatory fines or penalties.
Although our Corporate Integrity Agreement expired, if we were found to have breached it, we may be subject to criminal prosecution and/or exclusion from U.S. federal healthcare programs.
On September 29, 2010, Wright Medical Technology, Inc. entered into a 12-month Deferred Prosecution Agreement with the FDA determines,United States Attorney’s Office for any reason,the District of New Jersey (USAO). On September 15, 2011, WMT reached an agreement with the USAO and the OIG-HHS under which WMT voluntarily agreed to extend the term of its the Deferred Prosecution Agreement for 12 months. On October 4, 2012, the USAO issued a press release announcing that the amended Deferred Prosecution Agreement expired on September 29, 2012, that the USAO had moved to dismiss the criminal complaint against WMT because WMT had fully complied with the terms of the Deferred Prosecution Agreement, and that the court had ordered dismissal of the complaint on October 4, 2012. On September 29, 2010, WMT also entered into a five-year Corporate Integrity Agreement with the Office of the Inspector General of the United States Department of Health and Human Services. The CIA was filed as Exhibit 10.2 to legacy Wright's Current Report on Form 8-K filed on September 30, 2010. The CIA expired on September 29, 2015 and on January 27, 2016, we received notification from the OIG-HHS that the term of the CIA has concluded. While the term of the CIA has concluded, our products are not safe or effective. Any recall or FDA requirement that we seek additional approvals or clearances could result in significant delays, fines, increased costs associatedfailure to continue to maintain compliance with modification of a product, loss of revenue and potential operating restrictions imposed by the FDA.

Healthcare policy changes, including legislation to reform the U.S. healthcare system, may have a material adverse effect on us.

The Patient Protection and Affordable Care Act, as amended by the Health Care and Education Affordability Reconciliation Act, collectively, the PPACA, substantially changes the way health care is financed by both governmental and private insurers, encourages improvements in the quality of healthcare items and services, and significantly impacts the medical device industry. The PPACA includes, among other things, the following measures:

an excise tax on any entity that manufactures or imports medical devices offered for sale in the United States;

a new Patient-Centered Outcomes Research Institute to oversee, identify priorities in and conduct comparative clinical effectiveness research;

new reporting and disclosure requirements on device manufacturers for any “transfer of value” made or distributed to prescriberslaws, regulations and other healthcare providers, effective March 30, 2013 (referred to as the Physician Sunshine Payment Act), which reporting requirements will be difficult to define, track and report;

payment system reforms including a national pilot program on payment bundling to encourage hospitals, physicians and other providers to improve the coordination, quality and efficiency of certain healthcare services through bundled payment models, beginning on or before January 1, 2013;

an independent payment advisory board that will submit recommendations to reduce Medicare spending if projected Medicare spending exceeds a specified growth rate; and

a new licensure framework for follow-on biologic products.

We cannot predict what healthcare programs and regulations will be ultimately implemented at the federal or state level, or the effect of any future legislation or regulation. However, these provisions as adopted could meaningfully change the way healthcare is delivered and financed, and may materially impact numerous aspects of our business. In particular, any changes that lower reimbursements for our products or reduce medical procedure volumes could adversely affect our business and operating results.

In addition, in the future there may continuecould expose us to besignificant liability, including, but not limited to, exclusion from federal healthcare program participation, including Medicaid and Medicare, potential prosecution, civil and criminal fines or penalties, as well as additional proposals relating to the reform of the U.S. healthcare system. Certain of these proposals could limit the prices we are able to charge for our products, or the amounts of reimbursement available for our products,litigation cost and could limit the acceptance and availability of our products. The adoption of some or all of these proposals couldexpense, which would have a material adverse effect on our financial position and operating results.

Furthermore, initiatives sponsored by government agencies, legislative bodies and the private sector to limit the growth of healthcare costs, including price regulation and competitive pricing, are ongoing in markets where we do business. We could experience a negative impact on ourcondition, operating results dueand cash flows.


The European Union and many of its world markets rely on the CE-Mark as the path to increased pricing pressuremarket our products.
The European Medical Device Directive requires that many of our products that bear the CE-Mark be supported by post-market clinical data. We are in the United Statesprocess of implementing systems and certain other markets. Governments, hospitalsprocedures to control this activity in order to comply with these requirements, including establishing contractual relationships with the healthcare provider clinical study sites in accordance with our internal compliance requirements. We intend to obtain the needed clinical data to support our marketed products, but there can be no assurance that European regulators will accept the results. This could potentially impact business performance. In addition, changes to the certification and other third-party payorsoversight responsibilities of notified bodies presently under consideration by the European Commission, if implemented, could reduceresult in more stringent notified body oversight requirements, require additional resources to maintain compliance, and increase the amountrisk of approved reimbursementsnegative audit observations.
Our biologics business is subject to emerging governmental regulations that can significantly impact our business.
The FDA has statutory authority to regulate allograft-based products, processing, and materials. The FDA, European Union and Health Canada have been working to establish more comprehensive regulatory frameworks for our products. Reductions in reimbursement levels or coverage or other cost-containment measures could unfavorably affect our future operating results.

Our financial performance mayallograft-based, tissue-containing products, which are principally derived from cadaveric tissue. The framework developed by the FDA establishes risk-based criteria for determining whether a particular human tissue-based product will be adversely affected by medical device tax provisions in the health care reform laws.

The PPACA imposes a deductible excise tax equal to 2.3% of the price ofclassified as human tissue, a medical device, on any entity that manufactures or imports medical devices offered for sale in the United States, with limited exceptions, beginning in 2013. Under these provisions, the total cost to the medical device industry is estimated to be approximately $20 billion over 10 years. These taxes would result in a significant increase in the tax burden on our industry, which could have a material, negative impact on our operating results and our cash flows. The tax could create a risk up to 2.3% of our United States revenue.

The use, misuse or off-label use of our products may harm our image in the marketplace or result in injuries that lead to product liability suits, which could be costly to our business or result in FDA sanctions if we are deemed to have engaged in improper promotion of our products.

Our currently marketed products have been cleared by the FDA’s 510(k) clearance process for use under specific circumstances. Our promotional materials and training methods must comply with FDA and other applicable laws and regulations, including the prohibition on the promotion of a medical device for a use that has not been cleared or approved by the FDA. Use of a device outside of its cleared or approved indication is known as “off-label” use. We cannot prevent a surgeon from using our products or procedure for off-label use, as the FDA does not restrict or regulate a physician’s choice of treatment within the practice of medicine. However, if the FDA determines that our promotional materials or training constitute promotion of an off-label use, the FDA could request that we modify our training or promotional materials or subject us to regulatory or enforcement actions, including the issuance of an untitled letter, a warning letter, injunction, seizure, civil fine and criminal penalties. Other federal, state or foreign governmental authorities also might take action if they consider our promotion or training materials to constitute promotion of an uncleared or unapproved use, which could result in significant fines or penalties under other statutory authorities, such as laws prohibiting false claims for reimbursement. In that event, our reputation could be damaged and adoption of the products would be impaired. Although we train our sales force not to promote our products for off-label uses, and our instructions for use in all markets specify that our products are not intended for use outside of those indications cleared for use, the FDA or another regulatory agency could conclude that we have engaged in off-label promotion.

In addition, there may be increased risk of injury if surgeons attempt to use our products off-label. Furthermore, the use of our products for indications other than those indications for which our products have been cleared by the FDA may not effectively treat such conditions, which could harm our reputation in the marketplace among surgeons and patients. Surgeons also may misuse our products or use improper techniques if they are not adequately trained, potentially leading to injury and an increased risk of product liability. Product liability claims are expensive to defend and could divert our management’s attention and result in substantial damage awards against us. Any of these events could harm our business and operating results.

If our marketed medical devices are defective or otherwise pose safety risks, the FDA and similar foreign governmental authorities could require their recall, or we may initiate a recall of our products voluntarily.

The FDA and similar foreign governmental authorities may require the recall of commercialized products in the event of material deficiencies or defects in design or manufacture or in the event that a product poses an unacceptable risk to health. Manufacturers, on their own initiative, may recall a product if any material deficiency in a device is found. In the past we have initiated voluntary product recalls. For example, in 2008, we recalled a small number of medical devices due to a mislabeled product. We requested FDA closure of the recall in January 2010. A government-mandated or voluntary recall by us or one of our sales agencies could occur as a result of an unacceptable risk to health, component failures, manufacturing errors, design or labeling defects or other deficiencies and issues. Recalls of any of our products would divert managerial and financial resources and have an adverse effect on our financial condition and operating results. Any recall could impair our ability to produce our products in a cost-effective and timely manner in order to meet our customers’ demands. We also may be required to bear other costs or take other actions that may have a negative impact on our future revenue and our ability to generate profits. We may initiate voluntary recalls involving our products in the future that we determine do not require notification of the FDA. If the FDA disagrees with our determinations, they could require us to report those actions as recalls. A future recall announcement could harm our reputation with customers and negatively affect our revenue. In addition, the FDA could take enforcement action for failing to report the recalls when they were conducted.

In the EEA we must comply with the EU Medical Device Vigilance System, the purpose of which is to improve the protection of health and safety of patients, users and others by reducing the likelihood of reoccurrence of incidents related to the use of a medical device. Under this system, incidents must be reported to the competent authorities of the Member States of the EEA. An incident is defined as any malfunction or deterioration in the characteristics and/or performance of a device, as well as any inadequacy in the labeling or the instructions for use which, directly or indirectly, might lead to or might have

led to the death of a patient or user or of other persons or to a serious deterioration in their state of health. Incidents are evaluated by the EEA competent authorities to whom they have been reported, and where appropriate, information is disseminated between them in the form of National Competent Authority Reports, or NCARs. The Medical Device Vigilance System is further intended to facilitate a direct, early and harmonized implementation of Field Safety Corrective Actions, or FSCAs across the Member States of the EEA where the device is in use. An FSCA is an action taken by a manufacturer to reduce a risk of death or serious deterioration in the state of health associated with the use of a medical device that is already placed on the market. An FSCA may include the recall, modification, exchange, destruction or retrofitting of the device. FSCAs must be communicated by the manufacturer or its legal representative to its customers and/or to the end users of the device through Field Safety Notices.

If our products cause or contribute to a death or a serious injury, or malfunction in certain ways, we will be subject to medical device reporting regulations, which can result in voluntary corrective actions or agency enforcement actions.

Under the FDA medical device reporting regulations, or MDR, we are required to report to the FDA any incident in which our product has or may have caused or contributed to a death or serious injury or in which our product malfunctioned and, if the malfunction were to recur, would likely cause or contribute to death or serious injury. If we fail to report these events to the FDA within the required timeframes, or at all, the FDA could take enforcement action against us. Any adverse event involving our products could result in future voluntary corrective actions, such as recalls or customer notifications, or agency action, such as inspection, mandatory recall or other enforcement action. Any corrective action, whether voluntary or involuntary, as well as defending ourselves in a lawsuit, will require the dedication of our time and capital, distract management from operating our business, and may harm our reputation and financial results.

Our manufacturing operations require us to comply with the FDA’s and other governmental authorities’ laws and regulations regarding the manufacture and production of medical devices, which is costly and could subject us to enforcement action.

We and certain of our third-party manufacturers are required to comply with the FDA’s Quality System Regulation, or QSR, which covers the methods of documentation of the design, testing, production, control, quality assurance, labeling, packaging, sterilization, storage and shipping of our products. We and certain of our suppliers also are subject to the regulations of foreign jurisdictions regarding the manufacturing process for our products marketed outside of the United States. The FDA enforces the QSR through periodic announced and unannounced inspections of manufacturing facilities. In January 2013, our OrthoHelix facility located in Medina, Ohio was subject to a routine FDA inspection. The inspection resulted in the issuance of a Form FDA-483 listing four inspectional observations. The FDA’s observations related to our documentation of corrective and preventative actions, procedures for receiving, reviewing and evaluating complaints, procedures to control product that does not conform to specified requirements and procedures to ensure that all purchased or otherwise received product and services conform to specified requirements. Although we believe we have corrected all four of these observations, the FDA could disagree with our conclusion and corrective and remedial measures. The failure by us or one of our suppliers to comply with applicable statutes and regulations administered by the FDA and other regulatory bodies, or the failure to timely and adequately respond to any adverse inspectional observations or product safety issues, could result in, among other things, any of the following enforcement actions:

untitled letters, warning letters, fines, injunctions, consent decrees and civil penalties;

customer notifications or repair, replacement, refunds, recall, detention or seizure of our products;

operating restrictions or partial suspension or total shutdown of production;

refusing or delaying our requests forbiologic drug requiring 510(k) clearance or PMA of new products or modified products;

withdrawing 510(k) clearances or PMAs that have already been granted;

refusal to grant export approval for our products; or

criminal prosecution.

Any of these actions could impair our ability to produce our products in a cost-effective and timely manner in order to meet our customers’ demands. We also may be required to bear other costs or take other actions that may have a negative impact on our future revenue and our ability to generate profits. Furthermore, our key component suppliers may not currently be or may not continue to be in compliance with all applicable regulatory requirements, which could result in our failure to produce our products on a timely basis and in the required quantities, if at all.

We are subject to substantial post-market government regulation that could have a material adverse effect on our business.

The production and marketing of ourapproval. All tissue-based products are subject to extensive FDA regulation, including establishment of registration requirements, product listing requirements, good tissue practice requirements for manufacturing, and screening requirements that ensure that diseases are not transmitted to tissue


25


recipients. The FDA has also proposed extensive additional requirements addressing sub-contracted tissue services, traceability to the recipient/patient, and donor records review. If a tissue-based product is considered human tissue, FDA requirements focus on preventing the introduction, transmission, and spread of communicable diseases to recipients. Clinical data or review byof safety and efficacy is not required before the tissue can be marketed. However, if tissue is considered a medical device or biologic drug, then FDA and

numerous other governmental authorities both inclearance or approval is required.

Additionally, our biologics business involves the United Statesprocurement and abroad. For example, in additiontransplantation of allograft tissue, which is subject to other state regulatory requirements, Massachusetts, California and Arizona require compliance with the standards in industry codes such as the Code of Ethics on Interactions with Health Care Professionals issued by the Advanced Medical Technology Association (commonly known as AdvaMed), the Code on Interactions with Healthcare Professionals issued by MEDEC, the national association of Canada’s medical technology companies, and international equivalents. Many of these standards simply create industry standards of conduct, others tie into compliance with the advertising and promotion regulationsfederal regulation under the Food, Drug & CosmeticNational Organ Transplant Act the Anti-kickback Statute, the False Claims Act, HIPAA and the Physician Sunshine Payment Act. The failure by us or one of our suppliers to comply with applicable legal and regulatory requirements could result in, among other things, the FDA or other governmental authorities:

imposing fines and penalties on us;

preventing us from manufacturing or selling our products;

delaying the introduction of our new products into the market;

recalling, seizing or enjoining(NOTA). NOTA prohibits the sale of our products;

withdrawing, delaying or denying approvals or clearances for our products;

issuing warning letters or untitled letters;

imposing operating restrictions;

imposing injunctions; and

commencing criminal prosecutions.

Failure to comply with applicable regulatory requirements also could result in civil actions against ushuman organs, including bone and other unanticipated expenditures. If anyhuman tissue, for valuable consideration within the meaning of NOTA. NOTA permits the payment of reasonable expenses associated with the transportation, processing, preservation, quality control, and storage of human tissue. We currently charge our customers for these actions wereexpenses. In the future, if NOTA is amended or reinterpreted, we may not be able to occur it would harmcharge these expenses to our reputationcustomers, and, causeas a result, our product revenue to sufferbusiness could be adversely affected.

Our principal allograft-based biologics offerings include ALLOMATRIX®, GRAFTJACKET® and may prevent us from generating revenue.

IGNITE® products.

The results of our clinical trials may not support our product claims or may result in the discovery of adverse side effects.

Our ongoing research and development, pre-clinical testing, and clinical trial activities are subject to extensive regulation and review by numerous governmental authorities both in the United States and abroad. We are currently conducting post-market clinical studies of some of our products to gather additional information about these products’ safety, efficacy, or optimal use. In the future we may conduct additional clinical trials to support approval of new products. Clinical studies must be conducted in compliance with FDA regulations or the FDA may take enforcement action. The data collected from these clinical trials may ultimately be used to support market approval or clearance for these products or gather additional information about approved or cleared products. Even if our clinical trials are completed as planned, we cannot be certain that their results will support our product claims or that the FDA or foreign authorities will agree with our conclusions regarding them. Success in pre-clinical testing and early clinical trials does not always ensure that later clinical trials will be successful, and we cannot be sure that the later trials will replicate the results of prior trials and studies. The clinical trial process may fail to demonstrate that our products are safe and effective for the proposed indicated uses, which could cause us to abandon a product and may delay development of others. Any delay or termination of our clinical trials will delay the filing of our product submissions and, ultimately, our ability to commercialize our products and generate revenue. It is also possible that patients enrolled in clinical trials will experience adverse side effects that are not currently part of the product’s profile.

If the third parties on which we rely to conduct our clinical trials and to assist us with pre-clinicalclinical development do not perform as contractually required or expected, we may not be able to obtain, or in some cases, maintain regulatory clearance or approval for or commercialize our products.

We often must rely on third parties, such as contract research organizations, medical institutions, clinical investigators, and contract laboratories to conduct our clinical trials. If these third parties do not successfully carry out their contractual duties or regulatory obligations or meet expected deadlines, if these third parties need to be replaced, or if the quality or accuracy of the data they obtain is compromised due to thetheir failure to adhere to our clinical protocols or regulatory requirements, or for other reasons, our pre-clinical and clinical development activities or clinical trials may be extended, delayed, suspended, or terminated, and we may not be able to obtain or, in some cases maintain, regulatory clearance or approval for, or successfully commercialize, our products on a timely basis, if at all, and our business, operating results, and prospects may be adversely affected. Furthermore, our third-party clinical trial investigators may be delayed in conducting our clinical trials for reasons outside of their control.

Future regulatory actions

If we fail to compete successfully in the future against our existing or potential competitors, our sales and operating results may adversely affectbe negatively affected, and we may not achieve future growth.
The markets for our products are highly competitive and subject to rapid and profound technological change. Our success depends, in part, on our ability to sellmaintain a competitive position in the development of technologies and products for use by our customers. Many of the companies developing or marketing competitive products profitably.

From timeenjoy several competitive advantages over us, including greater financial and human resources for product development and sales and marketing; greater name recognition; established relationships with surgeons, hospitals and third-party payors; broader product lines and the ability to time, legislation is draftedoffer rebates or bundle products to offer greater discounts or incentives to gain a competitive advantage; and introduced that could significantly change the statutory provisions governing the clearance or approval, manufactureestablished sales and marketing and distribution networks. Some of a medical device. In addition, FDAour competitors have indicated an increased focus on the extremities and other regulationsbiologics markets, which are our primary strategic focus. Our competitors may develop and guidance are often revisedpatent processes or reinterpreted in waysproducts earlier than us, obtain regulatory clearances or approvals for competing products more rapidly than us, develop more


26


effective or less expensive products or technologies that may significantly affectrender our businesstechnology or products obsolete or non-competitive or acquire technologies and our products. It is impossibletechnology licenses complementary to predict whether legislative changes will be enacted or regulations, guidance or interpretations changed, and

what the impact of such changes, if any, may be.

We may be subject to or otherwise affected by federal and state healthcare laws, including fraud and abuse and health information privacy and security laws, and could face substantial penalties if we are unable to fully comply with such laws.

Although we do not provide healthcare services, submit claims for third-party reimbursement, or receive payments directly from Medicare, Medicaid or other third-party payors for our products or the procedures in which our products are used, healthcare regulation by federal and state governments could significantly impact our business. Healthcare fraud and abuse and health information privacy and security laws potentially applicableadvantageous to our operations include:

the federal Anti-Kickback Law,business, which constrains our marketing practices and those of our independent sales agencies, educational programs, pricing, bundling and rebate policies, grants for physician-initiated trials and CME, and other remunerative relationships with healthcare providers, by prohibiting, among other things, soliciting, receiving, offering or providing remuneration, intended to induce the purchase or recommendation of an item or service reimbursable under a federal healthcare program, such as the Medicare or Medicaid programs;

federal false claims laws which prohibit, among other things, knowingly presenting, or causing to be presented, claims for payment from Medicare, Medicaid, or other third-party payors that are false or fraudulent;

the federal Health Insurance Portability and Accountability Act of 1996, or HIPAA, and its implementing regulations, which created federal criminal laws that prohibit executing a scheme to defraud any healthcare benefit program or making false statements relating to healthcare matters and which also imposes certain regulatory and contractual requirements regarding the privacy, security and transmission of individually identifiable health information; and

state laws analogous to each of the above federal laws, such as anti-kickback and false claims laws that may apply to items or services reimbursed by any third-party payor, including commercial insurers, and state laws governing the privacy and security of certain health information, many of which differ from each other in significant ways and often are not preempted by HIPAA, thus complicating compliance efforts.

If our past or present operations, or those of our independent sales agencies, are found to be in violation of any of such laws or any other governmental regulations that may apply to us, we may be subject to penalties, including civil and criminal penalties, damages, fines, exclusion from federal healthcare programs and the curtailment or restructuring of our operations. Similarly, if the healthcare providers or entities with whom we do business are found to be non-compliant with applicable laws, they may be subject to sanctions, which could also have a negative impact on us. Any penalties, damages, fines, curtailment or restructuring of our operations could adversely affect our ability to operate our business and our financial results. The risk of our company being found in violation of these laws is increased by the fact that many of them have not been fully interpreted by the regulatory authorities or the courts, and their provisions are open to a variety of interpretations. Further, the recently enacted PPACA, among other things, amends the intent requirement of the federal anti-kickback and criminal health care fraud statutes. A person or entity no longer needs to have actual knowledge of this statute or specific intent to violate it. In addition, the PPACA provides that the government may assert that a claim including items or services resulting from a violation of the federal anti-kickback statute constitutes a false or fraudulent claim for purposes of the false claims statutes. Any action against us for violation of these laws, even if we successfully defend against them, could cause us to incur significant legal expenses and divert our management’s attention from the operation of our business.

The PPACA also includes a number of provisions that impact medical device manufacturers, including new reporting and disclosure requirements on device and drug manufacturers for any “transfer of value” made or distributed to prescribers and other healthcare providers, effective March 30, 2013 (known as the Physician Sunshine Payment Act). Such information will be made publicly available in a searchable format beginning September 30, 2013. In addition, device and drug manufacturers also will be required to report and disclose any investment interests held by physicians and their immediate family members during the preceding calendar year. Failure to submit required information may result in civil monetary penalties of up to an aggregate of $150,000 per year (and up to an aggregate of $1 million per year for “knowing failures”), for all payments, transfers of value or ownership or investment interests not reported in an annual submission. The PPACA also imposes excise taxes on medical device manufacturers, permits the use of comparative effectiveness research to make Medicare coverage determinations in certain circumstances, creates an Independent Medicare Advisory Board charged with recommending ways to reduce the rate of Medicare spending and changes payment methodologies under the Medicare and Medicaid programs. All of these changes could adversely affect our business and financialoperating results.

Governments and regulatory authorities have increased their enforcement of these healthcare fraud and abuse laws in recent years. For example, in 2007 five competitors in the orthopaedics industry settled a Department of Justice

investigation into the financial relationships and consulting agreements between the companies and surgeons for a combined fine of $311.0 million. The companies agreed to new corporate compliance procedures and federal monitoring. At issue were alleged financial inducements designed to encourage physicians to use the payor company’s products exclusively and the failure of physicians to disclose these relationships to hospitals and patients. Individual states also may be investigating the relationship between healthcare providers and companies in the orthopaedics industry. Many states have their own regulations governing the relationship between companies and healthcare providers. While we have not been the target of any investigations, we cannot guarantee that we will not be investigated in the future. If investigated we cannot assure that the costs of defending or resolving those investigations or proceedings would not have a material adverse effect on our financial condition, operating results and cash flows.

Failure to obtain and maintain regulatory approvals in jurisdictions outside the United States will prevent us from marketing our products in such jurisdictions.

We currently market, and intend to continue to market, our products outside the United States. Outside the United States, we can market a product only if we receive a marketing authorization and, in some cases, pricing approval, from the appropriate regulatory authorities. The approval procedure varies among countries and can involve additional testing, and the time required to obtain approval may differ from that required to obtain FDA clearance or approval. The regulatory approval process outside the United States may include Not all of the risks associated with obtaining FDA clearance or approval in addition to other risks. For example, in order to market our products in the Member States of the EEA, our devices are required to comply with the essential requirements of the EU Medical Devices Directives (Council Directive 93/42/EEC of 14 June 1993 concerning medical devices, as amended, and Council Directive 90/385/EEC of 20 June 2009 relating to active implantable medical devices, as amended). Compliance with these requirements entitles us to affix the CE conformity mark to our medical devices, without which they cannot be commercialized in the EEA. In order to demonstrate compliance with the essential requirements and obtain the right to affix the CE conformity mark we must undergo a conformity assessment procedure, which varies according to the type of medical device and its classification. Except for low risk medical devices (Class I), where the manufacturer can issue an EC Declaration of Conformity based on a self-assessment of the conformity of its products with the essential requirements of the Medical Devices Directives, a conformity assessment procedure requires the intervention of a Notified Body, which is an organization accredited by a Member State of the EEA to conduct conformity assessments. The Notified Body would typically audit and examine the quality system for the manufacture, design and final inspection of our devices before issuing a certification demonstrating compliance with the essential requirements. Based on this certification we can draw up an EC Declaration of Conformity, which allows us to affix the CE mark to our products.

We may not obtain regulatory approvals or certifications outside the United States on a timely basis, if at all. Clearance or approval by the FDA does not ensure approval or certification by regulatory authorities or Notified Bodies in other countries, and approval or certification by one foreign regulatory authority or Notified Body does not ensure approval by regulatory authorities in other countries or by the FDA. We may be required to perform additional pre-clinical or clinical studies even if FDA clearance or approval, or the right to bear the CE mark, has been obtained. If we fail to receive necessary approvals to commercialize our products in jurisdictions outside the United States on a timely basis, or at all, our business, financial condition and operating results could be adversely affected.

Our existing xenograft-based biologics business is and any future biologics products we pursue would be subject to emerging governmental regulations that could materially affect our business.

Some of our products are xenograft, or animal-based, tissue products. Our principal xenograft-based biologics offering is Conexa reconstructive tissue matrix. All of our current xenograft tissue-based products are regulated as medical devices and are subject to the FDA’s medical device regulations.

We currently are planning to offer products based on human tissue. The FDA has statutory authority to regulate human cells, tissues and cellular and tissue-based products, or HCT/Ps. An HCT/P is a product containing or consisting of human cells or tissue intended for transplantation into a human patient, including allograft-based products. The FDA, EU and Health Canada have been working to establish more comprehensive regulatory frameworks for allograft-based, tissue-containing products, which are principally derived from cadaveric tissue.

Section 361 of the Public Health Service Act, or PHSA, authorizes the FDA to issue regulations to prevent the introduction, transmission or spread of communicable disease. HCT/Ps regulated as 361 HCT/Ps are subject to requirements relating to: registering facilities and listing products with the FDA; screening and testing for tissue donor eligibility; Good Tissue Practice, or GTP, when processing, storing, labeling and distributing HCT/Ps, including required labeling information; stringent recordkeeping; and adverse event reporting. The FDA has also proposed extensive additional requirements that address sub-contracted tissue services, tracking to the recipient/patient, and donor records review. If a tissue-based product is

considered human tissue, the FDA requirements focus on preventing the introduction, transmission and spread of communicable diseases to recipients. A product regulated solely as a 361 HCT/P is not required to undergo premarket clearance or approval.

The FDA may inspect facilities engaged in manufacturing 361 HCT/Ps and may issue untitled letters, warning letters, or otherwise authorize orders of retention, recall, destruction and cessation of manufacturing if the FDA has reasonable grounds to believe that an HCT/P or the facilities where it is manufactured are in violation of applicable regulations. There also are requirements relating to the import of HCT/Ps that allow the FDA to make a decision as to the HCT/Ps’ admissibility into the United States.

An HCT/P is eligible for regulation solely as a 361 HCT/P if it is: minimally manipulated; intended for homologous use as determined by labeling, advertising or other indications of the manufacturer’s objective intent for a homologous use; the manufacture does not involve combination with another article, except for water, crystalloids or a sterilizing, preserving, or storage agent (not raising new clinical safety concerns for the HCT/P); and it does not have a systemic effect and is not dependent upon the metabolic activity of living cells for its primary function or, if it has such an effect, it is intended for autologous use or allogenetic use in close relatives or for reproductive use. If any of these requirements are not met, then the HCT/P is also subject to applicable biologic, device, or drug regulation under the FDCA or the PHSA. These biologic, device or drug HCT/Ps must comply both with the requirements exclusively applicable to 361 HCT/Ps and, in addition, with requirements applicable to biologics under the PHSA, or devices or drugs under the FDCA, including premarket licensure, clearance or approval.

Title VII of the PPACA, the Biologics Price Competition and Innovation Act of 2009, or BPCIA, creates a new licensure framework for follow-on biologic products, which could ultimately subject our biologics business to competition to so-called “biosimilars.” Under the BPCIA, a manufacturer may submit an application for licensure of a biologic product that is “biosimilar to” or “interchangeable with” a referenced, branded biologic product. Previously, there had been no licensure pathway for such a follow-on product. While we do not anticipate that the FDA will license a follow-on biologic for several years, given the need to generate data sufficient to demonstrate “biosimilarity” to or “interchangeability” with the branded biologic according to criteria set forth in the BPCIA, as well as the need for the FDA to implement the BPCIA’s provisions with respect to particular classes of biologic products, we cannot guarantee that our biologics will not eventually become subject to direct competition by a licensed “biosimilar.”

Procurement of certain human organs and tissue for transplantation, including allograft tissue we may use in future products, is subject to federal regulation under the National Organ Transplant Act, or NOTA. NOTA prohibits the acquisition, receipt, or other transfer of certain human organs, including bonesales and other human tissue, for valuable consideration within the meaning of NOTA. NOTA permits the payment of reasonable expenses associated with the removal, transportation, implantation, processing, preservation, quality control and storage of human organs. For any future products implicating NOTA’s requirements, we would reimburse tissue banks for their expenses associated with the recovery, storage and transportation of donated human tissue that they would provide to us. NOTA payment allowances may be interpreted to limit the amount of costs and expenses that we may recover in our pricing for our services, thereby negatively impacting our future revenue and profitability. If we were to be found topersonnel have violated NOTA’s prohibition on the sale or transfer of human tissue for valuable consideration, we would potentially be subject to criminal enforcement sanctions, which could materially and adversely affect our operating results. Further, in the future, if NOTA is amended or reinterpreted, we may not be able to pass these expenses on to our customers and, as a result, our business could be adversely affected.

Our operations involve the use of hazardous materials, and we must comply with environmental health and safety laws and regulations, which can be expensive and may affect our business and operating results.

We are subject to a variety of laws and regulations of the countries in which we operate and distribute products, such as the European Union, or EU, France, Ireland, other European nations and the United States, relating to the use, registration, handling, storage, disposal, recycling and human exposure to hazardous materials. Liability under environmental laws can be joint and several and without regard to comparative fault, and environmental, health and safety laws could become more stringent over time, imposing greater compliance costs and increasing risks and penalties associated with violations, which could harm our business. In the EU, where our manufacturing facilities are located, we and our suppliers are subject to EU environmental requirements such as the Registration, Evaluation, Authorization and Restriction of Chemicals, or REACH, regulation. In addition, we are subject to the environmental, health and safety requirements of individual European countries in which we operate such as France and Ireland. For example, in France, requirements known as the Installations Classées pour la Protection de l’Environnement regime provide for specific environmental standards related to industrial operations such as noise, water treatment, air quality and energy consumption. In Ireland, our manufacturing facilities are likewise subject to local environmental regulations, such as related to water pollution and water quality, that are administered by the Environmental Protection Agency. We believe that we are in material compliance with all applicable environmental, health

and safety requirements in the countries in which we operate and do not have reason to believe that we are responsible for any cleanup liabilities. In addition, certain hazardous materials are present at some of our facilities, such as asbestos, that we believe are managed in compliance with all applicable laws.non-compete agreements. We also are subject to greenhouse gas regulationscompete with other organizations in the EUrecruiting and elsewhere and we believe that we are in compliance based on present emissions levels at our facilities. Although we believe that our activities conform in all material respects with applicable environmental, health and safety laws, we cannot assure you that violations of such laws will not arise as a result of human error, accident, equipment failure, presently unknown conditions or other causes. The failure to comply with past, present or future laws, including potential laws relating to climate control initiatives, could result in the imposition of fines, third-party property damage and personal injury claims, investigation and remediation costs, the suspension of production or a cessation of operations. We also expect that our operations will be affected by other new environmental and health and safety laws, including laws relating to climate control initiatives, on an ongoing basis. Although we cannot predict the ultimate impact of any such new laws, they could result in additional costs and may require us to change how we design, manufacture or distribute our products, which could have a material adverse effect on our business.

Our business is subject to evolving corporate governance and public disclosure regulations that have increased both our compliance costs and the risk of noncompliance, which could have an adverse effect on our stock price.

We are subject to changing rules and regulations promulgated by a number of governmental and self-regulated organizations, including the SEC, the NASDAQ Stock Market, and the FASB. These rules and regulations continue to evolve in scope and complexity and many new requirements have been created in response to laws enacted by Congress, making compliance more difficult and uncertain. For example, our efforts to comply with the Dodd-Frank Wall Street Reform and Consumer Protection Act and other new regulations have resulted in, and are likely to continue to result in, increased general and administrative expenses and a diversion of management time and attention from revenue-generating activities to compliance activities.

Risks Related to Our Intellectual Property

If our patents and other intellectual property rights do not adequately protect our products, we may lose market share to our competitors.

We rely on patents, trade secrets, copyrights, know-how, trademarks, license agreements and contractual provisions to establish our intellectual property rights and protect our products. These legal means, however, afford only limited protection and may not adequately protect our rights. The patents we own may not be of sufficient scope or strength to provide us with any meaningful protection or commercial advantage, and competitors may be able to design around our patents or develop products that provide outcomes that are similar to ours. In addition, we cannot be certain that any of our pending patent applications will be issued. The USPTO may reject or require a significant narrowing of the claims in our pending patent applications affecting the patents issuing from such applications. Any patents issuing from the pending patent applications may not provide us with significant commercial protection. We could incur substantial costs in proceedings before the USPTO and the proceedings may be time-consuming, which may cause significant diversion of effort by our technicalretaining qualified scientific, sales, and management personnel. These proceedings could resultIf our competitors are more successful than us in adverse decisions as to the validity of our inventions and may result in the narrowing or cancellation of claims in issued patents. In addition, the laws of some of the countries in which our products are or may be sold may not protect our intellectual property to the same extent as U.S. laws or at all. We alsothese matters, we may be unable to protectcompete successfully against our rights in trade secrets and unpatented proprietary technology in these countries.

In the event a competitor infringes our patentexisting or other intellectual property rights, enforcing those rights may be costly, difficult and time-consuming. Even if successful, litigation to enforce our intellectual property rights or to defend our patents against challenge could be expensive and time-consuming and could divert our management’s attention. We may not have sufficient resources to enforce our intellectual property rights or to defend our patents or other intellectual property rights against a challenge. If we are unsuccessful in enforcing and protecting our intellectual property rights and protecting our products, it could harm our business and operating results.

future competitors. In addition, there are numerous recent changesthe orthopaedic industry has been subject to increasing consolidation recently and over the U.S. patent lawslast few years. Consolidation in our industry not involving our company could result in existing competitors increasing their market share through business combinations and proposed changes to the rules of the USPTO, which may have a significant impact on our ability to obtain and enforce intellectual property rights. For example, the Leahy-Smith America Invents Act, or the Leahy-Smith Act, was adoptedresult in September 2011. The Leahy-Smith Act includes a number of significant changes to U.S. patent law, including provisions that affect the way patent applications will be prosecuted and may also affect patent litigation. Under the Leahy-Smith Act, the U.S. will transition from a “first-to-invent” system to a “first-to-file” system for patent applications filed on or after March 16, 2013. With respect to patent applications filed on or after March 16, 2013, if we are the first to invent but not the first to file a patent application, we may not be able to fully protect our intellectual property rights and may be found to have violated the intellectual property rights of others if we continue to operate in the absence of a patent issued to us. The USPTO is currently developing regulations and procedures to govern administration of the Leahy-Smith Act, and many of the substantive changes to patent law associated

with the Leahy-Smith Act have recently become effective. Accordingly, it is not clear what, if any, impact the Leahy-Smith Act will have on the operation of our business. However, the Leahy-Smith Act and its implementation could increase the uncertainties and costs surrounding the prosecution of our patent applications and the enforcement or defense of our issued patents, all ofstronger competitors, which could have a material adverse effect on our business, financial condition, and financial condition.

operating results. We rely onmay be unable to compete successfully in an increasingly consolidated industry and cannot predict with certainty how industry consolidation will affect our trademarks, trade namescompetitors or us.

We operate in markets outside the United States that are subject to political, economic, and brand namessocial instability and expose us to distinguish our products fromadditional risks.
Operations in countries outside of the productsUnited States accounted for approximately 28% of our competitors, and have registered or applied to register many of these trademarks. However,net sales for our trademark applications may not be approved. Third parties may also oppose our trademark applications or otherwise challenge our usefiscal year ended December 27, 2015. Our operations outside of the trademarks. InUnited States are accompanied by certain financial and other risks. We intend to continue to pursue growth opportunities in sales outside the eventUnited States, especially in emerging markets, which could expose us to greater risks associated with international sales operations. Our international sales operations expose us and our representatives, agents, and distributors to risks inherent in operating in foreign jurisdictions. These risks include:
the imposition of additional U.S. and foreign governmental controls or regulations on orthopaedic implants and biologic products;
new export license requirements;
the imposition of U.S. or international sanctions against a country, company, person, or entity with whom we do business that would restrict or prohibit continued business with that country, company, person, or entity;
economic instability, including currency risk between the U.S. dollar and foreign currencies, in our trademarks are successfully challenged, we could be forced to rebrand our products,target markets;
the imposition of restrictions on the activities of foreign agents, representatives, and distributors;
scrutiny of foreign tax authorities, which could result in significant fines, penalties, and additional taxes being imposed upon us;
a shortage of high-quality international salespeople and distributors;
loss of brand recognitionany key personnel who possess proprietary knowledge or are otherwise important to our success in international markets;
changes in third-party reimbursement policy that may require some of the patients who receive our products to directly absorb medical costs or that may necessitate our reducing selling prices for our products;
unexpected changes in foreign regulatory requirements;
differing local product preferences and product requirements;
changes in tariffs and other trade restrictions, particularly related to the exportation of our biologic products;
work stoppages or strikes in the healthcare industry, such as those that have affected our operations in France, Canada, Korea, and Finland in the past;
difficulties in enforcing and defending intellectual property rights;
foreign currency exchange controls that might prevent us from repatriating cash earned in countries outside the Netherlands;
complex data privacy requirements and labor relations laws; and
exposure to different legal and political standards due to our conducting business in over 50 countries.
Since we conduct operations through U.S. operating subsidiaries, not only are we subject to the laws of non-U.S. jurisdictions, but we also are subject to U.S. laws governing our activities in foreign countries, such as the FCPA, as well as various import-export laws, regulations, and embargoes. If our business activities were determined to violate these laws, regulations, or rules, we could requiresuffer serious consequences.
Healthcare regulation and reimbursement for medical devices vary significantly from country to country. This changing environment could adversely affect our ability to sell our products in some jurisdictions.
We have a significant amount of indebtedness. We may not be able to generate enough cash flow from our operations to service our indebtedness, and we may incur additional indebtedness in the future, which could adversely affect our business, financial condition, and operating results.
We have a significant amount of indebtedness, including $60 million in aggregate principal with additional accrued interest under WMG’s 2.00% Convertible Senior Notes due 2017 (2017 Notes) and $632.5 million in aggregate principal with

27


additional accrued interest under WMG’s 2.00% Convertible Senior Notes due 2020, which Wright Medical Group N.V. has guaranteed (2020 Notes, together with the 2017 Notes, the Notes). Our ability to make payments on, and to refinance, our indebtedness, including the Notes, and our ability to fund planned capital expenditures, contractual cash obligations, research and development efforts, working capital, acquisitions, and other general corporate purposes depends on our ability to generate cash in the future. This, to a certain extent, is subject to general economic, financial, competitive, legislative, regulatory, and other factors, some of which are beyond our control. If we do not generate sufficient cash flow from operations or if future borrowings are not available to us in an amount sufficient to devote resourcespay our indebtedness, including payments of principal upon conversion of outstanding Notes or on their respective maturity dates or in connection with a transaction involving us that constitutes a fundamental change under the respective indenture governing the Notes, or to advertisingfund our liquidity needs, we may be forced to refinance all or a portion of our indebtedness, including the Notes, on or before the maturity dates thereof, sell assets, reduce or delay capital expenditures, seek to raise additional capital, or take other similar actions. We may not be able to execute any of these actions on commercially reasonable terms or at all. Our ability to refinance our indebtedness will depend on our financial condition at the time, the restrictions in the instruments governing our indebtedness, and marketing these new brands. Further,other factors, including market conditions. In addition, in the event of a default under the Notes, the holders and/or the trustee under the indentures governing the Notes may accelerate payment obligations under the Notes, which could have a material adverse effect on our business, financial condition, and operating results. Our inability to generate sufficient cash flow to satisfy our debt service obligations, or to refinance or restructure our obligations on commercially reasonable terms or at all, would likely have an adverse effect, which could be material, on our business, financial condition, and operating results.
In addition, our significant indebtedness, combined with our other financial obligations and contractual commitments, could have other important consequences. For example, it could:
make us more vulnerable to adverse changes in general U.S. and worldwide economic, industry, and competitive conditions and adverse changes in government regulation;
limit our flexibility in planning for, or reacting to, changes in our business and our industry;
restrict our ability to make strategic acquisitions or dispositions or to exploit business opportunities;
place us at a competitive disadvantage compared to our competitors may infringewho have less debt; and
limit our trademarks,ability to borrow additional amounts for working capital, capital expenditures, contractual obligations, research and development efforts, acquisitions, debt service requirements, execution of our business strategy, or we may not have adequate resources to enforceother purposes.

Any of these factors could materially and adversely affect our trademarks.

business, financial condition, and operating results. In addition, we hold licenses from third partiesmay incur additional indebtedness, and if we do, the risks related to our business and our ability to service our indebtedness would increase.

In addition, under our Notes, we are required to offer to repurchase the Notes upon the occurrence of a fundamental change, which could include, among other things, any acquisition of ours for consideration other than publicly traded securities. The repurchase price must be paid in cash, and this obligation may have the effect of discouraging, delaying, or preventing an acquisition of ours that are necessarywould otherwise be beneficial to our security holders.
A failure to comply with the designcovenants and manufacturingother provisions of somethe indentures governing the Notes could result in events of default under such indentures, which could require the immediate repayment of our products. The loss of such licenses would prevent us from manufacturing, marketing and selling these products, which could harm our business.

In addition to patents, we seek to protect our trade secrets, know-how and other unpatented technology, in part, with confidentiality agreements with our vendors, employees, consultants and others who may have access to proprietary information. We cannot be certain, however, that these agreements will not be breached, adequate remedies for any breach would be available or our trade secrets, know-how and other unpatented proprietary technology will not otherwise become known to or be independently developed by our competitors.

outstanding indebtedness. If we are subjectat any time unable to any future intellectual property lawsuits, a court could require usgenerate sufficient cash flows from operations to pay significant damages or prevent us from sellingservice our products.

The orthopaedic medical device industryindebtedness when payment is litigious with respect to patents and other intellectual property rights. Companies in the orthopaedic medical device industry have used intellectual property litigation to gain a competitive advantage. In the future, we may become a party to lawsuits involving patents or other intellectual property. A legal proceeding, regardless of outcome, could drain our financial resources and divert the time and effort of our management. A patent infringement suit or other infringement or misappropriation claim brought against us or any of our licensees may force us or any of our licensees to stop or delay developing, manufacturing or selling potential products that are claimed to infringe a third party’s intellectual property, unless that party grants us or any licensees rights to use its intellectual property. In such cases,due, we may be required to attempt to renegotiate the terms of the indentures and other agreements relating to the indebtedness, seek to refinance all or a portion of the indebtedness, or obtain licensesadditional financing. There can be no assurance that we will be able to patentssuccessfully renegotiate such terms, that any such refinancing would be possible, or proprietary rightsthat any additional financing could be obtained on terms that are favorable or acceptable to us.

Hedge and warrant transactions entered into in connection with the issuance of our Notes may affect the value of our ordinary shares.
In connection with the issuance of the 2020 Notes, WMG entered into hedge transactions with various financial institutions with the objective of reducing the potential dilutive effect of issuing WMG common stock upon conversion of the 2020 Notes and the potential cash outlay from the cash conversion of the 2020 Notes. WMG also entered into separate warrant transactions with the same financial institutions. These hedge and warrant transactions were subject to certain modifications as a result of the consummation of the Wright/Tornier merger.
In connection with the hedge and warrant transactions associated with the 2020 Notes, these financial institutions purchased WMG common stock in secondary market transactions and entered into various over-the-counter derivative

28


transactions with respect to WMG common stock. As a result of the completion of the Wright/Tornier merger, the WMG common stock converted into our ordinary shares. These entities or their affiliates are likely to modify their hedge positions from time to time prior to conversion or maturity of the 2020 Notes by purchasing and selling our ordinary shares, other of our securities, or other instruments they may wish to use in connection with such hedging. Any of these transactions and activities could adversely affect the value of our ordinary shares and, as a result, the number and value of the ordinary shares holders will receive upon conversion of the 2020 Notes. In addition, subject to movement in the price of our ordinary shares, if the hedge transactions settle in our favor, we could be exposed to credit risk related to the other party with respect to the payment we are owed from such other party. If any of the participants in the hedge transactions is unwilling or unable to perform its obligations for any reason, we would not be able to receive the benefit of such transaction. We cannot provide any assurances as to the financial stability or viability of any of the participants in the hedge transactions.
Cash payments we may be required to make upon conversion or maturity of our outstanding 2017 Notes would result in a reduction of our cash available to fund business operations.
WMG has $60 million in aggregate principal amount of cash convertible senior notes due 2017 outstanding. In August 2012, in connection with the issuance of the 2017 Notes, WMG entered into hedge and warrant transactions with various financial institutions designed to reduce its exposure to potential cash payments in excess of the principal amount of these notes that it may be required to make upon conversion. These hedge and warrant transactions, however, were terminated in February 2015 when WMG repurchased $240 million aggregate principal amount of the 2017 Notes. Accordingly, if holders convert their 2017 Notes prior to maturity, WMG may be required to make cash payments to those holders in excess of the principal amount of the converted notes. The timing of any cash payments that WMG is required to make upon conversion of the outstanding 2017 Notes is uncertain, and any such payments or payments WMG is required to make upon maturity of the 2017 Notes will reduce the cash available to fund our business operations. In addition, the 2017 Notes mature on August 15, 2017 and no assurance can be provided that we will have sufficient cash to fund the maturity payments at that time.
Rating agencies may provide unsolicited ratings on the Notes that could reduce the market value or liquidity of our ordinary shares.
We have not requested a rating of the Notes from any rating agency and we do not anticipate that the Notes will be rated. However, if one or more rating agencies independently elects to rate the Notes and assigns the Notes a rating lower than the rating expected by investors, or reduces such rating in the future, the market price or liquidity of our Notes and ordinary shares could be harmed. Should a decline in the market price of our Notes, as compared to the price of our ordinary shares occur, this may trigger the right of the holders of our Notes to convert such notes into cash and ordinary shares, as applicable.
We likely will need additional financing to satisfy our anticipated future liquidity requirements, which may not be available on favorable terms at the time it is needed and which could reduce our operational and strategic flexibility.
Although it is difficult for us to predict our future liquidity requirements, we believe that our cash and cash equivalents balance of approximately $139.8 million as of December 27, 2015 will be sufficient for at least the next 12 months to fund our working capital requirements and operations, permit anticipated capital expenditures in 2016 and meet our anticipated contractual cash obligations in 2016. We may face liquidity challenges during the next few years in light of anticipated significant contingent liabilities and financial obligations and commitments, including among others, acquisition-related contingent consideration payments, payments related to our outstanding indebtedness, and costs and payments related to pending litigation.

In the event that we would require additional working capital to fund future operations, we could seek to acquire that through additional equity or debt financing arrangements which may or may not be available on favorable terms at such time. If we raise additional funds by issuing equity securities, our shareholders may experience dilution. Debt financing, if available, may involve covenants restricting our operations or our ability to incur additional debt, in orderaddition to those under our existing indentures. Any debt financing or additional equity that we raise may contain terms that are not favorable to us or our shareholders. If we do not have, or are not able to obtain, sufficient funds, we may have to delay development or commercialization of our products or scale back our operations.
Worldwide economic instability could adversely affect our net sales, financial condition, or results of operations.
The health of the global economy, and the credit markets and the financial services industry in particular, affects our business and operating results. While the health of the credit markets and the financial services industry appears to have stabilized, there is no assurance that it will remain stable and there can be no assurance that there will not be deterioration in the global economy. If the credit markets are not favorable, we may be unable to raise additional financing when needed or on

29


favorable terms. Our customers may experience financial difficulties or be unable to borrow money to fund their operations which may adversely impact their ability to purchase our products or to pay for our products on a timely basis, if at all. In addition, any economic crisis could also adversely impact our suppliers’ ability to provide us with materials and components, either of which may negatively impact our business. As with our customers and vendors, these economic conditions make it more difficult for us to accurately forecast and plan our future business activities. Further, there are concerns for the overall stability and suitability of the Euro as a single currency, given the economic and political challenges facing individual Eurozone countries. Continuing deterioration in the creditworthiness of the Eurozone countries, the withdrawal of one or more member countries from the European Union, or the failure of the Euro as a common European currency could adversely affect our sales, financial condition, or operating results.
The collectability of our accounts receivable may be affected by general economic conditions.
Our liquidity is dependent on, among other things, the collection of our accounts receivable. Collections of our receivables may be affected by general economic conditions. Although current economic conditions have not had a material adverse effect on our ability to collect such receivables, we can make no assurances regarding future economic conditions or their effect on our ability to collect our receivables, particularly from our international stocking distributors. In addition, some of our trade receivables are with national health care systems in many countries (including, but not limited to, Greece, Ireland, Portugal, and Spain). Repayment of these receivables is dependent upon the financial stability of the economies of those countries. In light of these global economic fluctuations, we continue to monitor the creditworthiness of customers located outside of the United States. Failure to receive payment of all or a significant portion of these receivables could adversely affect our operating results.
If we are unable to continue to commercializedevelop and market new products and technologies, we may experience a decrease in demand for our products. However,products, or our products could become obsolete, and our business would suffer.
We are continually engaged in product development and improvement programs, and new products represent a significant component of our sales growth rate. We may be unable to compete effectively with our competitors unless we can keep up with existing or new products and technologies in the orthopaedic market. If we do not continue to introduce new products and technologies, or if those products and technologies are not accepted, we may not be successful. Moreover, research and development efforts may require a substantial investment of time and resources before we are adequately able to obtaindetermine the commercial viability of a new product, technology, material, or innovation. Demand for our products also could change in ways we may not anticipate due to evolving customer needs, changing demographics, slow industry growth rates, declines in the extremities and biologics market, the introduction of new products and technologies, evolving surgical philosophies, and evolving industry standards, among others. Additionally, our competitors’ new products and technologies may beat our products to market, may be more effective or less expensive than our products, or may render our products obsolete. Our new products and technologies also could render our existing products obsolete and thus adversely affect sales of our existing products and lead to increased expense for excess and obsolete inventory.
Our inability to maintain contractual relationships with healthcare professionals could have a negative impact on our research and development and medical education programs.
We maintain contractual relationships with respected surgeons and medical personnel in hospitals and universities who assist in product research and development and in the training of surgeons on the safe and effective use of our products. We continue to place emphasis on the development of proprietary products and product improvements to complement and expand our existing product lines as well as providing high quality training on those products. If we are unable to maintain these relationships, our ability to develop and market new and improved products and train on the use of those products could decrease, and our future operating results could be unfavorably affected. In addition, it is possible that U.S. federal and state and international laws requiring us to disclose payments or other transfers of value, such as free gifts or meals, to surgeons and other healthcare providers could have a chilling effect on these relationships with individuals or entities that may, among other things, want to avoid public scrutiny of their financial relationships with us.
Our business could suffer if the medical community does not continue to accept allograft technology.
New allograft products, technologies, and enhancements may never achieve broad market acceptance due to numerous factors, including:
lack of clinical acceptance of allograft products and related technologies;
the introduction of competitive tissue repair treatment options that render allograft products and technologies too expensive and obsolete;

30


lack of available third-party reimbursement;
the inability to train surgeons in the use of allograft products and technologies;
the risk of disease transmission; and
ethical concerns about the commercial aspects of harvesting cadaveric tissue.

Market acceptance also will depend on the ability to demonstrate that existing and new allograft products and technologies are attractive alternatives to existing tissue repair treatment options. To demonstrate this, we rely upon surgeon evaluations of the clinical safety, efficacy, ease of use, reliability, and cost effectiveness of our tissue repair options and technologies. Recommendations and endorsements by influential surgeons are important to the commercial success of allograft products and technologies. In addition, several countries, notably Japan, prohibit the use of allografts. If allograft products and technologies are not broadly accepted in the marketplace, we may not achieve a competitive position in the market.
If adequate levels of reimbursement from third-party payors for our products are not obtained, surgeons and patients may be reluctant to use our products and our sales may decline.
In the United States, healthcare providers who purchase our products generally rely on third-party payors, principally U.S. federally-funded Medicare, state-funded Medicaid, and private health insurance plans, to pay for all or a portion of the cost of joint reconstructive procedures and products utilized in those procedures. We may be unable to sell our products on a profitable basis if third-party payors deny coverage or reduce their current levels of reimbursement. Our sales depend largely on governmental healthcare programs and private health insurers reimbursing patients’ medical expenses. Surgeons, hospitals, and other healthcare providers may not purchase our products if they do not receive appropriate reimbursement from third-party payors for procedures using our products. In light of healthcare reform measures, payors continue to review their coverage policies for existing and new therapies and may deny coverage for treatments that include the use of our products.
In addition, some healthcare providers in the United States have adopted or are considering bundled payment methodologies and/or managed care systems in which the providers contract to provide comprehensive healthcare for a fixed cost per person. Healthcare providers may attempt to control costs by authorizing fewer elective surgical procedures, including joint reconstructive surgeries, or by requiring the use of the least expensive implant available. Changes in reimbursement policies or healthcare cost containment initiatives that limit or restrict reimbursement for our products may cause our sales to decline.
If adequate levels of reimbursement from third-party payors outside of the United States are not obtained, international sales of our products may decline. Outside of the United States, reimbursement systems vary significantly by country. Many foreign markets have government-managed healthcare systems that govern reimbursement for medical devices and procedures. Canada, and some European and Asian countries, in particular France, Japan, Taiwan, and Korea, have tightened reimbursement rates. Additionally, Brazil, China, Russia, and the United Kingdom have recently begun landmark reforms that will significantly alter their healthcare systems. Finally, some foreign reimbursement systems provide for limited payments in a given period and therefore result in extended payment periods.
Our business could be significantly and adversely impacted by healthcare reform legislation.
Comprehensive healthcare reform legislation has significantly and adversely impacted our business. For example, the Affordable Care Act imposed a 2.3% excise tax on U.S. sales of medical devices. Although the medical device excise tax was recently suspended for two years, it is possible that the suspension may be lifted or expire. The Affordable Care Act also includes numerous provisions to limit Medicare spending through reductions in various fee schedule payments and by instituting more sweeping payment reforms, such as bundled payments for episodes of care and the establishment of “accountable care organizations” under which hospitals and physicians will be able to share savings that result from cost control efforts. Many of these provisions will be implemented through the regulatory process, and policy details have not yet been finalized. Various healthcare reform proposals have also emerged at the state level. We cannot predict with certainty the impact that these U.S. federal and state health reforms will have on us. However, an expansion in government’s role in the U.S. healthcare industry may lower reimbursements for products, reduce medical procedure volumes, and adversely affect our business and operating results, possibly materially.
There is an increasing trend for more criminal prosecutions and compliance enforcement activities for noncompliance with the Health Insurance Portability and Accountability Act (HIPAA) as well as for data breaches involving protected health information (PHI). In the ordinary course of our business, we may receive PHI. If we are unable to comply with HIPAA or experiences a data breach involving PHI, we could be subject to criminal and civil sanctions.

31


If we cannot retain our key personnel, we may be unable to manage and operate our business successfully and meet our strategic objectives.
Our future success depends, in part, upon our ability to retain and motivate key managerial, scientific, sales, and technical personnel, as well as our ability to continue to attract and retain additional highly qualified personnel. We compete for such personnel with other companies, academic institutions, governmental entities, and other organizations. There can be no assurance that we will be successful in retaining our current personnel or in hiring or retaining qualified personnel in the future. Key personnel may depart because of difficulties with change or a desire not to remain with our company, especially in light of our recently completed merger. Any unanticipated loss or interruption of services of our management team and our key personnel could significantly reduce our ability to meet our strategic objectives because it may not be possible for us to find appropriate replacement personnel should the need arise. Loss of key personnel or the inability to hire or retain qualified personnel in the future could have a material adverse effect on our ability to operate successfully. Further, any licenses required under any patentsinability on our part to enforce non-compete or proprietary rightsnon-solicitation arrangements related to key personnel who have left the business could have a material adverse effect on our business.
If a natural or man-made disaster adversely affects our manufacturing facilities or distribution channels, we could be unable to manufacture or distribute our products for a substantial amount of third partiestime, and our sales could be disrupted.
We principally rely on four manufacturing facilities, two of which are in France, one of which is in Ireland and one of which is in Arlington, Tennessee. The facilities and the manufacturing equipment we use to produce our products would be difficult to replace and could require substantial lead-time to repair or replace. For example, the machinery associated with our manufacturing of pyrocarbon in one of our French facilities is highly specialized and would take substantial lead-time and resources to replace. We also maintain a facility in Bloomington, Minnesota, a facility in Arlington, Tennessee, and a warehouse in Montbonnot, France, which contain large amounts of our inventory. Our facilities, warehouses, or distribution channels may be affected by natural or man-made disasters. For example, in the event of a natural or man-made disaster at one of our warehouses, we may lose substantial amounts of inventory that would be difficult to replace. Our manufacturing facility in Arlington, Tennessee is located near the New Madrid fault line. In the event our facilities, warehouses, or distribution channels are affected by a disaster, we would be forced to rely on, among others, third-party manufacturers and alternative warehouse space and distribution channels, which may or may not be available, and our sales could decline. Although we believe we have adequate disaster recovery plans in place and possess adequate insurance for damage to our property and the disruption of our business from casualties, such plans and insurance may not cover such disasters or be sufficient to cover all of our potential losses and may not continue to be available to us on acceptable terms or at all. Even
Our business plan relies on certain assumptions about the markets for our products, which, if incorrect, may adversely affect our business and operating results.
We believe that the aging of the general population and increasingly active lifestyles will continue and that these trends will increase the need for our extremities and biologics products. The projected demand for our products could materially differ from actual demand if our assumptions regarding these trends and acceptance of our products by the medical community prove to be incorrect or do not materialize, or if non-surgical treatments gain more widespread acceptance as a viable alternative to orthopaedic implants.
Fluctuations in foreign currency exchange rates could result in declines in our reported net sales and earnings.
Because a majority of our international sales are denominated in local currencies and not in U.S. dollars, our reported net sales and earnings are subject to fluctuations in foreign currency exchange rates. Foreign currency exchange rate fluctuations negatively impacted our net sales by $0.6 million during 2015. Operating costs related to these sales are largely denominated in the same respective currencies, thereby partially limiting our transaction risk exposure. However, cost of sales related to these sales are primarily denominated in U.S. dollars; therefore, as the U.S. dollar strengthens, the gross margin associated with our sales denominated in foreign currencies experience declines.
WMG has recently employed a derivative program using foreign currency forward contracts to mitigate the risk of currency fluctuations on our intercompany receivable and payable balances that are denominated in foreign currencies. These forward contracts are expected to offset the transactional gains and losses on the related intercompany balances. These forward contracts are not designated as hedging instruments under Financial Accounting Standards Board (FASB) Accounting Standard Codification (ASC) Section 815, Derivatives and Hedging Activities. Accordingly, the changes in the fair value and the settlement of the contracts are recognized in the period incurred. Although we address currency risk management through regular operating and financing activities, and more recently through hedging activities, these actions may not prove to be fully effective, and hedging activities involve additional risks.

32


We incur significant expenditures of resources to maintain relatively high levels of instruments and we historically have had a high level of inventory, which can adversely affect our operating results and reduce our cash flows.
The nature of our business requires us to maintain a certain level of instruments since in order to market effectively we often must maintain and bring our customers instrument kits. In addition, we historically have maintained extra inventory in the form of back-up products and products of different size in order to ensure that our customers have the right products when they need them. This practice has resulted in us maintaining a relatively high level of inventory, which can adversely affect our operating results and reduce our cash flows. In addition, to the extent that a substantial portion of our inventory becomes obsolete, it could have a material adverse effect on our earnings and cash flows due to the resulting costs associated with inventory impairment charges and costs required to replace such inventory.
Our quarterly operating results are subject to substantial fluctuations, and you should not rely on them as an indication of our future results.
Our quarterly operating results may vary significantly due to a combination of factors, many of which are beyond our control. These factors include:
demand for products, which historically has been lowest in the third quarter;
our ability to meet the demand for our products;
the level of competition;
the number, timing, and significance of new products and product introductions and enhancements by us and our competitors;
our ability to develop, introduce, and market new and enhanced versions of our products on a timely basis;
the timing of or our licensees were ablefailure to obtain rightsregulatory clearances or approvals for products;
changes in pricing policies by us and our competitors;
changes in the treatment practices of orthopaedic surgeons;
changes in distributor relationships and sales force size and composition;
the timing of material expense- or income-generating events and the related recognition of their associated financial impact;
the number and mix of products sold in the quarter and the geographies in which they are sold;
the number of selling days;
the availability and cost of components and materials;
prevailing interest rates on our excess cash investments;
fluctuations in foreign currency exchange rates;
the timing of significant orders and shipments;
ability to obtain reimbursement for our products and the timing of patients’ use of their calendar year medical insurance deductibles;
work stoppages or strikes in the healthcare industry;
changes in FDA and foreign governmental regulatory policies, requirements, and enforcement practices;
changes in accounting policies, estimates, and treatments;
restructuring, impairment, and other special charges, costs associated with our pending litigation and U.S. governmental inquiries, and other charges;
variations in cost of sales due to the third party’s intellectual property,amount and timing of excess and obsolete inventory charges, commodity prices, and manufacturing variances;
income tax fluctuations; and
general economic factors.

We believe our quarterly sales and operating results may vary significantly in the future and period-to-period comparisons of our results of operations are not necessarily meaningful and should not be relied upon as indications of future performance. We cannot assure you that our sales will increase or be sustained in future periods or that we will be profitable in any future period. Any shortfalls in sales or earnings from levels expected by securities or orthopaedic industry analysts could have an immediate and significant adverse effect on the trading price of our ordinary shares in any given period.
We may not achieve our financial guidance or projected goals and objectives in the time periods that we anticipate or announce publicly, which could have an adverse effect on our business and could cause the market price of our ordinary shares to decline.
We typically provide projected financial information, such as our anticipated annual net sales, adjusted earnings and adjusted earnings before interest, taxes, depreciation, and amortization. These financial projections are based on management’s

33


then current expectations and typically do not contain any significant margin of error or cushion for any specific uncertainties or for the uncertainties inherent in all financial forecasting. The failure to achieve our financial projections or the projections of analysts and investors could have an adverse effect on our business, disappoint analysts and investors, and cause the market price of our ordinary shares to decline. Our net sales performance has been outside of our guidance range in certain quarters, which negatively impacted the market price of our ordinary shares, and could do so in the future should our results fall below our guidance range and the expectations of analysts and investors.
We also set goals and objectives for, and make public statements regarding, the timing of certain accomplishments and milestones regarding our business or operating results, such as the timing of financial objectives, new products, regulatory actions, pending litigation, and anticipated distributor and sales representative transitions. The actual timing of these rights mayevents can vary dramatically due to a number of factors, including the risk factors described in this report. As a result, there can be nonexclusive, thereby givingno assurance that we will succeed in achieving our competitors accessprojected goals and objectives in the time periods that we anticipate or announce publicly. The failure to achieve such projected goals and objectives in the same intellectual property. Ultimately,time periods that we anticipate or announce publicly could have an adverse effect on our business, disappoint investors and analysts, and cause the market price of our ordinary shares to decline.
We may be unable to commercialize somemaintain competitive global cash management and a competitive effective corporate tax rate.
We cannot give any assurance as to our future effective tax rate because of, our potential products oramong other things, uncertainty regarding the tax policies of the jurisdictions where we operate and uncertainty regarding the level of net income that we will earn in those jurisdictions in the future. Our actual effective tax rate may have to cease somevary from this expectation and that variance may be material. Additionally, the tax laws of our business operations asthe Netherlands and other jurisdictions in which we operate could change in the future, and such changes could cause a result of patent infringement claims, which could severely harm our business.

In any infringement lawsuit, a third party could seek to enjoin, or prevent, us from commercializing our existing or future products, or may seek damages from us, and any such lawsuit would likely be expensive for us to defend against. If we lose one of these proceedings, a court or a similar foreign governing body could require us to pay significant damages to third parties, seek licenses from third parties, pay ongoing royalties, redesign our products so that they do not infringe or prevent us from manufacturing, using or selling our products. In addition to being costly, protracted litigation to defend or prosecute our intellectual property rights could resultmaterial change in our customers or potential customers deferring or limiting their purchase or useeffective tax rate.

Our provision for income taxes will be based on certain estimates and assumptions made by management in consultation with our tax and other advisors. Our group income tax rate will be affected by, among other factors, the amount of net income earned in our various operating jurisdictions, the affected products until resolutionavailability of benefits under tax treaties, the litigation.

From timerates of taxes payable in respect of that income, and withholding taxes on dividends paid from one jurisdiction to time,the next. We will enter into many transactions and arrangements in the ordinary course of business in respect of which the tax treatment is not entirely certain. We will, therefore, make estimates and judgments based on our knowledge and understanding of applicable tax laws and tax treaties, and the application of those tax laws and tax treaties to our business, in determining our consolidated tax provision. For example, certain countries could seek to tax a greater share of income than will be provided for by us. The final outcome of any audits by taxation authorities may differ from the estimates and assumptions we receive noticesmay use in determining our consolidated tax provisions and accruals. This could result in a material adverse effect on our consolidated income tax provision, financial condition, and the net income for the period in which such determinations are made.

In particular, dividends, distributions, and other intra-group payments from third parties alleging infringementour U.S. affiliates to certain of our non-U.S. subsidiaries may be subject to U.S. withholding tax at a rate of 30% unless the entity receiving such payments can demonstrate that it qualifies for reduction or misappropriationelimination of the patent, trademarkU.S. withholding tax under the income tax treaty (if any) between the United States and the jurisdiction in which the entity is organized or other intellectual property rights of third parties by us or our customers in connection with the useis a tax resident. In certain cases, treaty qualification may depend on whether at least 50% of our products or we otherwise may become aware of possible infringement claims against us. We routinely analyze such claims and determine how best to respond in lightultimate beneficial owners are qualified residents of the circumstances existingUnited States or the treaty jurisdiction within the meaning of the applicable treaty. There can be no assurance that we will satisfy this beneficial ownership requirement at the time includingwhen such dividends, distributions, or other payments are made. Moreover, the importanceU.S. Internal Revenue Service (IRS) may challenge our determination that the beneficial ownership requirement is satisfied. If we do not satisfy the beneficial ownership requirement, such dividends, distributions, or other payments may be subject to 30% U.S. withholding tax.
We may face potential limitations on the utilization of our U.S. tax attributes.
Following the acquisition of a U.S. corporation by a non-U.S. corporation, Section 7874 of the intellectual property rightInternal Revenue Code of 1986, as amended (Code) can limit the ability of the acquired U.S. corporation and its U.S. affiliates to utilize U.S. tax attributes such as net operating losses and certain tax credits to offset U.S. taxable income resulting from certain transactions. Based on the limited guidance available, we currently expect that this limitation likely will not apply to us and as a result, our U.S. affiliates likely will not be limited by Section 7874 of the third party,Code in their ability to utilize their U.S. tax attributes to offset their U.S. taxable income, if any, resulting from certain specified taxable transactions. However, no assurances can be given in this regard. If, however, Section 7874 of the relative strengthCode were to apply to the Wright/Tornier merger and if our U.S. affiliates engage in transactions that would generate U.S. taxable income subject to this limitation in the future, it could take us longer to use our net operating losses and tax credits and, thus, we could pay U.S. federal income tax sooner than we otherwise would have. Additionally, if the limitation were to apply and if we do not generate taxable income consistent with our expectations, it is

34


possible that the limitation under Section 7874 on the utilization of U.S. tax attributes could prevent our U.S. affiliates from fully utilizing their U.S. tax attributes prior to their expiration.
Future changes to U.S. tax laws could materially affect us, including our status as a non-U.S. corporation.
Under current U.S. federal income tax law, a corporation generally will be considered to be resident for U.S. federal income tax purposes in its place of organization or incorporation. Accordingly, under the generally applicable U.S. federal income tax rules, we, as a Netherlands incorporated entity, would be classified as a non-U.S. corporation (and, therefore, not a U.S. tax resident). Section 7874 of Code, however, contains specific rules (more fully discussed below) that can cause a non-U.S. corporation to be treated as a U.S. corporation for U.S. federal income tax purposes. These rules are complex and there is little or no guidance as to their application.
We currently expect we should continue to be treated as a foreign corporation for U.S. federal tax purposes, however, it is possible that the IRS could disagree with that position and assert that Section 7874 applies to treat us as a U.S. corporation. In addition, new statutory or regulatory provisions under Section 7874 or otherwise could be enacted or promulgated that adversely affect our status as a foreign corporation for U.S. federal tax purposes, and any such provisions could have retroactive application. If we were to be treated as a U.S. corporation for federal tax purposes, we would be subject to U.S. corporate income tax on our worldwide income, and the income of our foreign subsidiaries would be subject to U.S. tax when repatriated or when deemed recognized under the U.S. tax rules for controlled foreign subsidiaries. In such a case, we would be subject to substantially greater U.S. tax liability than currently contemplated. Moreover, in such a case, a non-U.S. shareholder of our company would be subject to U.S. withholding tax on the gross amount of any dividends paid by us to such shareholder.
Any such U.S. corporate income or withholding tax could be imposed in addition to, rather than in lieu of, any Dutch corporate income tax or withholding tax that may apply.
Our tax position may be adversely affected by changes in tax law relating to multinational corporations, or by increased scrutiny by tax authorities.
Recent legislative proposals have aimed to expand the scope of non-infringement or non-misappropriationU.S. corporate tax residence, limit the ability of foreign-owned corporations to deduct interest expense, and make other changes in the taxation of multinational corporations.
Additionally, the U.S. Congress, government agencies in jurisdictions where we and our affiliates do business, and the productOrganization for Economic Co-operation and Development have focused on issues related to the taxation of multinational corporations. One example is in the area of “base erosion and profit shifting,” where payments are made between affiliates from a jurisdiction with high tax rates to a jurisdiction with lower tax rates. As a result, the tax laws in the United States, the Netherlands and other countries in which we and our affiliates do business could change on a prospective or products incorporatingretroactive basis, and any such changes could impact the intellectual property right at issue.

expected tax treatment for us and adversely affect our financial results.

Moreover, U.S. and non-U.S. tax authorities may carefully scrutinize companies involved or recently involved in cross-border business combinations, such as us, which may lead such authorities to assert that we owe additional taxes.
Our exposure to several tax jurisdictions may have an adverse effect on us and this may increase the aggregate tax burden on us and our shareholders.
We are subject to a large number of different tax laws and regulations in the various jurisdictions in which we operate. These laws and regulations are often complex and are subject to varying interpretations. The combined effect of the application of tax laws, including the application or disapplication of tax treaties of one or more of these jurisdictions and their interpretation by the relevant tax authorities could, under certain circumstances, produce contradictory results. We often rely on generally available interpretations of tax laws and regulations to determine the existence, scope, and level of our liability to tax in the jurisdictions in which we operate. In addition, we take positions in the course of our business with respect to various tax matters, including the compliance with the arm’s length principles in respect of transactions with related parties, the tax deductibility of interest and other costs, and the amount of depreciation or write-down of our assets that we can recognize for tax purposes. There is no assurance that the tax authorities in the relevant jurisdictions will agree with such interpretation of these laws and regulations or with the positions taken by us. If such tax positions are challenged by relevant tax authorities, the imposition of additional taxes could increase our effective tax rate and cost of operations.
Furthermore, because we are incorporated under Dutch law, we are treated for Dutch corporate income tax purposes as a resident of the Netherlands. Based on our management structure and the current tax laws of the United States and the Netherlands, as well as applicable income tax treaties and current interpretations thereof, we expect to remain a tax resident

35


solely of the Netherlands. If we were to be treated as a tax resident of a jurisdiction other than or in addition to the Netherlands, we could be subject to corporate income tax in that other jurisdiction, and could be required to withhold tax on any dividends paid by us to our shareholders under the applicable laws of that jurisdiction.
Risks Relating to Our Ordinary Shares

and Jurisdiction of Incorporation

The trading volume and prices of our ordinary shares have been and may continue to be volatile, which could result in substantial losses to our shareholders.

The trading volume and prices of our ordinary shares have been and may continue to be volatile and could fluctuate

widely due to factors beyond our control. Since our initial public offering in February 2011,During 2015, the sale price of our ordinary shares has ranged from $14.53 per share$18.03 to $29.93 per share, as reported by$27.06. Such volatility may be the NASDAQ Global Select Market. This may happen becauseresult of broad market and industry factors, like the performance and fluctuation of the market prices of other companies with business operations located mainly in Europe that have listed their securities in the United States.factors. In addition to market and industry factors, the price and trading volume for our ordinary shares may be highly volatile for factors specific to our own operations, including the following:

variations in our revenue,net sales, earnings, and cash flow;

flow, and in particular variations that deviate from our projected financial information;

announcements of new investments, acquisitions, strategic partnerships, or joint ventures;

announcements of new services and expansionsproducts by us or our competitors;

announcements of divestitures or discontinuance of products or assets;

changes in financial estimates by securities analysts;

additions or departures of key personnel;

sales of our equity securities by our significant shareholders or management or sales of additional equity securities by our company;

pending and potential litigation or regulatory investigations; and

fluctuations in market prices for our products.


Any of these factors may result in large and sudden changes in the volume and price at which our ordinary shares trade. In the past, shareholdersShareholders of a public company often broughtsometimes bring securities class action suits against the company following periods of instability in the market price of that company’s securities. If we were involved in a class action suit, it could divert a significant amount of our management’s attention and other resources from our business and operations, which could harm our operating results and require us to incur significant expenses to defend the suit. Any such class action suit, whether or not successful, could harm our reputation and restrict our ability to raise capital in the future. In addition, if a claim is successfully made against us, we may be required to pay significant damages, which could have a material adverse effect on our financial condition and operating results.

We have in the past and may in the future experience deficiencies, including material weaknesses, in our internal control over financial reporting. Our business and our share price may be adversely affected if we do not remediate these material weaknesses or if we have other weaknesses in our internal controls.

Our management is responsible for establishing and maintaining adequate internal control over financial reporting. Internal control over financial reporting is a process designed to provide reasonable assurance regarding the reliability of financial reporting and the preparation of financial statements in accordance with U.S. GAAP. A material weakness, as defined in the standards established by the Public Company Accounting Oversight Board, is a deficiency, or a combination of deficiencies, in internal control over financial reporting, such that there is a reasonable possibility that a material misstatement of our annual or interim financial statements will not be prevented or detected on a timely basis. In connection with the audit of our financial statements for 2009, we identified a material weakness in our internal control over financial reporting relating to our audited financial statements for 2007 and 2008. Specifically, in our case, management and our independent registered accounting firm determined that internal controls over identifying, evaluating and documenting accounting analysis and conclusions over complex non-routine transactions, including related-party transactions, required strengthening. Although we remediated this material weakness, additional control deficiencies may be identified by management or our independent registered public accounting firm, and such control deficiencies also could represent one or more material weaknesses. A report by us of a material weakness may cause investors to lose confidence in our financial statements, and the trading price of our ordinary shares may decline. If we fail to remedy any material weakness, our financial statements may be inaccurate, our access to the capital markets may be restricted and the trading price of our ordinary shares may decline.

If securities or industry analysts do not publish research or reports about our business, or if they adversely change their recommendations regarding our ordinary shares, the market price for our ordinary shares and trading volume could decline.

The trading market for our ordinary shares is influenced by research or reports that industry or securities analysts publish about us or our business. If one or more analysts who cover us downgrade our ordinary shares, the market price for our ordinary shares likely would decline. If one or more of these analysts cease coverage of us or fail to regularly publish reports on us, we could lose visibility in the financial markets, which, in turn, could cause the market price or trading volume for our ordinary shares to decline.

Your percentage of ownership in us may be diluted in the future.

As with any publicly-traded company, your percentage ownership in us may be diluted in the future because of equity issuances for acquisitions, capital market transactions or otherwise, including equity awards that we expect will be granted to our directors, officers and employees.

The sale or availability for sale of substantial amounts of our ordinary shares could adversely affect their market price.

Sales of substantial amounts of our ordinary shares in the public market, or the perception that these sales could occur, could adversely affect the market price of our ordinary shares and could materially impair our ability to raise capital through equity offerings in the future. An entity affiliated with Alain Tornier, one of our directors, has recently sold a portion of its Tornier share holdings. We cannot predict what effect, if any, market sales of securities held by our significant shareholders or any other shareholder or the availability of these securities for future sale will have on the market price of our ordinary shares.

We are party to a registration rights agreement with certain of our shareholders and officers, including TMG Holdings Coöperatief U.A. (TMG), or TMG, Vertical Fund I, L.P., Vertical Fund II, L.P., entities affiliated with Alain Tornier, Douglas W. Kohrs and certain former shareholders of OrthoHelix, which requires us to register ordinary shares held by these personsTMG under the U.S. Securities Act of 1933, as amended, subject to certain limitations, restrictions and conditions. The market price of our ordinary shares could decline as a result of the registration and sale of or the perception that registration and sales may occur of a large number of our ordinary shares.


36


Rights of a holder of ordinary shares are governed by Dutch law and differ from the rights of shareholders under U.S. law.
We are a NetherlandsDutch public company with limited liability (naamloze vennootschap). Our corporate affairs and the rights of holders of our ordinary shares are governed by Dutch law and our articles of association. The rights of our shareholders and the responsibilities of members of our board of directors may be different from those in companies governed by the laws of U.S. jurisdictions. For example, Dutch law does not provide for a shareholder derivative action. In addition, in the performance of its duties, our board of directors is required by Dutch law to act in the interest of our company and itour affiliated business, and to consider the interests of our company, our shareholders, our employees, and other stakeholders, in all cases with reasonableness and fairness. It is possible that some of these parties will have interests that are different from, or in addition to, interests of our shareholders.
U.S. investors may not be difficult for youable to obtain or enforce judgments obtained in U.S. courts in civil and commercial matters against us or our executive officers, somemembers of our board of directors and some of our named experts in the United States.

or officers.

We were formedare organized under the laws of the Netherlands, and, as such, the rights of holders of our ordinary shares and the civil liability of our directors are governed by Dutchthe laws of the Netherlands and our articles of association. The rights of shareholders under the laws of the Netherlands may differ from the rights of shareholders of companies incorporated in other jurisdictions. Certain of our directors and executive officers and mostA substantial portion of our assets and some of the assets of our directors are located outside of the United States. As a result, youit may not be abledifficult for investors to serveeffect service of process within the United States on us, or on such persons into enforce outside the United States or obtain or enforceany judgments fromobtained against us in U.S. courts against them or us based onin any action, including actions predicated upon the civil liability provisions of the U.S. federal securities laws oflaws. In addition, it may be difficult for investors to enforce rights predicated upon the United States. There is doubt as to whether Dutch courts would enforce certain civil liabilities under U.S. federal securities laws in original actions brought in courts in jurisdictions located outside the United States (including the Netherlands) or enforce claims for punitive damages.

Under our articles

The United States and the Netherlands currently do not have a treaty providing for the reciprocal recognition and enforcement of association, we indemnifyjudgments in civil and hold our directors harmless against all claims and suits brought against them, subject to limited exceptions. Although there is doubt as to whether U.S. courts would enforce such provision in an action broughtcommercial matters (other than arbitral awards). A final judgment for the payment of money rendered by any federal or state court in the United States underwhich is enforceable in the United States, whether or not predicated solely upon U.S. federal securities laws, such provision could make enforcing judgments obtained outsidewould not automatically be recognized or enforceable in the Netherlands. In order to obtain a judgment which is enforceable in the Netherlands, the party in whose favor a final and conclusive judgment of the U.S. court has been rendered will be required to file its claim with a court of competent jurisdiction in the Netherlands. Such party may submit to a Dutch court the final judgment rendered by the U.S. court. If and to the extent that the Dutch court finds that the jurisdiction of the U.S. court has been based on grounds which are internationally acceptable and that proper legal procedures have been observed, the Dutch court will generally tend to give binding effect to the judgment of the court of the United States without substantive re-examination or re-litigation on the merits of the subject matter, unless the judgment contravenes principles of public policy of the Netherlands.
There can be no assurance that U.S. investors will be able to enforce against us or members of our board of directors or officers who are residents of the Netherlands more difficult to enforce against our assets inor countries other than the Netherlands or jurisdictions that would apply Dutch law.

Rights of a holder of ordinary shares are governed by Dutch law and differ from the rights of shareholders under U.S. law.

We are a public limited liability company incorporated under Dutch law. The rights of holders of ordinary shares are governed by Dutch law and our articles of association. These rights differ from the typical rights of shareholdersUnited States any judgments obtained in U.S. corporations. For example, Dutch law significantly limitscourts in civil and commercial matters, including judgments under the circumstances under which shareholders of Dutch companies may bring an action on behalf of a company.

U.S. federal securities laws.

We do not anticipate paying dividends on our ordinary shares.

Our articles of association prescribe that profits or reserves appearing from our annual accounts adopted by the general meeting shall be at the disposal of the general meeting. We have power to make distributions to shareholders and other persons entitled to distributable profits only to the extent that our equity exceeds the sum of the paid and called-up portion of the ordinary share capital and the reserves that must be maintained in accordance with provisions of Dutch law or our articles of association. The profits must first be used to set up and maintain reserves required by law and must then be set off against certain financial losses. We may not make any distribution of profits on ordinary shares that we hold. The general meeting, whether or not upon the proposal of our board of directors, determines whether and how much of the remaining profit they will reserve and the manner and date of such distribution. All calculations to determine the amounts available for dividends will be based on our Dutch annual accounts, which may be different from our consolidated financial statements prepared in accordance with US GAAP. Our statutory accounts to date have been prepared and will continue to be prepared under Dutch generally accepted accounting principles and are deposited with the Trade Register in Amsterdam, the Netherlands. We have not previously declared or paid cash dividends and we have no plan to declare or pay any dividends in the near future on our ordinary shares. We currently intend to retain most, if not all, of our available funds and any future earnings to operate and expand our business. Our board

37


Warburg Pincus (Bermuda) Private Equity IX, L.P. and its affiliates have two designees on our board of directors and control approximately 44.3%6.1% of our outstanding ordinary shares, and this concentration of ownershipcontrol may have an effect on transactions that are otherwise favorable to our shareholders.

Warburg Pincus (Bermuda) Private Equity IX, L.P. and its affiliates or Warburg Pincus,(Warburg Pincus), beneficially own, in the aggregate, approximately 44.3%6.1% of our outstanding ordinary shares. These shareholdersThis concentration of ownership could have an effect on matters

requiring our shareholders’ approval, including the electionappointment of directors. This concentration of ownership also may delay, deter or prevent a change in control, and may make some transactions more difficult or impossible to complete without the support of these shareholders,Warburg Pincus, regardless of the impact of this transaction on our other shareholders. In addition, our securityholders’ agreement as amended on August 27, 2010, gives TMG Holdings Coöperatief U.A., an affiliate of Warburg Pincus, the right to designate three of the eight directors to be nominated to our board of directors for so long as TMG beneficially owns at least 25% of theour outstanding ordinary shares, two of the eight directors for so long as TMG beneficially owns at least 10% but less than 25% of theour outstanding ordinary shares and one of the eight directorsdirector for so long as TMG beneficially owns at least 5% but less than 10% of theour outstanding ordinary shares, and we have agreed to use our reasonable best efforts to cause the TMG designees to be elected.

Currently, two of our directors are designees of TMG.


38


Item 1B. Unresolved Staff Comments

Comments.


None.


Item 2. Properties.


Our global corporate headquarters are located in Amsterdam, the Netherlands.
Our U.S. headquarters are located in Memphis, Tennessee, where we conduct our principal executive, research and development, sales and marketing, and administrative activities. We lease 92,000 square feet of office space with research and development facilities under a lease agreement that is renewable through 2034. Our upper extremities sales and marketing, U.S. distribution and customer service operations are located in a 56,000 square foot facility in Bloomington, Minnesota wherethat we conduct our principal executive, sales and marketing, administrative activities, U.S. distribution and customer service operations. This facility is leasedlease through 2022. Our OrthoHelixU.S. manufacturing operations which includeconsist of a state of the art manufacturing facility in Arlington, Tennessee. We lease the manufacturing facility from the Industrial Development Board of the Town of Arlington. At this facility, we produce primarily orthopaedic implants and some related surgical instrumentation while utilizing lean manufacturing philosophies. We also have research and development distribution, customer service and administrative functions, are located in Medina Ohio. Our primary U.S. research and development operations are based in a 12,200 square foot leased facility in Warsaw, Indiana, with small satellite quality, marketing and research and development offices in Medina, Ohio and San Diego, California.

Our global corporate headquarters are located in Amsterdam, the Netherlands. Indiana.

Outside the United States, our primary manufacturing facilities are located in Montbonnot and Grenoble, France; and Macroom, Ireland. In the 112,000 square foot Montbonnot campus, we conduct manufacturing and manufacturing support such as purchasing and engineering,activities, sales and marketing, research and development, quality and regulatory assurance, distribution and administrative functions. In our 84,700 square foot Macroom facilities,facility, we conduct manufacturing operations and manufacturing support, such as purchasing, engineering, and quality assurance functions. Our pyrocarbon manufacturing is performed at our 9,900 square foot facility in Grenoble, France. In addition, we maintain subsidiary sales offices and distribution warehouses in various countries, including France, Germany, Italy, the Netherlands, Denmark, Switzerland, United Kingdom, Belgium, Japan, Canada, and Australia. We have an international research and development facility in Costa Rica.
We believe that our facilities are adequate and suitable for their use.

Below is a summary of our material facilities:

Entity

City
 CityState/Country 

State/Country

Owned or
Leased
 Owned or
Leased
Occupancy
Memphis 

Occupancy

Square
Footage
Lease
Expiration
Date

Tornier, Inc.

Bloomington

Minnesota,

Tennessee,
United States

Leased

Offices/Warehouse/

Distribution

56,00001/01/2022

Tornier, Inc

EdinaMinnesota, United StatesLeasedOffices19,10012/31/2015

Tornier, Inc.

WarsawIndiana, United States Leased Offices/R&D
Arlington 12,200
Tennessee,
United States
 Leased 02/28/2015
Manufacturing/
Warehouse/
Distribution
Bloomington 

OrthoHelix Surgical Designs, Inc

Minnesota,
United States
 Leased
Offices/Warehouse/
Distribution
Warsaw
Indiana,
United States
LeasedOffices/R&D
Medina 
Ohio,
United States
 Leased Offices/Warehouse/R&D19,50005/31/2014

Tornier SAS

Montbonnot France Leased Offices15,10005/31/2022Offices/

Tornier SAS

Montbonnot France Leased 

Warehouse/
Distribution/

Offices

19,50005/31/2022

Tornier SAS

Montbonnot France Leased Offices/R&D25,50005/31/2022

Tornier SAS

Montbonnot France Owned 51% 
Manufacturing/
Offices
51,70009/03/2018

Tornier SAS

Grenoble France Leased 
Manufacturing/
Offices/R&D
9,90007/22/2012

Tornier Orthopedics Ireland Limited

DunmanwayIrelandOwnedManufacturing/Offices15,200N/A

Tornier Orthopedics Ireland Limited

Macroom Ireland Leased 
Manufacturing/
Offices
84,70012/01/2028


39


Item 3. Legal Proceedings.

A description

From time to time, we or our subsidiaries are subject to various pending or threatened legal actions and proceedings, including those that arise in the ordinary course of our business and some of which involve claims for damages that are substantial in amount. These actions and proceedings may relate to, among other things, product liability, intellectual property, distributor, commercial, and other matters. These actions and proceedings could result in losses, including damages, fines, or penalties, any of which could be substantial, as well as criminal charges. Although such matters are inherently unpredictable, and negative outcomes or verdicts can occur, we believe we have significant defenses in all of them, are vigorously defending all of them, and do not believe any of them will have a material adverse effect on our financial position. However, we could incur judgments, pay settlements, or revise our expectations regarding the outcome of any matter. Such developments, if any, could have a material adverse effect on our results of operations in the period in which applicable amounts are accrued, or on our cash flows in the period in which amounts are paid.
The actions and proceedings described in this section relate primarily to Wright Medical Technology, Inc., an indirect subsidiary of Wright Medical Group N.V., and are not necessarily applicable to Wright Medical Group N.V. or other affiliated entities. Maintaining separate legal entities within our corporate structure is intended to ring-fence liabilities.  We believe our ring-fenced structure should preclude corporate veil-piercing efforts against entities whose assets are not associated with particular claims.  

Governmental Inquiries

On September 29, 2010, we entered into a five-year Corporate Integrity Agreement with the Office of the Inspector General of the United States Department of Health and Human Services. The CIA was filed as Exhibit 10.2 to legacy Wright's current report on Form 8-K filed on September 30, 2010. The CIA expired on September 29, 2015, and on January 27, 2016, we received notification from the OIG-HHS that the term of the CIA has concluded. While the term of the CIA has concluded, our failure to continue to maintain compliance with U.S. healthcare laws, regulations, and other requirements in the future could expose us to significant liability, including, but not limited to, exclusion from federal healthcare program participation, including Medicaid and Medicare, potential prosecution, civil and criminal fines or penalties, as well as additional litigation cost and expense.

On August 3, 2012, we received a subpoena from the United States Attorney's Office for the Western District of Tennessee requesting records and documentation relating to our PROFEMUR® series of hip replacement devices. The subpoena covers the period from January 1, 2000 to August 2, 2012. We continue to cooperate with the investigation.

Patent Litigation

In 2011, Howmedica Osteonics Corp. and Stryker Ireland, Ltd. (collectively, Stryker), each a subsidiary of Stryker Corporation, filed a lawsuit against us in the United States District Court for the District of New Jersey alleging that we infringed Stryker's U.S. Patent No. 6,475,243 related to our LINEAGE® Acetabular Cup System and DYNASTY® Acetabular Cup System. The lawsuit seeks an order of infringement, injunctive relief, unspecified damages, and various other costs and relief. On July 9, 2013, the Court issued a claim construction ruling. On November 25, 2014, the Court entered judgment of non-infringement in our favor. On January 7, 2015, Howmedica and Stryker filed a notice of appeal to the Court of Appeals for the Federal Circuit. The Court of Appeals heard oral argument on December 10, 2015 and took the case under advisement. We are presently awaiting the Court’s written decision.

In 2012, Bonutti Skeletal Innovations, LLC (Bonutti) filed a patent infringement lawsuit against us in the United States Court for the District of Delaware. Subsequently, Inter Partes Review (IPR) of the Bonutti patents was sought before the U.S. Patent and Trademark Office. On April 7, 2014, the Court stayed the case pending outcome of the IPR. Bonutti originally alleged that the Link Sled Prosthesis infringes U.S. Patent 6,702,821. The Link Sled Prosthesis is a product we distributed under a distribution agreement with LinkBio Corp, which expired on December 31, 2013. In January 2013, Bonutti amended its complaint, alleging that the ADVANCE® knee system, including ODYSSEY® instrumentation, infringes U.S. Patent 8,133,229, and that the ADVANCE® knee system, including ODYSSEY® instrumentation and PROPHECY® guides, infringes U.S. Patent 7,806,896, which was issued on October 5, 2010. All of the claims of the asserted patents are directed to surgical methods for minimally invasive surgery. As a result of the arguments submitted in the IPR, Bonutti abandoned the claims subject to the IPR from U.S. Patent 8,133,229, leaving one claim from U.S. Patent 7,806,896 still pending before the Patent Office Board that administers IPRs. On February 18, 2015, the Patent Office Board held that remaining claim invalid. Following the conclusion of the IPRs, the District Court has lifted the stay, and we are continuing with our defense as to remaining patent claims asserted by Bonutti.

40


In June 2013, Orthophoenix, LLC filed a patent lawsuit against us in the United States District Court for the District of Delaware alleging that our X-REAM® product infringes two patents. In June 2014, we filed a request for IPR with the U.S. Patent and Trademark Office. On December 16, 2014, the Patent Office Board denied our petitions requesting IPR. We are continuing with our defense before the District Court.
In June 2013, Anglefix, LLC filed suit in the United States District Court for the Western District of Tennessee, alleging that our ORTHOLOC® products infringe Anglefix’s asserted patent. On April 14, 2014, we filed a request for IPR with the U.S. Patent and Trademark Office. In October 2014, the Court stayed the case pending outcome of the IPR. On June 30, 2015, the Patent Office Board entered judgment in our favor as to all patent claims at issue in the IPR. Following the conclusion of the IPR, the District Court lifted the stay, and we are continuing with our defense as to remaining patent claims asserted by Anglefix.
In February 2014, Biomedical Enterprises, Inc. filed suit against Solana Surgical, LLC (Solana) in the United States District Court for the Western District of Texas alleging Solana's FuseForce Fixation system infringes U.S. Patent No. 8,584,853 entitled “Method and Apparatus for an Orthopedic Fixation System.” On February 20, 2015, Solana filed a request for IPR with the U.S. Patent and Trademark Office. On February 27, 2015, Biomedical Enterprises filed an amended complaint to add WMG and WMT as parties to the litigation. On April 3, 2015, the parties filed a stipulation of dismissal without prejudice as to us. On August 10, 2015, the Patent Office Review Board initiated IPR as to all challenged patent claims. The Patent Office Board heard oral argument in the IPR proceeding on February 17, 2016, and we are proceeding with our defense before the District Court.
On September 23, 2014, Spineology filed a patent infringement lawsuit, Case No. 0:14-cv-03767, in the United States District Court in Minnesota, alleging that our X-REAM® bone reamer infringes U.S. Patent No. RE42,757 entitled “EXPANDABLE REAMER.”  In January 2015, as the deadline for service of its complaint, Spineology dismissed its complaint without prejudice and filed a new, identical complaint. We filed an answer to the new complaint with the Court on April 27, 2015 and discovery is underway. The parties have submitted Markman claim construction briefing to the Court and a Markman hearing is scheduled for March 23, 2016.
Subject to the provisions of the asset purchase agreement with MicroPort for the sale of the OrthoRecon business, we, as between us and MicroPort, will continue to be responsible for defense of pre-existing patent infringement cases relating to the OrthoRecon business, and for resulting liabilities, if any.
Product Liability
We have been named as a defendant, in some cases with multiple other defendants, in lawsuits in which it is alleged that as yet unspecified defects in the design, manufacture, or labeling of certain metal-on-metal hip replacement products rendered the products defective. The lawsuits generally employ similar allegations that use of the products resulted in excessive metal ions and particulate in the patients into whom the devices were implanted, in most cases resulting in revision surgery (collectively, the CONSERVE® Claims). We anticipate that additional lawsuits relating to metal-on-metal hip replacement products may be brought.
Because of the similar nature of the allegations made by several plaintiffs whose cases were pending in federal courts, upon motion of one plaintiff, Danny L. James, Sr., the United States Judicial Panel on Multidistrict Litigation in February 2012 transferred certain actions pending in the federal court system related to metal-on-metal hip replacement products to the United States District Court for the Northern District of Georgia, for consolidated pre-trial management of the cases before a single United States District Court Judge (the MDL). The consolidated matter is known as In re: Wright Medical Technology, Inc. Conserve Hip Implant Products Liability Litigation.
Certain plaintiffs have elected to file their lawsuits in state courts in California. In doing so, most of those plaintiffs have named a surgeon involved in the design of the allegedly defective products as a defendant in the actions, along with his personal corporation. Pursuant to contractual obligations, we have agreed to indemnify and defend the surgeon in those actions. Similar to the MDL proceeding in federal court, because the lawsuits generally employ similar allegations, certain of those pending lawsuits in California were consolidated for pre-trial handling on May 14, 2012 pursuant to procedures of California State Judicial Counsel Coordinated Proceedings (the JCCP). The consolidated matter is known as In re: Wright Hip Systems Cases, Judicial Counsel Coordination Proceeding No. 4710.
There are other individual lawsuits related to metal-on-metal hip products pending in various state courts. As of January 30, 2016, there were 1,126 such lawsuits pending in the MDL and JCCP, and an additional 22 cases pending in various state courts. We have also entered into 893 so-called "tolling agreements" with potential claimants who have not yet filed suit. There are also 56 non-U.S. lawsuits presently pending. We believe we have data that supports the efficacy and safety of our

41


metal-on-metal hip products. While continuing to dispute liability, we have participated in court supervised non-binding mediation in the multi-district federal court litigation.
The first bellwether trial in the MDL commenced on November 9, 2015 in Atlanta, Georgia. On November 24, 2015, the jury returned a verdict in favor of the plaintiff and awarded the plaintiff $1 million in compensatory damages and $10 million in punitive damages. We believe there were significant trial irregularities and are vigorously contesting the trial result. On December 28, 2015, we filed a post-trial motion for judgment as a matter of law or, in the alternative, for a new trial or a reduction of damages awarded. That motion is pending.
The supervising judge in the JCCP has set a trial date of March 14, 2016 for the first bellwether trial in California. We expect that trial to proceed as scheduled.
We have received claims for personal injury against us associated with fractures of our PROFEMUR® long titanium modular neck product (PROFEMUR® Claims). As of January 30, 2016, there were 42 pending U.S. lawsuits and 23 pending non-U.S. lawsuits alleging such claims.
We are aware that MicroPort has recalled certain sizes of its cobalt chrome modular neck products as a result of alleged fractures. As of February 16, 2016, there were 2 pending U.S. lawsuits and 2 pending non-U.S. lawsuits against us alleging personal injury resulting from the fracture of a cobalt chrome modular neck (Modular Neck Claims).
In June 2015, a jury returned a $4.4 million verdict against us in a case involving a fractured hip implant stem sold prior to the MicroPort closing. This was a one-of-a-kind case unrelated to the modular neck fracture cases we have previously reported. There are no other cases pending related to this component, nor are we aware of other instances where this component has fractured. The case, Alan Warner et al. vs. Wright Medical Technology, Inc. et al., case no. BC 475958, was tried in the Superior Court of the State of California for the County of Los Angeles, Central District. In September 2015, the trial judge reduced the jury verdict to $1.025 million and indicated that if the plaintiff did not accept the reduced award he would schedule a new trial solely on the issue of damages. The plaintiff elected not to accept the reduced damage award, and both parties have appealed. The Court has not set a date for a new trial on the issue of damages and we do not expect it will do so until the appeals are adjudicated.
Insurance Litigation
In June 2014, St. Paul Surplus Lines Insurance Company (Travelers), which was an excess carrier in our coverage towers across multiple policy years, filed a declaratory judgment action in Tennessee state court naming us and certain of our other insurance carriers as defendants and asking the Court to rule on the rights and responsibilities of the parties with regard to the CONSERVE® Claims. Among other things, Travelers appears to dispute our contention that the CONSERVE® Claims arise out of more than a single occurrence thereby triggering multiple policy periods of coverage.  Travelers further seeks a determination as to the applicable policy period triggered by the alleged single occurrence.  We filed a separate lawsuit in state court in California for declaratory judgment against certain carriers and breach of contract against the primary carrier, and have moved to dismiss or stay the Tennessee action on a number of grounds, including that California is the most appropriate jurisdiction. During the third quarter of 2014, the California Court granted Travelers' motion to stay our California action.
In May 2015, we entered into confidential settlement discussions with our insurance carriers through a private mediator. These discussions are continuing.
On September 29, 2015, Markel International Insurance Company Ltd., as successor to Max Insurance Europe Ltd. (Max Insurance), which is the third insurance carrier in our coverage towers across multiple policy years, asserted that the terms and conditions identified in its reservation of rights will preclude coverage for the Modular Neck Claims. We strongly dispute the carrier's position, and in accordance with the dispute resolution provisions of the policy, on January 18, 2016, we filed a Notice of Arbitration against Max Insurance in London, England pursuant to the provisions of the Arbitration Act of 1996.  We are seeking reimbursement, up to the policy limits of $25 million, of costs incurred in the defense and settlement of the Modular Neck Claims.
MicroPort Indemnification Claim
On October 27, 2015, MicroPort filed a lawsuit in the United States District Court for the District of Delaware against Wright Medical Group N.V. alleging that we breached the indemnification provisions of the asset purchase agreement by failing to indemnify MicroPort for alleged damages arising out of certain pre-closing matters and for breach of certain representations and warranties. The complaint includes claims relating to MicroPort’s recall of certain of its cobalt chrome modular neck products, and seeks damages in an unspecified amount plus attorneys’ fees and costs, as well as declaratory judgment. On January 4, 2016,

42


we filed an answer to the complaint and also filed a counterclaim seeking declaratory judgment and indemnification and other damages in an unspecified amount from MicroPort. A scheduling order has not yet been entered in the lawsuit.
Wright/Tornier Merger Related Litigation
On November 25, 2014, a class action complaint was filed in the Court of Chancery of the state of Delaware (Delaware Chancery Court), by a purported shareholder of WMG under the caption Paul Parshall v. Wright Medical Group, Inc., et al., C.A. No. 10400-CB. An amended complaint in the action was filed on February 6, 2015. The amended complaint names as defendants WMG, Tornier, Trooper Holdings Inc. (Holdco), Trooper Merger Sub Inc. (Merger Sub) and the members of the WMG board of directors. The amended complaint asserts various causes of action, including, among other things, that the members of the WMG board of directors breached their fiduciary duties owed to the WMG shareholders in connection with entering into the merger agreement, approving the merger, and causing WMG to issue a preliminary Form S-4 that allegedly fails to disclose material information about the merger. The amended complaint further alleges that WMG, Tornier, Holdco, and Merger Sub aided and abetted the alleged breaches of fiduciary duties by the WMG board of directors. The plaintiff is seeking, among other things, injunctive relief enjoining or rescinding the merger and an award of attorneys’ fees and costs.
Also on November 25, 2014, a second class action complaint was filed in the Chancery Court of Shelby County Tennessee, for the Thirtieth Judicial District, at Memphis (Tennessee Chancery Court), by a purported shareholder of WMG under the caption Anthony Marks as Trustee for Marks Clan Super v. Wright Medical Group, Inc., et al., CH-14-1721-1. An amended complaint in the action was filed on January 7, 2015. On February 23, 2015, the plaintiff voluntarily dismissed the action, as pending in the Tennessee Chancery Court, without prejudice. Later on February 23, 2015, the plaintiff refiled the action in the Delaware Chancery Court under the caption Anthony Marks as Trustee for Marks Clan Super v. Wright Medical Group, Inc., et al., C.A. No. 10706-CB. The complaint names as defendants WMG, Tornier, Holdco, Merger Sub, and the members of the WMG board of directors. The complaint asserts various causes of action, including, among other things, that the members of the WMG board of directors breached their fiduciary duties owed to the WMG shareholders in connection with entering into the merger agreement, approving the merger, and causing WMG to issue a preliminary Form S-4 that allegedly fails to disclose material information about the merger. The complaint further alleges that WMG, Tornier, Holdco, and Merger Sub aided and abetted the alleged breaches of fiduciary duties by the WMG board of directors. The plaintiff is seeking, among other things, injunctive relief enjoining or rescinding the merger and an award of attorneys’ fees and costs.
On March 2, 2015, the Delaware Chancery Court consolidated Paul Parshall v. Wright Medical Group, Inc., et al., C.A. No. 10400-CB, and Anthony Marks as Trustee for Marks Clan Super v. Wright Medical Group, Inc., et al., C.A. No. 10706-CB, under the caption In re Wright Medical Group, Inc. Stockholders Litigation, C.A. No. 10400-CB (Consolidated Delaware Action).
On November 26, 2014, a third class action complaint was filed in the Circuit Court of Tennessee, for the Thirtieth Judicial District, at Memphis (Tennessee Circuit Court), by a purported shareholder of WMG under the caption City of Warwick Retirement System v. Gary D. Blackford et al., CT-005015-14. An amended complaint in the action was filed on January 5, 2015. The amended complaint names as defendants WMG, Tornier, Holdco, Merger Sub, and the members of the WMG board of directors. The amended complaint asserts various causes of action, including, among other things, that the members of the WMG board of directors breached their fiduciary duties owed to the WMG shareholders in connection with entering into the merger agreement, approving the merger, and causing WMG to issue a preliminary Form S-4 that allegedly fails to disclose material information about the merger. The amended complaint further alleges that Tornier, Holdco, and Merger Sub aided and abetted the alleged breaches of fiduciary duties by the WMG board of directors. The plaintiff is seeking, among other things, injunctive relief enjoining or rescinding the merger and an award of attorneys’ fees and costs.
On December 2, 2014, a fourth class action complaint was filed in the Tennessee Chancery Court by a purported shareholder of WMG under the caption Paulette Jacques v. Wright Medical Group, Inc., et al., CH-14-1736-1. An amended complaint in the action was filed on January 27, 2015. The amended complaint names as defendants WMG, Tornier, Holdco, Merger Sub, Warburg Pincus LLC and the members of the WMG board of directors. The amended complaint asserts various causes of action, including, among other things, that the members of the WMG board of directors breached their fiduciary duties owed to the WMG shareholders in connection with entering into the merger agreement, approving the merger, and causing WMG to issue a preliminary Form S-4 that allegedly fails to disclose material information about the merger. The amended complaint further alleges that WMG, Tornier, Warburg Pincus LLC, Holdco and Merger Sub aided and abetted the alleged breaches of fiduciary duties by the WMG board of directors. The plaintiff is seeking, among other things, injunctive relief enjoining or rescinding the merger and an award of attorneys’ fees and costs.
On March 24, 2015, a fifth class action complaint was filed in the Delaware Chancery Court, by a purported shareholder of WMG under the caption Michael Prince v. Robert J. Palmisano, et al., C.A. No. 10829-CB. The complaint asserts various

43


causes of action, including, among other things, that the members of the WMG board of directors breached their fiduciary duties owed to the WMG shareholders in connection with entering into the merger agreement, approving the merger, and causing WMG to issue a preliminary Form S-4 that allegedly fails to disclose material information about the merger. The complaint further alleges that WMG, Tornier, Holdco, and Merger Sub aided and abetted the alleged breaches of fiduciary duties by the WMG board of directors. The plaintiff is seeking, among other things, injunctive relief enjoining or rescinding the merger and an award of attorneys’ fees and costs. In an order dated May 22, 2015, the Delaware Chancery Court consolidated the Prince action into the Consolidated Delaware Action.
In an order dated March 31, 2015, the Tennessee Circuit Court transferred City of Warwick Retirement System v. Gary D. Blackford et al., CT-005015-14 to the Tennessee Chancery Court for consolidation with Paulette Jacques v. Wright Medical Group, Inc., et al., CH-14-1736-1 (Consolidated Tennessee Action). In an order dated April 9, 2015, the Tennessee Chancery Court stayed the Consolidated Tennessee Action; that stay expired upon completion of the Wright/Tornier merger.
On May 28, 2015, the parties to the Consolidated Delaware Action reached an agreement-in-principle to settle the cases, which has been memorialized in a memorandum of understanding. In connection with the contemplated settlement, we agreed to make certain supplemental disclosures in Tornier’s publicly-filed Securities and Exchange Commission Form S-4 registration statement, which were sought by the plaintiffs in connection with the Consolidated Delaware Action. The parties to the Consolidated Delaware Action also expect that, in connection with the contemplated settlement, counsel for plaintiffs will make an application for an award of attorneys’ fees. The contemplated settlement will be subject to customary conditions, including completion of appropriate settlement documentation, approval by the court, notice to the class and a hearing, and consummation of the merger. There can be no assurance that the contemplated settlement will be finalized or that court approval will be granted.
Other
In addition to those noted above, we are subject to various other legal proceedings, product liability claims, corporate governance, and other matters which arise in Note 19the ordinary course of our consolidated financial statements included in this report is incorporated herein by reference.

business.

Item 4. Mine Safety Disclosures.


Not applicable.


44


PART II


Item 5. Market for Registrant’s Common Equity, Related StockholderShareholder Matters and Issuer Purchases of Equity Securities.

Market Information

Our ordinary shares are traded on the NASDAQ Global Select Market under the symbol “TRNX.“WMGI.OurPrior to the completion of the Wright/Tornier merger on October 1, 2015, legacy Tornier ordinary shares have traded onunder the NASDAQ Global Select Market sincesymbol "TRNX" while legacy Wright ordinary shares traded under the datesymbol "WMGI." Due to the "reverse acquisition" nature of our initial public offering on February 3, 2011. the Wright/Tornier merger, historical information below reflects the high and low prices of legacy Tornier.
The following table sets forth, for the fiscal quartersperiods indicated, the high and low daily per share sales prices for our ordinary shares as reported by the NASDAQ Global Select Market.

   High   Low 

Fiscal year 2012


First Quarter

  $25.84    $17.25  

Second Quarter

  $25.91    $19.21  

Third Quarter

  $23.02    $17.15  

Fourth Quarter

  $20.49    $14.53  

Fiscal year 2011


First Quarter (commencing on February 3, 2011)

  $20.28    $17.80  

Second Quarter

  $29.38    $18.31  

Third Quarter

  $29.93    $19.58  

Fourth Quarter

  $24.42    $16.69  

 High Low
Fiscal Year 2015   
First Quarter$26.98
 $23.32
Second Quarter$27.06
 $24.45
Third Quarter$26.13
 $21.43
Fourth Quarter$23.86
 $18.03
Fiscal Year 2014   
First Quarter$21.17
 $17.77
Second Quarter$24.35
 $16.68
Third Quarter$25.11
 $19.28
Fourth Quarter$28.53
 $21.64
Holders

As of February 24, 201310, 2016, there were 111437 holders of record of our ordinary shares.

Dividends

We have never declared or paid cash dividends on our ordinary shares. We currently intend to retain all future earnings for the operation and expansion of our business. We do not anticipate declaring or paying cash dividends on our ordinary shares in the foreseeable future. Any payment of cash dividends on our ordinary shares will be at the discretion of our board of directors and will depend upon our results of operations, earnings, capital requirements, contractual restrictions, and other factors deemed relevant by our board of directors. The credit agreement relating to our senior secured term loans and senior secured revolving credit facility contains covenants limiting our ability to pay cash dividends.

Purchases of Equity Securities by the Company

None.

Recent Sales

We did not purchase any ordinary shares or other equity securities of Unregistered Securities

Duringour company during the fourth fiscal quarter ended December 30, 2012, we27, 2015.

Recent Sales of Unregistered Securities
We did not issue any ordinary shares or other equity securities of our company that were not registered under the Securities Act of 1933, as amended, except forduring the issuancefourth fiscal quarter ended December 27, 2015.


45

Table of an aggregate of 1,941,270 ordinary shares to former stockholders and other equity holders of OrthoHelix in connection with our purchase of OrthoHelix. The issuance of such shares was exempt from the registration requirements of the Securities Act of 1933, as amended, pursuant to Section 4(2) thereof and Regulation D promulgated thereunder, based upon appropriate representations and certifications that we obtained from each OrthoHelix stockholder, option holder and warrant holder receiving ordinary shares.

Use of Proceeds from Registered Securities

Our initial public offering was effected through a registration statement on Form S-1 (File No. 333-167370) that was declared effective by the SEC on February 2, 2011. An aggregate of 10,062,500 ordinary shares were registered (including the underwriters’ over-allotment of 1,312,500 ordinary shares), of which we sold 8,750,000 shares, at an initial price to the public of $19.00 per share (before underwriters’ discounts and commissions). The offering closed on February 8, 2011, and, as a result, we received net proceeds of approximately $149.2 million, after underwriters’ discounts and commissions of approximately $10.8 million and offering related expenses of $6.2 million. Merrill Lynch, Pierce, Fenner & Smith Incorporated and J.P. Morgan Securities LLC were the managing underwriters of the offering. Subsequently, on March 7, 2011, we issued an additional 721,274 ordinary shares at an offering price of $19.00 per share (before underwriters’

discounts and commissions) due to the exercise of the underwriters’ overallotment option, and received additional net proceeds of approximately $12.8 million, after underwriters’ discounts and commissions of approximately $0.9 million. Aggregate gross proceeds from the offering, including the exercise of the over-allotment option, were $180.0 million and net proceeds received after underwriters’ discounts and commissions and offering related expenses were approximately $162.0 million.

Through December 30, 2012, we used approximately $116.1 million (€86.4 million) of the net proceeds from the offering to repay all of the outstanding indebtedness under our notes payable, including accrued interest thereon. Additionally, through December 30, 2012, we used $9.1 million of the net proceeds from the offering to purchase instruments and implants and $16.8 million to reduce our short-term borrowings under our lines of credit. The majority of the $116.1 million used to repay the outstanding indebtedness under our notes payable, including accrued interest thereon, and none of the $9.1 million used to purchase instruments and implants or $16.8 million used to reduce our short-term borrowings under our various lines of credit were paid to certain of our directors and officers, or their associates, to persons owning ten percent or more of our outstanding ordinary shares and other affiliates of ours. We expect to use the remaining net proceeds for general corporate purposes. Pending the uses described above, we have invested the remaining net proceeds in a variety of short-term, interest-bearing, time deposits. There has been no material change in the planned use of proceeds from the offering from that described in the final prospectus dated February 2, 2011 filed by us with the SEC pursuant to Rule 424(b)(1).

Contents


Comparison of Total StockholderShareholder Returns

The graph below compares the cumulative total shareholder returns for legacy Tornier ordinary shares from the period from February 3, 2011, the date of ourlegacy Tornier's initial public offering, to December 30, 2012, forOctober 1, 2015, the date of the Wright/Tornier merger, and our combined company ordinary shares from October 1, 2015 to December 27, 2015 (our fiscal year-end). The graph also reflects cumulative total shareholder returns from an index composed of U.S. companies whose stock is listed on the NASDAQ Global Select Market (the( NASDAQ U.S. CompaniesComposite Index), and an index consisting of NASDAQ-listed companies in the surgical, medical and dental instruments and supplies industry (the( NASDAQ Medical Equipment CompaniesSubsector), as well as an index of companies with the SIC Code 384 - Surgical, Medical, and Dental Instruments Supplies (Surgical, Medical, and Dental Instruments Index). Total returns for the indices are weighted based on the market capitalization of the companies included therein. In addition, due the "reverse acquisition" nature of the Wright/Tornier merger and the fact that the historical financial statements of legacy Wright have replaced the historical financial statements of legacy Tornier, the graph below also includes the cumulative total shareholder returns for WMG common stock from February 3, 2011 to October 1, 2015, the date of the Wright/Tornier merger.
The graph assumes that $100.00 was invested on February 3, 2011, in ourlegacy Tornier/Wright Medical Group N.V. ordinary shares, legacy Wright common stock, the NASDAQ U.S. CompaniesComposite Index, and the NASDAQ Medical Equipment CompaniesSubsector, and the Surgical, Medical, and Dental Instruments Supplies Index, and that all dividends were reinvested. Total returns for the two NASDAQ indices are weighted based on the market capitalization of the companies included therein.
Historic stock price performance of our ordinary shares is not indicative of future stockshare price performance. We do not make or endorse any prediction as to future share price performance.
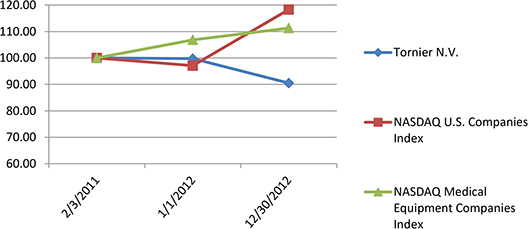
   February 3,
2011
   January 1,
2012
   December 30,
2012
 

Tornier N.V.

   100.00     99.72     90.50  

NASDAQ U.S. Companies Index

   100.00     97.07     118.30  

NASDAQ Medical Equipment Companies Index

   100.00     106.85     111.32  

The above stock performance graph shall not be deemed to be “filed”

 2/3/201120112012201320142015
Legacy Tornier / Wright Medical Group N.V.$100.00
$99.72
$90.25
$101.33
$141.05
$130.53
Legacy Wright100.00
109.27
134.11
199.47
175.96
139.21
NASDAQ Stock Market (US Companies)100.00
96.90
112.41
159.02
186.95
199.95
NASDAQ Medical Equipment Index100.00
106.18
115.96
137.82
161.79
189.90
SIC Code 384 - Surgical, Medical, and Dental Instruments and Supplies100.00
103.99
113.11
135.59
156.93
170.26


46


Prepared by Zacks Investment Research, Inc. Used with 
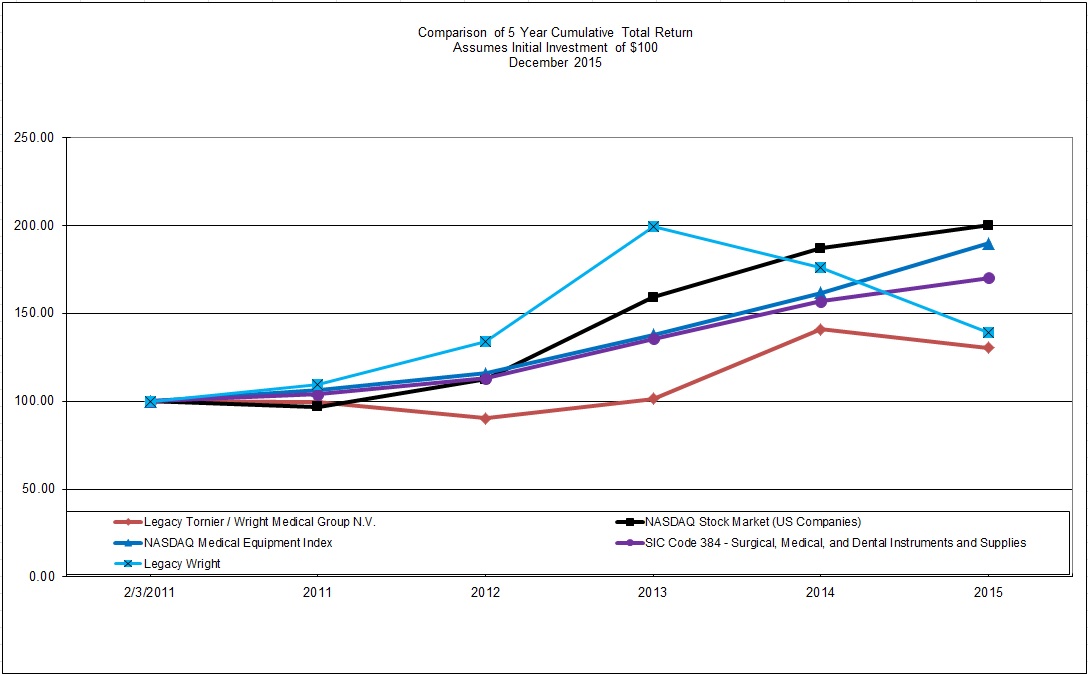
the Securities and Exchange Commission or subject to the liabilitiespermission. All rights reserved. Copyright 1980-2016


47


Item 6. Selected Financial Data.


The following tables set forth certain of our selected consolidated financial data as of the dates and for the years indicated. The selected consolidated financial data was derived from our consolidated financial statements. The audited consolidatedDue to the "reverse acquisition" nature of the Wright/Tornier merger, the historical financial statements as of December 30, 2012 and January 1, 2012, and forlegacy Wright have replaced the three years in the period ended December 30, 2012 are included elsewhere in this report. The audited consolidatedhistorical financial statements as of January 2, 2011, December 27, 2009 and December 28, 2008 and for the years ended December 27, 2009 and December 28, 2008 are not included in this report.legacy Tornier. Historical results are not necessarily indicative of the results to be expected for any future period. These tables are presented in thousands, except per share data.

Our fiscal year-end is generally determined on a 52-week basis and always falls on the Sunday nearest to December 31. Every few years, it is necessary to add an extra week to the year making it a 53-week period in order to have our year end fall on the Sunday nearest to December 31. For example, the year ended January 2, 2011 includes an extra week


 Fiscal year ended
 December 27, December 31, December 31, December 31, December 31,
 2015 2014 2013 2012 2011
Consolidated Statement of Operations:         
Net sales$415,461
 $298,027
 $242,330
 $214,105
 $210,753
Cost of sales (1)
119,255
 73,223
 59,721
 48,239
 56,762
Cost of sales — restructuring (2)


 667
Gross profit296,206
 224,804
 182,609
 165,866
 153,324
Operating expenses:         
Selling, general and administrative (1)
429,398
 289,620
 230,785
 150,296
 131,611
Research and development (1)
39,855
 24,963
 20,305
 13,905
 15,422
  Amortization of intangible assets16,922
 10,027
 7,476
 4,417
 2,412
BioMimetic impairment charges
 
 206,249
 
 
Gain on sale of intellectual property (3)


 (15,000) 
Restructuring charges (2)


 431
 4,613
Total operating expenses486,175
 324,610
 464,815
 154,049
 154,058
Operating (loss) income (4)
(189,969) (99,806) (282,206) 11,817
 (734)
Interest expense, net41,358
 17,398
 16,040
 10,113
 6,381
Other expense (income), net (5)
10,884
 129,626
 (67,843) 5,089
 4,241
Loss before income taxes(242,211) (246,830) (230,403) (3,385) (11,356)
(Benefits) provision for income taxes(6)
(3,851) (6,334) 49,765
 2
 (3,961)
Net loss from continuing operations$(238,360) $(240,496) $(280,168) $(3,387) $(7,395)
(Loss) income from discontinued operations, net of tax$(60,341) $(19,187) $6,223
 $8,671
 $2,252
Net (loss) income$(298,701) $(259,683) $(273,945) $5,284
 $(5,143)
Net loss from continuing operations per share:         
Basic (7)
$(3.68) $(4.69) $(5.82) $(0.08) $(0.19)
Diluted (7)
$(3.68) $(4.69) $(5.82) $(0.08) $(0.19)
Weighted-average number of ordinary shares outstanding —
basic (7)
64,808
 51,293
 48,103
 39,967
 39,462
Weighted-average number of ordinary shares outstanding —
diluted (7)
64,808
 51,293
 48.103
 39.967
 39.462


48


 December 27, December 31, December 31, December 31, December 31,
 2015 2014 2013 2012 2011
Consolidated Balance Sheet Data:         
Cash and cash equivalents$139,804
 $227,326
 $168,534
 $320,360
 $153,642
Marketable securities
 2,575
 14,548
 12,646
 18,099
Working capital (8)
352,946
 249,958
 375,901
 545,611
 383,799
Total assets (8)
2,089,675
 890,073
 996,789
 945,301
 742,991
Long-term liabilities (8)
827,711
 424,209
 417,011
 343,440
 198,549
Shareholders’ equity1,055,026
 278,803
 459,714
 523,441
 468,464
 Fiscal year ended
 December 27, December 31, December 31, December 31, December 31,
 2015 2014 2013 2012 2011
Other Data:         
Cash flow provided by (used in) operating activities$(195,870) $(116,002) $(36,601) $68,822
 $61,441
Cash flow provided by (used in) investing activities(15,970) 145,630
 (121,317) (1,048) (30,560)
Cash flow provided by (used in) financing activities126,862
 33,051
 6,257
 98,721
 (30,050)
Depreciation29,481
 18,582
 26,296
 38,275
 40,227
Share-based compensation expense24,964
 11,487
 15,368
 10,974
 9,108
Capital expenditures(9)
43,666
 48,603
 37,530
 19,323
 46,957

(1)These line items include the following amounts of non-cash, share-based compensation expense for the periods indicated:
 Fiscal year ended
 December 27, December 31, December 31, December 31, December 31,
 2015 2014 2013 2012 2011
Cost of sales$287
 $254
 $503
 $704
 $735
Selling, general and administrative22,777
 10,149
 10,675
 6,767
 4,875
Research and development1,900
 1,084
 780
 368
 320
Discontinued operations
 
 3,410
 3,135
 3,178

(2)During the years ended December 31, 2012 and 2011, we recorded pre-tax charges associated with the cost improvement restructuring efforts totaling $0.4 million and $5.3 million, respectively.
(3)During the year ended December 31, 2012, we recorded income of $15 million related to a sale and license back transaction for intellectual property.
(4)During the year ended December 27, 2015, we recognized $91.1 million in costs for due diligence, transaction, and transition costs related to the Wright/Tornier merger, $14.2 million of share-based compensation acceleration, and $11.4 million of inventory step-up amortization. During the year ended December 31, 2014, we recognized: (a) $2.1 million in costs associated with distributor conversions and non-competes; (b) $14.1 million in costs for due diligence, transaction, and transition costs related to the Biotech, Solana, and OrthoPro acquisitions, (c) $11.9 million in charges related to the Wright/Tornier merger; (d) $5.9 million in transition costs related to the OrthoRecon divestiture; (e) $1.2 million in costs associated with management changes; and (f) $0.9 million in costs associated with a patent dispute settlement. During the year ended December 31, 2013, we recognized: (a) $3.7 million in costs associated with distributor conversions and non-competes; (b) $12.9 million in due diligence and transaction costs related to the BioMimetic and Biotech acquisitions; (c) $21.6 million in transaction costs for the OrthoRecon divestiture; and (d) $206.2 million in BioMimetic impairment charges.
(5)During the year ended December 27, 2015, we recognized a $7.6 million gain from mark-to-market adjustments on the Contingent Value Rights (CVRs) issued in connection with the BioMimetic acquisition and $9.8 million of charges for the mark-to-market adjustment of our derivative instruments. During the year ended December 31, 2014, we recognized approximately $125 million from mark-to-market adjustments on the CVRs issued in connection with the BioMimetic acquisition, $2.0 million of charges for the mark-to-market adjustment of our derivative instruments, and $1.8 million of charges due to the fair value adjustment to contingent consideration associated with our acquisition of WG Healthcare. During the year ended December 31, 2013, we recognized a $7.8 million gain related to the previously held investment in BioMimetic. During the year ended December 31, 2012, we recognized $2.7 million for the write-off of unamortized deferred financing fees associated with the termination of our senior credit facility and the redemption of approximately $25 million of our 2014 convertible notes. Additionally, we recognized $1.1 million of charges for the mark-to-market adjustment of our derivative

49

Table of the year ended January 2, 2011, making the first quarter 14 weeks in length, as opposed to 13 weeks in length.

   Year ended 
   December 30,
2012
  January 1,
2012
  January 2,
2011
  December 27,
2009
  December 28,
2008
 

Statement of Operations Data:


Revenue

  $277,520   $261,191   $227,378   $201,462   $177,370  

Cost of goods sold

   81,918    74,882    63,437    54,859    45,500  


Gross profit

   195,602    186,309    163,941    146,603    131,870  

Selling, general and administrative

   170,447    161,448    149,175    136,420    128,612  

Research and development

   22,524    19,839    17,896    18,120    20,635  

Amortization of intangible assets

   11,721    11,282    11,492    15,173    11,186  

Special charges

   19,244    892    306    1,864    —    


Operating loss

   (28,334  (7,152  (14,928  (24,974  (28,563

Interest income

   338    550    223    250    210  

Interest expense

   (3,733  (4,326  (21,805  (19,917  (11,381

Foreign currency transaction (loss) gain

   (473  193    (8,163  3,003    1,701  

Loss on extinguishment of debt

   (593  (29,475  —      —      —    

Other non-operating income (expense)

   116    1,330    43    (28,461  (1,371


Loss before income taxes

   (32,679  (38,880  (44,630  (70,099  (39,404

Income tax benefit

   10,935    8,424    5,121    14,413    5,227  


Consolidated net loss

   (21,744  (30,456  (39,509  (55,686  (34,177

Net loss attributable to noncontrolling interest

   —      —      (695  (1,067  (1,173


Net loss attributable to Tornier

   (21,744  (30,456  (38,814  (54,619  (33,004

Accretion of noncontrolling interest

   —      —      (679  (1,127  (3,761


Net loss attributable to ordinary shareholders

  $(21,744 $(30,456 $(39,493 $(55,746 $(36,765


Weighted-average ordinary shares outstanding:
basic and diluted

   40,064    38,227    27,770    24,408    23,930  

Net loss per share: basic and diluted

  $(0.54 $(0.80 $(1.42 $(2.28 $(1.54


Balance Sheet Data:


Cash and cash equivalents

  $31,108   $54,706   $24,838   $37,969   $21,348  

Other current assets

   166,210    144,166    148,376    133,179    122,167  

Total assets

   654,227    511,700    491,178    520,187    475,967  

Total liabilities

   218,148    110,240    220,939    277,140    212,442  

Noncontrolling interest

   —      —      —      23,259    23,200  

Total shareholders’ equity

   436,079    401,460    270,239    219,788    240,325  

Other Financial Data:


Net cash provided by (used in) operating activities

  $14,431   $23,166   $2,889   $2,291   $(19,482

Net cash used in investing activities

   (125,795  (29,475  (22,853  (31,104  (43,314

Net cash provided by financing activities

   86,666    39,110    7,427    44,857    66,487  

Depreciation and amortization

   30,232    28,317    27,038    29,732    22,331  

Capital expenditures

   (23,290  (26,333  (20,525  (23,448  (31,622

Effect of exchange rate changes on cash and cash equivalents

   1,100    (2,933  (594  577    310  

Note: The results included above as of December 30, 2012 and forContents


instruments. During the year ended December 30, 2012 include31, 2011, we recognized $4.1 million for the resultswrite-off of OrthoHelix Surgical Designs Inc. from October 4, 2012 (datepro-rata unamortized deferred financing fees and transaction costs associated with the tender offer for our convertible notes completed during 2011.
(6)During the year ended December 31, 2013, we recognized a $119.6 million tax valuation allowance recorded against deferred tax assets in our U.S. jurisdiction due to recent operating losses.
(7)
The prior year weighted-average shares outstanding and net loss per share amounts were converted to meet post-merger valuations as described within Note 13. The 2015 weighted-average shares outstanding includes additional shares issued on October 1, 2015 as part of the Wright/Tornier merger as described in Note 13.
(8)The prior year deferred tax balances were reclassified to account for early adoption of ASU 2015-17.
(9)During the year ended December 31, 2014, our capital expenditures included $9.4 million related to the expansion of our manufacturing facility in Arlington, Tennessee.


50


Item 7. Management’s Discussion and Analysis of Financial Condition and Results of Operations.

You should read the


The following management's discussion and analysis of our financial condition and results of operations togetherdescribes the principal factors affecting the results of our operations, financial condition, and changes in financial condition, as well as our critical accounting estimates.

On October 1, 2015, we became Wright Medical Group N.V. following the merger of Wright Medical Group, Inc. with Tornier N.V. Upon completion of the merger, Robert J. Palmisano, former President and CEO of legacy Wright, became our President and CEO, David H. Mowry, former President and CEO of legacy Tornier, became our Executive Vice President and Chief Operating Officer, and Lance A. Berry, former Senior Vice President and CFO of legacy Wright, became our Senior Vice President and Chief Financial Officer. Our board of directors is comprised of five representatives from legacy Wright’s board of directors and five representatives from legacy Tornier’s board of directors, including Mr. Palmisano and Mr. Mowry. Immediately upon completion of the merger, legacy Wright shareholders owned approximately 52% of the combined company and legacy Tornier shareholders owned approximately 48%. In connection with the merger, the trading symbol for our ordinary shares changed from “TRNX” to “WMGI.”

Because of these and other facts and circumstances, the merger has been accounted for as a “reverse acquisition” under US GAAP, and as such, legacy Wright is considered the acquiring entity for accounting purposes. Therefore, legacy Wright’s historical results of operations replaced legacy Tornier’s historical results of operations for all periods prior to the merger. More specifically, the accompanying consolidated financial statements for periods prior to the merger are those of legacy Wright and its subsidiaries, and for periods subsequent to the notes thereto included elsewheremerger also include legacy Tornier and its subsidiaries.

On January 9, 2014, legacy Wright completed the sale of the OrthoRecon business to MicroPort. We determined that this transaction meets the criteria for classification as discontinued operations. As such, the financial results of the OrthoRecon business have been reflected within discontinued operations for all periods presented and, unless otherwise noted, the discussion below is on a continuing operations basis.
References in this report,section to "we," "our" and other financial information included"us" refer to Wright Medical Group N.V. and its subsidiaries after the Wright/Tornier merger and Wright Medical Group, Inc. and its subsidiaries before the merger. Beginning in this report. The following discussion may contain predictions, estimates2015 as a result of the Wright/Tornier merger, our fiscal year runs from the Monday nearest to the 31st of December of a year, and other forward-looking statements that involve a number of risks and uncertainties, including those discussed under “Special Note Regarding Forward Looking Statements,” “Part 1, Item 1A. Risk Factors” and elsewhere in this report. These risks could cause our actual results to differ materially from any future performance suggested below.

Basis of Presentation

Our fiscal year-end is generally determined on a 52-week basis and always fallsends on the Sunday nearest to the 31st of December of the following year. Prior to the Wright/Tornier merger, our fiscal year end was December 31. Every few years, it is necessaryReferences in this report to add an extra weeka particular year generally refer to the year making it a 53-week period in orderapplicable fiscal year. Accordingly, references to have our year end fall on the Sunday nearest to December 31. For example, the“2015” or “the year ended January 2, 2011 (2010) includes an extra week of operations relative toDecember 27, 2015” mean the yearsfiscal year ended December 30, 2012 (2012) and January 1, 2012 (2011). The extra week was added in the first quarter of the year ended January 2, 2011, making the first quarter 14 weeks in length, as opposed to 13 weeks in length.

27, 2015.

Executive Overview
OverviewCompany Description.

We are a global medical device company focused on surgeons that treat musculoskeletal injuriesextremities and disordersbiologics products. We are committed to delivering innovative, value-added solutions improving quality of life for patients worldwide, and are a recognized leader of surgical solutions for the upper extremities (shoulder, elbow, wrist and hand), lower extremities (foot and ankle) and biologics markets, three of the shoulder, elbow, wrist, hand, ankle and foot. We refer to these surgeons as extremity specialists. We sell to this extremity specialist customer base a broad line of joint replacement, trauma, sports medicine and biologic products to treat extremity joints. fastest growing segments in orthopaedics.

Our motto of “specialists serving specialists” encompasses this focus. In certain international markets, we also offer joint replacement products forglobal corporate headquarters are located in Amsterdam, the hip and knee. We currently sell approximately 100 product lines in approximately 40 countries.

We believe we are differentiated by our full portfolio of upper and lower extremity products, our focused extremity-focused sales organization and our strategic focus on extremities. We further believe that we are well positioned to benefit from the opportunities in the extremity products marketplace, primarily in the shoulder and ankle joint replacement markets and also the foot and ankle trauma market with our acquisition of OrthoHelix.Netherlands. We also have expandedsignificant operations located in Memphis, Tennessee (U.S. headquarters, research and development, sales and marketing administration, and administrative activities); Bloomington, Minnesota (upper extremities sales and marketing); Arlington, Tennessee (manufacturing and warehousing operations); Grenoble, France (manufacturing and research and development); and Macroom, Ireland (manufacturing). In addition, we have local sales and distribution offices in Canada, Australia, Asia, and throughout Europe.

We offer a broad product portfolio of over 160 extremities products and 20 biologics products that are designed to provide solutions to our technology basesurgeon customers, with the goal of improving clinical outcomes and the “quality of life” for their patients. Our product offering to include: new joint replacement products based on new materials; improved trauma products based on innovative designs; and proprietary biologic materials for soft tissue repair. In the United States, which is the largest orthopaedic market, we believe that our “specialists serving specialists” market approach is strategically aligned with what we believe is an ongoing trend in orthopaedics for surgeons to specialize in certain partsportfolio consists of the anatomy or certain types of procedures.

Our principal products are organized in four majorfollowing product categories: upper extremity joints and trauma, lower extremity joints and trauma, sports medicine and biologics, and large joints and other. Our upper extremity joints and trauma products

Upper extremities, which include joint replacementimplants and bone fixation devices for the shoulder, hand,elbow, wrist, and elbow. Our lower extremity joints and trauma products,hand;
Lower extremities, which include our OrthoHelix portfolio, include joint replacementimplants and bone fixation devices for the foot and ankle. Our sportsankle;
Biologics, which include products used to support treatment of damaged or diseased bone, tendons, and soft tissues or to stimulate bone growth;
Sports medicine and biologics product category includesother, which include products used across several anatomic sites to mechanically repair tissue-to-tissue or tissue-to-bone injuries in the case of sports medicine, or to support or induce remodeling and regeneration of tendons and ligaments, in the case of biologics. Our large joints and other productsancillary products; and
Large joints, which include hip and knee joint replacement implantsimplants.

51


Our sales and ancillary products.

Indistribution system in the United States wecurrently consists of 65 geographic sales territories that are staffed by 458 direct sales representatives and 30 independent sales agencies or distributors. These sales representatives and independent sales agencies and distributors are generally aligned to selling either our upper extremities products or lower extremities products, but, in some cases, certain agencies or direct sales representatives sell products from both our upper extremity joints and trauma, lower extremity joints and trauma, and sports medicine and biologics product categories; we do not currently market large joints in the United States. While we market our products to extremity specialists, our revenue is generated from sales to healthcare institutions and distributors. In the United States, we currently sell through our legacy Tornier and OrthoHelix sales channels, which both consist of independent commission-based sales agencies, with variations based upon individual territories. As we integrate OrthoHelix, we plan to organize our sales channels to focus on upper extremities and lower extremities to allow us to increase our selling opportunities by improving our overall procedure coverage, leveraging our entire product portfolio, and accessing new specialists and accounts. Although this may resultportfolios in some disruption our U.S. distribution channels, we believe that this strategy will be a significant competitive advantage longer term.their territories. Internationally, we sell our full product portfolio, including upper extremity joints and trauma, lower extremity joints and trauma, sports medicine and biologics and large joints. We utilize several distribution approaches depending onthat are tailored to the needs and requirements of each individual market requirements, includingmarket. Our international sales and distribution system currently consists of 11 direct sales organizationsoffices and approximately 90 distributors that sell our products in over 50 countries, with principal markets outside the United States in Europe, Asia, Canada, Australia, and Latin America. Our U.S. sales accounted for 72% of total net sales in 2015.

Principal Products. We have focused our efforts into growing our position in the largest Europeanextremities and biologics markets. We believe a more active and aging patient population with higher expectations regarding “quality of life,” an increasing global awareness of extremities and biologics solutions, improved clinical outcomes as a result of the use of such products, technological advances resulting in specific designs for such products that simplify procedures and address unmet needs for early interventions, and the growing need for revisions and revision related solutions will drive the market for extremities and biologics products.
The extremities market is one of the fastest growing market segments within orthopaedics, with annual growth rates of 7-10%. We believe major trends in the extremities market include procedure-specific and anatomy-specific devices, locking plates, and an increase in total ankle replacement or arthroplasty procedures. Upper extremities reconstruction involves implanting devices to replace, reconstruct, or fixate injured or diseased joints and bones in the shoulder, elbow, wrist, and hand. It is estimated that approximately 60% of the upper extremities market is in total shoulder replacement or arthroplasty implants. We believe major trends in the upper extremities market include minimally invasive fracture repair devices and next-generation joint arthroplasty systems. Lower extremities reconstruction involves implanting devices to replace, reconstruct, or fixate injured or diseased joints and bones in the foot and ankle. A large segment of the lower extremities market is comprised of plating and screw systems for reconstructing and fusing joints or repairing bones after traumatic injury. We believe major trends in the lower extremities market include the use of external fixation devices in diabetic patients, total ankle arthroplasty, advanced tissue fixation devices, and biologics. New technologies have been introduced into the lower extremities market in recent years including next-generation total ankle replacements, which currently have low levels of market penetration. We believe that market adoption of total ankle replacement, which currently represents approximately 6% of the lower extremities market, will result in significant future growth in the lower extremities market.
Our principal upper extremities products include the AEQUALIS ASCEND® and SIMPLICITI® total shoulder replacement systems, the AEQUALIS® REVERSED II™ reversed shoulder system, and the AEQUALIS ASCEND® FLEX™ convertible shoulder system. The SIMPLICITI® is the first minimally invasive, ultra-short stem total shoulder that has been available in certain international markets Australia, Japan and Canada and independent distributors for most other international markets. As we receive required regulatory approvals, we will begin to selectively introduce the OrthoHelix product portfolio

into select international markets. In 2012, we generated revenuea couple of $277.5 million, of which 56%years, but was just commercially launched by legacy Tornier on a limited focused basis in the United States late in the second quarter of 2015, after receipt of FDA 510(k) clearance in March 2015. We believe SIMPLICITI® allows us to expand the market to include younger patients that historically have deferred these procedures. Other principal upper extremities products include the EVOLVE® radial head prosthesis for elbow fractures, the EVOLVE® Elbow Plating System, RAYHACK® osteotomy system, and 44%the MICRONAIL® intramedullary wrist fracture repair system.

Our principal lower extremities products include the INBONE® and INFINITY® Total Ankle Replacement Systems, both of which can be used with our PROPHECY® Preoperative Navigation Guides, which combine computer imaging with a patient’s CT scan, and are designed to provide alignment accuracy while reducing surgical steps. Our lower extremities products also include the CLAW® II Polyaxial Compression Plating System, the ORTHOLOC® 3Di Reconstruction Plating System, the PhaLinx® System used for hammertoe indications, PRO-TOE® VO Hammertoe System, the DARCO® family of locked plating systems, the VALOR® ankle fusion nail system, and the Swanson line of toe joint replacement products. We expect to commercially launch our most recent total ankle replacement product, the INVISION™ Total Ankle Revision System, in 2016.
Our biologic products use both biological tissue-based and synthetic materials to allow the body to regenerate damaged or diseased bone and to repair damaged or diseased soft tissue. These products aid the body’s natural regenerative capabilities to heal itself, minimizing or delaying the need for invasive implant surgery. The newest addition to our biologics product portfolio is AUGMENT® Bone Graft, which is based on recombinant human platelet-derived growth factor (rhPDGF-BB), a synthetic copy of one of the body’s principal healing agents. FDA approval of AUGMENT® Bone Graft in the United States for ankle and/or hindfoot fusion indications occurred during the third quarter of 2015. Prior to FDA approval, this product was international.

available for sale in Canada for foot and ankle fusion indications and in Australia and New Zealand for hindfoot and ankle fusion indications. The AUGMENT® Bone Graft product line was acquired from BioMimetic Therapeutics, Inc. (BioMimetic) in March 2013. Our other principal biologics products include the GRAFTJACKETOrthoHelix Acquisition®

line of soft tissue repair


52


and containment membranes, the ALLOMATRIX® line of injectable tissue-based bone graft substitutes, the PRO-DENSE® injectable regenerative graft, the OSTEOSET® synthetic bone graft substitute, and the PRO-STIM® injectable inductive graft.
Significant Business Developments.On October 4, 2012,1, 2015, we acquired OrthoHelix Surgical Designs, Inc (OrthoHelix). Incompleted the transaction, we paid consideration consisting of $100.4 million cashWright/Tornier merger, as previously described. The merger created a mid-sized growth company uniquely positioned with leading technologies and 1,941,270 of our ordinary shares (which was determined to be equal to $35 million divided by the average closing sale price per ordinary share during the five trading days immediately prior to and after the date of our initial public announcementspecialized sales forces in three of the merger agreement). In addition,fastest growing areas of orthopaedics – upper extremities, lower extremities, and biologics. The highly complementary nature of the two legacy businesses has provided us significant diversity and scale across a range of geographies and product categories. Legacy Wright is a recognized leader of surgical solutions for the lower extremities market and legacy Tornier has an impressive upper extremities product portfolio, including in particular, shoulder replacement products. Together, we agreedintend to make additional earn-out paymentscontinue to leverage the global strengths of both product brands as a pure-play extremities-biologics business.
On September 1, 2015, FDA approval of AUGMENT® Bone Graft in cashthe United States for ankle and/or hindfoot fusion indications was obtained, and we commercially launched the product in the United States shortly thereafter.
On September 29, 2015, legacy Wright's five-year Corporate Integrity Agreement with the Office of upthe Inspector General of the United States Department of Health and Human Services expired, and on January 27, 2016, we received notification from the OIG-HHS that the term of the CIA has concluded.
On June 16, 2014, legacy Wright announced the full U.S. commercial launch of the INFINITY® Total Ankle Replacement System, which complements our ankle portfolio and allows us to an aggregateoffer a total ankle replacement system that addresses the continuum of $20.0 million based uponcare for end-stage ankle arthritis patients.
On January 30, 2014, legacy Wright completed the acquisition of Solana Surgical, LLC, and on February 5, 2014, completed the acquisition of OrthoPro, L.L.C., both privately-held, high-growth extremities companies. These acquisitions added complementary extremities product portfolios to further accelerate growth opportunities in our salesglobal extremities business. Legacy Wright acquired 100% of lower extremity joints and trauma products during fiscal years 2013 and 2014. Of the transaction consideration, $10.0outstanding equity of Solana for approximately $48 million in cash remainsand $41.4 million of WMG common stock. Legacy Wright acquired 100% of OrthoPro's outstanding equity for approximately $32.5 million in an escrow accountcash.
On January 9, 2014, legacy Wright completed the sale of its OrthoRecon business to fund payment obligations with respect to post-closing indemnification obligations of OrthoHelix’s former equity holders. In addition, a portionMicroPort. The financial results of the earn-out payments are subjectOrthoRecon business have been reflected within discontinued operations for all periods presented and, unless otherwise noted, the discussion below is on a continuing operations basis.
Financial Highlights. In 2015, net sales increased 39% totaling $415.5 million, compared to certain rights$298.0 million in 2014, driven by a $57 million increase in upper extremities sales primarily resulting from the Wright/Tornier merger and $43 million in growth from our lower extremities business.
Our 2015 U.S. sales increased by $88 million or 41% compared to 2014, driven by a $43 million increase in upper extremities sales primarily resulting from the Wright/Tornier merger and $38 million in growth from our lower extremities business primarily driven by continued success of set-off for post-closing indemnification obligationsour Total Ankle Replacement products, as well as growth in our core foot and ankle plating systems. 
Our international sales increased by $30 million or 35% during 2015 as compared to 2014 primarily due to a $24 million increase in upper extremities and large joint sales primarily resulting from the Wright/Tornier merger and continued growth in our European direct markets and Australia, partially offset by a $10.5 million unfavorable impact from foreign currency exchange rates.
In 2015, our net loss from continuing operations totaled $238.4 million, compared to a net loss from continuing operations of OrthoHelix’s equity holders.

In addition, and as part of$240.5 million in 2014. This decrease in net loss from continuing operations was primarily driven by:

a $7.6 million gain from mark-to-market adjustments on the OrthoHelix transaction, on October 4, 2012, we and our U.S. operating subsidiary, Tornier, Inc. (Tornier USA), entered into a credit agreement with Bank of America, N.A., as administrative agent, SG Americas Securities, LLC, as syndication agent, BMO Capital Markets and JPMorgan Chase Bank, N.A., as co-documentation agents, Merrill Lynch, Pierce, Fenner & Smith Incorporated and SG Americas Securities, LLC, as joint lead arrangers and joint bookrunners, and the other lenders party thereto. The credit agreement provides for an aggregate credit commitment to Tornier USA, as borrower, of $145.0 million, consisting of: (1) a senior secured term loan facility to Tornier USA denominated in dollars in an aggregate principal amount of up to $75.0 million; (2) a senior secured term loan facility to Tornier USA denominated in euros in an aggregate principal amount of up to the U.S. dollar equivalent of $40.0 million; and (3) a senior secured revolving credit facility to Tornier USA denominated at the election of Tornier USA, in U.S. dollars, euros, pounds sterling and yen in an aggregate principal amount of up to the U.S. dollar equivalent of $30.0 million. Funds available under the revolving credit facility may be used for general corporate purposes. The borrowings under the credit facility were used to pay the consideration for the OrthoHelix acquisition, and fees, costs and expenses incurredContingent Value Rights (CVRs) issued in connection with the OrthoHelixBioMimetic acquisition
$91.1 million in costs for due diligence, transaction, and transition costs related to the credit agreement and to repay prior existing indebtedness. The credit agreement contains customary covenants, including financial covenants which require us to maintain minimum interest coverage, annual capital expenditure limits and maximum total net leverage ratios, as well as customary eventsWright/Tornier merger;
$9.8 million of default. The obligations undercharges for the credit agreement are guaranteed by us, Tornier USA and certain othermark-to-market adjustment of our subsidiaries,derivative instruments;
$24.8 million of non-cash interest expense related to the 2017 and subject2020 convertible notes;
$25.1 million of charges related to certain exceptions, are secured by a first priority security interestthe write-off of unamortized debt discount and deferred financing costs associated with the settlement of the 2017 convertible notes;
$14.2 million of non-cash share-based compensation expense in substantially all2015 associated with the accelerated vesting of our assetslegacy Wright's unvested awards outstanding upon the closing of the Wright/Tornier merger; and

53


$11.4 million of inventory step-up amortization in 2015 associated with inventory acquired from the assets of certain of our existingWright/Tornier merger.
Opportunities and future subsidiaries of Tornier.

Challenges.Facilities Consolidation Initiative

We recently implemented a facilities consolidation initiative pursuant to which we consolidated a number of our facilities in France, Ireland and the United States. The facilities consolidation initiative was driven by our strategy to drive operational productivity and to realize operating costs savings beginning in 2013. Under the initiative, we consolidated our Dunmanway, Ireland manufacturing facility into our Macroom, Ireland manufacturing facility and our St. Ismier, France manufacturing facility into our existing Montbonnot, France manufacturing facility. We also leased a new facility located in Bloomington, Minnesota to use as our U.S. business headquarters and consolidated our Minneapolis-based marketing, training, regulatory, clinical, supply chain and corporate functions with our Stafford, Texas-based distribution operations. With the completion of the U.S. consolidationWright/Tornier merger, we believe we are now well positioned and committed to accelerating growth in our extremities and biologics business. We intend to leverage the global strengths of both the legacy Wright and legacy Tornier product brands as a pure-play extremities and biologics business. We believe our leadership will be further enhanced by the recent FDA premarket approval of AUGMENT® Bone Graft, a biologic solution that adds additional depth to one of the most comprehensive extremities product portfolios in the fourth quarterindustry, as well as provides a platform technology for future new product development. The highly complementary nature of 2012,legacy Wright’s and legacy Tornier’s businesses has given us significant diversity and scale across a range of geographies and product categories. We believe we are differentiated in the global facilities consolidation initiativemarketplace by our strategic focus on extremities and biologics, our full portfolio of upper and lower extremities and biologics products, and our specialized and focused sales organization.

We are highly focused on ensuring that during this integration period no business momentum is lost. Our integration motto has been concluded. For"Do no harm." Although we recognize that we will have revenue dis-synergies during the integration period, we believe we have an excellent opportunity to improve efficiency and leverage fixed costs in our business going forward.
While our ultimate financial goal is to achieve sustained profitability, in the short-term we anticipate continuing operating losses until we are able to grow our sales to a sufficient level to support our cost structure, including the inherent infrastructure costs of our industry.
Significant Industry Factors. Our industry is affected by numerous competitive, regulatory, and other significant factors. The growth of our business relies on our ability to continue to develop new products and innovative technologies, obtain regulatory clearance and maintain compliance for our products, protect the proprietary technology of our products and our manufacturing processes, manufacture our products cost-effectively, respond to competitive pressures specific to each of our geographic markets, including our ability to enforce non-compete agreements, and successfully market and distribute our products in a profitable manner. We, and the entire industry, are subject to extensive governmental regulation, primarily by the FDA. Failure to comply with regulatory requirements could have a material adverse effect on our business, operating results, and financial condition. We, as well as other participants in our industry, are subject to product liability claims, which could have a material adverse effect on our business, operating results, and financial condition.
Results of Operations
Comparison of the year ended December 30, 2012, we recognized a pretax charge of $6.4 million related27, 2015 to the global facilities consolidation initiative. Any remaining payments related to the charges taken as part of the initiative will be paid in 2013. For further discussion, please refer to Note 18 to our consolidated financial statements.

Medical Device Tax

An excise tax of 2.3% on the sale, lease, rental or use of certain medical devices was mandated by the 2010 health care reform legislation and went into effect January 1, 2013. The excise tax applies to manufacturers, producers and importers of taxable medical devices. The excise tax generally is based on the medical device’s wholesale price and is imposed on the manufacturer or importer when the taxable device is first sold, leased, rented or used by the manufacturer or importer. A taxable device generally is considered sold, for purposes of the excise tax, when title passes from the manufacturer to the purchaser. The tax could create a risk up to 2.3% of our United States revenue.

Foreign Currency Exchange Rates

A substantial portion of our business is located outside the United States and as a result we generate revenue and

incur expenses denominated in currencies other than the U.S. dollar. As a result, fluctuations in the value of foreign currencies relative to the U.S. Dollar can impact our operating results. The majority of our operations denominated in currencies other than the U.S. dollar are denominated in Euros. In the yearsyear ended December 30, 2012 and January 1, 2012, approximately 44% and 46% of our revenue was denominated in foreign currencies. As a result, our revenue can be significantly impacted by fluctuations in foreign currency exchange rates. We expect that foreign currencies will continue to represent a similarly significant percentage of our revenue in the future. Selling, marketing and administrative costs related to these sales are largely denominated in the same foreign currencies, thereby limiting our foreign currency transaction risk exposure. In addition, we also have significant levels of other selling, general and administrative expenses and research and development expenses denominated in foreign currencies. We, therefore, believe that the risk of a significant impact on our earnings from foreign currency fluctuations is mitigated to some extent.

A substantial portion of the products we sell in the United States are manufactured in countries where costs are incurred in Euros. Fluctuations in the Euro to U.S. dollar exchange rate will have an impact on the cost of the products we manufacture in those countries, but we would not likely be able to change our U.S. dollar selling prices of those same products in the United States in response to those cost fluctuations. As a result, fluctuations in the Euro to U.S. dollar exchange rates could have a significant impact on our gross profit in future periods in which that inventory is sold. Impacts associated with fluctuations in foreign currency exchange rates are discussed in more detail under “Item 7A. Quantitative and Qualitative Disclosures about Market Risk.”

We evaluate our results of operations on both an as reported and a constant currency basis. The constant currency presentation is a non-GAAP financial measure, which excludes the impact of fluctuations in foreign currency exchange rates. We believe providing constant currency information provides valuable supplemental information regarding our results of operations, consistent with how we evaluate our performance. We calculate constant currency percentages by converting our current-period local currency financial results using the prior-period foreign currency exchange rates and comparing these adjusted amounts to our prior-period reported results. This calculation may differ from similarly-titled measures used by others; and, accordingly, the constant currency presentation is not meant to be a substitution for recorded amounts presented in conformity with GAAP nor should such amounts be considered in isolation.

31, Revenue and Expense Components2014

The following is a description of the primary components of revenue and expenses.

Revenue

We derive our revenue from the sale of medical devices that are used by orthopaedic surgeons who treat diseases and disorders of extremity joints including the shoulder, elbow, wrist, hand, ankle and foot, and large joint, including the hip and knee. We report our sales in four primary product categories: upper extremity joints and trauma, lower extremity joints and trauma, sports medicine and biologics, and large joints and other. Our revenue is generated from sales to two types of customers: healthcare institutions and distributors, with sales to healthcare institutions representing a majority of our revenue. In the United States, we sell through a focused sales channel consisting of a network of mostly independent commission-based sales agencies, with some direct sales organizations in certain territories. Internationally, in select markets, we sell our full product portfolio, including upper extremity joints and trauma, lower extremity joints and trauma, sports medicine and biologics and large joints. Revenue from sales to healthcare institutions is recognized at the time of surgical implantation. We generally record revenue from sales to our distributors at the time the product is shipped to the distributor. These distributors, who sell the products to their customers, take title to the products and assume all risks of ownership at the time of shipment. Our distributors are obligated to pay within specified terms regardless of when, if ever, they sell the products. We charge our customers for shipping and record shipping revenue as part of revenue.

Cost of Goods Sold

We manufacture a majority of the products that we sell. Our cost of goods sold consists primarily of direct labor, manufacturing overhead, raw materials and components, and excludes amortization of intangible assets, which is presented as a separate component of operating expenses. A portion of the products we sell are manufactured by third parties, and our cost of goods sold for those products consists primarily of the price invoiced to us by our third-party vendors. Cost of goods sold also includes share-based compensation expenses related to individuals whose salaries are also included within this category. All of our internal manufacturing facilities are located in Europe and the related manufacturing costs are incurred in Euro. As a result, the cost of goods sold for our products manufactured in Europe and then sold in the United States and other geographies with functional currencies other than the Euro is subject to foreign currency exchange rate fluctuations, which can impact our gross profits.

Selling, General and Administrative Expenses

Our selling, general and administrative expenses consist of both variable components, which fluctuate based on our revenues, and non-variable components, which do not fluctuate based on our revenues. Our variable selling costs consist primarily of commissions paid to our independent sales agencies used in the United States and some other countries to generate sales, royalties based on certain product sales and freight expense we pay to ship our products to customers. Our non-variable sales costs consist primarily of salaries, personnel costs, including share-based compensation and other support costs related to the selling, marketing and support of our products as well as trade shows, promotions and physician training. Selling, general and administrative expenses also include the cost of distributing our products, which includes the operating costs and certain administrative costs related to our various worldwide sales and distribution operations. We provide surgical instrumentation to our customers for use during procedures involving our products. There are no contractual arrangements related to our customers’ use of our surgical instrumentation and we do not charge a fee for providing access to the related instrumentation. We record surgical instrumentation on our balance sheet as a long-lived asset. The depreciation expense related to our surgical instrumentation is included in sales, general and administrative expenses. Additionally, expenses for our executive, finance, legal, compliance, administrative, information technology and human resource departments are included in selling, general and administrative expenses, as well as the U.S. Medical Device Excise tax which was effective on January 1, 2013.

Research and Development Expenses

Research and development expenses include costs associated with the design, development, testing, deployment and enhancement of products and certain regulatory costs. This category also includes costs associated with the design and execution of our clinical trials and regulatory submissions. Research and development expenses also include share-based compensation related to individuals within our research and development groups.

Amortization of Intangible Assets

Our intangible assets include developed technology, customer relationships, trademarks and trade names and other identified intangibles as a result of business acquisitions. In addition, intangible assets also include purchases of intellectual property including patents, license rights and customer lists, among other things. The amortization expenses related to these items is recorded in amortization of intangible assets within operating expenses.

Special Charges

Special charges are recorded as a separate line item within our operating expenses on the consolidated statement of operations and include operating expenses directly related to business combinations and related integration activities, restructuring initiatives, management exit costs, and certain other items that are typically infrequent in nature and that affect the comparability and trend of operating results.

Interest Income

Interest income reflects interest associated with both our cash held at financial institutions and highly liquid investments with maturities of three months or less.

Interest Expense

Interest expense reflects interest associated with our senior secured term loans, revolving line of credit, mortgage-related debt and capital leases. We also accrete interest expense on our earnout liabilities related to previous business acquisitions.

Foreign Currency Transaction (Loss) Gain

Foreign currency transaction (loss) gain consists primarily of foreign currency gains and losses on transactions denominated in a currency other than the functional currency of the related entity. Our foreign currency transactions primarily consist of foreign currency denominated cash, liabilities and intercompany receivables and payables.

Other Non-Operating Income (Expense)

Other non-operating income (expense) primarily relates to the results of transactions that are not directly associated with the results of our ongoing primary operating activities.

Income Tax Benefit

Income tax benefit includes federal income taxes, income taxes in foreign jurisdictions, state income taxes and changes to our deferred taxes and deferred tax valuation allowance.

Results of Operations

Fiscal Year Comparisons

The following table sets forth, for the periods indicated, certain items from our consolidated statementsresults of operations expressed as dollar amounts (in thousands) and as percentages of net sales:
 Fiscal year ended
 December 27, 2015 December 31, 2014
 Amount% of sales Amount% of sales
Net sales$415,461
100.0 % $298,027
100.0 %
Cost of sales1
119,255
28.7 % 73,223
24.6 %
Gross profit296,206
71.3 % 224,804
75.4 %
Operating expenses:     
Selling, general and administrative1
429,398
103.4 % 289,620
97.2 %
Research and development1
39,855
9.6 % 24,963
8.4 %
Amortization of intangible assets16,922
4.1 % 10,027
3.4 %
Total operating expenses486,175
117.0 % 324,610
108.9 %
Operating loss(189,969)(45.7)% (99,806)(33.5)%
Interest expense, net41,358
10.0 % 17,398
5.8 %
Other expense (income), net10,884
2.6 % 129,626
43.5 %
Loss from continuing operations before income taxes(242,211)(58.3)% (246,830)(82.8)%
(Benefit) provision for income taxes(3,851)(0.9)% (6,334)(2.1)%
Net loss from continuing operations$(238,360)(57.4)% $(240,496)(80.7)%
Loss from discontinued operations, net of tax 1
(60,341)  (19,187) 
Net loss$(298,701)  $(259,683) 
___________________________

54


1These line items include the following amounts of non-cash, share-based compensation expense for the periods indicated:
 Fiscal year ended
 December 27, 2015% of sales December 31, 2014% of sales
Cost of sales$287
0.1% $254
0.1%
Selling, general and administrative22,777
5.5% 10,149
3.4%
Research and development1,900
0.5% 1,084
0.4%
Income from discontinued operations, net of tax
n/a
 
n/a

The following table sets forth our net sales by product line for the periods indicated (in thousands) and the percentage of revenue that such items represent for the periods shown.

   Year ended 
   December 30,
2012
  January 1,
2012
  January 2,
2011
 

Statements of Operations Data:


Revenue

  $277,520    100 $261,191    100 $227,378    100

Cost of goods sold

   81,918    30    74,882    29    63,437    28  


Gross profit

   195,602    70    186,309    71    163,941    72  

Selling, general and administrative

   170,447    61    161,448    62    149,175    66  

Research and development

   22,524    8    19,839    8    17,896    8  

Amortization of intangible assets

   11,721    4    11,282    4    11,492    5  

Special charges

   19,244    7    892    0    306    0  


Operating loss

   (28,334  (10  (7,152  (3  (14,928  (7

Interest income

   338    0    550    0    223    0  

Interest expense

   (3,733  (1  (4,326  (2  (21,805  (10

Foreign currency transaction (loss) gain

   (473  (0  193    0    (8,163  (4

Loss on extinguishment of debt

   (593  (0  (29,475  (11        

Other non-operating income

   116    0    1,330    1    43    0  


Loss before income taxes

   (32,679  (12  (38,880  (15  (44,630  (20

Income tax benefit

   10,935    4    8,424    3    5,121    2  


Consolidated net loss

   (21,744  (8  (30,456  (12  (39,509  (17

Net loss attributable to noncontrolling interest

                   (695  0  


Net loss attributable to Tornier

   (21,744  (8  (30,456  (12  (38,814  (17

Accretion of noncontrolling interest

                   (679  0  


Net loss attributable to ordinary shareholders

  $(21,744  (8)%  $(30,456  (12)%  $(39,493  (17)% 


The following tables set forth, for the periods indicated, our revenue by product category and geography expressed as dollar amounts and the changes in revenue between the specified periods expressed as percentages:

year-over-year change:

 Fiscal year ended
 December 27, December 31, %
 2015 2014 change
U.S.     
Lower extremities187,096
 148,631
 25.9 %
Upper extremities58,756
 15,311
 283.8 %
Biologics50,583
 45,494
 11.2 %
Sports med & other3,388
 2,641
 28.3 %
Total extremities & biologics299,823
 212,077
 41.4 %
Large joint18
 
 N/A
Total U.S.$299,841
 $212,077
 41.4 %
      
International     
Lower extremities51,200
 47,001
 8.9 %
Upper extremities24,789
 11,312
 119.1 %
Biologics19,652
 20,590
 (4.6)%
Sports med & other9,862
 7,047
 39.9 %
Total extremities & biologics105,503
 85,950
 22.7 %
Large joint10,117
 
 N/A
Total International$115,620
 $85,950
 34.5 %
      
Total Sales$415,461
 $298,027
 39.4 %
Net sales
Revenue by Product CategoryU.S. Sales.

    Year ended   Percent change 
   December 30,
2012
   January 1,
2012
   January 2,
2011
   2012/
2011
  2011/
2010
  2012/
2011
  2011/
2010
 
   ($ in thousands)   (as stated)  (constant
currency)
 

Upper extremity joints and trauma

  $175,242    $164,064    $139,175     7  18  9  16

Lower extremity joints and trauma

   34,109     26,033     23,629     31    10    33    8  

Sports medicine and biologics

   15,526     14,779     13,210     5    12    7    10  


Total extremities

   224,877     204,876     176,014     10    16    12    14  

Large joints and other

   52,643     56,315     51,364     (7  10    1    4  


Total

  $277,520    $261,191    $227,378     6  15  9  12


Revenue by Geography

    Year ended   Percent change    
   January 1,
2012
   January 1,
2012
   January 2,
2011
   2012/
2011
  2011/
2010
  2012/
2011
  2011/
2010
 
   ($ in thousands)   (as stated)  (constant
currency)
 

United States

  $156,750    $141,496    $127,762     11  11  11  11

International

   120,770     119,695     99,616     1    20    8    14  


Total

  $277,520    $261,191    $227,378     6  15  9  12


Year Ended December 30, 2012 (2012) Compared to Year Ended January 1, 2012 (2011)

Revenue. Revenue increased by 6% to $277.5U.S. net sales totaled $299.8 million in 20122015, a 41% increase from $261.2$212.1 million in 2011 as a result2014, representing approximately 72% of increasedtotal net sales in all2015 and 71% of total net sales in 2014. Products acquired as part of the Wright/Tornier merger contributed sales of $51.6 million in 2015, which accounted for 24 percentage points of the increase from 2014.

Our U.S. lower extremities net sales increased to $187.1 million in 2015 from $148.6 million, representing growth of 26% over 2014. Sales in 2015 included $6.7 million from products acquired from the Wright/Tornier merger, which accounted for 4 percentage points of the increase. The remaining $31.8 million increase was driven by continued success of our Total Ankle Replacement products, as well as growth in our core foot and ankle plating systems. 
Our U.S. upper extremities net sales increased to $58.8 million in 2015 from $15.3 million, representing growth of 284%, driven entirely by $43.3 million of acquired product sales from the Wright/Tornier merger.
Our U.S. biologics net sales totaled $50.6 million in 2015, representing an 11% increase over 2014, primarily driven by sales of recently launched biologic products, including AUGMENT® Bone Graft, which was commercially launched in fourth quarter of 2015.
International Extremities Sales. Net sales of our extremities categories, partially offset byproducts in our international regions totaled $105.5 million in 2015, a decrease23% increase from $86.0 million in 2014. Products acquired as part of the Wright/Tornier merger

55


contributed sales of large joints and other due primarily to$21.7 million in 2015, which accounted for 25 percentage points of the negativeincrease from 2014. Our 2015 international extremities sales included an unfavorable foreign currency impact of approximately $10.5 million when compared to 2014 net sales, which had a 12 percentage point unfavorable impact on the growth rate.
Our international lower extremities net sales increased 9% to $51.2 million in 2015, including a $6.2 million unfavorable foreign currency exchange rates. Theimpact which had a 13 percentage point unfavorable impact on the growth experiencedrate. Sales in 2015 included $2.5 million from products acquired from the extremities categories was driven primarily by increased demand, product expansion and our acquisition of OrthoHelix. Excluding the negative impacts of foreign currency exchange rate fluctuations of approximately $8.1 million, principally due to the performanceWright/Tornier merger, which accounted for 5 percentage points of the U.S. dollar against the Euro, on a constant currency basis, our revenue grew by 9%.

Revenue by product category. Revenue in upper extremity joints and trauma increased by 7% to $175.2 million in 2012 from $164.1 million in 2011, primarily as a result of the continued increase in sales of our Aequalis reversed and Aequalis Ascend shoulder products, and to a lesser degree, our Simpliciti shoulder products. We believe that increased sales of our Aequalis reversed shoulder products resulted from continued market growth in shoulder replacement procedures and continued market movement towards reversed shoulder replacement procedures. We also saw an increase in sales of our Aequalis Ascend shoulder products which continued to gain share in the shoulder replacement market. Included in the upper extremity joints and trauma revenue for 2012 was $0.2 million of incremental revenue from our acquisition of OrthoHelix. Offsetting these increases was the negative impact of foreign currency exchange rate fluctuations of $3.4 million. Excluding the impacts of foreign currency exchange rates, revenue in upper extremity joints and trauma increased by 9%. Revenue in our lower extremity joints and trauma increased by 31% to $34.1 million in 2012 from $26.0 million in 2011, primarily due to $7.8 million in incremental revenue from our acquisition of OrthoHelix. Revenue in sports medicine and biologics increased by 5% to $15.5 million in 2012 from $14.8 million in 2011. This increase was primarily attributable to increased sales of our anchor and suture products internationally, partially offset by a decrease in revenue of our biologics products. Biologics revenue primarily consisted of sales of our Conexa product. The market for this type of biologic product had been declining recently due to difficulties in reimbursement and a lack of supporting clinical data. We have been focused on providing the market additional clinical information related to our Conexa product and have seen revenue growth in recent periods. Revenue from large joints and other decreased by 7% to $52.6 million in 2012 from $56.3 million in 2011 primarily related to negative foreign currency exchange rate fluctuations of $4.0 million. Excluding2015. Before the impact of foreign currency exchange rate fluctuations,and acquired products, the 17% increase was driven by an 8% increase in sales in our direct markets in Europe, a 50% increase in sales in Australia and a 30% increase in sales in Canada.     

Our international upper extremities net sales increased 119 percent to $24.8 million in 2015 from $11.3 million, driven entirely by $17.3 million of acquired product sales from the Wright/Tornier merger. Additionally, 2015 sales included a $1.1 million unfavorable foreign currency impact which had a 9 percentage point unfavorable impact on the growth rate.
Our international biologics net sales decreased 5% to $19.7 million, wholly attributable to a $2.0 million unfavorable foreign currency impact, which had a 10 percentage point unfavorable impact on the growth rate.
International Large Joint Sales. Our 2015 international large joints and other product revenue increased 1% on a constant currency basis in 2012 comparedjoint net sales of $10.1 million are wholly attributable to 2011. products acquired from the Wright/Tornier merger.
We believeanticipate that our 2016 net sales will show significant growth from 2015 due to the market growthimpact of large bonesthe acquired products, is lower than extremities products and would expect this trend to continueparticularly in the near future.

Revenueupper extremities product line, which we expect to be partially offset by geography. Revenueanticipated sales dis-synergies due to sales force integrations. Additionally, we anticipate higher levels of growth in our U.S. biologics net sales due to the ongoing launch of AUGMENT® Bone Graft in the United States increased by 11%States.

Cost of sales
Our cost of sales totaled $119.3 million or 28.7% of sales in 2015, compared to $156.8$73.2 million or 24.6% of sales in 2012 from $141.5 million in 2011. While the United States revenue was negatively affected by certain distribution channel changes made during 2012, overall United States revenue increased2014, representing an increase of 4.1 percentage points as a resultpercentage of the incremental revenue from our OrthoHelix acquisition and increases in sales in upper extremity joints and trauma products. Included in the United States revenue was $8.0 million in incremental revenue from our OrthoHelix acquisition. International revenue increased slightly to $120.8 million in 2012 from $119.7 million in 2011. International revenue was negatively impacted by foreign currency exchange rate fluctuations of approximately $8.1 million, principally due to the performance of the U.S. dollar against the Euro. Excluding the impact of foreign currency exchange rate fluctuations, our international revenue grew by 8% on a constant currency basis.net sales. This increase was primarily due todriven by $11.4 million (2.2% of net sales) of inventory step-up amortization in 2015 associated with inventory acquired from the Wright/Tornier merger, as well as increased revenue in France, Australia, the United Kingdom and the Netherlands as a result of increased demand.

Cost of goods sold. Our cost of goods sold increased by 9% to $81.9 million in 2012 from $74.9 million in 2011. As a percentage of revenue, cost of goods sold increased to 30% in 2012 from 29% in 2011, primarily due to a higher level ofprovisions for excess and obsolete inventory charges including $3.0 million related to product rationalization initiatives as a result of our acquisition of OrthoHelix. Additionally, cost of goods sold in 2012 included approximately $2.0 million in fair value adjustments related toand inventory acquired in our acquisitions of OrthoHelix and our exclusive stocking distributor in Belgium and Luxembourg. losses.

Our cost of goods soldsales and corresponding gross profit as a percentage of revenuepercentages can be expected to fluctuate in future periods depending upon certain factors, including, among others, changes in our product sales mix and prices, distribution channels and geographies, manufacturing yields, plans for insourcing some previously outsourced

production activities, inventory reserves required,period expenses, levels of production volume, and fluctuating inventory costs due to changes in foreign currency exchange rates since the period they were manufactured. In addition,rates. Additionally, we expect an increase over the next year in the level of ouranticipate that cost of goods sold from the sell through ofsales in 2016 will be unfavorably impacted by inventory step-up amortization associated with inventory acquired from business combinations.

the Wright/Tornier merger. This step-up amortization will be recognized over a 14-month period subsequent to the Wright/Tornier merger.

Selling, general and administrative. Ouradministrative
As a percentage of net sales, selling, general and administrative expenses increased by 6% to $170.4103.4% in 2015, compared to 97.2% in 2014. Selling, general and administrative expense included $75.9 million (18.3% of net sales) and $31.9 million (10.7% of net sales) of due diligence, transition, and transaction costs associated with the Wright/Tornier merger and other recent acquisitions in 2012 from $161.42015 and 2014, respectively. For 2015, selling, general and administrative expense also included a $13.1 million in 2011. As(3.2% of net sales) share-based compensation charge for accelerated vesting of outstanding unvested awards upon closing of the Wright/Tornier merger. For 2014, selling, general and administrative expense also included $1.2 million of costs related to management changes (0.4% of net sales) and $0.9 million of costs related to a percentagepatent dispute settlement (0.3% of revenue,net sales). The remaining selling, general and administrative expenses remained consistentdecrease as a percentage of sales was driven primarily by leveraging general and administrative expenses over increased net sales.
Research and development
Our investment in research and development activities represented 9.6% and 8.4% of net sales in 2015 and 2014, respectively. Research and development costs increased as a percentage of net sales in 2015 compared to 2014 primarily attributable to spending to support our product portfolio.
Amortization of intangible assets
Charges associated with amortization of intangible assets totaled $16.9 million in 2015, compared to $10.0 million in 2014. This increase was driven by amortization of intangible assets acquired as part of the Wright/Tornier merger, as well as a $1.8 million write-off of a legacy Wright intangible asset. Based on intangible assets held at 62%December 27, 2015, we expect to amortize approximately $25.2 million in 20122016, $24.6 million in 2017, $20.8 million in 2018, $19.2 million in 2019, and 2011. The$18.5 million in 2020.

56


Interest expense, net
Interest expense, net, totaled $41.4 million in 2015 and $17.4 million in 2014. Increased interest expense was driven by the increase in debt outstanding following the issuance of the 2020 Notes in the first quarter of 2015. Our 2015 interest expense related primarily to non-cash interest expense associated with the amortization of the discount on the 2020 Notes and 2017 Notes of $21.8 million and $2.9 million, respectively; amortization of deferred financing charges on the 2020 Notes and 2017 Notes of $2.7 million and $0.5 million, respectively; and cash interest expense on the 2020 Notes and 2017 Notes totaling $12.8 million. Our 2014 interest expense related primarily to non-cash interest expense associated with the amortization of the discount on the 2017 Notes of $9.3 million, as well as cash interest expense on the 2017 Notes totaling $6.0 million.
Our interest income generated in 2015 and 2014 was approximately $0.3 million in both years, and was generated by our invested cash balances and investments in marketable securities. The amount of interest income we expect to realize in 2016 and beyond is subject to variability, dependent upon both the rate of invested returns we realize and the amount of excess cash balances on hand.
Other expense (income), net
Other expense (income), net was $10.9 million of expense in 2015, compared to $129.6 million of income in 2014. For 2015, other expense, net includes a gain of $7.6 million for the mark-to-market adjustment on the CVRs issued in connection with the BioMimetic acquisition, as well as an unrealized gain of $9.9 million for the mark-to-market adjustment on our derivatives, offset by a $25.1 million charge for write-off of pro-rata unamortized deferred financing fees and debt discount with repayment of $240 million of the 2017 Notes. For 2014, other expense, net includes an unrealized loss of $125.0 million for the mark-to-market adjustment on the CVRs issued in connection with the BioMimetic acquisition, $1.8 million for the fair value adjustment for contingent consideration associated with the WG Healthcare acquisition, and an unrealized loss of $2.0 million for net mark-to-market adjustments on our derivative asset and liability.
Benefit (provision) for income taxes
We recorded a tax benefit of $3.9 million in 2015 and $6.3 million in 2014. During 2015, our effective tax rate was approximately 1.6%, as compared to 2.6% in 2014. Our 2015 tax benefit was primarily attributable to losses benefited in jurisdictions where we did not have a valuation allowance. Our 2014 tax benefit included $5.5 million of benefit recorded in continuing operations as a result of the gain realized in discontinued operations. Our relatively low effective tax rate in both periods was primarily related to the valuation allowance on our U.S. net deferred tax assets, resulting in the inability to recognize a tax benefit for pre-tax losses in the United States except to the extent to which we recognize a gain in discontinued operations.
Loss from discontinued operations, net of tax
Loss from discontinued operations, net of tax, consists of the operations of the OrthoRecon business that was sold to MicroPort. For 2014, net loss from discontinued operations included operations from January 1 through January 9, 2014, which was the closing date of the transaction, costs associated with external legal defense fees, and changes to any contingent liabilities associated with the OrthoRecon business, as well as the $24.3 million gain on the sale of the OrthoRecon business. Subsequent to the closing date, costs associated with legal defense, income/loss associated with product liability insurance recoveries/denials, and changes to any contingent liabilities associated with the OrthoRecon business have been reflected within results of discontinued operations, and we will continue to reflect these within results of discontinued operations in future periods.


57


Comparison of the year ended December 31, 2014 to the year ended December 31, 2013
The following table sets forth, for the periods indicated, our results of operations expressed as dollar amounts (in thousands) and as percentages of net sales:
 Year ended December 31,
 2014 2013
 Amount% of sales Amount% of sales
Net sales$298,027
100.0 % $242,330
100.0 %
Cost of sales1
73,223
24.6 % $59,721
24.6 %
Gross profit224,804
75.4 % 182,609
75.4 %
Operating expenses:     
Selling, general and administrative1
289,620
97.2 % 230,785
95.2 %
Research and development1
24,963
8.4 % 20,305
8.4 %
Amortization of intangible assets10,027
3.4 % 7,476
3.1 %
BioMimetic impairment charges
 % 206,249
85.1 %
Total operating expenses324,610
108.9 % 464,815
191.8 %
Operating loss(99,806)(33.5)% (282,206)(116.5)%
Interest expense, net17,398
5.8 % 16,040
6.6 %
Other expense, net129,626
43.5 % (67,843)(28.0)%
Loss from continuing operations before income taxes(246,830)(82.8)% (230,403)(95.1)%
Provision for income taxes(6,334)(2.1)% 49,765
20.5 %
Net loss from continuing operations$(240,496)(80.7)% $(280,168)(115.6)%
(Loss) income from discontinued operations, net of tax 1
(19,187)  6,223
 
Net loss$(259,683)  $(273,945) 
___________________________
1These line items include the following amounts of non-cash, share-based compensation expense for the periods indicated:
 Year Ended December 31,
 2014% of sales 2013% of sales
Cost of sales$254
0.1% $503
0.2%
Selling, general and administrative10,149
3.4% 10,675
4.4%
Research and development1,084
0.4% 780
0.3%
Loss from discontinued operations, net of tax
n/a
 3,410
n/a


58


The following table sets forth our net sales by product line for the periods indicated (in thousands) and the percentage of year-over-year change:
 Fiscal year ended
 December 31, December 31, %
 2014 2013 change
U.S.     
Lower extremities148,631
 115,642
 28.5 %
Upper extremities15,311
 17,423
 (12.1)%
Biologics45,494
 42,561
 6.9 %
Sports med & other2,641
 2,022
 30.6 %
Total extremities & biologics212,077
 177,648
 19.4 %
Large joint
 
 N/A
Total U.S.$212,077
 $177,648
 19.4 %
      
International     
Lower extremities47,001
 35,020
 34.2 %
Upper extremities11,312
 7,240
 56.2 %
Biologics20,590
 17,231
 19.5 %
Sports med & other7,047
 5,191
 35.8 %
Total extremities & biologics85,950
 64,682
 32.9 %
Large joint
 
 N/A
Total International$85,950
 $64,682
 32.9 %
      
Total Sales$298,027
 $242,330
 23.0 %

Net sales
U.S. Sales. U.S. net sales totaled $212.1 million in 2014, a 19% increase from $177.6 million in 2013, representing approximately 71% of total net sales in 2013 and 73% of total net sales in 2012. Products acquired from the 2014 Solana and OrthoPro acquisitions contributed sales of $22.4 million in 2014.
Our U.S. lower extremities net sales increased 29%, driven by sales of $20.8 million from products acquired from Solana and OrthoPro, as well as growth of our total ankle replacement products. The U.S. lower extremities sales growth includes the impact of the addition of Solana and OrthoPro's products into our existing direct sales force, offset by some cannibalization of product sales.
Our U.S. upper extremities net sales decreased to $15.3 million in 2014, representing a 12% decrease from 2013, driven by dis-synergies following the OrthoRecon divestiture.
Our U.S. biologics net sales increased 7% to $45.5 million in 2014, compared to $42.6 million in 2013, driven primarily by an increase in the sales of our PRO-DENSE® and ALLOPURE® line of products.
International Sales. Net sales in our international markets totaled $86.0 million in 2014, a 33% increase as compared to net sales of $64.7 million in 2013. Sales from products acquired from Biotech contributed sales of $13.7 million in 2014. Our 2014 international net sales included an unfavorable foreign currency impact of approximately $0.6 million when compared to 2013 net sales.
Our international lower extremities net sales increased 34% to $47.0 million in 2014, driven by sales of $8.2 million from products acquired from Biotech and increases in other geographic regions as a result of our focus on international market expansion.
Our international biologics net sales increased 19% as a result of a 33% increase in Asia, which was due to the addition of a new distribution partner in China in the second quarter of 2013, and a 21% increase of sales in Australia, primarily related to sales of AUGMENT® Bone Graft acquired from the BioMimetic acquisition in the first quarter of 2013.

59


Cost of sales
Our cost of sales were flat as a percentage of net sales, totaling $73.2 million or 24.6% of sales in 2014, compared to $59.7 million or 24.6% of sales in 2013. This was primarily a result of dis-synergies associated with fixed overhead manufacturing costs following the sale of our OrthoRecon business and increased inventory step-up amortization associated with acquisitions, offset by lower levels of provisions for excess and obsolete inventory.
Selling, general and administrative
As a percentage of net sales, selling, general and administrative expenses was primarily a resultincreased to 97.2% in 2014, compared to 95.2% in 2013. For 2014, selling, general and administrative expense included $14.1 million transition and transaction costs associated with acquired businesses (4.7% of $3.4net sales), $11.9 million of additional variable selling expenses including commissions, royaltiesWright/Tornier merger costs (4.0% of net sales), $5.8 million of transition costs associated with the sale of the OrthoRecon business (2.0% of net sales), $1.2 million of costs related to management changes (0.4% of net sales), and freight expenses due$0.9 million of costs related to increased revenue.a patent dispute settlement (0.3% of net sales). For 2013, Selling, general and administrative expenses also increased compared to 2011 as a resultexpense included $21.6 million of increased instrument depreciation, sales managementtransition costs associated with the sale of our OrthoRecon business (8.9% of net sales), $12.9 million of due diligence, transition, and transaction costs related to information technology, partially offset by a decrease in expensesour acquisitions of BioMimetic and Biotech (5.3% of net sales), and $0.9 million of cost related to certain management incentives. These items were partially offset by the favorable impactdistributor transition agreements (0.4% of foreign currency exchange rate fluctuations of $6.1 million. We expect annet sales). The remaining increase in our 2013 selling, general and administrative expenses as a result of the U.S. Medical Device Excise tax, which was effective on January 1, 2013.

Research and development. Research and development expenses increased by 14% to $22.5 million in 2012 from $19.8 million in 2011. As a percentage of revenue, research and development expenses remained consistent with the prior year period at 8%. The increasenet sales was driven by investment in total research and development expense of $2.7 million was primarily due to increased clinical study related expenses, an increased level of expenses on certain shoulder related development projects including the Ascend Flex convertible shoulder, certain biologics related development projects and increased personnel related expenses. These items were partially offset by the favorable impact of foreign currency exchange rate fluctuations of $0.8 million and a decrease in expenses related to certain management incentives. We anticipate that research and development expense will not remain at our current levels.

Amortization of intangible assets. Amortization of intangible assets increased by 4% to $11.7 million in 2012 from $11.3 million in 2011, primarilyinternational growth opportunities, dis-synergies as a result of the sale of the OrthoRecon business in certain corporate and international expenses, and short-term expense dis-synergies associated with the acquired Solana and OrthoPro businesses, which were partially offset by lower levels of expense for cash incentive compensation. The dis-synergies as a result of the sale of the OrthoRecon business included expenses associated with our information technology support, a new corporate headquarters, and international employees and facilities.

Research and development
Our investment in research and development activities represented 8.4% of net sales in both 2014 and 2013. Research and development costs as a percentage of net sales were flat in 2014 as compared to 2013 primarily attributable to increased sales levels, partially offset by dis-synergies in certain shared functions as a result of the sale of the OrthoRecon business.
Amortization of intangible assets
Charges associated with amortization of intangible assets recorded through our acquisitiontotaled $10.0 million in 2014, compared to $7.5 million in 2013. This increase was driven by intangible assets acquired during the first quarter of OrthoHelix2014 and the acquisitionfourth quarter of our exclusive stocking distributor2013. (See further discussion in Belgium and Luxembourg in 2012, partially offset by the complete amortization of certain license related intangible assets that were fully amortized in 2011.

Special charges. Special charges were $19.2 million in 2012 compared to $0.9 million in 2011. Special charges in 2012 included approximately $6.4 million of expense related to our facilities consolidation initiative. The $6.4 million is comprised of employee-benefit related expenses including severance and retention of terminated employees in the U.S., moving and transportation expenses, impairment charges on fixed assets related to the impacted facilities of Stafford, Texas and Dunmanway, Ireland, lease termination costs related to the Edina, Minnesota facility, professional fees and other expenses. Also included in special charges in 2012 is approximately $2.0 million of bad debt expense related to the termination of a distributor and worsening general economic conditions in Italy, $1.4 million of expense related to certain distribution changes in the U.S. and internationally, $3.5 million of integration costs related to our acquisitions of OrthoHelix and our exclusive stocking distributor in Belgium and Luxembourg, $1.2 million of expense related to management exit costs including the departures of our former Chief Executive Officer and Global Chief Financial Officer and $4.7 million of intangible impairment charges. For 2011, the $0.9 million of special charges were primarily related to severance costs from management organizational changes in 2011. See Note 133 to our consolidated financial statements contained in “Item 8. Financial Statements and Supplementary Data.”). This increase was partially offset by a decrease in amortization expense associated with certain distributor non-compete agreements that became fully amortized during 2014.

BioMimetic impairment charges
There were no BioMimetic impairment charges in 2014. During the quarter ended September 30, 2013, we recorded charges of approximately $206.2 million associated with the BioMimetic business acquired in the first quarter of 2013. On August 7, 2013, we received a not approvable letter from the FDA in response to our premarket approval application for further detailsAUGMENT® Bone Graft for use as an alternative to autograft in hindfoot and ankle fusion procedures, and we were required to evaluate assets associated with the BioMimetic acquisition for impairment. As a result of this evaluation, we recorded an intangible impairment charge of approximately $88.1 million and a goodwill impairment charge of $115.0 million, as well as the recognition of a $3.2 million charge for non-cancelable inventory commitments for the raw materials used in the manufacture of AUGMENT® Bone Graft, which we estimated would expire unused.
Interest expense, net
Interest expense, net, consisted of interest expense of $17.7 million in 2014 and $16.4 million in 2013, partially offset by interest income of $0.3 million in both 2014 and 2013. Our interest expense related primarily to non-cash interest expense associated with the amortization of the discount on our 2017 Notes of $9.3 million and $8.7 million in 2014 and 2013, respectively, and non-cash interest expense related to the amortization of deferred financing costs of $1.7 million and $1.6 million in 2014 and 2013, respectively, as well as cash interest expense on our 2017 Notes totaling $6.0 million in both 2014 and 2013.
Other expense, net
Other expense (income), net was $129.6 million of expense in 2014, compared to $67.8 million of income in 2013. For 2014, other expense, net included an unrealized loss of $125.0 million for the mark-to-market adjustment on the facilities consolidation initiativeCVRs issued in connection with the BioMimetic acquisition, $1.8 million for the fair value adjustment for contingent consideration associated with the WG Healthcare acquisition, and an unrealized loss of $2.0 million for net mark-to-market adjustments on

60


our derivative asset and liability. For 2013, other special charges. expense (income), net included a $61.1 million unrealized gain on the CVRs issued in connection with the BioMimetic acquisition and a $7.8 million realized gain on our previously held investment in BioMimetic, partially offset by an unrealized loss of $1.0 million for net mark-to-market adjustments on our derivative asset and liability.
Provision (benefit) for income taxes
We expectrecorded a tax benefit of $6.3 million in 2014 and tax expense of $49.8 million in 2013. During 2014, our effective tax rate was approximately 2.6% as compared to continue to record special charges(21.6)% in 2013 aggregating to approximately $10 million to $12 million,2013. Our relatively low effective tax rate in 2014 was primarily related to inventory step-up, the integration of OrthoHelix and transitions withinvaluation allowance on our U.S. distribution channel.

Interest income.Our interest income decreased by 38%net deferred tax assets, resulting in the inability to $0.3 millionrecognize a tax benefit for pre-tax losses in 2012 from $0.6 million in 2011, primarily as a result of lower average levels of cash held and decreased average interest rates in 2012 compared to 2011.

Interest expense. Our interest expense decreased by 14% to $3.7 million in 2012 from $4.3 million in 2011 due primarilythe United States, except to the repaymentextent to which we recognize a gain in discontinued operations. Our 2014 tax benefit, therefore, included $5.5 million of our notes payablebenefit recorded in February 2011. Our interest expense for 2012 related primarily to the interest paid on our term loans, mortgages, and prior lines of credit and overdraft arrangements. We anticipate an increase in our interest expense in future periodscontinuing operations as a result of the establishment of a new credit facilitygain realized in late 2012, which was used to fund our acquisition of OrthoHelix, that significantly increased our total debt. In addition, we expect to accrete additional interest expense on the OrthoHelix earn-out liabilities.

Foreign currency transaction (loss) gain. We recognized $0.5 million of foreign currency transaction losses in 2012 compared to $0.2 million of foreign currency transaction gains in 2011. Foreign currency gains and losses are recognized when a transaction is denominated in a currency other than the subsidiary’s functional currency and are primarily attributable to foreign currency exchange rate fluctuations on foreign currency denominated intercompany payables and receivables.

Loss on extinguishment of debt.We recognized a $0.6 million loss on the extinguishment of debt in 2012 as a result of penalties incurred upon repayment of certain portions of our European debt. We were required to pay-off all existing debt prior to entering into the senior secured term loans that were used to finance our acquisition of OrthoHelix. See Note 8 to our consolidated financial statements for further details. In 2011, we recognized a $29.5 million loss on extinguishment of debt due to the repayment of our notes payable.discontinued operations. Our notes payable were issued in 2008 and 2009 together with warrants to purchase ordinary shares of our company. At the time of issuance, we recognized the estimated fair value of the warrants as a warrant liability with an offsetting debt discount to reduce the carrying value of the notes payable to the estimated fair value at the time of issuance. This debt discount was then amortized as additional interest expense over the term of the notes. At the time of repayment in the first quarter of 2011, we recognized the remaining unamortized portion of the discount as a loss on the extinguishment of debt. See Note 7 to our consolidated financial statements for further discussion of the accounting treatment of the notes payable and related warrants.

Other non-operating income. Our other non-operating income decreased to $0.1 million in 2012 from $1.3 million in 2011. The $1.3 million related to 2011 was primarily due to the recognition of a gain related to the resolution of our contingent liability recorded as a part of our acquisition of C2M Medical Inc.

Income tax benefit.Our effective tax rate was 33.5% in 2012 and 21.6% in 2011, respectively. The change in our effective tax rate from 2011 to 2012 primarily relates to the relative percentage of our pre-tax income from operations in countries with related income2013 tax expense comparedincluded a $119.6 million provision to operations in countries in which we have pre-tax losses but for which we record a valuation allowance against our deferred tax assets and thus, cannot recognize income tax benefits. In connectionprimarily associated with net operating losses in the acquisition of OrthoHelix in 2012, we recorded deferred tax liabilities of $11.9 million, which included $10.7 million related to amortizable intangible assets and $1.2 million related to indefinite-lived acquired in-process research and development. The deferred tax liabilities of $10.7 million related to the amortizable intangibles reduces our net deferred tax assets by a like amount and in a manner that provides predictable future taxable income over the asset amortization period. As a result, we reduced our pre-acquisition deferred tax asset valuation allowance in 2012 by $10.7 million, which has been reflected as an income tax benefit in our consolidated statements of operations. Although the deferred tax liability of $1.2 million related to acquired in-process research and development also reduces our net deferred tax assets by a like amount, it does so in a manner that does not provide predictable future taxable income because the related asset is indefinite-lived. Therefore, the deferred tax asset valuation allowance was not reducedUnited States as a result of this item. As a result, our income tax benefit increased to $10.9 million for the year ended December 30, 2012 compared to an income tax benefit of $8.4 million in 2011. Given our history ofrecent cumulative operating losses we do not generally record a provision for income taxes in the United States and certain of our European geographies.

Year Ended January 1, 2012 (2011) Compared to Year Ended January 2, 2011 (2010)

Revenue. Revenue increased by 15% to $261.2 million in 2011 from $227.4 million in 2010 as a result of increased sales in each of our product categories, with the most significant dollar increase occurring in our upper extremity joints and trauma category. The growth across all product categories was due primarily to increased demand and product expansion. Our overall revenue growth of 15% consisted of 11% growth in the United States and 20% growth in our international geographies. Our revenue was positively impacted by foreign currency exchange rate fluctuations of approximately $6.6 million during 2011. Our global revenue growth, excluding the impact of foreign currency exchange rate fluctuations for 2011, was 12%.

Revenue by product category. Revenue in upper extremity joints and trauma product category increased by 18% to $164.1 million in 2011 from $139.2 million in 2010 primarily as a result ofU.S. tax jurisdiction, which had an increase in sales of our Aequalis Reverse and Aequalis Ascend shoulder products. We believe that increased sales of our Aequalis shoulder products resulted from market growth in shoulder replacement procedures and market movement towards reversed shoulder replacement procedures. We also saw an increase in sales of our Ascend shoulder product which gained share in the shoulder replacement market. Revenue in our lower extremity joints and trauma increased by 10% to $26.0 million for 2011 from $23.6 million for 2010, primarily due to increased sales in our ankle replacement products in both the United States and internationally and increased sales of our ankle fusion product in the United States due to expanded instrument set availability. Revenue in sports medicine and biologics increased by 12% to $14.8 million for 2011 from $13.2 million for 2010. This increase was attributable to an increase in international sales of our sports medicine product lines. Revenue from large joints and other increased by 10% to $56.3 million for 2011 from $51.4 million for 2010. Our large joint and other revenue increase was primarily due to an increased level of sales in our hip and knee product lines in France, in addition to $2.7 million of favorable impact from changes in foreign currency exchange rates.

Revenue by geography. Revenue in the United States increased by 11% to $141.5 million in 2011 from $127.8 million in 2010, primarily driven by an increase in sales in upper extremities joints and trauma products. International revenue increased by 20% to $119.7 million in 2011 from $99.6 million in 2010. Our international revenue was positively

impacted by approximately $6.6 million in 2011 as a result of foreign currency exchange rate fluctuations, principally due to the performance of the U.S. dollar against the Euro. Excluding the impact of foreign currency exchange rate fluctuations, our international revenue increased by 14% in 2011, primarily due to increased revenue in France, Australia and Germany; however, nearly all of our international markets experienced constant currency revenue growth during 2011.

Cost of goods sold. Our cost of goods sold increased by 18% to $74.9 million in 2011 from $63.4 million in 2010. As aunfavorable 51.9 percentage of revenue, cost of goods sold increased to 29% in 2011 from 28% in 2010, primarily due to the impact of manufacturing variances in 2011 as compared to 2010 resulting from lower inventory growth offset partially by a lower level of inventory obsolescence expense. Our geographic revenue mix can also have anpoint impact on our cost2013 effective tax rate.

Loss (income) from discontinued operations, net of goodstax
Loss from discontinued operations, net of tax, consists of the operations of the OrthoRecon business that was sold to MicroPort. For 2014, net loss from discontinued operations included operations from January 1 through January 9, 2014, which was the closing date of the transaction, costs associated with external legal defense fees, and changes to any contingent liabilities associated with the OrthoRecon business, as a percentagewell as the $24.3 million gain on the sale of revenue because our international revenue generally resultsthe OrthoRecon business.
For 2014, income from discontinued operations included twelve months of activity of the OrthoRecon business.
Seasonality and Quarterly Fluctuations
We traditionally experience lower sales volumes in a higher levelthe third quarter than throughout the rest of cost of goods soldthe year as a percentage of revenue than our United States revenue due to the differences in selling pricesmany of our products are used in various countries. Our international revenue represented 46% of total revenueelective procedures, which generally decline during 2011 compared to 44% during 2010. However, the majority of the increasesummer months. This typically results in international revenue mix for the full year was in countries with relatively stronger pricing. The fourth quarter of 2010 included a higher level of revenue to our European distributor business than the fourth quarter of 2011. As a result, our shift in geographic mix for the full year of 2011 had a limited impact on our total gross profit as a percentage of revenue.

Selling, general and administrative. Our selling, general and administrative expenses increased by 8% to $161.4 million in 2011 from $149.2 million in 2010. Asand research and development expenses as a percentage of revenue,net sales that are higher during this period than throughout the rest of the year. In addition, our first quarter selling, general and administrative expenses decreased to 62% during 2011 compared to 66% during 2010 due primarily to leverageinclude additional expenses that we incur in connection with the annual meetings held by the American College of Foot and Ankle Surgeons and the American Academy of Orthopaedic Surgeons. During these three-day events, we display our existing salesmost recent and marketing infrastructure. The increase in total expense is primarily a result of $4.0 million related to foreign currency exchange rate fluctuations, $5.4 million of additional variable selling related expenses such as commissions, royalties and freight on our higher revenue base, and $0.8 million of increased instrument depreciation and maintenance costs from a higher level of instrumentsinnovative products in the field. In addition, we incurred increased legal, audit and administrative fees as a result of being a U.S. public reporting company as well as increased stock-based compensation expense in 2011.

Research and development. Research and development expenses increased by 11% to $19.8 million in 2011 from $17.9 million in 2010. As a percentage of revenue, research and development expenses remained at 8% during 2011 and 2010. The increase in total expenses was the result of increased clinical study related expenses and certain biologic related development projects as well as $0.4 million related to foreign currency exchange rate fluctuations.

Amortization of intangible assets. Amortization of intangible assets decreased by 2% to $11.3 million in 2011 from $11.5 million in 2010, primarily as a result of the impairment of an intangible that was abandoned in 2011.

Special charges. Special charges increased to $0.9 million for 2011 compared to $0.3 million for 2010. This increase was primarily related to severance costs from management organizational changes in 2011.

Interest income.Our interest income increased 147% to $0.5 million in 2011 from $0.2 million in 2010 as a result of an increase in cash from the net proceeds from our initial public offering in February 2011.

Interest expense. Our interest expense decreased by 80% to $4.3 million in 2011 from $21.8 million in 2010 as a result of the repayment of our notes payable in February 2011. Our notes payable carried an 8% stated interest rate and were recorded at a discount because they were issued together with warrants. The discount on our notes payable was previously also amortized as additional interest expense. As a result, the existence of our notes payable in prior periods caused a much higher level of interest expense. Other interest expense related to the interest paid on our term loans, mortgages, and existing lines of credit.

Foreign currency transaction gain (loss). We recorded a foreign currency transaction gain of $0.2 million in 2011 and a foreign currency transaction loss of $8.2 million in 2010. Our foreign currency transaction gains and losses recognized during the year relate to various foreign currency denominated intercompany balances between our various global operating entities. The primary driver of our foreign currency transaction loss in 2010 was related to the revaluation of our warrant liability which was denominated in a currency other than the functional currency of our parent legal entity. We settled our warrant liability in May 2010 by exchanging all the outstanding warrants for our ordinary shares.

Loss on extinguishment of debt.We recognized a $29.5 million loss on extinguishment of debt in 2011 due to the repayment of our notes payable. Our notes payable were issued in 2008 and 2009 together with warrants to purchase ordinary shares of the company. At the time of issuance, we recognized the estimated fair value of the warrants as a warrant liability with an offsetting debt discount to reduce the carrying value of the notes payable to the estimated fair value at the time of issuance. This debt discount was then amortized as additional interest expense over the term of the notes. At the time of repayment in the first quarter of 2011, we wrote-off the remaining unamortized portion of the discount as a loss on the

extinguishment of debt. See Note 7 to our consolidated financial statements for further discussion of the accounting treatment of the notes payable and related warrants.

Other non-operating income. We recorded other non-operating income of $1.3 million in 2011 and less than $0.1 million in 2010. The income in 2011 was primarily related to recognition of a gain on the resolution of a contingent liability recorded from the prior consolidation and acquisition of C2M Medical, Inc. The contingent liability related to then remaining earnout payments on sales of our Piton products. This earnout period ended during the third quarter of 2011 and the remaining liability was reversed and recognized as a gain in the same quarter.

Income tax benefit. Our income tax benefit increased $3.3 million to $8.4 million in 2011 compared to $5.1 million in 2010. Our effective tax rate for 2011 and 2010 was 22% and 11%, respectively. During 2011, we recognized $7.5 million of deferred tax benefit related to the $29.5 million loss on extinguishment of debt previously discussed. This benefit was the result of reversing the remaining deferred tax liability related to the unamortized debt discount on our notes payable at the time of repayment. The remaining income tax benefit recognized during 2011 related primarily to pre-tax losses of certain of our international subsidiaries. Our income tax benefit in 2010 primarily related to a tax benefit recorded related to our French subsidiaries as well as deferred tax benefit on the amortization of the debt discount recognized on our notes payable.

Seasonality and Quarterly Fluctuations

Our business is seasonal in nature. Historically, demand for our products has been the lowest in our third quarter as a result of the European holiday schedule during the summer months.

lower extremities market.

We have experienced and expect to continue to experience meaningful variability in our revenuenet sales and gross profitcost of sales as a percentage of net sales among quarters, as well as within each quarter, as a result of a number of factors including, among others,other things, the number and mix of products sold in the quarter and the geographies in which they are sold; the demand for, and pricing of our products and the products of our competitors; the timing of or failure to obtain regulatory clearances or approvals for products; costs, benefits, and timing of new product introductions; the level of competition; the timing and extent of promotional pricing or volume discounts; changes in average selling prices; the availability and cost of components and materials; number of selling days; fluctuations in foreign currency exchange rates; the timing of patients’ use of their calendar year medical insurance deductibles; and impairment and other special charges.

Liquidity and Capital Resources

Since inception, we have generated significant operating losses. These, combined with significant charges not related to cash from operations, which have included amortization of acquired intangible assets, fair value adjustments to a warrant liability and accretion of noncontrolling interests, have resulted in an accumulated deficit of $235.7 million as of December 30, 2012. Historically, our liquidity needs have been met through a combination of sales of our equity securities together with issuances of debt, including term loans, notes payable and warrants, and other bank related debt. In February 2011, we completed an initial public offering from which we received net proceeds of approximately $162.0 million after underwriters’ discounts, commissions and offering expenses. Certain notes payable were repaid in full during the first quarter of 2011 using $116.1 million of these proceeds.

The following table sets forth, for the periods indicated, certain liquidity measures:

   As of 
   December 30,
2012
   January 1,
2012
   January 2,
2011
 
   ($ in thousands) 

Balance Sheet


Cash and cash equivalents

  $31,108    $54,706    $24,838  

Working capital

   136,692     133,398     96,965  

Total debt

   120,052     39,911     138,120  

Lines of credit availability

   29,000     23,796     11,252  

On October 4, 2012,measures (in thousands):

 December 27, December 31,
 2015 2014
Cash and cash equivalents$139,804
 $227,326
Short-term marketable securities
 2,575
Working capital352,946
 249,958

Operating Activities. Cash used in operating activities totaled $195.9 million, $116.0 million, and $36.6 million in 2015, 2014, and 2013, respectively. The increase in cash used in operating activities in 2015 compared to 2014 was due to lower cash profitability, primarily due to costs associated with the Wright/Tornier merger and a $28 million milestone payment associated with the BioMimetic acquisition upon FDA approval of AUGMENT® Bone Graft. This portion of the payment represents the excess over the value originally assigned as part of the purchase price allocation.
The increase in cash used in operating activities in 2014 compared to 2013 was driven by decreased cash profitability, primarily due to costs associated with the sale of the OrthoRecon business, costs associated with the acquisitions of BioMimetic and Biotech, and operating expenses associated with the acquired BioMimetic business.

61


Investing Activities. Our capital expenditures totaled $43.7 million in 2015, $48.6 million in 2014, and $37.5 million in 2013. While capital expenditures in 2015 decreased from 2014, they were higher than normal due to capital spending on system integrations resulting from the Wright/Tornier merger and completion of the expansion of our U.S. corporate headquarters. The increase in 2014 compared to 2013 was primarily attributable to spending on the expansion of our manufacturing facility in Arlington, Tennessee and our U.S. corporate headquarters. Historically, our capital expenditures have consisted principally of purchased manufacturing equipment, research and testing equipment, and computer systems. Of the $43.7 million in capital expenditures in 2015, $38.7 million was for routine capital expenditures and $5.0 million was for capital expenditures associated with integration activities of the Wright/Tornier merger.
During 2015, we acquired OrthoHelix Surgical Designs, Inc. In$30 million of cash as a result of the Wright/Tornier merger since this merger was an all-stock transaction, and we paid consideration consisting of $100.4$4.9 million cash (including a final working capital adjustment of $0.3 million) and 1,941,270 of our ordinary shares (which was determined to be equal to $35.0 million divided byfor the average closing sale price per ordinary share during the five trading days immediately prior to and after the date of our initial public announcementacquisition of the merger agreement).Surgical Specialties sales and distribution business. In addition,2014, we agreed to make additional earn-out payments in cash of up topaid an aggregate of $20.0 million based upon our sales of lower extremity joints and trauma products during fiscal years 2013 and 2014. Of the transaction consideration, $10.0$81 million in cash, remainsnet of cash acquired, for the Solana and OrthoPro acquisitions.
Financing Activities. During 2015, cash provided by financing activities totaled $126.9 million, compared to $33.1 million in an escrow account2014 and $6.3 million in 2013. Cash provided by financing activities in 2015 resulted primarily from proceeds received from the issuance of the 2020 Notes, and to funda lesser extent, proceeds from the issuance of the related warrants and proceeds from settling the 2017 Notes hedge option. These amounts were partially offset by amounts used to redeem some of the 2017 Notes, repurchase all of the warrants related to the 2017 Notes, enter into hedges in connection with the 2020 Notes, repay legacy Tornier debt, and pay contingent consideration. See Notes 6 and 9 of our consolidated financial statements contained in “Item 8. Financial Statements and Supplementary Data” for additional information regarding our derivative and debt activity, respectively.
As of October 1, 2015, legacy Tornier had approximately $75 million in outstanding term debt and $7 million in a line of credit under a  pre-existing credit agreement.  Upon completion of the Wright/Tornier merger, we terminated all commitments under this credit agreement and repaid approximately $81 million in outstanding indebtedness. We did not incur any early termination penalties in connection with such repayment and termination.
During 2015, we paid a $70 million milestone payment obligationsassociated with respect post-closing indemnification obligationsthe BioMimetic acquisition upon FDA approval of OrthoHelix’s former equity holders. In addition, aAUGMENT® Bone Graft. This portion of the earn-outpayment represents the value originally assigned as part of the purchase price allocation.
During 2014, we received $37.2 million of cash in connection with the issuance of shares under our share-based compensation plan, as compared to $6.3 million in 2013. This increase was driven primarily by stock option exercises of former employees transferred to MicroPort following the sale of the OrthoRecon business.
As of December 27, 2015 and December 31, 2014, we had less than 25% of our consolidated cash and cash equivalents held in jurisdictions outside of the United States, which are expected to be indefinitely reinvested for continued use in operations outside of the United States. We do not intend to repatriate these funds as repatriation of these assets to the United States would have negative tax consequences.
Discontinued Operations. Cash flows from discontinued operations are combined with cash flows from continuing operations in the consolidated statements of cash flows. During 2015, cash used in discontinued operations was approximately $28 million associated with legal defense costs and settlement of product liabilities, net of insurance proceeds received. During 2014, cash provided by discontinued operations was approximately $250.5 million driven by the cash received from the sale of the OrthoRecon business, compared to $29 million in 2013. We do not expect that the future cash outflows from discontinued operations will have an impact on our ability to meet contractual cash obligations and fund our working capital requirements, operations, and anticipated capital expenditures.

62


Contractual Cash Obligations. At December 27, 2015, we had contractual cash obligations and commercial commitments as follows (in thousands):
 Payments due by periods
 Contractual obligations
Total Less than 1 year 1-3 years 3-5 years More than 5 years
Amounts reflected in consolidated balance sheet:         
Capital lease obligations(1)
$17,659
 $1,989
 $3,643
 $3,299
 $8,728
Long-term notes(2)
697,238
 835
 61,100
 632,930
 2,376
          
Amounts not reflected in consolidated balance sheet:         
Operating leases37,659
 10,001
 9,945
 6,999
 10,714
Interest on long-term debt notes(3)
55,009
 13,952
 26,227
 14,830
 
          
Total contractual cash obligations$807,565
 $26,777
 $100,915
 $658,058
 $21,818

(1)Payments include amounts representing interest.
(2)
Our long-term notes include 2017 and 2020 Notes, shareholder debt, and mortgages. See further discussion in Note 9 to our consolidated financial statements contained in “Item 8. Financial Statements and Supplementary Data.”
(3)
Represents interest on 2017 and 2020 Notes, shareholder debt, and mortgages. See further discussion in Note 9 to our consolidated financial statements contained in “Item 8. Financial Statements and Supplementary Data.”
Portions of these payments are denominated in foreign currencies and were translated in the table above based on their respective U.S. dollar exchange rates at December 27, 2015. These future payments are subject to foreign currency exchange rate risk.
The amounts reflected in the table above for capital lease obligations represent future minimum lease payments under our capital lease agreements, which are primarily for certain

rights property and equipment. The present value of set-offthe minimum lease payments are recorded in our balance sheet at December 27, 2015. The minimum lease payments related to these leases are discussed further in Note 9 to our consolidated financial statements contained in “Item 8. Financial Statements and Supplementary Data.”

The amounts reflected in the table above for post-closing indemnificationoperating leases represent future minimum lease payments under non-cancelable operating leases primarily for certain equipment and office space. In accordance with US GAAP, our operating leases are not recognized on our consolidated balance sheets; however, the minimum lease payments related to these agreements are disclosed in Note 16 to our consolidated financial statements contained in “Item 8. Financial Statements and Supplementary Data.”
The table above does not include the 2020 Notes Conversion Derivative (see "Item 7A. Quantitative and Qualitative Disclosures About Market Risk" for quantitative analysis on possible cash obligations upon maturity at various assumed stock prices).
The table above also does not include certain contingent consideration. Contingent consideration of OrthoHelix’sup to $84 million may be paid upon reaching certain revenue milestones related to the BioMimetic acquisition. In addition, contingent consideration of up to $1.5 million and $0.6 million may be paid upon achieving revenue milestones related to the acquisitions of Surgical Specialties Australia Pty and WG Healthcare, respectively. These potential additional cash payments are based on the future financial performance of the acquired assets. The estimated fair value of these liabilities has been recorded on our consolidated balance sheets within Accrued expenses and other current liabilities and Other long-term liabilities.
In addition to the contractual cash obligations discussed above, all of our U.S. sales and a portion of our international sales are subject to commissions based on net sales. A substantial portion of our global sales are subject to royalties earned based on product sales.
Additionally, as of December 27, 2015, we had approximately $10 million of unrecognized tax benefits recorded on our consolidated balance sheet. This represents the tax benefits associated with various tax positions taken, or expected to be taken, on U.S. and international tax returns that have not been recognized in our financial statements due to uncertainty regarding their resolution. We are unable to make a reliable estimate of the eventual cash flows by period that may be required to settle these matters. Certain of these matters may not require cash settlement due to the existence of net operating loss carryforwards. Therefore, our unrecognized tax benefits are not included in the table above. See Note 11 to our consolidated financial statements contained in “Item 8. Financial Statements and Supplementary Data.”

63


Other Liquidity Information. We have funded our cash needs since 2000 through various equity holders.

and debt issuances and through cash flow from operations.

In February 2015, WMG issued $632.5 million of the 2020 Notes, which generated net proceeds of approximately $613 million. In connection with our acquisitionthe offering of OrthoHelix,the 2020 Notes, WMG entered into convertible note hedging transactions with three counterparties. WMG also entered into warrant transactions in which WMG sold warrants for an aggregate of 20,489,142 shares of WMG common stock to these three counterparties. WMG used approximately $58 million of the net proceeds from the offering to pay the cost of the convertible note hedging transactions (after such cost was partially offset by the proceeds we received from the sale of the warrants). WMG also used approximately $292 million of the net proceeds from the offering to repurchase approximately $240 million aggregate principal amount of outstanding 2017 Notes in privately negotiated transactions.  On November 24, 2015, we entered into a new credit agreement. Undersupplemental indenture to the credit agreement, we borrowed $145.0 million, consisting of: (1)indenture governing the 2020 Notes which provided for, among other things, our full and unconditional guarantee, on a senior secured term loan facility to Tornier USA denominated in dollars in an aggregate principal amountunsecured basis, of up to U.S. $75.0 million (referred to as the USD term loan facility); (2) a senior secured term loan facility to Tornier USA denominated in euros in an aggregate principal amountall of upWMG's obligations relating to the U.S. dollar equivalent of U.S. $40.0 million (referred2010 Notes and to as the EUR term loan facility); and (3) a senior secured revolving credit facility to Tornier USA denominated at the election of Tornier USA, in U.S. dollars, euros, pounds, sterling and yen in an aggregate principal amount of upmake certain other adjustments to the U.S. dollar equivalentterms of U.S. $30.0 million. Funds available under the revolving credit facility may be used for general corporate purposes.

The borrowings underindenture to give effect to the term loan facilities were used to payWright/Tornier merger. Also on November 24, 2015, we assumed the consideration for our OrthoHelix acquisition, and fees, costs and expenses incurredwarrants initially issued by WMG in connection with the acquisition and the credit agreement and to repay prior existing indebtedness of us and our subsidiaries. The credit agreement contains customary covenants, including financial covenants which require2020 Note offering.

Although it is difficult for us to maintain minimum interest coverage and maximum total net leverage ratios, and customary events of default. The obligations under the credit agreement are guaranteed by us, Tornier USA and certain other ofpredict our subsidiaries, and subject to certain exceptions, are secured by a first priority security interest in substantially all of our assets and the assets of certain of our existing and future subsidiaries of Tornier.

Loans under our USD term facility bear interest at (a) the alternate base rate (if denominated in U.S. dollars), equal to the greatest of (i) the prime rate in effect on such day, (ii) the federal funds rate in effect on such day plus 1/2 of 1%, and (iii) the adjusted LIBO rate, with a floor of 1% (as defined in our new credit agreement) plus 1%, plus in the case of each of (i)-(iii) above, an applicable rate of 2.00% or 2.25% (depending on our total net leverage ratio as defined in our credit agreement), or (b) in the case of a eurocurrency loan (as defined in our credit agreement), at the applicable adjusted LIBO rate for the relevant interest period plus an applicable rate of 3.00% or 3.25% (depending on our total net leverage ratio), plus the mandatory cost (as defined in our credit agreement) if such loan is made in a currency other than U.S. dollars or from a lending office in the United Kingdom or a participating member state (as defined in our credit agreement). Under the EUR term facility, (a) alternate base rate loans bear interest at the alternate base rate plus the applicable rate, which is 3.00% or 3.25% (depending on our total net leverage ratio) and (b) eurocurrency loans bear interest at the adjusted LIBO rate for the relevant interest period, plus an applicable rate, which is 4.00% or 4.25% (depending on our total net leverage ratio), plus the mandatory cost, if applicable. Loans under our revolving credit facility bear interest at (a) the alternate base rate (if denominated in U.S. dollars), equal to the greatest of (i) the prime rate in effect on such day, (ii) the federal funds rate in effect on such day plus 1/2 of 1%, and (iii) the adjusted LIBO rate plus 1%, plus in the case of each of (i)-(iii) above, an applicable rate of 2.00% or 2.25% (depending on our total net leverage ratio as defined in our credit agreement), or (b) in the case of a eurocurrency loan (as defined in our credit agreement), at the applicable adjusted LIBO rate for the relevant interest period plus an applicable rate of 3.00% or 3.25% (depending on our total net leverage ratio), plus the mandatory cost (as defined in our credit agreement) if such loan is made in a currency other than U.S. dollars or from a lending office in the United Kingdom or a participating member state (as defined in our credit agreement).

Weliquidity requirements, we believe that our cash and cash equivalents balance for the combined business of approximately $31.1$139.8 million as of December 30, 2012 along with available credit under our revolving credit facility of $29.0 million27, 2015 will be sufficient for the next 12 months to fund our working capital requirements and operations, and permit anticipated capital expenditures during 2013. in 2016 of approximately $43 million, and meet our anticipated contractual cash obligations in 2016. However, our future funding requirements will depend on many factors, including our future net sales and expenses.

In the event that we would require additional working capital to fund future operations, or for other needs, we could seek to acquire that through additional issuances of equity or to a lesser extent due to limitations in place as a result of our credit facility, debt financing arrangements which may or may not be available on favorable terms at such time.

The following table sets forth, for the periods indicated, certain cash flow measures:

   As of 
   December 30,
2012
  January 1,
2012
  January 2,
2011
 
   ($ in thousands) 

Cash Flow


Consolidated net loss

   (21,744  (30,456  (39,509

Cash provided by operating activities

   14,431    23,166    2,889  

Cash used in investing activities

   (125,795  (29,475  (22,853

Cash provided by financing activities

   86,666    39,110    7,427  

Operating activities. Net cash provided If we raise additional funds by operating activities decreased by $8.8 millionissuing equity securities, our shareholders may experience dilution. Debt financing, if available, may involve covenants restricting our operations or our ability to $14.4 millionincur additional debt, in 2012 comparedaddition to $23.2 million in 2011. The primary driver of this decrease was the increase in the portionthose under our existing indentures. Any debt financing or additional equity that we raise may contain terms that are not favorable to us or our shareholders. If we do not have, or are not able to obtain, sufficient funds, we may have to delay development or commercialization of our consolidated

net loss that wasproducts or scale back our operations.

We intend to use our cash related. Our 2011 consolidated net loss of $30.5 million included a $29.5 million non-cash loss on the extinguishment of debt, while our 2012 consolidated net loss of $21.7 million included significant cash charges for our facilities consolidation initiative, the acquisitionbalance and integration of OrthoHelix,any additional financing to fund transaction and certain senior management exit costs, among other items.

Net cash provided by operating activities was $23.2 million in 2011 compared to net cash provided by operating activities of $2.9 million in 2010. The increase was primarily driven by improvement in our consolidated net loss adjusted for non-cash items and a reduced use of cash for working capital during 2011 as compared to 2010.

Investing activities. Net cash used in investing activities totaled $125.8 million, $29.5 million and $22.9 million in 2012, 2011 and 2010, respectively. The increase in net cash used in investing activities in 2012 compared to 2011 was primarily driven by cash paid for acquisitions. In 2012, our acquisition of OrthoHelix included cash consideration of $100.4 million, while the acquisition of our exclusive stocking distributor in Belgium and Luxembourg was a $2.2 million all-cash transaction. Our industry is capital intensive, particularly as it relates to surgical instrumentation. Historically, our capital expenditures have consisted principally of purchased manufacturing equipment, research and testing equipment, computer systems, office furniture and equipment and surgical instruments. Expenditures related to property, plant and equipment increased in 2012 as compared to 2011 due to investments made related to our facilities consolidation initiative. Total capital expenditures were $11.3 million, $6.6 million and $6.7 million in 2012, 2011 and 2010, respectively. Lastly, these items were partially offset by a year-over-year decrease in instrument additions in 2012. Our instrument additions in 2011 were higher than both 2012 and 2010 due to the allocation of a portion of our 2011 initial public offering proceeds to make additional investments in instrumentation to support anticipated future revenue growth. Instrument additions in 2012, 2011 and 2010 were $12.0 million, $19.7 million and $13.8 million, respectively. We anticipate that capital expenditures in 2013 will approximate their historical levels.

Financing activities. Net cash provided by financing activities totaled $86.7 million, $39.1 million and $7.4 million in 2012, 2011 and 2010, respectively. The increase in net cash provided by financing activities in 2012 compared to 2011 was due to proceeds received from the issuance of long-term debt of $115.0 million related to our acquisition of OrthoHelix. This increase in cash provided by financing activities was partially offset by the repayment of a majority of our previously existing debt, which was a requirement of the new credit agreement, and the incurrence of debt issuancetransition costs associated with the new credit agreement.

The increase in net cash provided by financing activities in 2011 comparedWright/Tornier merger, to 2010 was duefund growth opportunities for our extremities and biologics business, and to the receipt of approximately $168.8 million from the completion of our initial public offering and subsequent exercisepay certain retained liabilities of the underwriters’ overallotment option, netOrthoRecon business.

In process research and development. In connection with the BioMimetic acquisition, we acquired in-process research and development (IPRD) technology related to projects that had not yet reached technological feasibility as of underwriters’ discountsthe acquisition date, which included AUGMENT® Bone Graft, which was undergoing the FDA approval process, and commissions and offering expenses. ThisAUGMENT® Injectable Bone Graft. FDA approval of AUGMENT® Bone Graft in the United States for ankle and/or hindfoot fusion indications was offset in part byobtained during the repaymentthird quarter of our previously existing notes payable2015.
The acquisition date fair value of $116.1 million. We also used cashthe IPRD technology was $27.1 million for AUGMENT® Injectable Bone Graft. The fair value of the IPRD technology was reduced to reduce our short-term borrowings under various lines of credit by $10.5 million and our long-term borrowing arrangements net of newly issued long-term debt by $3.1 million.

Contractual Obligations and Commitments

The following table summarizes our outstanding contractual obligations$0 as of December 30, 2012 for31, 2014, which reflects the categories set forth below, assuming only scheduled amortizations and repayment at maturity:

   Payment Due By Period 
Contractual Obligations  Total   Less than
1 Year
   1 - 3 Years   3 - 5 Years   More than
5 Years
 
   ($ in thousands) 

Amounts reflected in consolidated balance sheet:


Bank debt

  $116,312    $3,971    $7,957    $104,015    $369  

Shareholder loan

   2,198     —       —       —       2,198  

Contingent consideration

   15,265     360     14,905     —       —    

Capital leases

   1,542     623     720     199     —    

Amounts not reflected in consolidated balance sheet:


Interest on bank debt

   22,401     5,318     10,101     6,925     57  

Interest on contingent consideration

   1,989     995     994     —       —    

Interest on capital leases

   156     80     65     11     —    

Operating leases

   31,920     5,489     9,098     72,14     10,119  


Total

  $191,783    $16,836    $43,840    $118,364    $12,743  


Off-Balance Sheet Arrangements

We do not have any off-balance sheet arrangements, as defined by the rules and regulationsimpairment charges recognized in 2013 after receipt of the SEC,not approvable letter from the FDA in response to a PMA application for AUGMENT® Bone Graft for use as an alternative to autograft in hindfoot and ankle fusion procedures.

In connection with the Wright/Tornier merger, we acquired IPRD technology related to three projects that had not yet reached technological feasibility as of the merger date. These projects included PerFORM Rev/Rev+, AEQUALIS® Adjustable Reversed Ext (AARE), and PerFORM+ that were assigned fair values of $14.5 million, $2.1 million, and $0.4 million, respectively, on the acquisition date.
The IPRD projects acquired are as follows:
AUGMENT® Injectable Bone Graft (Augment Injectable) combines rhPDGF-BB with an injectable bone matrix, and is targeted to be used in either open (surgical) treatment of fusions and fractures or closed (non-surgical) or minimally invasive treatment of fractures. AUGMENT® Injectable can be injected into a fusion or fracture site during an open surgical procedure, or it can be injected through the skin into a fracture site, in either case locally delivering rhPDGF-BB to promote fusion or fracture repair. Our initial clinical development program for AUGMENT® Injectable has focused on securing regulatory approval for open indications in the United States and in several markets outside the United States. Recently, we have focused our efforts on securing FDA approval of AUGMENT®. We currently estimate it could take one to three years to complete this project. We have incurred expenses of approximately $3.7 million for AUGMENT® Injectable since the date of acquisition and $1.2 million in the year ended December 27, 2015. We are currently evaluating future costs related to AUGMENT® Injectable following the recent Approvable Letter from the FDA on the AUGMENT® PMA.

64


PerFORM Rev/Rev+ is a next-generation reverse construct which replaces the existing Reverse II Glenoid Product. PerFORM Reverse consists of new baseplate options, with various backside angles and thicknesses to address additional glenoid deformities, and also includes a new central fixation technology that is different than any other system in the market. Development of this product is in manufacturing validation stage. Pre-market release trials are expected to start during early 2016 and 510(k) clearance is anticipated for later in 2016. We have oran anticipated completion date in 2017 and the cost to complete the project is estimated to be less than $1 million. However, the risks and uncertainties associated with completion are reasonably likelydependent upon FDA clearance.
AEQUALIS® Adjustable Reversed Ext (AARE) will ultimately be our second-generation revision product, with an improved implant that is convertible and addresses more indications, and a revamped instrument set that includes universal extraction instrumentation. The implants in this system are complete from a design standpoint, have regulatory approval, and are being sold using a previous generation of instrumentation in a limited capacity. The instruments for the new revision system are currently in design phase. We have an anticipated completion date in 2017 and project cost to complete is estimated to be less than $1 million. However, the risks and uncertainties associated with completion are dependent upon testing validations and FDA clearance.
PerFORM+ is a Posterior Augmented Glenoid product, specifically positioned to address glenoid deformities (B2, C2, classifications, etc.) in anatomic total shoulder constructs. PerFORM + recently completed the initial market release to a limited number of surgeons. Full launch of the product is expected in 2016. We have a material effect on our financial condition, changesan anticipated completion date in financial condition, revenue or expenses, results of operations, liquidity, capital expenditures or capital resources. As a result, we2016 and project cost to complete is estimated to be less than $1 million. However, the risks and uncertainties associated with completion are not materially exposed to any financing, liquidity, market or credit risk that could arise if we had engaged in these arrangements.

dependent upon FDA clearance.

Critical Accounting Policies

Our consolidated financial statementsEstimates

All of our significant accounting policies and related financial informationestimates are based on the application of U.S. GAAP. The preparation ofdescribed in Note 2 to our consolidated financial statements contained in conformity with U.S. GAAP requires us to make estimatesItem 8. Financial Statements and assumptions that affect the amounts reported in our consolidated financial statements and accompanying notes.

Supplementary Data.” Certain of our more critical accounting policiesestimates require the application of significant judgment by management in selecting the appropriate assumptions for calculating financial estimates.in determining the estimate. By their nature, these judgments are subject to an inherent degree of uncertainty. TheseWe develop these judgments are based on our historical experience, terms of existing contracts, our observance of trends in the industry, information provided by our physician customers, and information available from other outside sources, as appropriate. ChangesDifferent, reasonable estimates could have been used in the current period. Additionally, changes in accounting estimates are reasonably likely to occur from period to period. Changes inBoth of these estimates and changes in our businessfactors could have a material impact on the presentation of our consolidated financial statements.

condition, changes in financial condition, or results of operations.

We believe that the following accounting policiesfinancial estimates are both important to the portrayal of our financial condition and results of operations and require subjective or complex judgments. Further, we believe that the items discussed below are properly recognizedrecorded in our consolidated financial statements for all periods presented. ManagementOur management has discussed the development, selection, and disclosure of our most critical financial estimates with the audit committee andof our board of directors.directors and with our independent auditors. The judgments about those financial estimates are based on information available as of the date of our consolidated financial statements. Our critical accounting policies andThose financial estimates are described below:

include:

Revenue RecognitionDiscontinued operations.

We derive our revenue fromOn January 9, 2014, legacy Wright completed the sale of medical devices that are used by orthopaedic surgeons who treat diseases and disordersthe OrthoRecon business, which consists of extremity joints, including the shoulder, elbow, wrist, hand, ankle and foot, and large joints, including thelegacy Wright's hip and knee.knee product implants, to MicroPort. We determined that this transaction meets the criteria for classification as discontinued operations under the provisions of FASB ASC 205-20. As such, all historical operating results for the OrthoRecon business are reflected within discontinued operations in our consolidated statements of operations. In addition, costs incurred in 2013 associated with corporate employees and infrastructure transferred as a part of the sale have been included in discontinued operations. As this sale occurred in early 2014, costs for 2014 and 2015 primarily relate to product liability claims, including legal defense, settlements and judgments, and changes in contingent liabilities net of product liability insurance recoveries. Further, all assets and associated liabilities transferred to MicroPort were classified as assets and liabilities held for sale on our consolidated balance sheet, in accordance with FASB ASC 360.

Revenue recognition. Our revenue isrevenues are primarily generated from sales tothrough two types of customers: healthcare institutionscustomers, hospitals and distributors. Sales to healthcare institutions representsurgery centers and stocking distributors, with the majority of our revenue. Inrevenue derived from sales to hospitals and surgery centers. Our products are sold through a network of employee and independent sales representatives in the United States we sell through a focused sales channel primarily consisting of a network of mostly independent commission-based sales agencies, with some direct sales organizations in certain territories. Internationally, we utilizeand by a combination of directemployee sales organizations,representatives, independent sales representatives, and distributors. Generally, revenuestocking distributors outside the United States. We record revenues from sales to healthcare institutionshospitals and surgery centers when they take title to the product, which is generally when the product is surgically implanted in a patient.
During the quarter ended December 27, 2015, following the Wright/Tornier merger, we changed our estimate of uninvoiced revenue. While we have generally recognized revenue at the time that the product was surgically implanted, from a timing perspective, we now recognize revenue at the time the surgery and associated products used are reported, as opposed to previously when we received clerical documentation from the hospital. We have accounted for this as a change in estimate and have recorded additional revenue of surgical implantation. approximately $3 million in the quarter ended December 27, 2015.

65


We generally record revenuerevenues from sales to our stocking distributors at the time the product is shipped to the distributor. Distributors,Our stocking distributors, who sell the products to their customers, take title to the products and assume all risks of ownership at time of shipment. We do not have any arrangements with distributors that allow for retroactive pricing adjustments.ownership. Our stocking distributors are obligated to pay us within specified terms regardless of when, if ever, they sell the products. In certain circumstances, we may accept sales returns fromgeneral, our stocking distributors and in certain situations in which the rightdo not have any rights of return exists,or exchange; however, in limited situations, we estimatehave repurchase agreements with certain stocking distributors. Those certain agreements require us to repurchase a reserve forspecified percentage of the inventory purchased by the distributor within a specified period of time prior to the expiration of the contract. During those specified periods, we defer the applicable percentage of the sales. An insignificant amount of sales related to these types of agreements were deferred and not yet recognized as revenue as of December 27, 2015 and December 31, 2014.
We must make estimates of potential future product returns and recognize the reserve as a reduction ofrelated to current period product revenue. We base our estimate for sales returns on historical sales and product return information, including historical experience and trend information. Our reserve for sales returns has historically been immaterial. We charge our customers for shipping and handling and recognize these amounts as part of revenue.

AllowanceIn 2011, we entered into a trademark license agreement with KCI Medical Resources, a subsidiary of Kinetic Concepts, Inc. (KCI). In exchange for Doubtful Accounts$8.5 million, of which $5.5 million was received immediately and $3 million was received in January 2012, this license agreement provides KCI with a non-transferable license to use our trademarks associated with our GRAFTJACKET

® line of products in connection with the marketing and distribution of KCI's soft tissue graft containment products used in the wound care field, subject to certain exceptions. License revenue under this agreement is being recognized over 12 years on a straight-line basis.

Allowances for doubtful accounts.We maintain anexperience credit losses on our accounts receivable; and accordingly, we must make estimates related to the ultimate collection of our accounts receivable. Specifically, we analyze our accounts receivable, historical bad debt experience, customer concentrations, customer creditworthiness, and current economic trends when evaluating the adequacy of our allowance for doubtful accounts for estimated losses in the collection of accounts receivable. We make estimates regarding the future ability of our customers to make required payments based on historical credit experience, delinquency and expected future trends. accounts.
The majority of our receivablesaccounts receivable are due from healthcare institutions,hospitals, many of which are government funded. Accordingly, our collection history with this class of customer has been favorablefavorable. Historically, we have experienced minimal bad debts from our hospital customers and has resulted inmore significant bad debts from certain international stocking distributors, typically as a low levelresult of historical write-offs.specific financial difficulty or geo-political factors. We write off accounts receivable when we determine that the accounts receivable are uncollectible, typically upon customer bankruptcy or the customer’s non-response to continuedrepeated collection efforts.

We believe that the amount included in our allowance for doubtful accounts historically has been ana historically appropriate estimate of the amount of accounts receivable that isare ultimately not collected. While we believe that our allowance for doubtful accounts is adequate, the financial condition of our customers and the geopoliticalgeo-political factors that impact reimbursement under individual countries’ healthcare systems can change rapidly, which maywould necessitate additional

allowances in future periods. For example, in 2012, we recorded a $2.0 million reserve for certain specific customer accounts in Italy, primarily due to the impact of the ongoing economic challenges in Italy and the termination of an agreement with one distributor. Our allowanceallowances for doubtful accounts was $4.8were $1.2 million and $2.5$0.9 million, at December 30, 201227, 2015 and January 1, 2012,December 31, 2014, respectively.

Excess and Obsolete Inventoryobsolete inventories.

We value our inventory at the lower of the actual cost to purchase and/or manufacture the inventory on a first-in, first-out or FIFO,(FIFO) basis or its net realizable value. We regularly review inventory quantities on hand for excess and obsolete inventory (which can include charges for product expirations) and, when circumstances indicate, we incur charges to write down inventories to their net realizable value. Our review of inventory for excess and obsolete quantities is based primarily on an analysis of historical product sales together with our forecast of future product demand and production requirements.requirements for the next 36 months. A significant decrease in demand could result in an increase in the amount of excess inventory quantities on hand. Additionally, our industry is characterized by regular new product developmentsdevelopment that could result in an increase in the amount of obsolete inventory quantities on hand due to cannibalization of existing products. Also, our estimates of future product demand may prove to be inaccurate in which case we may be required to incur charges for excess and obsolete inventory. In the future, if additional inventory write-downs are required, we would recognize additional cost of goods sold at the time of such determination. Regardless of changes in our estimates of future product demand, we do not increase the value of our inventory above its adjusted cost basis. Therefore, although we make every effort to ensure the accuracy of our forecasts of future product demand, significant unanticipated decreases in demand or technological developments could have a significant impact on the value of our inventory and our reported operating results. Charges incurred

During the quarter ended December 27, 2015, we adjusted our estimate for excess and obsolete (E&O) inventory which resulted in a charge of $4.1 million. Our new E&O estimate is based on both the current age of kit inventory as compared to its estimated life cycle and our forecasted product demand and production requirements for other inventory items for the next 36 months. Total charges incurred to write down excess and obsolete inventory to net realizable value included in “Cost of sales” were $8.2approximately $14.2 million, $5.0$4.0 million, and $5.2$4.7 million for the years ended 2012, 2011,December 27, 2015 and 2010,December 31, 2014 and 2013, respectively. The $8.2 million of charges incurred in 2012 included a $3.0 million charge related to the rationalization of products associated with the integration of OrthoHelix into our company.

Instruments

Instruments are surgical tools used by orthopaedic surgeons during joint replacement and other surgical procedures to facilitate the implantation of our products. There are no contractual terms with respect to the usage of our instruments by our customers. Surgeons are under no contractual commitment to use our instruments. We maintain ownership of these instruments and, when requested, we allow the surgeons to use the instruments to facilitate implantation of our related products. We currently do not charge for the use of our instruments and there are no minimum purchase commitments relating to our products. As our surgical instrumentation is used numerous times over several years, often by many different customers, instruments are recognized as long-lived assets once they have been placed in service. Instruments and instrument parts that have not been placed in service are carried at cost and are included as instruments in progress within instruments, net of allowances for excess and obsolete instruments, on our consolidated balance sheets. Once placed in service, instruments are carried at cost, less accumulated depreciation. Instrument parts used to maintain the functionality of instruments but do not extend the life of the instruments are expensed as they are consumed and recorded as part of selling, general and administrative expense. Depreciation is computed using the straight-line method based on average estimated useful lives. Estimated useful lives are determined principally in reference to associated product life cycles, and average five years. As instruments are used as tools to assist surgeons, depreciation of instruments is recognized as a selling, general and administrative expense. Instrument depreciation expense was $12.4 million, $11.0 million, and $9.4 million during 2012, 2011, and 2010, respectively.

We review instruments for impairment whenever events or changes in circumstances indicate that the carrying value of the assets may not be recoverable. An impairment loss would be recognized when estimated future undiscounted cash flows relating to the assets are less than the asset’s carrying amount. An impairment loss is measured as the amount by which the carrying amount of an asset exceeds its fair value.

Business Combinations, Goodwill and Long-Lived Assetslong-lived assets.

We account for acquired businesses using the purchase method of accounting. Under the purchase method, our consolidated financial statements include the operationsfinancial results of an acquired business starting from


66


the completion ofdate the acquisition.acquisition is completed. In addition, the assets acquired, liabilities assumed, and any contingent consideration must be recorded at the date of acquisition at their respective estimated fair values, with any excess of the purchase price over the estimated fair values of the net assets acquired recorded as goodwill. Significant judgment is required in estimating the fair value of contingent consideration and intangible assets and in assigning their respective useful lives. Accordingly, we typically obtain the assistance of third-party valuation specialists for significant acquisitions. The fair value estimates are based on available historical information and on future expectations and assumptions deemed reasonable by management, but are inherently uncertain.

We typically have used a discounted cash flow analysis to determine the fair value of contingent consideration on the date of acquisition. Significant changes in the discount rate used could affect the accuracy of the fair value calculation. ChangesContingent consideration is adjusted based on experience in subsequent periods and the valueimpact of the contingent considerationchanges related to assumptions are accreted through interest expenserecorded in the consolidated statement of operations.

operating expenses as incurred.

We typically use an income method to estimate the fair value of intangible assets, which is based on forecasts of the expected future cash flows attributable to the respective assets. Significant estimates and assumptions inherent in the valuations reflect a consideration of other marketplace participants and include the amount and timing of future cash flows (including expected growth rates and profitability), the underlying product or technology life cycles, the economic barriers to entry, and the discount rate applied to the cash flows. Unanticipated market or macroeconomic events and circumstances may occur that could affect the accuracy or validity of the estimates and assumptions.

result in a triggering event for which we would test for impairment.

Determining the useful life of an intangible asset also requires judgment. Certain intangibles are expected to have indefinite lives based on their history and our plans to continue to support and build the acquired brands. Other acquired intangible assets (e.g., certain trademarks or brands, customer relationships, patents and technologies) are expected to have finite useful lives. Our assessment as to trademarks and brands that have an indefinite life and those that have a finite life is based on a number of factors including competitive environment, market share, trademark and/or brand history, underlying product life cycles, operating plans, and the macroeconomic environment of the countries in which the trademarks or brands are sold. Our estimates of the useful lives of finite-lived intangibles are primarily based on these same factors. All of our acquired technology and customer-related intangibles are expected to have finite useful lives.

We have

As of December 27, 2015, we had approximately $239.8$876.3 million of goodwill recorded as a result of the acquisition of businesses. Goodwill is tested for impairment annually, or more frequently if changes in circumstances or the occurrence of events suggest that impairment exists. Based on our single business approach to decision-making, planningThe annual evaluation of goodwill impairment may require the use of estimates and resource allocation, we have determined that we have one reporting unit for purposes of evaluating goodwill for impairment. We use widely accepted valuation techniquesassumptions to determine the fair value of our reporting unit used in our annual goodwill impairment analysis. Our valuation is primarily based on quantitative assessments regardingunits using projections of future cash flows. Unless circumstances otherwise dictate, the fair value of the reporting unit relative to the carrying value. We also use a market approach to evaluate the reasonableness of the income approach. We performed our annual impairment test is performed on October 1 each year.
We performed a qualitative assessment of goodwill for impairment as of October 1, 2015 for our reporting units in effect immediately prior to the first day of the fourth quarter of 2012Wright/Tornier merger, and determined that it is not more likely than not that the respective carrying values of our pre-merger reporting units (U.S., International and BioMimetic) exceeded their fair value, of our reporting unit significantly exceeded its carrying value and, therefore, no impairment chargeindicating that goodwill was necessary.

The impairment evaluation relatednot impaired.

Our business is capital intensive, particularly as it relates to goodwill requires the use of considerable management judgment to determine discounted future cash flows, including estimates and assumptions regarding the amount and timing of cash flows, cost of capital and growth rates. Cash flow assumptions used in the assessment are estimated using assumptions in our annual operating plan as well as our five-year strategic plan. Our annual operating plan and strategic plan contain revenue assumptions that are derived from existing technology as well as future revenues attributed to in-process technologies and the associated launch, growth and decline assumptions normal for the life cycle of those technologies. In addition, management considers relevant market information, peer company data and historical financial information. We also considered our historical operating losses in assessing the risk related to our future cash flow estimates and attempted to reflect that risk in the development of our weighted average cost of capital.

surgical instrumentation. We depreciate our property, plant and equipment and instruments and amortize our intangible assets based upon our estimate of the respective asset’s useful life. Our estimate of the useful life of an asset requires us to make judgments about future events, such as product life cycles, new product development, product cannibalization, and technological obsolescence, as well as other competitive factors beyond our control. We account for the impairment of finite, long-lived assets in accordance with Financial Accounting Standards Board (FASB) Accounting Standard Codification (ASC)the FASB ASC Section 360, Property, Plant and Equipment (FASB ASC 360).Equipment. Accordingly, when indicators of impairment exist, we evaluate impairments of our property, plant and equipment and instruments based upon an analysis of estimated undiscounted future cash flows. If we determine that a change is required in the useful life of an asset, future depreciation and amortization is adjusted accordingly. Alternatively, if we determine that an asset has been impaired, an adjustment would be charged to earningsincome based on the asset’s fair market value, or discounted cash flows if the fair market value is not readily determinable.

determinable, reducing income in that period.


Valuation of in-process research and development.The estimated fair value attributed to IPRD represents an estimate of the fair value of purchased in-process technology for research programs that have not reached technological feasibility and have no alternative future use. Only those research programs that had advanced to a stage of development where management believed reasonable net future cash flow forecasts could be prepared and a reasonable possibility of technical success existed were included in the estimated fair value.
IPRD is recorded as an indefinite-lived intangible asset until completion or abandonment of the associated research and development projects. Accordingly, no amortization expense is reflected in the results of operations. If a project is completed, the carrying value of the related intangible asset will be amortized over the remaining estimated life of the asset beginning with the period in which the project is completed. If a project becomes impaired or is abandoned, the carrying value of the related intangible asset will be written down to its fair value and an impairment charge will be taken in the period the impairment occurs. These intangible assets are tested for impairment on an annual basis, or earlier if impairment indicators are present.

67


Product liability claims, product liability insurance recoveries and other litigation. Periodically, claims arise involving the use of our products. We make provisions for claims specifically identified for which we believe the likelihood of an unfavorable outcome is probable and an estimate of the amount of loss has been developed. As additional information becomes available, we reassess the estimated liability related to our pending claims and make revisions as necessary.
The product liability claims described in this section relate primarily to Wright Medical Technology, Inc., an indirect subsidiary of Wright Medical Group N.V., and are not necessarily applicable to Wright Medical Group N.V. or other affiliated entities. Maintaining separate legal entities within our corporate structure is intended to ring-fence liabilities.  We believe our ring-fenced structure should preclude corporate veil-piercing efforts against entities whose assets are not associated with particular claims.  
We have received claims for personal injury against us associated with fractures of our PROFEMUR® long titanium modular neck product (PROFEMUR® Claims). As of January 30, 2016 there were 42 pending U.S. lawsuits and 23 pending non-U.S. lawsuits alleging such claims. The overall fracture rate for the product is low and the fractures appear, at least in part, to relate to patient demographics. Beginning in 2009, we began offering a cobalt-chrome version of our PROFEMUR® modular neck, which has greater strength characteristics than the alternative titanium version. Historically, we have reflected our liability for these claims as part of our standard product liability accruals on a case-by-case basis. However, during the quarter ended September 30, 2011, as a result of an increase in the number and monetary amount of these claims, management estimated our liability to patients in North America who have previously required a revision following a fracture of a PROFEMUR® long titanium modular neck, or who may require a revision in the future. Management has estimated that this aggregate liability ranges from approximately $22.5 million to $28.9 million. Any claims associated with this product outside of North America, or for any other products, will be managed as part of our standard product liability accrual methodology on a case by case basis.

Due to the uncertainty within our aggregate range of loss resulting from the estimation of the number of claims and related monetary payments, we have recorded a liability of $22.5 million, which represents the low-end of our estimated aggregate range of loss. We have classified $8.5 million of this liability as current in “Accrued expenses and other current liabilities” and $14 million as non-current in “Other liabilities” on our condensed consolidated balance sheet. We expect to pay the majority of these claims within the next three years.

During the quarter ended September 30, 2015, we increased our estimated liability by approximately $4 million for claims that had been incurred in prior periods. We have analyzed the impact of this adjustment and determined that this out-of-period charge did not have a material impact to the prior period or current period financial statements. 

We are aware that MicroPort has recalled certain sizes of its cobalt chrome modular neck products as a result of alleged fractures. As of February 16, 2016, there were 2 pending U.S. lawsuits and 2 pending non-U.S. lawsuits against us alleging personal injury resulting from the fracture of a cobalt chrome modular neck. These claims will be managed as part of our standard product liability accrual methodology on a case-by-case basis.

We have maintained product liability insurance coverage on a claims-made basis. During the quarter ended March 31, 2013, we received a customary reservation of rights from our primary product liability insurance carrier asserting that present and future claims related to fractures of our PROFEMUR® titanium modular neck hip products and which allege certain types of injury (Modular Neck Claims) would be covered as a single occurrence under the policy year the first such claim was asserted. The effect of this coverage position would be to place Modular Neck Claims into a single prior policy year in which applicable claims-made coverage was available, subject to the overall policy limits then in effect. Management agrees with the assertion that the Modular Neck Claims should be treated as a single occurrence, but notified the carrier that it disputed the carrier's selection of available policy years. During the second quarter of 2013, we received confirmation from the primary carrier confirming their agreement with our policy year determination. Based on our insurer's treatment of Modular Neck Claims as a single occurrence, we increased our estimate of the total probable insurance recovery related to Modular Neck Claims by $19.4 million, and recognized such additional recovery as a reduction to our selling, general and administrative expenses for the three-months ended March 31, 2013, within results of discontinued operations. In the quarter ended June 30, 2013, we received payment from the primary insurance carrier of $5 million. In the quarter ended September 30, 2013, we received payment of $10 million from the next insurance carrier in the tower. We have requested, but not yet received, payment of the remaining $25 million from the third insurance carrier in the tower for that policy period. The policies with the second and third carrier in this tower are “follow form” policies and management believes the third carrier should follow the coverage position taken by the primary and secondary carriers. On September 29, 2015, that third carrier asserted that the terms and conditions identified in its reservation of rights will preclude coverage for the Modular Neck Claims. We strongly dispute the carrier's position and, in accordance with the dispute resolution provisions of the policy, have initiated an arbitration proceeding in London, England seeking payment of these funds. Pursuant to applicable accounting standards, we have reduced our

68


insurance receivable balance for this claim to $0, and recorded a $25 million charge within "Net loss from discontinued operations."

Claims for personal injury have also been made against us associated with our metal-on-metal hip products (primarily our CONSERVE® product line). The pre-trial management of certain of these claims has been consolidated in the federal court system, in the United States District Court for the Northern District of Georgia under multi-district litigation (MDL) and certain other claims by the Judicial Counsel Coordinated Proceedings (JCCP) in state court in Los Angeles County, California (collectively the Consolidated Metal-on-Metal Claims).
As of January 30, 2016, there were 1,126 such lawsuits pending in the MDL and JCCP, and an additional 22 cases pending in various state courts. We have also entered into approximately 893 so called "tolling agreements" with potential claimants who have not yet filed suit. There are also approximately 56 non-U.S. lawsuits presently pending. We believe we have data that supports the efficacy and safety of our metal-on-metal hip products. While continuing to dispute liability, we have participated in court supervised non-binding mediation in the multi-district federal court litigation.

The first bellwether trial in the MDL commenced on November 9, 2015 in Atlanta, Georgia. On November 24, 2015, the jury returned a verdict in favor of the plaintiff and awarded the plaintiff $1 million in compensatory damages and $10 million in punitive damages. We believe there were significant trial irregularities and are vigorously contesting the trial result. On December 28, 2015, we filed a post-trial motion for judgment as a matter of law or, in the alternative, for a new trial or a reduction of damages awarded. That motion is pending. We have not recorded an accrual for this verdict because we do not consider it to be probable and estimable at this time.

The supervising judge in the JCCP has set a trial date of March 14, 2016 for the first bellwether trial in California. We expect that trial to proceed as scheduled.

We have maintained product liability insurance coverage on a claims-made basis. During the quarter ended September 30, 2012, we received a customary reservation of rights from our primary product liability insurance carrier asserting that certain present and future claims which allege certain types of injury related to our CONSERVE® metal-on-metal hip products (CONSERVE® Claims) would be covered as a single occurrence under the policy year the first such claim was asserted. The effect of this coverage position would be to place CONSERVE® Claims into a single prior policy year in which applicable claims-made coverage was available, subject to the overall policy limits then in effect. Management agrees that there is insurance coverage for the CONSERVE® Claims, but has notified the carrier that it disputes the carrier's characterization of the CONSERVE® Claims as a single occurrence.

Management has recorded an insurance receivable for the probable recovery of spending in excess of our retention for a single occurrence. During 2015, we received $6.1 million of insurance proceeds, which represent the amount undisputed by the carrier for the policy year the first claim was asserted. Our acceptance of these proceeds was not a waiver of any other claim that we may have against the insurance carrier. As of December 27, 2015, this receivable totaled approximately $17 million, and is solely related to defense costs incurred through December 27, 2015. However, the amount we ultimately receive may differ depending on the final conclusion of the insurance policy year or years and the number of occurrences. We believe our contracts with the insurance carriers are enforceable for these claims and, therefore, we believe it is probable that we will receive recoveries from our insurance carriers. However, our insurance carriers could still ultimately deny coverage for some or all of our insurance claims.

Every metal-on-metal hip case involves fundamental issues of science and medicine that often are uncertain, that continue to evolve, and which present contested facts and issues that can differ significantly from case to case. Such contested facts and issues include medical causation, individual patient characteristics, surgery specific factors, and the existence of actual, provable injury. Given these complexities, we are unable to reasonably estimate a probable liability for these matters. Although we continue to contest liability, based upon currently available information, we estimate a reasonably possible range of liability for the Consolidated Metal-on-Metal Claims, before insurance recoveries, averaging from zero to $250,000 per case.
Based upon the information we have at this time, we do not believe our liabilities, if any, in connection with these matters will exceed our available insurance. However, as described below, we are currently litigating coverage issues with certain of our carriers. As the litigation moves forward and circumstances continue to develop, our belief we will be able to resolve the Consolidated Metal-on-Metal Claims within available insurance coverage could change, which could materially impact our results of operations and financial position. Further, and notwithstanding our present belief we will be able to resolve these Claims within available insurance proceeds, we would consider contributing a limited amount to the funding of an acceptable, comprehensive, mediated settlement among claimants and insurers. To this end, we have indicated a willingness to contribute up to $30 million to achieve such a comprehensive settlement. Due to continuing uncertainty around (i) whether a

69


multi-party comprehensive settlement can be achieved, (ii) the outcome of our coverage litigation with insurers which could impact the ability to reach a settlement and (iii) the case-by-case outcomes of any Metal-on-Metal claims ultimately litigated (and which we expect to contest vigorously), we are unable to reasonably estimate a probable liability for these matters and, therefore, no amounts have been accrued.

In June 2014, St. Paul Surplus Lines Insurance Company (Travelers), which was an excess carrier in our coverage towers across multiple policy years, filed a declaratory judgment action in Tennessee state court naming us and certain of our other insurance carriers as defendants and asking the court to rule on the rights and responsibilities of the parties with regard to the CONSERVE® Claims. Among other things, Travelers appears to dispute our contention that the CONSERVE® Claims arise out of more than a single occurrence thereby triggering multiple policy periods of coverage.  Travelers further seeks a determination as to the applicable policy period triggered by the alleged single occurrence.  We filed a separate lawsuit in state court in California for declaratory judgment against certain carriers and breach of contract against the primary carrier, and have moved to dismiss or stay the Tennessee action on a number of grounds, including that California is the most appropriate jurisdiction. During the third quarter of 2014, the California Court granted Travelers' motion to stay our California action.

In May 2015, we entered into confidential settlement discussions with our insurance carriers through a private mediator. These discussions are continuing.

In February 2014, Biomet, Inc. (Biomet) announced it had reached a settlement in the multi-district litigation involving its own metal-on-metal hip products. The terms announced by Biomet include: (i) an expected base settlement amount of $200,000; (ii) an expected minimum settlement amount of $20,000; (iii) no payments to plaintiffs who did not undergo a revision surgery; and (iv) a total settlement amount expected to be within Biomet’s aggregate insurance coverage. We believe our situation involves facts and circumstances that differ significantly from the Biomet cases.

In addition to the Consolidated Metal-on-Metal Claims discussed above, there are currently certain other pending claims related to our metal-on-metal hip products for which we are accounting in accordance with our standard product liability accrual methodology on a case-by-case basis.
Certain liabilities associated with the OrthoRecon business, including product liability claims associated with hip and knee products sold prior to the closing, were not assumed by MicroPort. Liabilities associated with these product liability claims, including legal defense, settlements and judgments, income associated with product liability insurance recoveries, and changes to any contingent liabilities associated with the OrthoRecon business have been reflected within results of discontinued operations, and we will continue to reflect these within results of discontinued operations in future periods. MicroPort is responsible for product liability claims associated with products it sells after the closing.

In June 2015, a jury returned a $4.4 million verdict against us in a case involving a fractured hip implant stem sold prior to the MicroPort closing.  This was a one-of-a-kind case unrelated to the modular neck fracture cases we have been reporting. There are no other cases pending related to this component, nor are we aware of other instances where this component has fractured. In September 2015, the trial judge reduced the jury verdict to $1.025 million and indicated that if plaintiff did not accept the reduced award he would schedule a new trial solely on the issue of damages. The plaintiff elected not to accept the reduced damage award, and both parties have appealed. The court has not set a date for a new trial on the issue of damages and we do not expect it will do so until the appeals are adjudicated. We will maintain our current $4.4 million accrual as a probable liability until the matter is resolved. The $4.4 million probable liability associated with this matter is reflected within “Accrued expenses and other current liabilities,” and a $4 million receivable associated with the probable recovery from product liability insurance is reflected within “Other current assets.”

In July 2015, we received demand letters from MicroPort seeking indemnification under the terms of the asset purchase agreement for the sale of our OrthoRecon business for losses or potential losses it has incurred or may incur as a result of either alleged breaches of representations in the asset purchase agreement or alleged unassumed liabilities. MicroPort asserted that the range of potential losses for which it seeks indemnity is between $18.5 million and $30 million. We responded to MicroPort's demand letters and received a further demand letter reiterating each of their claims and providing revised claim amounts. In this letter MicroPort asserted that the range of potential losses for which it seeks indemnity is between $77.5 million and $112.5 million.

On October 27, 2015, MicroPort filed a lawsuit in the United States District Court for the District of Delaware against Wright Medical Group N.V. alleging that we breached the indemnification provisions of the asset purchase agreement by failing to indemnify MicroPort for alleged damages arising out of certain pre-closing matters and for breach of certain representations and warranties. The complaint includes claims relating to MicroPort’s recall of certain of its cobalt chrome modular neck products, and seeks damages in an unspecified amount plus attorneys’ fees and costs, as well as declaratory

70


judgment. On January 4, 2016, we filed an answer to the complaint and also filed a counterclaim seeking declaratory judgment and indemnification and other damages in an unspecified amount from MicroPort. A scheduling order has not yet been entered in the lawsuit.
Accounting for Income Taxesincome taxes.

Our effective tax rate is based on income by tax jurisdiction, valuation allowances, statutory rates, and tax-savingtax saving initiatives available to us in the various jurisdictions in which we operate. Significant judgment is required in determining our effective tax rate and evaluating our tax positions. This process includes assessing temporary differences resulting from differing recognition of items for income tax and financial reportingaccounting purposes. These differences result in deferred tax assets and liabilities, which are included within our consolidated balance sheet. Realization of deferred tax assets in each taxable jurisdiction is dependent on our ability to generate future taxable income sufficient to realize the benefits. Management evaluates deferred tax assets on an

ongoing basis and provides valuation allowances to reduce net deferred tax assets to the amount that is more likely than not to be realized.

Our valuation allowance balances totaled $30.0$336.1 million and $29.8$171.4 million as of December 30, 201227, 2015 and January 1, 2012,December 31, 2014, respectively, due to uncertainties related to our ability to realize, before expiration, somecertain of our deferred tax assets for both U.S. and foreign income tax purposes. During 2013, we recognized a $119.6 million valuation allowance against our U.S. deferred tax assets due to recent operating losses in the U.S. tax jurisdiction, which resulted in the determination that our U.S. deferred tax assets were not more likely than not to be utilized in the foreseeable future. These deferred tax assets primarily consist of the carryforward of certain tax basis net operating losses and general business tax credits.

We recognize See Note 11 to our consolidated financial statements contained in “Item 8. Financial Statements and Supplementary Data” for further discussion of our deferred tax benefits when they are more likely than not to be realized. assets and the associated valuation allowance.

As a multinational corporation, we are subject to taxation in many jurisdictions and the calculation of our tax liabilities involves dealing with uncertainties in the application of complex tax laws and regulations in various taxing jurisdictions. In accordance with ASC 740 Income Taxes, we recognize the tax effects of an income tax position only if they are “more-likely-than-not” to be sustained based solely on the technical merits as of the reporting date. If we ultimately determine that the payment of these liabilities will be unnecessary, we will reverse the liability and recognize a tax benefit in the period in which we determine the liability no longer applies. Conversely, we record additional tax charges in a period in which we determine that a recorded tax liability is less than we expect the ultimate assessment to be. Our liability for unrecognized tax benefits totaled $2.6$9.9 million and $1.9$4.4 million as of December 30, 201227, 2015 and January 1, 2012,December 31, 2014, respectively.

See Note 11Share-Based Compensation to our consolidated financial statements contained in “

For purposesItem 8. Financial Statements and Supplementary Data” for further discussion of calculating share-basedour unrecognized tax benefits.

We operate within numerous taxing jurisdictions. We are subject to regulatory review or audit in virtually all of those jurisdictions, and those reviews and audits may require extended periods of time to resolve. Management makes use of all available information and makes reasoned judgments regarding matters requiring interpretation in establishing tax expense, liabilities, and reserves. We believe adequate provisions exist for income taxes for all periods and jurisdictions subject to review or audit.
Share-based compensation we estimate. We calculate the grant date fair value of non-vested shares as the closing sales price on the trading day immediately prior to the grant date. We use the Black-Scholes option pricing model to determine the fair value of stock options using a Black-Scholes option pricing model.and employee stock purchase plan shares. The determination of the fair value of these share-based payment awards utilizing this Black-Scholeson the date of grant using an option-pricing model is affected by our ordinary sharestock price andas well as assumptions regarding a number of assumptions, including expected volatility,complex and subjective variables, which include the expected life of the award, the expected stock price volatility over the expected life of the awards, expected dividend yield, and risk-free interest rate and expected dividends. The estimated fair value of share-based awards exchanged for employee and non-employee director services are expensed over the requisite service period. Option awards issued to non-employees (excluding non-employee directors) are recorded at their fair value as determined in accordance with authoritative guidance, are periodically revalued as the options vest and are recognized as expense over the related service period.

rate.

We do not have information available which is indicative of future exercise and post-vesting behavior to estimate the expected term. As a result, we adoptedlife of options evaluating the historical activity as required by FASB ASC Topic 718, Compensation — Stock Compensation. Prior to the Wright/Tornier merger, the expected life of options was estimated based on historical option exercise and employee termination data. Post merger, the expected life of options was estimated based on the simplified method due to a lack of estimatingcomparable, historic option exercise, and employee termination data for the combined company. The expected term of a stock option, as permitted by the Staff Accounting Bulletin No. 107. Under this method, the expected term is presumed to be the mid-point between the vesting date and the contractual end of the term of our share-based awards. As a non-public entity prior to February 2011, historicprice volatility assumption was not available for our ordinary shares. As a result, we estimated volatility based on a peer group of companies that we believe collectively provides a reasonable basis for estimating volatility. We intend to continue to consistently use the same group of publicly traded peer companies to determine volatility in the future until sufficient information regardingupon historical volatility of our ordinary share price becomes available or the selected companies are no longer suitableshares for this purpose.both legacy Wright and legacy Tornier prior to October 1, 2015. The risk-free interest rate is based on the implied yield available ondetermined using U.S. Treasury zero-coupon issuesrates where the term is consistent with a remaining term approximately equal to the expected life of ourthe stock options. Expected dividend yield is not considered as we have never paid dividends and have no plans of doing so in the future.
The estimated pre-vesting forfeiture rateBlack-Scholes option-pricing model was developed for use in estimating the fair value of traded options that have no vesting restrictions and are fully transferable, characteristics not present in our option grants and employee stock purchase plan shares. Existing valuation models, including the Black-Scholes and lattice binomial models, may not provide reliable measures of the fair values of our share-based compensation. Consequently, there is based ona risk that our historical experience together with estimates of future employee turnover. We do not expectthe fair values of our share-based compensation awards on the grant dates may bear little resemblance to declare cash dividendsthe actual values realized upon the exercise, expiration, early termination, or forfeiture of those share-based payments in the foreseeable future. ForCertain share-based payments, such as employee stock options, may expire worthless or otherwise result in zero intrinsic value as compared to the fair values

71


originally estimated on the grant date and reported in our financial statements. Alternatively, value may be realized from these instruments that is significantly higher than the fair values originally estimated on the grant date and reported in our financial statements. There is not currently a summarymarket-based mechanism or other practical application to verify the reliability and accuracy of the estimates stemming from these valuation models.
We are required to estimate forfeitures at the time of grant and revise those estimates in subsequent periods if actual forfeitures differ from those estimates. We use historical data to estimate pre-vesting forfeitures and record share-based compensation expense relatedonly for those awards that are expected to vest. All share-based awards see Note 16 of our consolidated financial statements.

are amortized on a straight-line basis over their respective requisite service periods, which are generally the vesting periods.

If factors change and we employ different assumptions for estimating share-based compensation expense in future periods, such share-based compensation expense in future periods may differ significantly from what we have recorded in the past. If there iscurrent period and could materially affect our operating income, net income, and net income per share. A change in assumptions may also result in a difference betweenlack of comparability with other companies that use different models, methods, and assumptions.
See Note 14 to our consolidated financial statements contained in “Item 8. Financial Statements and Supplementary Data” for further information regarding our share-based compensation.
Restructuring charges. We evaluate impairment issues for long-lived assets under the assumptions usedprovisions of FASB ASC 360. We record severance-related expenses once they are both probable and estimable in determining share-based compensationaccordance with the provisions of FASB ASC Section 712, Compensation-Nonretirement Postemployment Benefits, for severance provided under an ongoing benefit arrangement. One-time termination benefit arrangements and other costs associated with exit activities are accounted for under the provisions of FASB ASC Section 420, Exit or Disposal Cost Obligations. We estimated the expense for our restructuring initiatives by accumulating detailed estimates of costs, including the estimated costs of employee severance and related termination benefits, impairment of property, plant and equipment, contract termination payments for leases, and any other qualifying exit costs. Such costs represented management’s best estimates, which were evaluated periodically to determine if an adjustment was required.

Recent accounting pronouncements. On May 28, 2014 and August 12, 2015, the FASB issued Accounting Standard Update (ASU) 2014-09 and 2015-14, Revenue from Contracts with Customers, which supersedes virtually all existing revenue recognition guidance under US GAAP. The ASU provides a five-step model for revenue recognition that companies will apply to recognize revenue in a manner that reflects the timing of the transfer of services to customers and the actual factors which become known over time, specifically with respectamount of revenue recognized reflects the consideration that a company expects to anticipated forfeitures, we may changereceive for the input factors used in determining share-based compensation costsgoods and services provided. The ASU will be effective for future grants. These changes, if any, may materially impact our results of operationsus fiscal year 2018. We are in the period such changesinitial phases of our adoption plans and; accordingly, we are made. We expectunable to continue to grant stock options and other share-based awards in the future, and to the extent that we do,estimate any effect this may have on our actual share-based compensation expense recognized in future periods will likely increase.

revenue recognition practices.


Recent Accounting Pronouncements

In June 2011, the Financial Accounting Standards Board issued Accounting Standards Update (ASU) 2011-05,Comprehensive Income (Topic 220), Presentation of Comprehensive Income, which converges the presentation of other comprehensive income (OCI) in financial statements prepared under US GAAP and International Financial Reporting Standards (IFRS). This guidance would require disclosure of reclassification adjustments from OCI to net income. In December 2011,On April 7, 2015, the FASB issued ASU 2011-12,Comprehensive Income (Topic 220), Deferral of the Effective Date for Amendments to2015-03, Simplifying the Presentation of ReclassificationsDebt Issuance Costs, as part of Items Outits simplification initiative. The ASU changes the presentation of Accumulated Other Comprehensive Incomedebt issuance costs in Accounting Standards Update No. 2011-05financial statements. Under current guidance (i.e., which deferredASC 835-30-45-3 before the effective date of this guidance to fiscal years beginning after December 15, 2011, with early election permitted. We adopted the provisions of ASU 2011-05ASU), an entity reports debt issuance costs in the first quarterbalance sheet as deferred charges (i.e., as an asset). Under the ASU, an entity presents such costs in the balance sheet as a direct deduction from the related debt liability rather than as an asset. Amortization of 2012. As the adoption was only related to disclosures, the impact of adoption was immaterial to our consolidated financial results.

In September 2011,costs is reported as interest expense. Further, on August 16, 2015, the FASB issued ASU 2011-08, Goodwill2015-15 Presentation and Other (ASC Topic 350), Testing Goodwill for

Subsequent Measurement of Debt Issuance Costs Associated With Line-of-Credit Arrangements Impairment, which simplifiedto clarify the requirements related toSEC staff’s position on presenting and measuring debt issuance costs incurred in connection with line-of-credit arrangements given the annual goodwill impairment test. Companies now have the option to first assess qualitative factors to determine whether it is more likely than not that the fair valuelack of a reporting unit is less than its carrying amount. If the assessment indicatesguidance on this topic in ASU 2015-03. The SEC staff has announced that it iswould not more likely than not thatobject to an entity deferring and presenting debt issuance costs as an asset and subsequently amortizing the fair valuedeferred debt issuance costs ratably over the term of a reporting unit is less than its carrying amount, the Company no longer has to perform the two-step impairment test.line-of-credit arrangement. The ASU 2011-08 waswill be effective for us fiscal years beginning after December 15, 2011 with early adoption permitted.year 2016. We adopteddo not expect this guidance beginning in the first quarter of 2012. Thechange to significantly impact of adoption did not have a material impact on our consolidated financial position or operating results.statements.


In July 2012,On September 25, 2015, the FASB issued ASU 2012-02,Intangibles — Goodwill and Other (Topic 350),Testing Indefinite-Lived Intangible Assets2015-16, Simplifying the Accounting for Impairment.Measurement-Period Adjustments to simplify the accounting for measurement-period adjustments. The ASU, adds an optional qualitative assessment for determining whether an indefinite-lived intangible assetwhich is impaired. Companies have the option to first perform a qualitative assessment to determine whether it is more likely than not (a likelihood of more than 50%) that an indefinite-lived intangible asset is impaired. If a company determines that it is more likely than not that the fair value of such an asset exceeds its carrying amount, it would not need to calculate the fair valuepart of the assetFASB’s simplification initiative, was issued in response to stakeholder feedback that year. However, ifrestatements of prior periods to reflect adjustments made to provisional amounts recognized in a company concludes otherwise, it must calculatebusiness combination increase the fair valuecost and complexity of financial reporting but do not significantly improve the usefulness of the asset, compare that value with its carrying amount and record an impairment charge, if any.information. The guidance isASU will be effective for annualus fiscal year 2016. As detailed in Note 3, purchase price allocations for the Wright/Tornier merger are subject to adjustment during the measurement period. Under this ASU, an acquirer must recognize adjustments to provisional amounts that are identified during the measurement period in the reporting period in which the adjustment amounts are determined and interim impairment tests performed for fiscal years beginning after September 15, 2012 withmust present these amounts separately on the face of the income statement or disclose in the notes, the portion of the amount recorded in current-period earnings by line item that would have been recorded in previous reporting periods if the adjustment to the provisional amounts had been recognized as of the acquisition date.


72


On November 20, 2015, the FASB issued ASU 2015-17, Balance Sheet Classification of Deferred Taxes, as part of its simplification initiative (i.e., the Board’s effort to reduce the cost and complexity of certain aspects of US GAAP). The ASU requires entities to present deferred tax assets and deferred tax liabilities as noncurrent in a classified balance sheet. It thus simplifies the current guidance, which requires entities to separately present deferred tax assets and deferred tax liabilities as current or noncurrent in a classified balance sheet. This ASU allows early adoption permitted.adoption. We adoptedhave elected to early adopt this guidance infor the fourth quarter of 2012. The impact of adoptionyear ended December 27, 2015 and retrospectively applied this guidance to the 2014 tax balances. We noted that this change did not have a materialsignificantly impact on our consolidated financial position or operating results.statements.


73


Item 7A. Quantitative and Qualitative Disclosures aboutAbout Market Risk.

We are exposed

Interest Rate Risk
Our exposure to various market risks, which may result in potential losses arisinginterest rate risk arises principally from adverse changes in market rates and prices, such asthe interest rates and foreign currency exchange rate fluctuations. We do not enter into derivatives or other financial instruments for trading or speculative purposes. We believe we are not exposed to a material market riskassociated with respect to our invested cash balances. On December 27, 2015, we had invested short-term cash and cash equivalents.

Interest Rate Risk

Borrowings under our senior secured term loans have variableequivalents of approximately $140 million for the combined business. We believe that a 10 basis point change in interest rates as detailed below. As of December 30, 2012, we had $1.0 million in borrowings under our revolving lines of credit and $113.1 million in borrowings under our senior secured term loans. Based upon this debt level, a 25 basis point increaseis reasonably possible in the annualnear term. Based on our current level of investment, an increase or decrease of 10 basis points in interest rate on such borrowingsrates would have an annual impact of $0.3 million onapproximately $140,000 to our interest expense.

Atincome.

Equity Price Risk
The 2017 Notes include conversion and settlement provisions that are based on the optionprice of Tornier USA, loans under our revolving credit facilityordinary shares and USD term facility, both of which were completed on October 4, 2012, bear interest at (a) the alternate base rate (if denominated in U.S. dollars), equalprior to the greatestWright/Tornier merger, WMG common stock, at conversion or at maturity of (i) the prime ratenotes. On February 13, 2015, WMG issued $632.5 million of the 2020 Notes, which generated net proceeds of approximately $613 million. Approximately $292 million of the net proceeds from the offering were used to repurchase approximately $240 million aggregate principal amount of the 2017 Notes in effect on such day, (ii)privately negotiated transactions. In addition, all of the federal funds effective rate2017 Notes Hedges were settled and all of the warrants associated with the 2017 Notes were repurchased, generating net proceeds of approximately $10 million. As of December 27, 2015, we had approximately $60 million in effect on such day plus 1/2outstanding debt under the 2017 Notes. The following table shows the amount of 1%,cash that we would be required to provide holders of the 2017 Notes upon maturity assuming various closing prices of our ordinary shares at the date of maturity:
Share price Cash payment in excess of principal (in thousands)
$27.98(10% greater than conversion price)$6,001
$30.53(20% greater than conversion price)$12,002
$33.07(30% greater than conversion price)$18,003
$35.62(40% greater than conversion price)$24,004
$38.16(50% greater than conversion price)$30,004
The fair value of our 2017 Notes Conversion Derivative is directly impacted by the price of our ordinary shares and (iii)prior to the adjusted LIBO rate (as defined inWright/Tornier merger, WMG common stock. The following table presents the fair values of our credit agreement) plus 1%) plus in the case of each of (i)-(iii) above, an applicable rate of 2.00% or 2.25% (depending on our total net leverage ratio (as defined in our credit agreement)), or (b) in the case2017 Notes Conversion Derivative as a result of a eurocurrency loan (as defined in our credit agreement), at the applicable adjusted LIBO rate for the relevant interest period plus an applicable rate of 3.00% or 3.25% (depending on our total net leverage ratio), plus the mandatory cost (as defined in our credit agreement) if such loan is made in a currency other than dollars of any lender our new credit agreement (other than a lender to our credit agreement on October 4, 2012) from a lending office in the United Kingdom or a participating member state (as defined in our credit agreement). Under the EUR term facility, (a) alternate base rate loans bear interest at the alternate base rate plus the applicable rate, which is 3.00% or 3.25% (depending on our total net leverage ratio)hypothetical 10% increase and (b) eurocurrency loans bear interest at the adjusted LIBO rate for the relevant interest period, plus an applicable rate, which is 4.00% or 4.25% (depending on our total net leverage ratio), plus the mandatory cost, if applicable.

At December 30, 2012 our cash and cash equivalents were $31.1 million. Based on our annualized average interest rate, a 10% decrease in the annual interest rateprice of our ordinary shares. We believe that a 10% change in our share price is reasonably possible in the near term:

(in thousands)   
 Fair value of security given a 10% decrease in share priceFair value of security as of December 27, 2015Fair value of security given a 10% increase in share price
2017 Notes Conversion Derivative (Liability)7,28210,44014,079
The 2020 Notes includes conversion and settlement provisions that are based on such balancesthe price of our ordinary shares at conversion or at maturity of the notes. In addition, the hedges and warrants associated with these convertible notes also include settlement provisions that are based on the price of our ordinary shares. The amount of cash we may be required to pay, or the number of shares we may be required to provide to note holders at conversion or maturity of these notes, is determined by the price of our ordinary shares. The amount of cash that we may receive from hedge counterparties in connection with the related hedges and the number of shares that we may be required to provide warrant counterparties in connection with the related warrants are also determined by the price of our ordinary shares.
Upon the expiration of our warrants issued in connection with the 2020 Notes, we will issue ordinary shares to the purchasers of the warrants to the extent the price of our ordinary shares exceeds the warrant strike price of $40.00 at that time. The following table shows the number of shares that we would issue to warrant counterparties at expiration of the warrants assuming various closing prices of our ordinary shares on the date of warrant expiration:
Share price Shares (in thousands)
$44.00(10% greater than strike price)1,863
$48.00(20% greater than strike price)3,415
$52.00(30% greater than strike price)4,728
$56.00(40% greater than strike price)5,854
$60.00(50% greater than strike price)6,830

74


The fair value of the 2020 Notes Conversion Derivative and the 2020 Notes Hedge is directly impacted by the price of our ordinary shares. We entered into the 2020 Notes Hedges in connection with the issuance of the 2020 Notes with the option counterparties. The 2020 Notes Hedges, which are cash-settled, are intended to reduce our exposure to potential cash payments that we are required to make upon conversion of the 2020 Notes in excess of the principal amount of converted notes if our ordinary share price exceeds the conversion price. The following table presents the fair values of the 2020 Notes Conversion Derivative and 2020 Notes Hedge as a result of a hypothetical 10% increase and decrease in an immaterial impact onthe price of our interest income on an annual basis.

ordinary shares. We believe that a 10% change in our share price is reasonably possible in the near term:

(in thousands)   
 Fair value of security given a 10% decrease in share priceFair value of security as of December 27, 2015Fair value of security given a 10% increase in share price
2020 Notes Hedges (Asset)$101,688$127,758$155,911
2020 Notes Conversion Derivative (Liability)$99,942$129,107$160,910
Foreign Currency Exchange Rate Risk

Fluctuations

Fluctuations in the rate of exchange rate between the U.S. dollar and foreign currencies could adversely affect our financial results. In 2012Approximately 30% and 2011, approximately 44% and 46%, respectively,21% of our revenuesnet sales from continuing operations were denominated in foreign currencies. Wecurrencies during the years ended December 27, 2015 and December 31, 2014, respectively, and we expect that foreign currencies will continue to represent a similarly significant percentage of our revenuesnet sales in the future. Operating expensesCost of sales related to these revenuessales are primarily denominated in U.S. dollars; however, operating costs related to these sales are largely denominated in the same respective currency,currencies, thereby partially limiting our transaction risk exposure, to some extent. However, for revenuesexposure. For sales not denominated in U.S. dollars, if there is an increase in the rate at which a foreign currency is exchanged for U.S. dollars it will require more of the foreign currency to equal a specified amount of U.S. dollars than before the rate increase. In such cases, and if we price our products in the

foreign currency, we will receive less in U.S. dollars than we did before the rate increase went into effect. If we price our products in U.S. dollars and our competitors price their products in local currency, an increase in the relative strength of the U.S. dollar could result in our prices not being competitive in a market where business is transacted in the local currency.

In the year ended December 30, 2012,2015, approximately 79%97% of our revenuesnet sales denominated in foreign currencies wereare derived from EUEuropean Union countries, and werewhich are denominated in Euros.the Euro; from the United Kingdom, which are denominated in the British pound; from Australia which are denominated in Australian dollar; and from Canada, which are denominated in the Canadian dollar. Additionally, we have significant intercompany receivables, payables, and debt with certain Europeanfrom our foreign subsidiaries whichthat are denominated in foreign currencies, principally the Euro.Euro, the Japanese yen, the British pound, the Australian dollar, and the Canadian dollar. Our principal exchange rate risk, therefore, exists between the U.S. dollar and the Euro.Euro, British pound, Australian dollar, and the Canadian dollar. Fluctuations from the beginning to the end of any given reporting period result in the remeasurementrevaluation of our foreign currency-denominated cash,intercompany receivables, payables, and debt generating currency transactiontranslation gains or losses that impact our non-operating income/income and expense levels in the respective periodperiod.
As discussed in Note 2 to the consolidated financial statements contained in “Item 8. Financial Statements and Supplementary Data,” we enter into certain short-term derivative financial instruments in the form of foreign currency forward contracts. These forward contracts are reporteddesigned to mitigate our exposure to currency fluctuations in our intercompany balances denominated currently in Euros, British pounds, and Canadian dollars. Any change in the fair value of these forward contracts as a result of a fluctuation in a currency exchange rate is expected to be offset by a change in the value of the intercompany balance. These contracts are effectively closed at the end of each reporting period.
A uniform 10% strengthening in the value of the U.S. dollar relative to the currencies in which our transactions are denominated would have resulted in an increase in operating income of approximately $1.4 million for the year ended December 27, 2015. This hypothetical calculation assumes that each exchange rate would change in the same direction relative to the U.S. dollar. This sensitivity analysis of the effects of changes in foreign currency transaction gain (loss)exchange rates does not factor in a potential change in sales levels or local currency prices, which can also be affected by the change in exchange rates.
Other
As of December 27, 2015, we had outstanding $60 million and $632.5 million principal amount of our 2017 and 2020 Notes, respectively. We carry these instruments at face value less unamortized discount on our consolidated balance sheets. Since these instruments bear interest at a fixed rate, we have no financial statements. In 2012, we began to economically hedge our exposure to fluctuationsstatement risk associated with changes in interest rates. However, the fair value of these instruments fluctuates when interest rates change, and in the Euro by entering into foreign exchange forward contracts. In future periods, we may hedge other foreign currency exposures.

case of our 2017 and 2020 Notes, when the market price of our ordinary shares fluctuates. We do not carry the 2017 and 2020 Notes at fair value, but present the fair value of the principal amount of our 2017 and 2020 Notes for disclosure purposes.

75


Item 8. Financial Statements and Supplementary Data.

Index to Consolidated Financial Statements


Wright Medical Group N.V.
Consolidated Financial Statements
for the Fiscal Years Ended December 27, 2015 and December 31, 2014 and 2013
Index to Financial Statements

Page
70Consolidated Financial Statements 

72

73

73

74

75

76


76


Report of Independent Registered Public Accounting Firm

The Board of Directors and Shareholders

of Tornier


Wright Medical Group N.V. and Subsidiaries

:

We have audited the accompanying consolidated balance sheets of TornierWright Medical Group N.V. and subsidiaries (the Company) as of December 30, 2012,27, 2015 and January 1, 2012,December 31, 2014, and the related consolidated statements of operations, comprehensive loss, cash flows, and changes in shareholders’ equity and cash flows for each of the three fiscal years in the period ended December 30, 2012. Our audits also included the27, 2015, December 31, 2014 and December 31, 2013. These consolidated financial statement schedule listed in the Index at Item 15(a). These financial statements and schedule are the responsibility of the Company’s management. Our responsibility is to express an opinion on these consolidated financial statements and schedule based on our audits.

We conducted our audits in accordance with the standards of the Public Company Accounting Oversight Board (United States). Those standards require that we plan and perform the audit to obtain reasonable assurance about whether the financial statements are free of material misstatement. An audit includes examining, on a test basis, evidence supporting the amounts and disclosures in the financial statements. An audit also includes assessing the accounting principles used and significant estimates made by management, as well as evaluating the overall financial statement presentation. We believe that our audits provide a reasonable basis for our opinion.

In our opinion, the consolidated financial statements referred to above present fairly, in all material respects, the consolidated financial position of Tornier N.V.the Company as of December 27, 2015 and subsidiaries at December 30, 2012 and January 1, 2012,31, 2014, and the consolidated results of theirits operations and theirits cash flows for each of the three fiscal years in the period ended December 30, 2012,27, 2015, December 31, 2014 and December 31, 2013, in conformity with U.S. generally accepted accounting principles. Also, in our opinion, the related financial statement schedule, when considered in relation to the basic financial statements taken as a whole, present fairly in all material respects the information set forth therein.

We also have audited, in accordance with the standards of the Public Company Accounting Oversight Board (United States), Tornier N.V.’sthe Company’s internal control over financial reporting as of December 30, 2012,27, 2015, based on criteria established in Internal Control-IntegratedControl - Integrated Framework (2013) issued by the Committee of Sponsoring Organizations of the Treadway Commission (COSO), and our report dated March 1, 2013,February 23, 2016 expressed an unqualified opinion thereon.

/s/ Ernst & Youngon the effectiveness of the Company’s internal control over financial reporting.


(signed) KPMG LLP

Minneapolis, Minnesota

March 1, 2013

Memphis, Tennessee
February 23, 2016


77


Report of Independent Registered Public Accounting Firm

The Board of Directors and Shareholders

of Tornier


Wright Medical Group N.V. and Subsidiaries

:

We have audited TornierWright Medical Group N.V. and subsidiaries’s (the Company) internal control over financial reporting as of December 30, 2012,27, 2015, based on criteria established in Internal Control—Control - Integrated Framework (2013) issued by the Committee of Sponsoring Organizations of the Treadway Commission (the COSO criteria)(COSO). Tornier Wright Medical Group N.V. and subsidiaries’’s management is responsible for maintaining effective internal control over financial reporting and for its assessment of the effectiveness of internal control over financial reporting, included in the accompanying Management’s Annual Report on Internal Control Over Financial Reporting. Our responsibility is to express an opinion on the company’sCompany’s internal control over financial reporting based on our audit.

We conducted our audit in accordance with the standards of the Public Company Accounting Oversight Board (United States). Those standards require that we plan and perform the audit to obtain reasonable assurance about whether effective internal control over financial reporting was maintained in all material respects. Our audit included obtaining an understanding of internal control over financial reporting, assessing the risk that a material weakness exists, and testing and evaluating the design and operating effectiveness of internal control based on the assessed risk, andrisk. Our audit also included performing such other procedures as we considered necessary in the circumstances. We believe that our audit provides a reasonable basis for our opinion.

A company’s internal control over financial reporting is a process designed to provide reasonable assurance regarding the reliability of financial reporting and the preparation of financial statements for external purposes in accordance with generally accepted accounting principles. A company’s internal control over financial reporting includes those policies and procedures that (1) pertain to the maintenance of records that, in reasonable detail, accurately and fairly reflect the transactions and dispositions of the assets of the company; (2) provide reasonable assurance that transactions are recorded as necessary to permit preparation of financial statements in accordance with generally accepted accounting principles, and that receipts and expenditures of the company are being made only in accordance with authorizations of management and directors of the company; and (3) provide reasonable assurance regarding prevention or timely detection of unauthorized acquisition, use, or disposition of the company’s assets that could have a material effect on the financial statements.

Because of its inherent limitations, internal control over financial reporting may not prevent or detect misstatements. Also, projections of any evaluation of effectiveness to future periods are subject to the risk that controls may become inadequate because of changes in conditions, or that the degree of compliance with the policies or procedures may deteriorate.

As indicated in the accompanying Management’s Annual Report on Internal Control Over Financial Reporting, management’s assessment of and conclusion on the effectiveness of internal control over financial reporting did not include the internal controls of OrthoHelix Surgical Designs, Inc., which is included in the 2012 consolidated financial statements of Tornier N.V. and subsidiaries and constituted less than 5% of total assets as of December 30, 2012 and less than 3% of revenues for the year then ended. Our audit of internal control over financial reporting also did not include an evaluation of the internal control over financial reporting of OrthoHelix Surgical Designs, Inc.

In our opinion, TornierWright Medical Group N.V. and subsidiaries maintained, in all material respects, effective internal control over financial reporting as of December 30, 2012,27, 2015, based on criteria established in Internal Control - Integrated Framework (2013) issued by the COSO criteria.

Committee of Sponsoring Organizations of the Treadway Commission (COSO).

Wright Medical Group, Inc. acquired Tornier N.V. in a reverse acquisition on October 1, 2015 with the combined company renamed Wright Medical Group N.V., and management excluded from its assessment of the effectiveness of Wright Medical Group N.V.’s internal control over financial reporting as of December 27, 2015, Tornier N.V.’s internal control over financial reporting associated with total assets, excluding goodwill and intangibles, of $365,090,000 and total net sales of $83,403,000 included in the consolidated financial statements of Wright Medical Group N.V. and subsidiaries as of and for the year ended December 27, 2015. Our audit of internal control over financial reporting of Wright Medical Group N.V. also excluded the evaluation of the internal control over financial reporting of Tornier N.V.
We also have audited, in accordance with the standards of the Public Company Accounting Oversight Board (United States), the consolidated balance sheets of TornierWright Medical Group N.V. and subsidiaries as of December 30, 201227, 2015 and January 1, 2012,December 31, 2014, and the related consolidated statements of operations, comprehensive loss, cash flows, and shareholders’ equity and cash flows for each of the three fiscal years in the period ended December 30, 201227, 2015, December 31, 2014 and December 31, 2013, and our report dated March 1, 2013February 23, 2016 expressed an unqualified opinion thereon.

/s/ Ernst & Youngon those consolidated financial statements.


(signed) KPMG LLP

Minneapolis, Minnesota

March 1, 2013

Memphis, Tennessee
TORNIER N.V. AND SUBSIDIARIESFebruary 23, 2016


78

Consolidated Balance Sheets

(in thousands except share and per share data)

   December 30,
2012
  January 1,
2012
 

Assets


Current assets:


Cash and cash equivalents

  $31,108   $54,706  

Accounts receivable (net of allowance of $4,846 and $2,486, respectively)

   54,192    45,908  

Inventories

   86,697    79,883  

Income taxes receivable

   382    —    

Deferred income taxes

   2,734    620  

Prepaid taxes

 �� 14,752    12,417  

Prepaid expenses

   2,998    2,225  

Other current assets

   4,455    3,113  


Total current assets

   197,318    198,872  

Instruments, net

   51,394    49,347  

Property, plant and equipment, net

   37,151    33,353  

Goodwill

   239,804    130,544  

Intangible assets, net

   126,594    97,665  

Deferred income taxes

   159    69  

Other assets

   1,807    1,850  


Total assets

  $654,227   $511,700  


Liabilities and shareholders’ equity


Current liabilities:


Short-term borrowing and current portion of long-term debt

  $4,595   $18,011  

Accounts payable

   11,526    12,020  

Accrued liabilities

   44,410    34,445  

Income taxes payable

   83    917  

Deferred income taxes

   12    81  


Total current liabilities

   60,626    65,474  

Long-term debt

   115,457    21,900  

Deferred income taxes

   20,284    16,966  

Contingent consideration

   15,265    —    

Other non-current liabilities

   6,516    5,900  


Total liabilities

   218,148    110,240  

Shareholders’ equity:


Ordinary shares, €0.03 par value; authorized 175,000,000 at December 30, 2012 and January 1, 2012, respectively; issued and outstanding 41,728,257 and 39,270,029 at December 30, 2012 and January 1, 2012, respectively

   1,655    1,560  

Additional paid-in capital

   660,968    608,772  

Accumulated deficit

   (235,732  (213,988

Accumulated other comprehensive income

   9,188    5,116  


Total shareholders’ equity

   436,079    401,460  


Total liabilities and shareholders’ equity

  $654,227   $511,700  


Wright Medical Group N.V.
Consolidated Balance Sheets
(In thousands, except share data)

 December 27, 2015 December 31, 2014
Assets:   
Current assets:   
Cash and cash equivalents$139,804
 $227,326
Marketable securities
 2,575
Accounts receivable, net131,050
 57,190
Inventories229,109
 88,412
Prepaid expenses15,002
 11,161
Other current assets44,919
 50,355
Total current assets 2
559,884
 437,019
    
Property, plant and equipment, net240,769
 104,235
Goodwill876,344
 190,966
Intangible assets, net256,743
 69,025
Deferred income taxes 2
2,580
 1,649
Other assets153,355
 87,179
Total assets 2
$2,089,675
 $890,073
Liabilities and Shareholders’ Equity:   
Current liabilities:   
Accounts payable$30,904
 $16,729
Accrued expenses and other current liabilities 2
173,863
 169,614
Current portion of long-term obligations2,171
 718
Total current liabilities 2
206,938
 187,061
    
Long-term debt and capital lease obligations577,382
 280,612
Deferred income taxes 2
41,755
 9,553
Other liabilities208,574
 134,044
Total liabilities 2
1,034,649
 611,270
Commitments and contingencies (Note 16)

 
Shareholders’ equity:   
Ordinary shares, €0.03 par value, authorized: 320,000,000 shares; issued and outstanding: 102,672,678 shares at December 27, 2015 and 52,913,093 shares at December 31, 2014 1
3,790
 2,101
Additional paid-in capital 1
1,835,586
 749,469
Accumulated other comprehensive (loss) income(10,484) 2,398
Accumulated deficit(773,866) (475,165)
Total shareholders’ equity1,055,026
 278,803
Total liabilities and shareholders’ equity 2
$2,089,675
 $890,073

1
The prior year balances were converted to meet post-merger valuations as described within Note 13.
2
The prior year deferred tax balances were reclassified to account for early adoption of ASU 2015-17.
The accompanying notes are an integral part of thethese consolidated financial statements.

TORNIER N.V. AND SUBSIDIARIES


79

Consolidated Statements
Table of Operations

(in thousands except per share data)

   Fiscal Year Ended 
   December 30,
2012
  January 1,
2012
  January 2,
2011
 

Revenue

  $277,520   $261,191   $227,378  

Cost of goods sold

   81,918    74,882    63,437  


Gross profit

   195,602    186,309    163,941  

Operating expenses:


Selling, general and administrative

   170,447    161,448    149,175  

Research and development

   22,524    19,839    17,896  

Amortization of intangible assets

   11,721    11,282    11,492  

Special charges

   19,244    892    306  


Total operating expenses

   223,936    193,461    178,869  


Operating loss

   (28,334  (7,152  (14,928

Other income (expense):


Interest income

   338    550    223  

Interest expense

   (3,733  (4,326  (21,805

Foreign currency transaction (loss) gain

   (473  193    (8,163

Loss on extinguishment of debt

   (593  (29,475  —    

Other non-operating income, net

   116    1,330    43  


Loss before income taxes

   (32,679  (38,880  (44,630

Income tax benefit

   10,935    8,424    5,121  


Consolidated net loss

   (21,744  (30,456  (39,509

Net loss attributable to non-controlling interest

   —      —      (695


Net loss attributable to Tornier

   (21,744  (30,456  (38,814

Accretion of non-controlling interest

   —      —      (679


Net loss attributable to ordinary shareholders

  $(21,744 $(30,456 $(39,493


Net loss per share:


Basic and diluted

  $(0.54 $(0.80 $(1.42


Weighted average shares outstanding:


Basic and diluted

   40,064    38,227    27,770  


TORNIER N.V. AND SUBSIDIARIES

ContentsConsolidated Statements of Comprehensive Loss

(in thousands)

   Fiscal year ended 
   December 30,
2012
  January 1,
2012
  January 2,
2011
 

Consolidated net loss

  $(21,744 $(30,456 $(39,509

Unrealized loss on retirement plans, net of tax

   (866  (32  (32

Foreign currency translation adjustments

   4,938    (10,160  (4,149


Comprehensive loss

  $(17,672 $(40,648 $(43,690

Comprehensive net loss attributable to non-controlling interest

   —      —      (695


Comprehensive net loss attributable to Tornier

  $(17,672 $(40,648 $(42,995


Wright Medical Group N.V.
Consolidated Statements of Operations
(In thousands, except per share data)

 Fiscal year ended
 December 27, 2015 December 31, 2014 December 31, 2013
Net sales$415,461
 $298,027
 $242,330
Cost of sales 1
119,255
 73,223
 59,721
Gross profit296,206
 224,804
 182,609
Operating expenses:     
Selling, general and administrative 1
429,398
 289,620
 230,785
Research and development 1
39,855
 24,963
 20,305
Amortization of intangible assets16,922
 10,027
 7,476
BioMimetic impairment charges
 
 206,249
Total operating expenses486,175
 324,610
 464,815
Operating loss(189,969) (99,806) (282,206)
Interest expense, net41,358
 17,398
 16,040
Other expense (income), net10,884
 129,626
 (67,843)
Loss from continuing operations before income taxes(242,211) (246,830) (230,403)
(Benefit) provision for income taxes(3,851) (6,334) 49,765
Net loss from continuing operations$(238,360) $(240,496) $(280,168)
(Loss) income from discontinued operations, net of tax1
$(60,341) $(19,187) $6,223
Net loss$(298,701) $(259,683) $(273,945)
      
Net loss from continuing operations per share (Note 13):2
     
Basic$(3.68) $(4.69) $(5.82)
Diluted$(3.68) $(4.69) $(5.82)
      
Net loss per share (Note 13):2


Basic$(4.61) $(5.06) $(5.69)
Diluted$(4.61) $(5.06) $(5.69)
      
Weighted-average number of ordinary shares outstanding-basic2
64,808
 51,293
 48,103
Weighted-average number of ordinary shares outstanding-diluted2
64,808
 51,293
 48,103
___________________________
1
These line items include the following amounts of non-cash, share-based compensation expense for the periods indicated:
 Fiscal year ended
 December 27, 2015 December 31, 2014 December 31, 2013
Cost of sales$287
 $254
 $503
Selling, general and administrative22,777
 10,149
 10,675
Research and development1,900
 1,084
 780
Discontinued operations
 
 3,410
2
The prior year weighted-average shares outstanding and net loss per share amounts were converted to meet post-merger valuations as described within Note 13. The 2015 weighted-average shares outstanding includes additional shares issued on October 1, 2015 as part of the Wright/Tornier merger as described in Note 13.
The accompanying notes are an integral part of thethese consolidated financial statements.

TORNIER


80


Wright Medical Group N.V. AND SUBSIDIARIES

Consolidated Statements of Cash Flows

Comprehensive Loss

(inIn thousands)

   Fiscal Year Ended 
   December 30,
2012
  January 1,
2012
  January 2,
2011
 

Cash flows from operating activities:


Consolidated net loss

  $(21,744 $(30,456 $(39,509

Adjustments to reconcile consolidated net loss to cash provided by operating activities:


Depreciation and amortization

   30,232    28,107    27,038  

Impairment of fixed assets

   2,041    —      —    

Lease termination costs

   731    —      —    

Intangible impairment

   4,737    210    —    

Non-cash foreign currency (gain) loss

   (495  298    7,143  

Deferred income taxes

   (4,506  (11,619  (6,548

Tax benefit from reversal of valuation allowance

   (10,700  —      —    

Share-based compensation

   6,830    6,547    5,630  

Non-cash interest expense and discount amortization

   524    2,040    19,612  

Inventory obsolescence

   8,171    4,996    5,212  

Loss on extinguishment of debt

   —      29,475    —    

Change in fair value of warrant liability

   —      —      (172

Incentive related to new facility lease

   1,400    —      —    

Acquired inventory step-up

   1,993    —      —    

Other non-cash items affecting earnings

   1,836    (186  1,871  

Changes in operating assets and liabilities, net of acquisitions:


Accounts receivable

   (2,188  (4,673  (3,790

Inventories

   (3,057  (7,939  (17,349

Accounts payable and accruals

   87    2,573    2,348  

Other current assets and liabilities

   (1,526  3,987    (307

Other non-current assets and liabilities

   65    (194  1,710  


Net cash provided by operating activities

   14,431    23,166    2,889  

Cash flows from investing activities:


Acquisition-related cash payments

   (102,612  —      —    

Purchases of intangible assets

   (1,410  (3,142  (2,328

Additions of instruments

   (11,999  (19,734  (13,838

Property, plant and equipment lease incentive

   (1,400  —      —    

Purchases of property, plant and equipment

   (9,891  (6,599  (6,687

Proceeds from sale of property, plant and equipment

   1,517    —      —    


Net cash used in investing activities

   (125,795  (29,475  (22,853

Cash flows from financing activities:


Change in short-term debt

   (8,009  (10,513  6,468  

Repayments of long-term debt

   (28,684  (8,147  (7,687

Repayment of notes payable

   —      (116,108  —    

Proceeds from issuance of long-term debt

   121,045    5,032    11,361  

Deferred financing costs

   (5,396  (2,731  (3,534

Issuance of ordinary shares

   7,710    171,577    819  


Net cash provided by financing activities

   86,666    39,110    7,427  

Effect of exchange rate changes on cash and cash equivalents

   1,100    (2,933  (594


(Decrease) increase in cash and cash equivalents

   (23,598  29,868    (13,131

Cash and cash equivalents:


Beginning of period

   54,706    24,838    37,969  


End of period

  $31,108   $54,706   $24,838  


Non cash investing and financing transactions:


Fixed assets acquired pursuant to capital lease

  $560   $640   $614  


Supplemental disclosure:


Income taxes paid (refunded)

   2,937   $1,119   $999  


Interest paid

  $2,084   $2,235   $2,193  


  Fiscal year ended
  December 27, December 31, December 31,
  2015 2014 2013
       
Net loss $(298,701) $(259,683) $(273,945)
       
Other comprehensive income (loss), net of tax:      
Changes in foreign currency translation (12,882) (17,840) (1,381)
Reclassification of gain on equity securities, net of taxes $1 and $3,041, respectively 
 1
 (4,757)
Unrealized gain on marketable securities, net of taxes $987 
 
 1,543
Reclassification of currency translation adjustment (CTA) write-off to earnings related to liquidation of Japanese subsidiary 
 2,628
 
Reclassification of minimum pension liability to earnings 
 (344) 14
Other comprehensive loss (12,882) (15,555) (4,581)
       
Comprehensive loss $(311,583) $(275,238) $(278,526)

The accompanying notes are an integral part of thethese consolidated financial statements.

TORNIER N.V. AND SUBSIDIARIES


Consolidated Statements
Table of Shareholders’ Equity

(in thousands)

           Additional
Paid-In

Capital
  Accumulated
Other
Comprehensive

Income (Loss)
       
                  
   Ordinary Shares     Accumulated
Deficit
  Total 
   Shares   Amount      

Balance at December 27, 2009

   24,667    $968    $344,049   $19,489   $(144,718 $219,788  

Net loss attributable to Tornier

   —       —       —      —      (38,814  (38,814

Unrealized loss on retirement plans

   —       —       —      (32  —      (32

Foreign currency translation adjustments

   —       —       —      (4,149  —      (4,149

Accretion of non-controlling interest

   —       —       (679  —      —      (679

Conversion of warrants to ordinary shares, net of $21,686 tax

   3,780     143     63,156    —      —      63,299  

Acquisition of C2M Medical, Inc.

   1,031     41     23,159    —      —      23,200  

Issuances of ordinary shares to related parties

   44     2     980    —      —      982  

Other issuances of ordinary shares

   47     2     817    —      —      819  

Share-based compensation

   —       —       5,825    —      —      5,825  


Balance at January 2, 2011

   29,569    $1,156    $437,307   $15,308   $(183,532 $270,239  


Net loss attributable to Tornier

   —       —       —      —      (30,456  (30,456

Unrealized loss on retirement plans

   —       —       —      (32  —      (32

Foreign currency translation adjustments

   —       —       —      (10,160  —      (10,160

Initial public offering financing costs

   —       —       (17,962  —      —      (17,962

Issuances of ordinary shares related to initial public offering

   9,471     394     179,560    —      —      179,954  

Issuance of ordinary shares related to stock option exercises

   230     10     3,310    —      —      3,320  

Share-based compensation

   —       —       6,557    —      —      6,557  


Balance at January 1, 2012

   39,270    $1,560    $608,772   $5,116   $(213,988 $401,460  


Net loss

   —       —       —      —      (21,744  (21,744

Unrealized loss on retirement plans

   —       —       —      (866  —      (866

Foreign currency translation adjustments

   —       —       —      4,938    —      4,938  

Issuances of ordinary shares related to acquisition of OrthoHelix Surgical Designs, Inc.

   1,941     75     37,954    —      —      38,029  

Issuances of ordinary shares related to employee stock purchase plan

   8     1     169    —      —      170  

Issuances of ordinary shares for restricted stock units

   50     2     (2  —      —      —    

Issuance of ordinary shares related to stock option exercises

   459     17     7,523    —      —      7,540  

Share-based compensation

   —       —       6,552    —      —      6,552  


Balance at December 30, 2012

   41,728    $1,655    $660,968   $9,188   $(235,732 $436,079  


Contents


Wright Medical Group N.V.
Consolidated Statements of Cash Flows
(In thousands)

 Fiscal year ended
 December 27, December 31, December 31,
 2015 2014 2013
Operating activities:     
Net loss$(298,701) $(259,683) $(273,945)
Adjustments to reconcile net loss to net cash used in operating activities:     
Depreciation29,481
 18,582
 26,296
Share-based compensation expense24,964
 11,487
 15,368
Amortization of intangible assets16,922
 10,027
 8,345
Amortization of deferred financing costs and debt discount27,600
 10,969
 10,288
Deferred income taxes (Note 11)
(3,087) (396) 51,958
Provision for excess and obsolete inventory 1
14,218
 3,967
 4,688
Write-off of deferred financing costs25,101
 
 
Excess tax benefit from share-based compensation arrangements
 (59) (804)
Amortization of inventory step-up11,356
 
 
Non-cash adjustment to derivative fair value(10,045) 2,000
 1,000
Non-cash realized gain on BioMimetic stock (Note 3)

 
 (7,798)
Gain on sale of OrthoRecon business


 (24,277) 
BioMimetic goodwill and intangible impairment charge
 
 203,081
Mark-to-market adjustment for CVRs (Note 2)
(7,571) 125,012
 (61,151)
Reduction of insurance receivable25,000
 
 
Other4,780
 2,582
 (2,788)
Changes in assets and liabilities (net of acquisitions):     
Accounts receivable(13,078) (11,970) (3,477)
Inventories 1
(24,695) (25,317) 2,686
Prepaid expenses and other current assets(10,471) 30,531
 (21,945)
Accounts payable(2,919) 12,907
 (1,334)
Accrued expenses and other liabilities23,258
 (22,364) 12,931
CVR payment in excess of value assigned as part of PPA(27,983) 
 
Net cash used in operating activities(195,870) (116,002) (36,601)
Investing activities:     
Capital expenditures(43,666) (48,603) (37,530)
Acquisition of businesses(4,905) (80,556) (95,409)
Purchase of intangible assets(82) (11,693) (4,291)
Cash acquired from merger with Tornier30,117
 
 
Sales and maturities of available-for-sale marketable securities2,566
 11,795
 27,332
Investment in available-for-sale marketable securities
 
 (20,719)
Proceeds from sale of assets
 274,687
 9,300
Net cash (used in) provided by investing activities(15,970) 145,630
 (121,317)
Financing activities:     
Issuance of ordinary shares3,513
 37,201
 6,328
Proceeds from 2020 Warrants87,072
 
 
Payment of 2020 Notes hedge option(144,843) 
 
Repurchase of 2017 Warrants(59,803) 
 
Payment of 2017 Notes Premium(49,152) 
 
Proceeds from 2017 Notes hedge option69,764
 
 
Maturity/redemption of 2014 convertible senior notes
 (3,768) 
Payment of debt acquired from merger with Tornier(81,367) 
 
Proceeds from convertible 2020 notes632,500
 
 
Redemption of convertible 2017 notes(240,000) 
 
Payments of deferred financing costs and equity issuance costs(20,081) 
 (16)
Payment of contingent consideration(70,120) 
 
Payments of capital leases(621) (441) (859)

82


Wright Medical Group N.V.
Consolidated Statements of Cash Flows (Continued)
(In thousands)

 Fiscal year ended
 December 27, December 31, December 31,
 2015 2014 2013
Excess tax benefit from share-based compensation arrangements
 59
 804
Net cash provided by financing activities126,862
 33,051
 6,257
      
Effect of exchange rates on cash and cash equivalents(2,544) (4,088) 36
      
Net (decrease) increase in cash and cash equivalents(87,522) 58,591
 (151,625)
      
Cash and cash equivalents, beginning of year227,326
 168,735
 320,360
      
Cash and cash equivalents, end of year$139,804
 $227,326
 $168,735
1
The prior year balances were revised to show separate presentation related to provision for excess and obsolete inventory.


The accompanying notes are an integral part of thethese consolidated financial statements.


83


Wright Medical Group N.V.
Consolidated Statements of Changes in Shareholders’ Equity
For the fiscal years ended December 31, 2013 and 2014 and December 27, 2015
(In thousands, except share data)
 Ordinary shares 
Additional paid-in capital 1
  Retained earnings/ (accumulated deficit) Accumulated other comprehensive income Total shareholders' equity
 
Number of
shares 1
 
Amount 1
 
Balance at December 31, 201240,930,191
 $1,620
 $440,824
 $58,463
 $22,534
 $523,441
2013 Activity:           
Net loss
 
 
 (273,945) 
 (273,945)
Foreign currency translation


 (1,381) (1,381)
Reclassification of gain on equity securities, net of taxes $3,041


 (4,757) (4,757)
Unrealized gain (loss) on marketable securities, net of taxes $987


 1,543
 1,543
Minimum pension liability adjustment


 14
 14
Issuances of ordinary shares317,040
 12
 6,316
 
 
 6,328
Ordinary shares issued in connection with BioMimetic acquisition7,171,847
 279
 168,482
 
 
 168,761
Ordinary shares issued in connection with Biotech acquisition765,046
 31
 20,933
 
 
 20,964
Grant of non-vested shares of ordinary shares290,193


Forfeitures of non-vested shares of ordinary shares(40,695) 


Vesting of stock-settled phantom stock and restricted stock units43,116
 14
 (14) 
 
 
Tax deficits realized from share-based compensation arrangements, net
 
 (1,045) 
 
 (1,045)
Share-based compensation
 
 19,687
 
 
 19,687
Equity issuance costs associated with BioMimetic acquisition
 
 104
 
 
 104
Balance at December 31, 201349,476,738
 $1,956
 $655,287
 $(215,482) $17,953
 $459,714
2014 Activity:           
Net loss
 
 
 (259,683) 
 (259,683)
Foreign currency translation


 (17,840) (17,840)
Reclassification of gain on equity securities, net of taxes $1


 1
 1
Minimum pension liability adjustment 2


 (344) (344)
Currency translation adjustment (CTA) write-off to earnings related to liquidation of Japanese subsidiary 2


 2,628
 2,628
Issuances of ordinary shares1,718,100
 68
 37,132
 
 
 37,200
Ordinary shares issued in connection with Solana acquisition1,406,799
 57
 41,387
 
 
 41,444
Grant of non-vested shares of ordinary shares252,477


Forfeitures of non-vested shares of ordinary shares(24,051) 


Vesting of stock-settled phantom stock and restricted stock units83,030
 20
 (20) 
 
 
Share-based compensation
 
 15,683
 
 
 15,683
Balance at December 31, 201452,913,093
 $2,101
 $749,469
 $(475,165) $2,398
 $278,803

84


Wright Medical Group N.V.
Consolidated Statements of Changes in Shareholders’ Equity (Continued)
For the Fiscal Years Ended December 31, 2013 and 2014 and December 27, 2015
(In thousands, except share data)
 Ordinary shares 
Additional paid-in capital 1
  Retained earnings/ (accumulated deficit) Accumulated other comprehensive income Total shareholders' equity
 
Number of
shares 1
 
Amount 1
 
2015 Activity:           
Net loss
 $
 $
 $(298,701) $
 $(298,701)
Foreign currency translation
 $
 $
 $
 $(12,882) $(12,882)
Issuances of ordinary shares160,306
 $6
 $3,514
 $
 $
 $3,520
Ordinary shares issued in connection with Tornier merger49,569,007
 $1,666
 $1,032,570
 $
 $
 $1,034,236
Grant of non-vested shares of ordinary shares5,246
 $
 $
 $
 $
 $
Forfeitures of non-vested shares of ordinary shares(5,869) $
 $
 $
 $
 $
Vesting of stock-settled phantom stock and restricted stock units30,895
 $17
 $(17) $
 $
 $
Share-based compensation
 $
 $24,803
 $
 $
 $24,803
Issuance of stock warrants, net of equity issuance costs
 $
 $25,247
 $
 $
 $25,247
Balance at December 27, 2015102,672,678
 $3,790
 $1,835,586
 $(773,866) $(10,484) $1,055,026

1
The prior year balances of ordinary shares and additional paid in capital were restated to meet post-merger conversion values as further described within Note 13.
2
The balances of CTA and minimum pension liability adjustment within AOCI were written-off in 2014 following the liquidation of our former Japanese subsidiary as part of the sale of our OrthoRecon business. This was recorded within the gain on the sale of the OrthoRecon business within results of discontinued operations.


The accompanying notes are an integral part of these consolidated financial statements.

85


WRIGHT MEDICAL GROUP N.V.
NOTES TO CONSOLIDATED FINANCIAL STATEMENTS


1. Organization and Description of Business

TORNIERWright Medical Group N.V. AND SUBSIDIARIES

Notes to the Consolidated Financial Statements

1. Business Description

Tornier N.V. (Tornier(Wright or the Company)we) is a global medical device company focused on orthopaedic surgeons that treat musculoskeletal injuriesextremities and disordersbiologics products. We are committed to delivering innovative, value-added solutions improving quality of life for patients worldwide and are a recognized leader of surgical solutions for the upper extremities (shoulder, elbow, wrist and hand), lower extremities (foot and ankle) and biologics markets, three of the shoulder, elbow, wrist, hand, ankle and foot. Tornier refers to these surgeons as extremity specialists. Tornier sells to this extremity specialist customer base a broad line of joint replacement, trauma, sports medicine and biologicfastest growing segments in orthopaedics. We market our products to treat extremity joints. The Company’s motto of “specialists serving specialists” encompasses this focus. In certain international markets, Tornier also offers joint replacement products for the hip and knee. Tornier currently sells approximately 100 product lines in approximately 40 countries.

The Company’sover50 countries worldwide.

Our global corporate headquarters are located in Amsterdam, the Netherlands. The Company’s U.S.We also have significant operations located in Memphis, Tennessee (U.S. headquarters, and its U.S. sales and distribution operations are in Bloomington, Minnesota. The Company conducts manufacturing, research and development, sales and distributionmarketing administration, and administrative activities inactivities); Bloomington, Minnesota (upper extremities sales and marketing); Arlington, Tennessee (manufacturing and warehousing operations); Grenoble, France (manufacturing and also has manufacturing operations in Ireland. The Company has otherresearch and development); and Macroom, Ireland (manufacturing). In addition, we have local sales and distribution operationsoffices in Canada, Australia, Germany, Italy,Asia, and throughout Europe. For purposes of this report, references to "international" or "foreign" relate to non-U.S. matters while references to "domestic" relate to U.S. matters.
Upon completion of the Netherlands, Belgium,merger between legacy Wright and legacy Tornier (the Wright/Tornier merger or merger), Robert J. Palmisano, former President and Chief Executive Officer (CEO) of legacy Wright, became President and CEO of the combined company. David H. Mowry, former President and CEO of legacy Tornier, became Executive Vice President and Chief Operating Officer, and Lance A. Berry, former Senior Vice President (SVP) and Chief Financial Officer (CFO) of legacy Wright, became SVP and CFO. Our board of directors is comprised of five representatives from legacy Wright’s board of directors and five representatives from legacy Tornier’s board of directors, including Mr. Palmisano and Mr. Mowry. Immediately upon completion of the merger, legacy Wright shareholders owned approximately 52% of the combined company and legacy Tornier shareholders owned approximately 48%. In connection with the merger, the trading symbol for our ordinary shares changed from “TRNX” to “WMGI.” Because of these and other facts and circumstances, the merger has been accounted for as a “reverse acquisition” under generally acceptable accounting principles in the United Kingdom, Scandinavia, JapanStates (US GAAP), and Switzerlandas such, legacy Wright is considered the acquiring entity for accounting purposes. Therefore, legacy Wright’s historical results of operations replaced legacy Tornier’s historical results of operations for all periods prior to the merger. More specifically, the accompanying consolidated financial statements for periods prior to the merger are those of legacy Wright and has other researchits subsidiaries, and developmentfor periods subsequent to the merger also include legacy Tornier and qualityits subsidiaries.
Our fiscal year runs from the Monday nearest to the thirty-first of December of a year, and regulatory functions located in Warsaw, Indiana, and San Diego, California. The operationsends on the Sunday nearest to the thirty-first of OrthoHelix Surgical Designs, Inc. (OrthoHelix), which was acquired inDecember of the fourth quarter of 2012, are located in Medina, Ohio.

following year. Prior to the merger, our fiscal year ended December 31 each year.

The consolidated financial statements and accompanying notes present theour consolidated results of the Company for each of the fiscal years in the three-year period ended December 30, 2012, January 1, 201227, 2015, December 31, 2014, and January 2, 2011.

On January 28, 2011, the Company executed a 3-to-1 reverse stock split of the Company’s ordinary shares. The consolidated financial statements as of January 2, 2011 and for the year ended January 2, 2011 give retroactive effect to the reverse stock split.

On January 28, 2011, the Company made a change to its legal form by converting from Tornier B.V., a private company with limited liability (besloten vennootschap met beperkte aansprakelijkheid) to Tornier N.V., a public company with limited liability (naamloze vennootschap).

In February 2011, the Company completed an initial public offering of 8,750,000 ordinary shares at an offering price of $19.00 per share (before underwriters’ discounts and commissions). The Company received proceeds of approximately $149.2 million (after underwriters’ discounts and commissions of approximately $10.8 million and additional offering related costs of $6.2 million). Net proceeds were used for the retirement of debt, working capital and other general corporate purposes. Additionally, on March 7, 2011, the Company issued an additional 721,274 ordinary shares at an offering price of $19.00 per share (before underwriters’ discounts and commissions) due to the exercise of the underwriters’ overallotment option. The Company received additional net proceeds of approximately $12.8 million (after underwriters’ discounts and commissions of approximately $0.9 million).

December 31, 2013.

All amounts are presented in U.S. Dollar (“$”dollar ($), except where expressly stated as being in other currencies, e.g., Euros (“€”(€).

References in these note to consolidated financial statements to "we," "our" and "us" refer to Wright Medical Group N.V. and its subsidiaries after the Wright/Tornier merger and Wright Medical Group, Inc. and its subsidiaries before the merger.
2. Summary of Significant Accounting Policies
Principles of Consolidation.

Consolidation

The accompanying consolidated financial statements include theour accounts and those of the Company and all of its wholly and majority ownedour wholly-owned subsidiaries. In consolidation, all material intercompanyIntercompany accounts and transactions are eliminated.

have been eliminated in consolidation.

Use of EstimatesEstimates.

The consolidatedpreparation of financial statements are prepared in conformity with United States generally accepted accounting principles (U.S. GAAP) and include amounts that are based on management’s bestUS GAAP requires management to make estimates and judgments.assumptions that affect the amounts reported in the financial statements and accompanying notes. Actual results could differ from those estimates.

Basis The most significant areas requiring the use of Presentation

The Company’s fiscal year-end is generally determined on a 52-week basismanagement estimates relate to discontinued operations, revenue recognition, the determination of allowances for doubtful accounts and always falls onexcess and obsolete inventories, accounting for business combinations and the Sunday nearest to December 31. Every few years, it is necessary to add an extra weekevaluation of goodwill and long-lived assets, product liability claims and other litigation, income taxes, share-based compensation, and accounting for restructuring charges.

Discontinued Operations. On January 9, 2014, pursuant to the year making it a 53-week period in order previously disclosed Asset Purchase Agreement, dated as of June 18, 2013 (the MicroPort Agreement), by and among us and MicroPort Scientific Corporation (MicroPort), we completed our divesture and sale of our business operations operating under our prior OrthoRecon operating segment (the OrthoRecon Business)

86


WRIGHT MEDICAL GROUP N.V.
NOTES TO CONSOLIDATED FINANCIAL STATEMENTS
(continued)

to have the year end fall on the Sunday nearest to December 31. For example, the year ended January 2, 2011 (2010) includes an extra week of operations relativeMicroPort. Pursuant to the years ended December 30, 2012 (2012) and January 1, 2012 (2011). The extra week was addedterms of the MicroPort Agreement, the purchase price (as defined in the first quarteragreement) for the OrthoRecon Business was approximately $283 million (including a working capital adjustment), which MicroPort paid in cash.
All historical operating results for the OrthoRecon business, including costs associated with corporate employees and infrastructure transferred as a part of the year ended January 2, 2011, making this quarter 14 weekssale, are reflected within discontinued operations in length.

Reclassifications

Certain prior year amounts have been reclassified to conform with the presentation used in 2012. These reclassifications did not have a material impact in the presentation of prior year amounts.

Foreign Currency Translation

The functional currencies for the Company and all of the Company’s wholly owned subsidiaries are their local currencies. The reporting currency of the Company is the United States dollar. Accordingly, the consolidated financial statements of the Company and its international subsidiaries are translated into United States dollars using current exchange rates for the consolidated balance sheets and average exchange rates for the consolidated statements of operations. Further, all assets and associated liabilities to be transferred to MicroPort were classified as assets and liabilities held for sale on our consolidated balance sheet as of December 31, 2013. See Note 4 for further discussion of discontinued operations. Other than Note 4, unless otherwise stated, all discussion of assets and liabilities in these Notes to the Consolidated Financial Statements reflect the assets and liabilities held and used in our continuing operations, and all discussion of revenues and expenses reflect those associated with our continuing operations.

Cash and Cash Equivalents. Cash and cash flows. Unrealized translation gainsequivalents include all cash balances and lossesshort-term investments with original maturities of three months or less. Any such investments are readily convertible into known amounts of cash, and are so near their maturity that they present insignificant risk of changes in value because of interest rate variation.
Inventories. Our inventories are valued at the lower of cost or market on a first-in, first-out (FIFO) basis. Inventory costs include material, labor costs, and manufacturing overhead.
During the quarter ended December 27, 2015, we adjusted our estimate for excess and obsolete (E&O) inventory which resulted in a charge of $4.1 million. Our new E&O estimate is based on both the current age of kit inventory as compared to its estimated life cycle and our forecasted product demand and production requirements for other inventory items for the next 36 months. Total charges incurred to write down excess and obsolete inventory to net realizable value included in accumulated other comprehensive income (loss) in shareholders’ equity. When a transaction is denominated in a currency other than the subsidiary’s functional currency, the Company recognizes a transaction gain or loss in net earnings. Foreign currency transaction (losses) gains included in net earnings“Cost of sales” were $(0.5)approximately $14.2 million, $0.2$4.0 million, and $(8.2) million during the years ended December 30, 2012, January 1, 2012, and January 2, 2011, respectively.

Revenue Recognition

The Company derives its revenue from the sale of medical devices that are used by orthopaedic surgeons who treat diseases and disorders of extremity joints, including the shoulder, elbow, wrist, hand, ankle and foot, and large joints, including the hip and knee. The Company’s revenue is generated from sales to two types of customers: healthcare institutions and distributors. Sales to healthcare institutions represent the majority of the Company’s revenue. The Company utilizes a network of independent commission based sales agencies for sales in the United States, with variations based upon individual territories, and a combination of direct sales organizations, independent sales representatives and distributors for sales outside the United States. Generally, revenue from sales to healthcare institutions is recognized at the time of surgical implantation. The Company generally records revenue from sales to its distributors at the time the product is shipped to the distributor. Distributors, who sell the products to their customers, take title to the products and assume all risks of ownership at time of shipment. The Company does not have any arrangements with distributors that allow for retroactive pricing adjustments. The Company’s distributors are obligated to pay within specified terms regardless of when, if ever, they sell the products. In certain circumstances, the Company may accept sales returns from distributors and in certain situations in which the right of return exists, the Company estimates a reserve for sales returns and recognizes the reserve as a reduction of revenue. The Company bases its estimate for sales returns on historical sales and product return information including historical experience and trend information. The Company’s reserve for sales returns has historically been immaterial.

Shipping and Handling

Amounts billed to customers for shipping and handling of products are reflected in revenue and are not considered significant. Costs related to shipping and handling of products are expensed as incurred, are included in selling, general and administrative expense, and were $5.1 million, $5.2 million, and $4.3$4.7 million for the years ended December 30, 2012, January 1, 2012,27, 2015 and January 2, 2011,December 31, 2014 and 2013, respectively.

CashProduct Liability Claims, Product Liability Insurance Recoveries, and Cash EquivalentsOther Litigation.

Cash equivalentsWe are highly liquid investmentsinvolved in legal proceedingsinvolving product liability claims as well as contract, patent protection, and other matters. See Note 16 for additional information regarding product liability claims, product liability insurance recoveries, and other litigation.

We make provisions for claims specifically identified for which we believe the likelihood of an unfavorable outcome is probable and the amount of loss can be estimated. For unresolved contingencies with potentially material exposure that are deemed reasonably possible, we evaluate whether a potential loss or range of loss can be reasonably estimated. Our evaluation of these matters is the result of a comprehensive process designed to ensure that recognition of a loss or disclosure of these contingencies is made in a timely manner. In determining whether a loss should be accrued or a loss contingency disclosed, we evaluate a number of factors including: the procedural status of each lawsuit; any opportunities for dismissal of the lawsuit before trial; the amount of time remaining before trial date; the status of discovery; the status of settlement; arbitration or mediation proceedings; and management’s estimate of the likelihood of success prior to or at trial. The estimates used to establish a range of loss and the amounts to accrue are based on previous settlement experience, consultation with legal counsel, and management’s settlement strategies. If the estimate of a probable loss is in a range and no amount within the range is more likely, we accrue the minimum amount of the range. We recognize legal fees as an original maturity of three months or less. The carrying amount reportedexpense in the consolidated balance sheetsperiod incurred. These expenses are reflected in either continuing or discontinued operations depending on the product associated with the claim.
Property, Plant and Equipment. Our property, plant and equipment is stated at cost. Depreciation, which includes amortization of assets under capital lease, is generally provided on a straight-line basis over the estimated useful lives generally based on the following categories:
Land improvements 15to25years
Buildings 10to33years
Machinery and equipment 3to14years
Furniture, fixtures and office equipment 1to14years
Surgical instruments   6years
Expenditures for major renewals and betterments, including leasehold improvements, that extend the useful life of the assets are capitalized and depreciated over the remaining life of the asset or lease term, if shorter. Maintenance and repair costs are charged to expense as incurred. Upon sale or retirement, the asset cost and related accumulated depreciation are eliminated from the respective accounts and any resulting gain or loss is included in income.
Intangible Assets and Goodwill. Goodwill is recognized for the excess of the purchase price over the fair value of net assets of businesses acquired. Financial Accounting Standards Board (FASB) Accounting Standards Codification (ASC) 350-30-35-18 requires companies to evaluate for impairment intangible assets not subject to amortization, such as our in-process research and development (IPRD) assets, if events or changes in circumstances indicate than an asset might be impaired. Further, FASB ASC

87


WRIGHT MEDICAL GROUP N.V.
NOTES TO CONSOLIDATED FINANCIAL STATEMENTS
(continued)

350-20-35-30 requires companies to evaluate goodwill and intangibles not subject to amortization for impairment between annual impairment tests if an event occurs or circumstances change that would more likely than not reduce the fair value of a reporting unit below its carrying amount. Unless circumstances otherwise dictate, the annual impairment test is performed on October 1 each year. See Note 8 for discussion of our 2015 goodwill impairment analysis.
Our intangible assets with estimable useful lives are amortized on a straight-line basis over their respective estimated useful lives to their estimated residual values. This method of amortization approximates the expected future cash flow generated from their use. Finite lived intangibles are reviewed for impairment in accordance with FASB ASC Section 360, Property, Plant and Equipment (FASB ASC 360). The weighted average amortization periods for completed technology, distribution channels, trademarks, licenses, customer relationships, non-compete agreements, and other intangible assets are 10 years, 10 years, 5 years, 12 years, 18 years, 4 years and 3 years, respectively. The weighted average amortization period of our intangible assets on a combined basis is 13 years.
Valuation of Long-Lived Assets. Management periodically evaluates carrying values of long-lived assets, including property, plant and equipment and intangible assets, when events and circumstances indicate that these assets may have been impaired. We account for the impairment of long-lived assets in accordance with FASB ASC 360. Accordingly, we evaluate impairment of our property, plant and equipment based upon an analysis of estimated undiscounted future cash equivalentsflows. If it is cost,determined that a change is required in the useful life of an asset, future depreciation and amortization is adjusted accordingly. Alternatively, should we determine that an asset is impaired, an adjustment would be charged to income based on the difference between the asset’s fair market value and the asset's carrying value.
Allowances for Doubtful Accounts. We experience credit losses on our accounts receivable and; accordingly, we must make estimates related to the ultimate collection of our accounts receivable. Specifically, management analyzes our accounts receivable, historical bad debt experience, customer concentrations, customer credit-worthiness, and current economic trends when evaluating the adequacy of our allowance for doubtful accounts.
The majority of our accounts receivable are from hospitals, many of which approximates fair value.

Accounts Receivable

Accountsare government funded. Accordingly, our collection history with this class of customer has been favorable. Historically, we have experienced minimal bad debts from our hospital customers and more significant bad debts from certain international stocking distributors, typically as a result of specific financial difficulty or geo-political factors. We write off accounts receivable consist of tradewhen we determine that the accounts receivable are uncollectible, typically upon customer receivables. The Company maintains anbankruptcy or the customer’s non-response to continued collection efforts. Our allowance for doubtful accounts for estimated losses in the collection of accounts receivable. The Company makes estimates regarding the future

ability of its customers to make required payments based on historical credit experience, delinquency and expected future trends. The majority of the Company’s receivables are from health care institutions, many of which are government-funded. The Company’s allowance for doubtful accounts was $4.8 million, $2.5totaled $1.2 million and $2.5$0.9 million at December 30, 2012, January 1, 201227, 2015 and January 2, 2011,December 31, 2014, respectively. The increase in the allowance for doubtful accounts in 2012 was primarily due to additional reserves recorded related to specific customers and the impact

Concentration of general economic conditions in Italy.

Credit Risk.Financial instruments that potentially subject the Companyus to concentrations of credit risk consist principally of accounts receivable. Management attempts to minimize credit risk by reviewing customers’ credit history before extending credit and by monitoring credit exposure on a regular basis. TheAn allowance for doubtfulpossible losses on accounts receivable is established based upon factors surrounding the credit risk of specific customers, historical trends, and other information. Collateral or other security is generally not required for accounts receivable. As

Concentrations of Supply of Raw Material. We rely on a limited number of suppliers for the components used in our products. For certain human biologic products, we depend on one supplier of demineralized bone matrix and cancellous bone matrix. We rely on one supplier for our GRAFTJACKET® family of soft tissue repair and graft containment products. We maintain adequate stock from these suppliers in order to meet market demand. Additionally, we have other soft tissue repair products which include our CONEXA™ Reconstructive Tissue Matrix, ACTISHIELD™ and ACTISHIELD™ CF Amniotic Barrier Membranes, VIAFLOW™ and VIAFLOW™ C Flowable Placental Tissue Matrices, BIOFIBER® biologic absorbable scaffold products, and PHANTOM FIBER™ high strength, resorbable suture products.
We currently rely on one supplier for a key component of our AUGMENT® Bone Graft. In December 30, 2012, there were no customers that2013, this supplier notified us of its intent to terminate the supply agreement in December 2015. This supplier was contractually required to meet our supply requirements until the termination date, and to use commercially reasonable efforts to assist us in identifying a new supplier and support the transfer of technology and supporting documentation to produce this component. Our transition to a new supplier is underway with full cooperation from both the current and the new supplier.  Management believes the current supplier has produced sufficient product to meet our production needs for the interim period until the new supplier is on line. See Item 1A, Risk Factors, for further information on our suppliers.
Income Taxes. Income taxes are accounted for more than 10% of accounts receivable.

Royalties

The Company pays royalties to certain individuals and companies that have developed and retain the legal rightspursuant to the technology or have assisted the Companyprovisions of FASB ASC Section 740, Income Taxes (FASB ASC 740). Our effective tax rate is based on income by tax jurisdiction, statutory rates, and tax saving initiatives available to us in the developmentvarious jurisdictions in which we operate. Significant judgment is required in determining our effective tax rate and evaluating our tax positions. This process includes assessing temporary differences resulting from differing recognition of technology or new products.items for income tax and financial accounting purposes. These royalties are based on sales and are reflected as selling, general and administrative expensesdifferences result in the consolidated statements of operations.

Inventories

Inventories, net of reserves for obsolete and slow-moving goods, are stated at the lower of cost or market value. Cost is determined on a first-in, first-out (FIFO) basis. Inventory is held both within the Company and by third-party distributors on a consignment basis. Inventories consist of raw materials, work-in-process and finished goods. Finished goods inventories are held primarily in the United States, Europe and Australia and consist primarily of joint implants and related products. Inventory balances consist of the following (in thousands):

   December 30,
2012
   January 1,
2012
 

Raw materials

  $5,696    $5,986  

Work in process

   4,933     4,766  

Finished goods

   76,068     69,131  


Total

  $86,697    $79,883  


The Company regularly reviews inventory quantities on-hand for excess and obsolete inventory and, when circumstances indicate, incurs charges to write down inventories to their net realizable value. The Company’s review of inventory for excess and obsolete quantities is based primarily on the estimated forecast of future product demand, production requirements, and introduction of new products. The Company recognized $8.2 million, $5.0 million and $5.2 million of expense for excess or obsolete inventory in earnings during the years ended December 30, 2012, January 1, 2012 and January 2, 2011, respectively. The increase in the earnings charges in 2012 included a $3.0 million charge related to the rationalization of products associated with the integration of OrthoHelix into Tornier. Additionally, the Company had $29.3 million and $20.1 million in inventory held on consignment at December 30, 2012 and January 1, 2012, respectively. The increase in inventory held on consignment was due to inventory acquired as a result of the acquisition of OrthoHelix.

Property, Plant and Equipment

Property, plant and equipment are carried at cost less accumulated depreciation. Depreciation is computed using the straight-line method based on estimated useful lives of five to thirty-nine years for buildings and improvements and two to eight years for machinery and equipment. The cost of maintenance and repairs is expensed as incurred. The Company reviews property, plant and equipment for impairment whenever events or changes in circumstances indicate that the carrying value of an asset may not be recoverable. An impairment loss would be recognized when estimated future undiscounted cash flows relating to the asset are less than the asset’s carrying amount. An impairment loss is measured as the amount by which the carrying amount of an asset exceeds its fair value. As a result of the facilities consolidation initiative, the Company recorded several fixed asset impairments during fiscal 2012 related to the Company’s facilities in St. Ismier, France, Dunmanway, Ireland, and Stafford, Texas in the aggregate amount of $0.9 million for the year ended December 30, 2012. No impairment losses were recognized during the years ended January 1, 2012 and January 2, 2011.

Instruments

Instruments are surgical tools used by surgeons during joint replacement and other surgical procedures to facilitate the implantation of the Company’s products. Instruments are recognized as long-lived assets. Instruments and instrument parts that have not been placed in service are carried at cost, and are included as instruments in progress within instruments, net on the consolidated balance sheets. Once placed in service, instruments are carried at cost, less accumulated depreciation. Depreciation is computed using the straight-line method based on average estimated useful lives. Estimated useful lives are determined principally in reference to associated product life cycles, and average five years. Instrument parts used to maintain the functionality of instruments but do not extend the life of the instruments are expensed as they are consumed and recorded as part of selling, general and administrative expense. The Company reviews instruments for impairment whenever events or changes in circumstances indicate that the carrying value of the assets may not be recoverable. An impairment loss would be recognized when estimated future undiscounted cash flows relating to the asset are less than the asset’s carrying amount. An impairment loss is measured as the amount by which the carrying amount of an asset exceeds its fair value. The Company recorded an impairment charge of $1.0 million for the year ended December 30, 2012 related to instrument sets and components that were impaired as a result of revisions to existing product lines. No impairment losses were recognized during years ended January 1, 2012 or January 2, 2011. Instruments included in long-term assets on the consolidated balance sheets are as follows (in thousands):

   December 30,
2012
  January 1,
2012
 

Instruments

  $85,869   $72,971  

Instruments in progress

   18,171    18,024  

Accumulated depreciation

   (52,646  (41,648


Instruments, net

  $51,394   $49,347  


The Company provides instruments to surgeons for use in surgeries and retains title to the instruments throughout the implantation process. The increase in gross instruments in 2012 is a result of the acquisition of OrthoHelix. As instruments are used as tools to assist surgeons, depreciation of instruments is recognized as a selling, general and administrative expense. Instrument depreciation expense was $12.4 million, $11.0 million and $9.4 million during the years ended December 30, 2012, January 1, 2012 and January 2, 2011, respectively.

Business Combinations

For all business combinations, the Company records all assets and liabilities of the acquired business, including goodwill and other identified intangible assets, generally at their fair values. Contingent consideration, if any, is recognized at its fair value on the acquisition date and changes in fair value are recognized in earnings until settlement. Acquisition-related transaction costs are expensed as incurred rather than treated as part of the cost of acquisition.

Goodwill

Goodwill is recognized as the excess of the purchase price over the fair value of net assets of businesses acquired. Goodwill is not amortized, but is subject to impairment tests. Based on the Company’s single business approach to decision-making, planning and resource allocation, management has determined that the Company has one reporting unit for the purpose of evaluating goodwill for impairment. The Company performs its annual goodwill impairment test as of the first day of the fourth quarter of its fiscal year or more frequently if changes in circumstances or the occurrence of events suggest that an impairment exists. Impairment tests are done by comparing the reporting unit’s fair value to its carrying amount to determine if there is potential impairment. If the fair value of the reporting unit is less than its carrying value, an impairment loss is recorded to the extent that the implied fair value of the reporting unit’s goodwill is less than the carrying value of the reporting unit’s goodwill. The fair value of the reporting unit and the implied fair value of goodwill are determined based on widely accepted valuation techniques. No goodwill impairment losses were recorded during the years ended December 30, 2012, January 1, 2012 and January 2, 2011 as the fair value of the reporting unit significantly exceeded its carrying value.

Intangible Assets

Intangible assets with an indefinite life, including certain trademarks and trade names, are not amortized. The useful lives of indefinite-life intangible assets are assessed annually to determine whether events and circumstances continue to support an indefinite life. Intangible assets with an indefinite life are tested for impairment annually or whenever events or circumstances indicate that the carrying amount may not be recoverable. An impairment loss is recognized if the carrying amount exceeds the estimated fair value of the asset. The amount of the impairment loss to be recorded would be determined

based upon the excess of the asset’s carrying value over its fair value. No impairment losses were recorded during the years ended December 30, 2012, January 1, 2012 and January 2, 2011.

Intangible assets with a finite life, including developed technology, customer relationships, and patents and licenses, are amortized on a straight-line basis over their estimated useful lives, ranging from one to twenty years. Costs incurred to extend or renew license arrangements are capitalized as incurred and amortized over the shorter of the life of the extension or renewal, or the remaining useful life of the underlying product being licensed. Intangible assets with a finite life are tested for impairment whenever events or circumstances indicate that the carrying amount may not be recoverable. An impairment loss would be recognized when estimated future undiscounted cash flows relating to the asset are less than the asset’s carrying amount. An impairment loss is measured as the amount by which the carrying amount of an asset exceeds its fair value. For the year ended December 30, 2012, the Company recognized an impairment charge of $4.7 million dollars related to intangibles where the carrying value was greater than the fair value of the intangibles. This impairment related to developed technology and customer relationship intangibles that were recognized as part of acquisitions that occurred in 2007. The fair value of the intangibles was determined using a discounted cash flow analysis. For the year ended January 1, 2012, the Company recognized an impairment charge of $0.2 million related to developed technology from acquired entities that is no longer being used. No impairment charges were recognized during the year ended January 2, 2011. For the year ended December 30, 2012, intangible asset impairments are included in special charges on the consolidated statement of operations. For the year ended January 1, 2012 and January 2, 2011 intangible asset impairments are included in amortization of intangible assets in the consolidated statements of operations.

Derivative Financial Instruments

All of the Company’s derivative instruments are recorded in the accompanying consolidated balance sheets as either an asset or liability and are measured at fair value. The changes in the derivative’s fair value are recognized currently in current period earnings.

Changes to the fair value of foreign currency derivative instrument economic hedges are recognized in foreign currency transaction gain (loss) on the consolidated statement of operations. Any related derivative assets or liabilities are recorded as other current assets or other current liabilities, respectively, in the consolidated balance sheets.

The Company also issued warrants in 2008 and 2009 for ordinary shares that were recognized as warrant liabilities on the consolidated balance sheets. Changes in the fair value of these warrants resulted in other non-operating gain of $0.4 million for the year ended January 2, 2011. See Note 7 for additional information on these warrants.

Research and Development

All research and development costs are expensed as incurred.

Income Taxes

Deferreddeferred tax assets and liabilities, which are determined based on differences between the financial reporting and tax basesincluded within our


88


WRIGHT MEDICAL GROUP N.V.
NOTES TO CONSOLIDATED FINANCIAL STATEMENTS
(continued)

consolidated balance sheet. The measurement of deferred tax assets are recognizedis reduced by a valuation allowance if, based upon available evidence, it is more likely than not that some component or all of the benefits of deferred tax assets will not be realized.

The Company accrues interestSee Note 11 for further discussion of our consolidated deferred tax assets and penalties related toliabilities, and the associated valuation allowance.

We provide for unrecognized tax benefits based upon our assessment of whether a tax position is “more-likely-than-not” to be sustained upon examination by the tax authorities. If a tax position meets the more-likely-than-not standard, then the related tax benefit is measured based on a cumulative probability analysis of the amount that is more-likely-than-not to be realized upon ultimate settlement or disposition of the underlying tax position.
Other Taxes. Taxes assessed by a governmental authority that are imposed concurrent with our revenue transactions with customers are presented on a net basis in our consolidated statements of operations.
Revenue Recognition. Our revenues are primarily generated through two types of customers, hospitals and surgery centers, and stocking distributors, with the majority of our revenue derived from sales to hospitals. Our products are primarily sold through a network of employee sales representatives and independent sales representatives in the Company’s provisionUnited States and by a combination of employee sales representatives, independent sales representatives, and stocking distributors outside the United States. Revenues from sales to hospitals are recorded when the hospital takes title to the product, which is generally when the product is surgically implanted in a patient.
During the quarter ended December 27, 2015, following the Wright/Tornier merger, we changed our estimate of uninvoiced revenue. While we have generally recognized revenue at the time that the product was surgically implanted, from a timing perspective, we now recognize revenue at the time the surgery and associated products used are reported, as opposed to previously when we received clerical documentation from the hospital. We have accounted for income taxes. Atthis as a change in estimate and have recorded additional revenue of approximately $3 million in the quarter ended December 27, 2015.
We record revenues from sales to our stocking distributors outside the United States at the time the product is shipped to the distributor. Stocking distributors, who sell the products to their customers, take title to the products and assume all risks of ownership. Our distributors are obligated to pay within specified terms regardless of when, if ever, they sell the products. In general, the distributors do not have any rights of return or exchange; however, in limited situations, we have repurchase agreements with certain stocking distributors. These repurchase agreements require us to repurchase a specified percentage of the inventory purchased by the distributor within a specified period of time prior to the expiration of the contract. During those specified periods, we defer the applicable percentage of the sales. An insignificant amount of deferred revenue related to these types of agreements was recorded at December 27, 2015 and December 31, 20122014.
We must make estimates of potential future product returns related to current period product revenue. We develop these estimates by analyzing historical experience related to product returns. Judgment must be used and January 1, 2012, accrued interestestimates made in connection with establishing the allowance for sales returns in any accounting period. Our reserve for sales returns has historically been immaterial.
Shipping and penalties were $0.2 millionHandling Costs. We incur shipping and $0.2 million, respectively.

handling costs associated with the shipment of goods to customers, independent distributors, and our subsidiaries. Amounts billed to customers for shipping and handling of products are included in net sales. Costs incurred related to shipping and handling of products to customers are included in selling, general and administrative expenses. All other shipping and handling costs are included in cost of sales.

Other Comprehensive Income (Loss)Research and Development Costs.

Other comprehensive income (loss) refers Research and development costs are charged to expense as incurred.

Foreign Currency Translation. The financial statements of our subsidiaries whose functional currency is the local currency are translated into U.S. dollars using the exchange rate at the balance sheet date for assets and liabilities and the weighted average exchange rate for the applicable period for revenues, expenses, gains, and losses. Translation adjustments are recorded as a separate component of comprehensive income in shareholders’ equity. Gains and losses that under U.S. GAAPresulting from transactions denominated in a currency other than the local functional currency are included in comprehensive income (loss) but are excluded from net earnings, as these amounts are recorded directly as an adjustment to shareholders’ equity. Other comprehensive income (loss) is comprised mainly of foreign currency translation adjustments and unrealized gains (losses) on retirement plans. These amounts are presented“Other expense, net” in theour consolidated statements of operations.
Comprehensive Income. Comprehensive income is defined as the change in equity during a period related to transactions and other events and circumstances from non-owner sources. It includes all changes in equity during a period except those resulting from investments by owners and distributions to owners. The difference between our net income and our comprehensive loss.

income is attributable to foreign currency translation.

Share-Based CompensationCompensation.

The Company accounts We account for share-based compensation in accordance with FASB ASC TopicSection 718, formerly StatementCompensation — Stock Compensation (FASB ASC 718). Under the fair value recognition provisions of Financial Accounting Standards (SFAS) No. 123(R),Share-Based Payments—Revised, which requiresFASB ASC 718, share-based compensation cost to beis measured at the grant date based on the fair value of the award and is recognized as expense on a straight-line basis over the requisite service period, which is the vesting period. The determination of the fair value of share-based payment awards, such as options, on the date of grant using an option-pricing model is affected by the Company’s shareour stock price, as well as assumptions regarding a


89


WRIGHT MEDICAL GROUP N.V.
NOTES TO CONSOLIDATED FINANCIAL STATEMENTS
(continued)

number of complex and subjective variables, which include the expected life of the award, the expected sharestock price volatility over the expected life of the award,awards, expected dividend yield, and risk-free interest rate.
We recorded share-based compensation expense of

$25.0 million, $11.5 million, and $12.0 million during the years ended December 27, 2015 and December 31, 2014 and 2013, respectively, within results of continuing operations. The increase in expense in 2015 related to accelerated vesting of all unvested awards upon the closing of the Wright/Tornier merger. See Note 14 for further information regarding our share-based compensation assumptions and expenses.

Derivative Instruments. We account for derivative instruments and hedging activities under FASB ASC Section 815, Derivatives and Hedging (FASB ASC 815). Accordingly, all of our derivative instruments are recorded in the accompanying consolidated balance sheets as either an asset or liability and measured at fair value. The changes in the derivative’s fair value are recognized currently in earnings unless specific hedge accounting criteria are met.
We employ a derivative program using foreign currency forward contracts to mitigate the risk of currency fluctuations on our intercompany receivable and payable balances that are denominated in foreign currencies. These forward contracts are expected to offset the transactional gains and losses on the related intercompany balances. These forward contracts are not designated as hedging instruments under FASB ASC 815. Accordingly, the changes in the fair value and the settlement of the contracts are recognized in the period incurred in the accompanying consolidated statements of operations.
We recorded a net loss of approximately $0.3 million on our foreign currency contracts for the year ended December 27, 2015. For the years ended December 31, 2014 and 2013, we recorded a net gain of approximately $0.4 million and a net loss of approximately $0.6 million on foreign currency contracts, respectively, which are included in “Other (income) expense, net” in our consolidated statements of operations. These gains and losses substantially offset translation losses and gains recorded on our intercompany receivable and payable balances, also included in “Other (income) expense, net.” At December 27, 2015 and December 31, 2014, we had $3.6 million and $0 in foreign currency contracts outstanding, respectively.
On August 31, 2012 and February 13, 2015, we issued the 2017 Notes and 2020 Notes, respectively, as defined and described in Note 9. The 2017 Notes Conversion Derivative and 2020 Notes Conversion Derivative, each as defined and described in Note 6, requires bifurcation from the 2017 Notes and 2020 Notes in accordance with ASC Topic 815, and are accounted for as derivative liabilities. We also entered into 2020 Notes Hedges, as defined and described in Note 6, in connection with the issuance of the 2020 Notes with three counterparties.  The 2020 Notes Hedges, which are cash-settled, are intended to reduce our exposure to potential cash payments that we are required to make upon conversion of the 2020 Notes in excess of the principal amount of converted notes if our ordinary share price exceeds the conversion price. The 2020 Notes Hedges are accounted for as derivative assets in accordance with ASC Topic 815. The 2017 Notes Hedges, as defined and described in Note 6, were fully settled in February 2015 when the 2020 Notes were issued.
Reclassifications. Certain prior year amounts have been reclassified to conform to the current year presentation.
Supplemental Cash Flow Information. Cash paid for interest and income taxes was as follows (in thousands):
 Fiscal year ended
 December 27, December 31, December 31,
 2015 2014 2013
Interest$11,198
 $6,518
 $5,904
Income taxes$1,051
 $1,525
 $1,634
Recent Accounting Pronouncements. On May 28, 2014 and August 12, 2015, the FASB issued Accounting Standard Update (ASU) 2014-09 and 2015-14, Revenue from Contracts with Customers, which supersedes virtually all existing revenue recognition guidance under US GAAP. The ASU provides a five-step model for revenue recognition that companies will apply to recognize revenue in a manner that reflects the timing of the transfer of services to customers and the amount of revenue recognized reflects the consideration that a company expects to receive for the goods and services provided. The ASU will be effective for us fiscal year 2018. We are in the initial phases of our adoption plans and; accordingly, we are unable to estimate any effect this may have on our revenue recognition practices.
On April 7, 2015, the FASB issued ASU 2015-03, Simplifying the Presentation of Debt Issuance Costs, as part of its simplification initiative. The ASU changes the presentation of debt issuance costs in financial statements. Under current guidance (i.e., ASC 835-30-45-3 before the ASU), an entity reports debt issuance costs in the balance sheet as deferred charges (i.e., as an asset). Under the ASU, an entity presents such costs in the balance sheet as a direct deduction from the related debt liability rather than as an asset. Amortization of the costs is reported as interest expense. Further, on August 16, 2015, the FASB issued ASU 2015-15 Presentation and Subsequent Measurement of Debt Issuance Costs Associated With Line-of-Credit Arrangements to clarify the

90


WRIGHT MEDICAL GROUP N.V.
NOTES TO CONSOLIDATED FINANCIAL STATEMENTS
(continued)

SEC staff’s position on presenting and measuring debt issuance costs incurred in connection with line-of-credit arrangements given the lack of guidance on this topic in ASU 2015-03. The SEC staff has announced that it would not object to an entity deferring and presenting debt issuance costs as an asset and subsequently amortizing the deferred debt issuance costs ratably over the term of the line-of-credit arrangement. The ASU will be effective for us fiscal year 2016. We do not expect this change to significantly impact our financial statements.
On September 25, 2015, the FASB issued ASU 2015-16, Simplifying the Accounting for Measurement-Period Adjustments to simplify the accounting for measurement-period adjustments. The ASU, which is part of the FASB’s simplification initiative, was issued in response to stakeholder feedback that restatements of prior periods to reflect adjustments made to provisional amounts recognized in a business combination increase the cost and complexity of financial reporting but do not significantly improve the usefulness of the information. The ASU will be effective for us fiscal year 2016. As detailed in Note 3, purchase price allocations for the Wright/Tornier merger are subject to adjustment during the measurement period. Under this ASU, an acquirer must recognize adjustments to provisional amounts that are identified during the measurement period in the reporting period in which the adjustment amounts are determined and must present these amounts separately on the face of the income statement or disclose in the notes, the portion of the amount recorded in current-period earnings by line item that would have been recorded in previous reporting periods if the adjustment to the provisional amounts had been recognized as of the acquisition date.
On November 20, 2015, the FASB issued ASU 2015-17, Balance Sheet Classification of Deferred Taxes, as part of its simplification initiative (i.e., the Board’s effort to reduce the cost and complexity of certain aspects of US GAAP). The ASU requires entities to present deferred tax assets (DTAs) and deferred tax liabilities (DTLs) as noncurrent in a classified balance sheet. It thus simplifies the current guidance, which requires entities to separately present DTAs and DTLs as current or noncurrent in a classified balance sheet. This ASU allows early adoption. We have elected to early adopt this guidance for the year ended December 27, 2015 and retrospectively applied this guidance to prior year tax balances. This change did not significantly impact our financial statements.

3. Acquisitions and Disposition
Tornier N.V.
On October 1, 2015, we completed the Wright/Tornier merger. Immediately upon completion of the merger, legacy Wright shareholders owned approximately 52% of the combined company and legacy Tornier shareholders owned approximately 48%. Effective upon completion of the merger, we have operated under the leadership of the legacy Wright management team and our board of directors is comprised of five representatives from legacy Wright’s board of directors and five representatives from legacy Tornier’s board of directors. Because of these and other facts and circumstances, the merger has been accounted for as a “reverse acquisition” under US GAAP. As such, legacy Wright is considered the acquiring entity for accounting purposes; and therefore, legacy Wright’s historical results of operations replaced legacy Tornier’s historical results of operations for all periods prior to the merger. As part of the merger, each legacy Wright share was converted into the right to receive 1.0309 ordinary shares of the combined company. The Wright/Tornier merger added legacy Tornier’s complementary extremity product portfolio to further accelerate growth opportunities in our global extremities business. The results of operations of both companies are included in our consolidated financial statements for all periods after completion of the merger.
The acquired business contributed net sales of $83.4 million and operating loss of $14.6 million to our consolidated results of operations from the date of acquisition through December 27, 2015, which includes $11.4 million of inventory step-up amortization and $4.1 million of intangible asset amortization. This operating loss does not include the merger-related transaction costs discussed below.
Merger-Related Transaction Costs
In conjunction with the merger, we incurred approximately $20.1 million and $8.7 million of merger-related transaction costs in the years ended December 27, 2015 and December 31, 2014, respectively, all of which were recognized as selling, general and administrative expense in our consolidated statements of operations. These expenses primarily related to advisory fees, legal fees, and accounting and tax professional fees.
Purchase Consideration and Net Assets Acquired
The purchase consideration in a reverse acquisition is determined with reference to the value of equity that the accounting acquirer, legacy Wright, would have had to issue to the owners of the accounting acquiree, legacy Tornier, to give them the same percentage interest in the combined entity. The fair value of WMG common stock used in determining the purchase price was $21.02 per share, the closing price on September 30, 2015, which resulted in a total purchase consideration of $1.034 billion.

91


WRIGHT MEDICAL GROUP N.V.
NOTES TO CONSOLIDATED FINANCIAL STATEMENTS
(continued)

The calculation of the purchase consideration is as follows (in thousands):
Fair value of ordinary shares effectively transferred to Tornier shareholders$1,005,468
Fair value of ordinary shares effectively transferred to Tornier share award holders8,091
Fair value of ordinary shares effectively issued to Tornier stock option holders20,676
Fair value of total consideration$1,034,235
The acquisition was recorded by allocating the costs of the assets acquired based on their estimated fair values at the acquisition date. The excess of the cost of the acquisition over the fair value of the assets acquired is recorded as goodwill. The fair values were based on management’s analysis, including work performed by third-party valuation specialists.
The following presents the preliminary allocation of the purchase consideration to the assets acquired and liabilities assumed on October 1, 2015 (in thousands):
Cash and cash equivalents30,117
Accounts receivable63,510
Inventories140,715
Other current assets9,256
Property, plant and equipment, net123,099
Intangible assets, net204,200
Deferred income taxes1,399
Other assets8,658
Total assets acquired580,954
Current liabilities(105,500)
Long-term debt(79,554)
Deferred income taxes(36,544)
Other non-current liabilities(8,434)
Total liabilities assumed(230,032)
Net assets acquired350,922
  
Goodwill683,313
  
Total preliminary purchase consideration$1,034,235
Any changes in the estimated fair values of the net assets recorded for this business combination upon the finalization of more detailed analyses of the facts and circumstances that existed at the date of the transaction will change the allocation of the purchase price. Any subsequent changes to the purchase allocation during the measurement period that are material will be recorded in the reporting period in which the adjustment amounts are determined.
The goodwill is primarily attributable to strategic opportunities that arose from the acquisition of Tornier. The goodwill is not expected to be deductible for tax purposes.
Trade receivables and payables, as well as other current and non-current assets and liabilities, were valued at the existing carrying values as they represented the fair value of those items at the acquisition date, based on management’s judgments and estimates. Trade receivables included gross contractual amounts of $73.9 million and our best estimate of $10.4 million which represents contractual cash flows not expected to be collected at the acquisition date.
The fair value of property, plant and equipment utilized a combination of the cost and market approaches, depending on the characteristics of the asset classification.
Of the $204.2 million of acquired intangible assets, $91.0 million was assigned to customer relationships (20 year life), $89.2 million was assigned to developed technology (10 year life), $15.7 million was assigned to in-process research and development, and $8.3 million was assigned to trade names (2.6 year life).

92


WRIGHT MEDICAL GROUP N.V.
NOTES TO CONSOLIDATED FINANCIAL STATEMENTS
(continued)

Pro Forma Condensed Combined Financial Information (Unaudited)
The following unaudited pro forma combined financial information summarizes the results of operations for the periods indicated as if the Wright/Tornier merger had been completed as of January 1, 2014. Pro forma information reflects adjustments that are expected to have a continuing impact on our results of operations and are directly attributable to the merger. The unaudited pro forma results include adjustments to reflect, among other things, the amortization of the inventory step-up, the incremental intangible asset amortization to be incurred based on the preliminary values of each identifiable intangible asset, and to eliminate interest expense related to legacy Tornier's former bank term debt and line of credit, which was repaid upon completion of the Wright/Tornier merger. The pro forma amounts do not purport to be indicative of the results that would have actually been obtained if the merger had occurred as of January 1, 2014 or that may be obtained in the future, and do not reflect future synergies, integration costs, or other such costs or savings.
 
Year ended
December 27, 2015
 
Year ended
December 31, 2014
Net sales656,417
 627,435
Net loss from continuing operations(293,419) (330,231)
The pro forma net loss for the year ended December 27, 2015 includes the following non-recurring items: $32.1 million of merger-related transaction expenses, $30.1 million of non-cash share-based compensation charges, and $5.5 million of contractual change-in-control severance charges. The pro forma net loss for the year ended December 31, 2014 includes $12.4 million of non-recurring merger-related transaction expenses.
Divestiture of Certain Tornier Ankle Replacement and Toe Assets
On October 1, 2015, simultaneous with the completion of the Wright/Tornier merger, legacy Tornier completed the divestiture of the U.S. rights to legacy Tornier's SALTO TALARIS® and SALTO TALARIS® XT™ line of ankle replacement products and line of silastic toe replacement products, among other assets, for cash. We retained the right to sell these products outside the United States for up to 20 years unless the purchaser exercises an option to purchase the ex-United States rights to the products. The completion of the asset divestiture was subject to and contingent upon the completion of the Wright/Tornier merger and we believe was necessary in order to obtain U.S. Federal Trade Commission approval of the Wright/Tornier merger. As these assets were not part of Wright/Tornier merger, they were not part of the purchase allocation. Additionally, the pro forma results exclude the divested operations as if the divestiture were to have occurred on January 1, 2014.
Solana Surgical, LLC
On January 30, 2014, we acquired 100% of the outstanding equity of Solana Surgical, LLC (Solana), a privately held Memphis, Tennessee orthopaedic company, for approximately $48.0 million in cash and $41.4 million of WMG common stock. The transaction added Solana's complementary extremity product portfolio to further accelerate growth opportunities in our global extremities business. The operating results from this acquisition are included in our condensed consolidated financial statements from the acquisition date.
The acquisition was recorded by allocating the costs of the assets acquired based on their estimated fair values at the acquisition date. The excess of the cost of the acquisition over the fair value of the assets acquired is recorded as goodwill. The following is a summary of the estimated fair values of the assets acquired (in thousands):
Cash and cash equivalents $416
Accounts receivable 2,366
Inventory 2,244
Prepaid and other current assets 372
Property, plant and equipment 360
Intangible assets 21,584
Accounts payable and accrued liabilities (2,196)
Total net assets acquired $25,146
   
Goodwill 64,326
   
Total purchase consideration $89,472
The purchase price allocation was adjusted in the quarter ended June 30, 2014 for the finalization of the valuation of the acquired intangible assets. Intangible assets decreased $0.5 million during the quarter ended June 30, 2014. During the quarter ended

93


WRIGHT MEDICAL GROUP N.V.
NOTES TO CONSOLIDATED FINANCIAL STATEMENTS
(continued)

September 30, 2014 the purchase price allocation was adjusted to record certain tax-related liabilities existing at the date of acquisition. Accrued liabilities increased $0.2 million during the quarter ended September 30, 2014. The purchase price allocation is now considered final.
The goodwill is primarily attributable to strategic opportunities that arose from the acquisition of Solana. The goodwill is expected to be deductible for tax purposes.
Of the $21.6 million of acquired intangible assets, $11.7 million was assigned to purchased technology (10 year life), $9.3 million was assigned to customer relationships (12 year life), and $0.6 million was assigned to trademarks (2 year life).
The acquired business contributed revenues of $14.3 million and operating income of $1.3 million, which excludes transaction and transition costs, to our consolidated results from the date of acquisition through December 31, 2014. Our consolidated results include $7.2 million of transaction and transition expenses recognized in the twelve months ended December 31, 2014.
Our consolidated results of operations would not have been materially different than reported results had the Solana acquisition occurred at the beginning of 2013; and therefore, pro forma financial information has not been presented.
OrthoPro, L.L.C.
On February 5, 2014, we acquired 100% of the outstanding equity of OrthoPro, a privately held Salt Lake City, Utah orthopaedic company, for approximately $32.5 million in cash at closing, subject to a working capital adjustment, plus contingent consideration to be paid upon the achievement of certain revenue milestones in 2014 and 2015 (estimated fair value of contingent consideration is $0 as of December 31, 2014 and December 27, 2015). The transaction added OrthoPro's complementary extremity product portfolio to further accelerate growth opportunities in our global extremities business. The operating results from this acquisition are included in our condensed consolidated financial statements from the acquisition date.
During the quarter ended June 30, 2014, we finalized the calculation of the acquisition date fair value of contingent consideration, which was reduced by $2.9 million at that time.
The acquisition was recorded by allocating the costs of the assets acquired based on their estimated fair values at the acquisition date. The excess of the cost of the acquisition over the fair value of the assets acquired was recorded as goodwill. The following is a summary of the estimated fair values of the assets acquired (in thousands):
Cash and cash equivalents $98
Accounts receivable 1,308
Inventory 2,156
Prepaid and other current assets 49
Property, plant and equipment 1,801
Intangible assets 7,772
Accounts payable and accrued liabilities (949)
Total net assets acquired $12,235
   
Goodwill 20,801
   
Total purchase consideration $33,036
The purchase price allocation was adjusted in the quarter ended June 30, 2014 for the finalization of the valuation of acquired intangible assets. Intangible assets decreased $1.8 million during the quarter ended June 30, 2014. The purchase price allocation was adjusted in the quarter ended September 30, 2014 to record certain tax related liabilities that existed at the date of acquisition. Accrued liabilities increased $0.4 million during the quarter ended September 30, 2014. The purchase price allocation is now considered final.
The goodwill is primarily attributable to strategic opportunities that arose from the acquisition of OrthoPro. The goodwill is expected to be deductible for tax purposes.
Of the $7.8 million of acquired intangible assets, $4.2 million was assigned to customer relationships (12 year life), $3.4 million was assigned to purchased technology (10 year life), and $0.2 million was assigned to trademarks (2 year life).
The acquired business contributed revenues of $8.1 million and operating income of $0.5 million, which excludes transaction and transition costs, to our consolidated results from the date of acquisition through December 31, 2014. Our consolidated results include $5.1 million of transaction and transition expenses recognized in the twelve months ended December 31, 2014.

94


WRIGHT MEDICAL GROUP N.V.
NOTES TO CONSOLIDATED FINANCIAL STATEMENTS
(continued)

Our consolidated results of operations would not have been materially different than reported results had the OrthoPro acquisition occurred at the beginning of 2013; and therefore, pro forma financial information has not been presented.
Biotech International
On November 15, 2013, we acquired 100% of the outstanding equity shares of Biotech International (Biotech), a privately held French orthopaedic extremities company, for approximately $55.0 million in cash and $21.0 million of WMG common stock, plus additional contingent consideration to be paid upon the achievement of certain revenue milestones in 2014 and 2015 (estimated fair value of contingent consideration is $0 as of December 27, 2015 and December 31, 2014). All WMG common stock issued in connection with the transaction was subject to a lockup period of one year. The transaction significantly expanded our direct sales channel in France and international distribution network and added Biotech’s complementary extremity product portfolio to further accelerate growth opportunities in our global extremities business. The operating results from this acquisition are included in our consolidated financial statements from the acquisition date.
During the quarter ended September 30, 2014, we finalized the calculation of the acquisition date fair value of contingent consideration, which was reduced by $4.2 million at that time.
The acquisition was recorded by allocating the costs of the assets and liabilities acquired based on their estimated fair values at the acquisition date. The excess of the cost of the acquisition over the fair value of the net assets and liabilities acquired was recorded as goodwill. The following is a summary of the estimated fair values of the assets acquired (in thousands):
Cash and cash equivalents$252
Accounts receivable4,364
Inventory5,188
Prepaid and other current assets303
Deferred tax asset - current501
Property, plant and equipment2,573
Intangible assets17,800
Accounts payable and accrued liabilities(2,552)
Deferred tax liability - noncurrent(4,228)
       Net assets acquired24,201
  
Goodwill51,836
Total purchase consideration$76,037
The purchase price allocation was adjusted in 2014 for the finalization of the valuation of acquired intangible assets, to record certain tax-related liabilities, and to adjust accounts receivable and inventory to acquisition date fair value. Intangible assets, net of tax, increased $1.5 million, tax liabilities increased $0.5 million, accounts receivable decreased $0.7 million, inventory decreased $0.4 million, and deferred tax assets increased $0.5 million during 2014. The purchase price allocation is now considered final.
The goodwill is attributable to the workforce of the acquired business and strategic opportunities that arose from the acquisition of Biotech. The goodwill is not expected to be deductible for tax purposes.
Of the estimated $17.8 million of acquired intangible assets, $10.1 million was assigned to customer relationships (12 year life), $7.1 million was assigned to purchased technology (10 year life), and $0.6 million was assigned to trademarks (2 year life).
The acquired business contributed revenues of $13.7 million and operating loss of $5.3 million, which excludes transaction and transition costs, to our consolidated results during 2014. Our consolidated results include $1.5 million of transition expenses recognized in the twelve months ended December 31, 2014.
Our consolidated results of operations would not have been materially different than reported results had the Biotech acquisition occurred at the beginning of 2013; and therefore, pro forma financial information has not been presented.

4. Discontinued Operations
On January 9, 2014, we completed the divestiture and sale of the OrthoRecon business to MicroPort. Pursuant to the terms of the MicroPort Agreement, the purchase price (as defined in the agreement) was approximately $283 million (including a working capital adjustment), which MicroPort paid in cash. As a result of the transaction, we recognized approximately $24.3 million as the gain on disposal of the OrthoRecon business, before the effect of income taxes.

All current and historical operating results for the prior OrthoRecon segment, including costs associated with corporate employees and infrastructure being transferred as a part of the sale, are reflected within discontinued operations in our consolidated financial statements. Certain liabilities associated with the OrthoRecon business, including product liability claims associated with hip and knee products sold prior to the closing, were not assumed by MicroPort. Charges associated with these product liability claims, including legal defense, settlements and judgments, income associated with product liability insurance recoveries, and changes to any contingent liabilities associated with the OrthoRecon business have been reflected within results of discontinued operations, and we will continue to reflect these within results of discontinued operations in future periods. We will incur continuing cash outflows associated with legal defense costs and the ultimate resolution of these contingent liabilities, net of insurance proceeds, until these liabilities are resolved. The following table summarizes the results of discontinued operations (in thousands):
 Fiscal year ended
 December 27, December 31, December 31,
 2015 2014 2013
Revenue$
 $3,056
 $231,865
(Loss) income before tax(60,341) (13,521) 9,489
Income tax provision
 5,666
 3,266
(Loss) income from discontinued operations, net of tax(60,341) (19,187) 6,223

During the fiscal year ended December 27, 2015, we recognized a $25 million charge to write down an insurance receivable associated with product liability claims. Additionally, during 2015, we increased our estimated product liability by approximately $4 million for claims that had been incurred in prior periods. We have analyzed the impact of this adjustment and determined that this out-of-period charge did not have a material impact to the prior period or current period financial statements. See Note 16 for additional information regarding our product liabilities and the associated insurance.
The 2014 effective tax rate within the results of discontinued operations reflects the sale of non-deductible goodwill of $25.8 million associated with the OrthoRecon business.

5. Inventories
Inventories consist of the following (in thousands):
 December 27, December 31,
 2015 2014
Raw materials$18,057
 $6,910
Work-in-process27,946
 13,849
Finished goods183,106
 67,653
 $229,109
 $88,412

6. Fair Value of Financial Instruments

The Company applies Accounting Standards Codification (ASC) Topic 820, and Derivatives

We account for derivatives in accordance with FASB ASC 815, which establishes a framework for measuringaccounting and reporting standards requiring that derivative instruments be recorded on the balance sheet as either an asset or liability measured at fair value. Additionally, changes in the derivative’s fair value shall be recognized currently in earnings unless specific hedge accounting criteria are met.
FASB ASC Section 820, Fair Value Measurements and clarifies the definition of fair value within that framework. The Company measures certain assets and liabilities at fair value on a recurring or non-recurring basis. U.S. GAAPDisclosures requires fair value measurements to be classified and disclosed in one of the following three categories:

Level 1—Assets

Level 1:Financial instruments with unadjusted, quoted prices listed on active market exchanges.
Level 2:Financial instruments determined using prices for recently traded financial instruments with similar underlying terms as well as directly or indirectly observable inputs, such as interest rates and yield curves that are observable at commonly quoted intervals.
Level 3:Financial instruments that are not actively traded on a market exchange. This category includes situations where there is little, if any, market activity for the financial instrument. The prices are determined using significant unobservable inputs or valuation techniques.
2017 Conversion Derivative and liabilitiesNotes Hedging

95


On August 31, 2012, WMG issued the 2017 Notes. See Note 9 for further information regarding the 2017 Notes. The 2017 Notes have a conversion derivative feature (2017 Notes Conversion Derivative) that requires bifurcation from the 2017 Notes in accordance with unadjusted, quoted prices listed on active market exchanges.

Level 2—AssetsASC Topic 815, and liabilities determinedis accounted for as a derivative liability. The fair value of the 2017 Notes Conversion Derivative at the time of issuance of the 2017 Notes was $48.1 million.

In connection with the issuance of the 2017 Notes, WMG entered into hedges (2017 Notes Hedges) with three option counterparties (Option Counterparties). The aggregate cost of the 2017 Notes Hedges was $56.2 million and was accounted for as a derivative asset in accordance with ASC Topic 815 as of December 31, 2014.
On February 13, 2015, WMG issued $632.5 million aggregate principal amount of the 2020 Notes, which generated proceeds of approximately $613 million net of issuance costs. See Note 9 for further information regarding the 2020 Notes. WMG used approximately $292 million of these net proceeds to repurchase and extinguish approximately $240 million aggregate principal amount of the 2017 Notes, settle the associated portion of the 2017 Notes Conversion Derivative at a cost of approximately $49 million, and satisfy the accrued interest of $2.4 million. WMG also settled all of the 2017 Notes Hedges (receiving $70 million) and repurchased all of the warrants associated with the 2017 Notes (paying $60 million), generating net proceeds of approximately $10 million.
The following table summarizes the fair value and the presentation in the consolidated balance sheet (in thousands):
 Location on consolidated balance sheetDecember 27, 2015December 31, 2014
2017 Notes HedgesOther assets$
$80,000
2017 Notes Conversion DerivativeOther liabilities$10,440
$76,000
The 2017 Notes Hedges and the 2017 Notes Conversion Derivative are measured at fair value using prices for recently traded assets and liabilities with similar underlying terms, as well as directly or indirectly observable inputs, such as interest rates and yield curves that are observable at commonly quoted intervals.

Level 3—Assets and liabilities that inputs. These instruments are not actively traded and are valued using an option pricing model that uses observable and unobservable market data for inputs.

Neither the 2017 Notes Conversion Derivative nor the 2017 Notes Hedges qualify for hedge accounting; thus, any change in the fair value of the derivatives is recognized immediately in the consolidated statements of operations. The following table summarizes the gain (loss) on changes in fair value (in thousands):
 December 27,December 31,
 20152014
2017 Notes Hedges$(10,236)$(38,000)
2017 Notes Conversion Derivative16,408
36,000
Net gain/(loss) on changes in fair value$6,172
$(2,000)
2020 Conversion Derivative and Notes Hedging
On February 13, 2015, WMG issued the 2020 Notes. See Note 9 for further information regarding the 2020 Notes. The 2020 Notes have a conversion derivative feature (2020 Notes Conversion Derivative) that requires bifurcation from the 2020 Notes in accordance with ASC Topic 815, and is accounted for as a derivative liability. The fair value of the 2020 Notes Conversion Derivative at the time of issuance of the 2020 Notes was $149.8 million.
In connection with the issuance of the 2020 Notes, WMG entered into hedges (2020 Notes Hedges) with the Option Counterparties. The 2020 Notes Hedges, which are cash-settled, are intended to reduce WMG's exposure to potential cash payments that WMG is required to make upon conversion of the 2020 Notes in excess of the principal amount of converted notes if our ordinary share price exceeds the conversion price. The aggregate cost of the 2020 Notes Hedges was $144.8 million and is accounted for as a derivative asset in accordance with ASC Topic 815.
 Location on condensed consolidated balance sheetDecember 27, 2015December 31, 2014
2020 Notes HedgesOther assets$127,758
$
2020 Notes Conversion DerivativeOther liabilities$129,107
$


The 2020 Notes Hedges and the 2020 Notes Conversion Derivative are measured at fair value using Level 3 inputs. These instruments are not actively traded and are valued using an option pricing model that uses observable and unobservable market exchange.data for inputs.
Neither the 2020 Notes Conversion Derivative nor the 2020 Notes Hedges qualify for hedge accounting; thus, any change in the fair value of the derivatives is recognized immediately in the condensed consolidated statements of operations. The following table summarizes the gain on changes in fair value (in thousands):
 December 27,December 31,
 20152014
2020 Notes Hedges$(17,085)$
2020 Notes Conversion Derivative20,677

Net gain on changes in fair value$3,592
$
To determine the fair value of the embedded conversion option in the 2017 and 2020 Notes Conversion Derivative, a trinomial lattice model was used. A trinomial stock price lattice generates three possible outcomes of stock price - one up, one down, and one stable. This category includes situationslattice generates a distribution of stock prices at the maturity date and throughout the life of the 2017 Notes and 2020 Notes. Using this stock price lattice, a convertible note lattice was created where there is little, if any, market activitythe value of the embedded conversion option was estimated by comparing the value produced in a convertible note lattice with the option to convert against the value without the ability to convert. In each case, the convertible note lattice first calculates the possible convertible note values at the maturity date, using the distribution of stock prices, which equals to the maximum of (x) the remaining bond cash flows and (y) stock price times the conversion price. The values of the 2017 Notes Conversion Derivative and 2020 Notes Conversion Derivative at the valuation date was estimated using the values at the maturity date and moving back in time on the lattices (both for the assetlattice with the conversion option and without the conversion option). Specifically, at each node, if the 2017 Notes or liability. 2020 Notes are eligible for early conversion, the value at this node is the maximum of (i) converting to stock, which is the stock price times the conversion price, and (ii) holding onto the 2017 Notes and 2020 Notes, which is the discounted and probability-weighted value from the three possible outcomes at the future nodes plus any accrued but unpaid coupons that are not considered at the future nodes. If the 2017 Notes or 2020 Notes are not eligible for early conversion, the value of the conversion option at this node equals to (ii). In the lattice, a credit adjustment was applied to the discount for each cash flow in the model as the embedded conversion option, as well as the coupon and notional payments, is settled with cash instead of shares.
To estimate the fair value of the 2017 Notes Hedges and 2020 Notes Hedges, we used the Black-Scholes formula combined with credit adjustments, as the Option Counterparties have credit risk and the call options are cash settled. We assumed that the call options will be exercised at the maturity since our ordinary shares do not pay any dividends and management does not expect to declare dividends in the near term.
The pricesfollowing assumptions were used in the fair market valuations of the 2017 Notes Conversion Derivatives and 2020 Notes Conversion Derivatives and the 2020 Notes Hedge as of December 27, 2015:
 2017 Notes Conversion Derivative2020 Notes Conversion Derivative
2020 Notes
Hedge
Stock Price Volatility (1)43.21%43.21%43.21%
Credit Spread for Wright (2)6.54%5.4%NA
Credit Spread for Deutsche Bank AG (3)N/AN/A0.82%
Credit Spread for Wells Fargo Securities, LLC (3)N/AN/A0.43%
Credit Spread for JPMorgan Chase Bank (3)N/AN/A0.62%
(1)Volatility selected based on historical and implied volatility of ordinary shares of Wright Medical Group N.V.
(2)Credit spread implied from traded price.
(3)Credit spread of each bank is estimated using CDS curves. Source: Bloomberg.
Other Derivatives not Designated as Hedging Instruments
We employ a derivative program using foreign currency forward contracts to mitigate the risk of currency fluctuations on our intercompany receivable and payable balances that are denominated in foreign currencies. These forward contracts are expected to offset the transactional gains and losses on the related intercompany balances. These forward contracts are not designated as hedging instruments under FASB ASC Topic 815. Accordingly, the changes in the fair value and the settlement of the contracts


are recognized in the period incurred in the accompanying consolidated statements of operations. At December 27, 2015 and December 31, 2014, we had $3.6 million and $0 in foreign currency contracts outstanding, respectively.
As part of the acquisition of WG Healthcare on January 7, 2013, we may be obligated to pay contingent consideration upon the achievement of certain revenue milestones; therefore, we have recorded the estimated fair value of future contingent consideration of approximately $0.6 million and $1.5 million as of December 27, 2015 and December 31, 2014, respectively.
As part of the acquired sales and distribution business of Surgical Specialties Australia Pty. Ltd, in 2015, we have recorded contingent consideration of approximately $1.5 million as of December 27, 2015.
The fair value of the contingent consideration as of December 27, 2015 and December 31, 2014, was determined using significant unobservable inputs or valuation techniques.

A summarya discounted cash flow model and probability adjusted estimates of the future earnings and is classified in Level 3. Changes in the fair value of contingent consideration are recorded in “Other (income) expense, net” in our consolidated statements of operations.

On March 1, 2013, as part of the acquisition of BioMimetic Therapeutics, Inc. (BioMimetic), we issued Contingent Value Rights (CVRs) as part of the merger consideration. Each CVR entitles its holder to receive additional cash payments of up to $6.50 per share, which are payable upon receipt of FDA approval of AUGMENT® Bone Graft and upon achieving certain revenue milestones. On September 1, 2015, AUGMENT® Bone Graft received FDA approval and the first of the milestone payments associated with the CVRs was paid out at $3.50 per share, which totaled $98.1 million. The fair value of the CVRs outstanding at December 27, 2015 and December 31, 2014 was $28 million and $134 million, respectively, and was determined using the closing price of the security in the active market (Level 1). For the years ended December 27, 2015 and December 31, 2014, the change in the value of the CVRs resulted in income of $7.6 million and expense of $125 million, respectively, which was recorded in "Other expense (income), net" in the consolidated statements of operations.
The carrying value of cash and cash equivalents, accounts receivable, and accounts payable approximates the fair value of these financial instruments at December 27, 2015 and December 31, 2014 due to their short maturities and variable rates.
The following table summarizes the valuation of our financial instruments (in thousands):
 Total
Quoted Prices
in Active
Markets
(Level 1)
Prices with
Other
Observable
Inputs
(Level 2)
Prices with
Unobservable
Inputs
(Level 3)
At December 27, 2015    
Assets    
Cash and cash equivalents$139,804
$139,804
$
$
Available-for-sale marketable securities    
U.S. agency debt securities


Certificate of deposit


Corporate debt securities


U.S. government debt securities


Total available-for-sale marketable securities


2020 Notes Hedges127,758


127,758
     
Total$267,562
$139,804
$
$127,758
     
Liabilities    
2017 Notes Conversion Derivative$10,440
$
$
$10,440
2020 Notes Conversion Derivative129,107


129,107
Contingent consideration2,340


2,340
Contingent consideration (CVRs)28,310
28,310


Total$170,197
$28,310
$
$141,887


 Total
Quoted Prices
in Active
Markets
(Level 1)
Prices with
Other
Observable
Inputs
(Level 2)
Prices with
Unobservable
Inputs
(Level 3)
At December 31, 2014    
Assets    
Cash and cash equivalents$227,326
$227,326
$
$
Available-for-sale marketable securities    
U.S. agency debt securities


Certificates of deposits


Corporate debt securities566

566

U.S. government debt securities2,009
2,009


Total available-for-sale marketable securities2,575
2,009
566

     
2017 Notes Hedges80,000


80,000
Total$309,901
$229,335
$566
$80,000
     
Liabilities    
2017 Notes Conversion Derivative$76,000
$
$
$76,000
Contingent consideration1,705


1,705
Contingent consideration (CVRs)133,981
133,981


Total$211,686
$133,981
$
$77,705
The following is a roll forward of our assets and liabilities that are measured at fair value on a recurring basis atusing unobservable inputs (Level 3):
  Balance at December 31, 2014AdditionsTransfers into Level 3Gain/(Loss) included in EarningsSettlementsCurrencyBalance at December 27, 2015
         
2017 Notes Hedges 80,000


(10,236)(69,764)

2017 Notes Conversion Derivative (76,000)

16,408
49,152

(10,440)
2020 Notes Hedges 
144,843

(17,085)

127,758
2020 Notes Conversion Derivative 
(149,784)
20,677


(129,107)
Contingent consideration (1,705)(1,546)
171
656
84
(2,340)


WRIGHT MEDICAL GROUP N.V.
NOTES TO CONSOLIDATED FINANCIAL STATEMENTS
(continued)

7. Property, Plant and Equipment
Property, plant and equipment, net consists of the following (in thousands):
 December 27, December 31,
 2015 2014
Land and land improvements$1,986
 $520
Buildings36,746
 26,887
Machinery and equipment40,251
 24,265
Furniture, fixtures and office equipment98,521
 59,885
Construction in progress21,505
 14,178
Surgical instruments149,960
 65,359
 348,969
 191,094
Less: Accumulated depreciation(108,200) (86,859)
 $240,769
 $104,235

The components of property, plant and equipment recorded under capital leases consist of the following (in thousands):
 December 27, December 31,
 2015 2014
Buildings$12,408
 $8,471
Machinery and equipment3,302
 477
Furniture, fixtures and office equipment
 59
 15,710
 9,007
Less: Accumulated depreciation(3,052) (862)
 $12,658
 $8,145

Depreciation expense recognized within results of continuing operations approximated $29.5 million, $18.5 million, and $14.4 million for the fiscal years ended December 30, 201227, 2015 and January 1, 2012 are as follows:

   December 30, 2012  Quoted Prices in
Active Markets
(Level 1)
   Significant Other
Observable Inputs
(Level 2)
   Significant
Unobservable
Inputs (Level 3)
 

Cash and cash equivalents

  $31,108   $31,108    $—      $—    

Contingent consideration

   (15,265  —       —       (15,265

Derivative asset

   274    —       274     —    


Total, net

  $16,117   $31,108    $274    $(15,265


   January 1, 2012  Quoted Prices in
Active Markets
(Level 1)
   Significant Other
Observable Inputs
(Level 2)
   Significant
Unobservable
Inputs (Level 3)
 

Cash and cash equivalents

  $54,706   $54,706    $—      $—    


Total, net

  $54,706   $54,706    $—      $—    


AsDecember 31, 2014 and 2013, respectively, and included depreciation of December 30, 2012,assets under capital leases.


100


WRIGHT MEDICAL GROUP N.V.
NOTES TO CONSOLIDATED FINANCIAL STATEMENTS
(continued)

8. Goodwill and Intangibles
Changes in the Company had a derivative asset with recurring Level 2 fair value measurements. The derivatives are foreign exchange forward contracts and their fair values are based on pricing for similar recently executed transactions. The contracts were first entered into in 2012. Thecarrying amount of loss recognized in foreign exchange loss forgoodwill occurring during the year ended December 30, 2012 related to this derivative27, 2015, are as follows (in thousands):
 Total
Goodwill at December 31, 2014$190,966
Goodwill associated with Tornier N.V. merger$683,313
Goodwill associated with Surgical Specialties acquisition$6,158
Foreign currency translation$(4,093)
Goodwill at December 27, 2015$876,344
Goodwill is approximately $0.3 million. Included in Level 3 fair value measurements as of December 30, 2012 is a $0.7 million contingent consideration liability related to potential earnout paymentsrecognized for the acquisitionexcess of the Company’s exclusive distributor in Belgium and Luxembourg that was completed in May 2012, and a $14.5 million contingent consideration liability related to potential earnout payments for the acquisition of OrthoHelix that was completed in October 2012. Earn-out liabilities are included in contingent consideration on the consolidated balance sheet. The earn-out liabilities are carried at fair value, which is determined based on a discounted cash flow analysis that included revenue estimates and a discount rate, which are considered significant unobservable inputs as of December 30, 2012. The revenue estimates were based on current management expectations for these businesses and the discount rate used as of December 30, 2012 was 8% and was based on the Company’s estimated weighted average cost of capital. To the extent that these assumptions were to change,purchase price over the fair value of the earn-out liabilities could change significantly. For the year ended December 30, 2012, the Company recognized $0.3 million in interest expense on the mark-to-marketnet assets of the earn-out liabilities. The Company had no Level 3 fair value measurements asbusinesses acquired. Goodwill is required to be tested for impairment at least annually. On October 1, 2015, we performed a qualitative assessment of January 1, 2012. There

were no transfers into or out of Level 3 fair value measurements in the period.

The Company also has some assets and liabilities that are measured at fair value on a non-recurring basis. The Company reviews the carrying amount of its long-lived assets other thanlegacy Wright’s goodwill for potential impairment, whenever events or changesbased upon our reporting units in circumstances indicate that their carrying values may not be recoverable. During the year ended December 30, 2012, the Company recognized an intangible impairment of $4.7 million. The impairment was determined using a discounted cash flow analysis. Key inputs into the analysis included estimated future revenues and expenses and a discount rate. The discount rate of 8% was based on the Company’s weighted average cost of capital. These inputs are considered to be significant unobservable inputs and are considered Level 3 fair value measurements.

During the year ended December 30, 2012, the Company initiated and completed a facilities consolidation initiative that included the closure and consolidation of certain facilities in France, Ireland and the U.S., which resulted in the recognition of a $0.9 million impairment charge to write down certain fixed assets to their estimated fair values. The fair value calculations were performed using a cost-to-sell analysis and are considered Level 2 fair value measurements as the key inputs into the calculations included estimated market values of the facilities, which are considered indirect observable inputs. In addition, the Company recorded $0.7 million of lease termination costs for the year ended December 30, 2012 relatedeffect prior to the facilities consolidation initiative. The termination costs wereWright/Tornier merger, and determined using a discounted cash flow analysis that included a discount rate assumption, which is based on the credit adjusted risk free interest rate input, and an assumption related to the timing and amount of sublease income. The timing of the sublease income is a significant unobservable input and thus is considered a Level 3 fair value measurement.

As of December 30, 2012, the Company had short-term and long-term debt of $120.1 million, the vast majority of which was variable rate debt. The fair value of the Company’s debt obligations approximates carrying value as a result of its variable rate term and would be considered a Level 2 measurement.

Recent Accounting Pronouncements

In June 2011, the Financial Accounting Standards Board (FASB) issued Accounting Standards Update (ASU) 2011-05,Comprehensive Income (Topic 220), Presentation of Comprehensive Income. The guidance requires an entity to present components of net income and other comprehensive income in one continuous statement, referred to as the statement of comprehensive income, or in two separate, but consecutive statements. Companies will no longer be permitted to present components of other comprehensive income solely in the statements of stockholders’ equity. The Company adopted ASU 2011-05 beginning in the quarter ended April 1, 2012 and has made the appropriate disclosures in the consolidated financial statements.

In September 2011, the FASB issued ASU 2011-08,Goodwill and Other (ASC Topic 350), Testing Goodwill for Impairment, which simplified the requirements related to the annual goodwill impairment test. Companies now have the option to first assess qualitative factors to determine whether it is more likely than not that the fair value of a reporting unit is less than its carrying amount. If the assessment indicates that it is not more likely than not that the carrying value exceeded fair value, indicating that goodwill was not impaired.

Subsequent to the completion of a reporting unit is less than its carrying amount, the Company no longer has to performWright/Tornier merger, our management began managing our operations as one reportable segment, orthopaedic products, which includes the two-step impairment test. ASU 2011-08 was effective for fiscal years beginning after December 15, 2011 with early adoption permitted. The Company adopted this guidance beginning in the first quarterdesign, manufacture, marketing, and sales of 2012. The impact of adoption did not have a material impactextremities and biologics products. Based on the Company’s consolidated financial position or operating results.

In July 2012, the FASB issued ASU 2012-02,Intangibles — Goodwill and Other (Topic 350), Testing Indefinite-Lived Intangible Assets for Impairment, which adds an optional qualitative assessment for determining whether an indefinite-lived intangible asset is impaired, similarabove, the fair valuation analysis performed in conjunction with the Wright/Tornier merger and the close proximity of the merger to the goodwill guidance issued in ASU 2011-08. Companies have the option to first perform a qualitative assessment to determine whether it isyear-end, we believe that no event has occurred that would more likely than not (a likelihood of more than 50%) that an indefinite-lived intangible asset is impaired. If a company determines that it is more likely than not thatreduce the fair value of such an asset exceedsbelow its carrying amount it would not need to calculate the fair value of the asset inand that year. However, if a company concludes otherwise, it must perform the annual quantitative impairment tests. The Company adopted this guidance beginning in 2012. The impacttest is unnecessary between October 1, 2015 and December 27, 2015.

In September 2015, we acquired the sales and distribution business of adoption did not have a material impact on the Company’s consolidated financial position or operating results.

3. Business Combinations

On October 4, 2012, the Company completedSurgical Specialties Australia Pty. Ltd. Prior to the acquisition, of 100% of the outstanding common stock of OrthoHelix Surgical Designs, Inc. OrthoHelix is an innovative, high-growth company that is focused on developing and marketing specialty implantable screw and plate systems for the repair of small bone fractures and deformities predominantlySpecialties was our exclusive sales agent in the foot and ankle. Under the terms of the agreement, the Company acquired the assets and assumed certain liabilities of

OrthoHelix for an aggregate purchase price of $152.6 million, including $100.4 million in cash, the equivalent of $38.0 million in Tornier ordinary shares based on the closing share price on the date of acquisition, and $14.2 million related to the fair value of additional contingent consideration of up to $20.0 million. The contingent consideration is payable in future periods based on growth of the lower extremity joints and trauma revenue category.

The OrthoHelix acquisition was accounted for as an acquisition ofAustralia. As a business; and, accordingly, the results have been included in the Company’s consolidated results of operations from the date of acquisition. The allocation of the total purchase price of to the net tangible and identifiable intangible assets was based on their estimated fair values asresult of the acquisition, date.we now have a direct employee sales force in Australia. We will not record any incremental revenue as a result of the acquisition as we have historically directly billed the end customer and paid Surgical Specialties a commission. The excessasset purchase agreement included a $4.9 million cash payment and estimated future payments of $5.3 million, primarily related to non-competition and meeting certain financial milestones. As part of the purchase price overallocation, we acquired $5.3 million of intangible assets related to customer relationships, non-competition, and settlement of the identifiable intangiblepre-existing agreement and net tangible assets in the amount of $105.9$6.2 million was allocated to goodwill, which is not deductible for tax purposes. Qualitatively, the three largest components of goodwill, include: (1) expansion into international markets; (2)offset by a $1.4 million deferred tax liability recorded as part of the relationships betweentransaction.

On October 1, 2015, we merged with Tornier N.V. As part of the Company’s sales representatives and physicians; and (3) the development of new product lines and technology. The purchase price allocation, is preliminary pending the final determinationwe acquired $683.3 million of the fair valuegoodwill and $204.2 million of certain acquired assets and assumed liabilities.

The following represents the preliminary allocation of the purchase price:

   Purchase  Price
Allocation

(In Thousands)
 

Goodwill

  $105,904  

Other intangible assets

   40,600  

Tangible assets acquired and liabilities assumed:


Accounts receivable

   4,330  

Inventory

   12,033  

Other assets

   776  

Instruments, net

   4,475  

Accounts payable and accrued liabilities

   (3,606

Deferred income taxes

   (11,900

Other long-term debt

   (16


Total preliminary purchase price

  $152,596  


Acquired identifiable intangible assets are amortized on a straight-line basis over their estimated useful lives. The following table represents components of these identifiable intangible assets and their estimated useful lives at the acquisition date:

   Fair Value
(In Thousands)
   Estimated Useful
Life

(In Years)
 

Developed technology

  $35,500     10  

In-process research and development

   3,500     N/A  

Trademarks and trade names

   1,500     3  

Non-compete agreements

   100     3  


Total identifiable intangible assets

  $40,600    


The preliminary estimated fair value of the intangible assets acquired was determined by the Company with the assistance of a third-party valuation expert. Tornier used an income approachrelated to measure the fair value of the developedcustomer relationships, completed technology, and in-process research and development based on the multi-period excess earnings method, whereby the fair value is estimated based upon the present valuetechnology, and trade names. See Note 3 for additional details describing this acquisition.


101


WRIGHT MEDICAL GROUP N.V.
NOTES TO CONSOLIDATED FINANCIAL STATEMENTS
(continued)

The components of the trademarks based upon the relief from royalty method, whereby the fair value is estimated based upon discounting the royalty savings as well as any tax benefits related to ownership to a present value. Tornier used an income approach to measure the fair value of non-compete agreements, based on the incremental income method, whereby value is estimated by discounting the cash flow differential as well as any tax benefits related to ownership to a present value. These fair value measurements were based on significant inputs not observable in the market and thus represent Level 3 measurements under the fair value hierarchy. The significant unobservable inputs include the discount rate of 8% which was based on the Company’s estimate of its weighted cost of capital.

Pro forma results of operations (unaudited) of the Company for the years ended December 30, 2012 and January 1, 2012, as if the acquisition had occurred on January 3, 2011, are as follows:

   Year Ended
December 30,
2012
  Year Ended
January 1, 2012
 

Revenue

  $298,051   $283,370  

Net Loss

   (31,390  (43,155

Basic and diluted net loss per share

  $(0.75 $(1.07

Pro formaour identifiable intangible assets, net income for the year ended December 30, 2012 was adjusted to exclude all acquisition-related costs. Total acquisition costs related to OrthoHelix were $1.2 million and included in special charges on the consolidated statement of operations. The pro forma results of operations are not necessarily indicative of future operating results. Included in the consolidated statement of operations is approximately $8.0 million of revenue and $1.8 million of net loss related to operations of OrthoHelix subsequent to the transaction closing.

4. Property, Plant and Equipment

Property, plant and equipment balances are as follows (in thousands):

   December 30,
2012
  January 1,
2012
 

Land

  $1,830   $2,138  

Building and improvements

   12,908    12,501  

Machinery and equipment

   25,767    20,335  

Furniture, fixtures and office equipment

   26,541    24,255  

Software

   4,729    4,110  

Construction in progress

   2,148    —    


   73,923    63,339  

Accumulated depreciation

   (36,772  (29,986


Property, plant and equipment, net

  $37,151   $33,353  


 December 27, 2015 December 31, 2014
 Cost 
Accumulated
amortization
 Cost 
Accumulated
amortization
Indefinite life intangibles:       
IPRD technology$15,290
   $4,266
  
Trademarks
   4,004
  
Total indefinite life intangibles15,290
   8,270
  
        
Finite life intangibles:       
 Distribution channels250
 $219
 250
 $194
 Completed technology124,388
 14,877
 33,253
 9,185
 Licenses4,868
 703
 8,234
 1,637
 Customer relationships119,235
 7,966
 27,946
 4,636
 Trademarks14,861
 3,464
 2,798
 1,850
 Non-compete agreements7,521
 2,917
 8,508
 3,397
 Other527
 51
 771
 106
Total finite life intangibles271,650
 $30,197
 81,760
 $21,005
        
Total intangibles286,940
   90,030
  
Less: Accumulated amortization(30,197)   (21,005)  
Intangible assets, net$256,743
   $69,025
  

Prior to 2015, we had assigned an indefinite life to four intangible assets which totaled $8.3 million. During the quarter ended December 27, 2015, a useful-life was assigned to these intangible assets due to various factors including the approval of AUGMENT® Bone Graft. As a resultsuch, the only indefinite life intangible as of the facilities consolidation initiative, the Company recorded several fixed asset impairments during 2012December 27, 2015 related to the Company’s facilities in St. Ismier, France, Dunmanway, Ireland, and Stafford, Texas inIPRD acquired from the aggregate amount of $0.9 million for year ended December 30, 2012. Additionally,Wright/Tornier merger.
Based on the Company recorded $0.1 million in impairments related to certain distribution channel changes in Europe. These changes are reflected in related fixed asset categories above. These impairments were recorded in special charges, a component of operating expenses, in the consolidated statements of operations for the year ended December 30, 2012. See Note 18 for further description of the facilities consolidation initiative.

Depreciation expense recorded on property, plant and equipment was $6.1 million, $6.0 million and $6.1 million during the years ended December 30, 2012, January 1, 2012 and January 2, 2011, respectively.

5. Goodwill and Other Intangible Assets

The following table summarizes the changes in the carrying amount of goodwill for the years ended December 30, 2012 and January 1, 2012 (in thousands):

Balance at January 2, 2011

  $131,830  

Contingent payment on acquisition

   1,099  

Foreign currency translation

   (2,385


Balance at January 1, 2012

  $130,544  

Contingent payment on acquisition

   1,193  

Goodwill acquired in acquisition

   106,654  

Foreign currency translation

   1,413  


Balance at December 30, 2012

  $239,804  


The goodwill balancetotal finite life intangible assets held at December 30, 2012 contains $11.427, 2015, we expect to amortize approximately $25.2 million of goodwill that qualifies for future tax deductions.

The components of identifiable intangible assets are as follows (in thousands):

   Gross Value   Accumulated
Amortization
  Net Value 

Balances at December 30, 2012


Intangible assets subject to amortization:


Developed technology

  $107,974    $(34,109 $73,865  

Customer relationships

   59,212     (24,634  34,578  

Licenses

   5,525     (2,927  2,598  

In-process research and development

   3,500     (5  3,495  

Other

   3,923     (1,357  2,566  

Intangible assets not subject to amortization:


Tradename

   9,492     —      9,492  


Total

  $189,626    $(63,032 $126,594  


   Gross Value   Accumulated
Amortization
  Net Value 

Balances at January 1, 2012


Intangible assets subject to amortization:


Developed technology

  $75,106    $(29,313 $45,793  

Customer relationships

   60,399     (21,821  38,578  

Licenses

   4,882     (2,061  2,821  

Other

   1,930     (1,056  874  

Intangible assets not subject to amortization:


Tradename

   9,599     —      9,599  


Total

  $151,916    $(54,251 $97,665  


During the year ended December 30, 2012, the Company acquired its exclusive distributor in Belgium2016, $24.6 million in 2017, $20.8 million in 2018, $19.2 million in 2019, and Luxembourg for $3.5$18.5 million which included a $1.0 million earn-out. The preliminary purchase accounting for this transaction resulted in an increase in intangible assets of $3.0 million2020.


9. Long-Term Debt and goodwill of $0.8 million for the year ended December 30, 2012. Additionally, the Company acquired OrthoHelix on October 4, 2012 which resulted in the recording of additional goodwill of $105.9 millionCapital Lease Obligations
Long-term debt and additional intangible assets of $40.6 million for the year ended December 30, 2012. See Note 3 for further details on the acquisition of OrthoHelix.

For the year ended December 30, 2012, the Company recognized an impairment charge of $4.7 million related to intangibles where the carrying value was greater than the fair value of the intangibles due to a reduction in forecasted revenue from these products due to cannibalization as a result of acquiring similar products as part of the OrthoHelix acquisition. For the year ended January 1, 2012, the Company recognized an impairment charge of $0.2 million related to developed technology from acquired entities that is no longer being used. No impairment charges were recognized during the year

ended January 2, 2011. For the year ended December 30, 2012, intangible asset impairments are included in special charges on the consolidated statement of operations. For the year ended January 1, 2012, intangible asset impairments are included in amortization of intangible assets in the consolidated statements of operations.

All finite-lived intangible assets have been assigned an estimated useful life and are amortized on a straight-line basis over the number of years that approximates the assets’ respective useful lives (ranging from one to twenty years). Included in other intangibles are non-compete agreements and patents. The weighted-average amortization periods, by major intangible asset class, are as follows:

Weighted-Average
Amortization Period
(In Years)

Developed technology

12

Customer relationships

13

Licenses

5

In-process research and development

5

Other

4

Total amortization expense for finite-lived intangible assets was $11.6 million, $11.3 million and $11.5 million during the years ended December 30, 2012, January 1, 2012 and January 2, 2011, respectively. Amortization expense is recorded as amortization of intangible assets in the consolidated statements of operations. Estimated annual amortization expense for fiscal years ending 2013 through 2017 is as follows (in thousands):

   Amortization Expense 

2013

  $14,588  

2014

   14,283  

2015

   14,098  

2016

   13,112  

2017

   12,505  

6. Accrued Liabilities

Accrued liabilitiescapital lease obligations consist of the following (in thousands):

   December 30, 2012   January 1, 2012 

Accrued payroll and related expenses

  $16,521    $14,596  

Accrued royalties

   9,001     7,771  

Other accrued liabilities

   18,888     12,078  


  $44,410    $34,445  


7.

 December 27, 2015 December 31, 2014
Capital lease obligations$13,763
 $8,678
2017 Notes56,505

272,652
2020 Notes504,547
 
Mortgages2,740
 
Shareholder debt1,998
 
 579,553
 281,330
Less: current portion(2,171) (718)
 $577,382
 $280,612

2020 Notes Payable
On February 13, 2015, WMG issued $632.5 million aggregate principal amount of the 2020 Notes pursuant to an indenture, dated as of February 13, 2015 between WMG and WarrantsThe Bank of New York Mellon Trust Company, N.A., as Trustee. The 2020 Notes require interest to Issue Ordinary Shares

In April 2009,be paid semi-annually on each February 15 and August 15 at an annual rate of 2.00%, and mature on February 15, 2020 unless earlier converted or repurchased. The 2020 Notes are convertible at the Company issued notes payableoption of the holder, during certain periods and subject to certain conditions described below, solely into cash at an initial conversion rate of 32.3939 shares of WMG common stock per $1,000 principal amount of the 2020 Notes, subject to adjustment upon the occurrence of certain events, which represents


102


WRIGHT MEDICAL GROUP N.V.
NOTES TO CONSOLIDATED FINANCIAL STATEMENTS
(continued)

an initial conversion price of approximately $30.87 per share of WMG common stock. On November 24, 2015, Wright Medical Group N.V. executed a supplemental indenture, fully and unconditionally guaranteeing, on a senior unsecured basis, WMG’s obligations relating to the 2020 Notes, changing the underlying reference securities from WMG common stock to Wright Medical Group N.V. ordinary shares and making a corresponding adjustment to the conversion price. From and after the effective time of the Wright/Tornier merger, (i) all calculations and other determinations with respect to the 2020 Notes previously based on references to WMG common stock are calculated or determined by reference to our ordinary shares, and (ii) the Conversion Rate (as defined in the aggregate2020 Notes Indenture) for the 2020 Notes was adjusted to an initial conversion rate of 33.39487 ordinary shares (subject to adjustment as provided in the 2020 Notes Indenture) per $1,000 principal amount of €37the 2020 Notes (subject to, and in accordance with, the settlement provisions of the 2020 Notes Indenture). The 2020 Notes may not be redeemed by WMG prior to the maturity date, and no “sinking fund” is available for the 2020 Notes, which means that WMG is not required to redeem or retire the 2020 Notes periodically.
The holders of the 2020 Notes may convert their notes at any time prior to August 15, 2019 solely into cash, in multiples of $1,000 principal amount, upon satisfaction of one or more of the following circumstances: (1) during any calendar quarter commencing after the calendar quarter ending on March 31, 2015 (and only during such calendar quarter), if the last reported sale price of our ordinary shares for at least 20 trading days (whether or not consecutive) during a period of 30 consecutive trading days ending on the last trading day of the immediately preceding calendar quarter is greater than or equal to 130% of the conversion price on each applicable trading day; (2) during the five business day period after any five consecutive trading day period in which the trading price per $1,000 principal amount of 2020 Notes for each trading day of the measurement period was less than 98% of the product of the last reported sale price of our ordinary shares and the conversion rate on each such trading day; or (3) upon the occurrence of specified corporate events. The Wright/Tornier merger did not result in a conversion right for holders of the 2020 Notes. On or after August 15, 2019 until the close of business on the second scheduled trading day immediately preceding the maturity date, holders may convert their 2020 Notes solely into cash, regardless of the foregoing circumstances. Upon conversion, a holder will receive an amount in cash, per $1,000 principal amount of the 2020 Notes, equal to the settlement amount as calculated under the indenture relating to the 2020 Notes. If WMG undergoes a fundamental change, as defined in the indenture relating to the 2020 Notes, subject to certain conditions, holders of the 2020 Notes will have the option to require WMG to repurchase for cash all or a portion of their notes at a purchase price equal to 100% of the principal amount of the 2020 Notes to be repurchased, plus any accrued and unpaid interest to, but excluding, the fundamental change repurchase date, as defined in the indenture relating to the 2020 Notes. In addition, following certain corporate transactions, WMG, under certain circumstances, will increase the applicable conversion rate for a holder that elects to convert its 2020 Notes in connection with such corporate transaction. The 2020 Notes are senior unsecured obligations that rank: (i) senior in right of payment to any of WMG's indebtedness that is expressly subordinated in right of payment to the 2020 Notes; (ii) equal in right of payment to any of WMG's unsecured indebtedness that is not so subordinated; (iii) effectively junior in right of payment to any secured indebtedness to the extent of the value of the assets securing such indebtedness; and (iv) structurally junior to all indebtedness and other liabilities (including trade payables) of WMG's subsidiaries. In conjunction with the issuance of the 2020 Notes, we recorded deferred financing charges of approximately $18 million, (approximately $49.3 million)which are being amortized over the term of the 2020 Notes using the effective interest method.
The 2020 Notes Conversion Derivative requires bifurcation from the 2020 Notes in accordance with ASC Topic 815, Derivatives and Hedging, and is accounted for as a derivative liability. See Note 6 for additional information regarding the 2020 Notes Conversion Derivative. The fair value of the 2020 Notes Conversion Derivative at the time of issuance of the 2020 Notes was $149.8 million and was recorded as original debt discount for purposes of accounting for the debt component of the 2017 Notes. This discount is amortized as interest expense using the effective interest method over the term of the 2020 Notes. For the year ended December 27, 2015, we recorded $21.8 million of interest expense related to the amortization of the debt discount based upon an effective rate of 8.54%.
The components of the 2020 Notes were as follows (in thousands):
 Fiscal year ended
 December 27, 2015
Principal amount of 2020 Notes632,500 
Unamortized debt discount(127,953)
Net carrying amount of 2020 Notes$504,547 
The estimated fair value of the 2020 Notes was approximately $641 million at December 27, 2015, based on a quoted price in an active market (Level 1).

103


WRIGHT MEDICAL GROUP N.V.
NOTES TO CONSOLIDATED FINANCIAL STATEMENTS
(continued)

WMG entered into the 2020 Notes Hedges in connection with the issuance of the 2020 Notes with the Option Counterparties. See Note 6 for additional information on the 2020 Notes Hedges. The 2020 Notes Hedges, which are cash-settled, are intended to reduce WMG's exposure to potential cash payments that WMG would be required to make if holders elect to convert the 2020 Notes at a time when our ordinary share price exceeds the conversion price. However, in connection with certain events, including, among others, (i) a merger or other make-whole fundamental change (as defined in the 2020 Notes indenture), (ii) certain hedging disruption events, which may include changes in tax laws, an increase in the cost of borrowing our ordinary shares in the market or other material increases in the cost to the Option Counterparties of hedging the 2020 Note Hedges and warrants, (iii) WMG's failure to perform certain obligations under the 2020 Notes indenture or under the 2020 Notes Hedges and warrant transactions, (iv) certain payment defaults on WMG's existing indebtedness in excess of $25 million or (v) if WMG or any of its significant subsidiaries become insolvent or otherwise becomes subject to bankruptcy proceedings, the Option Counterparties have the discretion to terminate the 2020 Note Hedges and warrant transactions at a value determined by them in a commercially reasonable manner, which may reduce the effectiveness of the 2020 Note Hedges or increase WMG's obligations under the warrant transactions. In addition, the Option Counterparties have broad discretion to make certain adjustments to the 2020 Notes Hedges and warrant transactions upon the occurrence of certain other events, including, among others, (i) any adjustment to the conversion rate of the 2020 Notes, (ii) a change in law that adversely impacts the Option Counterparties’ ability to hedge their positions in the 2020 Note Hedges and warrants or (iii) upon the announcement of certain significant corporate events, including events that may give rise to a grouptermination event as described above, such as the announcement of investorsa third-party tender offer for more than 10% of our ordinary shares or that included then existing shareholders, new investors and managementmay have a material economic effect on the warrant transactions. Any such adjustment may also reduce the effectiveness of the Company.2020 Note Hedges or increase WMG's obligations under the warrant transactions. The notes carriedaggregate cost of the 2020 Notes Hedges was $145 million and is accounted for as a fixedderivative asset in accordance with ASC Topic 815. See Note 6 of the condensed consolidated financial statements for additional information regarding the 2020 Notes Hedges and the 2020 Notes Conversion Derivative.
WMG also entered into warrant transactions in which it sold warrants for an aggregate of 20.5 million shares of WMG common stock to the Option Counterparties, subject to adjustment. The strike price of the warrants was initially $40 per share of WMG common stock, which was 59% above the last reported sale price of WMG common stock on February 9, 2015. On November 24, 2015, Wright Medical Group N.V. assumed WMG's obligations pursuant to the warrants. Following the assumption, the warrants became exercisable for Wright Medical Group N.V. ordinary shares and the strike price of the warrants was adjusted to $38.8010 per ordinary share. The warrants are net-share settled and are exercisable over the 200 trading day period beginning on May 15, 2020. The warrant transactions will have a dilutive effect to the extent that the market value per ordinary share during such period exceeds the applicable strike price of the warrants.
Aside from the initial payment of the $145 million premium to the Option Counterparties, we do not expect to be required to make any cash payments to the Option Counterparties under the 2020 Notes Hedges and expect to be entitled to receive from the Option Counterparties cash, generally equal to the amount by which the market price per ordinary share exceeds the strike price of the convertible note hedging transactions during the relevant valuation period. The strike price under the 2020 Notes Hedges is equal to the conversion price of the 2020 Notes. Additionally, if the market value per ordinary share exceeds the strike price on any day during the 200 trading day measurement period under the warrant transaction, we will be obligated to issue to the Option Counterparties a number of ordinary shares equal in value to one percent of the amount by which the then-current market value of one ordinary share exceeds the then-effective strike price of each warrant, multiplied by the number of reference ordinary shares into which the 2020 Notes are then convertible at or following maturity. We will not receive any additional proceeds if warrants are exercised.
2017 Notes
On August 31, 2012, WMG issued $300 million aggregate principal amount of the 2017 Notes pursuant to an indenture, dated as of August 31, 2012 between WMG and The Bank of New York Mellon Trust Company, N.A., as Trustee. The 2017 Notes mature on August 15, 2017, and we pay interest on the 2017 Notes semi-annually on each February 15 and August 15 at an annual interest rate of 8.0% with2.00%. WMG may not redeem the 2017 Notes prior to the maturity date, and no “sinking fund” is available for the 2017 Notes, which means that WMG is not required to redeem or retire the 2017 Notes periodically. The 2017 Notes are convertible at the option of the holder, during certain periods and subject to certain conditions as described below, solely into cash at an initial conversion rate of 39.3140 shares per $1,000 principal amount of the 2017 Notes, subject to adjustment upon the occurrence of specified events, which represents an initial conversion price of $25.44 per share. The holder of the 2017 Notes may convert their notes at any time prior to February 15, 2017 only under the following circumstances: (1) during any calendar quarter commencing after the calendar quarter ending December 31, 2012 (and only during such calendar quarter), if the last reported sale price of our ordinary shares for at least 20 trading days (whether or not consecutive) during a period of 30 consecutive trading days ending on the last trading day of the immediately preceding calendar quarter is greater than or equal to 130% of the conversion price on each

104


WRIGHT MEDICAL GROUP N.V.
NOTES TO CONSOLIDATED FINANCIAL STATEMENTS
(continued)

applicable trading day; (2) during the five business day period after any five consecutive trading day period in which the trading price per $1,000 principal amount of notes for each trading day of the measurement period was less than 98% of the product of the last reported sale price of our ordinary shares and the conversion rate on each such trading day; or (3) upon the occurrence of specified corporate events. While we currently do not expect significant conversions because the notes currently trade at a premium to the as-converted value, and a converting holder would forego future interest payments, any conversions would reduce our cash resources. On or after February 15, 2017 until the close of business on the second scheduled trading day immediately preceding the maturity date, holders may convert their 2017 Notes solely into cash, regardless of the foregoing circumstances. Upon conversion, a holder will receive an amount in cash, per $1,000 principal amount of the 2017 Notes, equal to the settlement amount as calculated under the indenture relating to the 2017 Notes. If we undergo a fundamental change, as defined in the indenture relating to the 2017 Notes, subject to certain conditions, holders of the 2017 Notes will have the option to require WMG to repurchase for cash all or a portion of their notes at a purchase price equal to 100% of the principal amount of the 2017 Notes to be repurchased, plus any accrued and unpaid interest to, but excluding, the fundamental change repurchase date, as defined in kind semi-annually.the indenture relating to the 2017 Notes. In addition, following certain corporate transactions, WMG, under certain circumstances, will pay a cash make-whole premium by increasing the applicable conversion rate for a holder that elects to convert its 2017 Notes in connection with such corporate transaction. The notes were set2017 Notes are senior unsecured obligations that rank: (i) senior in right of payment to matureany of WMG's indebtedness that is expressly subordinated in March 2014. right of payment to the 2017 Notes; (ii) equal in right of payment to any of WMG's unsecured indebtedness that is not so subordinated; (iii) effectively junior in right of payment to any secured indebtedness to the extent of the value of the assets securing such indebtedness; and (iv) structurally junior to all indebtedness and other liabilities (including trade payables) of WMG's subsidiaries. As a result of this transaction, we recognized deferred financing charges of approximately $8.8 million, which are being amortized over the term of the 2017 Notes using the effective interest method.
The 2017 Notes Conversion Derivative requires bifurcation from the 2017 Notes in accordance with ASC Topic 815, Derivatives and Hedging, and is accounted for as a derivative liability. See Note 6 for additional information regarding the 2017 Notes Conversion Derivative. The fair value of the 2017 Notes Conversion Derivative at the time of issuance of the 2017 Notes was $48.1 million and was recorded as original debt discount for purposes of accounting for the debt component of the 2017 Notes. This discount is amortized as interest expense using the effective interest method over the term of the 2017 Notes. For the year ended December 27, 2015 and December 31, 2014, we recorded $2.9 million and $9.3 million of interest expense related to the amortization of the debt discount, respectively, based upon an effective rate of 6.47%.
In connection with the note agreement,issuance of the Company also issued warrants to purchase an2020 Notes, on February 13, 2015, WMG repurchased and extinguished $240 million aggregate principal amount of 2.9 million ordinary shares at an exercise pricethe 2017 Notes and settled all of $16.98 per share. The Company recordedthe 2017 Notes Hedges (receiving $70 million) and repurchased all of the warrants as liabilities(paying $60 million) associated with an offsettingthe 2017 Notes. As a result of the repurchase, we recognized approximately $25.1 million for the write-off of related pro-rata unamortized deferred financing fees and debt discount recorded as a reductionwithin "Other expense (income), net" in our condensed consolidated statements of operations. As of December 27, 2015, $60 million aggregate principal amount of the carrying2017 Notes remained outstanding and is included within long-term obligations on the consolidated balance sheet.
The components of the 2017 Notes were as follows (in thousands):
 December 27, 2015December 31, 2014
Principal amount of 2017 Notes$60,000
$300,000
Unamortized debt discount(3,495)(27,348)
Net carrying amount of 2017 Notes$56,505
$272,652
The estimated fair value of the notes. The debt discount2017 Notes was being amortized as additional interest expense over the lifeapproximately $68 million at December 27, 2015, based on a quoted price in an active market (Level 1).
Acquired Debt, Repayment of the notes. The Company executed agreements in May 2010 where 100%Certain Indebtedness and Termination of the warrants were exchanged for ordinary shares.

In February 2008, the Company issued notes payable in the aggregate amount of €34.5 million (approximately $52.4 million) to a group of investors that included then existing shareholders and management of the Company. The notes carried a fixed annual interest rate of 8.0% with interest payments accrued in-kind. The notes were set to mature on February 28, 2013. Also,Credit Facility

On October 1, 2015, in connection with the 2008 note agreement, the Company issued warrants to purchase an aggregate of 3.1 million ordinary shares at a price of $16.98 per share. The Company had recorded the warrants as liabilities with an offsetting debt discount recorded as a reductionconsummation of the carrying value of the notes. TheWright/Tornier merger, we acquired certain mortgages, shareholder debt, discount was being amortized as additional interest expense over the life of the notes. The Company executed agreements in May 2010 where 100% of the warrants were exchanged for ordinary shares.

In February 2011, the Company used approximately $116.1 million (€86.4 million) of the net proceeds from its initial public offering to repay all of the outstanding indebtedness under the notes payable, including accrued interest thereon. At the time of repayment, the Company recognizedterm debt, and a loss on debt extinguishment of $29.5 million and related deferred tax benefit of $7.5 million to recognize the remaining balance of unamortized discount on the notes and to reverse the related deferred tax liability.

Notes payable balances prior to the repayment in February 2011 were as follows:

   February 14,
2011
(Time of
Repayment)
  January 2,
2011
 

Gross notes payable

  $116,109   $114,357  

Discount to notes payable

   (29,352  (30,096


Net notes payable

  $86,757   $84,261  

8. Long-Term Debt

A summary of other long-term debt is as follows (in thousands):

   December 30,
2012
  January 1,
2012
 

Lines of credit and overdraft arrangements

  $1,000   $9,989  

Mortgages

   3,719    5,508  

Bank term debt

   113,135    22,262  

Shareholder debt

   2,198    2,152  


Total debt

   120,052    39,911  

Less current portion

   (4,595  (18,011


Long-term debt

  $115,457   $21,900  


Aggregate maturities of debt for the next five years are as follows (in thousands):

2013

  $3,574  

2014

   2,968  

2015

   5,710  

2016

   5,605  

2017

   98,609  

Thereafter

   2,566  

Lines of Credit

On October 4, 2012, the Company, and its U.S. operating subsidiary, Tornier, Inc. (Tornier USA), entered into a credit agreement with Bank of America, N.A., as Administrative Agent, SG Americas Securities, LLC, as Syndication Agent, BMO Capital Markets and JPMorgan Chase Bank, N.A., as Co-Documentation Agents, Merrill Lynch, Pierce, Fenner & Smith Incorporated and SG Americas Securities, LLC, as Joint Lead Arrangers and Joint Bookrunners, and the other lenders party thereto. The credit facility included a senior secured revolving credit facility to Tornier USA denominated at the election of Tornier USA, in U.S. dollars, Euros, pounds, sterling and yen in an aggregate principal amount of up to the U.S. dollar equivalent of $30.0 million. Funds available under the revolving credit facility may be used for general corporate purposes. Loans under our revolving credit facility bear interest at (a) the alternate base rate (if denominated in U.S. dollars), equal to the greatest of (i) the prime rate in effect on such day, (ii) the federal funds rate in effect on such day plus 1/2 of 1%, and (iii) the adjusted LIBO rate plus 1%, plus in the case of each of (i)-(iii) above, an applicable rate of 2.00% or 2.25% (depending on our total net leverage ratio as defined in our credit agreement), or (b) in the case of a eurocurrency loan (as defined in our credit agreement), at the applicable adjusted LIBO rate for the relevant interest period plus an applicable rate of 3.00% or 3.25% (depending on our total net leverage ratio), plus the mandatory cost (as defined in our credit agreement) if such loan is made in a currency other than U.S. dollars or from a lending office in the United Kingdom or a participating member state (as defined in our credit agreement). The total amount outstanding as of December 30, 2012 related to this line of credit was $1.0 million. credit.

The debt matures in October 2017.

Tornier USA had established a $10.0 million secured line of credit at January 1, 2012. The line was secured by working capital and equipment. As of January 1, 2012, there was no outstanding balance under the line. Borrowings under

the line of credit beared annual interest at a 30-day LIBOR plus 2.25%, with a minimum interest rate of 5%. This facility was terminated in 2012.

The Company’s European subsidiaries had established unsecured bank overdraft arrangements which allowed for available credit totaling $23.8 million at January 1, 2012. Borrowings under these overdraft arrangements were $10.0 million at January 1, 2012 and had variable annual interest rates based on the Euro Overnight Index Average plus 1.3% or a three-month Euro plus 0.5%-3.0%. This debt was paid off in 2012.

Mortgages

The Company had a mortgagemortgages acquired are secured by an office building in Stafford, Texas. This building was sold in December 2012 and the outstanding mortgage balance was paid off. This mortgage had an outstanding amount of $1.2 million at January 1, 2012 and beared a variable annual interest rate of LIBOR plus 2%.

The Company also has a mortgage secured by an office building in Grenoble,Montbonnot, France. This mortgageThese mortgages had an outstanding balance of $3.7 million and $4.3$2.7 million at December 30, 201227, 2015 and January 1, 2012, respectively. This mortgage bears a fixed annual interest rate of 4.9%.

Bank Term Debt

In addition to the senior secured revolving credit facility discussed above, the credit agreement entered into on October 4, 2012 also provided for an aggregate credit commitment to Tornier USA of $145.0 million, consisting of: (1) a senior secured term loan facility to Tornier USA denominated in dollars in an aggregate principal amount of up to $75.0 million; (2) a senior secured term loan facility to Tornier USA denominated in Euros in an aggregate principal amount of up to the U.S. dollar equivalent of $40.0 million. The borrowings under the term loan facilities were used to pay the cash consideration for the OrthoHelix acquisition, and fees, costs and expenses incurred in connection with the acquisition and the credit agreement and to repay prior existing indebtedness of the Company and its subsidiaries. The debt matures in October 2017. Borrowings under these facilities within the credit agreement as of December 30, 2012 were as follows:

Senior secured U.S. dollar term loan

  $75,000  

Senior secured Euro term loan

   40,772  

Debt discount

   (5,138


Total

  $110,634  


The USD term facility bears interest at (a) the alternate base rate (if denominated in U.S. dollars), equal to the greatest of (i) the prime rate in effect on such day, (ii) the federal funds rate in effect on such day plus 1/2 of 1%, and (iii) the adjusted LIBO rate, with a floor of 1% (as defined in our new credit agreement) plus 1%, plus in the case of each of (i)-(iii) above, an applicable rate of 2.00% or 2.25% (depending on our total net leverage ratio as defined in our credit agreement), or (b) in the case of a eurocurrency loan (as defined in our credit agreement), at the applicable adjusted LIBO rate for the relevant interest period plus an applicable rate of 3.00% or 3.25% (depending on our total net leverage ratio), plus the mandatory cost (as defined in our credit agreement) if such loan is made in a currency other than U.S. dollars or from a lending office in the United Kingdom or a participating member state (as defined in our credit agreement). Under the EUR term facility, (a) alternate base rate loans bear interest at the alternate base rate plus the applicable rate, which is 3.00% or 3.25% (depending on our total net leverage ratio) and (b) eurocurrency loans bear interest at the adjusted LIBO rate for the relevant interest period, plus an applicable rate, which is 4.00% or 4.25% (depending on our total net leverage ratio), plus the mandatory cost, if applicable.

The credit agreement, including the term loans and the revolving line of credit, contains customary covenants, including financial covenants which require the Company to maintain minimum interest coverage, annual capital expenditure limits and maximum total net leverage ratios, and customary events of default. The obligations under the credit agreement are guaranteed by the Company, Tornier USA and certain other specified subsidiaries of the Company, and subject to certain exceptions, are secured by a first priority security interest in substantially all of the assets of the Company and certain specified existing and future subsidiaries of the Company. The Company was in compliance with all covenants as of December 30, 2012.

As a result of entering into the credit agreement, the Company used a portion of the proceeds to repay several of its previous outstanding debt balances.

The Company’s international subsidiaries had other long-term secured and unsecured notes totaling $1.3 million and $22.3 million at December 30, 2012 and January 1, 2012, respectively, with initial maturities ranging from three to ten years. A portion of these notes have fixed annual interest rates that range from 3.7% to 8.5%. A majority of 2.55%-4.9%.

The shareholder debt acquired was the notes outstanding in 2011 were paid off in 2012. At the timeresult of repayment, the Company recognized a loss on debt extinguishment of $0.6 million related to penalties and fees for prepayment.

Also included in term debt is $1.5 million related to capital leases. See Note 14 for further details.

Shareholder Debt

In 2008 one of the Company’stransaction where a 51%-owned and consolidated subsidiariessubsidiary of legacy Tornier borrowed $2.2 million from a then-current member of the Company’slegacy Tornier board of directors, who iswas also a 49% owner of the consolidated subsidiary. This loan was used to partially fund the purchase of real estate in Grenoble, France, to be used as


105


WRIGHT MEDICAL GROUP N.V.
NOTES TO CONSOLIDATED FINANCIAL STATEMENTS
(continued)

a manufacturing facility. Interest on the debt is variable basedvariable-based on the three-month Euro Libor rate plus 0.5%. and has no stated term. The outstanding balance on this debt was $2.2$2 million as of December 30, 201227, 2015. See Note 17 of the condensed consolidated financial statements for additional information regarding this related party transaction.
As of October 1, 2015, legacy Tornier had approximately $74 million in outstanding term debt and January 1, 2012, respectively. $7 million in a line of credit under a pre-existing credit agreement. Upon completion of the Wright/Tornier merger, we terminated all commitments under this credit agreement and repaid approximately $81 million in outstanding indebtedness. We did not incur any early termination penalties in connection with such repayment and termination.
Maturities
Aggregate annual maturities of our long-term obligations at December 27, 2015, excluding capital lease obligations, are as follows (in thousands):
2016835
201760,589
2018509
2019212
2020632,717
Thereafter2,376
 $697,238
As discussed in Note 7, we have acquired certain property and equipment pursuant to capital leases. At December 27, 2015, future minimum lease payments under capital lease obligations, together with the present value of the net minimum lease payments, are as follows (in thousands):
2016$1,989
20171,842
20181,801
20191,718
20201,581
Thereafter8,728
Total minimum payments17,659
Less amount representing interest(3,896)
Present value of minimum lease payments13,763
Current portion(1,341)
Long-term portion$12,422

10. Accumulated Other Comprehensive Income (AOCI)
Other comprehensive income (OCI) includes certain gains and losses that under US GAAP are included in comprehensive income but are excluded from net income as these amounts are initially recorded as an adjustment to shareholders’ equity. Amounts in OCI may be reclassified to net income upon the occurrence of certain events.
Our 2014 OCI is comprised of foreign currency translation adjustments, unrealized gains and losses on available-for-sale securities, and adjustments to our minimum pension liability. Our 2015 OCI is comprised solely of foreign currency translation adjustments. Foreign currency translation adjustments are reclassified to net income upon sale or upon a complete or substantially complete liquidation of an investment in a foreign entity. Unrealized gains and losses on available-for-sale securities and reclassified to net income if we sell the security before maturity of if the unrealized loss in a security is considered to be other-than-temporary.

106


WRIGHT MEDICAL GROUP N.V.
NOTES TO CONSOLIDATED FINANCIAL STATEMENTS
(continued)

Changes in and reclassifications out of AOCI, net of tax, for the twelve months ended December 31, 2014 and December 27, 2015 were as follows (in thousands):
 Currency translation adjustment 
Unrealized
gain (loss) on
marketable securities
 
Minimum
pension
liability
adjustment
 Total
Balance December 31, 2013$17,610
 $(1) $344
 $17,953
Other comprehensive income loss, net of tax(17,840) 1
 
 (17,839)
Reclassification to CTA and minimum pension liability adjustment 1
2,628
 
 (344) 2,284
Balance December 31, 2014$2,398
 $
 $
 $2,398
Other comprehensive income loss, net of tax(12,882) 
 
 (12,882)
Balance December 27, 2015$(10,484) $
 $
 $(10,484)
___________________________
1
The balances of CTA and minimum pension liability adjustment within AOCI were written-off following the liquidation of our former Japanese subsidiary as part of the sale of our OrthoRecon business. This was recorded within the gain on the sale of the OrthoRecon business within results of discontinued operations.

11. Income Taxes
The non-controlling interestcomponents of our loss before income taxes are as follows (in thousands):
 Fiscal year ended
 December 27, 2015 December 31, 2014 December 31, 2013
U.S.$(225,473) $(242,998) $(230,975)
Foreign(16,738) (3,832) 572
Loss before income taxes$(242,211) $(246,830) $(230,403)

The components of our provision (benefit) for income taxes are as follows (in thousands):
 Fiscal year ended
 December 27, 2015 December 31, 2014 December 31, 2013
Current (benefit) provision:     
U.S.:     
Federal$
 $(48) $296
State255
 198
 85
Foreign608
 1,674
 180
Total current (benefit) provision863
 1,824
 561
Deferred provision (benefit):     
U.S.:     
Federal(1,450) (3,164) 48,257
State(166) (1,411) 884
Foreign(3,098) (3,583) 63
Total deferred provision (benefit)(4,714) (8,158) 49,204
Total provision (benefit) for income taxes$(3,851) $(6,334) $49,765

107


WRIGHT MEDICAL GROUP N.V.
NOTES TO CONSOLIDATED FINANCIAL STATEMENTS
(continued)

A reconciliation of the statutory U.S. federal income tax rate to our effective income tax rate is as follows:
 Fiscal year ended
 December 27, 2015 December 31, 2014 December 31, 2013
Income tax provision at statutory rate35.0 % 35.0 % 35.0 %
State income taxes3.7 % 1.8 % 3.2 %
Change in valuation allowance(36.5)% (15.9)% (51.9)%
CVR fair market value adjustment1.1 % (17.7)% 9.3 %
Goodwill impairment %  % (17.5)%
Other, net(1.7)% (0.6)% 0.3 %
Total1.6 % 2.6 % (21.6)%

The significant components of our deferred income taxes as of December 27, 2015 and December 31, 2014 are as follows (in thousands):
 Fiscal year ended
 December 27, 2015 December 31, 2014
Deferred tax assets:   
Net operating loss carryforwards$289,715
 $131,986
General business credit carryforward6,121
 3,696
Reserves and allowances52,482
 27,334
Share-based compensation expense18,423
 7,942
Convertible debt notes and conversion option46,631
 31,491
Other6,720
 7,418
Valuation allowance(336,060) (171,392)
    
Total deferred tax assets84,032
 38,475
    
Deferred tax liabilities:   
Depreciation8,455
 1,915
Intangible assets58,266
 9,977
Convertible note bond hedge49,826
 31,200
Other6,660
 3,287
    
Total deferred tax liabilities123,207
 46,379
    
Net deferred tax liabilities$(39,175) $(7,904)
At December 27, 2015, we had net operating loss carryforwards for U.S. federal income tax purposes of approximately $700 million, of which approximately $8 million related to equity compensation deductions, for which when realized, the resulting benefit will be credited to shareholders' equity. The federal net operating losses begin to expire in this subsidiary is deemed immaterial2016 and extend through 2035. State net operating losses carryforwards at December 27, 2015 totaled approximately $537 million, which begin to expire in 2016 and extend through 2035. Additionally, we had general business credit carryforwards of approximately $6 million, which begin to expire in 2016 and extend through 2035. At December 27, 2015, we had foreign net operating loss carryforwards of approximately $101 million, $45 million of which do not expire and $56 million which begin to expire in 2016 and extend through 2028.
At December 27, 2015 and December 31, 2014, we had a valuation allowance of $336 million and $171 million, respectively, related to certain U.S. and foreign deferred tax assets. In addition, our ending valuation allowance balance includes approximately $56 million allocated from the preliminary purchase consideration with respect to the consolidated financial statements.

9. Retirement and Postretirement Benefit Plans

The Company’s French subsidiary is required by French government regulations to offer a plan to its employees that provides certain lump-sum retirement benefits. This plan qualifies as a defined benefit retirement plan. The French regulations do not require fundingmerger with Tornier. We recognized income tax expense for valuation allowance increase of this liability in advance and as a result there are no plan assets associated with this defined-benefit plan. The Company has a liability of $2.5$109 million and $1.5 million recorded at December 30, 2012 and January 1, 2012, respectively, for future obligations under the plan. The increase in the liability was driven by a decrease in the government mandated discount rate from 4.7% to 2.8%. The change in the discount rate resulted in a $0.9 million unrealized loss recorded as a component of other comprehensive loss. The related periodic benefit expense was immaterial in all periods presented.

10. Derivative Instruments

The Company’s operations outside the United States are significant. As a result, the Company has foreign exchange exposure on transactions denominated in currencies that are different than the functional currency in certain legal entities. Starting in 2012, the Company began entering into forward contracts to manage their exposure to foreign currency transaction gains (losses). As it relates to the Company’s U.S. operating entity, Tornier Inc., the Company has entered into forward contracts to manage the foreign currency exposures to the Euro. As it relates to the Company’s French operating entity, Tornier SAS, the Company has entered into forward contracts to manage the foreign currency exposure to the Australian Dollar, British Pound, Japanese Yen, Swiss Franc and U.S. Dollar. Forward contracts are recorded on the consolidated balance sheet at fair value. At December 30, 2012, the Company had foreign currency forward contracts outstanding with a fair value of $0.3 million. These contracts are accounted for as economic hedges and accordingly, changes in fair value are recognized in earnings. The net loss on foreign exchange forward contracts is recognized in foreign currency transaction gain (loss). Forduring the year ended December 30, 2012, the Company recognized gains of $0.3 million27, 2015, primarily related to these forward currency contracts.

11. Income Taxes

The components of earnings (loss) before taxes for the years ended December 30, 2012, January 1, 2012 and January 2, 2011, consist of the following (in thousands):

   December 30,
2012
  January 1, 2012  January 2, 2011 

United States loss

  $(19,858 $(2,631 $(6,526

Rest of the world loss

   (12,821  (36,249  (38,104


Loss before taxes

  $(32,679 $(38,880 $(44,630


The income tax benefit (provision) for the years ended December 30, 2012, January 1, 2012 and January 2, 2011, consists of the following (in thousands):

   December 30,
2012
  January 1,
2012
  January 2,
2011
 

Current (provision) benefit:


United States

  $(150 $(327 $(433

Rest of the world

   (2,523  (3,140  539  

Deferred benefit

   13,608    11,891    5,015  


Total income tax benefit

  $10,935   $8,424   $5,121  


A reconciliation ofadditional net operating losses incurred in the United States statutory income tax rate toStates. Management believes it is more likely than not that the Company’s effective tax rate for the years ended December 30, 2012, January 1, 2012 and January 2, 2011, is as follows:

   December
30, 2012
  January 1,
2012
  January 2,
2011
 

Income tax provision at U.S. statutory rate

   34.0  34.0  34.0

Release of valuation allowance

   32.8    —      —    

Change in valuation allowance

   (33.4  (10.1  (11.9

Non-taxed interest income on participating loan

   1.7    6.4    0.3  

State and local taxes

   2.6    (0.4  (0.1

Tax deductible IPO costs

   1.7    —      —    

Other foreign taxes

   (3.5  (2.0  (6.0

Unrecognized interest deduction

   —      (0.5  (2.5

Impact of foreign income tax rates

   (2.5  (6.9  (5.8

Non-deductible expenses

   (1.8  (0.6  (0.4

Other

   1.9    1.7    3.9  


Total

   33.5  21.6  11.5


Deferred income taxes reflect the net tax effects of temporary differences between the carrying amounts of assets and liabilities for financial reporting purposes and the amounts used for income tax purposes. The Company has established valuation allowances forremaining deferred tax assets whenwill be fully realized.

It is our current practice and intention to reinvest the earnings of our non-U.S. subsidiaries in those operations. Therefore, we do not provide for deferred taxes on the excess of the financial reporting over the tax basis in our investments in foreign subsidiaries

108


WRIGHT MEDICAL GROUP N.V.
NOTES TO CONSOLIDATED FINANCIAL STATEMENTS
(continued)

that are essentially permanent in duration. We would recognize a deferred income tax liability if we were to determine that such earnings are no longer indefinitely reinvested. At December 27, 2015, undistributed earnings of our foreign subsidiaries amounted to approximately $15 million. The determination of the amount of expected future taxable income is not likely to support the use of the deduction or credit.

The components of deferred taxes for the years ended December 30, 2012 and January 1, 2012, consist of the following (in thousands):

   December 30,
2012
  January 1,
2012
 

Deferred tax assets:


Net operating loss carryforwards

  $27,924   $26,219  

Inventory

   4,960    1,769  

Exchange rate changes

   223    156  

Stock options

   9,715    8,289  

Accruals and other provisions

   5,067    987  


Total deferred tax assets

   47,889    37,420  

Less: valuation allowance

   (30,011  (29,817


Total deferred tax assets after valuation allowance

   17,878    7,603  

Deferred tax liabilities:


Intangible assets

   (33,248  (22,209

Depreciation

   (2,033  (1,752


Total deferred tax liabilities

   (35,281  (23,961


Total net deferred tax liabilities

  $(17,403 $(16,358


In connection with the acquisition of OrthoHelix, the Company recorded deferred tax liabilities of $11.9 million, which included $10.7 million related to amortizable intangible assets and $1.2 million related to indefinite-lived acquired in-process research and development. The deferred tax liabilities of $10.7 million related to the amortizable intangibles reduces the Company’s net deferred tax assets by a like amount and in a manner that provides predictable future taxable income over the asset amortization period. As a result, the Company reduced its pre-acquisition deferred tax asset valuation allowance in 2012 by $10.7 million, which has been reflected as an income tax benefit in the consolidated statements of operations. Although theunrecognized deferred tax liability on these undistributed earnings is not practicable.

As of $1.2 million related to acquired in-process research and development also reduces the net deferredDecember 27, 2015, our unrecognized tax assets by a like amount, it does so in a manner that does not provide predictable future taxable income because the related asset is indefinite-lived. Therefore, the deferred tax asset valuation allowance was not reduced as a result of this item.

The Company had $30.0 million, $29.8 million and $26.9 million of valuation allowance recorded at December 30, 2012, January 1, 2012 and January 2, 2011, respectively. If any amounts reverse, the reversals would be recognized in the income tax provision in the period of reversal. The Company recognized $0.2 million ($10.9 million of increase valuation allowance netted against the $10.7 million of reversal from the OrthoHelix acquisition), $2.9 million and $5.2 million of the valuation allowance as a tax expense during the years ended December 30, 2012, January 1, 2012, and January 2, 2011, respectively.

Net operating loss carryforwards totalingbenefits totaled approximately $106 million at December 31, 2012, $53 million which relates to the United States and $53 million related to jurisdictions outside the United States. are available to reduce future taxable earnings of the Company’s consolidated U.S. subsidiaries and certain European subsidiaries, respectively. These net operating loss carryforwards include $14 million with no expiration date; the remaining carryforwards have expiration dates between 2015 and 2030.

The Company has recorded a long-term liability of approximately $2.6 million and $1.9 million at December 30, 2012 and January 1, 2012, respectively, which represents the Company’s best estimate of the potential additional tax liability related to certain tax positions from unclosed tax years in certain of its subsidiaries. To the extent that the results of any future tax audits differ from the Company’s estimate, changes to tax uncertainties will be reported as adjustments to income tax expense.

$10 million. The total amount of net unrecognized tax benefits that, if recognized, would affect the tax rate was $7.9approximately $5 million at December 30, 2012. The Company files27, 2015. Our 2009-2013 U.S. federal income tax returns in the U.S. federal jurisdiction and in various U.S. state and foreign jurisdictions. The Company is notare currently under examination by any U.S. federal, statethe Internal Revenue Service. While we believe that we are adequately accrued for possible adjustments, the final resolution of this examination cannot be determined at this time and local, or non-U.S. incomecould result in a final settlement that differs from current estimates. It is, therefore, possible that our unrecognized tax examinations by tax authorities. If any examinations were initiated,benefits could change in the Company would not expect the results of these examinations to have a material impact on its consolidated financial statements in future years.

next twelve months.

A reconciliation of the beginning and ending balances of the total amountsamount of unrecognized tax benefits is as followsfollows:
Balance at January 1, 2015$4,439
Additions from mergers5,618
Additions for tax positions related to current year344
Additions for tax positions of prior years
Reductions for tax positions of prior years(206)
Settlements
Foreign currency translation(254)
Balance at December 27, 2015$9,941
We accrue interest required to be paid by the tax law for the underpayment of taxes on the difference between the amount claimed or expected to be claimed on the tax return and the tax benefit recognized in the financial statements. Management has made the policy election to record this interest as interest expense and penalties, if incurred, would be recognized as penalty expense within "Other expense (income)" on our consolidated statements of operations. As of December 27, 2015, accrued interest and penalties related to our unrecognized tax benefits totaled approximately $1 million.
We file numerous consolidated and separate company income tax returns in the United States and in many foreign jurisdictions. We are no longer subject to foreign income tax examinations by tax authorities in significant jurisdictions for years before 2007. With few exceptions, we are subject to U.S. federal, state, and local income tax examinations for years 2012 through 2014. However, tax authorities have the ability to review years prior to these to the extent that we utilize tax attributes carried forward from those prior years.

12. Other Balance Sheet Information
Other long-term liabilities consist of the following (in thousands):

Gross unrecognized tax benefits at January 2, 2011

  $4,707  

Increase for tax positions in prior years

   246  

Decrease for tax positions in prior years

   (24

Increase for tax positions in current year

   453  

Foreign currency translation

   (150


Gross unrecognized tax benefits at January 1, 2012

  $5,232  

Increase for tax positions in prior years

   2,282  

Decrease for tax positions in prior years

   —    

Increase for tax positions in current year

   306  

Foreign currency translation

   89  


Gross unrecognized tax benefits at December 30, 2012

  $7,909  


12.

 December 27, December 31,
 2015 2014
Product liability (See Note 16)
13,990
 6,050
Notes Conversion Derivatives (See Note 6)
139,547
 76,000
Deferred license revenue (See Note 2)
3,263
 3,689
Contingent consideration and CVRs (See Note 6)
29,858
 36,549
Other21,916
 11,756
 $208,574
 $134,044
Accrued expenses and other liabilities consist of the following (in thousands):

109


 December 27, December 31,
 2015 2014
Employee bonus$27,515
 $2,557
Other employee benefits22,816
 5,968
Royalties12,918
 3,220
Taxes other than income18,895
 5,782
Commissions15,196
 6,857
Professional and legal fees21,048
 13,822
Contingent consideration (See Note 6)
792
 99,137
Product liability (see Note 16)
16,630
 10,262
Other38,053
 22,009
 $173,863
 $169,614

13. Capital Stock and Earnings Per Share

The Company

We are authorized to issue up to 320,000,000 ordinary shares, each share with a par value of three Euro cents (€0.03). We had 41.7 million102,672,678 and 39.3 million52,913,093 ordinary shares issued and outstanding as of December 30, 201227, 2015 and JanuaryDecember 31, 2014, respectively. As discussed in Note 3, the Wright/Tornier merger completed on October 1, 2012, respectively.

2015 has been accounted for as a “reverse acquisition” under US GAAP. As such, legacy Wright is considered the acquiring entity for accounting purposes; and therefore, legacy Wright’s historical results of operations replaced legacy Tornier’s historical results of operations for all periods prior to the merger. Additionally, each legacy Wright share was converted into the right to receive 1.0309 ordinary shares of the combined company and the par value was revised to reflect the €0.03 par value as compared to the legacy Wright par value of $0.01. These changes resulted in the restatement of the following to conform to the current presentation:

ordinary shares and APIC balances for all periods included within the statements of shareholders' equity;
2014 ordinary shares balance, APIC balance, and ordinary shares outstanding on the balance sheet;
2013 and 2014 earnings per share and weighted average ordinary shares outstanding on the statements of operations;
2013 and 2014 weighted average ordinary shares outstanding below; and
2013 and 2014 impact of share-based compensation on earnings per share in Note 14.
FASB ASC Topic 260, Earnings Per Share, requires the presentation of basic and diluted earnings per share. Basic earnings per share is calculated based on the weighted-average number of ordinary shares outstanding during the period. Diluted earnings per share is calculated to include any dilutive effect of our ordinary share equivalents. For the years ended December 27, 2015 and December 31, 2014, our ordinary share equivalents consisted of stock options, non-vested shares of ordinary shares, stock-settled phantom stock units, restricted stock units, and warrants. Additionally, for the year ended December 31, 2013, our ordinary share equivalents consisted of stock options, non-vested shares of ordinary shares, stock-settled phantom stock units, restricted stock units, 2014 Notes, and warrants. The Companydilutive effect of the stock options, non-vested shares of ordinary shares, stock-settled phantom stock units, restricted stock units, and warrants is calculated using the treasury-stock method. The dilutive effect of the 2014 Notes is calculated by applying the “if-converted” method. This assumes an add-back of interest, net of income taxes, to net income as if the securities were converted at the beginning of the period. The 2014 Notes matured on December 1, 2014. Net-share settled warrants on the 2017 Notes and 2020 Notes were anti-dilutive for the years ended December 27, 2015 and December 31, 2014.
We had outstanding options to purchase 3.8 million, 4.2 million and 3.7 million9,866,666 ordinary shares at December 30, 2012, January 1, 2012 and January 2, 2011, respectively. The Company also had 0.4 million and 0.2 million1,133,295 restricted stock units outstanding at December 30, 201227, 2015, 4,309,062 ordinary shares and January 1, 2012. Outstanding options to purchase ordinary shares,282,674 restricted stock units and warrants representing an aggregaterestricted stock awards at December 31, 2014, and 3,472,561 ordinary shares and 129,353 restricted stock units and restricted stock awards at December 31, 2013. None of 4.2 million, 4.4 million and 3.7 million shares are notthe options, restricted stock units, or restricted stock awards were included in diluted earnings per share for the years ended December 30, 2012, January 1, 201227, 2015, December 31, 2014, and January 2, 2011, respectively,December 31, 2013 because the Companywe recorded a net loss infor all periodsperiods; and therefore, including these instruments would be anti-dilutive.

13. Segment


WRIGHT MEDICAL GROUP N.V.
NOTES TO CONSOLIDATED FINANCIAL STATEMENTS
(continued)

The weighted-average number of ordinary shares outstanding for basic and Geographic Data

The Company has one reportable segment, orthopaedic products, which includes the design, manufacture and marketing of joint implants and other related products. The Company’s geographic regions consist of the United States, France and other areas. Long-lived assets are those assets located in each region. Revenues attributed to each region are based on the location in which the products were sold.

Revenue by geographic regiondiluted earnings per share purposes is as follows (in thousands):

   Year Ended 
   December 30, 2012   January 1, 2012   January 2, 2011 

Revenue by geographic region:


United States

  $156,750    $141,496    $127,762  

France

   52,737     55,438     47,324  

Other international

   68,033     64,257     52,292  


Total

  $277,520    $261,191    $227,378  


Revenue

 Fiscal year ended
 December 27, 2015 December 31, 2014 December 31, 2013
Weighted-average number of ordinary shares outstanding — basic1
64,808
 51,293
 48,103
Ordinary share equivalents
 
 
Weighted-average number of ordinary shares outstanding — diluted1
64,808
 51,293
 48,103

1
The prior year balances were converted to meet post-merger valuations as described above.

14. Share-Based Compensation
We currently have two share-based compensation plans under which share-based awards may be granted - the Wright Medical Group N.V. Amended and Restated 2010 Incentive Plan and the Tornier N.V. 2010 Employee Stock Purchase Plan, which are described below. In addition, we have several legacy Wright and legacy Tornier share-based compensation plans and agreements under which stock options are outstanding, but no future share-based awards may be granted.
Amounts recognized in the consolidated financial statements with respect to share-based compensation are as follows:
 Fiscal year ended
 December 27, 2015 December 31, 2014 December 31, 2013
Total cost of share-based payment plans$24,716
 $11,287
 $11,912
Amounts capitalized as inventory(51) (66) (467)
Amortization of capitalized amounts299
 266
 513
Charged against income before income taxes24,964
 11,487
 11,958
Amount of related income tax benefit recognized in income
 
 (3,945)
Impact to net loss from continuing operations$24,964
 $11,487
 $8,013
Impact to net income from discontinued operations
 8,845
 2,320
Impact to net (loss) income$24,964
 $20,332
 $10,333
Impact to basic earnings per share, continuing operations 1
$0.39
 $0.22
 $0.17
Impact to basic earnings per share 1
$0.39
 $0.40
 $0.21
Impact to diluted earnings per share, continuing operations 1
$0.39
 $0.22
 $0.17
Impact to diluted earnings per share 1
$0.39
 $0.40
 $0.21

1
The prior year balances were converted to meet post-merger valuations as described in Note 13.
On October 1, 2015, all stock options, restricted stock units, non-vested shares of WMG common stock, and stock-settled phantom stock units outstanding as of the effective time of the Wright/Tornier merger automatically vested, resulting in $14.2 million in share-based compensation expense. Upon this acceleration, 1,321,852 stock options vested with a weighted-average exercise price of $25.53 per share, and 282,564 restricted stock units, non-vested shares of WMG common stock, and stock-settled phantom stock units vested with a weighted-average grant-date fair value of $26.30 per share.
As of December 27, 2015, we had $37.3 million of total unrecognized share-based compensation cost related to unvested share-based compensation arrangements. This cost is expected to be recognized over a weighted-average period of 3.54 years.
During 2014, as part of the divestiture of our OrthoRecon business to MicroPort, we modified share-based compensation awards held by product categoryemployees assigned to MicroPort to accelerate vesting for unvested share-based compensation awards, as an incentive to induce each employee to accept and continue employment with MicroPort, contingent upon the closing of the sale. On January 12, 2014, all unvested share-based compensation awards held by these former 65 employees were vested, which was comprised of approximately 500,000 non-vested options with a weighted-average exercise price of $22.50 per share and 266,000 non-vested

111


WRIGHT MEDICAL GROUP N.V.
NOTES TO CONSOLIDATED FINANCIAL STATEMENTS
(continued)

shares. The incremental cost associated with the modified share-based compensation totaled $8.8 million, and was recognized as a reduction to our gain realized on the sale of the OrthoRecon business in the first quarter of 2014. There were no outstanding stock options held by these former employees as of December 31, 2014.
During 2013, in connection with the BioMimetic acquisition, we recognized $2.2 million of share-based compensation expense related to the incremental fair value of replacement awards attributed to pre-combination service.
Equity Incentive Plans
The Wright Medical Group N.V. Amended and Restated 2010 Incentive Plan (the 2010 Plan), which is an amended and restated version of legacy Tornier's Tornier N.V. Amended and Restated 2010 Incentive Plan, was approved by our shareholders on June 18, 2015 and became effective upon completion of the Wright/Tornier merger on October 1, 2015. The 2010 Plan authorizes us to grant a wide variety of share-based and cash-based awards, including incentive and non-qualified options, stock appreciation rights, stock grants, stock unit grants, cash-based awards, and other share-based awards. To date, only stock options and stock grants in the form of restricted stock units (RSUs) have been granted. Both types of awards generally have graded vesting periods of 3 or 4 years and the options expire 10 years after the grant date. Options are granted with exercise prices equal to the fair market value of our ordinary shares on the date of grant.
The 2010 Plan reserves for issuance a number of ordinary shares equal to the sum of (i) the number of ordinary shares available for grant under legacy Tornier's prior stock option plan as of February 2, 2011 (not including issued or outstanding shares granted pursuant to options under such plan as of such date); (ii) the number of ordinary shares forfeited upon the expiration, cancellation, forfeiture, cash settlement, or other termination following February 2, 2011 of an option outstanding as of February 2, 2011 under legacy Tornier's prior stock option plan; and (iii) 8,200,000 shares. As of December 27, 2015, 2.9 million ordinary shares remained available for grant under the 2010 Plan, and there were 6,022,912 ordinary shares covering outstanding awards under such plan as of such date.
In addition to the legacy Tornier prior stock option plan mentioned above under which previously granted vested options remained outstanding as of December 27, 2015, there are two legacy Wright share-based compensation plans and four non-plan inducement option agreements under which previously granted vested options remained outstanding as of December 27, 2015, including the Wright Medical Group, Inc. Second Amended and Restated 2009 Equity Incentive Plan (the Legacy Wright 2009 Plan) and the Wright Medical Group, Inc. Fifth Amended and Restated 1999 Equity Incentive Plan. All of these plans and agreements were terminated with respect to future awards, and thus, no future share-based awards may be granted under any of these legacy plans and agreements.
No stock options or other share-based awards were granted under legacy Wright's share-based compensation plans during 2015 due to the pending Wright/Tornier merger. During 2014 and 2013, legacy Wright granted 853 thousand and 1,033 thousand stock options, respectively, and granted 264 thousand and 223 thousand non-vested shares of common stock, stock-settled phantom stock units, and restricted stock units, respectively, to employees under the Legacy Wright 2009 Plan. All of the options issued under the Legacy Wright 2009 Plan expire after 10 years from the date of grant. All outstanding awards under the legacy Wright plans automatically vested on October 1, 2015 as a result of the Wright/Tornier merger; therefore, there are no restricted stock units, non-vested shares of common stock, or stock-settled phantom stock units outstanding at December 27, 2015. Additionally, under the legacy Wright plans, there were 3,362,110 stock options outstanding as of December 27, 2015.
Stock options
We estimate the fair value of stock options using the Black-Scholes valuation model. The Black-Scholes option-pricing model requires the input of estimates, including the expected life of stock options, expected stock price volatility, the risk-free interest rate and the expected dividend yield. Prior to the Wright/Tornier merger, the expected life of options was estimated based on historical option exercise and employee termination data. Post merger, the expected life of options was estimated based on the simplified method due to a lack of comparable, historic option exercise, and employee termination data for the combined company. The expected stock price volatility assumption was estimated based upon historical volatility of our ordinary shares for both legacy Wright and legacy Tornier prior to October 1, 2015. The risk-free interest rate was determined using U.S. Treasury rates where the term is consistent with the expected life of the stock options. Expected dividend yield is not considered as we have never paid dividends and have no plans of doing so in the future. We are required to estimate forfeitures at the time of grant and revise those estimates in subsequent periods if actual forfeitures differ from those estimates. We use historical data to estimate pre-vesting forfeitures and record share-based compensation expense only for those awards that are expected to vest. The fair value of stock options is amortized on a straight-line basis over the respective requisite service period, which is generally the vesting period.

112


WRIGHT MEDICAL GROUP N.V.
NOTES TO CONSOLIDATED FINANCIAL STATEMENTS
(continued)

The weighted-average grant date fair value of stock options granted to employees in 2015, 2014, and 2013 was $7.05 per share, $9.98 per share, and $8.60 per share, respectively. The fair value of each option grant is estimated on the date of grant using the Black-Scholes option valuation model using the following assumptions:
 Fiscal year ended
 December 27, 2015 December 31, 2014 December 31, 2013
Risk-free interest rate1.4% - 1.6% 1.5% - 1.8% 0.1% - 1.4%
Expected option life6 years 6 years 6 years
Expected price volatility33% 31% 36%

A summary of our stock option activity during 2015 is as follows:
 
Shares
(000’s)
 
Weighted-average exercise
price
 
Weighted-average remaining
contractual life
 
Aggregate intrinsic value*
($000’s)
Outstanding at December 31, 20143,517 $24.22
    
Exercised(134) 23.13
    
Forfeited or expired(87) 26.26
    
Incremental shares upon conversion99 23.49
    
Assumed awards in merger2,476 20.43
    
Granted post-merger3,135 20.63
    
Exercised post-merger(22) 19.01
    
Forfeited or expired post-merger(34) 20.26
    
Outstanding at December 27, 20158,950 $21.66
 7.45 $17,945
Exercisable at December 27, 20155,826 $22.21
 6.19 $7,871

*
The aggregate intrinsic value is calculated as the difference between the market value of our ordinary shares as of December 27, 2015 and the exercise price of the options. The market value as of December 27, 2015 was $23.56 per share, which is the closing sale price of our ordinary shares on December 24, 2015, the last trading day prior to December 27, 2015, as reported by the NASDAQ Global Select Market.
The total intrinsic value of options exercised during 2015, 2014, and 2013 was $0.4 million, $5.3 million, and $1.4 million, respectively.
A summary of our stock options outstanding and exercisable at December 27, 2015 is as follows (in(shares in thousands):

   Year Ended 
   December 30, 2012   January 1, 2012   January 2, 2011 

Revenue by product type:


Upper extremity joints and trauma

  $175,242    $164,064    $139,175  

Lower extremity joints and trauma

   34,109     26,033     23,629  

Sports medicine and biologics

   15,526     14,779     13,210  


Total extremities

   224,877     204,876     176,014  

Large joints and other

   52,643     56,315     51,364  


Total

  $277,520    $261,191    $227,378  


Long-lived tangible assets, including instruments, property, plant

  Options outstanding Options exercisable
Range of exercise prices Number outstanding Weighted-average remaining
contractual life
 Weighted-average exercise
price
 Number exercisable Weighted-average exercise
price
$2.00 — $16.00 441
 3.8 $13.54
 441
 $13.54
$16.01 — $24.00 7,117
 7.8 20.86
 3,993
 21.05
$24.01 — $35.87 1,392
 6.8 28.28
 1,392
 28.28
  8,950
 7.4 $21.66
 5,826
 $22.21

Restricted stock units, non-vested shares, and equipmentstock-settled phantom stock units
We calculate the grant date fair value of restricted stock units, non-vested shares of common stock, and stock-settled phantom stock units using the closing sale prices on the trading day immediately prior to the grant date. We are required to estimate forfeitures at the time of grant and revise those estimates in subsequent periods if actual forfeitures differ from those estimates. We use historical data to estimate pre-vesting forfeitures and record share-based compensation expense only for those awards that are expected to vest.
We granted 1.1 million, 0.3 million, and 0.2 million restricted stock units, non-vested shares of common stock, and stock-settled phantom stock units to employees with weighted-average grant-date fair values of $20.60 per share, $30.04 per share, and $24.66 per share during 2015, 2014, and 2013, respectively. The fair value of the unvested restricted stock units granted after completion

113


WRIGHT MEDICAL GROUP N.V.
NOTES TO CONSOLIDATED FINANCIAL STATEMENTS
(continued)

of the Wright/Tornier merger shares will be recognized on a straight-line basis over the respective requisite service period, which is generally the vesting period.
During 2015, we did not grant any restricted stock units to non-employees, and during 2014 and 2013, we granted a negligible amount of non-vested shares to non-employees.
A summary of our restricted stock unit, non-vested shares, and stock-settled phantom stock unit activity during 2015 is as follows:
 
Shares
(000’s)
 
Weighted-average
grant-date
fair value
 
Aggregate
intrinsic value*
($000’s)
Non-vested at December 31, 2014493
 $26.23
  
Vested(213) 25.11
  
Forfeited(6) 29.59
  
Incremental shares upon conversion9
 $26.30
  
Acceleration upon merger(283) $26.30
  
Granted post-merger1,139
 $20.60
  
Vested post-merger(2) $20.62
  
Forfeited post-merger(4) $10.87
  
Non-vested at December 27, 20151,133
 $20.63
 $26,700
___________________
*
The aggregate intrinsic value is calculated as the market value of our ordinary shares as of December 27, 2015. The market value as of December 27, 2015 was $23.56 per share, which is the closing sale price of our ordinary shares on December 24, 2015, the last trading day prior to December 27, 2015, as reported by the NASDAQ Global Select Market.
The total fair value of shares vested during 2015, 2014, and 2013 was $11.8 million, $5.4 million, and $6.5 million, respectively.
Inducement Stock Options
On occasion, legacy Wright granted stock options under an inducement stock option agreement, in order to induce candidates to commence employment with legacy Wright as a member of the executive management team. These options vested over a service period ranging from three to four years.
A summary of our inducement grant stock option activity during 2015 is as follows:
 
Shares
(000’s)
 
Weighted-average exercise
price
 
Weighted-average remaining
contractual life
 
Aggregate intrinsic value*
($000’s)
Outstanding at December 31, 2014890
 $17.21
    
Granted
 
    
Exercised
 
    
Forfeited or expired
 
    
Incremental shares upon conversion27
 16.69
    
Outstanding at December 27, 2015917
 16.69
 6 $6,300
Exercisable at December 27, 2015917
 $16.69
 6 $6,300

*The aggregate intrinsic value is calculated as the difference between the market value of ordinary shares as of December 27, 2015 and the exercise price of the shares. The market value as of December 27, 2015 was 23.56 per share, which is the closing sale price of our ordinary shares on December 24, 2015, the last trading day prior to December 27, 2015, as reported by the NASDAQ Global Select Market.

114


WRIGHT MEDICAL GROUP N.V.
NOTES TO CONSOLIDATED FINANCIAL STATEMENTS
(continued)

A summary of our inducement grant stock options outstanding and exercisable at December 27, 2015, is as follows (in(shares in thousands):

   December 30,
2012
   January 1,
2012
 

Long-lived assets:


United States

  $31,342    $25,221  

France

   39,764     40,564  

Other international

   17,439     16,915  


Total

  $88,545    $82,700  


  Options outstanding Options exercisable
Range of exercise prices Number outstanding Weighted-average remaining
contractual life
 Weighted-average exercise
price
 Number exercisable Weighted-average exercise
price
$2.00 — $16.00 696
 5.76 $15.57
 696
 $15.57
$16.01 — $35.87 221
 6.76 20.22
 221
 20.22
  917
 6.00 $16.69
 917
 $16.69
Employee Stock Purchase Plan
Under the Tornier N.V. 2010 Employee Stock Purchase Plan (the ESPP), which was approved by the legacy Tornier shareholders in August 2010, we are authorized to issue and sell up to 333,333 ordinary shares to employees of certain designated subsidiaries who work at least 20 hours per week. Under the ESPP, there are two six-month plan periods during each calendar year, one beginning January 1 and ending on June 30, and the other beginning July 1 and ending on December 31. Under the terms of the ESPP, employees can choose each offering period to have up to 10% of their annual base earnings withheld to purchase up to 833 of our ordinary shares. The purchase price of the shares is 85% of the market price on the last day of the offering period. As a result of the then pending Wright/Tornier merger, legacy Tornier suspended the operation of the ESPP effective as of December 31, 2014. We are considering restarting the ESPP sometime during 2016. As of December 27, 2015, there were 285,845 ordinary shares available for future issuance under the ESPP.
Legacy Wright also had a similar employee stock purchase plan (the Legacy Wright ESPP), under which its employees could choose each offering period to have up to 5% of their annual base earnings, limited to $5,000, withheld to purchase WMG common stock. The purchase price of the stock was 85% of the lower of its beginning-of-period or end-of-period market price. Legacy Wright terminated the Legacy Wright ESPP after the completion of the second half of 2014 offering period due to the then pending Wright/Tornier merger; and therefore, as of December 27, 2015, there were no shares available for future issuance under the Legacy Wright ESPP.
Under the Legacy Wright ESPP, legacy Wright sold to employees approximately 22,000 and 23,000 in 2014 and 2013, respectively, with weighted-average fair values of $8.18 and $6.81 per share, respectively. During 2014 and 2013, we recorded nominal amounts of non-cash, share-based compensation expense related to the Legacy Wright ESPP.
In applying the Black-Scholes methodology to the purchase rights granted under the Legacy Wright ESPP, we used the following assumptions:
 Fiscal year ended
 December 31, 2014 December 31, 2013
Risk-free interest rate0.3% - 0.6% 0.1% - 0.4%
Expected option life6 months 6 months
Expected price volatility31% 36%

15. Retirement Benefit Plans
For the year ended December 27, 2015, legacy Wright and legacy Tornier provided separate retirement benefit plans for their respective employees.
14.Legacy Wright sponsored a defined contribution plan under Section 401(k) of the Internal Revenue Code of 1986, as amended (Code), which covered U.S. employees who are 21 years of age and over. Under this plan, legacy Wright matched voluntary employee contributions at a rate of 100% for the first 2% of an employee’s annual compensation and at a rate of 50% for the next 2% of an employee’s annual compensation. Employees vest in company contributions after three years of service. The expense related to this plan recognized within our results from continuing operations was $2.5 million in 2015, $1.6 million in 2014, and $1.2 million in 2013.
Legacy Tornier sponsored a qualified defined contribution plan that permitted eligible employees to make pre-tax deferrals of their pay as permitted under Section 401(k) of the Code. The plan covered U.S. employees who were 18 years of age and over. Under this plan, legacy Tornier provided a matching contribution each pay period equal to 50% of the employee’s pre-tax deferrals (other than catch-up contributions) that did not exceed 6% of the employee’s eligible earnings for that pay period, (for a maximum

115


WRIGHT MEDICAL GROUP N.V.
NOTES TO CONSOLIDATED FINANCIAL STATEMENTS
(continued)

matching contribution equal to 3% of the employee’s eligible earnings for that pay period).  Employees vested in the company’s matching contributions at 25% after one year of service, 50% after two years of service and 100% after three years of service. The expense related to this plan recognized within our results from continuing operations was $0.2 million in 2015.

116


WRIGHT MEDICAL GROUP N.V.
NOTES TO CONSOLIDATED FINANCIAL STATEMENTS
(continued)


16. Commitments and Contingencies
Operating Leases
We lease certain equipment and office space under non-cancelable operating leases. Rental expense under operating leases approximated $8.6 million, $7.1 million, and $8 million for the years ended

December 27, 2015, December 31, 2014, and 2013, respectively. Future minimum rental commitmentspayments, by year and in the aggregate, under non-cancelable operating leases in effect aswith initial or remaining lease terms of December 30, 2012one year or more, are as follows at December 27, 2015(in thousands):

2013

  $5,489  

2014

   4,923  

2015

   4,175  

2016

   3,645  

2017

   3,568  

Thereafter

   10,120  


Total

  $31,920  


Operating leases include copiers, automobiles and property leases and have maturity dates between 2013 and 2022. Total rent expense

2016$10,001
20175,608
20184,337
20193,717
20203,282
Thereafter10,714
 $37,659
Portions of our payments for the years ended December 30, 2012, January 1, 2012 and January 2, 2011 was $4.3 million, $3.5 million and $3.3 million, respectively.

Future lease payments under capitaloperating leases are as follows (in thousands):

2013

  $691  

2014

   475  

2015

   272  

2016

   123  

2017

   77  

Thereafter

   —    


Total minimum lease payments

   1,638  

Less amount representing interest

   (153


Present value of minimum lease payments

   1,485  

Current portion

   (622


Long-term portion

  $863  


Fixed assets that are recorded as capital lease assets consist of machinerydenominated in foreign currencies and equipment, and have a carrying value of $2.6 million ($3.4 million gross value, less $0.8 million accumulated depreciation) and $1.7 million ($2.7 million gross value, less $1.0 million accumulated depreciation) at December 30, 2012 and January 1, 2012, respectively. Amortization of capital lease assets is included in depreciation expensewere translated in the consolidated financial statements.

tables above based on their respective U.S. dollar exchange rates at 15. Certain RelationshipsDecember 27, 2015. These future payments are subject to foreign currency exchange rate risk.

Purchase Obligations
We have entered into certain supply agreements for our products, which include minimum purchase obligations. We paid approximately $0 and Related-Party Transactions

The Company leases all of its approximately 55,000 square feet of manufacturing facilities and approximately 52,000 square feet of office space located in Grenoble, France, from Alain Tornier (Mr. Tornier), who is a current shareholder and member of the Company’s board of directors. Annual lease payments to Mr. Tornier amounted to $1.6 million, $1.9 million and $1.7$2.0 million during the years ended December 27, 2015 and December 31, 2014 under those supply agreements. During 2015, we entered into a supply agreement which includes minimum purchase obligations of $0.4 million, $1.5 million, and $3 million for 2016, 2017, and 2018, respectively.

Legal Contingencies
The legal contingencies described in this footnote relate primarily to Wright Medical Technology, Inc., an indirect subsidiary of Wright Medical Group N.V., and are not necessarily applicable to Wright Medical Group N.V. or other affiliated entities. Maintaining separate legal entities within our corporate structure is intended to ring-fence liabilities.  We believe our ring-fenced structure should preclude corporate veil-piercing efforts against entities whose assets are not associated with particular claims.  
As described below, our business is subject to various contingencies, including patent and other litigation, product liability claims, and a government inquiry.  These contingencies could result in losses, including damages, fines, or penalties, any of which could be substantial, as well as criminal charges. Although such matters are inherently unpredictable, and negative outcomes or verdicts can occur, we believe we have significant defenses in all of them, are vigorously defending all of them, and do not believe any of them will have a material adverse effect on our financial position. However, we could incur judgments, pay settlements, or revise our expectations regarding the outcome of any matter. Such developments, if any, could have a material adverse effect on our results of operations in the period in which applicable amounts are accrued, or on our cash flows in the period in which amounts are paid.
Our contingencies are subject to significant uncertainties and, therefore, determining the likelihood of a loss or the measurement of a loss can be complex. We have accrued for losses that are both probable and reasonably estimable. Unless otherwise indicated, we are unable to estimate the range of reasonably possible loss in excess of amounts accrued.  Our assessment process relies on estimates and assumptions that may prove to be incomplete or inaccurate. Unanticipated events and circumstances may occur that could cause us to change our estimates and assumptions.

117


WRIGHT MEDICAL GROUP N.V.
NOTES TO CONSOLIDATED FINANCIAL STATEMENTS
(continued)

Governmental Inquiries
On September 29, 2010, we entered into a five-year Corporate Integrity Agreement (CIA) with the Office of the Inspector General of the United States Department of Health and Human Services (OIG-HHS). The CIA was filed as Exhibit 10.2 to legacy Wright's current report on Form 8-K filed on September 30, 2010. The CIA expired on September 29, 2015, and on January 27, 2016, we received notification from the OIG-HHS that the term of the CIA has concluded. While the term of the CIA has concluded, our failure to continue to maintain compliance with U.S. healthcare laws, regulations, and other requirements in the future could expose us to significant liability, including, but not limited to, exclusion from U.S. federal healthcare program participation, including Medicaid and Medicare, potential prosecution, civil and criminal fines or penalties, as well as additional litigation cost and expense.
On August 3, 2012, we received a subpoena from the United States Attorney's Office for the Western District of Tennessee requesting records and documentation relating to our PROFEMUR® series of hip replacement devices. The subpoena covers the period from January 1, 2000 to August 2, 2012. We continue to cooperate with the investigation.
Patent Litigation
In 2011, Howmedica Osteonics Corp. and Stryker Ireland, Ltd. (collectively, Stryker), each a subsidiary of Stryker Corporation, filed a lawsuit against us in the United States District Court for the District of New Jersey alleging that we infringed Stryker's U.S. Patent No. 6,475,243 related to our LINEAGE® Acetabular Cup System and DYNASTY® Acetabular Cup System. The lawsuit seeks an order of infringement, injunctive relief, unspecified damages, and various other costs and relief. On July 9, 2013, the Court issued a claim construction ruling. On November 25, 2014, the Court entered judgment of non-infringement in our favor. On January 7, 2015, Howmedica and Stryker filed a notice of appeal to the Court of Appeals for the Federal Circuit. The Court of Appeals heard oral argument on December 10, 2015 and took the case under advisement. We are presently awaiting the Court’s written decision.
In 2012, Bonutti Skeletal Innovations, LLC (Bonutti) filed a patent infringement lawsuit against us in the United States Court for the District of Delaware. Subsequently, Inter Partes Review (IPR) of the Bonutti patents was sought before the U.S. Patent and Trademark Office. On April 7, 2014, the Court stayed the case pending outcome of the IPR. Bonutti originally alleged that the Link Sled Prosthesis infringes U.S. Patent 6,702,821. The Link Sled Prosthesis is a product we distributed under a distribution agreement with LinkBio Corp, which expired on December 31, 2013. In January 2013, Bonutti amended its complaint, alleging that the ADVANCE® knee system, including ODYSSEY® instrumentation, infringes U.S. Patent 8,133,229, and that the ADVANCE® knee system, including ODYSSEY® instrumentation and PROPHECY® guides, infringes U.S. Patent 7,806,896, which was issued on October 5, 2010. All of the claims of the asserted patents are directed to surgical methods for minimally invasive surgery. As a result of the arguments submitted in the IPR, Bonutti abandoned the claims subject to the IPR from U.S. Patent 8,133,229, leaving one claim from U.S. Patent 7,806,896 still pending before the Patent Office Board that administers IPR’s. On February 18, 2015, the Patent Office Board held that remaining claim invalid. Following the conclusion of the IPRs, the District Court has lifted the stay, and we are continuing with our defense as to remaining patent claims asserted by Bonutti.
In June 2013, Orthophoenix, LLC filed a patent lawsuit against us in the United States District Court for the District of Delaware alleging that the X-REAM® product infringes two patents. In June 2014, we filed a request for IPR with the U.S. Patent and Trademark Office. On December 16, 2014, the Patent Office Board denied our petitions requesting IPR. We are continuing with our defense before the District Court.
In June 2013, Anglefix, LLC filed suit in the United States District Court for the Western District of Tennessee, alleging that our ORTHOLOC® products infringe Anglefix’s asserted patent. On April 14, 2014, we filed a request for IPR with the U.S. Patent and Trademark Office. In October 2014, the Court stayed the case pending outcome of the IPR. On June 30, 2015, the Patent Office Board entered judgment in our favor as to all patent claims at issue in the IPR. Following the conclusion of the IPR, the District Court lifted the stay, and we are continuing with our defense as to remaining patent claims asserted by Anglefix.
In February 2014, Biomedical Enterprises, Inc. filed suit against Solana Surgical, LLC (Solana) in the United States District Court for the Western District of Texas alleging Solana's FuseForce Fixation system infringes U.S. Patent No. 8,584,853 entitled “Method and Apparatus for an Orthopedic Fixation System.” On February 20, 2015, Solana filed a request for IPR with the U.S. Patent and Trademark Office. On February 27, 2015, Biomedical Enterprises filed an amended complaint to add WMG and WMT as parties to the litigation. On April 3, 2015, the parties filed a stipulation of dismissal without prejudice as to us. On August 10, 2015, the Patent Office Review Board initiated IPR as to all challenged patent claims. The Patent Office Board heard oral argument in the IPR proceeding on February 17, 2016, and we are proceeding with our defense before the District Court.

118


WRIGHT MEDICAL GROUP N.V.
NOTES TO CONSOLIDATED FINANCIAL STATEMENTS
(continued)

On September 23, 2014, Spineology filed a patent infringement lawsuit, Case No. 0:14-cv-03767, in the U.S. District Court in Minnesota, alleging that our X-REAM® bone reamer infringes U.S. Patent No. RE42,757 entitled “EXPANDABLE REAMER.”  In January 2015, as the deadline for service of its complaint, Spineology dismissed its complaint without prejudice and filed a new, identical complaint. We filed an answer to the new complaint with the Court on April 27, 2015 and discovery is underway. The parties have submitted Markman claim construction briefing to the Court and a Markman hearing is scheduled for March 23, 2016.
On January 13, 2015, we received a notice from Corin Limited claiming a portion of the INFINITY® Total Ankle System infringes their patent rights in France, Germany, Italy, Spain, the Netherlands, and the United Kingdom. If a lawsuit is filed we will contest these claims vigorously.
Subject to the provisions of the asset purchase agreement with MicroPort for the sale of the OrthoRecon business, we, as between us and MicroPort, will continue to be responsible for defense of pre-existing patent infringement cases relating to the OrthoRecon business, and for resulting liabilities, if any.
Product Liability
We have received claims for personal injury against us associated with fractures of our PROFEMUR® long titanium modular neck product (PROFEMUR® Claims). As of January 30, 2016 there were 42 pending U.S. lawsuits and 23 pending non-U.S. lawsuits alleging such claims. The overall fracture rate for the product is low and the fractures appear, at least in part, to relate to patient demographics. Beginning in 2009, we began offering a cobalt-chrome version of our PROFEMUR® modular neck, which has greater strength characteristics than the alternative titanium version. Historically, we have reflected our liability for these claims as part of our standard product liability accruals on a case-by-case basis. However, during the quarter ended September 30, 2011, as a result of an increase in the number and monetary amount of these claims, management estimated our liability to patients in North America who have previously required a revision following a fracture of a PROFEMUR® long titanium modular neck, or who may require a revision in the future. Management has estimated that this aggregate liability ranges from approximately $22.5 million to $28.9 million. Any claims associated with this product outside of North America, or for any other products, will be managed as part of our standard product liability accrual methodology on a case-by-case basis.
Due to the uncertainty within our aggregate range of loss resulting from the estimation of the number of claims and related monetary payments, we have recorded a liability of $22.5 million, which represents the low-end of our estimated aggregate range of loss. We have classified $8.5 million of this liability as current in “Accrued expenses and other current liabilities” and $14 million as non-current in “Other liabilities” on our consolidated balance sheet. We expect to pay the majority of these claims within the next three years.
During the quarter ended September 30, 2015, we increased our estimated liability by approximately $4 million for claims that had been incurred in prior periods. We have analyzed the impact of this adjustment and determined that this out-of-period charge did not have a material impact to the prior period or current period financial statements. 
We are aware that MicroPort has recalled certain sizes of its cobalt chrome modular neck products as a result of alleged fractures. As of February 16, 2016, there were 2 pending U.S. lawsuits and 2 pending non-U.S. lawsuits against us alleging personal injury resulting from the fracture of a cobalt chrome modular neck. These claims will be managed as part of our standard product liability accrual methodology on a case-by-case basis.
We have maintained product liability insurance coverage on a claims-made basis. During the quarter ended March 31, 2013, we received a customary reservation of rights from our primary product liability insurance carrier asserting that present and future claims related to fractures of our PROFEMUR® titanium modular neck hip products and which allege certain types of injury (Modular Neck Claims) would be covered as a single occurrence under the policy year the first such claim was asserted. The effect of this coverage position would be to place Modular Neck Claims into a single prior policy year in which applicable claims-made coverage was available, subject to the overall policy limits then in effect. Management agrees with the assertion that the Modular Neck Claims should be treated as a single occurrence, but notified the carrier that it disputed the carrier's selection of available policy years. During the second quarter of 2013, we received confirmation from the primary carrier confirming their agreement with our policy year determination. Based on our insurer's treatment of Modular Neck Claims as a single occurrence, we increased our estimate of the total probable insurance recovery related to Modular Neck Claims by $19.4 million, and recognized such additional recovery as a reduction to our selling, general and administrative expenses for the three months ended March 31, 2013, within results of discontinued operations. In the quarter ended June 30, 2013, we received payment from the primary insurance carrier of $5 million. In the quarter ended September 30, 2013, we received payment of $10 million from the next insurance carrier in the tower. We have requested, but not yet received, payment of the remaining $25 million from the third insurance carrier in the tower for that policy period. The policies with the second and third carrier in this tower are “follow form” policies and

119


WRIGHT MEDICAL GROUP N.V.
NOTES TO CONSOLIDATED FINANCIAL STATEMENTS
(continued)

management believes the third carrier should follow the coverage position taken by the primary and secondary carriers. On September 29, 2015, that third carrier asserted that the terms and conditions identified in its reservation of rights will preclude coverage for the Modular Neck Claims. We strongly dispute the carrier's position and, in accordance with the dispute resolution provisions of the policy, have initiated an arbitration proceeding in London, England seeking payment of these funds. Pursuant to applicable accounting standards, we have reduced our insurance receivable balance for this claim to $0, and recorded a $25 million charge within "Net loss from discontinued operations" during the year ended December 27, 2015.
Claims for personal injury have also been made against us associated with our metal-on-metal hip products (primarily our CONSERVE® product line). The pre-trial management of certain of these claims has been consolidated in the federal court system, in the United States District Court for the Northern District of Georgia under multi-district litigation (MDL) and certain other claims by the Judicial Counsel Coordinated Proceedings (JCCP) in state court in Los Angeles County, California (collectively the Consolidated Metal-on-Metal Claims).
As of January 30, 2016, there were 1,126 such lawsuits pending in the MDL and JCCP, and an additional 22 cases pending in various state courts. We have also entered into 893 so called "tolling agreements" with potential claimants who have not yet filed suit. There are also 56 non-U.S. lawsuits presently pending. We believe we have data that supports the efficacy and safety of our metal-on-metal hip products. While continuing to dispute liability, we have participated in court supervised non-binding mediation in the multi-district federal court litigation.
The first bellwether trial in the MDL commenced on November 9, 2015 in Atlanta, Georgia. On November 24, 2015, the jury returned a verdict in favor of the plaintiff and awarded the plaintiff $1 million in compensatory damages and $10 million in punitive damages. We believe there were significant trial irregularities and are vigorously contesting the trial result. On December 28, 2015, we filed a post-trial motion for judgment as a matter of law or, in the alternative, for a new trial or a reduction of damages awarded. That motion is pending. We have not recorded an accrual for this verdict because we are unable to reasonably estimate a probable liability at this time.
The supervising judge in the JCCP has set a trial date of March 14, 2016 for the first bellwether trial in California. We expect that trial to proceed as scheduled.
We have maintained product liability insurance coverage on a claims-made basis. During the quarter ended September 30, 2012, we received a customary reservation of rights from our primary product liability insurance carrier asserting that certain present and future claims which allege certain types of injury related to our CONSERVE® metal-on-metal hip products (CONSERVE® Claims) would be covered as a single occurrence under the policy year the first such claim was asserted. The effect of this coverage position would be to place CONSERVE® Claims into a single prior policy year in which applicable claims-made coverage was available, subject to the overall policy limits then in effect. Management agrees that there is insurance coverage for the CONSERVE® Claims, but has notified the carrier that it disputes the carrier's characterization of the CONSERVE® Claims as a single occurrence.
Management has recorded an insurance receivable for the probable recovery of spending in excess of our retention for a single occurrence. During 2015, we received $6.1 million of insurance proceeds, which represent the amount undisputed by the carrier for the policy year the first claim was asserted. Our acceptance of these proceeds was not a waiver of any other claim that we may have against the insurance carrier. As of December 27, 2015, this receivable totaled approximately $17 million, and is solely related to defense costs incurred through December 27, 2015, less insurance proceeds received. However, the amount we ultimately receive may differ depending on the final conclusion of the insurance policy year or years and the number of occurrences. We believe our contracts with the insurance carriers are enforceable for these claims; and, therefore, we believe it is probable that we will receive recoveries from our insurance carriers. However, our insurance carriers could still ultimately deny coverage for some or all of our insurance claims.
Every metal-on-metal hip case involves fundamental issues of science and medicine that often are uncertain, that continue to evolve, and which present contested facts and issues that can differ significantly from case to case. Such contested facts and issues include medical causation, individual patient characteristics, surgery specific factors, and the existence of actual, provable injury. Given these complexities, we are unable to reasonably estimate a probable liability for these matters. Although we continue to contest liability, based upon currently available information, we estimate a reasonably possible range of liability for the Consolidated Metal-on-Metal Claims, before insurance recoveries, averaging from zero to $250,000 per case.
Based upon the information we have at this time, we do not believe our liabilities, if any, in connection with these matters will exceed our available insurance. However, as described below, we are currently litigating coverage issues with certain of our carriers. As the litigation moves forward and circumstances continue to develop, our belief we will be able to resolve the Consolidated Metal-on-Metal Claims within available insurance coverage could change, which could materially impact our results of operations

120


WRIGHT MEDICAL GROUP N.V.
NOTES TO CONSOLIDATED FINANCIAL STATEMENTS
(continued)

and financial position. Further, and notwithstanding our present belief we will be able to resolve these Claims within available insurance proceeds, we would consider contributing a limited amount to the funding of an acceptable, comprehensive, mediated settlement among claimants and insurers. To this end, we have indicated a willingness to contribute up to $30 million to achieve such a comprehensive settlement. Due to continuing uncertainty around (i) whether a multi-party comprehensive settlement can be achieved, (ii) the outcome of our coverage litigation with insurers which could impact the ability to reach a settlement and (iii) the case by case outcomes of any Metal-on-Metal claims ultimately litigated (and which we expect to contest vigorously), we are unable to reasonably estimate a probable liability for these matters; and, therefore, no amounts have been accrued.
In June 2014, St. Paul Surplus Lines Insurance Company (Travelers), which was an excess carrier in our coverage towers across multiple policy years, filed a declaratory judgment action in Tennessee state court naming us and certain of our other insurance carriers as defendants and asking the court to rule on the rights and responsibilities of the parties with regard to the CONSERVE® Claims. Among other things, Travelers appears to dispute our contention that the CONSERVE® Claims arise out of more than a single occurrence thereby triggering multiple policy periods of coverage.  Travelers further seeks a determination as to the applicable policy period triggered by the alleged single occurrence.  We filed a separate lawsuit in state court in California for declaratory judgment against certain carriers and breach of contract against the primary carrier, and have moved to dismiss or stay the Tennessee action on a number of grounds, including that California is the most appropriate jurisdiction. During the third quarter of 2014, the California Court granted Travelers' motion to stay our California action.
In May 2015, we entered into confidential settlement discussions with our insurance carriers through a private mediator. These discussions are continuing.
In February 2014, Biomet, Inc. (Biomet) announced it had reached a settlement in the multi-district litigation involving its own metal-on-metal hip products. The terms announced by Biomet include: (i) an expected base settlement amount of $200,000; (ii) an expected minimum settlement amount of $20,000; (iii) no payments to plaintiffs who did not undergo a revision surgery; and (iv) a total settlement amount expected to be within Biomet’s aggregate insurance coverage. We believe our situation involves facts and circumstances that differ significantly from the Biomet cases.
In addition to the Consolidated Metal-on-Metal Claims discussed above, there are currently certain other pending claims related to our metal-on-metal hip products for which we are accounting in accordance with our standard product liability accrual methodology on a case-by-case basis.
Certain liabilities associated with the OrthoRecon business, including product liability claims associated with hip and knee products sold prior to the closing, were not assumed by MicroPort. Liabilities associated with these product liability claims, including legal defense, settlements and judgments, income associated with product liability insurance recoveries, and changes to any contingent liabilities associated with the OrthoRecon business have been reflected within results of discontinued operations, and we will continue to reflect these within results of discontinued operations in future periods. MicroPort is responsible for product liability claims associated with products it sells after the closing.
In June 2015, a jury returned a $4.4 million verdict against us in a case involving a fractured hip implant stem sold prior to the MicroPort closing.  This was a one-of-a-kind case unrelated to the modular neck fracture cases we have been reporting. There are no other cases pending related to this component, nor are we aware of other instances where this component has fractured. In September 2015, the trial judge reduced the jury verdict to $1.025 million and indicated that if the plaintiff did not accept the reduced award he would schedule a new trial solely on the issue of damages. The plaintiff elected not to accept the reduced damage award, and both parties have appealed. The Court has not set a date for a new trial on the issue of damages and we do not expect it will do so until the appeals are adjudicated. We will maintain our current $4.4 million accrual as a probable liability until the matter is resolved. The $4.4 million probable liability associated with this matter is reflected within “Accrued expenses and other current liabilities,” and a $4 million receivable associated with the probable recovery from product liability insurance is reflected within “Other current assets.”
MicroPort Indemnification Claim
In July 2015, we received demand letters from MicroPort seeking indemnification under the terms of the asset purchase agreement for the sale of our OrthoRecon business for losses or potential losses it has incurred or may incur as a result of either alleged breaches of representations in the asset purchase agreement or alleged unassumed liabilities. MicroPort asserted that the range of potential losses for which it seeks indemnity is between $18.5 million and $30 million. We responded to MicroPort's demand letters and received a further demand letter reiterating each of their claims and providing revised claim amounts. In this letter MicroPort asserted that the range of potential losses for which it seeks indemnity is between $77.5 million and $112.5 million.

121


WRIGHT MEDICAL GROUP N.V.
NOTES TO CONSOLIDATED FINANCIAL STATEMENTS
(continued)

On October 27, 2015, MicroPort filed a lawsuit in the United States District Court for the District of Delaware against Wright Medical Group N.V. alleging that we breached the indemnification provisions of the asset purchase agreement by failing to indemnify MicroPort for alleged damages arising out of certain pre-closing matters and for breach of certain representations and warranties. The complaint includes claims relating to MicroPort’s recall of certain of its cobalt chrome modular neck products, and seeks damages in an unspecified amount plus attorneys’ fees and costs, as well as declaratory judgment. On January 1, 20124, 2016, we filed an answer to the complaint and January 2, 2011, respectively.

also filed a counterclaim seeking declaratory judgment and indemnification and other damages in an unspecified amount from MicroPort. A scheduling order has not yet been entered in the lawsuit.

Other
In addition to those noted above, we are subject to various other legal proceedings, product liability claims, corporate governance, and other matters which arise in the ordinary course of business.

17. Certain Relationships and Related-Party Transactions
On July 29, 2008, the CompanyTornier SAS, a subsidiary of legacy Tornier, formed a real estate holding company (SCI Calyx) together with Mr. Tornier.Alain Tornier (Mr. Tornier). SCI Calyx is owned 51% by the CompanyTornier SAS and 49% by Mr. Tornier. SCI Calyx was initially capitalized by a contribution of capital of €10,000 funded 51% by the CompanyTornier SAS and 49% by Mr. Tornier. SCI Calyx then acquired a combined manufacturing and office facility in Montbonnot, France, for approximately $6.1 million. The manufacturing and office facility acquired was to be used to support the manufacture of certain of the Company’slegacy Tornier’s current products and house certain operations already located in Montbonnot, France. This real estate purchase was funded through mortgage borrowings of $4.1 million and $2.0 million cash borrowed from the two current shareholders of SCI Calyx. The $2.0 million cash borrowed from the SCI Calyx shareholders originally consisted of a $1.0 million note due to Mr. Tornier and a $1.0 million note due to Tornier SAS, which is the Company’s wholly owned French operating subsidiary.SAS. Both of the notes issued by SCI Calyx bear annual interest at the three-month Euro Libor rate plus 0.5% and have no stated term. During 2010, SCI Calyx borrowed approximately $1.4 million from Mr. Tornier in order to fund on-going leasehold improvements necessary to prepare the Montbonnot facility for its intended use. This cash was borrowed under the same terms as the original notes. On September 3, 2008, Tornier SAS the Company’s French operating subsidiary, entered into a lease agreement with SCI Calyx relating to these facilities. The agreement, which terminates in 2015,2018, provides for an annual rent payment of €440,000, which has subsequently been increased and is currently €888,583€965,655 annually. Annual lease payments to SCI Calyx amounted to $2.2 million during the year ended December 27, 2015, $0.6 million of which is reflected in our consolidated financial statements in light of the timing of the Wright/Tornier merger. As of December 30, 2012,27, 2015, future minimum payments under this lease were €4.4$12.3 million in the aggregate. As of December 30, 2012,27, 2015, SCI Calyx had related-party debt outstanding to Mr. Tornier of $2.2$2.0 million. The SCI Calyx entity is consolidated by the Company,us, and the related real estate and liabilities are included in theon our consolidated balance sheets.

Since 2006, Tornier SAS has entered into various lease agreements with entities affiliated with Mr. Tornier or members of his family. On May 30, 2006, Tornier SAS entered into two lease agreements with Mr. Tornier and his sister, Colette Tornier, relating to the Company’s former facilities in Saint-Ismier, France. The agreements provided for annual rent payments of €104,393 and €28,500, respectively, which were increased to €121,731 and €33,233 annually, respectively. On June 26, 2012, Tornier SAS entered into an amendment to these lease agreements to terminate them effective as of September 30, 2012. No early termination payments were made by Tornier SAS pursuant to the terms of the amendment. During 2012, Tornier SAS paid an aggregate of €2.7 million to an entity affiliated with Mr. Tornier and his sister, Colette Tornier, as rent for the Company’s former facility located in Saint-Ismier, France. On December 29, 2007, Tornier SAS entered into a lease agreement with Cymaise SCI, relating to the Company’s former facilities in Saint-Ismier, France. The agreement provides for a term through May 30, 2015 and an annual rent payment of €480,000, which was subsequently increased to €531,243 annually. Cymaise SCI is wholly owned by Mr. Tornier and his sister, Colette Tornier. On December 29, 2007, Tornier SAS entered into a lease agreement with Animus SCI, relating to the Company’sour facilities in Montbonnot Saint Martin, France. On August 18, 2012, the parties amended the lease agreement to extend the term until May 31, 2022 and reduce the annual rent. The amended agreement provides for an initial annual rent payment of €279,506, annually.which was subsequently increased to €296,861. Animus SCI is wholly owned by Mr. Tornier. On February 6, 2008, Tornier SAS entered into a lease agreement with Balux SCI, effective as of May 22, 2006, relating to the Company’sour facilities in Montbonnot Saint Martin, France. On August 18, 2012, the parties amended the lease agreement to extend the term until May 31, 2022 and reduce the annual rent. The amended agreement provides for an initial annual rent payment of €252,545.€252,254, which was subsequently increased to €564,229. Balux SCI is wholly ownedwholly-owned by Mr. Tornier and his sister, Colette Tornier. As of December 30, 2012,27, 2015, future minimum payments under all of these agreements were €279,506$6.0 million in the aggregate.

16. Share-Based Compensation

Share-based awards are granted under the Tornier N.V. 2010 Incentive Plan, as amended and restated (2010 Plan). This plan allows for the issuance


18. Quarterly Results of up to 7.7 million ordinary shares in connection with the grant of a combination of potential share-based awards, including stock options, restricted stock units, stock appreciation rights and other types of awards as deemed appropriate. To date, only options to purchase ordinary shares (options) and restricted stock units (RSUs) have been awarded. Both types of awards generally have graded vesting periods of four years and the options expire ten years after the grant date. Options are granted with exercise prices equal to the fair value of the Company’s ordinary shares on the date of grant.

The Company recognizes compensation expense for these awards on a straight-line basis over the vesting period. Share-based compensation expense is included in cost of goods sold, selling, general and administrative, and research and development expenses on the consolidated statements of operations.

Below is a summary of the allocation of share-based compensation (in thousands):

   Year ended 
   December 30,
2012
   January 1,
2012
   January 2,
2011
 

Cost of goods sold

  $864    $841    $536  

Selling, general and administrative

   5,477     5,263     4,661  

Research and development

   489     443     433  


Total

  $6,830    $6,547    $5,630  


The Company recognizes the fair value of share-based awards granted in exchange for employee services as a cost of those services. Total compensation cost included in the consolidated statements of operations for employee share-based payment arrangements was $6.5 million, $6.2 million and $5.1 million during the years ended December 30, 2012, January 1, 2012 and January 2, 2011, respectively. The amount of expense related to non-employee options was $0.3 million, $0.3 million and $0.5 million for the years ended December 30, 2012, January 1, 2012 and January 2, 2011, respectively. Additionally, $0.3 million and $0.6 million were included in inventory as a capitalized cost as of December 31, 2012 and January 1, 2012, respectively.

Stock Option Awards

The Company estimates the fair value of stock options using the Black-Scholes option pricing model. The Black-Scholes option pricing model requires the input of estimates, including the expected life of stock options, expected stock price volatility, the risk-free interest rate and the expected dividend yield. The Company calculates the expected life of stock options using the SEC’s allowed short-cut method. The expected stock price volatility assumption was estimated based upon historical volatility of the common stock of a group of the Company’s peers that are publicly traded. The risk-free interest rate was determined using U.S. Treasury rates with terms consistent with the expected life of the stock options. Expected dividend yield is not considered, as the Company has never paid dividends and currently has no plans of doing so during the term of the options. The Company estimates forfeitures at the time of grant and revises those estimates in subsequent periods if actual forfeitures differ from those estimates. The Company uses historical data when available to estimate pre-vesting option forfeitures, and records share-based compensation expense only for those awards that are expected to vest. The weighted-average fair value of the Company’s options granted to employees was $8.55, $12.06 and $11.03 per share, in 2012, 2011 and 2010, respectively. The fair value of each option grant is estimated on the date of grant using the Black-Scholes option pricing model using the following weighted-average assumptions:

   Years ended 
   December 30,
2012
  January 1,
2012
  January 2,
2011
 

Risk-free interest rate

   0.9  2.1  2.3

Expected life in years

   6.1    6.1    5.8  

Expected volatility

   48.1  48.6  49.8

Expected dividend yield

   0.0  0.0  0.0

As of December 30, 2012, the Company had $9.8 million of total unrecognized compensation cost related to unvested share-based compensation arrangements granted to employees under the 2010 Plan and the Company’s prior stock option plan. That cost is expected to be recognized over a weighted-average service period of 2.7 years. Shares reserved for future compensation grants were 2.5 million and 0.4 million at December 30, 2012 and January 1, 2012, respectively. Exercise prices per share for options outstanding at December 30, 2012, ranged from $13.39 to $27.31.

A summary of the Company’s employee stock option activity is as follows:

   Ordinary Shares
(In Thousands)
  Weighted-Average
Exercise Price
   Weighted-Average
Remaining
Contractual Life
(In Years)
   Aggregate Intrinsic
Value (in Millions)
 

Outstanding at December 27, 2009

   2,651    15.06     7.6     5.0  


Granted

   992    22.50      

Exercised

   (32  15.32      

Forfeited or expired

   (79  15.81      


Outstanding at January 2, 2011

   3,532    17.02     7.4     19.4  


Granted

   647    24.76      

Exercised

   (210  15.02      

Forfeited or expired

   (73  20.96      


Outstanding at January 1, 2012

   3,896    18.32     6.9     (3.8


Granted

   626    18.45      

Exercised

   (426  16.56      

Forfeited or expired

   (314  22.33      


Outstanding at December 30, 2012

   3,782    18.23     6.4     (7.3


Exercisable at period end

   2,567    16.93     5.3     (1.7

The Company did not grant options to purchase ordinary shares to non-employees in the year ended December 30, 2012. During the years ended January 1, 2012 and January 2, 2011, the Company granted options to purchase 74,667 and 21,000 ordinary shares, respectively, to non-employees in exchange for consulting services. The options granted in 2011 and 2010 had weighted-average exercise prices of $19.39 and $22.50 per share, respectively. 197,773 of these non-employee options were exercisable at December 30, 2012. 31,060 of these options were exercised in 2012. These options have vesting periods of either two or four years and expire 10 years after the grant date. The measurement date for options granted to non-employees is often after the grant date, which often requires updates to the estimate of fair value until the services are performed. The weighted-average per share fair value on the date of grant of each non-employee option granted was $9.74 in 2011.

Total compensation expense related to stock options, including employees and non-employees, recognized in the consolidated statements of operations was approximately $5.0 million, $5.8 million and $5.6 million for the years ended December 30, 2012, January 1, 2012 and January 2, 2011, respectively.

Restricted Stock Units Awards

The Company began to grant RSUs in 2011 under the 2010 Plan. Vesting of these awards typically occurs over a four-year period and the grant date fair value of the awards is recognized as expense over the vesting period. Total compensation expense recognized in the consolidated statements of operations related to RSUs was $1.8 million and $0.7 million for the years ended December 30, 2012 and January 1, 2012, respectively.

A summary of the Company’s activity related to the RSUs is as follows:

   Shares
(In Thousands)
  Weighted-Average
Grant Date Fair
Value Per Share
 

Outstanding at January 2, 2011

   —      —    

Granted

   221    25.06  

Vested

   (7  23.61  

Cancelled

   (7  25.52  


Outstanding at January 1, 2012

   207    25.10  

Granted

   305    18.51  

Vested

   (55  20.21  

Cancelled

   (35  24.01  


Outstanding at December 30, 2012

   422    20.57  


17. Other Non-Operating Income

During the year ended December 30, 2012, the Company recognized $0.1 million in other non-operating income. During the year ended January 1, 2012, the Company recognized $1.3 million in non-operating income, which included a $1.0 million gain on settlement of a contingent liability and a $0.3 million gain related to the sale of certain non-operating real estate in France. During the year ended January 2, 2011, the Company recognized $0.4 million of non-operating gains related to the mark-to-market of the warrant liability. These warrants were converted into ordinary shares later in 2011.

18. Special Charges

Special charges are recorded as a separate line item within operating expenses on the consolidated statement of operations and primarily include operating expenses directly related to business combinations and related integration activities, restructuring initiatives (including the facilities consolidation initiative), management exit costs and certain other items that are typically infrequent in nature and that affect the comparability and trend of operating results. The table below summarizes amounts included in special charges for the related periods:

   Year ended 
   December 30,
2012
   January 1,
2012
   January 2,
2011
 

Restructuring costs

  $6,357    $—      $—    

Management exit costs

   1,229     632     —    

Acquisition and integration costs

   3,546     —       —    

Distribution channel change costs

   1,374     —       —    

Increased allowances for uncollectible accounts in Italy

   2,001     —       —    

Intangible asset impairments

   4,737     —       —    

Other

   —       260     306  


Total

  $19,244    $892    $306  


Included in special charges for the year ended December 30, 2012, were $6.4 million of restructuring costs related to the Company’s facilities consolidation initiative. See below for further details on this initiative. Also included in special charges were management exit costs of $1.2 million which included severance related to the Company’s former Chief Executive Officer and Global Chief Financial Officer; acquisition and integration costs of $3.5 million which included costs related to the Company’s acquisition of OrthoHelix and the Company’s exclusive distributor in Belgium and Luxembourg; distribution channel change costs of $1.4 million which included termination costs related to certain strategic business decisions made related to the Company’s U.S. and international distribution channels; Increased allowances of uncollectible accounts in Italy of $2.0 million which related to bad debt expense related to the termination of a distributor and general economic conditions in Italy; and intangible impairments of $4.7 million as the Company made certain strategic decisions related to previously acquired intangibles which was determined to be impaired as a result of the acquisition of OrthoHelix. Included in special charges on the consolidated statement of operations for the year ended January 1, 2012 are $0.6 million in management termination costs and $0.3 million of charges related to the closure of the Company’s Beverly, Massachusetts facility. Included in special charges for the year ended January 2, 2011 are $0.3 million in costs incurred related to commissions paid in the United Kingdom related to the termination of the relationship with a former distributor and expenses related to the Company’s consolidation of its U.S. operations.

On April 13, 2012, the Company announced a facilities consolidation initiative, stating that it planned to consolidate several of its facilities to drive operational productivity and to reduce annual operating expenses by $2.3 million to $2.8 million beginning in 2013. Under the initiative, the Company consolidated its Dunmanway, Ireland manufacturing facility into its Macroom, Ireland manufacturing facility in the second quarter of 2012 and, in the third quarter of 2012, the Company consolidated its St. Ismier, France manufacturing facility into its Montbonnot, France manufacturing facility. In addition, the Company leased a new facility in Bloomington, Minnesota to use its U.S. business headquarters and consolidated its Minneapolis-based marketing, training, regulatory, supply chain, and corporate functions with it Stafford, Texas-based distribution operations. This initiative was completed in the fourth quarter of 2012.

Charges incurred in connection with the facilities consolidation initiative during the year ended December 30, 2012 are presented in the following table (in thousands). All of the following amounts were recognized within special charges in the Company’s consolidated statements of operations for the year ended December 30, 2012.

   Fiscal Year Ended 
   December 30, 2012 

Employee termination benefits

  $1,180  

Impairment charges related to fixed assets

   872  

Moving, professional fees and other initiative-related expenses

   4,305  


Total facilities consolidation expenses

  $6,357  


The $1.2 million of employee termination benefits includes severance and retention related to approximately 65 employees impacted by the facilities consolidation initiative in the U.S. The $0.9 million of impairment charges related to fixed assets include charges for closing the impacted facilities in the U.S., France and Ireland. The $4.3 million of moving, professional fees and other initiative-related expenses include moving and transportation expenses, lease termination costs, professional fees and other expenses that were incurred to execute the facilities consolidation initiative.

Included in accrued liabilities on the consolidated balance sheet as of December 30, 2012 is an accrual related to the facilities consolidation initiative. Activity in the facilities consolidation accrual is presented in the following table (in thousands):

Facility consolidation accrual balance as of January 2, 2012

  $  

Charges:


Employee termination benefits

   1,180  

Moving, professional fees and other initiative-related expenses

   4,305  


Total charges

   5,485  

Payments:


Employee termination benefits

   (620

Moving, professional fees and other initiative-related expenses

   (4,191


Total payments

   (4,811


Facilities consolidation accrual balance as of December 30, 2012

  $674  


The Company anticipates that substantially all of this accrual will be paid in the first quarter of 2013.

19. Litigation

On October 25, 2007, two of the Company’s former sales agents filed a complaint in the U.S. District Court for the Southern District of Illinois, alleging that the Company had breached their agency agreements and committed fraudulent and negligent misrepresentations. The jury rendered a verdict on July 31, 2009, awarding the plaintiffs a total of $2.6 million in actual damages and $4.0 million in punitive damages. While the court struck the award of punitive damages on March 31, 2010, it denied the Company’s motion to set aside the verdict or order a new trial. The Company timely filed a notice of appeal with the U.S. Court of Appeals for the Seventh Circuit in respect of the remaining actual damages. On August 24, 2011, the U.S. Court of Appeals for the Seventh Circuit issued its decision affirming the order of the lower court setting aside the award of punitive damages. In addition, the appellate court affirmed the lower court’s finding of liability against the Company, but vacated the lower court’s damages award of $2.6 million in compensatory damages as being not supported by the record and being too speculative. The case was then remanded to the lower court for a recalculation of damages that is consistent with the appellate court’s decision. On May 17, 2012, the lower court ordered a new trial on the issue of damages. It is anticipated that the new trial will be conducted during the first half of 2013.

The Company has considered the facts of the case, the related case law and the decision of the U.S. Court of Appeals for the Seventh Circuit and, based on this information, believes that the verdict rendered on July 31, 2009 was inappropriate given the related facts and supporting legal arguments. The Company has considered the progress of the case, the views of legal counsel, the facts and arguments presented at the original jury trial, and the decision of the U.S. Court of Appeals for the Seventh Circuit and the fact that the Company intends to continue to vigorously defend its position through the remand proceedings in assessing the probability of a loss occurring for this matter. The Company has determined that a

loss is reasonably possible. The Company estimates the high end of the range to be $2.6 million, the amount of the initial jury verdict, minus the punitive damage award. The Company believes it continues to have a strong defense against these claims and is vigorously contesting these allegations. After assessing all relevant information, the Company has accrued an amount at the low end of the range, which is deemed immaterial.

In addition to the item noted above, the Company is subject to various other legal proceedings, product liability claims and other matters which arise in the ordinary course of business. In the opinion of management, the amount of liability, if any, with respect to these matters will not materially affect the Company’s consolidated financial statements or liquidity.

20. Selected Quarterly InformationOperations (unaudited):

The following table presents a summary of the Company’sour unaudited quarterly operating results for each of the four quarters in 20122015 and 2011,2014, respectively (in thousands). This information was derived from unaudited interim financial statements that, in the opinion of management, have been prepared on a basis consistent with the financial statements contained elsewhere in this reportfiling and include all adjustments, consisting only of normal recurring adjustments, necessary for a fair presentationstatement of such information when read in conjunction with the Company’sour audited financial statements and related notes. The operating results for any quarter are not necessarily indicative of results for any future period.

   Year ended December 30, 2012 
   Fourth
Quarter
  Third
Quarter
  Second
Quarter
  First
Quarter
 
   (in thousands, except per share data) 

Revenue

  $79,033   $58,015   $66,014   $74,458  

Gross profit

   52,059    42,285    47,916    53,342  

Consolidated net loss

   (4,803  (11,681  (5,084  (176

Net loss per share:


basic and diluted

  $(0.12 $(0.29 $(0.13 $(0.00
   Year ended January 1, 2012 
   Fourth
Quarter
  Third
Quarter
  Second
Quarter
  First
Quarter
 
   (in thousands, except per share data) 

Revenue

  $69,042   $57,556   $65,158   $69,435  

Gross profit

   48,868    40,906    47,141    49,394  

Consolidated net loss

   (1,981  (1,637  (2,869  (23,969

Net loss attributable to ordinary shareholders

   (1,981  (1,637  (2,869  (23,969

Net loss per share:


basic and diluted

  $(0.05 $(0.04 $(0.07 $(0.68


122


WRIGHT MEDICAL GROUP N.V.
NOTES TO CONSOLIDATED FINANCIAL STATEMENTS
(continued)

 2015
 
First
quarter
 
Second
quarter
 
Third
quarter
 
Fourth
quarter
Net sales$77,934
 $80,420
 $80,139
 $176,968
Cost of sales19,125
 21,635
 23,052
 55,443
Gross profit58,809
 58,785
 57,087
 121,525
Operating expenses:       
Selling, general and administrative82,199
 82,605
 85,997
 178,596
Research and development7,117
 7,957
 9,570
 15,211
Amortization of intangible assets2,614
 2,565
 2,562
 9,181
Total operating expenses91,930
 93,127
 98,129
 202,988
Operating loss$(33,121) $(34,342) $(41,042) $(81,463)
Net loss from continuing operations, net of tax$(46,248) $(37,306) $(62,650) $(92,155)
Income (loss) from discontinued operations, net of tax$(3,500) $(7,009) $(36,211) $(13,621)
Net income (loss)$(49,748) $(44,315) $(98,861) $(105,776)
Net loss, continuing operations per share, basic 1
(0.88) (0.71) (1.19) (0.90)
Net loss, continuing operations per share, diluted 1
(0.88) (0.71) (1.19) (0.90)
Net income (loss) per share, basic 1
$(0.95) $(0.84) $(1.87) $(1.03)
Net income (loss) per share, diluted 1
$(0.95) $(0.84) $(1.87) $(1.03)
___________________________
1
The prior quarter balances were converted to meet post-merger valuations as described within Note 13.
Our fourth quarter 2015 results of operations include results of the legacy Tornier business, effective upon October 1, 2015, the closing date of the Wright/Tornier merger.
Our 2015 operating loss included the following:
transaction and transition costs totaling $11.0 million, $12.1 million, $19.9 million, and $39.2 million during the first, second, third, and fourth quarters of 2015, respectively;
non-cash share-based compensation expense of $14.2 million in the year ended December 30, 2012 include costs incurredfourth quarter of 2015 associated with the accelerated vesting of legacy Wright's unvested awards outstanding upon the closing of the Wright/Tornier merger; and
amortization of inventory step-up of $11.4 million in the fourth quarter of 2015 associated with inventory acquired from the Wright/Tornier merger.
Our 2015 net loss from continuing operations included the following:
the after-tax effect of the above amounts;
the after-tax effects of our CVR mark-to-market adjustments of $13.5 million unrealized gain, $8.5 million unrealized gain, $14.6 million unrealized loss, and $0.3 million unrealized gain recognized in the first, second, third, and fourth quarters of 2015, respectively;
the after-tax effects of $25.2 million of charges related to special charges that are not included inthe write-off of unamortized debt discount and deferred financing costs associated with the settlement of 2017 Convertible Notes during the first quarter of 2012. The fourth quarter for 2015;
the year ended December 30, 2012 also includes the impactafter-tax effects of the OrthoHelix acquisition. The first quarter of the year ended January 1, 2012 includes a $22.0 million loss, net of $7.5 million of tax benefit, on the extinguishment of the Company’s notes payable, as well as $2.1 million ofnon-cash interest expense related to the amortization of the debt discount on our 2017 Convertible Notes and 8% interest2020 Convertible Notes totaling $4.5 million, $6.6 million, $6.8 million, and $6.9 million during the first, second, third, and fourth quarters of 2015, respectively;
the after-tax effects of our mark-to-market adjustments on derivative assets and liabilities totaling a $6.9 million gain, $0.4 million gain, $4.7 million gain, and $2.3 million loss recognized in the first, second, third, and fourth quarters of 2015, respectively; and
the after-tax effects of charges due to the fair value adjustment to contingent consideration totaled $0.2 million in the second quarter of 2015.

123


WRIGHT MEDICAL GROUP N.V.
NOTES TO CONSOLIDATED FINANCIAL STATEMENTS
(continued)


 2014
 First
quarter
 Second
quarter
 Third
quarter
 Fourth
quarter
Net sales$71,062
 $72,364
 $71,307
 $83,294
Cost of sales17,417
 20,006
 16,703
 19,097
Gross profit53,645
 52,358
 54,604
 64,197
Operating expenses:       
Selling, general and administrative68,648
 72,055
 66,926
 81,991
Research and development5,856
 6,799
 5,948
 6,360
Amortization of intangible assets2,187
 2,675
 2,379
 2,786
BioMimetic impairment charges


Total operating expenses76,691
 81,529
 75,253
 91,137
Operating income (loss)$(23,046) $(29,171) $(20,649) $(26,940)
Net income (loss), continuing operations, net of tax$(30,298) $(53,583) $(49,647) $(106,968)
Net income (loss), discontinued operations, net of tax$(122) $(2,643) $(12,160) $(4,262)
Net income (loss)$(30,420) $(56,226) $(61,807) $(111,230)
Net loss, continuing operations per share, basic 1
$(0.60) $(1.05) $(0.96) $(2.05)
Net loss, continuing operations per share, diluted 1
$(0.60) $(1.05) $(0.96) $(2.05)
Net income (loss) per share, basic 1
$(0.61) $(1.10) $(1.20) $(2.13)
Net income (loss) per share, diluted 1
$(0.61) $(1.10) $(1.20) $(2.13)
___________________________
1
The prior year balances were converted to meet post-merger valuations as described within Note 13.
Our 2014 operating loss included the following:
costs associated with distributor conversions and non-competes, for which we recognized $0.5 million, $0.7 million, $0.5 million, and $0.4 million during the first, second, third, and fourth quarters of 2014, respectively;
costs associated with due diligence, transaction and transition costs related to the notes payable, which is not includedBiotech, Solana, and OrthoPro acquisitions totaling $5.2 million, $4.6 million, $1.9 million, and $2.5 million during the first, second, third, and fourth quarters of 2014, respectively;
costs associated with a patent dispute settlement and management changes totaled $0.9 million and $1.2 million, respectively, in the otherthird quarter of 2014;
transition costs associated with the divestiture of the OrthoRecon business totaling $2.2 million, $1.3 million, $0.9 million, and $1.4 million during the first, second, third, and fourth quarters of 2011.

2014, respectively; and
Tornier merger costs totaled $11.9 million in the fourth quarter of 2014.
Our 2014 net loss from continuing operations included the following:
the after-tax effect of the above amounts;
the after-tax effects of our mark-to-market adjustments on derivative assets and liabilities totaling a $1.0 million loss recognized in the first and third quarters of 2014, respectively;
the after-tax effects of our CVR mark-to-market adjustments of $14.3 million unrealized loss, $18.5 million unrealized loss, $18.5 million unrealized loss, and $73.7 million unrealized loss recognized in the first, second, third, and fourth quarters of 2014, respectively; and
the after-tax effects of charges due to the fair value adjustment to contingent consideration associated with our acquisition of WG Healthcare totaled $1.8 million and $0.1 million in the third and fourth quarter of 2014, respectively.

124


WRIGHT MEDICAL GROUP N.V.
NOTES TO CONSOLIDATED FINANCIAL STATEMENTS
(continued)

In addition to those noted above, our 2014 net loss included a $24.3 million gain, on the sale of the OrthoRecon business recognized in the first quarter of 2014 within discontinued operations.
19. Segment and Geographic Data
Effective upon completion of the Wright/Tornier merger during the quarter ended December 27, 2015, our management, including our chief executive officer, who is our chief operating decision maker (CODM), managed our operations as one reportable segment, orthopaedic products, which includes the design, manufacture, marketing, and sales of extremities, biologics, large joint, and other products. Beginning in early 2016, new reportable segments will be established and will include U.S. Lower Extremities, U.S. Upper Extremities, International Extremities, and Large Joints. Information regarding profitability below the consolidated level was not available to be provided or reviewed by executive management, including our CODM, during the fourth quarter of 2015 following the merger.
Our principal geographic regions consist of the United States, Europe (which includes the Middle East and Africa), and Other (which principally represents Asia, Australia, Canada, and Latin America). Net sales attributed to each geographic region are based on the location in which the products were sold. Long-lived assets are those assets located in each geographic region.
Net sales by product line are as follows (in thousands):
 Fiscal year ended
 December 27, December 31, December 31,
 2015 2014 2013
U.S.     
Lower extremities$187,096
 $148,631
 $115,642
Upper extremities58,756
 15,311
 17,423
Biologics50,583
 45,494
 42,561
Sports med & other3,388
 2,641
 2,022
Total extremities & biologics299,823
 212,077
 177,648
Large joint18
 
 
Total U.S.$299,841
 $212,077
 $177,648
      
International     
Lower extremities$51,200
 $47,001
 $35,020
Upper extremities24,789
 11,312
 7,240
Biologics19,652
 20,590
 17,231
Sports med & other9,862
 7,047
 5,191
Total extremities & biologics105,503
 85,950
 64,682
Large joint10,117
 
 
Total International$115,620
 $85,950
 $64,682
      
Total$415,461
 $298,027
 $242,330
      

Net sales by geographic region are as follows (in thousands):
 Fiscal year ended
 December 27, December 31, December 31,
Net sales by geographic region:2015 2014 2013
United States$299,841
 $212,077
 $177,648
Europe72,779
 48,991
 31,210
Other42,841
 36,959
 33,472
Total$415,461
 $298,027
 $242,330

No single foreign country accounted for more than 10% of our total net sales during 2015, 2014, or 2013.

125


WRIGHT MEDICAL GROUP N.V.
NOTES TO CONSOLIDATED FINANCIAL STATEMENTS
(continued)

Long-lived tangible assets, including instruments and property, plant and equipment, are as follows (in thousands):
 Fiscal year ended
 December 27, December 31, December 31,
Long-Lived Assets:2015 2014 2013
United States$160,989
 $92,822
 $61,179
Europe72,643
 8,065
 6,581
Other7,137
 3,348
 2,755
Total$240,769
 $104,235
 $70,515

126


Item 9. Changes in and Disagreements Withwith Accountants on Accounting and Financial Disclosure.

Not applicable.


Item 9A. Controls and Procedures.

Evaluation of Disclosure Controls

Our President and Chief Executive Officer and Chief Financial Officer, referred to collectively herein as the Certifying Officers, are responsible for establishing and maintaining ourProcedures

We have established disclosure controls and procedures. The Certifying Officers have reviewedprocedures, as such term is defined in Rule 13a-15(e) under the Securities Exchange Act of 1934. Our disclosure controls and evaluatedprocedures are designed to ensure that material information relating to us, including our consolidated subsidiaries, is made known to our principal executive officer and principal financial officer by others within our organization. Under the supervision and with the participation of our management, including our principal executive officer and principal financial officer, we conducted an evaluation of the effectiveness of our disclosure controls and procedures (as defined in Rules 240.13a-15(e) and 240.15d-15(e) promulgated under the Securities Exchange Act of 1934, as amended) as of December 30, 2012. Based on27, 2015 to ensure that review and evaluation, which included inquiries made to certain of our other employees, the Certifying Officers have concluded that, as of the end of the period covered by this report, our disclosure controls and procedures, as designed and implemented, are effective in ensuring that information relating to Tornier required to be disclosed by us in the reports that we file or submit under the Securities Exchange Act of 1934 as amended, is recorded, processed, summarized, and reported within the time periods specified in the Securities and Exchange Commission’sSEC’s rules and forms, including ensuringforms. Disclosure controls and procedures include, without limitation, controls and procedures designed to ensure that such information required to be disclosed by us in the reports that we file or submit under the Securities Exchange Act of 1934 is accumulated and communicated to our management, including the Certifying Officers,our principal executive officer and principal financial officer as appropriate, to allow timely decisions regarding required disclosure.

Based on this evaluation, our principal executive officer and principal financial officer concluded that our disclosure controls and procedures were effective as of December 27, 2015.

Management’s Annual Report on Internal Control Over Financial Reporting

Our management is responsible for establishing and maintaining adequate internal control over financial reporting. Under the supervision and with the participation of our management, including our Presidentprincipal executive officer and Chief Executive Officer and Chief Financial Officer,principal financial officer, we conducted an evaluation of the effectiveness of our internal control over financial reporting as of December 30, 2012,27, 2015, based on the criteria established in Internal Control — Integrated Framework issuedset forth by the Committee of Sponsoring Organizations of the Treadway Commission (COSO). in Internal Control - Integrated Framework (2013) issued. Based on this evaluation, our management concluded that our internal control over financial reporting was effective as of December 30, 2012. This evaluation did not include the27, 2015. Our internal controls related to OrthoHelix, the acquisition of which was completed during 2012. OrthoHelix is a wholly owned subsidiary whose total assets and revenues represent 4.7% and 2.9%, respectively, of the related consolidatedcontrol over financial statement amountsreporting as of and for the year ended December 30, 2012 (see Note 3). The report of Ernst &Young27, 2015 has been audited by KPMG LLP, ouran independent registered public accounting firm, regardingas stated in their report, which is included herein.
In the fourth quarter of our fiscal year ended December 27, 2015, we completed the Wright/Tornier merger. The Wright/Tornier merger was structured as a triangular merger pursuant to which Wright Medical Group, Inc. (legacy Wright) merged with and into a wholly-owned subsidiary of Tornier N.V. (legacy Tornier). As a result of the merger, legacy Wright became a wholly-owned subsidiary of legacy Tornier, and legacy Tornier changed its name to Wright Medical Group N.V. The merger was accounted for as a “reverse acquisition” under US GAAP. Accordingly, legacy Wright, the legal acquiree, is considered the accounting acquirer, and legacy Tornier, the legal acquirer, is considered the accounting acquiree for accounting purposes under US GAAP. As such, legacy Wright’s historical results of operations replaced legacy Tornier’s historical results of operations for all periods prior to the merger.
In light of the “reverse acquisition” nature of the merger, the timing of the merger, the relatively low percentage that legacy Tornier's financial information represents on our consolidated financial information included in this report, and other factors, we determined that it was impracticable to provide a report on our internal control over financial reporting of all of our consolidated entities as of the end of our fiscal year ended December 27, 2015. Therefore, we have limited the scope of our management’s assessment of the effectiveness of our internal control over financial reporting in this report to legacy Wright and have excluded legacy Tornier. We believe this limitation of scope of our management’s assessment of the effectiveness of our internal control over financial reporting in this report is appropriate for several reasons, including the following:
the “reverse acquisition” nature of the merger, which resulted in legacy Wright, as the legal acquiree, being considered the accounting acquirer, and legacy Tornier, as the legal acquirer, being considered the accounting acquiree for accounting purposes under US GAAP;
the fact that legacy Wright’s historical results of operations replaced legacy Tornier’s historical results of operations for all periods prior to the merger;
the timing of the merger, which occurred during the last quarter of our fiscal year 2015, and therefore, did not give us sufficient time to fully incorporate the internal control over financial reporting of legacy Tornier into our internal control over financial reporting;
the financial information of legacy Tornier included in this report, which as a result of the October 1, 2015 acquisition date reflects only one quarter of financial information for legacy Tornier;

127


the fact that our executive management team and financial and accounting personnel are comprised largely of legacy Wright’s executive management team and financial and accounting personnel, including in “Part II. Item 8, Financial Statementsparticular the fact that our principal executive officer, principal financial officer and Supplementary Data” under “Reportprincipal accounting officer are the principal executive officer, principal financial officer and principal accounting officer of Independent Registered Public Accounting Firm.”

legacy Wright and not legacy Tornier; and

the internal control over financial reporting environment that existed post-merger, which largely represents the internal control over financial reporting environment of legacy Wright.
Accordingly, we believe that our management’s assessment of the effectiveness of internal control over financial reporting of legacy Wright, the legal acquiree, but accounting acquirer, is more relevant and meaningful than an assessment of the effectiveness of the internal control over financial reporting of legacy Tornier, the legal acquirer, but accounting acquiree.
Legacy Tornier's total assets, excluding goodwill and intangibles, which were subject to legacy Wright’s consolidation and business combination controls and thus would be included in management’s report on internal control over financial reporting, totaled 18% of total consolidated assets as of December 27, 2015. Legacy Tornier's net sales represented approximately 20% of our consolidated net sales as reflected in our consolidated financial statements for the fiscal year ended December 27, 2015.
Changes in Internal Control Over Financial Reporting

During the three monthsfourth quarter of the fiscal year ended December 30, 2012,27, 2015, there were no changes in our internal control over financial reporting that materially affected, or that are reasonably likely to materially affect, our internal control over financial reporting, except for the factchanges that we are currently inmade to begin to incorporate the processinternal control over financial reporting of evaluatinglegacy Tornier with and integrating OrthoHelix’sinto our internal controls into ours.

control over financial reporting.

Item 9B. Other Information.

On February 12, 2013, our board

Not applicable.

128

Table of directors, upon recommendation of our compensation committee, approved the material terms of the Tornier N.V. Employee Performance Incentive Compensation Plan for 2013. Under the terms of the plan, each participant, including Tornier’s executive officers, is eligible to earn an annual cash incentive payment based primarily on the achievement of corporate, and in some cases, divisional performance goals, and in the case of most participants, individual performance goals. The plan is designed to reward all eligible employees for achieving annual goals and to closely align their accomplishments with the interests of Tornier’s shareholders.

Each plan participant has an annual incentive target bonus under the plan, expressed as a percentage of his or her annual base salary. Each plan participant’s target bonus percentage is based on the individual’s position and level of responsibility within the company. The target bonus percentages, expressed as a percentage of annual base salary, for Tornier’s executive officers named in this report are as follows for 2013: David H. Mowry, President and Chief Executive Officer (80%); Shawn T McCormick, Chief Financial Officer (50%); Terry M. Rich, Senior Vice President, U.S. Commercial Operations (75%); Stéphan Epinette, Vice President, International Commercial Operations (40%); and Kevin M. Klemz, Vice President, Chief Legal Officer and Secretary (40%).

Each plan participant’s annual cash incentive bonus under the plan is determined by multiplying the participant’s target bonus amount (the participant’s target bonus percentage times his or her annual base salary) by a payout percentage equal to between 0% and 150% and determined based primarily on the achievement of corporate, and in some cases, divisional performance goals, and in the case of most participants, individual performance goals. The corporate performance goals under the plan for 2013 are based on Tornier’s adjusted revenue, adjusted EBITDA (defined as earnings before interest, taxes, depreciation and amortization) and adjusted free cash flow (defined as cash flows from operations less instrument investments and plant, property and equipment investments), in each case as adjusted for certain items, including changes to foreign currency exchange rates and items that are unusual and not reflective of normal operations, and as compared with pre-established target amounts.

Contents


PART III


Item 10. Directors, Executive Officers and Corporate Governance.


Directors and Executive Officers

The table below sets forth, as of February 25, 2013,10, 2016, certain information concerning our current directors and executive officers. No family relationships exist among any of our directors or executive officers.

Name

 Age 

Position

David H. Mowry

Robert J. Palmisano
 5071 President and Chief Executive Officer and Executive Director

Shawn T McCormick

David H. Mowry
 53Executive Vice President and Chief Operating Officer and Executive Director
Lance A. Berry43Senior Vice President and Chief Financial Officer
Robert P. Burrows69Senior Vice President, Supply Chain
James A. Lightman58Senior Vice President, General Counsel and Secretary
Gregory Morrison52Senior Vice President, Human Resources
J. Wesley Porter46Senior Vice President and Chief Compliance Officer
Julie D. Tracy54Senior Vice President and Chief Communications Officer
Jennifer S. Walker 48 Chief Financial OfficerSenior Vice President, Process Improvement

Stéphan Epinette

Terry M. Rich
 4248 Vice President, International Commercial OperationsUpper Extremities

Kevin M. Klemz

D. Cordell
 5150 Vice President, Chief Legal OfficerLower Extremities and SecretaryBiologics

Gregory Morrison

Peter S. Cooke
 4950 Global Vice President, Human ResourcesInternational

Terry M. Rich

William L. Griffin, Jr.
 4567 Senior Vice President U.S. Commercial Operationsand General Manager, BioMimetic

Julie B. Andrews

44Vice President and Chief Accounting Officer
SeanDavid D. CarneyStevens(1)(2)

 4362 Chairman and Non-Executive Director

Kevin C. O’Boyle(2)(3)

56Interim Vice Chairman, Non-Executive Director

Richard B. EmmittGary D. Blackford(3)

 6858 Non-Executive Director

Alain Tornier

Sean D. Carney(1)(4)
 6646 Non-Executive Director

Richard F. WallmanJohn L. Miclot(1)(3)(4)

 6156 Non-Executive Director

Kevin C. O’Boyle(3)
59Non-Executive Director
Amy S. Paul(1)
64Non-Executive Director
Richard F. Wallman(2)(3)
64Non-Executive Director
Elizabeth H. Weatherman(1)(2)(3)

 5255 Non-Executive Director

________________________
(1)Member of the compensation committee.
(2)(1)Member of the nominating, corporate governance and compliance committee.
(2)Member of the strategic transactions committee.
(3)Member of the audit committee.

(4)Member of the compensation committee.


The following is a biographical summary of the experience of our directors and executive officers:
Robert J. Palmisano was appointed our President and Chief Executive Officer and an executive director and member of our board of directors in October 2015 in connection with the Wright/Tornier merger. Mr. Palmisano has served as President and Chief Executive Officer of Wright Medical Group, Inc. since September 2011. Prior to joining Wright, Mr. Palmisano served as President and Chief Executive Officer of ev3 Inc., a global endovascular device company, from April 2008 to July 2010, when it was acquired by Covidien plc. From 2003 to 2007, Mr. Palmisano was President and Chief Executive Officer of IntraLase Corp. Before joining IntraLase, Mr. Palmisano was President and Chief Executive Officer of MacroChem Corporation from 2001 to 2003. Mr. Palmisano currently serves on the Providence College Board of Trustees. Mr. Palmisano previously served on the board of directors of ev3 Inc., Osteotech, Inc. and Abbott Medical Optics, Inc., all publicly held companies, and Bausch & Lomb, a privately held company. Under the terms of his employment agreement, we have agreed that Mr. Palmisano shall be nominated by our board of directors for election as an executive director and a member of our board of directors at each annual general meeting of shareholders. Mr. Palmisano’s qualifications to serve on our board of directors

129


include his day-to-day knowledge of our company and business due to his position as President and Chief Executive Officer, his experience serving on other officers:

public companies’ boards of directors, and his extensive business knowledge working with other public companies in the medical device industry.

David H. Mowrywasappointed our Executive Vice President and Chief Operating Officer in October 2015 in connection with the Wright/Tornier merger. Mr. Mowry has served as an executive director and member of our board of directors since June 2013. Mr. Mowry served as President and Chief Executive Officer of Tornier N.V. from November 2012 to October 2015. Mr. Mowry joined usTornier in July 2011 as Chief Operating Officer and inOfficer. In November 2012, he was appointed Interim President and Chief Executive Officer, on an interim basis, and effective as ofin February 21, 2013, he was appointed President and Chief Executive Officer on a non-interim basis. HeMr. Mowry has over 24 years of experience in the medical device industry. Prior to joining us, Mr. MowryTornier, he served from July 2010 to July 2011 as the President of the Global Neurovascular Division of Covidien plc, a global provider of healthcare products.products company, from July 2010 to July 2011. From January 2010 to July 2010, Mr. Mowryhe served as Senior Vice President and President, Worldwide Neurovascular of ev3 Inc., a global endovascular device company acquired by a wholly owned subsidiary of Covidien Group S.a.r.l in July 2010. From August 2007 to January 2010, Mr. Mowryhe served as Senior Vice President of Worldwide Operations of ev3. Prior to this position, Mr. Mowry wasev3 and as Vice President of Operations forof ev3 Neurovascular from November 2006 to October 2007. Before joining ev3, Mr. Mowry served as Vice President of Operations and Logistics at the Zimmer Spine division of Zimmer Holdings Inc., a reconstructive and spinal implants, trauma, and related orthopaedic surgical products company, from February 2002 to November 2006. Prior to Zimmer, Mr. Mowry was the President and Chief Operating Officer of HeartStent Corp., a medical device company. Mr. Mowry iscurrently serves on the board of directors of EndoChoice Holdings, Inc., a graduate of the United States Military Academy in West Point, New York with a degree in Engineering and Mathematics.

Shawn T McCormick joined us in September 2012 as Chief Financial Officer. He has over 20 years of experience in thepublicly held medical device industry. Priorcompany. Mr. Mowry’s qualifications to joining us, he servedsit on our board of directors include his extensive knowledge of our company and day-to-day operations in light of his current position as Executive Vice President and Chief Operating Officer and former position as President and Chief Executive Officer of Lutonix, Inc., a medical device company acquired by C. R. Bard, Inc.Tornier.

Lance A. Berry was appointed our Senior Vice President and Chief Financial Officer in December 2011, from April 2011 to February 2012. From January 2009 to July 2010,October 2015 in connection with the Wright/Tornier merger. Mr. McCormickBerry has served as Senior Vice President and Chief Financial Officer of ev3Wright Medical Group, Inc., a global medical device company acquired by Covidien plc since 2009. He joined Wright in July 2010. Prior to joining ev3, Mr. McCormick2002, and, until his appointment as Chief Financial Officer, served as Vice President and Corporate DevelopmentController. Prior to joining Wright, Mr. Berry served as audit manager with the Memphis, Tennessee office of Arthur Andersen LLP from 1995 to 2002. Mr. Berry is a certified public accountant, inactive.
Robert P. Burrows was appointed our Senior Vice President, Supply Chain in October 2015 in connection with the Wright/Tornier merger. Mr. Burrows joined Wright Medical Group, Inc. in August 2014 as Senior Vice President, Supply Chain. Prior to Wright, he served as Managing Principal of The On-Point Group, a privately held logistics and supply chain consultancy, from July 1994 through July 2014. While at Medtronic,On-Point, Mr. Burrows led over 40 client engagements, most recently as an operations consultant overseeing the transition and expansion of Wright’s extremities and biologics manufacturing.
James A. Lightman was appointed our Senior Vice President, General Counsel and Secretary in October 2015 in connection with the Wright/Tornier merger. Mr. Lightman joined Wright Medical Group, Inc., a global medical device company, where he was responsible for leading Medtronic’s worldwide business development activities in December 2011 as Senior Vice President, General Counsel and previously hadSecretary. Prior to joining Wright, Mr. Lightman served in key corporatevarious legal and divisional financial leadership roles withinexecutive positions with Bausch & Lomb Incorporated, a privately held eye contact company. From February 2008 to November 2009, Mr. Lightman served as Vice President and Assistant General Counsel of Bausch & Lomb, and most recently held the Medtronic organization. Mr. McCormick joined Medtronic in July 1992 and held various finance and leadership positions during his tenure.position of Vice President, Global Sales Operations until August 2011. From JulyJune 2007 to MayFebruary 2008, he served as Vice President Corporate Technology and New VenturesGeneral Counsel of Medtronic. From July 2002 to July 2007, he was Vice President, Finance for Medtronic’s Spinal, Biologics and Navigation business. Prior to that, Mr. McCormick held various other positions with Medtronic, including Corporate Development Director, Principal Corporate Development Associate, Manager, Financial Analysis, Senior Financial Analyst and Senior Auditor.Eyeonics, Inc. Prior to joining Medtronic, he spent almost four years with the public accounting firm KPMG Peat Marwick.Eyeonics, Mr. McCormick earned his Master of Business Administration from the University of Minnesota’s Carlson School of Management and his Bachelor of Science in Accounting from Arizona State University. He is a Certified Public Accountant.

Stéphan Epinette joined us in December 2008 and leads our international commercial operations (primarily Europe, Asia Pacific and Latin America) and large joints business as Vice President of International Commercial Operations. Mr. Epinette has over 19 years of experience in the orthopaedic medical device industry. Prior to joining us, he served in various leadership roles with Stryker Corporation, a medical device and equipment company, in its MedSurg and Orthopaedic divisions in France, the United States and Switzerland from 1993 to December 2008, including as Business Unit Director France from 2005 to 2008. His past functions at Stryker Corporation also included Marketing Director MedSurg EMEA, Assistant to the EMEA President and Director of Business Development & Market Intelligence EMEA. Mr. Epinette earned a Master’s Degree in Health Economics from Sciences Politiques, Paris, a Master’s Degree in International Business from Paris University XII and a Bachelor of Arts from EBMS Barcelona. He also attended the INSEAD executive course in Finance and in Marketing.

Kevin M. Klemz joined us in September 2010 as Vice President, Chief Legal Officer and Secretary. Prior to joining us, Mr. KlemzLightman served as Senior Vice President Secretary and Chief Legal Officer at ev3 Inc.General Counsel of IntraLase Corp. from August 2007February 2005 to August 2010, and asApril 2007.

Gregory Morrison was appointed our Senior Vice President, SecretaryHuman Resources in October 2015 in connection with the Wright/Tornier merger. Mr. Morrison served as Senior Vice President, Global Human Resources and Chief Legal Officer at ev3 Inc.HPMS (High Performance Management System) of Tornier from January 20072014 to August 2007. Prior to joining ev3 Inc., Mr. Klemz was a partner in the law firm Oppenheimer Wolff & Donnelly LLP, where he was a corporate lawyer for approximately 20 years. Mr. Klemz has a Bachelor of Arts in Business Administration from Hamline UniversityOctober 2015 and a Juris Doctor from William Mitchell College of Law.

Gregory Morrison joined us in December 2010served as Global Vice President, Human Resources.Resources from December 2010 to January 2014. Prior to joining us,Tornier, Mr. Morrison served as Senior Vice President, Human Resources atof ev3 Inc., a global endovascular device company acquired by Covidien plc in July 2010, from August 2007 to December 2010, and as Vice President, Human Resources from May 2002 to August 2007. Prior to joining ev3, Inc., Mr. Morrison served as Vice President of Organizational Effectiveness forof Thomson Legal & Regulatory from March 1999 to February 2002 and Vice President of Global Human Resources forof Schneider Worldwide, which was acquired by Boston Scientific Corporation, from 1988 to March 1999.


130


J. Wesley Porter was appointed our Senior Vice President and Chief Compliance Officer in October 2015 in connection with the Wright/Tornier merger. Mr. Morrison hasPorter joined Wright Medical Group, Inc. in July 2014 as Vice President, Compliance and became Senior Vice President and Chief Compliance Officer in October 2014. Prior to joining Wright, Mr. Porter served as Vice President, Deputy Compliance Officer of Allergan, Inc. from September 2012 to February 2014, Vice President, Ethics and Compliance of CareFusion Corp. from June 2009 to September 2012, and Senior Corporate Counsel, Compliance, HIPAA and Reimbursement of Smith & Nephew, Inc. from April 2006 to May 2009.
Julie D. Tracy was appointed our Senior Vice President and Chief Communications Officer in October 2015 in connection with the Wright/Tornier merger. Ms. Tracy served as Senior Vice President, Chief Communications Officer of Wright Medical Group, Inc. from October 2011 to October 2015. Prior to joining Wright, Ms. Tracy served as Chief Communications Officer of Epocrates, Inc., a Bachelorpublicly held company that sold physician platforms for clinical content, practice tools and health industry engagement, from March 2011 to October 2011. From January 2008 to July 2010, Ms. Tracy was Senior Vice President and Chief Communications Officer of Artsev3 Inc. Prior to ev3, Ms. Tracy held marketing and investor relations positions at Kyphon Inc. from January 2003 to November 2007 and Thoratec Corporation from January 1998 to January 2003. Ms. Tracy currently serves as a member of the Board of Directors for the National Investor Relations Institute, the professional association of corporate officers and investor relations consultants responsible for communication among corporate management, shareholders, securities analysts and other financial community constituents.
Jennifer S. Walker was appointed our Senior Vice President, Process Improvement in EnglishOctober 2015 in connection with the Wright/Tornier merger. Ms. Walker served as Senior Vice President, Process Improvement of Wright Medical Group, Inc. from December 2011 to October 2015 and CommunicationsVice President and Corporate Controller from North Adams State CollegeDecember 2009 to December 2011. Since joining Wright’s financial organization in 1993, she served as Assistant Controller, Director, Financial Reporting & Risk Management, Director, Corporate Tax & Risk Management, and Tax Manager of Wright. Prior to joining Wright, Ms. Walker was a Master of Arts in Corporate Communications from Fairfield University.senior tax accountant with Arthur Andersen LLP. Ms. Walker is a certified public accountant.

Terry M. Rich joined us was appointed our President, Upper Extremities in March 2012October 2015 in connection with the Wright/Tornier merger. Mr. Rich served as Senior Vice President, U.S. Commercial Operations.Operations of Tornier from March 2012 to October 2015. Prior to joining us,Tornier, Mr. Rich served as Senior Vice President of Sales - West of NuVasive, Inc., a medical device company focused on developing minimally disruptive surgical products and procedures for the spine. Prior to such position, Mr. Rich served as Area Vice President, Sales Director and Area Business Manager of NuVasive Inc. from December 2005. Prior to joining NuVasive, Mr. Rich served as Partner/Area Sales Manager of Bay Area Spine of DePuy Spine, Inc., a spine company and subsidiary of Johnson & Johnson, from July 2004 to December 2005.
Kevin D. Cordell was appointed our President, Lower Extremities and Biologics in October 2015 in connection with the Wright/Tornier merger. Mr. RichCordell served as President, U.S. Extremities of Wright Medical Group, Inc. from September 2014 to October 2015. Prior to joining Wright, Mr. Cordell served as Vice President of Sales for the GI Solutions business at Covidien plc, a global healthcare products company, from May 2012 to September 2014. While at Covidien, he served as Vice President of Sales and Global Marketing for its Peripheral Vascular business from July 2010 to May 2012. He joined Covidien in July 2010 through the acquisition of ev3 Inc., a global endovascular device company, where he served as Vice President of U.S. Sales from January 2009 to July 2010. Prior to ev3, Mr. Cordell served as Vice President, Global Sales of FoxHollow Technologies, Inc. from March 2007 to October 2007. Earlier in his career, Mr. Cordell held various positions of increasing responsibility for Johnson & Johnson’s Cordis Cardiology and Centocor companies. Mr. Cordell serves on the board of directors of TissueGen, Inc., a privately-held developer of biodegradable polymer technology for implantable drug delivery.
Peter S. Cooke was appointed our President, International in October 2015 in connection with the Wright/Tornier merger. Mr. Cooke served as President, International of Wright Medical Group, Inc. from January 2014 to October 2015 and served as Senior Vice President, International from January 2013 to January 2014. Prior to joining Wright, Mr. Cooke served as Vice President and General Manager, Vascular Therapies Emerging Markets of Covidien plc, a global healthcare products company, from 2010 to January 2013. Prior to Covidien, Mr. Cooke served in various general management roles for ev3 Inc., a global endovascular device company acquired by Covidien in July 2010, including Vice President and General Manager, International from July 2008 to July 2010; Vice President, General Manager, International from November 2006 to June 2008; Vice President, Sales International from January 2005 until November 2006; and Regional Director Asia Pacific and China from February 2003 until January 2005. Prior to ev3, Mr. Cooke spent eleven years at Guidant Corporation, three years at Baxter Healthcare Corporation and two years at St. Jude Medical, Inc.

131


William L. Griffin, Jr. was appointed our Senior Vice President and General Manager, BioMimetic in October 2015 in connection with the Wright/Tornier merger. Mr. Griffin served as Senior Vice President and General Manager, BioMimetic Therapeutics of Wright Medical Group, Inc. from March 2013 to October 2015 and Senior Vice President, Global Operations from 2008 to March 2013. Prior to joining Wright, Mr. Griffin had global responsibility for all operations at Smith & Nephew, Inc. since 2002. From 1997 until 2002, he held positions at Johnson & Johnson Medical, including serving as its Vice President and General Manager. Mr. Griffin began his career in the medical device industry with Becton, Dickinson and Company where he spent 23 years with the final position of Vice President of Global Supply Chain Services.
Julie B. Andrews was appointed our Vice President and Chief Accounting Officer in October 2015 in connection with the Wright/Tornier merger. Ms. Andrews served as Vice President and Chief Accounting Officer of Wright Medical Group, Inc. from May 2012 to October 2015. From February 1998 to May 2012, Ms. Andrews held numerous key financial positions with Medtronic, Inc., a global medical device company. Most recently, Ms. Andrews served as Medtronic’s Vice President, Finance for its spinal and biologics business units. Ms. Andrews has significant accounting, finance, and business skills as well as global experience, having held positions in worldwide planning and analysis in Medtronic Sofamor Danek and in Medtronic’s spinal and biologics business. Prior to joining Medtronic, Ms. Andrews worked with Thomas & Betts Corporation in Memphis, Tennessee and Thomas Havey, LLP in Chicago, Illinois.
David D. Stevens joined our board of directors as a Bachelornon-executive director in October 2015 in connection with the Wright/Tornier merger. Mr. Stevens serves as our Chairman of Labor Relationsthe Board. Mr. Stevens was a member of the board of directors of Wright Medical Group, Inc. from Rutgers College, Rutgers University.2004 to 2015 and served as Chairman of the Board from 2009 to October 2015 and interim Chief Executive Officer of Wright from April 2011 to September 2011. He has been a private investor since 2006. Mr. Stevens served as Chief Executive Officer of Accredo Health Group, Inc., a subsidiary of Medco Health Solutions, Inc., from 2005 to 2006. He was Chairman of the Board and Chief Executive Officer of Accredo Health, Inc. from 1996 to 2005, and was President and Chief Operating Officer of the predecessor companies of Accredo Health from their inception in 1983 until 1996. He serves on the board of directors of Allscripts Healthcare Solutions, Inc., a publicly held company. He previously served on the board of directors of Viasystems Group, Inc., a publicly held company, from 2012 until May 2015 when it was acquired by TTM Technologies, Inc., Medco Health Solutions, Inc., a publicly held company, from 2006 until 2012 when it was acquired by Express Scripts Holding Company, and Thomas & Betts Corporation, a publicly held company, from 2004 to 2012 when it was acquired by ABB Ltd. Mr. Steven’s qualifications to serve on our board of directors include his extensive experience serving as a chief executive officer, including as interim chief executive officer of Wright, his close familiarity with our business, and his prior experience as a director of Wright.

Gary D. Blackford joined our board of directors as a non-executive director in October 2015 in connection with the Wright/Tornier merger. Mr. Blackford was a member of the board of directors of Wright Medical Group, Inc. from 2008 to 2015. From 2002 to February 2015, Mr. Blackford served as President and Chief Executive Officer and a member of the board of directors of Universal Hospital Services, Inc., a provider of medical technology outsourcing and services to the health care industry, and from 2007 to February 2015, served as Chairman of the Board. From 2001 to 2002, Mr. Blackford served as Chief Executive Officer of Curative Health Services Inc. From 1999 to 2001, Mr. Blackford served as Chief Executive Officer of ShopforSchool, Inc. He served as Chief Operating Officer for Value Rx from 1995 to 1998 and Chief Operating Officer and Chief Financial Officer of MedIntel Systems Corporation from 1993 to 1994. Mr. Blackford serves on the board of directors of Halyard Health, Inc., a publicly held company. Mr. Blackford previously served on the board of directors of Compex Technologies, Inc., a publicly held medical device company, from 2005 until its acquisition by Encore Medical Corporation in 2006. Mr. Blackford’s qualifications to serve as a member of our board of directors include his experience as a chief executive officer and director of a health care services company and other companies and as a director of other public companies in the healthcare industry, his extensive experience leading healthcare companies, and his prior experience as a director of Wright.
Sean D. Carney is one of our directors and has served as a non-executive director and member of our board of directors since July 2006. Mr. Carney servesserved as our Chairman.Chairman of the Board of Tornier from May 2010 to October 2015. Mr. Carney was appointed as a director of Tornier in connection with the securityholders’ agreement that weTornier entered into with certain holders of our securities. Mr. Carney became Chairman of our board of directors in May 2010.its shareholders. For more information regarding the securityholders’ agreement, please refer to the discussion below under “—“-Board Structure and Composition.Composition.” Since 1996, Mr. Carney has been employed by Warburg Pincus LLC, a private equity firm, and has served as a Member and Managing Director of Warburg Pincus LLC and a General Partner of Warburg Pincus & Co. since January 2001. Warburg Pincus LLC and Warburg Pincus & Co. are part of the Warburg Pincus entities collectively referred to elsewhere in this report as Warburg Pincus, a principal stockholdershareholder that owns approximately 44.3%6.1% of our outstanding ordinary shares as of February 15, 2013.10, 2016. Prior to joining Warburg Pincus, Mr. Carney formerly served on the boardwas a consultant at McKinsey & Company, Inc., a

132


management consulting company. He is also a member of the board of directors of Bausch & Lomb Incorporated and several other private companies. During the past five years, Mr. Carney previously served on the board of directors of DexCom, Inc., a publicly held medical device company.company, Arch Capital Group Ltd., a publicly held company, MBIA Inc., a publicly held company, and several privately held companies. Mr. Carney receivedCarney’s qualifications to serve as a Mastermember of Business Administration from Harvard Business School and a Bachelorour board of Arts from Harvard College. Mr. Carney’sdirectors include his substantial experience as an investor and director in medical device companies, his experience as a public company director, and his experience evaluating financial results have ledresults.
John L. Miclot joined our board of directors as a non-executive director in October 2015 in connection with the Wright/Tornier merger. Mr. Miclot was a member of the board of directors of Wright Medical Group, Inc. from 2007 to 2015. Mr. Miclot has served as President and Chief Executive Officer and a member of the conclusionboard of directors of LinguaFlex, Inc., a medical device company focused on treatment of sleep disordered breathing, since August 2015. From December 2011 to December 2014, he served as Chief Executive Officer and a member of the board of directors of Tengion Inc., a publicly held company that focused on organ and cell regeneration. Prior to joining Tengion, Mr. Miclot was an Executive-in Residence at Warburg Pincus, LLC. From 2008 to 2010, he should servewas President and Chief Executive Officer of CCS Medical, Inc., a provider of products and services for patients with chronic diseases. From 2003 until 2008, he served as President and Chief Executive Officer of Respironics, Inc., a provider of sleep and respiratory products, and prior to such time, served in various positions at Respironics, Inc. from 1998 to 2003, including Chief Strategic Officer and President of the Homecare Division. From 1995 to 1998, he served as Senior Vice President, Sales and Marketing of Healthdyne Technologies, Inc., a medical device company that was acquired by Respironics, Inc. in 1998. Mr. Miclot spent the early part of his medical career at DeRoyal Industries, Inc., Baxter International Inc., Ohmeda Medical, Inc. and Medix Inc. Mr. Miclot serves on the board of directors of Dentsply International, a publicly held company, and serves as Chairman and a member of the board of directors of Breathe Technologies, Inc., a privately held company. Mr. Miclot also serves as a director at this timeof the Pittsburgh Zoo and PPG Aquarium, charitable and educational institutions, serves on the University of Iowa Tippie College of Business board of advisors and serves as an industrial advisor to EQT Partners, an investment company. Mr. Miclot previously served on the board of directors of ev3 Inc., a global endovascular device company, prior to the sale of the company in light2010. Mr. Miclot’s qualifications to serve on our board of our businessdirectors include his substantial experience as a chief executive officer of several medical device companies, his deep knowledge of the medical device industry, and structure.his prior experience as a director of Wright.

Kevin C. O’Boyle is one of our directors and has served as a non-executive director and member of our board of directors since June 2010. In November 2012, Mr. O’Boyle was appointed as Interim Vice Chairman.Chairman of Tornier, a position he held for about a year. From December 2010 to October 2011, Mr. O’Boyle served as Senior Vice President and Chief Financial Officer of Advanced BioHealing Inc., a medical device company which was acquired by Shire PLCplc in May 2011, and from June 2011 to May 2012, served as Senior Vice President of Business Operations.2011. From January 2003 until December 2009, Mr. O’Boyle served as the Chief Financial Officer of NuVasive, Inc., a medical device orthopedics company that completed its initial public offeringspecializing in May 2004.spinal disorders. Prior to that time, Mr. O’Boyle served in various positions during his six years with ChromaVision Medical Systems, Inc., a publicly held medical device company specializing in the oncology market, including as its Chief Financial Officer and Chief Operating Officer. Mr. O’Boyle also held various positions during his seven years with Albert Fisher North America, Inc., a publicly held international food company, including Chief Financial Officer and Senior Vice President of Operations. Mr. O’Boyle currently serves on the board of

directors of GenMark Diagnostics, Inc., ZeltiqZELTIQ Aesthetics, Inc., and Durata Therapeutics,Sientra, Inc., all publicly tradedheld companies. Mr. O’Boyle is a Certified Public Accountant and received a Bachelorpreviously served on the board of Sciencedirectors of Durata Therapeutics, Inc. until its acquisition by Actavis plc in Accounting from the Rochester InstituteNovember 2014. Mr. O’Boyle’s qualifications to serve on our board of Technology and successfully completed the Executive Management Program at the University of California Los Angeles, John E. Anderson Graduate Business School. Mr. O’Boyle’sdirectors includes his executive experience in the healthcare industry, his experience with companies during their transition from being privately held to publicly reportingheld, and his financial and accounting expertise have ledexpertise.

Amy S. Paul joined our board of directors to the conclusion that Mr. O’Boyle should serve as a non-executive director and on our audit committee at this time in light of our business and structure.

Richard B. Emmitt is one of our directors and has served as a director since July 2006. Mr. Emmitt was appointed as a directorOctober 2015 in connection with the securityholders’ agreement that we entered intoWright/Tornier merger. Ms. Paul was a member of the board of directors of Wright Medical Group, Inc. from 2008 to 2015. Ms. Paul retired in 2008 following a 26-year career with certain holders of our securities. For more information regarding the securityholders’ agreement, please refer to the discussion below under “—Board Structure and Composition.” Mr. Emmitt served asC.R. Bard, Inc., a General Partner of The Vertical Group L.P., an investment management and venture capital firm focused on the medical device company, most recently serving as the Group Vice President-International since 2003. She served in various positions at C.R. Bard, Inc. from 1982 to 2003, including President of Bard Access Systems, Inc., President of Bard Endoscopic Technologies, Vice President and biotechnology industries, from its inception in 1989 through December 2007. Commencing in January 2008, Mr. Emmitt has been a Member andBusiness Manager of The Vertical Group G.P.Bard Ventures, Vice President of Marketing of Bard Cardiopulmonary Division, Marketing Manager for Davol Inc., LLC, which controls The Vertical Group L.P. Mr. Emmitt currentlyand Senior Product Manager for Davol Inc. Ms. Paul serves on the board of directors of several privatelyDerma Sciences, Inc., a publicly held companies. During the past five years, Mr. Emmittcompany. Ms. Paul previously served on the board of directors of ev3Viking Systems, Inc., a publicly held company, until October 2012 when it was acquired by Conmed Corporation, and American Medical Systems Holdings, Inc. Mr. Emmitt holdswas a Mastercommissioner of Business Administrationthe Northwest Commission on Colleges and Universities from 2010 to 2013. Ms. Paul serves on the Rutgers School of Business and a Bachelor of Arts from Bucknell University. Mr. Emmitt’s substantial experience as an investor and board member of numerous medical device companies ranging from development stage private companiesPresident’s Innovation Network at Westminster College. Ms. Paul’s qualifications to public companies with substantial revenues has ledserve on our board of directors toinclude her over three decades of experience in the conclusionmedical device industry, including having served in various executive roles with responsibilities that he should serveinclude international and divisional operations as


133


well as marketing and sales functions, her experience as a director at this timeof another public company in lightthe healthcare industry, and her prior experience as a director of our business and structure.Wright.
Richard F. Wallman

Alain Tornier is one of our directors and has served as a non-executive director since May 1976. Mr. Tornier assumed a leadership role in our predecessor entity in 1976, following the deathand member of his father, René Tornier, our founder. Mr. Tornier later served as our President and Chief Executive Officer until our acquisition by an investor group in September 2006, when he retired. Mr. Tornier holds a Master of Sciences degree from Grenoble University. Mr. Tornier’s significant experience in the global orthopaedics industry and deep understanding of our company’s history and operations have led our board of directors to the conclusion that he should serve as a director at this time in light of our business and structure.

Richard F. Wallman is one of our directors and has served as a director since December 2008. From 1995 through his retirement in 2003, Mr. Wallman served as the Senior Vice President and Chief Financial Officer of Honeywell International, Inc., a diversified technology company, and AlliedSignal, Inc., a diversified technology company (prior to its merger with Honeywell International, Inc.). Prior to joining AlliedSignal, Inc. as Chief Financial Officer,, Mr. Wallman served as Controller of International Business Machines Corporation. In addition to serving as one of our directors, Mr. Wallman is also a member ofserves on the board of directors of Charles River Laboratories International, Inc., Convergys Corporation, Dana Holding CorporationExtended Stay America, Inc. and its wholly subsidiary ESH Hospitality, Inc., and Roper Industries,Technologies, Inc., all publicly held companies. During the past five years, Mr. Wallman previously served on the board of directors of Ariba, Inc., ExpressJet Holdings Inc. and Avaya Inc., as well as auto suppliers LearDana Holding Corporation, and Hayes Lemmerz International, Inc., allboth publicly held companies. Mr. Wallman holds a MasterWallman’s qualifications to serve on our board of Business Administration from the University of Chicago Booth School of Business with concentrations in finance and accounting and a Bachelor of Science in Electrical Engineering from Vanderbilt University. Mr. Wallman’sdirectors include his prior public company experience, including as Chief Financial Officer of Honeywell, his significant public company director experience, and his financial experience and expertise, have ledexpertise.

Elizabeth H. Weatherman has served as a non-executive director and member of our board of directors to the conclusion that he should serve as a director at this time in light of our business and structure.

Elizabeth H. Weatherman is one of our directors and has served as a director since July 2006. Ms. Weatherman was appointed as a director of Tornier in connection with the securityholders’ agreement that weTornier entered into with certain holders of our securities.shareholders. For more information regarding the securityholders’ agreement, please refer to the discussion below under “—Board Structure and Composition.Composition.” Ms. Weatherman is a General Partner of Warburg Pincus & Co., a private equity firm, a Managing Director of Warburg Pincus LLC and a member of the firm’s Executive Management Group. Ms. Weatherman joined Warburg Pincus in 1988 and is currently responsible forprimarily focused on the firm’s U.S. healthcare investment activities. Warburg Pincus LLC and Warburg Pincus & Co. are part of the Warburg Pincus entities collectively referred to elsewhere in this report as Warburg Pincus, a principal stockholdershareholder that owns approximately 44.3%6.1% of our outstanding ordinary shares as of February 15, 2013.10, 2016. Ms. Weatherman currently serves on the board of directors of Bausch & Lomb Incorporated and several other privately held companies. During the past five years, Ms. Weatherman previously served on the boards of directors of several publicly held companies, primarily in the medical device industry, including ev3 Inc., Wright Medical Group, Inc., and Kyphon Inc., and several privately held companies. Ms. Weatherman’s qualifications to serve on our board of directors of ev3 Inc., American Medical Systems Holdings, Inc. and Kyphon, Inc. Ms. Weatherman earned a Master of Business Administration from the Stanford Graduate School of Business and a Bachelor of Arts from Mount Holyoke College. Ms. Weatherman’sinclude her extensive experience as a director of several public and private companies in the medical device industry has led our board of directors to the conclusion that she should serve as a director at this time in light of our business and structure.industry.

Board Structure and Composition

We have a one-tier board structure. Our articles of association provide that the number of members of our board of directors will be determined by our board of directors, provided that at all times our board of directors shallwill be comprised of at least one executive director and two non-executive directors. Our board of directors currently consists of sixten directors, alltwo of whom are executive directors and eight of whom are non-executive directors. As a result of resignation of Douglas W. Kohrs, our former President, Chief Executive Officer and Executive Director, in November 2012, the executive director position is currently vacant. Under applicable Dutch law, the vacancy can only be filled by a resolution of the general meeting of shareholders from a binding nomination drawn up by the board of directors. In November 2012, upon the resignation of Mr. Kohrs, the board of directors delegated to our then interim President and Chief Executive Officer, David H. Mowry, the duties and responsibilities of our executive director. Prior to our next annual general meeting of shareholders, the board of directors, upon a recommendation of our nominating, corporate governance and compliance committee, intends to make a binding nomination of an individual, who likely will be Mr. Mowry, to fill the open vacant executive director position.

All eight of our non-executive directors except Mr. Tornier, are “independent directors” under the Listing Rules of the NASDAQ Global Select Stock Market. Therefore, five of our current six directors are independent directors. Independence requirements for service on our audit committee are discussed below under “—Board Committees—Audit Committee.Committeeand independence requirements for service on our compensation committee are discussed below under “—Compensation Committee.” All of our non-executive directors, other than Mr. WallmanCarney and Mr. O’BoyleMs. Weatherman, are independent under the independence definition in the Dutch Corporate Governance Code. Because we currently comply with the NASDAQ corporate governance requirements, the Dutch Corporate Governance Code requirement that a majority of our directors be independent within the meaning of the Dutch Corporate Governance Code does not apply provided we explain such deviation in our annual report.

Our board of directors and our shareholders each have approved that our board of directors be divided into three classes, as nearly equal in number as possible, with each director serving a three-year term and one class being elected at each year’s annual general meeting of shareholders. Messrs. Wallman and O’Boyle are in the class of directors whose term expires at the 2013 annual general meeting of our shareholders. Mr. Tornier and Ms. Weatherman are in the class of directors whose term expires at the 2014 annual general meeting of our shareholders. Messrs. Carney and Emmitt are in the class of directors whose term expires at the 2015 annual general meeting of our shareholders. At each annual general meeting of our shareholders, successors to the class of directors whose term expires at such meeting will be elected to serve for three-year terms or until their respective successors are elected and qualified.

The general meeting of shareholders appoints the members of our board of directors, subject to a binding nomination of theour board of directors in accordance with the relevant provisions of the Dutch Civil Code. Our board of directors will makemakes the binding nomination based on a recommendation of our nominating, corporate governance and compliance committee. A nominee is deemedIf the list of candidates contains one candidate for each open position to be filled, such candidate shall be appointed unlessby the general meeting of shareholders opposesunless the usebinding nature of the nominations by our board of directors is set aside by the general meeting of shareholders. The binding nomination procedurenature of nomination(s) by our board of directors can only be set aside by a resolution passed with the affirmative vote of at least two-thirds majority of the votes cast which votes also representat an annual or extraordinary general meeting of shareholders, provided such two-thirds vote constitutes more than 50%one-half of our issued share capital. In such case, a new meeting is called to fill the vacancies forat which the binding nominations were initially made. Nominees for appointment are presented by the board of directors. These nominations are not binding. The resolution for appointment in such meetingof a member of our board of directors shall require the affirmative votea majority of at least two-thirds majority of the votes cast representing more than 50%one-half of our issued share capital.

If our board of directors fails to use its right to submit a binding nomination, the general meeting of shareholders may appoint members of our board of directors with a resolution passed with the affirmative vote of at least a two-thirds majority of the votes cast, representing more than 50% of our issued share capital.

A resolution of the general meeting of shareholders to suspend a member of our board of directors requires the affirmative vote of an absolute majority of the votes cast. A resolution of the general meeting of shareholders to suspend or

134


dismiss members of our board of directors, other than pursuant to a proposal by our board of directors, requires a majority of at least two-thirds of the votes cast, representing more than 50%one-half of our issued share capital.

Pursuant

With respect to Board composition, under the terms of his employment agreement, we have agreed that Mr. Palmisano shall be nominated by our board of directors for election as an executive director and a member of our board of directors at each annual general meeting of shareholders. In addition, pursuant to a securityholders’ agreement dated July 18, 2006, byamong our company and among Tornier N.V., formerly known as TMG B.V.,certain of our shareholders, including TMG Holdings Coöperatief V.A.U.A. (TMG), Vertical Fund I, L.P., Vertical Fund II, L.P., KCH Stockholm AB, Mr. Tornier, WP Bermuda and certain other shareholders at the time, and by subsequent joinder agreements, additional shareholders, which agreement was amended on August 27, 2010, TMG has the right to designate three directors to be nominated to our board of directors for so long as TMG beneficially owns at least 25% of our outstanding ordinary shares, two directors for so long as TMG beneficially owns at least 10% but less than 25% of our outstanding ordinary shares and one director for so long as TMG beneficially owns at least 5% but less than 10% of our outstanding ordinary shares, and we haveshares. We agreed to use our reasonable best efforts to cause the TMG designees to be elected.

As of February 10, 2016, TMG beneficially owned 6.1% of our outstanding ordinary shares. Mr. Carney and Ms. Weatherman are our current directors who are designees of TMG.

Under our articles of association, our internal rules for the board of directors, and Dutch law, the members of theour board of directors are collectively responsible for theour management, general, and financial affairs and policy and strategy of

our company.strategy. Our executive director historically has been our Chief Executive Officer, who isdirectors are primarily responsible for managing our day-to-day affairs as well as other responsibilities that have been delegated to theour executive directordirectors in accordance with our articles of association and our internal rules for the board of directors. In November 2012, upon the resignation of our former President and Chief Executive Officer, the board of directors delegated to our then interim President and Chief Executive Officer, Mr. Mowry, the duties and responsibilities of our executive director. We intend to nominate an individual to fill the vacant executive director position prior to our next annual general meeting of shareholders. Our non-executive directors supervise our Chief Executive Officerexecutive directors and our general affairs and provide general advice to our Chief Executive Officer.them. In performing their duties, our non-executive directors are guided by the interests of our company and, shall, within the boundaries set by relevant Dutch law, must take into account the relevant interests of our stakeholders. The internal affairs of theour board of directors are governed by our internal rules for the board of directors, a copy of which is available on the Investor Relations—Corporate Information—Governance Documents & Charters section of our corporate website atwww.tornier.comwww.wright.com.

Mr. CarneyStevens serves as Chairman and Mr. O’Boyle serves as Interim Viceour Chairman. The duties and responsibilities of the Chairman include, among others: determining the agenda and chairing the meetings of theour board of directors, managing theour board of directors to ensure that it operates effectively, ensuring that the members of theour board of directors receive accurate, timely and clear information, encouraging active engagement by all the members of theour board of directors, promoting effective relationships and open communication between non-executive directors and the executive directordirectors, and monitoring effective implementation of our board of directors decisions. The duties and responsibilities of the Interim Vice Chairman include, among others, serving as liaison between our President and Chief Executive Officer and the non-executive directors, coordinating a board evaluation of the performance of the President and Chief Executive Officer, coordinating feedback among the non-executive directors and the President and Chief Executive Officer, and in the absence of the Chairman, performing the duties and responsibilities of the Chairman. The duties of the Interim Vice Chairman also included leading, together with the nominating, corporate governance and compliance committee, the search process for a non-interim President and Chief Executive Officer and coordinating such process with the other members of the nominating, corporate governance and compliance committee.

All regular meetings of our board of directors are scheduled to be held in the Netherlands. Each director has the right to cast one vote and may be represented at a meeting of our board of directors by a fellow director. Our board of directors may pass resolutions only if a majority of the directors is present at the meeting and all resolutions must be passed by a majority of the directors that have no conflict of interest present or represented. However, asAs required by Dutch law, our articles of association provide that when one or more members of our board of directors is absent or prevented from acting, the remaining members of our board of directors will be entrusted with the management of our company. The intent of this provision is to satisfy certain requirements under Dutch law and provide that, in rare circumstances, when a director is incapacitated, severely ill, or similarly absent or prevented from acting, the remaining members of our board of directors (or, in the event there are no such remaining members, a person appointed by our shareholders at a general meeting) will be entitled to act on behalf of our board of directors in the management of our company, notwithstanding the general requirement that otherwise requires a majority of our board of directors be present. In these limited circumstances, our articles of association permit our board of directors to pass resolutions even if a majority of the directors is not present at the meeting.

Subject to Dutch law and any director’s objection, resolutions may be passed in writing by a majorityall of the directors in office. Pursuant toUnder Dutch law, members of the internal rules for our board of directors a director may not participate in discussions orthe deliberation and the decision-making process on a transactionsubject or subjecttransaction in relation to which he or she has a direct or indirect personal interest that conflicts with the interest of our company and business enterprise. If all directors are conflicted and in the absence of a supervisory board, the resolution shall be adopted by the general meeting of shareholders, except if the articles of association prescribe otherwise. Our articles of association provide that a director shall not take part in any vote on a subject or transaction in relation to which he or she has a direct or indirect personal interest that conflicts with the interest of our company and business enterprise. In such event, the other directors shall be authorized to adopt the resolution. If all directors have a conflict of interest with us. Resolutions to enter into such transactions mustas mentioned above, the resolution shall be approvedadopted by a majoritythe non-executive directors.

135


Board Committees

Our board of directors has anfour standing board committees: audit committee, a compensation committee, and a nominating, corporate governance and compliance committee, eachand strategic transactions committee. Each of whichthese committees has the responsibilities and composition described in the table below and the responsibilities described in the sections below. Our board of directors has adopted a written charter for each committee of our board of directors, whichdirectors. These charters are available on the Investor Relations—Corporate Information—Governance Documents & Charters section of our corporate website atwww.tornier.comwww.wright.com. Our board of directors from time to time may establish other committees.

The following table summarizes the current membership of each of our four board committees.
DirectorAuditCompensationNominating, corporate governance and complianceStrategic transactions
Robert J. Palmisano
David H. Mowry
Gary D. Blackford
Sean D. CarneyChair
Kevin C. O’Boyle
John L. Miclot
Amy S. PaulChair
David D. Stevens
Richard F. WallmanChair
Elizabeth H. WeathermanChair

Audit Committee

Our

The audit committee oversees a broad range of issues surrounding our accounting and financial reporting processes and audits of our financial statements. The primary responsibilities of ourthe audit committee include:

assisting our board of directors in monitoring the integrity of our financial statements, our compliance with legal and regulatory requirements insofar as they relate to our financial statements and financial reporting

obligations and any accounting, internal accounting controls or auditing matters, our independent auditor’s qualifications and independence, and the performance of our internal audit function and independent auditors;

obligations and any accounting, internal accounting controls or auditing matters, our independent auditor’s qualifications and independence and the performance of our internal audit function and independent auditors;

appointing, compensating, retaining, and overseeing the work of any independent registered public accounting firm engaged for the purpose of performing any audit, review, or attest services and for dealing directly with any such accounting firm;

providing a medium for consideration of matters relating to any audit issues;

establishing procedures for the receipt, retention, and treatment of complaints received by our companyus regarding accounting, internal accounting controls, or auditing matters, and for the confidential, anonymous submission by our employees of concerns regarding questionable accounting or auditing matters; and

reviewing and approving all related party transactions required to be disclosed under Item 404 of SEC Regulation S-K.

the U.S. federal securities laws.

Our


The audit committee reviews and evaluates, at least annually, the performance of the audit committee and its members, including compliance of the committee with its charter.

Our

The audit committee has the sole authority to select, retain, oversee, and terminate its own counsel, consultants, and advisors and approve the fees and other retention terms of such counsel, consultants, and advisors, as it deems appropriate.
The audit committee consists of Mr. Wallman (Chair), Mr. EmmittBlackford, and Mr. O’Boyle. We believe that the composition of ourthe audit committee complies with the applicable rules of the SEC and the NASDAQ Global Select Stock Market. Our board of directors has determined that each of Mr. Wallman, Mr. EmmittBlackford, and Mr. O’Boyle is an “audit committee financial expert,” as defined in the SEC rules, and satisfies the financial sophistication requirements of the NASDAQ

136


Global Select Stock Market. TheOur board of directors also has determined that each of Messrs.Mr. Wallman, EmmittMr. Blackford, and Mr. O’Boyle meets the more stringent independence requirements for audit committee members of Rule 10A-3(b)(1) under the Exchange Act and the Listing Rules of the NASDAQ Global Select Stock Market, and each of Messrs.Mr. Wallman, Mr. Blackford, and Mr. O’Boyle is independent under the Dutch Corporate Governance Code.

Compensation Committee

The primary responsibilities of ourthe compensation committee, which are within the scope of the board of directors compensation policy adopted by the general meeting of our shareholders, include:

reviewing and approving corporate goals and objectives relevant to the compensation of our Chief Executive Officer and other executive officers, evaluating the performance of these officers in light of those goals and objectives, and setting compensation of these officers based on such evaluations;

making recommendations to our board of directors with respect to incentive compensation and equity-based plans that are subject to board and shareholder approval, administering or overseeing all of our incentive compensation and equity-based plans, and discharging any responsibilities imposed on the committee by any of these plans;

reviewing and discussing with management the “CompensationCompensation Discussion and Analysis”Analysis section of this report and based on such discussions, recommending to our board of directors whether the “CompensationCompensation Discussion and Analysis”Analysis section should be included in this report;

approving, or recommending to our board of directors for approval, the compensation programs, and the payouts for all programs, applying to our non-executive directors, including reviewing the competitiveness of our non-executive director compensation programs and reviewing the terms to make sure they are consistent with our board of directors compensation policy adopted by the general meeting of our shareholders; and

reviewing and discussing with our Chief Executive Officer and reporting periodically to our board of directors plans for development and corporate succession plans for our executive officers and other key employees.

Our


The compensation committee reviews and evaluates, at least annually, the performance of the compensation committee and its members, including compliance of the committee with its charter.

Our

The compensation committee has the sole authority to select, retain, oversee, and terminate its own counsel, consultants, and advisors and approve the fees and other retention terms of such counsel, consultants, and advisors, as it deems appropriate.
The compensation committee consists of Mr. Carney (Chair), Mr. WallmanMiclot, and Ms. Weatherman. We believe that the composition of the compensation committee complies with the applicable rules of the SEC and the NASDAQ Global Select Stock Market. Our board of directors has determined that each of Mr. Carney, Mr. Miclot, and Ms. Weatherman meets the more stringent independence requirements for compensation committee members of Rule 10C-1 under the Exchange Act and the Listing Rules of the NASDAQ Global Select Stock Market. None of our executive officers has served as a member of the board of directors or compensation committee of any entity that has an executive officer serving as a member of our board of directors.

Nominating, Corporate Governance and Compliance Committee

The primary responsibilities of ourthe nominating, corporate governance and compliance committee include:

reviewing and making recommendations to our board of directors regarding the size and composition of our board of directors;

identifying, reviewing, and recommending nominees for election as directors;

making recommendations to our board of directors regarding corporate governance matters and practices, including any revisions to our internal rules for our board of directors; and

overseeing our compliance efforts with respect to our legal, regulatory, and quality systems requirements and ethical programs, including our code of business conduct, and ethics, other than with respect to matters relating to our financial statements and financial reporting obligations and any accounting, internal accounting controls or auditing matters, which are within the purview of the audit committee.

Our

137


The nominating, corporate governance and compliance committee reviews and evaluates, at least annually, the performance of the nominating, corporate governance and compliance committee and its members, including compliance of the committee with its charter.

Our

The nominating, corporate governance and compliance committee has the sole authority to select, retain, oversee, and terminate its own counsel, consultants, and advisors and approve the fees and other retention terms of such counsel, consultants, and advisors, as it deems appropriate.
The nominating, corporate governance and compliance committee consists of Ms. Paul (Chair), Mr. Carney (Chair) and Mr. O’Boyle.

Stevens.

OurThe nominating, corporate governance and compliance committee considers all candidates recommended by our shareholders pursuant to those specific minimum qualifications that the nominating, corporate governance and compliance committee believes must be met by a recommended nominee for a position on our board of directors, which qualifications are described in the nominating, corporate governance and compliance committee’s charter, a copy of which is available on the Investor Relations—Corporate Information—Governance Documents & Charters section of our corporate websitewww.tornier.comwww.wright.com.

We have made no material changes to the procedures by which shareholders may recommend nominees to our board of directors as described in our most recent proxy statement.

Strategic Transactions Committee
The primary responsibilities of the strategic transactions committee include:
reviewing and evaluating potential opportunities for strategic business combinations, acquisitions, mergers, dispositions, divestitures, investments, and similar strategic transactions involving our company or any one or more of our subsidiaries outside the ordinary course of our business that may arise from time to time;
approving on behalf of our board of directors any strategic transaction that may arise from time to time and is deemed appropriate by the strategic transactions committee and involves total cash consideration of less than $5.0 million; provided, however, that the strategic transactions committee is not authorized to approve any strategic transaction involving the issuance of capital stock or in which any director, officer, or affiliate of our company has a material interest;
making recommendations to our board of directors concerning approval of any strategic transactions that may arise from time to time and are deemed appropriate by the strategic transactions committee and are beyond the authority of the strategic transactions committee to approve;
reviewing integration efforts with respect to completed strategic transactions from time to time and making recommendations to management and our board of directors, as appropriate;
assisting management in developing, implementing, and adhering to a strategic plan and direction for its activities with respect to strategic transactions and making recommendations to management and our board of directors, as appropriate;
reviewing and approving the settlement or compromise of any material litigation or claim against us; and
reviewing and evaluating potential opportunities for restructuring our business in response to completed strategic transactions or otherwise in an effort to realize anticipated cost and expense savings for, and other benefits, to our company and making recommendations to management and our board of directors, as appropriate.

The strategic transactions committee reviews and evaluates periodically the performance of the committee and its members, including compliance of the committee with its charter.
The strategic transactions committee has the sole authority to select, retain, oversee, and terminate its own counsel, consultants, and advisors and approve the fees and other retention terms of such counsel, consultants, and advisors, as it deems appropriate.
The strategic transactions committee consists of Ms. Weatherman (Chair), Mr. Stevens and Mr. Wallman.

138


Code of Business Conduct and Ethics

We have adopted a code of business conduct, and ethics, which applies to all of our directors, officers, and employees. OurThe code of business conduct and ethics is available on the Investor Relations—Corporate Information—Governance Documents & Charters section of our corporate website atwww.tornier.comwww.wright.com. Any person may request a copy free of charge by writing to us at Tornier, Inc.James A. Lightman, Senior Vice President, General Counsel and Secretary, Wright Medical Group N.V., 10801 Nesbitt Ave South, Bloomington, Minnesota 55437.Prins Bernhardplein 200, 1097 JB Amsterdam, the Netherlands. We intend to disclose on our website any amendment to, or waiver from, a provision of our code of business conduct and ethics that applies to directors and executive officers and that is required to be disclosed pursuant to the rules of the SEC and the NASDAQ Global Select Stock Market.

Section 16(a) Beneficial Ownership Reporting Compliance

Section 16(a) of the Exchange Act requires our directors, and executive officers, and all persons who beneficially own more than 10% of our outstanding ordinary shares to file with the SEC initial reports of ownership and reports of changes in ownership of our ordinary shares. Directors, executive officers, and greater than 10% beneficial owners also are required to furnish us with copies of all Section 16(a) forms they file. To our knowledge, based on review of the copies of such reports and amendments to such reports furnished to us with respect to the year ended December 30, 2012,27, 2015, and based on written representations by our directors and executive officers, all required Section 16 reports under the Exchange Act for our directors, executive officers, and beneficial owners of greater than 10% of our ordinary shares were filed on a timely basis during the year ended December 30, 2012.

27, 2015.

Item 11. Executive Compensation.


Compensation Discussion and Analysis

In this Compensation Discussion and Analysis or CD&A,(CD&A), we describe the key principles and approaches we use to determine elements of compensation paid to, awarded to and earned by the following named executive officers, whose compensation is set forth in the Summary Compensation Table found later in this report:

under “
Executive Compensation Tables and NarrativesSummary Compensation Information”:

Robert J. Palmisano, who serves as our current President and Chief Executive Officer and an executive director, and prior to the Wright/Tornier merger, served as legacy Wright’s President and Chief Executive Officer;

David H. Mowry, who currently serves as our current Executive Vice President and Chief Operating Officer and an executive director, and prior to the Wright/Tornier merger, served as legacy Tornier’s former President and Chief Executive Officer;
Lance A. Berry, who serves as our current Senior Vice President and Chief Financial Officer, and prior to the Wright/Tornier merger, served as legacy Wright’s Senior Vice President and Chief Financial Officer;
Shawn T McCormick, who prior to the Wright/Tornier merger served as legacy Tornier’s former Chief Financial Officer;
Gregory Morrison, who serves as our current Senior Vice President, Human Resources, and prior to the Wright/Tornier merger, served as legacy Tornier’s Senior Vice President, Global Human Resources and HPMS;
Terry M. Rich, who serves as our current President, Upper Extremities, and prior to the Wright/Tornier merger, served as legacy Tornier’s Senior Vice President, U.S. Commercial Operations;
James A. Lightman, who serves as our current Senior Vice President, General Counsel and Secretary, and prior to the Wright/Tornier merger, served as legacy Wright’s Senior Vice President, General Counsel and Secretary; and
Gordon W. Van Ummersen, who prior to the Wright/Tornier merger served as legacy Tornier’s former Senior Vice President, Global Product Delivery.

We refer to these current and former executive officers as our “named executive officers” and our President and Chief Executive Officer and during 2012 served as our Interim President and Chief Executive Officer and, prior to such position, Chief Operating Officer;

Douglas W. Kohrs, who served as our President, Chief Executive Officer and Executive Director until his resignation on November 12, 2012;

Shawn T McCormick, who joined Tornier“CEO” in September 2012 and currently serves as our Chief Financial Officer;

Carmen L. Diersen, who served as our Global Chief Financial Officer Director until her resignation on July 17, 2012;

Terry M. Rich, who joined Tornier in March 2012 and currently serves as our Senior Vice President, U.S. Commercial Operations;

Stéphan Epinette, who currently serves as our Vice President, International Commercial Operations; and

Kevin M. Klemz, who currently serves as our Vice President, Chief Legal Officer and Secretary.

this CD&A. This CD&A should be read in conjunction with the accompanying compensation tables, corresponding notes and narrative discussion, as they provide additional information and context to our compensation disclosures.


139


Executive Summary

2015 was a significant year for us. On October 1, 2015, we completed the Wright/Tornier merger and became the premier extremities and biologics company. Since the completion of the merger, we have devoted significant time and resources to integrating the operations of legacy Wright and legacy Tornier and focusing our executives and other employees on our combined company mission, vision and values.
One of our key executive compensation objectives is to link pay to performance.performance by aligning the financial interests of our executives with those of our shareholders and by emphasizing pay for performance in our compensation programs. We typically strive to accomplish this objective primarily through the operation of our employeeannual performance incentive compensation plan, which compensates our executive officersexecutives for achieving annual corporate financial performanceand other goals and, in the case of some executives, individual goals. Although the performance goals under our performance incentive plan for the first half of 2015 were primarily financial related, our executive officers, divisionalsecond half of 2015 performance goals were broader and intended to motivate our combined company to achieve short-term common goals determined after completion of the merger to be critically important in positioning our combined company for a successful 2016.
Because the merger was considered a “reverse acquisition,” the historical financial statements of legacy Wright replaced our historical financial statements for all periods prior to the merger. Our total net sales for 2015 were $415.5 million as reported. Our pro forma total net sales for 2015, which includes financial results for both the legacy Wright and Tornier businesses giving effect to the merger as if it had occurred on the first day of fiscal 2015, were $656.4 million. Our total extremities net sales for 2015 were $321.8 million as reported. Our pro forma total extremities net sales for 2015 were $519.8 million.
The completion of the Wright/Tornier merger and our 2015 financial performance goals and individual performance goals.

In 2012, we experienced increased revenues compared to 2011 and believe we made strideshad the following impact on our pay programs in restructuring certain aspects of our business and realigning our management structure. Our acquisition of OrthoHelix Surgical Designs, Inc. in October 2012, in particular, was important in expanding our lower extremity product portfolio and positioning us for future2015:

Total net revenue, growth in ourtotal extremities products. However, our financial performance, as measured by certain key performance indicators for 2012 including revenue, gross margin as a percentage of revenue, EBITDA, revenue from new products and free cash flow, in each case as adjusted, for certain items, such as effects fromlegacy Tornier for the first half of 2015 were between threshold and target goals or between target and maximum goals, resulting in first half of 2015 performance incentive plan bonuses to our OrthoHelix acquisition, was belownamed executive officers who were executives of legacy Tornier during that time of 96.4% of target for our internal expectations set atcorporate performance goals.
Adjusted net revenue for legacy Wright for the beginningfirst half of the year. As a result, there were no 2012 payouts for2015 substantially exceeded target goals, resulting in first half of 2015 performance incentive plan corporate portion bonuses to legacy Wright named executive officers of 144% of target.
Legacy Wright U.S. lower extremities revenue and divisional financiallegacy Tornier global upper extremities revenue and other performance goals under ourfor the second half of 2015 substantially exceeded target goals, resulting in second half of 2015 performance incentive compensation plan for executive officers. There were, however, payouts for achievement of individual performance goals by our executive officers, generally ranging from 100% to 105% of target. However, we place primary emphasis on overall corporate and divisional performance goals rather than individual performance goals as evidenced by the fact that 80% to 90% of our executives’ 2012 payouts were determined based on the achievement of corporate and divisional performance goals and only 10% a 20% based on achievement of individual performance goals. Thus, the overall 2012 incentive plan payoutsbonuses for our named executive officers ranged between only 10%of 150% of target.
Because the merger was a “change in control” under legacy Wright’s and 22%legacy Tornier’s stock-based compensation plans, all unvested equity awards of target. Since mostlegacy Wright and legacy Tornier outstanding as of our executives’ pay is variable compensation tied to financial results or share price, and not fixed compensation, these low performance incentive compensation payoutsthe merger automatically vested. While this automatic vesting resulted in actual totaladditional compensation for our executives substantially belowfor 2015, we believe it served its intended purpose of retaining and motivating the legacy Wright and legacy Tornier executive teams through the completion of the merger.
Our executive management team changed significantly as a result of the merger, which resulted in a change in our targeted range of 50th to 75th percentile of a group of similarly sized peer companies for 2012.

Key 2012 Compensation-Related Actions

During 2012, we took a number of actions that supported ourprincipal executive compensation philosophy of ensuring that ourofficer, principal financial officer, and several other executive pay program reinforces our corporate mission, vision and values and is reflectiveofficer positions during 2015. Because the departures of our performance, market competitive to attractformer legacy Tornier executives were in connection with a “change in control,” these executives received “change in control” severance payments and retain key employeesbenefits, which resulted in additional compensation for 2015. While these payments resulted in higher compensation for these executives than in prior years, we believe these payments served their intended purpose of retaining and aligned withmotivating these executives through the interests of our shareholders, including the following:

Our compensation committee reviewed and revised our formal compensation objectives and principles to guide executive pay decisions, which are described in more detail below.

Our compensation committee engaged an independent compensation consultant, Mercer (US) Inc., to provide executive pay advice to our compensation committee. During 2012, at the requestcompletion of the compensation committee, Mercer recommended a peer groupmerger.

Effective upon completion of companies, collected relevant market data from these companies to allow the compensation committee to compare elements ofmerger, we entered into an employment with our pay program to those of our peers, provided information on executive pay trends and implications for our company and made other recommendations to our compensation committee regarding our executive compensation program.

Our board of directors, upon recommendation of our compensation committee, adopted long-term incentive grant guidelines for the grant of equity awards to our employees under the Tornier N.V. 2010 Incentive Plan.

Our board of directors, upon recommendation of our compensation committee, approved, and our shareholders approved at our 2012 annual general meeting of shareholders, an amendment to the Tornier N.V. 2010 Incentive Plan to increase the number of ordinary shares available for issuance under the plan by 2.7 million. The share increase was intended to provide a sufficient number of shares for at least a couple of years; and thus, we do not anticipate submitting another plan amendment to increase the number of shares available for issuance under the plan this year.

In November 2012, we promoted David H. Mowry to Interim President and Chief Executive Officer uponand separation pay agreements with our other named executive officers who were continuing as officers of the resignationcombined company. We also entered into confidentiality, non-competition, non-solicitation and intellectual property rights agreements with our executives. The terms of Douglas W. Kohrs,these agreements are substantially identical to prior agreements with legacy Wright. We also entered into a service agreement with our former President and Chief Executive Officer and Executive Director who resigned on November 12, 2012. In February 2013, we appointed Mr. MowryVice President and Chief ExecutiveOperating Officer, onwhich deal with certain Dutch law matters relating to their roles as executive directors, and under which we allocate a non-interim basis. In connection with Mr. Kohrs departure,portion of their annual base salary to their service as executive directors.

Because of the automatic vesting of equity awards as a result of the merger and to continue to retain our best talent after the merger, we entered into a severance arrangement with Mr. Kohrs, which included a six-month transition consulting arrangement.

We hired a new Chief Financial Officer, Shawn T McCormick, who commenced employment with us on September 4, 2012,granted special one-time “re-up” equity awards to replace Carmen L. Diersen,several of our former Global Chief Financial Officer, who resigned on July 17, 2012. In connection with her departure, we entered into a severance arrangement with Ms. Diersen, which included a one-year transition consulting arrangement. Mr. Kohrs served askey executives, including many of our principal financial officer from July 17, 2012 until September 4, 2012.

We realigned and streamlined ournamed executive management structure by reducing the number of direct reportsofficers, in addition to our President and Chief Executive Officer.

annual equity grants, shortly after completion


We honored

140


of the desire of a significant portionmerger. These equity awards resulted in some of our shareholders, who at our 2011 annual general meeting of shareholders supported a “say-on-pay” vote every three years,named executive officers receiving higher stock-based compensation in 2015 than in prior years.

Compensation Highlights and accordingly, did not submit a “say-on-pay” proposal to our shareholders during 2012. At our 2011 annual general meeting of shareholders, over 99% of the votes cast by our shareholders were in favor of our “say-on-pay” proposal. Accordingly, ourBest Practices
Our compensation committee generally believes that such results affirmed shareholder support of our approach to executive compensation and did not believe it was necessary to make, and therefore have not made, any significant changes to our executive pay program solely in response to that vote. We intend to submit a “say-on-pay” proposal to our shareholders again at our 2014 annual general meeting of shareholders.

Compensation Best Practices

We maintain certainpractices include many best pay practices whichthat support our executive compensation objectives and principles, and benefit our shareholders. These practices include the following:

What We Do:

Pay for performance. We tie compensation directly to financial performance.and other performance metrics. Our annual cashperformance incentive plan typically pays out with respect to each performance measure only if certain minimum threshold levels of financial performance are met, and even if maximum levels ofmet.
Bonus caps. Our performance are exceeded, our annual cash incentive plan payoutsbonuses are capped at 200% of target and legacy Tornier's plan bonuses were capped at 150% of target.

target for the first half of 2015.

Performance measure mix. We use a mix of performance measures within our performance incentive plan.
At-risk pay. A significant portion of our executives’executive compensation is “performance-based” or “at risk.” For 2012, 71% and 62% of target total direct compensation was performance-based for our current and former CEOs, respectively, and at least 57% of target total direct compensation for our other named executive officers was performance-based, assuming grant date fair values for equity awards.

Equity-based pay. A significant portion of our executives’executive compensation is “equity-based” and in the form of stock-based incentive awards, comprising of 48%awards.
LTI grant guidelines. Each year, we review and 44% of target total direct compensationadopt long-term incentive guidelines for the executives who served asgrant of equity awards under our CEO during 2012 and at least 39% of target total direct compensation for our other named executive officers in 2012, assuming grant date fair values for equity awards.

stock incentive plan.

Long-term vesting. Value received under our long-term equity-based incentive awards is tied to three-year to four-year vesting and any value received by executives from stock option grants is contingent upon long-term stock price performance in that stock options have value only if the pricemarket value of our ordinary shares exceeds the exercise price of the options.

Clawback policy. Our stock incentive plan and related award agreements include a “clawback” mechanism to recoup incentive compensation if it is determined that our executives engaged in certain conduct adverse to the company’sour interests.

In addition, our performance incentive plan also contains a clawback provision.

Stock ownership guidelines. We maintain stock ownership guidelines for all of our executives.
Independent committee and consultant. We have an independent compensation committee which is advised by an independent external compensation consultant.

What We Don’t Do:
No repricing. We do not allow repricing or exchange of any equity awards without shareholder approval.
No excessive perquisites. We do not provide excessive perquisites to our executives.
No tax gross-ups, other than a limited tax gross-up to our CEO. We do not provide tax “gross up”“gross-up” payments to our executives, other than certain limited tax gross-up payments to our CEO as required under the terms of his employment agreement.
No hedging or pledging. We do not allow hedging or pledging of our employment agreementssecurities.

Say-on-Pay Vote
At our 2014 annual general meeting of shareholders, our shareholders had the opportunity to provide an advisory vote on the compensation paid to our named executive officers, or a “say-on-pay” vote. Of the votes cast by our shareholders, over 99% were in favor of our “say-on-pay” proposal. Accordingly, the compensation committee generally believes that these results affirmed shareholder support of our approach to executive compensation and did not believe it was necessary to make; and therefore, we have not made, any significant changes to our executive pay program solely in response to that vote. In accordance with the result of the advisory vote on the frequency of the say-on-pay vote, which was conducted at our 2011 annual general meeting of shareholders, our board of directors has determined that we will conduct an executive compensation advisory vote every three years. Accordingly, the next say-on-pay vote will occur in 2017 in connection with any other compensation, benefits or perquisites provided to our executives.

2017 annual general meeting of shareholders.

We provide only limited modest perquisites to our executives.

Compensation Objectives and Principles

Philosophies

Our executive compensation policies, plans and programs seek to enhance our profitability,financial performance, and thus shareholder value, by aligning the financial interests of our executives with those of our shareholders and by emphasizing pay for performance.pay-for-performance. Specifically, our executive compensation programs are designed to:


141


Reinforce our corporate mission, vision and values.
Attract and retain executives important to the success of our company and the creation of value for our shareholders.

company.

Reinforce our corporate mission, vision and values.

Align the interests of our executives with the interests of our shareholders.

Reward our executives for progress toward our corporate mission and vision, the achievement of company performance objectives, the creation of shareholder value in the short- and long-term, and their general contributions to the success of our company.


To achieve these objectives, ourthe compensation committee makes executive compensation decisions based on the following principles:

philosophies:

Base salary and total compensation levels will generally be targeted withinto be near the range of the 50th to 7567th percentile of a group of similarly sizedsimilarly-sized peer companies. However, the specific competitiveness of any individual executive’s salary and compensation will be determined considering factors like the executive’s skills and capabilities, contributions as a member of the executive management team, and contributions to our overall performance. Pay levels will also reflectperformance, and the sufficiency of total compensation potential and structure to ensure the retention of an executive when considering the executive’s compensation potential that may be available elsewhere.

At least two-thirds of the CEO’s compensation and half of other executives’ compensation opportunity should be in the form of variable compensation that is tied to financial results and/or share price.

creation of shareholder value.

The portion of total compensation that is performance-based or at-risk should increase with an executives’executive’s overall responsibilities, job level, and compensation. However, compensation programs should not encourage excessive risk-taking by executives.

behavior among executives and should support our commitment to corporate compliance.

A primaryPrimary emphasis should be placed on company performance as measured against goals approved by ourthe compensation committee rather than on individual performance.

At least half of the CEO’s compensation and one-third of other executives’ compensation opportunity should be in the form of stock-based incentive awards.


Executive Compensation Decision Making
Determination of Compensation

Role of Compensation Committee and Board. The responsibilities of ourthe compensation committee include reviewing and approving corporate goals and objectives relevant to the compensation of our executive officers, evaluating each executive’s performance in light of those goals and objectives and, either as a committee or together with the other directors, determining and approving each executive’s compensation, including performance-based compensation based on these evaluations (and, in the case of the executives, other than the CEO, the CEO’s evaluation of such executive’s individual performance). Consistent with our shareholder-approved board of directors compensation policy, the compensation packagepackages for our CEO isand Executive Vice President and Chief Operating Officer, who also serve as executive directors of our company, are determined by theour non-executive members of our board in accordance with such policy,directors, based upon recommendations from the compensation committee.

In setting or recommending executive compensation for our named executive officers, the compensation committee considers the following primary factors:

each executive’s position within the company and the level of responsibility;

the ability of the executive to impact key business initiatives;

the executive’s individual experience and qualifications;

compensation paid to executives of comparable positions by companies similar to our company;

us;

company performance, as compared to specific pre-established objectives;

individual performance, generally and as compared to specific pre-established objectives;

the executive’s current and historical compensation levels;

advancement potential and succession planning considerations;

an assessment of the risk that the executive would leave our companyus and the harm to our company’s business initiatives if the executive left;

the retention value of executive equity holdings, including outstanding stock options and restricted stock unit (RSU) awards;

the dilutive effect on the interests of our shareholders of long-term equity-based incentive awards; and

anticipated share-based compensation expense as determined under applicable accounting rules.


The compensation committee also considers the recommendations of our CEO with respect to executive compensation to be paid to other executives. The significance of any individual factor described above in setting executive compensation will vary from year to year and may vary among our executives. In making its final decision regarding the form and amount of compensation to be paid to our named executive officers (other than ourthe CEO), ourthe compensation committee considers and gives great weight to the recommendations of ourthe CEO recognizing that due to his reporting and otherwise close relationship

142


with each executive, the CEO often is in a better position than the compensation committee to evaluate the performance of each executive (other than himself). In making its final decision regarding the form and amount of compensation to be paid to ourthe CEO, the compensation committee considers the results of the CEO’s self-review and his individual annual performance review by the compensation committee, benchmarking data gathered by Mercer, and the recommendations of our non-executive board members.

directors.

Role of Management. Three members of our executive team play a role in our executive compensation process and regularly attend meetings of ourthe compensation committee – our- the CEO, GlobalSenior Vice President, Human Resources, and Senior Vice President, Chief Legal OfficerGeneral Counsel and Secretary. OurThe CEO assists ourthe compensation committee primarily by making formal recommendations regarding the amount and type of compensation to be paid to our executives (other than himself). In making suchthese recommendations, ourthe CEO considers many of the same factors listed above that the compensation committee

considers in setting executive compensation, including in particular the results of each executive’s annual performance review and the executive’s achievement of his or her individual management performance objectives established in connection with our annual cashperformance incentive plan, described below. Our GlobalThe Senior Vice President, Human Resources assists ourthe compensation committee primarily by gathering compensation related data regarding our executives and coordinating the exchange of suchthis information and other executive compensation information among the members of ourthe compensation committee, ourthe compensation committee’s compensation consultant and management in anticipation of compensation committee meetings. OurThe Senior Vice President, Chief Legal OfficerGeneral Counsel and Secretary assists ourthe compensation committee primarily by ensuring compliance with legal and regulatory requirements and educating the committee on executive compensation trends and best practices from a corporate governance perspective. Final deliberations and decisions regarding the compensation to be paid to each of our executives,executive, however, are made by our board of directors or compensation committee without the presence of suchthe executive.

Role of Consultant. OurThe compensation committee has retained the services of Mercer (US) Inc. (Mercer) to provide executive compensation advice. Mercer’s engagement by the compensation committee includes reviewing and advising on all significant aspects of executive compensation. This includes base salaries, short-term cash incentives and long-term equity incentives for our executive and other officers,executives, and cash compensation and long-term equity incentives for our non-executive directors. At the request of the compensation committee, each year, Mercer recommendedrecommends a peer group of companies, collectedcollects relevant market data from these companies to allow the compensation committee to compare elements of our compensation program to those of our peers, providedprovides information on executive compensation trends and implications for our companyus and mademakes other recommendations to the compensation committee regarding certain aspects of our executive compensation program. Our management, principally our Globalthe Senior Vice President, Human Resources and the chair of ourthe compensation committee, regularly consult with representatives of Mercer before compensation committee meetings. A representative of Mercer is invited on a regular basis to attend, and sometimesperiodically attends, meetings of ourthe compensation committee. In making its final decision regarding the form and amount of compensation to be paid to our executives, ourthe compensation committee considers the information gathered by and recommendations of Mercer. The compensation committee values especially Mercer’s benchmarking information and input regarding best practices and trends in executive compensation matters.

Use of Peer Group and Other Market Data. To help determine the appropriate levels of compensation for certain elements of our executive compensation program, ourthe compensation committee reviews annually the compensation levels of our named executive officers and other executives against the compensation levels of comparable positions with companies similar to our companyus in terms of industry, revenues, products operations and revenues.operations. The elements of our executive compensation program to which the compensation committee “benchmarks��“benchmarks” or uses to base or justify a compensation decision or to structure a framework for compensating executives include base salary, short-term cash incentive opportunity, and long-term equity incentives. With respect to other elements of our executive compensation program, such as perquisites, severance, and change in control arrangements, ourthe compensation committee benchmarks these elements on a periodic or as needed basis and in some cases uses peer group or market data more as a “market check” after determining the compensation on some other basis.

The compensation committee believes that compensation paid by peer group companies is more representative of the compensation required to attract, retain, and motivate our executive talent than broader survey data. The compensation committee believesdata and that the compensation paid by the peer companies whichthat are in the same business,industry, with similar products and operations, and with revenues in a range similar to oursus, generally provides more relevant comparisons.

In February 2012,2015, Mercer worked with ourthe post-Wright/Tornier merger compensation committee to identify a peer group and recommended andof 13 companies that the compensation committee approved a peer groupat its first in-person meeting in the Netherlands after completion of 15 companies.the merger. Companies in the peer group are public companies in the health care equipment and supplies business with products and operations similar to those of our company,ours and whichthat had annual revenues generally within thea range of one-half to two times our then-anticipated post-merger annual revenues. The peer group includesincluded the following companies:


143

Table of Contents

American Medical Systems Holdings,The Cooper Companies, Inc.ThoratecMasimo CorporationExactech,NuVasive, Inc.
WrightGlobus Medical, Group, Inc.Arthrocare CorporationCyberonics, Inc.
Volcano CorporationMerit Medical Systems, Inc.Alphatec Holdings,ResMed Inc.
Nuvasive,Greatbatch, Inc.Natus Medical IncorporatedICU Medical, Inc.Conceptus,Sirona Dental Systems, Inc.
Zoll MedicalHaemonetics CorporationNxStage Medical, Inc.Thoratec Corporation
Integra LifeSciences Holdings CorporationRTI Biologics, Inc.

The table below sets forth certain revenue and other financial information as of a date available prior to the date Mercer used to compile the proposed peer group and market capitalization information as of February 28, 2015 regarding the peer group and Tornier’sour position within the peer group as of September 2012:

   Annual revenue
(in millions)
  Market capitalization
(in millions)
 

25th percentile

  $217   $629  

Median

   333    863  

75th percentile

   437    996  

Tornier

   267    752  

Percentile rank

   31  43

that the compensation committee used in connection with its recommendations and decisions regarding executive compensation for 2015:

 
Trailing 12-month revenue
(in millions)
 

Three-year
revenue growth
 

Trailing
12-month EBIT
 
Market capitalization
(in millions)
25th percentile
$478 25% $69 $1,325
50th percentile
688 34% 93 2,171
75th percentile
928 42% 143 2,299
Tornier + WrightN/A N/A N/A 3,300
Percentile rank51%N/A N/A N/A 78%

In reviewing benchmarking data, ourthe compensation committee recognizes that benchmarking may not always be appropriate as a stand-alone tool for setting compensation due to aspects of our business and objectives that may be unique to our company.us. Nevertheless, ourthe compensation committee believes that gathering this information is an important part of its compensation-related decision-making process. However, where a sufficient basis for comparison does not exist between the peer group or survey data and an executive, the compensation committee gives less weight to the peer group and survey data. For example, relative compensation benchmarking analysis does not consider individual specific performance or experience or other case-by-case factors that may be relevant in hiring or retaining a particular executive.

Market Positioning. In general, we target base salary and total compensation levels withinto be near the range of the 50th to 75th67th percentile of our peer group. However, the specific competitiveness of any individual executive’s pay will be determined considering factors like the executive’s skills and capabilities, contributions as a member of the executive management team, and contributions to our overall performance. The compensation committee will also consider the sufficiency of total compensation potential and the structure of pay plans to ensure the hiring or retention of an executive when considering the compensation potential that may be available elsewhere.

Executive Compensation Components

The principal elements of our executive compensation program for 20122015 were:

base salary;

short-term cash incentive compensation;

long-term equity-based incentive compensation, in the form of stock options and stockRSU awards; and

other compensation arrangements, such as benefits made generally available to our other employees, limited and modest executive benefits and perquisites, and severance and change in control arrangements.


In determining the form of compensation for our named executive officers, ourthe compensation committee views these elements of our executive pay program as related but distinct. OurThe compensation committee does not believe that significant compensation derived by an executive from one element of our compensation program should necessarily result in a reduction in the amount of compensation the executive receives from other elements. At the same time, our compensation committee does not believeelements or that minimal compensation derived from one element of compensation should necessarily result in an increase in the amount the executive should receive from one or more other elements of compensation.

Except as otherwise described below, ourin this CD&A, the compensation committee has not adopted any formal or informal policies or guidelines for allocating compensation between long-term and currently paid out compensation, between cash and non-cash compensation, or among different forms of non-cash compensation. However, ourthe compensation committee’s philosophy is to make a greater percentage of an executive’s compensation performance-based, and therefore at risk, as the

144

Table of Contents

executive’s position changes and responsibility increases given the influence more senior level executives generally have on company performance. Thus, individuals with greater roles and responsibilities associated with achieving our company’s objectives should bear a greater proportion of the risk that those goals are not achieved and should receive a greater proportion of the reward if objectives are met or surpassed. For example, this philosophy is illustrated by the higher cashannual performance incentive targetsplan target and equity-based awardslong-term equity incentives of our CEO as compared to our other executives.

In addition, our objective is that at least two-thirds of the CEO’s compensation and one-half of other executives’ compensation opportunity be in the form of variable compensation that is tied to financial results or share price and that at least half of the CEO’s compensation and one-third of other executives’ compensation opportunity be in the form of stock-based incentive awards.

Base Salary
Overview

Overview. We provide a base salary for our named executive officers which,that, unlike some of the other elements of our executive compensation program, is not subject to company or individual performance risk. We recognize the need for

most executives to receive at least a portion of their total compensation in the form of a guaranteed base salary that is paid in cash regularly throughout the year. Base salary amountssalaries are established under each executive’s employment agreement,upon hiring an executive, and are subject to subsequent annual upward adjustments by our compensation committee, or in the case of any executive who is also a director, our board of directors, upon recommendation of our compensation committee.

adjustments.

Setting Initial Salaries for New Executives. We initially fix base salaries for our executives at a level we believe enables us to hire and retain them in a competitive environment and to reward satisfactory individual performance and a satisfactory level of contribution to our overall business objectives. During 2012, twoIn connection with the Wright/Tornier merger, we brought on several new executives from legacy Wright. In October 2015, at the first in-person compensation committee meeting in the Netherlands after completion of the merger, we set initial base salaries for these new executives, which were effective October 1, 2015, the closing date of the merger. In setting these salaries, we took into consideration the following factors, among others: (1) the executives’ existing actual and “notional” base salaries at legacy Wright, as described in more detail below; (2) the fact that legacy Wright executives had not yet received an annual merit increase for 2015; and (3) the base salaries of executives in comparable positions in our named executive officers,peer group. In addition, with respect to Mr. McCormick and Mr. Rich, were hired. In establishing each of Mr. McCormick’s and Mr. Rich’s initialPalmisano, we also took into consideration his employment agreement which provided that we would review his base salary at $350,000, our compensation committee considered the executive’s prior experience, successleast annually for any increase.
Because legacy Wright had offered its executives in servingpast years an opportunity to elect to receive legacy Wright equity in those positions, most recentlieu of an annual base salary increase paid in cash throughout the year, certain executives from legacy Wright had both “actual” base salaries, which were their actual base salaries paid to them in cash during the year in accordance with legacy Wright’s payroll procedures, and other compensation at his prior employer,what we refer to as well as“notional” base salaries, which were what their base salaries would have been had they not elected to receive legacy Wright equity in lieu of an annual base salary increase. In setting initial base salaries for these executives, we took into consideration both their actual and notional base salaries, with more emphasis, however, on their notional base salaries.
In addition to setting initial base salaries for our new executives from legacy Wright, we also reviewed the base salaries of our otherlegacy Tornier executives andwho remained as executives of our compensation committee’s general knowledge ofcombined company after the competitive market. Market pay levels aremerger. In some cases, we increased their base salaries effective October 1, 2015 to reflect a market adjustment based in part on the most recent Mercer executive compensation analysis performed for our compensation committee. Although Mr. McCormick’s base salary is slightly above the 75th percentilesalaries of executives in comparable positions in our peer group and Mr. Rich’s base salary is slightly belowand/or to reflect the 75th percentilefact that some of these executives were required to relocate to our peer group for similarly titled executives, the compensation committee believed it was necessary to set their base salaries at such a level to attract them to the company.

new U.S. corporate headquarters in Memphis, Tennessee from our former U.S. corporate headquarters in Bloomington, Minnesota.

Annual Salary Increases. We typically increasereview the base salaries of our named executive officers in the beginning of each year following the completion of our prior year individual performance reviews in an amount equal to an approximate cost of living adjustment. We do soreviews. If appropriate, we increase base salaries to recognize annual increases in the cost of living and superior individual performance and to ensure that our base salaries remain market competitive. We refer to our typical annual base salary increases as a result of cost of living adjustments and individual performance as “merit increases.” In addition, we may make additional upward adjustments to a particularan executive’s base salary to compensate anthe executive for assuming increased roles and responsibilities, to reward an executive for superior individual performance, to retain an executive at risk of recruitment by other companies, and/or to bring an executive’s base salary closer to the 50th to 75th percentileour target market positioning of companies in our peer group. Although meritWe refer to these base salary increases were made toas “market adjustments.”

145

Table of Contents

2015 Base Salaries. The table below sets forth the 2014 base salaries (actual and notional, if applicable) of our named executive officers, during 2012, notheir base salaries effective October 1, 2015, the percentage increase compared to their 2014 base salaries (actual and notional, if applicable) set by legacy Wright or legacy Tornier, as applicable, and the market positioning of their 2015 base salaries in our peer group:
Name 
2014
base salary
(actual/notional)
($)
 
2015
base salary
($)
 
2015
base salary % increase compared to 2014 actual and notional base salary(1)(2)
 
2015 base salary compared to
peer group percentile
Robert J. Palmisano $ 750,000/836,200 $886,200 18.2%/6.0% 
Above 75th 
David H. Mowry 550,000 622,000 13.0% 
Above 75th 
Lance A. Berry 375,000 397,500 6.0% 
Above 50th 
Shawn T McCormick 365,456 377,333 3.0% 
At 50th 
Gregory Morrison 300,002 365,000 21.7% 
Above 50th 
Terry M. Rich 369,694 384,482 4.0% 
Above 75th 
James A. Lightman 310,000/352,000 373,100 20.4%/6.0% 
Above 50th 
Gordon W. Van Ummersen 356,122 365,025 2.5% 
Above 50th 
_________________
(1)Percentage increase compared to 2014 base salary reflects any base salary increase received effective October 1, 2015 and, in the case of the legacy Tornier executives, any base salary increase received effective February 1, 2015.

(2)In the case of the legacy Wright executives who previously elected to receive legacy Wright equity in lieu of prior base salary increases, the percentage increase is compared to both their 2014 actual base salary and 2014 notional base salary.

The February 2015 base salary increases for our legacy Tornier named executive officers ranged from 2.5% to 4.0% over their respective 2014 base salaries. No upward market adjustments were mademade. The October 2015 base salary increases for our legacy Wright named executive officers reflected a 6.0% merit increase over their respective 2014 base salaries or 2014 notional base salaries in the case of certain legacy Wright executives who previously elected to anyreceive legacy Wright equity in lieu of prior base salary increases. In addition, the October 2015 base salary increases for Messrs. Mowry and Morrison reflected upward market adjustments and additional base compensation to ease their relocation to Memphis, Tennessee.
2016 Base Salaries. In February 2016, we set the following base salaries.

The merit increasessalaries for 2016 for our named executive officers who were executives at the timeeffective April 1, 2016: Mr. Palmisano ($921,648), Mr. Mowry ($646,880), Mr. Berry ($413,400), Mr. Morrison ($379,600), Mr. Rich ($399,861), and Mr. Lightman $388,024). The 2016 base salaries represent merit increases of the increase in February 2012 ranged from 2.5% to 3.5%4% over 2011their respective 2015 base salaries. 2012 base salaries (effective as of February 1, 2012), the percentage increases compared to 2011 base salaries, and the 2012 base salaries compared to the peer 50th percentile are provided in the table below for each of our named executive officers whoNo upward market adjustments were executives at the time of the merit increase:made.

Name

  2012
base salary
($)
   2012
base salary  %
increase
compared to
2011
  

2012 base
salary
compared to

peer group
50th
percentile

David H. Mowry(1)

   335,563     3.25 13% below

Douglas W. Kohrs

   518,490     2.89 6% below

Carmen L. Diersen

   342,286     2.50 8% above

Stéphan Epinette(2)

   286,866     3.50 10% below

Kevin M. Klemz

   286,441     3.25 5% below

(1)For purposes of the peer group comparison, Mr. Mowry’s base salary is compared to the base salaries of other chief operating officers since that was Mr. Mowry’s position at the time of his base salary increase in February 2012.
(2)Mr. Epinette’s base salary is paid in Euros and was €220,666 for 2012. For purposes of the table and the peer group comparison, a rate of one Euro to $1.30 was used to convert Mr. Epinette’s base salary into U.S. dollars.

Whether an executive received a 2.5% to 3.5% merit increase was based primarily on the results of the executive’s performance review for 2011. In evaluating the performance of Mr. Kohrs and the amount of his 2012 merit increase, the compensation committee reviewed Mr. Kohrs’s self-review, discussed his performance and sought the input from the non-executive directors. In assessing the performance of Mr. Kohrs, the compensation committee evaluated primarily his ability to achieve his goals and objectives and lead the company.

Salary Increases in Connection with Promotions. We typically increase the base salaries of our named executive officers in connection with promotions to compensate them for their assumption of increased roles and responsibilities and to bring their base compensation closer to those of executives in comparable positions at similar companies. In connection with his promotion to Interim President and Chief Executive Officer in November 2012, Mr. Mowry received a base salary increase of $49,437. This increase was intended to compensate Mr. Mowry for his increased responsibilities and to bring his

base salary closer to the 50th percentile for Chief Operating Officers in our peer group with the understanding that the amount of Mr. Mowry’s base salary would be revisited if he is appointed President and Chief Executive Officer on a non-interim basis. In February 2013, Mr. Mowry was appointed President and Chief Executive Officer on a non-interim basis and his base salary was increased to $450,000 to bring his base salary closer to the 50th percentile for CEOs in our peer group. Mr. Mowry’s base salary of $450,000 is still below the 25th percentile for CEOs in our peer group. The compensation committee believes this market positioning is appropriate in light of Mr. Mowry’s prior base salary and that this will be his first full year serving as President and Chief Executive Officer.

Short-Term Cash Incentive Compensation

Our short-term cash incentive compensation is typically paid as an annual cash bonus under our employee performance incentive compensation plan and in the case of Mr. Epinette, also under our French incentive compensation scheme.

Employee Performance Incentive Compensation Plan. Annual cash bonuses under our employee performance incentive compensation plan areis intended to compensate executives, as well as other employees, for achieving annual corporate financial and other performance goals and, in some cases, divisional financial goals, and, in most cases, individual performance goals.

For 2015, because of the timing of the Wright/Tornier merger, our named executive officers who were executives of legacy Tornier received a first half of 2015 pro-rated cash incentive based on legacy Tornier’s first half of 2015 performance and a second half of 2015 pro-rated cash incentive based on our combined company’s second half of 2015 performance. Our named executive officers who were executives of legacy Wright similarly received a first half of 2015 pro-rated cash incentive based on legacy Wright’s first half of 2015 performance and a second half of 2015 pro-rated cash incentive based on our combined company’s second half of 2015 performance.
All 2015 short-term cash incentive bonuses to our named executive officers, other than first half of 2015 bonuses to named executive officers who did not continue as executives of the combined company after the Wright/Tornier merger, were paid out in February 2016 and were dependent upon their continued service through the end of fiscal 2015. First half of 2015 pro-rated cash incentive bonuses to legacy Tornier executives who did not continue as executives of the combined company after the Wright/Tornier merger were paid in October 2015 shortly after completion of the merger pursuant to the terms of resignation agreements and releases entered into with such executives in connection with the merger.

146


Target bonus amounts (80%Bonuses Percentages. Target short-term cash incentive bonuses for 2015 for each executive were based on a percentage of base salary and were as follows for Mr. Kohrs, 75% for Mr. Rich and 50%each named executive officer:
Name First half of 2015 percentage of base salary Second half of 2015 percentage of base salary
Robert J. Palmisano 100% 100%
David H. Mowry 80% 80%
Lance A. Berry 60% 65%
Shawn T McCormick 50% 50%
Gregory Morrison 40% 50%
Terry M. Rich 75% 55%
James A. Lightman 50% 50%
Gordon W. Van Ummersen 50% 50%
In the case of the legacy Wright executives who previously elected to receive legacy Wright equity in lieu of prior base salary increases, the target bonus percentages were based on a percentage of their notional base salaries.
The first half of 2015 target bonus percentages for eachthe legacy Tornier named executive officers did not change from their 2014 levels. Based on an executive compensation analysis by Mercer in October 2013, the target bonus percentages for the legacy Tornier named executive officers were either at or below the 50th percentile for executives with similar positions in our peer group at that time, except in the case of Mr. Mowry, Mr. McCormickwhose target bonus percentage of 80% was slightly above the 25th percentile and Ms. Diersen and 40% of base salary for Mr. Epinettebelow the 50th percentile, and Mr. Klemz) were established under each named executive officer’s employment agreementRich, whose target bonus percentage of 75% was above the 75th percentile. The compensation committee set Mr. Rich’s target bonus percentage at the time such agreements were entered into. 75% to give him a competitive compensation package so we could hire him from his prior employer.
The 2012second half of 2015 target bonus percentages for our named executive officers did not change from their 2011first half of 2015 levels, except in the case of Messrs. Berry, Morrison, and Rich. Mr. Kohrs and Mr. Epinette. Mr. Kohrs’sBerry’s target bonus percentage was increased from 60% to 80% to bring his target short-term incentive opportunity and target cash compensation closer toalign him slightly above the 50th percentile since his target short-term incentive opportunity was below the 25th percentile and his target cash compensation was at the 25th percentile of our peer group before the increase.percentile. Mr. Epinette’sMorrison’s target bonus percentage was increased from 30% to 40%align his target bonus percentage with our other senior vice presidents. Mr. Rich’s target bonus percentage was decreased to bring hishim more in line with the target short-term incentive opportunity and target cash compensation closer to the 50th percentile since both his target short-term incentive opportunity and target cash compensation was below the 25th percentilebonus percentages of our other business group presidents and other executives with similar positions in our peer group before the increase.group. Based on an executive compensation analysis by Mercer in October 2012,2015, the target bonus percentages for our named executive officers were either at or belowslightly above the 50th percentile for executives with similar positions in our peer group, except in the case of Mr. Rich, whose target bonus percentage of 75% is closer tobetween the 50th and 75th percentile, and Mr. Morrison, whose target bonus percentage is at the 75th percentile. The compensation committee set Mr. Rich’s target bonus percentage at 75%
First Half of 2015 Performance Goals and Actual Bonuses to provide Mr.Legacy Tornier Executives. First half of 2015 bonuses to legacy Tornier executives, including Messrs. Mowry, McCormick, Morrison, Rich, a competitive compensation package to hire him from his then current employer. For 2013, the target bonus percentages for each of our named executive officers will remain the same, except that consistent with his new position as President and Chief Executive Officer, Mr. Mowry’s target bonus percentage was increased from 50% to 80%.

For 2012, payouts under our employee incentive compensation plan to our named executive officersVan Ummersen, were based upon achievement of corporate performance goals for all executives, divisional performance goals for two executives andplus individual performance goals for all executives, except our former PresidentMessrs. Mowry and Chief Executive Officer whose payout wasRich.

Named executive officer 
Percentage based upon
corporate
performance goals
 
Percentage based upon individual
performance goals
David H. Mowry 100% 0%
Shawn T McCormick 90% 10%
Gregory Morrison 80% 20%
Terry M. Rich 100% 0%
Gordon W. Van Ummersen 90% 10%

147

Table of Contents

The corporate performance metrics and their weightings for the first half of 2015 are set forth in the table below. These four metrics were selected because they were determined to be based solely upon achievementthe four most important indicators of the corporatelegacy Tornier’s financial performance goals.

Named executive officer

  Percentage based upon corporate
performance goals
  Percentage based upon
divisional performance goals
  Percentage based upon
individual performance goals
 

David H. Mowry

   90  0  10

Douglas W. Kohrs

   100  0  0

Shawn T McCormick

   90  0  10

Carmen L. Diersen

   90  0  10

Terry Rich

   20  70  10

Stéphan Epinette

   20  70  10

Kevin M. Klemz

   80  0  20

Consistent with the design for the 2012 payout for our former President2015 as evaluated by management and Chief Executive Officer, the payout under our 2013 employee performance incentive compensation plan for Mr. Mowry is based 100% upon achievement of corporate performance goals, with no divisional performance or individual performance components. Otherwise, the percentage split among corporate performance goals, divisional performance goals and individual performance goals is the same for our other named executive officers for 2013.

For 2012,analysts. Extremities revenue was weighted most heavily since that was intended to be legacy Tornier’s greatest focus in 2015.

First half of 2015 corporate performance metricWeighting
Adjusted extremities revenue50%
Adjusted EBITDA20%
Adjusted free cash flow20%
Adjusted total revenue10%
The table below sets forth the corporate performance goals related tofor the followingfirst half of 2015, the range of possible payouts, and the actual payout percentages for our legacy Tornier named executive officers based on actual performance metrics: adjusted revenue, adjusted gross margin as a percentage of revenue, adjusted EBITDA, adjusted revenue from new products and adjusted free cash flow.achieved. In each case, the goals were adjusted for certain items, including changes to foreign currency exchange rates and items that are unusual and not reflective of normal operations. The weightings for each ofoperations, which in 2015, included excluding the corporate performance metrics for purposes of determining the achievement of the corporate performance goals portion of the payout are set forth in the table below. The corporate performance goals for 2013 include the following three performance metrics from 2012: adjusted

revenue, adjusted EBITDA and adjusted free cash flow, and the weightings will be 60%, 20% and 20%, respectively. These three corporate performance goals were selected for 2013 because they were determined to be the three most important key indicatorsrevenues of our financial performance for 2013. Revenue is weighted more heavily since that is intended to be our greatest focus in 2013.

The table below sets forth the corporate performance metrics and goals for 2012SALTO® ankle products, which were established by our board of directors, upon recommendation of our compensation committee,divested in connection with the range of possible payouts, and the actual payout percentage for our named executive officers based on the actual performance achieved.Wright/Tornier merger. If performance achieved falls below the threshold level, there is no payout for such performance metric. If performance achieved falls between the threshold, target and maximum levels, actual payout percentages are determined on a sliding scale basis, with payouts for each performance metric starting at 50% of target for threshold performance achievement and capped at 150% of target for maximum achievement. For 2012,the first half of 2015, the total weighted-averageweighted‑average payout percentage applicable to the portion of the 2012first half of 2015 annual cashperformance incentive bonus tied to corporate performance goals was zero, as detailed in96.4% of target. Actual performance exceeded target for the table below, resulting in no payout based on the corporateadjusted EBITDA and free cash flow performance goals and was just below target for 2012.

                           Level  of
fiscal

2012
payout
 
                           
      Performance goals(1)  Payout percentage  2012
performance(2)
  

Performance metric

  Weighting  Threshold  Target  Maximum  Threshold  Target  Maximum   

Adjusted revenue(3)

   40 $287.3 mil.   $290.0 mil.   $295.2 mil.    50  100  150 $277.6 mil.    0.0

Adjusted gross margin % of revenue(4)

   15  72.0  72.4  73.3  50  100  150  71.8  0.0

Adjusted EBITDA(5)

   15 $40.3 mil.   $42.1 mil.   $46.3 mil.    50  100  150 $31.6 mil.    0.0

Adjusted revenue from new products(6)

   15 $14.1 mil.   $15.7 mil.   $17.3 mil.    50  100  150 $9.4 mil.    0.0

Adjusted free cash flow(7)

   15 $8.6 mil.   $9.1 mil.   $10.5 mil.    50  100  150 $0.2 mil.    0.0

the adjusted total and extremities revenue performance goals.
Performance goals(1)
Performance metric
Threshold
(50% payout)
Target
(100% payout)
Maximum
(150% payout)
First half of 2015
performance(2)
First half of 2015
bonus
Adjusted extremities revenue(3)
$153.3 mil.$157.3 mil.$161.3 mil.$156.1 mil.85.3%
Adjusted EBITDA(4)
16.8 mil.17.8 mil.19.6 mil.18.7 mil.125%
Adjusted free cash flow(5)
(14.8) mil.(11.8) mil.(9.8) mil.(11.3) mil.112.5%
Adjusted total revenue(6)
184.9 mil.189.9 mil.194.9 mil.186.2 mil.62.7%

(1)The performance goals were establishedcalculated using non-GAAP financial measures, which we believe provide meaningful supplemental information regarding our core operational performance. The performance goals were calculated based on an assumed foreign currency exchange rate and excluded the impact of the OrthoHelix acquisition.rate. For revenue, we assumed a foreign currency exchange rate of 1.29,1.33, which represented the actual reported average rate of foreign exchange in 2011.2014. For all other performance goals, we assumed a foreign currency exchange rate of 1.401.12 U.S. dollars for 1 Euro, which represented an anticipated average rate of foreign exchange for 20122015 and which was the foreign currency exchange rate used by our companyus for 20122015 budgeting purposes.
(2)The compensation committee determined 2012 payoutsfirst half of 2015 bonuses after reviewing ourlegacy Tornier’s unaudited financial statements, which were adjusted for changes to foreign currency exchange rates and which were subject to additional discretionary adjustment by the compensation committee for items that are unusual and not reflective of normal operations. For purposes of determining 2012 payouts, in addition to foreign currency exchange rate adjustments, the compensation committee made additional adjustmentsoperations as discussed in the notes below. Accordingly, the figures included in the “2012“First half of 2015 performance” column reflect foreign currency exchange rate and discretionary adjustments and differ from the figures reported in our 2012 auditedlegacy Tornier’s unaudited financial statements.statements for the six months ended June 28, 2015.
(3)“Adjusted extremities revenue” means ourlegacy Tornier’s extremities revenue for 2012, as adjusted for changes to foreign currency exchange rates.
(4)“Adjusted gross margin % of revenue” means our gross profit divided by our revenues for 2012,the six months ended June 28, 2015, as adjusted for changes to foreign currency exchange rates excluding the sales, cost of goods sold and all direct and integration costsrevenue related to OrthoHelix.legacy Tornier’s SALTO® ankle products which legacy Tornier divested in connection with the Wright/Tornier merger.
(5)
(4)“Adjusted EBITDA” means ourlegacy Tornier’s net loss for 2012, as adjusted for changes to foreign currency exchange rates, before interest income and expense, income tax expense and benefit, depreciation and amortization for the six months ended June 28, 2015, as adjusted further to give effect to, among other things, non-operating income and expense, foreign currency transaction gains and losses, share-based compensation, loss on extinguishment of debt, amortization of the inventory step-up from acquisitions inventory product rationalization charges due to acquisition, and special charges including facilities consolidationacquisition, integration and distribution transition costs, instrument use tax refund, restructuring charges, acquisition and integration costs, intangible impairments recorded due to acquisition, distribution channel change costs, management exitmerger-related costs, and one time bad debt expense charges in Italy.certain other items that affect the comparability and trend of legacy Tornier’s operating results.
(6)“Adjusted revenue from new products” means our revenue for 2012 attributable to new products, as adjusted for changes to foreign currency exchange rates. We define “new products” for purposes of this performance metric as a specific list of new products, launched during 2011, and approved by our compensation committee.
(7)(5)“Adjusted free cash flow” means legacy Tornier’s net cash flow generated from operationsprovided by operating activities for the six months ended June 28, 2015 less instrument investments and plant, property and equipment investments, and cash payments related to our facilities consolidation, as adjusted for changes to foreign currency exchange rates.

For 2012, payouts under our employee incentive compensation plan for two

148

Table of our named executive officers, Mr. Rich and Mr. Epinette, were based upon achievement of divisional performance goals. Since Mr. Rich is in charge of our U.S. commercial operations, 70% of his 2012 payout was based upon adjusted U.S. revenue, and since Mr. Epinette is in charge of our international commercial operations, 70% of his 2012 payout was based upon adjusted non-U.S. revenue. The table below sets forth the divisional performance goals for 2012, the range of possible payouts and the actual payout

percentage for Mr. Rich and Mr. Epinette based on actual performance achieved.

Performance

metric

  Performance goals   Payout percentage  2012
performance
   Level of
2012  payout
 
  Threshold   Target   Maximum   Threshold  Target  Maximum    

U.S. adjusted revenue

  $157.4 mil.    $158.9 mil.    $161.8 mil.     50  100  150 $148.7 mil.     0.0

Non-U.S. adjusted revenue

  $127.6 mil.    $128.8 mil.    $131.1 mil.     50  100  150 $127.4 mil.     0.0

As with the corporate performance goals, the compensation committee determined 2012 payouts after reviewing our U.S. and non-U.S. revenue in our unaudited financial statements for 2012, and which revenues were adjusted for changes to foreign currency exchange rates and further adjusted to exclude revenue resulting from our OrthoHelix acquisition. In addition, non-U.S. revenue did not include revenue from Canada since Mr. Epinette was not in charge of those operations during 2012. Accordingly, the actual U.S. and non-U.S. adjusted revenue used to determine Mr. Rich’s and Mr. Epinette’s 2012 payouts differ from the figures reported in our 2012 audited financial statements.

Contents


(6)“Adjusted total revenue” means legacy Tornier’s total revenue for the six months ended June 28, 2015, as adjusted for changes to foreign currency exchange rates and revenue related to legacy Tornier’s SALTO® ankle products which legacy Tornier divested in connection with the Wright/Tornier merger.
To foster cooperation and communication among our executives, ourthe compensation committee places primary emphasis on overall corporate and divisional performance goals rather than on individual performance goals. MostFor named executive officers, at least 80% of our executives’their legacy Tornier first half of 2015 annual cashperformance incentive plan payout wasbonuses were determined based on the achievement of corporate and divisional performance goals and only 20% or less waswere based on achievement of individual performance goals. In addition, no bonus payouts attributable to individual performance were to occur if the threshold adjusted EBITDA corporate performance goal was not achieved.
The individual performance goals used to determine the payoutbonuses under our employee performance incentive compensationlegacy Tornier’s plan arewere management by objectives, known internally as MBOs. Although MBOs are generally two to three to five written, measurablespecific and specificmeasurable objectives agreed to and approved by the executive, CEO and compensation committee in the beginning of the year. Allyear, for 2015, there was just one MBO that applied to all legacy Tornier executives with MBOs for the first half of 2015. The MBO related to activities in anticipation of the integration of legacy Wright and legacy Tornier. It was determined that such integration would be critical to the initial success of the merger and therefore the intent of just one MBO for 2015 was to focus executives on integration. The compensation committee determined that the legacy Tornier named executive officers achieved a 100% achievement of their MBOs.
First Half of 2015 Performance Goals and Actual Bonuses to Legacy Wright Executives. First half of 2015 bonuses to legacy Wright executives, including Messrs. Palmisano, Berry, and Lightman, were weighted, with areasbased upon achievement of critical importance or critical focus weighted most heavily. As100% corporate performance goals for Messrs. Palmisano and Berry and 75% corporate performance goals and 25% individual performance goals for Mr. Lightman.
The corporate performance metrics and their weightings for the first half of 2015 are set forth in the table below.
First half of 2015 corporate performance metricWeighting
Adjusted revenue from continuing operations(1)
67%
Adjusted gross margin from continuing operations(2)
33%
_________________
(1)This performance measure was calculated using a non-GAAP financial measure, which we believe provides meaningful supplemental information regarding our core operational performance. Adjusted revenue from continuing operations was calculated by excluding (a) the difference in foreign currency to a plan rate and (b) AUGMENT® Bone Graft revenues.

(2)This performance measure was calculated using a non-GAAP financial measure, which we believe provides meaningful supplemental information regarding our core operational performance. Adjusted gross margin from continuing operations was calculated by excluding (a) the difference in foreign currency to a plan rate; (b) AUGMENT® Bone Graft revenues; and (c) non-cash inventory step-up amortization.

Originally, three corporate performance metrics were selected by legacy Wright, including the two performance metrics described above and a third performance metric that was based on AUGMENT® Bone Graft revenues. However, in June 2015, a decision was made to eliminate the AUGMENT® Bone Graft revenue goal due to the delay in FDA approval of the product, and the remaining two goals were re-weighted as described above.
The percentage of the target bonus earned by bonus objective was based on the following performance levels:
Performance levelPercent of target bonus earned
Minimum0%
Threshold (50% payout)50.1% to 99.9%
Target (100% payout)100%
Above target (150% payout)100.1% to 150%
High (200% payout)150.1% to 200%


149

Table of Contents

A legacy Wright participant would not be paid for a performance metric where achievement was below the minimum performance goal. If the target performance goal was exceeded, legacy Wright would pay a bonus in excess of the target performance bonus. However, no legacy Wright participant would be paid an amount which exceeded twice the target performance bonus.
In setting the threshold, target, above target, and high performance achievement levels, legacy Wright considered past performance, market conditions, and the financial, strategic, and operational plans presented by management. When setting the target performance levels, legacy Wright sought to ensure that at- or above-market performance was the goal. For above target performance levels, the achievement levels required “stretch” performance by the management team to achieve this level of performance. At the threshold level, targets would be set on a steeper slope than at the above target/high categories, so that missed target performance would result in more rapidly declining bonus opportunity, and below the threshold level, generally no bonus was paid for that performance level.
The performance level of each corporate performance goal for the first half of 2015 for legacy Wright was based on the following:
Performance level Adjusted revenue from continuing operations Adjusted gross margin from continuing operations
Minimum <$138,400,000 <74.30%
Threshold (50% payout) $138,400,001 to $150,399,999 74.30% to 75.79%
Target (100% payout) $150,400,000 75.8%
Above target (150% payout) $150,400,001 to $155,000,000 75.81% to 76.80%
High (200% payout) $155,000,001 to $158,000,000 76.81% to 77.80%
For the first half of 2015, adjusted revenue from continuing operations was approximately $155,900,000 and adjusted gross margin from continuing operations was approximately 73.80%. Although the adjusted gross margin from continuing operations goal was not met, legacy Wright determined that a target bonus was appropriate in light of the effect of a shorter performance period on the achievement of that performance goal and the opportunity during the second half of 2015 to improve gross margins. Accordingly, legacy Wright determined that the overall weighted corporate performance achievement rating was 144% of target.
With respect to the individual performance goal component, legacy Wright determined that all legacy Wright executives with an individual performance goal component achieved 100% of their individual performance goals.
Second Half of 2015 Performance Goals and Actual Bonuses. Bonuses under our performance incentive plan to our named executive officers participated in a review process duringfor the beginningsecond half of 20132015 were based upon achievement of four corporate performance goals. To ensure alignment amongst executives at both legacy Wright and in connection with such review was rated (on a scale from onelegacy Tornier, the corporate performance goals were the same for all plan participants, and were as follows:
1.2016 Annual Operating Plan: Complete our 2016 annual operating plan and workforce planning by February 2016 board of directors meeting.
2.HPMS - Total Alignment: Complete High Performance Management System (HPMS) success tree to include the new mission, vision, values, and vital few initiatives for the combined company.
3.Continue Driving Core Business While Executing Integration: Achieved combined revenue growth of legacy Wright’s U.S. lower extremity and legacy Tornier’s global upper extremity products at 1.5x or greater of market.
4.Rapid AUGMENT® Adoption: Completed training of greater than 150 foot and ankle surgeons on AUGMENT® Bone Graft.

We selected these performance goals for the second half of 2015 to four with a ratingfocus our executives on integrating the businesses of three representing target or “on plan” performance) depending upon whether,legacy Wright and legacy Tornier as quickly and efficiently as possible, aligning our combined workforce towards our new combined company vision, mission and values, and continuing to grow our core extremities and biologics businesses at times, when, their MBOs for 2012 were achieved. These ratings were then used to determine the portion of the final bonus payout attributable to MBOs. above-market growth rates.
In the case of Mr. McCormick, who did not establish MBOs at the beginning of the year since he was not then an employee, the individual performance portion of his 2012 payout was determined byFebruary 2016, the compensation committee based upon, among other things, his self-assessmentdetermined an overall achievement rating of his 2012 individual performance.

150% of target.


150

Table of Contents

Total Performance Incentive Plan Bonuses. The MBOsfollowing table sets for eachthe first half of 2015 performance incentive plan bonuses and the second half of 2015 performance incentive plan bonuses for all named executive officer who had MBOs for 2012 related primarily to the continued implementation of a high performance management system that we established at the end of 2010. This system focuses executives’ efforts on our vital programs, action items and objectives to work toward fulfilling our corporate mission, vision and values. Mr. Mowry’s MBOs related to new product launches, clinical milestones for new products, product delivery and marketing alignment, facilities consolidation and manufacturing and supply chain improvements. Mr. Rich’s MBOs related to our U.S. commercial operations, including strategic planning and execution, organizational design, talent acquisition, performance management and compensation design. Mr. Epinette’s MBOs related to international revenues and expenses, new international products launched, the opening of an officeofficers, which bonuses will be paid in Japan and product sales in new countries. Mr. Klemz’s MBOs related to our compliance program, enterprise risk management, patent oversight, equity-based incentive award process and board and corporate governance matters. Our compensation committee determined that Messrs. Mowry, Rich, Epinette and Klemz achieved 103.8%, 100.0%, 102.5% and 100.0% of their respective MBOs, and approved payouts at these percentages for the portion of the executives’ bonuses tied to individual performance, or the MBOs,March 2016, except in the case of Mr. Epinette, whereMessrs. McCormick and Van Ummersen who received their first half of 2015 bonuses in October 2015:
Named executive officer First half of 2015 Second half of 2015 Total
Robert J. Palmisano $602,004
 $645,651
 $1,247,655
David H. Mowry 220,870
 358,200
 579,070
Lance A. Berry 162,113
 181,266
 343,379
Shawn T McCormick 90,724
 141,500
 232,224
Gregory Morrison 59,709
 115,238
 174,947
Terry M. Rich 128,874
 187,435
 316,309
James A. Lightman 117,084
 135,931
 253,015
Gordon W. Van Ummersen 87,885
 136,884
 224,769

Performance Incentive Plan Goals for 2016. In February 2016, the compensation committee approved an upward adjustment of €10,000 to recognize the performance of Tornier’s international business during 2012. For Mr. McCormick who did not have any formal MBOsgoals for 2012 since he commenced his employment in September 2012, the compensation committee determined that he achieved an individualour performance payout at 100.0% based primarily on his self-assessment and the assessment by the CEO and compensation committee.

For 2012, the payoutincentive plan for 2016. The 2016 target bonus percentages attributable to corporate and divisional performance represented between 20% and 90% and individual performance represented 10% or 20% of the overall annual cash incentive bonus payouts for thoseour named executive officers that received 2012 bonuses, which resulted in payouts at approximately the following aggregate percentages: (i) Mr. Mowry – 10.38%, (ii) Mr. McCormick – 10.00%, (iii) Mr. Rich – 10.00%, (iv) Mr. Epinette – 21.58%, and (v) Mr. Klemz – 20.00%. As a result of a termination of their employment during 2012, Mr. Kohrs and Ms. Diersen were not eligible to receive and did not receivechange from their second half of 2015 levels. Consistent with the design for the second half of 2015 plan, the annual cash incentive bonus payouts for 2012.

The table below sets forth, with respect to each named executive officer, the maximum potential bonus opportunity as a percentage of base salary and the actual bonus paid under the employee performance incentive compensation plan for 2012, both in amount and as a percentage of 2012 base earnings:

Name


Maximum potential
bonus as percentage of
base salary

  Actual
bonus paid
($)
   Actual bonus paid as a
percentage of

2012 base earnings
 

David H. Mowry

  75% (150% of 50%)   17,666     5.2

Douglas W. Kohrs

  120% (150% of 80%)   0     0

Shawn T McCormick(1)

  75% (150% of 50%)   5,710     5.0

Carmen L. Diersen

  75% (150% of 50%)   0     0

Terry M. Rich(1)

  113% (150% of 75%)   21,185     7.5

Stéphan Epinette(2)

  60% (150% of 40%)   25,395     8.6

Kevin M. Klemz

  60% (150% of 40%)   22,825     8.0

(1)Mr. McCormick’s and Mr. Rich’s 2012 annual cash incentive payouts were pro-rated since they did not serve as executives during the entire 2012 fiscal year.
(2)A rate of one Euro to $1.33329 was used to convert Mr. Epinette’s bonus paid into U.S. dollars.

For 2013, thereour CEO will be no payouts attributable to individual performance for our executive officers and certain other employees if a threshold level of performance for the corporate performance goal, adjusted EBITDA, is not met.

French Incentive Compensation Scheme.In addition to participating in our employee performance incentive compensation plan, Mr. Epinette participates in an incentive compensation schemebased 100% on the same basis as other employees of our French operating subsidiary. This scheme enables our French operating subsidiary to provide its employees with a form of compensation that is efficient with respect to income tax and mandated social contributions in France. The payments made under the French incentive compensation scheme, which receives preferential tax treatment, are exempted from social security contributions. Under the French incentive compensation scheme, employees of our French operating subsidiary may receive an annual incentive cash payment equal to a specified percentage of their base salary, up to certain statutory limits. In 2012, employees were eligible to receive up to 16% of base salary, up to a statutory limit of €17,676. For 2012, annual incentive payments were dependent on the achievement of performance goals relating to adjusted revenue, adjusted EBITDA, adjusted revenue over net value of implants and instruments and on-time delivery to market of certain new products. In each case these amounts are adjusted for certain items similar to the adjustments that apply to the corporate performance goals, established underwith no individual performance components. Bonuses for our employeeother named executive officers will be based 100% on achievement of corporate performance incentive compensation plan.

goals for Messrs. Mowry and Berry and 80% on achievement of corporate performance goals and 20% on achievement of individual goals for Messrs. Morrison and Lightman. Mr. Rich's 2016 bonus will be based 40% on corporate performance goals and 60% on divisional goals. The table below sets forth the 2012 financialcorporate performance metricsmeasures for the French incentive compensation scheme, the range of possible payouts for Mr. Epinette, and the estimated actual payout percentage for Mr. Epinette2016 will be based on our adjusted net sales, adjusted net sales of AUGMENT® Bone Graft, adjusted EBITDA, and adjusted free cash flow.

Additional Short-Term Cash Incentive Bonus to Van Ummersen. In connection with his departure from the performance achieved. If performance achieved falls betweencompany, we paid an additional $100,000 integration bonus to Mr. Van Ummersen, which we agreed to pay him under his resignation agreement and release of claims if he successfully completed the thresholdtransition of accounts to the purchaser of legacy Tornier’s U.S. SALTO® ankle and target/maximum levels, actual payout percentages are determined on a sliding scale basis, with payouts starting at 0.25% of base salary for minimum performance achievement and capped at 4% of base salary for target/maximum achievement. The actual payout percentages and Mr. Epinette’s actual 2012 incentive payment amount under the French incentive compensation scheme will be determined, on a final basis, and paid during mid-2013 after the French employee committee meets and approves the final payouts. It is anticipated that the actual payout percentages for Mr. Epinette’s actual 2012 payment amount will be as set forth in the table below, resulting in an anticipated payment of the maximum statutory limit of €17,676.

          Payout    
      Performance goals(1)   Threshold
(% of  base
salary)
  Target/max.
(% of
base
salary)
  2012
performance(2)
  Level  for
2012
payment
 

Performance metric

  Weighting  Threshold   Target/max.(3)      

Adjusted revenue(4)

   25 $249.6 million    $293.7 million     0.25  4 $278.2 million    2.5

Adjusted EBITDA(5)

   25 $39.4 million    $46.4 million     0.25  4 $31.6 million    0.0

Adjusted revenue/net value of implants and instruments(6)

   25  1.79     2.10     0.25  4  2.09    3.8

On-time delivery to market of new products(7)

   25  N/A     N/A     0.25  4  100  4.0

(1)The performance goals excluded the impact of the OrthoHelix acquisition and were established based on an assumed foreign currency exchange rate of 1.40 U.S. dollars for 1 Euro, which represented an anticipated average rate of foreign exchange for 2012 and which was the rate of foreign exchange used by our company for 2012 budgeting purposes.
(2)

The compensation committee determined incentive payment amounts after reviewing our unaudited financial statements for the applicable year, which were adjusted for changes to the foreign currency exchange rates and which were subject to further discretionary adjustment by our compensation committee for items that are unusual and not reflective of normal operations. For purposes of determining 2012 bonus amounts, in addition to foreign currency exchange adjustments, the compensation

committee made additional adjustments discussed in the notes below. Accordingly, the figures included in the “2012 performance” column reflect foreign currency exchange rate and discretionary adjustments and differ from the figures reported in our 2012 audited financial statements.
(3)Under the French incentive compensation scheme, the maximum possible payout is 16% of base salary, up to a statutory limit of €17,676, which is based on 100% achievement of target levels. Therefore, target and maximum performance and payout amounts are the same for the purposes of the French incentive compensation scheme.
(4)“Adjusted revenue” means our revenue for 2012, as adjusted for changes to the foreign currency exchange rates and the impact of the OrthoHelix acquisition.
(5)“Adjusted EBITDA” means our net loss for 2012, as adjusted for changes to foreign currency exchange rates, before interest income and expense, income tax expense and benefit, depreciation and amortization, as adjusted further to give effect to non-operating income and expense, foreign currency transaction gains and losses, share-based compensation, loss on extinguishment of debt, amortization of the inventory step-up from acquisitions, inventory product rationalization charges due to acquisition, and special charges including facilities consolidation charges, acquisition and integration costs, intangible impairments recorded due to acquisition, distribution channel change costs, management exit costs, and one time bad debt expense charges in Italy.
(6)“Adjusted revenue/net value of implants and instruments” means revenue for 2012, adjusted as described in note (4) above, divided by the net value of our inventory of raw materials, semi-finished products, and finished goods inventory in warehouses and with customers, excluding the inventory for OrthoHelix, plus the net value of implants and instruments, subject to adjustment for changes to the foreign currency exchange rates and excluding the instruments for OrthoHelix.
(7)“On-time delivery to market of new products” means the timely release of certain new, strategic products by specific dates. The target/maximum payout amount with respect to this metric assumes the timely release of all new products scheduled to be delivered for a given year, whereas the threshold payout amount is determined by dividing 4% (the target/maximum payout for this metric) by the number of new products scheduled to be delivered for a given year.

certain toe products.

Long-Term Equity-Based Incentive Compensation
Generally

Generally. OurThe compensation committee’s primary objectives with respect to long-term equity-based incentives are to align the interests of our executives with the long-term interests of our shareholders, promote stock ownership, and create significant incentives for executive retention. Long-term equity-based incentives typically comprise a significant portion of each named executive officer’s compensation package, consistent with our executive compensation philosophy that at least half of the CEO’s compensation and one-third of other executives’ compensation opportunity should be in the form of stock-based incentive awards. For 2012, equity-based compensation comprised 49% and 61% of

In June 2015, our shareholders approved the total compensation for the two individuals serving as our CEO during the year and ranged from 37% to 79% of the total compensation for our other named executive officers who served as executives at the time of grant, assuming grant date fair value for equity awards. The executives with the higher percentage of equity-based compensation are those that joined our company in 2012 and thus received higher talent acquisition grants during 2012.

Before our initial public offering in February 2011, we granted stock options under our prior stock option plan, which is now the TornierWright Medical Group N.V. Amended and Restated Stock Option Plan and referred to in this report as our prior stock option plan. As of February 2, 2011, we ceased making grants under our prior stock option plan and subsequently have granted stock options and other equity-based awards under our new stock incentive plan, the Tornier N.V. 2010 Incentive Plan, referredwhich we refer to in this report as our stock incentive plan. Both our board of directors and shareholders have approved our stock incentive plan, under which our named executive officers (as well as other executives and key employees) are eligible to receive equity-based incentive awards. For more information on the terms of our stock incentive plan, see “Executive Compensation—“-—Grants of Plan-Based Awards— TornierAwards- Wright Medical Group N.V. Amended and Restated 2010 Incentive Plan.Plan.” All equity-based incentive awards granted to our named executive officers during 20122015 were made under our stock incentive plan.

To assist our board of directors in granting, and our compensation committee and management in recommending the grant of, equity-based incentive awards, our compensation committee, on recommendation of Mercer, in February 2012, adopted long-term incentive grant guidelines. In addition to our long-term incentive grant guidelines, our board of directors has adopted a stock grant policy document, which includes policies that our board of directors and compensation committee follows in connection with granting equity-based incentive awards, including the long-term incentive grant guidelines.

Types of Equity Grants. Under our long-term incentive grant guidelines, and our policy document, our board of directors, on recommendation of the compensation committee, generally grants three types of equity-based incentive awards to our named executive officers: performance recognition grants, talent acquisition grants, and special recognition grants. On limited occasion, our compensation committee may grant purely discretionary awards.awards may be granted. During 2012, only2015, annual performance recognition grants and talent acquisition grants in the form of special, one-time “re-up” grants were made to one or more of our named executive officers.officers, as described in more detail under “—

2015 Equity Awards.”

Performance recognition grants are discretionary annual grants that are historically made during mid-year to give the compensation committee another formal opportunity during the year to review executive compensation and recognize executive and other key employee performance. In July 2012, theDuring 2015, annual performance recognition grants were approved by the boardgranted in October 2015 after

151

Table of directors, on recommendationContents

completion of the compensation committee, butWright/Tornier merger as opposed to in mid-year due to restrictive covenants on the grant dateof new equity awards during the pendency of the awards was effective as of the third full trading day after the release of our second quarter earnings in August 2012. merger.
The recipients and the size of the annual performance recognition grants are determined on a preliminary basis, by each executive with input from their management team and based on our long-term incentive grant guidelines and the 10-trading day average closing sale price of our ordinary shares as reported by the NASDAQ Global Select Market. Grants are determined one week before the corporate approval of the awards, and then are ultimately approved by our board of directors, on recommendation by the compensation committee.guidelines. Under our long-term incentive grant guidelines for annual performance recognition grants, our named executive officers receivereceived a certain percentage of their respective base salaries in stock options and stock grant awards (granted in the form of restricted stock units and referred to as stock awards or RSUs in this CD&A and elsewhere in this report), as set forth in more detail in the table below.

Once the target total long-term equity value is determined for each executive based on the executive’s relevant percentage of base salary, half of the value is provided in stock options and the other half is provided in stockRSU awards. The reasons we use stock options and stock awards are described below under the headings “—Stock Options” and “—Stock Awards.” The target dollar value to be delivered in stock options (50% of the target total long-term equity value) is divided by the Black-Scholes value of one ordinary share to determine the number of stock options, which may then be rounded to the nearest whole number or in some cases multiple of 100. The number of stock awards is calculated using the intended dollar value (50% of the target total long-term equity value) divided by the 10-trading day average closing sale price of our ordinary shares as reported by the NASDAQ Global Select Market and as determined one week before the date of anticipated corporate approval of the award, which number may then be rounded to the nearest whole number or in some cases multiple of 100. Typically, the number of ordinary shares subject to stock awards is fewer than the number of ordinary shares that would have been covered by a stock option of equivalent target value. The actual number of stock options and stock awards granted may then be pared back so that the estimated run rate dilution under our stock incentive plan is acceptable to our compensation committee (i.e., approximately 2.75% for 2012). The CEO next reviews the preliminary individual awards and may make recommended discretionary adjustments. Such proposed individual awards are then presented to the compensation committee, which also may make discretionary adjustments before recommending awards to our board of directors for approval. After board approval, awards are issued,Consistent with the exercise price of the stock options equal to the closing price of our ordinary shares on the grant date. In determining the number of stock options or stock awards to make to an executive as part of a performance recognition grant, previous awards, whether vested or unvested, granted to such individual have no impact.

The table below describes our long-term incentive grant guidelines for annual performance recognition grantsprinciple that applied to our named executive officers for 2012. Mr. McCormick and Ms. Diersen are not listed in the table because they did not receive annual performance recognition grants for 2012. As described below under “—2012 Equity Awards,” because of the disappointing financial performance of the company, the compensation committee approved equity awards for each of these named executive officers with dollar values less than the incentive grant guidelines amount.

Named executive officer

  Grade level   Incentive grant guideline
expressed as % of base salary for
grade level
  Incentive grant  guideline
dollar value of
long-term incentives ($)
 

David H. Mowry

   9     175  587,235  

Douglas W. Kohrs

   11     275  1,425,848  

Terry M. Rich

   8     125  437,500  

Stéphan Epinette(1)

   8     125  339,274  

Kevin M. Klemz

   8     125  358,051  

(1)A rate of one Euro to $1.23 was used to convert Mr. Epinette’s base salary into U.S. dollars for purposes of determining his long-term incentive grant guideline.

We seek to align the interests of our executives should be aligned with those of our shareholders by providing a significant portion of compensation in equity-based awards. Consistent with this principle,and that the portion of an executive’s total compensation that varies with performance and is at risk should increase with the executive’s level of responsibility. Thus,responsibility, incentive grants, expressed as a percentage of base salary and dollar values, increase as an executive’s level of responsibility increases. The incentive grant guidelines were benchmarked by Mercer against our peer group.

Talent acquisition

The table below describes our long-term incentive grant guidelines for annual performance recognition grants are madethat applied to our named executive officers for 2015. Neither Mr. McCormick nor Mr. Van Ummersen had an incentive grant guideline for 2015 since they were leaving the company.
Named executive officer Grade level 
Incentive grant guideline
expressed as % of base salary
 
Dollar value of
incentive grant guideline (1) ($)
Robert J. Palmisano 13 400% $3,477,600
David H. Mowry 12 250% 1,555,000
Lance A. Berry 11 175% 682,500
Shawn T McCormick N/A N/A N/A
Gregory Morrison 10 125% 456,250
Terry M. Rich 10 100% 384,500
James A. Lightman 10 125% 457,625
Gordon W. Van Ummersen N/A N/A N/A

(1)The dollar value of the incentive grant guideline that applied for the 2015 equity grants to the legacy Wright executives was based on a base salary that reflected a 4% merit increase rather than the 6% merit increase that they received.
Once the target total long-term equity value was determined for each executive based on the executive’s relevant percentage of base salary, half of the value was provided in stock options and the other half was provided in RSU awards. The reasons why we use stock options and RSU awards are described below under “—Stock Optionsand “—RSU Awards.”
Talent acquisition grants are used for new hires. These grants of options and RSU awards are considered and approved by our board of directors, upon recommendation of ourthe compensation committee, as part of the

executive’s compensation package at the time of hire (with the grant date and exercise price delayed until the hire date)date or the first open window period after board approval of the grant). As with our performance recognition grants, the size of our talent acquisition grants is determined by dollar amount (as opposed to number of underlying shares), and under our long-term incentive grant guidelines, is generally two times the long-term incentive grant guidelines for annual performance recognition grants. We have set talent acquisition grants, at two times the long-term incentive grant guidelines for annual performance recognition grants, upon recommendationas recommended by Mercer. We recognize that higher initial grants often are necessary to attract a new executive, especially one who may have accumulated a substantial amount of equity-based long-term incentive awards at a previous employer that would typically be forfeited upon acceptance of employment with us. In some cases, we may need to further increase a talent acquisition grant to attract an executive.

Our compensation committee Although no talent acquisitions grants were made during 2015, we made special one-time “re-up” grants to all of our named executive officers other than Messrs. McCormick and Van Ummersen in October 2015 together with the annual performance recognition grants. The purpose of these “re-up” grants was to encourage these executives to stay with our combined company after completion of the Wright/Tornier merger by partially restoring their unvested equity retention value and, in some cases, to facilitate the transition of executives into new roles. The amount of these “re-up” grants was based on what we typically grant in connection with talent acquisition grants and was benchmarked by Mercer and found to be aligned with market practice of award sizes for new hires who would similarly have no unvested equity awards.

In addition to our annual performance recognition grants and talent acquisition grants, from time to onetime, we may make special recognition grants or more of our nameddiscretionary grants to executive officers during 2012, as described in more detail below under “—2012 Equity Awards.”

for retention or other purposes. Such grants may vest based on the passage of time and/or the achievement of certain performance goals.

Stock Options. Historically, we have granted stock options to our named executive officers, as well as other key employees. We believe that options effectively incentivize employees to maximize company performance, as the value of awards is directly tied to an appreciation in the value of our ordinary shares. They also provide an effective retention

152

Table of Contents

mechanism because of vesting provisions. An important objective of our long-term incentive program is to strengthen the relationship between the long-term value of our ordinary shares and the potential financial gain for employees. Stock options provide recipients with the opportunity to purchase our ordinary shares at a price fixed on the grant date regardless of future market price. The vesting of our stock options is generally time-based. Consistenttime-based, with our historical practice, 25% of the shares underlying the stock option typically vestvesting on the one-year anniversary of the grant date (or if later, on the hire date) and the remaining 75% of the underlying shares vestvesting over a three-year period thereafter in 1236 nearly equal quarterlymonthly installments. Our policy is to grant options only with an exercise price equal to or more than the fair market value of ouran ordinary sharesshare on the grant date.

Because stock options become valuable only if the share price increases above the exercise price and the option holder remains employed during the period required for the option to vest, they provide an incentive for an executive to remain employed. In addition, stock options link a portion of an employee’s compensation to the interests of our shareholders by providing an incentive to achieve corporate goals and increase the market price of our ordinary shares over the four-year vesting period.

To comply with Dutch insider trading laws, we

We typically time our option grants to occur on the third trading day after the public release of our financial results for our most recently ended quarter and on the first fullquarter. As a Dutch company, we must comply with Dutch insider trading day thereafter that is not during a “closed period” for our French employees (including Mr. Epinette).

laws which prohibit option grants when we are aware of material nonpublic information.

StockRSU Awards. StockRSU awards are intended to retain key employees, including our named executive officers, through vesting periods. StockRSU awards provide the opportunity for capital accumulation and more predictable long-term incentive value than stock options. All of our stockRSU awards are stock grants in the form of restricted stock units, which is a commitment by us to issue ordinary shares at the time the stockRSU award vests.

The specific terms of vesting of a stockan RSU award dependdepends on whether the award is a performance recognition grant or talent acquisition grant. Performance recognition grants of stockRSU awards are made mid-year and vest in four annual installments on June 1st1st of each year. Talent acquisition grants of stockRSU awards to new hires vest in a similar manner, except that the first installment is often pro-rated, depending on the grant date. Due

2015 Equity Awards. The table below sets forth the number of stock options and RSU awards granted to the provisions of local law and the terms of our French sub-plan under our stock incentive plan, stock awards issued to our French employees (including Mr. Epinette) vest on a different schedule than the one described above for stock awards. These stock awards vest and become issuable as to 50% of the underlying shares on the first June 1st after the second year anniversary of the grant date and thereafter vest, on a cumulative basis, as to 25% of the underlying shares on June 1stof each subsequent year.

2012 Equity Awards. Our board of directors, on recommendation of the compensation committee, made annual performance recognition grants and talent acquisition grants to one or more of our named executive officers during 2012.

The table below describes the actual performance recognition grants made to our named executive officers in 2012 and the applicable long-term incentive grant guideline for such performance recognition grants for these executives. Since neither2015. Neither Mr. McCormick nor Ms. Diersen was employed at the time of the performance recognition grants, neitherMr. Van Ummersen received a grant for 2012 and they are not listed in the table below. Because of the disappointing financial performance of the company, the compensation committee approved equity awards for each of these named executive officers with dollar values less thanduring 2015 since they were leaving the incentive grant guidelines.

Named executive officer

  Stock
options
   Stock
awards
   Actual award value per
long-term incentive
grant guideline(1)

($)
   Difference between actual
award value per long-
term  incentive grant
guideline and guideline(1)

($)
 

David H. Mowry

   23,365     10,678     452,961     (134,274

Douglas W. Kohrs

   51,987     23,758     1,007,814     (418,034

Terry M. Rich

   14,443     6,601     280,014     (157,486

Stéphan Epinette(2)

   17,501     7,998     339,274     0  

Kevin M. Klemz

   15,515     7,090     300,758     (57,293

(1)The value per long-term incentive grant guideline of the annual performance recognition grants is based on the value calculated under our long-term incentive grant guidelines and does not necessarily match the grant date fair value of the equity awards under applicable accounting rules and as set forth in the Grants of Plan Based Awards Table later in this report.
(2)A rate of one Euro to $1.23 was used to convert Mr. Epinette’s base salary into U.S. dollars for purposes of determining his long-term incentive grant guideline.

Since Mr. McCormick and Mr. Rich joined Tornier as new executives in 2012, they received talent acquisition grants in 2012. The table below describes the 2012 talent acquisition grants made to Mr. McCormick and Mr. Rich and the long-term incentive grant guidelines for these grants:

Named executive officer

  Stock
options
   Stock
awards
   Value of
long-term incentive grant
guideline(1)

($)
 

Shawn T McCormick

   42,645     19,531     875,000  

Terry M. Rich

   55,690     21,220     875,000  

(1)The value per long-term incentive grant guideline of the talent acquisition grants is based on the value calculated under our long-term incentive grant guidelines and does not necessarily match the grant date fair value of the equity awards under applicable accounting rules and as set forth in the Grants of Plan Based Awards Table later in this report.

company.

  Annual performance recognition grants Special one-time re-up grants
Named executive officer 
Stock
options
 
RSU
awards
 
Stock
options
 
RSU
awards
Robert J. Palmisano 239,481 82,761 598,702 206,901
David H. Mowry 107,083 37,006 214,167 74,012
Lance A. Berry 47,000 16,242 70,499 24,363
Shawn T McCormick N/A N/A N/A N/A
Gregory Morrison 31,419 10,858 47,129 16,287
Terry M. Rich 26,478 9,150 39,717 13,726
James A. Lightman 31,514 10,891 47,271 16,336
Gordon W. Van Ummersen N/A N/A N/A N/A

Additional information concerning the long-term incentive compensation information for our named executive officers for 20122015 is included in the Summary Compensation Table and Grants of Plan-Based Awards Table later in this report.

under the heading “Executive Compensation Tables and Narratives.”

All Other Compensation

Retirement Benefits.In 2012, each of2015, our named executive officers had the opportunity to participate in retirement plans maintained by our operating subsidiaries, including our U.S. operating subsidiary’sa 401(k) plan, and, with respect to Mr. Epinette, our French operating subsidiary’s government-mandated pension plan and a government-mandated pension plan for managerial staff, or the Retraite Complémentaire, on the same basis as our other employees. We believe that these plans provide an enhanced opportunity for our executives to plan for and meet their retirement savings needs. Mr. Epinette also participated in our French operating subsidiary’s defined contribution pension plan for key employees, or the Retraite Supplémentaire, on the same basis as other key employees. The Retraite Supplémentaire is intended to supplement the state pension plans mandated by French labor laws and to provide participants with a form of compensation that is efficient with respect to income tax and mandated social contributions. Except for these plans, we do not provide pension arrangements or post-retirement health coverage for our employees, including our named executive officers. We also do not provide any nonqualified defined contribution or other deferred compensation plans.


153

Table of Contents

RelocationPerquisites and Other Benefits. We provide new hiresour executive officers with modest perquisites to attract and employees who we requestretain them. The perquisites provided to relocate with standard, market competitive reimbursements of and paymentsour executives during 2015 included $1,000 for certain relocation benefits. In July 2011, Mr. Mowry, who owned a homepersonal insurance premiums and lived in California, commenced employment as our then new Chief Operating Officer. We reimbursed Mr. Mowryup to $5,000 reimbursement for certain relocation expenses, such as moving expenses, as included in the “All other compensation” column of the Summary Compensation Tablefinancial and quantified in the related note to that column.tax planning and tax preparation. In addition, to ease his move and transition to the Minneapolis/St. Paul area, we agreedare required to provide Mr. Mowry a monthly housing stipend of $3,000 for 24 months for his rental payments and utilities for housing in or near Minneapolis/St. Paul and/or maintaining his home in California. The amount of the monthly housing stipend was determined based on average monthly rentals for an apartment in downtown Minneapolis. In addition, in March 2012, Mr. Rich, who owned a home and lived in California, commenced employment as our new Senior Vice President, U.S. Commercial Operations. We reimbursed Mr. Rich for certain relocation expenses, such as moving expenses,CEO additional perquisites under the terms of his employment agreement, which we agreed upon at the time of his initial hiring by legacy Wright to attract him to our relocation policycompany. These additional perquisites include payment of certain legal fees, additional reimbursement for financial and as included intax planning and tax preparation, a monthly allowance of $7,500 for housing and automobile expenses, reimbursement for reasonable travel expenses between Memphis, Tennessee and his residences, and an annual physical examination. To the “All other compensation” columnextent that the reimbursements for his housing and automobile expenses and travel expenses between Memphis, Tennessee and his residences are not deductible by Mr. Palmisano for income tax purposes, such amounts are “grossed-up” for income tax purposes so that the reimbursed items will be received net of any deduction for income and payroll taxes. We agreed to this gross-up provision at the time of his initial hiring by legacy Wright to attract him to our company and ease the financial burden on him to travel between Memphis, Tennessee and his residences. We believe these perquisites are an important part of our overall compensation package and help us accomplish our goal of attracting, retaining, and rewarding top executive talent. The value of all of the Summary Compensation Table and quantified in the related note to that column.

Contingent Sign-On Bonus. Under Mr. McCormick’s employment agreement, we agreed to pay him a $75,000 sign-on bonus, contingent on his employment for at least one year. We believe that this payment assisted in our ability to hire Mr. McCormick.

Perquisites and Other Benefits.Our named executive officers receive other benefits, which also are received by our other employees, including the opportunity to purchase our ordinary shares at a discount with payroll deductions under our tax-qualified employee stock purchase plan, and health, dental and life insurance benefits. We provide limited additional modest perquisites provided to our named executive officers only on a case-by-case basis, including the housing stipend for Mowry described above2015 can be found under “Executive Compensation Tables and an automobile allowanceNarrativesAll Other Compensation for Mr. Epinette. We provided Mr. Epinette with an automobile allowance on the same basis as other key employees of our French operating subsidiary pursuant to our company policy, which we believe is necessary in light of the competitive market for talent in our industry.2015-Supplemental

.”

Change in Control and Post-Termination Severance Arrangements

Change in Control Arrangements. To encourage continuity, stability and retention when considering the potential disruptive impact of an actual or potential corporate transaction, we have established change in control arrangements, including provisions in our prior stock option plan, current stock incentive plan and written employmentequity-based compensation plans, separation pay agreements with our executives, and other key employees.our employment agreement with our CEO, which are described in more detail below and under “Executive Compensation Tables and NarrativesPotential Payments Upon a Termination or Change in Control.” These arrangements are designed to incentivize our executives to remain with theour company in the event of a change in control or potential change in control.
Both legacy Wright and legacy Tornier had similar provisions that were triggered upon completion of the Wright/Tornier merger. Actual payments and benefits provided to our named executive officers as a result of the merger are described and quantified under “Executive Compensation Tables and NarrativesPotential Payments Upon a Termination or Change in ControlActual Payments to Named Executive Officers in Connection with the Wright/Tornier Merger.” We believe these provisions served their intended purpose as the management teams of both legacy Wright and legacy Tornier remained intact through the completion of the merger.
Under the terms of our current stock incentive plan and the individual award documents provided to recipients of awards under that plan, all stock options and stockRSU awards will become immediately vested (and, in the case of options, exercisable) upon the completion of a change in control of theour company. For more information, see “Executive Compensation—“Executive Compensation Tables and NarrativesPotential Payments Upon a Termination or Change in Control—ControlChange in Control Arrangements—Generally.Arrangements.” Thus, the immediate vesting of stock options and stockRSU awards is triggered by the change in control, itself, and thus is known as a “single trigger” change in control arrangement. We believe our “single trigger” equity acceleration change in control arrangements provide important retention incentives during what can often be an uncertain time for employees. They also provide executives with additional monetary motivation to focus on and complete a transaction that our board of directors believes is in the best interests of our company and shareholders rather than seekingto seek new employment opportunities. We also believe that the immediate acceleration of equity-based awards aligns the interests of our executives and other employees with those of our shareholders by allowing our executives to participate fully in the benefits of a change in control as to all of their equity. If an executive were to leave before the completion of the change in control, non-vested awards held by the executive would terminate.

In addition, we have entered into an employment agreement with our CEO and separation pay agreements with our other named executive officers and other officers towhich provide certain payments and benefits in the event of a change in control, mosttermination of which are payable only in the event their employment is terminated in connection with thea change in control (“double-trigger” provisions).control. These “double-trigger” change in control protections were initially offeredare intended to induce the executives to accept or continue employment with our company, provide consideration to an executiveexecutives for certain restrictive covenants that apply following a termination of employment, and provide continuity of management in connection with a threatened or actual change in control transaction. If thean executive’s employment is terminated without cause or by the executive for “good reason” (as defined in the employment agreements) within 12 months (24 months for our CEO) following a change in control, the executive will be entitled to receive a lump sum severance payment equal to his or her base salary plus target bonus for the year of termination, health and welfare benefit continuation for 12 months following termination and accelerated vesting of all unvested options and stock awards.certain benefits. These arrangements and a quantification of the payment and benefits provided under these arrangements are described in more detail under “Executive Compensation—Executive Compensation Tables and NarrativesPotential Payments Upon a Termination or Change in Control—Change in Control Arrangements..Other than the immediate acceleration of equity-based awards which we believe aligns our executives’ interests with those of our shareholders by allowing executives to participate fully in the benefits of a change in control as to all of their equity, in order for our named executive officers to receive any other payments or benefits as a result of a change in control of our company, there must be a termination of the executive’s employment, either by us without cause or by the executive for good reason. The termination of the executive’s employment by the executive without good reason will not give rise to additional payments or benefits either in a change in control situation or otherwise. Thus, theseThese additional payments and benefits will not just be triggered just by a change in control, but also will require a termination event not within the control of the executive, and thus are known as “double trigger” change in control arrangements. As opposed to the immediate acceleration of equity-based awards, we believe that other change in control payments and benefits should properly be tied to

154

Table of Contents

termination following a change in control, given the intent that these amounts provide economic security to ease in the executive’s transition to new employment.

We believe our change in control arrangements are an important part of our executive compensation program in part because they mitigate some of the risk for executives working in a smaller company where there is a meaningful likelihood that the company may be acquired. Change in control benefits are intended to attract and retain qualified executives who, absent these arrangements and in anticipation of a possible change in control of our company, might viewconsider seeking employment alternatives to be less risky than remaining with our company through the transaction. We believe that relative to theour company’s overall value, our potential change in control benefits are relatively small. We confirm this belief on an annual

basis by reviewing a tally sheet for each executive that summarizes the change in control and severance benefits potentially payable to each executive. We also believe that the form and amount of such benefits are reasonable in light of those provided to executives by companies in our peer group and other companies with which we compete for executive talent and the amount of time typically required to find executive employment opportunities. We, thus, believe we must continue to offer such protections in order to remain competitive in attracting and retaining executive talent.

Other Severance Arrangements. Each of our named executive officers who continued as an executive officer of the combined company is entitled to receive severance benefits upon certain other qualifying terminations of employment, other than a change in control, pursuant to the provisions of such executive’san employment agreement.agreement for our CEO and separation pay agreements for our other named executive officers. These severance arrangements were initially offeredare intended to induce the executives to accept or continue employment with our company and are primarily intended to retain our executives and provide consideration to an executivethose executives for certain restrictive covenants that apply following a termination of employment. Additionally, we entered into the employmentthese agreements because they provide us valuable protection by subjecting the executives to restrictive covenants that prohibit the disclosure of confidential information during and following their employment and limit their ability to engage in competition with us or otherwise interfere with our business relationships following their termination of employment. For more information on our employment agreements and severance arrangements with our named executive officers, see the discussions below under the headings “Executive Compensation—Summary Compensation—Employment Agreements”“—Executive Compensation Tables and “PotentialNarrativesPotential Payments Upon a Termination or Change in Control”Control.
In addition, in connection with their departures from the company, we entered into a resignation agreement and release of claims with each of Mr. McCormick and Mr. Van Ummersen, the purpose of which was to provide for: (1) his resignation as an officer effective as of the effective time of the merger and as an employee effective as of the end of a three-month transition period after the merger; (2) payments and benefits to which he is entitled under his employment agreement as a result of the termination of his employment; (3) limited additional payments and benefits described below which he received upon his execution of a release of claims on the last day of his employment; and (4) other provisions standard and customary in this type of agreement. While these severance payments resulted in higher compensation for these executives than in prior years, we believe these payments served their employment,intended purpose of retaining and motivating these executives through the completion of the merger. For more information regarding these agreements, see “—Executive Compensation Tables and NarrativesSummary Compensation InformationAgreements with Other Named Executive Officers.”
Stock Ownership Guidelines
We have established stock ownership guidelines that are intended to further align the interests of our executives with those of our shareholders. Stock ownership targets for each of Mr. Kohrsour executive officers have been set at that number of our ordinary shares with a value equal to a multiple of the executive’s annual base salary, with the multiple equal to four times for our CEO and Ms. Diersen andtwo times for our U.S. operating subsidiary entered into a separation agreement pursuant to which, in exchange forother named executive officers. Each of the executive officers has five years from the date of hire or, if the ownership multiple has increased during his or her execution of a general release, each of Mr. Kohrs and Ms. Diersen became entitledtenure, five years from the date established in connection with such increase to the severance payments and benefits provided underreach his or her stock ownership targets. Until the applicable stock ownership target is achieved, each executive subject to the guidelines is required to retain an amount equal to 75% of the net shares received as a result of the exercise of stock options or the vesting of RSU awards. If there is a significant decline in the price of our ordinary shares that causes executives to be out of compliance, such executives will be subject to the 75% retention ratio, but will not be required to purchase additional shares to meet the applicable targets. Our compensation committee reports on compliance with the guidelines at least annually to our board of directors.

155

Table of Contents

Named executive officer
Stock ownership target as a multiple of
base salary
In
compliance (yes/no)
Robert J. Palmisano4xYes
David H. Mowry2xYes
Lance A. Berry2xYes
Gregory Morrison2xYes
Terry M. Rich2xYes
James A. Lightman2xYes

Anti-Hedging and Pledging
Our code of conduct on insider trading and confidentiality prohibits our executive officers from engaging in hedging transactions, such as short sales, transactions in publicly traded options, such as puts, calls and other derivatives, and pledging our ordinary shares.
Clawback Policy
Our stock incentive plan and corporate performance incentive plan contain “clawback” provisions. Under our stock incentive plan, if an executive is determined by the compensation committee to have taken action that would constitute “cause” or an “adverse action,” as those terms are defined in the plan, during or within one year after the termination of the executive’s employment, agreement and described belowall rights of the executive under the headings “Executive Compensation—Summary Compensation—Employment Agreements,” “Potential Payments Uponplan and any agreements evidencing an award then held by the executive will terminate and be forfeited. In addition, the compensation committee may require the executive to surrender and return to us any shares received, and/or to disgorge any profits or any other economic value made or realized by the executive in connection with any awards or any shares issued upon the exercise or vesting of any awards during or within one year after the termination of the executives employment or other service. Under our performance incentive plan, we have the right to take all actions necessary, to recover any awards or amounts paid to any plan participant to the extent required or permitted by applicable laws, rules or regulations, securities exchange listing requirements or any policy of our company implementing the foregoing.
Tax Deductibility of Compensation
In designing our executive compensation program, we consider the deductibility of executive compensation under Code Section 162(m), which provides that we may not deduct more than $1 million paid to certain executive officers, other than “performance-based” compensation meeting certain requirements. Although we recently amended our stock incentive plan to incorporate provisions intended to satisfy the requirements for awarding “performance-based” compensation as defined in Code Section 162(m) under the plan, we did not grant any “performance-based” compensation under the plan during 2015. In addition, while we designed our plan to operate in a Termination or Changemanner intended to qualify as “performance-based” under Code Section 162(m), the compensation committee may administer the plan in Control—Severance Arrangement with Douglas W. Kohrs” and “Potential Payments Upon a Termination or Change in Control—Severance Arrangement with Carmen L. Diersen.” We also entered into consulting agreements with Mr. Kohrs and Ms. Diersen which we believe were helpful in transitioning their duties and responsibilitiesmanner that does not satisfy the requirements of Code Section 162(m) to other employees.

achieve a result that the compensation committee determines to be appropriate.


156


Compensation Committee Report

Our

The compensation committee has reviewed and discussed the foregoing “Compensation“—Compensation Discussion and Analysis” section of this reportAnalysis” with our management. Based on this review and these discussions, ourthe compensation committee has recommended to our board of directors that the foregoing “Compensation“—Compensation Discussion and Analysis”Analysis be included in thisour annual report on Form 10-K.

This report is dated February 11, 2013.

10-K for the year ended December 27, 2015.

Compensation Committee


Sean D. Carney

Richard W. Wallman

John L. Miclot
Elizabeth H. Weatherman


Executive Compensation

Tables and Narratives

Summary Compensation

Information

The table below provides summary information concerning all compensation awarded to, earned by, or paid to the individuals that served as our principal executive officer andor principal financial officer during the year ended December 27, 2015 and other named executive officers for each of the last three fiscal years ended December 30, 2012, January 1, 2012 and January 2, 2011.

of which they served as an executive officer.

SUMMARY COMPENSATION TABLE – 2012

Name and principal position

  
Year
   
Salary(1)

($)
   
Bonus(2)

($)
   Stock
awards(3)

($)
   Option
awards(4)
($)
   Non-equity
incentive plan
compensation(5)

($)
   All
other
compen-
sation(6)

($)
   Total
($)
 

David H. Mowry(7)

President and Chief Executive Officer


2012

2011


341,591

143,844


0

0


192,630

436,313


195,481

539,650


17,666

46,627


42,251

35,706


789,619

1,202,140


Douglas W. Kohrs(8)

Former President, Chief Executive Officer and Executive Director


2012

2011

2010


421,688

503,422

490,333


0

0

0


428,592

830,340

0


434,944

1,067,336

913,625


0

209,134

236,994


127,541

0

0


1,412,765

2,610,232

1,640,952


Shawn T McCormick(9)

Chief Financial Officer

   2012     114,198     75,000     354,488     357,207     5,710     0     906,603  


Carmen L. Diersen(10)

Former Global Chief
Financial Officer


2012

2011

2010


182,342

333,193

172,500


0

0

0


0

249,984

0


0

321,509

1,711,935


0

106,888

70,691


186,263

7,350

184,866


368,605

1,018,924

2,139,992


Terry M. Rich(11)

Senior Vice President, U.S. Commercial Operations

   2012     282,468     0     614,993     735,654     21,185     0     1,654,300  


Stéphan Epinette(12)

Vice President, International Commercial Operations


2012

2011

2010


297,688

299,620

275,303


0

28,636

0


143,323

186,186

0


145,192

236,519

365,450


48,962

81,960

92,843


87,988

99,002

98,715


723,153

931,923

832,311


Kevin M. Klemz(13)

Vice President, Chief Legal Officer and Secretary


2012

2011

2010


285,690

276,806

81,865


0

0

0


127,903

166,320

0


129,805

213,640

899,925


22,825

74,730

26,839


7,350

7,350

0


573,573

738,846

1,008,629


- 2015
Name and principal position Year 


Salary(1)
($)


Bonus(2)
($)
 

Stock awards(3)
($)
 

Option
awards(4)
($)
 
Non-equity incentive plan compensation(5)
($)
 
All other
compen-sation(6)
($)


Total
($)
Robert J. Palmisano(7)
President and Chief Executive Officer and Executive Director
 2015 222,068
 
 5,972,830
 5,914,722
 1,247,655
 1,668,463
 15,025,738
David H. Mowry(8)
Executive Vice President and Chief Operating Officer and Executive Director
 2015 544,527
 
 2,289,191
 2,266,933
 579,070
 947,471
 6,627,192
 2014 548,613
 
 649,995
 655,281
 568,632
 7,350
 2,375,238
 2013 444,334
 
 687,758
 689,921
 513,999
 27,673
 1,955,971
Lance A. Berry(9)
Senior Vice President and Chief Financial Officer
 2015 105,894
 
 837,275
 829,143
 343,379
 253,346
 2,369,037
Shawn T McCormick(10)
Former Chief Financial Officer
 2015 368,935


 232,224
 1,144,672
 1,745,831
 2014 364,433
 
 456,450
 217,703
 211,098
 4,773
 1,254,457
 2013 354,411
 
 240,848
 241,636
 47,686
 3,707
 888,288
Gregory Morrison(11)
Senior Vice President, Human Resources
 2015 316,467
 
 559,730
 554,282
 174,947
 566,958
 2,172,384
 2014 297,730
 
 658,265
 178,716
 137,194
 6,954
 1,278,859
Terry M. Rich(12)
Senior Vice President, U.S. Commercial Operations
 2015 363,097
 
 471,703
 467,112
 316,309
 475,419
 2,093,640
 2014 368,726
 
 458,941
 220,230
 380,525
 
 1,428,422
 2013 358,823
 
 244,116
 244,915
 16,093
 
 863,947
James A. Lightman(13)
Senior Vice President, General Counsel and Secretary
 2015 97,295
 
 561,420
 555,955
 253,015
 285,730
 1,753,415
Gordon W. Van Ummersen(14)
Former Senior Vice President,
Global Product Delivery
 2015 357,149


 324,769
 1,107,650
 1,789,568
 2014 325,533
 
 408,842
 169,712
 207,951
 37,350
 1,149,388
 2013 196,314
 80,000
 475,161
 476,721
 26,414
 21,510
 1,276,120
____________________
(1)From August 26, 2010 and through November 12, 2012, 5%Five percent of each of Mr. Kohrs’sPalmisano’s and Mr. Mowry’s annual base salary was allocated to his service as aan executive director and member of our board of directors.
(2)We generally do not pay any discretionary bonuses or bonuses that are subjectively determined and did not pay any such bonuses to any named executive officers in 2012, 2011 or 2010, except for a contingent sign-on bonus for Mr. McCormick during 2012 and a discretionary bonus to Mr. Epinette to recognize the performance of our international business during 2011.2015. Annual cash incentive bonus payouts based on performance against pre-established performance goals under our employee performance incentive compensation plan and in the case of Mr. Epinette, our French incentive compensation scheme, are reported in the “Non-equity incentive plan compensation” column.

157

Table of Contents

(3)AmountAmounts reported representsrepresent the aggregate grant date fair value for stockRSU awards granted to each named executive officer computed in accordance with FASB ASC Topic 718. The grant date fair value is determined based on the per share closing sale price of our ordinary shares on the grant date.
(4)AmountAmounts reported representsrepresent the aggregate grant date fair value for option awards granted to each named executive officer computed in accordance with FASB ASC Topic 718. The grant date fair value is determined based on our Black-Scholes option pricing model. The table below sets forth the specific assumptions used in the valuation of each such option award:

Grant

date

  Grant date
fair value
per share ($)
   Risk free
interest  rate
  Expected
life
   Expected
volatility
  Expected
dividend
yield
 

03/12/2012

   11.04     1.20  6.11 years     48.65  0  

08/10/2012

   8.37     0.93  6.11 years     48.14  0  

08/28/2012

   8.30     0.95  6.25 years     47.94  0  

09/04/2012

   8.38     0.85  6.11 years     48.03  0  

08/12/2011

   11.13     1.29  6.11 years     48.33  0  

05/12/2011

   12.34     2.26  6.11 years     48.60  0  

06/21/2010

   11.41     2.42  6.11 years     50.57  0  

Grant

date

  Grant date
fair value
per share ($)
   Risk free
interest  rate
  Expected
life
   Expected
volatility
  Expected
dividend
yield
 

06/03/2010

   10.96     2.33  5.48 years     49.74  0  


Grant
date
 
Grant date
fair value
per share ($)
 

Risk free
interest rate
 

Expected
life
 

Expected
volatility
 
Expected
dividend
yield
10/13/2015 7.06 1.375% 6.08 years 32.70% 
08/12/2014 9.87 1.900% 6.10 years 45.10% 
08/09/2013 9.03 1.700% 6.11 years 46.58% 
02/26/2013 7.92 1.000% 6.11 years 47.21% 
(5)RepresentsAmounts reported for 2015 represent payouts under our performance incentive plan for second half of 2015 performance and amounts paid under our employeelegacy Tornier’s and legacy Wright's performance incentive compensation plan andfor first half of 2015 performance. In addition, the amount reported for Mr. Epinette, also under our French incentive compensation scheme. The amountVan Ummersen includes a $100,000 integration bonus that was paid on December 31, 2015 pursuant to the terms of his resignation agreement and release of claims. Amounts reflected for each year reflectsreflect the annual cash incentive bonusamounts earned for that year but paid during the following year. Neitheryear, except in the case of Mr. Kohrs nor Ms. Diersen were eligible to receive an annual cashMcCormick and Mr. Van Ummersen for 2015 since they received their first half of 2015 payouts in 2015 and Mr. Mowry for 2014 when $330,000 of his target incentive bonus based on 2012 performance.payout was paid at the end of 2014.
(6)The amounts shown
Amounts reported in this column for 2012 include the following with respect to each named executive officer:2015 are described under “-All Other Compensation for 2015 - Supplemental.

Name

  Retirement
benefits(a)
($)
   Severance
benefits(b)
($)
   Perquisites and other
personal benefits(c)

($)
   Total
($)
 

Mr. Mowry

   6,251     —       36,000     42,251  

Mr. Kohrs

   —       127,541     —       127,541  

Mr. McCormick

   —       —       —       —    

Ms. Diersen

   5,531     180,732     —       186,263  

Mr. Rich

   —       —       —       —    

Mr. Epinette

   70,722     —       17,266     87,988  

Mr. Klemz

   7,350     —       —       7,350  


(a)Represents 401(k) matching contributions under the Tornier, Inc. 401(k) plan for Ms. Diersen and Messrs. Mowry and Klemz, and for Mr. Epinette the following retirement contributions on his behalf: (i) $4,977 in contributions to the French government mandated pension plan; (ii) $46,522 in contributions to our French operating subsidiary’s Retraite Complémentaire; and (iii) $19,223 in contributions to our French operating subsidiary’s Retraite Supplémentaire.
(b)Represents for Mr. Kohrs: (i) $64,811 in severance pay; (ii) $11,283 in reimbursement of health care coverage premiums; (iii) $48,947 in payout of accrued but unused vacation; and (iv) $2,500 in consulting payments, in each case paid to Mr. Kohrs in connection with his termination of employment. Represents for Ms. Diersen: (i) $154,248 in severance pay; (ii) $7,383 in reimbursement of health care coverage premiums; (iii) $14,101 in payout of accrued but unused vacation; and (iv) $5,000 in consulting payments; in each case paid to Ms. Diersen in connection with his termination of employment.
(c)Represents $36,000 in a housing stipend for Mr. Mowry and $17,267 in automobile expenses for Mr. Epinette.
(7)Mr. MowryPalmisano was appointed as Interimour President and Chief Executive Officer effective November 12, 2012 and priorupon completion of the Wright/Tornier merger, on October 1, 2015. Prior to such positiontime, Mr. Palmisano served as Chief Operating Officer from July 20, 2011 to November 12, 2012. In February 2013, Mr. Mowry was appointed President and Chief Executive Officer on a non-interim basis.of Wright Medical Group, Inc. and, in such capacity, earned or was awarded or paid salary and other compensation by legacy Wright prior to October 1, 2015, which amounts are not included in the above table.
(8)Mr. Kohrs resignedMowry was appointed our Executive Vice President and Chief Operating Officer effective upon completion of the Wright/Tornier merger, on October 1, 2015. Mr. Mowry served as our President and Chief Executive Officer and Executive Director effectivefrom November 12, 2012.2012 to October 1, 2015.
(9)Mr. McCormickBerry was appointed asour Senior Vice President and Chief Financial Officer effective September 4, 2012.upon completion of the Wright/Tornier merger, on October 1, 2015. Prior to such time, Mr. Berry served as Senior Vice President and Chief Financial Officer of Wright Medical Group, Inc. and, in such capacity, earned or was paid salary and other compensation by legacy Wright prior to October 1, 2015, which amounts are not included in the above table.
(10)Ms. Diersen resignedMr. McCormick served as Globalour Chief Financial Officer effective July 17, 2012.until completion of the Wright/Tornier merger, on October 1, 2015 and after such date remained as an employee though January 1, 2016, Mr. Kohrs servedMcCormick currently serves as Interim Chief Financial Officer from July 17, 2012 to September 4, 2012.one of our independent consultants.
(11)Mr. Morrison was appointed our Senior Vice President, Human Resources effective upon completion of the Wright/Tornier merger, on October 1, 2015. Mr. Morrison served as our Senior Vice President, Global Human Resources and HPMS prior to such time.
(12)Mr. Rich was appointed our President, Upper Extremities effective upon completion of the Wright/Tornier merger, on October 1, 2015. Mr. Rich served as our Senior Vice President, U.S. Commercial Operations effective March 12, 2012.prior to such time.
(12)Mr. Epinette’s cash compensation was paid in Euro. The foreign currency exchange rate of 1.2847 U.S. dollars for 1 Euro, which reflects an average conversion rate for 2012, was used to calculate Mr. Epinette’s base salary and all other compensation amounts for 2012. The foreign currency exchange rate of 1.33329 U.S. dollars for 1 Euro was used to calculate his annual cash incentive bonus under the employee performance incentive compensation plan and the French incentive compensation scheme.
(13)Mr. KlemzLightman was appointed asour Senior Vice President, Chief Legal OfficerGeneral Counsel and Secretary effective September 13, 2010.upon completion of the Wright/Tornier merger, on October 1, 2015. Prior to such time, Mr. Lightman served as Senior Vice President, General Counsel and Secretary of Wright Medical Group, Inc. and, in such capacity, earned or was paid salary and other compensation by legacy Wright prior to October 1, 2015, which amounts are not included in the above table.

(14)Mr. Van Ummersen served as our Senior Vice President, Global Product Delivery until completion of the Wright/Tornier merger, on October 1, 2015 and after such date remained as an employee though December 31, 2015.

158

Table of Contents

Employment Agreements with Robert J. Palmisano. We, throughEffective October 1, 2015, we entered into a service agreement and one of our operating subsidiaries typically executeentered into an employment agreements in conjunctionagreement with the hiring or promotion ofRobert J. Palmisano, our President and Chief Executive Officer.
The service agreement deals with certain Dutch law matters relating to Mr. Palmisano’s role as an executive officer. Our nameddirector. Under the terms of the service agreement, we have allocated a portion of Mr. Palmisano’s annual base salary to his service as an executive officersdirector, which amounts are generally compensated bypaid after deduction of applicable withholdings for taxes and social security contributions. In addition, under the terms of the service agreement, we have agreed to provide Mr. Palmisano with indemnification and director and officer liability insurance, on terms and conditions that are at least as favorable to Mr. Palmisano as those then provided to any other current or former director or executive officer of our company or any of our affiliates.
The employment agreement provides that during the term of the agreement, Mr. Palmisano will serve as President and Chief Executive Officer of our company and each principal operating subsidiary and will report to whichour Chairman of the Board and board of directors. During the term, Mr. Palmisano shall be nominated by our board of directors for election as an executive director and a member of our board of directors at each annual general meeting of shareholders. The employment agreement expires on December 31, 2018, subject to earlier termination under certain circumstances. Commencing on October 1, 2017 and on each anniversary thereafter, the term will automatically extend for an additional one-year period, unless at least 30 days prior to such named executive officer primarily provided services. Tornier, Inc., our U.S. operating subsidiary, is adate, either party gives notice of non-extension to the other.
With respect to compensation, the employment agreements with Messrs. Mowry, McCormick, Rich and Mr. Klemz, which agreements are substantially the same, other than differences inagreement establishes an annual base salary target annual bonus percentagesfor Mr. Palmisano at $886,200 and severance.provides that our board of directors will review his compensation at least annually for any increase. The employment agreements haveagreement acknowledges that a specified termcertain percentage of three years and are subject to automatic renewal for one-year terms unless either we or the executive provides 60 days’ advance notice of a desire not to renew the agreement. Under the

agreements, each executive is entitled to a specifiedMr. Palmisano’s base salary subject to increase but not decrease,will be paid by Wright Medical Group N.V. in consideration for his services as an executive director of Wright Medical Group N.V. under the service agreement described above. The employment agreement provides that Mr. Palmisano is eligible to receive an annual cashperformance incentive bonus with a targetpursuant to the Wright Medical Group N.V. Performance Incentive Plan and, if applicable, the Wright Medical Group N.V. Amended and Restated 2010 Incentive Plan, depending on whether, and to what extent, certain performance goals established by the compensation committee for such year have been achieved. The amount of the performance incentive bonus equalpayable to a specified percentageMr. Palmisano will be targeted at 100% of his annual base salary and will not exceed 200% of his annual base salary. The employment agreement provides that Mr. Palmisano will receive an annual equity grant under our stock incentive plan (or any successor plan) equal to 300% of his annual base salary, and comprised 50% non-qualified stock options and 50% RSU awards, unless the board of directors establishes a different percentage as specified in the agreement. In addition, the employment agreement provides that Mr. Palmisano is entitledeligible to participate in the employeefringe benefit plansprograms, including those for medical and arrangementsdisability insurance and retirement benefits that we generally maintainmake available to our executive officers from time to time. During the term, Mr. Palmisano will be reimbursed for up to $1,000 for personal insurance premiums, other than for insurance coverage that pays for medical, prescription drug, dental, vision, or other medical care expenses. In addition, he may elect, in accordance with our senior executives.cafeteria plan rules, not to participate in the medical and disability insurance programs provided by us, in which case, we will pay him up to $900 per month (or such greater amount that we would otherwise pay for medical and disability coverage for him and his spouse under our benefits programs). Mr. Palmisano is also entitled to receive reimbursement for up to $15,000 for financial and tax planning and tax preparation, and an annual physical examination at our expense. The employment agreementsagreement also containprovides for a monthly allowance of $7,500 for housing and automobile expenses, and Mr. Palmisano will be reimbursed for reasonable travel expenses between Memphis, Tennessee and his residences. To the extent that these reimbursements are not deductible by Mr. Palmisano for income tax purposes, such amounts will be “grossed-up” for income tax purposes so that the reimbursed items will be received net of any deduction for income and payroll taxes. The employment agreement contains severance provisions which areas described in more detail under the heading “—Potential Payments Upon a Termination or Change in Control”Control.” We have guaranteed the obligations of our subsidiary under Mr. Palmisano’s employment agreement.

Mr. Palmisano and one of our subsidiaries also entered into a confidentiality, non-competition, non-solicitation and intellectual property rights agreement, pursuant to which Mr. Palmisano agreed to certain covenants intended to protect against the disclosurethat impose obligations on him regarding confidentiality of confidential information, duringtransfer of inventions, non-solicitation of employees, customers and following employment, as well as restrictions on engaging in competitionsuppliers, and non-competition with our company or otherwise interferingbusiness.
Agreements with Other Named Executive Officers.Effective October 1, 2015, we entered into a service agreement with David H. Mowry, our business relationships,Executive Vice President and Chief Operating Officer and an executive director, which extend through the first anniversary of an executive’s termination of employment for any reason. With respectdeals with certain Dutch law matters relating to certain executives, the employment agreements provide for certain limited additional benefits. Under Mr. Mowry’s employment agreement, we agreed to provide Mr. Mowry a monthly housing stipend of $3,000 for 24 months and reimbursement of certain moving and travel costs to assist Mr. Mowry in his relocation to the Minneapolis/St. Paul area. Under Mr. McCormick’s employment agreement, we agreed to pay Mr. McCormick a $75,000 sign-on bonus, contingent upon his employment for at least one year. Under Mr. Rich’s employment agreement, we agreed to reimburse Mr. Rich for certain relocation expenses, suchrole as moving expenses, pursuant to thean executive director. The terms of our relocation policy.

Tornier SAS, our French operating subsidiary, is a party to an employmentthe service agreement with Mr. Epinette, which does not have a specified term, but which may be terminated by either party in accordance with local law, and which isare substantially similar to the employmentservice agreement with Mr. Palmisano, as described above.


159

Table of Contents

Mr. Mowry and the other named executive officers who are currently executive officers and one of our subsidiaries also entered into confidentiality, non-competition, non-solicitation and intellectual property rights agreements. The material terms of these agreements described above with respect to base salary, annual target bonus, benefit participation and non-compete obligations. Pursuantare substantially similar to the agreement and French labor laws,with Mr. Epinette is entitled to receive certain payments and benefits following a voluntary or involuntary terminationPalmisano, as described above. In addition, through one of employment,our subsidiaries, we have entered into separation pay agreements with our named executive officers who are currently executive officers, other than Mr. Palmisano, which agreements are described in more detail under the heading “—Potential Payments Upon a Termination or Change in Control.Control.

Equity

Immediately prior to the completion of the Wright/Tornier merger, legacy Tornier entered into a resignation agreement and Non-Equity Incentive Compensation. During 2012, our named executive officersrelease of claims with each of Mr. McCormick and Mr. Van Ummersen, the purpose of which was to provide for: (1) his resignation as an officer effective as of the effective time of the merger and as an employee effective as of the end of a three-month transition period after the merger; (2) payments and benefits to which he is entitled under his employment agreement as a result of the termination of his employment; (3) limited additional payments and benefits described below which he received grantsupon his execution of stock optionsa release of claims on the last day of his employment; and stock awards(4) other provisions standard and customary in this type of agreement. With respect to the payments and benefits, the agreements provided that Mr. McCormick and Mr. Van Ummersen would receive: (1) no change to his base salary during the transition period of time after the merger during which he remained an employee; (2) no future equity grants; (3) a change in control payment equal to one year base salary and his full target annual bonus, which would be paid in one lump sum within 15 days of his termination date in accordance with the terms of his employment agreement; (4) health insurance benefits in accordance with the terms of his employment agreement; and (5) a pro-rated bonus calculated under our stock incentive plan. These grants and our stockthe terms of legacy Tornier’s corporate performance incentive plan are described in more detailand a pro-rated bonus calculated under the headings “Compensation Discussion and Analysis” and “—Grantsterms of Plan-Based Awards.” Our named executive officers also received annual cash incentive bonuses under our employee performance incentive compensation plan, for their 2012 performance. In addition, Mr. Epinette will receive an annual cash incentive bonus in mid-2013 under our French incentive compensation scheme. The bonus amounts and these plans are described in more detail under the headings “Compensation Discussion and Analysis” and “—Grants of Plan-Based Awards.”

Retirement Benefits. Under the Tornier, Inc. 401(k) Plan, participants, including our named executive officers, other than Mr. Epinette, may voluntarily request that we reduce his or her pre-tax compensation and contribute such amounts to the 401(k) plan’s trust up to certain statutory maximums. We contribute matching contributions in an amount equal to 3% of the participant’s eligible earnings for a pay period, or if less, 50% of the participant’s pre-tax 401(k) contributions (other than catch-up contributions) for that pay period. Mr. Epinette is eligible to participate and participates in our French operating subsidiary’s government-mandated pension plan, government-mandated pension plan for managerial staff, the Retraite Complémentaire, and defined contribution pension plan for key employees, the Retraite Supplémentaire, in each case based on the same basis as other key employees of our French operating subsidiary. In 2012, pursuant to the Retraite Supplémentaire, our French operating subsidiary made contributions equal to approximately 6.5% of Mr. Epinette’s base salary on Mr. Epinette’s behalf. The Retraite Supplémentaire is intended to supplement the state pension plans mandated by French labor laws and to provide participants with a form of compensation that is efficient with respect to income tax and mandated social contributions. Except for our French operating subsidiary’s government-mandated pension plan and a government-mandated pension plan for managerial staff, we do not provide pension arrangements or post-retirement health coverage for our employees, including our named executive officers. We also do not provide any nonqualified defined contribution or other deferred compensation plans.

Severance Payments. The “All other compensation” column of the Summary Compensation Table for 2012 includes amounts paid or accrued pursuant to severance arrangements with Mr. Kohrs and Ms. Diersen and amounts paid to Mr. Kohrs and Ms. Diersen pursuant to consulting arrangements entered into in connection with their separation of employment from our company. The terms of these arrangements are described in more detail under the headings “—Potential Payments Upon Termination or Change in Control—Severance Arrangement—Douglas W. Kohrs” and “—Potential Payments Upon Termination or Change in Control—Severance Arrangement—Carmen L. Diersen.”

Perquisites and Personal Benefits. With respect to perquisites and personal benefits, we are required under Mr. Mowry’s employment agreement to provide Mr. Mowry a monthly housing stipend of $3,000 for 24 months and reimburse him for certain moving and travel costs to assist him in his relocation to the Minneapolis/St. Paul area, and we are required under Mr. Rich’s employment agreement to reimburse Mr. Rich for certain relocation expenses, such as moving expenses,current incentive target pursuant to the terms of our relocation policy.thereof. In addition, we provideunder the terms of his agreement, Mr. EpinetteVan Ummersen was eligible to receive a $100,000 integration bonus on December 31, 2015 if he successfully completed the transition of accounts to the purchaser of legacy Tornier’s U.S. SALTO® ankle and certain toe products. All amounts paid or to be paid to Mr. McCormick and Mr. Van Ummersen under their resignation agreements are reflected in the Summary Compensation Table.

In January 2016, upon completion of his employment, Tornier Inc. entered into a consulting agreement with Mr. McCormick pursuant to which he serves as an automobile allowance. The only other benefits that our named executive officers receiveindependent consultant in exchange for a consulting fee of $1,000 per month through the end of September 2016. His consulting payments which began in January 2016 are benefits thatdependent upon his provision of future consulting services and are also received by our other employees, includingnot reflected in the retirement benefits described above, an ability to purchase our ordinary shares at a discount with payroll deductions under our employee stock purchase plan and medical, dental, vision and life insurance benefits.

Summary Compensation Table.

Indemnification Agreements. We have entered into indemnification agreements with all of our named executive officers. The indemnification agreements are governed by the laws of the State of Delaware (USA) and provide, among other things, for indemnification to the fullest extent permitted by law and our articles of association against any and all expenses (including attorneys’ fees) and liabilities, judgments, fines and amounts paid in settlement actually and reasonablythat are paid or incurred by the executive or on his or her behalf in connection with such action, suit or proceeding and any appeal therefrom.proceeding. We will be obligated to pay these amounts only if the executive acted in good faith and in a manner he or she reasonably believed to be in or not opposed to the best interests of our company, and, with respect to any criminal action, suit or proceeding, had no reasonable cause to believe his or her conduct was unlawful.company. The indemnification agreements provide that the executive will not be indemnified and advanced expenses (i)advanced with respect to an action, suit or proceeding initiated by the executive unless (i) so authorized or consented to by our board of directors or (ii) with respect to any action, suit or proceeding instituted by the executive to enforce or interpret the indemnification agreement unless the executive is successful in establishing a right to indemnificationcompany has joined in such action, suit or proceeding in whole or in part, or unless and to(ii) the extent that the court in such action, suit or proceeding determines that, despiteis one to enforce the executive’s failurerights under the indemnification agreement. The company’s indemnification and expense advance obligations are subject to establish the rightcondition that an appropriate person or body not party to indemnification, hethe particular action, suit or sheproceeding shall not have determined that the executive is entitlednot permitted to indemnity for such expenses.be indemnified under applicable law. The indemnification agreementagreements also set forth procedures that apply in the event an executive requests indemnification or an expense advance.

160

Table of Contents

All Other Compensation for 2015 - Supplemental.The table below provides information concerning amounts reported in the “All other compensation” column of the Summary Compensation Table for 2015 with respect to each named executive officer. Additional detail on these amounts are provided below the table.
Name Equity award acceleration $ 

Sever-
ance
benefits
$
 
Retirement benefits
$
 
Housing/
car allowance $
 
Commu-ting expense
$
 
Financial planning
$
 
Insurance premium
$
 
Gross-up
$
 
Other
$
 
Total other compen-sation
$
Mr. Palmisano 1,478,050
 
 8,539
 43,450
 50,000
 5,000
 
 12,254
 71,170
 1,668,463
Mr. Mowry 942,396
 
 450


 4,625
 947,471
Mr. Berry 243,307
 
 10,039


 253,346
Mr. McCormick 564,295
 570,000
 10,377


 1,144,672
Mr. Morrison 541,457
 
 7,350


 18,151
 566,958
Mr. Rich 475,419


 475,419
Mr. Lightman 285,730


 285,730
Mr. Van Ummersen 548,379
 551,538
 7,733


 1,107,650

Acceleration of Legacy Wright and Legacy Tornier Equity Awards in Connection with Wright/Tornier Merger. Pursuant to their terms, all legacy Wright and legacy Tornier equity awards that were outstanding as of immediately prior to the effective time of the Wright/Tornier merger automatically accelerated in full in connection with the merger and all legacy Wright equity awards converted into our ordinary shares or options to purchase our ordinary shares based on the exchange ratio used in the merger. The value of this automatic acceleration of equity awards held by each of the named executive officers is reflected in the “All other compensation” column of the Summary Compensation Table. The value of each unvested restricted share or RSU award is calculated based on $20.67, the closing price of our ordinary shares on the closing date of the merger as reported by the NASDAQ Global Select Market, and the value of each unvested stock option is calculated based on the difference between $20.67 and the exercise price of each option.
Severance Benefits. As previously described, we entered into a claimresignation agreement and release of claims with each of Mr. McCormick and Mr. Van Ummersen. Amounts paid or accrued under these agreements are reflected in the “Severance benefits” column of the above supplemental table for indemnification.“All other compensation.”

Retirement Benefits. Under the 401(k) Plan of legacy Wright and legacy Tornier, participants, including our named executive officers, may voluntarily request that we reduce his or her pre-tax compensation and contribute such amounts to the 401(k) plan’s trust up to certain statutory maximums. We contribute matching contributions in an amount equal to 3% of the participant’s eligible earnings for a pay period, or if less, 50% of the participant’s pre-tax 401(k) contributions (other than catch-up contributions) for that pay period.  We do not provide any nonqualified defined contribution or other deferred compensation plans for our executives.
Relocation Benefits. Mr. Mowry and Mr. Morrison received relocation expense reimbursements that are reflected in the "Other" column of the above supplemental table for "All other compensation."
Perquisites and Personal Benefits. The only perquisites and personal benefits provided to our named executive officers are $1,000 for certain personal insurance premiums and up to $5,000 reimbursement for financial and tax planning and tax preparation, except in the case of Mr. Palmisano who is entitled to certain additional perquisites and personal benefits under his employment agreement, including up to $15,000 reimbursement for financial and tax planning and tax preparation, a monthly allowance of $7,500 for housing and automobile expenses, reimbursement for reasonable travel expenses between Memphis, Tennessee and his residences, and an annual physical examination. To the extent that the reimbursements for his housing and automobile expenses and travel expenses between Memphis, Tennessee and his residences are not deductible by Mr. Palmisano for income tax purposes, such amounts are “grossed-up” for income tax purposes so that the reimbursed items will be received net of any deduction for income and payroll taxes. In addition, during 2015, we paid $71,170 in legal fees and expenses incurred by Mr. Palmisano in connection with the negotiation of his new employment agreement, which is reflected in the “Other” column of the above supplemental table for “All other compensation.”

161


Grants of Plan-Based Awards

The table below provides information concerning grants of plan-based awards to each of our named executive officers during the year ended December 30, 2012.27, 2015. Non-equity incentive plan-based awards were granted to our named executive officers under our employee performance incentive compensation plan and in the caseperformance incentive plan of Mr. Epinette, our French incentive compensation scheme.legacy Tornier, the material terms of which are described under “—Compensation Discussion and Analysis. Stock awards (in the form of RSU awards) and option awards were granted under our stock incentive plan. The material terms of these awards and the material plan provisions relevant to these awards are described under “—Compensation Discussion and Analysis,” or in the notes to the table below or in the narrative following the table below. We did not grant any “equity incentive plan” awards within the meaning of the SEC rules during the year ended December 30, 2012.

27, 2015.

GRANTS OF PLAN-BASED AWARDS – 2012

                       All  other
stock
awards:

number of
shares of

stock or
units(5) (#)
   All other
option
awards:

number of
securities
underlying
options(6)
(#)
   Exercise
or base

price of
option
awards
($/Sh)
   Grant date
fair value

stock and
option
awards(7)
($)


   Grant
date
   Board
approval
date(1)
   Estimated future payouts under non-
equity incentive plan awards(2)
         

Name

      Threshold(3)
($)
   Target
($)
   Maximum(4)
($)
         

David H. Mowry


Cash incentive award

   N/A     02/14/12     12,810     170,796     239,114          

Cash incentive award

   N/A     11/12/12     232     3,090     4,635          

Stock option

   08/10/12     07/31/12             23,365     18.37     195,481  

Stock grant

   08/10/12     07/31/12           10,678         192,630  


Douglas W. Kohrs


Cash incentive award

   N/A     02/14/12     18,976     253,013     354,218          

Stock option

   08/10/12     07/31/12             51,987     18.37     434,944  

Stock grant

   08/10/12     07/31/12           23,758         428,592  


Shawn T McCormick


Cash incentive award

   N/A     07/16/12     4,282     57,099     79,939          

Stock option

   09/04/12     07/16/12             42,645     18.38     357,207  

Stock grant

   09/04/12     07/16/12           19,531         354,488  


Carmen L. Diersen


Cash incentive award

   N/A     02/14/12     6,838     91,171     127,639          


Terry M. Rich


Cash incentive award

   N/A     02/14/12     10,593     141,234     197,727          

Stock option

   03/12/12     02/14/12             55,690     11.04     614,818  

Stock grant

   03/12/12     02/14/12           21,220         495,911  

Stock option

   08/10/12     07/31/12             14,443     18.37     120,836  

Stock grant

   08/10/12     07/31/12           6,601         119,082  


Stéphan Epinette


Cash incentive award

   N/A     02/14/12     6,698     89,306     125,029          

French incentive compensation scheme award

   N/A     06/29/12     744     22,708     22,708          

Stock option

   08/28/12     07/31/12             17,501     18.30     145,192  

Stock grant

   08/28/12     07/31/12           7,998         143,323  


Kevin M. Klemz


Cash incentive award

   N/A     02/14/12     8,571     114,276     159,986          

Stock option

   08/10/12     07/31/12             15,515     18.37     129,805  

Stock grant

   08/10/12     07/31/12           7,090         127,903  

- 2015

    
Board approval
date
 
Estimated future payouts under non-equity incentive plan awards(1)
 
All other stock awards: number of shares of stock or
units(4) (#)
 
All other option awards: number of securities underlying options(5) (#)
 Exercise or base price of option awards ($/Sh) 
Grant date fair value stock and option awards(6) ($)
Name 
Grant
date
  
Thres-hold(2) ($)
 
Target
($)
 
Maxi-mum(3) ($)
    
Robert J. Palmisano                 
  Cash incentive award(7)
 N/A 10/13/15 
 443,100
 886,200


  Stock option 10/13/15 10/13/15 


 838,183
 20.62
 5,914,722
  Stock grant 10/13/15 10/13/15 
 
 
 289,662
 
 
 5,972,830
David H. Mowry                 
  Cash incentive award N/A 02/13/15 11,440
 228,800
 343,200


  Cash incentive award N/A 10/13/15 
 248,800
 497,600


  Stock option 10/13/15 10/13/15 


 321,250
 20.62
 2,266,933
  Stock grant 10/13/15 10/13/15 
 
 
 111,018
 
 
 2,289,191
Lance A. Berry                 
  Cash incentive award(7)
 N/A 10/13/15 
 129,188
 258,375


  Stock option 10/13/15 10/13/15 


 117,499
 20.62
 829,143
  Stock grant 10/13/15 10/13/15 
 
 
 40,605
 
 
 837,275
Shawn T McCormick                 
  Cash incentive award N/A 02/13/15 4,717
 94,333
 141,500


  Cash incentive award N/A 10/13/15 
 94,333
 188,667


Gregory Morrison                 
  Cash incentive award N/A 02/13/15 3,120
 62,400
 93,601


  Cash incentive award N/A 10/13/15 
 91,250
 182,500


  Stock option 10/13/15 10/13/15 


 78,548
 20.62
 554,282
  Stock grant 10/13/15 10/13/15 
 
 
 27,145
 
 
 559,730
Terry M. Rich                 
  Cash incentive award N/A 02/13/15 7,209
 144,181
 216,271


  Cash incentive award N/A 10/13/15 
 124,957
 249,913


  Stock option 10/13/15 10/13/15 


 66,195
 20.62
 467,112
  Stock grant 10/13/15 10/13/15 
 
 
 22,876
 
 
 471,703
James A. Lightman                 
  Cash incentive award(7)
 N/A 10/13/15 
 93,275
 186,550


  Stock option 10/13/15 10/13/15 


 78,785
 20.62
 555,955
  Stock grant 10/13/15 10/13/15 
 
 
 27,227
 
 
 561,420
Gordon W. Van Ummersen                 
  Cash incentive award N/A 02/13/15 4,563
 91,256
 136,884


  Cash incentive award N/A 10/01/15 
 100,000


  Cash incentive award N/A 10/13/15 
 91,256
 182,513


____________________
(1)With respect to stock awards and option awards, the grant date was not necessarily the board approval date since the grant date was the third full trading day after the public release of our then most recent financial results, or in the case of Mr. Epinette, the first full trading thereafter that was not during a closed period in accordance with our French sub-planAmounts reported represent estimated future payouts under our stocklegacy Tornier’s performance incentive plan for first half of 2015 performance and our equity grant procedures for French residents. With respect to newly hired officers, the grant date may be the first day of their employment.
(2)Represents amounts payable under our employee performance incentive compensation plan for 2012, whichsecond half of 2015 performance. Legacy Tornier’s performance incentive plan for first half of 2015 performance was approved by our board of directors on February 14, 2012. The additional threshold, target13, 2015, and maximum estimated future payoutsour performance incentive plan for Mr. Mowry under the plan are the resultsecond half of increase in his base salary on November 12, 2012. The threshold target and maximum estimated future payouts for Mr. McCormick have been prorated to reflect his September 4, 2012 start date. In addition, for Mr. Epinette, also represents amounts payable under our French operating subsidiary’s incentive compensation scheme governed by an agreement entered into2015 performance was approved by our French operating subsidiaryboard of directors on June 29, 2012. The foreign currency exchange rate of 1.2847 U.S. dollars for 1 Euro, which reflects an average conversion rate for 2012, was used to calculate Mr. Epinette’s threshold, target and maximum awards. The actual amounts paid under the employeeOctober 13, 2015. See note (7) below regarding legacy Wright’s performance incentive compensation plan and French incentive compensation scheme are reflected in the “Non-equity incentive compensation” columnfor first half of the Summary Compensation Table.2015 performance. Actual payouts under these performance

162

Table of Contents

incentive plans are reflected in the “Non-equity incentive compensation” column of the Summary Compensation Table. In addition, the amount reported for Mr. Van Ummersen reflects an estimated future payout under an integration bonus pursuant to the terms of his resignation agreement and release of claims.
(3)The threshold amount
(2)Threshold amounts for awards payable under our employeethe performance incentive compensation plan and our French operating subsidiary’s incentive compensation scheme assumesplans assume the satisfaction of the threshold level of the lowest weighted financialcorporate performance goal.
(4)
(3)Maximum amounts reflect payout of the portion of our annual cash incentive bonus tied to corporate financial performance goalspayouts at a maximum rate of 150% of target for legacy Tornier’s performance incentive plan for first half of 2015 performance and the portion of our annual cash incentive bonus tied to individual performance goals at a rate of 100%200% of target underfor our employee performance incentive compensation plan. Target and maximum payout amounts are the sameplan for the purposessecond half of our French incentive compensation scheme.2015 performance.
(5)Represents
(4)Amounts reported represent stock grants in the form of restricted stock unitsRSU awards granted under our stock incentive plan. The restricted stock unitsRSU awards granted on October 13, 2015 vest and become issuable over time, with the last tranche becoming issuable on June 1, 2016 (June 1, 2017 in the case of Mr. Epinette),2019, in each case, so long as the individual remains an employee or consultant of our company.
(6)Represents
(5)Amounts reported represent options granted under our stock incentive plan. All options have a ten-year term and vest over a four-year period, with 25% of the underlying shares vesting on the one-year anniversary of the grant date and the remaining 75% of the underlying shares vesting over a three-year period thereafter in 1236 as nearly equal as possible quarterlymonthly installments.
(7)We refer you to
(6)See notes (3) and (4) to the Summary Compensation Table for a discussion of the assumptions made in calculating the grant date fair value of stock awards and option awards.


(7)Does not include cash incentive award grants by legacy Wright for first half of 2015 performance since Mr. Palmisano, Mr. Berry, and Mr. Lightman were not executive officers of our company as of the grant of such awards.

Tornier N.V. EmployeeCorporate Performance Incentive Compensation Plan. Plan. Under the terms of the Tornier N.V. EmployeeCorporate Performance Incentive Compensation Plan, our named executive officers,executives, as well as other employees of our company, earn annuallegacy Tornier, earned cash incentive bonuses based on ourthe financial or other performance of legacy Tornier during the first half of 2015 and individual objectives. The material terms of the plan are described in detail under the heading “Compensation“-Compensation Discussion and Analysis—Short-TermAnalysis-Short-Term Cash Incentive Compensation.Compensation.

FrenchWright Medical Group, Inc. Performance Incentive Compensation SchemePlan. Under the terms of the Tornier SASWright Medical Group, Inc. Performance Incentive Compensation Scheme, Mr. Epinette,Plan, executives, as well as other executivesemployees of our company who are employed by our French operating subsidiary, earn annuallegacy Wright, earned cash incentive bonuses based on our financial performance and the financial or other performance of our French operating subsidiary.legacy Wright during the first half of 2015 and individual objectives. The material terms of the plan are described in detail under the heading “Compensation“-Compensation Discussion and Analysis—Short-TermAnalysis-Short-Term Cash Incentive Compensation.Compensation.

TornierWright Medical Group N.V. Performance Incentive Plan. Under the terms of the Wright Medical Group N.V. Performance Incentive Plan, our named executive officers, as well as other employees, earned cash incentive bonuses based on our financial performance for the second half of 2015. The material terms of the plan are described in detail under “-Compensation Discussion and Analysis-Short-Term Cash Incentive Compensation.”
Wright Medical Group N.V. Amended and Restated 2010 Incentive Plan.At ouran extraordinary general meeting of shareholders held on August 26, 2010,June 18, 2015, our shareholders approved the TornierWright Medical Group N.V. Amended and Restated 2010 Incentive Plan, which we refer to as our stock incentive plan, which permits the grant of a wide variety of equitystock-based and cash-based awards, to our employees, including our employees, directors and consultants, including incentive and non-qualified options, stock appreciation rights, stock grants, stock unit grants, cash-based awards, and other stock-based awards. Our stock incentive plan is designed to assist us in attracting and retaining our employees, directors and consultants, provide an additional incentive to such individuals to work to increase the value of our ordinary shares, and provide such individuals with a stake in our future which corresponds to the stake of each of our shareholders.

Our shareholders approved an amendment to the stock incentive plan on June 27, 2012 to increase the number of ordinary shares available for issuance under the plan.

The stock incentive plan as amended, reserves for issuance a number of ordinary shares equal to the sum of (i) the number of ordinary shares available for grant under our prior stock option planthe Tornier N.V. Amended and Restated Stock Option Plan as of February 2, 2011 (not including issued or outstanding shares granted pursuant to options under our prior stock optionsuch plan as of such date);, which was 1,199,296; (ii) the number of ordinary shares forfeited upon the expiration, cancellation, forfeiture, cash settlement, or other termination following February 2, 2011 of an option outstanding as of February 2, 2011 under our prior stock option

plan; and (iii) 2.7 million.8,200,000. As of December 30, 2012, 2.5 million27, 2015, 2,910,716 ordinary shares remained available for grant under the stock incentive plan, and there were 0.3 million6,022,912 ordinary shares covering outstanding awards under such plan as of such date. For purposes of determining the remaining ordinary shares available for grant under the stock incentive plan, to the extent that an award expires or is cancelled, forfeited, settled in cash, or otherwise terminated without a delivery to the participant of the full number of ordinary shares to which the award related, the undelivered ordinary shares will again be available for grant. Similarly,Any ordinary shares withheld to satisfy tax withholding obligations in respect of awards issued under the plan, any ordinary shares withheld to pay the exercise price of awards issued under the plan and any ordinary shares not issued or surrendered in paymentdelivered as a result of the “net exercise” of an exercise price or taxes relating to an awardoutstanding option after June 18, 2015 are counted against the ordinary shares authorized for issuance under the plan.


163

Table of Contents

The maximum aggregate number of ordinary shares subject to non-employee director awards to any one non-employee director in any one fiscal year may not exceed 100,000 ordinary shares; provided that such limit will not apply to any election by a non-employee director to receive shares in lieu of cash retainers and meeting fees. The following additional limits apply to awards payable to any participant in any calendar year. With respect to awards of stock incentive plan willoptions and SARs, no more than 2,000,000 ordinary shares may underlie awards issued to any one participant in a calendar year. For cash-based awards, no more than $5,000,000 may be deemedpayable to constituteany one participant in a calendar year, and for any other award based on, denominated in or otherwise related to shares, not deliveredno more than 2,000,000 ordinary shares may be issued to theany one participant and will be deemed to again be available for awards under the stock incentive plan. in a calendar year.
The total number of ordinary shares available for issuance under the stock incentive plan, and the number of ordinary shares subject to outstanding awards and the sub-limits on certain types of award grants are subject to adjustment in the event of any reorganization, merger, consolidation, recapitalization, liquidation, reclassification, stock dividend, stock split, combination of shares, rights offering, divestiture, or extraordinary dividend (including a spin off) or any other similar change in our corporate structure or ordinary shares.

Our board of directors has the ability to amend the stock incentive plan or any awards granted thereunder at any time, provided that, certain amendments are subject to approval by our shareholders and subject to certain exceptions, no amendment may adversely affect any outstanding award without the consent of the affected participant. Our board of directors also may suspend or terminate the stock incentive plan at any time, and, unless sooner terminated, the stock incentive plan will terminate on August 25, 2020.

Under the terms of the stock incentive plan, stock options must be granted with a per share exercise price equal to at least 100% of the fair market value of an ordinary share on the grant date. For purposes of the plan, the fair market value of ouran ordinary sharesshare is the closing sale price of our ordinary shares, as reported by the NASDAQ Global Select Market. We set the per share exercise price of all stock options granted under the plan at an amount at least equal to 100% of the fair market value of our ordinary shares on the grant date. Options become exercisable at such times and in such installments as may be determined by our board of directors, or compensation committee, provided that most options may not be exercisable after 10 years from their grant date. The vesting of our stock options is generally time-based and is as follows: 25% of the shares underlying the stock option vest on the one-year anniversary of the grant date and the remaining 75% of the underlying shares vest over a three-year period thereafter in 1236 as nearly equal as possible quarterlymonthly installments, in each case so long as the individual remains an employee or consultant of our company.

Currently, optionees must pay the exercise price of stock options in cash, except that ourthe compensation committee may allow payment to be made (in whole or in part) by a “cashless exercise” effected through an unrelated broker through a sale on the open market, by a “net exercise” of the option, or by a combination of such methods. In the case of a “net exercise” of an option, we will not require a payment of the exercise price of the option from the grantee but will reduce the number of our ordinary shares issued upon the exercise by the largest number of whole shares that has a fair market value that does not exceed the aggregate exercise price for the shares exercised under this method.

Under the terms of the grant certificates under which stock options have been granted to theour named executive officers, if an executive’s employment or service with our company terminates for any reason, other than upon a “life event,” the unvested portion of the option will immediately terminate and the executive’s right to exercise the then vested portion of the option will: (i)will immediately terminate, if the executive’s employment or service relationship with our company terminated for cause; (ii) continue for a period of one year if the executive’s employmentcause or service relationship with our company terminated as a result of his or her death or disability; or (iii) continue for a period of 90 days if the executive’s employment or service relationship with our company terminated for any reason, other than for cause or upon death or disability.

Upon a “life event,” defined as the executive’s death, disability or qualified retirement, a pro rata portion of the unvested portion of the option will immediately vest and the remaining unvested portion will immediately terminate and the executive’s right to exercise the then vested portion of the option will continue for a period of one year if the executive’s employment or service relationship with our company terminated as a result of his or her death or disability or continue for a period of 90 days if the executive’s employment or service relationship with our company terminated by reason of a qualified retirement.

Stock grants under the plan are made in the form of restricted stock unitsRSU awards and assuming the recipient continuously provides services to our company (whether as an employee or as a consultant) typically vest and the ordinary shares underlying such grantsawards are issued over time. The specific terms of vesting of a stock grant dependsan RSU award depend upon whether the award is a performance recognition grant, talent acquisition grant, or special recognition grant, or discretionary grant. Performance recognition grants are typically made in mid-year and vest, or become issuable, in four as nearly equal as possible annual installments on June 1st of each year. Time-basedPromotional performance recognition grants and talent acquisition grants granted to new hirespromoted employees and promotednew employees and special recognition grants vest in a similar manner, except that the first installment is pro-rated, depending upon the grant date.

Grants also may vest upon the achievement of certain financial performance goals.


164

Table of Contents

As a condition of receiving stock options or stock grants,RSU awards, recipients, including our named executive officers, must agree to pay all applicable tax withholding obligations in connection with the awards. With respect to stockawards, and in the case of our RSU grants, our executives must agree upon acceptance of the award to pay in cash all applicable tax withholding obligations, or alternatively, may givea “sell-to-cover” instruction pursuant to which the executive gives instructions to, and authorization anyauthorizes, a brokerage firm determined acceptable to us for such purpose to sell on the executive’s behalf that number of ordinary shares issuable upon vesting of the stock grantRSU award as we determinedetermined to be appropriate to generate cash proceeds sufficient to satisfy any applicable tax withholding obligation.

obligations.

Under the terms of the grant certificates under which RSU awards have been granted to the named executive officers, if an executive’s employment or service with our company terminates for any reason, other than death or disability or a qualified retirement, the unvested portion of the RSU award will immediately terminate. Upon an executive’s death, the unvested portion of the RSU award will immediately vest and the underlying shares will become issuable. Upon the termination of an executive’s employment or service relationship due to the executive’s disability or a qualified retirement, a pro rata portion of the unvested RSU award will immediately vest and such underlying shares will become issuable and the remaining unvested portion will immediately terminate.
Cash-based awards may be granted to participants in such amounts and upon such terms as the committee may determine. The terms and conditions applicable to cash-based awards will be evidenced by an award agreement with the grantee. Each cash-based award will specify a payment amount or payment range as determined by the committee. If the cash-based awards are subject to performance goals, the number and/or value of cash-based awards that will be paid out to the participant will depend on the extent to which the performance goals and any other non-performance terms are met.
With respect to awards that the committee determines are intended to qualify as exempt performance-based compensation under Code Section 162(m) (162(m) awards), the committee will pre-establish, in writing and no later than 90 days after the commencement of the period of service to which the performance relates (or at such earlier time as is consistent with qualifying the 162(m) award for such exemption), one or more performance goals applicable to such 162(m) awards, the amount or amounts that will be payable or earned if the performance goals are achieved, and such other terms and conditions as the committee deems appropriate with respect to such awards. At the close of the applicable performance period, the committee will certify whether the applicable performance goals have been attained, and no amount will be paid under 162(m) awards unless the performance goal or goals applicable to the payment of such 162(m) awards have been so certified. The committee may, in its sole and absolute discretion (either in individual cases or in ways that affect more than one participant), reduce the actual payment, if any, to be made under 162(m) awards to the extent consistent with the performance-based compensation exemption.
The incentive plan provides that grants of performance awards may be made subject to achieving “performance goals” over a specified performance period. Performance goals with respect to those awards that are intended to qualify as “performance-based compensation” for purposes of Code Section 162(m) are limited to an objectively determinable measure of performance relating to any, or any combination of, the following (measured either absolutely or by reference to an index or indices or the performance of one or more companies and determined either on a consolidated basis or, as the context permits, on a divisional, subsidiary, line of business, project or geographical basis or in combinations thereof and subject to such adjustments, if any, as the committee specifies, consistent with the requirements of Code Section 162(m)): sales revenue, operating income before or after taxes, net income before or after taxes, net income before securities transactions, net or operating income excluding non-recurring charges, return on assets, return on equity, return on capital, market share, earnings per share, cash flow, revenue, revenue growth, expenses, stock price, dividends, total stockholder return, price/earnings ratio, market capitalization, book value, product quality, customer retention, unit sales, strategic business objectives or any other performance measure deemed appropriate by the committee in its discretion.
Other stock-based or stock-related awards (including the grant or offer for sale of unrestricted ordinary shares or the payment in cash or otherwise of amounts based on the value of ordinary shares) may be granted in such amounts and subject to such terms and conditions (including performance goals) as determined by the committee. Each other stock-based award shall be expressed in terms of ordinary shares or units based on ordinary shares, as determined by the committee. Other stock-based awards will be paid in cash or ordinary shares, as determined by the committee.
With the exception of stock options and SARs, awards under the incentive plan may, in the committee’s discretion, earn dividend equivalents with respect to the cash or stock dividends or other distributions that would have been paid on ordinary shares covered by such award had such shares been issued and outstanding on the dividend payment date. Such dividend equivalents will be converted to cash or additional ordinary shares by such formula and at such time and subject to such limitations as determined by the committee. Dividend equivalents will be accrued for the account of the participant and will be paid to the participant on the date on which the corresponding awards are exercised, settled, paid, or become free of restrictions, as applicable. Dividend equivalents will be subject to forfeiture to the same extent that the corresponding awards are subject to forfeiture as provided in plan or any award agreement.

165

Table of Contents

As described in more detail under the heading “—Potential-Potential Payments Upon Termination or Change in Control,” if a change in control of our company occurs, then, under the terms of our stock incentive plan, all outstanding options become immediately exercisable in full and remain exercisable for the remainder of their terms and all issuance conditions on all outstanding stock grantsRSU awards will be deemed satisfied; provided, however, that if any such issuance condition relates to satisfying any performance goal and there is a target for the goal, the issuance condition will be deemed satisfied generally only to the extent of the stated target.

Outstanding Equity Awards at Fiscal Year-End

The table below provides information regarding unexercised stock options and unvested stock awards that have not vested for each of our named executive officers that remained outstanding at our fiscal year-end, December 30, 2012.27, 2015. We did not have any “equity incentive plan” awards within the meaning of the SEC rules outstanding aton December 30, 2012.

27, 2015.

OUTSTANDING EQUITY AWARDS AT FISCAL YEAR-END – 2012

   Option awards   Stock awards 

Name

  Number of
securities
underlying
unexercised
options (#)

exercisable
   Number of securities
underlying
unexercised options
(#)

unexercisable(1)
   Option
exercise
price ($)
   Option
expiration
date(2)
   Number of
shares or
units of stock
that have not
vested(3) (#)
   Market value
of shares or
units that have
not vested(4) ($)
 

David H. Mowry


15,153

—  


33,337

23,635


23.61

18.04


08/12/2021

08/10/2022


           25,309     412,278  


Douglas W. Kohrs(5)

   583,333     —       13.3914     07/18/2016      
   379,529     —       13.89     02/26/2017      
   158,333     —       16.98     04/24/2018      
   62,492     4,174     16.98     05/01/2019      
   57,289     26,044     22.50     02/01/2020      


32,430

—  


54,050

51,987


25.20

18.04


05/12/2021

08/10/2022


           48,471     789,587  


Shawn T McCormick

   —       42,645     18.15     09/04/2022      
           19,531     318,160  


Carmen L. Diersen(6)

   93,750     56,250     22.50     06/21/2020      
   9,768     16,282     25.20     05/12/2021      
           7,440     121,198  


Terry M. Rich

   —       55,690     23.36     03/12/2022      
   —       14,443     18.04     08/10/2022      
           26,495     431,604  


Stéphan Epinette

   62,492     4,174     16.98     05/01/2019      
   22,914     10,419     22.50     02/01/2020      
   6,715     11,195     27.31     12/01/2020      
   —       17,501     18.22     08/28/2022      
           14,818     241,385  


Kevin M. Klemz

   46,873     36,460     22.50     09/13/2020      
   6,489     10,821     25.20     05/12/2021      
   —       15,515     18.04     08/10/2022      
           12,040     196,132  

- 2015

  Option awards Stock awards
Name 
Number of securities underlying unexercised options (#)
exercisable
 
Number of securities underlying unexercised options (#)
unexercisable(1)
 Option exercise price ($) 


Option expiration date(2)
 
Number of shares or units of stock that have not vested(3) (#)
 
Market value of shares or units that have not vested(4) ($)
Robert J. Palmisano628,849
 
 15.55
 09/17/2021    
  4,112
 
 17.70
 04/16/2022    
  145,500
 
 20.75
 05/09/2022    
  9,771
 
 22.55
 04/17/2023    
  144,625
 
 23.93
 05/14/2023    
  7,939
 
 30.14
 04/01/2024    
  129,462
 
 29.06
 05/13/2024    
  
 838,183
 20.62
 10/13/2025    
          289,662
 6,824,437
David H. Mowry48,490
 
 23.61
 08/12/2021    
  23,365
 
 18.04
 08/10/2022    
  17,466
 
 17.28
 02/26/2023    
  61,057
 
 19.45
 08/09/2023    
  66,373
 
 21.66
 08/12/2024    
  
 321,250
 20.62
 10/13/2025 111,018
 2,615,584
Lance A. Berry7,732
 
 18.94
 04/04/2016    
  10,309
 
 28.32
 05/14/2018    
  6,575
 
 15.01
 05/13/2019    
  9,635
 
 17.82
 05/13/2020    
  12,528
 
 15.04
 05/11/2021    
  1,924
 
 17.70
 04/16/2022    
  19,557
 
 20.75
 05/09/2022    
  30,602
 
 23.93
 05/14/2023    
  18,262
 
 29.06
 05/13/2024    
  
 117,499
 20.62
 10/13/2025    
          40,605
 956,654
Shawn T McCormick42,645
 
 18.15
 09/04/2022    
  26,745
 
 19.45
 08/09/2023    
  22,051
 
 21.66
 08/12/2024    


166

Table of Contents

  Option awards Stock awards
Name 
Number of securities underlying unexercised options (#)
exercisable
 
Number of securities underlying unexercised options (#)
unexercisable(1)
 Option exercise price ($) 


Option expiration date(2)
 
Number of shares or units of stock that have not vested(3) (#)
 
Market value of shares or units that have not vested(4) ($)
Gregory Morrison83,333
 
 22.50
 12/16/2020    
  16,220
 
 25.20
 05/12/2021    
  14,505
 
 18.04
 08/10/2022    
  20,833
 
 19.45
 08/09/2023    
  18,102
 
 21.66
 08/12/2024    
  
 78,548
 20.62
 10/13/2025 27,145
 639,536
Terry M. Rich55,690
 
 23.36
 03/12/2022    
  14,443
 
 18.04
 08/10/2022    
  27,108
 
 19.45
 08/09/2023    
  22,307
 
 21.66
 08/12/2024    
  
 66,195
 20.62
 10/13/2023 22,876
 538,959
James A. Lightman67,008
 
 15.75
 12/29/2021    
  1,132
 
 17.70
 04/16/2022    
  14,889
 
 20.75
 05/09/2022    
  3,999
 
 22.55
 04/17/2023    
  22,199
 
 23.93
 05/14/2023    
  18,173
 
 29.06
 05/13/2024    
  
 78,785
 20.62
 10/13/2025    
          27,227
 641,468
Gordon W. Van Ummersen52,765
 
 19.45
 08/09/2023    
  17,190
 
 21.66
 08/12/2024    
          
 
____________________
(1)
All stock options vest over a four-year period, with 25% of the underlying shares vesting on the one-year anniversary of the grant date and the remaining 75% of the underlying shares vesting over a three-year period thereafter in 1236 as nearly equal as possible quarterlymonthly installments, in each case so long as the individual remains an employee or consultant of our company. If a change in control of our company occurs, all outstanding options become immediately exercisable in full and remain exercisable for the remainder of their terms. For more information, we refer you tosee the discussion under the heading “—Potential-Potential Payments Upon a Termination or Change in Control.
(2)

All option awards have a 10-year term, but may terminate earlier if the recipient’s employment or service relationship with our company terminates. It is anticipated that Mr. Kohrs’s consulting arrangement will terminate on May 12, 2013 and Ms. Diersen’s consulting arrangement will terminate on July 16, 2013. Upon such termination, all of Mr. Kohrs’s and Ms. Diersen’s unvested option awards will terminate at that time and any unexercised vested option awards will expire 90 days thereafter. For more information, we refer you to the discussion under the heading “—Potential Payments Upon Termination or Change in Control—

Severance Arrangement with Douglas W. Kohrs” and “—Potential Payments Upon Termination or Change in Control—Severance Arrangement with Carmen L. Diersen.”
(3)The release dates and release amounts for the unvested stock awards are as follows:

Name

  June 1, 2013   June 1, 2014   June 1, 2015   June 1, 2016   June 1, 2017 

Mr. Mowry

   7,546     7,546     7,547     2,670     —    

Mr. Kohrs

   14,176     14,176     14,179     5,940     —    

Mr. McCormick

   3,662     5,289     5,289     5,291     —    

Ms. Diersen

   2,480     2,480     2,480     —       —    

Mr. Rich

   8,281     8,281     8,282     1,651     —    

Mr. Epinette

   3,410     1,705     5,704     1,999     2,000  

Mr. Klemz

   3,422     3,422     3,423     1,773     —    

Name 06/01/16 06/01/17 06/01/18 06/01/19
Mr. Palmisano 72,415 72,415 72,415 72,417
Mr. Mowry 27,754 27,755 27,754 27,755
Mr. Berry 10,150 10,152 10,151 10,152
Mr. McCormick    
Mr. Morrison 6,785 6,787 6,786 6,787
Mr. Rich 5,718 5,720 5,718 5,720
Mr. Lightman 6,806 6,807 6,807 6,807
Mr. Van Ummersen    

If a change in control of our company occurs, all issuance conditions on all outstanding stock grantsawards will be deemed satisfied; provided, however, that if any such issuance condition relates to satisfying any performance goal and there is a target for the goal, the issuance or condition will be deemed satisfied generally only to the extent of the stated target.


167

Table of Contents

(4)The market value of stock grantsawards that had not vested as of December 30, 201227, 2015 is based on the per share closing sale price of our ordinary shares on the last trading day of our fiscal year, December 24, 2015 ($23.56), as reported by the NASDAQ Global Select Market, on December 28, 2012 ($16.29).Market.
(5)It is anticipated that Mr. Kohrs’s consulting arrangement will terminate on May 12, 2013. Upon such termination, all of Mr. Kohrs’s unvested option awards and unvested stock awards will terminate at that time and any unexercised vested option awards will expire 90 days thereafter.
(6)It is anticipated that Ms. Diersen’s consulting arrangement will terminate on July 16, 2013. Upon such termination, all of Ms. Diersen’s unvested option awards and unvested stock awards will terminate at that time and any unexercised vested option awards will expire 90 days thereafter.


Options Exercised and Stock Vested During Fiscal Year


The table below provides information regarding stock options that were exercised by our named executive officers and stock awards that vested for each of our named executive officers during the fiscal year ended December 30, 2012.

   Option awards(1)   Stock awards(2) 

Name

  Number of  shares
acquired
on exercise
(#)
   Value
realized
on exercise
($)
   Number of
shares acquired

on vesting
(#)
   Value
realized on
vesting
($)
 

David H. Mowry


Stock options

   —       —        

Restricted stock units

       3,849     75,325  


Douglas W. Kohrs


Stock options

   —       —        

Restricted stock units

       8,237     161,198  


Shawn T McCormick


Stock options

   —       —        

Restricted stock units

       —       —    


Carmen L. Diersen


Stock options

   —       —        

Restricted stock units

       2,480     48,534  


Terry M. Rich


Stock options

   —       —        

Restricted stock units

       1,326     25,950  


Stéphan Epinette


Stock options

   —       —        

Restricted stock units

       —       —    


Kevin M. Klemz


Stock options

   —       —        

Restricted stock units

       1,650     32,291  

27, 2015.
  
Option awards(1)
 
Stock awards(2)
Name 
Number of shares
acquired
on exercise
(#)
 
Value
realized
on exercise
($)
 
Number of shares acquired
on vesting
(#)
 
Value
realized on
vesting
($)
Robert J. Palmisano        
Stock options      
Restricted stock(3)
     71,507 1,478,050
David H. Mowry        
Stock options      
Restricted stock units     66,750 1,529,623
Lance A. Berry        
Stock options      
Restricted stock(3)
     11,771 243,307
Shawn T McCormick        
Stock options      
Restricted stock units     25,211 521,112
Gregory Morrison        
Stock options      
Restricted stock units     32,778 723,858
Terry M. Rich        
Stock options      
Restricted stock units     35,682 821,890
James A. Lightman        
Stock options      
Restricted stock(3) 
     9,836 203,310
Gordon W. Van Ummersen        
Stock options      
Restricted stock units     33,363 704,373
____________________
(1)The number of shares acquired upon exercise reflects the gross number of shares acquired absent netting for shares surrendered to pay the option exercise price and/or satisfy tax withholding requirements. The value realized on exercise represents the gross number of shares acquired on exercise multiplied by the market price of our ordinary shares on the exercise date, as reported by Thethe NASDAQ Global Select Market, less the per share exercise price.

(2)The number of shares acquired upon vesting reflects the gross number of shares acquired absent netting of shares surrendered or sold to satisfy tax withholding requirements. The value realized on vesting of the restricted stock unitRSU awards held by each of the named executive represents the gross number of ordinary shares acquired, multiplied by the closing sale price of our ordinary shares on the vesting date or the last trading day prior to the vesting date if the vesting date was not a trading day, as reported by Thethe NASDAQ Global Select Market,Market.
(3)For Messrs. Palmisano, Berry, and Lightman, represents restricted stock of legacy Wright held by them prior to them becoming executive officers of our company that vested immediately in full effective upon completion of the Wright/Tornier merger and converted into our ordinary shares. The number of shares acquired on June 1, 2012 (the vesting date)is the number of $19.57 per share.ordinary shares acquired (taking into account the exchange ratio used in the merger) and the value realized on vesting represents the gross number of ordinary shares acquired multiplied by the closing sale price of our ordinary shares on the vesting date, as reported by the NASDAQ Global Select Market.


168


Potential Payments Upon a Termination or Change in Control

Employment Agreement with Robert J. Palmisano

Severance Arrangements – Generally. TornierEffective October 1, 2015, Wright Medical Group, Inc., one of our U.S. operatingsubsidiaries, entered into an employment agreement with Robert J. Palmisano, our President and Chief Executive Officer. Under the terms of our employment agreement with Mr. Palmisano, in the event of a termination of his employment, the post-employment pay and benefits, if any, to be received by him will vary according to the basis for his termination. We have guaranteed the obligations under the employment agreement since our subsidiary, Wright Medical Group, Inc., is a party to the agreement. The employment agreement will continue until December 31, 2018, subject to earlier termination under certain circumstances, and commencing on October 1, 2017, will automatically renew for additional one-year periods unless we or Mr. Palmisano provides notice of non-extension of the agreement.

In the event that Mr. Palmisano’s employment is terminated for cause or he terminates his employment other than for “good reason” (as defined in the employment agreement) or disability, we will have no obligations to him, other than payment of accrued obligations. Accrued obligations include: (i) any accrued base salary through the date of termination; (ii) any annual cash incentive compensation awards earned but not yet paid; (iii) the value of any accrued vacation; (iv) reimbursement for any unreimbursed business expenses; and (v) only in the case of a termination at any time by reason of death or disability, his annual target incentive payment for the year that includes the date of termination.
In the event of an involuntary termination of his employment, we will be required to provide him, in addition to his accrued obligations: (i) a lump sum payment equal to two and one-half times the sum of: (a) his then current annual base salary; plus (b) his annual target incentive bonus; (ii) payment or reimbursement for the cost of COBRA continuation coverage for up to 12 months; (iii) outplacement assistance for a period of 12 months, subject to termination if Mr. Palmisano accepts employment with another employer; (iv) financial planning services for a period of 12 months; and (v) an annual physical examination within 12 months of termination.
In the event of a termination of his employment due to death or disability, we will be required to provide him, in addition to his accrued obligations, his annual target incentive bonus.
In the event of an involuntary termination of his employment in anticipation of or within a 24-month period following a “change in control,” we will be required to provide him, in addition to his accrued obligations: (i) a lump sum payment equal to three times the sum of: (a) his then current annual base salary, plus (b) his annual target incentive bonus; (ii) his annual target incentive bonus for the year in which his termination occurs; (iii) payment or reimbursement for the cost of COBRA continuation coverage for up to 12 months; (iv) outplacement assistance for a period of 12 months, subject to termination if Mr. Palmisano accepts employment with another employer; (v) financial planning services for a period of 12 months; and (vi) an annual physical examination within 12 months of termination.
Upon termination for any reason other than for cause, disability, or death, Mr. Palmisano must enter into a release of all claims within 30 days after the date of termination before any payments will be made to him under the employment agreement, other than accrued obligations. If he breaches the terms of the confidentiality, non-competition, non-solicitation, intellectual property rights agreement, then our obligations to make payments or provide benefits will cease immediately and permanently, and he will be required to repay an amount equal to 30% of the post-employment payments and benefits previously provided to him under the employment agreement, with interest. The employment agreement provides for other clawback and forfeiture provisions, including if we are required to restate our financial statements under certain circumstances. All payments under his employment agreement will be net of applicable tax withholding obligations. The agreement also provides that if any severance payments or other payments or benefits deemed made in connection with a future change in control are subject to the ��golden parachute” excise tax under Code Section 4999, the payments will be reduced to one dollar less than the amount that would subject him to the excise tax if the reduction results in him receiving a greater amount on a net-after tax basis than would be received if he received the payments and benefits and paid the excise tax.
Severance Pay Agreements with Other Named Executive Officers. Our subsidiary, Wright Medical Group, Inc., has entered into separation pay agreements with each of our named executive officers, exceptother than Mr. Epinette, whichPalmisano. We have guaranteed the obligations under these separation pay agreements. The separation pay agreements providewill continue until October 1, 2018 and, commencing on October 1, 2017, will automatically renew for certain severance protections. additional one-year periods unless we or the executive provides notice of termination of the agreement.
Under such agreements, if the executive’s employmentterms of the separation pay agreement, in the event that the executive is terminated by Tornier, Inc. without “cause” (as such term is defined infor cause or the executive terminates his employment agreements), in addition toother than for good reason or disability, we will have no obligations, other than payment of accrued obligations. Accrued obligations include: (i) any accrued but unpaidbase salary and benefits through the date of termination; (ii) any annual cash incentive compensation awards earned but not yet paid; (iii) the value of any accrued vacation; (iv) reimbursement for any

169


unreimbursed business expenses; and (v) only in the case of a termination at any time by reason of death or disability, an annual incentive target bonus for the year that includes the date of termination, prorated for the portion of the year that the executive will be entitled to base salary and health and welfare benefit continuation for 12 months followingwas employed.
In the event of an involuntary termination and, in the eventof the executive’s employment, is terminated withoutother than for cause, duewe will be obligated to non-renewalpay a severance payment and accrued obligations and provide certain benefits to the executive. The severance payment will equal the sum of (i) the executive’s then current annual base salary, plus (ii) an amount equal to his then current annual target bonus. Half of the total severance payment amount will be payable at or within a reasonable time after the date of termination and the remaining half will be payable in installments beginning six months after the date of termination, with a final installment to be made on or before March 15 of the calendar year following the year of termination. In the event of an involuntary termination of the executive’s employment agreements by Tornier, Inc.,in connection with a change in control, then his severance payment will equal two times the amount of his severance payment as described above. Under the separation pay agreement, an involuntary termination of the executive’s employment will occur if we terminate the executive’s employment other than for cause, disability, voluntary retirement, or death or if the executive resigns for good reason, in each case as defined in the separation pay agreement.
In addition to a severance payment, the executive also will be entitled to a payment equal to his or her pro rata annual bonus forreceive the year of termination.

Tornier SAS, our French operating subsidiary, is a party to an employment agreement with Mr. Epinette, which agreement provides for certain protections. Pursuant to the agreement and French labor laws, Mr. Epinette is entitled to receive certain payments andfollowing benefits following a voluntary or involuntary termination of employment, including an amount equal to 12 months’ gross monthly salary, which is payable as consideration for the restrictive covenants contained in the agreement, a payment equal to Mr. Epinette’s French incentive compensation scheme payment for the year of his termination and, in the case of an involuntary termination of employment, a severance payment payable pursuant to French law, the amount of which is determined based on Mr. Epinette’s gross monthly salary and years of service with Tornier SAS. Pursuant to French law, gross monthly salary represents the average salary Mr. Epinette received during the 12-month period preceding his termination and includes the amount of any annual cash incentive bonus payable to Mr. Epinette during such period pursuant to our annual cash incentive bonus program.

Separation Arrangement with Douglas W. Kohrs.Tornier Inc., our U.S. operating subsidiary, entered into a separation agreement and release of claims with Mr. Kohrs in connection with his termination of employment, on November 12, 2012, pursuant to which, in exchange for his execution of a general release of claims, Mr. Kohrs became entitled to the severance payments and benefits payable to him in the event of an involuntary termination of employment without causehis employment: (i) a pro rata portion of the executive’s annual cash incentive compensation award for the fiscal year that includes the termination date, if earned pursuant to the employment agreement to which he was a party with Tornier, Inc. prior to his termination of employment. The separation agreement provides for the following, among other things:

payment by us of all amountsterms thereof and benefits accrued but unpaid through the date of termination, including base salary, unreimbursed expensesat such time and accrued and unused vacation;

cash severance payments by us to Mr. Kohrs in an aggregate amount equal to his annual base salary of $518,490, paid in accordance with our prevailing payroll practices, in the form of salary continuation through November 12, 2013; and

if timely elected, payment of COBRA continuation coverage premiums for 12 months, or until Mr. Kohrs has secured other employment, whichever occurs first.

Any amounts Mr. Kohrs receivessuch manner as a result of other full-time employment or engaging in his own business prior to November 12, 2013 will be set off from the cash severance payments required to be paid to Mr. Kohrs under his separation agreement. The separation agreement also includes an agreement by Mr. Kohrs to comply with certain non-competition and other obligations and cooperate with respect to any future investigations and litigation.

To assist in implementing an orderly transition of management responsibilities, Tornier Inc. and Mr. Kohrs entered into a consulting agreementdetermined pursuant to which Mr. Kohrs serves as a consultant of Tornier Inc. and is expected to do so through May 12, 2013. Mr. Kohrs receives $2,500 per month for up to eight hours of consulting services per month and is compensated at a rate of $300 per hour for any consulting services in excess of the foregoing. Pursuant to the terms of our prior stock option plan and current stock incentive plan, Mr. Kohrs’s stock options and stock grants will continue to vest so long as Mr. Kohrs continues to provide services to us as a consultant, and he will be entitled to exercisethereof, less any outstanding vested stock options for 90 days following his cessation ofpayments thereof already made during such services. The consulting agreement also contains customary confidentiality provisions.

Separation Arrangement with Carmen L. Diersen.Tornier Inc., our U.S. operating subsidiary, entered into a separation agreement and release of claims with Ms. Diersen in connection with her termination of employment, on July 17,

2012, pursuant to which, in exchange for her execution of a general release of claims, Ms. Diersen became entitled to the severance payments and benefits payable to herfiscal year (or, in the event of an involuntary termination in connection with a change in control, a pro rata portion of the executive’s target annual cash incentive compensation award for the fiscal year that includes the termination date, less any payments thereof already made during such fiscal year); (ii) payment or reimbursement for the cost of COBRA continuation coverage for up to 12 months (18 months in the event of an involuntary termination in connection with a change in control); (iii) outplacement assistance for a period of one year (two years in the event of an involuntary termination in connection with a change in control), subject to termination if the executive accepts employment without cause pursuantwith another employer; (iv) financial planning services for a period of one year (two years in the event of an involuntary termination in connection with a change in control); (v) payment to continue insurance coverage equal to the employment agreementexecutive’s annual supplemental insurance premium benefit provided to which she was a party with Tornier, Inc.him or her prior to her termination of employment. The separation agreement provides for the following, among other things:

payment by us of all amounts and benefits accrued but unpaid through the date of termination including base salary, unreimbursed(twice the premium benefit in the event of an involuntary termination in connection with a change in control); (vi) an annual physical examination within 12 months of termination; and (vii) reasonable attorneys’ fees and expenses andif any such fees or expenses are incurred to recover benefits rightfully owed under the separation pay agreement.

In the event of a termination of an executive’s employment due to death or disability, we will be required to provide the executive, in addition to his or her accrued and unused vacation;

cash severance payments by us to Ms. Diersen in an aggregate amount equal toobligations, a pro rata portion of his or her annual base salarytarget incentive bonus.

Upon termination for any reason other than cause, disability, or death, the executive must enter into a release of $342,285, paid in accordance with our prevailing payroll practices, inall claims within 30 days after the formdate of salary continuation through July 17, 2013; and

if timely elected, payment of COBRA continuation coverage premiums for 12 months, or until Ms. Diersen has secured other employment, whichever occurs first.

Any amounts Ms. Diersen receives as a result of other full-time employment or engaging in her own business prior to July 17, 2013termination before any payments will be set off from the cash severance payments required to be paid to Ms. Diersen under her separation agreement. The separation agreement also includes an agreement by Ms. Diersen to comply with certain non-competition and other obligations and cooperate with respect to any future investigations and litigation.

To assist in implementing an orderly transition of management responsibilities, Tornier Inc. and Ms. Diersen entered into a consulting agreement pursuant to which Ms. Diersen serves as a consultant of Tornier Inc. and is expected to do so through July 16, 2013. Ms. Diersen receives $2,500 per month for up to 15 hours of consulting services per month and is compensated at a rate of $150 per hour for any consulting services in excess of the foregoing. Pursuantmade to the terms of our prior stock option plan and current stock incentive plan, Ms. Diersen’s stock options and stock grants will continue to vest so long as Ms. Diersen continues to provide services to us as a consultant, and she will be entitled to exercise any outstanding vested stock options for 90 days following her cessation of such services. The consultingexecutive under the separation pay agreement, also contains customary confidentiality provisions.

Change in Control Arrangements – Generally. Underother than accrued obligations. If the executive breaches the terms of the employment agreements Tornier Inc. has entered into with Mr. Mowry, Mr. McCormick, Mr. Richconfidentiality, non-competition, non-solicitation, and Mr. Klemz, inintellectual property rights agreement or the event the executive’s employment is terminated without causerelease, then our obligations to make payments or by the executive for “good reason” (as such term is defined in the employment agreements) within 12 months following a change in control,provide benefits will cease immediately and permanently, and the executive will be entitledrequired to receive accrued but unpaid salaryrepay an amount equal 90% of the payments and benefits throughpreviously provided to the dateexecutive under the separation pay agreement, with interest. The separation pay agreement provides for other clawback and forfeiture provisions, including if we are required to restate our financial statements under certain circumstances. All payments under the separation pay agreement will be net of termination,applicable tax withholding obligations. The separation pay agreement provides that if any severance payments or other payments or benefits deemed made in connection with a lump sum payment equal to his base salary plus target bonus for the year of termination, health and welfare benefit continuation for 12 months following termination and accelerated vesting of all unvested options and stock grants.

Under the terms of the employment agreement between Tornier SAS and Mr. Epinette, if Mr. Epinette is terminated for reasons other than negligence or serious misconduct following afuture change in control (as such term is definedare subject to the “golden parachute” excise tax under Code Section 4999, the payments will be reduced to one dollar less than the amount that would subject the executive to the excise tax if the reduction results in the employment agreement), he is entitled to gross monthly salary continuationexecutive receiving a greater amount on a net-after tax basis than would be received if the executive received the payments and healthbenefits and welfare benefit continuation for 12 months following termination of employment, accelerated vesting of all unvested options, as well as a payment equal to Mr. Epinette’s annual target bonus and French incentive compensation scheme payment forpaid the year of his termination. Pursuant to French law, gross monthly salary represents the average salary Mr. Epinette received during the 12-month period preceding his termination and includes the amount of any annual cash incentive bonus payable to Mr. Epinette during such period pursuant to our annual cash incentive bonus program.

excise tax.

Change in Control Provisions in Stock Incentive Plan. In addition to the change in control severance protections provided in Mr. Palmisano’s employment agreement and the employmentseparation pay agreements with our executives, our prior stock option plan and our current stock incentive plan under which stock options and stock grantsRSU awards have been granted to our named executive officers containcontains “change in control” provisions. Under the terms of our prior stock option plan and current stock incentive plan, if there is a change in control of our company, then, all outstanding options become immediately exercisable in full and remain exercisable for the remainder of their terms and all issuance conditions on all outstanding stock grantsRSU awards will be deemed satisfied; provided, however, that if any such issuance condition relates to satisfying any performance goal and there is a target for the goal, the issuance condition will be deemed satisfied generally only to the extent of the stated target. Alternatively, the compensation committee may determine that outstanding awards will be cancelled as of the consummation of the change in control and that holders of cancelled awards will

170

Table of Contents

receive a payment in respect of such cancellation based on the amount of per share consideration being paid in connection with the change in control less, in the case of options and other awards subject to exercise, the applicable exercise price.

A “change in control” under our current stock incentive plan means:

the acquisition (other than from Tornier)us) by any person, entity or group, subject to certain exceptions, of 50% or more of either our then-outstanding ordinary shares or the combined voting power of our then-outstanding ordinary shares or the combined voting power of our then-outstanding capital stock entitled to vote generally in the election of directors;

the “continuity directors” cease for any reason to constitute at least a majority of our board of directors;

consummation of a reorganization, merger or consolidation, in each case, with respect to which persons who were our shareholders immediately prior to such reorganization, merger or consolidation do not, immediately thereafter, own more than 50% of the combined voting power entitled to vote generally in the election of directors of the then-outstanding voting securities of the reorganized, merged, consolidated, or other surviving corporation (or its direct or indirect parent corporation);

approval by our shareholders of a liquidation or dissolution of our company; or

the consummation of the sale of all or substantially all of our assets with respect to which persons who were our shareholders immediately prior to such sale do not, immediately thereafter, own more than 50% of the combined voting power entitled to vote generally in the election of directors of the then-outstanding voting securities of the acquiring corporation (or its direct or indirect parent corporation).

The definition of change in control in our prior stock option plan and executive employment agreements is not identical but substantially similar to the definition in our current stock incentive plan.


Potential Payments to Named Executive Officers.The table below reflects the amount of compensation and benefits payable to each named executive officer, other than Messrs. McCormick and Van Ummersen, in the event of (i) any termination (including for cause) orvoluntary resignation or a voluntary/termination or termination for cause termination;cause; (ii) an involuntary termination without cause; (iii) an involuntary termination without cause or a resignation for good reason within 12 months (24 months in the case of Mr. Palmisano) following a change in control, or a qualifying change in control termination; and (iv) termination by reason of an executive’s death and (v) termination by reason of an executive’sor disability. The amounts shownreported in the table assume that the applicable triggering event occurred on December 30, 2012,27, 2015, and, therefore, are estimates of the amounts that would be paid to the named executive officers upon the occurrence of such triggering event. Neither Mr. Kohrs nor Ms. Diersen is included in the table below because neither individual was employed as of December 30, 2012. For more information regarding the amounts payableAmounts paid to Mr. KohrsMessrs. McCormick and Ms. DiersenVan Ummersen in connection with their departure from the terminationcompany are described under Summary Compensation InformationAgreements with Other Named Executive Officers” and quantified under "—Actual Payments to Named Executive Officers in Connection with Wright/Tornier Merger."
Name 
Type of payment(1)
 
Voluntary/
for cause
termination
($)
 
Involuntary
termination
without
cause
($)
 
Qualifying
change in
control
termination
($)
 
Death/
disability
($)
Robert J. Palmisano Cash severance  4,431,000 5,317,200 
  Benefit continuation  19,920 19,920 
  
Annual bonus(2)
  886,200 886,200 886,200
  Outplacement benefits  30,000 30,000 
  
Other termination benefits(3)
  6,000 6,000 
  
Option award acceleration(4)
   2,464,258 
  
RSU award acceleration(5)
   6,824,437 
     Total  5,373,120 15,548,015 886,200
           
David H. Mowry Cash severance  1,119,600 2,239,200 
  Benefit continuation  19,920 29,880 
  
Annual bonus(6)
  497,600 497,600 497,600
  Outplacement benefits  30,000 60,000 
  
Other termination benefits(3)
  6,000 12,000 
  
Option award acceleration(4)
   528,991 
  
RSU award acceleration(5)
   2,615,584 
     Total  1,673,120 5,983,255 497,600


171

Table of their employment, please refer to the discussion above under “—Separation Arrangement with Douglas W. Kohrs” and “—Separation Arrangement with Carmen L. Diersen.”

      Triggering Events 

Name


Type of payment

  Voluntary/
for cause
termination
($)
  Involuntary
termination
without
cause
($)
  Qualifying
change in
control
termination
($)
  Death
($)
   Disability
($)
 

David H. Mowry

  Cash severance(1)   —      335,563    335,563    —       —    
  Benefit continuation(2)   —      12,617    12,617    —       —    
  Target bonus(3)   —      —      170,796    —       —    
  Option award acceleration(4)   —      —      —      —       —    
  Stock award acceleration(5)   —      —      412,278    —       —    
      Total   —      348,180    931,254    —       —    


Shawn T McCormick

  Cash severance(1)   —      350,000    350,000    —       —    
  Benefit continuation(2)   —      12,617    12,617    —       —    
  Target bonus(3)   —      —      175,000    —       —    
  Option award acceleration(4)   —      —      —      —       —    
  Stock award acceleration(5)   —      —      318,160    —       —    
      Total   —      362,617    855,777    —       —    


Terry M. Rich

  Cash severance(1)   —      350,000    350,000    —       —    
  Benefit continuation(2)   —      12,617    12,617    —       —    
  Target bonus(3)   —      —      141,234    —       —    
  Option award acceleration(4)   —      —      —      —       —    
  Stock award acceleration(5)   —      —      431,604    —       —    
      Total   —      362,617    935,455    —       —    


Stéphan Epinette(6)

  Cash severance   384,465(8)   311,604(9)   768,929(10)   —       384,465  

      Triggering Events 

Name


Type of payment

  Voluntary/
for cause
termination
($)
   Involuntary
termination
without
cause
($)
   Qualifying
change in
control
termination
($)
   Death
($)
   Disability
($)


Benefit continuation

   —       12,617     12,617     —       —    
  

Target bonus(7)

   22,708     22,708     112,015     22,708     22,708  
  

Option award acceleration(4)

   —       —       —       —       —    
  

Stock award acceleration(5)

   —       —       241,385     —       —    
  

    Total

   407,173     346,929     1,134,946     22,708     407,173  


Kevin M. Klemz

  Cash severance(1)   —       286,441     286,441     —       —    
  

Benefit continuation(2)

   —       12,617     12,617     —       —    
  

Target bonus(3)

   —       —       114,276     —       —    
  

Option award acceleration(4)

   —       —       —       —       —    
  

Stock award acceleration(5)

   —       —       196,132     —       —    
  

    Total

   —       299,058     609,466     —       —    

Contents

Name 
Type of payment(1)
 
Voluntary/
for cause
termination
($)
 
Involuntary
termination
without
cause
($)
 
Qualifying
change in
control
termination
($)
 
Death/
disability
($)
Lance A. Berry Cash severance  655,875 1,311,750 
  Benefit continuation  19,920 29,880 
  
Annual bonus(2)
  258,375 258,375 258,375
  Outplacement benefits  30,000 60,000 
  
Other termination benefits(3)
  6,000 12,000 
  
Option award acceleration(4)
   345,447 
  
RSU award acceleration(5)
   956,654 
     Total  970,170 2,974,106 258,375
           
Gregory Morrison Cash severance  547,500 1,095,000 
  Benefit continuation  19,920 29,880 
  
Annual bonus(2)
  182,500 182,500 182,500
  Outplacement benefits  30,000 60,000 
  
Other termination benefits(3)
  6,000 12,000 
  
Option award acceleration(4)
   230,931 
  
RSU award acceleration(5)
   639,536 
     Total  785,920 2,249,847 182,500
           
Terry M. Rich Cash severance  595,947 1,191,894 
  Benefit continuation  19,920 29,880 
  
Annual bonus(2)
  211,465 211,465 211,465
  Outplacement benefits  30,000 60,000 
  
Other termination benefits(3)
  6,000 12,000 
  
Option award acceleration(4)
   194,613 
  
RSU award acceleration(5)
   538,959 
     Total  863,332 2,238,811 211,465
           
James A. Lightman Cash severance  559,650 1,119,300 
  Benefit continuation  19,920 29,880 
  
Annual bonus(2)
  186,550 186,550 186,550
  Outplacement benefits  30,000 60,000 
  
Other termination benefits(3)
  6,000 12,000 
  
Option award acceleration(4)
   231,628 
  
RSU award acceleration(5)
   641,468 
     Total  802,120 2,280,826 186,550
____________________
(1)RepresentsWhere applicable, the valuebenefit amounts set forth in the table reflect an automatic reduction in the payment to the extent necessary to prevent the payment from being subject to an excise tax, but only if by reason of salary continuation for 12 months orthe reduction, the after-tax benefit of the reduced payment of a lump sum equal to 12-months’ base salary followingexceeds the executive’s termination, as applicable.after-tax benefit if such reduction were not made.
(2)Includes the value of medical, dental and vision benefit continuation for each executive and their family for 12 months following the executive’s termination. With respectAssumes payment equal to a qualifying change in control termination, we will bear the entire cost of coverage.
(3)Includes value of full target annual bonus for the year of the change in control. In the case of all of the named executive officers, other than Mr. Epinette, ifwhich the termination is an involuntary termination without cause and the date of termination is such that the termination is structured as a non-renewal of the executive’s employment agreement, then under such circumstances a pro rata portion of the executive’s annual bonus would be required to be paid under the terms of the executive’s employment agreement.occurs.
(3)Reflects the cost of financial planning services and continued executive insurance. Reimbursement of reasonable attorneys’ fees and expenses is not included as the amount is not estimable.
(4)The value of the automatic acceleration of the vesting of unvested stock options held by a named executive officer is basedBased on the difference between: (i) the per share market price of ourthe ordinary shares underlying the unvested stock options held by such executive as of December 30, 201224, 2015, the last trading day of fiscal 2015, based upon the per share closing sale price of our ordinary shares on such date ($23.56), as reported by the NASDAQ Global Select Market, on December 28, 2012 ($16.29), and (ii) the per share exercise price of the options held by such executive. The range of per share exercise pricesprice of all unvested stock options held by our named executive officers included in the table as of December 30, 2012 was $13.39 to $27.31.27, 2015 is $20.62.
(5)The value of the automatic acceleration of the vesting of stock awards held by a named executive officer is basedBased on: (i) the number of unvested stockRSU awards held by such officerexecutive as of December 30, 2012,27, 2015, multiplied by (ii) the per share market price of our ordinary shares as of December 30, 201224, 2015, the last trading day of fiscal 2015, based upon the per share closing sale price of our ordinary shares on December 24, 2015 ($23.56), as reported by the NASDAQ Global Select Market.

172

Table of Contents


(6)Amounts reported assume payment equal to full target annual bonus, even though the bonus will be pro-rated and even though the bonus will be paid only if earned pursuant to the terms of our performance incentive plan in the case of a termination other than in connection with a change in control or death or disability.

Actual Payments to Named Executive Officers in Connection with Wright/Tornier Merger. The table below reflects the amount of compensation and benefits paid or payable to each named executive officer as a result of the Wright/Tornier merger which occurred on October 1, 2015. These amounts are reflected in the “All other compensation” column of the Summary Compensation Table.
Name 

Cash
severance ($)
 
Benefits
continuation ($)
 Option award acceleration ($)(1) 
Restricted stock/RSU
award acceleration ($)(2)
 Total ($)
Mr. Palmisano    1,478,050 1,478,050
Mr. Mowry   74,814 867,582 942,396
Mr. Berry    243,307 243,307
Mr. McCormick 566,000 4,000 43,183 521,112 1,134,295
Mr. Morrison   22,248 519,210 541,458
Mr. Rich   26,033 449,386 475,419
Mr. Lightman   82,420 203,310 285,730
Mr. Van Ummersen 547,538 4,000 32,187 516,192 1,099,917
____________________
(1)Based on the difference between: (i) the per share market price of the ordinary shares underlying the unvested stock options held by such executive as of October 1, 2015, the date of the Wright/Tornier merger ($20.67), as reported by the NASDAQ Global Select Market, on December 28, 2012 ($16.29).and (ii) the per share exercise price of the options held by such executive.
(6)The foreign currency exchange rate
(2)Based on: (i) the number of 1.2847 U.S. dollars forunvested RSU awards held by such executive as of October 1, Euro, which reflects an average conversion rate for 2012, was used to calculate Mr. Epinette’s payments and benefits upon termination of employment.
(7)Includes amounts payable pursuant to the French incentive compensation scheme maintained by Tornier SAS assuming 100% achievement of applicable performance metrics. Pursuant to French law, participants receive their annual incentive payment for the year of their termination of employment for any reason. Upon a qualifying termination following a change in control, Mr. Epinette also will receive his full target annual bonus for the year of the change in control under our employee performance incentive compensation plan.
(8)Reflects an amount equal to 12 months’ gross monthly salary, which is payable as consideration for the restrictive covenants contained in Mr. Epinette’s employment agreement (the “restrictive covenant consideration”). Pursuant to French law, gross monthly salary represents the average salary Mr. Epinette received during the 12-month period preceding his termination and includes the amount of annual incentive bonus payable to Mr. Epinette in 2012 in respect of 2011 performance pursuant to our annual bonus program.
(9)Reflects, in addition to the restrictive covenant consideration described in note (8), an amount equal to one-fifth of Mr. Epinette’s gross monthly salary,2015, multiplied by his number(ii) the per share market price of yearsour ordinary shares as of service with Tornier SAS, which is intended to reflect an amount payable pursuant to French law insuch date based upon the eventper share closing sale price of Mr. Epinette’s involuntary termination of employment. Mr. Epinette will receive these benefits following any involuntary termination of employment, except for a termination involving serious or gross misconduct.our ordinary shares on October 1, 2015 ($20.67), as reported by the NASDAQ Global Select Market.
(10)Reflects, in addition to the restrictive covenant consideration described in note (8), an amount equal to 12 months’ gross monthly salary, which is intended to reflect an amount payable pursuant to Mr. Epinette’s employment agreement in the event of an involuntary termination of employment within 12 months following a change in control.


Risk Assessment of Compensation Policies, Practices, and Programs


As a result of our annual assessment on risk in our compensation programs, we concluded that our compensation policies, practices, and programs and related compensation governance structure, work together in a manner so as to encourage our employees, including our named executive officers, to pursue growth strategies that emphasize shareholder value creation, but not to take unnecessary or excessive risks that could threaten the value of our company. As part of our assessment, we noted in particular the following:

annual base salaries for all employees are not subject to performance risk and, for most non-executive employees, constitute the largest part of their total compensation;

while performance-based, or at risk, compensation constitutes a significant percentage of the overall total compensation of many of our employees, including in particular our named executive officers, and thereby we believe motivates our employees to help fulfill our corporate mission, vision, and values, including specific and focused company performance goals, the non-performance based compensation for most employees for most years is also a sufficiently high percentage of their overall total compensation that we do not believe that unnecessary or excessive risk taking is encouraged by the performance-based compensation;

for most employees, our performance-based compensation has appropriate maximums;

a significant portion of performance-based compensation of our employees is in the form of long-term equity incentives which do not encourage unnecessary or excessive risk because they generally vest over a three to four-year period of time thereby focusing our employees on our company’s long-term interests; and

performance-based or variable compensation awarded to our employees, which for our higher-level employees, including our named executive officers, constitutes the largest part of their total compensation, is appropriately balanced between annual and long-term performance and cash and equity compensation, and utilizes several different performance measures and goals that are drivers of long-term success for our company and our shareholders.


As a matter of best practice, we will continue to monitor our compensation policies, practices, and programs to ensure that they continue to align the interest of our employees, including in particular our executive officers, with those of our long-term shareholders while avoiding unnecessary or excessive risk.


173


Compensation Committee Interlocks and Insider Participation

Sean D. Carney, Richard F. Wallman, and Elizabeth H. Weatherman, served as members of the compensation committee of our board of directors during 2015 until October 1, 2015, and Sean D. Carney, John L. Miclot, and Elizabeth H. Weatherman, served as members of the compensation committee of our board of directors during 2015 after October 1, 2015. No member of the compensation committee is or was an officer or employee of ours or any of our subsidiaries while serving on the compensation committee. In addition, no executive officer of ours served during 2015 as a director or a member of the compensation committee of any entity that had an executive officer serving as our director or a member of the compensation committee.
Director Compensation

Overview

Under the terms of our board of directors compensation policy, which was approved by the general meeting of our shareholders on August 26, 2010 and was amended on October 28, 2010, the compensation packages for our non-executive directors are determined by our board ofnon-executive directors, based upon recommendationsa recommendation by the compensation committee. Such compensation is determined by our non-executive directors pursuant to the terms of our articles of association, which provide that if all directors have a conflict of interest in the matter to be acted upon, the matter shall be approved by our non-executive directors. In determining non-executive director compensation, we target such compensation in the market median range of our peer companies; although, we may deviate from the median if we determine necessary or appropriate on a case by casecase-by-case basis.

Under the terms of our non-executive director compensation program, compensation for our non-executive directors is comprised of both cash compensation and equity-based compensation. Cash compensation is in the form of annual or other retainers for non-executive directors, chairman, committee chairs, and committee members. Equity-based compensation is in the form of initial and annual stock option and stock grants (in the form of RSU awards). Each of these components is described in more detail below. We do not provide perquisites and other personal benefits to our non-executive directors.
During 2012, our2015, the compensation committee engaged Mercer to review our non-executive director compensation program.program as it would apply after the Wright/Tornier merger. In so doing, Mercer analyzed the outside director compensation levels and practices of our peer companies. Mercer used the same peer group of 15 peer companies as werewas approved by the compensation committee and used to gather compensation information for our executive officers at that time and are described inofficers. For more information regarding the “Compensationpeer companies, see the information under “—Compensation Discussion and Analysis” sectionAnalysisDetermination of Executive CompensationUse of Peer Group and Other Market Data of this report. Based on Mercer’s recommendations, ourthe compensation committee recommended and our board of directors approved ain October 2015 certain changes to our non-executive director compensation policy,program, effective October 1, 2015. These changes include an increase in our annual non-executive director retainer from $40,000 to $45,000, the termspremium for our chair of which arethe nominating, corporate governance and compliance committee from $5,000 to $10,000, the annual retainer for audit committee members from $10,000 to $15,000, and the compensation committee and nominating, corporate governance and compliance committee from $5,000 to $7,000, and an increase in the annual equity-based compensation award from $150,000 to $160,000. Our non-executive director compensation program is consistent with our shareholder-approved board of directors compensation policy. In November 2012, our compensation committee recommended and our board

174

Table of directors approved a change to our non-executive director compensation policy to provide for compensation to our new interim vice chairman, the terms of which also are consistent with our shareholder-approved board of directors compensation policy.

Under the terms of the non-executive director compensation policy, compensation for our non-executive directors is comprised of both cash compensation and equity-based compensation. Our cash compensation is in the form of annual or other retainers for our non-executive directors, chairman of the board, interim vice chairman, committee chairs and committee members. Our equity-based compensation is in the form of initial and annual stock option and stock grants (in the

form of restricted stock units). Each of these components is described in more detail below. We do not generally provide perquisites and other personal benefits to our non-executive directors.

Contents


Cash Compensation

The cash compensation component of our non-executive director compensation consists of gross annual fees, commonly referred to as annual cash retainers, paid to each non-executive director and additional annual cash retainers paid to the chairman and each board committee chair and member.

The table below sets forth the annual cash retainers paid to each non-executive director and the additional annual cash retainers paid to the chairman and each board committee chair and member:

Description

Annual cash
retainer ($)

Non-executive director

40,000

Chairman of the board premium

50,000

Audit committee chair premium

10,000

Compensation committee chair premium

5,000

Nominating and corporate governance committee chair premium

5,000

Audit committee member (including chair)

10,000

Compensation committee member (including chair)

5,000

Nominating and corporate governance committee member (including chair)

5,000

member prior to October 1, 2015 and after the changes to our non-executive director compensation program effective as of October 1, 2015:

  Annual cash retainer ($)
Description 
Before
October 1, 2015
 
After
October 1, 2015
Non-executive director 40,000 45,000
Chairman premium 50,000 50,000
Audit committee chair premium 15,000 15,000
Compensation committee chair premium 10,000 10,000
Nominating, corporate governance and compliance committee chair premium 5,000 10,000
Strategic transactions committee chair premium 10,000 10,000
Audit committee member (including chair) 10,000 15,000
Compensation committee member (including chair) 5,000 7,000
Nominating, corporate governance and compliance committee member (including chair) 5,000 7,000
Strategic transactions committee member (including chair) 5,000 5,000

The annual cash retainers are paid on a quarterly basis in arrears within 30 days of the end of each calendar quarter. For example, the retainers for the first calendar quarter covering the period from January 1 through March 31 are paid within 30 days of March 31.

Our interim vice chairman

In addition, each non-executive director receives a cash retainertravel stipend of $100,000, paid$2,000 for each board meeting attended in two equal installments of $50,000 each.

person that takes place in the Netherlands or other location outside the United States.

Equity-Based Compensation

The equity-based compensation component of our non-executive director compensation consists of initial stock option and stock grants (in the form of restricted stock units)RSUs awards to new non-executive directors upon their first appointment or election to our board of directors and annual stock option and stock grants (in the form of restricted stock units)RSU awards to all non-executive directors on the same date that annual performance recognition grants of equity awards are made to our employees (or such other date if otherwise in accordance with all applicable, laws, rules, and regulations).

Non-executive directors, upon their initial election to our board of directors and on an annual basis thereafter effective as of the same date that annual performance recognition grants of equity awards are made to our employees (or such other date if otherwise in accordance with all applicable, laws, rules, and regulations), receive $125,000,$160,000, one-half of which is paid in stock options and the remaining one-half of which is paid in stock grants (in the form of restricted stock units).RSU awards. The number of ordinary shares underlying the stock options and stock grantsRSU awards is determined based on the 10-trading10‑trading day average closing sale price of an ordinary share, as reported by the NASDAQ Global Select Market, and as determined one week prior to the date of anticipated corporate approval of the award. The stock options have a term of 10 years and a per share exercise price equal to 100% of the fair market value of an ordinary share on the grant date. The stock options and stock grants (in the form of restricted stock units) vest over a three-yeartwo-year period, with one-thirdone-half of the underlying shares vesting on each of the one-year two-year and three-yeartwo-year anniversaries of the grant date, in each case so long as the director is still a director as of such date.

The RSU awards vest in full on the one-year anniversary of the grant date so long as the director is still a director as of such date.

Because of the pendency of the Wright/Tornier merger and our inability to grant equity awards prior to the completion of the merger, no stock options or RSU awards were granted to any of our directors until after completion of the merger. Accordingly, on August 10, 2012,October 13, 2015, at the first in-person board of directors meeting held in the Netherlands after completion of the merger, each of our non-executive directors receivedwas granted equity awards with an aggregate value of $160,000, comprised of a stock option to purchase 6,44811,018 ordinary shares at an exercise price of $18.04$20.62 per share and a stock grant in the forman RSU award representing 3,808 ordinary shares.

175

Table of a restricted stock unit representing 2,947 shares.

Contents


Election to Receive Equity-Based Compensation in Lieu of Cash Compensation

Our non-executive director compensation policy allows our non-executive directors to elect to receive a stock grantan RSU award in lieu of 100% of their annual cash retainers payable for services to be rendered as a non-executive director, chairman and chair or member of any board committee. Each non-executive director who elects to receive a stock grantan RSU award in lieu of such director’s annual cash retainers is granted a stock grant (in the form of a restricted stock unit)an RSU award under our stock incentive plan for that number of ordinary shares as determined by dividing the aggregate dollar amount of all annual cash retainers anticipated to payable to such director for the period commencing on July 1 of each year to June 30 of the following year by the 10-trading day average closing sale price of our ordinary shares as reported by the NASDAQ Global Select Market and as

determined one week prior to the date of anticipated corporate approval of the award. AllThese RSU awards are typically granted effective as of the same date that other director equity grants are made and annual performance recognition grants of equity awards are made to our employees or such other date if otherwise in accordance with all applicable, laws, rules and regulations. These RSU awards vest in four equal installments on the following September 30th, December 31st, March 31st and June 30th.

Four of our non-executive directors elected to receive such a stock grantan RSU award in lieu of their cash retainers for the period covering July 1, 20112014 through June 30, 2012,2015, and accordingly, effective as of August 12, 2014, these four non-executive directors received RSU awards. Two of our non-executive directors elected to receive such a stock grantan RSU award in lieu of their cash retainers for the period covering July 1, 20122015 through June 30, 2013. Accordingly, effective as2016. Because of August 12, 2011 allthe pendency of the Wright/Tornier merger, however, and our inability to grant equity awards prior to completion of the merger, these two non-executive directors received a stockthese RSU awards on October 13, 2015 at the first in-person board of directors meeting held in the Netherlands after completion of the merger. Because of the timing of these grants, the first tranche vested immediately on the grant and effective as of August 10, 2012, four of our non-executive directors received a stock grant.date, October 13, 2015. These stock grantsRSU awards are described in more detail in note (1) to the Director Compensation Table below.

under “—Summary of Cash and Other Director Compensation.”

If a non-executive director who elected to receive a stock grantan RSU award in lieu of such director’s annual cash retainers is no longer a director before such director’s interest in all of the ordinary shares underlying the stock grantRSU award have vested and become issuable, then such director will forfeit his or her rights to receive all of the shares underling such stock grantRSU award that have not vested and been issued as of the date such director’s status as a director so terminates. In such case, the non-executive director will receive in cash a pro rata portion of his or her annual cash retainers for the quarter in which the director’s status as a director terminates.

If a non-executive director who elected to receive a stock grantan RSU award in lieu of such director’s annual cash retainers becomes entitled to receive an increased or additional annual cash retainer during the period from July 1 to June 30 of the next year, such director will receive such increased or additional annual cash retainer in cash until July 1 of the next year when the director may elect (on or prior to June 15 of the next year) to receive a stock grantan RSU award in lieu of such director’s annual cash retainers.

If a non-executive director who elected to receive a stock grantan RSU award in lieu of such director’s annual cash retainers experiences a change in the director’s membership on one or more board committees or chair positions prior to June 30 of the next year such that the director becomes entitled to receive annual cash retainers for the period from July 1 to June 30 of the next year aggregating an amount less than the aggregate amount used to calculate the director’s most recent stock grantRSU award received, the director will forfeit as of the effective date of such board committee or chair change his or her rights to receive a pro rata portion of the shares underlying such stock grantRSU award reflecting the decrease in the director’s aggregate annual cash retainers and the date on which such decrease occurred. In addition, the vesting of the stock grantRSU award will be revised appropriately to reflect any such change in the number of shares underlying the stock grantRSU award and the date on which such change occurred.


176


Summary of Cash and Other Director Compensation

The table below summarizes the compensation received by each individual who served as a non-executive director of our non-executive directors forcompany during the year ended December 30, 2012.27, 2015. While Mr. KohrsMessrs. Palmisano and Mowry did not receive additional compensation for his formertheir service as a director,directors, a portion of histheir compensation was allocated to histheir service as a membermembers of ourthe board of directors. For more information regarding the allocation of Mr. Kohrs’sMessrs. Palmisano’s and Mowry’s compensation, please refer to note (1) to the Summary Compensation Table.

Table under “—Executive Compensation Tables and NarrativesSummary Compensation.”

DIRECTOR COMPENSATION– 2012

Name

  Fees earned
or paid
in cash(1)
($)
   Stock
awards(2)(3)
($)
   Option
awards(4)(5)
($)
   All other
compensation(6)
($)
   Total
($)
 

Sean D. Carney

   110,000     91,719     116,321     —       213,351  

Richard B. Emmitt

   50,000     70,684     116,321     —       237,005  

Pascal E.R. Girin(7)

   45,000     53,164     116,321     —       214,485  

Kevin C. O’Boyle

   55,000     53,164     116,321     —       224,485  

Alain Tornier

   40,000     67,187     116,321     —       223,508  

Richard F. Wallman

   65,000     53,164     116,321     —       234,485  

Elizabeth H. Weatherman

   45,000     68,945     116,321     —       230,266  

COMPENSATION- 2015

Name 
Fees earned
or paid
in cash(1)(2)
($)
 
Stock
awards(3)(4)
($)
 
Option
awards(5)(6)
($)
 
All other compensation(7)(8)
($)
 
Total
($)
Gary D. Blackford(9)
 15,000 78,521 77,750 2,000 173,271
Sean D. Carney 107,250 158,753 77,750 2,000 345,753
Richard B. Emmitt(10)
 41,250   4,000 45,250
John L. Miclot(9)
 13,000 78,521 77,750  169,271
Kevin C. O’Boyle 67,500 78,521 77,750 6,000 229,771
Amy S. Paul(9)
 15,500 78,521 77,750 2,000 173,771
David D. Stevens(9)
 25,500 78,521 77,750 2,000 183,771
Alain Tornier(10)
 30,000    30,000
Richard F. Wallman 71,250 78,521 77,750 6,000 233,521
Elizabeth H. Weatherman 48,500 132,999 77,750 4,000 263,249
____________________
(1)

Unless a director otherwise elects to convert all of his or her annual retainers into stockRSU awards, (in the form of restricted stock units), annual retainers are paid in cash on a quarterly basis in arrears within 30 days of the end of each calendar quarter. AllFour of our non-executive directors elected to convert all of their annual retainers covering the period of service from July 1, 20112014 to June 30, 20122015 and fourtwo of our non-executive directors elected to convert their annual retainers covering the period of service from July 1, 20122015 to June 30, 20132016 into stockRSU awards under our stock incentive plan. Accordingly, all of thethese four non-executive directors were granted stockRSU awards on August 12, 20112014 and four of ourthe two non-executive directors were granted stockRSU awards on August 10, 2012October 13, 2015 for that number of ordinary shares as determined based on the following formula: (a) the aggregate dollar amount of all annual cash retainers that otherwise would have been payable to the non-executive director for services to be rendered as a non-executive director, chairman and chair or member of any board committee (based on such director’s board committee memberships and chair positions as of the grant date), divided by (b) the 10-trading10‑trading day average closing sale price of an ordinary share, as reported by the NASDAQ Global Select Market, and as determined approximately one week prior to the date of anticipated corporate approval of the award. Such stockRSU awards vest and the underlying shares become issuable in four as nearly equal as possible

quarterly installments, on September 30, December 31, March 31 and June 30, in each case so long as the non-executive director is a director of our company as of such date. Due to the pendency and timing of the Wright/Tornier merger, the number of ordinary shares for the most recent RSU awards was determined based on the average closing sale price of an ordinary share during the period from October 1, 2015 until the date of grant on October 13, 2015 and the first tranche vested on October 13, 2015.


The table below sets forth: (a) the number of stockRSU awards granted to each non-executive director on August 10, 2012;October 13, 2015; (b) the total amount of annual retainers converted by such director into stockRSU awards; (c) of such total amount of annual retainers converted into stockRSU awards, the amount attributed to the director’s service during 2012,2015, which amount is included in the “Fees earned or paid in cash” column for each director; (d) the grant date fair value of the stock awards computed in accordance with FASB ASC Topic 718; and (e) the incremental grant date fair value for the stock awards above and beyond the amount of annual retainers for 20122015 service converted into stockRSU awards computed in accordance with FASB ASC Topic 718 .

Name

  Total amount
of retainers
converted
into stock
awards

($)
   Number of
stock  awards
(#)
   Amount of
retainer
converted into
stock awards

attributable to
2012 service

($)
   Grant date fair
value of stock
awards

($)
   Incremental grant
date fair value of
stock awards
received during
2012

($)
 

Mr. Carney

   110,000     5,186     55,000     93,555     38,555  

Mr. Emmitt

   50,000     2,357     25,000     42,520     17,520  

Mr. Tornier

   40,000     1,886     20,000     34,023     14,023  

Ms. Weatherman

   45,000     2,122     22,500     38,281     15,781  

718.

Name 
Total amount of retainers converted into RSU awards
($)
 
Number of
RSU awards
(#)
 
Amount of retainer converted into RSU awards attributable to 2015 service
($)
 
Grant date fair value of RSU awards
($)
 
Incremental grant date fair value of RSU awards received during 2015
($)
Mr. Carney 81,750 3,891 40,875 80,232 39,357
Ms. Weatherman 55,500 2,642 27,750 54,478 26,728

177

Table of Contents

The table below sets forth: (a) the number of stockRSU awards granted to each non-executive director on August 12, 2011;2014; (b) the total amount of annual retainers converted by such director into stockRSU awards; (c) of such total amount of annual retainers converted into stockRSU awards, the amount attributed to the director’s service during 2012, which is the amount shown in the “Fees earned or paid in cash” column for each director;2014; (d) the grant date fair value of the stockRSU awards computed in accordance with FASB ASC Topic 718; and (e) the incremental grant date fair value for the stockRSU awards above and beyond the amount of annual retainers for 20112014 service converted into stockRSU awards computed in accordance with FASB ASC Topic 718 .

Name

  Total amount
of retainers
converted
into stock
awards

($)
   Number of
stock  awards
(#)
   Amount of
retainer
converted into
stock awards
attributable to
2012 service

($)
   Grant date fair
value of stock
awards

($)
   Incremental grant
date fair value of
stock awards
received during
2011

($)
 

Mr. Carney

   110,000     3,940     55,000     93,023     38,023  

Mr. Emmitt

   50,000     1,791     25,000     42,286     17,286  

Mr. Girin

   43,333     1,552     21,667     33,810     12,143  

Mr. O’Boyle

   53,333     1,910     26,667     42,286     15,619  

Mr. Tornier

   40,000     1,432     20,000     33,810     13,810  

Mr. Wallman

   65,000     2,328     32,500     54,964     22,464  

Ms. Weatherman

   45,000     1,612     22,500     38,059     15,559  

718.
Name 
Total amount of retainers converted into RSU awards
($)
 
Number of
RSU awards
(#)
 
Amount of retainer converted into RSU awards attributable to 2014 service
($)
 
Grant date fair value of RSU awards
($)
 
Incremental grant date fair value of RSU awards received during 2014
($)
Mr. Carney 115,000 6,422 57,500 124,908 67,408
Mr. Emmitt 50,000 2,792 25,000 54,304 29,304
Mr. Tornier 40,000 2,234 20,000 43,451 23,451
Ms. Weatherman 45,000 2,513 22,500 48,878 26,378

(2)Does not include fees earned or paid in cash to legacy Wright directors by legacy Wright for service as directors of legacy Wright prior to completion of the Wright/Tornier merger, which consisted of the following: by Mr. Blackford ($33,750); Mr. Miclot ($37,500); Ms. Paul ($37,500); and Mr. Stevens ($69,750). No other compensation was received by these individuals for service as directors of legacy Wright prior to completion of the Wright/Tornier merger.
(3)On August 10, 2012,October 13, 2015, each non-executive director received a stockan RSU award (in the form of a restricted stock unit) for 2,9473,808 ordinary shares granted under our stock incentive plan. The stockRSU award vests and the underlying shares become issuable in three as nearly equal as possible annual installments, on the one-year two-year and three-year anniversariesanniversary of the grant date, and in each caseOctober 13, 2016, so long as the non-executive director is a director of our company as of such date. In addition, as describedescribed above in note (1), certain non-executive directors elected to convert their annual retainers covering the period of service from July 1, 20122015 to June 30, 20132016 into stockRSU awards under our stock incentive plan. The amount reported in the “Stock awards” column represents the aggregate grant date fair value for the August 10, 2012 stockOctober 13, 2015 RSU awards granted to each director in 20122015 and for those directors who elected to convert their annual retainers covering the period of service from July 1, 20122015 to June 30, 2013,2016, the incremental grant date fair value for the August 10, 2012 stockadditional October 13, 2015 RSU awards granted to eachsuch director in 2012 above and beyond the amount of annual retainers for 2012 service converted into stock awards,2015, in each case as computed in accordance with FASB ASC Topic 718. The grant date fair value for stockRSU awards is determined based on the closing sale price of our ordinary shares on the grant date.
(3)
(4)The table below provides information regarding the number of unvested stock awards (all of which are in the form of restricted stock units)RSUs) held by each of the non-executive directors at December 30, 2012 on a per grant basis27, 2015: Mr. Blackford (3,808); Mr. Carney (6,727); Mr. Emmitt (0); Mr. Miclot (3,808); Mr. O’Boyle (3,808); Ms. Paul (3,808); Mr. Stevens (3,808); Mr. Tornier (0); Mr. Wallman (3,808), and on an aggregate basis.Ms. Weatherman (5,790).

Name

  05/12/11
grant date
   08/12/11
grant date
   08/10/12
grant date
   Total number  of
underlying

unvested shares
 

Mr. Carney

   1,980     2,947     3,890     8,817  

Mr. Emmitt

   1,980     2,947     1,768     6,695  

Mr. Girin

   0     0     0     0  

Mr. O’Boyle

   1,980     2,947     0     4,927  

Mr. Tornier

   1,980     2,947     1,415     6,342  

Mr. Wallman

   1,980     2,947     0     4,927  

Ms. Weatherman

   1,980     2,947     1,592     6,519  

(4)
(5)On August 10, 2012,October 13, 2015, each non-executive director received a stock option to purchase 6,44811,018 ordinary shares at an exercise price of $18.04$20.62 per share granted under our stock incentive plan. Such option expires on August 10, 2022October 13, 2025 and vests with respect to one-thirdone-half of the underlying ordinary shares on each of the following dates, so long as the individual remains a director of our company as of such date: August 10, 2013, August 10, 2014October 13, 2016 and August 10, 2015. AmountOctober 13, 2017. Amounts reported in the “Option awards” column representsrepresent the aggregate grant date fair value for option awards granted to each non-executive director in 20122015 computed in accordance with FASB ASC Topic 718. The grant date fair value is determined based on our Black-Scholes option pricing model. The grant date value per share for the option granted on August 10, 2012October 13, 2015 was $8.27$7.06 and was determined using the following specific assumptions: risk free interest rate: 0.91%1.375%; expected life: 6.006.08 years; expected volatility: 47.96%32.7%; and expected dividend yield: 0.


(5)
(6)The table below provides information regarding the aggregate number of options to purchase our ordinary shares outstanding at December 30, 201227, 2015 and held by each of our non-executive directors:

Name

  Aggregate
number of shares
underlying
options
   Exercisable/
unexercisable
  Range of
exercise
price(s) ($)
   Range of
expiration
date(s)

Mr. Carney

   14,248    2,600/11,648   18.04-25.20    05/12/2021-08/10/2022

Mr. Emmitt

   14,248    2,600/11,648   18.04-25.20    05/12/2021-08/10/2022

Mr. Girin

   2,600    2,600/0   25.20    02/02/2013

Mr. O’Boyle

   64,248    33,850/30,398   18.04-25.20    06/03/2020-08/10/2022

Mr. Tornier

   14,248    2,600/11,648   18.04-25.20    05/12/2021-08/10/2022

Mr. Wallman

   48,623    36,975/11,648   16.98-25.20    12/08/2018-08/10/2022

Ms. Weatherman

   14,248    2,600/11,648   18.04-25.20    05/12/2021-08/10/2022

(6)
NameAggregate number of shares underlying options
Exercisable/
unexercisable
Range of
exercise
price(s) ($)
Range of
expiration
date(s)
Mr. Blackford72,87061,852/11,01815.01-29.0605/14/2018-10/13/2025
Mr. Carney38,83827,820/11,01818.04-25.2005/12/2021-10/13/2025
Mr. Emmitt27,82027,820/018.04-25.2005/12/2021-08/12/2024
Mr. O’Boyle88,83877,820/11,01818.04-25.2006/03/2020-10/13/2025
Mr. Miclot103,79992,781/11,01815.01-29.0603/30/2017-10/13/2025
Ms. Paul88,33577,317/11,01815.01-29.0605/14/2018-10/13/2025
Mr. Stevens88,33577,317/11,01815.01-29.0605/12/2015-10/13/2025
Mr. Tornier27,82027,820/018.04-25.2005/12/2021-08/12/2024
Mr. Wallman73,21362,195/11,01816.98-25.2012/08/2018-10/13/2025
Ms. Weatherman38,83827,820/11,01818.04-25.2005/12/2021-10/13/2025

178

Table of Contents


(7)Represents the value of immediate acceleration of unvested stock options, restricted stock and RSU awards in connection with the Wright/Tornier merger and travel stipends of $2,000 for each board meeting attended in person that takes place in the Netherlands or other location outside the United States.

(8)We do not generally provide perquisites and other personal benefits to our non-executive directors. Any perquisites or personal benefits actually provided to any non-executive director were less than $10,000 in the aggregate
(7)Mr. Girin resigned as a director
(9)Joined our board of directors effective upon completion of the Wright/Tornier merger on November 2, 2012 effective immediately.October 1, 2015.

(10)Resigned from our board of directors effective upon completion of the Wright/Tornier merger on October 1, 2015.


179

Table of Contents

Item 12. Security Ownership of Certain Beneficial Owners and Management and Related Stockholder Matters.

Security Ownership of Certain Beneficial Owners and Management

The table below sets forth certain information concerning the beneficial ownership of our ordinary shares as of February 15, 2013, by:

each of our directors and named executive officers;

all of our current directors and executive officers as a group; and

10, 2016, by each person known by us to beneficially own more than 5% of our ordinary shares.

The calculations in the table below assume that there are 41,740,444102,708,047 ordinary shares outstanding. Beneficial ownership is determined in accordance with the rules and regulations of the SEC. In computing the number of ordinary shares beneficially owned by a person and the percentage ownership of that person, we have included ordinary shares that the person has the right to acquire within 60 days, including through the exercise of any option, warrant or other right, the conversion of any other security, and the issuance of ordinary shares upon the vesting of stock awards granted in the form of restricted stock units. The ordinary shares that a shareholder has the right to acquire within 60 days, however, are not included in the computation of the percentage ownership of any other person.

Unless otherwise indicated, the address for each of the individuals listed below is c/o Tornier N.V., Fred. Roeskestraat 123, 1076 EE Amsterdam, the Netherlands.

   Ordinary shares
beneficially owned(1)
 
   Number   Percent 

Directors and named executive officers:


David H. Mowry

   20,747     *  

Douglas W. Kohrs(2)

   1,721,445     4.0

Shawn T McCormick

   —       *  

Carmen L. Diersen(3)

   132,384     *  

Terry M. Rich

   14,678     *  

Stéphan Epinette

   101,025     *  

Kevin M. Klemz

   60,751     *  

Sean D. Carney(4)

   18,502,165     44.3

Richard B. Emmitt(5)

   954,087     2.3

Kevin C. O’Boyle

   39,550     *  

Alain Tornier(6)

   3,959,221     9.5

Richard F. Wallman

   87,123     *  

Elizabeth H. Weatherman(7)

   18,498,283     44.3

All directors and executive officers as a group (12 people)

   23,800,813     56.6

Principal shareholders:


Warburg Pincus Entities (TMG Holdings Coöperatief U.A.)(8)

   18,491,809     44.3

Alain Tornier and related entities(9)

   3,959,221     9.5

Class of   
Ordinary shares
beneficially owned
securities Name and address of beneficial owner Number Percent
Ordinary shares 
FMR LLC(1)
 15,396,371 15.0%
Ordinary shares 
OrbiMed Advisors LLC(2)
 8,245,111 8.0%
Ordinary shares 
T. Rowe Price Associates, Inc.(3)
 8,171,486 8.0%
Ordinary shares 
The Vanguard Group, Inc.(4)
 6,309,119 6.1%
Ordinary shares 
Warburg Pincus Entities (TMG Holdings Coöperatief U.A.)(5) 
 6,221,809 6.1%
Ordinary shares 
Invesco Ltd.(6)
 5,959,205 5.8%
____________________
*Represents beneficial ownership of less than 1% of our outstanding ordinary shares.
(1)Based solely on information contained in a Schedule 13G/A of FMR LLC, an investment advisor, filed with the SEC on February 12, 2016, with sole investment discretion with respect to all such shares and sole voting authority with respect to 974,750 shares. Edward C. Johnson 3d is a Director and the Chairman of FMR LLC and Abigail P. Johnson is a Director, the Vice Chairman and the President of FMR LLC. Members of the family of Edward C. Johnson 3d, including Abigail P. Johnson, are the predominant owners, directly or through trusts, of Series B voting common shares of FMR LLC, representing 49% of the voting power of FMR LLC. The Johnson family group and all other Series B shareholders have entered into a shareholders’ voting agreement under which all Series B voting common shares will be voted in accordance with the majority vote of Series B voting common shares. Accordingly, through their ownership of voting common shares and the execution of the shareholders’ voting agreement, members of the Johnson family may be deemed, under the Investment Company Act of 1940, to form a controlling group with respect to FMR. Neither FMR nor Edward C. Johnson 3d nor Abigail P. Johnson has the sole power to vote or direct the voting of the shares owned directly by the various investment companies registered under the Investment Company Act (“Fidelity Funds”) advised by Fidelity Management & Research Company (“FMR Co”), a wholly owned subsidiary of FMR, which power resides with the Fidelity Funds’ Boards of Trustees. Fidelity Co carries out the voting of the shares under written guidelines established by the Fidelity Funds’ Boards of Trustees. The business address of FMR LLC is 245 Summer Street, Boston, Massachusetts 02210.
(2)Based solely on a Schedule 13G/A filed on February 11, 2016 by OrbiMed Advisors LLC, OrbiMed Capital LLC, and Samuel D. Isaly reflecting beneficial ownership as of December 31, 2015. The beneficial ownership reflected in the table includes 3,781,397 ordinary shares beneficially owned by OrbiMed Advisors LLC with shared voting and investment discretion; 4,463,714 ordinary shares beneficially owned by OrbiMed Capital LLC with shared voting and investment discretion, and 8,245,111 ordinary shares beneficially owned by Samuel D. Isaly with shared voting and investment discretion. The address of their principal business office is 601 Lexington Avenue, 54th floor, New York, New York 10022.

(3)Based solely on information contained in a Schedule 13G/A of T. Rowe Price Associates, Inc., an investment advisor, filed with the SEC on February 10, 2016, reflecting beneficial ownership as of December 31, 2015, with sole investment discretion with respect to all such shares, and sole voting authority with respect to 1,005,718 shares. The address of T. Rowe Price Associates, Inc. is 100 East Pratt Street, Baltimore, Maryland 21202.

(4)Based solely on information contained in a Schedule 13G of The Vanguard Group, Inc., an investment adviser, filed with the SEC on February 16, 2016, reflecting beneficial ownership as of December 31, 2015, with sole investment discretion with respect to 6,150,047 shares, sole voting authority with respect to 156,381 shares, shared investment discretion with respect to 159,072 shares and shared voting authority with respect to 8,326 shares. The address of The Vanguard Group, Inc. is 100 Vanguard Blvd., Malvern, Pennsylvania 19355.
(5)Reflects ordinary shares held by TMG Holdings Coöperatief U.A., a Dutch coöperatief (TMG). TMG is wholly-owned by Warburg Pincus (Bermuda) Private Equity IX, L.P., a Bermuda limited partnership (WP Bermuda IX), and WP (Bermuda) IX PE One Ltd., a Bermuda company (WPIX PE One). The general partner of WP Bermuda IX is Warburg Pincus (Bermuda) Private Equity Ltd., a

180

Table of Contents

Bermuda company (WP Bermuda Ltd.). WP Bermuda IX is managed by Warburg Pincus LLC, a New York limited liability company (WP LLC, and together with WP Bermuda IX, WPIX PE One and WP Bermuda Ltd., the Warburg Pincus Entities). Charles R. Kaye and Joseph P. Landy are the Managing General Partners of Warburg Pincus & Co., a New York general partnership (WP), and Managing Members and Co‑Chief Executive Officers of WP LLC and may be deemed to control the Warburg Pincus Entities. Each of the Warburg Pincus Entities, Mr. Kaye and Mr. Landy has shared voting and investment control of all of the ordinary shares referenced above. By reason of the provisions of Rule 16a-1 of the Securities Exchange Act of 1934, as amended, Mr. Kaye, Mr. Landy and the Warburg Pincus Entities may be deemed to be the beneficial owners of the ordinary shares held by TMG. Each of Mr. Kaye, Mr. Landy and the Warburg Pincus Entities disclaims beneficial ownership of the ordinary shares referenced above except to the extent of any pecuniary interest therein. The address of the Warburg Pincus entities is 450 Lexington Avenue, New York, New York 10017.
(6)Based solely on information contained in a Schedule 13G of Invesco Ltd., an investment advisor, filed with the SEC on February 12, 2016, reflecting beneficial ownership as of December 31, 2015, with sole investment discretion and sole voting authority with respect to all such shares. The address of Invesco Ltd. is 1555 Peachtree Street NE, Suite 1800, Atlanta, Georgia 30309.

Security Ownership of Management
The table below sets forth certain information concerning the beneficial ownership of our ordinary shares as of February 10, 2016, by each of our directors and named executive officers and all of our current directors and executive officers as a group.
The calculations in the table below assume that there are 102,708,047 ordinary shares outstanding. Beneficial ownership is determined in accordance with the rules and regulations of the SEC. In computing the number of ordinary shares beneficially owned by a person and the percentage ownership of that person, we have included ordinary shares that the person has the right to acquire within 60 days, including through the exercise of any option, warrant or other right, the conversion of any other security, and the issuance of ordinary shares upon the vesting of stock awards granted in the form of restricted stock units. The ordinary shares that a shareholder has the right to acquire within 60 days, however, are not included in the computation of the percentage ownership of any other person.
Class of   
Ordinary shares
beneficially owned(1)
securities Name and address of beneficial owner Number Percent
Ordinary shares Robert J. Palmisano 1,221,213 1.2%
Ordinary shares David H. Mowry 279,544 *
Ordinary shares Lance A. Berry 175,074 *
Ordinary shares Shawn T McCormick 127,475 *
Ordinary shares Gregory Morrison 189,910 *
Ordinary shares Terry M. Rich 158,881 *
Ordinary shares James A. Lightman 143,955 *
Ordinary shares Gordon W. Van Ummersen 100,014 *
Ordinary shares David D. Stevens 144,283 *
Ordinary shares Gary D. Blackford 118,242 *
Ordinary shares 
Sean D. Carney(2)
 6,277,779 6.1%
Ordinary shares John L. Miclot 121,934 *
Ordinary shares Kevin C. O’Boyle 88,148 *
Ordinary shares Amy S. Paul 107,934 *
Ordinary shares Richard F. Wallman 115,096 *
Ordinary shares 
Elizabeth H. Weatherman(3)
 6,267,552 6.1%
Ordinary shares All directors and executive officers as a group (22 persons) 9,899,153 9.4%
____________________
*Represents beneficial ownership of less than 1% of our outstanding ordinary shares.

181

Table of Contents

(1)
Includes for the persons listed below the following ordinary shares subject to options held by that person that are currently exercisable or become exercisable within 60 days of February 15, 201210, 2016 and ordinary shares issuable upon the vesting of stockRSU awards granted in the form of restricted stock units within 60 days of February 15, 2012:10, 2016:

Name

  Options   Stock awards in the form
of restricted stock units
 

David H. Mowry

   18,183     —    

Douglas W. Kohrs

   1,288,193     —    

Shawn McCormick

   —      

Carmen L. Diersen

   114,521     —    

Terry M. Rich

   13,922     —    

Stéphan Epinette

   99,497     —    

Kevin M. Klemz

   59,651     —    

Sean D. Carney

   2,600     1,297  

Richard B. Emmitt

   2,600     589  

Name

  Options   Stock awards in the form
of restricted stock units
 

Kevin C. O’Boyle

   36,975     —    

Alain Tornier

   2,600     472  

Richard F. Wallman

   36,975     —    

Elizabeth H. Weatherman

   2,600     531  

All directors and executive officers as a group (12 persons)

   329,570     2,889  

Name Options RSU awards
Robert J. Palmisano 1,070,258 
David H. Mowry 216,751 
Lance A. Berry 117,124 
Shawn T McCormick 91,441 
Gregory Morrison
 152,993 
Terry M. Rich 119,548 
James A. Lightman 127,400 
Gordon W. Van Ummersen 69,955 
David D. Stevens 77,317 
Gary D. Blackford 61,852 
Sean D. Carney 27,820 973
John L. Miclot 92,781 
Kevin C. O’Boyle 77,820 
Amy S. Paul 77,317 
Richard F. Wallman 62,195 
Elizabeth H. Weatherman 27,820 661
All directors and executive officers as a group (22 persons) 2,859,455 1,634

(2)Mr. Kohrs resigned as our President, Chief Executive Officer and Executive Director effective as of November 12, 2012.
(3)Ms. Diersen resigned as our Global Chief Financial Officer effective July 17, 2012.
(4)Includes 18,491,8096,221,809 ordinary shares held by affiliates of Warburg Pincus & Co. Mr. Carney is a Partner of Warburg Pincus & Co. and a Member and a Managing Director of Warburg Pincus LLC. All ordinary shares indicated as owned by Mr. Carney are included because of his affiliation with the Warburg Pincus Entities (as defined below). See footnote (9) below.Entities. Mr. Carney disclaims beneficial ownership of all securities that may be deemed to be beneficially owned by the Warburg Pincus Entities, except to the extent of any pecuniary interest therein. Mr. Carney’s address is c/o Warburg Pincus LLC, 450 Lexington Avenue, New York, New York 10017.

(5)Includes: (i) 26,933 shares held in Mr. Emmitt’s IRA account, (ii) 262 shares held by Mr. Emmitt’s spouse, (iii) 206 shares held by an IRA account of Mr. Emmitt’s spouse, and (iv) 720,911 shares held by VFI, a Delaware limited partnership, and 162,358 shares held by VFII, a Delaware limited partnership. The Vertical Group, L.P., a Delaware limited partnership, is the sole general partner of each of VFI and VFII, and The Vertical Group GP, LLC controls The Vertical Group, L.P. Mr. Emmitt is a Member and Manager of The Vertical Group GP, LLC, which controls The Vertical Group, L.P. All ordinary shares indicated as owned by Mr. Emmitt are included because of his affiliation with The Vertical Group, L.P. Mr. Emmitt disclaims beneficial ownership of all securities that may be deemed to be beneficially owned by The Vertical Group, L.P., except to the extent of any indirect pecuniary interest therein. Mr. Emmitt’s address is c/o The Vertical Group, L.P., 25 DeForest Avenue, Summit, New Jersey 07901.
(6)(3)Includes 3,485,292 ordinary shares held by KCH Oslo AS (KCH Oslo) and 467,797 ordinary shares held by Phil Invest ApS. KCH Stockholm AB wholly owns KCH Oslo, and Mr. Tornier wholly owns KCH Stockholm AB. Mr. Tornier also wholly owns Phil Invest ApS. All ordinary shares indicated as owned by Mr. Tornier are included because of his affiliation with these entities.
(7)Includes 18,491,8096,221,809 ordinary shares held by affiliates of Warburg Pincus & Co. Ms. Weatherman is a Partner of Warburg Pincus & Co. and a Member and a Managing Director of Warburg Pincus LLC. All ordinary shares indicated as owned by Ms. Weatherman are included because of her affiliation with the Warburg Pincus Entities. See footnote (8) below. Ms. Weatherman disclaims beneficial ownership of all securities that may be deemed to be beneficially owned by the Warburg Pincus Entities, except to the extent of any pecuniary interest therein. Ms. Weatherman’s address is c/o Warburg Pincus LLC, 450 Lexington Avenue, New York, New York 10017.
(8)Reflects ordinary shares held by TMG Holdings Coöperatief U.A., a Dutch coöperatief (TMG). TMG is wholly owned by Warburg Pincus (Bermuda) Private Equity IX, L.P., a Bermuda limited partnership (WP Bermuda IX), and WP (Bermuda) IX PE One Ltd., a Bermuda company (WPIX PE One). The general partner of WP Bermuda IX is Warburg Pincus (Bermuda) Private Equity Ltd., a Bermuda company (WP Bermuda Ltd.). WP Bermuda IX is managed by Warburg Pincus LLC, a New York limited liability company (WP LLC, and together with WP Bermuda IX, WPIX PE One and WP Bermuda Ltd., the Warburg Pincus Entities). Charles R. Kaye and Joseph P. Landy are the Managing General Partners of Warburg Pincus & Co., a New York general partnership (WP), and Managing Members and Co-Presidents of WP LLC and may be deemed to control the Warburg Pincus Entities. Each of the Warburg Pincus Entities, Mr. Kaye and Mr. Landy has shared voting and investment control of all of the ordinary shares referenced above. By reason of the provisions of Rule 16a-1 of the Securities Exchange Act of 1934, as amended, Mr. Kaye, Mr. Landy and the Warburg Pincus Entities may be deemed to be the beneficial owners of the ordinary shares held by TMG. Each of Mr. Kaye, Mr. Landy and the Warburg Pincus Entities disclaims beneficial ownership of the ordinary shares referenced above except to the extent of any pecuniary interest therein. The address of the Warburg Pincus entities is 450 Lexington Avenue, New York, New York 10017.
(9)Includes 3,485,292 ordinary shares held by KCH Oslo, 467,797 ordinary shares held by Phil Invest ApS and shares held directly by or issuable to Mr. Tornier upon the exercise of certain stock options and the vesting of certain stock awards as described in footnote (1). KCH Stockholm AB wholly owns KCH Oslo, and Mr. Tornier wholly owns KCH Stockholm AB. Mr. Tornier also wholly owns Phil Invest ApS. The address of KCH Oslo is c/o Knut Solvang, Postboks 345 Lysaker, N-1326 Lysaker, Norway.


182


Securities Authorized for Issuance Under Equity Compensation Plans

The table below provides information about ourregarding the number of ordinary shares that mayto be issued upon the exercise of outstanding stock options and RSU awards granted under our equity compensation plans and the number of ordinary shares remaining available for future issuance our equity compensation plans as of December 30, 2012.

Plan category

  Number of securities
to be issued upon
exercise of outstanding
options and restricted
stock units
(a)
   Weighted-average
exercise price of
outstanding options,
warrants and rights
(b)
   Number of securities
remaining available for
future issuance under
equity compensation
plans (excluding securities
reflected in column (a))
(c)
 

Equity compensation plans approved by security holders

   4,204,430    $18.46     2,802,709  

Equity compensation plans not approved by security holders

   —       —       —    


Total

   4,204,430    $18.46     2,802,709  


27, 2015.
EQUITY COMPENSATION PLAN INFORMATION
Plan category
Number of securities
to be issued upon
exercise of outstanding
options, warrants and rights
(a)
Weighted‑average
exercise price of
outstanding options,
warrants and rights
(b)
Number of securities
remaining available for
future issuance under
equity compensation
plans (excluding securities
reflected in column (a))
(c)
Equity compensation plans approved by security holders
6,720,866(1)(2)(3)
$20.55(4)
3,205,372(5)
Equity compensation plans not approved by security holders
Total
6,720,866(1)(2)(3)
$20.55(4)
3,205,372(5)
____________________
(1)Amount includes ordinary shares issuable upon the exercise of stock options granted under the Wright Medical Group N.V. Amended and Restated 2010 Incentive Plan and Tornier N.V. Amended and Restated Stock Option Plan and the Tornier N.V. Amended and Restated 2010 Incentive Plan and ordinary shares issuable upon the vesting of stockRSU awards in the form of restricted stock units granted under the TornierWright Medical Group N.V. Amended and Restated 2010 Incentive Plan.
(2)Excludes employee stock purchase rights under the Tornier N.V. 2010 Employee Stock Purchase Plan, as amended. Under such plan, each eligible employee may purchase up to 833 ordinary shares at semi-annual intervals on June 30th and December 31st each calendar year at a purchase price per share equal to 85% of the closing sales price per share of our ordinary shares on the last day of the offering period. Offering periods under this plan were suspended in connection with the Wright/Tornier merger and as of December 27, 2015 had not been reinstated.
(3)IncludedExcludes an aggregate of 3,362,110 ordinary shares issuable upon the exercise of stock options granted under legacy Wright equity compensation plans and non-plan inducement option agreements assumed by us in connection with the Wright/Tornier merger. The weighted-average per share exercise price of these assumed stock options as of December 27, 2015 was $23.50. No further grants or awards will be made under these assumed legacy Wright equity compensation plans and non-plan inducement option agreements.
(4)Not included in the weighted-average exercise price calculation are 422,264 stock awards granted in the form of restricted stock units with a weighted-average exercise price of $20.57. The weighted-average exercise price of all outstanding stock options as of December 30, 2012 and reflected in column (a) was $18.23.1,133,295 RSU awards.
(4)
(5)Amount includes 2,483,6002,910,716 ordinary shares remaining available for future issuance under the TornierWright Medical Group N.V. Amended and Restated 2010 Incentive Plan and 319,109285,845 ordinary shares remaining available for future issuance under the Tornier N.V. 2010 Employee Stock Purchase Plan, as amended. No shares remain available for grant under the Tornier N.V. Amended and Restated Stock Option Plan or any of the legacy Wright equity compensation plans since such plan wasplans have been terminated with respect to future grants upon our initial public offering in February 2011.grants.


183

Table of Contents

Item 13. Certain Relationships and Related Transactions, and Director Independence.

Introduction
Below under the heading “-

Certain Relationships and Description ofRelated Party Transactions

We describe below transactions and series” is a description of similar transactions that have occurred since the beginning of our last fiscal year, or any currently proposed transactions, to which we were or are a participant and in which:

the amounts involved exceeded or will exceed $120,000; and

a related person (including any director, director nominee, executive officer, holder of more than 5% of our ordinary shares or any member of their immediate family) had or will have a direct or indirect material interest.

We refer


These transactions are referred to these transactions as “related party transactions.”

Procedures Regarding Approval of Related Party Transactions
As provided in our audit committee charter, all related party transactions are to be reviewed and pre-approved by ourthe audit committee. In determining whether to approve a related party transaction, ourthe audit committee generally will evaluate the transaction in terms of (i) the benefits to us;our company; (ii) the impact on a director’s independence in the event the related person is a director, an immediate family member of a director, or an entity in which a director is a partner, shareholder or executive officer; (iii) the availability of other sources for comparable products or services; (iv) the terms and conditions of the transaction; and (v) the terms available to unrelated third parties or to employees generally. OurThe audit committee will then document its findings and conclusions in written minutes. In the event a transaction relates to a member of ourthe audit committee, that member will not participate in the audit committee’s deliberations.

Description of Related Party Transactions
The following persons and entities that participated in the transactions described in this section were related persons at the time of the transaction:

Alain Tornier and Related Entities. Mr. Alain Tornier iswas a member of our board of directors.directors until the completion of the Wright/Tornier merger. Mr. Tornier wholly owns KCH Stockholm AB, which wholly owns Karenslyst Årgang 2011 XXXVIIKCH Oslo AS, which holds more than 5%approximately 1.7% of our outstanding ordinary shares. Mr. Tornier also wholly owns Phil Invest ApS, which also holds our ordinary shares.shares as of February 10, 2016.

TMG Holdings Coöperatief U.A., Warburg Pincus (Bermuda) Private Equity IX, L.P., Sean D. Carney and Elizabeth H. Weatherman. TMG Holdings Coöperatief U.A., or TMG, holds more than 5%approximately 6.1% of our outstanding ordinary shares. Ourshares as of February 10, 2016. Tornier’s directors, Mr.Sean D. Carney and Ms.Elizabeth H. Weatherman, are Managing Directors of Warburg Pincus LLC, which manages TMG as well as its parent entities Warburg Pincus (Bermuda) Private Equity IX, L.P., or WP Bermuda, WP (Bermuda) IX PE One Ltd. and Warburg Pincus (Bermuda) Private Equity Ltd., or WPPE. (“WPPE”). Furthermore, Mr. Carney and Ms. Weatherman are Partners of Warburg Pincus & Co., the sole member of WPPE.

Vertical Fund I, L.P., Vertical Fund II, L.P. and Richard B. Emmitt. Mr. Emmitt, a member of our board of directors, is a Member and Manager of The Vertical Group, L.P., which is the sole general partner of each of Vertical Fund I, L.P. and Vertical Fund II, L.P. Mr. Emmitt is also a Member and Manager of The Vertical Group GP, LLC, which controls The Vertical Group, L.P.

On July 18, 2006, Tornier N.V., formerly known as TMG B.V., entered into

We are party to a securityholders’ agreement with certain of our shareholders, including TMG, VFI, VFII,WP Bermuda, KCH Stockholm AB and Mr. Tornier, WP Bermuda, and certain other shareholders at that time, and, by subsequent joinder agreements, additional shareholders, which agreement was amended on August 27, 2010. This agreement contained right of first refusal, tag-along and drag-along provisions, which terminated upon our initial public offering in February 2011.Tornier. Under director nomination provisions of this agreement, TMG has the right to designate three of the eight directors to be nominated to our board of directors for so long as TMG beneficially owns at least 25% of our outstanding ordinary shares, two of the eight directors for so long as TMG beneficially owns at least 10% but less than 25% of our outstanding ordinary shares and one of the eight directorsdirector for so long as TMG beneficially owns at least 5% but less than 10% of our outstanding ordinary shares, and weshares. We agreed to use our reasonable best efforts to cause the TMG designees to be elected. Thiselected as directors. TMG holds approximately 6.1% of our outstanding ordinary shares as of February 10, 2016. Mr. Carney and Ms. Weatherman are the current directors who are designees of TMG. The securityholders’ agreement terminates upon the written consent of all parties to the agreement.

We are party to a registration rights agreement with certain of our shareholders, and officers,including entities affiliated with certain of our directors, including TMG Vertical Fund I, L.P., Vertical Fund II, L.P.,and KCH Stockholm AB and Phil Invest ApS, whom we refer to as the holders.AB. Pursuant to the registration rights agreement, we have agreed to (i) use our reasonable best efforts to effect up to three registered offerings of at least $10 million each upon a demand of TMG or its affiliates, and one registered offering of at least $10 million upon a demand of The Vertical Group, (ii) use our reasonable best efforts to become eligible for use of Form S-3 for registration statements and once we become eligible TMG or its affiliates shall have the right to demand an unlimited number of registrations of at least $10 million each on Form S-3 and (iii) maintain the effectiveness of each such registration statement for a period of 120 days or until the distribution of the registrable securities pursuant to the registration statement is complete. Pursuant to the registration rights agreement, all holdersWe have also havegranted certain incidental or “piggyback” registration rights with respect to anythe registrable shares, subject to certain limitations and restrictions, including volume and marketing restrictions imposed by the underwriters of the offering with respect to which the

184


rights are exercised. Under the registration rights agreement, we have agreed to bear the expenses, including the fees and disbursements of one legal counsel for the holders, in connection with the registration of the registrable securities, except for any underwriting commissions relating to the sale of the registrable securities.

On February 9, 2007, we signed an exclusive, worldwide license and supply agreement with Tepha for its poly-4-hydroxybutyrate polymer for a license fee of $110,000, plus an additional $750,000 as consideration for certain research and development. Tepha is further entitled to royalties of up to 5% of sales under these licenses. We amended this agreement in December 2011 to include certain additional rights and an option to license additional products. We paid less than $0.1 million of minimum royalty payments during 2012 to Tepha under the terms of this agreement. Additionally, we made payments of $0.1 million during 2012 related to the purchase of materials. Vertical Fund I, L.P. and Vertical Fund II, L.P. in the aggregate own approximately 20% of Tepha’s outstanding common and preferred stock. In addition, Mr. Emmitt serves on Tepha’s board of directors.

On January 22, 2008, we signed an agreement with BioSET to develop, commercialize and distribute products incorporating BioSET’s F2A synthetic growth factor technology in the field of orthopaedic and podiatric soft tissue repair. As amended on February 10, 2010, this agreement granted us an option to purchase an exclusive, worldwide license for such products in consideration for a payment of $1 million. We exercised this option on February 10, 2010. Upon FDA approval of certain products, an additional $2.5 million will become due. BioSET is entitled to royalties of up to 6% for sales of products under this agreement. We have not accrued or paid any royalties under the terms of this agreement. Vertical Fund I, L.P. and Vertical Fund II, L.P. in the aggregate own approximately 20% of BioSET’s outstanding capital stock.

On July 29, 2008, we formed a real estate holding company, SCI Calyx, together with Mr.Alain Tornier. SCI Calyx is owned 51% by us and 49% by Mr. Tornier. SCI Calyx was initially capitalized by a contribution of capital of €10,000 funded

51% by us and 49% by Mr. Tornier. SCI Calyx then acquired a combined manufacturing and office facility in Montbonnot, France, for approximately $6.1 million. The manufacturing and office facility is used to support the manufacture of certain of our current products and house certain of our operations in Montbonnot, France. This real estate purchase was funded through mortgage borrowings of $4.1 million and $2.0 million cash borrowed from the two current shareholders of SCI Calyx. The $2.0 million cash borrowed from the SCI Calyx shareholders originally consisted of a $1.0 million note due to Mr. Tornier and a $1.0 million note due to Tornier SAS, which is our wholly ownedwholly-owned French operating subsidiary. Both of the notes issued by SCI Calyx bear interest at the three-month Euro Libor rate plus 0.5% and have no stated term. During 2010, SCI Calyx borrowed approximately $1.4 million from Mr. Tornier in order to fund on-going leasehold improvements necessary to prepare the Montbonnot facility for its intended use. This cash was borrowed under the same terms as the original notes. Asof December 30, 2012,27, 2015, SCI Calyx had related-partyrelated‑party debt outstanding to Mr. Tornier of $2.2$2.0 million. The SCI Calyx entity is consolidated by us, and the related real estate and liabilities are included in our consolidated balance sheets. On September 3, 2008, Tornier SAS, our French operating subsidiary, entered into a lease agreement with SCI Calyx relating to these facilities. The agreement, which terminates in 2018, provides for an annual rent payment of €440,000, which has subsequently been increased and is currently €888,583 annually.€965,655. As of December 30, 2012,27, 2015, future minimum payments under this lease were €4.4$12.3 million in the aggregate.

Since 2006, Tornier SAS has entered into various lease agreements with entities affiliated with Mr. Tornier or members of his family. On May 30, 2006, Tornier SAS entered into two lease agreements with Mr. Tornier and his sister, Colette Tornier, relating to our former facilities in Saint-Ismier, France. The agreements provided for annual rent payments of €104,393 and €28,500, respectively, which were increased to €121,731 and €33,233 annually, respectively. On June 26, 2012, Tornier SAS entered into an amendment to these lease agreements to terminate them effective as of September 30, 2012. No early termination payments were made by Tornier SAS pursuant to the terms of the amendment. During 2012, Tornier SAS paid an aggregate of €2.7 million to an entity affiliated with Mr. Tornier and his sister, Colette Tornier, as rent for Tornier’s former facility located in Saint-Ismier, France. On December 29, 2007, Tornier SAS entered into a lease agreement with Cymaise SCI, relating to our former facilities in Saint-Ismier, France. The agreement provides for a term through May 30, 2015 and an annual rent payment of €480,000, which was subsequently increased to €531,243 annually. Cymaise SCI is wholly owned by Mr. Tornier and his sister, Colette Tornier.

On December 29, 2007, Tornier SAS entered into a lease agreement with Animus SCI, relating to our facilities in Montbonnot Saint Martin, France. On August 18, 2012, the parties amended the lease agreement to extend the term until May 31, 2022 and reduce the annual rent. The amended agreement provides for an initial annual rent payment of €279,506 annually.annually, which was subsequently increased to €296,861. Animus SCI is wholly ownedwholly-owned by Mr. Tornier. On February 6, 2008, Tornier SAS entered into a lease agreement with Balux SCI, effective as of May 22, 2006, relating to our facilities in Montbonnot Saint Martin, France. On August 18, 2012, the parties amended the lease agreement to extend the term until May 31, 2022 and reduce the annual rent. The amended agreement provides for an initial annual rent payment of €252,545 annually.€252,254, which was subsequently increased to €564,229. Balux SCI is wholly ownedwholly-owned by Mr. Tornier and his sister, Colette Tornier. As of December 30, 2012,27, 2015, future minimum payments under all of these agreements were €279,506$6.0 million in the aggregate.

Director Independence

The information regarding director independence is disclosed in “ItemPart III - Item 10. Directors, Executive Officers and Corporate Governance—GovernanceBoard Structure and Composition”Composition and in “ItemPart III - Item 10. Directors, Executive Officers and Corporate Governance—GovernanceBoard Committees”Committees of this report.


185


Item 14. Principal Accounting Fees and Services.


Appointment of and Recent Change in Independent Registered Public Accounting Firms
The audit committee of our board of directors is directly responsible for the appointment, compensation, and oversight of our independent auditor or independent registered public accounting firm. Our general meeting of shareholders is directly responsible for the appointment of the auditor who will audit our Dutch statutory annual accounts to be prepared in accordance with Dutch law each year.
At our Annual General Meeting held on June 18, 2015, our shareholders ratified the appointment of KPMG LLP as our independent registered public accounting firm for the fiscal year ending December 27, 2015, assuming the Wright/Tornier merger was completed during the fiscal year 2015, and therefore, subject to a condition precedent that the Wright/Tornier merger was completed during the fiscal year 2015. Similarly, at the Annual General Meeting, our shareholders appointed KPMG N.V. to serve as our auditor who will audit our Dutch statutory annual accounts to be prepared in accordance with Dutch law for the year ending December 27, 2015, assuming the Wright/Tornier merger was completed during the fiscal year 2015, and therefore, subject to a condition precedent that the Wright/Tornier merger was completed during the fiscal year 2015. KPMG LLP had served as legacy Wright’s independent registered public accounting firm since 2002.
On December 3, 2015, the audit committee of our board of directors formally dismissed Ernst & Young LLP and engaged KPMG LLP, as our independent registered public accounting firm. In addition, on December 3, 2015, the audit committee of our board of directors formally dismissed E&Y Accountants LLP and engaged KPMG N.V. as our auditor who will audit our Dutch statutory annual accounts to be prepared in accordance with Dutch law for the year ending December 27, 2015.
Audit, Audit-Related, Tax, and All Other Fees
The following table shows the fees that we or legacy Wright paid or accrued for audit and other services provided by our current independent registered public accounting firm, KPMG LLP, for 2015 and 2014:
Fees 2015 2014
Audit fees 2,009,760 1,133,410
Audit‑related fees 41,000 23,000
Tax fees 15,000 134,401
All other fees 350,000 
Total 2,415,760 1,290,811

The following table shows the fees that we or legacy Tornier paid or accrued for audit and other services provided by our former independent registered public accounting firm, Ernst & Young LLP, for 2015 and 2014:
Fees 2015 2014
Audit fees 461,000 1,477,315
Audit‑related fees  473,064
Tax fees  
All other fees  1,995
Total 461,000 1,952,374
In the above table, in accordance with the SEC’s definitions and rules, “audit fees” are fees for professional services for the audit of our consolidated financial statements included in this annual report on Form 10-K, and the review of our consolidated financial statements included in quarterly reports on Form 10-Q and registration statements and for services that are normally provided by our independent registered public accounting firm in connection with statutory and regulatory filings or engagements; “audit‑related fees” are fees for assurance and related services that are reasonably related to the performance of the audit or review of our consolidated financial statements and are not included in “audit fees” and include fees for services performed related to audits on our benefit plan and due diligence on acquisitions.; “tax fees” are fees for tax compliance and consultation primarily related to assistance with international tax compliance and tax audits, tax advice on acquisitions, and tax

186


planning; and “all other fees” are fees for any services not included in the first three categories, which includes fees for a risk management review and assessment.
Pre-Approval Policies and Procedures
In addition to retaining KPMG to audit our consolidated financial statements for 2015, the audit committee retained KPMG to provide other auditing and advisory services in 2015. The audit committee understands the need for our independent registered public accounting firm to maintain objectivity and independence in its audits of our consolidated financial statements. The audit committee has reviewed all non-audit services provided by KPMG in 2015 and has concluded that the provision of such services was compatible with maintaining KPMG’s independence in the conduct of its auditing functions.
To help ensure the independence of the independent auditor, the audit committee pre-approves all audit and permissible non-audit services to be provided to us by our independent registered public accounting firm prior to commencement of services. Our audit committee chairman has the delegated authority to pre-approve such services up to a specified aggregate fee amount. These pre-approval decisions are presented to the full audit committee at its next scheduled meeting.

The following table shows the fees that we paid or accrued for audit and other services provided by Ernst & Young LLP for 2012 and 2011:

Fees

  2012   2011 

Audit fees

  $1,467,055    $1,303,020  

Audit-related fees

   113,060     —    

Tax fees

   84,015     8,004  

All other fees

   3,285     3,285  


Total

  $1,667,415    $1,314,309  


In the above table, “audit fees” are fees for professional services for the audit


187


PART IV


Item 15. Exhibits, Financial Statement Schedules.

Financial Statements

Our consolidated financial statements are included

See Index to Consolidated Financial Statements in Item 8 of Part“Financial Statements and Supplementary Data.”
Financial Statement Schedules
See Schedule II — Valuation and Qualifying Accounts on page S-1 of this report.

Financial Statement Schedules

The following financial statement schedule is provided below: Schedule II—Valuation and Qualifying Accounts. All other schedules are omitted because the required information is inapplicable or the information is presented in the consolidated financial statements or related notes.

Tornier N.V.

Schedule II-Valuation and Qualifying Accounts

(In thousands)

      Additions       
   Balance at  Charged to         Balance at
 
   beginning
of period
  costs  &
expenses
  Deductions  end
of period
 

Description

    Describe(a)   Describe(b)  

Allowance for Doubtful Accounts (in millions):


Year ended December 30, 2012

  $(2,486  (2,355  87     (92 $(4,846


Year ended January 1, 2012

  $(2,519 $(775 $755    $53   $(2,486


Year ended January 2, 2011

  $(2,667 $(275 $307    $116   $(2,519


(a)Uncollectible amounts written off, net of recoveries.
(b)Effect of changes in foreign exchange rates.

Exhibits

The exhibits to this report are listed on thean Exhibit Index, which follows the signature page to this report. A copy of any of the exhibits will be furnished at a reasonable cost, upon receipt of a written request for any such exhibit. Such request should be sent to Tornier, Inc.James A. Lightman, Senior Vice President, General Counsel and Secretary, Wright Medical Group N.V., 10801 Nesbitt Avenue South, Bloomington, Minnesota 55437.

Prins Bernhardplein 200, 1097 JB Amsterdam, the Netherlands. The following is a list ofExhibit Index indicates each management contract or compensatory plan or arrangement required to be filed as an exhibit to this annual report on Form 10-K pursuant to Item 15(a):

1.Amended and Restated Employment Agreement, effective as of February 21, 2013, by and between Tornier, Inc. and David H. Mowry (incorporated by reference to Exhibit 10.1 to the Registrant’s Current Report on Form 8-K filed with the Securities and Exchange Commission on February 21, 2013 (File No. 001-35065)).

2.Separation Agreement and Release of Claims, dated November 12, 2012, by and between Tornier, Inc. and Douglas W. Kohrs (incorporated by reference to Exhibit 10.1 to the Registrant’s Current Report on Form 8-K filed with the Securities and Exchange Commission on November 13, 2012 (File No. 001-35065)).

3.Consulting Agreement, dated November 12, 2012, by and between Tornier, Inc. and Douglas W. Kohrs (incorporated by reference to Exhibit 10.2 to the Registrant’s Current Report on Form 8-K filed with the Securities and Exchange Commission on November 13, 2012 (File No. 001-35065)).

4.Employment Agreement, dated July 18, 2006, by and between Tornier, Inc. and Douglas W. Kohrs, as amended on August 26, 2010 (incorporated by reference to Exhibit 10.1 to the Registrant’s Amendment No. 8 to Registration Statement on Form S-1 filed with the Securities and Exchange Commission on January 7, 2011 (Registration No. 333-167370)).

5.Employment Agreement, dated September 4, 2012, by and between Tornier, Inc. and Shawn T McCormick (filed herewith).

6.Separation Agreement and Release of Claims, dated July 17, 2012, by and between Tornier, Inc. and Carmen L. Diersen (incorporated by reference to Exhibit 10.4 to the Registrant’s Current Report on Form 8-K filed with the Securities and Exchange Commission on July 18, 2012 (File No. 001-35065)).

7.Consulting Agreement, dated July 17, 2012, by and between Tornier, Inc. and Carmen L. Diersen (incorporated by reference to Exhibit 10.5 to the Registrant’s Current Report on Form 8-K filed with the Securities and Exchange Commission on July 18, 2012 (File No. 001-35065)).

8.Employment Agreement, dated June 21, 2010, by and between Tornier, Inc. and Carmen L. Diersen (incorporated by reference to Exhibit 10.2 to the Registrant’s Amendment No. 1 to Registration Statement on Form S-1 filed with the Securities and Exchange Commission on July 15, 2010 (Registration No. 333-167370)).

9.Employment Agreement, dated March 12, 2012, by and between Tornier, Inc. and Terry M. Rich (filed herewith).

10.Permanent Employment Contract, dated August 29, 2008, by and between Tornier, SAS and Stéphan Epinette (incorporated by reference to Exhibit 10.4 to the Registrant’s Registration Statement on Form S-1 filed with the Securities and Exchange Commission on June 8, 2010 (Registration No. 333-167370)).

11.Employment Agreement, dated September 13, 2010, by and between Tornier, Inc. and Kevin Klemz (incorporated by reference to Exhibit 10.6 to the Registrant’s Amendment No. 8 to Registration Statement on Form S-1 filed with the Securities and Exchange Commission on January 7, 2011 (Registration No. 333-167370)).

12.Tornier N.V. Amended and Restated 2010 Incentive Plan (incorporated by reference to Exhibit 10.1 to the Registrant’s Current Report on Form 8-K filed with the Securities and Exchange Commission on June 29, 2012 (File No. 001-35065)).

13.Rules for the Grant of Qualified Stock Options to Participants in France under the Tornier N.V. 2010 Incentive Plan (incorporated by reference to Exhibit 10.1 to the Registrant’s Quarterly Report on Form 10-Q for the fiscal quarter ended July 3, 2011 (File No. 001-35065)).

14.Rules for the Grant of Stock Grants in the Form of Qualified Restricted Stock Units to Grantees in France under the Tornier N.V. 2010 Incentive Plan (incorporated by reference to Exhibit 10.2 to the Registrant’s Quarterly Report on Form 10-Q for the fiscal quarter ended July 3, 2011 (File No. 001-35065)).

15.Form of Option Certificate under the Tornier N.V. 2010 Incentive Plan (filed herewith).

16.Form of Stock Grant Certificate (in the form of a Restricted Stock Unit) under the Tornier N.V. 2010 Incentive Plan (filed herewith).

17.Tornier N.V. Amended and Restated Stock Option Plan (incorporated by reference to Exhibit 10.9 to the Registrant’s Amendment No. 9 to Registration Statement on Form S-1 filed with the Securities and Exchange Commission on January 18, 2011 (Registration No. 333-167370)).

18.Form of Option Agreement under the Tornier N.V. Stock Option Plan for Directors and Officers (incorporated by reference to Exhibit 10.9 to the Registrant’s Registration Statement on Form S-1 filed with the Securities and Exchange Commission on June 8, 2010 (Registration No. 333-167370)).

19.Tornier N.V. 2010 Employee Stock Purchase Plan (incorporated by reference to Exhibit 10.42 to the Registrant’s Amendment No. 9 to Registration Statement on Form S-1 filed with the Securities and Exchange Commission on January 18, 2011 (Registration No. 333-167370)).

20.First Amendment of the Tornier N.V. 2010 Employee Stock Purchase Plan (incorporated by reference to Exhibit 10.1 to the Registrant’s Quarterly Report on Form 10-Q for the fiscal quarter ended October 2, 2011 (File No. 001-35065)).

21.Tornier N.V. 2013 Employee Performance Incentive Compensation Plan (incorporated by reference to Item 9B to the Registrant’s Annual Report on Form 10-K for the fiscal year ended December 30, 2012 (File No. 001-35065)).

22.Retraite Supplémentaire maintained by Tornier SAS (incorporated by reference to Exhibit 10.10 to the Registrant’s Registration Statement on Form S-1 filed with the Securities and Exchange Commission on June 8, 2010 (Registration No. 333-167370)).

23.Form of Indemnification Agreement (incorporated by reference to Exhibit 10.40 to the Registrant’s Amendment No. 3 to Registration Statement on Form S-1 filed with the Securities and Exchange Commission on September 14, 2010 (Registration No. 333-167370)).

report.


188


SIGNATURES

Pursuant to the requirements of Section 13 or 15(d) of the Securities Exchange Act of 1934, the registrant has duly caused this report to be signed on its behalf by the undersigned, thereunto duly authorized.

Dated: March 1, 2013                                                     TORNIER N.V.

February 23, 2016
By/s/ David H. Mowry
David H. Mowry
President and Chief Executive Officer
(principal executive officer)
By
WRIGHT MEDICAL GROUP N.V.
By:  /s/ Shawn T McCormickRobert J. Palmisano
Robert J. Palmisano
 
Shawn T McCormick
President and Chief FinancialExecutive Officer
(principal financial and accounting officer)

Pursuant to the requirements of the Securities Exchange Act of 1934, this report has been signed below by the following persons on behalf of the registrant and in the capacities and on the dates indicated.

Name

Signature
 

Title


Date

/S/ DAVID H. MOWRY

David H. Mowry


/s/ Robert J. Palmisano
Robert J. Palmisano
President, Chief Executive Officer and Executive Director
(Principal Executive Officer)
February 23, 2016
/s/ Lance A. Berry
Lance A. Berry
Senior Vice President and Chief ExecutiveFinancial Officer (principal executive officer)

(Principal Financial Officer )
 March 1, 2013February 23, 2016

/S/ SHAWN T MCCORMICK

Shawn T McCormick


Chief Financial Officer

(principal financial and accounting officer)

 March 1, 2013

/S/ SEAN D. CARNEY

Sean D. Carney

s/ Julie B. Andrews
Julie B. Andrews
 

Vice President and Chief Accounting Officer
(Principal Accounting Officer )
February 23, 2016
/s/ David D. Stevens
David D. Stevens
Chairman of the Board

 March 1, 2013February 23, 2016

/S/ RICHARD B. EMMITT

Richard B. Emmitt


Director

 March 1, 2013

/S/ KEVIN C. O’BOYLE

Kevin C. O’Boyle

s/ Gary D. Blackford
Gary D. Blackford
 

Interim Vice Chairman

Non-Executive Director 
 March 1, 2013February 23, 2016

/S/ ALAIN TORNIER

Alain Tornier


Director

 March 1, 2013
/s/ Sean D. Carney
Sean D. Carney
Non-Executive Director February 23, 2016

/Ss/ John L. Miclot
John L. Miclot
Non-Executive Director 
February 23, 2016
/ RICHARD F. WALLMAN

s/ David H. Mowry

David H. Mowry
Executive DirectorFebruary 23, 2016
/s/ Kevin C. O'Boyle
Kevin C. O'Boyle
Non-Executive Director 

February 23, 2016
/s/ Amy S. Paul
Amy S. Paul
Non-Executive Director 
February 23, 2016
/s/ Richard F. Wallman

Richard F. Wallman
 

Non-Executive Director

 March 1, 2013February 23, 2016

/S/ ELIZABETH H. WEATHERMAN

s/ Elizabeth H. Weatherman

Elizabeth H. Weatherman
 

Non-Executive Director

 March 1, 2013February 23, 2016

TORNIER


189


WRIGHT MEDICAL GROUP N.V.

EXHIBIT INDEX TO ANNUAL REPORT ON FORM 10-K

10‑K

FOR THE YEAR ENDED DECEMBER 30, 2012

27, 2015

Exhibit No.


Exhibit


Method of Filing

2.1 Agreement and Plan of Merger dated as of October 27, 2014 among Tornier N.V., Trooper Holdings Inc., Trooper Merger Sub Inc. and Wright Medical Group, Inc.*Incorporated by reference to Exhibit 2.1 to the Registrant’s Current Report on Form 8-K as filed with the Securities and Exchange Commission on October 27, 2014 (File No. 001-35065)
2.2Agreement and Plan of Merger dated as of January 30, 2014 among Wright Medical Group, Inc., WMMS, LLC, OrthoPro, L.L.C. and OP CHA, Inc., as Company Holders’ Agent*Incorporated by reference to Exhibit 2.1 to Wright Medical Group, Inc.’s Current Report on Form 8-K as filed with the Securities and Exchange Commission on January 31, 2014 (File No. 001-35823)
2.3Agreement and Plan of Merger dated as of January 30, 2014 among Wright Medical Group, Inc., Winter Solstice LLC, Solana Surgical, LLC, and Alan Taylor, as Members’ Representative*Incorporated by reference to Exhibit 2.2 to Wright Medical Group, Inc.’s Current Report on Form 8-K as filed with the Securities and Exchange Commission on January 31, 2014 (File No. 001-35823)
2.4Asset Purchase Agreement dated as of June 18, 2013 among MicroPort Medical B.V., MicroPort Scientific Corporation and Wright Medical Group, Inc.*Incorporated by reference to Exhibit 2.1 to Wright Medical Group, Inc.’s Current Report on Form 8-K as filed with the Securities and Exchange Commission on June 21, 2013 (File No. 001-35823)
2.5Agreement and Plan of Merger dated as of November 19, 2012 among BioMimetic Therapeutics, Inc., Wright Medical Group, Inc., Achilles Merger Subsidiary, Inc. and Achilles Acquisition Subsidiary, LLC*Incorporated by reference to Exhibit 2.1 to Wright Medical Group, Inc.’s Current Report on Form 8-K as filed with the Securities and Exchange Commission on November 19, 2012 (File No. 001-32883)
2.6Agreement and Plan of Merger dated as of August 23, 2012 by and among Tornier N.V., Oscar Acquisition Corp., OrthoHelix Surgical Designs, Inc. and the Representative* Incorporated by reference to Exhibit 2.1 to the Registrant’s Current Report on Form 8-K as filed with the Securities and Exchange Commission on August 24, 2012 (File No. 001-35065)
2.22.7 AssetSales and Purchase Agreement dated March 5, 2007, byas of October 16, 2013 between Upperside SA, Naxicap Rendement 2018 and among DVO – Extremity Solutions, LLC, DVO Acquisition,Banque Populaire Developpement as Sellers and Wright Medical Group, Inc. and Tornier B.V.*as Purchaser* Incorporated by reference to Exhibit 10.122.1 to the Registrant’s Amendment No. 1 to Registration StatementWright Medical Group, Inc.’s Current Report on Form S-18-K as filed with the Securities and Exchange Commission on July 15, 2010 (RegistrationOctober 18, 2013 (File No. 333-167370)
2.3Agreement and Plan of Merger, dated February 27, 2007, by and among Tornier US Holdings, Inc., Axya Acquisition II, Inc. and Axya Holdings, Inc.*Incorporated by reference to Exhibit 10.14 to the Registrant’s Amendment No. 1 to Registration Statement on Form S-1 filed with the Securities and Exchange Commission on July 15, 2010 (Registration No. 333-167370)
2.4Merger Agreement, dated January 22, 2007, by and among Nexa Orthopedics, Inc., Tornier US Holdings, Inc. and Nexa Acquisition, Inc.*Incorporated by reference to Exhibit 10.13 to the Registrant’s Amendment No. 1 to Registration Statement on Form S-1 filed with the Securities and Exchange Commission on July 15, 2010 (Registration No. 333-167370)
001-35823)
3.1 Articles of Association of TornierWright Medical Group N.V. Incorporated by reference to Exhibit 3.13.2 to the Registrant’s AnnualCurrent Report on Form 10-K for the fiscal year ended January 2, 2011 (File No. 001-35065)
4.1Specimen Certificate for Ordinary Shares of Tornier N.V.Incorporated by reference to Exhibit 4.1 to the Registrant’s Amendment No. 3 to Registration Statement on Form S-18-K as filed with the Securities and Exchange Commission on September 14, 2010 (RegistrationOctober 1, 2015 (File No. 333-167370)001-35065)
4.24.1 Registration Rights Agreement dated July 16, 2010 by and among the investorsInvestors on Schedule I thereto, the persons listedPersons Listed on Schedule II thereto and Tornier B.V. Incorporated by reference to Exhibit 4.2 to the Registrant’s Amendment No. 2 to Registration Statement on Form S-1 as filed with the Securities and Exchange Commission on August 11, 2010 (Registration No. 333-167370)
4.34.2 Amendment and Waiver to Registration Rights Agreement dated as of July 16, 2010 by and among the Investors and Tornier N.V. Incorporated by reference to Exhibit 4.4 to the Registrant’s Registration Statement on Form S-3 as filed with the Securities and Exchange Commission on October 17, 2012 (Registration No. 333-184461)
4.3Indenture dated as of February 13, 2015 between Wright Medical Group, Inc. and Bank of New York Mellon Trust Company, N.A. (including the Form of the 2.00% Cash Convertible Senior Note due 2020)Incorporated by reference to Exhibit 4.1 to Wright Medical Group, Inc.’s Current Report on Form 8-K as filed with the Securities and Exchange Commission on February 13, 2015 (File No. 001-35823)
4.4Supplemental Indenture dated as of November 24, 2015 among Wright Medical Group, Inc., Wright Medical Group N.V., as Guarantor, and The Bank of New York Mellon Trust Company, N.A., as TrusteeIncorporated by reference to Exhibit 4.1 to the Registrant’s Current Report on Form 8-K as filed with the Securities and Exchange Commission on November 27, 2015 (File No. 001-35065)

190


Exhibit No.ExhibitMethod of Filing
4.5Contingent Value Rights Agreement dated as of March 1, 2013 between Wright Medical Group, Inc. and American Stock Transfer & Trust Company, LLCIncorporated by reference to Exhibit 10.1 to Wright Medical Group, Inc.’s Current Report on Form 8-K as filed with the Securities and Exchange Commission on March 1, 2013 (File No. 001-32883)
4.6Assignment and Assumption Agreement dated as of October 1, 2015 between Wright Medical Group, Inc., Wright Medical Group N.V. and American Stock Transfer & Trust Company, LLC, as TrusteeIncorporated by reference to Exhibit 4.2 to the Registrant’s Registration Statement on Form 8-A as filed with the Securities and Exchange Commission on October 1, 2015 (File No. 001-35065)
10.1 Securityholders’ Agreement dated July 18, 2006 among the Parties listed on Schedule I thereto, KCH Stockholm AB, Alain Tornier, Warburg Pincus (Bermuda) Private Equity IX, L.P., TMG B.V. (predecessor to Tornier B.V.)Incorporated by reference to Exhibit 10.28 to the Registrant’s Amendment No. 3 to Registration Statement on Form S-1 as filed with the Securities and Exchange Commission on September 14, 2010 (Registration No. 333-167370)
10.2Amendment No. 1 to the Securityholders’ Agreement dated August 27, 2010 among the Securityholders on Schedule I thereto and Tornier B.V.Incorporated by reference to Exhibit 10.37 to the Registrant’s Amendment No. 3 to Registration Statement on Form S-1 as filed with the Securities and Exchange Commission on September 14, 2010 (Registration No. 333-167370)
10.3Wright Medical Group N.V. Amended and Restated Employment Agreement, effective2010 Incentive Plan**Incorporated by reference to Exhibit 10.2 to the Registrant’s Current Report on Form 8-K as filed with the Securities and Exchange Commission on June 19, 2015 (File No. 001-35065)
10.4Form of February 21, 2013,Option Certificate under the Wright Medical Group N.V. Amended and Restated 2010 Incentive Plan Representing Stock Options Granted to Executive Officers**Incorporated by reference to Exhibit 10.2 to the Registrant’s Current Report on Form 8-K as filed with the Securities and between Exchange Commission on October 16, 2015 (File No. 001-35065)
10.5Form of Stock Grant Certificate (in the Form of a Restricted Stock Unit) under the Wright Medical Group N.V. Amended and Restated 2010 Incentive Plan Representing Restricted Stock Units Granted to Executive Officers**Incorporated by reference to Exhibit 10.3 to the Registrant’s Current Report on Form 8-K as filed with the Securities and Exchange Commission on October 16, 2015 (File No. 001-35065)
10.6Form of Stock Grant Certificate (in the Form of a Restricted Stock Unit) under the Wright Medical Group N.V. Amended and Restated 2010 Incentive Plan Representing Restricted Stock Units Granted to New Executive Officers**Incorporated by reference to Exhibit 10.4 to the Registrant’s Current Report on Form 8-K as filed with the Securities and Exchange Commission on October 16, 2015 (File No. 001-35065)
10.7Form of Option Certificate under the Wright Medical Group N.V. Amended and Restated 2010 Incentive Plan Representing Stock Options Granted to Robert J. Palmisano**Incorporated by reference to Exhibit 10.5 to the Registrant’s Current Report on Form 8-K as filed with the Securities and Exchange Commission on October 16, 2015 (File No. 001-35065)
10.8Form of Stock Grant Certificate (in the Form of a Restricted Stock Unit) under the Wright Medical Group N.V. Amended and Restated 2010 Incentive Plan Representing Restricted Stock Units Granted to Robert J. Palmisano**Incorporated by reference to Exhibit 10.6 to the Registrant’s Current Report on Form 8-K as filed with the Securities and Exchange Commission on October 16, 2015 (File No. 001-35065)
10.9Form of Option Certificate under the Wright Medical Group N.V. Amended and Restated 2010 Incentive Plan Representing Stock Options Granted to Non-Executive Directors**Incorporated by reference to Exhibit 10.7 to the Registrant’s Current Report on Form 8-K as filed with the Securities and Exchange Commission on October 16, 2015 (File No. 001-35065)
10.10Form of Stock Grant Certificate (in the Form of a Restricted Stock Unit) under the Wright Medical Group N.V. Amended and Restated 2010 Incentive Plan Representing Restricted Stock Units Granted to Non-Executive Directors**Incorporated by reference to Exhibit 10.8 to the Registrant’s Current Report on Form 8-K as filed with the Securities and Exchange Commission on October 16, 2015 (File No. 001-35065)

191


Exhibit No.ExhibitMethod of Filing
10.11Form of Stock Grant Certificate (in the Form of a Restricted Stock Unit) under the Wright Medical Group N.V. Amended and Restated 2010 Incentive Plan Representing Restricted Stock Units Granted to Non-Executive Directors in Lieu of Cash Retainers**Incorporated by reference to Exhibit 10.9 to the Registrant’s Current Report on Form 8-K as filed with the Securities and Exchange Commission on October 16, 2015 (File No. 001-35065)
10.12Tornier Inc.N.V. Amended and David H. MowryRestated 2010 Incentive Plan** Incorporated by reference to Exhibit 10.1 to the Registrant’s Current Report on Form 8-K as filed with the Securities and Exchange Commission on February 21, 2013 (File No. 001-35065)


Exhibit No.

Exhibit

Method of Filing

10.2Separation Agreement and Release of Claims, dated November 12, 2012, by and between Tornier, Inc. and Douglas W. KohrsIncorporated by reference to Exhibit 10.1 to the Registrant’s Current Report on Form 8-K filed with the Securities and Exchange Commission on November 13, 2012June 19, 2015 (File No. 001-35065)
10.3Consulting Agreement, dated November 12, 2012, by and between Tornier, Inc. and Douglas W. KohrsIncorporated by reference to Exhibit 10.2 to the Registrant’s Current Report on Form 8-K filed with the Securities and Exchange Commission on November 13, 2012 (File No. 001-35065)
10.4Employment Agreement, dated July 18, 2006, by and between Tornier, Inc. and Douglas W. Kohrs, as amended on August 26, 2010Incorporated by reference to Exhibit 10.1 to the Registrant’s Amendment No. 8 to Registration Statement on Form S-1 filed with the Securities and Exchange Commission on January 7, 2011 (Registration No. 333-167370)
10.5Employment Agreement, dated September 4, 2012, by and between Tornier, Inc. and Shawn T McCormickFiled herewith
10.6Separation Agreement and Release of Claims, dated July 17, 2012, by and between Tornier, Inc. and Carmen L. DiersenIncorporated by reference to Exhibit 10.4 to the Registrant’s Current Report on Form 8-K filed with the Securities and Exchange Commission on July 18, 2012 (File No. 001-35065)
10.7Consulting Agreement, dated July 17, 2012, by and between Tornier, Inc. and Carmen L. DiersenIncorporated by reference to Exhibit 10.5 to the Registrant’s Current Report on Form 8-K filed with the Securities and Exchange Commission on July 18, 2012 (File No. 001-35065)
10.8Employment Agreement, dated June 21, 2010, by and between Tornier, Inc. and Carmen L. DiersenIncorporated by reference to Exhibit 10.2 to the Registrant’s Amendment No. 1 to Registration Statement on Form S-1 filed with the Securities and Exchange Commission on July 15, 2010 (Registration No. 333-167370)
10.9Employment Agreement, dated March 12, 2012, by and between Tornier, Inc. and Terry M. RichFiled herewith
10.10Permanent Employment Contract, dated August 29, 2008, by and between Tornier, SAS and Stéphan EpinetteIncorporated by reference to Exhibit 10.4 to the Registrant’s Registration Statement on Form S-1 filed with the Securities and Exchange Commission on June 8, 2010 (Registration No. 333-167370)
10.11Employment Agreement, dated September 13, 2010, by and between Tornier, Inc. and Kevin KlemzIncorporated by reference to Exhibit 10.6 to the Registrant’s Amendment No. 8 to Registration Statement on Form S-1 filed with the Securities and Exchange Commission on January 7, 2011 (Registration No. 333-167370)
10.12Tornier N.V. Amended and Restated 2010 Incentive PlanIncorporated by reference to Exhibit 10.1 to the Registrant’s Current Report on Form 8-K filed with the Securities and Exchange Commission on June 29, 2012 (File No. 001-35065)


Exhibit No.

Exhibit

Method of Filing

10.13Rules for the Grant of Qualified Stock Options to Participants in France under the Tornier N.V. 2010 Incentive PlanIncorporated by reference to Exhibit 10.1 to the Registrant’s Quarterly Report on Form 10-Q for the fiscal quarter ended July 3, 2011 (File No. 001-35065)
10.14Rules for the Grant of Stock Grants in the Form of Qualified Restricted Stock Units to Grantees in France under the Tornier N.V. 2010 Incentive PlanIncorporated by reference to Exhibit 10.2 to the Registrant’s Quarterly Report on Form 10-Q for the fiscal quarter ended July 3, 2011 (File No. 001-35065)
10.15 Form of Option Certificate under the Tornier N.V. 2010 Incentive PlanFiled herewith
10.16Form of Stock Grant Certificate (in the form of a Restricted Stock Unit) under the Tornier N.V. 2010 Incentive PlanFiled herewith
10.17Tornier N.V. Amended and Restated Stock Option PlanPlan** Incorporated by reference to Exhibit 10.9 to the Registrant’s Annual Report on Form 10-K for the fiscal year ended December 29, 2013 (File No. 001-35065)
10.14Tornier N.V. Amended and Restated Stock Option Plan**Incorporated by reference to Exhibit 10.10 to the Registrant’s Amendment No. 9 to Registration Statement on Form S-1 as filed with the Securities and Exchange Commission on January 18, 2011 (Registration No. 333-167370)
10.1810.15 Form of Option Agreement under the Tornier N.V. Stock Option Plan for Directors and OfficersOfficers** Incorporated by reference to Exhibit 10.9 to the Registrant’s Registration Statement on Form S-1 as filed with the Securities and Exchange Commission on June 8, 2010 (Registration No. 333-167370)
10.16Wright Medical Group, Inc. Second Amended and Restated 2009 Equity Incentive Plan**Incorporated by reference to Wright Medical Group, Inc.’s Definitive Proxy Statement as filed with the Securities and Exchange Commission on April 4, 2013 (File No. 001-35823)
10.17Form of Executive Stock Option Agreement under the Wright Medical Group, Inc. Second Amended and Restated 2009 Equity Incentive Plan**Incorporated by reference to Exhibit 10.4 to Wright Medical Group, Inc.’s Annual Report on Form 10-K for the fiscal year ended December 31, 2012 (File No. 001-32883)
10.18Form of Non-Employee Director Stock Option Agreement under the Wright Medical Group, Inc. Second Amended and Restated 2009 Equity Incentive Plan**Incorporated by reference to Exhibit 10.6 to Wright Medical Group, Inc.’s Annual Report on Form 10-K for the fiscal year ended December 31, 2012 (File No. 001-32883)
10.19Wright Medical Group, Inc. Fifth Amended and Restated 1999 Equity Incentive Plan**Incorporated by reference to Wright Medical Group, Inc.’s Definitive Proxy Statement as filed with the Securities and Exchange Commission on April 14, 2008 (File No. 001-32883)
10.20First Amendment to the Wright Medical Group, Inc. Fifth Amended and Restated 1999 Equity Incentive Plan**Incorporated by reference to Exhibit 10.2 to Wright Medical Group, Inc.’s Quarterly Report on Form 10-Q for the fiscal quarter ended September 30, 2008 (File No. 001-32883)
10.21Form of Executive Stock Option Agreement under the Wright Medical Group, Inc. Fifth Amended and Restated 1999 Equity Incentive Plan**Incorporated by reference to Exhibit 10.13 to Wright Medical Group, Inc.’s Quarterly Report on Form 10-Q for the fiscal quarter ended June 30, 2009 (File No. 001-32883)
10.22Form of Non-Employee Director Stock Option Agreement under the Wright Medical Group, Inc. Fifth Amended and Restated 1999 Equity Incentive Plan**Incorporated by reference to Exhibit 10.15 to Wright Medical Group, Inc.’s Quarterly Report on Form 10-Q for the fiscal quarter ended June 30, 2009 (File No. 001-32883)
10.23 Tornier N.V. 2010 Employee Stock Purchase PlanPlan** Incorporated by reference to Exhibit 10.42 to the Registrant’s Amendment No. 9 to Registration Statement on Form S-1 as filed with the Securities and Exchange Commission on January 18, 2011 (Registration No. 333-167370)
10.2010.24 First Amendment of the Tornier N.V. 2010 Employee Stock Purchase PlanPlan** Incorporated by reference to Exhibit 10.1 to the Registrant’s Quarterly Report on Form 10-Q for the fiscal quarter ended October 2, 2011 (File No. 001-35065)
10.2110.25 Second Amendment of the Tornier N.V. 20132010 Employee Performance Incentive Compensation PlanStock Purchase Plan** Incorporated by reference to Item 9BExhibit 10.17 to the Registrant’s Annual Report on Form 10-K for the fiscal year ended December 29, 2014 (File No. 001-35065)

192


Exhibit No.ExhibitMethod of Filing
10.26Wright Medical Group N.V. Performance Incentive Plan**Incorporated by reference to Exhibit 10.1 to the Registrant’s Current Report on Form 8-K as filed with the Securities and Exchange Commission on October 16, 2015 (File No. 001-35065)
10.27Form of Indemnification Agreement**Incorporated by reference to Exhibit 10.1 to the Registrant’s Current Report on Form 8-K as filed with the Securities and Exchange Commission on October 1, 2015 (File No. 001-35065)
10.28Service Agreement effective as of October 1, 2015 between Wright Medical Group N.V. and Robert J. Palmisano**Incorporated by reference to Exhibit 10.10 to the Registrant’s Current Report on Form 8-K as filed with the Securities and Exchange Commission on October 16, 2015 (File No. 001-35065)
10.29Employment Agreement effective as of October 1, 2015 between Wright Medical Group, Inc. and Robert J. Palmisano**Incorporated by reference to Exhibit 10.11 to the Registrant’s Current Report on Form 8-K as filed with the Securities and Exchange Commission on October 16, 2015 (File No. 001-35065)
10.30Guaranty by Wright Medical Group N.V. effective as of October 1, 2015 with respect to Wright Medical Group, Inc. Obligations under Employment Agreement with Robert J. Palmisano**Incorporated by reference to Exhibit 10.12 to the Registrant’s Current Report on Form 8-K as filed with the Securities and Exchange Commission on October 16, 2015 (File No. 001-35065)
10.31Confidentiality, Non-Competition, Non-Solicitation and Intellectual Property Rights Agreement effective as of October 1, 2015 between Wright Medical Group, Inc. and Robert J. Palmisano**Incorporated by reference to Exhibit 10.13 to the Registrant’s Current Report on Form 8-K as filed with the Securities and Exchange Commission on October 16, 2015 (File No. 001-35065)
10.32Inducement Stock Option Grant Agreement dated as of September 17, 2011 between Wright Medical Group, Inc. and Robert J. Palmisano**Incorporated by reference to Exhibit 10.2 to Wright Medical Group, Inc.’s Current Report on Form 8-K as filed with the Securities and Exchange Commission on September 22, 2011 (File No. 001-32883)
10.33Service Agreement effective as of October 1, 2015 between Wright Medical Group N.V. and David H. Mowry**Incorporated by reference to Exhibit 10.14 to the Registrant’s Current Report on Form 8-K as filed with the Securities and Exchange Commission on October 16, 2015 (File No. 001-35065)
10.34Confidentiality, Non-Competition, Non-Solicitation and Intellectual Property Rights Agreement effective as of October 1, 2015 between Wright Medical Group, Inc. and David H. Mowry**Incorporated by reference to Exhibit 10.15 to the Registrant’s Current Report on Form 8-K as filed with the Securities and Exchange Commission on October 16, 2015 (File No. 001-35065)
10.35Separation Pay Agreement effective as of October 1, 2015 between Wright Medical Group, Inc. and David H. Mowry**Incorporated by reference to Exhibit 10.19 to the Registrant’s Current Report on Form 8-K as filed with the Securities and Exchange Commission on October 16, 2015 (File No. 001-35065)
10.36Confidentiality, Non-Competition, Non-Solicitation and Intellectual Property Rights Agreement effective as of October 1, 2015 between Wright Medical Group, Inc. and Lance A. Berry**Incorporated by reference to Exhibit 10.16 to the Registrant’s Current Report on Form 8-K as filed with the Securities and Exchange Commission on October 16, 2015 (File No. 001-35065)
10.37Separation Pay Agreement effective as of October 1, 2015 between Wright Medical Group, Inc. and Lance A. Berry**Incorporated by reference to Exhibit 10.20 to the Registrant’s Current Report on Form 8-K as filed with the Securities and Exchange Commission on October 16, 2015 (File No. 001-35065)
10.38Confidentiality, Non-Competition, Non-Solicitation and Intellectual Property Rights Agreement effective as of October 1, 2015 between Wright Medical Group, Inc. and Gregory Morrison**Incorporated by reference to Exhibit 10.17 to the Registrant’s Current Report on Form 8-K as filed with the Securities and Exchange Commission on October 16, 2015 (File No. 001-35065)
10.39Separation Pay Agreement effective as of October 1, 2015 between Wright Medical Group, Inc. and Gregory Morrison**Incorporated by reference to Exhibit 10.21 to the Registrant’s Current Report on Form 8-K as filed with the Securities and Exchange Commission on October 16, 2015 (File No. 001-35065)

193


Exhibit No.ExhibitMethod of Filing
10.40Confidentiality, Non-Competition, Non-Solicitation and Intellectual Property Rights Agreement effective as of October 1, 2015 between Tornier, Inc. and Terry M. Rich**Incorporated by reference to Exhibit 10.18 to the Registrant’s Current Report on Form 8-K as filed with the Securities and Exchange Commission on October 16, 2015 (File No. 001-35065)
10.41Separation Pay Agreement effective as of October 1, 2015 between Tornier, Inc. and Terry M. Rich**Incorporated by reference to Exhibit 10.22 to the Registrant’s Current Report on Form 8-K as filed with the Securities and Exchange Commission on October 16, 2015 (File No. 001-35065)
10.42Confidentiality, Non-Competition, Non-Solicitation and Intellectual Property Rights Agreement effective as of October 1, 2015 between Wright Medical Group, Inc. and James A. Lightman**Filed herewith
10.43Separation Pay Agreement effective as of October 1, 2015 between Wright Medical Group, Inc. and James A. Lightman**Filed herewith
10.44Inducement Stock Option Grant Agreement dated as of December 29, 2011 between Wright Medical Group, Inc. and James A. Lightman**Incorporated by reference to Exhibit 10.32 to Wright Medical Group, Inc.’s Annual Report on Form 10-K for the fiscal year ended December 31, 2011 (File No. 001-32883)
10.45Form of Guaranty by Wright Medical Group N.V. with respect to Wright Medical Group, Inc. or Tornier, Inc. Obligations under Separation Pay Agreements with Executive Officers**Incorporated by reference to Exhibit 10.23 to the Registrant’s Current Report on Form 8-K as filed with the Securities and Exchange Commission on October 16, 2015 (File No. 001-35065)
10.46Resignation Agreement and Release of Claims dated October 1, 2015 between Shawn T McCormick and Tornier, Inc.**Incorporated by reference to Exhibit 10.2 to the Registrant’s Current Report on Form 8-K as filed with the Securities and Exchange Commission on October 1, 2015 (File No. 001-35065)
10.47Employment Agreement dated September 4, 2012 between Tornier, Inc. and Shawn T McCormick**Incorporated by reference to Exhibit 10.5 to the Registrant’s Annual Report on Form 10-K for the fiscal year ended December 30, 2012 (File No. 001-35065)
10.48Resignation Agreement and Release of Claims dated October 1, 2015 between Gordon Van Ummersen and Tornier, Inc.**Filed herewith
10.49Employment Agreement dated June 10, 2013 between Tornier, Inc. and Gordon Van Ummersen**Incorporated by reference to Exhibit 10.5 to the Registrant’s Annual Report on Form 10-K for the fiscal year ended December 29, 2013 (File No. 001-35065)
10.50Settlement Agreement dated September 29, 2010 among the United States of America, acting through the United States Department of Justice and on behalf of the Office of Inspector General of the Department of Health and Human Services, and Wright Medical Technology, Inc.Incorporated by reference to Exhibit 10.1 to Wright Medical Group, Inc.’s Current Report on Form 8-K as filed with the Securities and Exchange Commission on September 30, 2010 (File No. 001-32883)
10.51Corporate Integrity Agreement dated September 29, 2010, between Wright Medical Technology, Inc. and the Office of Inspector General of the Department of Health and Human ServicesIncorporated by reference to Exhibit 10.2 to Wright Medical Group, Inc.’s Current Report on Form 8-K as filed with the Securities and Exchange Commission on September 30, 2010 (File No. 001-32883)
10.52Deferred Prosecution Agreement dated September 29, 2010 between Wright Medical Technology, Inc. and the United States Attorney’s Office for the District of New JerseyIncorporated by reference to Exhibit 10.3 to Wright Medical Group, Inc.’s Current Report on Form 8-K as filed with the Securities and Exchange Commission on September 30, 2010 (File No. 001-32883)
10.53Amendment to the Corporate Integrity Agreement dated September 14, 2011 between Wright Medical Technology, Inc. and the Office of Inspector General of the Department of Health and Human ServicesIncorporated by reference to Exhibit 10.2 to Wright Medical Group, Inc.’s Current Report on Form 8-K as filed with the Securities and Exchange Commission on September 15, 2011 (File No. 001-32883)

194


10.22Exhibit No. Retraite Supplémentaire maintainedExhibitMethod of Filing
10.54Addendum and Amendment to the Deferred Prosecution Agreement dated September 15, 2011 between Wright Medical Technology, Inc. and the United States Attorney’s Office for the District of New JerseyIncorporated by Tornier SASreference to Exhibit 10.1 to Wright Medical Group, Inc.’s Current Report on Form 8-K as filed with the Securities and Exchange Commission on September 15, 2011 (File No. 001-32883)
10.55Base Call Option Transaction Confirmation dated as of February 9, 2015 between Wright Medical Group, Inc. and Deutsche Bank AG, London BranchIncorporated by reference to Exhibit 10.1 to Wright Medical Group, Inc.’s Current Report on Form 8-K as filed with the Securities and Exchange Commission on February 13, 2015 (File No. 001-35823)
10.56Base Call Option Transaction Confirmation dated as of February 9, 2015 between Wright Medical Group, Inc. and JPMorgan Chase Bank, National AssociationIncorporated by reference to Exhibit 10.3 to Wright Medical Group, Inc.’s Current Report on Form 8-K as filed with the Securities and Exchange Commission on February 13, 2015 (File No. 001-35823)
10.57Base Call Option Transaction Confirmation dated as of February 9, 2015 between Wright Medical Group, Inc. and Wells Fargo Bank, National AssociationIncorporated by reference to Exhibit 10.5 to Wright Medical Group, Inc.’s Current Report on Form 8-K as filed with the Securities and Exchange Commission on February 13, 2015 (File No. 001-35823)
10.58Base Warrants Confirmation dated as of February 9, 2015 between Wright Medical Group, Inc. and Deutsche Bank AG, London BranchIncorporated by reference to Exhibit 10.7 to Wright Medical Group, Inc.’s Current Report on Form 8-K as filed with the Securities and Exchange Commission on February 13, 2015 (File No. 001-35823)
10.59Base Warrants Confirmation dated as of February 9, 2015 between Wright Medical Group, Inc. and JPMorgan Chase Bank, National AssociationIncorporated by reference to Exhibit 10.9 to Wright Medical Group, Inc.’s Current Report on Form 8-K as filed with the Securities and Exchange Commission on February 13, 2015 (File No. 001-35823)
10.60Base Warrants Confirmation dated as of February 9, 2015 between Wright Medical Group, Inc. and Wells Fargo Bank, National AssociationIncorporated by reference to Exhibit 10.11 to Wright Medical Group, Inc.’s Current Report on Form 8-K as filed with the Securities and Exchange Commission on February 13, 2015 (File No. 001-35823)
10.61Additional Call Option Transaction Confirmation dated as of February 10, 2015 between Wright Medical Group, Inc. and Deutsche Bank AG, London BranchIncorporated by reference to Exhibit 10.2 to Wright Medical Group, Inc.’s Current Report on Form 8-K as filed with the Securities and Exchange Commission on February 13, 2015 (File No. 001-35823)
10.62Additional Call Option Transaction Confirmation dated as of February 10, 2015 between Wright Medical Group, Inc. and JPMorgan Chase Bank, National AssociationIncorporated by reference to Exhibit 10.4 to Wright Medical Group, Inc.’s Current Report on Form 8-K as filed with the Securities and Exchange Commission on February 13, 2015 (File No. 001-35823)
10.63Additional Call Option Transaction Confirmation dated as of February 10, 2015 between Wright Medical Group, Inc. and Wells Fargo Bank, National AssociationIncorporated by reference to Exhibit 10.6 to Wright Medical Group, Inc.’s Current Report on Form 8-K as filed with the Securities and Exchange Commission on February 13, 2015 (File No. 001-35823)
10.64Additional Warrants Confirmation dated as of February 10, 2015 between Wright Medical Group, Inc. and Deutsche Bank AG, London BranchIncorporated by reference to Exhibit 10.8 to Wright Medical Group, Inc.’s Current Report on Form 8-K as filed with the Securities and Exchange Commission on February 13, 2015 (File No. 001-35823)
10.65Additional Warrants Confirmation dated as of February 10, 2015 between Wright Medical Group, Inc. and JPMorgan Chase Bank, National Association Incorporated by reference to Exhibit 10.10 to the Registrant’s Registration StatementWright Medical Group, Inc.’s Current Report on Form S-18-K as filed with the Securities and Exchange Commission on June 8, 2010 (RegistrationFebruary 13, 2015 (File No. 333-167370)001-35823)
10.2310.66 FormAdditional Warrants Confirmation dated as of Indemnification AgreementFebruary 10, 2015 between Wright Medical Group, Inc. and Wells Fargo Bank, National Association Incorporated by reference to Exhibit 10.4010.12 to the Registrant’s Amendment No. 3 to Registration StatementWright Medical Group, Inc.’s Current Report on Form S-18-K as filed with the Securities and Exchange Commission on September 14, 2010 (RegistrationFebruary 13, 2015 (File No. 333-167370)


001-35823)

Exhibit No.

10.67
 

Exhibit

MethodAmendment to the Base Warrant Confirmation dated as of Filing

10.24Contribution Agreement, dated March 26, 2010, byNovember 24, 2015 between Wright Medical Group N.V. and between Tornier B.V., Vertical Fund I, L.P., Vertical Fund II, L.P., TMG Holdings Coöperatief U.A., Stichting Administratiekantoor Tornier, Fred B. Dinger III and Douglas W. KohrsDeutsche Bank AG, London Branch Incorporated by reference to Exhibit 10.1510.1 to the Registrant’s Amendment No. 1 to Registration StatementCurrent Report on Form S-18-K as filed with the Securities and Exchange Commission on July 15, 2010 (RegistrationNovember 27, 2015 (File No. 333-167370)001-35065)
10.68Amendment to the Base Warrant Confirmation dated as of November 24, 2015 between Wright Medical Group N.V. and JPMorgan Chase Bank, National AssociationIncorporated by reference to Exhibit 10.2 to the Registrant’s Current Report on Form 8-K as filed with the Securities and Exchange Commission on November 27, 2015 (File No. 001-35065)

195


10.25Exhibit No.ExhibitMethod of Filing
10.69Amendment to the Base Warrant Confirmation dated as of November 24, 2015 between Wright Medical Group N.V. and Wells Fargo Bank, National AssociationIncorporated by reference to Exhibit 10.3 to the Registrant’s Current Report on Form 8-K as filed with the Securities and Exchange Commission on November 27, 2015 (File No. 001-35065)
10.70Amendment to the Additional Warrant Confirmation dated as of November 24, 2015 between Wright Medical Group N.V. and Deutsche Bank AG, London BranchIncorporated by reference to Exhibit 10.4 to the Registrant’s Current Report on Form 8-K as filed with the Securities and Exchange Commission on November 27, 2015 (File No. 001-35065)
10.71Amendment to the Additional Warrant Confirmation dated as of November 24, 2015 between Wright Medical Group N.V. and JPMorgan Chase Bank, National AssociationIncorporated by reference to Exhibit 10.5 to the Registrant’s Current Report on Form 8-K as filed with the Securities and Exchange Commission on November 27, 2015 (File No. 001-35065)
10.72Amendment to the Additional Warrant Confirmation dated as of November 24, 2015 between Wright Medical Group N.V. and Wells Fargo Bank, National AssociationIncorporated by reference to Exhibit 10.6 to the Registrant’s Current Report on Form 8-K as filed with the Securities and Exchange Commission on November 27, 2015 (File No. 001-35065)
10.73Agreement of Lease dated December 28, 2013 between Wright Medical Technology, Inc. and RBM Cherry Road PartnersIncorporated by reference to Exhibit 10.94 to Wright Medical Group Inc.’s Annual Report on Form 10-K for the fiscal year ended December 31, 2013 (File No. 001-35823)
10.74 Lease Agreement dated as of May 14, 2012 between Liberty Property Limited Partnership, as Landlord, and Tornier, Inc., as Tenant 

Incorporated by reference to Exhibit 10.1 to Tornier’sthe Registrant’s Current Report on Form 8-K as filed with the

Securities and Exchange Commission on May 15, 2012

(File (File No. 001-35065)

10.2610.75 Commercial Leases (Two), dated May 30, 2006 by and between Alain Tornier and Colette Tornier and Tornier SAS Incorporated by reference to Exhibit 10.22 to the Registrant’s Amendment No. 2 to Registration Statement on Form S-1 as filed with the Securities and Exchange Commission on August 11, 2010 (Registration No. 333-167370)
10.27Memorandum of Understanding dated as of June 26, 2012 between SCI Estole Fonciere and Tornier SASIncorporated by reference to Exhibit 10.3 to the Registrant’s Quarterly Report on Form 10-Q for the fiscal quarter ended July 1, 2012 (File No. 001-35065)
10.2810.76 Commercial Lease dated December 29, 2007 by and between Animus SCI and Tornier SAS Incorporated by reference to Exhibit 10.23 to the Registrant’s Amendment No. 2 to Registration Statement on Form S-1 as filed with the Securities and Exchange Commission on August 11, 2010 (Registration No. 333-167370)
10.2910.77 

Rider No. 1 to Commercial Lease dated August 18, 2012 between Animus SCI and

Tornier SAS

 Incorporated by reference to Exhibit 10.8 to the Registrant’s Quarterly Report on Form 10-Q for the fiscal quarter ended September 30, 2012 (File No. 001-35065)
10.3010.78 Commercial Lease dated February 6, 2008 by and between Balux SCI and Tornier SAS Incorporated by reference to Exhibit 10.24 to the Registrant’s Amendment No. 2 to Registration Statement on Form S-1 as filed with the Securities and Exchange Commission on August 11, 2010 (Registration No. 333-167370)
10.3110.79 Rider No. 1 to the Commercial Lease dated February 6, 2008 dated August 18, 2012 between Balux SCI and Tornier SAS Incorporated by reference to Exhibit 10.7 to the Registrant’s Quarterly Report on Form 10-Q for the fiscal quarter ended September 30, 2012 (File No. 001-35065)
10.32Commercial Lease, dated December 29, 2007, by and between Cymaise SCI and Tornier SASIncorporated by reference to Exhibit 10.25 to the Registrant’s Amendment No. 2 to Registration Statement on Form S-1 filed with the Securities and Exchange Commission on August 11, 2010 (Registration No. 333-167370)
10.3310.80 Commercial Lease dated September 3, 2008 by and between SCI Calyx and Tornier SAS Incorporated by reference to Exhibit 10.26 to the Registrant’s Amendment No. 2 to Registration Statement on Form S-1 as filed with the Securities and Exchange Commission on August 11, 2010 (Registration No. 333-167370)


Exhibit No.

Exhibit

Method of Filing

10.3410.81 Commercial Lease dated December 23, 2008 by and between Seamus Geaney and Tornier Orthopedics Ireland Limited Incorporated by reference to Exhibit 10.27 to the Registrant’s Amendment No. 1 to Registration Statement on Form S-1 as filed with the Securities and Exchange Commission on July 15, 2010 (Registration No. 333-167370)
10.3510.82 Securityholders’
Development, Manufacturing and Supply Agreement dated July 18, 2006, byas of June 28, 2005 between BioMimetic Therapeutics, Inc. and among the parties listed on Schedule I thereto, KCH Stockholm AB, Alain Tornier, Warburg Pincus (Bermuda) Private Equity IX, L.P., TMG B.V. (predecessor to Tornier B.V.)Kensey Nash Corporation(1)
 Incorporated by reference to Exhibit 10.2810.10 to the Registrant’s Amendment No. 3 toBioMimetic Therapeutics, Inc.’s Registration Statement on Form S-1 as filed with the Securities and Exchange Commission on September 14, 2010February 10, 2006 (Registration No. 333-167370)333-131718)

196


10.36Exhibit No. ExhibitMethod of Filing
10.83
First Amendment No. 1 to the Securityholders’Development, Manufacturing and Supply Agreement datedeffective August 27, 2010, by15, 2006 between BioMimetic Therapeutics, Inc. and among the Securityholders on Schedule I thereto and Tornier B.V.Kensey Nash Corporation(1)
 Incorporated by reference to Exhibit 10.3710.58 to the Registrant’s Amendment No. 3 to Registration StatementBioMimetic Therapeutics, Inc.’s Annual Report on Form S-1 filed with10-K/A for the Securities and Exchange Commission on September 14, 2010 (Registrationfiscal year ended December 31, 2009 (File No. 333-167370)000-51934)
10.3710.84 Joinder
Second Amendment to Development, Manufacturing and Supply Agreement dated March 30, 2007, byeffective November 1, 2006 between BioMimetic Therapeutics, Inc. and between Tornier B.V. and DVO—Extremity Solutions, LLCKensey Nash Corporation(1)
 Incorporated by reference to Exhibit 10.2910.59 to the Registrant’s Amendment No. 3 to Registration StatementBioMimetic Therapeutics, Inc.’s Annual Report on Form S-1 filed with10-K/A for the Securities and Exchange Commission on September 14, 2010 (Registrationfiscal year ended December 31, 2009 (File No. 333-167370)000-51934)
10.3810.85 Joinder
Third Amendment to Development, Manufacturing and Supply Agreement dated September 24, 2007, byeffective April 2, 2008 between BioMimetic Therapeutics, Inc. and between Tornier B.V. and TMG Partners II LLCKensey Nash Corporation(1)
 Incorporated by reference to Exhibit 10.3010.60 to the Registrant’s Amendment No. 3 to Registration StatementBioMimetic Therapeutics, Inc.’s Annual Report on Form S-1 filed with10-K/A for the Securities and Exchange Commission on September 14, 2010 (Registrationfiscal year ended December 31, 2009 (File No. 333-167370)000-51934)
10.3910.86 Joinder
Fourth Amendment to Development, Manufacturing and Supply Agreement dated October 27, 2008, byeffective September 30, 2010 between BioMimetic Therapeutics, Inc. and between Tornier B.V. and TMG Partners III LLCKensey Nash Corporation(1)
 Incorporated by reference to Exhibit 10.3110.62 to the Registrant’s Amendment No. 3 to Registration StatementBioMimetic Therapeutics, Inc.’s Annual Report on Form S-1 filed with10-K for the Securities and Exchange Commission on September 14,fiscal year ended December 31, 2010 (Registration(File No. 333-167370)000-51934)
10.4010.87 Joinder
Technology Transfer Agreement dated May 11, 2009, byas of September 1, 2014 between Novartis Vaccines and between Tornier B.V.Diagnostics, Inc. and Split Rock Partners, L.P.BioMimetic Therapeutics, LLC(2)
 Incorporated by reference to Exhibit 10.3210.99 to the Registrant’s Amendment No. 3 to Registration StatementWright Medical Group, Inc.’s Quarterly Report on Form S-1 filed with10-Q for the Securities and Exchange Commission onfiscal quarter ended September 14, 2010 (Registration30, 2014 (File No. 333-167370)001-35823)
10.41Joinder Agreement, dated April 2008, by and between Tornier B.V. and Stichting Administratiekantoor TornierIncorporated by reference to Exhibit 10.33 to the Registrant’s Amendment No. 3 to Registration Statement on Form S-1 filed with the Securities and Exchange Commission on September 14, 2010 (Registration No. 333-167370)
10.42Joinder Agreement, dated May 25, 2010, by and between Tornier B.V. and Medtronic Bakken Research Center B.V.Incorporated by reference to Exhibit 10.34 to the Registrant’s Amendment No. 3 to Registration Statement on Form S-1 filed with the Securities and Exchange Commission on September 14, 2010 (Registration No. 333-167370)


Exhibit No.

Exhibit

Method of Filing

10.43Quality Assurance Agreement, dated April 1, 1998, by and between CeramTec AG and Tornier SAIncorporated by reference to Exhibit 10.35 to the Registrant’s Amendment No. 3 to Registration Statement on Form S-1 filed with the Securities and Exchange Commission on September 14, 2010 (Registration No. 333-167370)
10.4410.88 By-Laws of SCI Calyx Incorporated by reference to Exhibit 10.36 to the Registrant’s Amendment No. 2 to Registration Statement on Form S-1 as filed with the Securities and Exchange Commission on August 11, 2010 (Registration No. 333-167370)
10.4512.1 Credit Agreement dated asComputation of October 4, 2012 among Tornier N.V., Tornier, Inc., as Borrower, BankRatio of America, N.A., as Administrative Agent, SG Americas Securities, LLC, as Syndication Agent, BMO Capital Markets and JPMorgan Chase Bank, N.A., as Co-Documentation Agents, Merrill Lynch, Pierce, Fenner & Smith Incorporated and SG Americas Securities, LLC, as Joint Lead Arrangers and Joint Bookrunners, and the Other Lenders Party TheretoEarnings to Fixed Charges Incorporated by reference to Exhibit 10.1 to the Registrant’s Current Report on Form 8-K as filed with the Securities and Exchange Commission on October 4, 2012 (File No. 001-35065)
Filed herewith
21.1 Subsidiaries of TornierWright Medical Group N.V. Filed herewith
23.1 Consent of Ernst & YoungKPMG LLP, an Independent Registered Public Accounting Firm Filed herewith
31.1 Certification of Chief Executive Officer pursuant to Exchange Act Rules 13a-14(a)/15d-14(a), as adopted pursuant to Section 302 of the Sarbanes-OxleySarbanes‑Oxley Act of 2002 Filed herewith
31.2 Certification of Chief Financial Officer pursuant to Exchange Act Rules 13a-14(a)/15d-14(a), as adopted pursuant to Section 302 of the Sarbanes-OxleySarbanes‑Oxley Act of 2002 Filed herewith
32.1 Certification of Chief Executive Officer pursuant to 18 U.S.C. Section 1350, as adopted pursuant to Section 906 of the Sarbanes-Oxley Act of 2002Furnished herewith
32.2Certification ofand Chief Financial Officer pursuant to 18 U.S.C. Section 1350, as adopted pursuant to Section 906 of the Sarbanes-OxleySarbanes‑Oxley Act of 2002 Furnished herewith

197


Exhibit No.ExhibitMethod of Filing
101 The following materials from TornierWright Medical Group N.V.’s Annual Report on Form 10-K for the fiscal year ended December 30, 2012,27, 2015, formatted in XBRL (Extensible Business Reporting Language): (i) the Consolidated Balance Sheets as of December 30, 201227, 2015 and January 2, 2011,December 31, 2014, (ii) the Consolidated Statements ofFurnished herewith


Exhibit No.

Exhibit

Method of Filing

Operations for each of the fiscal years in the three-year period ended December 30, 2012,27, 2015, (iii) the Consolidated Statements of Comprehensive Loss for each of the fiscal years in the three-year period ended December 30, 2012,27, 2015, (iv) the Consolidated Statements of Cash Flows for each of the fiscal years in the three-year period ended December 30, 2012,27, 2015, (v) Consolidated Statements of Shareholders’ Equity for each of the fiscal years in the three-year period ended December 30, 2012,27, 2015, and (vi) Notes to Consolidated Financial Statements**Statements Filed herewith

__________________________
*All exhibits and schedules to this agreement have been omitted pursuant to Item 601(b)(2) of Regulation S-K. TornierThe Registrant will furnish the omitted exhibits and schedules to the SECSecurities and Exchange Commission upon request by the SEC.Securities and Exchange Commission.

**Pursuant toA management contract or compensatory plan or arrangement.

(1)A confidential treatment renewal application has been submitted under Rule 406T of Regulation S-T, the XBRL related information in Exhibit 101 to this annual report on Form 10-K shall not be deemed to be “filed” for purposes of Section 18 of24b-2 under the Securities Exchange Act of 1934, as amended,amended. The confidential portions of this exhibit have been omitted and marked accordingly. The confidential portions have been filed separately with the Securities and Exchange Commission pursuant to a confidential treatment renewal request.

(2)Confidential treatment granted under Rule 24b-2 under the Securities Exchange Act of 1934, as amended. The confidential portions of this exhibit have been omitted and marked accordingly. The confidential portions have been filed separately with the Securities and Exchange Commission pursuant to a confidential treatment request.


Note:Certain instruments defining the rights of holders of long-term debt securities of the Registrant or otherwise subjectits subsidiaries are omitted pursuant to Item 601(b)(4)(iii) of SEC Regulation S-K. The Registrant hereby undertakes to furnish to the liabilitySecurities and Exchange Commission, upon request, copies of that section, and shall not be deemed part of a registration statement, prospectus or other document filed under Section 11 or 12 of the Securities Act of 1933, as amended, or otherwise subject to the liability of those sections, except as shall be expressly set forth by specific reference inany such filings.instruments.


198


Report of Independent Registered Public Accounting Firm
The Board of Directors and Shareholders

Wright Medical Group N.V.:


Under date of February 23, 2016, we reported on the consolidated balance sheets of Wright Medical Group N.V. and subsidiaries (the Company) as of December 27, 2015 and December 31, 2014, and the related consolidated statements of operations, comprehensive loss, cash flows, and changes in shareholders’ equity for the years ended December 27, 2015, December 31, 2014 and December 31, 2013, which are included in the annual report on Form 10-K for the year ended December 27, 2015. In connection with our audits of the aforementioned consolidated financial statements, we also audited the related financial statement schedule listed in Item 15 in the annual report on Form 10-K. The financial statement schedule is the responsibility of the Company’s management. Our responsibility is to express an opinion on the financial statement schedule based on our audits.
In our opinion, such financial statement schedule, when considered in relation to the basic consolidated financial statements taken as a whole, presents fairly, in all material respects, the information set forth therein.

(signed) KPMG LLP
Memphis, Tennessee
February 23, 2016


199


Wright Medical Group N.V.
Schedule II-Valuation and Qualifying Accounts
(In thousands)

 
Balance at
Beginning of Period
 
Charged to Cost and
Expenses
 
Deductions
and Other
 
Balance at End of
Period
Allowance for doubtful accounts:       
For the period ended:       
December 27, 2015$930
 $(878) $1,137
 $1,189
December 31, 2014$272
 $(684) $1,342
 $930
December 31, 2013$291
 $(66) $47
 $272
Sales returns and allowance:       
For the period ended:       
December 27, 2015$66
 $151
 

 $217
December 31, 2014$282
 $(216) 

 $66
December 31, 2013$
 $(16) $
 $(16)

S-1