UNITED STATES
SECURITIES AND EXCHANGE COMMISSION
Washington, D.C. 20549
FORM 10-K
| x | ANNUAL REPORT PURSUANT TO SECTION 13 OR 15(d) OF THE SECURITIES EXCHANGE ACT OF 1934 |
For the fiscal year ended December 31, 20122013
OR
| ¨ | TRANSITION REPORT PURSUANT TO SECTION 13 OR 15(d) OF THE SECURITIES EXCHANGE ACT OF 1934 |
For the transition period from to
Commission file number 0-15341
DONEGAL GROUP INC.
(Exact name of registrant as specified in its charter)
| Delaware | 23-2424711 | |
(State or other jurisdiction of incorporation or organization) | (I.R.S. Employer | |
Identification No.) | ||
| 1195 River Road, Marietta, Pennsylvania | 17547 | |
| (Address of principal executive offices) | (Zip code) | |
Registrant’s telephone number, including area code: (888) 877-0600
Securities registered pursuant to Section 12(b) of the Act:
Title of Each Class | Name of Each Exchange on Which Registered | |
| Class A Common Stock, $.01 par value | The NASDAQ Global Select Market | |
| Class B Common Stock, $.01 par value | The NASDAQ Global Select Market |
Securities registered pursuant to Section 12(g) of the Act: None.
Indicate by check mark whether the registrant is a well-known seasoned issuer as defined in Rule 405 of the Securities Act: Yes ¨. No x.
Indicate by check mark if the registrant is not required to file reports pursuant to Section 13 or 15(d) of the Exchange Act. Yes ¨. No x.
Indicate by check mark whether the registrant (1) has filed all reports required to be filed by Section 13 or 15(d) of the Securities Exchange Act of 1934 during the preceding 12 months (or for such shorter period that the registrant was required to file such reports) and (2) has been subject to such filing requirements for the past 90 days. Yes x. No ¨.
Indicate by check mark whether the registrant has submitted electronically and posted on its corporate website, if any, every Interactive Data File required to be submitted and posted pursuant to Rule 405 of Regulation S-T during the preceding 12 months (or for such shorter period that the registrant was required to submit and post such files). Yes x. No ¨.
Indicate by check mark if disclosure of delinquent filers pursuant to Item 405 of Regulation S-K is not contained herein, and will not be contained, to the best of registrant’s knowledge, in definitive proxy or information statements we incorporate by reference in Part III of this Form 10-K or any amendment to this Form 10-K. x
Indicate by check mark whether the registrant is a large accelerated filer, an accelerated filer, a non-accelerated filer, or a smaller reporting company. See definition of “large accelerated filer,” “accelerated filer” or “smaller reporting company” in Rule 12b-2 of the Exchange Act (check one):
| Large accelerated filer | ¨ | Accelerated filer | x | |||
| Non-accelerated filer | ¨ (Do not check if a smaller reporting company) | Smaller reporting company | ¨ | |||
Indicate by check mark whether the registrant is a shell company. Yes ¨. No x.
State the aggregate market value of the voting and non-voting common equity held by non-affiliates computed by reference to the price at which the common equity was last sold, or the average bid and asked price of such common equity, as of the last business day of the registrant’s most recently completed second fiscal quarter. $176,019,297.$191,025,187.
Indicate the number of shares outstanding of each of the registrant’s classes of common stock, as of the latest practicable date: 20,050,64920,870,231 shares of Class A common stock and 5,576,775 shares of Class B common stock outstanding on March 1, 2013.2014.
Documents Incorporated by Reference
The registrant incorporates by reference portions of the registrant’s definitive proxy statement relating to registrant’s annual meeting of stockholders to be held April 18, 201317, 2014 into Part III of this report.
INDEX TO FORM 10-K REPORT
(i)
| Item 1. | Business. |
Introduction
Donegal Group Inc., or DGI, is an insurance holding company whose insurance subsidiaries offer personal and commercial lines of property and casualty insurance to businesses and individuals in 22 Mid-Atlantic, Midwestern, New England and Southern states. As used herein, the terms “we,” “us” and “our” refer to Donegal Group Inc. and its subsidiaries.
Donegal Mutual Insurance Company, or Donegal Mutual, organized us as an insurance holding company on August 26, 1986. At December 31, 2012,2013, Donegal Mutual held approximately 39%37% of our outstanding Class A common stock and approximately 76% of our outstanding Class B common stock. This ownership provides Donegal Mutual with approximately 66%65% of the aggregate voting power of our outstanding shares of Class A common stock and our outstanding shares of Class B common stock. Our insurance subsidiaries and Donegal Mutual have interrelated operations due to a pooling agreement and other intercompany agreements and transactions we describe in Note 3 of the Notes to Consolidated Financial Statements. While maintaining the separate corporate existence of each company, our insurance subsidiaries and Donegal Mutual conduct business together as the Donegal Insurance Group. As such, Donegal Mutual and our insurance subsidiaries share the same business philosophy, the same management, the same employees and the same facilities and offer the same types of insurance products.
We have been an effective consolidator of smaller “main street” property and casualty insurance companies, and we expect to continue to acquire other insurance companies to expand our business in a given region or to commence operations in a new region. Since 1995, we have completed six acquisitions of property and casualty insurance companies or began to participate in their business through Donegal Mutual’s entry into quota-share reinsurance agreements with them.
Our insurance subsidiaries and Donegal Mutual provide their policyholders with a selection of insurance products at competitive rates, while pursuing profitability by adhering to a strict underwriting discipline. Our insurance subsidiaries derive a substantial portion of their insurance business from smaller to mid-sized regional communities. We believe this focus provides our insurance subsidiaries with competitive advantages in terms of local market knowledge, marketing, underwriting, claims servicing and policyholder service. At the same time, we believe our insurance subsidiaries have cost advantages over many smaller regional insurers that result from economies of scale they realize through centralized accounting, administrative, data processing, investment and other services.
We believe we have a substantial opportunity, as a well-capitalized regional insurance holding company with a solid business strategy, to grow profitably and compete effectively with national property and casualty insurers. Our downstream holding company structure, with Donegal Mutual asholding approximately 65% of the aggregate voting power of our controlling stockholder,common stock, has proven its effectiveness and success over the past 2728 years of our existence. Over that time frame, we have grown significantly in terms of revenue and financial strength, and the Donegal Insurance Group has developed an excellent reputation as a regional group of property and casualty insurers.
We own 48.2% of Donegal Financial Services Corporation, or DFSC. DFSC is a grandfathered unitary savings and loan holding company that owns all of the outstanding capital stock of Union Community Bank, FSB, a federalstate savings bank, or UCB. UCB has 13 banking offices, all of which are located in Lancaster County, Pennsylvania. Donegal Mutual owns the remaining 51.8% of DFSC. For further information regarding DFSC, we refer to “Business - Donegal Financial Services Corporation” in this Form 10-K Annual Report.
We have four segments: our investment function, our personal lines of insurance, our commercial lines of insurance and our investment in DFSC. We set forth financial information about these segments in Note 2019 of the Notes to Consolidated Financial Statements. The personal lines products of our insurance subsidiaries consist primarily of homeowners and private passenger automobile policies. The commercial lines products of our insurance subsidiaries consist primarily of commercial automobile, commercial multi-peril and workers’ compensation policies.
Available Information
You may obtain our Annual Reports on Form 10-K, including this Form 10-K Annual Report, our quarterly reports on Form 10-Q, our current reports on Form 8-K, our proxy statement and our other filings pursuant to the Securities Exchange Act of 1934, or the Exchange Act, without charge by viewing our website atwww.donegalgroup.com. You may also view our Code of Business Conduct and Ethics and the charters of our executive committee, our audit committee, our compensation committee and our nominating committee on our website. Upon request to our corporate secretary, we will also provide printed copies of any of these documents to you without charge. We have provided the address of our website solely for the information of investors. We do not intend the reference to our website address to be an active link or to otherwise incorporate the contents of our website into this Form 10-K Annual Report.
-1-
History and Organizational Structure
In the mid-1980s,mid-1980’s, Donegal Mutual recognized its need,the desirability, as a mutual insurance company, to developof developing additional sources of capital and surplus toso it could remain competitive and to have the capacitysurplus to expand its business and assureensure its long-term viability. Donegal Mutual determined to implement a downstream holding company structure as one of its strategic responses.business strategies. Accordingly, in 1986, Donegal Mutual formed us as a downstream holding company. Initially, Donegal Mutual owned all of our outstanding capitalcommon stock. WeAfter Donegal Mutual formed us, we in turn formed Atlantic States Insurance Company, or Atlantic States as our wholly owned property and casualty insurance company subsidiary. We subsequently effected a public offering to provide
In connection with the surplus necessary to support the businessestablishment of Atlantic States began to receive on October 1, 1986 as its share underand our downstream insurance holding company system, Donegal Mutual and DGI entered into a proportional reinsurance agreement, or pooling agreement, between Donegal Mutual and Atlantic States that became effective on that date.October 1, 1986. Under thisthe pooling agreement, Donegal Mutual and Atlantic States pool and then share proportionately substantially all of their respective premiums, losses and expenses.loss expenses to the reinsurance pool, and the reinsurance pool, acting through Donegal Mutual, then cedes a portion of the pooled business, currently 80%, to our subsidiary, Atlantic States. Since we established Atlantic States in 1986, Donegal Mutual and our insurance subsidiaries have conducted business together as the Donegal Insurance Group, while retaining their separate legal and corporate existences. Donegal Mutual and Atlantic States share the underwriting results in proportion to their respective participation in the underwriting pool. As the Donegal Insurance Group, Donegal Mutual and our insurance subsidiaries share a combined business plan to enhance market penetration and underwriting profitability objectives. As such, Donegal Mutual and our insurance subsidiaries share the same business philosophies, the same management, the same employees and the same facilities and offer the same types of insurance products. We believe Donegal Mutual’s majority interest in the combined voting power of our Class A common stock and of our Class B common stock fosters our ability to implement our business philosophies, enjoy management continuity, maintain superior employee relations and provide a stable environment within which we can grow our businesses.
The products Donegal Mutual and our insurance subsidiaries offer are generally complementary, which permits the Donegal Insurance Group to offer a broad range of products in a given market and to expand the Donegal Insurance Group’s ability to service an entire personal lines or commercial lines account. Distinctions within the products Donegal Mutual and our insurance subsidiaries offer generally relate to specific risk profiles within similar classes of business, such as preferred tier products versus standard tier products. Donegal Mutual and we do not allocate all of the standard risk gradients to one company. As a result, the underwriting profitability of the business the individual companies write directly will vary. However, the underwriting pool homogenizes the risk characteristics of all business Donegal Mutual and Atlantic States write directly. We receive 80% of the results of the underwriting pool because Atlantic States has an 80% participation in the pool. The business Atlantic States derives from the underwriting pool represents a significant percentage of our total consolidated revenues. However, that percentage has gradually decreased over the past few years as we have acquired a number of other property and casualty insurance companies in other jurisdictions that do not participate in the underwriting pool.
As the capital of Atlantic States and our other insurance subsidiaries has increased, itsthe underwriting capacity of our insurance subsidiaries, including Atlantic States, has proportionately increased. The size of the underwriting pool has increased proportionately.substantially. Therefore, as we originally planned in the mid-1980s, Atlantic States has successfully raised the capital necessary to support the growth of its direct business as well as to accept increases in its allocation of business from the underwriting pool. The allocationIn addition, the portion of the underwriting pool allocated to Atlantic States from the pool has increased from an initial allocation of 35% in 1986 to an 80% allocation since March 1, 2008. The size of the underwriting pool has increased substantially since its inception. The business Atlantic States derives from the pool represents the predominant percentage of our total revenues. We do not anticipate any further changeschange in the pooling agreement between Atlantic States and Donegal Mutual in the foreseeable future, including any change in the percentage participation of Atlantic States in the underwriting pool. Our insurance subsidiaries other than Atlantic States do not participate in the pooling agreement. We refer to Note 3 of the Notes to Consolidated Financial Statements for more information regarding the pooling agreement.
Since Donegal Mutual established our downstream holding company structure in 1986, Donegal Mutual and our insurance subsidiaries have conducted business together while retaining their separate legal and corporate existences. As such, Donegal Mutual and our insurance subsidiaries share the same business philosophies, the same management, the same employees, the same facilities and we offer the same types of insurance products. In addition, as the Donegal Insurance Group, Donegal Mutual and our insurance subsidiaries share a combined business plan to achieve market penetration and underwriting profitability objectives. The products Donegal Mutual and our insurance subsidiaries offer are generally complementary, which permits the Donegal Insurance Group to offer a broader range of products to a given market and to expand the Donegal Insurance Group’s ability to service an entire personal lines or commercial lines account. Distinctions within the products of Donegal Mutual and our insurance subsidiaries generally relate to specific risk profiles targeted within similar classes of business, such as preferred tier versus standard tier products. Although the underwriting profitability of the business the individual companies write directly will vary, the underwriting pool homogenizes the risk characteristics of all business Donegal Mutual and Atlantic States write directly. Donegal Mutual and Atlantic States share the underwriting results of the pool in proportion to their respective participation in the pool.
In addition to Atlantic States, our insurance subsidiaries include Southern Insurance Company of Virginia, or Southern, Le Mars Insurance Company, or Le Mars, The Peninsula Insurance Company and its wholly owned subsidiary, Peninsula Indemnity Company, or collectively, the Peninsula, Group, Sheboygan Falls Insurance Company, or Sheboygan, and Michigan Insurance Company, or MICO. We also benefit from Donegal Mutual’s 100% quota-share reinsurance agreement with Southern Mutual Insurance Company, or Southern Mutual, and Donegal Mutual’s placement of its assumed business from Southern Mutual into the pooling agreement.
-2-
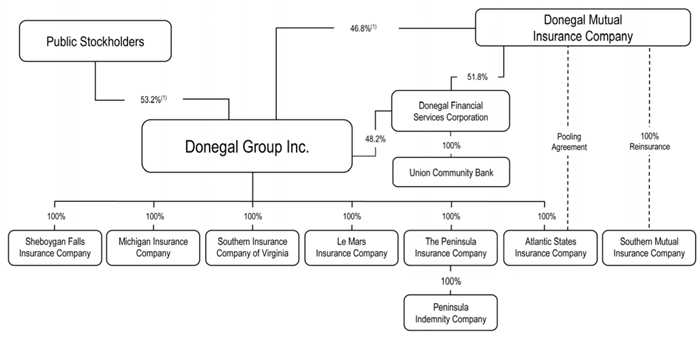
The following chart summarizesdepicts our organizational structure. The chart depicts all of our property and casualty insurance subsidiaries, Southern Mutual and our interest in DFSC:
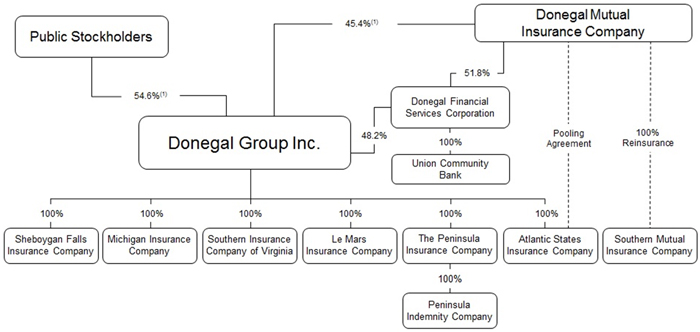
| (1) | Because of the different relative voting power of our Class A common stock and Class B common stock, our public stockholders hold approximately |
Relationship with Donegal Mutual
Donegal Mutual provides facilities, personnel and other services to us and our insurance subsidiaries. Donegal Mutual allocates certain related expenses to Atlantic States in relation to the relative participation of Donegal Mutual and Atlantic States in the underwriting pool. Our insurance subsidiaries other than Atlantic States reimburse Donegal Mutual for their respective personnel costs and bear their proportionate share of information services costs based on their respective percentage of the total written premiums of the Donegal Insurance Group. Charges for these services totaled $94.0 million, $78.8 million and $64.7 million for 2013, 2012 and $64.0 million for 2012, 2011, and 2010, respectively.
Our insurance subsidiaries have various reinsurance arrangements with Donegal Mutual. These agreements include:
an excess of loss reinsurance agreementagreements with Le Mars, Peninsula, Sheboygan and Southern;
catastrophe reinsurance agreements with Atlantic States, Le Mars and Southern;
a quota-share reinsurance agreement with Le Mars;
a quota-share reinsurance agreement with Peninsula; and
a quota-share reinsurance agreement with MICO.
The intentpurpose of the excess of loss and catastrophe reinsurance agreements is to lessen the effects of a single large loss, or an accumulation of smaller losses arising from one event, to levels that are appropriate given each subsidiary’s size, underwriting profile and surplus position.
The intentpurpose of the quota-share reinsurance agreement with Le Mars is to transfer to Le Mars 100% of the premiums and losses related to certain products Donegal Mutual offers in certain Midwest states, which provide the availability of complementary products to Le Mars’ commercial accounts.
The intentpurpose of the quota-share reinsurance agreement with Peninsula is to transfer to Donegal Mutual 100% of the premiums and losses related to the workers’ compensation product line of Peninsula in certain states, which provides the availability of an additional workers’ compensation tier to Donegal Mutual’s commercial accounts. Donegal Mutual places its assumed business from Peninsula into the underwriting pool.
-3-
The intentpurpose of the quota-share reinsurance agreement with MICO is to transfer to Donegal Mutual 25% of the premiums and losses related to MICO’s business. Donegal Mutual places its assumed business from MICO into the underwriting pool.
Effective November 1, 2012, Donegal Mutual and Southern terminated their quota-share reinsurance agreement on a run-off basis. The intent of the quota-share reinsurance agreement with Southern was to transfer to Southern 100% of the premiums and losses related to certain personal lines products Donegal Mutual offered in Virginia through the use of its automated policy quoting and issuance system.
We and Donegal Mutual have maintained a coordinating committee since our formation in 1986. The coordinating committee consists of two members of our board of directors, neither of whom is a member of Donegal Mutual’s board of directors, and two members of Donegal Mutual’s board of directors, neither of whom is a member of our board of directors. The purpose of the coordinating committee is to establish and maintain a process for an annual evaluation of the transactions between Donegal Mutual, our insurance subsidiaries and us. The coordinating committee considers the fairness of each intercompany transaction to Donegal Mutual and its policyholders and to us and our stockholders.
A new agreement or any change to a previously approved agreement must receive coordinating committee approval. The coordinating committee approval process for a new agreement between Donegal Mutual and us or one of our insurance subsidiaries or a change in such an agreement is as follows:
both of our members on the coordinating committee must determine that the new agreement or the change in an existing agreement is fair and equitable to us and in the best interests of our stockholders;
both of Donegal Mutual’s members on the coordinating committee must determine that the new agreement or the change in an existing agreement is fair and equitable to Donegal Mutual and in the best interests of its policyholders;
the new agreement or the change in an existing agreement must be approved by our board of directors; and
the new agreement or the change in an existing agreement must be approved by Donegal Mutual’s board of directors.
The coordinating committee also meets annually to review each existing agreement between Donegal Mutual and us or our insurance subsidiaries, including all reinsurance agreements between Donegal Mutual and our insurance subsidiaries. The purpose of this annual review is to examine the results of the agreements over the past year and, in the case of reinsurance agreements, over a five-year period and to determine if the results of the existing agreements remain fair and equitable to us and our stockholders and fair and equitable to Donegal Mutual and its policyholders or if Donegal Mutual and we should mutually agree to certain adjustments. In the case of these reinsurance agreements, the annual adjustments typically relate to the reinsurance premiums, losses and reinstatement premiums. These agreements are ongoing in nature and will continue in effect throughout 20132014 in the ordinary course of business.
Our members on the coordinating committee, as of the date of this Form 10-K Annual Report, are Robert S. Bolinger and John J. Lyons. Donegal Mutual’s members on the coordinating committee as of such date are Dennis J. Bixenman and John E. Hiestand. We refer to our proxy statement for our annual meeting of stockholders on April 18, 201317, 2014 for further information about the members of the coordinating committee.
We believe our relationships with Donegal Mutual offer us and our insurance subsidiaries a number of competitive advantages, including the following:
enabling our stable management, the consistent underwriting discipline of our insurance subsidiaries, external growth, long-term profitability and financial strength;
-4-
creating operational and expense synergies from the combination of resources and integrated operations of Donegal Mutual and our insurance subsidiaries;
enhancing our opportunities to expand by acquisition because of the ability of Donegal Mutual to affiliate with and acquire control of other mutual insurance companies and, thereafter, demutualize them and combine them with us;
producing more stable and uniform underwriting results for our insurance subsidiaries over extended periods of time than we could achieve without our relationship with Donegal Mutual;
-4-
providing opportunities for growth because of the ability of Donegal Mutual to enter into reinsurance agreements with other mutual insurance companies and place the business it assumes into the pooling agreement; and
providing Atlantic States with a significantly larger underwriting capacity because of the underwriting pool Donegal Mutual and Atlantic States have maintained since 1986.
In the latter portion of the fourth quarter of 20122013 and the first quarter of 2013,2014, our board of directors and the board of directors of Donegal Mutual each undertook a review of the relationships of Donegal Mutual and DGI and determined that continuing the current relationships and the current corporate structure of Donegal Mutual and DGI is in the best interests of Donegal MutualDGI and its various constituencies.
Business Strategy
Our strategy is designed to allow our insurance subsidiaries to achieve their longstanding goal of outperforming the United States property and casualty insurance industry in terms of profitability and service, thereby providing value to the policyholders of our insurance subsidiaries and, ultimately, providing value to our stockholders. The annual net premiums earned of our insurance subsidiaries have increased from $265.8 million in 2004 to $475.0$515.3 million in 2012,2013, a compound annual growth rate of 7.5%7.6%. Over the same time period, our insurance subsidiaries have generally achieved a statutory combined ratio more favorable than that of the United States property and casualty insurance industry as a whole.
The combined ratio of our insurance subsidiaries and that of the United States property and casualty insurance industry as computed using United States generally accepted accounting principles, or GAAP, and statutory accounting principles, or SAP, for the years 20082009 through 20122013 are shown in the following table:
| 2012 | 2011 | 2010 | 2009 | 2008 | 2013 | 2012 | 2011 | 2010 | 2009 | |||||||||||||||||||||||||||||||
Our GAAP combined ratio(1) | 101.6 | % | 110.6 | % | 104.7 | % | 102.2 | % | 97.2 | % | 98.8 | % | 101.6 | % | 110.6 | % | 104.7 | % | 102.2 | % | ||||||||||||||||||||
Our SAP combined ratio | 99.8 | 107.9 | 102.9 | 101.1 | 95.1 | 97.4 | 99.8 | 107.9 | 102.9 | 101.1 | ||||||||||||||||||||||||||||||
Industry SAP combined ratio(2) | 106.2 | 107.5 | 101.0 | 101.2 | 104.7 | 97.6 | 102.2 | 106.7 | 101.2 | 99.5 | ||||||||||||||||||||||||||||||
| (1) | Our GAAP combined ratio for 2011 was adversely affected by |
| (2) | As reported or projected by A.M. Best Company. |
We and Donegal Mutual believe we can continue to expand our insurance operations over time through organic growth and acquisitions of, or affiliations with, other insurance companies. We and Donegal Mutual have enhanced the performance of companies we have acquired, while leveraging the acquired companies’ core strengths and local market knowledge to expand their operations. Our insurance subsidiaries and Donegal Mutual also seek to increase their premium base by making quality independent agency appointments, enhancing their competitive position within each agency, introducing new and enhanced insurance products and developing and maintaining automated systems to improve their service, communications and efficiency.
We and Donegal Mutual translate these initiatives into our book value growth in a number of ways, including the following:
Maintainingmaintaining a conservative underwriting culture and pricing discipline to sustain our record of underwriting profitability;
Continuingcontinuing our investment in technology to achieve operating efficiencies that lower expenses, and enhance the service we provide to agencies and policyholders and increase the speed of our communications with agencies and policyholders; and
Maintainingmaintaining a conservative investment approach.
-5-
A detailed review of our business strategies follows:
| • | Achieving underwriting profitability. |
Our insurance subsidiaries focus on achieving a combined ratio of less than 100%. Our insurance subsidiaries did not achieveachieved that objective in 20112013, and 2010 because of adverse weather, declining economic activity and a soft insurance market in our marketing areas in those years, but we remain committed to achieving consistent underwriting profitability. The accounting for the acquisition of MICO also adversely affected our combined ratio in 2011. We believe that underwriting profitability is a fundamental component of our long-term financial strength because it allows our insurance subsidiaries to generate profits without relying exclusively on their investment income. Our insurance subsidiaries seek to enhance their underwriting results by:
carefully selecting the product lines they underwrite;
carefully selecting the individual risks they underwrite;
minimizing their individual exposure to catastrophe-prone areas; and
evaluating their claims history on a regular basis to ensure the adequacy of their underwriting guidelines and product pricing.
Our insurance subsidiaries have no material exposures to asbestos and environmental liabilities. Our insurance subsidiaries seek to provide more than one policy to a given personal lines or commercial lines customer because this “account selling” strategy diversifies their risk and has historically improved their underwriting results. Finally, ourOur insurance subsidiaries also use reinsurance to manage their exposure and limit their maximum net loss from large single risks or risks in concentrated areas. Our insurance subsidiaries believe these practices are key factors in their ability to maintain a statutory combined ratio that has generally been generally more favorable than the combined ratio of the United States property and casualty insurance industry.
| • | Pursuing profitable growth by organic expansion within the traditional operating territories of our insurance subsidiaries through developing and maintaining quality agency representation. |
We believe that continued expansion of our insurance subsidiaries within their existing markets will be a key source of their continued premium growth and that maintaining an effective and growing network of independent agencies is integral to their expansion. Our insurance subsidiaries seek to be among the top three insurers within each of the independent agencies for the lines of business our insurance subsidiaries write by providing a consistent, competitive and stable market for their products. We believe that the consistency of their product offerings enables our insurance subsidiaries to compete effectively for agents with other insurers whose product offerings fluctuate based on industry conditions. Our insurance subsidiaries offer a competitive compensation program to their independent agents that rewards them for producing profitable growth for our insurance subsidiaries. Our insurance subsidiaries provide their independent agents with ongoing support to enable them to better attract and service customers, including:
fully automated underwriting and policy issuance systems for both personal, commercial and farm lines of insurance;
training programs;
marketing support;
availability of a service center that provides comprehensive service for our personal lines policyholders; and
field visitations by marketing and underwriting personnel and senior management of our insurance subsidiaries.
Our insurance subsidiaries appoint independent agencies with a strong underwriting and growth track record. We believe that our insurance subsidiaries, by carefully selecting, motivating and supporting their independent agencies, will drive continued long-term growth.
-6-
| • | Acquiring property and casualty insurance companies to augment the organic growth of our insurance subsidiaries in existing markets and to expand into new geographic regions. |
We have been an effective consolidator of smaller “main street” property and casualty insurance companies, and we expect to continue to acquire other insurance companies to expand our business in a given region or to commence operations in a new region.
Since 1995, we have completed six acquisitions of property and casualty insurance companies or participated in their business through Donegal Mutual’s entry into quota-share reinsurance agreements with them. We intend to continue our growth by pursuing affiliations and acquisitions that meet our criteria. Our primary criteria include:are:
Locationlocation in regions where our insurance subsidiaries are currently conducting business or that offer an attractive opportunity to conduct profitable business;
Aa mix of business similar to the mix of business of our insurance subsidiaries;
Premiumpremium volume up to $100.0 million; and
Fairfair and reasonable transaction terms.
We believe that our interrelationship with Donegal Mutual assists us in pursuing affiliations with, and subsequent acquisitions of, mutual insurance companies because, through Donegal Mutual, we understand the concerns and issues that mutual insurance companies face. In particular, Donegal Mutual has had success affiliating with underperforming mutual insurance companies, and we have either acquired them following their conversion to a stock company or benefited from their underwriting results as a result of Donegal Mutual’s entry into a 100% quota-share reinsurance agreement with them and placement of its assumed business into the pooling agreement. We have utilized our strengths and financial position to improve the operations of those underperforming insurance companies significantly. We evaluate a number of areas for operational synergies when considering acquisitions, including product underwriting, expenses, the cost of reinsurance and technology.
We and Donegal Mutual have the ability to employ a number of acquisition and affiliation methods. Our prior acquisitions and affiliations have taken one of the following forms:
purchase of all of the outstanding stock of a stock insurance company;
purchase of a book of business;
quota-share reinsurance transaction; or
two-step acquisition of a mutual insurance company in which:
as the first step, Donegal Mutual purchases a surplus note from the mutual insurance company, Donegal Mutual enters into a services agreement with the mutual insurance company and Donegal Mutual’s designees become a majority of the members of the board of directors of the mutual insurance company; and
as the second step, the mutual insurance company enters into a quota-share reinsurance agreement with Donegal Mutual or demutualizes, or converts, into a stock insurance company. Upon the demutualization or conversion, we purchase the surplus note from Donegal Mutual and exchange it for all of the stock of the stock insurance company resulting from the demutualization or conversion.
We believe that our ability to make direct acquisitions of stock insurance companies and to make indirect acquisitions of mutual insurance companies through a sponsored conversion or a quota-share reinsurance agreement provides us with flexibility that is a competitive advantage in seekingmaking acquisitions. We also believe we have demonstratedour historic record clearly demonstrates our ability to acquire control of an underperforming insurance company, re-underwrite its book of business, reduce its cost structure and return it to sustained profitability.
While Donegal Mutual and we generally engage in preliminary discussions with potential direct or indirect acquisition candidates on an almost continuous basis and are so engaged at the date of this Form 10-K Report, neither Donegal Mutual nor we make any public disclosure regarding a proposed acquisition until Donegal Mutual or we have entered into a definitive acquisition agreement.
-7-
The following table highlights our history of insurance company acquisitions and affiliations since 1988:
Company Name | State of Domicile | Year | Method of Acquisition/Affiliation | |||
Southern Mutual Insurance Company and now Southern Insurance Company of Virginia | Virginia | 1984 | Surplus note investment by Donegal Mutual in 1984; demutualization in 1988; acquisition of stock by us in 1988. | |||
Pioneer Mutual Insurance Company and then Pioneer Insurance Company (1)(2) | Ohio | 1992 | Surplus note investment by Donegal Mutual in 1992; demutualization in 1993; acquisition of stock by us in 1997. | |||
Delaware Mutual Insurance Company and then Delaware Atlantic Insurance Company (1)(2) | Delaware | 1993 | Surplus note investment by Donegal Mutual in 1993; demutualization in 1994; acquisition of stock by us in 1995. | |||
Pioneer Mutual Insurance Company and then Pioneer Insurance Company(1)(2) | New York | 1995 | Surplus note investment by Donegal Mutual in 1995; demutualization in 1998; acquisition of stock by us in 2001. | |||
Southern Heritage Insurance Company (2) | Georgia | 1998 | Purchase of stock by us in 1998. | |||
Le Mars Mutual Insurance Company of Iowa and now Le Mars Insurance Company (1) | Iowa | 2002 | Surplus note investment by Donegal Mutual in 2002; demutualization in 2004; acquisition of stock by us in 2004. | |||
Peninsula Insurance Group | Maryland | 2004 | Purchase of stock by us in 2004. | |||
Sheboygan Falls Mutual Insurance Company and now Sheboygan Falls Insurance Company (1) | Wisconsin | 2007 | Contribution note investment by Donegal Mutual in 2007; demutualization in 2008; acquisition of stock by us in 2008. | |||
Southern Mutual Insurance Company (3) | Georgia | 2009 | Surplus note investment by Donegal Mutual and quota-share reinsurance in 2009. | |||
Michigan Insurance Company | Michigan | 2010 | Purchase of stock by us and surplus note investment by Donegal Mutual in 2010. | |||
| (1) | Each of these acquisitions initially took the form of an affiliation with Donegal Mutual. Donegal Mutual provided surplus note financing to the insurance company, and, in connection therewith, sufficient designees of Donegal Mutual were appointed so as to constitute a majority of the members of the board of directors of the insurance company. Donegal Mutual and the insurance company simultaneously entered into a services agreement whereby Donegal Mutual provided services to improve the operations of the insurance company. Once the insurance company’s results of operations improved to the satisfaction of Donegal Mutual, Donegal Mutual sponsored the demutualization of the insurance company. Upon the consummation of the demutualization, Donegal Mutual |
| (2) | To reduce administrative and compliance costs and expenses, these subsidiaries subsequently merged into one of our existing insurance subsidiaries. |
| (3) | Control acquired by Donegal Mutual. |
| • | Providing responsive and friendly customer and agent service to enable our insurance subsidiaries to attract new policyholders and retain existing policyholders. |
We believe that excellent policyholder service is important in attracting new policyholders and retaining existing policyholders. Our insurance subsidiaries work closely with their independent agents to provide a consistently responsive level of claims service, underwriting and customer support. Our insurance subsidiaries seek to respond expeditiously and effectively to address customer and independent agent inquiries in a number of ways, including:
Availabilityavailability of a customer call center for claims reporting;
Availabilityavailability of a secure website for access to policy information and documents, payment processing and other features;
-8-
Quicktimely replies to information requests and policy submissions; and
Promptprompt responses to and processing of claims.
Our insurance subsidiaries periodically conduct policyholder surveys to evaluate the effectiveness of their service to policyholders. The management of our insurance subsidiaries meets frequentlyon a regular basis with the personnel of the independent insurance agents our insurance subsidiaries appoint to seek service improvement recommendations, react to service issues and better understand local market conditions.
| • | Maintaining premium rate adequacy to enhance the underwriting results of our insurance subsidiaries, while maintaining their existing book of business and preserving their ability to write new business. |
Our insurance subsidiaries seek discipline in their pricing by effecting rate increases to maintain or improve their underwriting profitability without unduly affecting their customer retention. In addition to appropriate pricing, our insurance subsidiaries seek to ensure that their premium rates are adequate relative to the amount of risk they insure. Our insurance subsidiaries review loss trends on a periodic basis to identify changes in the frequency and severity of their claims and to assess the adequacy of their rates and underwriting standards. Our insurance subsidiaries also carefully monitor and audit the information they use to price their policies for the purpose of enabling them to receive an adequate level of premiums for their risk.the risk they assume. For example, our insurance subsidiaries inspect substantially all commercial lines risks and a substantial number of personal lines property risks before they commit to insure them to determine the adequacy of the insured amount to the value of the insured property, assess property conditions and identify any liability exposures. Our insurance subsidiaries audit the payroll data of their workers’ compensation customers to verify that the assumptions used to price a particular policy were accurate. By implementing appropriate rate increases and understanding the risks our insurance subsidiaries agree to insure, they are generally able to achieve their strategy of achieving consistent underwriting profitability.
| • | Focusing on expense controls and utilization of technology to increase the operating efficiency of our insurance subsidiaries. |
Our insurance subsidiaries maintain stringent expense controls under direct supervision of their senior management. We centralize many processing and administrative activities of our insurance subsidiaries to realize operating synergies and better control expenses. Our insurance subsidiaries utilize technology to automate much of their underwriting and to facilitate agency and policyholder communications on an efficient, timely and cost-effective basis. We operate on a paperless basis. As a result of our focus on expense control, our insurance subsidiaries have reduced their expense ratio from 36.6% in 1999 to 31.2%31.8% in 2012.2013. Our insurance subsidiaries have also increased their annual premium per employee, a measure of efficiency that our insurance subsidiaries use to evaluate their operations, from approximately $470,000 in 1999 to approximately $908,000$915,000 in 2012.2013.
Our insurance subsidiaries maintain technology comparable to that of the largest of their competitors. “Ease of doing business” is an increasingly important component of an insurer’s value to an independent agency. Our insurance subsidiaries provide a fully automated personal lines underwriting and policy issuance system called “WritePro®.” WritePro® is a web-based user interface that substantially eases data entry and facilitates the quoting and issuance of policies for the independent agents of our insurance subsidiaries. Our insurance subsidiaries also provide a similar commercial business system called “WriteBiz®.” WriteBiz® is a web-based user interface that provides the independent agents of our insurance subsidiaries with an online ability to quote and issue commercial automobile, workers’ compensation, business owners and tradesman policies automatically. WriteFarm® is a web-based user interface that provides the independent agents of our insurance subsidiaries with an online ability to quote and issue farm policies automatically.policies. As a result, applications of the independent agents for our insurance subsidiaries can become policies without further re-entry of information. These systems also interface with the policy management systems of the independent agents of our insurance subsidiaries.
| • | Maintaining a conservative investment approach. |
Return on invested assets is an important element of the financial results of our insurance subsidiaries. The investment strategy of our insurance subsidiaries is to generate an appropriate amount of after-tax income on invested assets while minimizing credit risk through investments in high-quality securities. As a result, our insurance subsidiaries seek to invest a high percentage of their assets in diversified, highly rated and marketable fixed-maturity instruments. The fixed-maturity portfolios of our insurance subsidiaries consist of both taxable and tax-exempt securities. Our insurance subsidiaries maintain a portion of their portfolios in short-term securities to provide liquidity for the payment of claims and operation of their respective businesses. Our insurance subsidiaries maintain a negligible percentage (1.1%(1.5% at December 31, 2012)2013) of their portfolios in equity securities.
-9-
Competition
The property and casualty insurance industry is highly competitive on the basis of both price and service. Numerous companies compete for business in the geographic areas where our insurance subsidiaries operate. Many of these other insurance companies are substantially larger and have greater financial resources than those of our insurance subsidiaries. In addition, because our insurance subsidiaries and Donegal Mutual market their respective insurance products exclusively through independent insurance agencies, most of which represent more than one insurance company, our insurance subsidiaries face competition within agencies, as well as competition to retain qualified independent agents.
Products and Underwriting
We report the results of our insurance operations in two segments: personal lines of insurance and commercial lines of insurance. The personal lines our insurance subsidiaries write consist primarily of private passenger automobile and homeowners insurance. The commercial lines our insurance subsidiaries write consist primarily of commercial automobile, commercial multi-peril and workers’ compensation insurance. We describe these lines of insurance in greater detail below:
Personal
Private passenger automobile —- policies that provide protection against liability for bodily injury and property damage arising from automobile accidents and protection against loss from damage to automobiles owned by the insured.
Homeowners —- policies that provide coverage for damage to residences and their contents from a broad range of perils, including fire, lightning, windstorm and theft. These policies also cover liability of the insured arising from injury to other persons or their property while on the insured’s property and under other specified conditions.
Commercial
Commercial automobile —- policies that provide protection against liability for bodily injury and property damage arising from automobile accidents and protection against loss from damage to automobiles owned by the insured.
Commercial multi-peril —- policies that provide protection to businesses against many perils, usually combining liability and physical damage coverages.
Workers’ compensation —- policies employers purchase to provide benefits to employees for injuries sustained during employment. The workers’ compensation laws of each state determine the extent of the coverage we provide.
-10-
The following table sets forth the net premiums written of our insurance subsidiaries by line of insurance for the periods indicated:
| Year Ended December 31, | Year Ended December 31, | |||||||||||||||||||||||||||||||||||||||||||||||
| 2012 | 2011 | 2010 | 2013 | 2012 | 2011 | |||||||||||||||||||||||||||||||||||||||||||
| (dollars in thousands) | Amount | % | Amount | % | Amount | % | Amount | % | Amount | % | Amount | % | ||||||||||||||||||||||||||||||||||||
Net Premiums Written: | ||||||||||||||||||||||||||||||||||||||||||||||||
Personal lines: | ||||||||||||||||||||||||||||||||||||||||||||||||
Automobile | $ | 195,132 | 39.3 | % | $ | 186,677 | 41.1 | % | $ | 171,497 | 43.8 | % | $ | 196,363 | 36.8 | % | $ | 195,132 | 39.3 | % | $ | 186,677 | 41.1 | % | ||||||||||||||||||||||||
Homeowners | 97,120 | 19.6 | 89,405 | 19.7 | 83,415 | 21.3 | 106,420 | 20.0 | 97,120 | 19.6 | 89,405 | 19.7 | ||||||||||||||||||||||||||||||||||||
Other | 16,319 | 3.3 | 14,983 | 3.3 | 13,135 | 3.4 | 15,915 | 3.0 | 16,319 | 3.3 | 14,983 | 3.3 | ||||||||||||||||||||||||||||||||||||
|
|
|
|
|
|
|
|
|
|
|
| |||||||||||||||||||||||||||||||||||||
Total personal lines | 308,571 | 62.2 | 291,065 | 64.1 | 268,047 | 68.5 | 318,698 | 59.8 | 308,571 | 62.2 | 291,065 | 64.1 | ||||||||||||||||||||||||||||||||||||
|
|
|
|
|
|
|
|
|
|
|
| |||||||||||||||||||||||||||||||||||||
Commercial lines: | ||||||||||||||||||||||||||||||||||||||||||||||||
Automobile | 51,261 | 10.3 | 46,168 | 10.2 | 37,094 | 9.5 | 58,165 | 10.9 | 51,261 | 10.3 | 46,168 | 10.2 | ||||||||||||||||||||||||||||||||||||
Workers’ compensation | 65,390 | 13.2 | 51,849 | 11.4 | 34,920 | 8.9 | 77,589 | 14.5 | 65,390 | 13.2 | 51,849 | 11.4 | ||||||||||||||||||||||||||||||||||||
Commercial multi-peril | 64,476 | 13.0 | 57,988 | 12.8 | 47,411 | 12.1 | 74,516 | 14.0 | 64,476 | 13.0 | 57,988 | 12.8 | ||||||||||||||||||||||||||||||||||||
Other | 6,749 | 1.3 | 6,981 | 1.5 | 4,050 | 1.0 | 4,463 | 0.8 | 6,749 | 1.3 | 6,981 | 1.5 | ||||||||||||||||||||||||||||||||||||
|
|
|
|
|
|
|
|
|
|
|
| |||||||||||||||||||||||||||||||||||||
Total commercial lines | 187,876 | 37.8 | 162,986 | 35.9 | 123,475 | 31.5 | 214,733 | 40.2 | 187,876 | 37.8 | 162,986 | 35.9 | ||||||||||||||||||||||||||||||||||||
|
|
|
|
|
|
|
|
|
|
|
| |||||||||||||||||||||||||||||||||||||
Total business | $ | 496,447 | 100.0 | % | $ | 454,051 | 100.0 | % | $ | 391,522 | 100.0 | % | $ | 533,431 | 100.0 | % | $ | 496,447 | 100.0 | % | $ | 454,051 | 100.0 | % | ||||||||||||||||||||||||
|
|
|
|
|
|
|
|
|
|
|
| |||||||||||||||||||||||||||||||||||||
The personal lines and commercial lines underwriting departments of our insurance subsidiaries evaluate and select those risks that they believe will enable our insurance subsidiaries to achieve an underwriting profit. The underwriting departments have significant interaction with the independent agents regarding the underwriting philosophy and the underwriting guidelines of our insurance subsidiaries. Our underwriting personnel also assist the research and development department in the development of quality products at competitive prices to promote growth and profitability.
In order to achieve underwriting profitability on a consistent basis, our insurance subsidiaries:
assess and select quality standard and preferred risks;
adhere to disciplined underwriting and re-underwriting guidelines;
inspect substantially all commercial lines risks and a substantial number of personal lines property risks; and
utilize various types of risk management and loss control services.
Our insurance subsidiaries also review their existing policies and accounts to determine whether those risks continue to meet their underwriting guidelines. If a given policy or account no longer meets those underwriting guidelines, our insurance subsidiaries will take appropriate action regarding that policy or account, including raising premium rates or non-renewing the policy to the extent applicable law permits.
As part of the effort of our insurance subsidiaries to maintain acceptable underwriting results, they conduct annual reviews of agencies that have failed to meet their underwriting profitability criteria. The review process includes an analysis of the underwriting and re-underwriting practices of the agency, the completeness and accuracy of the applications the agency has submitted,submits, the adequacy of the training of the agency’s staff and the agency’s record of adherence to the underwriting guidelines and service standards of our insurance subsidiaries. Based on the results of this review process, the marketing and underwriting personnel of our insurance subsidiaries develop, together with the agency, a plan to improve its underwriting profitability. Our insurance subsidiaries monitor the agency’s compliance with the plan and take other measures as required in the judgment of our insurance subsidiaries, including the termination to the extent applicable law permits of agencies that are unable to achieve acceptable underwriting profitability.
-11-
Distribution
Our insurance subsidiaries market their products primarily in the Mid-Atlantic, Midwestern, New England and Southern regions through approximately 2,5002,600 independent insurance agencies. At December 31, 2012,2013, the Donegal Insurance Group actively wrote business in 22 states (Alabama, Delaware, Georgia, Indiana, Iowa, Maine, Maryland, Michigan, Nebraska, New Hampshire, New York, North Carolina, Ohio, Oklahoma, Pennsylvania, South Carolina, South Dakota, Tennessee, Vermont, Virginia, West Virginia and Wisconsin). We believe the relationships of our insurance subsidiaries with their independent agents are valuable in identifying, obtaining and retaining profitable business. Our insurance subsidiaries maintain a stringent agency selection procedure that emphasizes appointing agencies with proven marketing strategies for the development of profitable business, and our insurance subsidiaries only appoint agencies with a strong underwriting history and potential growth capabilities. Our insurance subsidiaries also regularly evaluate the independent agencies that represent them based on their profitability and performance in relation to the objectives of our insurance subsidiaries. Our insurance subsidiaries seek to be among the top three insurers within each of their agencies for the lines of business they write.
The following table sets forth the percentage of direct premiums our insurance subsidiaries write, including 80% of the direct premiums Donegal Mutual and Atlantic States write, in each of the states where they conducted a significant portion of their business in 2012:2013:
Pennsylvania | % | |||
Michigan | ||||
Virginia | 9.0 | |||
Maryland | ||||
| ||||
Delaware | ||||
Georgia | 5.1 | |||
Ohio | ||||
Wisconsin | ||||
Iowa | 2.5 | |||
Tennessee | ||||
Nebraska | ||||
South Dakota | 1.0 | |||
Ten other states | ||||
|
| |||
Total | 100.0 | % | ||
|
|
Our insurance subsidiaries employ a number of policies and procedures that we believe enable them to attract, retain and motivate their independent agents. The consistency, competitiveness and stability of the product offerings of our insurance subsidiaries assist them in competing effectively for independent agents with other insurers whose product offerings may fluctuate based upon industry conditions. Our insurance subsidiaries have a competitive profit-sharing plan for their independent agents, consistent with applicable state laws and regulations, under which the independent agents may earn additional commissions based upon the volume of premiums produced and the profitability of the business our insurance subsidiaries receive from that agency.
Our insurance subsidiaries encourage their independent agents to focus on “account selling,” or serving all of a particular insured’s property and casualty insurance needs, which our insurance subsidiaries believe generally results in more favorable loss experience than covering a single risk for an individual insured.
Technology
Donegal Mutual owns the majority of the technology systems our insurance subsidiaries use. The technology systems consist primarily of an integrated central processing computer system, a series of server-based computer networks and various communicationscommunication systems that allow the home office of our insurance subsidiaries and their branch offices to utilize the same systems for the processing of business. Donegal Mutual maintains backup facilities and systems at the office of one of our insurance subsidiaries and through a contract with a leading provider of computer disaster recovery sites and tests these backup facilities and systems on a regular basis. Our insurance subsidiaries bear their proportionate share of information services expenses based on their respective percentage of the total net written premiums of the Donegal Insurance Group.
The business strategy of our insurance subsidiaries depends on the use, development and implementation of integrated technology systems. These systems enable our insurance subsidiaries to provide a high level of service to agents and
-12-
policyholders by processing business in a timely and efficient manner, communicating and sharing data with agents, providing a variety of methods for the payment of premiums and allowing for the accumulation and analysis of information for the management of our insurance subsidiaries.
We believe the availability and use of these technology systems has resulted in improved service to agents and policyholders, increased efficiencies in processing the business of our insurance subsidiaries and lower operating costs. Key components of these integrated technology systems are the agency interface system, the WritePro®, WriteBiz® and WriteFarm® systems, a claims processing system and an imaging system. The agency interface system provides our insurance subsidiaries with a high level of data sharing both to and from agents’ systems and also provides agents with an integrated means of processing new business. The WritePro®, WriteBiz® and WriteFarm® systems are fully automated underwriting and policy issuance systems that provide agents with the ability to generate underwritten quotes and automatically issue policies that meet the underwriting guidelines of our insurance subsidiaries with limited or no intervention by their personnel. The claims processing system allows our insurance subsidiaries to process claims efficiently and in an automated environment. The imaging system eliminates the need to handle paper files, while providing greater access to the same information by a variety of personnel. We believe our technology systems compare favorably to those of many national property and casualty insurance carriers in terms of quality and service levels.
Claims
The management of claims is a critical component of the philosophy of our insurance subsidiaries to achieve underwriting profitability on a consistent basis and is fundamental to the successful operations of our insurance subsidiaries and their dedication to excellent service. Our senior claims management oversees the claims processing units of each of our insurance subsidiaries to assure consistency in the claims settlement process. The field office staff of our insurance subsidiaries receives support from home office technical, litigation, material damage, subrogation and medical audit personnel.
The claims departments of our insurance subsidiaries rigorously manage claims to assure that they settle legitimate claims quickly and fairly and that they identify questionable claims for defense. In the majority of cases, the personnel of our insurance subsidiaries, who have significant experience in the property and casualty insurance industry and know the service philosophy of our insurance subsidiaries, adjust claims. Our insurance subsidiaries provide various means of claims reporting on a 24-hours a day, seven-days a week basis, including toll-free numbers and electronic reporting through our website. Our insurance subsidiaries strive to respond to notifications of claims promptly, generally within the day reported. Our insurance subsidiaries believe that, by responding promptly to claims, they provide quality customer service and minimize the ultimate cost of the claims. Our insurance subsidiaries engage independent adjusters as needed to handle claims in areas in which the volume of claims is not sufficient to justify the hiring of internal claims adjusters by our insurance subsidiaries. Our insurance subsidiaries also employ private adjusters and investigators, structural experts and various outside legal counsel to supplement their internal staff and to assist in the investigation of claims. Our insurance subsidiaries have a special investigative unit staffed by former law enforcement officers that attempts to identify and prevent fraud and abuse and to control questionable claims.
The management of the claims departments of our insurance subsidiaries develops and implements policies and procedures for the establishment of adequate claim reserves. Our insurance subsidiaries employ an actuarial staff that regularly reviews their reserves for incurred but not reported claims. The management and staff of the claims departments resolve policy coverage issues, manage and process reinsurance recoveries and handle salvage and subrogation matters. The litigation and personal injury sections of our insurance subsidiaries manage all claims litigation. Branch office claims above certain thresholds require home office review and settlement authorization. Our insurance subsidiaries provide their claims adjusters reserving and settlement authority based upon their experience and demonstrated abilities. Larger or more complicated claims require consultation and approval of senior department management.
Liabilities for Losses and Loss Expenses
Liabilities for losses and loss expenses are estimates at a given point in time of the amounts an insurer expects to pay with respect to incurred policyholder claims based on facts and circumstances then known. At the time of establishing its estimates, an insurer recognizes that its ultimate liability for losses and loss expenses will exceed or be less than such estimates. Our insurance subsidiaries base their estimates of liabilities for losses and loss expenses on assumptions as to future loss trends and expected claims severity, judicial theories of liability and other factors. However, during the loss adjustment period, our insurance subsidiaries may learn additional facts regarding individual claims, and, consequently, it often becomes necessary for our insurance subsidiaries to refine and adjust their estimates of liability. We reflect any adjustments to our insurance subsidiaries’ liabilities for losses and loss expenses in our operating results in the period in which our insurance subsidiaries record the changes in their estimates.
-13-
Our insurance subsidiaries maintain liabilities for the payment of losses and loss expenses with respect to both reported and unreported claims. Our insurance subsidiaries establish these liabilities for the purpose of covering the ultimate costs of
-13-
settling all losses, including investigation and litigation costs. Our insurance subsidiaries base the amount of their liability for reported losses primarily upon a case-by-case evaluation of the type of risk involved, knowledge of the circumstances surrounding each claim and the insurance policy provisions relating to the type of loss their policyholder incurred. Our insurance subsidiaries determine the amount of their liability for unreported claims and loss expenses on the basis of historical information by line of insurance. Our insurance subsidiaries account for inflation in the reserving function through analysis of costs and trends and reviews of historical reserving results. Our insurance subsidiaries closely monitor their liabilities and recompute them periodically using new information on reported claims and a variety of statistical techniques. Our insurance subsidiaries do not discount their liabilities for losses.
Reserve estimates can change over time because of unexpected changes in assumptions related to our insurance subsidiaries’ external environment and, to a lesser extent, assumptions as to our insurance subsidiaries’ internal operations. For example, our insurance subsidiaries have experienced a decrease in claims frequency on workers’ compensation claims during the past several years while claims severity has gradually increased. These trend changes give rise to greater uncertainty as to the pattern of future loss settlements on workers’ compensation claims. Related uncertainties regarding future trends include the cost of medical technologies and procedures and changes in the utilization of medical procedures. Assumptions related to our insurance subsidiaries’ external environment include the absence of significant changes in tort law and legal decisions that increase liability exposure, consistency in judicial interpretations of insurance coverage and policy provisions and the rate of loss cost inflation. Internal assumptions include consistency in the recording of premium and loss statistics, consistency in the recording of claims, payment and case reserving methodology, accurate measurement of the impact of rate changes and changes in policy provisions, consistency in the quality and characteristics of business written within a given line of business and consistency in reinsurance coverage and the collectability of reinsured losses, among other items. To the extent our insurance subsidiaries determine that underlying factors impacting their assumptions have changed, our insurance subsidiaries attempt to make appropriate adjustments for such changes in their reserves. Accordingly, our insurance subsidiaries’ ultimate liability for unpaid losses and loss expenses will likely differ from the amount recorded at December 31, 2012.2013. For every 1% change in our insurance subsidiaries’ loss and loss expense reserves, net of reinsurance recoverable, the effect on our pre-tax results of operations would be approximately $2.5$2.7 million.
The establishment of appropriate liabilities is an inherently uncertain process, and we can provide no assurance that our insurance subsidiaries’ ultimate liability will not exceed our insurance subsidiaries’ loss and loss expense reserves and have an adverse effect on our results of operations and financial condition. Furthermore, we cannot predict the timing, frequency and extent of adjustments to our insurance subsidiaries’ estimated future liabilities, since the historical conditions and events that serve as a basis for our insurance subsidiaries’ estimates of ultimate claim costs may change. As is the case for substantially all property and casualty insurance companies, our insurance subsidiaries have found it necessary in the past to increase their estimated future liabilities for losses and loss expenses in certain periods, and, in other periods, their estimates have exceeded their actual liabilities. Changes in our insurance subsidiaries’ estimate of their liability for losses and loss expenses generally reflect actual payments and the evaluation of information received since the prior reporting date. Our insurance subsidiaries recognized an increase (decrease) in their liability for losses and loss expenses of prior years of $10.4 million, $7.6 million ($and($168,460) in 2013, 2012 and ($2.9) million in 2012, 2011, and 2010, respectively. Our insurance subsidiaries made no significant changes in their reserving philosophy, key reserving assumptions or claims management personnel, and there have beenmade no significant offsetting changes in estimates that increased or decreased their loss and loss expense reserves in thosethese years. The 2013 development represented 4.1% of the December 31, 2012 net carried reserves and resulted primarily from higher-than-expected severity in the private passenger automobile liability, commercial multiple peril, commercial automobile and workers’ compensation lines of business in accident years prior to 2013. The majority of the 2013 development related to increases in the liability for losses and loss expenses of prior years for Atlantic States and Southern. The 2012 development represented 3.1% of the December 31, 2011 net carried reserves and resulted primarily from higher-than-expected severity in the private passenger automobile liability and workers’ compensation lines of business in accident year 2011.years prior to 2012. The majority of the 2012 development related to increases in the liability for losses and loss expenses of prior years for Atlantic States and Southern. The 2011 development represented an immaterial amountpercentage of ourthe December 31, 2010 net carried reserves. The 2010 development represented 1.6% of our December 31, 2009 net carried reserves and resulted primarily from less-than-expected severity in the private passenger automobile liability and homeowners lines of business in accident years prior to 2009.
Excluding the impact of catastrophic weather events, our insurance subsidiaries have noted stable amounts in the number of claims incurred and slight downward trends in the number of claims outstanding at period ends relative to their premium base in recent years across most of their lines of business. However, the amount of the average claim outstanding has increased gradually over the past several years as the property and casualty insurance industry has experienced increased litigation trends and economic conditions that have extended the estimated length of disabilities and contributed to increased medical loss costs and a general slowing of settlement rates in litigated claims. Our insurance subsidiaries could be required to make further adjustments to their estimates in the future. However, on the basis of our insurance subsidiaries’ internal procedures which analyze, among other things, their prior assumptions, their experience with similar cases and historical trends such as reserving patterns, loss payments, pending levels of unpaid claims and product mix, as well as court decisions, economic conditions and public attitudes, we believe that our insurance subsidiaries have made adequate provision for their liability for losses and loss expenses at December 31, 2012.2013.
-14-
Differences between liabilities reported in our financial statements prepared on a GAAP basis and our insurance subsidiaries’ financial statements prepared on a SAP basis result from anticipating salvage and subrogation recoveries for GAAP but not for SAP. These differences amounted to $13.1 million, $12.0 million $11.2 million and $10.0$11.2 million at December 31, 2013, 2012 and 2011, and 2010, respectively.
-14-
The following table sets forth a reconciliation of the beginning and ending GAAP net liability of our insurance subsidiaries for unpaid losses and loss expenses for the periods indicated:
| Year Ended December 31, | Year Ended December 31, | |||||||||||||||||||||||
| (in thousands) | 2012 | 2011 | 2010 | 2013 | 2012 | 2011 | ||||||||||||||||||
Gross liability for unpaid losses and loss expenses at beginning of year | $ | 442,408 | $ | 383,319 | $ | 263,599 | $ | 458,827 | $ | 442,408 | $ | 383,319 | ||||||||||||
Less reinsurance recoverable | 199,393 | 165,422 | 83,337 | 207,891 | 199,393 | 165,422 | ||||||||||||||||||
|
|
|
|
|
| |||||||||||||||||||
Net liability for unpaid losses and loss expenses at beginning of year | 243,015 | 217,897 | 180,262 | 250,936 | 243,015 | 217,897 | ||||||||||||||||||
|
|
| ||||||||||||||||||||||
Acquisition of MICO | — | — | 26,960 | |||||||||||||||||||||
|
|
|
|
|
| |||||||||||||||||||
Provision for net losses and loss expenses for claims incurred in the current year | 325,276 | 340,671 | 277,194 | 332,770 | 325,276 | 340,671 | ||||||||||||||||||
Change in provision for estimated net losses and loss expenses for claims incurred in prior years | 7,596 | (168 | ) | (2,885 | ) | 10,358 | 7,596 | (168 | ) | |||||||||||||||
|
|
|
|
|
| |||||||||||||||||||
Total incurred | 332,872 | 340,503 | 274,309 | 343,128 | 332,872 | 340,503 | ||||||||||||||||||
|
|
|
|
|
| |||||||||||||||||||
Net losses and loss payments for claims incurred during: | ||||||||||||||||||||||||
The current year | 205,876 | 219,183 | 179,069 | 201,782 | 205,876 | 219,183 | ||||||||||||||||||
Prior years | 119,074 | 96,202 | 84,565 | 126,677 | 119,074 | 96,202 | ||||||||||||||||||
|
|
|
|
|
| |||||||||||||||||||
Total paid | 324,950 | 315,385 | 263,634 | 328,459 | 324,950 | 315,385 | ||||||||||||||||||
|
|
|
|
|
| |||||||||||||||||||
Net liability for unpaid losses and loss expenses at end of year | 250,936 | 243,015 | 217,897 | 265,605 | 250,936 | 243,015 | ||||||||||||||||||
Plus reinsurance recoverable | 207,891 | 199,393 | 165,422 | 230,014 | 207,891 | 199,393 | ||||||||||||||||||
|
|
|
|
|
| |||||||||||||||||||
Gross liability for unpaid losses and loss expenses at end of year | $ | 458,827 | $ | 442,408 | $ | 383,319 | $ | 495,619 | $ | 458,827 | $ | 442,408 | ||||||||||||
|
|
|
|
|
| |||||||||||||||||||
The following table sets forth the development of the liability for net unpaid losses and loss expenses of our insurance subsidiaries from 20022003 to 2012.2013. Loss data in the table includes business Atlantic States received from the underwriting pool.
“Net liability at end of year for unpaid losses and loss expenses” sets forth the estimated liability for net unpaid losses and loss expenses recorded at the balance sheet date for each of the indicated years. This liability represents the estimated amount of net losses and loss expenses for claims arising in the current and all prior years that are unpaid at the balance sheet date, including losses incurred but not reported.
The “Net liability re-estimated as of” portion of the table shows the re-estimated amount of the previously recorded liability based on experience for each succeeding year. The estimate increases or decreases as payments are made and more information becomes known about the severity of the remaining unpaid claims. For example, the 2005 liability has developed a redundancy after seveneight years because we expect the re-estimated net losses and loss expenses to be $21.8 million less than the estimated liability we initially established in 2005 of $173.0 million.
The “Cumulative (excess) deficiency” shows the cumulative excess or deficiency at December 31, 20122013 of the liability estimate shown on the top line of the corresponding column. An excess in liability means that the liability established in prior years exceeded the amount of actual payments and currently re-estimated unpaid liability remaining. A deficiency in liability means that the liability established in prior years was less than the amount of actual payments and currently re-estimated remaining unpaid liability.
The “Cumulative amount of liability paid through” portion of the table shows the cumulative net losses and loss expense payments made in succeeding years for net losses incurred prior to the balance sheet date. For example, the 2005 column indicates that at December 31, 20122013 payments equal to $145.5$146.9 million of the currently re-estimated ultimate liability for net losses and loss expenses of $151.2 million had been made.
Amounts shown in the 2004 column of the table include information for Le Mars and the Peninsula Group for all accident years prior to 2004. Amounts shown in the 2008 column of the table include information for Sheboygan for all accident years prior to 2008. Amounts shown in the 2010 column of the table include information for MICO for the month of December 2010.
-15-
| Year Ended December 31, | Year Ended December 31, | |||||||||||||||||||||||||||||||||||||||||||||||||||||||||||||||||||||||||||||||||||||||
| (in thousands) | 2002 | 2003 | 2004 | 2005 | 2006 | 2007 | 2008 | 2009 | 2010 | 2011 | 2012 | 2003 | 2004 | 2005 | 2006 | 2007 | 2008 | 2009 | 2010 | 2011 | 2012 | 2013 | ||||||||||||||||||||||||||||||||||||||||||||||||||||||||||||||||||
Net liability at end of year for unpaid losses and loss expenses | $ | 131,108 | $ | 138,896 | $ | 171,431 | $ | 173,009 | $ | 163,312 | $ | 150,152 | $ | 161,307 | $ | 180,262 | $ | 217,896 | $ | 243,015 | $ | 250,936 | $ | 138,896 | $ | 171,431 | $ | 173,009 | $ | 163,312 | $ | 150,152 | $ | 161,307 | $ | 180,262 | $ | 217,896 | $ | 243,015 | $ | 250,936 | $ | 265,605 | ||||||||||||||||||||||||||||||||||||||||||||
Net liability re-estimated as of: | ||||||||||||||||||||||||||||||||||||||||||||||||||||||||||||||||||||||||||||||||||||||||
One year later | 130,658 | 136,434 | 162,049 | 159,393 | 153,299 | 152,836 | 171,130 | 177,377 | 217,728 | 250,611 | 136,434 | 162,049 | 159,393 | 153,299 | 152,836 | 171,130 | 177,377 | 217,728 | 250,611 | 261,294 | ||||||||||||||||||||||||||||||||||||||||||||||||||||||||||||||||||||
Two years later | 128,562 | 130,030 | 152,292 | 153,894 | 150,934 | 154,435 | 167,446 | 177,741 | 217,355 | 130,030 | 152,292 | 153,894 | 150,934 | 154,435 | 167,446 | 177,741 | 217,355 | 255,612 | ||||||||||||||||||||||||||||||||||||||||||||||||||||||||||||||||||||||
Three years later | 124,707 | 123,399 | 148,612 | 151,792 | 150,078 | 152,315 | 166,756 | 178,403 | 123,399 | 148,612 | 151,792 | 150,078 | 152,315 | 166,756 | 178,403 | 218,449 | ||||||||||||||||||||||||||||||||||||||||||||||||||||||||||||||||||||||||
Four years later | 119,817 | 120,917 | 147,280 | 150,183 | 148,745 | 151,120 | 166,852 | 120,917 | 147,280 | 150,183 | 148,745 | 151,120 | 166,852 | 179,909 | ||||||||||||||||||||||||||||||||||||||||||||||||||||||||||||||||||||||||||
Five years later | 118,445 | 119,968 | 145,874 | 150,087 | 148,407 | 151,287 | 119,968 | 145,874 | 150,087 | 148,407 | 151,287 | 166,788 | ||||||||||||||||||||||||||||||||||||||||||||||||||||||||||||||||||||||||||||
Six years later | 118,605 | 119,731 | 146,101 | 150,555 | 149,031 | 119,731 | 146,101 | 150,555 | 149,031 | 151,739 | ||||||||||||||||||||||||||||||||||||||||||||||||||||||||||||||||||||||||||||||
Seven years later | 118,905 | 120,425 | 146,739 | 151,161 | 120,425 | 146,739 | 151,161 | 149,487 | ||||||||||||||||||||||||||||||||||||||||||||||||||||||||||||||||||||||||||||||||
Eight years later | 119,635 | 120,768 | 147,597 | 120,768 | 147,597 | 151,243 | ||||||||||||||||||||||||||||||||||||||||||||||||||||||||||||||||||||||||||||||||||
Nine years later | 119,887 | 121,505 | 121,505 | 147,705 | ||||||||||||||||||||||||||||||||||||||||||||||||||||||||||||||||||||||||||||||||||||
Ten years later | 120,812 | 121,631 | ||||||||||||||||||||||||||||||||||||||||||||||||||||||||||||||||||||||||||||||||||||||
Cumulative (excess) deficiency | (10,296 | ) | (17,391 | ) | (23,834 | ) | (21,848 | ) | (14,281 | ) | 1,135 | 5,545 | (1,859 | ) | (541 | ) | 7,596 | (17,265 | ) | (23,726 | ) | (21,766 | ) | (13,825 | ) | 1,587 | 5,481 | (353 | ) | 553 | 12,597 | 10,358 | ||||||||||||||||||||||||||||||||||||||||||||||||||||||||
|
|
|
|
|
|
|
|
|
|
|
|
|
|
|
|
|
|
|
| |||||||||||||||||||||||||||||||||||||||||||||||||||||||||||||||||||||
Cumulative amount of liability paid through: | ||||||||||||||||||||||||||||||||||||||||||||||||||||||||||||||||||||||||||||||||||||||||
One year later | $ | 46,268 | $ | 51,965 | $ | 67,229 | $ | 71,718 | $ | 72,499 | $ | 71,950 | $ | 79,592 | $ | 84,565 | $ | 96,201 | �� | $ | 119,074 | $ | 51,965 | $ | 67,229 | $ | 71,718 | $ | 72,499 | $ | 71,950 | $ | 79,592 | $ | 84,565 | $ | 96,202 | $ | 119,074 | $ | 126,677 | |||||||||||||||||||||||||||||||||||||||||||||||
Two years later | 74,693 | 81,183 | 102,658 | 107,599 | 104,890 | 105,576 | 116,035 | 123,204 | 148,140 | 81,183 | 102,658 | 107,599 | 104,890 | 105,576 | 116,035 | 123,204 | 148,140 | 181,288 | ||||||||||||||||||||||||||||||||||||||||||||||||||||||||||||||||||||||
Three years later | 93,288 | 99,910 | 123,236 | 125,926 | 121,711 | 124,659 | 136,837 | 147,165 | 99,910 | 123,236 | 125,926 | 121,711 | 124,659 | 136,837 | 147,165 | 178,073 | ||||||||||||||||||||||||||||||||||||||||||||||||||||||||||||||||||||||||
Four years later | 105,143 | 109,964 | 133,844 | 133,805 | 132,698 | 135,392 | 148,243 | 109,964 | 133,844 | 133,805 | 132,698 | 135,392 | 148,243 | 161,363 | ||||||||||||||||||||||||||||||||||||||||||||||||||||||||||||||||||||||||||
Five years later | 111,523 | 113,684 | 136,377 | 139,935 | 138,878 | 140,280 | 113,684 | 136,377 | 139,935 | 138,878 | 140,280 | 155,331 | ||||||||||||||||||||||||||||||||||||||||||||||||||||||||||||||||||||||||||||
Six years later | 114,145 | 114,499 | 139,847 | 143,309 | 141,752 | 114,499 | 139,847 | 143,309 | 141,752 | 143,778 | ||||||||||||||||||||||||||||||||||||||||||||||||||||||||||||||||||||||||||||||
Seven years later | 114,641 | 116,727 | 142,016 | 145,492 | 116,727 | 142,016 | 145,492 | 143,784 | ||||||||||||||||||||||||||||||||||||||||||||||||||||||||||||||||||||||||||||||||
Eight years later | 116,663 | 118,169 | 143,894 | 118,169 | 143,894 | 146,894 | ||||||||||||||||||||||||||||||||||||||||||||||||||||||||||||||||||||||||||||||||||
Nine years later | 117,998 | 119,123 | 119,123 | 144,565 | ||||||||||||||||||||||||||||||||||||||||||||||||||||||||||||||||||||||||||||||||||||
Ten years later | 118,843 | 119,509 | ||||||||||||||||||||||||||||||||||||||||||||||||||||||||||||||||||||||||||||||||||||||
| Year Ended December 31, | Year Ended December 31, | |||||||||||||||||||||||||||||||||||||||||||||||||||||||||||||||||||||||
| 2004 | 2005 | 2006 | 2007 | 2008 | 2009 | 2010 | 2011 | 2012 | 2005 | 2006 | 2007 | 2008 | 2009 | 2010 | 2011 | 2012 | 2013 | |||||||||||||||||||||||||||||||||||||||||||||||||||||||
| (in thousands) | (in thousands) | |||||||||||||||||||||||||||||||||||||||||||||||||||||||||||||||||||||||
Gross liability at end of year | $ | 267,190 | $ | 265,730 | $ | 259,022 | $ | 226,432 | $ | 239,809 | $ | 263,599 | $ | 383,317 | $ | 442,408 | $ | 458,827 | $ | 265,730 | $ | 259,022 | $ | 226,432 | $ | 239,809 | $ | 263,599 | $ | 383,317 | $ | 442,408 | $ | 458,827 | $ | 495,619 | ||||||||||||||||||||||||||||||||||||
Reinsurance recoverable | 95,759 | 92,721 | 95,710 | 76,280 | 78,502 | 83,337 | 165,421 | 199,393 | 207,891 | 92,721 | 95,710 | 76,280 | 78,502 | 83,337 | 165,421 | 199,393 | 207,891 | 230,014 | ||||||||||||||||||||||||||||||||||||||||||||||||||||||
Net liability at end of year | 171,431 | 173,009 | 163,312 | 150,152 | 161,307 | 180,262 | 217,896 | 243,015 | 250,936 | 173,009 | 163,312 | 150,152 | 161,307 | 180,262 | 217,896 | 243,015 | 250,936 | 265,605 | ||||||||||||||||||||||||||||||||||||||||||||||||||||||
Gross re-estimated liability | 242,342 | 242,556 | 239,216 | 228,764 | 249,455 | 198,898 | 359,452 | 448,807 | 243,402 | 241,395 | 232,173 | 253,815 | 207,525 | 370,297 | 473,949 | 488,557 | ||||||||||||||||||||||||||||||||||||||||||||||||||||||||
re-estimated recoverable | 94,745 | 91,395 | 90,185 | 77,477 | 82,603 | 20,495 | 142,097 | 198,196 | 92,159 | 91,908 | 80,434 | 87,027 | 27,616 | 151,848 | 218,337 | 227,263 | ||||||||||||||||||||||||||||||||||||||||||||||||||||||||
Net re-estimated liability | 147,597 | 151,161 | 149,031 | 151,287 | 166,852 | 178,403 | 217,355 | 250,611 | 151,243 | 149,487 | 151,739 | 166,788 | 179,909 | 218,449 | 255,612 | 261,294 | ||||||||||||||||||||||||||||||||||||||||||||||||||||||||
Gross cumulative deficiency (excess) | (24,848 | ) | (23,174 | ) | (19,806 | ) | 2,332 | 9,646 | (64,701 | ) | (23,865 | ) | 6,400 | (22,328 | ) | (17,627 | ) | 5,741 | 14,006 | (56,074 | ) | (13,020 | ) | 31,542 | 29,730 | |||||||||||||||||||||||||||||||||||||||||||||||
Third-Party Reinsurance
Our insurance subsidiaries and Donegal Mutual purchase certain third-party reinsurance on a combined basis. Le Mars, the Peninsula, Group, Sheboygan and MICO also have separate reinsurance programs that provide certain coverage that is commensurate with their relative size and exposures. Our insurance subsidiaries use several different reinsurers, all of which, consistent with the requirements of our insurance subsidiaries and Donegal Mutual, have an A.M. Best rating of A- (Excellent) or better or, with respect to foreign reinsurers, have a financial condition that, in the opinion of our management, is equivalent to a company with at least an A- (Excellent) rating from A.M. Best.
-16-
The external reinsurance our insurance subsidiaries and Donegal Mutual purchase includes:
“excess of loss reinsurance,” under which their losses are automatically reinsured, through a series of contracts, over a set retention (generally $1,000,000 for 2013 and 2012 and $750,000 for 2011); and
“catastrophiccatastrophe reinsurance,” under which theyDonegal Mutual, Atlantic States and Southern recover, through a series of contracts, 90% toreinsurance agreements, 100% of an accumulation of many losses resulting from a single event, including natural disasters, over a set retention (generally $5.0 million) and after exceeding an annual aggregate deductible ($5.0 million forin 2013 and $0 in 2012 and 2011).
The amount of coverage each of these types of reinsurance provides depends upon the amount, nature, size and location of the risk being reinsured.
For property insurance, our insurance subsidiaries have excess of loss treaties that provide for coverage of $4.0 million per loss over a set retention of $1.0 million. For liability insurance, our insurance subsidiaries have excess of loss treaties that provide for coverage of $39.0$49.0 million per occurrence over a set retention of $1.0 million. For workers’ compensation insurance, our insurance subsidiaries have excess of loss treaties that provide for coverage of $9.0 million on any one life over a set retention of $1.0 million.
Our insurance subsidiaries and Donegal Mutual maintain external property catastrophe coverage through a series of layered treaties up to aggregate losses of $145.0 million for any single event over their respective set retentions. Our insurance subsidiaries and Donegal Mutual participated in 10% of the first $10.0 million of an accumulation of losses from any single event over $5.0 million in 2012.
Our insurance subsidiaries and Donegal Mutual also purchase facultative reinsurance to cover exposures from property and casualty losses that exceed the limits provided by their respective treaty reinsurance.
MICO maintains a quota-share reinsurance agreement with third-party reinsurers to reduce its net exposures. Effective from December 1, 2010 to December 31, 2011, the quota-share reinsurance percentage was 50%. Effective January 1, 2012, MICO reduced the quota-share reinsurance percentage from 50% to 40%. Effective January 1, 2013, MICO reduced the quota-share reinsurance percentage from 40% to 30%. Effective January 1, 2014, MICO reduced the quota-share reinsurance percentage from 30% to 20%.
Investments
At December 31, 2012, 99.0%2013, 100% of all debt securities our insurance subsidiaries held had an investment-grade rating. The investment portfolios of our insurance subsidiaries did not contain any mortgage loans or any non-performing assets at December 31, 2012.2013.
The following table shows the composition of the debt securities (at carrying value) in the investment portfolios of our insurance subsidiaries, excluding short-term investments, by rating at December 31, 2012:2013:
| (dollars in thousands) | December 31, 2012 | December 31, 2013 | ||||||||||||||
Rating(1) | Amount | Percent | Amount | Percent | ||||||||||||
U.S. Treasury and U.S. agency securities(2) | $ | 201,358 | 27.3 | % | $ | 202,494 | 31.4 | % | ||||||||
Aaa or AAA | 53,203 | 7.2 | 35,814 | 5.6 | ||||||||||||
Aa or AA | 379,372 | 51.5 | 255,117 | 39.6 | ||||||||||||
A | 89,338 | 12.1 | 140,949 | 21.9 | �� | |||||||||||
BBB | 13,339 | 1.9 | 9,648 | 1.5 | ||||||||||||
|
|
|
| |||||||||||||
Total | $ | 736,610 | 100.0 | % | $ | 644,022 | 100.0 | % | ||||||||
|
|
|
| |||||||||||||
| (1) | Ratings assigned by Moody’s Investors Services, Inc. or Standard & Poor’s Corporation. |
| (2) | Includes |
Our insurance subsidiaries invest in both taxable and tax-exempt securities as part of their strategy to maximize after-tax income. This strategy considers, among other factors, the alternative minimum tax. Tax-exempt securities made up approximately 59.8%59.0%, 63.8%59.8% and 67.2%63.8% of the debt securities in the combined investment portfolios of our insurance subsidiaries at December 31, 2013, 2012 2011 and 2010,2011, respectively.
-17-
The following table shows the classification of our investments and the investments of our insurance subsidiaries (at carrying value) at December 31, 2013, 2012 and 2011 and 2010:(at carrying value):
| December 31, | December 31, | |||||||||||||||||||||||||||||||||||||||||||||||
| 2012 | 2011 | 2010 | 2013 | 2012 | 2011 | |||||||||||||||||||||||||||||||||||||||||||
| (dollars in thousands) | Amount | Percent of Total | Amount | Percent of Total | Amount | Percent of Total | Amount | Percent of Total | Amount | Percent of Total | Amount | Percent of Total | ||||||||||||||||||||||||||||||||||||
Fixed maturities(1): | ||||||||||||||||||||||||||||||||||||||||||||||||
Held to maturity: | ||||||||||||||||||||||||||||||||||||||||||||||||
U.S. Treasury securities and obligations of U.S. government corporations and agencies | $ | 1,000 | 0.1 | % | $ | 1,000 | 0.1 | % | $ | 1,000 | 0.1 | % | $ | 47,946 | 6.1 | % | $ | 1,000 | 0.1 | % | $ | 1,000 | 0.1 | % | ||||||||||||||||||||||||
Obligations of states and political subdivisions | 40,909 | 5.1 | 56,966 | 7.3 | 59,852 | 8.2 | 108,435 | 13.7 | 40,909 | 5.1 | 56,966 | 7.3 | ||||||||||||||||||||||||||||||||||||
Corporate securities | — | — | 250 | — | 3,247 | 0.5 | 14,875 | 1.9 | — | — | 250 | — | ||||||||||||||||||||||||||||||||||||
Residential mortgage-backed securities | 191 | — | 274 | — | 667 | 0.1 | ||||||||||||||||||||||||||||||||||||||||||
Mortgage-backed securities | 69,114 | 8.7 | 191 | — | 274 | — | ||||||||||||||||||||||||||||||||||||||||||
|
|
|
|
|
|
|
|
|
|
|
| |||||||||||||||||||||||||||||||||||||
Total held to maturity | 42,100 | 5.2 | 58,490 | 7.4 | 64,766 | 8.9 | 240,370 | 30.4 | 42,100 | 5.2 | 58,490 | 7.4 | ||||||||||||||||||||||||||||||||||||
|
|
|
|
|
|
|
|
|
|
|
| |||||||||||||||||||||||||||||||||||||
Available for sale: | ||||||||||||||||||||||||||||||||||||||||||||||||
U.S. Treasury securities and obligations of U.S. government corporations and agencies | 71,311 | 8.8 | 60,978 | 7.8 | 57,316 | 7.9 | 14,334 | 1.8 | 71,311 | 8.8 | 60,978 | 7.8 | ||||||||||||||||||||||||||||||||||||
Obligations of states and political subdivisions | 416,987 | 51.7 | 398,877 | 50.8 | 389,629 | 53.5 | 277,547 | 35.1 | 416,987 | 51.7 | 398,877 | 50.8 | ||||||||||||||||||||||||||||||||||||
Corporate securities | 77,356 | 9.6 | 64,113 | 8.2 | 67,095 | 9.2 | 40,672 | 5.1 | 77,356 | 9.6 | 64,113 | 8.2 | ||||||||||||||||||||||||||||||||||||
Residential mortgage-backed securities | 128,856 | 16.0 | 122,630 | 15.6 | 89,807 | 12.3 | ||||||||||||||||||||||||||||||||||||||||||
Mortgage-backed securities | 71,099 | 8.9 | 128,856 | 16.0 | 122,630 | 15.6 | ||||||||||||||||||||||||||||||||||||||||||
|
|
|
|
|
|
|
|
|
|
|
| |||||||||||||||||||||||||||||||||||||
Total available for sale | 694,510 | 86.1 | 646,598 | 82.4 | 603,847 | 82.9 | 403,652 | 50.9 | 694,510 | 86.1 | 646,598 | 82.4 | ||||||||||||||||||||||||||||||||||||
|
|
|
|
|
|
|
|
|
|
|
| |||||||||||||||||||||||||||||||||||||
Total fixed maturities | 736,610 | 91.3 | 705,088 | 89.8 | 668,613 | 91.8 | 644,022 | 81.3 | 736,610 | 91.3 | 705,088 | 89.8 | ||||||||||||||||||||||||||||||||||||
Equity securities(2) | 8,757 | 1.1 | 7,438 | 1.0 | 10,161 | 1.4 | 12,423 | 1.6 | 8,757 | 1.1 | 7,438 | 1.0 | ||||||||||||||||||||||||||||||||||||
Investments in affiliates(3) | 37,236 | 4.6 | 32,322 | 4.1 | 8,992 | 1.2 | 35,685 | 4.5 | 37,236 | 4.6 | 32,322 | 4.1 | ||||||||||||||||||||||||||||||||||||
Short-term investments(4) | 23,826 | 3.0 | 40,461 | 5.1 | 40,776 | 5.6 | 99,678 | 12.6 | 23,826 | 3.0 | 40,461 | 5.1 | ||||||||||||||||||||||||||||||||||||
|
|
|
|
|
|
|
|
|
|
|
| |||||||||||||||||||||||||||||||||||||
Total investments | $ | 806,429 | 100.0 | % | $ | 785,309 | 100.0 | % | $ | 728,542 | 100.0 | % | $ | 791,808 | 100.0 | % | $ | 806,429 | 100.0 | % | $ | 785,309 | 100.0 | % | ||||||||||||||||||||||||
|
|
|
|
|
|
|
|
|
|
|
| |||||||||||||||||||||||||||||||||||||
| (1) | We refer to Notes 1 and |
| (2) | We value equity securities at fair value. Total cost of equity securities was $12.2 million at December 31, 2013, $8.7 million at December 31, 2012 and $7.2 million at December 31, |
| (3) | We value investments in affiliates at cost, adjusted for our share of earnings and losses of our affiliates as well as changes in equity of our affiliates due to unrealized gains and losses. |
| (4) | We value short-term investments at cost, which approximates fair value. |
-18-
The following table sets forth the maturities (at carrying value) in the fixed maturity and short-term investment portfoliosportfolio of our insurance subsidiaries at December 31, 2013, 2012 2011 and 2010:2011:
| December 31, | December 31, | |||||||||||||||||||||||||||||||||||||||||||||||
| 2012 | 2011 | 2010 | 2013 | 2012 | 2011 | |||||||||||||||||||||||||||||||||||||||||||
| (dollars in thousands) | Amount | Percent of Total | Amount | Percent of Total | Amount | Percent of Total | Amount | Percent of Total | Amount | Percent of Total | Amount | Percent of Total | ||||||||||||||||||||||||||||||||||||
Due in(1): | ||||||||||||||||||||||||||||||||||||||||||||||||
One year or less | $ | 10,004 | 1.4 | % | $ | 16,181 | 2.3 | % | $ | 12,968 | 1.9 | % | $ | 8,257 | 1.3 | % | $ | 10,004 | 1.4 | % | $ | 16,181 | 2.3 | % | ||||||||||||||||||||||||
Over one year through three years | 31,176 | 4.2 | 27,912 | 4.0 | 54,028 | 8.1 | 22,424 | 3.5 | 31,176 | 4.2 | 27,912 | 4.0 | ||||||||||||||||||||||||||||||||||||
Over three years through five years | 64,839 | 8.8 | 71,820 | 10.2 | 66,720 | 10.0 | 40,234 | 6.2 | 64,839 | 8.8 | 71,820 | 10.2 | ||||||||||||||||||||||||||||||||||||
Over five years through ten years | 201,953 | 27.4 | 188,523 | 26.7 | 201,523 | 30.1 | 190,440 | 29.6 | 201,953 | 27.4 | 188,523 | 26.7 | ||||||||||||||||||||||||||||||||||||
Over ten years through fifteen years | 191,179 | 26.0 | 172,956 | 24.5 | 147,512 | 22.1 | 166,186 | 25.8 | 191,179 | 26.0 | 172,956 | 24.5 | ||||||||||||||||||||||||||||||||||||
Over fifteen years | 108,412 | 14.7 | 104,792 | 14.9 | 95,389 | 14.3 | 76,267 | 11.8 | 108,412 | 14.7 | 104,792 | 14.9 | ||||||||||||||||||||||||||||||||||||
Residential mortgage-backed securities | 129,047 | 17.5 | 122,904 | 17.4 | 90,473 | 13.5 | ||||||||||||||||||||||||||||||||||||||||||
Mortgage-backed securities | 140,214 | 21.8 | 129,047 | 17.5 | 122,904 | 17.4 | ||||||||||||||||||||||||||||||||||||||||||
|
|
|
|
|
|
|
|
|
|
|
| |||||||||||||||||||||||||||||||||||||
| $ | 736,610 | 100.0 | % | $ | 705,088 | 100.0 | % | $ | 668,613 | 100.0 | % | $ | 644,022 | 100.0 | % | $ | 736,610 | 100.0 | % | $ | 705,088 | 100.0 | % | |||||||||||||||||||||||||
|
|
|
|
|
|
|
|
|
|
|
| |||||||||||||||||||||||||||||||||||||
| (1) | Based on stated maturity dates with no prepayment assumptions. Actual maturities will differ because borrowers may have the right to call or prepay obligations with or without call or prepayment penalties. |
As shown above, our insurance subsidiaries held investments in residential mortgage-backed securities having a carrying value of $129.0$140.2 million at December 31, 2012.2013. The mortgage-backed securities consist primarily of investments in governmental agency balloon pools with stated maturities between one and 24 years. The stated maturities of these investments limit the exposure of our insurance subsidiaries to extension risk in the event that interest rates rise and prepayments decline. Our insurance subsidiaries perform an analysis of the underlying loans when evaluating a residential mortgage-backed security for purchase, and they select those securities that they believe will provide a return that properly reflects the prepayment risk associated with the underlying loans.
The following table sets forth the investment results of our insurance subsidiaries for the years ended December 31, 2013, 2012 2011 and 2010:2011:
| Year Ended December 31, | Year Ended December 31, | |||||||||||||||||||||||
| (dollars in thousands) | 2012 | 2011 | 2010 | 2013 | 2012 | 2011 | ||||||||||||||||||
Invested assets(1) | $ | 795,869 | $ | 756,925 | $ | 697,689 | $ | 799,119 | $ | 795,869 | $ | 756,925 | ||||||||||||
Investment income(2) | 20,169 | 20,858 | 19,950 | 18,795 | 20,169 | 20,858 | ||||||||||||||||||
Average yield | 2.5 | % | 2.8 | % | 2.9 | % | 2.4 | % | 2.5 | % | 2.8 | % | ||||||||||||
Average tax-equivalent yield | 3.5 | 3.8 | 4.0 | 3.3 | 3.5 | 3.8 | ||||||||||||||||||
| (1) | Average of the aggregate invested amounts at the beginning and end of the period. |
| (2) | Investment income is net of investment expenses and does not include realized investment gains or losses or provision for income taxes. |
A.M. Best Rating
Donegal Mutual and our insurance subsidiaries have an A.M. Best rating of A (Excellent), based upon the respective current financial condition and historical statutory results of operations of Donegal Mutual and our insurance subsidiaries. We believe that the A.M. Best rating of Donegal Mutual and our insurance subsidiaries is an important factor in their marketing of the products to their agents and customers. A.M. Best’s ratings are industry ratings based on a comparative analysis of the financial condition and operating performance of insurance companies. A.M. Best’s classifications are A++ and A+ (Superior), A and A- (Excellent), B++ and B+ (Good), B and B- (Fair), C++ and C+ (Marginal), C and C- (Weak), D (Poor) and E (Under Regulatory Supervision), F (Liquidation) and S (Suspended). A.M. Best bases its ratings upon factors relevant to the payment of claims of policyholders and are not directed toward the protection of investors in insurance companies. According to A.M. Best, the “Excellent” rating that the Donegal Insurance Group maintains is assigned to those companies that, in A.M. Best’s opinion, have an excellent ability to meet their ongoing obligations to policyholders.
-19-
Regulation
The supervision and regulation of insurance companies consists primarily of the laws and regulations of the various states in which the insurance companies transact business, with the primary regulatory authority being the insurance regulatory authorities in the state of domicile of the insurance company. Such supervision and regulation relate to numerous aspects of an insurance company’s business and financial condition. The primary purpose of such supervision and regulation is the protection of policyholders. The authority of the state insurance departments includes the establishment of standards of solvency that insurers must meet and maintain, the licensing of insurers and insurance agents to do business, the nature of, and limitations on, investments, premium rates for property and casualty insurance, the provisions that insurers must make for current losses and future liabilities, the deposit of securities for the benefit of policyholders, the approval of policy forms, notice requirements for the cancellation of policies and the approval of certain changes in control. State insurance departments also conduct periodic examinations of the affairs of insurance companies and require the filing of annual and other reports relating to the financial condition of insurance companies.
In addition to state-imposed insurance laws and regulations, the National Association of Insurance Commissioners, or the NAIC, has established a risk-based capital system, or RBC, for assessing the adequacy of statutory capital and surplus that augments the states’ current fixed dollar minimum capital requirements for insurance companies. At December 31, 2012,2013, our insurance subsidiaries and Donegal Mutual each exceeded the minimum levels of statutory capital the RBC rules require by a substantial margin.
Generally, every state has guaranty fund laws under which insurers licensed to do business in that state can be assessed on the basis of premiums written by the insurer in that state in order to fund policyholder liabilities of insolvent insurance companies. Under these laws in general, an insurer is subject to assessment, depending upon its market share of a given line of business, to assist in the payment of policyholder claims against insolvent insurers. Our insurance subsidiaries and Donegal Mutual have made accruals for their portion of assessments related to such insolvencies based upon the most current information furnished by the guaranty associations.
We are part of an insurance holding company system of which Donegal Mutual is the ultimate controlling person. All of the states in which our insurance companies and Donegal Mutual maintain a domicile have legislation that regulates insurance holding company systems. Each insurance company in the insurance holding company system must register with the insurance supervisory agency of its state of domicile and furnish information concerning the operations of companies within the insurance holding company system that may materially affect the operations, management or financial condition of the insurers within the system. Pursuant to these laws, the respective insurance departments in which our subsidiaries and Donegal Mutual maintain a domicile may examine our insurance subsidiaries or Donegal Mutual at any time, require disclosure of material transactions by the holding company with another member of the insurance holding company system and require prior notice or prior approval of certain transactions, such as “extraordinary dividends” from the insurance subsidiaries to the holding company. We have insurance subsidiaries domiciled in Iowa, Maryland, Michigan, Pennsylvania, Virginia and Wisconsin.
The Pennsylvania Insurance Holding Companies Act, which generally applies to Donegal Mutual, us and our insurance subsidiaries, requires that all transactions within an insurance holding company system to which an insurer is a party must be fair and reasonable and that any charges or fees for services performed must be reasonable. Any management agreement, service agreement, cost sharing arrangement and material reinsurance agreement must be filed with the Pennsylvania Insurance Department, or the Department, and is subject to the Department’s review. We have filed the pooling agreement between Donegal Mutual and Atlantic States that established the underwriting pool and all material reinsurance agreements between Donegal Mutual and our insurance subsidiaries with the Department.
Approval of the applicable insurance commissioner is also required prior to consummation of transactions affecting the control of an insurer. In virtually all states, including Iowa, Maryland, Michigan, Pennsylvania, Virginia and Wisconsin, where our insurance subsidiaries are domiciled, the acquisition of 10% or more of the outstanding capital stock of an insurer or its holding company or the intent to acquire such an interest creates a rebuttable presumption of a change in control. Pursuant to an order issued in April 2003, the Department approved Donegal Mutual’s ownership of up to 70% of our outstanding Class A common stock and up to 100% of our outstanding Class B common stock.
Our insurance subsidiaries have the legal obligation under state insurance laws to participate in involuntary insurance programs for automobile insurance, as well as other property and casualty insurance lines, in the states in which they conduct business. These programs include joint underwriting associations, assigned risk plans, fair access to insurance requirements plans, reinsurance facilities, windstorm plans and tornado plans. Legislation establishing these programs requires all companies that write lines covered by these programs to provide coverage, either directly or through reinsurance, for insureds who are unable to obtain insurance in the voluntary market. The legislation creating these programs usually allocates a pro rata portion of risks attributable to such insureds to each company on the basis of the direct premiums it has written in that state or the number of automobiles it insures in that state. Generally, state law requires participation in these programs as a condition to obtaining a certificate of authority. Our loss ratio on insurance we write under these involuntary programs has traditionally been significantly greater than our loss ratio on insurance we voluntarily write in those states.
-20-
Regulatory requirements, including RBC requirements, may impact our insurance subsidiaries’ ability to pay dividends. The amount of statutory capital and surplus necessary for our insurance subsidiaries to satisfy regulatory requirements, including RBC requirements, was not significant in relation to our insurance subsidiaries’ statutory capital and surplus at December 31, 2012.2013. Generally, the maximum amount that an insurance subsidiary may pay to us as ordinary dividends during any year after notice to, but without prior approval of, the insurance commissioner of its domiciliary state is limited to a stated percentage of that subsidiary’s statutory capital and surplus at December 31 of the preceding fiscal year or the net income of that subsidiary for its preceding fiscal year. Our insurance subsidiaries paid dividends to us of $12.5 million, $7.0 million and $16.0 million in 2013, 2012 and $12.0 million in 2012, 2011, and 2010, respectively. At December 31, 2012,2013, the amount of dividends our insurance subsidiaries could pay to us during 2013,2014, without the prior approval of their respective domiciliary insurance commissioners, is shown in the following table.
Name of Insurance Subsidiary | Ordinary Dividend Amount | Ordinary Dividend Amount | ||||||
Atlantic States | $ | 18,046,566 | $ | 18,660,666 | ||||
Southern | — | 4,195,635 | ||||||
Le Mars | 2,680,314 | 2,762,791 | ||||||
Peninsula Group | 4,247,109 | |||||||
Peninsula | 4,189,149 | |||||||
Sheboygan | — | 1,086,411 | ||||||
MICO | 4,244,320 | 4,159,470 | ||||||
|
| |||||||
Total | $ | 29,218,309 | $ | 35,054,122 | ||||
|
| |||||||
Donegal Mutual Insurance Company
Donegal Mutual organized as a mutual fire insurance company in Pennsylvania in 1889. At December 31, 2012,2013, Donegal Mutual had admitted assets of $350.7$383.8 million and policyholders’ surplus of $187.7$204.5 million. At December 31, 2012,2013, Donegal Mutual had total liabilities of $162.9$179.4 million, including reserves for net losses and loss expenses of $46.2$48.7 million and unearned premiums of $39.3$44.2 million. Donegal Mutual’s investment portfolio of $215.7$228.9 million at December 31, 20122013 consisted primarily of investment-grade bonds of $16.9$16.7 million, its investment in DFSC’s common stock and its investment in our common stock. At December 31, 2012,2013, Donegal Mutual owned 7,755,953 shares, or approximately 39%37%, of our Class A common stock, which Donegal Mutual carried on its books at $98.6$101.0 million, and 4,217,0394,235,539 shares, or approximately 76%, of our Class B common stock, which Donegal Mutual carried on its books at $53.6$55.1 million. We present Donegal Mutual’s financial information in accordance with SAP as required by the NAIC Accounting Practices and Procedures Manual.Manual requires. Donegal Mutual does not, nor is it required to, prepare financial statements in accordance with GAAP.
Donegal Financial Services Corporation
In 2000, we and Donegal Mutual formed DFSC as a unitary thrift holding company and its wholly owned subsidiary, Province Bank FSB, as a federal savings bank. In May 2011, DFSC merged with Union National Financial Corporation, or UNNF, with DFSC as the surviving company in the merger. Under the merger agreement, Province Bank FSB and Union National Community Bank, which UNNF owned, also merged to form UCB. UCB is a federalstate savings bank with 13 branch offices in Lancaster County, Pennsylvania, and approximately $510.0$512.8 million in assets at December 31, 2012.2013.
Because Donegal Mutual and we together own all of the outstanding capital stock of DFSC, the Board of Governors of the Federal Reserve System, or the FRB, regulates Donegal Mutual, DFSC and us as grandfathered savings and loan holding companies. As a result, Donegal Mutual, DFSC and we are subject to regulation by the FRB under the holding company provisions of the federal Home Owners’ Loan Act, or HOLA. However, if any of Donegal Mutual, DFSC or we were to lose this grandfathered status, they or we would become a bank holding company regulated by the FRB under the Bank Holding Company Act. UCB, as a federally chartered and insuredstate-chartered stock savings bank, is subject to regulation and supervision by the OfficePennsylvania Department of the Comptroller of the CurrencyBanking and by the Federal Deposit Insurance Corporation. The primary purpose of the federal statutory and regulatory supervision of financial institutions is to protect depositors, the financial institutions and the financial system as a whole rather than the stockholders of financial institutions or their holding companies. UCB is currently in the process of convertingconverted from a federally-chartered stock savings bank to a Pennsylvania-chartered stock savings bank.bank during 2013.
-21-
Sections 23A and 23B of the Federal Reserve Act impose quantitative and qualitative restrictions on transactions between a savings association and its “affiliates.” Affiliates of a savings association include, among other entities, the savings
-21-
association’s holding company and non-banking companies under common control with the savings association such as Donegal Mutual and us. These restrictions on transactions with affiliates apply to transactions between DFSC and UCB, on the one hand, and Donegal Mutual and us and our insurance subsidiaries, on the other hand. These restrictions also apply to transactions among DFSC, UCB and Donegal Mutual. Because DFSC directly controls UCB and Donegal Mutual and we indirectly control UCB, DFSC, Donegal Mutual and we are subject to the Change in Bank Control Act.
Cautionary Statement Regarding Forward-Looking Statements
This Form 10-K Annual Report and the documents we incorporate by reference in this Form 10-K Annual Report contain “forward-looking statements” within the meaning of the Private Securities Litigation Reform Act of 1995. These forward-looking statements include certain discussions relating to underwriting, premium and investment income volumes, business strategies, reserves, profitability and business relationships and our other business activities during 20122013 and beyond. In some cases, you can identify forward-looking statements by terms such as “may,” “will,” “should,” “could,” “would,” “expect,” “plan,” “intend,” “anticipate,” “believe,” “estimate,” “objective,” “project,” “predict,” “potential,” “goal” and similar expressions. These forward-looking statements reflect our current views about future events, our current assumptions and are subject to known and unknown risks and uncertainties that may cause our results, performance or achievements to differ materially from those we anticipate or imply by our forward-looking statements. We cannot control or predict many of the factors that could determine our future financial conditions or results of operations. Such factors may include those we describe under “Risk Factors.” The forward-looking statements contained in this annual report reflect our views and assumptions only as of the date of this Form 10-K Report. Except as required by law, we do not intend to update, and we assume no responsibility for updating, any forward-looking statements we have made. We qualify all of our forward-looking statements by these cautionary statements.
| Item 1A. | Risk Factors. |
Risk Factors
Risks Relating to Us and Our Business
Donegal Mutual is our controlling stockholder. Donegal Mutual and its directors and executive officers have potential conflicts of interest between the best interests of our stockholders and the best interests of the policyholders of Donegal Mutual.
Donegal Mutual controls the election of all of the members of our board of directors. Six of the 11 members of our board of directors are also directors of Donegal Mutual. Donegal Mutual and we share the same executive officers. These common directors and executive officers have a fiduciary duty to our stockholders and also have a fiduciary duty to the policyholders of Donegal Mutual. Among the potential conflicts of interest that could arise from these separate fiduciary duties are the following:
We and Donegal Mutual periodically review the percentage participation of Atlantic States and Donegal Mutual in the underwriting pool that Donegal Mutual and Atlantic States have maintained since 1986;
Our insurance subsidiaries and Donegal Mutual annually review and then establish the terms of certain reinsurance agreements between them with the objective, over the long-term, of having an approximately equal balance between payments and recoveries;
We and Donegal Mutual periodically allocate certain shared expenses among ourselves and our insurance subsidiaries in accordance with various inter-company expense-sharing agreements; and
Our insurance subsidiaries may enter into other transactions or contractual relationships with Donegal Mutual, including, for example, our purchases from time to time from Donegal Mutual of the surplus note of a mutual insurance company that will convert into a stock insurance company and ultimately become one of our wholly owned subsidiaries.
-22-
Donegal Mutual has sufficient voting power to determine the outcome of all matters submitted to our stockholders for approval.
Each share of our Class A common stock has one-tenth of a vote per share and generally votes as a single class with our Class B common stock. Our Class B common stock which has one vote per share, except for matters that would uniquely affect the rights of holders of our Class A common stock or our Class B common stock.share. Donegal Mutual has the right to vote approximately 66%65% of the aggregate voting power of our Class A common stock and our Class B common stock and has sufficient voting control to:
elect all of the members of our board of directors, who determine our management and policies; and
control the outcome of any corporate transaction or other matter submitted to a vote of our stockholders for approval, including mergers or other acquisition proposals and the sale of all or substantially all of our assets, in each case regardless of how all of our other stockholders other than Donegal Mutual vote their shares.
The interests of Donegal Mutual in maintaining this greater than majoritygreater-than-majority control of us may have an adverse effect on the price of our Class A common stock and the price of our Class B common stock because of the absence of any potential “takeover” premium and may, therefore, be inconsistent with the interests of our stockholders other than Donegal Mutual.
Donegal Mutual’s majority voting control, certain provisions of our certificate of incorporation and by-laws and certain provisions of Delaware law make it remote that anyone could acquire actual control of us unless Donegal Mutual were in favor of the acquisition of actual control.
Donegal Mutual’s majority voting control, certain anti-takeover provisions in our certificate of incorporation and by-laws and certain provisions of the Delaware General Corporation Law, or the DGCL, could delay or prevent the removal of members of our board of directors and could make a merger, tender offer or proxy contest involving us more expensive as well as unlikely to succeed, even if such events were in the best interests of our stockholders other than Donegal Mutual. These factors could also discourage a third party from attempting to acquire actual control of us. In particular, our certificate of incorporation and by-laws include the following anti-takeover provisions:
our board of directors is classified into three classes, so that our stockholders elect only one-third of the members of our board of directors each year;
our stockholders may remove our directors only for cause;
our stockholders may not take stockholder action except at an annual or special meeting of our stockholders;
the request of stockholders holding at least 20% of the aggregate voting power of our Class A common stock and our Class B common stock is required for a stockholder to call a special meeting of our stockholders;
our by-laws require that stockholders provide advance notice to us to nominate candidates for election to our board of directors or to propose any other item of stockholder business at a stockholders’ meeting;
we do not permit cumulative voting rights in the election of our directors;
our certificate of incorporation does not provide for preemptive rights in connection with any issuance of securities by us; and
our board of directors may issue, without stockholder approval unless otherwise required by law, preferred stock with such terms as our board of directors may determine.
We have authorized preferred stock that we could issue without stockholder approval to make it more difficult for a third party to acquire us.
We have 2.0 million authorized shares of preferred stock that we could issue in one or more series without further stockholder approval, unless the DGCL or the NASDAQ Global Select Market otherwise requires, and upon such terms and conditions, and having such rights, privileges and preferences, as our board of directors may determine our potential issuance of preferred stock and that may make it difficult for a third party to acquire control of us.
-23-
Because we are an insurance holding company, no person can acquire or seek to acquire a 10% or greater interest in us without first obtaining approval of the insurance commissioners of the states of domicile of our insurance subsidiaries.
We own insurance subsidiaries domiciled in the states of Iowa, Maryland, Michigan, Pennsylvania, Virginia and Wisconsin, and Donegal Mutual controls an insurance company domiciled in Georgia. The insurance laws of each of these states provide that no person can acquire or seek to acquire a 10% or greater interest in us without first filing specified
-23-
information with the insurance commissioner of that state and obtaining the prior approval of the proposed acquisition of a 10% or greater interest in us by the state insurance commissioner based on statutory standards designed to protect the safety and soundness of the insurance holding company and its subsidiary.
Because we are a grandfathered unitary savings and loan holding company, no person can acquire or seek to acquire more than a 10% interest in either class of our common stock without first obtaining approval of, or an exemption from, the Board of Governors of the Federal Reserve System.FRB.
We own 48.2% of the outstanding stock of DFSC, which owns all of the outstanding stock of UCB. As a result of our ownership interest in DFSC, we are a grandfathered unitary savings and loan holding company regulated under HOLA by the FRB.FRB under HOLA. No person may lawfully acquire more than 10% of any class of voting security of a unitary savings and loan holding company registered under the Exchange Act without first filing specified information with the FRB and obtaining the FRB’s prior approval of the proposed acquisition or an exemption from the FRB.
Our insurance subsidiaries currently conduct business in a limited number of states, with a concentration of business in Pennsylvania, Michigan, Maryland and Virginia. Any single catastrophe occurrence or other condition affecting losses in these states could adversely affect the results of operations of our insurance subsidiaries.
Our insurance subsidiaries conduct business in 22 states located primarily in the Mid-Atlantic, Midwestern, New England and Southern states. A substantial portion of their business consists of private passenger and commercial automobile, homeowners and workers’ compensation insurance in Pennsylvania, Michigan, Maryland and Virginia. While our insurance subsidiaries and Donegal Mutual actively manage our respective exposure to catastrophes through their underwriting process and the purchase of reinsurance, a single catastrophic occurrence, destructive weather pattern, general economic trend, terrorist attack, regulatory development or other condition affecting one or more of the states in which our insurance subsidiaries conduct substantial business could materially adversely affect their business, financial condition and results of operations. Common catastrophic events include hurricanes, earthquakes, tornadoes, wind and hail storms, fires, explosions and severe winter storms.
If the independent agents who market the products of our insurance subsidiaries do not maintain their current levels of premium writing with us, fail to comply with established underwriting guidelines of our insurance subsidiaries or otherwise inappropriately market the products of our insurance subsidiaries, the business, financial condition and results of operations of our insurance subsidiaries could be adversely affected.
Our insurance subsidiaries market their insurance products solely through a network of approximately 2,5002,600 independent insurance agencies. This agency distribution system is one of the most important components of the competitive profile of our insurance subsidiaries. As a result, our insurance subsidiaries depend to a material extent upon their independent agents, each of whom has the authority to bind our insurance subsidiaries to insurance coverage. To the extent that such independent agents’ marketing efforts fail to result in the maintenance of their current levels of volume and quality or they bind our insurance subsidiaries to unacceptable insurance risks, fail to comply with the established underwriting guidelines of our insurance subsidiaries or otherwise inappropriately market the products of our insurance subsidiaries, the business, financial condition and results of operations of our insurance subsidiaries could suffer.
The business of our insurance subsidiaries may not continue to grow and may be materially adversely affected if theyour insurance subsidiaries cannot retain existing, and attract new, independent agents or if insurance consumers increase their use of insurance marketing systems other than independent agents.
Our insurance subsidiaries’ ability to retain existing, and to attract new, independent agents is essential to the continued growth of the business of our insurance subsidiaries. If independent agents find it easier to do business with the competitors of our insurance subsidiaries, our insurance subsidiaries could find it difficult to retain their existing business or to attract new business. While our insurance subsidiaries believe they maintain good relationships with the independent agents they have appointed, our insurance subsidiaries cannot be certain that these independent agents will continue to sell the products of our insurance subsidiaries to the consumers these independent agents represent. Some of the factors that could adversely affect the ability of our insurance subsidiaries to retain existing, and attract new, independent agents include:
the significant competition among insurance companies to attract independent agents;
-24-
the labor-intensive and time-consuming process of selecting new independent agents;
the insistence of our insurance subsidiaries that independent agents adhere to consistent underwriting standards; and
the ability of our insurance subsidiaries to pay competitive and attractive commissions, bonuses and other incentives to independent agents.
-24-
While our insurance subsidiaries sell insurance to policyholders solely through their network of independent agencies, many competitors of our insurance subsidiaries sell insurance through a variety of delivery methods, including independent agencies, captive agencies, the Internet and direct sales. To the extent that current and potential policyholders change their marketing system preference, the business, financial condition and results of operations of our insurance subsidiaries may be adversely affected.
We are dependent on dividends from our insurance subsidiaries for the payment of our operating expenses, our debt service and dividends to our stockholders; however, there are regulatory restrictions and business considerations that regulate the amount of dividends our insurance subsidiaries may pay to us.
As a holding company, we rely primarily on dividends from our insurance subsidiaries as a source of funds to meet our corporate obligations and to pay dividends to our stockholders. The amount of dividends our insurance subsidiaries can pay to us is subject to regulatory restrictions and depends on the amount of surplus our insurance subsidiaries maintain. From time to time, the NAIC and various state insurance regulators consider modifying the method of determining the amount of dividends that an insurance company may pay without prior regulatory approval. The maximum amount of ordinary dividends that our insurance subsidiaries can pay to us in 20132014 without prior regulatory approval is approximately $29.2$35.1 million. Other business and regulatory considerations, such as the impact of dividends on surplus that could affect the ratings of our insurance subsidiaries, competitive conditions, RBC requirements, the investment results of our insurance subsidiaries and the amount of premiums that our insurance subsidiaries write could also adversely impact the ability of our insurance subsidiaries to pay dividends to us.
If A.M. Best downgrades the rating it has assigned to Donegal Mutual or any of our insurance subsidiaries, it would adversely affect their competitive position.
Industry ratings are a factor in establishing and maintaining the competitive position of insurance companies. A.M. Best, an industry-accepted source of insurance company financial strength ratings, rates Donegal Mutual and our insurance subsidiaries. A.M. Best ratings provide an independent opinion of an insurance company’s financial health and its ability to meet its obligations to its policyholders. We believe that the financial strength rating of A.M. Best is material to the operations of Donegal Mutual and our insurance subsidiaries. Currently, Donegal Mutual and our insurance subsidiaries each have an A (Excellent) rating from A.M. Best. If A.M. Best were to downgrade the rating of Donegal Mutual or any of our insurance subsidiaries, it would adversely affect the competitive position of Donegal Mutual and ouror that insurance subsidiariessubsidiary and make it more difficult for themit to market theirits products and retain theirits existing policyholders.
Our strategy to grow in part through acquisitions of smaller insurance companies exposes us to risks that could adversely affect our results of operations and financial condition.
The affiliation with and acquisition of smaller, and often undercapitalized, insurance companies involves risks that could adversely affect our results of operations and financial condition. The risks associated with these affiliations and acquisitions include:
the potential inadequacy of reserves for losslosses and loss expenses;
the need to supplement management with additional experienced personnel;
conditions imposed by regulatory agencies that make the realization of cost-savings through integration of operations more difficult;
a need for additional capital that was not anticipated at the time of the acquisition; and
the use of more of our management’s time in improving operation of the subsidiary than we originally anticipated.
-25-
If we cannot obtain sufficient capital to fund the organic growth of our insurance subsidiaries and to make acquisitions, we may not be able to expand our business.
Our strategy is to expand our business through the organic growth of our insurance subsidiaries and through our strategic acquisitions of regional insurance companies. Our insurance subsidiaries will require additional capital in the future to support this strategy. If we cannot obtain sufficient capital on satisfactory terms and conditions, we may not be able to expand the business of our insurance subsidiaries or to make future acquisitions. Our ability to obtain additional financing will depend on a
-25-
number of factors, many of which are beyond our control. For example, we may not be able to obtain additional debt or equity financing because we or our insurance subsidiaries may already have substantial debt at the time, because we or our insurance subsidiaries do not have sufficient cash flow to service or repay our existing or additional debt or because financial institutions are not making financing available. In addition, any equity capital we obtain in the future could be dilutive to our existing stockholders.
ManyA number of the competitors of our insurance subsidiaries have greater financial strength than our insurance subsidiaries, and these competitors may be able to offer their products at lower prices than our insurance subsidiaries can afford to offer their products.
The property and casualty insurance industry is intensely competitive. Competition can be based on many factors, including:
the perceived financial strength of the insurer;
premium rates;
policy terms and conditions;
policyholder service;
reputation; and
experience.
Our insurance subsidiaries compete with many regional and national property and casualty insurance companies, including direct sellers of insurance products, insurers having their own agency organizations and other insurers represented by independent agents. Many of these insurers have greater capital than our insurance subsidiaries, have substantially greater financial, technical and operating resources and have equal or higher ratings from A.M. Best than our insurance subsidiaries. In addition, our competitioncompetitors may become increasingly better capitalized in the future as the property and casualty insurance industry continues to consolidate.
The greater capitalization of many of the competitors of our insurance subsidiaries enables them to operate with lower profit margins and, therefore, allows them to market their products more aggressively, to take advantage more quickly of new marketing opportunities and to offer lower premium rates. Our insurance subsidiaries may not be able to maintain their current competitive position in the markets in which they operate if their competitors offer prices for their products that are lower than the prices our insurance subsidiaries are prepared to offer. Moreover, if these competitors lower the price of their products and our insurance subsidiaries meet their pricing, the profit margins and revenues of our insurance subsidiaries may decrease and their ratios of claims and expenses to premiums may increase. All of these factors could materially adversely affect the financial condition and results of operations of our insurance subsidiaries.subsidiaries and their A.M. Best ratings.
Because the investment portfolios of our insurance subsidiaries consist primarily of fixed-income securities, their investment income and the fair value of their investment portfolios could decrease as a result of a number of factors.
Our insurance subsidiaries invest the premiums they receive from their policyholders and maintain investment portfolios that consist primarily of fixed-income securities. The management of these investment portfolios is an important component of the profitability of our insurance subsidiaries. Our insurance subsidiaries andderive a significant portion of thetheir operating income of our insurance subsidiaries generate derives from the income they receive on their invested assets. A number of factors may affect the quality and/or yield of their portfolios, including the general economic and business environment, government monetary policy, changes in the credit quality of the issuers of the fixed-income securities our insurance subsidiaries own, changes in market conditions and regulatory changes. The fixed-income securities our insurance subsidiaries own consist primarily of securities issued by domestic entities that are backed either by the credit or collateral of the underlying issuer. Factors such as an economic downturn, disruption in the credit market or the availability of credit, a regulatory change pertaining to a particular issuer’s industry, a significant deterioration in the cash flows of the issuer or a change in the issuer’s marketplace may adversely affect the ability of our insurance subsidiaries to collect principal and interest from the issuer.issuer in which they invest.
-26-
The investments of our insurance subsidiaries are also subject to risk resulting from interest rate fluctuations. Increasing interest rates or a widening in the spread between interest rates available on U.S. Treasury securities and corporate debt or asset-backed securities, for example, will typically have an adverse impact on the market values of fixed-rate securities. If interest rates remain at historically low levels, our insurance subsidiaries will generally have a lower overall rate of return on investments of cash their operations generate. In addition, in the event of the call or maturity of investments in a low interest
-26-
rate environment, our insurance subsidiaries may not be able to reinvest the proceeds in securities with comparable interest rates. Changes in interest rates may reduce both the profitability and the return on the invested capital of our insurance subsidiaries.
We and our insurance subsidiaries depend on key personnel. The loss of any member of our executive management or the senior management of our insurance subsidiaries could negatively affect the continuation of our business strategies and achievement of our growth objectives.
The loss of, or failure to attract, key personnel could significantly impede the financial plans, growth, marketing and other objectives of us and our insurance subsidiaries. The continued success of our insurance subsidiaries depends to a substantial extent on the ability and experience of their senior management. Our insurance subsidiaries and we believe that our future success is dependent on our ability to attract and retain additional skilled and qualified personnel and to expand, train and manage our employees. We and our insurance subsidiaries may be unable to do so because of the intense competition for experienced personnel in the insurance industry. We and our insurance subsidiariesDonegal Mutual have two to five year automatically renewing employment agreements with our senior officers, including all of our named executive officers.
The reinsurance agreements on which our insurance subsidiaries rely do not relieve our insurance subsidiaries from their primary liability to their policyholders, and our insurance subsidiaries face a risk of non-payment from their reinsurers as well as the non-availability of reinsurance in the future.
Our insurance subsidiaries rely on reinsurance agreements to limit their maximum net loss from large single catastrophic risks or excess of loss risks in areas where our insurance subsidiaries may have a concentration of policyholders. Reinsurance also enables our insurance subsidiaries to increase their capacity to write insurance because it has the effect of leveraging the surplus of our insurance subsidiaries. Although the reinsurance our insurance subsidiaries maintain provides that the reinsurer is liable to them for any reinsured losses, the reinsurance doesagreements do not generally relieve our insurance subsidiaries from their primary liability to their policyholders if the reinsurer fails to pay the reinsurance claims of our insurance subsidiaries. To the extent that a reinsurer is unable to pay losses for which it is liable to our insurance subsidiaries, our insurance subsidiaries remain liable for such losses. At December 31, 2012,2013, our insurance subsidiaries had approximately $108.1$128.4 million of reinsurance receivables from third-party reinsurers relating to paid and unpaid losses. Any insolvency or inability of these reinsurers to make timely payments to our insurance subsidiaries under the terms of their reinsurance agreements would adversely affect the results of operations of our insurance subsidiaries.
Michigan law requires MICO to provide unlimited lifetime medical benefits under the personal injury protection, or PIP, coverage of the personal automobile and commercial automobile policies it writes in the State of Michigan. Michigan law also requires MICO to be a member of the Michigan Catastrophic Claims Association, or MCCA, in order to write automobile insurance. The MCCA receives funding through assessments that its members collect from policyholders in the state and provides reinsurance for PIP claims that exceed a set retention. At December 31, 2012,2013, MICO had approximately $34.4$46.2 million of reinsurance receivables from MCCA relating to paid and unpaid losses. The MCCA has generated significant operating deficits in recent years. Although we currently consider the risk to be remote, should the MCCA be unable to fulfill its payment obligations to MICO in the future, MICO’s financial condition and results of operations could be adversely affected.
In addition, our insurance subsidiaries face a risk of the non-availability of reinsurance or an increase in reinsurance costs that could adversely affect their ability to write business or their results of operations. Market conditions beyond the control of our insurance subsidiaries, such as the amount of surplus in the reinsurance market and the frequency and severity of natural and man-made catastrophes, affect both the availability and the cost of the reinsurance our insurance subsidiaries purchase. If our insurance subsidiaries cannot maintain their current level of reinsurance or purchase new reinsurance protection in amounts that our insurance subsidiaries consider sufficient, our insurance subsidiaries would either have to accept an increase in their net risk retention or reduce their insurance writings, which would adversely affect them.
Our equity investment in DFSC subjects us to certain risks inherent to community banking organizations.
Our equity in the earnings of DFSC primarily reflects the underlying profitability of UCB. UCB is subject to a number of risks, which include, but are not limited to, the following:
variations in interest rates that may negatively affect UCB’s financial performance;
inherent risks associated with UCB’s lending activities;
a significant decline in general economic conditions in the specific markets in which UCB operates;
the potential adverse impact of extensive federal and state regulation and supervision;
-27-
potential declines in the value of UCB’s investments that are considered other than temporary;
competition for loans and deposits with numerous regional and national banks and other financial institutions; and
UCB’s inability to attract and retain qualified key personnel.
Risks Relating to the Property and Casualty Insurance Industry
Industry trends, such as increased litigation against the insurance industry and individual insurers, the willingness of courts to expand covered causes of loss, rising jury awards, escalating medical costs and increasing loss severity may contribute to increased costs and toresult in the deterioration of the reserves of our insurance subsidiaries.
Loss severity in the property and casualty insurance industry has increased in recent years, principally driven by larger court judgments and increasing medical costs. In addition, many classes of complainants have brought legal actions and proceedings that tend to increase the size of judgments. The propensity of policyholders and third-party claimants to litigate and the willingness of courts to expand causes of loss and the size of awards to eliminate exclusions and to increase coverage limits may make the loss reserves of our insurance subsidiaries inadequate for current and future losses.
-27-
Loss or significant restriction of the use of credit scoring in the pricing and underwriting of the personal lines insurance products by our insurance subsidiaries could adversely affect their future profitability.
Our insurance subsidiaries use credit scoring as a factor in making risk selection and pricing decisions where allowed by state law for personal lines insurance products. Recently, some consumer groups and regulators have questioned whether the use of credit scoring unfairly discriminates against people with low incomes, minority groups and the elderly. These consumer groups and regulators often call for the prohibition or restriction on the use of credit scoring in underwriting and pricing. Laws or regulations enacted in a number of states that significantly curtail the use of credit scoring in the underwriting process could reduce the future profitability of our insurance subsidiaries.
Changes in applicable insurance laws or regulations or changes in the way regulators administer those laws or regulations could adversely affect the operating environment of our insurance subsidiaries and increase their exposure to loss or put them at a competitive disadvantage.
Property and casualty insurers are subject to extensive supervision in their domiciliary states and in the states in which they do business. This regulatory oversight includes matters relating to:
licensing and examination;
approval of premium rates;
market conduct;
policy forms;
limitations on the nature and amount of certain investments;
claims practices;
mandated participation in involuntary markets and guaranty funds;
reserve adequacy;
insurer solvency;
transactions between affiliates;
the amount of dividends that insurers may pay; and
restrictions on underwriting standards.
Such regulation and supervision are primarily for the benefit and protection of policyholders rather than stockholders. For instance, our insurance subsidiaries are subject to involuntary participation in specified markets in various states in which they operate and the premium rates our insurance subsidiaries may charge do not always correspond with the underlying costs of providing that coverage.
-28-
The NAIC and state insurance regulators are re-examining existing laws and regulations, specifically focusing on:
insurance company investments;
issues relating to the solvency of insurance companies;
risk-based capital guidelines;
restrictions on the terms and conditions included in insurance policies;
certain methods of accounting;
reserves for unearned premiums, losses and other purposes;
the values at which insurance companies may carry investment securities and the definition of other-than-temporary impairment; and
interpretations of existing laws and the development of new laws.
-28-
Changes in state laws and regulations, as well as changes in the way state regulators view related-party transactions in particular, could change the operating environment of our insurance subsidiaries and have an adverse effect on their business. The state insurance regulatory framework has recently come under increased federal scrunity.scrutiny. Congress is considering proposals that it should create an optional federal charter for insurers. Federal chartering has the potential to create an uneven playing field for insurers by subjecting federally-chartered and state-chartered insurers to different regulatory requirements. Federal chartering also raises the possibility of duplicative or conflicting federal and state requirements. In addition, if federal legislation repeals the partial exemption for the insurance industry from federal antitrust laws, our ability to collect and share loss cost data with the industry could adversely affect the results of operations of our insurance subsidiaries.
Insurance companies are subject to assessments, based on their market share in a given line of business, to assist in the payment of unpaid claims and related costs of insolvent insurance companies. Such assessments could adversely affect the financial condition of our insurance subsidiaries.
Our insurance subsidiaries must pay assessments pursuant to the guaranty fund laws of the various states in which they conduct business. Generally, under these laws, our insurance subsidiaries can be assessed, depending upon the market share of our insurance subsidiaries in a given line of insurance business, to assist in the payment of unpaid claims and related costs of insolvent insurance companies in those states. We cannot predict the number and magnitude of future insurance company failures in the states in which our insurance subsidiaries conduct business, but future assessments could adversely affect the business, financial condition and results of operations of our insurance subsidiaries.
Our insurance subsidiaries must establish premium rates and loss and loss expense reserves from forecasts of the ultimate costs they expect will arise from risks underwritten during the policy period, and the profitability of our insurance subsidiaries could be adversely affected if their premium rates or reserves are insufficient to satisfy their ultimate costs.
One of the distinguishing features of the property and casualty insurance industry is that it prices its products before it knows its costs, since insurers generally establish their premium rates before they know the amount of losses they will incur. Accordingly, our insurance subsidiaries establish premium rates from forecasts of the ultimate costs they expect to arise from risks they have underwritten during the policy period. These premium rates may not be sufficient to cover the ultimate losses incurred. Further, our insurance subsidiaries must establish reserves for losses and loss expenses as balance sheet liabilities based upon estimates involving actuarial and statistical projections at a given time of what our insurance subsidiaries expect their ultimate liability to be. Significant periods of time often elapse from the occurrence of an insured loss to the reporting of the loss and the payment of that loss. It is possible that our insurance subsidiaries’ ultimate liability could exceed these estimates because of the future development of known losses, the existence of losses that have occurred but are currently unreported and larger than historical settlements on pending and unreported claims. The process of estimating reserves is inherently judgmental and can be influenced by a number of factors, including the following:
trends in claim frequency and severity;
changes in operations;
-29-
emerging economic and social trends;
inflation; and
changes in the regulatory and litigation environments.
If our insurance subsidiaries have insufficient premium rates or reserves, insurance regulatory authorities may require increases to these reserves. An increase in reserves results in an increase in losses and a reduction in net income for the period in which the deficiency in reserves exists. Accordingly, if an increase in reserves is not sufficient, it may adversely impact their business, liquidity, financial condition and results of operations.
The financial results of our insurance subsidiaries depend primarily on their ability to underwrite risks effectively and to charge adequate rates to policyholders.
The financial condition, cash flows and results of operations of our insurance subsidiaries depend on their ability to underwrite and set rates accurately for a full spectrum of risks across a number of lines of insurance. Rate adequacy is necessary to generate sufficient premium to pay losses, loss adjustment expenses and underwriting expenses and to earn a profit.
-29-
The ability to underwrite and set rates effectively is subject to a number of risks and uncertainties, including:
the availability of sufficient, reliable data;
the ability to conduct a complete and accurate analysis of available data;
the ability to recognize in a timely manner changes in trends and to project both the severity and frequency of losses with reasonable accuracy;
uncertainties generally inherent in estimates and assumptions;
the ability to project changes in certain operating expense levels with reasonable certainty;
the development, selection and application of appropriate rating formulae or other pricing methodologies;
the use of modeling tools to assist with correctly and consistently achieving the intended results in underwriting and pricing;
the ability to innovate with new pricing strategies and the success of those innovations on implementation;
the ability to secure regulatory approval of premium rates on an adequate and timely basis;
the ability to predict policyholder retention accurately;
unanticipated court decisions, legislation or regulatory action;
unanticipated changes in our claim settlement practices;
changes in driving patterns for auto exposures;
changes in weather patterns for property exposures;
changes in the medical sector of the economy;
unanticipated changes in auto repair costs, auto parts prices and used car prices;
the impact of inflation and other factors on the cost of construction materials and labor;
the ability to monitor property concentration in catastrophe-prone areas, such as hurricane, earthquake and wind/hail regions; and
the general state of the economy in the states in which our insurance subsidiaries operate.
-30-
Such risks may result in the premium rates of our insurance subsidiaries being based on inadequate or inaccurate data or inappropriate assumptions or methodologies and may cause our estimates of future changes in the frequency or severity of claims to be incorrect. As a result, our insurance subsidiaries could underprice risks, which would negatively affect our margins, or our insurance subsidiaries could overprice risks, which could reduce their volume and competitiveness. In either event, underpricing or overpricing risks could adversely impact our operating results, financial condition and cash flows.
The cyclical nature of the property and casualty insurance industry may reduce the revenues and profit margins of our insurance subsidiaries.
The property and casualty insurance industry is highly cyclical with respect to both individual lines of business and the overall insurance industry. Premium rate levels relate to the availability of insurance coverage, which varies according to the level of surplus available in the insurance industry. The level of surplus in the industry varies with returns on invested capital and regulatory barriers to withdrawal of surplus. Increases in surplus may result in increased price competition among property and casualty insurers. If our insurance subsidiaries find it necessary to reduce premiums or limit premium increases due to these competitive pressures on pricing, our insurance subsidiaries may experience a reduction in their profit margins and revenues, an increase in their ratios of losses and expenses to premiums and, therefore, lower profitability.
-30-
Risks Relating to Our Common Stock
The price of our common stock may be adversely affected by its low trading volume.
Our Class A common stock and our Class B common stock have limited liquidity. Reported average daily trading volume infor our Class A common stock and our Class B common stock for the year ended December 31, 20122013 was approximately 22,29326,148 shares and approximately 184823 shares, respectively. This limited liquidity could subject our shares of Class A common stock and our shares of Class B common stock to greater price volatility.
Donegal Mutual’s ownership of our stock, anti-takeover provisions of our certificate of incorporation and by-laws and certain state laws make it unlikely anyone could acquire control of us unless Donegal Mutual were in favor of the acquisition of control.
Donegal Mutual’s ownership of our Class A common stock and Class B common stock, certain anti-takeover provisions of our certificate of incorporation and by-laws, certain provisions of Delaware law and the insurance laws and regulations of Iowa, Georgia, Maryland, Michigan, Pennsylvania, Virginia and Wisconsin could delay or prevent the removal of members of our board of directors and could make it more difficult for a merger, tender offer or proxy contest involving us to succeed, even if our stockholders other than Donegal Mutual believed any of such events would be beneficial to them. These factors could also discourage a third party from attempting to acquire control of us. The classification of our board of directors could also have the effect of delaying or preventing a change in our control.
In addition, we have 2,000,000 authorized shares of preferred stock that we could issue in one or more series without stockholder approval, to the extent applicable law permits, and upon such terms and conditions, and having such rights, privileges and preferences, as our board of directors may determine. Our ability to issue preferred stock could make it difficult for a third party to acquire us. We have no current plans to issue any preferred stock.
Moreover, the DGCL contains provisions that prohibit certain business combination transactions under certain circumstances. In addition, state insurance laws and regulations generally prohibit any person from acquiring, or seeking to acquire, a 10% or greater interest in an insurance company without the prior approval of the state insurance commissioner of the state of domicile of the insurer. Because of our indirect control of UCB, HOLA also prohibits the acquisition of a 10% or greater interest in either our Class A common stock or our Class B common stock without the prior approval of the FRB or the granting of an exemption by the FRB.
-31-
Item 1B. Unresolved Staff Comments.
We have no unresolved written comments from the Securities and Exchange Commission (“SEC”) staff regarding our filings under the Exchange Act.
| Item 2. |
We and our insurance subsidiaries share administrative headquarters with Donegal Mutual in a building in Marietta, Pennsylvania that Donegal Mutual owns. Donegal Mutual charges us and our insurance subsidiaries for an appropriate portion of the building expenses under an inter-company allocation agreement. The Marietta headquarters has approximately 230,000 square feet of office space. Southern owns a facility of approximately 10,000 square feet in Glen Allen, Virginia. Le Mars owns a facility of approximately 25,500 square feet in Le Mars, Iowa, the Peninsula Group owns a facility of approximately 14,600 square feet in Salisbury, Maryland and Sheboygan owns a facility of approximately 8,800 square feet in Sheboygan Falls, Wisconsin.
| Item 3. | Legal Proceedings. |
Our insurance subsidiaries are parties to routine litigation that arises in the ordinary course of their insurance business. We believe that the resolution of these lawsuits will not have a material adverse effect on the financial condition or results of operations of our insurance subsidiaries.
| Item 4. | Reserved. |
Not applicable.
-32-
Executive Officers of the Company
The following table sets forth information regarding the executive officers of Donegal Mutual and us, each of whom has served with us for more than 10 years:
Name | Age | Position | ||||
Donald H. Nikolaus | President and Chief Executive Officer of Donegal Mutual since 1981; President and Chief Executive Officer of us since 1986. Chairman of our board of directors since April 2012. | |||||
Kevin G. Burke | Senior Vice President of Human Resources of Donegal Mutual and us since 2005; Vice President of Human Resources of Donegal Mutual and us from 2001 to 2005; other positions from 2000 to 2001. | |||||
Cyril J. Greenya | Senior Vice President and Chief Underwriting Officer of Donegal Mutual and us since 2005; Senior Vice President, Underwriting, of Donegal Mutual from 1997 to 2005; other positions from 1986 to 2005. | |||||
Jeffrey D. Miller | Senior Vice President and Chief Financial Officer of Donegal Mutual and us since 2005; Vice President and Controller of Donegal Mutual and us from 2000 to 2005; other positions from 1995 to 2005. | |||||
Sanjay Pandey | 47 | Senior Vice President and Chief Information Officer of Donegal Mutual and us since 2013; Vice President and Chief Information Officer of Donegal Mutual and us from 2009 to 2013; other positions from 2000 to 2009. | ||||
Robert G. Shenk | Senior Vice President, Claims, of Donegal Mutual and us since 1997; other positions from 1986 to 1997. | |||||
Daniel J. Wagner | Senior Vice President and Treasurer of Donegal Mutual and us since 2005; Vice President and Treasurer of Donegal Mutual and us from 2000 to 2005; other positions from 1993 to 2005. | |||||
-33-
Item 5. Market for Registrant’s Common Equity, Related Stockholder Matters and Issuer Purchases of Equity Securities.
Our Class A common stock and Class B common stock trade on the NASDAQ Global Select Market under the symbols “DGICA” and “DGICB,” respectively. The following table shows the dividends paid per share and the stock price range for both classes of stock for each quarter during 20122013 and 2011:2012:
Quarter | High | Low | Cash Dividend Declared Per Share | High | Low | Cash Dividend Declared Per Share | ||||||||||||||||||
2013 - Class A | ||||||||||||||||||||||||
1st | $ | 16.52 | $ | 12.93 | $ | — | ||||||||||||||||||
2nd | 15.59 | 13.90 | 0.1275 | |||||||||||||||||||||
3rd | 14.90 | 13.35 | 0.1275 | |||||||||||||||||||||
4th | 16.88 | 14.15 | 0.2550 | |||||||||||||||||||||
2013 - Class B | ||||||||||||||||||||||||
1st | $ | 28.49 | $ | 17.92 | $ | — | ||||||||||||||||||
2nd | 27.85 | 19.00 | 0.1150 | |||||||||||||||||||||
3rd | 24.03 | 18.00 | 0.1150 | |||||||||||||||||||||
4th | 26.00 | 19.21 | 0.2300 | |||||||||||||||||||||
2012 - Class A | ||||||||||||||||||||||||
1st | $ | 16.00 | $ | 12.73 | $ | — | $ | 16.00 | $ | 12.73 | $ | — | ||||||||||||
2nd | 15.36 | 12.87 | 0.1225 | 15.36 | 12.87 | 0.1225 | ||||||||||||||||||
3rd | 14.93 | 12.91 | 0.1225 | 14.93 | 12.91 | 0.1225 | ||||||||||||||||||
4th | 14.69 | 12.25 | 0.2450 | 14.69 | 12.25 | 0.2450 | ||||||||||||||||||
2012 - Class B | ||||||||||||||||||||||||
1st | $ | 17.89 | $ | 14.74 | $ | — | $ | 17.89 | $ | 14.74 | $ | — | ||||||||||||
2nd | 18.00 | 16.85 | 0.1100 | 18.00 | 16.85 | 0.1100 | ||||||||||||||||||
3rd | 18.22 | 16.04 | 0.1100 | 18.22 | 16.04 | 0.1100 | ||||||||||||||||||
4th | 23.00 | 16.51 | 0.2200 | 23.00 | 16.51 | 0.2200 | ||||||||||||||||||
2011 - Class A | ||||||||||||||||||||||||
1st | $ | 15.51 | $ | 11.48 | $ | — | ||||||||||||||||||
2nd | 14.01 | 12.29 | 0.1200 | |||||||||||||||||||||
3rd | 13.93 | 11.22 | 0.1200 | |||||||||||||||||||||
4th | 14.94 | 11.53 | 0.2400 | |||||||||||||||||||||
2011 - Class B | ||||||||||||||||||||||||
1st | $ | 18.75 | $ | 15.21 | $ | — | ||||||||||||||||||
2nd | 19.51 | 13.91 | 0.1075 | |||||||||||||||||||||
3rd | 23.73 | 14.62 | 0.1075 | |||||||||||||||||||||
4th | 17.20 | 14.97 | 0.2150 | |||||||||||||||||||||
At the close of business on March 1, 2013,3, 2014, we had approximately 1,9671,926 holders of record of our Class A common stock and approximately 364340 holders of record of our Class B common stock.
We declared dividends of $0.51 per share on our Class A common stock and $0.46 per share on our Class B common stock in 2013, compared to $0.49 per share on our Class A common stock and $0.44 per share on our Class B common stock in 2012, compared to $0.48 per share on our Class A common stock and $0.43 per share on our Class B common stock in 2011.2012.
-34-
Between October 1, 20122013 and December 31, 2012,2013, we and Donegal Mutual purchased shares of our Class A common stock and Class B common stock as set forth in the table below:
Period | (a) Total Number of Shares | (b) Average Price Paid per | (c) Total Number of Shares | (d) Maximum Number (or Approximate Dollar Value) of Shares (or Units) that May Yet Be Purchased Under the Plans or Programs(1) | ||||||
Month #1 | Class A - — | Class A | Class A - — | |||||||
October | Class B - — | Class B | Class B - — | |||||||
Month #2 | Class A - — | Class A | Class A - — | |||||||
November 1 - 30, 2013 | Class B - — | Class B - $— | Class B - — | |||||||
Month #3 | Class A - 20,000 | Class A - $15.82 | Class A - 20,000 | (1) | ||||||
| Class B | Class B | Class B | (2) | ||||||
| ||||||||||
| ||||||||||
Total | Class A | Class A | Class A | |||||||
Class B | Class B | Class B | ||||||||
| (1) | We purchased these shares pursuant to our announcement first made on February 23, 2009 that we will purchase up to 300,000 shares of our Class A common stock at market prices prevailing from time to time in the open market subject to the provisions of SEC Rule 10b-18 and in privately negotiated transactions. We may purchase up to |
| (2) | Donegal Mutual purchased these shares pursuant to its announcement first made on August 17, 2004 that it will, at its discretion, purchase shares of our Class A common stock and Class B common stock at market prices prevailing from time to time in the open market subject to the provisions of SEC Rule 10b-18 and in privately negotiated transactions. Such announcement did not stipulate a maximum number of shares that may be purchased under this program. |
-35-
Stock Performance Chart.
The following graph provides an indicator of cumulative total stockholder returns on our Class A common stock and our Class B common stock for the period beginning on December 31, 20072008 and ending on December 31, 2012,2013, compared to the Russell 2000 Index and a peer group comprised of nineseven property and casualty insurance companies over the same period. The peer group consists of Cincinnati Financial Corp., Eastern Insurance Holdings Inc., EMC Insurance Group Inc., Hanover Insurance, Horace Mann Educators, Selective Insurance Group Inc., State Auto Financial Corp., Tower Group Inc. and United Fire and Casualty Co. The graph shows the change in value of an initial $100 investment on December 31, 2007,2008, assuming reinvestment of all dividends.


| 2007 | 2008 | 2009 | 2010 | 2011 | 2012 | 2008 | 2009 | 2010 | 2011 | 2012 | 2013 | |||||||||||||||||||||||||||||||||||||
Donegal Group Inc. Class A | $ | 100.00 | $ | 100.06 | $ | 95.46 | $ | 91.98 | $ | 93.38 | $ | 95.89 | $ | 100.00 | $ | 95.41 | $ | 91.93 | $ | 93.33 | $ | 95.84 | $ | 112.39 | ||||||||||||||||||||||||
Donegal Group Inc. Class B | 100.00 | 95.46 | 96.28 | 103.32 | 98.81 | 110.96 | 100.00 | 100.85 | 108.23 | 103.50 | 116.23 | 155.94 | ||||||||||||||||||||||||||||||||||||
Russell 2000 Index | 100.00 | 65.20 | 81.64 | 102.30 | 96.72 | 110.88 | 100.00 | 125.22 | 156.90 | 148.35 | 170.06 | 232.98 | ||||||||||||||||||||||||||||||||||||
Peer Group | 100.00 | 86.45 | 78.08 | 93.12 | 85.68 | 106.10 | 100.00 | 90.53 | 108.19 | 100.42 | 127.24 | 181.94 | ||||||||||||||||||||||||||||||||||||
Value Line Publishing LLC prepared the foregoing performance graph and data. The performance graph and accompanying data shall not be deemed “filed” as part of this Form 10-K Annual Report for purposes of Section 18 of the Exchange Act or otherwise subject to the liabilities of that section and should not be deemed incorporated by reference into any other filing we make under the Securities Act of 1933 or the Securities Exchange Act of 1934, except to the extent we specifically incorporate the performance graph and accompanying data by reference into such filing.
-36-
| Item 6. | Selected Financial Data. |
| Year Ended December 31, | 2012 | 2011 | 2010 | 2009 | 2008 | 2013 | 2012 | 2011 | 2010 | 2009 | ||||||||||||||||||||||||||||||
Income Statement Data | ||||||||||||||||||||||||||||||||||||||||
Premiums earned | $ | 475,002,222 | $ | 431,470,184 | $ | 378,030,129 | $ | 355,025,477 | $ | 346,575,266 | $ | 515,291,944 | $ | 475,002,222 | $ | 431,470,184 | $ | 378,030,129 | $ | 355,025,477 | ||||||||||||||||||||
Investment income, net | 20,168,919 | 20,858,179 | 19,949,714 | 20,630,583 | 22,755,784 | 18,795,239 | 20,168,919 | 20,858,179 | 19,949,714 | 20,630,583 | ||||||||||||||||||||||||||||||
Realized investment gains (losses) | 6,859,439 | 12,281,267 | 4,395,720 | 4,479,558 | (2,970,716 | ) | ||||||||||||||||||||||||||||||||||
Realized investment gains | 2,423,442 | 6,859,439 | 12,281,267 | 4,395,720 | 4,479,558 | |||||||||||||||||||||||||||||||||||
Total revenues | 514,982,585 | 475,017,619 | 408,549,446 | 386,733,407 | 372,424,227 | 547,110,065 | 514,982,585 | 475,017,619 | 408,549,446 | 386,733,407 | ||||||||||||||||||||||||||||||
Income (loss) before income tax (benefit) | 27,858,260 | (6,739,313 | ) | 9,844,149 | 20,676,689 | 32,092,044 | ||||||||||||||||||||||||||||||||||
Income tax (benefit) | 4,765,640 | (7,192,266 | ) | (1,623,030 | ) | 1,846,611 | 6,550,066 | |||||||||||||||||||||||||||||||||
Income (loss) before income taxes (benefit) | 32,710,265 | 27,858,260 | (6,739,313 | ) | 9,844,149 | 20,676,689 | ||||||||||||||||||||||||||||||||||
Income taxes (benefit) | 6,388,273 | 4,765,640 | (7,192,266 | ) | (1,623,030 | ) | 1,846,611 | |||||||||||||||||||||||||||||||||
Net income | 23,092,620 | 452,953 | 11,467,179 | 18,830,078 | 25,541,978 | 26,321,992 | 23,092,620 | 452,953 | 11,467,179 | 18,830,078 | ||||||||||||||||||||||||||||||
Basic earnings per share - Class A | 0.92 | 0.02 | 0.46 | 0.76 | 1.03 | 1.04 | 0.92 | 0.02 | 0.46 | 0.76 | ||||||||||||||||||||||||||||||
Diluted earnings per share - Class A | 0.91 | 0.02 | 0.46 | 0.76 | 1.02 | 1.02 | 0.91 | 0.02 | 0.46 | 0.76 | ||||||||||||||||||||||||||||||
Cash dividends per share - Class A | 0.49 | 0.48 | 0.46 | 0.45 | 0.42 | 0.51 | 0.49 | 0.48 | 0.46 | 0.45 | ||||||||||||||||||||||||||||||
Basic earnings per share - Class B | 0.83 | 0.01 | 0.41 | 0.68 | 0.92 | 0.94 | 0.83 | 0.01 | 0.41 | 0.68 | ||||||||||||||||||||||||||||||
Diluted earnings per share - Class B | 0.83 | 0.01 | 0.41 | 0.68 | 0.92 | 0.94 | 0.83 | 0.01 | 0.41 | 0.68 | ||||||||||||||||||||||||||||||
Cash dividends per share - Class B | 0.44 | 0.43 | 0.41 | 0.40 | 0.37 | 0.46 | 0.44 | 0.43 | 0.41 | 0.40 | ||||||||||||||||||||||||||||||
Balance Sheet Data at Year End | ||||||||||||||||||||||||||||||||||||||||
Total investments | $ | 806,429,032 | $ | 785,308,991 | $ | 728,541,814 | $ | 666,835,186 | $ | 632,135,526 | $ | 791,808,307 | $ | 806,429,032 | $ | 785,308,991 | $ | 728,541,814 | $ | 666,835,186 | ||||||||||||||||||||
Total assets | 1,336,889,187 | 1,290,793,478 | 1,174,619,523 | 935,601,927 | 880,109,036 | 1,385,410,502 | 1,336,889,187 | 1,290,793,478 | 1,174,619,523 | 935,601,927 | ||||||||||||||||||||||||||||||
Debt obligations | 72,465,000 | 74,965,000 | 56,082,371 | 15,465,000 | 15,465,000 | 63,000,000 | 72,465,000 | 74,965,000 | 56,082,371 | 15,465,000 | ||||||||||||||||||||||||||||||
Stockholders’ equity | 400,034,094 | 383,451,592 | 380,102,810 | 385,505,699 | 363,583,865 | 396,877,111 | 400,034,094 | 383,451,592 | 380,102,810 | 385,505,699 | ||||||||||||||||||||||||||||||
Book value per share | 15.63 | 15.01 | 14.86 | 15.12 | 14.29 | 15.02 | 15.63 | 15.01 | 14.86 | 15.12 | ||||||||||||||||||||||||||||||
-37-
| Item 7. | Management’s Discussion and Analysis of Results of Operations and Financial Condition. |
Overview
Donegal Mutual Insurance Company (“Donegal Mutual”) organized us as an insurance holding company on August 26, 1986. See “Business - History and Organizational Structure” for more information. Our insurance subsidiaries, Atlantic States Insurance Company (“Atlantic States”), Southern Insurance Company of Virginia (“Southern”), Le Mars Insurance Company (“Le Mars”), The Peninsula Insurance Company and Peninsula Indemnity Company (collectively, “Peninsula Group”“Peninsula”), Sheboygan Falls Insurance Company (“Sheboygan Falls”) and Michigan Insurance Company (“MICO”) write personal and commercial lines of property and casualty coverages exclusively through a network of independent insurance agents in certain Mid-Atlantic, Midwest, New England and Southern states. We acquired MICO on December 1, 2010 and we have included MICO’s results of operations in our consolidated results of operations from that date. The personal lines products of our insurance subsidiaries consist primarily of homeowners and private passenger automobile policies. The commercial lines products of our insurance subsidiaries consist primarily of commercial automobile, commercial multi-peril and workers’ compensation policies. We also own 48.2% of the outstanding stock of Donegal Financial Services Corporation (“DFSC”), a grandfathered unitary savings and loan holding company. Donegal Mutual owns the remaining 51.8% of the outstanding stock of DFSC.
At December 31, 2012,2013, Donegal Mutual held approximately 39%37% of our outstanding Class A common stock and approximately 76% of our outstanding Class B common stock. This ownership provides Donegal Mutual with approximately 66%65% of the aggregate voting power of our outstanding shares of Class A common stock and our outstanding shares of Class B common stock.
Donegal Mutual and Atlantic States entered into a proportional reinsurance agreement, or pooling agreement, effective October 1, 1986. Under this pooling agreement, Donegal Mutual and Atlantic States pool and then share proportionately substantially all of their respective premiums, losses and expenses. Atlantic States’ participation in the pool has been 80% since March 1, 2008. The operations of our insurance subsidiaries and Donegal Mutual are interrelated due to the pooling agreement and other factors. While maintaining the separate corporate existence of each company, our insurance subsidiaries and Donegal Mutual conduct business together as the Donegal Insurance Group. As such, Donegal Mutual and our insurance subsidiaries share the same business philosophy, the same management, the same employees and the same facilities and offer the same types of insurance products. See “Business - History and Organizational Structure” for more information regarding the pooling agreement and other transactions with our affiliates.
Our results of operations and financial condition have been impacted by two recent transactions:
In December 2010, we acquired MICO, which had been a majority owned subsidiary of West Bend Mutual Insurance Company (“West Bend”), for approximately $42.3 million in cash. MICO writes various lines of property and casualty insurance and had direct written premiums of $105.4 million and net written premiums of $27.1 million for the year ended December 31, 2010. Effective on December 1, 2010, MICO entered into a 50% quota-share agreement with third-party reinsurers and a 25% quota-share reinsurance agreement with Donegal Mutual to replace the 75% quota-share reinsurance agreement MICO had maintained with West Bend through November 30, 2010.
In May 2011, DFSC and Union National Financial Corporation (“UNNF”) merged, with DFSC as the surviving company in the merger. Under the merger agreement, Province Bank FSB, which DFSC owned, and Union National Community Bank, which UNNF owned, also merged and began doing business as Union Community Bank FSB (“UCB”). UCB isbecame a federalstate savings bank within 2013. UCB had 13 branch offices in Lancaster County, Pennsylvania, and $509.8$512.8 million in assets at December 31, 2012.2013. Donegal Mutual contributed $22.1 million and we contributed $20.6 million to DFSC as additional capital to facilitate the mergers. We use the equity method of accounting for our investment in DFSC. Under the equity method, we record our investment at cost, with adjustments for our share of DFSC’s earnings and losses as well as changes in DFSC’s equity due to DFSC’s unrealized gains and losses.
In February 2009, our board of directors authorized a share repurchase program, pursuant to which we may purchase up to 300,000 shares of our Class A common stock at market prices prevailing from time to time in the open market subject to the provisions of Securities and Exchange Commission (“SEC”) Rule 10b-18 and in privately negotiated transactions. We purchased 135,06424,240 and 119,257135,064 shares of our Class A common stock under this program during 20122013 and 2011,2012, respectively. At December 31, 2012,2013, we had the authority remaining to purchase 28,3084,068 shares under this program.
On July 18, 2013, our board of directors authorized a share repurchase program pursuant to which we have the authority to purchase up to 500,000 additional shares of our Class A common stock at prices prevailing from time to time in the open market subject to the provisions of the SEC Rule 10b-18 and in privately negotiated transactions. We did not purchase shares under this program during 2013.
At our annual meeting of stockholders on April 18, 2013, our stockholders approved an amendment to our certificate of incorporation that increased the number of shares of our Class A common stock we have the authority to issue from 30.0 million shares to 40.0 million shares.
-38-
Critical Accounting Policies and Estimates
We combine our financial statements with those of our insurance subsidiaries and present them on a consolidated basis in accordance with GAAP.
Our insurance subsidiaries make estimates and assumptions that can have a significant effect on amounts and disclosures we report in our financial statements. The most significant estimates relate to the reserves of our insurance subsidiaries for property and casualty insurance unpaid losses and loss expenses, valuation of investments and determination of other-than-temporary investment impairments and the policy acquisition costs of our insurance subsidiaries. While we believe our estimates and the estimates of our insurance subsidiaries are appropriate, the ultimate amounts may differ from the estimates we provided. We regularly review our methods for making these estimates and we reflect any adjustment we consider necessary in our current results of operations.
Liability for Losses and Loss Expenses
Liabilities for losses and loss expenses are estimates at a given point in time of the amounts an insurer expects to pay with respect to policyholder claims based on facts and circumstances then known. At the time of establishing its estimates, an insurer recognizes that its ultimate liability for losses and loss expenses will exceed or be less than such estimates. Our insurance subsidiaries base their estimates of liabilities for losses and loss expenses on assumptions as to future loss trends, expected claims severity, judicial theories of liability and other factors. However, during the loss adjustment period, our insurance subsidiaries may learn additional facts regarding individual claims, and, consequently, it often becomes necessary for our insurance subsidiaries to refine and adjust their estimates of liability. We reflect any adjustments to our insurance subsidiaries’ liabilities for losses and loss expenses in our operatingconsolidated results of operations in the period in which our insurance subsidiaries make the changes in estimates.
Our insurance subsidiaries maintain liabilities for the payment of losses and loss expenses with respect to both reported and unreported claims. Our insurance subsidiaries establish these liabilities for the purpose of covering the ultimate costs of settling all losses, including investigation and litigation costs. Our insurance subsidiaries base the amount of their liability for reported losses primarily upon a case-by-case evaluation of the type of risk involved, knowledge of the circumstances surrounding each claim and the insurance policy provisions relating to the type of loss the policyholder incurred. Our insurance subsidiaries determine the amount of their liability for unreported claims and loss expenses on the basis of historical information by line of insurance. Our insurance subsidiaries account for inflation in the reserving function through analysis of costs and trends and reviews of historical reserving results. Our insurance subsidiaries closely monitor their liabilities and recompute them periodically using new information on reported claims and a variety of statistical techniques. Our insurance subsidiaries do not discount their liabilities for losses.
Reserve estimates can change over time because of unexpected changes in assumptions related to our insurance subsidiaries’ external environment and, to a lesser extent, assumptions asrelated to our insurance subsidiaries’ internal operations. For example, our insurance subsidiaries have experienced a decrease in claims frequency on workers’ compensation claims during the past several years while claims severity has gradually increased. These trend changes give rise to greater uncertainty as to the pattern of future loss settlements on workers’ compensation claims. Related uncertainties regarding future trends include the cost of medical technologies and procedures and changes in the utilization of medical procedures. Assumptions related to our insurance subsidiaries’ external environment include the absence of significant changes in tort law and the legal environment that increase liability exposure, consistency in judicial interpretations of insurance coverage and policy provisions and the rate of loss cost inflation. Internal assumptions include consistency in the recording of premium and loss statistics, consistency in the recording of claims, payment and case reserving methodology, accurate measurement of the impact of rate changes and changes in policy provisions, consistency in the quality and characteristics of business written within a given line of business and consistency in reinsurance coverage and collectability of reinsured losses, among other items. To the extent our insurance subsidiaries determine that underlying factors impacting their assumptions have changed, our insurance subsidiaries attempt to make appropriate adjustments for such changes in their reserves. Accordingly, our insurance subsidiaries’ ultimate liability for unpaid losses and loss expenses will likely differ from the amount recorded at December 31, 2012.2013. For every 1% change in our insurance subsidiaries’ estimate for loss and loss expense reserves, net of reinsurance recoverable, the effect on our pre-tax results of operations would be approximately $2.5$2.7 million.
The establishment of appropriate liabilities is an inherently uncertain process and we can provide no assurance that our insurance subsidiaries’ ultimate liability will not exceed our insurance subsidiaries’ loss and loss expense reserves and have an adverse effect on our results of operations and financial condition. Furthermore, we cannot predict the timing, frequency and extent of adjustments to our insurance subsidiaries’ estimated future liabilities, since the historical conditions and events that serve as a basis for our insurance subsidiaries’ estimates of ultimate claim costs may change. As is the case for substantially all property and casualty insurance companies, our insurance subsidiaries have found it necessary in the past to increase their estimated future liabilities for losses and loss expenses in certain periods and, in other periods, their estimates of future liabilities have exceeded their actual liabilities. Changes in our insurance subsidiaries’ estimate of their liability for losses and loss expenses generally reflect actual payments and their evaluation of information received since the prior reporting date. Our
-39-
insurance subsidiaries recognized an increase (decrease) in their liability for losses and loss expenses of prior years of $10.4 million, $7.6 million and ($168,460) in 2013, 2012 and ($2.9) million in 2012, 2011, and 2010, respectively. Our insurance subsidiaries made no significant changes in their reserving philosophy, key reserving assumptions or claims management personnel, and there have beenmade no significant offsetting changes in estimates that increased or decreased their loss and loss expense reserves in thosethese years. The 20122013 development represented 3.1%4.1% of the December 31, 20112012 net carried reserves and resulted primarily from higher-than-expected severity in the private passenger automobile liability, commercial multiple peril, commercial automobile and workers’ compensation lines of business in accident years prior to 2012.2013.
Excluding the impact of weather events, our insurance subsidiaries have noted stable amounts in the number of claims incurred and a slight downward trend in the number of claims outstanding at period ends relative to their premium base in recent years across most of their lines of business. However, the amount of the average claim outstanding has increased gradually over the past several years as the United States property and casualty insurance industry has experienced increased litigation trends and economic conditions that have extended the estimated length of disabilities and contributed to increased medical loss costs. We have also experienced a general slowing of settlement rates in litigated claims. Our insurance subsidiaries could have to make further adjustments to their estimates in the future. However, on the basis of our insurance subsidiaries’ internal procedures, which analyze, among other things, their prior assumptions, their experience with similar cases and historical trends such as reserving patterns, loss payments, pending levels of unpaid claims and product mix, as well as court decisions, economic conditions and public attitudes, we believe that our insurance subsidiaries have made adequate provision for their liability for losses and loss expenses.
Atlantic States’ participation in the pool with Donegal Mutual exposes it to adverse loss development on the business of Donegal Mutual that is included in the pool.pool includes. However, pooled business represents the predominant percentage of the net underwriting activity of both companies, and Donegal Mutual and Atlantic States proportionately share any adverse risk development of the pooled business. The business in the pool is homogeneous and each company has a pro-rata share of the entire pool. Since substantially all of the business of Atlantic States and Donegal Mutual is pooled and the results shared by each company according to its participation level under the terms of the pooling agreement, the intent of the underwriting pool is to produce a more uniform and stable underwriting result from year to year for each company than theyeither would experience individually and to spread the risk of loss between the companies.
-40-
Our insurance subsidiaries’ liability for losses and loss expenses by major line of business at December 31, 20122013 and 20112012 consisted of the following:
| 2012 | 2011 | 2013 | 2012 | |||||||||||||
| (in thousands) | (in thousands) | |||||||||||||||
Commercial lines: | ||||||||||||||||
Automobile | $ | 32,012 | $ | 28,164 | $ | 36,017 | $ | 32,012 | ||||||||
Workers’ compensation | 67,715 | 60,134 | 79,932 | 67,715 | ||||||||||||
Commercial multi-peril | 39,645 | 38,895 | 39,822 | 39,645 | ||||||||||||
Other | 4,142 | 3,992 | 2,716 | 4,142 | ||||||||||||
|
|
|
| |||||||||||||
Total commercial lines | 143,514 | 131,185 | 158,487 | 143,514 | ||||||||||||
|
|
|
| |||||||||||||
Personal lines: | ||||||||||||||||
Automobile | 93,966 | 87,977 | 92,280 | 93,966 | ||||||||||||
Homeowners | 11,643 | 21,125 | 13,367 | 11,643 | ||||||||||||
Other | 1,813 | 2,728 | 1,471 | 1,813 | ||||||||||||
|
|
|
| |||||||||||||
Total personal lines | 107,422 | 111,830 | 107,118 | 107,422 | ||||||||||||
|
|
|
| |||||||||||||
Total commercial and personal lines | 250,936 | 243,015 | 265,605 | 250,936 | ||||||||||||
Plus reinsurance recoverable | 207,891 | 199,393 | 230,014 | 207,891 | ||||||||||||
|
|
|
| |||||||||||||
Total liability for losses and loss expenses | $ | 458,827 | $ | 442,408 | $ | 495,619 | $ | 458,827 | ||||||||
|
|
|
| |||||||||||||
We have evaluated the effect on our insurance subsidiaries’ loss and loss expense reserves and our stockholders’ equity in the event of reasonably likely changes in the variables we consider in establishing loss and loss expense reserves. We established the range of reasonably likely changes based on a review of changes in accident year development by line of business and applied it to our insurance subsidiaries’ loss reserves as a whole. The selected range does not necessarily indicate
-40-
what could be the potential best or worst case or likelythe most-likely scenario. The following table sets forth the effect on our insurance subsidiaries’ loss and loss expense reserves and our stockholders’ equity in the event of reasonably likely changes in the variables considered in establishing loss and loss expense reserves:
| Change in Loss and Loss Expense Reserves Net of Reinsurance | Change in Loss and Loss Expense Reserves Net of Reinsurance | Adjusted Loss and Loss Expense Reserves Net of Reinsurance at December 31, 2012 | Percentage Change in Equity at December 31, 2012(1) | Adjusted Loss and Loss Expense Reserves Net of Reinsurance at December 31, 2011 | Percentage Change in Equity at December 31, 2011(1) | Change in Loss and Loss Expense Reserves Net of Reinsurance | Adjusted Loss and Loss Expense Reserves Net of Reinsurance at December 31, 2013 | Percentage Change in Equity at December 31, 2013(1) | Adjusted Loss and Loss Expense Reserves Net of Reinsurance at December 31, 2012 | Percentage Change in Equity at December 31, 2012(1) | ||||||||||||||||||||||||||
| (dollars in thousands) | (dollars in thousands) | (dollars in thousands) | ||||||||||||||||||||||||||||||||||
| -10.0 | % | $ | 225,842 | 4.1 | % | $ | 218,714 | 4.1 | % | -10.0 | % | $ | 239,045 | 4.4 | % | $ | 225,842 | 4.1 | % | |||||||||||||||||
| -7.5 | 232,116 | 3.1 | 224,789 | 3.1 | -7.5 | 245,685 | 3.3 | 232,116 | 3.1 | |||||||||||||||||||||||||||
| -5.0 | 238,389 | 2.0 | 230,864 | 2.1 | -5.0 | 252,325 | 2.2 | 238,389 | 2.0 | |||||||||||||||||||||||||||
| -2.5 | 244,663 | 1.0 | 236,940 | 1.0 | -2.5 | 258,965 | 1.1 | 244,663 | 1.0 | |||||||||||||||||||||||||||
| Base | 250,936 | — | 243,015 | — | Base | 265,605 | — | 250,936 | — | |||||||||||||||||||||||||||
| 2.5 | 257,209 | -1.0 | 249,090 | -1.0 | 2.5 | 272,245 | -1.1 | 257,209 | -1.0 | |||||||||||||||||||||||||||
| 5.0 | 263,483 | -2.0 | 255,166 | -2.1 | 5.0 | 278,885 | -2.2 | 263,483 | -2.0 | |||||||||||||||||||||||||||
| 7.5 | 269,756 | -3.1 | 261,241 | -3.1 | 7.5 | 285,525 | -3.3 | 269,756 | -3.1 | |||||||||||||||||||||||||||
| 10.0 | 276,030 | -4.1 | 267,317 | -4.1 | 10.0 | 292,166 | -4.4 | 276,030 | -4.1 | |||||||||||||||||||||||||||
| (1) | Net of income tax effect. |
Our insurance subsidiaries base their reserves for unpaid losses and loss expenses on current trends in loss and loss expense development and reflect their best estimates for future amounts needed to pay losses and loss expenses with respect to incurred events currently known to them plus incurred but not reported (“IBNR”) claims. Our insurance subsidiaries develop their reserve estimates based on an assessment of known facts and circumstances, review of historical loss settlement patterns, estimates of trends in claims severity, frequency, legal and regulatory changes and other assumptions. Our insurance subsidiaries consistently apply actuarial loss reserving techniques and assumptions, which rely on historical information as adjusted to reflect current conditions, including consideration of recent case reserve activity. Our insurance subsidiaries use the most-likely number as determined by their actuaries.
-41-
actuaries determine. For the year ended December 31, 2013, the actuaries developed a range from a low of $238.8 million to a high of $295.5 million and with a most-likely number of $265.6 million. The actuaries’ range of estimates for commercial lines in 2013 was $142.5 million to $176.2 million, and the actuaries selected the most-likely number of $158.5 million. The actuaries’ range of estimates for personal lines in 2013 was $96.2 million to $119.3 million, and the actuaries selected the most-likely number of $107.1 million. For the year ended December 31, 2012, the actuaries developed a range from a low of $228.7 million to a high of $275.3 million and with a most-likely number of $250.9 million. The actuaries’ range of estimates for commercial lines in 2012 was $130.9 million to $157.4 million, and theythe actuaries selected the most-likely number of $143.5 million. The actuaries’ range of estimates for personal lines in 2012 was $97.8 million to $117.9 million, and theythe actuaries selected the most-likely number of $107.4 million. For the year ended December 31, 2011, the actuaries developed a range from a low of $227.0 million to a high of $260.2 million and with a most-likely number of $243.0 million. The actuaries’ range of estimates for commercial lines in 2011 was $122.6 million to $140.4 million, and they selected the most-likely number of $131.2 million. The actuaries’ range of estimates for personal lines in 2011 was $104.4 million to $119.8 million, and they selected the most-likely number of $111.8 million.
Our insurance subsidiaries seek to enhance their underwriting results by carefully selecting the product lines they underwrite. For personal lines products, our insurance subsidiaries insure standard and preferred risks in private passenger automobile and homeowners lines. For commercial lines products, the commercial risks that our insurance subsidiaries primarily insure are business offices, wholesalers, service providers, contractors, artisans and light manufacturing operations. Our insurance subsidiaries have limited exposure to asbestos and other environmental liabilities. Our insurance subsidiaries write no medical malpractice liability risks. Through the consistent application of this disciplined underwriting philosophy, our insurance subsidiaries have avoided many of the “long-tail” issues other insurance companies have faced. We consider workers’ compensation to be a “long-tail” line of business, in that workers’ compensation claims tend to be settled over a longer time frame than those in ourthe other lines of business.business of our insurance subsidiaries.
-41-
The following table presents 20122013 and 20112012 claim count and payment amount information for workers’ compensation. Workers’ compensation losses primarily consist of indemnity and medical costs for injured workers.
| For the Year Ended December 31, | For the Year Ended December 31, | |||||||||||||||
| (dollars in thousands) | 2012 | 2011 | 2013 | 2012 | ||||||||||||
Number of claims pending, beginning of period | 2,430 | 2,064 | 2,345 | 2,430 | ||||||||||||
Number of claims reported | 6,114 | 5,409 | 6,869 | 6,114 | ||||||||||||
Number of claims settled or dismissed | 6,199 | 5,043 | 6,605 | 6,199 | ||||||||||||
Number of claims pending, end of period | 2,345 | 2,430 | 2,609 | 2,345 | ||||||||||||
Losses paid | $ | 30,860 | $ | 24,596 | $ | 32,419 | $ | 30,860 | ||||||||
Loss expenses paid | 6,518 | 4,602 | 7,365 | 6,518 | ||||||||||||
Investments
We make estimates concerning the valuation of our investments and the recognition of other-than-temporary declines in the value of our investments. For equity securities, we write down the investment to its fair value and we reflect the amount of the write-down as a realized loss in our results of operations when we consider the decline in value of an individual investment to be other than temporary. We individually monitor all investments for other-than-temporary declines in value. Generally, we assume there has been an other-than-temporary decline in value if an individual equity security has depreciated in value by more than 20% of original cost and has been in such an unrealized loss position for more than six months. We held sevenfour equity securities that were in an unrealized loss position at December 31, 2012.2013. Based upon our analysis of general market conditions and underlying factors impacting these equity securities, we considered these declines in value to be temporary. With respect to a debt security that is in an unrealized loss position, we first assess if we intend to sell the debt security. If we determine we intend to sell the debt security, we recognize the impairment loss in our results of operations. If we do not intend to sell the debt security, we determine whether it is more likely than not that we will be required to sell the security prior to recovery. If we determine it is more likely than not that we will be required to sell the debt security prior to recovery, we recognize an impairment loss in our results of operations. If we determine it is more likely than not that we will not be required to sell the debt security prior to recovery, we then evaluate whether a credit loss has occurred. We determine whether a credit loss has occurred by comparing the amortized cost of the debt security to the present value of the cash flows we expect to collect. If we expect a cash flow shortfall, we consider that a credit loss has occurred. If we determine that a credit loss has occurred, we consider the impairment to be other than temporary. We then recognize the amount of the impairment loss related to the credit loss in our results of operations, and we recognize the remaining portion of the impairment loss in our other comprehensive income, net of applicable taxes. In addition, we may write down securities in an unrealized loss position based on a number of other factors, including when the fair value of an investment is significantly below its cost, when the financial condition of the issuer of a security has deteriorated, the occurrence of industry, company or geographic events that have negatively impacted the value of a security and rating agency downgrades. We held 46216 debt securities that were in an
-42-
unrealized loss position at December 31, 2012.2013. Based upon our analysis of general market conditions and underlying factors impacting these debt securities, we considered these declines in value to be temporary. We did not recognize any impairment losses in 2013, 2012 2011 or 2010.2011.
We held fixed maturities and equity securities with unrealized losses representing declines that we considered temporary at December 31, 2013 as follows:
| Less than 12 months | 12 months or longer | |||||||||||||||
| Fair Value | Unrealized Losses | Fair Value | Unrealized Losses | |||||||||||||
U.S. Treasury securities and obligations of U.S. government corporations and agencies | $ | 50,802,809 | $ | 821,941 | $ | 4,642,775 | $ | 104,331 | ||||||||
Obligations of states and political subdivisions | 65,170,891 | 363,240 | 13,404,781 | 98,676 | ||||||||||||
Corporate securities | 16,693,759 | 83,535 | 6,851,898 | 71,802 | ||||||||||||
Mortgage-backed securities | 72,878,347 | 535,944 | 19,013,889 | 213,414 | ||||||||||||
Equity securities | 1,628,893 | 92,867 | — | — | ||||||||||||
|
|
|
|
|
|
|
| |||||||||
Totals | $ | 207,174,699 | $ | 1,897,527 | $ | 43,913,343 | $ | 488,223 | ||||||||
|
|
|
|
|
|
|
| |||||||||
-42-
We held fixed maturities and equity securities with unrealized losses representing declines that we considered temporary at December 31, 2012 as follows:
| Less than 12 months | 12 months or longer | |||||||||||||||
| Fair Value | Unrealized Losses | Fair Value | Unrealized Losses | |||||||||||||
U.S. Treasury securities and obligations of U.S. government corporations and agencies | $ | 12,308,333 | $ | 43,951 | $ | — | $ | — | ||||||||
Obligations of states and political subdivisions | 22,134,226 | 606,065 | — | — | ||||||||||||
Corporate securities | 12,271,750 | 79,136 | 2,958,520 | 29,573 | ||||||||||||
Residential mortgage-backed securities | 22,491,562 | 66,443 | — | — | ||||||||||||
Equity securities | 2,226,050 | 106,748 | — | — | ||||||||||||
|
|
|
|
|
|
|
| |||||||||
Totals | $ | 71,431,921 | $ | 902,343 | $ | 2,958,520 | $ | 29,573 | ||||||||
|
|
|
|
|
|
|
| |||||||||
We held fixed maturities and equity securities with unrealized losses representing declines that we considered temporary at December 31, 2011 as follows:
| Less than 12 months | 12 months or longer | Less than 12 months | 12 months or longer | |||||||||||||||||||||||||||||
| Fair Value | Unrealized Losses | Fair Value | Unrealized Losses | Fair Value | Unrealized Losses | Fair Value | Unrealized Losses | |||||||||||||||||||||||||
U.S. Treasury securities and obligations of U.S. government corporations and agencies | $ | — | $ | — | $ | — | $ | — | $ | 12,308,333 | $ | 43,951 | $ | — | $ | — | ||||||||||||||||
Obligations of states and political subdivisions | 1,638,135 | 17,390 | 540,062 | 21,400 | 22,134,226 | 606,065 | — | — | ||||||||||||||||||||||||
Corporate securities | 10,101,753 | 528,164 | — | — | 12,271,750 | 79,136 | 2,958,520 | 29,573 | ||||||||||||||||||||||||
Residential mortgage-backed securities | 7,411,682 | 43,692 | 626 | 9 | ||||||||||||||||||||||||||||
Mortgage-backed securities | 22,491,562 | 66,443 | — | — | ||||||||||||||||||||||||||||
Equity securities | 4,083,863 | 407,705 | — | — | 2,226,050 | 106,748 | — | — | ||||||||||||||||||||||||
|
|
|
|
|
|
|
| |||||||||||||||||||||||||
Totals | $ | 23,235,433 | $ | 996,951 | $ | 540,688 | $ | 21,409 | $ | 71,431,921 | $ | 902,343 | $ | 2,958,520 | $ | 29,573 | ||||||||||||||||
|
|
|
|
|
|
|
| |||||||||||||||||||||||||
We present our investments in available-for-sale fixed maturity and equity securities at estimated fair value. The estimated fair value of a security may differ from the amount that could be realized if we sold the security in a forced transaction. In addition, the valuation of fixed maturity investments is more subjective when markets are less liquid, increasing the potential that the estimated fair value does not reflect the price at which an actual transaction would occur. We utilize nationally recognized independent pricing services to estimate fair values or obtain market quotations for substantially all of our fixed maturity and equity investments. We generally obtain one price per security. The pricing services utilize market quotations for fixed maturity and equity securities that have quoted prices in active markets. For fixed maturity securities that generally do not trade on a daily basis, the pricing services prepare estimates of fair value measurements based predominantly on observable market inputs. The pricing services do not use broker quotes in determining the fair values of our investments. Our investment personnel review the estimates of fair value the pricing services provide to determine if the estimates we obtain are representative of fair values based upon their general knowledge of the market, their research findings related to unusual fluctuations in value and their comparison of such values to execution prices for similar securities. Our investment personnel monitor the market and are familiar with current trading ranges for similar securities and pricing of specific investments. Our investment personnel review all pricing estimates that we receive from the pricing services against their expectations with respect to pricing based on fair market curves, security ratings, coupon rates, security type and recent trading activity. Our investment personnel review documentation with respect to the pricing services’ pricing methodology that they obtain periodically to determine if the primary pricing sources, market inputs and pricing frequency for various security types are reasonable. At December 31, 20122013 and 2011,2012, we received one estimate per security from one of the pricing services, and we priced substantially all of our Level 1 and Level 2 investments using those prices. In our review of the estimates the pricing services provided at December 31, 20122013 and 2011,2012, we did not identify any discrepancies, and we did not make any adjustments to the estimates the pricing services provided.
We had no sales or transfers from the held to maturity portfolio in 2013, 2012 2011 or 2010.
-43-
Policy Acquisition Costs
We defer our insurance subsidiaries’ policy acquisition costs, consisting primarily of commissions, premium taxes and certain other underwriting costs, reduced by ceded commissions, that vary with and relate directly to the production of business andbusiness. We amortize these costs over the period in which our insurance subsidiaries earn the premiums.premiums on that business. The method our insurance subsidiaries follow in computing deferred policy acquisition costs limits the amount of such deferred costs to their estimated realizable value, which gives effect to the premium to be earned, related investment income, losses and loss expenses and certain other costs we expect to incur as our insurance subsidiaries earn the premium.
Management Evaluation of Operating Results
Despite headwinds from economic uncertainty, challenging insurance market conditions and unusually adverse weather conditions that affected our results in recent years, we believe that our focused business strategy, including our insurance subsidiaries’ disciplined underwriting practices, have positioned us well for 20132014 and beyond.
The property and casualty insurance industry is highly cyclical, and individual lines of business experience their own cycles within the overall property and casualty insurance industry cycle. Premium rate levels relate to the availability of insurance coverage, which varies according to the level of surplus in the insurance industry and other factors. The level of surplus in the industry varies with returns on capital and regulatory barriers to the withdrawal of surplus. Increases in surplus have generally been accompanied by increased price competition among property and casualty insurers. If our insurance subsidiaries were to find it necessary to reduce premiums or limit premium increases due to competitive pressures on pricing, our insurance subsidiaries could experience a reduction in profit margins and revenues, an increase in ratios of losses and expenses to premiums and, therefore, lower profitability. The cyclicality of the insurance market and its potential impact on our
-43-
results is difficult to predict with any significant reliability. We evaluate the performance of our commercial lines and personal lines segments primarily based upon the underwriting results of our insurance subsidiaries as determined under statutory accounting practices (“SAP”), which our management uses to measure performance for the total business of our insurance subsidiaries.
-44-
We use the following financial data to monitor and evaluate our operating results:
| Year Ended December 31, | Year Ended December 31, | |||||||||||||||||||||||
| (in thousands) | 2012 | 2011 | 2010 | 2013 | 2012 | 2011 | ||||||||||||||||||
Net premiums written: | ||||||||||||||||||||||||
Personal lines: | ||||||||||||||||||||||||
Automobile | $ | 195,132 | $ | 186,677 | $ | 171,497 | $ | 196,363 | $ | 195,132 | $ | 186,677 | ||||||||||||
Homeowners | 97,120 | 89,405 | 83,415 | 106,420 | 97,120 | 89,405 | ||||||||||||||||||
Other | 16,319 | 14,983 | 13,135 | 15,915 | 16,319 | 14,983 | ||||||||||||||||||
|
|
|
|
|
| |||||||||||||||||||
Total personal lines | 308,571 | 291,065 | 268,047 | 318,698 | 308,571 | 291,065 | ||||||||||||||||||
|
|
|
|
|
| |||||||||||||||||||
Commercial lines: | ||||||||||||||||||||||||
Automobile | 51,261 | 46,168 | 37,094 | 58,165 | 51,261 | 46,168 | ||||||||||||||||||
Workers’ compensation | 65,390 | 51,849 | 34,920 | 77,589 | 65,390 | 51,849 | ||||||||||||||||||
Commercial multi-peril | 64,476 | 57,988 | 47,411 | 74,516 | 64,476 | 57,988 | ||||||||||||||||||
Other | 6,749 | 6,981 | 4,050 | 4,463 | 6,749 | 6,981 | ||||||||||||||||||
|
|
|
|
|
| |||||||||||||||||||
Total commercial lines | 187,876 | 162,986 | 123,475 | 214,733 | 187,876 | 162,986 | ||||||||||||||||||
|
|
|
|
|
| |||||||||||||||||||
Total net premiums written | $ | 496,447 | $ | 454,051 | $ | 391,522 | $ | 533,431 | $ | 496,447 | $ | 454,051 | ||||||||||||
|
|
|
|
|
| |||||||||||||||||||
Components of GAAP combined ratio: | ||||||||||||||||||||||||
Loss ratio | 70.1 | % | 78.9 | % | 72.6 | % | 66.6 | % | 70.1 | % | 78.9 | % | ||||||||||||
Expense ratio | 31.2 | 31.4 | 32.0 | 31.8 | 31.2 | 31.4 | ||||||||||||||||||
Dividend ratio | 0.3 | 0.3 | 0.1 | 0.4 | 0.3 | 0.3 | ||||||||||||||||||
|
|
|
|
|
| |||||||||||||||||||
GAAP combined ratio | 101.6 | % | 110.6 | % | 104.7 | % | 98.8 | % | 101.6 | % | 110.6 | % | ||||||||||||
|
|
|
|
|
| |||||||||||||||||||
Revenues: | ||||||||||||||||||||||||
Premiums earned: | ||||||||||||||||||||||||
Personal lines | $ | 300,272 | $ | 282,498 | $ | 260,900 | $ | 312,309 | $ | 300,272 | $ | 282,498 | ||||||||||||
Commercial lines | 174,735 | 152,247 | 117,755 | 202,983 | 174,735 | 152,247 | ||||||||||||||||||
|
|
|
|
|
| |||||||||||||||||||
SAP premiums earned | 475,007 | 434,745 | 378,655 | 515,292 | 475,007 | 434,745 | ||||||||||||||||||
GAAP adjustments | (5 | ) | (3,275 | ) | (625 | ) | — | (5 | ) | (3,275 | ) | |||||||||||||
|
|
|
|
|
| |||||||||||||||||||
GAAP premiums earned | 475,002 | 431,470 | 378,030 | 515,292 | 475,002 | 431,470 | ||||||||||||||||||
Net investment income | 20,169 | 20,858 | 19,950 | 18,795 | 20,169 | 20,858 | ||||||||||||||||||
Realized investment gains | 6,859 | 12,281 | 4,396 | 2,423 | 6,859 | 12,281 | ||||||||||||||||||
Equity in earnings (loss) of DFSC | 4,533 | 2,023 | (269 | ) | ||||||||||||||||||||
Equity in earnings of DFSC | 2,908 | 4,533 | 2,023 | |||||||||||||||||||||
Other | 8,420 | 8,386 | 6,442 | 7,692 | 8,420 | 8,386 | ||||||||||||||||||
|
|
|
|
|
| |||||||||||||||||||
Total revenues | $ | 514,983 | $ | 475,018 | $ | 408,549 | $ | 547,110 | $ | 514,983 | $ | 475,018 | ||||||||||||
|
|
|
|
|
| |||||||||||||||||||
-45-
| Year Ended December 31, | Year Ended December 31, | |||||||||||||||||||||||
| (in thousands) | 2012 | 2011 | 2010 | 2013 | 2012 | 2011 | ||||||||||||||||||
Components of net income: | ||||||||||||||||||||||||
Underwriting income (loss): | ||||||||||||||||||||||||
Personal lines | $ | (18,236 | ) | $ | (40,739 | ) | $ | (22,526 | ) | $ | 1,654 | $ | (18,236 | ) | $ | (40,739 | ) | |||||||
Commercial lines | 5,251 | (6,560 | ) | 2,252 | (524 | ) | 5,251 | (6,560 | ) | |||||||||||||||
|
|
|
|
|
| |||||||||||||||||||
SAP underwriting loss | (12,985 | ) | (47,299 | ) | (20,274 | ) | ||||||||||||||||||
SAP underwriting income (loss) | 1,130 | (12,985 | ) | (47,299 | ) | |||||||||||||||||||
GAAP adjustments | 5,545 | 1,532 | 2,458 | 5,175 | 5,545 | 1,532 | ||||||||||||||||||
|
|
|
|
|
| |||||||||||||||||||
GAAP underwriting loss | (7,440 | ) | (45,767 | ) | (17,816 | ) | ||||||||||||||||||
GAAP underwriting income (loss) | 6,305 | (7,440 | ) | (45,767 | ) | |||||||||||||||||||
Net investment income | 20,169 | 20,858 | 19,950 | 18,795 | 20,169 | 20,858 | ||||||||||||||||||
Realized investment gains | 6,859 | 12,281 | 4,396 | 2,423 | 6,859 | 12,281 | ||||||||||||||||||
Equity in earnings (loss) of DFSC | 4,533 | 2,023 | (269 | ) | ||||||||||||||||||||
Equity in earnings of DFSC | 2,908 | 4,533 | 2,023 | |||||||||||||||||||||
Other | 3,737 | 3,866 | 3,583 | 2,279 | 3,737 | 3,866 | ||||||||||||||||||
|
|
|
|
|
| |||||||||||||||||||
Income (loss) before income tax (expense) benefit | 27,858 | (6,739 | ) | 9,844 | 32,710 | 27,858 | (6,739 | ) | ||||||||||||||||
Income tax (expense) benefit | (4,765 | ) | 7,192 | 1,623 | (6,388 | ) | (4,765 | ) | 7,192 | |||||||||||||||
|
|
|
|
|
| |||||||||||||||||||
Net income | $ | 23,093 | $ | 453 | $ | 11,467 | $ | 26,322 | $ | 23,093 | $ | 453 | ||||||||||||
|
|
|
|
|
| |||||||||||||||||||
Statutory Combined Ratios
We evaluate our insurance operations by monitoring certain key measures of growth and profitability. In addition to using GAAP-based performance measurements, we also utilize certain non-GAAP financial measures that we believe are valuable in managing our business and for comparison to our peers. These non-GAAP measures are underwriting (loss) income, statutory combined ratio and net premiums written. An insurance company’s statutory combined ratio is a standard measure of underwriting profitability. This ratio is the sum of the ratio of calendar-year incurred losses and loss expenses to premiums earned; the ratio of expenses incurred for commissions, premium taxes and underwriting expenses to premiums written and the ratio of dividends to policyholders to premiums earned. The statutory combined ratio does not reflect investment income, federal income taxes or other non-operating income or expense. A ratio of less than 100 percent generally indicates underwriting profitability. The statutory combined ratio differs from the GAAP combined ratio. In calculating the GAAP combined ratio, installment payment fees are not deducted from incurred expenses and the expense ratio is based on premiums earned instead of premiums written. The following table sets forth our insurance subsidiaries’ statutory combined ratios by major line of business for the years ended December 31, 2013, 2012 2011 and 2010:2011:
| Year Ended December 31, | Year Ended December 31, | |||||||||||||||||||||||
| 2012 | 2011 | 2010 | 2013 | 2012 | 2011 | |||||||||||||||||||
Commercial lines: | ||||||||||||||||||||||||
Automobile | 94.5 | % | 105.4 | % | 90.0 | % | 104.9 | % | 94.5 | % | 105.4 | % | ||||||||||||
Workers’ compensation | 98.1 | 96.0 | 99.3 | 96.9 | 98.1 | 96.0 | ||||||||||||||||||
Commercial multi-peril | 90.5 | 103.0 | 96.7 | 92.9 | 90.5 | 103.0 | ||||||||||||||||||
Other | 15.0 | 46.1 | 42.8 | NM | 1 | 15.0 | 46.1 | |||||||||||||||||
Total commercial lines | 91.2 | 99.0 | 93.6 | 95.7 | 91.2 | 99.0 | ||||||||||||||||||
Personal lines: | ||||||||||||||||||||||||
Automobile | 108.1 | 106.9 | 103.8 | 103.2 | 108.1 | 106.9 | ||||||||||||||||||
Homeowners | 100.9 | 126.3 | 115.4 | 93.0 | 100.9 | 126.3 | ||||||||||||||||||
Other | 89.4 | 103.6 | 97.0 | 80.5 | 89.4 | 103.6 | ||||||||||||||||||
Total personal lines | 105.0 | 112.6 | 107.0 | 98.8 | 105.0 | 112.6 | ||||||||||||||||||
Total commercial and personal lines | 99.8 | 107.9 | 102.9 | 97.4 | 99.8 | 107.9 | ||||||||||||||||||
| 1 | Not meaningful |
-46-
Results of Operations
YEAR ENDED DECEMBER 31, 2013 COMPARED TO YEAR ENDED DECEMBER 31, 2012
Net Premiums Written
Our insurance subsidiaries’ 2013 net premiums written increased 7.5% to $533.4 million, compared to $496.4 million for 2012. We primarily attribute the increase to a reduction in MICO’s quota-share reinsurance, the impact of premium rate increases and an increase in the writing of commercial lines of insurance. Effective January 1, 2013, MICO reduced its external quota-share reinsurance percentage from 40% to 30%. Commercial lines net premiums written increased $26.6 million, or 14.1%, for 2013 compared to 2012. The increase includes $5.6 million related to the reduction in the amount of premium MICO reinsured in 2013, with the remainder attributable to increased writings of new accounts in the commercial automobile, commercial multi-peril and workers’ compensation lines of business. Personal lines net premiums written increased $10.4 million, or 3.4%, for 2013 compared to 2012. The increase includes $4.2 million resulting from the reduction in the amount of premium MICO reinsured in 2013, with the remainder primarily attributable to premium rate increases our subsidiaries implemented throughout 2012 and 2013 and reduced reinsurance reinstatement premiums.
Net Premiums Earned
Our insurance subsidiaries’ net premiums earned increased to $515.3 million for 2013, an increase of $40.3 million, or 8.5%, over 2012, reflecting increases in net premiums written during 2012 and 2013. Our insurance subsidiaries earn premiums and recognize them as income over the terms of the policies they issue. Such terms are generally one year or less in duration. Therefore, increases or decreases in net premiums earned generally reflect increases or decreases in net premiums written in the preceding twelve-month period compared to the same period one year earlier.
Investment Income
For 2013, our net investment income was $18.8 million, a $1.4 million decrease from 2012. An increase in our average invested assets from $795.9 million in 2012 to $799.1 million in 2013 was offset by a decrease in our annualized average rate of return to 2.4% in 2013, compared to 2.5% in 2012.
Installment Payment Fees
Our insurance subsidiaries’ installment fees decreased primarily as a result of their customers’ increased usage of payment plans that have lower installment payment fees during 2013.
Net Realized Investment Gains/Losses
Our net realized investment gains in 2013 and 2012 were $2.4 million and $6.9 million, respectively. The net realized investment gains in 2013 and 2012 resulted from normal turnover within our investment portfolio. We did not recognize any impairment losses during 2013 or 2012.
Equity in Earnings of DFSC
Our equity in the earnings of DFSC in 2013 and 2012 was $2.9 million and $4.5 million, respectively. The decrease in DFSC’s earnings resulted from a lesser benefit from acquisition accounting adjustments and lower net realized gains during 2013 compared to 2012.
Losses and Loss Expenses
Our insurance subsidiaries’ loss ratio, which is the ratio of incurred losses and loss expenses to premiums earned, was 66.6% in 2013, compared to 70.1% in 2012. Our insurance subsidiaries’ commercial lines loss ratio increased to 67.1% in 2013, compared to 65.5% in 2012. This increase resulted primarily from the commercial automobile loss ratio increasing to 73.0% in 2013, compared to 63.8% in 2012, and the commercial multi-peril ratio increasing to 61.5% in 2013, compared to 60.2% in 2012. The personal lines loss ratio decreased to 66.3% in 2013, compared to 72.8% in 2012, primarily as a result of a decrease in the homeowners loss ratio to 57.7% in 2013, compared to 66.1% in 2012, as a result of a decrease in weather-related claims. Our insurance subsidiaries experienced unfavorable loss reserve development of approximately $10.4 million during 2013 in their reserves for prior accident years, compared to unfavorable loss reserve development of approximately $7.6 million during 2012. The change in loss reserve development patterns occurred primarily within our insurance subsidiaries’ workers’ compensation, commercial automobile, commercial multi-peril and personal automobile reserves.
-47-
Underwriting Expenses
Our insurance subsidiaries’ expense ratio, which is the ratio of policy acquisition and other underwriting expenses to premiums earned, was 31.8% in 2013, compared to 31.2% in 2012.
Combined Ratio
Our insurance subsidiaries’ combined ratio was 98.8% and 101.6% in 2013 and 2012, respectively. The combined ratio represents the sum of the loss ratio, the expense ratio and the dividend ratio, which is the ratio of workers’ compensation policy dividends incurred to premiums earned.
Interest Expense
Our interest expense in 2013 was $1.6 million, compared to $2.4 million in 2012. The decrease was related to a lower average interest rate on borrowings during 2013 compared to 2012 due to the utilization of Federal Home Loan Bank (“FHLB”) borrowings to prepay $15.5 million of subordinated debentures during the first quarter of 2013.
Income Taxes
Our income tax expense was $6.4 million in 2013, compared to $4.8 million in 2012. Our effective tax rate for 2013 was 19.5%, compared to 17.1% for 2012. The change in effective tax rates is primarily due to tax-exempt interest income representing a smaller proportion of income before income tax expense in 2013 compared to 2012.
Net Income and Earnings Per Share
Our net income in 2013 was $26.3 million, or $1.02 per share of Class A common stock on a diluted basis and $.94 per share of Class B common stock, compared to $23.1 million, or $.91 per share of Class A common stock on a diluted basis and $.83 per share of Class B common stock, in 2012. We had 20.8 million and 20.0 million Class A shares outstanding at December 31, 2013 and 2012, respectively. We had 5.6 million Class B shares outstanding for both periods. There are no outstanding securities that dilute our shares of Class B common stock.
Book Value Per Share and Return on Equity
Our stockholders’ equity decreased by $3.2 million in 2013. We attribute the decrease to net after-tax unrealized losses within our available-for-sale fixed maturity investment portfolio during 2013. Book value per share decreased to $15.02 at December 31, 2013, compared to $15.63 a year earlier. Our return on average equity was 6.6% for 2013, compared to 5.9% for 2012.
YEAR ENDED DECEMBER 31, 2012 COMPARED TO YEAR ENDED DECEMBER 31, 2011
Net Premiums Written
Our insurance subsidiaries’ 2012 net premiums written increased 9.3% to $496.4 million, compared to $454.1 million for 2011. We primarily attribute the increase to a change in MICO’s quota-share reinsurance, the impact of premium rate increases and an increase in the writing of commercial lines of insurance. Effective January 1, 2012, MICO reduced its external quota-share reinsurance percentage from 50% to 40%. Commercial lines net premiums written increased $26.7 million, or 16.5%, for 2012 compared to 2011. The increase includes $5.3 million related to the reduction in the amount of premium MICO reinsured in 2012, with the remainder attributable to increased writings of new accounts in the commercial automobile, commercial multi-peril and workers’ compensation lines of business. Personal lines net premiums written increased $15.7 million, or 5.4%, for 2012 compared to 2011. The increase includes $4.6 million resulting from the reduction in the amount of premium MICO reinsured in 2012, with the remainder primarily attributable to premium rate increases our subsidiaries implemented throughout 2011 and 2012 and reduced reinsurance reinstatement premiums.
Net Premiums Earned
Our insurance subsidiaries’ net premiums earned increased to $475.0 million for 2012, an increase of $43.5 million, or 10.1%, over 2011, reflecting increases in net premiums written during 2011 and 2012. Our insurance subsidiaries earn premiums and recognize them as income over the terms of the policies they issue. Such terms are generally one year or less in duration. Therefore, increases or decreases in net premiums earned generally reflect increases or decreases in net premiums written in the preceding twelve-month period compared to the same period one year earlier.
-48-
Investment Income
For 2012, our net investment income was $20.2 million, a slight decrease from 2011. An increase in our average invested assets from $756.9 million in 2011 to $795.9 million in 2012 was offset by a decrease in our annualized average rate of return to 2.5% in 2012, compared to 2.8% in 2011.
Installment Payment Fees
Our insurance subsidiaries’ installment fees increased primarily as a result of increases in policy counts during 2012.
Net Realized Investment Gains/Losses
Our net realized investment gains in 2012 and 2011 were $6.9 million and $12.3 million, respectively. The net realized investment gains in 2012 resulted from normal turnover within our investment portfolio. The net realized investment gains for 2011 included $8.0 million in gains that resulted from the previously planned periodic sales of a portion of our holdings of an equity security that we obtained in an initial public offering and for which a selling restriction expired during 2011. We did not recognize any impairment losses during 2012 or 2011.
Equity in Earnings of DFSC
Our equity in the earnings of DFSC in 2012 and 2011 was $4.5 million and $2.0 million, respectively. The increase in DFSC’s earnings reflects the impact of the merger of UNNF and DFSC.
Losses and Loss Expenses
Our insurance subsidiaries’ loss ratio, which is the ratio of incurred losses and loss expenses to premiums earned, was 70.1% in 2012, compared to 78.9% in 2011. Our insurance subsidiaries’ commercial lines loss ratio decreased to 65.5% in 2012, compared to 71.8% in 2011. This decrease resulted primarily from the commercial automobile loss ratio decreasing to 63.8% in 2012, compared to 72.4% in 2011, and the commercial multi-peril ratio decreasing to 60.2% in 2012, compared to 74.8% in 2011, as a result of decreased claim severity. The personal lines loss ratio decreased to 72.8% in 2012, compared to 82.8% in 2011, primarily as a result of a decrease in the homeowners loss ratio to 66.1% in 2012, compared to 97.1% in 2011, as a result of a decrease in weather-related claims. Our insurance subsidiaries experienced unfavorable loss reserve development of approximately $7.6 million during 2012 in their reserves for prior accident years, compared to virtually no development for 2011. The change in loss reserve development patterns occurred primarily within our insurance subsidiaries’ workers’ compensation and personal automobile reserves.
-47-
Underwriting Expenses
Our insurance subsidiaries’ expense ratio, which is the ratio of policy acquisition and other underwriting expenses to premiums earned, was 31.2% in 2012, compared to 31.4% in 2011.
Combined Ratio
Our insurance subsidiaries’ combined ratio was 101.6% and 110.6% in 2012 and 2011, respectively. The combined ratio represents the sum of the loss ratio, expense ratio and dividend ratio, which is the ratio of workers’ compensation policy dividends incurred to premiums earned.
Interest Expense
Our interest expense in 2012 was $2.4 million, compared to $2.1 million in 2011. The higher interest expense in 2012 reflected an increase in our borrowings under our line of credit.
Income Taxes
Our income tax expense was $4.8 million in 2012, compared to a tax benefit of $7.2 million in 2011. Our effective tax rate for 2012 was 17.1%.
-49-
Net Income and Earnings Per Share
Our net income in 2012 was $23.1 million, or $.91 per share of Class A common stock on a diluted basis and $.83 per share of Class B common stock, compared to $452,953, or $.02 per share of Class A common stock on a diluted basis and $.01 per share of Class B common stock, in 2011. We had 20.0 million Class A shares and 5.6 million Class B shares outstanding for both periods. There are no outstanding securities that dilute our shares of Class B common stock.
Book Value Per Share and Return on Equity
Our stockholders’ equity increased by $16.6 million in 2012. We attribute the increase to our net income of $23.1 million and an increase in our net after-tax unrealized gains within our available-for-sale fixed maturity and equity investment portfolio from $23.5 million at December 31, 2011 to $26.4 million at December 31, 2012. Book value per share increased by 4.1% to $15.63 at December 31, 2012, compared to $15.01 a year earlier. Our return on average equity was 5.9% for 2012, compared to 0.1% for 2011.
YEAR ENDED DECEMBER 31, 2011 COMPARED TO YEAR ENDED DECEMBER 31, 2010
Net Premiums Written
Our insurance subsidiaries’ 2011 net premiums written increased 16.0% to $454.1 million, compared to $391.5 million for 2010. We primarily attribute the increase to $42.8 million of net premiums written related to our acquisition of MICO. Commercial lines net premiums written increased $39.5 million, or 32.0%, for 2011 compared to 2010. The increase included $22.5 million from MICO, with the remainder attributable to increased writings of new accounts in the commercial automobile, commercial multi-peril and workers’ compensation lines of business. Personal lines net premiums written increased $23.1 million, or 8.6%, for 2011 compared to 2010. The increase included $20.3 million from MICO, with the remainder primarily attributable to pricing increases in the personal automobile and homeowners lines of business.
Net Premiums Earned
Our insurance subsidiaries’ net premiums earned increased to $431.5 million for 2011, an increase of $53.5 million, or 14.2%, over 2010, reflecting increases in net premiums written during 2010 and 2011. Our insurance subsidiaries earn premiums and recognize them as income over the terms of the policies they issue. Such terms are generally one year or less in duration. Therefore, increases or decreases in net premiums earned will generally reflect increases or decreases in net premiums written in the preceding twelve-month period compared to the same period one year earlier.
Investment Income
For 2011, our net investment income was $20.9 million, an increase of $1.0 million from 2010. An increase in our average invested assets from $697.7 million in 2010 to $756.9 million in 2011 was offset by a decrease in our annualized average rate of return to 2.8% in 2011, compared to 2.9% in 2010. The increase in our average invested assets reflected the additional invested assets we acquired as part of the MICO transaction.
-48-
Installment Payment Fees
Our insurance subsidiaries’ installment fees increased primarily as a result of our acquisition of MICO and increases in policy counts during 2011.
Net Realized Investment Gains/Losses
Our net realized investment gains in 2011 and 2010 were $12.3 million and $4.4 million, respectively. The net realized investment gains for 2011 included $8.0 million in gains that resulted from the previously planned periodic sales of a portion of our holdings of an equity security that we obtained in an initial public offering and for which a selling restriction expired during 2011. The net realized investment gains in 2010 resulted from normal turnover within our investment portfolio. We did not recognize any impairment losses during 2011 or 2010.
Losses and Loss Expenses
Our insurance subsidiaries’ loss ratio, which is the ratio of incurred losses and loss expenses to premiums earned, was 78.9% in 2011, compared to 72.6% in 2010. Our insurance subsidiaries’ commercial lines loss ratio increased to 71.8% in 2011, compared to 66.6% in 2010. This increase resulted primarily from the commercial automobile loss ratio increasing to 72.4% in 2011, compared to 55.5% in 2010, and the commercial multi-peril ratio increasing to 74.8% in 2011, compared to 67.4% in 2010, as a result of increased claim severity. The personal lines loss ratio increased to 82.8% in 2011, compared to 75.3% in 2010, primarily as a result of an increase in the homeowners loss ratio to 97.1% in 2011, compared to 80.7% in 2010, as a result of an increase in weather-related claims. Our insurance subsidiaries incurred total weather-related losses of $52.6 million for 2011, compared to $33.0 million for 2010 and more than twice our prior five-year average of $23.3 million. Our insurance subsidiaries had virtually no development during 2011 in their reserves for prior accident years, compared to $2.9 million in favorable development for 2010.
Underwriting Expenses
Our insurance subsidiaries’ expense ratio, which is the ratio of policy acquisition and other underwriting expenses to premiums earned, was 31.4% in 2011, compared to 32.0% in 2010.
Combined Ratio
Our insurance subsidiaries’ combined ratio was 110.6% and 104.7% in 2011 and 2010, respectively. The combined ratio represents the sum of the loss ratio, expense ratio and dividend ratio, which is the ratio of workers’ compensation policy dividends incurred to premiums earned.
Interest Expense
Our interest expense in 2011 was $2.1 million, compared to $799,578 in 2010. The higher interest expense in 2011 reflected an increase in our borrowings under our line of credit.
Income Taxes
Our income tax benefit was $7.2 million in 2011, compared to $1.6 million in 2010. We recorded an income tax benefit based upon our loss before income tax and tax-exempt interest income earned for 2011. We carried back a portion of our 2011 net operating loss to the taxable income of prior years and our income tax benefit for 2011 reflected a current tax benefit for the carryback. We expected to apply the remainder of the 2011 net operating loss to taxable income we generate in future periods, and our income tax benefit for 2011 reflected a deferred tax benefit for the carryforward.
Net Income and Earnings Per Share
Our net income in 2011 was $452,953, or $.02 per share of Class A common stock and $.01 per share of Class B common stock, compared to our net income of $11.5 million, or $.46 per share of Class A common stock and $.41 per share of Class B common stock, in 2010. Our Class A shares outstanding did not change at 20.0 million. Our Class B shares outstanding remained at 5.6 million.
-49-
Book Value Per Share and Return on Equity
Our stockholders’ equity increased by $3.3 million in 2011. We attributed the increase to an increase in our net after-tax unrealized gains within our available-for-sale fixed maturity and equity investment portfolio from $8.6 million at December 31, 2010 to $23.5 million at December 31, 2011. Book value per share increased by 1.0% to $15.01 at December 31, 2011, compared to $14.86 a year earlier. Our return on average equity was 0.1% for 2011, compared to 3.0% for 2010.
Financial Condition
Liquidity and Capital Resources
Liquidity is a measure of an entity’s ability to secure enough cash to meet its contractual obligations and operating needs as they arise. Our major sources of funds from operations are the net cash flows generated from our insurance subsidiaries’ underwriting results, investment income and maturing investments.
We have historically generated sufficient net positive cash flow from our operations to fund our commitments and build our investment portfolio, thereby increasing future investment returns. The pooling agreement with Donegal Mutual historically has been cash flow positive because of the profitability of the underwriting pool. Because we settle the pool monthly, cash flows are substantially similar to cash flows that would result from the underwriting of direct business. We maintain a high degree of liquidity in our investment portfolio in the form of marketable fixed maturities, equity securities and short-term investments. We structure our fixed-maturity investment portfolio following a “laddering” approach so that projected cash flows from investment income and principal maturities are evenly distributed from a timing perspective. This laddering provides an additional measure of liquidity to meet our obligations and the obligations of our insurance subsidiaries should an unexpected variation occur in the future. Net cash flows provided by operating activities in 2013, 2012 and 2011 and 2010 were $46.0 million, $25.0 million $21.1 million and $22.0$21.1 million, respectively.
In June 2012,2013, we renewed our existing credit agreement with Manufacturers and Traders Trust Company (“M&T”) relating to a $60.0 million unsecured, revolving line of credit. The line of credit thatnow expires in July 2015.2016. We have the right to request a one-year extension of the credit agreement as of each anniversary date of the agreement. In December 2010 and March 2011, we borrowed $35.0 million and $3.5 million, respectively, in connection with our acquisition of MICO. In May 2011, we borrowed $19.0 million in connection with the merger of UNNF with and into DFSC. At December 31, 2012,2013, we had $52.0$43.0 million in outstanding borrowings and had the ability to borrow an additional $8.0$17.0 million at an interest raterates equal to M&T’s current prime rate or the then current LIBOR rate plus 2.25%, depending on our leverage ratio.. The interest rate on our outstanding borrowings is adjustable quarterly. At December 31, 2013, the interest rate on our outstanding borrowings was 2.42%. We pay a fee of 0.2% per annum on the loan commitment amount regardless of usage. The credit agreement requires our compliance with certain covenants. These covenants which include minimum levels of our net worth, leverage ratio, and statutory surplus and the A.M. Best ratings of our insurance subsidiaries. We complied with all requirements of the credit agreement during the year ended December 31, 2012.2013.
MICO has an agreement with the Federal Home Loan Bank (“FHLB”)FHLB of Indianapolis. Through its membership, MICO has the ability to issue debt to the FHLB of Indianapolis in exchange for cash advances. There were no outstanding borrowings at December 31, 20122013 or 2011.2012.
Atlantic States has an agreement withis a member of the FHLB of Pittsburgh. Through its membership, Atlantic States has the ability to issue debt to the FHLB of Pittsburgh in exchange for cash advances. There wereDuring 2013, Atlantic States issued secured debt in the principal amount of $15.0 million to the FHLB of Pittsburgh in exchange for cash advances in the amount of $15.0 million. The interest rate on the advances was .26% at December 31, 2013. Atlantic States then loaned $15.0 million to us. We used the proceeds of our loan from Atlantic States to fund our prepayment of our subordinated debentures. Atlantic States had no outstanding borrowings with the FHLB of Pittsburgh at December 31, 2012 or 2011.2012.
-50-
The following table shows expected payments for our significant contractual obligations at December 31, 2012:2013:
| (in thousands) | Total | Less than 1 year | 1-3 years | 4-5 years | After 5 years | Total | Less than 1 year | 1-3 years | 4-5 years | After 5 years | ||||||||||||||||||||||||||||||
Net liability for unpaid losses and loss expenses of our insurance subsidiaries | $ | 250,936 | $ | 114,528 | $ | 114,116 | $ | 10,095 | $ | 12,197 | $ | 265,605 | $ | 125,781 | $ | 118,706 | $ | 9,713 | $ | 11,405 | ||||||||||||||||||||
Subordinated debentures | 20,465 | 15,465 | — | — | 5,000 | 5,000 | — | — | — | 5,000 | ||||||||||||||||||||||||||||||
Borrowings under line of credit | 52,000 | — | 52,000 | — | — | 58,000 | 15,000 | 43,000 | — | — | ||||||||||||||||||||||||||||||
|
|
|
|
|
|
|
|
|
| |||||||||||||||||||||||||||||||
Total contractual obligations | $ | 323,401 | $ | 129,993 | $ | 166,116 | $ | 10,095 | $ | 17,197 | $ | 328,605 | $ | 140,781 | $ | 161,706 | $ | 9,713 | $ | 16,405 | ||||||||||||||||||||
|
|
|
|
|
|
|
|
|
| |||||||||||||||||||||||||||||||
We estimated the timing of the amounts for the net liability for unpaid losses and loss expenses of our insurance subsidiaries based on historical experience and expectations of future payment patterns. We have shown the liability net of reinsurance recoverable on unpaid losses and loss expenses to reflect expected future cash flows related to such liability. Assumed amounts from the underwriting pool with Donegal Mutual represent a substantial portion of our insurance subsidiaries’ gross liability for unpaid losses and loss expenses, and ceded amounts to the underwriting pool represent a substantial portion of our insurance subsidiaries’ reinsurance recoverable on unpaid losses and loss expenses. We include cash settlements of Atlantic States’ assumed liability from the pool in our monthly settlements of pooled activity. In these monthly settlements, we net amounts ceded to and assumed from the pool. Although Donegal Mutual and Atlantic States do not anticipate any further changes in the pool participation levels in the foreseeable future, any such change would be prospective in nature and therefore would not impact the timing of expected payments for Atlantic States’ proportionate liability for pooled losses occurring in periods prior to the effective date of such change.
We estimated the timing of the amounts for our subordinated debentures based on our principal prepayments in the amount of $15.5 million during 2013 and based on the contractual maturity for the remaining balance. We refer to Note 10 - Borrowings for more information about our subordinated debentures.
We estimated the timing of the amounts for the borrowings under our linelines of credit based on their contractual maturities as discussedthat we discuss in Note 109 - Borrowings. Our borrowings under our linelines of credit carry interest rates that vary as discussed in Note 109 - Borrowings. Based upon the interest rates in effect at December 31, 2012,2013, our annual interest cost associated with our borrowings under our linelines of credit is approximately $1.3$1.1 million. For every 1% change in the interest rate associated with our borrowings under our linelines of credit, the effect on our annual interest cost would be approximately $520,000.$580,000.
Cash dividends declared to stockholders totaled $13.0 million, $12.3 million and $12.0 million in 2013, 2012 and $11.5 million in 2012, 2011, and 2010, respectively. There are no regulatory restrictions on our payment of dividends to our stockholders, although there are state law restrictions on the payment of dividends from our insurance subsidiaries to us. Our insurance subsidiaries are required by law to maintain certain minimum surplus on a statutory basis and are subject to regulations under which their payment of dividends from statutory surplus is restricted and may require prior approval of their domiciliary insurance regulatory authorities. Our insurance subsidiaries are subject to risk-based capital (“RBC”) requirements. The amount of statutory capital and surplus necessary for our insurance subsidiaries to satisfy regulatory requirements, including the RBC requirements, was not significant in relation to our insurance subsidiaries’ statutory capital and surplus at December 31, 2012.2013. In 2012,2014, amounts available for distribution as dividends to us from our insurance subsidiaries without prior approval of their domiciliary insurance regulatory authorities are $18.0$18.7 million from Atlantic States, $2.7$4.2 million from Southern, $2.8 million from Le Mars, $4.2 million from MICO, $4.3Peninsula, $1.1 million from Peninsula, $0 from Sheboygan and $0$4.1 million from Southern,MICO, or a total of $29.2approximately $35.1 million.
-51-
Investments
At December 31, 20122013 and 2011,2012, our investment portfolio of primarily investment-grade bonds, common stock, short-term investments and cash totaled $826.2$819.4 million and $798.6$826.2 million, respectively, representing 61.8%59.1% and 61.9%61.8%, respectively, of our total assets (see “Business - Investments” for more information).
| December 31, | ||||||||||||||||||||||||
| 2012 | 2011 | 2010 | ||||||||||||||||||||||
| (dollars in thousands) | Amount | Percent of Total | Amount | Percent of Total | Amount | Percent of Total | ||||||||||||||||||
Fixed maturities: | ||||||||||||||||||||||||
Total held to maturity | $ | 42,100 | 5.2 | % | $ | 58,490 | 7.4 | % | $ | 64,766 | 8.9 | % | ||||||||||||
Total available for sale | 694,510 | 86.1 | 646,598 | 82.3 | 603,846 | 82.9 | ||||||||||||||||||
|
|
|
|
|
|
|
|
|
|
|
| |||||||||||||
Total fixed maturities | 736,610 | 91.3 | 705,088 | 89.7 | 668,612 | 91.8 | ||||||||||||||||||
Equity securities | 8,757 | 1.1 | 7,438 | 1.0 | 10,162 | 1.4 | ||||||||||||||||||
Investments in affiliates | 37,236 | 4.6 | 32,322 | 4.1 | 8,992 | 1.2 | ||||||||||||||||||
Short-term investments | 23,826 | 3.0 | 40,461 | 5.2 | 40,776 | 5.6 | ||||||||||||||||||
|
|
|
|
|
|
|
|
|
|
|
| |||||||||||||
Total investments | $ | 806,429 | 100.0 | % | $ | 785,309 | 100.0 | % | $ | 728,542 | 100.0 | % | ||||||||||||
|
|
|
|
|
|
|
|
|
|
|
| |||||||||||||
-51-
| December 31, | ||||||||||||||||||||||||
| 2013 | 2012 | 2011 | ||||||||||||||||||||||
| Percent of | Percent of | Percent of | ||||||||||||||||||||||
| (dollars in thousands) | Amount | Total | Amount | Total | Amount | Total | ||||||||||||||||||
Fixed maturities: | ||||||||||||||||||||||||
Total held to maturity | $ | 240,370 | 30.4 | % | $ | 42,100 | 5.2 | % | $ | 58,490 | 7.4 | % | ||||||||||||
Total available for sale | 403,652 | 51.0 | 694,510 | 86.1 | 646,598 | 82.3 | ||||||||||||||||||
|
|
|
|
|
|
|
|
|
|
|
| |||||||||||||
Total fixed maturities | 644,022 | 81.4 | 736,610 | 91.3 | 705,088 | 89.7 | ||||||||||||||||||
Equity securities | 12,423 | 1.5 | 8,757 | 1.1 | 7,438 | 1.0 | ||||||||||||||||||
Investments in affiliates | 35,685 | 4.5 | 37,236 | 4.6 | 32,322 | 4.1 | ||||||||||||||||||
Short-term investments | 99,678 | 12.6 | 23,826 | 3.0 | 40,461 | 5.2 | ||||||||||||||||||
|
|
|
|
|
|
|
|
|
|
|
| |||||||||||||
Total investments | $ | 791,808 | 100.0 | % | $ | 806,429 | 100.0 | % | $ | 785,309 | 100.0 | % | ||||||||||||
|
|
|
|
|
|
|
|
|
|
|
| |||||||||||||
The carrying value of our fixed maturity investments represented 91.3%81.4% and 89.8%91.3% of our total invested assets at December 31, 20122013 and 2011,2012, respectively.
Our fixed maturity investments consisted of high-quality marketable bonds, of which 100.0% and 99.0% were rated at investment-grade levels at December 31, 2013 and 2012, and 2011.respectively.
At December 31, 2012,2013, the net unrealized gain on available-for-sale fixed maturity investments, net of deferred taxes, amounted to $25.6$8.7 million, compared to $21.3$25.6 million at December 31, 2011.2012.
At December 31, 2012,2013, the net unrealized gain on our equity securities, net of deferred taxes, amounted to $61,149,$165,573, compared to $1.9 million$61,149 at December 31, 2011.2012.
Impact of Inflation
Our insurance subsidiaries establish their property and casualty insurance premium rates before they know the amount of losses and loss settlement expenses or the extent to which inflation may impact such expenses. Consequently, our insurance subsidiaries attempt, in establishing rates, to anticipate the potential impact of inflation.
Impact of New Accounting Standards
In October 2010,February 2013, the Financial Accounting Standards Board (“FASB”) issued updated guidance that requires an entity to addressprovide information about amounts it reclassifies out of accumulated other comprehensive income. If GAAP requires an entity to reclassify amounts out of accumulated other comprehensive income to net income in their entirety in the diversitysame reporting period, the guidance requires an entity to present significant amounts it reclassifies out of accumulated other comprehensive income by the respective line items of net income, either on the face of the statement where the entity presents net income or in practice for the accounting for costs associated with acquiring or renewing insurance contracts. This guidance modifies the definition of acquisition costs to specify that a cost must relate directlynotes to the successful acquisition of a new or renewal insurance contractentity’s financial statements,. For other amounts that GAAP does not require an entity to qualify for deferral. Ifreclassify to net income in their entirety, the application of this guidance would result in the capitalization of acquisition costsrequires an entity to cross-reference such amounts to other disclosures GAAP requires that a reporting entity had not previously capitalized, the entity may elect not to capitalizeprovide additional detail about those costs.amounts. The updated guidance iswas effective for interim and annual reporting periods beginning after December 15, 2011.2012. We adopted this new guidance prospectively in 2012. The amountas of acquisition costs we capitalized during 2012 did not change materially from the amount of acquisition costs that we would have capitalized had we applied our previous policy during the period. Our adoption of this new guidance did not have a material impact on our financial position, results of operations or cash flows.
In May 2011, the FASB issued guidance that eliminates the concepts of in-use and in-exchange when measuring the fair value of all financial instruments. The fair value of a financial asset should be measured on a standalone basis and cannot be measured as part of a group. The new guidance requires several new disclosures including the disclosure of all transfers between LevelJanuary 1, and Level 2 of the fair value hierarchy and additional disclosures regarding Level 3 assets. This guidance is effective for interim and annual periods beginning on or after December 15, 2011. We adopted this new guidance in 2012. Our adoption of this new guidance did not impact our financial position, results of operations or cash flows.
In June 2011, the FASB issued new guidance related to the presentation of other comprehensive income. The new guidance provides entities with an option to either replace the income statement with a statement of comprehensive income, which would display both the components of net income and comprehensive in a combined statement, or to present a separate statement of comprehensive income immediately following the income statement. The new guidance does not affect the components of other comprehensive income or the calculation of earnings per share. The new guidance is effective for fiscal years, and interim periods within those years, beginning after December 15, 2011. The new guidance is to be applied retrospectively with early adoption permitted. We adopted this new guidance in 2012.2013. Our adoption of this new guidance did not impact our financial position, results of operations or cash flows.
-52-
In September 2011, the FASB issued new guidance related to evaluating goodwill for impairment. The new guidance provides entities with the option to perform a qualitative assessment of whether it is more likely than not that the fair value of a reporting unit is less than its carrying amount before applying the quantitative two-step goodwill impairment test. If an entity concludes that it is not more likely than not that the fair value of a reporting unit is less than its carrying amount, it is not required to perform the quantitative two-step goodwill impairment test. Entities also have the option to bypass the assessment of qualitative factors for any reporting unit in any period and proceed directly to performing the first step of the quantitative two-step goodwill impairment test, as was required prior to the issuance of this new guidance. An entity may begin or resume performing the qualitative assessment in any subsequent period. The new guidance is effective for fiscal years, and interim periods within those years, beginning after December 15, 2011, with early adoption permitted. We adopted this new guidance in 2011. Our adoption of this new guidance did not impact our financial position, results of operations or cash flows.
In July 2012, the FASB issued guidance related to evaluating indefinite-lived intangible assets for impairment. The new guidance provides entities with the option to perform a qualitative assessment of whether it is more likely than not that the fair value of an indefinite-lived intangible asset is less than its carrying amount. If an entity concludes that it is not more likely than not that the fair value of an indefinite-lived intangible asset is less than its carrying value, it is not required to perform the quantitative impairment test. Entities also have the option to bypass the qualitative assessment for any indefinite-lived intangible asset in any period and proceed directly to performing the quantitative impairment test. Entities are able to resume performing the qualitative assessment in any subsequent period. The guidance is effective for annual and interim impairment tests performed for fiscal years beginning after September 15, 2012, with early adoption permitted. We adopted this new guidance in 2012. Our adoption of this new guidance did not impact our financial position, results of operations or cash flows.
-53-
| Item 7A. | Quantitative and Qualitative Disclosures About Market Risk. |
We are exposed to the impact of interest rate changes, to changes in fair values of investments and to credit risk.
In the normal course of business, we employ established policies and procedures to manage our exposure to changes in interest rates, fluctuations in the fair market value of our debt and equity securities and credit risk. We seek to mitigate these risks by various actions described below.
Interest Rate Risk
Our exposure to market risk for a change in interest rates is concentrated in our investment portfolio. We monitor this exposure through periodic reviews of our asset and liability positions. We regularly monitor estimates of cash flows and the impact of interest rate fluctuations relating to the investment portfolio. Generally, we do not hedge our exposure to interest rate risk because we have the capacity to, and do, hold fixed maturity investments to maturity.
Principal cash flows and related weighted-average interest rates by stated maturity dates for financial instruments sensitive to interest rates at December 31, 20122013 are as follows:
| (in thousands) | Principal Cash Flows | Weighted- Average Interest Rate | Principal Cash Flows | Weighted- Average Interest Rate | ||||||||||||||||
Fixed maturity and short-term investments: | ||||||||||||||||||||
| 2013 | $ | 33,712 | 1.37 | % | ||||||||||||||||
| 2014 | 11,912 | 4.30 | ||||||||||||||||||
| 2015 | 18,204 | 3.72 | ||||||||||||||||||
| 2016 | 29,395 | 4.27 | ||||||||||||||||||
| 2017 | 33,295 | 3.68 | ||||||||||||||||||
2014 | $ | 107,794 | 0.38 | % | ||||||||||||||||
2015 | 9,664 | 4.35 | ||||||||||||||||||
2016 | 13,265 | 4.05 | ||||||||||||||||||
2017 | 20,015 | 3.88 | ||||||||||||||||||
2018 | 21,535 | 4.38 | ||||||||||||||||||
Thereafter | 587,583 | 3.87 | 569,970 | 3.62 | ||||||||||||||||
|
| |||||||||||||||||||
Total | $ | 714,101 | $ | 742,243 | ||||||||||||||||
|
| |||||||||||||||||||
Fair value | $ | 762,072 | $ | 742,120 | ||||||||||||||||
|
| |||||||||||||||||||
Debt: | ||||||||||||||||||||
| 2013 | $ | 15,465 | 4.16 | % | ||||||||||||||||
| 2015 | 52,000 | 2.46 | ||||||||||||||||||
2014 | $ | 15,000 | 0.26 | % | ||||||||||||||||
2015 | 43,000 | 2.42 | ||||||||||||||||||
Thereafter | 5,000 | 5.00 | 5,000 | 5.00 | ||||||||||||||||
|
| |||||||||||||||||||
Total | $ | 72,465 | $ | 63,000 | ||||||||||||||||
|
| |||||||||||||||||||
Fair value | $ | 72,465 | $ | 63,000 | ||||||||||||||||
|
| |||||||||||||||||||
Actual cash flows from investments may differ from those stateddepicted above as a result of calls and prepayments.
Equity Price Risk
Our portfolio of equity securities, which we carry on our consolidated balance sheets at estimated fair value, has exposure to price risk, which is the risk of potential loss in estimated fair value resulting from an adverse change in prices. Our objective is to earn competitive relative returns by investing in a diverse portfolio of high-quality, liquid securities.
Credit Risk
Our objective is to earn competitive returns by investing in a diversified portfolio of securities. Our portfolio of fixed maturity securities and, to a lesser extent, short-term investments is subject to credit risk. We define this risk as the potential loss in fair value resulting from adverse changes in the borrower’s ability to repay the debt. We manage this risk by performing an analysis of prospective investments and through regular reviews of our portfolio by our investment staff. We also limit the amount of our total investment portfolio that we invest in any one security.
Our insurance subsidiaries provide property and liability insurance coverages through independent insurance agencies located throughout their operating areas. Our insurance subsidiaries bill the majority of this business directly to the insured, although our insurance subsidiaries bill a portion of their commercial business through their agents, to whom they extend credit in the normal course of business.
-54--53-
Because the pooling agreement does not relieve Atlantic States of primary liability as the originating insurer, Atlantic States is subject to a concentration of credit risk arising from business ceded to Donegal Mutual. Our insurance subsidiaries maintain reinsurance agreements with Donegal Mutual and with a number of other major unaffiliated authorized reinsurers.
Through November 30, 2010, MICO and West Bend were parties to quota-share reinsurance agreements whereby MICO ceded 75% of its business to West Bend. MICO and West Bend terminated the reinsurance agreement in effect at November 30, 2010 on a run-off basis. West Bend’s obligations related to all past reinsurance agreements with MICO remain in effect for all policies with effective dates prior to December 1, 2010. West Bend and MICO entered into a trust agreement on December 1, 2010. Under the terms of the trust agreement, West Bend placed into trust, for the sole benefit of MICO, assets with a fair value equal to the amount of unearned premiums and unpaid losses and loss expenses, reduced by any net premium balances not yet paid by MICO, that West Bend had assumed pursuant to such reinsurance agreements at November 30, 2010. The amount of assets required to be held in trust adjusts monthly based upon the remaining net obligations of West Bend. West Bend may terminate the trust agreement on the earlier of December 1, 2020 or the date whenon which the obligations of West Bend are equal to or less than $5.0 million. As of December 31, 2012,2013, West Bend’s net obligations under the reinsurance agreements were approximately $22.6$15.9 million, and the fair value of assets held in trust was approximately $26.3$17.9 million.
-55--54-
| Item 8. | Financial Statements and Supplementary Data. |
| 56 | ||||
| 57 | ||||
Consolidated Statements of | 58 | |||
| 59 | ||||
| 60 | ||||
Report of Independent Registered Public Accounting Firm - Consolidated Financial Statements | ||||
-56--55-
| December 31, | December 31, | |||||||||||||||||
| 2012 | 2011 | 2013 | 2012 | |||||||||||||||
Assets | ||||||||||||||||||
Investments | ||||||||||||||||||
Fixed maturities | ||||||||||||||||||
Held to maturity, at amortized cost (fair value $43,735,739 and $61,422,347 ) | $ | 42,100,196 | $ | 58,489,619 | ||||||||||||||
Available for sale, at fair value (amortized cost $655,173,806 and $614,298,854) | 694,509,821 | 646,598,178 | ||||||||||||||||
Equity securities, available for sale, at fair value (cost $8,663,183 and $7,238,803) | 8,757,258 | 7,437,538 | ||||||||||||||||
Held to maturity, at amortized cost (fair value $238,790,476 and $43,735,739) | $ | 240,370,277 | $ | 42,100,196 | ||||||||||||||
Available for sale, at fair value (amortized cost $390,254,251 and $655,173,806) | 403,651,965 | 694,509,821 | ||||||||||||||||
Equity securities, available for sale, at fair value (cost $12,168,110 and $8,663,183) | 12,422,837 | 8,757,258 | ||||||||||||||||
Investments in affiliates | 37,235,530 | 32,322,246 | 35,685,433 | 37,235,530 | ||||||||||||||
Short-term investments, at cost, which approximates fair value | 23,826,227 | 40,461,410 | 99,677,795 | 23,826,227 | ||||||||||||||
|
|
|
| |||||||||||||||
Total investments | 806,429,032 | 785,308,991 | 791,808,307 | 806,429,032 | ||||||||||||||
Cash | 19,801,290 | 13,245,378 | 27,636,416 | 19,801,290 | ||||||||||||||
Accrued investment income | 6,332,085 | 6,713,038 | 5,423,531 | 6,332,085 | ||||||||||||||
Premiums receivable | 117,196,478 | 104,715,327 | 123,904,629 | 117,196,478 | ||||||||||||||
Reinsurance receivable | 215,893,322 | 209,823,907 | 244,239,113 | 215,893,322 | ||||||||||||||
Deferred policy acquisition costs | 40,121,697 | 36,424,955 | 43,627,510 | 40,121,697 | ||||||||||||||
Deferred tax asset, net | 6,267,536 | 9,919,720 | 20,310,558 | 6,267,536 | ||||||||||||||
Prepaid reinsurance premiums | 111,156,162 | 106,450,018 | 112,663,942 | 111,156,162 | ||||||||||||||
Property and equipment, net | 5,953,833 | 6,154,383 | 6,424,703 | 5,953,833 | ||||||||||||||
Accounts receivable - securities | — | 1,507,500 | 1,187,866 | — | ||||||||||||||
Federal income taxes recoverable | — | 2,661,808 | 420,952 | — | ||||||||||||||
Goodwill | 5,625,354 | 5,625,354 | 5,625,354 | 5,625,354 | ||||||||||||||
Other intangible assets | 958,010 | 958,010 | 958,010 | 958,010 | ||||||||||||||
Other | 1,154,388 | 1,285,089 | 1,179,611 | 1,154,388 | ||||||||||||||
|
|
|
| |||||||||||||||
Total assets | $ | 1,336,889,187 | $ | 1,290,793,478 | $ | 1,385,410,502 | $ | 1,336,889,187 | ||||||||||
|
|
|
| |||||||||||||||
Liabilities and Stockholders’ Equity | ||||||||||||||||||
Liabilities | ||||||||||||||||||
Losses and loss expenses | $ | 458,827,395 | $ | 442,407,615 | $ | 495,619,269 | $ | 458,827,395 | ||||||||||
Unearned premiums | 363,088,103 | 336,937,261 | 382,734,642 | 363,088,103 | ||||||||||||||
Accrued expenses | 17,140,832 | 20,956,549 | 19,265,097 | 17,140,832 | ||||||||||||||
Reinsurance balances payable | 13,941,337 | 20,039,339 | 17,948,808 | 13,941,337 | ||||||||||||||
Borrowings under line of credit | 52,000,000 | 54,500,000 | ||||||||||||||||
Borrowings under lines of credit | 58,000,000 | 52,000,000 | ||||||||||||||||
Cash dividends declared to stockholders | 3,066,532 | 2,996,076 | 3,299,182 | 3,066,532 | ||||||||||||||
Subordinated debentures | 20,465,000 | 20,465,000 | 5,000,000 | 20,465,000 | ||||||||||||||
Accounts payable - securities | 751,641 | — | ||||||||||||||||
Federal income taxes payable | 583,977 | — | — | 583,977 | ||||||||||||||
Due to affiliate | 4,579,437 | 5,386,391 | 2,170,225 | 4,579,437 | ||||||||||||||
Drafts payable | 863,589 | 1,548,953 | 1,386,285 | 863,589 | ||||||||||||||
Other | 2,298,891 | 2,104,702 | 2,358,242 | 2,298,891 | ||||||||||||||
|
|
|
| |||||||||||||||
Total liabilities | 936,855,093 | 907,341,886 | 988,533,391 | 936,855,093 | ||||||||||||||
|
|
|
|
| ||||||||||||||
Stockholders’ Equity | ||||||||||||||||||
Preferred stock, $1.00 par value, authorized 2,000,000 shares; none issued | — | — | ||||||||||||||||
Class A common stock, $.01 par value, authorized 30,000,000 shares, issued 20,941,821 and 20,752,999 shares and outstanding 20,025,199 and 19,971,441 shares | 209,419 | 207,530 | ||||||||||||||||
Preferred stock, $.01 par value, authorized 2,000,000 shares; none issued | — | — | ||||||||||||||||
Class A common stock, $.01 par value, authorized 40,000,000 and 30,000,000 shares, issued 21,786,765 and 20,941,821 shares and outstanding 20,845,903 and 20,025,199 shares | 217,868 | 209,419 | ||||||||||||||||
Class B common stock, $.01 par value, authorized 10,000,000 shares, issued 5,649,240 shares and outstanding 5,576,775 shares | 56,492 | 56,492 | 56,492 | 56,492 | ||||||||||||||
Additional paid-in capital | 176,416,585 | 170,836,943 | 189,116,410 | 176,416,585 | ||||||||||||||
Accumulated other comprehensive income | 26,394,577 | 23,533,447 | ||||||||||||||||
Accumulated other comprehensive (loss) income | (2,312,890 | ) | 26,394,577 | |||||||||||||||
Retained earnings | 209,670,214 | 199,604,700 | 222,888,887 | 209,670,214 | ||||||||||||||
Treasury stock, at cost | (12,713,193) | (10,787,520 | ) | (13,089,656 | ) | (12,713,193 | ) | |||||||||||
|
|
|
| |||||||||||||||
Total stockholders’ equity | 400,034,094 | 383,451,592 | 396,877,111 | 400,034,094 | ||||||||||||||
|
|
|
| |||||||||||||||
Total liabilities and stockholders’ equity | $ | 1,336,889,187 | $ | 1,290,793,478 | $ | 1,385,410,502 | $ | 1,336,889,187 | ||||||||||
|
|
|
| |||||||||||||||
See accompanying notes to consolidated financial statements.
-56-
Consolidated Statements of Income and Comprehensive Income
| Years Ended December 31, | ||||||||||||
| 2013 | 2012 | 2011 | ||||||||||
Statements of Income | ||||||||||||
Revenues | ||||||||||||
Net premiums earned (includes affiliated reinsurance of $156,938,714, $142,608,940 and $130,555,613 - see note 3) | $ | 515,291,944 | $ | 475,002,222 | $ | 431,470,184 | ||||||
Investment income, net of investment expenses | 18,795,239 | 20,168,919 | 20,858,179 | |||||||||
Installment payment fees | 6,841,778 | 7,465,532 | 7,427,509 | |||||||||
Lease income | 849,795 | 953,216 | 957,353 | |||||||||
Net realized investment gains (includes $2,423,442 accumulated other comprehensive income reclassification) | 2,423,442 | 6,859,439 | 12,281,267 | |||||||||
Equity in earnings of DFSC | 2,907,867 | 4,533,257 | 2,023,127 | |||||||||
|
|
|
|
|
| |||||||
Total revenues | 547,110,065 | 514,982,585 | 475,017,619 | |||||||||
|
|
|
|
|
| |||||||
Expenses | ||||||||||||
Net losses and loss expenses (includes affiliated reinsurance of $86,962,750, $81,219,926 and $87,950,502 - see note 3) | 343,127,951 | 332,871,584 | 340,502,777 | |||||||||
Amortization of deferred policy acquisition costs | 81,753,000 | 74,314,000 | 68,571,000 | |||||||||
Other underwriting expenses | 82,196,700 | 73,914,514 | 66,923,764 | |||||||||
Policyholder dividends | 1,909,569 | 1,342,582 | 1,240,079 | |||||||||
Interest | 1,635,323 | 2,358,711 | 2,126,784 | |||||||||
Other | 3,777,257 | 2,322,934 | 2,392,528 | |||||||||
|
|
|
|
|
| |||||||
Total expenses | 514,399,800 | 487,124,325 | 481,756,932 | |||||||||
|
|
|
|
|
| |||||||
Income before income tax expense (benefit) | 32,710,265 | 27,858,260 | (6,739,313 | ) | ||||||||
Income tax expense (benefit) (includes $823,970 income tax expense from reclassification items) | 6,388,273 | 4,765,640 | (7,192,266 | ) | ||||||||
|
|
|
|
|
| |||||||
Net income | $ | 26,321,992 | $ | 23,092,620 | $ | 452,953 | ||||||
|
|
|
|
|
| |||||||
Basic earnings per common share: | ||||||||||||
Class A common stock | $ | 1.04 | $ | 0.92 | $ | 0.02 | ||||||
|
|
|
|
|
| |||||||
Class B common stock | $ | 0.94 | $ | 0.83 | $ | 0.01 | ||||||
|
|
|
|
|
| |||||||
Diluted earnings per common share: | ||||||||||||
Class A common stock | $ | 1.02 | $ | 0.91 | $ | 0.02 | ||||||
|
|
|
|
|
| |||||||
Class B common stock | $ | 0.94 | $ | 0.83 | $ | 0.01 | ||||||
|
|
|
|
|
| |||||||
Statements of Comprehensive Income | ||||||||||||
Net income | $ | 26,321,992 | $ | 23,092,620 | $ | 452,953 | ||||||
|
|
|
|
|
| |||||||
Other comprehensive (loss) income, net of tax | ||||||||||||
Unrealized (loss) gain on securities: | ||||||||||||
Unrealized holding (loss) gain arising during the period, net of income tax (benefit) expense of ($14,633,895), $4,833,143 and 12,237,669 | (27,107,995 | ) | 9,171,817 | 23,077,997 | ||||||||
Reclassification adjustment for gains included in net income, net of income tax of $823,970 $2,332,209 and $4,175,631 | (1,599,472 | ) | (4,527,230 | ) | (8,105,636 | ) | ||||||
|
|
|
|
|
| |||||||
Other comprehensive (loss) income | (28,707,467 | ) | 4,644,587 | 14,972,361 | ||||||||
|
|
|
|
|
| |||||||
Comprehensive (loss) income | $ | (2,385,475 | ) | $ | 27,737,207 | $ | 15,425,314 | |||||
|
|
|
|
|
| |||||||
See accompanying notes to consolidated financial statements.
-57-
Consolidated Statements of Income and Comprehensive IncomeStockholders’ Equity
| Years Ended December 31, | ||||||||||||
| 2012 | 2011 | 2010 | ||||||||||
Statements of Income | ||||||||||||
Revenues | ||||||||||||
Net premiums earned (includes affiliated reinsurance of $142,608,940, $130,555,613 and $134,823,098 - see note 3) | $ | 475,002,222 | $ | 431,470,184 | $ | 378,030,129 | ||||||
Investment income, net of investment expenses | 20,168,919 | 20,858,179 | 19,949,714 | |||||||||
Installment payment fees | 7,465,532 | 7,427,509 | 5,519,287 | |||||||||
Lease income | 953,216 | 957,353 | 922,937 | |||||||||
Net realized investment gains | 6,859,439 | 12,281,267 | 4,395,720 | |||||||||
Equity in earnings (loss) of DFSC | 4,533,257 | 2,023,127 | (268,341 | ) | ||||||||
|
|
|
|
|
| |||||||
Total revenues | 514,982,585 | 475,017,619 | 408,549,446 | |||||||||
|
|
|
|
|
| |||||||
Expenses | ||||||||||||
Net losses and loss expenses (includes affiliated reinsurance of $81,219,926, $87,950,502 and $81,539,930 - see note 3) | 332,871,584 | 340,502,777 | 274,308,858 | |||||||||
Amortization of deferred policy acquisition costs | 74,314,000 | 68,571,000 | 66,354,000 | |||||||||
Other underwriting expenses | 73,914,514 | 66,923,764 | 54,564,500 | |||||||||
Policyholder dividends | 1,342,582 | 1,240,079 | 619,158 | |||||||||
Interest | 2,358,711 | 2,126,784 | 799,578 | |||||||||
Other | 2,322,934 | 2,392,528 | 2,059,203 | |||||||||
|
|
|
|
|
| |||||||
Total expenses | 487,124,325 | 481,756,932 | 398,705,297 | |||||||||
|
|
|
|
|
| |||||||
Income (loss) before income tax expense (benefit) | 27,858,260 | (6,739,313 | ) | 9,844,149 | ||||||||
Income tax expense (benefit) | 4,765,640 | (7,192,266 | ) | (1,623,030 | ) | |||||||
|
|
|
|
|
| |||||||
Net income | $ | 23,092,620 | $ | 452,953 | $ | 11,467,179 | ||||||
|
|
|
|
|
| |||||||
Basic earnings per common share: | ||||||||||||
Class A common stock | $ | 0.92 | $ | 0.02 | $ | 0.46 | ||||||
|
|
|
|
|
| |||||||
Class B common stock | $ | 0.83 | $ | 0.01 | $ | 0.41 | ||||||
|
|
|
|
|
| |||||||
Diluted earnings per common share: | ||||||||||||
Class A common stock | $ | 0.91 | $ | 0.02 | $ | 0.46 | ||||||
|
|
|
|
|
| |||||||
Class B common stock | $ | 0.83 | $ | 0.01 | $ | 0.41 | ||||||
|
|
|
|
|
| |||||||
Statements of Comprehensive Income | ||||||||||||
Net income | $ | 23,092,620 | $ | 452,953 | $ | 11,467,179 | ||||||
|
|
|
|
|
| |||||||
Other comprehensive income (loss), net of tax | ||||||||||||
Unrealized gains (losses) on securities: | ||||||||||||
Unrealized holding gain (loss) arising during the period, net of income tax (benefit) of $4,833,143, $12,237,669 and ($1,976,358) | 9,171,817 | 23,077,997 | (3,544,783 | ) | ||||||||
Reclassification adjustment for gains included in net income, net of income tax of $2,332,209, $4,175,631 and $1,494,545 | (4,527,230 | ) | (8,105,636 | ) | (2,901,175 | ) | ||||||
|
|
|
|
|
| |||||||
Other comprehensive income (loss) | 4,644,587 | 14,972,361 | (6,445,958 | ) | ||||||||
|
|
|
|
|
| |||||||
Comprehensive income | $ | 27,737,207 | $ | 15,425,314 | $ | 5,021,221 | ||||||
|
|
|
|
|
| |||||||
| Common Stock | Accumulated Other | Total | ||||||||||||||||||||||||||||||||||
| Class A Shares | Class B Shares | Class A Amount | Class B Amount | Additional Paid- In Capital | Comprehensive Income (Loss) | Retained Earnings | Treasury Stock | Stockholders’ Equity | ||||||||||||||||||||||||||||
Balance, January 1, 2011 | 20,656,527 | 5,649,240 | $ | 206,566 | $ | 56,492 | $ | 167,093,504 | $ | 8,561,086 | $ | 213,435,095 | $ | (9,249,933 | ) | $ | 380,102,810 | |||||||||||||||||||
|
|
|
|
|
|
|
|
|
|
|
|
|
|
|
|
|
| |||||||||||||||||||
Issuance of common stock (stock compensation plans) | 96,472 | 964 | 1,459,579 | 1,460,543 | ||||||||||||||||||||||||||||||||
Net income | 452,953 | 452,953 | ||||||||||||||||||||||||||||||||||
Cash dividends | (11,999,488 | ) | (11,999,488 | ) | ||||||||||||||||||||||||||||||||
Grant of stock options | 2,283,860 | (2,283,860 | ) | — | ||||||||||||||||||||||||||||||||
Purchase of treasury stock | (1,537,587 | ) | (1,537,587 | ) | ||||||||||||||||||||||||||||||||
Other comprehensive income | 14,972,361 | 14,972,361 | ||||||||||||||||||||||||||||||||||
|
|
|
|
|
|
|
|
|
|
|
|
|
|
|
|
|
| |||||||||||||||||||
Balance, December 31, 2011 | 20,752,999 | 5,649,240 | $ | 207,530 | $ | 56,492 | $ | 170,836,943 | $ | 23,533,447 | $ | 199,604,700 | $ | (10,787,520 | ) | $ | 383,451,592 | |||||||||||||||||||
|
|
|
|
|
|
|
|
|
|
|
|
|
|
|
|
|
| |||||||||||||||||||
Issuance of common stock (stock compensation plans) | 188,822 | 1,889 | 2,995,622 | 2,997,511 | ||||||||||||||||||||||||||||||||
Net income | 23,092,620 | 23,092,620 | ||||||||||||||||||||||||||||||||||
Cash dividends | (12,278,965 | ) | (12,278,965 | ) | ||||||||||||||||||||||||||||||||
Grant of stock options | 2,531,598 | (2,531,598 | ) | — | ||||||||||||||||||||||||||||||||
Tax benefit on exercise of stock options | 52,422 | 52,422 | ||||||||||||||||||||||||||||||||||
Purchase of treasury stock | (1,925,673 | ) | (1,925,673 | ) | ||||||||||||||||||||||||||||||||
Other comprehensive income | 4,644,587 | 4,644,587 | ||||||||||||||||||||||||||||||||||
Other | (1,783,457 | ) | 1,783,457 | — | ||||||||||||||||||||||||||||||||
|
|
|
|
|
|
|
|
|
|
|
|
|
|
|
|
|
| |||||||||||||||||||
Balance, December 31, 2012 | 20,941,821 | 5,649,240 | 209,419 | 56,492 | 176,416,585 | 26,394,577 | 209,670,214 | (12,713,193 | ) | 400,034,094 | ||||||||||||||||||||||||||
|
|
|
|
|
|
|
|
|
|
|
|
|
|
|
|
|
| |||||||||||||||||||
Issuance of common stock (stock compensation plans) | 844,944 | 8,449 | 12,108,468 | 12,116,917 | ||||||||||||||||||||||||||||||||
Net income | 26,321,992 | 26,321,992 | ||||||||||||||||||||||||||||||||||
Cash dividends | (13,043,121 | ) | (13,043,121 | ) | ||||||||||||||||||||||||||||||||
Grant of stock options | 60,198 | (60,198 | ) | — | ||||||||||||||||||||||||||||||||
Tax benefit on exercise of stock options | 531,159 | 531,159 | ||||||||||||||||||||||||||||||||||
Purchase of treasury stock | (376,463 | ) | (376,463 | ) | ||||||||||||||||||||||||||||||||
Other comprehensive loss | (28,707,467 | ) | (28,707,467 | ) | ||||||||||||||||||||||||||||||||
|
|
|
|
|
|
|
|
|
|
|
|
|
|
|
|
|
| |||||||||||||||||||
Balance, December 31, 2013 | 21,786,765 | 5,649,240 | $ | 217,868 | $ | 56,492 | $ | 189,116,410 | $ | (2,312,890 | ) | $ | 222,888,887 | $ | (13,089,656 | ) | $ | 396,877,111 | ||||||||||||||||||
|
|
|
|
|
|
|
|
|
|
|
|
|
|
|
|
|
| |||||||||||||||||||
See accompanying notes to consolidated financial statements.
-58-
Consolidated Statements of Stockholders’ EquityCash Flows
| Common Stock | Additional Paid-In Capital | Accumulated Other Comprehensive Income | Retained Earnings | Treasury Stock | Total Stockholders’ Equity | |||||||||||||||||||||||||||||||
| Class A Shares | Class B Shares | Class A Amount | Class B Amount | |||||||||||||||||||||||||||||||||
Balance, January 1, 2010 | 20,569,930 | 5,649,240 | $ | 205,700 | $ | 56,492 | $ | 164,585,214 | $ | 15,007,044 | $ | 214,755,495 | $ | (9,104,246 | ) | $ | 385,505,699 | |||||||||||||||||||
|
|
|
|
|
|
|
|
|
|
|
|
|
|
|
|
|
| |||||||||||||||||||
Issuance of common stock (stock compensation plans) | 86,597 | 866 | 1,198,556 | 1,199,422 | ||||||||||||||||||||||||||||||||
Net income | 11,467,179 | 11,467,179 | ||||||||||||||||||||||||||||||||||
Cash dividends | (11,477,845 | ) | (11,477,845 | ) | ||||||||||||||||||||||||||||||||
Grant of stock options | 1,309,734 | (1,309,734 | ) | — | ||||||||||||||||||||||||||||||||
Purchase of treasury stock | (145,687 | ) | (145,687 | ) | ||||||||||||||||||||||||||||||||
Other comprehensive loss | (6,445,958 | ) | (6,445,958 | ) | ||||||||||||||||||||||||||||||||
|
|
|
|
|
|
|
|
|
|
|
|
|
|
|
|
|
| |||||||||||||||||||
Balance, December 31, 2010 | 20,656,527 | 5,649,240 | $ | 206,566 | $ | 56,492 | $ | 167,093,504 | $ | 8,561,086 | $ | 213,435,095 | $ | (9,249,933 | ) | $ | 380,102,810 | |||||||||||||||||||
|
|
|
|
|
|
|
|
|
|
|
|
|
|
|
|
|
| |||||||||||||||||||
Issuance of common stock (stock compensation plans) | 96,472 | 964 | 1,459,579 | 1,460,543 | ||||||||||||||||||||||||||||||||
Net income | 452,953 | 452,953 | ||||||||||||||||||||||||||||||||||
Cash dividends | (11,999,488 | ) | (11,999,488 | ) | ||||||||||||||||||||||||||||||||
Grant of stock options | 2,283,860 | (2,283,860 | ) | — | ||||||||||||||||||||||||||||||||
Purchase of treasury stock | (1,537,587 | ) | (1,537,587 | ) | ||||||||||||||||||||||||||||||||
Other comprehensive income | 14,972,361 | 14,972,361 | ||||||||||||||||||||||||||||||||||
|
|
|
|
|
|
|
|
|
|
|
|
|
|
|
|
|
| |||||||||||||||||||
Balance, December 31, 2011 | 20,752,999 | 5,649,240 | $ | 207,530 | $ | 56,492 | $ | 170,836,943 | $ | 23,533,447 | $ | 199,604,700 | $ | (10,787,520 | ) | $ | 383,451,592 | |||||||||||||||||||
|
|
|
|
|
|
|
|
|
|
|
|
|
|
|
|
|
| |||||||||||||||||||
Issuance of common stock (stock compensation plans) | 188,822 | 1,889 | 2,995,622 | 2,997,511 | ||||||||||||||||||||||||||||||||
Net income | 23,092,620 | 23,092,620 | ||||||||||||||||||||||||||||||||||
Cash dividends | (12,278,965 | ) | (12,278,965 | ) | ||||||||||||||||||||||||||||||||
Grant of stock options | 2,531,598 | (2,531,598 | ) | — | ||||||||||||||||||||||||||||||||
Tax benefit on exercise of stock options | 52,422 | 52,422 | ||||||||||||||||||||||||||||||||||
Purchase of treasury stock | (1,925,673 | ) | (1,925,673 | ) | ||||||||||||||||||||||||||||||||
Other comprehensive income | 4,644,587 | 4,644,587 | ||||||||||||||||||||||||||||||||||
Other | (1,783,457 | ) | 1,783,457 | — | ||||||||||||||||||||||||||||||||
|
|
|
|
|
|
|
|
|
|
|
|
|
|
|
|
|
| |||||||||||||||||||
Balance, December 31, 2012 | 20,941,821 | 5,649,240 | $ | 209,419 | $ | 56,492 | $ | 176,416,585 | $ | 26,394,577 | $ | 209,670,214 | $ | (12,713,193 | ) | $ | 400,034,094 | |||||||||||||||||||
|
|
|
|
|
|
|
|
|
|
|
|
|
|
|
|
|
| |||||||||||||||||||
| Years Ended December 31, | ||||||||||||
| 2013 | 2012 | 2011 | ||||||||||
Cash Flows from Operating Activities: | ||||||||||||
Net income | $ | 26,321,992 | $ | 23,092,620 | $ | 452,953 | ||||||
|
|
|
|
|
| |||||||
Adjustments to reconcile net income to net cash provided by operating activities: | ||||||||||||
Depreciation and amortization | 3,049,101 | 3,950,693 | 4,106,561 | |||||||||
Net realized investment gains | (2,423,442 | ) | (6,859,439 | ) | (12,281,267 | ) | ||||||
Equity in earnings of DFSC | (2,907,867 | ) | (4,533,257 | ) | (2,023,127 | ) | ||||||
Changes in Assets and Liabilities: | ||||||||||||
Losses and loss expenses | 36,791,874 | 16,419,780 | 59,088,943 | |||||||||
Unearned premiums | 19,646,539 | 26,150,842 | 39,665,100 | |||||||||
Accrued expenses | 2,124,265 | (3,815,717 | ) | (330,857 | ) | |||||||
Premiums receivable | (6,708,151 | ) | (12,481,151 | ) | (8,247,378 | ) | ||||||
Deferred policy acquisition costs | (3,505,813 | ) | (3,696,742 | ) | (1,979,376 | ) | ||||||
Deferred income taxes | 1,414,843 | 1,151,250 | (5,922,491 | ) | ||||||||
Reinsurance receivable | (28,345,791 | ) | (6,069,415 | ) | (35,987,161 | ) | ||||||
Accrued investment income | 908,554 | 380,953 | 652,133 | |||||||||
Amounts due to affiliate | (2,409,212 | ) | (806,954 | ) | 2,460,287 | |||||||
Reinsurance balances payable | 4,007,471 | (6,098,002 | ) | 899,017 | ||||||||
Prepaid reinsurance premiums | (1,507,780 | ) | (4,706,144 | ) | (17,084,247 | ) | ||||||
Current income taxes | (1,004,929 | ) | 3,245,785 | (1,713,483 | ) | |||||||
Other, net | 556,815 | (360,477 | ) | (674,296 | ) | |||||||
|
|
|
|
|
| |||||||
Net adjustments | 19,686,477 | 1,872,005 | 20,628,358 | |||||||||
|
|
|
|
|
| |||||||
Net cash provided by operating activities | 46,008,469 | 24,964,625 | 21,081,311 | |||||||||
|
|
|
|
|
| |||||||
Cash Flows from Investing Activities: | ||||||||||||
Purchases of fixed maturities: | ||||||||||||
Available for sale | (148,486,404 | ) | (241,343,085 | ) | (189,111,596 | ) | ||||||
Purchases of equity securities | (47,156,954 | ) | (31,254,324 | ) | (23,857,802 | ) | ||||||
Sales of fixed maturities: | ||||||||||||
Available for sale | 133,890,611 | 90,484,097 | 122,873,102 | |||||||||
Maturity of fixed maturities: | ||||||||||||
Held to maturity | 13,767,271 | 16,061,587 | 5,888,236 | |||||||||
Available for sale | 52,675,833 | 115,501,507 | 53,763,701 | |||||||||
Sales of equity securities | 43,204,703 | 30,001,187 | 27,036,422 | |||||||||
Purchase of MICO | — | — | (7,207,471 | ) | ||||||||
Net decrease (increase) in investment in affiliates | 1,139,800 | (100,000 | ) | (20,570,000 | ) | |||||||
Net purchases of property and equipment | (1,254,767 | ) | (744,082 | ) | (238,538 | ) | ||||||
Net (purchases) sales of short-term investments | (75,851,568 | ) | 16,635,183 | 314,583 | ||||||||
|
|
|
|
|
| |||||||
Net cash used in investing activities | (28,071,475 | ) | (4,757,930 | ) | (31,109,363 | ) | ||||||
|
|
|
|
|
| |||||||
Cash Flows from Financing Activities: | ||||||||||||
Issuance of common stock | 12,550,066 | 2,983,399 | 1,460,543 | |||||||||
Cash dividends paid | (12,810,471 | ) | (12,208,509 | ) | (11,874,367 | ) | ||||||
Purchases of treasury stock | (376,463 | ) | (1,925,673 | ) | (1,537,587 | ) | ||||||
Payments on subordinated debentures | (15,465,000 | ) | — | — | ||||||||
Payments on line of credit | (15,500,000 | ) | (6,000,000 | ) | (3,617,371 | ) | ||||||
Borrowings under lines of credit | 21,500,000 | 3,500,000 | 22,500,000 | |||||||||
|
|
|
|
|
| |||||||
Net cash (used in) provided by financing activities | (10,101,868 | ) | (13,650,783 | ) | 6,931,218 | |||||||
|
|
|
|
|
| |||||||
Net increase (decrease) in cash | 7,835,126 | 6,555,912 | (3,096,834 | ) | ||||||||
Cash at beginning of year | 19,801,290 | 13,245,378 | 16,342,212 | |||||||||
|
|
|
|
|
| |||||||
Cash at end of year | $ | 27,636,416 | $ | 19,801,290 | $ | 13,245,378 | ||||||
|
|
|
|
|
| |||||||
See accompanying notes to consolidated financial statements.
-59-
Consolidated Statements of Cash Flows
| Years Ended December 31, | ||||||||||||
| 2012 | 2011 | 2010 | ||||||||||
Cash Flows from Operating Activities: | ||||||||||||
Net income | $ | 23,092,620 | $ | 452,953 | $ | 11,467,179 | ||||||
|
|
|
|
|
| |||||||
Adjustments to reconcile net income to net cash provided by operating activities: | ||||||||||||
Depreciation and amortization | 3,950,693 | 4,106,561 | 3,143,767 | |||||||||
Net realized investment gains | (6,859,439 | ) | (12,281,267 | ) | (4,395,720 | ) | ||||||
Equity in (earnings) loss of DFSC | (4,533,257 | ) | (2,023,127 | ) | 268,341 | |||||||
Changes in Assets and Liabilities: | ||||||||||||
Losses and loss expenses | 16,419,780 | 59,088,943 | 14,904,770 | |||||||||
Unearned premiums | 26,150,842 | 39,665,100 | 21,762,781 | |||||||||
Accrued expenses | (3,815,717 | ) | (330,857 | ) | 718,956 | |||||||
Premiums receivable | (12,481,151 | ) | (8,247,378 | ) | (7,478,337 | ) | ||||||
Deferred policy acquisition costs | (3,696,742 | ) | (1,979,376 | ) | (1,601,400 | ) | ||||||
Deferred income taxes | 1,151,250 | (5,922,491 | ) | (2,380,430 | ) | |||||||
Reinsurance receivable | (6,069,415 | ) | (35,987,161 | ) | (5,348,447 | ) | ||||||
Accrued investment income | 380,953 | 652,133 | (489,244 | ) | ||||||||
Amounts due to affiliate | (806,954 | ) | 2,460,287 | (887,190 | ) | |||||||
Reinsurance balances payable | (6,098,002 | ) | 899,017 | (320,278 | ) | |||||||
Prepaid reinsurance premiums | (4,706,144 | ) | (17,084,247 | ) | (8,270,621 | ) | ||||||
Current income taxes | 3,245,785 | (1,713,483 | ) | (368,145 | ) | |||||||
Other, net | (360,477 | ) | (674,296 | ) | 1,278,821 | |||||||
|
|
|
|
|
| |||||||
Net adjustments | 1,872,005 | 20,628,358 | 10,537,624 | |||||||||
|
|
|
|
|
| |||||||
Net cash provided by operating activities | 24,964,625 | 21,081,311 | 22,004,803 | |||||||||
|
|
|
|
|
| |||||||
Cash Flows from Investing Activities: | ||||||||||||
Purchase of fixed maturities: | ||||||||||||
Available for sale | (241,343,085 | ) | (189,111,596 | ) | (195,198,227 | ) | ||||||
Purchase of equity securities: | (31,254,324 | ) | (23,857,802 | ) | (59,191,998 | ) | ||||||
Sale of fixed maturities | ||||||||||||
Available for sale | 90,484,097 | 122,873,102 | 72,092,788 | |||||||||
Maturity of fixed maturities: | ||||||||||||
Held to maturity | 16,061,587 | 5,888,236 | 8,649,275 | |||||||||
Available for sale | 115,501,507 | 53,763,701 | 80,116,222 | |||||||||
Sale of equity securities | 30,001,187 | 27,036,422 | 70,029,195 | |||||||||
Purchase of MICO | — | (7,207,471 | ) | (35,088,228 | ) | |||||||
Net increase in investment in affiliates | (100,000 | ) | (20,570,000 | ) | — | |||||||
Net purchase of property and equipment | (744,082 | ) | (238,538 | ) | (651,160 | ) | ||||||
Net sales of short-term investments | 16,635,183 | 314,583 | 16,052,089 | |||||||||
|
|
|
|
|
| |||||||
Net cash used in investing activities | (4,757,930 | ) | (31,109,363 | ) | (43,190,044 | ) | ||||||
|
|
|
|
|
| |||||||
Cash Flows from Financing Activities: | ||||||||||||
Issuance of common stock | 2,983,399 | 1,460,543 | 1,199,422 | |||||||||
Cash dividends paid | (12,208,509 | ) | (11,874,367 | ) | (11,405,268 | ) | ||||||
Purchase of treasury stock | (1,925,673 | ) | (1,537,587 | ) | (145,687 | ) | ||||||
Payments on line of credit | (6,000,000 | ) | (3,617,371 | ) | — | |||||||
Borrowings under line of credit | 3,500,000 | 22,500,000 | 34,955,088 | |||||||||
|
|
|
|
|
| |||||||
Net cash (used in) provided by financing activities | (13,650,783 | ) | 6,931,218 | 24,603,555 | ||||||||
|
|
|
|
|
| |||||||
Net increase (decrease) in cash | 6,555,912 | (3,096,834 | ) | 3,418,314 | ||||||||
Cash at beginning of year | 13,245,378 | 16,342,212 | 12,923,898 | |||||||||
|
|
|
|
|
| |||||||
Cash at end of year | $ | 19,801,290 | $ | 13,245,378 | $ | 16,342,212 | ||||||
|
|
|
|
|
| |||||||
See accompanying notes to consolidated financial statements.
-60-
Notes to Consolidated Financial Statements
1 - Summary of Significant Accounting Policies
Organization and Business
Donegal Mutual Insurance Company (“Donegal Mutual”) organized us as an insurance holding company on August 26, 1986. Our insurance subsidiaries, Atlantic States Insurance Company (“Atlantic States”), Southern Insurance Company of Virginia (“Southern”), Le Mars Insurance Company (“Le Mars”), the Peninsula Insurance Group (“Peninsula”), which consists of Peninsula Indemnity Company and The Peninsula Insurance Company, Sheboygan Falls Insurance Company (“Sheboygan”) and Michigan Insurance Company (“MICO”), write personal and commercial lines of property and casualty coverages exclusively through a network of independent insurance agents in certain Mid-Atlantic, Midwestern, New England and Southern states. We acquired MICO on December 1, 2010, and we have included MICO’s results of operations in our consolidated results of operations since that date. We also own 48.2% of the outstanding stock of Donegal Financial Services Corporation (“DFSC”), a grandfathered unitary savings and loan holding company that owns Union Community Bank FSB (“UCB”), a federalstate savings bank. UCB has 13 banking offices, all of which are located in Lancaster County, Pennsylvania. Donegal Mutual owns the remaining 51.8% of the outstanding stock of DFSC.
We have four segments: our investment function, our personal lines of insurance, our commercial lines of insurance and our investment in DFSC. The personal lines products of our insurance subsidiaries consist primarily of homeowners and private passenger automobile policies. The commercial lines products of our insurance subsidiaries consist primarily of commercial automobile, commercial multi-peril and workers’ compensation policies.
At December 31, 2012,2013, Donegal Mutual held approximately 39%37% of our outstanding Class A common stock and approximately 76% of our outstanding Class B common stock. This ownership provides Donegal Mutual with approximately 66%65% of the total voting power of our common stock. Our insurance subsidiaries and Donegal Mutual have interrelated operations due to a pooling agreement and other intercompany agreements and transactions. While each company maintains its separate corporate existence, our insurance subsidiaries and Donegal Mutual conduct business together as the Donegal Insurance Group. As such, Donegal Mutual and our insurance subsidiaries share the same business philosophy, the same management, the same employees and the same facilities and offer the same types of insurance products.
Atlantic States, our largest subsidiary, participates in a pooling agreement with Donegal Mutual. Under the pooling agreement, the two companies pool their insurance business and each company receives an allocated percentage of the pooled business. Atlantic States has an 80% share of the results of the pooled business, and Donegal Mutual has a 20% share of the results of the pooled business.
The same executive management and underwriting personnel administer products, classes of business underwritten, pricing practices and underwriting standards of Donegal Mutual and our insurance subsidiaries. In addition, as the Donegal Insurance Group, Donegal Mutual and our insurance subsidiaries share a combined business plan to achieve market penetration and underwriting profitability objectives. The products our insurance subsidiaries and Donegal Mutual market are generally complementary, thereby allowing the Donegal Insurance Group to offer a broader range of products to a given market and to expand the Donegal Insurance Group’s ability to service an entire personal lines or commercial lines account. Distinctions within the products of Donegal Mutual and our insurance subsidiaries generally relate to specific risk profiles targeted within similar classes of business, such as preferred tier versus standard tier products, but we do not allocate all of the standard risk gradients to one company. Therefore, the underwriting profitability of the business the individual companies write directly will vary. However, as the risk characteristics of all business Donegal Mutual and Atlantic States write directly are homogenized within the underwriting pool, Donegal Mutual and Atlantic States share the underwriting results in proportion to their respective participation in the pool. Pooled business represents the predominant percentage of the net underwriting activity of both Donegal Mutual and Atlantic States. We refer to Note 3 - Transactions with Affiliates for more information regarding the pooling agreement.
In December 2010, we acquired MICO, which had been a majority owned subsidiary of West Bend Mutual Insurance Company (“West Bend”), for $42.3 million in cash. Effective on December 1, 2010, MICO entered into a 50% quota-share agreement with third-party reinsurers and a 25% quota-share reinsurance agreement with Donegal Mutual to replace the 75% quota-share reinsurance agreement MICO maintained with West Bend through November 30, 2010.
In May 2011, DFSC and Union National Financial Corporation (“UNNF”) merged, with DFSC as the surviving company in the merger. Under the merger agreement, Province Bank FSB, which DFSC owned, and Union National Community Bank, which UNNF owned, also merged and began doing business as UCB. Donegal Mutual contributed $22.1 million and we contributed $20.6 million to DFSC as additional capital to facilitate the mergers. We use the equity method of accounting for our investment in DFSC. Under the equity method, we record our investment at cost, with adjustments for our share of DFSC’s earnings and losses as well as changes in DFSC’s equity due to unrealized gains and losses.
-61--60-
Basis of Consolidation
Our consolidated financial statements, which we have prepared in accordance with accounting principles generally accepted in the United States of America (“GAAP”), include our accounts and those of our wholly owned subsidiaries. We have eliminated all significant inter-company accounts and transactions in consolidation. The terms “we,” “us,” “our” or the “Company” as used herein refer to the consolidated entity.
Use of Estimates
In preparing our consolidated financial statements, our management makes estimates and assumptions that affect the reported amounts of assets and liabilities at the date of the balance sheet and revenues and expenses for the period. Actual results could differ significantly from those estimates.
We make estimates and assumptions that can have a significant effect on amounts and disclosures we report in our consolidated financial statements. The most significant estimates relate to our insurance subsidiaries’ reserves for property and casualty insurance unpaid losses and loss expenses, valuation of investments and determination of other-than-temporary impairment and our insurance subsidiaries’ policy acquisition costs. While we believe our estimates and the estimates of our insurance subsidiaries are appropriate, the ultimate amounts may differ from the estimates provided. We regularly review our methods for making these estimates as well as the continuing appropriateness of the estimated amounts, and we reflect any adjustment we consider necessary in our current results of operations.
Reclassification
During 2012, we recorded an entry that reduced Accumulated Other Comprehensive Income and increased Retained Earnings by $1.8 million to correct an immaterial error related to prior years.
Investments
We classify our debt and equity securities into the following categories:
Held to Maturity - Debt securities that we have the positive intent and ability to hold to maturity; reported at amortized cost.
Available for Sale - Debt and equity securities not classified as held to maturity; reported at fair value, with unrealized gains and losses excluded from income and reported as a separate component of stockholders’ equity (net of tax effects).
Short-term investments carried at amortized cost, which approximates fair value.
We make estimates concerning the valuation of our investments and the recognition of other-than-temporary declines in the value of our investments. For equity securities, we write down the investment to its fair value and we reflect the amount of the write-down as a realized loss in our results of operations when we consider the decline in value of an individual investment to be other than temporary. We individually monitor all of our investments for other-than-temporary declines in value. Generally, we assume there has been an other-than-temporary decline in value if an individual equity security has depreciated in value by more than 20% of original cost and has been in such an unrealized loss position for more than six months. With respect to a debt security that is in an unrealized loss position, we first assess if we intend to sell the debt security. If we determine we intend to sell the debt security, we recognize the impairment loss in our results of operations. If we do not intend to sell the debt security, we determine whether it is more likely than not that we will be required to sell the debt security prior to recovery. If we determine it is more likely than not that we will be required to sell the debt security prior to recovery, we recognize an impairment loss in our results of operations. If we determine it is more likely than not that we will not be required to sell the debt security prior to recovery, we then evaluate whether a credit loss has occurred. We determine whether a credit loss has occurred by comparing the amortized cost of the debt security to the present value of the cash flows we expect to collect. If we expect a cash flow shortfall, we consider that a credit loss has occurred. If we determine that a credit loss has occurred, we consider the impairment to be other than temporary. We then recognize the amount of the impairment loss related to the credit loss in our results of operations, and we recognize the remaining portion of the impairment loss in our other comprehensive income, net of applicable taxes. In addition, we may write down securities in an unrealized loss position based on a number of other factors, including when the fair value of an investment is significantly below its cost, when the financial condition of the issuer of a security has deteriorated, the occurrence of industry, company or geographic events that have negatively impacted the value of a security and rating agency downgrades.
-62-
We amortize premiums and discounts on debt securities over the life of the security as an adjustment to yield using the effective interest method. We compute realized investment gains and losses using the specific identification method.
We amortize premiums and discounts for mortgage-backed debt securities using anticipated prepayments.
-61-
We account for investments in affiliates using the equity method of accounting. Under the equity method, we record our investment at cost, with adjustments for our share of the affiliate’s earnings and losses as well as changes in the affiliate’s equity due to unrealized gains and losses.
Fair Values of Financial Instruments
We use the following methods and assumptions in estimating our fair value disclosures:
Investments - We present our investments in available-for-sale fixed maturity and equity securities at estimated fair value. The estimated fair value of a security may differ from the amount that could be realized if we sold the security in a forced transaction. In addition, the valuation of fixed maturity investments is more subjective when markets are less liquid, increasing the potential that the estimated fair value does not reflect the price at which an actual transaction would occur. We utilize nationally recognized independent pricing services to estimate fair values for our fixed maturity and equity investments. We generally obtain one price per security. The pricing services utilize market quotations for fixed maturity and equity securities that have quoted prices in active markets. For fixed maturity securities that generally do not trade on a daily basis, the pricing services prepare estimates of fair value measurements based predominantly on observable market inputs. The pricing services do not use broker quotes in determining the fair values of our investments. Our investment personnel review the estimates of fair value the pricing services provide to determine if the estimates obtained are representative of fair values based upon their general knowledge of the market, their research findings related to unusual fluctuations in value and their comparison of such values to execution prices for similar securities. Our investment personnel monitor the market and are familiar with current trading ranges for similar securities and pricing of specific investments. Our investment personnel review all pricing estimates that we receive from the pricing services against their expectations with respect to pricing based on fair market curves, security ratings, coupon rates, security type and recent trading activity. Our investment personnel review documentation with respect to the pricing services’ pricing methodology that they obtain periodically to determine if the primary pricing sources, market inputs and pricing frequency for various security types are reasonable. We refer to Note 65 - Fair Value Measurements for more information regarding our methods and assumptions in estimating fair values.
Cash and Short-Term Investments - The carrying amounts reported in the balance sheet for these instruments approximate their fair values.
Premiums and Reinsurance Receivables and Payables - The carrying amounts reported in the balance sheet for these instruments related to premiums and paid losses and loss expenses approximate their fair values.
Subordinated Debentures - The carrying amounts reported in the balance sheet for these instruments approximate their fair values.
-63-
Revenue Recognition
Our insurance subsidiaries recognize insurance premiums as income over the terms of the policies they issue. Our insurance subsidiaries calculate unearned premiums on a daily pro-rata basis. We recorded an unearned premium liability for the fair value of the net unexpired portion of the insurance policies we acquired in connection with our acquisition of MICO. We recognized this unearned premium liability as income over the terms of MICO’s policies.
Policy Acquisition Costs
We defer our insurance subsidiaries’ policy acquisition costs, consisting primarily of commissions, premium taxes and certain other underwriting costs, reduced by ceding commissions, that vary with and relate directly to the production of business. We amortize these deferred policy acquisition costs over the period in which our insurance subsidiaries earn the premiums. The method we follow in computing deferred policy acquisition costs limits the amount of such deferred costs to their estimated realizable value, which gives effect to the premium to be earned, related investment income, losses and loss expenses and certain other costs we expect to incur as our insurance subsidiaries earn the premium. Estimates in the calculation of policy acquisition costs have not shown material variability because of uncertainties in applying accounting principles or as a result of sensitivities to changes in key assumptions.
Property and Equipment
We report property and equipment at depreciated cost that we compute using the straight-line method based upon estimated useful lives of the assets.
-62-
Losses and Loss Expenses
Liabilities for losses and loss expenses are estimates at a given point in time of the amounts an insurer expects to pay with respect to policyholder claims based on facts and circumstances then known. At the time of establishing its estimates, an insurer recognizes that its ultimate liability for losses and loss expenses will exceed or be less than such estimates. Our insurance subsidiaries base their estimates of liabilities for losses and loss expenses on assumptions as to future loss trends and expected claims severity, judicial theories of liability and other factors. However, during the loss adjustment period, our insurance subsidiaries may learn additional facts regarding certain claims, and consequently, it often becomes necessary for our insurance subsidiaries to refine and adjust their estimates of liability. We reflect any adjustments to our insurance subsidiaries’ liabilities for losses and loss expenses in our operating results in the period in which our insurance subsidiaries record the changes in estimates.
Our insurance subsidiaries maintain liabilities for the payment of losses and loss expenses with respect to both reported and unreported claims. Our insurance subsidiaries establish these liabilities for the purpose of covering the ultimate costs of settling all losses, including investigation and litigation costs. Our insurance subsidiaries base the amount of their liability for reported losses primarily upon a case-by-case evaluation of the type of risk involved, knowledge of the circumstances surrounding each claim and the insurance policy provisions relating to the type of loss their policyholder incurred. Our insurance subsidiaries determine the amount of their liability for unreported claims and loss expenses on the basis of historical information by line of insurance. Our insurance subsidiaries account for inflation in the reserving function through analysis of costs and trends and reviews of historical reserving results. Our insurance subsidiaries closely monitor their liabilities and recompute them periodically using new information on reported claims and a variety of statistical techniques. Our insurance subsidiaries do not discount their liabilities for losses.
We recorded a liability for the fair value of the net loss and loss expense reserves we assumed in connection with our acquisition of MICO. We incorporated various factors in determining the fair value of those reserve estimates, including the guarantee against any deficiency in excess of $1.0 million we discuss in Note 4-Business Combinations.
Reserve estimates can change over time because of unexpected changes in assumptions related to our insurance subsidiaries’ external environment and, to a lesser extent, assumptions as to our insurance subsidiaries’ internal operations. For example, our insurance subsidiaries have experienced a decrease in claims frequency on workers’ compensation claims during the past several years while claims severity has gradually increased. These trend changes give rise to greater uncertainty as to the pattern of future loss settlements on workers’ compensation claims. Related uncertainties regarding future trends include the cost of medical technologies and procedures and changes in the utilization of medical procedures. Assumptions related to our insurance subsidiaries’ external environment include the absence of significant changes in tort law and the legal environment that increase liability exposure, consistency in judicial interpretations of insurance coverage and policy provisions and the rate of loss cost inflation. Internal assumptions include consistency in the recording of premium and loss statistics, consistency in the recording of claims, payment and case reserving methodology, accurate measurement of the impact of rate changes and changes in policy provisions, consistency in the quality and characteristics of business written within a given line of business
-64-
and consistency in reinsurance coverage and collectibility of reinsured losses, among other items. To the extent our insurance subsidiaries determine that underlying factors impacting their assumptions have changed, our insurance subsidiaries attempt to make appropriate adjustments for such changes in their reserves. Accordingly, our insurance subsidiaries’ ultimate liability for unpaid losses and loss expenses will likely differ from the amount recorded.
Our insurance subsidiaries seek to enhance their underwriting results by carefully selecting the product lines they underwrite. Our insurance subsidiaries’ personal lines products include standard and preferred risks in private passenger automobile and homeowners lines. Our insurance subsidiaries’ commercial lines products primarily include business offices, wholesalers, service providers, contractors, artisans and light manufacturing operations. Our insurance subsidiaries have limited exposure to asbestos and other environmental liabilities. Our insurance subsidiaries write no medical malpractice liability risks.
Income Taxes
We currently file a consolidated federal income tax return.
We account for income taxes using the asset and liability method. The objective of the asset and liability method is to establish deferred tax assets and liabilities for the temporary differences between the financial reporting basis and the tax basis of our assets and liabilities at enacted tax rates expected to be in effect when we realize or settle such amounts.
Credit Risk
Our objective is to earn competitive returns by investing in a diversified portfolio of securities. Our portfolio of fixed maturity securities and, to a lesser extent, short-term investments is subject to credit risk. We define this risk as the potential loss in fair value resulting from adverse changes in the borrower’s ability to repay the debt. We manage this risk by performing an analysis of prospective investments and through regular reviews of our portfolio by our investment staff. We also limit the amount of our total investment portfolio that we invest in any one security.
Our insurance subsidiaries provide property and liability insurance coverages through independent insurance agencies located throughout their operating areas. Our insurance subsidiaries bill the majority of this business directly to their policyholders, although our insurance subsidiaries bill a portion of their commercial business through their agents, to whom they extend credit in the normal course of business.
-63-
Our insurance subsidiaries have reinsurance agreements with Donegal Mutual and with a number of major unaffiliated reinsurers.
Reinsurance Accounting and Reporting
Our insurance subsidiaries rely upon reinsurance agreements to limit their maximum net loss from large single risks or risks in concentrated areas and to increase their capacity to write insurance. Reinsurance does not relieve our insurance subsidiaries from liability to their respective policyholders. To the extent that a reinsurer cannot pay losses for which it is liable under the terms of a reinsurance agreement with one of our insurance subsidiaries, our insurance subsidiaries retain continued liability for such losses. However, in an effort to reduce the risk of non-payment, our insurance subsidiaries require all of their reinsurers to have an A.M. Best rating of A- or better or, with respect to foreign reinsurers, to have a financial condition that, in the opinion of management, is equivalent to a company with an A.M. Best rating of A- or better. We refer to Note 1110 - Reinsurance for more information regarding our reinsurance agreements.
Stock-Based Compensation
We measure all share-based payments to employees, including grants of stock options, using a fair-value-based method and record such expense in our results of operations. In determining the expense we record for stock options granted to directors and employees of our subsidiaries and affiliates, other than Donegal Mutual, we estimate the fair value of each option award on the date of grant using the Black-Scholes option pricing model. The significant assumptions we utilize in applying the Black-Scholes option pricing model are the risk-free interest rate, expected term, dividend yield and expected volatility.
In 2013 and 2012, we realized $531,159 and $52,422, respectively in tax benefits upon the exercise of stock options. We did not realize any tax benefits upon the exercise of stock options in 2011 or 2010.
-65-
Earnings per Share
We calculate basic earnings per share by dividing net income by the weighted-average number of common shares outstanding for the period. Diluted earnings per share reflects the dilution that could occur if securities or other contracts to issue common stock were exercised or converted into common stock.
We have two classes of common stock, which we refer to as Class A common stock and Class B common stock. Our Class A common stock is entitled to the declaration and payment of cash dividends that are at least 10% higher than those declaredwe declare and paidpay on our Class B common stock. Accordingly, we use the two-class method for the computation of earnings per common share. The two-class method is an earnings allocation formula that determines earnings per share separately for each class of common stock based on dividends declared and an allocation of remaining undistributed earnings using a participation percentage that reflects the dividend rights of each class.
Goodwill and Other Intangible Assets
Goodwill represents the excess of the purchase price over the underlying fair value of acquired entities. When completing acquisitions, we seek also to identify separately identifiable intangible assets that we have acquired. We assess goodwill and intangible assets with an indefinite useful life for impairment annually. We also assess goodwill and other intangible assets for impairment upon the occurrence of certain events. In making our assessment, we consider a number of factors including operating results, business plans, economic projections, anticipated future cash flows and current market data. Inherent uncertainties exist with respect to these factors and to our judgment in applying them when we make our assessment. Impairment of goodwill and other intangible assets could result from changes in economic and operating conditions in future periods.
2 - Impact of New Accounting Standards
In October 2010,February 2013, the Financial Accounting Standards Board (the “FASB”(“FASB”) issued updated guidance that requires an entity to addressprovide information about amounts it reclassifies out of accumulated other comprehensive income. If GAAP requires an entity to reclassify amounts out of accumulated other comprehensive income to net income in their entirety in the diversitysame reporting period, the guidance requires an entity to present significant amounts it reclassifies out of accumulated other comprehensive income by
-64-
the respective line items of net income, either on the face of the statement where the entity presents net income or in practice for the accounting for costs associated with acquiring or renewing insurance contracts. This guidance modifies the definition of acquisition costs to specify that a cost must relate directlynotes to the successful acquisition of a new or renewal insurance contractentity’s financial statements,. For other amounts that GAAP does not require an entity to qualify for deferral. Ifreclassify to net income in their entirety, the application of this guidance would result in the capitalization of acquisition costsrequires an entity to cross-reference such amounts to other disclosures GAAP requires that a reporting entity had not previously capitalized, the entity may elect not to capitalizeprovide additional detail about those costs.amounts. The updated guidance iswas effective for interim and annual reporting periods beginning after December 15, 2011.2012. We adopted this new guidance prospectively in 2012. The amountas of acquisition costs we capitalized during 2012 did not change materially from the amount of acquisition costs that we would have capitalized had we applied our previous policy during the period. Our adoption of this new guidance did not have a material impact on our financial position, results of operations or cash flows.
In May 2011, the FASB issued guidance that eliminates the concepts of in-use and in-exchange when measuring the fair value of all financial instruments. The fair value of a financial asset should be measured on a standalone basis and cannot be measured as part of a group. The new guidance requires several new disclosures including the disclosure of all transfers between LevelJanuary 1, and Level 2 of the fair value hierarchy and additional disclosures regarding Level 3 assets. This guidance is effective for interim and annual periods beginning on or after December 15, 2011. We adopted this new guidance in 2012.2013. Our adoption of this new guidance did not impact our financial position, results of operations or cash flows.
In June 2011, the FASB issued new guidance related to the presentation of other comprehensive income. The new guidance provides entities with an option to either replace the income statement with a statement of comprehensive income, which would display both the components of net income and comprehensive in a combined statement, or to present a separate statement of comprehensive income immediately following the income statement. The new guidance does not affect the components of other comprehensive income or the calculation of earnings per share. The new guidance is effective for fiscal years, and interim periods within those years, beginning after December 15, 2011. The new guidance is to be applied retrospectively with early adoption permitted. We adopted this new guidance in 2012. Our adoption of this new guidance did not impact our financial position, results of operations or cash flows.
In September 2011, the FASB issued new guidance related to evaluating goodwill for impairment. The new guidance provides entities with the option to perform a qualitative assessment of whether it is more likely than not that the fair value of a reporting unit is less than its carrying amount before applying the quantitative two-step goodwill impairment test. If an entity concludes that it is not more likely than not that the fair value of a reporting unit is less than its carrying amount, it is not required to perform the quantitative two-step goodwill impairment test. Entities also have the option of bypassing the assessment of qualitative factors for any reporting unit in any period and proceed directly to performing the first step of the quantitative two-step goodwill impairment test, as was required prior to the issuance of this new guidance. An entity may begin or resume performing the qualitative assessment in any subsequent period. The new guidance is effective for fiscal years, and interim periods within those years, beginning after December 15, 2011, with early adoption permitted. We adopted this new guidance in 2011. Our adoption of this new guidance did not impact our financial position, results of operations or cash flows.
-66-
In July 2012, the FASB issued guidance related to evaluating indefinite-lived intangible assets for impairment. The new guidance provides entities with the option of performing a qualitative assessment of whether it is more likely than not that the fair value of an indefinite-lived intangible asset is less than its carrying amount. If an entity concludes that it is not more likely than not that the fair value of an indefinite-lived intangible asset is less than its carrying value, it is not required to perform the quantitative impairment test. Entities also have the option of bypassing the qualitative assessment for any indefinite-lived intangible asset in any period and proceed directly to performing the quantitative impairment test. Entities are able to resume performing the qualitative assessment in any subsequent period. This guidance is effective for annual and interim impairment tests performed for fiscal years beginning after September 15, 2012, with early adoption permitted. We adopted this new guidance in 2012. Our adoption of this new guidance did not impact our financial position, results of operations or cash flows.
3 - Transactions with Affiliates
Our insurance subsidiaries conduct business and have various agreements with Donegal Mutual that we describe in the following subparagraphs:
a. Reinsurance Pooling and Other Reinsurance Arrangements
Atlantic States, our largest insurance subsidiary, and Donegal Mutual have a pooling agreement under which both companies contribute all of their direct written business to the pool and receive an allocated percentage of their combined underwriting results, excluding certain reinsurance Donegal Mutual assumes from our insurance subsidiaries. Atlantic States has an 80% share of the results of the pool, and Donegal Mutual has a 20% share of the results of the pool. The intent of the pooling agreement is to produce more uniform and stable underwriting results from year to year for each pool participant than they would experience individually and to spread the risk of loss between the participants based on each participant’s relative amount of surplus and relative access to capital. Each participant in the pool has at its disposal the capacity of the entire pool, rather than being limited to policy exposures of a size commensurate with its own capital and surplus.
The following amounts represent reinsurance Atlantic States ceded to the pool during 2013, 2012 2011 and 2010:2011:
| 2012 | 2011 | 2010 | 2013 | 2012 | 2011 | |||||||||||||||||||
Premiums earned | $ | 132,876,094 | $ | 118,812,725 | $ | 105,376,068 | $ | 145,678,744 | $ | 132,876,094 | $ | 118,812,725 | ||||||||||||
Losses and loss expenses | 92,459,147 | 97,130,846 | 81,203,625 | 95,037,273 | 92,459,147 | 97,130,846 | ||||||||||||||||||
Prepaid reinsurance premiums | 70,572,281 | 64,214,378 | 57,783,435 | 75,232,651 | 70,572,281 | 64,214,378 | ||||||||||||||||||
Liability for losses and loss expenses | 83,623,652 | 77,312,645 | 65,028,781 | 88,035,924 | 83,623,652 | 77,312,645 | ||||||||||||||||||
The following amounts represent reinsurance Atlantic States assumed from the pool during 2013, 2012 2011 and 2010:2011:
| 2012 | 2011 | 2010 | 2013 | 2012 | 2011 | |||||||||||||||||||
Premiums earned | $ | 298,803,060 | $ | 266,687,610 | $ | 238,308,846 | $ | 337,548,492 | $ | 298,803,060 | $ | 266,687,610 | ||||||||||||
Losses and loss expenses | 187,415,893 | 206,907,170 | 160,256,348 | 198,785,775 | 187,415,893 | 206,907,170 | ||||||||||||||||||
Unearned premiums | 157,140,642 | 141,880,039 | 125,322,884 | 176,845,395 | 157,140,642 | 141,880,039 | ||||||||||||||||||
Liability for losses and loss expenses | 162,863,045 | 156,941,512 | 134,580,026 | 175,497,405 | 162,863,045 | 156,941,512 | ||||||||||||||||||
Donegal Mutual and Le Mars have a quota-share reinsurance agreement whereby Le Mars assumes 100% of the premiums and losses related to certain products Donegal Mutual offers in certain MidwestMidwestern states, which provide the availability of complementary products to Le Mars’ commercial accounts. Until October 31, 2012, Donegal Mutual and Southern had a quota-share reinsurance agreement whereby Southern assumed 100% of the premiums and losses related to personal lines products Donegal Mutual offersoffered in Virginia through the use of its automated policy quoting and issuance system. The following amounts represent reinsurance Southern and Le Mars assumed from Donegal Mutual pursuant to the quota-share reinsurance agreements during 2013, 2012 2011 and 2010:2011:
| 2012 | 2011 | 2010 | 2013 | 2012 | 2011 | |||||||||||||||||||
Premiums earned | $ | 22,189,399 | $ | 17,757,409 | $ | 14,516,901 | $ | 12,170,155 | $ | 22,189,399 | $ | 17,757,409 | ||||||||||||
Losses and loss expenses | 19,620,587 | 14,983,405 | 12,600,094 | 10,839,444 | 19,620,587 | 14,983,405 | ||||||||||||||||||
Unearned premiums | 9,926,381 | 10,225,922 | 8,124,069 | 1,831,672 | 9,926,381 | 10,225,922 | ||||||||||||||||||
Liability for losses and loss expenses | 8,873,592 | 7,770,053 | 7,316,879 | 7,838,274 | 8,873,592 | 7,770,053 | ||||||||||||||||||
-67--65-
Donegal Mutual and MICO have a quota-share reinsurance agreement whereby Donegal Mutual assumes 25% of the premiums and losses related to the business of MICO. Donegal Mutual and Peninsula have a quota-share reinsurance agreement whereby Donegal Mutual assumes 100% of the premiums and losses related to the workers’ compensation product line of Peninsula in certain states. The business Donegal Mutual assumes becomes part of the pooling agreement between Donegal Mutual and Atlantic States.
The following amounts represent reinsurance ceded to Donegal Mutual pursuant to these quota-share reinsurance agreements during 2013, 2012 2011 and 2010:2011:
| 2012 | 2011 | 2010 | 2013 | 2012 | 2011 | |||||||||||||||||||
Premiums earned | $ | 33,046,914 | $ | 22,123,229 | $ | 4,516,313 | $ | 34,992,435 | $ | 33,046,914 | $ | 22,123,229 | ||||||||||||
Losses and loss expenses | 22,569,557 | 16,038,590 | 3,463,112 | 25,301,470 | 22,569,557 | 16,038,590 | ||||||||||||||||||
Prepaid reinsurance premiums | 15,457,605 | 14,181,338 | 4,590,424 | 16,032,985 | 15,457,605 | 14,181,338 | ||||||||||||||||||
Liability for losses and loss expenses | 18,285,182 | 11,868,641 | 4,006,231 | 25,298,464 | 18,285,182 | 11,868,641 | ||||||||||||||||||
Atlantic States, Southern and Le Mars each have a catastrophe reinsurance agreement with Donegal Mutual that provides coverage under any one catastrophic occurrence above a set retention ($2,000,000, $1,500,0002,500,000, $2,000,000 and $500,000 for Atlantic States, Southern and Le Mars, respectively) up to $5,000,000,, with a combined retention of $3,000,000$5,000,000 for a catastrophe involving a combination of these subsidiaries. Oursubsidiaries, up to the amount Donegal Mutual and our insurance subsidiaries recover losses in excess of $5,000,000 for any one catastrophe occurrenceretain under catastrophe reinsurance agreements with unaffiliated reinsurers.reinsurers . Donegal Mutual and Southern have an excess of loss reinsurance agreement in which Donegal Mutual assumes up to $500,000 ($350,000 in 2011 and 2010)2011) of losses in excess of $500,000 ($400,000 in 2011 and 2010)2011).
The following amounts represent reinsurance that our insurance subsidiaries ceded to Donegal Mutual pursuant to these reinsurance agreements during 2013, 2012 2011 and 2010:2011:
| 2012 | 2011 | 2010 | 2013 | 2012 | 2011 | |||||||||||||||||||
Premiums earned | $ | 12,460,511 | $ | 12,953,452 | $ | 8,110,268 | $ | 12,108,754 | $ | 12,460,511 | $ | 12,953,452 | ||||||||||||
Losses and loss expenses | 10,787,850 | 20,770,637 | 6,649,775 | 2,323,726 | 10,787,850 | 20,770,637 | ||||||||||||||||||
Liability for losses and loss expenses | 2,206,786 | 3,980,024 | 3,441,447 | 2,366,370 | 2,206,786 | 3,980,024 | ||||||||||||||||||
The following amounts represent the effect of affiliated reinsurance transactions on net premiums our insurance subsidiaries earned during 2013, 2012 2011 and 2010:2011:
| 2012 | 2011 | 2010 | 2013 | 2012 | 2011 | |||||||||||||||||||
Assumed | $ | 320,992,459 | $ | 284,445,019 | $ | 252,825,747 | $ | 349,718,647 | $ | 320,992,459 | $ | 284,445,019 | ||||||||||||
Ceded | (178,383,519 | ) | (153,889,406 | ) | (118,002,649 | ) | (192,779,933 | ) | (178,383,519 | ) | (153,889,406 | ) | ||||||||||||
|
|
|
|
|
| |||||||||||||||||||
Net | $ | 142,608,940 | $ | 130,555,613 | $ | 134,823,098 | $ | 156,938,714 | $ | 142,608,940 | $ | 130,555,613 | ||||||||||||
|
|
|
|
|
| |||||||||||||||||||
The following amounts represent the effect of affiliated reinsurance transactions on net losses and loss expenses our insurance subsidiaries incurred during 2013, 2012 2011 and 2010:2011:
| 2012 | 2011 | 2010 | 2013 | 2012 | 2011 | |||||||||||||||||||
Assumed | $ | 207,036,480 | $ | 221,890,575 | $ | 172,856,442 | $ | 209,625,219 | $ | 207,036,480 | $ | 221,890,575 | ||||||||||||
Ceded | (125,816,554 | ) | (133,940,073 | ) | (91,316,512 | ) | (122,662,469 | ) | (125,816,554 | ) | (133,940,073 | ) | ||||||||||||
|
|
|
|
|
| |||||||||||||||||||
Net | $ | 81,219,926 | $ | 87,950,502 | $ | 81,539,930 | $ | 86,962,750 | $ | 81,219,926 | $ | 87,950,502 | ||||||||||||
|
|
|
|
|
| |||||||||||||||||||
-68--66-
b. Expense Sharing
Donegal Mutual provides facilities, management and other services to us and our insurance subsidiaries. Donegal Mutual allocates certain related expenses to Atlantic States in relation to the relative participation of Atlantic States and Donegal Mutual in the pooling agreement. Our insurance subsidiaries other than Atlantic States reimburse Donegal Mutual for their personnel costs and bear their proportionate share of information services costs based on their percentage of the total written premiums of the Donegal Insurance Group. Charges for these services totalled $94,021,056, $78,778,333 and $64,711,860 for 2013, 2012 and $63,982,793 for 2012, 2011, and 2010, respectively.
c. Lease Agreement
We lease office equipment and automobiles with terms ranging from 3 to 10 years to Donegal Mutual under a 10-year lease agreement dated January 1, 2011.
d. Legal Services
Donald H. Nikolaus, our Chairman of the Board and President and one of our directors, is a partner in the law firm of Nikolaus & Hohenadel. Such firm has served as our general counsel since 1986, principally in connection with the defense of claims litigation arising in Lancaster, Dauphin and York counties of Pennsylvania. We pay such firm its customary fees for such services.
e. Union Community Bank
At December 31, 20122013 and 2011,2012, we had $18,806,576$24,001,726 and $10,907,454,$18,806,576, respectively, in checking accounts with UCB, a wholly owned subsidiary of DFSC. We earned $1,954, $1,591 $1,019 and $1,575$1,019 in interest on these accounts during 2013, 2012 2011 and 2010,2011, respectively.
4 - Business Combinations
On December 1, 2010, we acquired all of the outstanding stock of MICO. We accounted for this acquisition as a business combination.
We acquired MICO from West Bend and its other stockholders for a price equal to 122% of MICO’s stockholders’ equity at November 30, 2010, or approximately $42.3 million in cash. We paid $35.1 million to MICO’s stockholders in December 2010 and recorded an additional amount payable at December 31, 2010 of $7.2 million, which we paid pursuant to the terms of our acquisition agreement in the first quarter of 2011. The acquisition of MICO enabled us to extend our insurance business to the state of Michigan. MICO writes various lines of property and casualty insurance and had direct written premiums of $105.4 million and $106.6 million and net premiums earned of $26.9 million and $27.0 million for the years ended December 31, 2010 and 2009, respectively. MICO’s stockholders’ equity and total assets at December 31, 2009 were $32.0 million and $224.5 million, respectively. We recorded goodwill of approximately $4.7 million and other intangible assets of approximately $958,000, none of which are deductible for federal income tax purposes. Pursuant to the terms of our acquisition agreement with West Bend, West Bend has guaranteed us against any deficiency in excess of $1.0 million in the loss and loss expenses of MICO at November 30, 2010. Conversely, we have agreed to return 50% of any redundancy in excess of $1.0 million. Any such deficiency or redundancy will be based on a final actuarial review of the development of such reserves to be conducted three years after November 30, 2010. Based upon a preliminary actuarial review at November 30, 2012, the redundancy in the reserves of MICO at November 30, 2010 was less than $1.0 million. Through December 1, 2010, MICO and West Bend were parties to quota-share reinsurance agreements whereby MICO ceded 75% (80% prior to 2008) of its business to West Bend. MICO and West Bend agreed to terminate the reinsurance agreement in effect at November 30, 2010 on a run-off basis. West Bend’s obligations related to all past reinsurance agreements with MICO remain in effect for all policies effective prior to December 1, 2010. West Bend and MICO entered into a trust agreement on December 1, 2010. Under the terms of the trust agreement, for the sole benefit of MICO, West Bend placed into trust assets with a fair value equal to the amount of unearned premiums and unpaid losses and loss adjustment expenses, reduced by any net premium balances not yet paid by MICO, that West Bend had assumed pursuant to such reinsurance agreements at November 30, 2010. The amount of assets required to be held in trust is adjustable monthly based upon the remaining net obligations of West Bend. West Bend may terminate the trust agreement on the earlier of December 1, 2020 or the date when the obligations of West Bend are equal to or less than $5.0 million. At December 31, 2012, West Bend’s net obligations under the reinsurance agreements were approximately $22.6 million, and the fair value of assets held in trust was approximately $26.3 million.
-69-
We recorded the MICO assets that we acquired and the MICO liabilities that we assumed at their estimated acquisition date fair value. The following table summarizes the estimated fair value of the net assets we acquired at the date of the MICO acquisition based on purchase price allocations:
| (in thousands) | ||||
Assets acquired: | ||||
Investments | $ | 68,693 | ||
Premiums receivable | 27,803 | |||
Prepaid reinsurance premiums | 25,054 | |||
Reinsurance receivable | 83,818 | |||
Goodwill | 4,703 | |||
Other intangible assets | 958 | |||
Other | 2,801 | |||
|
| |||
Total assets acquired | 213,830 | |||
|
| |||
Liabilities assumed: | ||||
Losses and loss expenses | 104,815 | |||
Unearned premiums | 33,688 | |||
Reinsurance balances payable | 16,899 | |||
Accrued expenses | 9,990 | |||
Other | 6,142 | |||
|
| |||
Total liabilities assumed | 171,534 | |||
|
| |||
Net assets acquired | $ | 42,296 | ||
|
| |||
We recorded goodwill of $4.7 million in connection with the MICO acquisition. The goodwill consists largely of economies of scale we expect to realize from integrating the operations of MICO with the operations of the Donegal Insurance Group and benefits we expect to derive from MICO’s relationships with its independent agents and policyholders. We have evaluated the goodwill for impairment during 2012. We will evaluate the goodwill for impairment annually or upon the occurrence of certain future events.
We operate MICO as a subsidiary and intend to continue to maintain its trade name for the foreseeable future. We have therefore established a trade name intangible asset in the amount of $958,000, which represents the estimated value of the future benefits we will derive from the continued use of the trade name. We will not amortize the trade name intangible asset because we have determined that the trade name intangible asset has an indefinite life. We have evaluated the trade name intangible asset for impairment during 2012. We will evaluate the trade name intangible asset for impairment annually or upon the occurrence of certain future events.
Our consolidated financial statements for the year ended December 31, 2010 included the operations of MICO from December 1, 2010, the date we acquired it. Effective on December 1, 2010, MICO entered into a 50% quota-share reinsurance agreement with third-party reinsurers and a 25% quota-share reinsurance agreement with Donegal Mutual to replace the 75% quota-share reinsurance agreement MICO maintained with West Bend through November 30, 2010. Our total revenues related to the operations of MICO and Atlantic States’ allocation with respect to Donegal Mutual’s quota-share reinsurance agreement for the period December 1, 2010 through December 31, 2010 were approximately $2.4 million. MICO’s results of operations for the period December 1, 2010 through December 31, 2010 did not significantly impact our consolidated net income for 2010.
-70-
The following table presents our unaudited pro forma historical results for the years ended December 31, 2010 and 2009 as if we had acquired MICO at January 1, 2009 and MICO had entered into a 25% quota-share reinsurance agreement with Donegal Mutual on that date:
| Year Ended December 31, | ||||||||
| 2010 | 2009 | |||||||
| (in thousands, except per share data) | ||||||||
Total revenues | $ | 458,231 | $ | 423,184 | ||||
Income before income tax benefit | 13,619 | 15,232 | ||||||
Income tax benefit | (741 | ) | (146 | ) | ||||
Net income | 14,360 | 15,378 | ||||||
Class A earnings per share - basic and diluted | 0.58 | 0.62 | ||||||
Class B earnings per share - basic and diluted | 0.52 | 0.55 | ||||||
Significant pro forma income statement adjustments for the year ended December 31, 2009 included a $3.8 million decrease in premiums earned related to the recognition of the pro forma fair value adjustment associated with the net unearned premium liability at January 1, 2009. We have prepared the unaudited pro forma results above for comparative purposes only. These unaudited pro forma results are not necessarily indicative of the results of operations that actually would have resulted had the acquisition occurred at January 1, 2009, nor are the pro forma results necessarily indicative of future operating results.
5 - Investments
The amortized cost and estimated fair values of fixed maturities and equity securities at December 31, 20122013 and 20112012 are as follows:
| 2012 | ||||||||||||||||||||||||||||||||
| Amortized Cost | Gross Unrealized Gains | Gross Unrealized Losses | Estimated Fair Value | 2013 | ||||||||||||||||||||||||||||
Held to Maturity | Amortized Cost | Gross Unrealized Gains | Gross Unrealized Losses | Estimated Fair Value | ||||||||||||||||||||||||||||
U.S. Treasury securities and obligations of U.S. government corporations and agencies | $ | 1,000,000 | $ | 11,510 | $ | — | $ | 1,011,510 | $ | 47,945,882 | $ | — | $ | 869,683 | $ | 47,076,199 | ||||||||||||||||
Obligations of states and political subdivisions | 40,909,132 | 1,609,211 | — | 42,518,343 | 108,435,110 | 465,309 | 446,695 | 108,453,724 | ||||||||||||||||||||||||
Residential mortgage-backed securities | 191,064 | 14,822 | — | 205,886 | ||||||||||||||||||||||||||||
Corporate securities | 14,874,969 | 17,337 | 111,957 | 14,780,349 | ||||||||||||||||||||||||||||
Mortgage-backed securities | 69,114,316 | 32,810 | 666,922 | 68,480,204 | ||||||||||||||||||||||||||||
|
|
|
|
|
|
|
| |||||||||||||||||||||||||
Totals | $ | 42,100,196 | $ | 1,635,543 | $ | — | $ | 43,735,739 | $ | 240,370,277 | $ | 515,456 | $ | 2,095,257 | $ | 238,790,476 | ||||||||||||||||
|
|
|
|
|
|
|
| |||||||||||||||||||||||||
| 2012 | ||||||||||||||||||||||||||||||||
| Amortized Cost | Gross Unrealized Gains | Gross Unrealized Losses | Estimated Fair Value | 2013 | ||||||||||||||||||||||||||||
Available for Sale | Amortized Cost | Gross Unrealized Gains | Gross Unrealized Losses | Estimated Fair Value | ||||||||||||||||||||||||||||
U.S. Treasury securities and obligations of U.S. government corporations and agencies | $ | 70,253,846 | $ | 1,101,208 | $ | 43,951 | $ | 71,311,103 | $ | 14,272,550 | $ | 117,736 | $ | 56,589 | $ | 14,333,697 | ||||||||||||||||
Obligations of states and political subdivisions | 385,371,983 | 32,221,045 | 606,065 | 416,986,963 | 265,783,151 | 11,778,794 | 15,221 | 277,546,724 | ||||||||||||||||||||||||
Corporate securities | 73,941,532 | 3,522,954 | 108,709 | 77,355,777 | 39,939,873 | 775,430 | 43,380 | 40,671,923 | ||||||||||||||||||||||||
Residential mortgage-backed securities | 125,606,445 | 3,315,976 | 66,443 | 128,855,978 | ||||||||||||||||||||||||||||
Mortgage-backed securities | 70,258,677 | 923,380 | 82,436 | 71,099,621 | ||||||||||||||||||||||||||||
|
|
|
|
|
|
|
| |||||||||||||||||||||||||
Fixed maturities | 655,173,806 | 40,161,183 | 825,168 | 694,509,821 | 390,254,251 | 13,595,340 | 197,626 | 403,651,965 | ||||||||||||||||||||||||
Equity securities | 8,663,183 | 200,823 | 106,748 | 8,757,258 | 12,168,110 | 347,594 | 92,867 | 12,422,837 | ||||||||||||||||||||||||
|
|
|
|
|
|
|
| |||||||||||||||||||||||||
Totals | $ | 663,836,989 | $ | 40,362,006 | $ | 931,916 | $ | 703,267,079 | $ | 402,422,361 | $ | 13,942,934 | $ | 290,493 | $ | 416,074,802 | ||||||||||||||||
|
|
|
|
|
|
|
| |||||||||||||||||||||||||
-71--67-
| 2011 | ||||||||||||||||||||||||||||||||
| Amortized Cost | Gross Unrealized Gains | Gross Unrealized Losses | Estimated Fair Value | 2012 | ||||||||||||||||||||||||||||
Held to Maturity | Amortized Cost | Gross Unrealized Gains | Gross Unrealized Losses | Estimated Fair Value | ||||||||||||||||||||||||||||
U.S. Treasury securities and obligations of U.S. government corporations and agencies | $ | 1,000,000 | $ | 53,990 | $ | — | $ | 1,053,990 | $ | 1,000,000 | $ | 11,510 | $ | — | $ | 1,011,510 | ||||||||||||||||
Obligations of states and political subdivisions | 56,965,959 | 2,857,005 | — | 59,822,964 | 40,909,132 | 1,609,211 | — | 42,518,343 | ||||||||||||||||||||||||
Corporate securities | 249,850 | 2,756 | — | 252,606 | ||||||||||||||||||||||||||||
Residential mortgage-backed securities | 273,810 | 18,986 | 9 | 292,787 | ||||||||||||||||||||||||||||
Mortgage-backed securities | 191,064 | 14,822 | — | 205,886 | ||||||||||||||||||||||||||||
|
|
|
|
|
|
|
| |||||||||||||||||||||||||
Totals | $ | 58,489,619 | $ | 2,932,737 | $ | 9 | $ | 61,422,347 | $ | 42,100,196 | $ | 1,635,543 | $ | — | $ | 43,735,739 | ||||||||||||||||
|
|
|
|
|
|
|
| |||||||||||||||||||||||||
| 2011 | ||||||||||||||||||||||||||||||||
| Amortized Cost | Gross Unrealized Gains | Gross Unrealized Losses | Estimated Fair Value | 2012 | ||||||||||||||||||||||||||||
Available for Sale | Amortized Cost | Gross Unrealized Gains | Gross Unrealized Losses | Estimated Fair Value | ||||||||||||||||||||||||||||
U.S. Treasury securities and obligations of U.S. government corporations and agencies | $ | 59,431,789 | $ | 1,545,768 | $ | — | $ | 60,977,557 | $ | 70,253,846 | $ | 1,101,208 | $ | 43,951 | $ | 71,311,103 | ||||||||||||||||
Obligations of states and political subdivisions | 372,663,210 | 26,252,161 | 38,789 | 398,876,582 | 385,371,983 | 32,221,045 | 606,065 | 416,986,963 | ||||||||||||||||||||||||
Corporate securities | 62,836,703 | 1,805,109 | 528,163 | 64,113,649 | 73,941,532 | 3,522,954 | 108,709 | 77,355,777 | ||||||||||||||||||||||||
Residential mortgage-backed securities | 119,367,152 | 3,306,932 | 43,694 | 122,630,390 | ||||||||||||||||||||||||||||
Mortgage-backed securities | 125,606,445 | 3,315,976 | 66,443 | 128,855,978 | ||||||||||||||||||||||||||||
|
|
|
|
|
|
|
| |||||||||||||||||||||||||
Fixed maturities | 614,298,854 | 32,909,970 | 610,646 | 646,598,178 | 655,173,806 | 40,161,183 | 825,168 | 694,509,821 | ||||||||||||||||||||||||
Equity securities | 7,238,803 | 606,440 | 407,705 | 7,437,538 | 8,663,183 | 200,823 | 106,748 | 8,757,258 | ||||||||||||||||||||||||
|
|
|
|
|
|
|
| |||||||||||||||||||||||||
Totals | $ | 621,537,657 | $ | 33,516,410 | $ | 1,018,351 | $ | 654,035,716 | $ | 663,836,989 | $ | 40,362,006 | $ | 931,916 | $ | 703,267,079 | ||||||||||||||||
|
|
|
|
|
|
|
| |||||||||||||||||||||||||
At December 31, 2013, our holdings of obligations of states and political subdivisions included general obligation bonds with an aggregate fair value of $294.1 million and an amortized cost of $284.9 million. Our holdings also included special revenue bonds with an aggregate fair value of $91.9 million and an amortized cost of $89.3 million. With respect to both categories, we held no securities of any issuer that comprised more than 10% of the category at December 31, 2013. Education bonds and water and sewer utility bonds represented 56% and 23%, respectively, of our total investments in special revenue bonds based on their carrying values at December 31, 2013. Many of the issuers of the special revenue bonds we held at December 31, 2013 have the authority to impose ad valorem taxes. In that respect, many of the special revenue bonds we held are similar to general obligation bonds.
At December 31, 2012, our holdings of obligations of states and political subdivisions included general obligation bonds with an aggregate fair value of $358.5 million and an amortized cost of $332.4 million. Our holdings also included special revenue bonds with an aggregate fair value of $101.0 million and an amortized cost of $93.9 million. With respect to both categories, we held no securities of any issuer that comprised more than 10% of the category at December 31, 2012. Education bonds and water and sewer utility bonds represented 54% and 19%, respectively, of our total investments in special revenue bonds based on their carrying values at December 31, 2012. Many of the issuers of the special revenue bonds we held at December 31, 2012 have the authority to impose ad valorem taxes. In that respect, many of the special revenue bonds we held are similar to general obligation bonds.
At December 31, 2011, our holdings
-68-
We made reclassifications from available for sale to held to maturity of obligations of states and political subdivisions included general obligation bonds with an aggregatefixed maturities at fair value of $372.2 million and an amortized cost of $348.4 million. Our holdings also included special revenue bonds with an aggregate fair value of $86.5 million and an amortized cost of $81.0 million. With respect to both categories, we held no securities of any issuer that comprised more than 10%on November 30, 2013. We present the impact of the categorytransfers in the following table, summarized by type of securities, at December 31, 2011. Education bonds and water and sewer utility bonds represented 59% and 17%, respectively,November 30, 2013:
| Amortized Cost | Estimated Fair Value | |||||||
U.S. Treasury securities and obligations of U.S. government corporations and agencies | $ | 50,627,225 | $ | 47,914,311 | ||||
Obligations of states and political subdivisions | 88,456,842 | 79,866,801 | ||||||
Corporate securities | 15,745,976 | 14,879,294 | ||||||
Mortgage-backed securities | 72,465,250 | 69,567,883 | ||||||
|
|
|
| |||||
Totals | $ | 227,295,293 | $ | 212,228,289 | ||||
|
|
|
| |||||
We have segregated within accumulated other comprehensive loss the net unrealized losses of our total investments in special revenue bonds based on their carrying values at December 31, 2011. Many$15.1 million arising prior to the November 30, 2013 reclassification date for fixed maturities reclassified from available for sale to held to maturity. We will amortize this balance over the remaining life of the issuersrelated securities as an adjustment of yield in a manner consistent with the special revenue bonds we held at December 31, 2011 haveaccretion of discount on the authority to impose ad valorem taxes. In that respect, many of the special revenue bonds we held are similar to general obligation bonds.same fixed maturities.
-72-
We set forth below the amortized cost and estimated fair value of fixed maturities at December 31, 20122013 by contractual maturity. Expected maturities may differ from contractual maturities because borrowers may have the right to call or prepay obligations with or without call or prepayment penalties.
| Amortized Cost | Estimated Fair Value | |||||||||||||||
| Amortized Cost | Estimated Fair Value | |||||||||||||||
Held to maturity | ||||||||||||||||
Due in one year or less | $ | 1,000,000 | $ | 1,011,510 | ||||||||||||
Due after one year through five years | 31,815,724 | 32,965,749 | $ | 26,553,403 | $ | 26,883,591 | ||||||||||
Due after five years through ten years | 9,093,408 | 9,552,594 | 65,434,886 | 64,537,687 | ||||||||||||
Due after ten years | — | — | 79,267,672 | 78,888,994 | ||||||||||||
Residential mortgage-backed securities | 191,064 | 205,886 | ||||||||||||||
Mortgage-backed securities | 69,114,316 | 68,480,204 | ||||||||||||||
|
|
|
| |||||||||||||
Total held to maturity | $ | 42,100,196 | $ | 43,735,739 | $ | 240,370,277 | $ | 238,790,476 | ||||||||
|
|
|
| |||||||||||||
Available for sale | ||||||||||||||||
Due in one year or less | $ | 8,942,472 | $ | 9,003,925 | $ | 8,172,570 | $ | 8,256,627 | ||||||||
Due after one year through five years | 62,233,761 | 64,199,249 | 35,310,675 | 36,104,054 | ||||||||||||
Due after five years through ten years | 181,558,392 | 192,859,072 | 119,933,647 | 125,005,089 | ||||||||||||
Due after ten years | 276,832,736 | 299,591,597 | 156,578,682 | 163,186,574 | ||||||||||||
Residential mortgage-backed securities | 125,606,445 | 128,855,978 | ||||||||||||||
Mortgage-backed securities | 70,258,677 | 71,099,621 | ||||||||||||||
|
|
|
| |||||||||||||
Total available for sale | $ | 655,173,806 | $ | 694,509,821 | $ | 390,254,251 | $ | 403,651,965 | ||||||||
|
|
|
| |||||||||||||
The amortized cost of fixed maturities on deposit with various regulatory authorities at December 31, 20122013 and 20112012 amounted to $10,565,116$10,553,953 and $10,629,319,$10,565,116, respectively.
Investments in affiliates consisted of the following at December 31, 20122013 and 2011:2012:
| 2012 | 2011 | 2013 | 2012 | |||||||||||||
DFSC | $ | 36,770,530 | $ | 31,857,246 | $ | 35,685,433 | $ | 36,770,530 | ||||||||
Other | 465,000 | 465,000 | — | 465,000 | ||||||||||||
|
|
|
| |||||||||||||
Total | $ | 37,235,530 | $ | 32,322,246 | $ | 35,685,433 | $ | 37,235,530 | ||||||||
|
|
|
| |||||||||||||
We account for investments in our affiliates using the equity method of accounting. Under this method, we record our investment at cost, with adjustments for our share of our affiliates’ earnings and losses as well as changes in our affiliates’ equity due to unrealized gains and losses. Our investments in affiliates includeat December 31, 2013 represented our 48.2% ownership interest in DFSC. In May 2011, DFSC merged with UNNF, with DFSC as the surviving company in the merger. Under the merger agreement, Province Bank FSB, which DFSC owned, and Union National Community Bank, which UNNF owned, also merged and began doing business as UCB. Donegal Mutual contributed $22.1 million and we contributed $20.6 million to DFSC as additional capital to facilitate the mergers. We made an additional equity investment in DFSC in the amount of $100,000 during 2012.
-69-
We include our share of DFSC’s net income in our results of operations. We have compiled the following summary financial information for DFSC at December 31, 20122013 and 20112012 from the financial statements of DFSC.
-73-
| December 31, | ||||||||
| Balance sheets: | 2013 | 2012 | ||||||
Total assets | $ | 512,577,883 | $ | 509,670,100 | ||||
|
|
|
| |||||
Total liabilities | $ | 438,649,355 | $ | 433,490,583 | ||||
Stockholders’ equity | 73,928,528 | 76,179,517 | ||||||
|
|
|
| |||||
Total liabilities and stockholders’ equity | $ | 512,577,883 | $ | 509,670,100 | ||||
|
|
|
| |||||
| December 31, | ||||||||
| 2012 | 2011 | |||||||
Balance sheets: | ||||||||
Total assets | $ | 509,670,100 | $ | 532,938,460 | ||||
|
|
|
| |||||
Total liabilities | $ | 433,490,583 | $ | 466,940,425 | ||||
Stockholders’ equity | 76,179,517 | 65,998,035 | ||||||
|
|
|
| |||||
Total liabilities and stockholders’ equity | $ | 509,670,100 | $ | 532,938,460 | ||||
|
|
|
| |||||
| Year Ended December 31, | ||||||||||||||||||||||||
| 2012 | 2011 | 2010 | Year Ended December 31, | |||||||||||||||||||||
Income statements: | 2013 | 2012 | 2011 | |||||||||||||||||||||
Net income (loss) | $ | 9,401,001 | $ | 4,196,054 | $ | (556,528 | ) | |||||||||||||||||
Net income | $ | 6,030,292 | $ | 9,401,001 | $ | 4,196,054 | ||||||||||||||||||
|
|
|
|
|
| |||||||||||||||||||
Other comprehensive (loss) income (loss) in our statements of comprehensive income includes net unrealized (losses) gains (losses) of ($2.2 million), $138,771 and $479,401 for 2013, 2012 and ($32,129) for 2012, 2011, and 2010, respectively, representing our share of DFSC’s unrealized investment gains or losses.
Other investmentAt December 31, 2012, our investments in affiliates representsincluded our investmentinvestments in statutory trusts that holdheld our subordinated debentures that we discuss in Note 109 - Borrowings.
We derive net investment income, consisting primarily of interest and dividends, from the following sources:
| 2012 | 2011 | 2010 | 2013 | 2012 | 2011 | |||||||||||||||||||
Fixed maturities | $ | 24,642,897 | $ | 25,044,316 | $ | 23,995,220 | $ | 23,621,977 | $ | 24,642,897 | $ | 25,044,316 | ||||||||||||
Equity securities | 85,905 | 162,934 | 42,869 | 122,603 | 85,905 | 162,934 | ||||||||||||||||||
Short-term investments | 34,482 | 57,296 | 91,665 | 98,817 | 34,482 | 57,296 | ||||||||||||||||||
Other | 44,874 | 48,588 | 46,095 | 41,608 | 44,874 | 48,588 | ||||||||||||||||||
|
|
|
|
|
| |||||||||||||||||||
Investment income | 24,808,158 | 25,313,134 | 24,175,849 | 23,885,005 | 24,808,158 | 25,313,134 | ||||||||||||||||||
Investment expenses | (4,639,239 | ) | (4,454,955 | ) | (4,226,135 | ) | (5,089,766 | ) | (4,639,239 | ) | (4,454,955 | ) | ||||||||||||
|
|
|
|
|
| |||||||||||||||||||
Net investment income | $ | 20,168,919 | $ | 20,858,179 | $ | 19,949,714 | $ | 18,795,239 | $ | 20,168,919 | $ | 20,858,179 | ||||||||||||
|
|
|
|
|
| |||||||||||||||||||
-70-
We present below gross realized gains and losses from investments, including those we classified as held to maturity, and the change in the difference between fair value and cost of investments:
| 2012 | 2011 | 2010 | 2013 | 2012 | 2011 | |||||||||||||||||||
Gross realized gains: | ||||||||||||||||||||||||
Fixed maturities | $ | 6,730,331 | $ | 4,959,707 | $ | 4,136,455 | $ | 4,774,437 | $ | 6,730,331 | $ | 4,959,707 | ||||||||||||
Equity securities | 926,053 | 8,760,511 | 1,791,585 | 1,634,315 | 926,053 | 8,760,511 | ||||||||||||||||||
|
|
|
|
|
| |||||||||||||||||||
| 7,656,384 | 13,720,218 | 5,928,040 | 6,408,752 | 7,656,384 | 13,720,218 | |||||||||||||||||||
|
|
|
|
|
| |||||||||||||||||||
Gross realized losses: | ||||||||||||||||||||||||
Fixed maturities | 42,135 | 163,316 | 533,918 | 3,091,538 | 42,135 | 163,316 | ||||||||||||||||||
Equity securities | 754,810 | 1,275,635 | 998,402 | 893,772 | 754,810 | 1,275,635 | ||||||||||||||||||
|
|
|
|
|
| |||||||||||||||||||
| 796,945 | 1,438,951 | 1,532,320 | 3,985,310 | 796,945 | 1,438,951 | |||||||||||||||||||
|
|
|
|
|
| |||||||||||||||||||
Net realized gains | $ | 6,859,439 | $ | 12,281,267 | $ | 4,395,720 | $ | 2,423,442 | $ | 6,859,439 | $ | 12,281,267 | ||||||||||||
|
|
|
|
|
| |||||||||||||||||||
Change in difference between fair value and cost of investments: | ||||||||||||||||||||||||
Fixed maturities | $ | 5,739,506 | $ | 29,646,545 | $ | (11,571,194 | ) | $ | (29,153,645 | ) | $ | 5,739,506 | $ | 29,646,545 | ||||||||||
Equity securities | (104,660 | ) | (7,459,314 | ) | 1,547,487 | 160,652 | (104,660 | ) | (7,459,314 | ) | ||||||||||||||
|
|
|
|
|
| |||||||||||||||||||
Totals | $ | 5,634,846 | $ | 22,187,231 | $ | (10,023,707 | ) | $ | (28,992,993 | ) | $ | 5,634,846 | $ | 22,187,231 | ||||||||||
|
|
|
|
|
| |||||||||||||||||||
We held fixed maturities and equity securities with unrealized losses representing declines that we considered temporary at December 31, 2013 as follows:
-74-
| Less than 12 months | 12 months or longer | |||||||||||||||
| Fair Value | Unrealized Losses | Fair Value | Unrealized Losses | |||||||||||||
U.S. Treasury securities and obligations of U.S. government corporations and agencies | $ | 50,802,809 | $ | 821,941 | $ | 4,642,775 | $ | 104,331 | ||||||||
Obligations of states and political subdivisions | 65,170,891 | 363,240 | 13,404,781 | 98,676 | ||||||||||||
Corporate securities | 16,693,759 | 83,535 | 6,851,898 | 71,802 | ||||||||||||
Mortgage-backed securities | 72,878,347 | 535,944 | 19,013,889 | 213,414 | ||||||||||||
Equity securities | 1,628,893 | 92,867 | — | — | ||||||||||||
|
|
|
|
|
|
|
| |||||||||
Totals | $ | 207,174,699 | $ | 1,897,527 | $ | 43,913,343 | $ | 488,223 | ||||||||
|
|
|
|
|
|
|
| |||||||||
We held fixed maturities and equity securities with unrealized losses representing declines that we considered temporary at December 31, 2012 as follows:
| Less than 12 months | 12 months or longer | |||||||||||||||
| Fair Value | Unrealized Losses | Fair Value | Unrealized Losses | |||||||||||||
U.S. Treasury securities and obligations of U.S. government corporations and agencies | $ | 12,308,333 | $ | 43,951 | $ | — | $ | — | ||||||||
Obligations of states and political subdivisions | 22,134,226 | 606,065 | — | — | ||||||||||||
Corporate securities | 12,271,750 | 79,136 | 2,958,520 | 29,573 | ||||||||||||
Residential mortgage-backed securities | 22,491,562 | 66,443 | — | — | ||||||||||||
Equity securities | 2,226,050 | 106,748 | — | — | ||||||||||||
|
|
|
|
|
|
|
| |||||||||
Totals | �� | $ | 71,431,921 | $ | 902,343 | $ | 2,958,520 | $ | 29,573 | |||||||
|
|
|
|
|
|
|
| |||||||||
We held fixed maturities and equity securities with unrealized losses representing declines that we considered temporary at December 31, 2011 as follows:
| Less than 12 months | 12 months or longer | Less than 12 months | 12 months or longer | |||||||||||||||||||||||||||||
| Fair Value | Unrealized Losses | Fair Value | Unrealized Losses | Fair Value | Unrealized Losses | Fair Value | Unrealized Losses | |||||||||||||||||||||||||
U.S. Treasury securities and obligations of U.S. government corporations and agencies | $ | — | $ | — | $ | — | $ | — | $ | 12,308,333 | $ | 43,951 | $ | — | $ | — | ||||||||||||||||
Obligations of states and political subdivisions | 1,638,135 | 17,390 | 540,062 | 21,400 | 22,134,226 | 606,065 | — | — | ||||||||||||||||||||||||
Corporate securities | 10,101,753 | 528,164 | — | — | 12,271,750 | 79,136 | 2,958,520 | 29,573 | ||||||||||||||||||||||||
Residential mortgage-backed securities | 7,411,682 | 43,692 | 626 | 9 | ||||||||||||||||||||||||||||
Mortgage-backed securities | 22,491,562 | 66,443 | — | — | ||||||||||||||||||||||||||||
Equity securities | 4,083,863 | 407,705 | — | — | 2,226,050 | 106,748 | — | — | ||||||||||||||||||||||||
|
|
|
|
|
|
|
| |||||||||||||||||||||||||
Totals | $ | 23,235,433 | $ | 996,951 | $ | 540,688 | $ | 21,409 | $ | 71,431,921 | $ | 902,343 | $ | 2,958,520 | $ | 29,573 | ||||||||||||||||
|
|
|
|
|
|
|
| |||||||||||||||||||||||||
We make estimates concerning the valuation of our investments and the recognition of other-than-temporary declines in the value of our investments. For equity securities, we write down the investment to its fair value, and we reflect the amount of the write-down as a realized loss in our results of operations when we consider the decline in value of an individual investment to be other than temporary. We individually monitor all investments for other-than-temporary declines in value. Generally, we assume there has been an other-than-temporary decline in value if an individual equity security has depreciated in value by more than 20% of original cost and has been in such an unrealized loss position for more than six months. We held sevenfour equity securities that were in an unrealized loss position at December 31, 2012.2013. Based upon our analysis of general market conditions
-71-
and underlying factors impacting these equity securities, we considered these declines in value to be temporary. With respect to a debt security that is in an unrealized loss position, we first assess if we intend to sell the debt security. If we determine we intend to sell the debt security, we recognize the impairment loss in our results of operations. If we do not intend to sell the debt security, we determine whether it is more likely than not that we will be required to sell the debt security prior to recovery. If we determine it is more likely than not that we will be required to sell the debt security prior to recovery, we recognize an impairment loss in our results of operations. If we determine it is more likely than not that we will not be required to sell the debt security prior to recovery, we then evaluate whether a credit loss has occurred. We determine whether a credit loss has occurred by comparing the amortized cost of the debt security to the present value of the cash flows we expect to collect. If we expect a cash flow shortfall, we consider that a credit loss has occurred. If we determine that a credit loss has occurred, we consider the impairment to be other than temporary. We then recognize the amount of the impairment loss related to the credit loss in our results of operations, and we recognize the remaining portion of the impairment loss in our other comprehensive income, net of applicable taxes. In addition, we may write down securities in an unrealized loss position based on a number of other factors, including when the fair value of an investment is significantly below its cost, when the financial condition of the issuer of a security has deteriorated, the occurrence of industry, company or geographic events that have negatively impacted the value of a security and rating agency downgrades. We held 46216 debt securities that were in an unrealized loss position at December 31, 2012.2013. Based upon our analysis of general market conditions and underlying factors impacting these debt securities, we considered these declines in value to be temporary.
We did not recognize any impairment losses in 2013, 2012 2011 or 2010.2011. We had no sales or transfers from the held to maturity portfolio in 2013, 2012 2011 or 2010.2011. We have no derivative instruments or hedging activities.
-75-
65 - Fair Value Measurements
We account for financial assets using a framework that establishes a hierarchy that ranks the quality and reliability of inputs, or assumptions, used in the determination of fair value and we classify financial assets and liabilities carried at fair value in one of the following three categories:
Level 1 - quoted prices in active markets for identical assets and liabilities;
Level 2 - directly or indirectly observable inputs other than Level 1 quoted prices; and
Level 3 - unobservable inputs not corroborated by market data.
For investments that have quoted market prices in active markets, we use the quoted market price as fair value and include these investments in Level 1 of the fair value hierarchy. We classify publicly traded equity securities as Level 1. When quoted market prices in active markets are not available, we base fair values on quoted market prices of comparable instruments or price estimates we obtain from independent pricing services. We classify our fixed maturity investments as Level 2. Our fixed maturity investments consist of U.S. Treasury securities and obligations of U.S. government corporations and agencies, obligations of states and political subdivisions, corporate securities and residential mortgage-backed securities.
We present our investments in available-for-sale fixed maturity and equity securities at estimated fair value. The estimated fair value of a security may differ from the amount that could be realized if we sold the security in a forced transaction. In addition, the valuation of fixed maturity investments is more subjective when markets are less liquid, increasing the potential that the estimated fair value does not reflect the price at which an actual transaction would occur. We utilize nationally recognized independent pricing services to estimate fair values or obtain market quotations for substantially all of our fixed maturity and equity investments. We generally obtain one price per security. The pricing services utilize market quotations for fixed maturity and equity securities that have quoted prices in active markets. For fixed maturity securities that generally do not trade on a daily basis, the pricing services prepare estimates of fair value measurements based predominantly on observable market inputs. The pricing services do not use broker quotes in determining the fair values of our investments. Our investment personnel review the estimates of fair value the pricing services provide to determine if the estimates we obtain are representative of fair values based upon their general knowledge of the market, their research findings related to unusual fluctuations in value and their comparison of such values to execution prices for similar securities. Our investment personnel monitor the market and are familiar with current trading ranges for similar securities and pricing of specific investments. Our investment personnel review all pricing estimates that we receive from the pricing services against their expectations with respect to pricing based on fair market curves, security ratings, coupon rates, security type and recent trading activity. Our investment personnel review documentation with respect to the pricing services’ pricing methodology that they obtain periodically to determine if the primary pricing sources, market inputs and pricing frequency for various security types are reasonable. At December 31, 20122013 and 2011,2012, we received one estimate per security from one of the pricing services, and we priced substantially all of our Level 1 and Level 2 investments using those prices. In our review of the estimates the pricing services provided at December 31, 20122013 and 2011,2012, we did not identify any discrepancies, and we did not make any adjustments to the estimates the pricing services provided.
-72-
We present our cash and short-term investments at estimated fair value. The carrying values in the balance sheet for premium receivables and reinsurance receivables and payables for premiums and paid losses and loss expenses approximate their fair values. The carrying amounts reported in the balance sheet for our subordinated debentures and borrowings under linelines of credit approximate their fair values. We classify these items as Level 3. We evaluate our assets and liabilities on a recurring basis to determine the appropriate level at which to classify them for each reporting period.
We evaluate our assets and liabilities on a regular basis to determine the appropriate level at which to classify them for each reporting period. Based on our review of the methodology and summary of inputs used by the pricing services use, we have concluded that our Level 1 and Level 2 investments were classified properly at December 31, 20122013 and 2011.2012.
The following table presents our fair value measurements for our investments in available-for-sale fixed maturity and equity securities at December 31, 2013:
-76-
| Fair Value Measurements Using | ||||||||||||||||
| Fair Value | Quoted Prices in Active Markets for Identical Assets (Level 1) | Significant Other Observable Inputs (Level 2) | Significant Unobservable Inputs (Level 3) | |||||||||||||
U.S. Treasury securities and obligations of U.S. government corporations and agencies | $ | 14,333,697 | $ | — | $ | 14,333,697 | $ | — | ||||||||
Obligations of states and political subdivisions | 277,546,724 | — | 277,546,724 | — | ||||||||||||
Corporate securities | 40,671,923 | — | 40,671,923 | — | ||||||||||||
Mortgage-backed securities | 71,099,621 | — | 71,099,621 | — | ||||||||||||
Equity securities | 12,422,837 | 6,467,766 | 5,955,071 | — | ||||||||||||
|
|
|
|
|
|
|
| |||||||||
Totals | $ | 416,074,802 | $ | 6,467,766 | $ | 409,607,036 | $ | — | ||||||||
|
|
|
|
|
|
|
| |||||||||
The following table presents our fair value measurements for our investments in available-for-sale fixed maturity and equity securities at December 31, 2012:
| Fair Value Measurements Using | ||||||||||||||||
| Fair Value | Quoted Prices in Active Markets for Identical Assets (Level 1) | Significant Other Observable Inputs (Level 2) | Significant Unobservable Inputs (Level 3) | |||||||||||||
U.S. Treasury securities and obligations of U.S. government corporations and agencies | $ | 71,311,103 | $ | — | $ | 71,311,103 | $ | — | ||||||||
Obligations of states and political subdivisions | 416,986,963 | — | 416,986,963 | — | ||||||||||||
Corporate securities | 77,355,777 | — | 77,355,777 | — | ||||||||||||
Residential mortgage-backed securities | 128,855,978 | — | 128,855,978 | — | ||||||||||||
Equity securities | 8,757,258 | 5,365,721 | 3,391,537 | — | ||||||||||||
|
|
|
|
|
|
|
| |||||||||
Totals | $ | 703,267,079 | $ | 5,365,721 | $ | 697,901,358 | $ | — | ||||||||
|
|
|
|
|
|
|
| |||||||||
U.S. Treasury securities and obligations of U.S. government corporations and agencies Obligations of states and political subdivisions Corporate securities Mortgage-backed securities Equity securities Totals The following table presents our fair value measurements for our investments in available-for-sale fixed maturity and equity securities at December 31, 2011: Fair Value Measurements Using Fair Value Quoted Prices in
Active Markets for
Identical Assets
(Level 1) Significant Other
Observable Inputs
(Level 2) Significant
Unobservable
Inputs (Level 3) $ 71,311,103 $ — $ 71,311,103 $ — 416,986,963 — 416,986,963 — 77,355,777 — 77,355,777 — 128,855,978 — 128,855,978 — 8,757,258 5,365,721 3,391,537 — $ 703,267,079 $ 5,365,721 $ 697,901,358 $ —
| Fair Value Measurements Using | ||||||||||||||||
| Fair Value | Quoted Prices in Active Markets for Identical Assets (Level 1) | Significant Other Observable Inputs (Level 2) | Significant Unobservable Inputs (Level 3) | |||||||||||||
U.S. Treasury securities and obligations of U.S. government corporations and agencies | $ | 60,977,557 | $ | — | $ | 60,977,557 | $ | — | ||||||||
Obligations of states and political subdivisions | 398,876,582 | — | 398,876,582 | — | ||||||||||||
Corporate securities | 64,113,649 | — | 64,113,649 | — | ||||||||||||
Residential mortgage-backed securities | 122,630,390 | — | 122,630,390 | — | ||||||||||||
Equity securities | 7,437,538 | 6,178,136 | 1,259,402 | — | ||||||||||||
|
|
|
|
|
|
|
| |||||||||
Totals | $ | 654,035,716 | $ | 6,178,136 | $ | 647,857,580 | $ | — | ||||||||
|
|
|
|
|
|
|
| |||||||||
7-73-
6 - Deferred Policy Acquisition Costs
Changes in our insurance subsidiaries’ deferred policy acquisition costs are as follows:
| 2012 | 2011 | 2010 | 2013 | 2012 | 2011 | |||||||||||||||||||
Balance, January 1 | $ | 36,424,955 | $ | 34,445,579 | $ | 32,844,179 | $ | 40,121,697 | $ | 36,424,955 | $ | 34,445,579 | ||||||||||||
Acquisition costs deferred | 78,010,742 | 70,550,376 | 67,955,400 | 85,258,813 | 78,010,742 | 70,550,376 | ||||||||||||||||||
Amortization charged to earnings | (74,314,000 | ) | (68,571,000 | ) | (66,354,000 | ) | (81,753,000 | ) | (74,314,000 | ) | (68,571,000 | ) | ||||||||||||
|
|
|
|
|
| |||||||||||||||||||
Balance, December 31 | $ | 40,121,697 | $ | 36,424,955 | $ | 34,445,579 | $ | 43,627,510 | $ | 40,121,697 | $ | 36,424,955 | ||||||||||||
|
|
|
|
|
| |||||||||||||||||||
-77--74-
87 - Property and Equipment
Property and equipment at December 31, 20122013 and 20112012 consisted of the following:
| 2012 | 2011 | Estimated Useful Life | 2013 | 2012 | Estimated Useful Life | |||||||||||||||
Office equipment | $ | 8,863,377 | $ | 8,347,493 | 5-15 years | $ | 9,116,070 | $ | 8,863,377 | 5-15 years | ||||||||||
Automobiles | 2,010,762 | 2,111,218 | 3 years | 2,106,116 | 2,010,762 | 3 years | ||||||||||||||
Real estate | 5,356,705 | 5,016,722 | 15-50 years | 5,911,129 | 5,356,705 | 15-50 years | ||||||||||||||
Software | 2,717,206 | 2,316,617 | 5 years | 2,717,205 | 2,717,206 | 5 years | ||||||||||||||
|
|
|
| |||||||||||||||||
| 18,948,050 | 17,792,050 | 19,850,520 | 18,948,050 | |||||||||||||||||
Accumulated depreciation | (12,994,217 | ) | (11,637,667 | ) | (13,425,817 | ) | (12,994,217 | ) | ||||||||||||
|
|
|
| |||||||||||||||||
| $ | 5,953,833 | $ | 6,154,383 | $ | 6,424,703 | $ | 5,953,833 | |||||||||||||
|
|
|
| |||||||||||||||||
Depreciation expense for 2013, 2012 2011 and 20102011 amounted to $783,897, $944,632 and $1.0 million, and $1.2 million, respectively.
98 - Liability for Losses and Loss Expenses
The establishment of an appropriate liability for losses and loss expenses is an inherently uncertain process, and we can provide no assurance that our insurance subsidiaries’ ultimate liability will not exceed their loss and loss expense reserves and have an adverse effect on our results of operations and financial condition. Furthermore, we cannot predict the timing, frequency and extent of adjustments to our insurance subsidiaries’ estimated future liabilities, because the historical conditions and events that serve as a basis for our insurance subsidiaries’ estimates of ultimate claim costs may change. As is the case for substantially all property and casualty insurance companies, our insurance subsidiaries have found it necessary in the past to increase their estimated future liabilities for losses and loss expenses in certain periods, and, in other periods, their estimates have exceeded their actual liabilities. Changes in our insurance subsidiaries’ estimate of their liability for losses and loss expenses generally reflect actual payments and their evaluation of information received since the prior reporting date.
-75-
We summarize activity in our insurance subsidiaries’ liability for losses and loss expenses as follows:
| 2012 | 2011 | 2010 | 2013 | 2012 | 2011 | |||||||||||||||||||
Balance at January 1 | $ | 442,407,615 | $ | 383,318,672 | $ | 263,598,844 | $ | 458,827,395 | $ | 442,407,615 | $ | 383,318,672 | ||||||||||||
Less reinsurance recoverable | (199,392,836 | ) | (165,422,373 | ) | (83,336,726 | ) | (207,891,560 | ) | (199,392,836 | ) | (165,422,373 | ) | ||||||||||||
|
|
|
|
|
| |||||||||||||||||||
Net balance at January 1 | 243,014,779 | 217,896,299 | 180,262,118 | 250,935,835 | 243,014,779 | 217,896,299 | ||||||||||||||||||
|
|
| ||||||||||||||||||||||
Acquisition of MICO | — | — | 26,960,063 | |||||||||||||||||||||
|
|
|
|
|
| |||||||||||||||||||
Incurred related to: | ||||||||||||||||||||||||
Current year | 325,275,882 | 340,671,237 | 277,193,930 | 332,770,088 | 325,275,882 | 340,671,237 | ||||||||||||||||||
Prior years | 7,595,702 | (168,460 | ) | (2,885,072 | ) | 10,357,863 | 7,595,702 | (168,460 | ) | |||||||||||||||
|
|
|
|
|
| |||||||||||||||||||
Total incurred | 332,871,584 | 340,502,777 | 274,308,858 | 343,127,951 | 332,871,584 | 340,502,777 | ||||||||||||||||||
|
|
|
|
|
| |||||||||||||||||||
Paid related to: | ||||||||||||||||||||||||
Current year | 205,876,331 | 219,183,102 | 179,069,304 | 201,781,955 | 205,876,331 | 219,183,102 | ||||||||||||||||||
Prior years | 119,074,197 | 96,201,195 | 84,565,436 | 126,676,599 | 119,074,197 | 96,201,195 | ||||||||||||||||||
|
|
|
|
|
| |||||||||||||||||||
Total paid | 324,950,528 | 315,384,297 | 263,634,740 | 328,458,554 | 324,950,528 | 315,384,297 | ||||||||||||||||||
|
|
|
|
|
| |||||||||||||||||||
Net balance at December 31 | 250,935,835 | 243,014,779 | 217,896,299 | 265,605,232 | 250,935,835 | 243,014,779 | ||||||||||||||||||
Plus reinsurance recoverable | 207,891,560 | 199,392,836 | 165,422,373 | 230,014,037 | 207,891,560 | 199,392,836 | ||||||||||||||||||
|
|
|
|
|
| |||||||||||||||||||
Balance at December 31 | $ | 458,827,395 | $ | 442,407,615 | $ | 383,318,672 | $ | 495,619,269 | $ | 458,827,395 | $ | 442,407,615 | ||||||||||||
|
|
|
|
|
| |||||||||||||||||||
Our insurance subsidiaries recognized an increase (decrease) in their liability for losses and loss expenses of prior years of $10.4 million, $7.6 million and ($168,460) in 2013, 2012 and ($2.9) million in 2012, 2011, and 2010, respectively. Our insurance subsidiaries made no significant changes in their reserving philosophy, key reserving assumptions or claims management personnel, and they have made no significant offsetting changes in estimates that increased or decreased their loss and loss expense reserves in these years. The 2013 development represented 4.1% of the December 31, 2012 net carried reserves and resulted primarily from higher-than-expected severity in the private passenger automobile liability, commercial multiple peril, commercial automobile and workers’ compensation lines of business in accident years prior to 2013. The majority of the 2013 development related to increases in the liability for losses and loss expenses of prior years for Atlantic States and Southern. The 2012 development represented 3.1% of the December 31, 2011 net carried reserves and resulted primarily from higher-than-expected severity in the private passenger automobile liability and workers’ compensation lines of business in accident years prior to 2012. The majority of the 2012 development related to increases in the liability for losses and loss expenses of
-78-
prior years for Atlantic States and Southern. The 2011 development represented an immaterial percentage of the December 31, 2010 net carried reserves. The 2010 development represented 1.6% of the December 31, 2009 net carried reserves and resulted primarily from lower-than-expected severity in the private passenger automobile liability and homeowners lines of business in accident years prior to 2009.
109 - Borrowings
Lines of Credit
In June 2012,2013, we renewed our existing credit agreement with Manufacturers and Traders Trust Company (“M&T”) relating to a $60.0 million unsecured, revolving line of credit. The line of credit thatnow expires in July 2015.2016. We have the right to request a one-year extension of the credit agreement as of each anniversary date of the agreement. In December 2010 and March 2011, we borrowed $35.0 million and $3.5 million, respectively, in connection with our acquisition of MICO. In May 2011, we borrowed $19.0 million in connection with the merger of UNNF with and into DFSC. At December 31, 2012,2013, we had $52.0$43.0 million in outstanding borrowings and had the ability to borrow an additional $8.0$17.0 million at an interest raterates equal to M&T’s current prime rate or the then current LIBOR rate plus 2.25%, depending on our leverage ratio.. The interest rate on our outstanding borrowings is adjustable quarterly. At December 31, 2012 ,2013, the interest rate on our outstanding borrowings was 2.46%2.42%. We pay a fee of 0.2% per annum on the loan commitment amount regardless of usage. The credit agreement requires our compliance with certain covenants. These covenants which include minimum levels of our net worth, leverage ratio, and statutory surplus and the A.M. Best ratings of our insurance subsidiaries. We complied with all requirements of the credit agreement during the year ended December 31, 2012.2013.
-76-
MICO has an agreement with the Federal Home Loan Bank (“FHLB”) of Indianapolis. Through its membership, MICO has the ability to issue debt to the FHLB of Indianapolis in exchange for cash advances. There were no outstanding borrowings at December 31, 20122013 or 2011.2012. The table below presents the amount of FHLB of Indianapolis stock MICO purchased, collateral pledged and assets related to MICO’s agreement at December 31, 2012.2013.
FHLB stock purchased and owned as part of the agreement | $ | 252,100 | $ | 252,100 | ||||
Collateral pledged, at par (carrying value $3,946,091) | 4,450,000 | |||||||
Collateral pledged, at par (carrying value $2,789,386) | 3,700,000 | |||||||
Borrowing capacity currently available | 3,493,664 | 2,413,882 | ||||||
Atlantic States has an agreement withis a member of the FHLB of Pittsburgh. Through its membership, Atlantic States has the ability to issue debt to the FHLB of Pittsburgh in exchange for cash advances. There were no outstanding borrowings at December 31, 2012 or 2011. The table below presents the amount of FHLB of Pittsburgh stock Atlantic States purchased, collateral pledged and assets related to Atlantic States’ agreement at December 31, 2012.
FHLB stock purchased and owned as part of the agreement | $ | 256,400 | ||
Collateral pledged, at par | — | |||
Borrowing capacity currently available | — |
During 2013, Atlantic States issued secured debt in the principal amount of $15.0 million to the FHLB of Pittsburgh in exchange for cash advances in the amount of $15.0 million. Atlantic States then provided intercompany loansloaned $15.0 million to us inus. We used the principal amountproceeds of $15.0 millionour loan from Atlantic States to fund our prepayment of our subordinated debentures, as we discuss below. The interest rate on the advances was .26% at December 31, 2013. Atlantic States had no outstanding borrowings with the FHLB of Pittsburgh at December 31, 2012. The table below presents the amount of FHLB of Pittsburgh stock Atlantic States purchased, collateral pledged and assets related to Atlantic States’ membership in the FHLB of Pittsburgh at December 31, 2013.
FHLB stock purchased and owned as part of the agreement | $ | 870,300 | ||
Collateral pledged, at par (carrying value $15,305,496) | 19,000,000 | |||
Borrowing capacity currently available | 305,496 |
Subordinated Debentures
On October 29, 2003, we received $10.0 million in net proceeds from the issuance of subordinated debentures. The debentures were scheduled to mature onhad a maturity date of October 29, 2033 and were callable at our option, at par. The debentures carried an interest rate equal to the three-month LIBOR rate plus 3.85%. At December 31, 2012, the interest rate on these debentures was 4.16%. At December 31, 2012 and 2011, our consolidated balance sheets included an investment in a statutory trust of $310,000 and subordinated debentures of $10.3 million related to this transaction. On January 28, 2013, we prepaid these subordinated debentures in full and liquidated our investment in the statutory trust.
On May 24, 2004, we received $5.0 million in net proceeds from the issuance of subordinated debentures. The debentures were scheduled to mature onhad a maturity date of May 24, 2034 and were callable at our option, at par. The debentures carried an interest rate equal to the three-month LIBOR rate plus 3.85%. At December 31, 2012, the interest rate on these debentures was 4.16%. At December 31, 2012 and 2011, our consolidated balance sheets included an investment in a statutory trust of $155,000 and subordinated debentures of $5.2 million related to this transaction. On February 25, 2013, we prepaid these subordinated debentures in full and liquidated our investment in the statutory trust.
-79-
In January 2002, West Bend purchased a surplus note from MICO for $5.0 million to increase MICO’s statutory surplus. On December 1, 2010, Donegal Mutual purchased the surplus note from West Bend at face value. The surplus note carries an interest rate of 5.00%, and any repayment of principal or interest requires prior insurance regulatory approval. Upon receipt of regulatory approval, MICO paid $250,000 in interest to Donegal Mutual during each of 20122013 and 2011.2012.
1110 - Reinsurance
Unaffiliated Reinsurers
Our insurance subsidiaries and Donegal Mutual purchase certain third-party reinsurance on a combined basis. Le Mars, MICO, Peninsula and Sheboygan also have separate third-party reinsurance programs that provide certain coverage that is commensurate with their relative size and exposures. Our insurance subsidiaries use several different reinsurers, all of which, consistent with the requirements of our insurance subsidiaries and Donegal Mutual, have an A.M. Best rating of A- (Excellent) or better, or, with respect to foreign reinsurers, have a financial condition that, in the opinion of our management, is equivalent to a company with at least an A- rating from A.M. Best. The external reinsurance our insurance subsidiaries and Donegal Mutual purchase includes “excess of loss reinsurance,” under which their losses are automatically reinsured, through a series of contracts, over a set retention (generally $1.0 million for 2013 and 2012 and $750,000 prior to 2012), and “catastrophic reinsurance,” under which they recover, through a series of contracts, 90% to 100% of an accumulation of many losses resulting from a single event, including natural disasters, over a set retention (generally $5.0 million). and after exceeding an annual aggregate deductible ($5.0 million in 2013 and $0 in 2012 and 2011) up to aggregate losses of $145.0 million per occurrence. For property insurance, our insurance subsidiaries had excess of loss treaties that provided for coverage up to $5.0 million per loss. For liability insurance, our insurance subsidiaries had excess of loss treaties that provided for coverage up to $40.0 million per occurrence. For workers’ compensation insurance, our insurance subsidiaries had excess of loss treaties that provided for coverage up to $10.0 million on any one life. Our insurance subsidiaries and Donegal Mutual had property catastrophe coverage through a series of layered treaties up to aggregate losses of $135.0$150.0 million for any single event. As many as 20 25
-77-
reinsurers provided coverage on any one treaty with no reinsurer taking more than 36.0%30.0% of any one treaty. The amount of coverage provided under each of these types of reinsurance depends upon the amount, nature, size and location of the risks being reinsured. Donegal Mutual and our insurance subsidiaries also purchased facultative reinsurance to cover exposures from losses that exceeded the limits provided by the treaty reinsurance Donegal Mutual and our insurance subsidiaries purchased. In order to write automobile insurance in the State of Michigan, MICO is required to be a member of the Michigan Catastrophic Claims Association (“MCCA”). The MCCA provides reinsurance to MICO for personal automobile and commercial automobile personal injury claims in the State of Michigan over a set retention.
Through December 1, 2010, MICO and West Bend were parties to quota-share reinsurance agreements whereby MICO ceded 75% of its business to West Bend. MICO and West Bend agreed to terminate the reinsurance agreement in effect at November 30, 2010 on a run-off basis. West Bend’s obligations related to all past reinsurance agreements with MICO remain in effect for all policies effective prior to December 1, 2010 as we discuss in Note 4-Business Combinations.2010.
MICO maintains a quota-share reinsurance agreement with third-party reinsurers to reduce its net exposures. Effective from December 1, 2010 to December 31, 2011, the quota-share reinsurance percentage was 50%. Effective January 1, 2012, MICO reduced the quota-share reinsurance percentage from 50% to 40%. Effective January 1, 2013, MICO reduced the quota-share reinsurance percentage from 40% to 30%. Effective January 1, 2014, MICO reduced the quota-share reinsurance percentage from 30% to 20%.
The following amounts represent ceded reinsurance transactions with unaffiliated reinsurers during 2013, 2012 2011 and 2010:2011:
| 2012 | 2011 | 2010 | ||||||||||
Premiums written | $ | 76,736,510 | $ | 80,265,127 | $ | 24,357,938 | ||||||
Premiums earned | 79,680,782 | 88,297,408 | 26,551,687 | |||||||||
Losses and loss expenses | 56,179,284 | 82,836,893 | 19,764,441 | |||||||||
Prepaid reinsurance premiums | 25,126,276 | 28,054,302 | 26,991,912 | |||||||||
Liability for losses and loss expenses | 103,775,940 | 106,231,527 | 92,945,915 | |||||||||
| 2013 | 2012 | 2011 | ||||||||||
Premiums written | $ | 69,776,461 | $ | 76,736,510 | $ | 80,265,127 | ||||||
Premiums earned | 73,504,433 | 79,680,782 | 88,297,408 | |||||||||
Losses and loss expenses | 58,556,283 | 56,179,284 | 82,836,893 | |||||||||
Prepaid reinsurance premiums | 21,398,306 | 25,126,276 | 28,054,302 | |||||||||
Liability for losses and loss expenses | 114,313,279 | 103,775,940 | 106,231,527 | |||||||||
-80-
Total Reinsurance
The following amounts represent our total ceded reinsurance transactions with both affiliated and unaffiliated reinsurers during 2013, 2012 2011 and 2010:2011:
| 2012 | 2011 | 2010 | 2013 | 2012 | 2011 | |||||||||||||||||||
Premiums earned | $ | 258,064,301 | $ | 242,186,814 | $ | 144,554,336 | $ | 266,284,366 | $ | 258,064,301 | $ | 242,186,814 | ||||||||||||
Losses and loss expenses | 181,995,838 | 216,776,966 | 111,080,953 | 181,218,752 | 181,995,838 | 216,776,966 | ||||||||||||||||||
Prepaid reinsurance premiums | 111,156,162 | 106,450,018 | 89,365,771 | 112,663,942 | 111,156,162 | 106,450,018 | ||||||||||||||||||
Liability for losses and loss expenses | 207,891,560 | 199,392,836 | 165,442,373 | 230,014,037 | 207,891,560 | 199,392,836 | ||||||||||||||||||
The following amounts represent the effect of reinsurance on premiums written for 2013, 2012 2011 and 2010:2011:
| 2012 | 2011 | 2010 | 2013 | 2012 | 2011 | |||||||||||||||||||
Direct | $ | 419,811,847 | $ | 397,810,566 | $ | 279,627,255 | $ | 441,469,330 | $ | 419,811,847 | $ | 397,810,566 | ||||||||||||
Assumed | 339,389,274 | 306,416,861 | 262,574,572 | 359,753,517 | 339,389,274 | 306,416,861 | ||||||||||||||||||
Ceded | (262,754,201 | ) | (250,176,390 | ) | (150,679,539 | ) | (267,792,144 | ) | (262,754,201 | ) | (250,176,390 | ) | ||||||||||||
|
|
|
|
|
| |||||||||||||||||||
Net premiums written | $ | 496,446,920 | $ | 454,051,037 | $ | 391,522,288 | $ | 533,430,703 | $ | 496,446,920 | $ | 454,051,037 | ||||||||||||
|
|
|
|
|
| |||||||||||||||||||
-78-
The following amounts represent the effect of reinsurance on premiums earned for 2013, 2012 2011 and 2010:2011:
| 2012 | 2011 | 2010 | 2013 | 2012 | 2011 | |||||||||||||||||||
Direct | $ | 408,846,530 | $ | 385,737,801 | $ | 269,394,549 | $ | 431,788,593 | $ | 408,846,530 | $ | 385,737,801 | ||||||||||||
Assumed | 324,219,993 | 287,919,197 | 253,189,916 | 349,787,717 | 324,219,993 | 287,919,197 | ||||||||||||||||||
Ceded | (258,064,301 | ) | (242,186,814 | ) | (144,554,336 | ) | (266,284,366 | ) | (258,064,301 | ) | (242,186,814 | ) | ||||||||||||
|
|
|
|
|
| |||||||||||||||||||
Net premiums earned | $ | 475,002,222 | $ | 431,470,184 | $ | 378,030,129 | $ | 515,291,944 | $ | 475,002,222 | $ | 431,470,184 | ||||||||||||
|
|
|
|
|
| |||||||||||||||||||
1211 - Income Taxes
Our provision for income tax consists of the following:
| 2012 | 2011 | 2010 | 2013 | 2012 | 2011 | |||||||||||||||||||
Current | $ | 3,614,390 | $ | (1,269,775 | ) | $ | 757,400 | $ | 4,973,430 | $ | 3,614,390 | $ | (1,269,775 | ) | ||||||||||
Deferred | 1,151,250 | (5,922,491 | ) | (2,380,430 | ) | 1,414,843 | 1,151,250 | (5,922,491 | ) | |||||||||||||||
|
|
|
|
|
| |||||||||||||||||||
Federal tax (benefit) provision | $ | 4,765,640 | $ | (7,192,266 | ) | $ | (1,623,030 | ) | ||||||||||||||||
Federal income tax (benefit) provision | $ | 6,388,273 | $ | 4,765,640 | $ | (7,192,266 | ) | |||||||||||||||||
|
|
|
|
|
| |||||||||||||||||||
Our effective tax rate is different from the amount computed at the statutory federal rate of 35% for 2013, 2012 2011 and 2010.2011. The reasons for such difference and the related tax effects are as follows:
| 2012 | 2011 | 2010 | ||||||||||
Income (loss) before income taxes | $ | 27,858,260 | $ | (6,739,313 | ) | $ | 9,844,149 | |||||
|
|
|
|
|
| |||||||
Computed “expected” taxes (benefit) | 9,750,391 | (2,358,760 | ) | 3,445,452 | ||||||||
Tax-exempt interest | (5,824,281 | ) | (6,038,463 | ) | (6,183,795 | ) | ||||||
Proration | 869,551 | 905,326 | 923,071 | |||||||||
Other, net | (30,021 | ) | 299,631 | 192,242 | ||||||||
|
|
|
|
|
| |||||||
Federal income tax (benefit) provision | $ | 4,765,640 | $ | (7,192,266 | ) | $ | (1,623,030 | ) | ||||
|
|
|
|
|
| |||||||
-81-
| 2013 | 2012 | 2011 | ||||||||||
Income (loss) before income taxes | $ | 32,710,265 | $ | 27,858,260 | $ | (6,739,313 | ) | |||||
|
|
|
|
|
| |||||||
Computed “expected” taxes (benefit) | 11,448,593 | 9,750,391 | (2,358,760 | ) | ||||||||
Tax-exempt interest | (5,789,963 | ) | (5,824,281 | ) | (6,038,463 | ) | ||||||
Proration | 868,306 | 869,551 | 905,326 | |||||||||
Other, net | (138,663 | ) | (30,021 | ) | 299,631 | |||||||
|
|
|
|
|
| |||||||
Federal income tax (benefit) provision | $ | 6,388,273 | $ | 4,765,640 | $ | (7,192,266 | ) | |||||
|
|
|
|
|
| |||||||
The tax effects of temporary differences that give rise to significant portions of the deferred tax assets and deferred tax liabilities at December 31, 20122013 and 20112012 are as follows:
| 2012 | 2011 | 2013 | 2012 | |||||||||||||
Deferred tax assets: | ||||||||||||||||
Unearned premium | $ | 17,613,415 | $ | 16,113,291 | $ | 18,875,418 | $ | 17,613,415 | ||||||||
Loss reserves | 7,275,091 | 7,339,644 | 6,966,581 | 7,275,091 | ||||||||||||
Net operating loss carryforward | 1,942,128 | 4,473,462 | — | 1,942,128 | ||||||||||||
Net operating loss carryforward - Le Mars | 1,797,194 | 2,191,532 | 1,665,748 | 1,797,194 | ||||||||||||
Alternative minimum tax credit carryforward | 7,964,853 | 4,294,879 | 10,011,483 | 7,964,853 | ||||||||||||
Net unrealized losses | 1,245,400 | — | ||||||||||||||
Other | 1,413,285 | 634,885 | 1,261,546 | 1,413,285 | ||||||||||||
|
|
|
| |||||||||||||
Total gross deferred assets | 38,005,966 | 35,047,693 | 40,026,176 | 38,005,966 | ||||||||||||
Less valuation allowance | (440,778 | ) | (440,778 | ) | (440,778 | ) | (440,778 | ) | ||||||||
|
|
|
| |||||||||||||
Net deferred tax assets | 37,565,188 | 34,606,915 | 39,585,398 | 37,565,188 | ||||||||||||
|
|
|
| |||||||||||||
Deferred tax liabilities: | ||||||||||||||||
Deferred policy acquisition costs | 14,042,594 | 12,750,631 | 15,269,629 | 14,042,594 | ||||||||||||
Net unrealized gains | 14,212,465 | 11,711,531 | — | 14,212,465 | ||||||||||||
Other | 3,042,593 | 225,033 | 4,005,211 | 3,042,593 | ||||||||||||
|
|
|
| |||||||||||||
Total gross deferred tax liabilities | 31,297,652 | 24,687,195 | 19,274,840 | 31,297,652 | ||||||||||||
|
|
|
| |||||||||||||
Net deferred tax asset | $ | 6,267,536 | $ | 9,919,720 | $ | 20,310,558 | $ | 6,267,536 | ||||||||
|
|
|
| |||||||||||||
-79-
We provide a valuation allowance when we believe it is more likely than not that we will not realize some portion of the tax asset. At December 31, 20122013 and 2011,2012, we established a valuation allowance of $440,778 related to a portion of the net operating loss carryforward of Le Mars that we acquired on January 1, 2004. We determined that we were not required to establish a valuation allowance for the other net deferred tax assets of $37.6$39.6 million and $34.6$37.6 million at December 31, 20122013 and 2011,2012, respectively, since it is more likely than not that we will realize these deferred tax assets through reversals of existing temporary differences, future taxable income carrybacks to taxable income in prior years and the implementation of tax-planning strategies.
Tax years 20092010 through 20122013 remained open for examination at December 31, 2012. At December 31, 2012, we had a net operating loss carryforward of $5.5 million, which is available to offset our future taxable income. This amount will expire in 2031 if not utilized.2013. The net operating loss carryforward of $5.1$4.8 million from Le Mars will begin to expire in 2020 if not utilized and is subject to an annual limitation of approximately $376,000. We also had an alternative minimum tax credit carryforward of $8.0$10.0 million with an indefinite life.
1312 - Stockholders’ Equity
On April 19, 2001, our stockholders approved an amendment to our certificate of incorporation. Among other things, the amendment reclassified our common stock as Class B common stock and effected a one-for-three reverse split of our Class B common stock effective April 19, 2001. The amendment also authorized a new class of common stock with one-tenth of a vote per share designated as Class A common stock. Our board of directors also declared a dividend of two shares of Class A common stock for each share of Class B common stock, after the one-for-three reverse split, held of record at the close of business April 19, 2001.
At our annual meeting of stockholders on April 18, 2013, our stockholders approved an amendment to our certificate of incorporation that increased the number of shares of our Class A common stock we have the authority to issue from 30.0 million shares to 40.0 million shares.
Each share of Class A common stock outstanding at the time of the declaration of any dividend or other distribution payable in cash upon the shares of Class B common stock is entitled to a dividend or distribution payable at the same time and to stockholders of record on the same date in an amount at least 10% greater than any dividend declared upon each share of Class B common stock. In the event of our merger or consolidation with or into another entity, the holders of Class A common stock and the holders of Class B common stock are entitled to receive the same per share consideration in such merger or consolidation. In the event of our liquidation, dissolution or winding-up, any assets available to common stockholders will be distributed pro-rata to the holders of Class A common stock and Class B common stock after payment of all of our obligations.
In February 2009, our board of directors authorized a share repurchase program, pursuant to which we may purchase up to 300,000 shares of our Class A common stock at market prices prevailing from time to time in the open market subject to the provisions of Securities and Exchange Commission (“SEC”) Rule 10b-18 and in privately negotiated transactions. We purchased 135,06424,240 and 119,257135,064 shares of our Class A common stock under this program during 20122013 and 2011,2012, respectively. At December 31, 2012,2013, we had the authority remaining to purchase 28,3084,068 shares under this program.
On July 18, 2013, our board of directors authorized a share repurchase program pursuant to which we have the authority to purchase up to 500,000 additional shares of our Class A common stock at prices prevailing from time to time in the open market subject to the provisions of SEC Rule 10b-18 and in privately negotiated transactions. We did not purchase shares under this program during 2013.
-82-
At December 31, 2013, our treasury stock consisted of 940,862 and 72,465 shares of Class A common stock and Class B common stock, respectively. At December 31, 2012, our treasury stock consisted of 916,622 and 72,465 shares of Class A common stock and Class B common stock, respectively. At December 31, 2011, our treasury stock consisted of 781,558 and 72,465 shares of Class A common stock and Class B common stock, respectively.
1413 - Stock Compensation Plans
Equity Incentive Plans
During 1996, we adopted an Equity Incentive Plan for Employees. During 2001, we adopted a nearly identical plan that made a total of 2,666,667 shares of Class A common stock available for issuance to employees of our subsidiaries and affiliates. During 2005, we amended the plan to make a total of 4,000,000 shares of Class A common stock available for issuance. During 2007, we adopted a nearly identical plan that made a total of 3,500,000 shares of Class A common stock available for issuance to employees of our subsidiaries and affiliates. During 2011, we adopted a nearly identical plan that made a total of 3,500,000 shares of Class A common stock available for issuance to employees of our subsidiaries and affiliates. During 2013, we adopted a nearly identical plan that made a total of 4,500,000 shares of Class A common stock available for issuance to employees of our subsidiaries and affiliates. Each plan provides for the granting of awards by our board of directors in the form of stock options, stock appreciation rights, restricted stock or any combination of the above. The plans provide that stock options may become exercisable up to ten years from date of grant, with an option price not less than fair market value on date of grant. We have not granted any stock appreciation rights.
-80-
During 1996, we adopted an Equity Incentive Plan for Directors. During 2001, we adopted a nearly identical plan that made 355,556 shares of Class A common stock available for issuance to our directors and those of our subsidiaries and affiliates. During 2007, we adopted a nearly identical plan that made 400,000 shares of Class A common stock available for issuance to our directors and the directors of our subsidiaries and affiliates. During 2011, we adopted a nearly identical plan that made 400,000 shares of Class A common stock available for issuance to our directors and the directors of our subsidiaries and affiliates.Weaffiliates. During 2013, we adopted a nearly identical plan that made 600,000 shares of Class A common stock available for issuance to our directors and the directors of our subsidiaries and affiliates. We may make awards in the form of stock options. The plan also provides for the issuance of 400 shares of restricted stock on the first business day of January in each year to each of our directors and each director of Donegal Mutual who does not serve as one of our directors. We issued 6,800, 5,5986,800 and 5,598 shares of restricted stock on January 2, 2013, 2012 2011 and 2010,2011, respectively.
We measure all share-based payments to employees, including grants of employee stock options, using a fair-value-based method and record such expense in our results of operations. In determining the expense we record for stock options granted to directors and employees of our subsidiaries and affiliates, other than Donegal Mutual, we estimate the fair value of each option award on the date of grant using the Black-Scholes option pricing model. The significant assumptions we utilize in applying the Black-Scholes option pricing model are the risk-free interest rate, expected term, dividend yield and expected volatility. The risk-free interest rate is the implied yield currently available on U.S. Treasury zero coupon issues with a remaining term equal to the expected term used as the assumption in the model. We base the expected term of an option award on our historical experience for similar awards. We determine the dividend yield by dividing the per share dividend by the grant date stock price. We base the expected volatility on the volatility of our stock price over a historical period comparable to the expected term.
The weighted-average grant date fair value of options granted during 2013 was $2.20. We calculated this fair value based upon a risk-free interest rate of 1.63%, expected life of five years, expected volatility of 23% and expected dividend yield of 3%.
The weighted-average grant date fair value of options granted during 2012 was $2.85. We calculated this fair value based upon a risk-free interest rate of .43%, expected life of five years, expected volatility of 33% and expected dividend yield of 3%.
The weighted-average grant date fair value of options granted during 2011 was $1.90. We calculated this fair value based upon a risk-free interest rate of .75%, expected life of five years, expected volatility of 31% and expected dividend yield of 4%.
The weighted-average grant date fair value of options granted during 2010 was $1.26. We calculated this fair value based upon a risk-free interest rate of 1.04%, expected life of three years, expected volatility of 29% and expected dividend yield of 4%.
We charged compensation expense for our stock compensation plans against income before income taxes of $547,374, $420,735 $283,811 and $46,733$283,811 for the years ended December 31, 2013, 2012 2011 and 2010,2011, respectively, with a corresponding income tax benefit of $186,107, $143,050 $96,496 and $15,889.$96,496. At December 31, 20122013 and 2011,2012, our total unrecognized compensation cost related to non-vested share-based compensation granted under our stock compensation plans was $1.2$1.1 million and $929,679,$1.2 million, respectively. We expect to recognize this cost over a weighted average period of 8.91.0 years.
During 2013, we received cash from option exercises under all stock compensation plans of $9.7 million. We accountrealized actual tax benefits for the tax deductions from option exercises of share-based compensation to employees and directors of Donegal Mutual as share-based compensation to employees of a controlling entity. As such, we measure the fair value of an award at the grant date and recognize the fair value as a dividend to the controlling entity. These provisions apply to options granted to the employees and directors of Donegal Mutual, the employer of record$531,159 for the employees that provide services to us. We recorded implied dividends of $2.5 million, $2.3 million and $1.3 million for the years ended December 31, 2012, 2011 and 2010, respectively.
-83-
2013. During 2012, we received cash from option exercises under all stock compensation plans of $1.1 million. We realized actual tax benefits for the tax deductions from option exercises of share-based compensation of $52,422 for 2012. We did not receive any cash from option exercises in 2011 or 2010.2011. No further shares are available for future option grants for plans in effect prior to 2011.2013.
-81-
Information regarding activity in our stock option plans follows:
| Number of Options | Weighted-Average Exercise Price Per Share | |||||||||||||||
Outstanding at December 31, 2009 | 3,290,099 | $ | 17.98 | |||||||||||||
Granted - 2010 | 1,787,500 | 14.00 | ||||||||||||||
Forfeited - 2010 | (15,500 | ) | 15.69 | |||||||||||||
Expired - 2010 | (1,063,432 | ) | 15.76 | |||||||||||||
|
| Number of Options | Weighted-Average Exercise Price Per Share | |||||||||||||
Outstanding at December 31, 2010 | 3,998,667 | 16.80 | 3,998,667 | $ | 16.80 | |||||||||||
Granted - 2011 | 2,321,000 | 12.52 | 2,321,000 | 12.52 | ||||||||||||
Forfeited - 2011 | (52,000 | ) | 15.63 | (52,000 | ) | 15.63 | ||||||||||
Expired - 2011 | (958,667 | ) | 21.00 | (958,667 | ) | 21.00 | ||||||||||
|
|
|
| |||||||||||||
Outstanding at December 31, 2011 | 5,309,000 | 14.18 | 5,309,000 | 14.18 | ||||||||||||
Granted - 2012 | 1,593,600 | 14.50 | 1,593,600 | 14.50 | ||||||||||||
Exercised - 2012 | (82,102 | ) | 13.01 | (82,102 | ) | 13.01 | ||||||||||
Forfeited - 2012 | (109,673 | ) | 13.84 | (109,673 | ) | 13.84 | ||||||||||
Expired - 2012 | (10,000 | ) | 21.00 | (10,000 | ) | 21.00 | ||||||||||
|
|
|
| |||||||||||||
Outstanding at December 31, 2012 | 6,700,825 | $ | 14.27 | 6,700,825 | 14.27 | |||||||||||
Granted - 2013 | 2,543,500 | 15.90 | ||||||||||||||
Exercised - 2013 | (722,322 | ) | 13.45 | |||||||||||||
Forfeited - 2013 | (116,669 | ) | 13.65 | |||||||||||||
Expired - 2013 | (1,204,000 | ) | 17.52 | |||||||||||||
|
| |||||||||||||||
Outstanding at December 31, 2013 | 7,201,334 | $ | 14.39 | |||||||||||||
|
|
|
| |||||||||||||
Exercisable at: | ||||||||||||||||
December 31, 2010 | 1,805,751 | $ | 18.13 | |||||||||||||
|
| |||||||||||||||
December 31, 2011 | 1,821,333 | $ | 16.42 | 1,821,333 | $ | 16.42 | ||||||||||
|
|
|
| |||||||||||||
December 31, 2012 | 3,072,970 | $ | 15.03 | 3,072,970 | $ | 15.03 | ||||||||||
|
|
|
| |||||||||||||
December 31, 2013 | 3,028,619 | $ | 13.47 | |||||||||||||
|
| |||||||||||||||
Shares available for future option grants at December 31, 20122013 totaled 40,9362,556,500 shares under all plans.
The following table summarizes information about fixed stock options outstanding at December 31, 2012:2013:
Exercise Price | Number of Options Outstanding | Weighted-Average Remaining Contractual Life | Number of Options Exercisable | |||||||
| $12.50 | 2,184,542 | 9.0 years | 728,181 | |||||||
| 14.00 | 1,710,683 | 3.0 years | 1,133,789 | |||||||
| 14.50 | 1,593,600 | 10.0 years | — | |||||||
| 15.00 | 3,000 | 3.0 years | 2,000 | |||||||
| 17.50 | 1,198,500 | 0.5 years | 1,198,500 | |||||||
| 18.70 | 3,000 | 0.5 years | 3,000 | |||||||
| 21.00 | 7,500 | 0.5 years | 7,500 | |||||||
|
|
|
| |||||||
| Total | 6,700,825 | 3,072,970 | ||||||||
|
|
|
| |||||||
Exercise Price | Number of Options Outstanding | Weighted-Average Remaining Contractual Life | Number of Options Exercisable | |||||||
$12.50 | 1,863,627 | 8.0 years | 1,242,417 | |||||||
14.00 | 1,284,207 | 2.0 years | 1,277,540 | |||||||
14.50 | 1,502,000 | 9.0 years | 500,662 | |||||||
15.00 | 3,000 | 2.0 years | 3,000 | |||||||
15.90 | 2,543,500 | 10.0 years | — | |||||||
17.50 | 5,000 | 0.25 years | 5,000 | |||||||
|
|
|
| |||||||
Total | 7,201,334 | 3,028,619 | ||||||||
|
|
|
| |||||||
-84-
Employee Stock Purchase Plans
During 1996, we adopted an Employee Stock Purchase Plan. During 2001, we adopted a nearly identical plan that made 533,333 shares of Class A common stock available for issuance. During 2011, we adopted another nearly identical plan that made 300,000 shares of Class A common stock available for issuance.
The 2011 plan extends over a 10-year period and provides for shares to be offered to all eligible employees at a purchase price equal to the lesser of 85% of the fair market value of our Class A common stock on the last day before the first day of each enrollment period (June 1 and December 1 of each year) under the plan or 85% of the fair market value of our common stock on the last day of each subscription period (June 30 and December 31 of each year).
-82-
A summary of plan activity follows:
| Shares Issued | Shares Issued | |||||||||||||||
| Price | Shares | Price | Shares | |||||||||||||
January 1, 2010 | $ | 12.85 | 11,717 | |||||||||||||
July 1, 2010 | 10.45 | 12,403 | ||||||||||||||
January 1, 2011 | 11.02 | 13,243 | $ | 11.02 | 13,243 | |||||||||||
July 1, 2011 | 10.88 | 11,371 | 10.88 | 11,371 | ||||||||||||
January 1, 2012 | 11.91 | 10,523 | 11.91 | 10,523 | ||||||||||||
July 1, 2012 | 11.29 | 19,031 | 11.29 | 19,031 | ||||||||||||
January 1, 2013 | 11.93 | 16,485 | ||||||||||||||
July 1, 2013 | 11.76 | 19,805 | ||||||||||||||
On January 1, 2013,2014, we issued an additional 16,48516,964 shares at a price of $11.93$12.58 per share under this plan.
Agency Stock Purchase Plans
During 1996, we adopted an Agency Stock Purchase Plan. During 2001, we adopted a nearly identical plan that made 533,333 shares of Class A common stock available for issuance. During 2011, we adopted another nearly identical plan that made 300,000 shares of Class A common stock available for issuance. The plan provides for agents of our insurance subsidiaries and Donegal Mutual to invest up to $12,000 per subscription period (April 1 to September 30 and October 1 to March 31 of each year) under various methods. We issue stock at the end of each subscription period at a price equal to 90% of the average market price during the last ten trading days of each subscription period. During 2013, 2012 2011 and 2010,2011, we issued 79,532, 70,366 66,260 and 56,87966,260 shares, respectively, under this plan. Expense recognized under the plan was not material.
-85--83-
1514 - Statutory Net Income, Capital and Surplus and Dividend Restrictions
The following table presents selected information, as filed with insurance regulatory authorities, for our insurance subsidiaries as determined in accordance with accounting practices prescribed or permitted by such insurance regulatory authorities:
| 2012 | 2011 | 2010 | 2013 | 2012 | 2011 | |||||||||||||||||||
Atlantic States: | ||||||||||||||||||||||||
Statutory capital and surplus | $ | 180,465,658 | $ | 173,505,872 | $ | 191,775,057 | $ | 186,606,655 | $ | 180,465,658 | $ | 173,505,872 | ||||||||||||
Statutory unassigned surplus | 124,924,794 | 113,497,280 | 131,817,978 | 131,028,806 | 124,924,794 | 113,497,280 | ||||||||||||||||||
Statutory net income (loss) | 12,507,540 | (7,729,040 | ) | 11,002,447 | 12,596,844 | 12,507,540 | (7,729,040 | ) | ||||||||||||||||
Southern: | ||||||||||||||||||||||||
Statutory capital and surplus | 58,841,059 | 60,876,093 | 63,609,630 | 62,702,432 | 58,841,059 | 60,876,093 | ||||||||||||||||||
Statutory unassigned surplus | 7,843,473 | 9,364,037 | 12,612,044 | 11,701,045 | 7,843,473 | 9,364,037 | ||||||||||||||||||
Statutory net (loss) income | (1,539,943 | ) | 1,795,195 | (2,083,206 | ) | |||||||||||||||||||
Statutory net income (loss) | 4,195,635 | (1,539,943 | ) | 1,795,195 | ||||||||||||||||||||
Le Mars: | ||||||||||||||||||||||||
Statutory capital and surplus | 26,803,140 | 24,720,327 | 25,539,580 | 27,627,914 | 26,803,140 | 24,720,327 | ||||||||||||||||||
Statutory unassigned surplus | 14,210,400 | 11,373,158 | 12,485,531 | 15,032,372 | 14,210,400 | 11,373,158 | ||||||||||||||||||
Statutory net income (loss) | 2,423,225 | (1,661,327 | ) | (3,166,242 | ) | 790,147 | 2,423,225 | (1,661,327 | ) | |||||||||||||||
Peninsula: | ||||||||||||||||||||||||
Statutory capital and surplus | 42,471,092 | 40,744,215 | 41,932,367 | 41,891,487 | 42,471,092 | 40,744,215 | ||||||||||||||||||
Statutory unassigned surplus | 24,671,678 | 22,601,043 | 23,580,784 | 24,089,092 | 24,671,678 | 22,601,043 | ||||||||||||||||||
Statutory net income | 1,478,823 | 1,210,247 | 2,336,947 | 1,481,670 | 1,478,823 | 1,210,247 | ||||||||||||||||||
Sheboygan: | ||||||||||||||||||||||||
Statutory capital and surplus | 10,944,235 | 10,800,499 | 11,671,405 | 12,085,839 | 10,944,235 | 10,800,499 | ||||||||||||||||||
Statutory unassigned (deficit) surplus | (1,087,936 | ) | (1,437,493 | ) | (479,140 | ) | ||||||||||||||||||
Statutory net loss | (33,316 | ) | (1,237,478 | ) | (286,613 | ) | ||||||||||||||||||
Statutory unassigned surplus (deficit) | 52,211 | (1,087,936 | ) | (1,437,493 | ) | |||||||||||||||||||
Statutory net income (loss) | 1,374,543 | (33,316 | ) | (1,237,478 | ) | |||||||||||||||||||
MICO: | ||||||||||||||||||||||||
Statutory capital and surplus | 42,443,200 | 39,264,423 | 37,343,663 | 41,594,701 | 42,443,200 | 39,264,423 | ||||||||||||||||||
Statutory unassigned surplus | 16,440,388 | 12,689,880 | 10,240,870 | 15,588,110 | 16,440,388 | 12,689,880 | ||||||||||||||||||
Statutory net income | 2,698,257 | 2,889,619 | 3,026,178 | 1,170,008 | 2,698,257 | 2,889,619 | ||||||||||||||||||
Our principal source of cash for payment of dividends is dividends from our insurance subsidiaries. State insurance laws require our insurance subsidiaries to maintain certain minimum capital and surplus amounts on a statutory basis. Our insurance subsidiaries are subject to regulations that restrict the payment of dividends from statutory surplus and may require prior approval of their domiciliary insurance regulatory authorities. Our insurance subsidiaries are also subject to risk based capital (“RBC”) requirements that may further impact their ability to pay dividends. Our insurance subsidiaries’ statutory capital and surplus at December 31, 20122013 exceeded the amount of statutory capital and surplus necessary to satisfy regulatory requirements, including the RBC requirements, by a significant margin. Amounts available for distribution to us as dividends from our insurance subsidiaries without prior approval of insurance regulatory authorities in 20132014 are $18.0$18.7 million from Atlantic States, $0$4.2 million from Southern, $2.7$2.8 million from Le Mars, $4.3$4.2 million from Peninsula, $0$1.1 million from Sheboygan and $4.2$4.1 million from MICO, or a total of approximately $29.2$35.1 million.
-86--84-
1615 - Reconciliation of Statutory Filings to Amounts Reported Herein
Our insurance subsidiaries must file financial statements with state insurance regulatory authorities using accounting principles and practices prescribed or permitted by those authorities. We refer to these accounting principles and practices as statutory accounting principles (“SAP”). Accounting principles used to prepare these SAP financial statements differ from those used to prepare financial statements on the basis of generally accepted accounting principles (“GAAP”).GAAP.
Reconciliations of statutory net income and capital and surplus, as determined using SAP, to the amounts included in the accompanying GAAP financial statements are as follows:
| Year Ended December 31, | Year Ended December 31, | |||||||||||||||||||||||
| 2012 | 2011 | 2010 | 2013 | 2012 | 2011 | |||||||||||||||||||
Statutory net income (loss) of insurance subsidiaries | $ | 17,534,586 | $ | (4,732,784 | ) | $ | 9,163,680 | $ | 21,608,847 | $ | 17,534,586 | $ | (4,732,784 | ) | ||||||||||
Increases (decreases): | ||||||||||||||||||||||||
Deferred policy acquisition costs | 3,696,742 | 1,979,376 | 1,601,400 | 3,505,813 | 3,696,742 | 1,979,376 | ||||||||||||||||||
Deferred federal income taxes | (1,151,250 | ) | 5,922,490 | 2,380,430 | (1,414,843 | ) | (1,151,250 | ) | 5,922,490 | |||||||||||||||
Salvage and subrogation recoverable | 772,600 | 1,273,000 | 748,000 | 1,059,400 | 772,600 | 1,273,000 | ||||||||||||||||||
Amortization of MICO fair value adjustments | (5,416 | ) | (3,275,777 | ) | (597,643 | ) | — | (5,416 | ) | (3,275,777 | ) | |||||||||||||
Consolidating eliminations and adjustments | (5,421,779 | ) | (15,080,164 | ) | (12,178,977 | ) | (10,648,834 | ) | (5,421,779 | ) | (15,080,164 | ) | ||||||||||||
Parent-only net income | 7,667,137 | 14,366,812 | 10,350,289 | 12,211,609 | 7,667,137 | 14,366,812 | ||||||||||||||||||
|
|
|
|
|
| |||||||||||||||||||
Net income as reported herein | $ | 23,092,620 | $ | 452,953 | $ | 11,467,179 | $ | 26,321,992 | $ | 23,092,620 | $ | 452,953 | ||||||||||||
|
|
|
|
|
| |||||||||||||||||||
| Year Ended December 31, | Year Ended December 31, | |||||||||||||||||||||||
| 2012 | 2011 | 2010 | 2013 | 2012 | 2011 | |||||||||||||||||||
Statutory capital and surplus of insurance subsidiaries | $ | 361,968,384 | $ | 349,911,429 | $ | 371,871,702 | $ | 372,509,028 | $ | 361,968,384 | $ | 349,911,429 | ||||||||||||
Increases (decreases): | ||||||||||||||||||||||||
Deferred policy acquisition costs | 40,121,697 | 36,424,955 | 34,445,579 | 43,627,510 | 40,121,697 | 36,424,955 | ||||||||||||||||||
Deferred federal income taxes | (25,682,004 | ) | (21,007,223 | ) | (14,834,855 | ) | (12,251,398 | ) | (25,682,004 | ) | (21,007,223 | ) | ||||||||||||
Salvage and subrogation recoverable | 12,000,600 | 11,228,000 | 9,955,000 | 13,060,000 | 12,000,600 | 11,228,000 | ||||||||||||||||||
Non-admitted assets and other adjustments, net | 2,005,603 | 1,478,988 | 4,889,231 | 2,363,038 | 2,005,603 | 1,478,988 | ||||||||||||||||||
Fixed maturities | 39,607,340 | 33,165,065 | 4,430,879 | (1,465,363 | ) | 39,607,340 | 33,165,065 | |||||||||||||||||
Parent-only equity and other adjustments | (29,987,526 | ) | (27,749,622 | ) | (30,654,726 | ) | (20,965,704 | ) | (29,987,526 | ) | (27,749,622 | ) | ||||||||||||
|
|
|
|
|
| |||||||||||||||||||
Stockholders’ equity as reported herein | $ | 400,034,094 | $ | 383,451,592 | $ | 380,102,810 | $ | 396,877,111 | $ | 400,034,094 | $ | 383,451,592 | ||||||||||||
|
|
|
|
|
| |||||||||||||||||||
1716 - Supplementary Cash Flow Information
The following table reflects net income taxes and interest paid during 2013, 2012 2011 and 2010:2011:
| 2012 | 2011 | 2010 | 2013 | 2012 | 2011 | |||||||||||||||||||
Income taxes | $ | 1,626,965 | $ | 324,291 | $ | 1,100,000 | $ | 5,450,000 | $ | 1,626,965 | $ | 324,291 | ||||||||||||
Interest | 2,128,693 | 1,793,366 | 705,210 | 1,527,037 | 2,128,693 | 1,793,366 | ||||||||||||||||||
-87--85-
1817 - Earnings Per Share
We have two classes of common stock, which we refer to as Class A common stock and Class B common stock. Our Class A common stock is entitled to be paid cash dividends that are at least 10% higher than the cash we pay on our Class B common stock. Accordingly, we use the two-class method for the computation of earnings per common share. The two-class method is an earnings allocation formula that determines earnings per share separately for each class of common stock based on dividends declared and an allocation of remaining undistributed earnings using a participation percentage reflecting the dividend rights of each class.
We present below a reconciliation of the numerators and denominators we used in the basic and diluted per share computations for our Class A common stock:
| Year Ended December 31, | Year Ended December 31, | |||||||||||||||||||||||
| (dollars in thousands, except per share data) | 2012 | 2011 | 2010 | 2013 | 2012 | 2011 | ||||||||||||||||||
Basic earnings per share: | ||||||||||||||||||||||||
Numerator: | ||||||||||||||||||||||||
Allocation of net income | $ | 18,455 | $ | 390 | $ | 9,183 | $ | 21,110 | $ | 18,455 | $ | 390 | ||||||||||||
|
|
|
|
|
| |||||||||||||||||||
Denominator: | ||||||||||||||||||||||||
Weighted-average shares outstanding | 20,031,455 | 19,997,146 | 19,961,274 | 20,363,677 | 20,031,455 | 19,997,146 | ||||||||||||||||||
|
|
|
|
|
| |||||||||||||||||||
Basic earnings per share | $ | 0.92 | $ | 0.02 | $ | 0.46 | $ | 1.04 | $ | 0.92 | $ | 0.02 | ||||||||||||
|
|
|
|
|
| |||||||||||||||||||
Diluted earnings per share: | ||||||||||||||||||||||||
Numerator: | ||||||||||||||||||||||||
Allocation of net income | $ | 18,455 | $ | 390 | $ | 9,183 | $ | 21,110 | $ | 18,455 | $ | 390 | ||||||||||||
|
|
|
|
|
| |||||||||||||||||||
Denominator: | ||||||||||||||||||||||||
Number of shares used in basic computation | 20,031,455 | 19,997,146 | 19,961,274 | 20,363,677 | 20,031,455 | 19,997,146 | ||||||||||||||||||
Weighted-average effect of dilutive securities | ||||||||||||||||||||||||
Add: Director and employee stock options | 274,103 | 36,499 | 17,794 | 398,708 | 274,103 | 36,499 | ||||||||||||||||||
|
|
|
|
|
| |||||||||||||||||||
Number of shares used in per share computations | 20,305,558 | 20,033,645 | 19,979,068 | 20,762,385 | 20,305,558 | 20,033,645 | ||||||||||||||||||
|
|
|
|
|
| |||||||||||||||||||
Diluted earnings per share | $ | 0.91 | $ | 0.02 | $ | 0.46 | $ | 1.02 | $ | 0.91 | $ | 0.02 | ||||||||||||
|
|
|
|
|
| |||||||||||||||||||
We used the following information in the basic and diluted per share computations for our Class B common stock:
| Year Ended December 31, | Year Ended December 31, | |||||||||||||||||||||||
| (dollars in thousands, except per share data) | 2012 | 2011 | 2010 | 2013 | 2012 | 2011 | ||||||||||||||||||
Basic and diluted earnings per share: | ||||||||||||||||||||||||
Numerator: | ||||||||||||||||||||||||
Allocation of net income | $ | 4,638 | $ | 63 | $ | 2,284 | $ | 5,212 | $ | 4,638 | $ | 63 | ||||||||||||
|
|
|
|
|
| |||||||||||||||||||
Denominator: | ||||||||||||||||||||||||
Weighted-average shares outstanding | 5,576,775 | 5,576,775 | 5,576,775 | 5,576,775 | 5,576,775 | 5,576,775 | ||||||||||||||||||
|
|
|
|
|
| |||||||||||||||||||
Basic and diluted earnings per share | $ | 0.83 | $ | 0.01 | $ | 0.41 | $ | 0.94 | $ | 0.83 | $ | 0.01 | ||||||||||||
|
|
|
|
|
| |||||||||||||||||||
During 2013, 2012 2011 and 2010,2011, we did not include certain options to purchase shares of our Class A common stock in the computation of diluted earnings per share because the exercise price of the options was greater than the average market price of our Class A common stock. The following table reflects such options that remained outstanding at December 31, 2013, 2012 2011 and 2010:2011:
| 2012 | 2011 | 2010 | ||||||||||
Options excluded from diluted earnings per share | 1,209,000 | 1,238,000 | 2,219,167 | |||||||||
|
|
|
|
|
| |||||||
| 2013 | 2012 | 2011 | ||||||||||
Options excluded from diluted earnings per share | 2,548,500 | 1,209,000 | 1,238,000 | |||||||||
|
|
|
|
|
| |||||||
-88--86-
1918 - Condensed Financial Information of Parent Company
Condensed Balance Sheets
(in thousands)
| December 31, | 2012 | 2011 | 2013 | 2012 | ||||||||||||
Assets | ||||||||||||||||
Investment in subsidiaries/affiliates (equity method) | $ | 470,565 | $ | 445,795 | $ | 457,886 | $ | 470,565 | ||||||||
Short-term investments | 326 | 9,258 | 149 | 326 | ||||||||||||
Cash | 805 | 684 | 1,604 | 805 | ||||||||||||
Property and equipment | 883 | 1,224 | 927 | 883 | ||||||||||||
Other | 304 | 381 | 586 | 304 | ||||||||||||
|
|
|
| |||||||||||||
Total assets | $ | 472,883 | $ | 457,342 | $ | 461,152 | $ | 472,883 | ||||||||
|
|
|
| |||||||||||||
Liabilities and Stockholders’ Equity | ||||||||||||||||
Liabilities | ||||||||||||||||
Cash dividends declared to stockholders | $ | 3,067 | $ | 2,996 | $ | 3,299 | $ | 3,067 | ||||||||
Borrowings under line of credit | 52,000 | 54,500 | ||||||||||||||
Borrowings under lines of credit | 58,000 | 52,000 | ||||||||||||||
Subordinated debentures | 15,465 | 15,465 | — | 15,465 | ||||||||||||
Other | 2,316 | 930 | 2,976 | 2,316 | ||||||||||||
|
|
|
| |||||||||||||
Total liabilities | 72,848 | 73,891 | 64,275 | 72,848 | ||||||||||||
|
|
|
| |||||||||||||
Stockholders’ equity | 400,035 | 383,451 | 396,877 | 400,035 | ||||||||||||
|
|
|
| |||||||||||||
Total liabilities and stockholders’ equity | $ | 472,883 | $ | 457,342 | $ | 461,152 | $ | 472,883 | ||||||||
|
|
|
| |||||||||||||
-89--87-
Condensed Statements of Income and Comprehensive Income
(in thousands)
| Year Ended December 31, | 2012 | 2011 | 2010 | 2013 | 2012 | 2011 | ||||||||||||||||||
Statements of Income | ||||||||||||||||||||||||
Revenues | ||||||||||||||||||||||||
Dividends from subsidiaries | $ | 7,000 | $ | 16,000 | $ | 12,000 | $ | 12,500 | $ | 7,000 | $ | 16,000 | ||||||||||||
Other | 5,487 | 2,995 | 701 | 3,758 | 5,487 | 2,995 | ||||||||||||||||||
|
|
|
|
|
| |||||||||||||||||||
Total revenues | 12,487 | 18,995 | 12,701 | 16,258 | 12,487 | 18,995 | ||||||||||||||||||
|
|
|
|
|
| |||||||||||||||||||
Expenses | ||||||||||||||||||||||||
Operating expenses | 2,323 | 2,392 | 2,060 | 3,777 | 2,323 | 2,392 | ||||||||||||||||||
Interest | 2,118 | 1,864 | 778 | 1,488 | 2,118 | 1,864 | ||||||||||||||||||
|
|
|
|
|
| |||||||||||||||||||
Total expenses | 4,441 | 4,256 | 2,838 | 5,265 | 4,441 | 4,256 | ||||||||||||||||||
|
|
|
|
|
| |||||||||||||||||||
Income before income tax expense (benefit) and equity in undistributed net income (loss) of subsidiaries | 8,046 | 14,739 | 9,863 | |||||||||||||||||||||
Income tax expense (benefit) | 378 | 372 | (487 | ) | ||||||||||||||||||||
Income before income tax (benefit) expense and equity in undistributed net income (loss) of subsidiaries | 10,993 | 8,046 | 14,739 | |||||||||||||||||||||
Income tax (benefit) expense | (1,219 | ) | 378 | 372 | ||||||||||||||||||||
|
|
|
|
|
| |||||||||||||||||||
Income before equity in undistributed net income (loss) of subsidiaries | 7,668 | 14,367 | 10,350 | 12,212 | 7,668 | 14,367 | ||||||||||||||||||
Equity in undistributed net income (loss) of subsidiaries | 15,425 | (13,914 | ) | 1,117 | 14,110 | 15,425 | (13,914 | ) | ||||||||||||||||
|
|
|
|
|
| |||||||||||||||||||
Net income | $ | 23,093 | $ | 453 | $ | 11,467 | $ | 26,322 | $ | 23,093 | $ | 453 | ||||||||||||
|
|
|
|
|
| |||||||||||||||||||
Statements of Comprehensive Income | ||||||||||||||||||||||||
Net income | $ | 23,093 | $ | 453 | $ | 11,467 | $ | 26,322 | $ | 23,093 | $ | 453 | ||||||||||||
|
|
|
|
|
| |||||||||||||||||||
Other comprehensive income (loss), net of tax | ||||||||||||||||||||||||
Unrealized gain (loss) - subsidiaries | 4,644 | 14,972 | (6,446 | ) | ||||||||||||||||||||
Other comprehensive (loss) income, net of tax | ||||||||||||||||||||||||
Unrealized (loss) gain - subsidiaries | (28,707 | ) | 4,644 | 14,972 | ||||||||||||||||||||
|
|
|
|
|
| |||||||||||||||||||
Other comprehensive income (loss), net of tax | 4,644 | 14,972 | (6,446 | ) | ||||||||||||||||||||
Other comprehensive (loss) income, net of tax | (28,707 | ) | 4,644 | 14,972 | ||||||||||||||||||||
|
|
|
|
|
| |||||||||||||||||||
Comprehensive income | $ | 27,737 | $ | 15,425 | $ | 5,021 | ||||||||||||||||||
Comprehensive (loss) income | $ | (2,385 | ) | $ | 27,737 | $ | 15,425 | |||||||||||||||||
|
|
|
|
|
| |||||||||||||||||||
-90--88-
Condensed Statements of Cash Flows
(in thousands)
| Year Ended December 31, | 2012 | 2011 | 2010 | 2013 | 2012 | 2011 | ||||||||||||||||||
Cash flows from operating activities: | ||||||||||||||||||||||||
Net income | $ | 23,093 | $ | 453 | $ | 11,467 | $ | 26,322 | $ | 23,093 | $ | 453 | ||||||||||||
|
|
|
|
|
| |||||||||||||||||||
Adjustments: | ||||||||||||||||||||||||
Equity in undistributed net (income) loss of subsidiaries | (15,425 | ) | 13,914 | (1,117 | ) | (14,110 | ) | (15,425 | ) | 13,914 | ||||||||||||||
Other | (2,624 | ) | (396 | ) | 547 | (2,200 | ) | (2,624 | ) | (396 | ) | |||||||||||||
|
|
|
|
|
| |||||||||||||||||||
Net adjustments | (18,049 | ) | 13,518 | (570 | ) | (16,310 | ) | (18,049 | ) | 13,518 | ||||||||||||||
|
|
|
|
|
| |||||||||||||||||||
Net cash provided | 5,044 | 13,971 | 10,897 | 10,012 | 5,044 | 13,971 | ||||||||||||||||||
|
|
|
|
|
| |||||||||||||||||||
Cash flows from investing activities: | ||||||||||||||||||||||||
Net sale (purchase) of short-term investments | 8,932 | 6,437 | (249 | ) | ||||||||||||||||||||
Net sale of short-term investments | 176 | 8,932 | 6,437 | |||||||||||||||||||||
Net purchase of property and equipment | (147 | ) | (380 | ) | (492 | ) | (420 | ) | (147 | ) | (380 | ) | ||||||||||||
Investment in subsidiaries | (100 | ) | (27,777 | ) | (35,088 | ) | 990 | (100 | ) | (27,777 | ) | |||||||||||||
Other | 44 | 43 | 20 | 44 | 44 | 43 | ||||||||||||||||||
|
|
|
|
|
| |||||||||||||||||||
Net cash used | 8,729 | (21,677 | ) | (35,809 | ) | |||||||||||||||||||
Net cash provided (used) | 790 | 8,729 | (21,677 | ) | ||||||||||||||||||||
|
|
|
|
|
| |||||||||||||||||||
Cash flows from financing activities: | ||||||||||||||||||||||||
Cash dividends paid | (12,208 | ) | (11,874 | ) | (11,405 | ) | (12,809 | ) | (12,208 | ) | (11,874 | ) | ||||||||||||
Issuance of common stock | 2,983 | 1,461 | 1,199 | 12,648 | 2,983 | 1,461 | ||||||||||||||||||
Payments on subordinated debentures | (15,465 | ) | — | — | ||||||||||||||||||||
Payments on line of credit | (6,000 | ) | (3,000 | ) | — | (15,500 | ) | (6,000 | ) | (3,000 | ) | |||||||||||||
Borrowings under line of credit | 3,500 | 22,500 | 35,000 | |||||||||||||||||||||
Borrowings under lines of credit | 21,500 | 3,500 | 22,500 | |||||||||||||||||||||
Repurchase of treasury stock | (1,927 | ) | (1,538 | ) | (146 | ) | (377 | ) | (1,927 | ) | (1,538 | ) | ||||||||||||
|
|
|
|
|
| |||||||||||||||||||
Net cash provided (used) | (13,652 | ) | 7,549 | 24,648 | ||||||||||||||||||||
Net cash (used) provided | (10,003 | ) | (13,652 | ) | 7,549 | |||||||||||||||||||
|
|
|
|
|
| |||||||||||||||||||
Net change in cash | 121 | (157 | ) | (264 | ) | 799 | 121 | (157 | ) | |||||||||||||||
Cash at beginning of year | 684 | 841 | 1,105 | 805 | 684 | 841 | ||||||||||||||||||
|
|
|
|
|
| |||||||||||||||||||
Cash at end of year | $ | 805 | $ | 684 | $ | 841 | $ | 1,604 | $ | 805 | $ | 684 | ||||||||||||
|
|
|
|
|
| |||||||||||||||||||
-91--89-
2019 - Segment Information
We have four reportable segments, which consist of our investment function, our personal lines of insurance, our commercial lines of insurance and our investment in DFSC. Using independent agents, our insurance subsidiaries market personal lines of insurance to individuals and commercial lines of insurance to small and medium-sized businesses.
We evaluate the performance of the personal lines and commercial lines primarily based upon our insurance subsidiaries’ underwriting results as determined under SAP for our total business.
We do not allocate assets to the personal and commercial lines and review the two segments in total for purposes of decision-making. We operate only in the United States and no single customer or agent provides 10 percent or more of our revenues.
Financial data by segment is as follows:
| 2012 | 2011 | 2010 | 2013 | 2012 | 2011 | |||||||||||||||||||
| (in thousands) | (in thousands) | |||||||||||||||||||||||
Revenues: | ||||||||||||||||||||||||
Premiums earned: | ||||||||||||||||||||||||
Commercial lines | $ | 174,735 | $ | 152,247 | $ | 117,755 | $ | 202,983 | $ | 174,735 | $ | 152,247 | ||||||||||||
Personal lines | 300,272 | 282,498 | 260,900 | 312,309 | 300,272 | 282,498 | ||||||||||||||||||
|
|
|
|
|
| |||||||||||||||||||
SAP premiums earned | 475,007 | 434,745 | 378,655 | 515,292 | 475,007 | 434,745 | ||||||||||||||||||
GAAP adjustments | (5 | ) | (3,275 | ) | (625 | ) | — | (5 | ) | (3,275 | ) | |||||||||||||
|
|
|
|
|
| |||||||||||||||||||
GAAP premiums earned | 475,002 | 431,470 | 378,030 | 515,292 | 475,002 | 431,470 | ||||||||||||||||||
Net investment income | 20,169 | 20,858 | 19,950 | 18,795 | 20,169 | 20,858 | ||||||||||||||||||
Realized investment gains | 6,859 | 12,281 | 4,396 | 2,423 | 6,859 | 12,281 | ||||||||||||||||||
Equity in earnings (loss) of DFSC | 4,533 | 2,023 | (269 | ) | ||||||||||||||||||||
Equity in earnings of DFSC | 2,908 | 4,533 | 2,023 | |||||||||||||||||||||
Other | 8,420 | 8,386 | 6,442 | 7,692 | 8,420 | 8,386 | ||||||||||||||||||
|
|
|
|
|
| |||||||||||||||||||
Total revenues | $ | 514,983 | $ | 475,018 | $ | 408,549 | $ | 547,110 | $ | 514,983 | $ | 475,018 | ||||||||||||
|
|
|
|
|
| |||||||||||||||||||
| 2012 | 2011 | 2010 | 2013 | 2012 | 2011 | |||||||||||||||||||
| (in thousands) | (in thousands) | |||||||||||||||||||||||
Income before income taxes: | ||||||||||||||||||||||||
Underwriting income (loss): | ||||||||||||||||||||||||
Commercial lines | $ | 5,251 | $ | (6,560 | ) | $ | 2,252 | $ | (524 | ) | $ | 5,251 | $ | (6,560 | ) | |||||||||
Personal lines | (18,236 | ) | (40,739 | ) | (22,526 | ) | 1,654 | (18,236 | ) | (40,739 | ) | |||||||||||||
|
|
|
|
|
| |||||||||||||||||||
SAP underwriting loss | (12,985 | ) | (47,299 | ) | (20,274 | ) | ||||||||||||||||||
SAP underwriting income (loss) | 1,130 | (12,985 | ) | (47,299 | ) | |||||||||||||||||||
GAAP adjustments | 5,545 | 1,532 | 2,458 | 5,175 | 5,545 | 1,532 | ||||||||||||||||||
|
|
|
|
|
| |||||||||||||||||||
GAAP underwriting loss | (7,440 | ) | (45,767 | ) | (17,816 | ) | ||||||||||||||||||
GAAP underwriting income (loss) | 6,305 | (7,440 | ) | (45,767 | ) | |||||||||||||||||||
Net investment income | 20,169 | 20,858 | 19,950 | 18,795 | 20,169 | 20,858 | ||||||||||||||||||
Realized investment gains | 6,859 | 12,281 | 4,396 | 2,423 | 6,859 | 12,281 | ||||||||||||||||||
Equity in earnings (loss) of DFSC | 4,533 | 2,023 | (269 | ) | ||||||||||||||||||||
Equity in earnings of DFSC | 2,908 | 4,533 | 2,023 | |||||||||||||||||||||
Other | 3,737 | 3,866 | 3,583 | 2,279 | 3,737 | 3,866 | ||||||||||||||||||
|
|
|
|
|
| |||||||||||||||||||
Income (loss) before income taxes | $ | 27,858 | $ | (6,739 | ) | $ | 9,844 | $ | 32,710 | $ | 27,858 | $ | (6,739 | ) | ||||||||||
|
|
|
|
|
| |||||||||||||||||||
2120 - Guaranty Fund and Other Insurance-Related Assessments
Our insurance subsidiaries’ liabilities for guaranty fund and other insurance-related assessments were $1,403,829$1,511,186 and $1,812,078$1,403,829 at December 31, 20122013 and 2011,2012, respectively. These liabilities included $433,994$527,241 and $548,644$433,994 related to surcharges collected by our insurance subsidiaries on behalf of regulatory authorities for 20122013 and 2011,2012, respectively.
-92--90-
2221 - Interim Financial Data (unaudited)
| 2012 | 2013 | |||||||||||||||||||||||||||||||
| First Quarter | Second Quarter | Third Quarter | Fourth Quarter | First Quarter | Second Quarter | Third Quarter | Fourth Quarter | |||||||||||||||||||||||||
Net premiums earned | $ | 114,691,791 | $ | 117,569,122 | $ | 120,916,960 | $ | 121,824,349 | $ | 124,702,041 | $ | 126,963,328 | $ | 130,645,011 | $ | 132,981,564 | ||||||||||||||||
Total revenues | 125,348,162 | 127,299,190 | 130,431,531 | 131,903,702 | 133,872,592 | 135,507,635 | 138,334,960 | 139,394,878 | ||||||||||||||||||||||||
Net losses and loss expenses | 76,609,219 | 86,385,353 | 82,105,094 | 87,771,918 | 85,533,016 | 89,519,350 | 84,882,734 | 83,192,851 | ||||||||||||||||||||||||
Net income | 8,010,147 | 2,023,067 | 6,839,384 | 6,220,022 | 6,475,436 | 2,628,987 | 7,653,734 | 9,563,835 | ||||||||||||||||||||||||
Net earnings per common share: | ||||||||||||||||||||||||||||||||
Class A common stock - basic | 0.32 | 0.08 | 0.27 | 0.25 | 0.26 | 0.10 | 0.30 | 0.38 | ||||||||||||||||||||||||
Class A common stock - diluted | 0.31 | 0.08 | 0.27 | 0.25 | 0.25 | 0.10 | 0.30 | 0.37 | ||||||||||||||||||||||||
Class B common stock - basic and diluted | 0.29 | 0.07 | 0.25 | 0.22 | 0.23 | 0.09 | 0.27 | 0.35 | ||||||||||||||||||||||||
| 2011 | 2012 | |||||||||||||||||||||||||||||||
| First Quarter | Second Quarter | Third Quarter | Fourth Quarter | First Quarter | Second Quarter | Third Quarter | Fourth Quarter | |||||||||||||||||||||||||
Net premiums earned | $ | 103,795,279 | $ | 104,991,401 | $ | 108,506,809 | $ | 114,176,695 | $ | 114,691,791 | $ | 117,569,122 | $ | 120,916,960 | $ | 121,824,349 | ||||||||||||||||
Total revenues | 111,583,442 | 117,054,498 | 119,164,471 | 127,215,208 | 125,348,162 | 127,299,190 | 130,431,531 | 131,903,702 | ||||||||||||||||||||||||
Net losses and loss expenses | 73,079,565 | 84,195,796 | 89,411,543 | 93,815,873 | 76,609,219 | 86,385,353 | 82,105,094 | 87,771,918 | ||||||||||||||||||||||||
Net income (loss) | 2,205,936 | (1,693,989 | ) | 819,926 | (878,920 | ) | ||||||||||||||||||||||||||
Net earnings (loss) per common share: | ||||||||||||||||||||||||||||||||
Class A common stock - basic and diluted | 0.09 | (0.07 | ) | 0.03 | (0.03 | ) | ||||||||||||||||||||||||||
Net income | 8,010,147 | 2,023,067 | 6,839,384 | 6,220,022 | ||||||||||||||||||||||||||||
Net earnings per common share: | ||||||||||||||||||||||||||||||||
Class A common stock - basic | 0.32 | 0.08 | 0.27 | 0.25 | ||||||||||||||||||||||||||||
Class A common stock - diluted | 0.31 | 0.08 | 0.27 | 0.25 | ||||||||||||||||||||||||||||
Class B common stock - basic and diluted | 0.08 | (0.06 | ) | 0.03 | (0.03 | ) | 0.29 | 0.07 | 0.25 | 0.22 | ||||||||||||||||||||||
-93--91-
Report of Independent Registered Public Accounting Firm
To the Stockholders and Board of Directors of Donegal Group Inc.
We have audited the accompanying consolidated balance sheets of Donegal Group Inc. and subsidiaries (the Company) as of December 31, 20122013 and 2011,2012, and the related consolidated statements of income and comprehensive income, stockholders’ equity, and cash flows for each of the years in the three-year period ended December 31, 2012.2013. These consolidated financial statements are the responsibility of the Company’s management. Our responsibility is to express an opinion on these consolidated financial statements based on our audits. We did not audit the financial statements of Donegal Financial Services Corporation (a 48.2 percent owned investee company). The Company’s investment in Donegal Financial Services Corporation at December 31, 2013 and 2012, was $35,685,433 and $36,770,530, respectively, and its equity in earnings of Donegal Financial Services Corporation was $2,907,867 and $4,533,257 for the year then ended.years 2013 and 2012, respectively. The financial statements of Donegal Financial Services Corporation were audited by other auditors whose report has been furnished to us, and our opinion, insofar as it relates to the amounts included for Donegal Financial Services Corporation, is based solely on the report of the other auditors.
We conducted our audits in accordance with the standards of the Public Company Accounting Oversight Board (United States). Those standards require that we plan and perform the audit to obtain reasonable assurance about whether the financial statements are free of material misstatement. An audit includes examining, on a test basis, evidence supporting the amounts and disclosures in the financial statements. An audit also includes assessing the accounting principles used and significant estimates made by management, as well as evaluating the overall financial statement presentation. We believe that our audits and the report of the other auditors provide a reasonable basis for our opinion.
In our opinion, based on our audits and the report of the other auditors, the consolidated financial statements referred to above present fairly, in all material respects, the financial position of Donegal Group Inc. and subsidiaries as of December 31, 20122013 and 2011,2012, and the results of their operations and their cash flows for each of the years in the three-year period ended December 31, 2012,2013, in conformity with U.S. generally accepted accounting principles.
We also have audited, in accordance with the standards of the Public Company Oversight Board (United States), Donegal Group Inc.‘s’s internal control over financial reporting as of December 31, 20122013 based on the criteria established inInternal Control - Integrated Framework (1992) issued by the Committee of Sponsoring Organizations of the Treadway Commission (COSO), and our report dated March 12, 201314, 2014 expressed an unqualified opinion on the effectiveness of the Company’s internal control over financial reporting.
 |
| Philadelphia, Pennsylvania |
| March 14, 2014 |

Philadelphia, Pennsylvania
March 12, 2013
-94--92-
| Item 9. | Changes in and Disagreements with Accountants on Accounting and Financial Disclosure. |
None.
| Item 9A. | Controls and Procedures. |
Evaluation of Disclosure Controls and Procedures
Our management, with the participation of our Chief Executive Officer and our Chief Financial Officer, has evaluated the effectiveness of our disclosure controls and procedures (as such term is defined in Rules 13a-15(e) and 15d-15(e) under the Exchange Act) at December 31, 20122013 covered by this Form 10-K Report. Based on such evaluation, our Chief Executive Officer and our Chief Financial Officer have concluded that, at December 31, 2012,2013, our disclosure controls and procedures are effective in recording, processing, summarizing and reporting, on a timely basis, information we are required to disclose in the reports that we file or submit under the Exchange Act and our disclosure controls and procedures are also effective to ensure that information we disclose in the reports we file or submit under the Exchange Act is accumulated and communicated to our management, including our Chief Executive Officer and our Chief Financial Officer, to allow timely decisions regarding required disclosure.
Management’s Report on Internal Control over Financial Reporting
Our management is responsible for establishing and maintaining adequate internal control over financial reporting, as that term is defined in Rule 13a-15(f) under the Exchange Act. Under the supervision and with the participation of our Chief Executive Officer and our Chief Financial Officer, our management has conducted an evaluation of the effectiveness of our internal control over financial reporting based on the framework and criteria established inInternal Control - Integrated Framework (1992) issued by the Committee of Sponsoring Organizations of the Treadway Commission (the “COSO Framework”). Based on our evaluation under the COSO Framework, our management has concluded that our internal control over financial reporting was effective at December 31, 2012.2013.
The effectiveness of our internal control over financial reporting at December 31, 20122013 has been audited by KPMG LLP, an independent registered public accounting firm, as stated in their report, which is included in this Form 10-K Annual Report.
Changes in Internal Control over Financial Reporting
We did not make any changes to our internal control over financial reporting (as such term is defined in Rules 13a-15(f) and 15d-15(f) under the Exchange Act) during the fourth quarter of 20122013 that have materially affected, or are reasonably likely to affect materially, our internal control over financial reporting.
| Item 9B. | Other Information. |
None.
-95--93-
Report of Independent Registered Public Accounting Firm
To the Stockholders and Board of Directors of Donegal Group Inc.
We have audited Donegal Group Inc.’s (the Company) internal control over financial reporting as of December 31, 2012,2013, based on criteria established inInternal Control - Integrated Framework (1992) issued by the Committee of Sponsoring Organizations of the Treadway Commission (COSO). Donegal Group Inc.‘s’s management is responsible for maintaining effective internal control over financial reporting and for its assessment of the effectiveness of internal control over financial reporting included in the accompanying Management’s Report on Internal Control Over Financial Reporting. Our responsibility is to express an opinion on the Company’s internal control over financial reporting based on our audit.
We conducted our audit in accordance with the standards of the Public Company Accounting Oversight Board (United States). Those standards require that we plan and perform the audit to obtain reasonable assurance about whether effective internal control over financial reporting was maintained in all material respects. Our audit included obtaining an understanding of internal control over financial reporting, assessing the risk that a material weakness exists, and testing and evaluating the design and operating effectiveness of internal control based on the assessed risk. Our audit also included performing such other procedures as we considered necessary in the circumstances. We believe that our audit provides a reasonable basis for our opinion.
A company’s internal control over financial reporting is a process designed to provide reasonable assurance regarding the reliability of financial reporting and the preparation of financial statements for external purposes in accordance with generally accepted accounting principles. A company’s internal control over financial reporting includes those policies and procedures that (1) pertain to the maintenance of records that, in reasonable detail, accurately and fairly reflect the transactions and dispositions of the assets of the company; (2) provide reasonable assurance that transactions are recorded as necessary to permit preparation of financial statements in accordance with generally accepted accounting principles, and that receipts and expenditures of the company are being made only in accordance with authorizations of management and directors of the company; and (3) provide reasonable assurance regarding prevention or timely detection of unauthorized acquisition, use, or disposition of the company’s assets that could have a material effect on the financial statements.
Because of its inherent limitations, internal control over financial reporting may not prevent or detect misstatements. Also, projections of any evaluation of effectiveness to future periods are subject to the risk that controls may become inadequate because of changes in conditions, or that the degree of compliance with the policies or procedures may deteriorate.
In our opinion, Donegal Group Inc. maintained, in all material respects, effective internal control over financial reporting as of December 31, 2012,2013, based on criteria established inInternal Control - Integrated Framework (1992) issued by the Committee of Sponsoring Organizations of the Treadway Commission.
We also have audited, in accordance with the standards of the Public Company Accounting Oversight Board (United States), the consolidated balance sheets of Donegal Group Inc. and subsidiaries as of December 31, 20122013 and 2011,2012, and the related consolidated statements of income and comprehensive income, stockholders’ equity, and cash flows for each of the years in the three-year period ended December 31, 2012,2013, and our report dated March 12, 201314, 2014 expressed an unqualified opinion on those consolidated financial statements.

Philadelphia, Pennsylvania
March 12, 2013
 |
| Philadelphia, Pennsylvania |
| March 14, 2014 |
-96--94-
| Item 10. | Directors, Executive Officers and Corporate Governance of the Registrant. |
We incorporate the response to this Item 10 by reference to our proxy statement we will file with the SEC on or about March 18, 20132014 relating to our annual meeting of stockholders that we will hold on April 18, 2013,17, 2014, or our Proxy Statement. We respond to this Item with respect to our executive officers by reference to Part I of this Form 10-K Report.
We incorporate the full text of our Code of Business Conduct and Ethics by reference to Exhibit 14 to this Form 10-K Report.
| Item 11. | Executive Compensation. |
We incorporate the response to this Item 11 by reference to our Proxy Statement. Neither the Report of our Compensation Committee nor the Report of our Audit Committee included in our Proxy Statement shall constitute or be deemed to constitute a filing with the SEC under the Securities Act or the Exchange Act or be deemed to have been incorporated by reference into any filing we make under the Securities Act or the Exchange Act, except to the extent we specifically incorporate the Report of Our Compensation Committee or the Report of Our Audit Company by reference.
| Item 12. | Security Ownership of Certain Beneficial Owners and Management and Related Stockholder Matters. |
We incorporate the response to this Item 12 by reference to our Proxy Statement.
| Item 13. | Certain Relationships and Related Transactions and Director Independence. |
We incorporate the response to this Item 13 by reference to our Proxy Statement.
| Item 14. | Principal Accountant Fees and Services. |
We incorporate the response to this Item 14 by reference to our Proxy Statement.
-97--95-
| Item 15. | Exhibits and Financial Statement Schedule. |
(a) Financial statements, financial statement schedule and exhibits filed:
(a) Consolidated Financial Statements
| Page | ||||
| 92 | ||||
Consolidated Balance Sheets at December 31, | 56 | |||
| 57 | ||||
| 58 | ||||
| 59 | ||||
| 60 | ||||
Report and Consent of Independent Registered Public Accounting Firm (Filed as Exhibit 23.1) | ||||
Consent of Independent Registered Public Accounting Firm (Filed as Exhibit 23.2) | ||||
Consent of Independent Registered Public Accounting Firm (Filed as Exhibit 23.3) | ||||
(b) Financial Statement Schedule
Schedule III - Supplementary Insurance Information | Filed herewith | |
Consolidated Financial Statements of Donegal Financial Services Corporation | Filed herewith | |
We have omitted all other schedules since they are not required, not applicable or the information is included in the financial statements or notes to the financial statements.
(c) Exhibits
Exhibit No. | Description of Exhibits | Reference | ||
3.1 | Certificate of Incorporation of Donegal Group Inc., as amended. | (a) | ||
3.2 | Amended and Restated By-laws of Donegal Group Inc. | (i) | ||
Management Contracts and Compensatory Plans or Arrangements | ||||
10.1 | Donegal Group Inc. 2013 Equity Incentive Plan for Employees. | (s) | ||
10.2 | Donegal Group Inc. 2013 Equity Incentive Plan for Directors. | (s) | ||
10.3 | Donegal Group Inc. 2011 Employee Stock Purchase Plan. | (c) | ||
10.4 | Donegal Group Inc. 2011 Equity Incentive Plan for Employees. | (c) | ||
10.5 | Donegal Group Inc. 2011 Equity Incentive Plan for Directors. | (c) | ||
10.6 | Employment Agreement dated as of July 29, 2011 among Donegal Mutual Insurance Company, Donegal Group Inc. and Donald H. Nikolaus. | (d) | ||
-96-
10.7 | Consulting Agreement dated as of July 29, 2011 among Donegal Mutual Insurance Company, Donegal Group Inc. and Donald H. Nikolaus. | (d) | ||
10.8 | Employment Agreement dated as of July 29, 2011 among Donegal Mutual Insurance Company, Donegal Group Inc. and Kevin G. Burke. | (d) | ||
10.9 | Employment Agreement dated as of July 29, 2011 among Donegal Mutual Insurance Company, Donegal Group Inc. and Cyril J. Greenya. | (d) | ||
10.10 | Employment Agreement dated as of July 29, 2011 among Donegal Mutual Insurance Company, Donegal Group Inc. and Jeffrey D. Miller. | (d) | ||
-98-
10.11 | Employment Agreement dated as of July 18, 2013 among Donegal Mutual Insurance Company, Donegal Group Inc. and Sanjay Pandey. | Filed herewith | ||
10.12 | Employment Agreement dated as of July 29, 2011 among Donegal Mutual Insurance Company, Donegal Group Inc. and Robert G. Shenk. | (d) | ||
10.13 | Employment Agreement dated as of July 29, 2011 among Donegal Mutual Insurance Company, Donegal Group Inc. and Daniel J. Wagner. | (d) | ||
10.14 | Donegal Mutual Insurance Company 401(k) Plan. | (e) | ||
10.15 | Amendment No. 1 effective January 1, 2000 to Donegal Mutual Insurance Company 401(k) Plan. | (e) | ||
10.16 | Amendment No. 2 effective January 6, 2000 to Donegal Mutual Insurance Company 401(k) Plan. | (b) | ||
10.17 | Amendment No. 3 effective July 23, 2001 to Donegal Mutual Insurance Company 401(k) Plan. | (b) | ||
10.18 | Amendment No. 4 effective January 1, 2002 to Donegal Mutual Insurance Company 401(k) Plan. | (b) | ||
10.19 | Amendment No. 5 effective December 31, 2001 to Donegal Mutual Insurance Company 401(k) Plan. | (b) | ||
10.20 | Amendment No. 6 effective July 1, 2002 to Donegal Mutual Insurance Company 401(k) Plan. | (h) | ||
10.21 | Donegal Group Inc. 2007 Equity Incentive Plan for Employees. | (j) | ||
10.22 | Donegal Group Inc. 2007 Equity Incentive Plan for Directors. | (j) | ||
10.23 | Donegal Group Inc. Incentive Compensation Program. | (k) | ||
Other Material Contracts | ||||
10.24 | Reinsurance and Retrocession Agreement dated May 21, 1996 between Donegal Mutual Insurance Company and Southern Insurance Company of Virginia. | (f) | ||
10.25 | Surplus Note Purchase Agreement dated September 8, 2009 between Donegal Mutual Insurance Company and Southern Mutual Insurance Company. | (l) | ||
10.26 | Quota-share Reinsurance Agreement dated October 30, 2009 but effective 11:59 p.m. on October 31, 2009 between Donegal Mutual Insurance Company and Southern Mutual Insurance Company. | (l) | ||
10.27 | Services and Affiliation Agreement dated October 30, 2009 between Donegal Mutual Insurance Company and Southern Mutual Insurance Company. | (l) | ||
10.28 | Technology License Agreement dated October 30, 2009 between Donegal Mutual Insurance Company and Southern Mutual Insurance Company. | (l) | ||
10.29 | Amended and Restated Proportional Reinsurance Agreement dated March 1, 2010 between Donegal Mutual Insurance Company and Atlantic States Insurance Company. | (l) | ||
10.30 | Agreement and Plan of Merger dated April 19, 2010, and as amended May 20, 2010, among Donegal Acquisition Inc., Donegal Financial Services Corporation, Donegal Group Inc. and Union National Financial Corporation; amended dated September 1, 2010; amended dated December 8, 2010. | (m) | ||
10.31 | Amended and Restated Agreement and Plan of Merger dated December 6, 2010 among Michigan Insurance Company, West Bend Mutual Insurance Company, Donegal Group Inc. and DGI Acquisition Corp. | (n) | ||
-97-
10.32 | Amended and Restated Tax Sharing Agreement dated December 1, 2010 among Donegal Group Inc., Atlantic States Insurance Company, Southern Insurance Company of Virginia, Le Mars Insurance Company, The Peninsula Insurance Company, Peninsula Indemnity Company and Michigan Insurance Company. | (o) | ||
10.33 | Amended and Restated Services Allocation Agreement dated December 1, 2010 among Donegal Group Inc., Atlantic States Insurance Company, Southern Insurance Company of Virginia, Le Mars Insurance Company, The Peninsula Insurance Company, Peninsula Indemnity Company and Michigan Insurance Company. | (o) | ||
10.34 | Quota-share Reinsurance Agreement dated December 1, 2010 between Donegal Mutual Insurance Company and Michigan Insurance Company. | (o) | ||
10.35 | Donegal Group Inc. 2011 Agency Stock Purchase Plan. | (p) | ||
-99-
10.36 | Credit Agreement dated June 21, 2010 between Donegal Group Inc. and Manufacturers and Traders Trust Company, First Amendment to Credit Agreement dated October 12, 2010 and Second Amendment to Credit Agreement dated June 1, 2011. | (q) | ||
10.37 | Third Amendment to Credit Agreement between Donegal Group Inc. and Manufacturers and Traders Trust Company dated June 1, 2012 and Fourth Amendment to Credit Agreement dated December 5, 2012. | (r) | ||
10.38 | Fifth Amendment to Credit Agreement between Donegal Group Inc. and Manufacturers and Traders Trust Company dated June 1, 2013. | Filed herewith | ||
14 | Code of Business Conduct and Ethics. | (g) | ||
21 | Subsidiaries of Registrant. | Filed herewith | ||
23.1 | Report and Consent of Independent Registered Public Accounting Firm. | Filed herewith | ||
23.2 | Consent of Independent Registered Public Accounting Firm. | Filed herewith | ||
23.3 | Consent of Independent Registered Public Accounting Firm. | Filed herewith | ||
31.1 | Rule 13a-14(a)/15(d)-14(a) Certification of Chief Executive Officer. | Filed herewith | ||
31.2 | Rule 13a-14(a)/15(d)-14(a) Certification of Chief Financial Officer. | Filed herewith | ||
32.1 | Section 1350 Certification of Chief Executive Officer. | Filed herewith | ||
32.2 | Section 1350 Certification of Chief Financial Officer. | Filed herewith | ||
Exhibit 101.INS | XBRL Instance Document | Filed herewith | ||
Exhibit 101.SCH | XBRL Taxonomy Extension Schema Document | Filed herewith | ||
Exhibit 101.PRE | XBRL Taxonomy Presentation Linkbase Document | Filed herewith | ||
Exhibit 101.CAL | XBRL Taxonomy Calculation Linkbase Document | Filed herewith | ||
Exhibit 101.LAB | XBRL Taxonomy Label Linkbase Document | Filed herewith | ||
Exhibit 101.DEF | XBRL Taxonomy Extension Definition Linkbase Document | Filed herewith | ||
-98-
| (a) | We incorporate such exhibit by reference to the like-described exhibit in Registrant’s Form |
| (b) | We incorporate such exhibit by reference to the like-described exhibit in Registrant’s Form 10-K Report for the year ended December 31, 2001. |
| (c) | We incorporate such exhibit by reference to the like-described exhibit in Registrant’s Form 8-K Report dated April 22, 2011. |
| (d) | We incorporate such exhibit by reference to the like-described exhibit in Registrant’s Form 8-K Report dated August 3, 2011. |
| (e) | We incorporate such exhibit by reference to the like-described exhibit in Registrant’s Form 10-K Report for the year ended December 31, 1999. |
| (f) | We incorporate such exhibit by reference to the like-described exhibit in Registrant’s Form 10-K Report for the year ended December 31, 1996. |
| (g) | We incorporate such exhibit by reference to the like-described exhibit in Registrant’s Form 10-K Annual Report for the year ended December 31, 2003. |
| (h) | We incorporate such exhibit by reference to the like-described exhibit in Registrant’s Form 10-K Annual Report for the year ended December 31, 2002. |
| (i) | We incorporate such exhibit by reference to the like-described exhibit in Registrant’s Form 8-K Report dated July 18, 2008. |
| (j) | We incorporate such exhibit by reference to the like-numbered exhibit in Registrant’s Form 8-K Report dated April 20, 2007. |
| (k) | We incorporate such exhibit by reference to the description of such plan in Registrant’s definitive proxy statement for its Annual Meeting of Stockholders held on April 21, 2011 filed on March 18, 2011. |
| (l) | We incorporate such exhibit by reference to the like-described exhibit in Registrant’s Form 10-K Annual Report for the year ended December 31, 2009. |
| (m) | We incorporate such exhibit by reference to the like-described exhibit in Registrant’s Form S-4 registration statement filed June 25, 2010, Registrant’s Form 8-K Report dated September 1, 2010 and Registrant’s Form 8-K Report dated December 8, 2010. |
| (n) | We incorporate such exhibit by reference to the like-described exhibit in Registrant’s Form 8-K Report dated December 8, 2010. |
-100-
| (o) | We incorporate such exhibit by reference to the like-described exhibit in Registrant’s Form 10-K Annual Report for the year ended December 31, 2010. |
| (p) | We incorporate such exhibit by reference to the like-described exhibit filed in Registrant’s Form S-3 registration statement filed on May 27, 2011. |
| (q) | We incorporate such exhibit by reference to the like-described exhibit in Registrant’s Form 10-K Annual Report for the year ended December 31, 2011. |
| (r) | We incorporate such exhibit by reference to the like-described exhibit in Registrant’s Form 10-K Annual Report for the year ended December 31, 2012. |
| (s) | We incorporate such exhibit by reference to the like-described exhibit in Registrant’s Form 8-K Report dated April 22, 2013. |
-101--99-
DONEGAL GROUP INC. AND SUBSIDIARIES
SCHEDULE III - SUPPLEMENTARY INSURANCE INFORMATION
SCHEDULE III — SUPPLEMENTARY INSURANCE INFORMATION
Years Ended December 31, 2013, 2012 2011 and 20102011
($ in thousands)
Segment | Net Earned Premiums | Net Investment Income | Net Losses And Loss Expenses | Amortization of Deferred Policy Acquisition Costs | Other Underwriting Expenses | Net Premiums Written | Net Earned Premiums | Net Investment Income | Net Losses And Loss Expenses | Amortization of Deferred Policy Acquisition Costs | Other Underwriting Expenses | Net Premiums Written | ||||||||||||||||||||||||||||||||||||
Year Ended December 31, 2013 | ||||||||||||||||||||||||||||||||||||||||||||||||
Personal lines | $ | 312,309 | $ | — | $ | 206,977 | $ | 49,549 | $ | 49,818 | $ | 318,698 | ||||||||||||||||||||||||||||||||||||
Commercial lines | 202,983 | — | 136,151 | 32,204 | 32,379 | 214,733 | ||||||||||||||||||||||||||||||||||||||||||
Investments | — | 18,795 | — | — | — | — | ||||||||||||||||||||||||||||||||||||||||||
|
|
|
|
|
| |||||||||||||||||||||||||||||||||||||||||||
| $ | 515,292 | $ | 18,795 | $ | 343,128 | $ | 81,753 | $ | 82,197 | $ | 533,431 | |||||||||||||||||||||||||||||||||||||
|
|
|
|
|
| |||||||||||||||||||||||||||||||||||||||||||
Year Ended December 31, 2012 | ||||||||||||||||||||||||||||||||||||||||||||||||
Personal lines | $ | 300,269 | $ | — | $ | 218,502 | $ | 46,977 | $ | 46,725 | $ | 308,571 | $ | 300,269 | $ | — | $ | 218,502 | $ | 46,977 | $ | 46,725 | $ | 308,571 | ||||||||||||||||||||||||
Commercial lines | 174,733 | — | 114,370 | 27,337 | 27,190 | 187,876 | 174,733 | — | 114,370 | 27,337 | 27,190 | 187,876 | ||||||||||||||||||||||||||||||||||||
Investments | — | 20,169 | — | — | — | — | — | 20,169 | — | — | — | — | ||||||||||||||||||||||||||||||||||||
|
|
|
|
|
|
|
|
|
|
|
| |||||||||||||||||||||||||||||||||||||
| $ | 475,002 | $ | 20,169 | $ | 332,872 | $ | 74,314 | $ | 73,915 | $ | 496,447 | $ | 475,002 | $ | 20,169 | $ | 332,872 | $ | 74,314 | $ | 73,915 | $ | 496,447 | |||||||||||||||||||||||||
|
|
|
|
|
|
|
|
|
|
|
| |||||||||||||||||||||||||||||||||||||
Year Ended December 31, 2011 | ||||||||||||||||||||||||||||||||||||||||||||||||
Personal lines | $ | 280,370 | $ | — | $ | 232,141 | $ | 44,558 | $ | 43,487 | $ | 291,065 | $ | 280,370 | $ | — | $ | 232,141 | $ | 44,558 | $ | 43,487 | $ | 291,065 | ||||||||||||||||||||||||
Commercial lines | 151,100 | — | 108,362 | 24,013 | 23,437 | 162,986 | 151,100 | — | 108,362 | 24,013 | 23,437 | 162,986 | ||||||||||||||||||||||||||||||||||||
Investments | — | 20,858 | — | — | — | — | — | 20,858 | — | — | — | — | ||||||||||||||||||||||||||||||||||||
|
|
|
|
|
|
|
|
|
|
|
| |||||||||||||||||||||||||||||||||||||
| $ | 431,470 | $ | 20,858 | $ | 340,503 | $ | 68,571 | $ | 66,924 | $ | 454,051 | $ | 431,470 | $ | 20,858 | $ | 340,503 | $ | 68,571 | $ | 66,924 | $ | 454,051 | |||||||||||||||||||||||||
|
|
|
|
|
|
|
|
|
|
|
| |||||||||||||||||||||||||||||||||||||
Year Ended December 31, 2010 | ||||||||||||||||||||||||||||||||||||||||||||||||
Personal lines | $ | 260,469 | $ | — | $ | 196,008 | $ | 45,719 | $ | 37,596 | $ | 268,047 | ||||||||||||||||||||||||||||||||||||
Commercial lines | 117,561 | — | 78,301 | 20,635 | 16,969 | 123,475 | ||||||||||||||||||||||||||||||||||||||||||
Investments | — | 19,950 | — | — | — | — | ||||||||||||||||||||||||||||||||||||||||||
|
|
|
|
|
| |||||||||||||||||||||||||||||||||||||||||||
| $ | 378,030 | $ | 19,950 | $ | 274,309 | $ | 66,354 | $ | 54,565 | $ | 391,522 | |||||||||||||||||||||||||||||||||||||
|
|
|
|
|
| |||||||||||||||||||||||||||||||||||||||||||
-102--100-
DONEGAL GROUP INC. AND SUBSIDIARIES
SCHEDULE III —- SUPPLEMENTARY INSURANCE INFORMATION, CONTINUED
($ in thousands)
| At December 31, | At December 31, | |||||||||||||||||||||||||||||||
Segment | Deferred Policy Acquisition Costs | Liability For Losses And Loss Expenses | Unearned Premiums | Other Policy Claims and Benefits Payable | Deferred Policy Acquisition Costs | Liability For Losses And Loss Expenses | Unearned Premiums | Other Policy Claims and Benefits Payable | ||||||||||||||||||||||||
2013 | ||||||||||||||||||||||||||||||||
Personal lines | $ | 26,351 | $ | 206,178 | $ | 231,172 | $ | — | ||||||||||||||||||||||||
Commercial lines | 17,277 | 289,441 | 151,563 | — | ||||||||||||||||||||||||||||
Investments | — | — | — | — | ||||||||||||||||||||||||||||
|
|
|
| |||||||||||||||||||||||||||||
| $ | 43,628 | $ | 495,619 | $ | 382,735 | $ | — | |||||||||||||||||||||||||
|
|
|
| |||||||||||||||||||||||||||||
| 2012 | ||||||||||||||||||||||||||||||||
Personal lines | $ | 24,956 | $ | 201,884 | $ | 225,841 | $ | — | $ | 24,956 | $ | 201,884 | $ | 225,841 | $ | — | ||||||||||||||||
Commercial lines | 15,166 | 256,943 | 137,247 | — | 15,166 | 256,943 | 137,247 | — | ||||||||||||||||||||||||
Investments | — | — | — | — | — | — | — | — | ||||||||||||||||||||||||
|
|
|
|
|
|
|
| |||||||||||||||||||||||||
| $ | 40,122 | $ | 458,827 | $ | 363,088 | $ | — | $ | 40,122 | $ | 458,827 | $ | 363,088 | $ | — | |||||||||||||||||
|
|
|
|
|
|
|
| |||||||||||||||||||||||||
2011 | ||||||||||||||||||||||||||||||||
Personal lines | $ | 23,385 | $ | 207,047 | $ | 216,314 | $ | — | ||||||||||||||||||||||||
Commercial lines | 13,040 | 235,361 | 120,623 | — | ||||||||||||||||||||||||||||
Investments | — | — | — | — | ||||||||||||||||||||||||||||
|
|
|
| |||||||||||||||||||||||||||||
| $ | 36,425 | $ | 442,408 | $ | 336,937 | $ | — | |||||||||||||||||||||||||
|
|
|
| |||||||||||||||||||||||||||||
See accompanying Report and Consent of Independent Registered Public Accounting Firm.
-103--101-
 | ||||
| Donegal Financial Services Corporation | ||||
| Consolidated Financial Statements | ||||
| December 31, 2013 and 2012 | ||||
| The report accompanying these financial statements was issued by BDO USA, LLP, a Delaware limited liability partnership and the U.S. member of BDO International Limited, a UK company limited by guarantee. |  |  | ||
Donegal Financial Services
Corporation
Financial Statements
December 31, 2012 and 2011

Donegal Financial Services Corporation
December 31, 20122013 and 20112012
| Page | ||||
| 1 | |||
| 3 | ||||
| 4 | ||||
Consolidated Statement of | 5 | |||
| 6 | ||||
| 7 | ||||
 | Tel: 717-233-8800 | 320 Market Street, 6th Floor | ||
| Fax: 717-233-8801 | Harrisburg, PA 17101 | |||
| www.bdo.com |

Report of Independent Registered Public Accounting Firm
Board of Directors
Donegal Financial Services Corporation
Mount Joy, Pennsylvania
We have audited the accompanying consolidated balance sheet of Donegal Financial Services Corporation and subsidiary, (the “Company”) as of December 31, 20122013 and the related consolidated statements of operations,income, comprehensive income (loss),loss, shareholders’ equity and cash flows for the year then ended. These consolidated financial statements are the responsibility of the Company’s management. Our responsibility is to express an opinion on these consolidated financial statements based on our audit.
We conducted our audit in accordance with the standards of the Public Company Accounting Oversight Board (United States). Those standards require that we plan and perform the audit to obtain reasonable assurance about whether the consolidated financial statements are free of material misstatement. The Company is not required to have, nor were we engaged to perform, an audit of its internal control over financial reporting. Our audit included consideration of internal control over financial reporting as a basis for designing audit procedures that are appropriate in the circumstances, but not for the purpose of expressing an opinion on the effectiveness of the Company’s internal control over financial reporting. Accordingly, we express no such opinion. An audit also includes examining, on a test basis, evidence supporting the amounts and disclosures in the consolidated financial statements, assessing the accounting principles used and significant estimates made by management, as well as evaluating the overall consolidated financial statement presentation. We believe that our audit provides a reasonable basis for our opinion.
In our opinion, the consolidated financial statements referred to above present fairly, in all material respects, the financial position of Donegal Financial Services Corporation and subsidiary at December 31, 2013, and the results of their operations and their cash flows for the year then ended, in conformity with accounting principles generally accepted in the United States of America.
 |
| Harrisburg, Pennsylvania |
| March 7, 2014 |
BDO USA, LLP, a Delaware limited liability partnership, is the U.S. member of BDO International Limited, a UK company limited by guarantee, and forms part of the international BDO network of independent member firms.
BDO is the brand name for the BDO network and for each of the BDO Member Firms.
[LOGO of Parente Beard]
Report of Independent Registered Public Accounting Firm
Board of Directors
Donegal Financial Services Corporation
We have audited the accompanying consolidated balance sheet of Donegal Financial Services Corporation and subsidiary (the “Company”) as of December 31, 2012 and the related consolidated statements of income, comprehensive income (loss), shareholders’ equity, and cash flows for each of the years in the two-year period ended December 31, 2012. These consolidated financial statements are the responsibility of the Company’s management. Our responsibility is to express an opinion on these consolidated financial statements based on our audit.
We conducted our audit of the Company’s consolidated financial statements as of and for the year ended December 31, 2012 in accordance with the standards of the Public Company Accounting Oversight Board (United States). Those standards require that we plan and perform the audit to obtain reasonable assurance about whether the consolidated financial statements are free of material misstatement. An audit includes examining, on a test basis, evidence supporting the amounts and disclosures in the consolidated financial statements. An audit also includes assessing the accounting principles used and significant estimates made by management, as well as evaluating the overall consolidated financial statement presentation. We believe that our audit provides a reasonable basis for our opinion.
We have audited the accompanying consolidated balance sheetconducted our audit of the Company as of December 31, 2011, andCompany’s consolidated financial statements for the related consolidated statements of operations, comprehensive income (loss), shareholders’ equity, and cash flows for each of the years in the two-year periodyear ended December 31, 2011. These consolidated financial statements are the responsibility of the Company’s management. Our responsibility is to express an opinion on these consolidated financial statements based on our audits.
We conducted our audits2011 in accordance with auditing standards generally accepted in the United States of America. Those standards require that we plan and perform the audit to obtain reasonable assurance about whether the consolidated financial statements are free of material misstatement. An audit includes examining, on a test basis, evidence supporting the amounts and disclosures in the consolidated financial statements. An audit also includes assessing the accounting principles used and significant estimates made by management, as well as evaluating the overall consolidated financial statement presentation. We believe that our audits provideaudit provides a reasonable basis for our opinion.
In our opinion, the consolidated financial statements referred to above present fairly, in all material respects, the financial position of Donegal Financial Services Corporation and subsidiary, as of December 31, 2012, and 2011, and the results of their operations and their cash flows for each of the years in the three-yeartwo-year period ended December 31, 2012 in conformity with accounting principles generally accepted in the United States of America.

Lancaster, Pennsylvania
March 8, 2013
 |
| Lancaster, Pennsylvania |
| March 8, 2013 |
Donegal Financial Services Corporation
(Dollars in Thousands, Except Share Data)
December 31, 20122013 and 20112012
| 2013 | 2012 | |||||||||||||||
| 2012 | 2011 | |||||||||||||||
Assets | ||||||||||||||||
Cash and due from banks | $ | 17,989 | $ | 18,249 | $ | 18,945 | $ | 17,989 | ||||||||
Interest-bearing demand deposits in other banks | 11,012 | 34,064 | 40,593 | 11,012 | ||||||||||||
|
|
|
| |||||||||||||
Cash and cash equivalents | 29,001 | 52,313 | 59,538 | 29,001 | ||||||||||||
Interest-bearing time deposits in other banks | 6 | 100 | 6 | 6 | ||||||||||||
Securities available-for-sale | 148,057 | 96,369 | 141,183 | 148,057 | ||||||||||||
Loans held for sale | 4,266 | 1,331 | 1,513 | 4,266 | ||||||||||||
Loans receivable, net of allowance for loan losses of $4,038 at December 31, 2012 and $3,413 at December 31, 2011 | 290,507 | 339,507 | ||||||||||||||
Loans receivable, net of allowance for loan losses of $4,047 at December 31, 2013 and $4,038 at December 31, 2012 | 274,589 | 290,507 | ||||||||||||||
Restricted investment in bank stocks | 2,320 | 3,249 | 1,176 | 2,320 | ||||||||||||
Property and equipment, net | 11,829 | 12,245 | 11,252 | 11,829 | ||||||||||||
Bank-owned life insurance | 12,558 | 12,165 | 12,944 | 12,558 | ||||||||||||
Goodwill | 901 | 901 | 901 | 901 | ||||||||||||
Intangible assets | 1,317 | 1,665 | 1,013 | 1,317 | ||||||||||||
Other real estate owned | 556 | 733 | 367 | 556 | ||||||||||||
Accrued interest receivable | 1,778 | 1,714 | 1,532 | 1,778 | ||||||||||||
Other assets | 6,574 | 10,646 | 6,564 | 6,574 | ||||||||||||
|
|
|
| |||||||||||||
Total assets | $ | 509,670 | $ | 532,938 | $ | 512,578 | $ | 509,670 | ||||||||
|
|
|
| |||||||||||||
Liabilities and Shareholders’ Equity | ||||||||||||||||
Liabilities | ||||||||||||||||
Deposits: | ||||||||||||||||
Demand, non-interest bearing | $ | 75,317 | $ | 79,662 | $ | 80,909 | $ | 75,317 | ||||||||
Interest bearing | 347,519 | 374,914 | 347,350 | 347,519 | ||||||||||||
|
|
|
| |||||||||||||
Total deposits | 422,836 | 454,576 | 428,259 | 422,836 | ||||||||||||
Junior subordinated debentures | 7,387 | 7,103 | 7,701 | 7,387 | ||||||||||||
Other liabilities | 3,267 | 5,261 | 2,690 | 3,267 | ||||||||||||
|
|
|
| |||||||||||||
Total liabilities | 433,490 | 466,940 | 438,650 | 433,490 | ||||||||||||
|
|
|
| |||||||||||||
Shareholders’ Equity | ||||||||||||||||
Common stock, par value $0.01 per share; 1,000 shares authorized, issued and outstanding | 1 | 1 | ||||||||||||||
Common stock, par value $0.01 per share; 17,864 shares authorized, issued and outstanding | 1 | 1 | ||||||||||||||
Surplus | 61,961 | 61,623 | 62,164 | 61,961 | ||||||||||||
Retained earnings | 11,777 | 2,376 | 16,407 | 11,777 | ||||||||||||
Accumulated other comprehensive income | 2,441 | 1,998 | ||||||||||||||
Accumulated other comprehensive (loss) income | (4,644 | ) | 2,441 | |||||||||||||
|
|
|
| |||||||||||||
Total shareholders’ equity | 76,180 | 65,998 | 73,928 | 76,180 | ||||||||||||
|
|
|
| |||||||||||||
Total liabilities and shareholders’ equity | $ | 509,670 | $ | 532,938 | $ | 512,578 | $ | 509,670 | ||||||||
|
|
|
| |||||||||||||
See notes to consolidated financial statements
Donegal Financial Services Corporation
Consolidated Statement of OperationsIncome
(Dollars in Thousands)
Years Ended December 31, 2013, 2012, 2011, and 20102011
| 2012 | 2011 | 2010 | 2013 | 2012 | 2011 | |||||||||||||||||||
Interest Income | ||||||||||||||||||||||||
Loans, including fees | $ | 25,644 | $ | 18,445 | $ | 3,830 | $ | 20,190 | $ | 25,644 | $ | 18,445 | ||||||||||||
Securities: | ||||||||||||||||||||||||
Taxable | 2,174 | 1,911 | 1,231 | 2,462 | 2,174 | 1,911 | ||||||||||||||||||
Tax exempt | 864 | 372 | — | 1,407 | 864 | 372 | ||||||||||||||||||
Other | 84 | 66 | 1 | 93 | 84 | 66 | ||||||||||||||||||
|
|
|
|
|
| |||||||||||||||||||
Total interest income | 28,766 | 20,794 | 5,062 | 24,152 | 28,766 | 20,794 | ||||||||||||||||||
|
|
|
|
|
| |||||||||||||||||||
Interest Expense | ||||||||||||||||||||||||
Deposits | 2,394 | 2,169 | 1,330 | 2,059 | 2,394 | 2,169 | ||||||||||||||||||
Junior subordinated debentures | 767 | 469 | — | 764 | 767 | 469 | ||||||||||||||||||
Other | — | 11 | 2 | — | — | 11 | ||||||||||||||||||
|
|
|
|
|
| |||||||||||||||||||
Total interest expense | 3,161 | 2,649 | 1,332 | 2,823 | 3,161 | 2,649 | ||||||||||||||||||
|
|
|
|
|
| |||||||||||||||||||
Net interest income | 25,605 | 18,145 | 3,730 | 21,329 | 25,605 | 18,145 | ||||||||||||||||||
Provision for Loan Losses | 1,148 | 2,641 | 157 | 205 | 1,148 | 2,641 | ||||||||||||||||||
|
|
|
|
|
| |||||||||||||||||||
Net interest income after provision for loan losses | 24,457 | 15,504 | 3,573 | 21,124 | 24,457 | 15,504 | ||||||||||||||||||
|
|
|
|
|
| |||||||||||||||||||
Other Income | ||||||||||||||||||||||||
Service charges on deposits | 1,433 | 1,105 | 171 | 1,239 | 1,433 | 1,105 | ||||||||||||||||||
Other service charges, commissions, fees | 1,368 | 934 | 40 | 1,310 | 1,368 | 934 | ||||||||||||||||||
Income from fiduciary activities | 76 | 42 | — | 75 | 76 | 42 | ||||||||||||||||||
Alternative investment sales commissions | 852 | 609 | — | 812 | 852 | 609 | ||||||||||||||||||
Gains on sales of loans | 775 | 790 | 367 | 889 | 775 | 790 | ||||||||||||||||||
Net realized gains on sales of securities | 1,488 | 1,805 | 117 | |||||||||||||||||||||
Net realized (losses)/gains on sales of securities | (557 | ) | 1,488 | 1,805 | ||||||||||||||||||||
Earnings from bank-owned life insurance | 393 | 256 | — | 386 | 393 | 256 | ||||||||||||||||||
Other | 92 | 115 | 112 | 79 | 92 | 115 | ||||||||||||||||||
|
|
|
|
|
| |||||||||||||||||||
Total other income | 6,477 | 5,656 | 807 | 4,233 | 6,477 | 5,656 | ||||||||||||||||||
|
|
|
|
|
| |||||||||||||||||||
Other Expenses | ||||||||||||||||||||||||
Salaries and employee benefits | 8,632 | 7,364 | 1,457 | 8,332 | 8,632 | 7,364 | ||||||||||||||||||
Occupancy and equipment | 2,598 | 1,984 | 681 | 2,520 | 2,598 | 1,984 | ||||||||||||||||||
Advertising and marketing | 224 | 123 | 84 | 331 | 224 | 123 | ||||||||||||||||||
Data and ATM processing | 2,020 | 1,476 | — | 2,129 | 2,020 | 1,476 | ||||||||||||||||||
Professional fees | 879 | 979 | 340 | 601 | 879 | 979 | ||||||||||||||||||
Supplies and printing | 267 | 221 | 38 | 276 | 267 | 221 | ||||||||||||||||||
FDIC insurance | 237 | 220 | 94 | 217 | 237 | 220 | ||||||||||||||||||
Merger expenses | 255 | 620 | 1,434 | — | 255 | 620 | ||||||||||||||||||
Amortization of core deposit intangible | 306 | 223 | — | 271 | 306 | 223 | ||||||||||||||||||
Other | 1,372 | 1,146 | 260 | 1,752 | 1,372 | 1,146 | ||||||||||||||||||
|
|
|
|
|
| |||||||||||||||||||
Total other expenses | 16,790 | 14,356 | 4,388 | 16,429 | 16,790 | 14,356 | ||||||||||||||||||
|
|
|
|
|
| |||||||||||||||||||
Income (loss) before income tax expense | 14,144 | 6,804 | (8 | ) | ||||||||||||||||||||
Income before income tax expense | 8,928 | 14,144 | 6,804 | |||||||||||||||||||||
Income Tax Expense | 4,743 | 2,608 | 549 | 2,898 | 4,743 | 2,608 | ||||||||||||||||||
|
|
|
|
|
| |||||||||||||||||||
Net income (loss) | $ | 9,401 | $ | 4,196 | $ | (557 | ) | |||||||||||||||||
Net income | $ | 6,030 | $ | 9,401 | $ | 4,196 | ||||||||||||||||||
|
|
|
|
|
| |||||||||||||||||||
See notes to consolidated financial statements
Donegal Financial Services Corporation
Consolidated Statements of Comprehensive (Loss) Income (Loss)
(Dollars in Thousands)
Years Ended December 31, 2013, 2012, 2011, and 20102011
| 2012 | 2011 | 2010 | ||||||||||
Net Income (Loss) | $ | 9,401 | $ | 4,196 | $ | (557 | ) | |||||
|
|
|
|
|
| |||||||
Other comprehensive income (loss): | ||||||||||||
Unrealized gains (losses) arising during the period on available-for-sale securities, net of income taxes of $734, $1,401, and $(12), respectively | 1,425 | 2,721 | (26 | ) | ||||||||
Reclassification adjustment for net gains on sales of available-for-sale securities included in net income (loss), net of income taxes of $506, $614, and $40, respectively | (982 | ) | (1,191 | ) | (77 | ) | ||||||
|
|
|
|
|
| |||||||
Total other comprehensive income (loss) | 443 | 1,530 | (103 | ) | ||||||||
|
|
|
|
|
| |||||||
Total comprehensive income (loss) | $ | 9,844 | $ | 5,726 | $ | (660 | ) | |||||
|
|
|
|
|
| |||||||
| 2013 | 2012 | 2011 | ||||||||||
Net income | $ | 6,030 | $ | 9,401 | $ | 4,196 | ||||||
|
|
|
|
|
| |||||||
Other comprehensive (loss) income: | ||||||||||||
Unrealized (losses) gains arising during the period on available-for-sale securities, net of income taxes of ($3,838), $734, and $1,401, respectively | (7,453 | ) | 1,425 | 2,721 | ||||||||
Reclassification adjustment for net losses/(gains) on sales of available-for-sale securities included in net income, income taxes of $189, ($506), and ($614), respectively(A)(B) | 368 | (982 | ) | (1,191 | ) | |||||||
|
|
|
|
|
| |||||||
Total other comprehensive (loss) income | (7,085 | ) | 443 | 1,530 | ||||||||
|
|
|
|
|
| |||||||
Total comprehensive (loss) income | $ | (1,055 | ) | $ | 9,844 | $ | 5,726 | |||||
|
|
|
|
|
| |||||||
| (A) | Amounts are included in net realized (losses) gains on sales of securities on the consolidated statement of income in total other income. |
| (B) | Income tax amounts are included in income tax expense on the consolidated statement of income. |
See notes to consolidated financial statements
Donegal Financial Services Corporation
Consolidated Statement of Shareholders’ Equity
(Dollars in Thousands)
Years Ended December 31, 2013, 2012, 2011, and 20102011
| Common Stock | Surplus | Retained Earnings (Accumulated Deficit) | Accumulated Other Comprehensive Income | Total | Common Stock | Surplus | Retained Earnings (Accumulated Deficit) | Accumulated Other Comprehensive Income (Loss) | Total | |||||||||||||||||||||||||||||||
Balance, January 1, 2010 | $ | 1 | $ | 18,959 | $ | (1,263 | ) | $ | 571 | $ | 18,268 | |||||||||||||||||||||||||||||
Net loss | — | — | (557 | ) | — | (557 | ) | |||||||||||||||||||||||||||||||||
Other comprehensive loss, net of taxes | — | — | — | (103 | ) | (103 | ) | |||||||||||||||||||||||||||||||||
|
|
|
|
| ||||||||||||||||||||||||||||||||||||
Balance, December 31, 2010 | 1 | 18,959 | (1,820 | ) | 468 | 17,608 | ||||||||||||||||||||||||||||||||||
Balance, January 1, 2011 | $ | 1 | $ | 18,959 | $ | (1,820 | ) | $ | 468 | $ | 17,608 | |||||||||||||||||||||||||||||
Net income | — | — | 4,196 | — | 4,196 | — | — | 4,196 | — | 4,196 | ||||||||||||||||||||||||||||||
Other comprehensive income, net of taxes | — | — | — | 1,530 | 1,530 | — | — | — | 1,530 | 1,530 | ||||||||||||||||||||||||||||||
Cash capital contribution from Donegal Mutual Insurance Company | — | 12,160 | — | — | 12,160 | — | 12,160 | — | — | 12,160 | ||||||||||||||||||||||||||||||
Cash capital contribution from Donegal Group Inc. | — | 20,570 | — | — | 20,570 | — | 20,570 | — | — | 20,570 | ||||||||||||||||||||||||||||||
Stock capital contribution from Donegal Mutual Insurance Company | — | 9,934 | — | — | 9,934 | — | 9,934 | — | — | 9,934 | ||||||||||||||||||||||||||||||
|
|
|
|
|
|
|
|
|
| |||||||||||||||||||||||||||||||
Balance, December 31, 2011 | 1 | 61,623 | 2,376 | 1,998 | 65,998 | 1 | 61,623 | 2,376 | 1,998 | 65,998 | ||||||||||||||||||||||||||||||
Net income | — | — | 9,401 | — | 9,401 | — | — | 9,401 | — | 9,401 | ||||||||||||||||||||||||||||||
Other comprehensive income, net of taxes | — | — | — | 443 | 443 | — | — | — | 443 | 443 | ||||||||||||||||||||||||||||||
Cash capital contribution from Donegal Mutual Insurance Company | — | 338 | — | — | 338 | — | 200 | — | — | 200 | ||||||||||||||||||||||||||||||
Stock Option Expense | — | 138 | — | — | 138 | |||||||||||||||||||||||||||||||||||
|
|
|
|
|
|
|
|
|
| |||||||||||||||||||||||||||||||
Balance, December 31, 2012 | $ | 1 | $ | 61,961 | $ | 11,777 | $ | 2,441 | $ | 76,180 | 1 | 61,961 | 11,777 | 2,441 | 76,180 | |||||||||||||||||||||||||
|
|
|
|
| ||||||||||||||||||||||||||||||||||||
Net income | — | — | 6,030 | — | 6,030 | |||||||||||||||||||||||||||||||||||
Other comprehensive loss, net of taxes | — | — | — | (7,085 | ) | (7,085 | ) | |||||||||||||||||||||||||||||||||
Common stock dividend | — | — | (1,400 | ) | — | (1,400 | ) | |||||||||||||||||||||||||||||||||
Stock option expense | — | 203 | — | — | 203 | |||||||||||||||||||||||||||||||||||
|
|
|
|
| ||||||||||||||||||||||||||||||||||||
Balance, December 31, 2013 | $ | 1 | $ | 62,164 | $ | 16,407 | $ | (4,644 | ) | $ | 73,928 | |||||||||||||||||||||||||||||
|
|
|
|
| ||||||||||||||||||||||||||||||||||||
See notes to consolidated financial statements
Donegal Financial Services Corporation
Consolidated Statement of Cash Flows
(Dollars in Thousands)
Years Ended December 31, 2012, 2011, and 2010
| 2012 | 2011 | 2010 | ||||||||||
Cash Flows from Operating Activities | ||||||||||||
Net income (loss) | $ | 9,401 | $ | 4,196 | $ | (557 | ) | |||||
Adjustments to reconcile net income (loss) to net cash provided by (used in) operating activities: | ||||||||||||
Provision for loan losses | 1,148 | 2,641 | 157 | |||||||||
Depreciation and amortization | 1,006 | 784 | 212 | |||||||||
Intangible amortization | 348 | 245 | — | |||||||||
Accretion of junior subordinated debentures | 284 | 58 | — | |||||||||
Net gains on sales of securities | (1,488 | ) | (1,805 | ) | (117 | ) | ||||||
Net loss (gain) on sales of other real estate owned | 67 | (16 | ) | (6 | ) | |||||||
Gain on sales of loans | (775 | ) | (790 | ) | (367 | ) | ||||||
Proceeds from sales of loans | 23,358 | 23,313 | 20,373 | |||||||||
Loans originated for sale | (25,518 | ) | (23,256 | ) | (19,369 | ) | ||||||
Stock option expense | 138 | — | — | |||||||||
Net loss on sale of property and equipment | 1 | 24 | — | |||||||||
Amortization on securities, net | 642 | 256 | 95 | |||||||||
Earnings from bank-owned life insurance | (393 | ) | (256 | ) | — | |||||||
Deferred income taxes (benefit) | 2,765 | (6,455 | ) | 272 | ||||||||
Decrease (increase) in accrued interest receivable and other assets | 1,015 | (6,418 | ) | (17 | ) | |||||||
(Decrease) increase in other liabilities | (1,994 | ) | (983 | ) | 1,742 | |||||||
|
|
|
|
|
| |||||||
Net cash provided by (used in) operating activities | 10,005 | (8,462 | ) | 2,418 | ||||||||
|
|
|
|
|
| |||||||
Cash Flows from Investing Activities | ||||||||||||
Purchases of securities available-for-sale | (114,226 | ) | (91,457 | ) | (15,859 | ) | ||||||
Proceeds from sales of securities available-for-sale | 44,170 | 47,762 | 2,004 | |||||||||
Proceeds from maturities and principal repayments of securities available-for-sale | 19,885 | 15,683 | 14,057 | |||||||||
Net cash proceeds from bank acquisition | — | 79,162 | — | |||||||||
Net decrease (increase) in loans | 47,335 | 9,659 | (636 | ) | ||||||||
Net maturities of interest bearing time deposits | 94 | — | — | |||||||||
Redemption of restricted stock | 929 | 841 | 42 | |||||||||
Proceeds from the sale of property and equipment | 7 | 8 | — | |||||||||
Purchases of property and equipment | (598 | ) | (72 | ) | (17 | ) | ||||||
Proceeds from sale of other real estate owned | 627 | 140 | 34 | |||||||||
|
|
|
|
|
| |||||||
Net cash (used in) provided by investing activities | (1,777 | ) | 61,726 | (375 | ) | |||||||
|
|
|
|
|
| |||||||
Cash Flows from Financing Activities | ||||||||||||
Net (decrease) increase in deposits | (31,740 | ) | (26,258 | ) | 2,349 | |||||||
Net decrease in short-term borrowings | — | — | (3,834 | ) | ||||||||
Proceeds from long-term debt | — | 27,677 | — | |||||||||
Repayment of long-term debt | — | (39,030 | ) | — | ||||||||
Capital contribution from Donegal Mutual Insurance Company | 200 | 12,160 | ||||||||||
Capital contribution from Donegal Group Inc. | — | 20,570 | — | |||||||||
|
|
|
|
|
| |||||||
Net cash used in financing activities | (31,540 | ) | (4,881 | ) | (1,485 | ) | ||||||
|
|
|
|
|
| |||||||
Net (decrease) increase in cash and cash equivalents | (23,312 | ) | 48,383 | 558 | ||||||||
Cash and Cash Equivalents, Beginning of Year | 52,313 | 3,930 | 3,372 | |||||||||
|
|
|
|
|
| |||||||
Cash and Cash Equivalents, End of Year | $ | 29,001 | $ | 52,313 | $ | 3,930 | ||||||
|
|
|
|
|
| |||||||
See notes to consolidated financial statements
Donegal Financial Services Corporation
Consolidated Statement of Cash Flows
(Dollars in Thousands)
Years Ended December 31, 2013, 2012, 2011, and 20102011
| 2012 | 2011 | 2010 | ||||||||||
Supplementary Cash Flows Information | ||||||||||||
Interest paid | $ | 3,296 | $ | 2,270 | $ | 1,331 | ||||||
|
|
|
|
|
| |||||||
Income taxes paid | $ | 1,100 | $ | 1,698 | $ | 48 | ||||||
|
|
|
|
|
| |||||||
Supplementary Schedule of Noncash Investing Activities | ||||||||||||
Loan transfers to other real estate owned | $ | 517 | $ | 857 | $ | 28 | ||||||
|
|
|
|
|
| |||||||
Acquisitions: | ||||||||||||
Assets Acquired: | ||||||||||||
Securities acquired through merger | $ | — | $ | 33,391 | $ | — | ||||||
Loans acquired through merger | — | 291,903 | — | |||||||||
Restricted stock acquired through merger | — | 3,257 | — | |||||||||
Property and equipment acquired through merger | — | 12,588 | — | |||||||||
Goodwill and intangible assets acquired through merger | — | 2,811 | — | |||||||||
Bank-owned life insurance acquired through merger | — | 11,909 | — | |||||||||
Other assets acquired through merger | — | 14,194 | — | |||||||||
|
|
|
|
|
| |||||||
| $ | — | $ | 370,053 | $ | — | |||||||
|
|
|
|
|
| |||||||
Liabilities Assumed: | ||||||||||||
Deposits acquired through merger | $ | — | $ | 401,685 | $ | — | ||||||
Junior subordinated debentures acquired through merger | — | 7,045 | — | |||||||||
Long-term debt acquired through merger | — | 11,353 | — | |||||||||
Other liabilities acquired through merger | — | 3,883 | — | |||||||||
|
|
|
|
|
| |||||||
| $ | — | $ | 423,966 | $ | — | |||||||
|
|
|
|
|
| |||||||
| 2013 | 2012 | 2011 | ||||||||||
Cash Flows from Operating Activities | ||||||||||||
Net income | $ | 6,030 | $ | 9,401 | $ | 4,196 | ||||||
Adjustments to reconcile net income to net cash provided by (used in) operating activities: | ||||||||||||
Provision for loan losses | 205 | 1,148 | 2,641 | |||||||||
Depreciation and amortization | 975 | 1,006 | 784 | |||||||||
Intangible amortization | 304 | 348 | 245 | |||||||||
Accretion of junior subordinated debentures | 314 | 284 | 58 | |||||||||
Net (loss) gain on sales of securities | 557 | (1,488 | ) | (1,805 | ) | |||||||
Net loss (gain) on sales of other real estate owned | 94 | 67 | (16 | ) | ||||||||
Gain on sales of loans | (889 | ) | (775 | ) | (790 | ) | ||||||
Proceeds from sales of loans | 32,091 | 23,358 | 23,313 | |||||||||
Loans originated for sale | (28,449 | ) | (25,518 | ) | (23,256 | ) | ||||||
Stock option expense | 203 | 138 | — | |||||||||
Net (gain) loss on sale of property and equipment | (2 | ) | 1 | 24 | ||||||||
Amortization on securities, net | 666 | 642 | 256 | |||||||||
Earnings from bank-owned life insurance | (386 | ) | (393 | ) | (256 | ) | ||||||
Deferred income taxes (benefit) | 1,928 | 2,765 | (6,455 | ) | ||||||||
Decrease (increase) in accrued interest receivable and other assets | 1,977 | 1,015 | (6,418 | ) | ||||||||
Decrease in other liabilities | (577 | ) | (1,994 | ) | (983 | ) | ||||||
|
|
|
|
|
| |||||||
Net cash provided by (used in) operating activities | 15,041 | 10,005 | (8,462 | ) | ||||||||
|
|
|
|
|
| |||||||
Cash Flows from Investing Activities | ||||||||||||
Purchases of securities available-for-sale | (50,782 | ) | (114,226 | ) | (91,457 | ) | ||||||
Proceeds from sales of securities available-for-sale | 27,849 | 44,170 | 47,762 | |||||||||
Proceeds from maturities and principal repayments of securities available-for-sale | 17,850 | 19,885 | 15,683 | |||||||||
Net cash proceeds from bank acquisition | — | — | 79,162 | |||||||||
Net decrease in loans | 15,683 | 47,335 | 9,659 | |||||||||
Net maturities of interest bearing time deposits | — | 94 | — | |||||||||
Redemption of restricted stock | 1,144 | 929 | 841 | |||||||||
Proceeds from the sale of property and equipment | 38 | 7 | 8 | |||||||||
Purchases of property and equipment | (434 | ) | (598 | ) | (72 | ) | ||||||
Proceeds from sale of other real estate owned | 125 | 627 | 140 | |||||||||
|
|
|
|
|
| |||||||
Net cash provided by (used in) investing activities | 11,473 | (1,777 | ) | 61,726 | ||||||||
|
|
|
|
|
| |||||||
Cash Flows from Financing Activities | ||||||||||||
Net increase (decrease) in deposits | 5,423 | (31,740 | ) | (26,258 | ) | |||||||
Proceeds from long-term debt | 6,000 | — | 27,677 | |||||||||
Repayment of long-term debt | (6,000 | ) | — | (39,030 | ) | |||||||
Capital contribution from Donegal Mutual Insurance Company | — | 200 | 12,160 | |||||||||
Capital contribution from Donegal Group Inc. | — | — | 20,570 | |||||||||
Dividends paid | (1,400 | ) | — | — | ||||||||
|
|
|
|
|
| |||||||
Net cash provided by (used in) financing activities | 4,023 | (31,540 | ) | (4,881 | ) | |||||||
|
|
|
|
|
| |||||||
Net increase (decrease) in cash and cash equivalents | 30,537 | (23,312 | ) | 48,383 | ||||||||
Cash and Cash Equivalents, Beginning of Year | 29,001 | 52,313 | 3,930 | |||||||||
|
|
|
|
|
| |||||||
Cash and Cash Equivalents, End of Year | $ | 59,538 | $ | 29,001 | $ | 52,313 | ||||||
|
|
|
|
|
| |||||||
See notes to consolidated financial statements
Donegal Financial Services Corporation
Consolidated Statement of Cash Flows
(Dollars in Thousands)
Years Ended December 31, 2013, 2012, and 2011
| 2013 | 2012 | 2011 | ||||||||||
Supplementary Cash Flows Information | ||||||||||||
Interest paid | $ | 2,880 | $ | 3,296 | $ | 2,270 | ||||||
|
|
|
|
|
| |||||||
Income taxes paid | $ | 1,150 | $ | 1,100 | $ | 1,698 | ||||||
|
|
|
|
|
| |||||||
Supplementary Schedule of Noncash Investing Activities | ||||||||||||
Loan transfers to other real estate owned | $ | 30 | $ | 517 | $ | 857 | ||||||
|
|
|
|
|
| |||||||
Acquisition: | ||||||||||||
Assets Acquired: | ||||||||||||
Securities acquired through merger | $ | — | $ | — | $ | 33,391 | ||||||
Loans acquired through merger | — | — | 291,903 | |||||||||
Restricted stock acquired through merger | — | — | 3,257 | |||||||||
Property and equipment acquired through merger | — | — | 12,588 | |||||||||
Goodwill and intangible assets acquired through merger | — | — | 2,811 | |||||||||
Bank-owned life insurance acquired through merger | — | — | 11,909 | |||||||||
Other assets acquired through merger | — | — | 14,194 | |||||||||
|
|
|
|
|
| |||||||
| $ | — | $ | — | $ | 370,053 | |||||||
|
|
|
|
|
| |||||||
Liabilities Assumed: | ||||||||||||
Deposits acquired through merger | $ | — | $ | — | $ | 401,685 | ||||||
Junior subordinated debentures acquired through merger | — | — | 7,045 | |||||||||
Long-term debt acquired through merger | — | — | 11,353 | |||||||||
Other liabilities acquired through merger | — | — | 3,883 | |||||||||
|
|
|
|
|
| |||||||
| $ | — | $ | — | $ | 423,966 | |||||||
|
|
|
|
|
| |||||||
See notes to consolidated financial statements
Donegal Financial Services Corporation
Notes to Consolidated Financial Statements
December 31, 20122013 and 20112012
| 1. | Summary of Significant Accounting Policies |
The accounting policies discussed below are followed consistently by Donegal Financial Services Corporation (the “Company”). These policies are in accordance with accounting principles generally accepted in the United States of America (“US GAAP”) and conform to common practices in the banking industry.
Nature of Operations
The consolidated financial statements include the accounts of the Company and its wholly-owned subsidiary, Union Community Bank, FSB, (the “Bank”). All material intercompany transactions have been eliminated in consolidation. The Company is owned by Donegal Mutual Insurance Company (the “Insurance Company”) and Donegal Group Inc.
The Company is a one-bank holding company and provides full banking services through its subsidiary, Union Community Bank, FSB.Bank. The Bank serves primarily Lancaster County, Pennsylvania.
On May 6, 2011, Donegal Financial Services Corporation, the parent company of Province Bank, FSB, merged with Union National Financial Corporation, the parent company of Union National Community Bank, pursuant to which Union National Financial Corporation merged with and into Donegal Financial Services Corporation. As part of the transaction, Union National Community Bank merged with and into Province Bank, FSB. The entity is operating under the new name Union Community Bank, FSB.Bank. This series of transactions is collectively referred to as the “acquisition”.
Estimates
The preparation of consolidated financial statements in conformity with US GAAP requires management to make estimates and assumptions that affect the reported amounts of assets and liabilities and disclosure of contingent assets and liabilities at the date of the consolidated financial statements and the reported amounts of revenues and expenses during the reporting period. Actual results could differ from those estimates. Material estimates that are particularly susceptible to significant change in the near term relate to the determination of the allowance for loan losses, the valuation of deferred tax assets, the evaluation of investment securities for other than temporary impairment, the fair valuing of assets acquired and liabilities assumed, and the evaluation of goodwill for impairment.
Presentation of Cash Flows
For purposes of reporting cash flows, cash and cash equivalents include cash on hand, amounts due from banks, federal funds sold, interest-bearing demand deposits with other banks, and short-term investments consisting of money market accounts and U.S. Treasury bills purchased with a maturity date of three months or less. Generally, federal funds are purchased and sold for one-day periods.
Donegal Financial Services Corporation
Notes to Consolidated Financial Statements
December 31, 20122013 and 20112012
Securities
Management determines the appropriate classification of debt securities at the time of purchase, or acquisition, and re-evaluates such designation as of each balance sheet date.
Securities classified as available-for-sale are those securities that the Company intends to hold for an indefinite period of time but not necessarily to maturity. Any decision to sell a security classified as available-for-sale would be based on various factors, including significant movement in interest rates, changes in maturity mix of the Company’s assets and liabilities, liquidity needs, regulatory capital considerations and other similar factors. Securities available-for-sale are carried at fair value. Unrealized gains and losses are reported as increases or decreases in other comprehensive income (loss). income. Realized gains or losses, determined on the basis of the cost of the specific securities sold, are included in earnings. Premiums and discounts are recognized in interest income using the interest method over the terms of the securities.
Other-than-temporary impairment guidance on debt securities specifies that (a) if a company does not have the intent to sell a debt security prior to recovery and (b) it is more likely than not that it will not have to sell the debt security prior to recovery, the security would not be considered other-than-temporarily impaired unless there is a loss due to credit quality. When an entity does not intend to sell the security, and it is more likely than not, the entity will not have to sell the security before the recovery of its cost basis, it will recognize the credit component of an other-than-temporary impairment of a debt security in earnings and the remaining portion in other comprehensive income (loss). income. The Company has not recognized any other-than-temporary impairment losses in the years ended December 31, 2013, 2012 2011 or 2010.2011.
Loans Held for Sale
Loans originated and intended for sale in the secondary market are carried in the aggregate at the lower of cost or estimated fair value. The fair value of loans held for sale is determined, when possible, using quoted secondary-market prices. If no such quoted prices exist, the fair value of a loan is determined using quoted prices for a similar loan or loans, adjusted for the specific attribute of that loan. Net unrealized losses are recognized through a valuation allowance with corresponding charges in the consolidated statement of operations.income. The Company did not write down any loans held for sale during the years ended December 31, 2013, 2012 2011 or 2010.2011. All sales are made without recourse and are sold with servicing released.
Loans Receivable
Loans that management has the intent and ability to hold for the foreseeable future or until maturity or payoff are generally stated at their outstanding unpaid principal balances, net of an allowance for credit losses, and any deferred fees or costs on originated loans. Interest income is accrued on the unpaid principal balance. Loan origination fees, net of certain direct origination costs, are deferred and recognized as an adjustment of the yield (interest income) of the related loans. The Company is generally amortizing these amounts over the contractual life of the loan. Premiums and discounts on purchased loans are amortized as adjustments to interest income using the effective yield method.
Donegal Financial Services Corporation
Notes to Consolidated Financial Statements
December 31, 20122013 and 20112012
The loan portfolio is segmented into commercial and consumer loans. Commercial loans consist of the following classes: commercial real estate secured; commercial & industrial (“C&I”); and commercial other. Consumer loans consist of the following classes: residential mortgage loans; home equity installment loans and lines of credit; and consumer loans other.
Commercial Loans - Real Estate Secured - - the Company engages in commercial lending secured by real estate in its primary market, Lancaster County, Pennsylvania, and surrounding areas. The majority of the commercial loan portfolio is secured by owner-occupied commercial office and manufacturing properties, as well as agricultural land. A smaller portion of the Company’s commercial real estate portfolio is secured by commercial real estate development and construction projects.
Generally, commercial real estate loans have terms that do not exceed 20 years, have loan-to-value ratios of up to 80% of the appraised value of the property, and typically require the personal guarantees of the principals of the borrowing entities. Terms of construction loans depend on the specifics of the project such as estimated absorption rates, estimated time to complete, etc. In underwriting commercial real estate loans, the Company performs a thorough analysis of the financial condition and cash flows of the borrower, the borrower’s credit history, the borrower’s character, and the reliability and predictability of the cash flow generated by the business and property securing the loan. Appraisals supporting the underwriting of properties securing commercial real estate loans are performed by independent appraisers.
Commercial real estate loans generally present a higher level of risk than other types of loans primarily due to adverse economic conditions causing declines in the values of the collateral. This market value risk is somewhat mitigated for owner-occupied commercial real estate loans since the performance and cash flow of the business is the primary source of loan repayment, and not the sale or rent of the real estate.
Commercial Loans - C & I, and Other - - The Company originates commercial loans not secured by real estate, but instead by business operations and non-real-estate assets, generally referred to as commercial and industrial loans. These commercial and industrial loans are made primarily to businesses located in the Company’s primary market, Lancaster County, Pennsylvania, and surrounding areas. These loans are used for various business purposes which include short-term loans and lines of credit to finance machinery and equipment purchases, and inventory and accounts receivable management, supporting the businesses growth, stability, and profitability.
Generally, the maximum term for commercial loans used for machinery and equipment purchases is based on the projected useful life of such machinery and equipment. Most working capital and business lines of credit are written on demand and require annual renewal. Commercial and industrial loans are generally secured with short-term assets; however, in some cases, additional collateral such as junior liens on real estate is provided as additional security for the loan. Loan-to-values have been established by the Company, specific to the type of business collateral, and generally do not exceed 75% of the value of the underlying business assets. Collateral values may be determined using invoices, inventory reports, accounts receivable aging reports and collateral appraisals.
Donegal Financial Services Corporation
Notes to Consolidated Financial Statements
December 31, 20122013 and 20112012
In underwriting commercial and industrial loans, an analysis of the borrower’s capacity to repay the loan, the adequacy of the borrower’s capital and collateral, the borrower’s character, as well as an evaluation of the local and broader economic conditions affecting the borrower’s business, is performed. Analysis of the borrower’s past, present and future cash flows is also an important aspect of the Company’s underwriting analysis.
Commercial loans generally present a higher level of risk than other types of loans primarily due to adverse economic conditions having a negative effect on business sales, receivable collections, and, cash flows.
Residential Mortgage Loans, and Home Equity Loans and Lines of Credit - - The Company originates one-to-four-family first position residential mortgage loans, and junior lien home equity loans and lines of credit, through the Company’s marketing efforts, to present customers, new walk-in customers, and referred customers. Residential mortgage and home equity credits include fixed-rate and adjustable rate mortgages with terms up to a maximum of 20 years for both permanent structures and those under construction. These one-to-four-family mortgage originations are secured by residential properties primarily located in the Company’s primary market, Lancaster County, Pennsylvania, and surrounding areas. The majority of residential mortgage and home equity credits have a total loans-to-value ratio of 80% or less. If the total of residential mortgage and home equity loans and lines on a residential property exceed 80% of the underlying real estate value, the borrowers are required to have private mortgage insurance.
In underwriting one-to-four-family residential mortgage and home equity credits, the Company evaluates both the borrower’s ability to make monthly payments (from the borrower’s existing financial condition and sustainable income sources), and the value of the residential property securing the loan. Real estate properties securing residential mortgage and home equity credits are appraised by independent appraisers. The Company generally requires borrowers to obtain an attorney’s title opinion or title insurance, and fire and property insurance (and flood insurance, if necessary) in an amount not less than the appraised value of the property securing the loan. The Company has not engaged in sub-prime residential mortgage originations.
Residential mortgage and home equity credits present a credit risk to the Company, but generally at a lower risk profile as compared to other types of loans since, though adverse economic conditions may cause a decline in property value or cessation in borrower repayment ability, the loan-to-value underwriting standards and generally higher marketability of residential real estate provides for more effective collateral liquidation to cover outstanding loan balances.
Consumer Loans, Other - - The Company offers a variety of secured and unsecured consumer loans, including vehicle loans, loans secured by savings deposits, and unsecured consumer loans. Consumer loan terms vary according to the type and value of collateral and creditworthiness of the borrower. In underwriting consumer loans, a thorough analysis of the borrower’s willingness and financial ability to repay the loan as agreed is performed. The ability to repay shall be determined by the borrower’s employment history, current financial conditions, and credit background.
Donegal Financial Services Corporation
Notes to Consolidated Financial Statements
December 31, 20122013 and 20112012
Consumer loans not secured by real estate generally entail greater credit risk than do residential mortgage loans, particularly in the case of consumer loans which are unsecured or are secured by rapidly depreciable assets, such as automobiles or recreational equipment. In such cases, any repossessed collateral for a defaulted consumer loan may not provide an adequate source of repayment of the outstanding loan balance as a result of the greater likelihood of damage, loss or depreciation. In addition, consumer loan collections are dependent on the borrower’s continuing financial stability, and thus are more likely to be affected by adverse personal circumstances. Furthermore, the application of various federal and state laws, including bankruptcy and insolvency laws, may limit the amount which can be recovered on such loans.
Nonaccrual Loans - - Generally, a loan is classified as nonaccrual, and the accrual of interest on such loan is discontinued, when (1) the contractual payment of principal or interest has become 90 days past due or (2) management has serious doubts about the further collectability of principal or interest, even though the loan is currently performing. A loan 90 days or more past due may remain on accrual status if it is in the process of collection and is either guaranteed or well-secured. When a loan is placed on nonaccrual status, unpaid interest credited to income is reversed. Interest received on nonaccrual loans including impaired loans is either applied against principal or reported as interest income, according to management’s judgment as to the collectability of principal. Generally, loans are restored to accrual status when both principal and interest are brought current, the loan has performed in accordance with the contractual terms for a reasonable period of time (generally six months), and the ultimate collectability of the total contractual principal and interest is no longer in doubt. The past due status of all classes of loans receivable is determined based on the contractual due dates for loan payments.
Allowance for Loan Losses
The allowance for loan losses represents management’s estimate of losses inherent in the loan portfolio as of the balance sheet date and is recorded as a reduction to loans. The allowance for loan losses is increased by the provision for loan losses, and decreased by charge-offs, net of recoveries. Loans deemed to be uncollectible are charged against the allowance for loan losses, and subsequent recoveries, if any, are credited to the allowance. All, or part, of the principal balance of loans receivable are charged off to the allowance as soon as it is determined that the repayment of all, or part, of the principal balance is highly unlikely. Non-residential consumer loans are generally charged off no later than 120 days past due on a contractual basis, earlier in the event of bankruptcy, or if there is an amount deemed uncollectible. Because all identified losses are immediately charged off, no portion of the allowance for loan losses is restricted to any individual loan or groups of loans, and the entire allowance is available to absorb any and all loan losses.
The allowance for loan losses is maintained at a level considered adequate to provide for losses that can be reasonably anticipated. Management performs a monthly evaluation of the adequacy of the allowance, which is based on the Company’s past loan loss experience, industry peer analysis, known and inherent risks in the portfolio, adverse situations that may affect the borrower’s ability to repay, the estimated value of any underlying collateral, composition of the loan portfolio, current economic conditions, and other relevant factors. This evaluation is inherently subjective as it requires material estimates that may be susceptible to significant revision as more information becomes available.
Donegal Financial Services Corporation
Notes to Consolidated Financial Statements
December 31, 20122013 and 20112012
The allowance for loan losses consists of specific, general and unallocated components. The specific component relates to loans that are classified as impaired. For such loans, an allowance is established when the (i) discounted cash flows, or (ii) collateral value, or (iii) observable market price of the impaired loan is lower than the carrying value of that loan. The general component covers pools of loans by loan class including commercial loans not considered impaired, as well as smaller balance homogeneous loans, such as residential real estate, home equity loans and home equity lines of credit, and other consumer loans. These pools of loans are evaluated for loss exposure based upon historical loss rates for each of these categories of loans, adjusted for relevant qualitative factors. Separate qualitative factor adjustments are made for higher-risk criticized loans that are not impaired.
Qualitative risk factors used by the Company to adjust historical loan loss rates include:
| 1. | Lending policies and procedures including underwriting standards and risk assessment. |
| 2. | Quality of the Company’s credit and collection processes. |
| 3. | National, regional, and local economic and business conditions as well as the condition of various market segments, including the value of underlying collateral for collateral dependent loans. |
| 4. | Nature and volume of the portfolio and terms of loans. |
| 5. | Experience, ability, and depth of lending management and staff. |
| 6. | Volume and severity of past due, classified and nonaccrual loans as well as trends and other loan modifications. |
| 7. | Quality of the Company’s loan review system, and the degree of oversight by the Company’s Board of Directors. |
| 8. | Existence and effect of any concentrations of credit and changes in the level of such concentrations. |
| 9. | Effect of external factors, such as competition and legal and regulatory requirements. |
Each qualitative factor is assigned a value that is added to or deducted from the historical loss rate for separately defined loan pools to reflect improving, stable or declining conditions based on management’s best judgment using relevant information available at the time of the evaluation.
A relatively small component of the allowance for loan losses is an unallocated component which covers uncertainties that could affect management’s estimate of probable losses. The unallocated component reflects the margin of imprecision inherent in the underlying assumptions used in the methodologies for estimating the specific and general loss components in the portfolio.
Donegal Financial Services Corporation
Notes to Consolidated Financial Statements
December 31, 20122013 and 20112012
If, based on current information and events, it is probable that the Company will be unable to collect both the contractual principal and interest payments as scheduled according to a loan’s contractual terms, the loan is considered impaired. However, management determines the significance of payment delays and shortfalls on a case-by-case basis and may judge an insignificant delay or insignificant shortfall in the amount of payments as not reflective of an impairment. For example, a loan is not considered impaired during a period of delay in payment if the Company expects to collect all amounts due including interest accrued at the contractual interest rate for the period of delay.
Measuring impairment of a loan requires judgment and estimates, and the eventual outcomes may differ from those estimates. When the Company determines that a loan is impaired, the Company measures impairment based on the present value of expected future cash flows, or based upon a loan’s observable market price, or based upon the fair value of collateral if the loan is collateral dependent. When the Company uses the fair value of collateral to measure impairment where some or all of the repayment of the loan is dependent upon the liquidation of the collateral, the fair value of the collateral shall be adjusted by the estimated costs of liquidation.
For commercial loans secured by real estate, estimated fair values are determined primarily through third-party appraisals. When a real estate secured loan becomes impaired, a decision is made regarding whether an updated appraisal of the real estate is necessary. This decision is based on various considerations, including the age of the most recent appraisal, the loan-to-value ratio based on the original appraisal and the condition of the property. Appraised values are discounted to arrive at the estimated selling price of the collateral, which is considered to be the estimated fair value. The discounts also include estimated costs to sell the property.
For commercial loans secured by non-real estate collateral, such as accounts receivable, inventory and equipment, estimated fair values are determined based on the borrower’s financial statements, inventory reports, accounts receivable agings or equipment appraisals or invoices. Indications of value from these sources are generally discounted based on the age of the financial information or the quality of the assets.
Large groups of smaller balance homogeneous loans are collectively evaluated for impairment. Accordingly, the Company does not separately identify individual residential mortgage loans, home equity loans and other consumer loans for impairment disclosures, unless such loans are associated with a commercial relationship or the subject of a troubled debt restructuring agreement.
Loans whose terms are modified are classified as troubled debt restructurings if the Company grants such borrowers concessions and it is deemed that those borrowers are experiencing financial difficulty. Concessions granted under a troubled debt restructuring generally involve a temporary reduction in interest rate or an extension of a loan’s stated maturity date. Non-accrual troubled debt restructurings are restored to accrual status if principal and interest payments, under the modified terms, are current for six consecutive months after modification.
Donegal Financial Services Corporation
Notes to Consolidated Financial Statements
December 31, 20122013 and 20112012
The allowance calculation methodology includes further segregation of loan pools into risk rating categories. The borrower’s overall financial condition, repayment sources, guarantors and value of collateral, if appropriate, are evaluated annually for commercial loans or when credit deficiencies arise, such as delinquent loan payments, for commercial and consumer loans. Credit quality risk ratings include regulatory classifications of special mention, substandard, doubtful and loss. Loans criticized as special mention have potential weaknesses that deserve management’s close attention. If uncorrected, the potential weaknesses may result in deterioration of the repayment prospects. Loans classified substandard have a well-defined weakness or weaknesses that jeopardize the liquidation of the debt. They include loans that are inadequately protected by the current sound net worth and paying capacity of the obligor or of the collateral pledged, if any. Loans classified doubtful have all the weaknesses inherent in loans classified substandard with the added characteristic that collection or liquidation in full, on the basis of current conditions and facts, is highly improbable. Loans classified as a loss are considered uncollectible and are charged off against the allowance for loan losses. Loans not criticized are rated pass.
In addition, Federal regulatory agencies, as an integral part of their examination process, periodically review the Company’s allowance for loan losses and may require the Company to recognize additions to or charge-offs against the allowance based on their judgments about information available to them at the time of their examination, which may not be currently available to management.
Based on management’s comprehensive analysis of the loan portfolio, management believes the current level of the allowance for loan losses is adequate.
Reserve for Unfunded Lending Commitments -The reserve for unfunded lending commitments represents management’s estimate of losses inherent in its unfunded loan commitments and is recorded in other liabilities on the balance sheet. The Company had a reserve of $125,000 as of December 31, 2013 and $129,000 as of December 31, 2012 and $124,000 as of December 31, 2011.2012.
Acquired Loans
Loans that we acquire in connection with acquisitions are recorded at fair value with no carryover of the related allowance for loan losses. Fair value of the loans involves estimating the amount and timing of principal and interest cash flows expected to be collected on the loans and discounting those cash flows at a market rate of interest.
The excess of cash flows expected at acquisition over the estimated fair value is referred to as the accretable discount and is recognized into interest income over the remaining life of the loan. The difference between contractually required payments at acquisition and the cash flows expected to be collected at acquisition is referred to as the nonaccretable discount. The nonaccretable discount includes estimated future credit losses expected to be incurred over the life of the loan. Subsequent decreases to the expected cash flows will require us to evaluate the need for an additional allowance for credit losses. Subsequent improvement in expected cash flows will result in the reversal of a corresponding amount of the nonaccretable discount which we will then reclassify as accretable discount that will be recognized into interest income over the remaining life of the loan.
Donegal Financial Services Corporation
Notes to Consolidated Financial Statements
December 31, 20122013 and 20112012
Acquired loans that met the criteria for impaired or nonaccrual of interest prior to the acquisition may be considered performing upon acquisition, regardless of whether the customer is contractually delinquent if we expect to fully collect the new carrying value (i.e. fair value) of the loans. As such, we may no longer consider the loan to be nonaccrual or nonperforming and may accrue interest on these loans, including the impact of any accretable discount. In addition, charge-offs on such loans would be first applied to the nonaccretable difference portion of the fair value adjustment.
Loans acquired through business combinations that do not meet the specific criteria of Accounting Standards Codification (“ASC”) 310-30, but for which a discount is attributable at least in part to credit quality, are also accounted for in accordance with this guidance. As a result, related discounts are recognized subsequently through accretion based on the contractual cash flows of the acquired loans.
Business Combinations and Core Deposit Intangible
We account for our merger and acquisitions using the acquisition accounting method. Acquisition accounting requires the total purchase price to be allocated to the estimated fair values of assets acquired and liabilities assumed, including certain intangible assets that must be recognized. Typically, this allocation results in the purchase price exceeding the fair value of net assets acquired, which is recorded as goodwill. Core deposit intangibles are a measure of the value of checking, money market and savings deposits acquired in business combinations accounted for under the purchase method. Core deposit intangibles are being amortized over the sum of year’s digits. We complete an annual impairment test for goodwill and other intangible assets. Identifiable intangible assets are evaluated for impairment if events and circumstances indicate a possible impairment. There can be no assurance that future goodwill impairment tests will not result in a charge to earnings.
Goodwill
Goodwill represents the excess of the purchase price over the underlying fair value of merged entities. We assess goodwill for impairment annually as of October 1 of each year. If certain events occur which indicate goodwill might be impaired between annual tests, goodwill must be tested when such events occur. In making this assessment, we consider a number of factors including operating results, business plans, economic projections, anticipated future cash flows, current market data, etc. There are inherent uncertainties related to these factors and our judgment in applying them to the analysis of goodwill impairment. Changes in economic and operating conditions could result in goodwill impairment in future periods. The Company did not identify any impairment on its outstanding goodwill from its most recent testing which was performed as of October 1, 2012.2013. Goodwill was evaluated in accordance with ASC 350-20 using a qualitative analysis.
Transfers of Financial Assets
Transfers of financial assets, including loan and loan participation sales, are accounted for as sales, when control over the assets has been surrendered. Control over transferred assets is deemed to be surrendered when (1) the assets have been isolated from the Company, (2) the transferee obtains the right (free of conditions that constrain it from taking advantage of that right) to pledge or exchange the transferred assets, and (3) the Company does not maintain effective control over the transferred assets through an agreement to repurchase them before their maturity.
Donegal Financial Services Corporation
Notes to Consolidated Financial Statements
December 31, 20122013 and 20112012
Property and Equipment
Buildings and improvements, leasehold improvements, and furniture, fixtures and equipment are stated at cost less accumulated depreciation. Depreciation is computed on the straight-line method over the assets’ estimated useful lives.
Restricted Investment in Bank Stock
Federal law requires a member institution of the Federal Home Loan Bank system to hold stock of its district Federal Home Loan Bank according to a predetermined formula. This restricted stock is carried at cost.
Management evaluates the restricted stock for impairment in accordance with ASC 942,Financial Services - Depository and Lending. Management’s determination of whether these investments are impaired is based on their assessment of the ultimate recoverability of their cost rather than by recognizing temporary declines in value. The determination of whether a decline affects the ultimate recoverability of their cost is influenced by criteria such as (1) the significance of the decline in net assets of the FHLB as compared to the capital stock amount for the FHLB and the length of time this situation has persisted, (2) commitments by the FHLB to make payments required by law or regulation and the level of such payments in relation to the operating performance of the FHLB, and (3) the impact of legislative and regulatory changes on institutions and, accordingly, on the customer base of the FHLB.
Management believes no impairment charge was necessary related to the FHLB restricted stock in 2013, 2012 2011 or 2010.2011.
Bank-Owned Life Insurance
The Company invests in bank-owned life insurance (“BOLI”) as a source of funding for employee benefit expenses. BOLI involves the purchase of life insurance by the Company on a chosen group of employees. The Company is the owner and is a joint or sole beneficiary of the policies. This life insurance investment is carried as an asset at the cash surrender value of the underlying policies. Income from the increase in cash surrender value of the policies and income from the realization of death benefits is reflected in non-interestother income.
ASC Topic 715,Compensation - Retirement Benefits, requires the recognition of a liability related to the postretirement benefits covered by an endorsement split-dollar life insurance arrangement. The Company has certain split-dollar life insurance arrangements as part of the Company’s bank-owned life insurance program, and recognized its liability and related compensation expense in accordance with ASC Topic 715. Compensation expense related to this split-dollar life insurance was $30,000, $43,000 $16,000, and $-0-$16,000 for the years ended December 31, 2013, 2012 and 2011, and 2010, respectively.
Donegal Financial Services Corporation
Notes to Consolidated Financial Statements
December 31, 20122013 and 20112012
Mortgage Servicing Rights
Mortgage servicing rights are recognized as assets upon the sale of a mortgage loan. A portion of the cost of the loan is allocated to the servicing right based upon relative fair value. The fair value of servicing rights is based on the present value of estimated future cash flows for pools of mortgages sold stratified by rate and maturity date. Assumptions that are incorporated in the valuation of servicing rights include assumptions about prepayment speeds on mortgages and the cost to service loans. Servicing rights are reported in intangible assets and are amortized over the estimated period of future servicing income to be received on the underlying mortgage loans. The carrying amount of mortgage servicing rights was $109,000$76,000 and $150,000$109,000 at December 31, 2013 and 2012, and 2011.respectively. Any related amortization expense is netted against loan servicing fee income and is reflected in the income statement in other non-interest income. Amortization expense was $33,000, $42,000 and $22,000 and $-0- atfor the years ended December 31, 2013, 2012 2011, and 2010,2011, respectively. Servicing rights are evaluated for impairment based upon estimated fair value as compared to unamortized book value.
The Company retains the servicing rights on certain mortgage loans sold to the FHLB and receives mortgage banking fee income based upon the principal balance outstanding. Total loans serviced for the FHLB amounted to $10,858,000$7,614,000 and $15,042,000$10,858,000 at December 31, 2013 and 2012, and 2011.respectively. These mortgage loans sold to the FHLB and serviced by the Company are not reflected in the balance sheet.
Other Real Estate Owned
Other real estate owned (“OREO”) includes assets acquired through foreclosure, deed in-lieu of foreclosure, and loans identified as in-substance foreclosures. A loan is classified as an in-substance foreclosure when effective control of the real estate collateral has been taken prior to completion of formal foreclosure proceedings. OREO is held for sale and is recorded at fair value less estimated costs to sell. Net costs to maintain OREO and subsequent net losses or gains attributable to OREO liquidations are included in the income statement in other expense as realized. No depreciation or amortization expense is recognized.
Advertising Costs
The Company follows the policy of charging the costs of advertising to expense as incurred.
Income Taxes
The Company accounts for income taxes in accordance with income tax accounting guidance (ASC 740,Income Taxes).
The income tax accounting guidance results in two components of income tax expense: current and deferred. Current income tax expense reflects taxes to be paid or refunded for the current period by applying the provisions of the enacted tax law to the taxable income or excess of deductions over revenues. The Company determines deferred income taxes using the liability (or balance sheet) method. Under this method, the net deferred tax asset or liability is based on the tax effects of the differences between the book and tax bases of assets and liabilities, and enacted changes in tax rates and laws are recognized in the period in which they occur.
Donegal Financial Services Corporation
Notes to Consolidated Financial Statements
December 31, 20122013 and 20112012
Deferred income tax expense results from changes in deferred tax assets and liabilities between periods. Deferred tax assets are reduced by a valuation allowance if, based on the weight of evidence available, it is more likely than not that some portion or all of a deferred tax asset will not be realized.
Uncertain tax positions are recognized if it is more likely than not, based on the technical merits, that the tax position will be realized or sustained upon examination. The term more likely than not means a likelihood of more than 50 percent; the terms examined and upon examination also include resolution of the related appeals or litigation processes, if any. A tax position that meets the more-likely-than-not recognition threshold is initially and subsequently measured as the largest amount of tax benefit that has a greater than 50 percent likelihood of being realized upon settlement with a taxing authority that has full knowledge of all relevant information. The determination of whether or not a tax position has met the more-likely-than-not recognition threshold considers the facts, circumstances, and information available at the reporting date and is subject to management’s judgment.
The Company recognizes interest and penalties on income taxes as a component of income tax expense. Tax years subject to examination by tax authorities are the years ended December 31, 2012, 2011 2010, and 2009.2010.
Off-Balance Sheet Financial Instruments
In the ordinary course of business, the Company has entered into off-balance sheet financial instruments consisting of commitments to extend credit. Such financial instruments are recorded in the consolidated balance sheet when they are funded.
Subsequent Events
The Company has evaluated events and transactions occurring subsequent to the consolidated balance sheet date of December 31, 20122013 for items that should potentially be recognized or disclosed in these consolidated financial statements. The evaluation was conducted through March 8, 2013,7, 2014, the date these consolidated financial statements were available to be issued.
Reclassifications
Certain amounts in the 2011 and 2010 consolidated financial statements have been reclassified to conform to the 2012 presentation. Such reclassifications had no impact on net income.
| 2. | Merger |
On May 6, 2011, Donegal Financial Services Corporation, the parent company of Province Bank, FSB, merged with Union National Financial Corporation, the parent company of Union National Community Bank, with Donegal Financial Services Corporation as the surviving entity. As part of the transaction, Union National Community Bank merged with and into Province Bank, FSB. The merged Bank is operating under the new name Union Community Bank, FSB.Bank.
Donegal Financial Services Corporation
Notes to Consolidated Financial Statements
December 31, 20122013 and 20112012
The assets and liabilities of Union National Community Bank and Union National Financial Corporation were recorded on the consolidated balance sheet at their estimated fair value as of May 6, 2011, and their results of operations have been included in the consolidated income statement since such date.
Included in the purchase price was goodwill and core deposit intangible of $901,000 and $1,738,000, respectively. The core deposit intangible will be amortized over a ten-year period using a sum of the year’s digits basis. The goodwill will not be amortized, but will be measured annually for impairment. Core deposit intangible amortization expense of $271,000, $306,000 and $223,000 was recorded in 2013, 2012 and 2011.2011, respectively. Intangible amortization expense projected for the succeeding five years beginning 20132014 is estimated to be $271,000, $237,000, $203,000, $168,000, $134,000 and $134,000$99,000 per year, respectively, and $196,000$97,000 in total for years after 2017.2018.
The allocation of the purchase price follows (in thousands):
Cash from Donegal Group Inc. | $ | 12,176 | ||
Cash from Donegal Mutual Insurance Company | 3,139 | |||
Value of 248,999 shares of Union National Financial Corporation common stock contributed by Donegal Mutual Insurance Company | 2,054 | |||
Value of 600,000 shares of Donegal Group Inc. Class A common stock contributed by Donegal Mutual Insurance Company | 7,880 | |||
|
| |||
Total cost of acquisition | 25,249 | |||
|
| |||
Union National Financial Corporation net assets acquired: | ||||
Shareholders’ equity | 29,306 | |||
|
| |||
Estimated adjustments to reflect assets acquired and liabilities assumed at fair value: | ||||
Total fair value adjustments | (7,511 | ) | ||
Associated deferred income taxes | 2,553 | |||
|
| |||
Fair value adjustment to net assets acquired, net of tax | (4,958 | ) | ||
|
| |||
Total Union National Financial Corporation net assets acquired | 24,348 | |||
|
| |||
Goodwill resulting from the merger | $ | 901 | ||
|
| |||
Donegal Financial Services Corporation
Notes to Consolidated Financial Statements
December 31, 20122013 and 20112012
The following table summarizes the estimated fair value of the assets acquired (in thousands):
Total purchase price | $ | 25,249 | ||
|
| |||
Net assets acquired: | ||||
Cash and due from banks | 79,162 | |||
Securities available-for-sale | 33,391 | |||
Loans | 291,903 | |||
Property and equipment | 12,588 | |||
Restricted investment in bank stocks | 3,257 | |||
Bank-owned life insurance | 11,909 | |||
Core deposit intangible | 1,738 | |||
Accrued interest receivable | 1,529 | |||
Deferred tax asset | 7,354 | |||
Other assets | 5,483 | |||
Non-interest bearing deposits | (72,841 | ) | ||
Interest-bearing deposits | (328,844 | ) | ||
Borrowings | (11,353 | ) | ||
Junior subordinated debentures | (7,045 | ) | ||
Other liabilities | (3,883 | ) | ||
|
| |||
| 24,348 | ||||
|
| |||
Goodwill | $ | 901 | ||
|
| |||
The fair value of the financial assets acquired included loans receivable with a gross amortized cost basis of $316,448,000. The table below illustrates the fair value adjustments made to the amortized costs basis in order to present a fair value of the loans acquired (in thousands).
Gross amortized costs basis at May 6, 2011 | $ | 316,448 | ||
Market rate adjustment | (4,178 | ) | ||
Credit fair value adjustment on pools of homogeneous loans | (9,118 | ) | ||
Credit fair value adjustment on distressed loans | (11,249 | ) | ||
|
| |||
Fair value of purchased loans at May 6, 2011 | $ | 291,903 | ||
|
| |||
The market rate adjustment represents the movement in market interest rates, irrespective of credit adjustments, compared to the stated rates of the acquired loans. The credit adjustment made on pools of homogeneous loans represents the changes in credit quality of the underlying borrowers from the loan inception to the acquisition date. The credit adjustment on distressed loans is derived in accordance with ASC 310-30-30 and represents the portion of the loan balance that has been deemed uncollectible based on our expectations of future cash flows for each respective loan.
Donegal Financial Services Corporation
Notes to Consolidated Financial Statements
December 31, 20122013 and 20112012
Information about the acquired Union National Financial Corporation distressed loan portfolio as of May 6, 2011 is as follows (in thousands):
Contractually required principal and interest at acquisition | $ | 23,871 | ||
Contractual cash flows not expected to be collected (nonaccretable discount) | (9,613 | ) | ||
|
| |||
Expected cash flows at acquisition | 14,258 | |||
Interest component of expected cash flows (accretable discount) | (1,636 | ) | ||
|
| |||
Fair value of acquired loans | $ | 12,622 | ||
|
| |||
ASC 805 allows adjustments to the goodwill calculation based on new information obtained during the measurement period. As a result of this guidance, the Company identified a $539,000 adjustment to the deferred tax asset during the measurement period, which resulted in a decrease of goodwill of $539,000, and an increase in deferred tax assets which has been reflected in the 2011 consolidated financial statements.
| 3. | Restrictions on Cash and Cash Equivalents |
The Company is required to maintain cash reserve balances for the Federal Reserve Bank. The total required reserve balances were $8,444,000$9,257,000 and $9,040,000$8,444,000 as of December 31, 20122013 and 2011,2012, respectively.
| 4. | Securities Available-for-Sale |
The amortized cost, related fair value and unrealized gains and losses of securities available-for-sale are as follows at December 31, 20122013 and 20112012 (in thousands):
| 2012 | 2013 | |||||||||||||||||||||||||||||||
| Amortized Cost | Gross Unrealized Gains | Gross Unrealized Losses | Fair Value | Amortized Cost | Gross Unrealized Gains | Gross Unrealized Losses | Fair Value | |||||||||||||||||||||||||
U.S. treasuries | $ | 3,014 | $ | 2 | $ | (14 | ) | $ | 3,002 | $ | 7,489 | $ | — | $ | (596 | ) | $ | 6,893 | ||||||||||||||
U.S. government agencies securities | 16,521 | 223 | (39 | ) | 16,705 | 13,025 | — | (713 | ) | 12,312 | ||||||||||||||||||||||
Corporate debt securities | 9,550 | 334 | (14 | ) | 9,870 | 3,174 | 57 | (118 | ) | 3,113 | ||||||||||||||||||||||
Tax-free municipal securities | 42,111 | 1,472 | (249 | ) | 43,334 | 42,593 | 372 | (3,537 | ) | 39,428 | ||||||||||||||||||||||
Taxable municipal securities | 3,347 | 494 | — | 3,841 | 2,839 | 167 | — | 3,006 | ||||||||||||||||||||||||
U.S. government sponsored enterprise mortgage-backed securities | 69,525 | 1,525 | (36 | ) | 71,014 | 78,808 | 276 | (2,944 | ) | 76,140 | ||||||||||||||||||||||
Equity securities | 291 | — | — | 291 | 291 | — | — | 291 | ||||||||||||||||||||||||
|
|
|
|
|
|
|
| |||||||||||||||||||||||||
| $ | 144,359 | $ | 4,050 | $ | (352 | ) | $ | 148,057 | $ | 148,219 | $ | 872 | $ | (7,908 | ) | $ | 141,183 | |||||||||||||||
|
|
|
|
|
|
|
| |||||||||||||||||||||||||
Donegal Financial Services Corporation
Notes to Consolidated Financial Statements
December 31, 20122013 and 20112012
| 2011 | 2012 | |||||||||||||||||||||||||||||||
| Amortized Cost | Gross Unrealized Gains | Gross Unrealized Losses | Fair Value | Amortized Cost | Gross Unrealized Gains | Gross Unrealized Losses | Fair Value | |||||||||||||||||||||||||
U.S. treasuries | $ | 6,115 | $ | 126 | $ | — | $ | 6,241 | $ | 3,014 | $ | 2 | $ | (14 | ) | $ | 3,002 | |||||||||||||||
U.S. government agencies securities | 10,607 | 163 | (2 | ) | 10,768 | 16,521 | 223 | (39 | ) | 16,705 | ||||||||||||||||||||||
Corporate debt securities | 4,831 | 50 | (7 | ) | 4,874 | 9,550 | 334 | (14 | ) | 9,870 | ||||||||||||||||||||||
Tax-free municipal securities | 19,585 | 1,123 | (3 | ) | 20,705 | 42,111 | 1,472 | (249 | ) | 43,334 | ||||||||||||||||||||||
Taxable municipal securities | 3,350 | 355 | — | 3,705 | 3,347 | 494 | — | 3,841 | ||||||||||||||||||||||||
U.S. government sponsored enterprise mortgage-backed securities | 48,813 | 1,224 | (2 | ) | 50,035 | 69,525 | 1,525 | (36 | ) | 71,014 | ||||||||||||||||||||||
Equity securities | 41 | — | — | 41 | 291 | — | — | 291 | ||||||||||||||||||||||||
|
|
|
|
|
|
|
| |||||||||||||||||||||||||
| $ | 93,342 | $ | 3,041 | $ | (14 | ) | $ | 96,369 | $ | 144,359 | $ | 4,050 | $ | (352 | ) | $ | 148,057 | |||||||||||||||
|
|
|
|
|
|
|
| |||||||||||||||||||||||||
Certain obligations of the U.S. Government are pledged to secure public deposits and for other purposes as required or permitted by law. The carrying value of the pledged assets was $35,305,000$35,406,000 and $35,219,000$35,305,000 at December 31, 20122013 and 2011,2012, respectively.
The amortized cost and fair value of securities as of December 31, 2012,2013, by contractual maturity, are shown below. Expected maturities may differ from contractual maturities because the securities may be called or prepaid with or without any penalty (in thousands).
| Amortized Cost | Fair Value | Amortized Cost | Fair Value | |||||||||||||
Due in one year or less | $ | 2,012 | $ | 2,040 | $ | 501 | $ | 512 | ||||||||
Due after one year through five years | 5,353 | 5,534 | 2,322 | 2,347 | ||||||||||||
Due after five years through ten years | 25,409 | 25,936 | 23,312 | 21,944 | ||||||||||||
Due after ten years | 41,769 | 43,242 | 42,985 | 39,949 | ||||||||||||
U.S. government sponsored enterprise mortgage-backed securities | 69,525 | 71,014 | 78,808 | 76,140 | ||||||||||||
Equity securities | 291 | 291 | 291 | 291 | ||||||||||||
|
|
|
| |||||||||||||
| $ | 144,359 | $ | 148,057 | $ | 148,219 | $ | 141,183 | |||||||||
|
|
|
| |||||||||||||
Donegal Financial Services Corporation
Notes to Consolidated Financial Statements
December 31, 20122013 and 20112012
The following table shows the Company’s investments’ gross unrealized losses and fair value, aggregated by investment category and length of time that individual securities have been in a continuous unrealized loss position at December 31, 20122013 and 20112012 (in thousands):
| 2012 | 2013 | |||||||||||||||||||||||||||||||||||||||||||||||
| Less than 12 Months | 12 Months or More | Total | Less than 12 Months | 12 Months or More | Total | |||||||||||||||||||||||||||||||||||||||||||
| Fair Value | Unrealized Losses | Fair Value | Unrealized Losses | Fair Value | Unrealized Losses | Fair Value | Unrealized Losses | Fair Value | Unrealized Losses | Fair Value | Unrealized Losses | |||||||||||||||||||||||||||||||||||||
U.S. treasuries | $ | 1,998 | $ | (14 | ) | $ | — | $ | — | $ | 1,998 | $ | (14 | ) | $ | 6,893 | $ | (596 | ) | $ | — | $ | — | $ | 6,893 | $ | (596 | ) | ||||||||||||||||||||
U.S. government agencies securities | 4,740 | (39 | ) | — | — | 4,740 | (39 | ) | 11,612 | (662 | ) | 699 | (51 | ) | 12,311 | (713 | ) | |||||||||||||||||||||||||||||||
Corporate debt securities | 1,844 | (14 | ) | — | — | 1,844 | (14 | ) | 1,733 | (118 | ) | — | — | 1,733 | (118 | ) | ||||||||||||||||||||||||||||||||
Tax-free municipal securities | 9,713 | (249 | ) | — | — | 9,713 | (249 | ) | 27,153 | (2,557 | ) | 4,746 | (980 | ) | 31,899 | (3,537 | ) | |||||||||||||||||||||||||||||||
U.S. government sponsored enterprise mortgage-backed securities | 10,151 | (36 | ) | — | — | 10,151 | (36 | ) | 55,721 | (2,498 | ) | 5,223 | (446 | ) | 60,944 | (2,944 | ) | |||||||||||||||||||||||||||||||
|
|
|
|
|
|
|
|
|
|
|
| |||||||||||||||||||||||||||||||||||||
| $ | 28,446 | $ | (352 | ) | $ | — | $ | — | $ | 28,446 | $ | (352 | ) | $ | 103,112 | $ | (6,431 | ) | $ | 10,668 | $ | (1,477 | ) | $ | 113,780 | $ | (7,908 | ) | ||||||||||||||||||||
|
|
|
|
|
|
|
|
|
|
|
| |||||||||||||||||||||||||||||||||||||
| 2011 | 2012 | |||||||||||||||||||||||||||||||||||||||||||||||
| Less than 12 Months | 12 Months or More | Total | Less than 12 Months | 12 Months or More | Total | |||||||||||||||||||||||||||||||||||||||||||
| Fair Value | Unrealized Losses | Fair Value | Unrealized Losses | Fair Value | Unrealized Losses | Fair Value | Unrealized Losses | Fair Value | Unrealized Losses | Fair Value | Unrealized Losses | |||||||||||||||||||||||||||||||||||||
U.S. treasuries | $ | 1,998 | $ | (14 | ) | $ | — | $ | — | $ | 1,998 | $ | (14 | ) | ||||||||||||||||||||||||||||||||||
U.S. government agencies securities | $ | 748 | $ | (2 | ) | $ | — | $ | — | $ | 748 | $ | (2 | ) | 4,740 | (39 | ) | — | — | 4,740 | (39 | ) | ||||||||||||||||||||||||||
Corporate debt securities | 1,893 | (7 | ) | — | — | 1,893 | (7 | ) | 1,844 | (14 | ) | — | — | 1,844 | (14 | ) | ||||||||||||||||||||||||||||||||
Tax-free municipal securities | 551 | (3 | ) | — | — | 551 | (3 | ) | 9,713 | (249 | ) | — | — | 9,713 | (249 | ) | ||||||||||||||||||||||||||||||||
U.S. government sponsored enterprise mortgage-backed securities | 945 | (2 | ) | — | — | 945 | (2 | ) | 10,151 | (36 | ) | — | — | 10,151 | (36 | ) | ||||||||||||||||||||||||||||||||
|
|
|
|
|
|
|
|
|
|
|
| |||||||||||||||||||||||||||||||||||||
| $ | 4,137 | $ | (14 | ) | $ | — | $ | — | $ | 4,137 | $ | (14 | ) | $ | 28,446 | $ | (352 | ) | $ | — | $ | — | $ | 28,446 | $ | (352 | ) | |||||||||||||||||||||
|
|
|
|
|
|
|
|
|
|
|
| |||||||||||||||||||||||||||||||||||||
The Company has 25At December 31, 2013, five available for sale U.S. treasury securities had unrealized losses and 5have not been in a continuous loss position for 12 months or more. These unrealized losses relate principally to changes in interest rates subsequent to the acquisition of specific securities. None of the securities in anthis category had a fair value significantly below their amortized cost.
At December 31, 2013, ten available for sale U.S. government and agency securities had unrealized losses. Nine of the ten securities have not been in a continuous loss position atfor 12 months or more. One security has been in a continuous loss position for more than 12 months. None of the securities in this category had a fair value significantly below their amortized cost. These unrealized losses relate principally to changes in interest rates subsequent to the acquisition of specific securities.
Donegal Financial Services Corporation
Notes to Consolidated Financial Statements
December 31, 2013 and 2012
At December 31, 2013, three available for sale corporate debt securities had unrealized losses and have not been in a continuous loss position for 12 months or more. These unrealized losses relate principally to changes in interest rates subsequent to the acquisition of specific securities. None of the securities in this category had a fair value significantly below their amortized cost.
At December 31, 2013, fifty-three available for sale municipal securities had unrealized losses. Forty-six of the fifty-three securities have not been in a continuous loss position for 12 months or more. Seven securities have been in a continuous loss position for more than 12 months. None of the securities in this category had a fair value significantly below their amortized cost. These unrealized losses relate principally to changes in interest rates subsequent to the acquisition of specific securities.
At December 31, 2013, twenty-nine available for sale U.S. government sponsored enterprise mortgage-backed securities had unrealized losses. Twenty-seven of the twenty-nine securities have not been in a continuous loss position for 12 months or more. Two securities have been in a continuous loss position for more than 12 months. None of the securities in this category had a fair value significantly below their amortized cost. These unrealized losses relate principally to changes in interest rates subsequent to the acquisition of specific securities.
At December 31, 2012, two available for sale U.S. treasury securities had unrealized losses and 2011, respectively. have not been in a continuous loss position for 12 months or more. These unrealized losses relate principally to changes in interest rates subsequent to the acquisition of specific securities. None of the securities in this category had a fair value significantly below their amortized cost.
At December 31, 2012, five available for sale U.S. government and agency securities had unrealized losses and have not been in a continuous loss position for 12 months or more. These unrealized losses relate principally to changes in interest rates subsequent to the acquisition of specific securities. None of the securities in this category had a fair value significantly below their amortized cost.
At December 31, 2012, two available for sale corporate debt securities had unrealized losses and have not been in a continuous loss position for 12 months or more. These unrealized losses relate principally to changes in interest rates subsequent to the acquisition of specific securities. None of the securities in this category had a fair value significantly below their amortized cost.
At December 31, 2012, thirteen available for sale municipal securities had unrealized losses and have not been in a continuous loss position for 12 months or more. These unrealized losses relate principally to changes in interest rates subsequent to the acquisition of specific securities. None of the securities in this category had a fair value significantly below their amortized cost.
At December 31, 2012, three available for sale U.S. government sponsored enterprise mortgage-backed securities had unrealized losses and have not been in a continuous loss position for 12 months or more. These unrealized losses relate principally to changes in interest rates subsequent to the acquisition of specific securities. None of the securities in this category had a fair value significantly below their amortized cost.
Donegal Financial Services Corporation
Notes to Consolidated Financial Statements
December 31, 2013 and 2012
Unrealized losses on these securities have not been recognized into earnings because the issuers of the securities are of high credit quality, management has the ability and intent to hold these securities for the foreseeable future and does not believe they will have to sell the securities or be required to sell the securities, and the declines in fair value are largely due to market interest rates and not a result of credit risk. The fair values of these securities are expected to recover as they approach maturity and/or market interest rates fluctuate.
Gross realized losses on securities sold during 2013, 2012 and 2011 totaled $793,000, $3,000 and 2010 totaled $3,000, $34,000, and $-0-, respectively. Gross realized gains on securities sold during 2012, 2011, and 2010 totaled $1,491,000, $1,839,000, and $117,000, respectively.
Donegal Financial Services Corporation
Notes to Consolidated Financial Statements
December 31,2013, 2012 and 2011
| 5. | Loans and Allowance for Loan Losses |
Credit Quality Indicators
The following tables present the classes of the loan portfolio summarized by the aggregate credit risk ratings (special mention, substandard and doubtful) within the Company’s internal risk rating system as of December 31, 20122013 and 20112012 (in thousands):
| 2012 | 2013 | |||||||||||||||||||||||||||||||||||||||
| Pass | Special Mention | Sub-standard | Doubtful | Total | Pass | Special Mention | Sub- standard | Doubtful | Total | |||||||||||||||||||||||||||||||
Commercial loans: | ||||||||||||||||||||||||||||||||||||||||
Real estate secured | $ | 143,752 | $ | 2,695 | $ | 19,603 | $ | — | $ | 166,050 | $ | 148,090 | $ | 1,018 | $ | 10,197 | $ | — | $ | 159,305 | ||||||||||||||||||||
C & I | 23,429 | 191 | 4,182 | — | 27,802 | 19,193 | 570 | 2,423 | — | 22,186 | ||||||||||||||||||||||||||||||
Other | 4,265 | — | — | — | 4,265 | 3,823 | — | — | — | 3,823 | ||||||||||||||||||||||||||||||
Residential mortgage loans | 9,631 | — | 168 | — | 9,799 | 8,036 | — | 177 | — | 8,213 | ||||||||||||||||||||||||||||||
Home equity installments and lines of credit | 81,866 | — | 499 | — | 82,365 | 81,629 | �� | — | 673 | — | 82,302 | |||||||||||||||||||||||||||||
Consumer loans, other | 4,232 | — | 32 | — | 4,264 | 2,769 | — | 38 | — | 2,807 | ||||||||||||||||||||||||||||||
|
|
|
|
|
|
|
|
|
| |||||||||||||||||||||||||||||||
| $ | 267,175 | $ | 2,886 | $ | 24,484 | $ | — | $ | 294,545 | $ | 263,540 | $ | 1,588 | $ | 13,508 | $ | — | $ | 278,636 | |||||||||||||||||||||
|
|
|
|
|
|
|
|
|
| |||||||||||||||||||||||||||||||
| 2011 | 2012 | |||||||||||||||||||||||||||||||||||||||
| Pass | Special Mention | Sub-standard | Doubtful | Total | Pass | Special Mention | Sub- standard | Doubtful | Total | |||||||||||||||||||||||||||||||
Commercial loans: | ||||||||||||||||||||||||||||||||||||||||
Real estate secured | $ | 175,026 | $ | 3,553 | $ | 22,281 | $ | — | $ | 200,860 | $ | 143,752 | $ | 2,695 | $ | 19,603 | $ | — | $ | 166,050 | ||||||||||||||||||||
C & I | 27,544 | 470 | 3,468 | — | 31,482 | 23,429 | 191 | 4,182 | — | 27,802 | ||||||||||||||||||||||||||||||
Other | 8,211 | — | — | — | 8,211 | 4,265 | — | — | — | 4,265 | ||||||||||||||||||||||||||||||
Residential mortgage loans | 12,248 | — | 202 | — | 12,450 | 9,631 | — | 168 | — | 9,799 | ||||||||||||||||||||||||||||||
Home equity installments and lines of credit | 84,607 | — | 289 | — | 84,896 | 81,866 | — | 499 | — | 82,365 | ||||||||||||||||||||||||||||||
Consumer loans, other | 4,997 | — | 24 | — | 5,021 | 4,232 | — | 32 | — | 4,264 | ||||||||||||||||||||||||||||||
|
|
|
|
|
|
|
|
|
| |||||||||||||||||||||||||||||||
| $ | 312,633 | $ | 4,023 | $ | 26,264 | $ | — | $ | 342,920 | $ | 267,175 | $ | 2,886 | $ | 24,484 | $ | — | $ | 294,545 | |||||||||||||||||||||
|
|
|
|
|
|
|
|
|
| |||||||||||||||||||||||||||||||
Donegal Financial Services Corporation
Notes to Consolidated Financial Statements
December 31, 20122013 and 20112012
Loans that are individually and collectively evaluated for impairment, as well as the related allowance for loan loss at December 31, 20122013 and 20112012 are presented below (in thousands):
| 2012 | 2013 | |||||||||||||||||||||||||||||||||||||||||||||||||||||||||||||||
| Total | Individually Evaluated for Impairment | Loans Acquired with Credit Deterioration | Collectively Evaluated for Impairment | Total | Individually Evaluated for Impairment | Loans Acquired with Credit Deterioration | Collectively Evaluated for Impairment | |||||||||||||||||||||||||||||||||||||||||||||||||||||||||
| Unpaid Balance | Allowance for Loan Losses | Unpaid Balance | Allowance for Loan Losses | Unpaid Balance | Allowance for Loan Losses | Unpaid Balance | Allowance for Loan Losses | Unpaid Balance | Allowance for Loan Losses | Unpaid Balance | Allowance for Loan Losses | Unpaid Balance | Allowance for Loan Losses | Unpaid Balance | Allowance for Loan Losses | |||||||||||||||||||||||||||||||||||||||||||||||||
Commercial loans: | ||||||||||||||||||||||||||||||||||||||||||||||||||||||||||||||||
Real estate secured | $ | 166,050 | $ | 2,451 | $ | — | $ | — | $ | — | $ | — | $ | 166,050 | $ | 2,451 | $ | 159,305 | $ | 2,661 | $ | — | $ | — | $ | — | $ | — | $ | 159,305 | $ | 2,661 | ||||||||||||||||||||||||||||||||
C & I | 27,802 | 645 | — | — | — | — | 27,802 | 645 | 22,186 | 447 | — | — | — | — | 22,186 | 447 | ||||||||||||||||||||||||||||||||||||||||||||||||
Other | 4,265 | 29 | — | — | — | — | 4,265 | 29 | 3,823 | 24 | — | — | — | — | 3,823 | 24 | ||||||||||||||||||||||||||||||||||||||||||||||||
Residential mortgage loans | 9,799 | 78 | — | — | — | — | 9,799 | 78 | 8,213 | 62 | — | — | — | — | 8,213 | 62 | ||||||||||||||||||||||||||||||||||||||||||||||||
Home equity installments and lines of credit | 82,365 | 655 | — | — | — | — | 82,365 | 655 | 82,302 | 696 | — | — | — | — | 82,302 | 696 | ||||||||||||||||||||||||||||||||||||||||||||||||
Consumer loans, other | 4,264 | 71 | — | — | — | — | 4,264 | 71 | 2,807 | 44 | — | — | — | — | 2,807 | 44 | ||||||||||||||||||||||||||||||||||||||||||||||||
Unallocated | — | 109 | — | — | — | — | — | 109 | — | 113 | — | — | — | — | — | 113 | ||||||||||||||||||||||||||||||||||||||||||||||||
|
|
|
|
|
|
|
|
|
|
|
|
|
|
|
| |||||||||||||||||||||||||||||||||||||||||||||||||
| $ | 294,545 | $ | 4,038 | $ | — | $ | — | $ | — | $ | — | $ | 294,545 | $ | 4,038 | $ | 278,636 | $ | 4,047 | $ | — | $ | — | $ | — | $ | — | $ | 278,636 | $ | 4,047 | |||||||||||||||||||||||||||||||||
|
|
|
|
|
|
|
|
|
|
|
|
|
|
|
| |||||||||||||||||||||||||||||||||||||||||||||||||
| 2011 | 2012 | |||||||||||||||||||||||||||||||||||||||||||||||||||||||||||||||
| Total | Individually Evaluated for Impairment | Loans Acquired with Credit Deterioration | Collectively Evaluated for Impairment | Total | Individually Evaluated for Impairment | Loans Acquired with Credit Deterioration | Collectively Evaluated for Impairment | |||||||||||||||||||||||||||||||||||||||||||||||||||||||||
| Unpaid Balance | Allowance for Loan Losses | Unpaid Balance | Allowance for Loan Losses | Unpaid Balance | Allowance for Loan Losses | Unpaid Balance | Allowance for Loan Losses | Unpaid Balance | Allowance for Loan Losses | Unpaid Balance | Allowance for Loan Losses | Unpaid Balance | Allowance for Loan Losses | Unpaid Balance | Allowance for Loan Losses | |||||||||||||||||||||||||||||||||||||||||||||||||
Commercial loans: | ||||||||||||||||||||||||||||||||||||||||||||||||||||||||||||||||
Real estate secured | $ | 200,860 | $ | 2,180 | $ | — | $ | — | $ | — | $ | — | $ | 200,860 | $ | 2,180 | $ | 166,050 | $ | 2,451 | $ | — | $ | — | $ | — | $ | — | $ | 166,050 | $ | 2,451 | ||||||||||||||||||||||||||||||||
C & I | 31,482 | 375 | — | — | — | — | 31,482 | 375 | 27,802 | 645 | — | — | — | — | 27,802 | 645 | ||||||||||||||||||||||||||||||||||||||||||||||||
Other | 8,211 | 32 | — | — | — | — | 8,211 | 32 | 4,265 | 29 | — | — | — | — | 4,265 | 29 | ||||||||||||||||||||||||||||||||||||||||||||||||
Residential mortgage loans | 12,450 | 81 | — | — | — | — | 12,450 | 81 | 9,799 | 78 | — | — | — | — | 9,799 | 78 | ||||||||||||||||||||||||||||||||||||||||||||||||
Home equity installments and lines of credit | 84,896 | 609 | — | — | — | — | 84,896 | 609 | 82,365 | 655 | — | — | — | — | 82,365 | 655 | ||||||||||||||||||||||||||||||||||||||||||||||||
Consumer loans, other | 5,021 | 85 | — | — | — | — | 5,021 | 85 | 4,264 | 71 | — | — | — | — | 4,264 | 71 | ||||||||||||||||||||||||||||||||||||||||||||||||
Unallocated | — | 51 | — | — | — | — | — | 51 | — | 109 | — | — | — | — | — | 109 | ||||||||||||||||||||||||||||||||||||||||||||||||
|
|
|
|
|
|
|
|
|
|
|
|
|
|
|
| |||||||||||||||||||||||||||||||||||||||||||||||||
| $ | 342,920 | $ | 3,413 | $ | — | $ | — | $ | — | $ | — | $ | 342,920 | $ | 3,413 | $ | 294,545 | $ | 4,038 | $ | — | $ | — | $ | — | $ | — | $ | 294,545 | $ | 4,038 | |||||||||||||||||||||||||||||||||
|
|
|
|
|
|
|
|
|
|
|
|
|
|
|
| |||||||||||||||||||||||||||||||||||||||||||||||||
Donegal Financial Services Corporation
Notes to Consolidated Financial Statements
December 31, 20122013 and 20112012
The following tables summarize the activity by segments of the allowance for loan losses for the years ended December 31, 2013, 2012 and 2011 (in thousands):
| 2012 | 2013 | |||||||||||||||||||||||||||||||||||||||||||||||||||||||||||||||
| Commercial Loans | Residential Mortgage Loans | Home Equity Installments and Lines of Credit | Consumer Loans, Other | Unallocated | Total | Commercial Loans | Residential Mortgage Loans | Home Equity Installments and Lines of Credit | Consumer Loans, Other | Unallocated | Total | |||||||||||||||||||||||||||||||||||||||||||||||||||||
| Real Estate Secured | C & I | Other | Real Estate Secured | C & I | Other | |||||||||||||||||||||||||||||||||||||||||||||||||||||||||||
Beginning balance, January 1, 2012 | $ | 2,180 | $ | 375 | $ | 32 | $ | 81 | $ | 609 | $ | 85 | $ | 51 | $ | 3,413 | ||||||||||||||||||||||||||||||||||||||||||||||||
Beginning balance, January 1, 2013 | $ | 2,451 | $ | 645 | $ | 29 | $ | 78 | $ | 655 | $ | 71 | $ | 109 | $ | 4,038 | ||||||||||||||||||||||||||||||||||||||||||||||||
Charge-offs | (18 | ) | (18 | ) | — | (19 | ) | (170 | ) | (307 | ) | — | (532 | ) | (4 | ) | (14 | ) | — | (100 | ) | (57 | ) | (50 | ) | — | (225 | ) | ||||||||||||||||||||||||||||||||||||
Recoveries | — | 5 | — | — | 1 | 3 | — | 9 | — | 16 | — | — | 11 | 2 | — | 29 | ||||||||||||||||||||||||||||||||||||||||||||||||
Provisions | 289 | 283 | (3 | ) | 16 | 215 | 290 | 58 | 1,148 | 214 | (200 | ) | (5 | ) | 84 | 87 | 21 | 4 | 205 | |||||||||||||||||||||||||||||||||||||||||||||
|
|
|
|
|
|
|
|
|
|
|
|
|
|
|
| |||||||||||||||||||||||||||||||||||||||||||||||||
Ending balance, December 31, 2012 | $ | 2,451 | $ | 645 | $ | 29 | $ | 78 | $ | 655 | $ | 71 | $ | 109 | $ | 4,038 | ||||||||||||||||||||||||||||||||||||||||||||||||
Ending balance, December 31, 2013 | $ | 2,661 | $ | 447 | $ | 24 | $ | 62 | $ | 696 | $ | 44 | $ | 113 | $ | 4,047 | ||||||||||||||||||||||||||||||||||||||||||||||||
|
|
|
|
|
|
|
|
|
|
|
|
|
|
|
| |||||||||||||||||||||||||||||||||||||||||||||||||
| 2011 | ||||||||||||||||||||||||||||||||
| Commercial Loans | Residential Mortgage Loans | Home Equity Installments and Lines of Credit | Consumer Loans, Other | Unallocated | Total | |||||||||||||||||||||||||||
| Real Estate Secured | C & I | Other | ||||||||||||||||||||||||||||||
Beginning balance, January 1, 2011 | $ | 742 | $ | 54 | $ | — | $ | 77 | $ | 123 | $ | 19 | $ | — | $ | 1,015 | ||||||||||||||||
Charge-offs | (40 | ) | (181 | ) | — | (30 | ) | — | (41 | ) | — | (292 | ) | |||||||||||||||||||
Recoveries | 4 | 45 | — | — | — | — | — | 49 | ||||||||||||||||||||||||
Provisions | 1,474 | 457 | 32 | 34 | 486 | 107 | 51 | 2,641 | ||||||||||||||||||||||||
|
|
|
|
|
|
|
|
|
|
|
|
|
|
|
| |||||||||||||||||
Ending balance, December 31, 2011 | $ | 2,180 | $ | 375 | $ | 32 | $ | 81 | $ | 609 | $ | 85 | $ | 51 | $ | 3,413 | ||||||||||||||||
|
|
|
|
|
|
|
|
|
|
|
|
|
|
|
| |||||||||||||||||
The changes in the allowance for loan losses for the years ended December 31, 2012, 2011 and 2010 are as follows (in thousands):
| 2012 | ||||||||||||||||||||||||||||||||
| Commercial Loans | Residential Mortgage Loans | Home Equity Installments and Lines of Credit | Consumer Loans, Other | Unallocated | Total | |||||||||||||||||||||||||||
| Real Estate Secured | C & I | Other | ||||||||||||||||||||||||||||||
Beginning balance, January 1, 2012 | $ | 2,180 | $ | 375 | $ | 32 | $ | 81 | $ | 609 | $ | 85 | $ | 51 | $ | 3,413 | ||||||||||||||||
Charge-offs | (18 | ) | (18 | ) | — | (19 | ) | (170 | ) | (307 | ) | — | (532 | ) | ||||||||||||||||||
Recoveries | — | 5 | — | — | 1 | 3 | — | 9 | ||||||||||||||||||||||||
Provisions | 289 | 283 | (3 | ) | 16 | 215 | 290 | 58 | 1,148 | |||||||||||||||||||||||
|
|
|
|
|
|
|
|
|
|
|
|
|
|
|
| |||||||||||||||||
Ending balance, December 31, 2012 | $ | 2,451 | $ | 645 | $ | 29 | $ | 78 | $ | 655 | $ | 71 | $ | 109 | $ | 4,038 | ||||||||||||||||
|
|
|
|
|
|
|
|
|
|
|
|
|
|
|
| |||||||||||||||||
| 2012 | 2011 | 2010 | ||||||||||
Balance, beginning | $ | 3,413 | $ | 1,015 | $ | 858 | ||||||
Charge-offs | (532 | ) | (292 | ) | — | |||||||
Recoveries | 9 | 49 | — | |||||||||
Provision for loan losses | 1,148 | 2,641 | 157 | |||||||||
|
|
|
|
|
| |||||||
Balance, ending | $ | 4,038 | $ | 3,413 | $ | 1,015 | ||||||
|
|
|
|
|
| |||||||
| 2011 | ||||||||||||||||||||||||||||||||
| Commercial Loans | Residential Mortgage Loans | Home Equity Installments and Lines of Credit | Consumer Loans, Other | Unallocated | Total | |||||||||||||||||||||||||||
| Real Estate Secured | C & I | Other | ||||||||||||||||||||||||||||||
Beginning balance, January 1, 2011 | $ | 742 | $ | 54 | $ | — | $ | 77 | $ | 123 | $ | 19 | $ | — | $ | 1,015 | ||||||||||||||||
Charge-offs | (40 | ) | (181 | ) | — | (30 | ) | — | (41 | ) | — | (292 | ) | |||||||||||||||||||
Recoveries | 4 | 45 | — | — | — | — | — | 49 | ||||||||||||||||||||||||
Provisions | 1,474 | 457 | 32 | 34 | 486 | 107 | 51 | 2,641 | ||||||||||||||||||||||||
|
|
|
|
|
|
|
|
|
|
|
|
|
|
|
| |||||||||||||||||
Ending balance, December 31, 2011 | $ | 2,180 | $ | 375 | $ | 32 | $ | 81 | $ | 609 | $ | 85 | $ | 51 | $ | 3,413 | ||||||||||||||||
|
|
|
|
|
|
|
|
|
|
|
|
|
|
|
| |||||||||||||||||
Donegal Financial Services Corporation
Notes to Consolidated Financial Statements
December 31, 20122013 and 20112012
The performance and credit quality of the loan portfolio is also monitored by analyzing the age of the loans receivable as determined by the length of time a recorded payment is past due. The following table presents the classes of the loan portfolio summarized by the past due status as of December 31, 20122013 and 20112012 (in thousands):
| 2012 | 2013 | |||||||||||||||||||||||||||||||||||||||||||||||||||||||
| 30-59 Days Past Due | 60-89 Days Past Due | >90 Days Past due | Non- Accrual Loans | Total Past Due and Non- Accrual | Current Loans | Total Loans Receivable | 30-59 Days Past Due | 60-89 Days Past Due | >90 Days Past due | Non-Accrual Loans | Total Past Due and Non-Accrual | Current Loans | Total Loans Receivable | |||||||||||||||||||||||||||||||||||||||||||
Commercial loans: | ||||||||||||||||||||||||||||||||||||||||||||||||||||||||
Real estate secured | $ | 15 | $ | — | $ | 134 | $ | 2,337 | $ | 2,486 | $ | 154,516 | $ | 157,002 | $ | 309 | $ | — | $ | — | $ | 1,325 | $ | 1,634 | $ | 155,085 | $ | 156,719 | ||||||||||||||||||||||||||||
C & I | — | 14 | 2 | 38 | 54 | 26,694 | 26,748 | — | 59 | 16 | 26 | 101 | 21,015 | 21,116 | ||||||||||||||||||||||||||||||||||||||||||
Other | — | — | — | — | — | 4,265 | 4,265 | — | — | — | — | — | 3,823 | 3,823 | ||||||||||||||||||||||||||||||||||||||||||
Acquired with credit deterioration | 359 | 374 | — | 701 | 1,434 | 8,668 | 10,102 | — | — | — | 1,025 | 1,025 | 2,631 | 3,656 | ||||||||||||||||||||||||||||||||||||||||||
Residential mortgage loans: | ||||||||||||||||||||||||||||||||||||||||||||||||||||||||
Residential mortgage loans | 78 | 133 | — | 379 | 590 | 9,151 | 9,741 | 29 | 8 | — | 281 | 318 | 7,832 | 8,150 | ||||||||||||||||||||||||||||||||||||||||||
Acquired with credit deterioration | — | — | — | 58 | 58 | — | 58 | — | — | — | 63 | 63 | — | 63 | ||||||||||||||||||||||||||||||||||||||||||
Home equity loans: | ||||||||||||||||||||||||||||||||||||||||||||||||||||||||
Home equity installments and lines of credit | 220 | 110 | — | 482 | 812 | 81,526 | 82,338 | 207 | 65 | 98 | 631 | 1,001 | 81,262 | 82,263 | ||||||||||||||||||||||||||||||||||||||||||
Acquired with credit deterioration | — | — | — | — | — | 27 | 27 | — | — | — | — | — | 39 | 39 | ||||||||||||||||||||||||||||||||||||||||||
Consumer loans, other | 6 | 18 | 6 | 48 | 78 | 4,186 | 4,264 | 4 | — | 4 | 2 | 10 | 2,797 | 2,807 | ||||||||||||||||||||||||||||||||||||||||||
|
|
|
|
|
|
|
|
|
|
|
|
|
| |||||||||||||||||||||||||||||||||||||||||||
| $ | 678 | $ | 649 | $ | 142 | $ | 4,043 | $ | 5,512 | $ | 289,033 | $ | 294,545 | $ | 549 | $ | 132 | $ | 118 | $ | 3,353 | $ | 4,152 | $ | 274,484 | $ | 278,636 | |||||||||||||||||||||||||||||
|
|
|
|
|
|
|
|
|
|
|
|
|
| |||||||||||||||||||||||||||||||||||||||||||
Donegal Financial Services Corporation
Notes to Consolidated Financial Statements
December 31, 20122013 and 20112012
| 2011 | 2012 | |||||||||||||||||||||||||||||||||||||||||||||||||||||||
| 30-59 Days Past Due | 60-89 Days Past Due | >90 Days Past due | Non- Accrual Loans | Total Past Due and Non- Accrual | Current Loans | Total Loans Receivable | 30-59 Days Past Due | 60-89 Days Past Due | >90 Days Past due | Non-Accrual Loans | Total Past Due and Non-Accrual | Current Loans | Total Loans Receivable | |||||||||||||||||||||||||||||||||||||||||||
Commercial loans: | ||||||||||||||||||||||||||||||||||||||||||||||||||||||||
Real estate secured | $ | 189 | $ | 369 | $ | 308 | $ | 2,009 | $ | 2,875 | $ | 188,383 | $ | 191,258 | $ | 15 | $ | — | $ | 134 | $ | 2,337 | $ | 2,486 | $ | 154,516 | $ | 157,002 | ||||||||||||||||||||||||||||
C & I | — | 13 | 90 | 108 | 211 | 30,291 | 30,502 | — | 14 | 2 | 38 | 54 | 26,694 | 26,748 | ||||||||||||||||||||||||||||||||||||||||||
Other | — | — | — | — | — | 8,211 | 8,211 | — | — | — | — | — | 4,265 | 4,265 | ||||||||||||||||||||||||||||||||||||||||||
Acquired with credit deterioration | — | 82 | 345 | 1,374 | 1,801 | 8,781 | 10,582 | 359 | 374 | — | 701 | 1,434 | 8,668 | 10,102 | ||||||||||||||||||||||||||||||||||||||||||
Residential mortgage loans: | ||||||||||||||||||||||||||||||||||||||||||||||||||||||||
Residential mortgage loans | 66 | 32 | — | 1,185 | 1,283 | 11,123 | 12,406 | 78 | 133 | — | 379 | 590 | 9,151 | 9,741 | ||||||||||||||||||||||||||||||||||||||||||
Acquired with credit deterioration | — | — | — | — | — | 44 | 44 | — | — | — | 58 | 58 | — | 58 | ||||||||||||||||||||||||||||||||||||||||||
Home equity loans: | ||||||||||||||||||||||||||||||||||||||||||||||||||||||||
Home equity installments and lines of credit | 939 | 85 | 42 | 427 | 1,493 | 83,376 | 84,869 | 220 | 110 | — | 482 | 812 | 81,526 | 82,338 | ||||||||||||||||||||||||||||||||||||||||||
Acquired with credit deterioration | — | — | — | — | — | 27 | 27 | — | — | — | — | — | 27 | 27 | ||||||||||||||||||||||||||||||||||||||||||
Consumer loans, other | 177 | 317 | 4 | — | 498 | 4,523 | 5,021 | 6 | 18 | 6 | 48 | 78 | 4,186 | 4,264 | ||||||||||||||||||||||||||||||||||||||||||
|
|
|
|
|
|
|
|
|
|
|
|
|
| |||||||||||||||||||||||||||||||||||||||||||
| $ | 1,371 | $ | 898 | $ | 789 | $ | 5,103 | $ | 8,161 | $ | 334,759 | $ | 342,920 | $ | 678 | $ | 649 | $ | 142 | $ | 4,043 | $ | 5,512 | $ | 289,033 | $ | 294,545 | |||||||||||||||||||||||||||||
|
|
|
|
|
|
|
|
|
|
|
|
|
| |||||||||||||||||||||||||||||||||||||||||||
The Company identified no loans that were considered troubled debt restructurings during the periods presented, and did not have any troubled debt restructurings as of December 31, 20122013 or 2011.2012.
Donegal Financial Services Corporation
Notes to Consolidated Financial Statements
December 31, 2013 and 2012
The following table provides activity for the accretable yield of purchased impaired loans for the years ended December 31, 20112013, 2012 and 20122011 (in thousands):
Accretable yield, January 1, 2011 | $ | — | $ | — | ||||
Acquisition of impaired loans | 1,636 | 1,636 | ||||||
Accretable yield amortized to interest income | (811 | ) | (811 | ) | ||||
Reclassification from non-accretable difference(1) | 978 | |||||||
Reclassification from nonaccretable difference(1) | 978 | |||||||
|
| |||||||
Accretable yield, December 31, 2011 | 1,803 | 1,803 | ||||||
Accretable yield amortized to interest income | (3,900 | ) | (3,900 | ) | ||||
Reclassification from non-accretable difference(1) | 2,694 | |||||||
Reclassification from nonaccretable difference(1) | 2,694 | |||||||
|
| |||||||
Accretable yield, December 31, 2012 | $ | 597 | 597 | |||||
Accretable yield amortized to interest income | (3,701 | ) | ||||||
Reclassification from nonaccretable difference(1) | 3,109 | |||||||
|
| |||||||
Accretable yield, December 31, 2013 | $ | 5 | ||||||
| ||||||||
| (1) | Reclassification from non-accretable difference represents an increase to the estimated cash flows to be collected on the underlying portfolio. |
Donegal Financial Services Corporation
Notes to Consolidated Financial Statements
December 31, 2012 and 2011
As of December 31, 2010, the Company had an average investment in impaired loans of $2,894,000 and interest income recognized on impaired loans on the accrual basis of $171,000. No additional funds are committed to be advanced in connection with impaired loans.
| 6. | Property and Equipment |
The components of property and equipment at December 31, 20122013 and 20112012 are as follows (in thousands):
| 2012 | 2011 | 2013 | 2012 | |||||||||||||
Land and Land Improvements | $ | 3,328 | $ | 3,328 | $ | 3,328 | $ | 3,328 | ||||||||
Buildings and Improvements | 7,414 | 7,414 | 7,414 | 7,414 | ||||||||||||
Leasehold improvements | 1,398 | 1,362 | 1,583 | 1,398 | ||||||||||||
Furniture, fixtures and equipment | 2,562 | 2,262 | 2,607 | 2,562 | ||||||||||||
Construction and Development | — | 3 | 14 | — | ||||||||||||
|
|
|
| |||||||||||||
| 14,702 | 14,369 | 14,946 | 14,702 | |||||||||||||
Accumulated depreciation and amortization | (2,873 | ) | (2,124 | ) | (3,694 | ) | (2,873 | ) | ||||||||
|
|
|
| |||||||||||||
| $ | 11,829 | $ | 12,245 | $ | 11,252 | $ | 11,829 | |||||||||
|
|
|
| |||||||||||||
Total depreciation and amortization expense was $975,000, $1,006,000 $784,000 and $212,000$784,000 for the years ended December 31, 2013, 2012 2011, and 2010,2011, respectively.
The Company leases its main office from the Insurance Company. On September 1, 2006, the Company renewed the lease for an additional term of eight years. Lease expense for the years ended December 31, 2013, 2012 and 2011 was $29,000, $27,000 and 2010 was $27,000, $25,000, and $24,000 respectively, under this related party operating lease.
Donegal Financial Services Corporation
Notes to Consolidated Financial Statements
December 31, 2013 and 2012
Future minimum lease payments by year, including payments due under renewal agreements, are as follows (in thousands):
| Lease Obligation | Sublease Income | Net Lease Obligations | Obligation to Related Party | |||||||||||||
2013 | $ | 800 | $ | 210 | $ | 590 | $ | 28 | ||||||||
2014 | 663 | 215 | 448 | 19 | ||||||||||||
2015 | 619 | 219 | 400 | — | ||||||||||||
2016 | 669 | 223 | 446 | — | ||||||||||||
2017 | 667 | 227 | 440 | — | ||||||||||||
Thereafter | 5,057 | 1,989 | 3,068 | — | ||||||||||||
Donegal Financial Services Corporation
Notes to Consolidated Financial Statements
December 31, 2012 and 2011
| Lease Obligation | Sublease Income | Net Lease Obligations | Obligation to Related Party | |||||||||||||
2014 | $ | 713 | $ | 210 | $ | 503 | $ | 19 | ||||||||
2015 | 670 | 215 | 455 | — | ||||||||||||
2016 | 722 | 219 | 503 | — | ||||||||||||
2017 | 722 | 223 | 499 | — | ||||||||||||
2018 | 664 | 227 | 437 | — | ||||||||||||
Thereafter | 12,171 | 1,989 | 10,182 | — | ||||||||||||
Net rent expense at December 31, 2013, 2012 2011 and 20102011 consisted of the following (in thousands):
| 2012 | 2011 | 2010 | 2013 | 2012 | 2011 | |||||||||||||||||||
Rental expense | $ | 900 | $ | 614 | $ | 109 | $ | 901 | $ | 900 | $ | 614 | ||||||||||||
Sublease rental income | (342 | ) | (234 | ) | — | (273 | ) | (342 | ) | (234 | ) | |||||||||||||
|
|
|
|
|
| |||||||||||||||||||
Net rental expense | $ | 558 | $ | 380 | $ | 109 | $ | 628 | $ | 558 | $ | 380 | ||||||||||||
|
|
|
|
|
| |||||||||||||||||||
| 7. | Deposits |
The components of deposits at December 31, 20122013 and 20112012 are as follows (in thousands):
| 2012 | 2011 | 2013 | 2012 | |||||||||||||
Demand, non-interest bearing | $ | 75,317 | $ | 79,662 | $ | 80,909 | $ | 75,317 | ||||||||
Demand, interest bearing | 88,941 | 86,183 | 89,152 | 88,941 | ||||||||||||
Savings and money market | 113,780 | 112,564 | 116,076 | 113,780 | ||||||||||||
Time, $100,000 and over | 42,848 | 50,982 | 44,015 | 42,848 | ||||||||||||
Time, other | 101,950 | 125,185 | 98,107 | 101,950 | ||||||||||||
|
|
|
| |||||||||||||
Total deposits | $ | 422,836 | $ | 454,576 | $ | 428,259 | $ | 422,836 | ||||||||
|
|
|
| |||||||||||||
At December 31, 2012,2013, the scheduled maturities of time deposits are as follows (in thousands):
2013 | $ | 74,005 | ||||||
2014 | 37,726 | $ | 69,577 | |||||
2015 | 22,805 | 51,849 | ||||||
2016 | 5,613 | 13,668 | ||||||
2017 | 4,584 | 4,447 | ||||||
2018 | 2,495 | |||||||
Thereafter | 65 | 86 | ||||||
|
| |||||||
| $ | 144,798 | $ | 142,122 | |||||
|
| |||||||
Donegal Financial Services Corporation
Notes to Consolidated Financial Statements
December 31, 2013 and 2012
| 8. | Borrowings |
As of December 31, 2013, the Company has a maximum borrowing capacity of $164,914,300 from the Federal Home Loan Bank, of which $-0- was outstanding as of December 31, 2013. Federal Home Loan Bank advances are secured by qualifying assets of the Company. As of December 31, 2012, the Company hashad a maximum borrowing capacity of $159,634,200 from the Federal Home Loan Bank of which $-0- was outstanding as of December 31, 2012. Federal Home Loan Bank advances are secured by qualifying assets of the Company. During 2011, the Company prepaid $11,353,000 of FHLB borrowings with a prepayment penalty of $13,000. As of December 31, 2011, the Company had a maximum borrowing capacity of $164,589,000 from the Federal Home Loan Bank of which $0 was outstanding as of December 31, 2011.
Donegal Financial Services Corporation
Notes to Consolidated Financial Statements
December 31, 2012 and 2011
| 9. | Junior Subordinated Debentures |
Through the acquisition of Union National Financial Corporation, the Company acquired three issuances of junior subordinated debentures with a contractual value of $17,341,000 and a fair market value of $7,045,000. The outstanding balance as of December 31, 20122013 was $7,387,000$7,701,000 and $7,103,000$7,387,000 at December 31, 2011.2012.
The Bank acquired a junior subordinated debenture issued on July 28, 2006, with a contractual amount of $6,000,000 due September 15, 2021 with a five-year initial fixed rate of 7.17%, and then an annual coupon rate, reset quarterly, based on three-month LIBOR plus 1.65%. The first coupon reset date was September 15, 2011. The outstanding balance as of December 31, 20122013 was $3,373,000, the coupon rate was 1.89% and the market yield was 9.95%. The outstanding balance was $3,159,000, the coupon rate was 1.96%, and the market yield was 10.07%. The outstanding balance was $2,965,000, the coupon rate was 2.20%, and the market yield was 10.56% at December 31, 2011.2012.
The Company acquired a debenture issued in December 2003 by Union National Capital Trust I (“UNCT 1”) in the amount of $8,248,000. The floating-rate debenture is due January 23, 2034, of which $248,000 is related to the Company’s capital contribution. UNCT I provides for quarterly distributions at a variable annual coupon rate that is reset quarterly, based on three-month LIBOR plus 2.85%. The outstanding balance was $3,337,000, the coupon rate was 3.09%, and the market yield was 9.86% at December 31, 2013. The outstanding balance was $3,263,000, the coupon rate was 3.16%, and the market yield was 10.06% at December 31, 2012. The outstanding balance was $3,198,000, the coupon rate was 3.12%, and the market yield was 9.95% at December 31, 2011.
The Company acquired a debenture issued in October 2004, by Union National Capital Trust II (“UNCT II”) in the amount of $3,093,000. The floating-ratefloating–rate debenture is due November 23, 2034, of which $93,000 is related to the Company’s capital contribution. UNCT II provides for quarterly distributions at a variable annual coupon rate that is reset quarterly, based on three-month LIBOR plus 2.00%. The outstanding balance was $991,000, the coupon rate was 2.24% and the market yield was 9.88% at December 31, 2013. The outstanding balance was $965,000, the coupon rate was 2.31% and the market yield was 10.11% at December 31, 2012. The outstanding balance was $940,000, the coupon rate was 2.26% and the market yield was 9.94% at December 31, 2011.
All of the junior subordinated debentures are callable at the Company’s option beginning at five years from the date of issuance. These debentures do not have to be called in full. UNCT I became callable in December 2008, UNCT II became callable in October 2009, and the Bank’s junior subordinated debenture became callable in September 2011. All three issuances of junior subordinated debentures qualify as a component of risk-based capital for regulatory purposes.
Donegal Financial Services Corporation
Notes to Consolidated Financial Statements
December 31, 20122013 and 20112012
| 10. | Income Taxes |
The components of the income tax expense (benefit) for the years ended December 31, 2013, 2012 2011, and 20102011 are as follows (in thousands):
| 2012 | 2011 | 2010 | 2013 | 2012 | 2011 | |||||||||||||||||||
Federal: | ||||||||||||||||||||||||
Current | $ | 1,287 | $ | 8,347 | $ | 181 | $ | 334 | $ | 1,287 | $ | 8,347 | ||||||||||||
Deferred | 2,765 | (6,455 | ) | 272 | 1,928 | 2,765 | (6,455 | ) | ||||||||||||||||
|
|
|
|
|
| |||||||||||||||||||
| 4,052 | 1,892 | 453 | 2,262 | 4,052 | 1,892 | |||||||||||||||||||
State, current | 691 | 716 | 96 | 636 | 691 | 716 | ||||||||||||||||||
|
|
|
|
|
| |||||||||||||||||||
Balance, ending | $ | 4,743 | $ | 2,608 | $ | 549 | $ | 2,898 | $ | 4,743 | $ | 2,608 | ||||||||||||
|
|
|
|
|
| |||||||||||||||||||
A reconciliation of the statutory income tax at a rate of 34% to the income tax expense included in the consolidated statement of operationsincome is as follows for 2013, 2012 2011 and 2010.2011.
| 2012 | 2011 | 2010 | 2013 | 2012 | 2011 | |||||||||||||||||||
Federal income tax at statutory rate | 34.0 | % | 34.0 | % | 34.0 | % | 34.0 | % | 34.0 | % | 34.0 | % | ||||||||||||
State tax expense, net of federal benefit | 3.2 | 7.0 | (789.8 | ) | 4.7 | 3.2 | 7.0 | |||||||||||||||||
Tax exempt income, net of disallowed interest expense | (2.7 | ) | (2.7 | ) | — | (5.7 | ) | (2.7 | ) | (2.7 | ) | |||||||||||||
Bank owned life insurance | (1.0 | ) | (1.3 | ) | — | (1.5 | ) | (1.0 | ) | (1.3 | ) | |||||||||||||
Stock option expense | 0.3 | — | — | 0.8 | 0.3 | — | ||||||||||||||||||
Nondeductible merger costs | — | 1.2 | (6,068.7 | ) | — | — | 1.2 | |||||||||||||||||
Other | (0.3 | ) | 0.1 | (4.4 | ) | 0.2 | (0.3 | ) | 0.1 | |||||||||||||||
|
|
|
|
|
| |||||||||||||||||||
Effective income tax rate | 33.5 | % | 38.3 | % | (6,828.9 | )% | 32.5 | % | 33.5 | % | 38.3 | % | ||||||||||||
|
|
|
|
|
| |||||||||||||||||||
Donegal Financial Services Corporation
Notes to Consolidated Financial Statements
December 31, 20122013 and 20112012
The components of the net deferred tax asset, included in other assets on the consolidated balance sheet, at December 31, 20122013 and 20112012 are as follows (in thousands):
| 2012 | 2011 | 2013 | 2012 | |||||||||||||
Deferred tax assets: | ||||||||||||||||
Allowance for loan loss | $ | 1,373 | $ | 1,132 | $ | 1,376 | $ | 1,373 | ||||||||
State net operating loss carryforward | 315 | 106 | 351 | 315 | ||||||||||||
Federal net operating loss carryforward | 602 | 1,040 | 161 | 602 | ||||||||||||
Alternative minimum tax credit carryforward | 864 | 864 | 1,101 | 864 | ||||||||||||
Nonaccrual interest | 28 | 82 | 23 | 28 | ||||||||||||
Purchase accounting adjustments | 941 | 3,407 | — | 941 | ||||||||||||
Low income housing tax credit carryforward | 437 | 519 | 437 | 437 | ||||||||||||
Unrealized loss on available for sale securities | 2,392 | — | ||||||||||||||
Other | 353 | — | 265 | 353 | ||||||||||||
|
|
|
| |||||||||||||
| 4,913 | 7,150 | 6,106 | 4,913 | |||||||||||||
Valuation allowance | (315 | ) | (106 | ) | (351 | ) | (315 | ) | ||||||||
|
|
|
| |||||||||||||
Total deferred tax assets, net of valuation allowance | 4,598 | 7,044 | 5,755 | 4,598 | ||||||||||||
|
|
|
| |||||||||||||
Deferred tax liabilities: | ||||||||||||||||
Property and equipment | (561 | ) | (236 | ) | (284 | ) | (561 | ) | ||||||||
Unrealized gain on available for sale securities | (1,257 | ) | (1,029 | ) | — | (1,257 | ) | |||||||||
Other | — | (6 | ) | |||||||||||||
Purchase accounting adjustments | (970 | ) | — | |||||||||||||
|
|
|
| |||||||||||||
Net deferred tax liabilities | (1,818 | ) | (1,271 | ) | (1,254 | ) | (1,818 | ) | ||||||||
|
|
|
| |||||||||||||
Net deferred tax assets | $ | 2,780 | $ | 5,773 | $ | 4,501 | $ | 2,780 | ||||||||
|
|
|
| |||||||||||||
The valuation allowance at December 31, 20122013 and 20112012 relates to state net operating loss carryforwards for which realizability is uncertain. At December 31, 2013, 2012 2011, and 20102011, the Company had state net operating loss carryforwards of $3,523,000, $3,153,000 $1,061,000 and $1,652,000,$2,417,000, respectively, which are available to offset future state taxable income, and expire at various dates through 2032. At December 31, 20122013 and 2011,2012, the Company had no valuation allowance established against its federal net operating loss carryforward, low income housing tax credit carryforward, or alternative minimum tax credit carryforward, as management believes the Company will generate sufficient future taxable income to fully utilize these deferred tax assets. The federal net operating loss carryforward will expire in 2030, the low income housing credit carryforward will expire between 2021 and 2027, and the alternative minimum tax credit carryforward has no expiration.
Donegal Financial Services Corporation
Notes to Consolidated Financial Statements
December 31, 20122013 and 20112012
In assessing the realizability of deferred tax assets, management considers whether it is more likely than not that some portion or all of the deferred tax assets will not be realized. The ultimate realization of deferred tax assets is dependent upon the generation of future taxable income during periods in which those temporary differences become deductible. Management considers the scheduled reversal of deferred tax liabilities, projected future taxable income and tax planning strategies in making this assessment. Based on the level of historical taxable income and projections for future taxable income over the periods in which the deferred tax assets are deductible and tax planning strategies, management believes it is more likely than not that the Company will realize the benefits of these deferred tax assets, net of any valuation allowance at December 31, 2012.2013.
| 11. | Transactions with Executive Officers, Directors and Affiliated Companies |
The Company has had, and may be expected to have in the future, banking transactions with its executive officers, directors, their immediate families and affiliated companies (commonly referred to as related parties). Deposits of related parties totaled $8,544,000$9,550,000 and $12,043,000$8,544,000 at December 31, 20122013 and 2011,2012, respectively. At December 31, 20122013 and 20112012, related party loans totaled $3,829,000$3,652,000 and $4,316,000,$3,829,000, respectively. During 2012,2013, loan advances and repayments totaled $3,306,000 and removal from related party status totaled $2,552,000, $2,926,000, and $113,000, respectively.$3,483,000.
During 2011, and 2010, Donegal Group Inc. incurred stock based compensation expense on behalf of employees of the Company in the amountsamount of $77,000 and $21,000, respectively, without reimbursement. There were no expenses incurred by Donegal Group Inc. for stock based compensation on behalf of the Company in 2013 or 2012.
The Company also has an operating lease agreement with the Insurance Company as described in Note 6.
| 12. | Financial Instruments with Off-Balance Sheet Risk |
The Company is a party to financial instruments with off-balance sheet risk in the normal course of business to meet the financing needs of its customers. These financial instruments include commitments to extend credit. Such commitments involve, to varying degrees, elements of credit and interest rate risk in excess of the amount recognized in the consolidated balance sheet.
The Company’s exposure to credit loss in the event of nonperformance by the other party to the financial instrument for commitments to extend credit is represented by the contractual amount of those instruments. The Company uses the same credit policies in making commitments and conditional obligations as it does for on-balance sheet instruments.
Donegal Financial Services Corporation
Notes to Consolidated Financial Statements
December 31, 20122013 and 20112012
At December 31, 20122013 and 2011,2012, the following financial instruments were outstanding whose contract amounts represent credit risk (in thousands):
| 2012 | 2011 | 2013 | 2012 | |||||||||||||
Commitments to grant loans | $ | 4,528 | $ | 4,146 | $ | 2,817 | $ | 4,528 | ||||||||
Unfunded commitments under lines of credit | 96,450 | 100,040 | 93,961 | 96,450 | ||||||||||||
|
|
|
| |||||||||||||
| $ | 100,978 | $ | 104,186 | $ | 96,778 | $ | 100,978 | |||||||||
|
|
|
| |||||||||||||
Commitments to extend credit are agreements to lend to a customer as long as there is no violation of any condition established in the contract. Since many of the commitments are expected to expire without being drawn upon, the total commitment amounts do not necessarily represent future cash requirements. Commitments generally have fixed expiration dates or other termination clauses and may require payment of a fee. The Company evaluates each customer’s credit worthiness on a case-by-case basis. The amount of collateral obtained, if deemed necessary by the Company upon extension of credit, is based on management’s credit evaluation. Collateral held typically consists of residential or commercial real estate.
| 13. | Concentration of Credit Risk |
The concentration of credit by type of loan is set forth in Note 5. The debtors’ ability to honor their contracts is influenced by the region’s economy and financial stability.
| 14. | Employee Benefit Plan |
The Company maintains a defined contribution 401(k) retirement Plan that covers eligible employees. The Company’s matching contribution is 100% of each participant’s first 1% of elective contribution and 50% of each participant’s next 5% of elective contributions with a maximum contribution of 3.50% of the participants compensation. The Company’s contributions to the Plan totaled $183,000, $103,000,$183,000 and $34,000$103,000 for the years ended December 31, 2013, 2012 2011, and 2010,2011, respectively.
| 15. | Regulatory Matters |
The Bank is subject to various regulatory capital requirements administered by its primary federal regulator,regulators, The Pennsylvania Department of Banking and Securities and the Office of the Comptroller of the Currency (OCC).Federal Deposit Insurance Corporation. Failure to meet the minimum capital requirements can initiate certain mandatory and possibly additional discretionary-actions by regulators that, if undertaken, could have a direct material effect on the Company’s consolidated financial statements. Under capital adequacy guidelines and the regulatory framework for prompt corrective action, the Bank must meet specific capital guidelines that involve quantitative measures of the Bank’s assets, liabilities and certain off-balance sheet items as calculated under regulatory accounting practices. The Bank’s capital amounts and classification are also subject to qualitative judgments by the regulators about components, risk-weightings and other factors, to be considered “well capitalized.”
Donegal Financial Services Corporation
Notes to Consolidated Financial Statements
December 31, 20122013 and 20112012
Quantitative measures established by regulation to ensure capital adequacy require the Bank to maintain minimum amounts and ratios (set forth below) of total and Tier 1 capital (as defined in the regulations) to risk-weighted assets and of Tier 1 capital to assets. Management believes, as of December 31, 2012,2013, that the Bank meets all capital adequacy requirements to which it is subject.
A comparison of the Bank’s actual capital amounts to the regulatory requirements at December 31, 20122013 and 20112012 is presented below (dollars in thousands). The Company’s actual capital amounts and ratios are not significantly different from the Bank’s.
| 2012 | 2013 | |||||||||||||||||||||||||||||||||||||||||||||||
| Actual | For Capital Adequacy Purposes | To be Well Capitalized under Prompt Corrective Action Provisions | Actual | For Capital Adequacy Purposes | To be Well Capitalized under Prompt Corrective Action Provisions | |||||||||||||||||||||||||||||||||||||||||||
| Amount | Ratio | Amount | Ratio | Amount | Ratio | Amount | Ratio | Amount | Ratio | Amount | Ratio | |||||||||||||||||||||||||||||||||||||
Total capital (to risk-weighted assets) | $ | 83,221 | 23.18 | % | $ | 28,726 | ³8.0 | % | $ | 35,908 | ³10.0 | % | $ | 88,745 | 25.83 | % | $ | ³27,483 | ³8.0 | % | $ | ³34,354 | ³10.0 | % | ||||||||||||||||||||||||
Tier 1 capital (to risk-weighted assets) | 75,895 | 21.14 | 14,363 | ³4.0 | 21,545 | ³6.0 | 81,200 | 23.64 | ³13,742 | ³4.0 | ³20,612 | ³ 6.0 | ||||||||||||||||||||||||||||||||||||
Core (Tier 1) capital (to adjusted total assets) | 75,895 | 15.05 | 20,176 | ³4.0 | 30,264 | ³6.0 | 81,200 | 15.67 | ³20,732 | ³4.0 | ³31,098 | ³ 6.0 | ||||||||||||||||||||||||||||||||||||
Tangible equity (to adjusted total assets) | 75,895 | 15.05 | 7,566 | ³1.5 | 7,566 | ³1.5 | 81,200 | 15.67 | ³ 7,774 | ³1.5 | ³ 7,774 | ³ 1.5 | ||||||||||||||||||||||||||||||||||||
| 2011 | 2012 | |||||||||||||||||||||||||||||||||||||||||||||||
| Actual | For Capital Adequacy Purposes | To be Well Capitalized under Prompt Corrective Action Provisions | Actual | For Capital Adequacy Purposes | To be Well Capitalized under Prompt Corrective Action Provisions | |||||||||||||||||||||||||||||||||||||||||||
| Amount | Ratio | Amount | Ratio | Amount | Ratio | Amount | Ratio | Amount | Ratio | Amount | Ratio | |||||||||||||||||||||||||||||||||||||
Total capital (to risk-weighted assets) | $ | 71,689 | 17.91 | % | $ | 32,023 | ³8.0 | % | $ | 40,029 | ³10.0 | % | $ | 83,221 | 23.18 | % | $ | ³28,726 | ³8.0 | % | $ | ³35,908 | ³10.0 | % | ||||||||||||||||||||||||
Tier 1 capital (to risk-weighted assets) | 65,187 | 16.29 | 16,011 | ³4.0 | 24,017 | ³6.0 | 75,895 | 21.14 | ³14,363 | ³4.0 | ³21,545 | ³ 6.0 | ||||||||||||||||||||||||||||||||||||
Core (Tier 1) capital (to adjusted total assets) | 65,187 | 12.24 | 21,310 | ³4.0 | 31,964 | ³6.0 | 75,895 | 15.05 | ³20,176 | ³4.0 | ³30,264 | ³ 6.0 | ||||||||||||||||||||||||||||||||||||
Tangible equity (to adjusted total assets) | 65,187 | 12.24 | 7,991 | ³1.5 | 7,991 | ³1.5 | 75,895 | 15.05 | ³ 7,566 | ³1.5 | ³ 7,566 | ³ 1.5 | ||||||||||||||||||||||||||||||||||||
| 16. | Fair Value Measurements |
Management uses its best judgment in estimating the fair value of the Company’s financial instruments; however, there are inherent weaknesses in any estimation technique. Therefore, for substantially all financial instruments, the fair value estimates herein are not necessarily indicative of the amounts the Company could have realized in a sales transaction on the dates indicated. The estimated fair value amounts have been measured as of year-end and have not been re-evaluated or updated for purposes of these consolidated financial statements subsequent to those respective dates. As such, the estimated fair values of these financial instruments subsequent to the respective reporting dates may be different than the amounts reported at year end.
Donegal Financial Services Corporation
Notes to Consolidated Financial Statements
December 31, 20122013 and 20112012
FASB ASC Topic 820-10,Fair Value Measurements and Disclosures, defines fair value measurement and disclosure guidance as the price that would be received to sell the asset or transfer the liability in an orderly transaction (that is, not a forced liquidation or distressed sale) between market participants at the measurement date under current market conditions. Additional guidance is provided in determining fair value when the volume and level of activity for the asset or liability has significantly decreased, including guidance on identifying circumstances when a transaction may not be considered orderly.
Fair value measurement and disclosure guidance provides a list of factors a reporting entity should evaluate to determine whether there has been a significant decrease in the volume and level of activity for the asset or liability in relation to normal market activity for the asset or liability. When the reporting entity concludes there has been a significant decrease in the volume and level of activity for the asset or liability, further analysis of the information from that market is needed and significant adjustments to the related prices may be necessary to estimate fair value.
The guidance further clarifies that when there has been a significant decrease in the volume and level of activity for the asset or liability; some transactions may not be orderly. In those situations, the entity must evaluate the weight of the evidence to determine whether the transaction is orderly, considering the circumstances that indicate that a transaction is not orderly. A transaction price that is not associated with an orderly transaction is given little, if any, weight when estimating fair value.
Fair value measurement and disclosure guidance establishes a fair value hierarchy that prioritizes the inputs to valuation methods used to measure fair value. The hierarchy gives the highest priority to unadjusted quoted prices in active markets for identical assets or liabilities (Level 1 measurements) and the lowest priority to unobservable inputs (Level 3 measurements). The three levels of the fair value hierarchy are as follows:
Level 1 - Unadjusted quoted prices in active markets that are accessible at the measurement date for identical, unrestricted assets or liabilities.
Level 2 - Quoted prices in markets that are not active, or inputs that are observable either directly or indirectly, for substantially the full term of the asset or liability.
Level 3 - Prices or valuation techniques that require inputs that are both significant to the fair value measurement and unobservable (i.e., supported with little or no market activity).
An asset’s or liability’s level within the fair value hierarchy is based on the lowest level of input that is significant to the fair value measurement.
Donegal Financial Services Corporation
Notes to Consolidated Financial Statements
December 31, 20122013 and 20112012
For financial assets measured at fair value on a recurring basis, the fair value measurements by level within the fair value hierarchy used at December 31, 20122013 and 20112012 are as follows (in thousands):
| 2012 | 2013 | |||||||||||||||||||||||||||||||
| Total | (Level 1) Quoted Prices in Active Markets for Identical Assets | (Level 2) Significant Other Observable Inputs | (Level 3) Significant Unobservable Inputs | Total | (Level 1) Quoted Prices in Active Markets for Identical Assets | (Level 2) Significant Other Observable Inputs | (Level 3) Significant Unobservable Inputs | |||||||||||||||||||||||||
U.S. treasuries | $ | 3,002 | $ | — | $ | 3,002 | $ | — | $ | 6,893 | $ | — | $ | 6,893 | $ | — | ||||||||||||||||
U.S. government agencies securities | 16,705 | — | 16,705 | — | 12,312 | — | 12,312 | — | ||||||||||||||||||||||||
Corporate debt securities | 9,870 | — | 9,870 | — | 3,113 | — | 3,113 | — | ||||||||||||||||||||||||
Tax-free municipal securities | 43,334 | — | 43,334 | — | 39,428 | — | 39,428 | — | ||||||||||||||||||||||||
Taxable municipal securities | 3,841 | — | 3,841 | — | 3,006 | — | 3,006 | — | ||||||||||||||||||||||||
U.S. government sponsored enterprise mortgage-backed securities | 71,014 | — | 71,014 | — | 76,140 | — | 76,140 | — | ||||||||||||||||||||||||
Equity securities | 291 | — | 291 | — | 291 | — | 291 | — | ||||||||||||||||||||||||
| 2011 | ||||||||||||||||
| Total | (Level 1) Quoted Prices in Active Markets for Identical Assets | (Level 2) Significant Other Observable Inputs | (Level 3) Significant Unobservable Inputs | |||||||||||||
U.S. treasuries | $ | 6,241 | $ | — | $ | 6,241 | $ | — | ||||||||
U.S. government agencies securities | 10,768 | — | 10,768 | — | ||||||||||||
Corporate debt securities | 4,874 | — | 4,874 | — | ||||||||||||
Tax-free municipal securities | 20,705 | — | 20,705 | — | ||||||||||||
Taxable municipal securities | 3,705 | — | 3,705 | — | ||||||||||||
U.S. government sponsored enterprise mortgage-backed securities | 50,035 | — | 50,035 | — | ||||||||||||
Equity securities | 41 | — | 41 | — | ||||||||||||
Donegal Financial Services Corporation
Notes to Consolidated Financial Statements
December 31, 2012 and 2011
| 2012 | ||||||||||||||||
| Total | (Level 1) Quoted Prices in Active Markets for Identical Assets | (Level 2) Significant Other Observable Inputs | (Level 3) Significant Unobservable Inputs | |||||||||||||
U.S. treasuries | $ | 3,002 | $ | — | $ | 3,002 | $ | — | ||||||||
U.S. government agencies securities | 16,705 | — | 16,705 | — | ||||||||||||
Corporate debt securities | 9,870 | — | 9,870 | — | ||||||||||||
Tax-free municipal securities | 43,334 | — | 43,334 | — | ||||||||||||
Taxable municipal securities | 3,841 | — | 3,841 | — | ||||||||||||
U.S. government sponsored enterprise mortgage-backed securities | 71,014 | — | 71,014 | — | ||||||||||||
Equity securities | 291 | — | 291 | — | ||||||||||||
The valuation technique used to measure the fair values for the items in the tables above are as follows:
Securities
The fair value of securities available-for-sale (carried at fair value) are determined by obtaining quoted market prices on nationally recognized securities exchanges (Level 1), or matrix pricing (Level 2), which is a mathematical technique used widely in the industry to value debt securities without relying exclusively on quoted market prices for the specific securities but rather by relying on the securities’ relationship to other benchmark quoted prices. For certain securities which are not traded in active markets or are subject
Donegal Financial Services Corporation
Notes to transfer restrictions, valuations are adjusted to reflect illiquidity and/or non-transferability,Consolidated Financial Statements
December 31, 2013 and such adjustments are generally based on available market evidence (Level 3). In the absence of such evidence, management’s best estimate is used.2012
The Company did not have any financial assets measured at fair value on a non-recurring basis at December 31, 20122013 or 2011.2012.
The estimated fair values of financial instruments as of December 31, 20122013 and 20112012 are set forth in the tables below (in thousands). The information in the table should not be interpreted as an estimate of the fair value of the Company in its entirety since a fair value calculation is only provided for a limited portion of the Company’s assets and liabilities. Due to a wide range of valuation techniques and the degree of subjectivity used in making the estimates, comparisons between the Company’s disclosures and those of other companies may not be meaningful.
| 2012 | 2011 | |||||||||||||||
| Carrying Amount | Fair Value | Carrying Amount | Fair Value | |||||||||||||
Assets: | ||||||||||||||||
Cash and cash equivalents | $ | 29,001 | $ | 29,001 | 52,313 | 52,313 | ||||||||||
Interest-bearing time deposits in other banks | 6 | 6 | 100 | 100 | ||||||||||||
Securities available-for-sale | 148,057 | 148,057 | 96,369 | 96,369 | ||||||||||||
Loans held for sale | 4,266 | 4,379 | 1,331 | 1,382 | ||||||||||||
Loans, net | 290,507 | 294,847 | 339,507 | 341,684 | ||||||||||||
Restricted investment in bank stocks | 2,320 | 2,320 | 3,249 | 3,249 | ||||||||||||
Accrued interest receivable | 1,778 | 1,778 | 1,714 | 1,714 | ||||||||||||
Mortgage servicing assets | 109 | 109 | 150 | 150 | ||||||||||||
Liabilities: | ||||||||||||||||
Demand and savings deposits | 278,038 | 278,038 | 278,409 | 278,409 | ||||||||||||
Time deposits | 144,798 | 146,741 | 176,167 | 179,049 | ||||||||||||
Junior subordinated debentures | 7,387 | 7,387 | 7,103 | 7,103 | ||||||||||||
Accrued interest payable | 291 | 291 | 426 | 426 | ||||||||||||
Off-Balance-Sheet Items: | ||||||||||||||||
Commitments to extend credit and standby letters of credit | — | — | — | — | ||||||||||||
Donegal Financial Services Corporation
Notes to Consolidated Financial Statements
December 31, 2012 and 2011
| 2013 | 2012 | |||||||||||||||
| Carrying Amount | Fair Value | Carrying Amount | Fair Value | |||||||||||||
Assets: | ||||||||||||||||
Cash and cash equivalents | $ | 59,538 | $ | 59,538 | $ | 29,001 | $ | 29,001 | ||||||||
Interest-bearing time deposits in other banks | 6 | 6 | 6 | 6 | ||||||||||||
Securities available-for-sale | 141,183 | 141,183 | 148,057 | 148,057 | ||||||||||||
Loans held for sale | 1,513 | 1,513 | 4,266 | 4,379 | ||||||||||||
Loans, net | 274,589 | 279,824 | 290,507 | 294,847 | ||||||||||||
Restricted investment in bank stocks | 1,176 | 1,176 | 2,320 | 2,320 | ||||||||||||
Accrued interest receivable | 1,532 | 1,532 | 1,778 | 1,778 | ||||||||||||
Mortgage servicing assets | 76 | 76 | 109 | 109 | ||||||||||||
Liabilities: | ||||||||||||||||
Demand and savings deposits | 286,137 | 286,137 | 278,038 | 278,038 | ||||||||||||
Time deposits | 142,122 | 143,076 | 144,798 | 146,741 | ||||||||||||
Junior subordinated debentures | 7,701 | 7,701 | 7,387 | 7,387 | ||||||||||||
Accrued interest payable | 234 | 234 | 291 | 291 | ||||||||||||
Off-Balance-Sheet Items: | ||||||||||||||||
Commitments to extend credit and standby letters of credit | — | — | — | — | ||||||||||||
The following methods and assumptions were used by the Company to estimate the fair value of its financial instruments at December 31, 20122013 and 2011.2012.
Cash and Cash Equivalents
The carrying amounts of cash and short-term investments (U.S. Treasury Bills with a maturity of less than 90 days) approximate their fair values.
Interest-Bearing Time Deposits in Other Banks
The carrying amounts of interest-bearing time deposits in other banks approximate their fair values. The Company generally purchases amounts below the insured limit, limiting the amount of credit risk on these time deposits.
Donegal Financial Services Corporation Notes to Consolidated Financial Statements December 31, 2013 and 2012
Securities Available-for-Sale
The carrying values of securities available-for-sale (carried at fair value) are determined by obtaining quoted market prices on nationally recognized securities exchanges (Level 1), or matrix pricing (Level 2), which is a mathematical technique used widely in the industry to value debt securities without relying exclusively on quoted market prices for the specific securities but rather by relying on the securities’ relationship to other benchmark quoted prices. For certain securities which are not traded in active markets or are subject to transfer restrictions, valuations are adjusted to reflect illiquidity and/or non-transferability, and such adjustments are generally based on available market evidence (Level 3). In the absence of such evidence, management’s best estimate is used.
Loans Held for Sale
The fair value of mortgage loans held for sale are determined as the par amounts to be received at settlement by establishing the respective buyer and rate in advance.
Loans
For variable-rate loans that reprice frequently and which entail no significant changes in credit risk, carrying value approximates fair value. The fair value of other loans are estimated by calculating the present value of future cash flows, discounted at the interest rates currently being offered for loans with similar terms to borrowers with similar credit quality.
Loans purchased were recorded at their acquisition date fair value. In order to record the loans at fair value, management made three different types of fair value adjustments. A market rate adjustment was made to adjust for the movement in market interest rates, irrespective of credit adjustments, compared to the stated rates of the acquired loans. A credit adjustment was made on pools of homogeneous loans representing the changes in credit quality of the underlying borrowers from the loan inception to the acquisition date. A credit adjustment on distressed loans which represents the portion of the loan balance that has been deemed uncollectible based on our expectations of future cash flows for each respective loan.
Donegal Financial Services Corporation
Notes to Consolidated Financial Statements
December 31, 2012 and 2011
Restricted Investment in Bank Stocks
The carrying amounts reported in the consolidated balance sheet for restricted investment in bank stocks approximate their fair values.
Accrued Interest Receivable
The carrying amount of accrued interest receivable approximates its fair value.
Mortgage Servicing Assets
The fair value of servicing assets is based on the present value of estimated future cash flows on pools of mortgages stratified by rate and maturity date.
Donegal Financial Services Corporation Notes to Consolidated Financial Statements December 31, 2013 and 2012
Deposit Liabilities
The fair values of deposits with no stated maturities, such as demand deposits, savings accounts, NOW and money market deposits, equal their carrying amounts, which represent the amount payable on demand. Fair values for fixed-rate certificates of deposit are estimated using a discounted cash flow calculation that applies interest rates currently being offered on certificates to a schedule of aggregated expected monthly maturities on time deposits.
Junior Subordinated Debentures
For floating-rate debentures, fair value is based on the difference between current interest rates for similar types of borrowing arrangements and the current coupon rate. For debentures that are at a fixed rate for a period of time, the fair value is determined using discounted cash flow analyses, based on current interest rates for similar types of borrowing arrangements.
Accrued Interest Payable
The carrying amount of accrued interest payable approximates its fair value.
Off-Balance-Sheet Instruments
The Company’s off-balance-sheet instruments consist of commitments to extend credit, and financial and performance standby letters of credit. The estimated fair value is based on fees currently charged to enter into similar agreements, taking into account the remaining term of the agreements and the present creditworthiness of the counterparties. For fixed-rate loan commitments, fair value also considers the difference between current levels of interest rates and the committed rates.
SIGNATURES
Pursuant to the requirements of Section 13 or 15(d) of the Securities Exchange Act of 1934, the Registrant has duly caused this report to be signed on its behalf by the undersigned, thereunto duly authorized.
| DONEGAL GROUP INC. | ||
| By: | /s/ Donald H. Nikolaus | |
| Donald H. Nikolaus, President | ||
Date: March 12, 201314, 2014
Pursuant to the requirements of the Securities Exchange Act of 1934, this report has been signed by the following persons on behalf of the Registrant in the capacities and on the dates indicated.
Signature | Title | Date | ||
/s/ Donald H. Nikolaus Donald H. Nikolaus | President and a Director (principal executive officer) | March | ||
| 14, 2014 | ||||
/s/ Jeffrey D. Miller Jeffrey D. Miller | Senior Vice President and Chief Financial Officer (principal financial and accounting officer) | March | ||
/s/ Scott A. Berlucchi Scott A. Berlucchi | Director | March 14, 2014 | ||
/s/ Robert S. Bolinger Robert S. Bolinger | Director | March | ||
| 14, 2014 | ||||
/s/ Patricia A. Gilmartin Patricia A. Gilmartin | Director | March | ||
| 14, 2014 | ||||
/s/ Philip H. Glatfelter, II Philip H. Glatfelter, II | Director | March | ||
| 14, 2014 | ||||
/s/ Jack L. Hess Jack L. Hess | Director | March | ||
| 14, 2014 | ||||
/s/ Kevin M. Kraft, Sr. Kevin M. Kraft, Sr. | Director | March | ||
| 14, 2014 | ||||
/s/ John J. Lyons John J. Lyons | Director | March | ||
| 14, 2014 | ||||
/s/ Jon M. Mahan Jon M. Mahan | Director | March | ||
| 14, 2014 | ||||
/s/ S. Trezevant Moore, Jr. |
| |||
| S. Trezevant Moore, Jr. | ||||
| Director | March | ||
| 14, 2014 | ||||
/s/ Richard D. Wampler, II Richard D. Wampler, II | Director | March | ||
| 14, 2014 | ||||
-1-