UNITED STATES
SECURITIES AND EXCHANGE COMMISSION
Washington D.C. 20549
FORM 10-K
Annual Report Pursuant to Section 13 or 15(d) of the Securities Exchange Act of 1934
For the fiscal year ended December 31, 20122014
Commission File Number 0-10661
TriCo Bancshares
(Exact name of Registrant as specified in its charter)
| California | 94-2792841 | |
(State or other jurisdiction of incorporation or organization) | (I.R.S. Employer Identification No.) |
| 63 Constitution Drive, Chico, California | 95973 | |
| (Address of principal executive offices) | (Zip Code) |
Registrant’s telephone number, including area code: (530) 898-0300
Securities registered pursuant to Section 12(b) of the Act:
Common Stock, without par value | Nasdaq | |
| (Title of Class) | (Name of each exchange on which registered) |
Securities registered pursuant to Section 12(g) of the Act: None.
Indicate by check mark whether the Registrant is a well-known seasoned issuer, as defined in Rule 405 of the Securities Act.
YES ¨ NO x
Indicate by check mark whether the Registrant is not required to file reports pursuant to Section 13 or Section 15(d) of the Act.
YES ¨ NO x
Indicate by check mark whether the Registrant (1) has filed all reports required to be filed by Section 13 or 15(d) of the Securities Exchange Act of 1934 during the preceding 12 months (or for such shorter periods that the Registrant was required to file such reports), and (2) has been subject to such filing requirements for the past 90 days.
YES x NO ¨
Indicate by check mark whether the registrant has submitted electronically and posted on its corporate Web site, if any, every Interactive Data File required to be submitted and posted pursuant to Rule 405 of Regulation S-T (§ 232.405 of this chapter) during the preceding 12 months (or for such shorter period that the registrant was required to submit and post such files).
YES x NO ¨
Indicate by check mark if disclosure of delinquent filers pursuant to Item 405 of Regulation S-K is not contained herein, and will not be contained, to the best of the Registrant’s knowledge, in definitive proxy or information statements incorporated by reference in Part III of the Form 10-K or any amendment to this Form 10-K.
YES x NO ¨
Indicate by check mark whether the Registrant is a large accelerated filer, an accelerated filer, a non-accelerated filer or a smaller reporting company. See the definitions of “large accelerated filer,” “accelerated filer” and “smaller reporting company” in Rule 12b-2 of the Act (check one).
| Large accelerated filer | ¨ | Accelerated filer | x | |||
| Non-accelerated filer | ¨ (Do not check if a smaller reporting company) | Smaller reporting company | ¨ | |||
Indicate by check mark whether the Registrant is a shell company (as defined in Rule 12b-2 of the Exchange Act).
YES ¨ NO x
The aggregate market value of the voting common stock held by non-affiliates of the Registrant, as of June 30, 2012,2014, was approximately $187,758,000$289,650,631 (based on the closing sales price of the Registrant’s common stock on the date). This computation excludes a total of 3,800,7923,616,101 shares that are beneficially owned by the officers and directors of Registrant who may be deemed to be the affiliates of Registrant under applicable rules of the Securities and Exchange Commission.
The number of shares outstanding of Registrant’s common stock, as of March 1, 2013,February 27, 2015, was 16,005,191 shares of common stock, without par value.22,740,503.
DOCUMENTS INCORPORATED BY REFERENCE
The information required to be disclosed pursuant to Part III of this report either shall be (i) deemed to be incorporated by reference from selected portions of TriCo Bancshares’ definitive proxy statement for the 20132015 annual meeting of stockholders, if such proxy statement is filed with the Securities and Exchange Commission pursuant to Regulation 14A not later than 120 days after the end of the Company’s most recently completed fiscal year, or (ii) included in an amendment to this report filed with the Commission on Form 10-K/A not later than the end of such 120 day period.
| Page Number | |||||||||
PART I | |||||||||
Item 1 | 2 | ||||||||
Item 1A | |||||||||
Item 1B | |||||||||
Item 2 | |||||||||
Item 3 | |||||||||
Item 4 | |||||||||
PART II | |||||||||
Item 5 | 18 | ||||||||
Item 6 | 20 | ||||||||
Item | |||||||||
| Management’s Discussion and Analysis of Financial Condition and Results of Operations | ||||||||
Item 7A | |||||||||
Item 8 | |||||||||
Item 9 | Changes in and Disagreements with Accountants on Accounting and Financial Disclosure | ||||||||
Item 9A | |||||||||
Item 9B | |||||||||
PART III | |||||||||
Item 10 | |||||||||
Item 11 | |||||||||
Item 12 | Security Ownership of Certain Beneficial Owners and Management and Related Stockholder Matters | ||||||||
Item 13 | Certain Relationships and Related Transactions, and Director Independence | ||||||||
Item 14 | |||||||||
PART IV | |||||||||
Item 15 | |||||||||
FORWARD-LOOKING STATEMENTS
In addition to historical information, this Annual Report on Form 10-K contains forward-looking statements about TriCo Bancshares (the “Company,” “TriCo” or “we”) and its subsidiaries for which it claims the protection of the safe harbor provisions contained in the Private Securities Litigation Reform Act of 1995. These forward-looking statements are based on Management’s current knowledge and belief and include information concerning the Company’s possible or assumed future financial condition and results of operations. When you see any of the words “believes”, “expects”, “anticipates”, “estimates”, or similar expressions, these generally indicate that we are making forward-looking statements. A number of factors, some of which are beyond the Company’s ability to predict or control, could cause future results to differ materially from those contemplated. These factors include those listed at Item 1A Risk Factors, in this report.
Forward-looking statements speak only as of the date they are made, and the Company does not undertake to update forward-looking statements to reflect circumstances or events that occur after the date the forward-looking statements are made, whether as a result of new information, future developments or otherwise.
PART I
Information About TriCo Bancshares’ Business
TriCo Bancshares is a bank holding company incorporated in California in 1981 and registered under the Bank Holding Company Act of 1956, as amended (the “BHC Act”). The Company’s principal subsidiary is Tri Counties Bank, a California-chartered commercial bank (the “Bank”). The Bank offers banking services to retail customers and small to medium-sized businesses through 6673 branch offices in Northern and Central California.California and had total assets of approximately $3.9 billion at December 31, 2014. The Bank’s deposits are insured by the Federal Deposit Insurance Corporation (the “FDIC”) up to applicable limits. See “Business of Tri Counties Bank”. The Company and the Bank are headquartered in Chico, California.
As a bank holding company, TriCo is subject to the supervision of the Board of Governors of the Federal Reserve System (the “FRB”) under the BHC Act. The Bank is subject to the supervision of the California Department of Financial InstitutionsBusiness Oversight (the “DFI”“DBO”) and the Federal Deposit Insurance Corporation (the “FDIC”). The CompanyFDIC. See “Regulation and Supervision.”
TriCo has five capital trusts, which are all wholly-owned trust subsidiaries formed for the Bank are headquartered in Chico, California.
On July 31, 2003, the Company formed a subsidiary business trust, TriCo Capital Trust I, to issuepurpose of issuing trust preferred securities. On June 22, 2004,securities (“Trust Preferred Securities”) and lending the Company formed a subsidiary business trust, TriCo Capital Trust II,proceeds to issue additionalTriCo. For more information regarding the trust preferred securities. Seesecurities please refer to Note 17, in“Junior Subordinated Debt” to the financial statements at Item 8 of this report for a discussion about the Company’s issuance of trust preferred securities. The Bank, TriCo Capital Trust I and TriCo Capital Trust II are TriCo’s only subsidiaries and TriCo does not conduct any material business operations independent of the Bank, TriCo Capital Trust I and TriCo Capital Trust II.report.
Additional information concerning the Company can be found on our website at www.tcbk.com. Copies of our annual reports on Form 10-K, quarterly reports on Form 10-Q, current reports on Form 8-K and amendments to these reports are available free of charge through the investors relations page of our website, www.tcbk.com, as soon as reasonably practicable after the Company files these reports with the U.S. Securities and Exchange Commission (“SEC”). The information on our website is not incorporated intopart this annual report.
Business of Tri Counties Bank
The Bank was incorporated as a California banking corporation on June 26, 1974, and received its certificate of authority to beginconduct banking operations on March 11, 1975. The Bank engages in the general commercial banking business in the California26 counties of Butte, Contra Costa, Del Norte, Fresno, Glenn, Kern, Lake, Lassen, Madera, Mendocino, Merced, Napa, Nevada, Placer, Sacramento, Shasta, Siskiyou, Stanislaus, Sutter, Tehama, Tulare, Yoloin Northern and Yuba.Central California. The Bank currently operates from 4157 traditional branches and 2516 in-store branches.
The Bank conducts a commercial banking business including accepting demand, savings and time deposits and making commercial, real estate, and consumer loans. It also offers installment note collection, issues cashier’s checks, sells travelers checks and provides safe deposit boxes and other customary banking services. Brokerage services are provided at the Bank’s offices by the Bank’s associationarrangement with Raymond James Financial Services, Inc., an independent financial services provider and broker-dealer. The Bank does not offer trust services or international banking services.
The Bank has emphasized retail banking since it opened. Most of the Bank’s customers are retail customers and small to medium-sized businesses. The Bank emphasizes serving the needs of local businesses, farmers and ranchers, retired individuals and wage earners. The majority of the Bank’s loans are direct loans made to individuals and businesses in northernNorthern and centralCentral California where its branches are located. At December 31, 2012,2014, the total of the Bank’s consumer loans net of deferred fees outstanding was $386,111,000 (24.7%$423,097,000 (18.5%), the total of commercial loans outstanding was $135,528,000 (8.7%$177,643,000 (7.8%), and the total of real estate loans including construction loans of $33,054,000$76,414,000 was $1,043,184,000 (66.6%$1,681,783,000 (73.7%). The Bank takes real estate, listed and unlisted securities, savings and time deposits, automobiles, machinery, equipment, inventory, accounts receivable and notes receivable secured by property as collateral for loans.
Most of the Bank’s deposits are attracted from individuals and business-related sources. No single person or group of persons provides a material portion of the Bank’s deposits, the loss of any one or more of which would have a materially adverse effect on the business of the Bank, nor is a material portion of the Bank’s loans concentrated within a single industry or group of related industries.
In order to attract loanAcquisition of North Valley Bancorp
On October 3, 2014, TriCo completed the acquisition of North Valley Bancorp following receipt of shareholder approval for both institutions and deposit business from individuals and small to medium-sized businesses, branchesall required regulatory approvals. As part of the acquisition, North Valley Bank, set lobby hoursa wholly-owned subsidiary of North Valley Bancorp, merged with and into Tri Counties Bank. In the acquisition, each share of North Valley common stock was converted into the right to accommodate local demands. In general, lobby hours are from 9:00 a.m.receive 0.9433 shares of TriCo common stock. TriCo issued an aggregate of approximately 6.58 million shares of TriCo common stock to 5:00 p.m. Monday through Thursday, and from 9:00 a.m. to 6:00 p.m.North Valley Bancorp shareholders, which was valued at a total of approximately $151 million based on Friday. Some Bank offices also utilize drive-up facilities operating from 9:00 a.m. to 6:00 p.m. The supermarket branches are open from 9:00 a.m. to 7:00 p.m. Monday through Saturday and 11:00 a.m. to 5:00 p.m.the closing trading price of TriCo common stock on Sunday.
The Bank offers 24-hour ATMs at all branch locations. The Bank’s 72 ATMs are linked to several national and regional networks such as CIRRUS and STAR.October 3, 2014 of $23.01. In addition, bankingeach outstanding option to purchase shares of North Valley Bancorp common stock, whether or not previously vested and exercisable, was cancelled and the holder of the option was entitled to receive from North Valley Bancorp, subject to any required tax withholding, an amount in cash, without interest, equal to the excess over the exercise price per share, if any, of 0.9433 multiplied by telephone onthe weighted average closing price of TriCo’s common stock for the 20 days preceding the merger, a 24-hour toll-free number is availabletotal of $1,061,000. In connection with the merger, TriCo assumed North Valley Bancorp’s obligations with respect to all customers. This service allowsits outstanding trust preferred securities.
2
North Valley Bank was a customer to obtain account balancesfull-service commercial bank headquartered in Redding, California. North Valley conducted a commercial and most recent transactions, transfer moneys between accounts, make loan payments, and obtain interest rate information.
In February 1998, the Bank became the first bank based in the Northern Sacramento Valley to offerretail banking services on the Internet. This banking service provides customers one more tool to access their accounts.
Purchasewhich included accepting demand, savings, and Assumption of Certain Assetsmoney market rate deposit accounts and Liabilities of Citizenstime deposits, and making commercial, real estate and consumer loans. North Valley Bank of Northern California
On September 23, 2011, the Bank acquired certain of thehad $935 million in assets and assumed substantially all of the liabilities of Citizens Bank of22 commercial banking offices in Shasta, Humboldt, Del Norte, Mendocino, Yolo, Sonoma, Placer and Trinity Counties in Northern California Nevada City, California (“Citizens”), including substantially all the deposits from the FDIC, as receiver for Citizens. The acquisition was made pursuant to the terms of a purchase and assumption agreement entered into by the Bank and the FDIC. Based upon a preliminary closing with the FDIC as of September 23, 2011, the Bank acquired $167.5 million in loans, $9.4 million in investment securities, and $93.5 million in cash and other assets, and assumed an estimated $239.9 million in deposits, $22.0 million in borrowings, and $0.8 million in other liabilities. The Bank paid no cash or other consideration to acquire Citizens. at June 30, 2014.
See Note 2 in the financial statements at Item 8 of this report for a discussion about this transaction.
Purchase and Assumption of Certain Assets and Liabilities of Granite Community Bank
On May 28, 2010, the Bank acquired certain of the assets and assumed substantially all of the liabilities of Granite Community Bank, N.A., Granite Bay, California (“Granite”), including substantially all the deposits from the FDIC, as receiver for Granite. The acquisition was made pursuant to the terms of a purchase and assumption agreement entered into by the Bank and the FDIC. The Bank acquired $64.8 million in loans, $3.6 million in investment securities, and $31.9 million in cash and other assets, and assumed an estimated $95.0 million in deposits, $5.0 million in borrowings, and $0.05 million in other liabilities. The Bank paid no cash or other consideration to acquire Granite. In connection with the Acquisition, the Bank entered into a loss-sharing agreement with the FDIC that covered approximately $89.3 million of Granite’s assets (before fair value adjustments). The Bank will share in the losses on the asset pools (loans, foreclosed loan collateral, and certain investment securities) covered under the loss-sharing agreement. Pursuant to the terms of the loss sharing agreement, the FDIC is obligated to reimburse the Bank for 80% of losses with respect to covered assets. The Bank will reimburse the FDIC for 80% of recoveries with respect to losses for which the FDIC paid the Bank under the loss sharing agreement. See Note 2 in the financial statements at Item 8 of this report for a discussion about this transaction.
Other Activities
The Bank may in the future engage in other businesses either directly or indirectly through subsidiaries acquired or formed by the Bank subject to regulatory constraints. See “Regulation and Supervision”.
Employees
At December 31, 2012,2014, the Company and the Bank employed 8311,009 persons, including seven executive officers. Full time equivalent employees were 737.965. No employees of the Company or the Bank are presently represented by a union or covered under a collective bargaining agreement. Management believes that its employee relations are good.
Competition
The banking business in California generally, and in the Bank’s primary service area of Northern and Central California specifically, is highly competitive with respect to both loans and deposits. It is dominated by a relatively small number of national and regional banks with many offices operating over a wide geographic area. Among the advantages such major banks have over the Bank is their ability to finance wide ranging advertising campaigns and to allocate their investment assets to regions of high yield and demand. By virtue of their greater total capitalization such institutions have substantially higher lending limits than does the Bank.
In addition to competing with other banks, the Bank competes with savings institutions, commercial banks compete with othercredit unions and the financial markets for funds as a result of the deregulation of the financial services industry.funds. Yields on corporate and government debt securities and other commercial paper may be higher than on deposits, and therefore affect the ability of commercial banks to attract and hold deposits. Commercial banks also compete for available funds with money market instruments and mutual funds. During past periods of high interest rates, money market funds have provided substantial competition to banks for deposits and they may continue to do so in the future. Mutual funds are also a major source of competition for savings dollars.
The Bank relies substantially on local promotional activity, personal contacts by its officers, directors, employees and shareholders, extended hours, personalized service and its reputation in the communities it services to compete effectively.
Regulation and Supervision
General
The Company and the Bank are subject to extensive regulation under both federal and state law. This regulation is intended primarily for the protection of depositors, the deposit insurance fund and the banking system as a whole, and not for the protection of shareholders of the Company. Set forth below is a summary description of the significant laws and regulations applicable to the Company and the Bank. The description is qualified in its entirety by reference to the applicable laws and regulations.
Regulatory Agencies
The Company is a legal entity separate and distinct from the Bank and its other subsidiaries. As a bank holding company, the Company is regulated under the BHC Act, and is subject to supervision, regulation and inspectionexamination by the FRB. The Company is also under the jurisdiction of the SEC and is subject to the disclosure and regulatory requirements of the Securities Act of 1933 and the Securities Exchange Act of 1934, each administered by the SEC. The Company’s common stock is listed on the Nasdaq Global Select market (“Nasdaq”) under the trading symbol “TCBK”” and the Company is, therefore, subject to the rules of Nasdaq for listed companies.
The Bank, as a state chartered bank, is subject to broad federal regulation and oversight extending to all its operations by the FDIC and to state regulation by the DFI.DBO.
Dodd-Frank Wall Street Reform and Consumer Protection Act
On July 21, 2010, the Dodd-Frank Wall Street Reform and Consumer Protection Act (the “Dodd-Frank Act”) was signed into law. The Dodd-Frank Act is intended to effect a fundamental restructuring of federal banking regulation. The Dodd-Frank Act is expected to have a significant impact on our business operations as its provisions take effect. Among the provisions that are likely to affect us are the following:
The creation of a Financial Services Oversight Counsel to identify emerging systemic risks and improve interagency cooperation; Expanded FDIC authority to conduct the orderly liquidation of certain systemically significant non-bank financial companies in addition to depository institutions;
The establishment of strengthened capital and liquidity requirements for banks and bank holding companies, including minimum leverage and risk-based capital requirements no less than the strictest requirements in effect for depository institutions as of the date of enactment;
The requirement by statute that bank holding companies serve as a source of financial strength for their depository institution subsidiaries;
Enhanced regulation of financial markets, including the derivative and securitization markets, and the elimination of certain proprietary trading activities by banks (the “Volcker Rule”);
The termination of investments by the U.S. Treasury under the Troubled Asset Relief Program (“TARP”);
The elimination and phase out of trust preferred securities from Tier 1 capital with certain exceptions;
A permanent increase of the previously implemented temporary increase of FDIC deposit insurance to $250,000 and an extension of federal deposit coverage until January 1, 2013, for the full net amount held by depositors in non-interesting bearing transaction accounts;
Authorization for financial institutions to pay interest on business checking accounts;
Changes in the calculation of FDIC deposit insurance assessments, such that the assessment base will no longer be the institution’s deposit base, but instead, will be its average consolidated total assets less its average tangible equity;
The elimination of remaining barriers to de novo interstate branching by banks;
Expanded restrictions on transactions with affiliates and insiders under Section 23A and 23B of the Federal Reserve Act and lending limits for derivative transactions, repurchase agreements, and securities lending and borrowing transactions;
Provisions that affect corporate governance and executive compensation at most United States publicly traded companies, including (i) stockholder advisory votes on executive compensation, (ii) executive compensation “clawback” requirements for companies listed on national securities exchanges in the event of materially inaccurate statements of earnings, revenues, gains or other criteria, (iii) enhanced independence requirements for compensation committee members, and (iv) giving the SEC authority to adopt proxy access rules which would permit stockholders of publicly traded companies to nominate candidates for election as director and have those nominees included in a company’s proxy statement; and
The creation of a Bureau of Consumer Financial Protection, which is authorized to promulgate and enforce consumer protection regulations relating to bank and non-bank financial products and which may examine and enforce its regulations on banks with more than $10 billion in assets.
The numerous rules and regulations that have been promulgated and are yet to be promulgated and finalized under Dodd-Frank are likely to significantly impact the Company’s operations and compliance costs, such as changes in FDIC assessments, the permitted payment of interest on demand deposits and projected enhanced consumer compliance requirements. More stringent capital, liquidity and leverage requirements are expected to impact the Company’s business as Dodd-Frank is fully implemented. The federal agencies have issued many proposed rules pursuant to provisions of Dodd Frank which will apply directly to larger institutions with either more than $50 billion in assets or more than $10 billion in assets, such as proposed regulations for financial institutions deemed systemically significant, proposed rules requiring capital plans and stress tests and the Reserve Board’s proposed rules to implement the Volcker Rule, as well as a final rule for the largest (over $250 billion in assets) and internationally active banks setting a new minimum risk-based capital floor. These and other requirements and policies imposed on larger institutions, such as expected countercyclical requirements for increased capital in times of economic expansion and a decrease in times of contraction, may subsequently become expected “best practices” for smaller institutions, such as the Company. Therefore, as a result of the changes required by Dodd-Frank, the profitability of the Company’s business activities may be impacted and the Company may be required to make changes to certain of its business practices. Such developments and new standards would require the Company to devote even more management attention and resources to evaluate and make any changes necessary to comply with new statutory and regulatory requirements.
The Bank Holding Company Act
The Company is registered as a bank holding company under the BHC Act. In general, the BHC Act limits the business of bank holding companies to banking, managing or controlling banks and other activities that the Federal ReserveFRB has determined to be so closely related to banking as to be a proper incident thereto. As a resultbank holding company, TriCo is required to file reports with the FRB and the FRB periodically examines the Company. Under the Dodd-Frank Wall Street Reform and Consumer
3
Protection Act (the “Dodd-Frank Act”), a bank holding company is required to serve as a source of financial and managerial strength to its subsidiary bank and, under appropriate circumstances, to commit resources to support the Gramm-Bliley Act, which amended the BHC Act,subsidiary bank. Qualified bank holding companies that areelect to be financial holding companies may engage in any activity, or acquire and retain the shares of a company engaged in any activity, that is either (i) financial in nature or incidental to such financial activity (as determined by the FRB in consultation with the Office of the Comptroller of the Currency (the “OCC”)) or (ii) complementary to a financial activity, and that does not pose a substantial risk to the safety and soundness of depository institutions or the financial system generally (as determined solely by the FRB). Activities that are financial in nature include securities underwriting and dealing, insurance underwriting and agency, and making merchant banking investments.
If a bank holding company seeks to engage in the broader range of activities that are permitted under the BHC Act for financial holding companies, (i) all of its depository institution subsidiaries must be “well capitalized” and “well managed” and (ii) it must file a declaration with the FRB that it elects to be a financial holding company. A depository institution subsidiary is considered to be “well capitalized” if it satisfies the requirements for this status discussed in the section captioned “Capital Adequacy and Prompt Corrective Action,” included elsewhere in this item. A depository institution subsidiary is considered “well managed” if it received a composite rating and management rating of at least “satisfactory” in its most recent examination. In addition, the subsidiary depository institution must have received a rating of at least “satisfactory” in its most recent examination under the Community Reinvestment Act. (See the section captioned “Consumer Protection Laws and Regulations” included elsewhere in this item.) The Company has not elected to become a financial holding company.
The BHC Act, the Federal Bank Merger Act, and other federal and state statutes regulate acquisitions of commercial banks. The BHC Act requires the prior approval of the FRB for the direct or indirect acquisition of more than 5 percent of the voting shares of a commercial bank or its parent holding company. Under the Federal Bank Merger Act, the prior approval of an acquiring bank’s primary federal regulator is required before it may merge with another bank or purchase the assets or assume the deposits of another bank. In reviewing applications seeking approval of merger and acquisition transactions, the bank regulatory authorities will consider, among other things, the competitive effect and public benefits of the transactions, the capital position of the combined organization, the applicant’s performance record under the Community Reinvestment Act, consumer compliance, fair housing laws and the effectiveness of the subject organizations in combating money laundering activities.
The Consumer Financial Protection Bureau
The Dodd-Frank Act created the Consumer Financial Protection Bureau (the “CFPB”) as an independent entity with broad rulemaking, supervisory and enforcement authority over consumer financial products and services, including deposit products, residential mortgages, home-equity loans and credit cards. The CFPB’s functions include investigating consumer complaints, conducting market research, rulemaking, supervising and examining bank consumer transactions, and enforcing rules related to consumer financial products and services. CFPB regulations and guidance apply to all financial institutions and banks with $10 billion or more in assets are subject to examination by the CFPB. Banks with less than $10 billion in assets, including the Bank, will continue to be examined for compliance by their primary federal banking agency. Significant recent CFPB developments that may affect the Bank’s operations and compliance costs include:
The Bank is not subject to examination by the CFPB but is required to comply with CFPB rules and regulations.
Safety and Soundness Standards
The Federal Deposit Insurance Corporation Improvement Act of 1991 (“FDICIA”) implemented certain specific restrictions on transactions and required the regulators to adopt overall safety and soundness standards for depository institutions related to internal control, loan underwriting and documentation, and asset growth. Among other things, FDICIA limits the interest rates paid on deposits by undercapitalized institutions, the use of brokered deposits and the aggregate extension of credit by a depository institution to an executive officer, director, principal stockholder or related interest, and reduces deposit insurance coverage for deposits offered by undercapitalized institutions for deposits by certain employee benefits accounts.
Section 39 to the Federal Deposit Insurance Act requires the agencies to establish safety and soundness standards for insured financial institutions covering:
internal controls, information systems and internal audit systems;
loan documentation;
credit underwriting;
interest rate exposure;
asset growth;
compensation, fees and benefits;
asset quality, earnings and stock valuation; and
excessive compensation for executive officers, directors or principal shareholders which could lead to material financial loss.
If an agency determines that an institution fails to meet any standard established by the guidelines, the agency may require the financial institution to submit to the agency an acceptable plan to achieve compliance with the standard. If the agency
4
requires submission of a compliance plan and the institution fails to timely submit an acceptable plan or to implement an accepted plan, the agency must require the institution to correct the deficiency. An institution must file a compliance plan within 30 days of a request to do so from the institution’s primary federal regulatory agency. The agencies may elect to initiate enforcement action in certain cases rather than rely on an existing plan particularly where failure to meet one or more of the standards could threaten the safe and sound operation of the institution.
Restrictions on Dividends and Distributions
A California corporation such as TriCo may make a distribution to its shareholders ifto the extent that either the corporation’s retained earnings equal at leastmeet or exceed the amount of the proposed distribution or if after giving effect to the distribution, the value of the corporation’s assets exceed the amount of its liabilities plus the amount of shareholders preferences, if any, and certain other conditions are met. It is the FRB’s policy that bank holding companies should generally pay dividends on common stock only out of income available over the past year, and only if prospective earnings retention is consistent with the organization’s expected future needs and financial condition.
The primary source of funds for payment of dividends by TriCo to its shareholders has been and will be the receipt of dividends and management fees from the Bank. TriCo’s ability to receive dividends from the Bank is limited by applicable state and federal law. Under the California Financial Code, funds available for cash dividend payments by a bank are restricted to the lesser of: (i) retained earnings; or (ii) the bank’s net income for its last three fiscal years (less any distributions to shareholders made during such period). However, with the prior approval of the Commissioner of the DFI,DBO, a bank may pay cash dividends in an amount not to exceed the greatest of the: (1) retained earnings of the bank; (2) net income of the bank for its last fiscal year; or (3) net income of the bank for its current fiscal year. However, if the DFIDBO finds that the shareholders’ equity of the bank is not adequate or that the payment of a dividend would be unsafe or unsound, the Commissioner may order the bank not to pay a dividend to shareholders.
Additionally, under FDICIA, a bank may not make any capital distribution, including the payment of dividends, if after making such distribution the bank would be in any of the “undercapitalized” categories under the FDIC’s Prompt Corrective Action regulations. A bank is undercapitalized for this purpose if its leverage ratios, Tier 1 risk-based capital level and total risk-based capital ratio are not at least four percent, four percent and eight percent, respectively.
The FRB, FDIC and the DFIDBO have authority to prohibit a bank holding company or a bank from engaging in practices which are considered to be unsafe and unsound. Depending on the financial condition of TriCo and the Bank and upon other factors, the FRB, FDIC or the DFIDBO could determine that payment of dividends or other payments by TriCo or the Bank might constitute an unsafe or unsound practice.
Consumer Protection Laws and Regulations
The Company is subject to many federal consumer protection statues and regulations, some of which are discussed below.
The Community Reinvestment Act of 1977 (“CRA”) is intended to encourage insured depository institutions, while operating safely and soundly, to help meet the credit needs of their communities. This actThe CRA specifically directs the federal regulatory agencies to assess a bank’s record of helping meet the credit needs of its entire community, including low- and moderate-income neighborhoods, consistent with safe and sound practices. This actThe CRA further requires the agencies to take a financial institution’s record of meeting its community credit needs into account when evaluating applications for, among other things, domestic branches, mergers or acquisitions, or holding company formations. The federal banking agencies userate depository institutions’ compliance with the Community Reinvestment Act assessment factors in order to provide a rating to the financial institution.Reinvestment. The ratings range from a high of “outstanding” to a low of “substantial noncompliance.” A less than “satisfactory” rating would likely result in the suspension of any growth of the Bank through acquisitions or opening de novo branches until the rating is improved. As of its most recent CRA examination, the Bank’s CRA rating was “Satisfactory.”
The Equal Credit Opportunity Act generally prohibits discrimination in any credit transaction, whether for consumer or business purposes, on the basis of race, color, religion, national origin, sex, marital status, age (except in limited circumstances), receipt of income from public assistance programs, or good faith exercise of any rights under the Consumer Credit Protection Act.
The Truth-in-Lending Act is designed to ensure that credit terms are disclosed in a meaningful way so that consumers may compare credit terms more readily and knowledgeably.
The Fair Housing Act regulates many practices, including making it unlawful for any lender to discriminate in its housing-related lending activities against any person because of race, color, religion, national origin, sex, handicap or familial status.
The Home Mortgage Disclosure Act grew out of public concern over credit shortages in certain urban neighborhoods and provides public information that will help show whether financial institutions are serving the housing credit needs of the neighborhoods and communities in which they are located. This act also includes a “fair lending” aspect that requires the collection and disclosure of data about applicant and borrower characteristics as a way of identifying possible discriminatory lending patterns and enforcing anti-discrimination statutes.
5
The Real Estate Settlement Procedures Act requires lenders to provide borrowers with disclosures regarding the nature and cost of real estate settlements. Also, this act prohibits certain abusive practices, such as kickbacks, and places limitations on the amount of escrow accounts.
Penalties under the above laws may include fines, reimbursements, injunctive relief and other penalties.
USA Patriot Act of 2001
The USA Patriot Act was enacted in 2001 to combat money laundering and terrorist financing. The impact of the Patriot Act on financial institutions is significant and wide ranging. The Patriot Act contains sweeping anti-money laundering and financial transparency laws and requires various regulations, including:
due diligence requirements for financial institutions that administer, maintain, or manage private bank accounts or correspondent accounts for non-U.S. persons,
standards for verifying customer identification at account opening,
rules to promote cooperation among financial institutions, regulators, and law enforcement entities to assist in the identification of parties that may be involved in terrorism or money laundering,
reports to be filed by non-financial trades and business with the Treasury Department’s Financial Crimes Enforcement Network for transactions exceeding $10,000, and
the filing of suspicious activities reports by securities brokers and dealers if they believe a customer may be violating U.S. laws and regulations.
Capital Requirements
Federal regulation imposes upon all financial institutions a variable system of risk-based capital guidelines designed to make capital requirements sensitive to differences in risk profiles among banking organizations, to take into account off-balance sheet exposures and to promote uniformity in the definition of bank capital uniform nationally.
The Bank and the Company are subject to the minimum capital requirements of the FDIC and the FRB, respectively. As a result of these requirements, the growth in assets is limited by the amount of its capital as defined by the respective regulatory agency. Capital requirements may have an effect on profitability and the payment of dividends on the common stock of the Bank and the Company. If an entity is unable to increase its assets without violating the minimum capital requirements or is forced to reduce assets, its ability to generate earnings would be reduced.
The FRB and the FDIC have adopted guidelines utilizing a risk-based capital structure. Qualifying capital is divided into two tiers. Tier 1 capital consists generally of common stockholders’ equity, qualifying noncumulative perpetual preferred stock,
qualifying cumulative perpetual preferred stock (up to 25% of total Tier 1 capital) and minority interests in the equity accounts of consolidated subsidiaries, less goodwill and certain other intangible assets. Tier 2 capital consists of, among other things, allowance for loan and lease losses up to 1.25% of weighted risk assets, other perpetual preferred stock, hybrid capital instruments, perpetual debt, mandatory convertible debt securities, subordinated debt and intermediate-term preferred stock. Tier 2 capital qualifies as part of total capital up to a maximum of 100% of Tier 1 capital. Amounts in excess of these limits may be issued but are not included in the calculation of risk-based capital ratios. Under these risk-based capital guidelines in effect as of December 31, 2014, the Bank and the Company are required to maintain capital equal to at least 8% of its assets, of which at least 4% must be in the form of Tier 1 capital.
The guidelines also require the Company and the Bank to maintain a minimum leverage ratio of 4% of Tier 1 capital to total assets (the “leverage ratio”). The leverage ratio is determined by dividing an institution’s Tier 1 capital by its quarterly average total assets, less goodwill and certain other intangible assets. The leverage ratio constitutes a minimum requirement for the most well-run banking organizations. See Note 29 in the financial statements at Item 8 of this report for a discussion about the Company’s risk-based capital and leverage ratios.
New Capital Rules and the Basel Accords
The currentIn July, 2013, the federal banking agencies approved final rules that substantially amend the regulatory risk-based capital guidelines which applyrules applicable to the CompanyTriCo and the Bank are based uponBank. The final rules implement the 1988“Basel III” regulatory capital accord (referredreforms and changes required by the Dodd-Frank Act. “Basel III” refers to as “Basel I”) oftwo consultative documents released by the International Basel Committee on Banking Supervision (the “Basel Committee”), a committeein December 2009, the rules text released in December 2010, and loss absorbency rules issued in January 2011, which include significant changes to bank capital, leverage and liquidity requirements.
The rules include new risk-based capital and leverage ratios, which will be phased in from 2015 to 2019, and will refine the definition of central banks and bank supervisors and regulators from the major industrialized countries.what constitutes “capital” for purposes of calculating those ratios. The Basel Committee develops broad policy guidelines for use by each country’s supervisors in determining the supervisory policies they apply. A new framework and accord, referred to as Basel II, evolved from 2004 to 2006 out of the efforts to revise capital adequacy standards for internationally active banks. Basel II emphasizes internal assessment of credit, market and operational risk; supervisory assessment and market discipline in determining minimum capital level requirements and became mandatory for large or “core” international banks outside the United States in 2008 (total assets of $250 billion or more or consolidated foreign exposures of $10 billion or more). Basel II was optional for others, and if adopted, must first be complied within a “parallel run” for two years along with the existing Basel I standards. The Company is not required to comply with Basel II and has not elected to apply the Basel II standards.
The United States federal banking agencies issued a proposed rule for banking organizations that do not use the “advanced approaches” under Basel II. While this proposed rule generally parallels the relevant approaches under Basel II, it diverges where United States markets have unique characteristics and risk profiles. A definitive final rule has not yet been issued. The United States banking agencies indicated, however, that they would retain the minimum leverage requirement for all United States banks.
In 2010 and 2011, the Basel Committee finalized proposed reforms on capital and liquidity, generally referred to as Basel III, to reconsider regulatory capital standards, supervisory and risk-management requirements and additional disclosures to further strengthen the Basel II framework in response to the worldwide economic downturn. Although Basel III is intended to be implemented by participating countries for large, internationally active banks, its provisions are likely to be considered by United States banking regulators in developing new regulations applicable to other banks in the United States. Basel III provides for increases in the minimum Tier 1 common equity ratioTriCo and the minimum requirement forBank as of January 1, 2015 under the final rules are: (i) a new common equity Tier 1 capital ratio. Basel III additionally includesratio of 4.5%; (ii) a Tier 1 capital ratio of 6% (increased from 4%); (iii) a total capital ratio of 8% (unchanged from previous rules); and (iv) a Tier 1 leverage ratio of 4% for all institutions. The final rules also establish a “capital conservation buffer” on top ofabove the new regulatory minimum requirement designed to absorb losses in periods of financial and economic distress; and an additional required countercyclical buffer percentage to be implemented according to a particular nation’s circumstances. These capital requirements, are further supplemented under Basel III by a non-risk-based leverage ratio. Basel III also reaffirms the Basel Committee’s intention to introduce higher capital requirements on securitization and trading activities.
The Basel III liquidity proposals have three main elements: (i) a “liquidity coverage ratio” designed to meet the bank’s liquidity needs over a 30-day time horizon under an acute liquidity stress scenario, (ii) a “net stable funding ratio” designed to promote more medium and long term funding over a one year time horizon, and (iii) a setwhich must consist entirely of monitoring tools that the Basel Committee indicates should be considered as the minimum types of information that banks should report to supervisors.
Implementation of Basel III in the United States will require regulations and guidelines by United States banking regulators, which may differ in significant ways from the recommendations published by the Basel Committee. The new Basel III capital standards were scheduled to be phased in from January 1, 2013 until January 1, 2019 but United States banking regulators have delayed the adoption of final rules implementing these standards. It is unclear how smaller banking organizations in the United States will be subject to these regulations and guidelines. Basel III standards, if adopted, would lead to significantly higher capital requirements, higher capital charges and more restrictive leverage and liquidity ratios. The Basel III standards, if adopted, could lead to significantly higher capital requirements, higher capital charges and more restrictive leverage and liquidity ratios. The standards would, among other things:
Impose more restrictive eligibility requirements forcommon equity Tier 1 and Tier 2 capital;
Increase the minimum Tier 1 common equity ratio to 4.5%, net of regulatory deductions, and introduce acapital. The capital conservation buffer will be phased-in over four years beginning on January 1, 2016, as follows: the maximum buffer will be 0.625% of an additionalrisk-weighted assets for 2016, 1.25% for 2017, 1.875% for 2018, and 2.5% offor 2019 and thereafter. This will result in the following minimum ratios beginning in 2019: (i) a common equity to risk-weighted assets, raising the target minimum common equity ratio to 7.0%;
Increase the minimum Tier 1 capital ratio toof 7.0%, (ii) a Tier 1 capital ratio of 8.5% inclusive of the capital conservation buffer;
Increase the minimum, and (iii) a total capital ratio of 10.5%. Under the final rules, institutions are subject to 10.5% inclusivelimitations on paying dividends, engaging in share repurchases, and paying discretionary bonuses if its capital level falls below the buffer amount. These limitations establish a maximum percentage of eligible retained income that could be utilized for such actions.
Basel III provided discretion for regulators to impose an additional buffer, the capital conservation buffer; and
Introduce a countercyclical capital“countercyclical buffer,” of up to 2.5% of common equity or other fully loss absorbingTier 1 capital forto take into account the macro-financial environment and periods of excessexcessive credit growth. However, the final rules permit the countercyclical buffer to be applied only to “advanced approach banks” ( i.e., banks with $250 billion or more in total assets or $10 billion or more in total foreign exposures), which currently excludes TriCo and the Bank. The final rules also implement revisions and clarifications consistent with Basel III regarding the various components of Tier 1 capital, including common equity, unrealized gains and losses, as well as certain instruments that will no longer
Introduces6
qualify as Tier 1 capital, some of which will be phased out over time. However, the final rules provide that small depository institution holding companies with less than $15 billion in total assets as of December 31, 2009 (such as TriCo) will be able to permanently include non-qualifying instruments that were issued and included in Tier 1 or Tier 2 capital prior to May 19, 2010 in additional Tier 1 or Tier 2 capital until they redeem such instruments or until the instruments mature.
The final rules also contain revisions to the prompt corrective action framework, which is designed to place restrictions on insured depository institutions, including the Bank, if their capital levels begin to show signs of weakness. These revisions became effective on January 1, 2015. Under the prompt corrective action requirements, which are designed to complement the capital conservation buffer, insured depository institutions will be required to meet the following increased capital level requirements in order to qualify as “well capitalized:” (i) a non-risk adjustednew common equity Tier 1 capital ratio of 6.5%; (ii) a Tier 1 capital ratio of 8% (increased from 6%); (iii) a total capital ratio of 10% (unchanged from current rules); and (iv) a Tier 1 leverage ratio of 3.0%, based on a measure5% (increased from 4%).
The final rules also set forth certain changes for the calculation of totalrisk-weighted assets, which will be phased in beginning January 1, 2015. The standardized approach final rule utilizes an increased number of credit risk exposure rather thancategories and risk weights, and also addresses: (i) an alternative standard of creditworthiness consistent with Section 939A of the Dodd-Frank Act Act; (ii) revisions to recognition of credit risk mitigation; (iii) rules for risk weighting of equity exposures and past due loans; (iv) revised capital treatment for derivatives and repo-style transactions; and (v) disclosure requirements for top-tier banking organizations with $50 billion or more in total assets and new liquidity standards.that are not subject to the “advance approach rules” that apply to banks with greater than $250 billion in consolidated assets. We believe that we were in compliance with the requirements applicable to us as set forth in the final rules as of January 1, 2015.
Prompt Corrective Action
Prompt Corrective Action Regulations of the federal bank regulatory agencies establish five capital categories in descending order (well capitalized, adequately capitalized, undercapitalized, significantly undercapitalized and critically undercapitalized), assignment to which depends upon the institution’s total risk-based capital ratio, Tier 1 risk-based capital ratio, and leverage ratio. Institutions classified in one of the three undercapitalized categories are subject to certain mandatory and discretionary supervisory actions, which include increased monitoring and review, implementation of capital restoration plans, asset growth restrictions, limitations upon expansion and new business activities, requirements to augment capital, restrictions upon deposit gathering and interest rates, replacement of senior executive officers and directors, and requiring divestiture or sale of the institution. The Bank has been classified as well-capitalized since adoption of these regulations.
Premiums for Deposit Insurance
Deposit accounts in the Bank are insured by the FDIC, generally up to a maximum of $250,000 per separately insured depositor. The Bank’s deposits are subject to FDIC deposit insurance assessments. The Bank pays insurance assessments based on its consolidated total assets less tangible equity capital. ThisThe assessment rate is based on the risk category of the institution. To determine the total base assessment rate, the FDIC first establishes an institution’s initial base assessment rate and then adjusts the initial base assessment based upon an institution’s levels of unsecured debt, secured liabilities, and brokered deposits. The total base assessment rate ranges from 2.5 to 45 basis points of the institution’s average consolidated total assets less tangible equity capital.
In May of 2009, the FDIC adopted a final rule imposing a five basis point special assessment on each insured depository institution’s assets minus Tier 1 capital as of June 30, 2009. As a result, the Bank’s expense for deposit insurance for the fiscal year ended December 31, 2009 includes approximately $933,000 for this emergency assessment which was levied as of June 30, 2009 and paid on September 30, 2009.
In November of 2009, the FDIC adopted an amendment to its assessment regulations to require insured institutions to prepay, on December 30, 2009, their estimated quarterly risk-based assessments for the fourth quarter of calendar 2009 and for all of the calendar years 2010, 2011 and 2012. The amount of the prepayment was generally determined based upon an institution’s assessment rate in effect on September 30, 2009, adjusted to reflect a 5% growth and as an assessment rate increase of three cents per $100 of deposits effective January 1, 2011. The Bank’s prepayment amount was $10,544,000.
On November 21, 2008, the Board of Directors of the FDIC adopted a final rule relating to the Temporary Liquidity Guarantee Program (“TLG Program”). The TLG Program was intended to counter the system-wide crisis in the nation’s financial sector. Under the TLG Program the FDIC (i) guaranteed, through the earlier of maturity or June 30, 2012, certain newly issued senior unsecured debt issued by participating institutions on or after October 14, 2008, and before June 30, 2009 and (ii) provided unlimited FDIC deposit insurance coverage for non-interest bearing transaction deposit accounts, Negotiable Order of Withdrawal accounts paying not more than 0.25% interest per annum and Interest on Lawyers Trust Accounts held at participating FDIC- insured institutions through December 31, 2010. The Dodd-Frank Act extended unlimited deposit insurance to non-interest bearing transaction accounts through December 31, 2012. The fee assessment for deposit insurance coverage was 10 basis points per quarter on amounts in covered accounts exceeding $250,000. On December 5, 2008, the Company elected to participate in both guarantee programs. The Company had issued no debt under the TLG Program on December 31, 2012 when the program expired.
The Bank is generally unable to control the amount of premiums that it is required to pay for FDIC insurance. If there are additional bank or financial institution failures or if the FDIC otherwise determines, the Bank may be required to pay even higher FDIC premiums than the recently increased levels. These announced increases and any future increases in FDIC insurance premiums may have a material and adverse affect on the Company’s earnings and could have a material adverse effect on the value of, or market for, the Company’s common stock.
The FDIC may terminate a depository institution’s deposit insurance upon a finding that the institution’s financial condition is unsafe or unsound or that the institution has engaged in unsafe or unsound practices that pose a risk to the DIF or that may prejudice the interest of the bank’s depositors. The termination of deposit insurance for the Bank would also result in the revocation of the Bank’s charter by the DFI.DBO.
Interstate Branching
The Dodd-Frank Act authorized national and state banks to establish branches in other states to the same extent as a bank chartered by that state would be permitted to branch. Previously, banks could only establish branches in other states if the host state expressly permitted out-of-state banks to establish branches in that state. Accordingly, banks will be able to enter new markets more freely.
Anti-Money Laundering Laws
A series of banking laws and regulations beginning with the bank Secrecy Act in 1970 requires banks to prevent, detect, and report illicit or illegal financial activities to the federal government to prevent money laundering, international drug trafficking, and terrorism. Under the Uniting and Strengthening America by Providing Appropriate Tools Required to
7
Intercept and Obstruct Terrorism Act of 2001, financial institutions are subject to prohibitions against specified financial transactions and account relationships, requirements regarding the Customer Identification Program, as well as enhanced due diligence and “know your customer” standards in their dealings with high risk customers, foreign financial institutions, and foreign individuals and entities.
Transactions with Affiliates
Banks are also subject to certain restrictions imposed by the Federal Reserve Act on extensions of credit to executive officers, directors, principal shareholders (including the Company) or any related interest of such persons. Extensions of credit must be made on substantially the same terms, including interest rates and collateral as, and follow credit underwriting procedures that are not less stringent than, those prevailing at the time for comparable transactions with persons not affiliated with the bank, and must not involve more than the normal risk of repayment or present other unfavorable features. Banks are also subject to certain lending limits and restrictions on overdrafts to such persons. Regulation W requires that certain transactions between the Bank and its affiliates, including its holding company, be on terms substantially the same, or at least as favorable to the Bank, as those prevailing at the time for comparable transactions with or involving nonaffiliated companies or, in the absence of comparable transactions, on terms and under circumstances, including credit standards, that in good faith would be offered to or would apply to nonaffiliated companies.
Impact of Monetary Policies
Banking is a business that depends on interest rate differentials. In general, the difference between the interest paid by a bank on its deposits and other borrowings, and the interest rate earned by banks on loans, securities and other interest-earning assets comprises the major source of banks’ earnings. Thus, the earnings and growth of banks are subject to the influence of economic conditions generally, both domestic and foreign, and also to the monetary and fiscal policies of the United States and its agencies, particularly the FRB. The FRB implements national monetary policy, such as seeking to curb inflation and combat recession, by its open-market dealings in United States government securities, by adjusting the required level of reserves for financial institutions subject to reserve requirements and through adjustments to the discount rate applicable to borrowings by banks which are members of the FRB. The actions of the FRB in these areas influence the growth of bank loans, investments and deposits and also affect interest rates. The nature and timing of any future changes in such policies and their impact on the Company cannot be predicted. In addition, adverse economic conditions could make a higher provision for loan losses a prudent course and could cause higher loan loss charge-offs, thus adversely affecting the Company’s net earnings.
Securities Laws
The Company is subject to the periodic reporting requirements of the Securities and Exchange Act of 1934, as amended, which include filing annual, quarterly and other current reports with the Securities and Exchange Commission. The Sarbanes-Oxley Act was enacted in 2002 to protect investors by improving the accuracy and reliability of corporate disclosures made pursuant to securities laws. Among other things, this act:
prohibits a registered public accounting firm from performing specified nonaudit services contemporaneously with a mandatory audit,
requires the chief executive officer and chief financial officer of an issuer to certify each annual or quarterly report filed with the Securities and Exchange Commission,
requires an issuer to disclose all material off-balance sheet transactions that may have a material effect on an issuer’s financial status, and
prohibits insider transactions in an issuer’s stock during lock-out periods of an issuer’s pension plans.
The Company is also required to comply with the rules and regulations of The NASDAQ Stock Market, Inc., on which its common stock is listed.
In analyzing whether to make or continue holding an investment in the Company, investors should consider, among other factors, the following:
Risks Related to the Nature and Geographic Area of Our Business
We face a challenging economic environment. A return of recessionary conditions in the United States and in California in particular could result in increases in our level of non-performing loans and/or reduce demand for our products and services, which could have an adverse effect on our results of operations.
From December 2007 through June 2009, the U.S. economy was in recession. Business activity across a wide range of industries and regions in the U. S. was greatly reduced, the value of real estate decreased and unemployment increased significantly. Although economic conditions have improved, certain sectors, such as real estate and manufacturing, remain weak and unemployment remains high. Business activity across a wide range of industries and regions is greatly reduced and local governments and many businesses continue to be in serious difficulty due to the lack of consumer spending.
Overall, during 2012, the business environment has been adverse for many households and businesses in California and the United States as unemployment remains high. In addition, concerns over the United States’ credit rating, the European sovereign debt crisis, among other economic indicators, have contributed to increased volatility in the capital markets and diminished expectations for the U.S. economy. These factors have caused, and may continue to cause, many financial institutions to seek additional capital, to merge with larger and stronger institutions and, in some cases, to fail. While we continue to take steps to decrease and limit our exposure to problem loans, we nonetheless retain direct exposure to the residential and commercial real estate markets and the economy generally, so we are affected by these events.
There can be no assurance that these conditions will improve in the near term. A return of recessionary conditions and/or continued negative developments in the domestic and international credit markets may significantly affect the markets in which we do business, the value of our loans and investments, and our ongoing operations, costs and profitability. Further declines in real estate values and sales volumes and continued high unemployment levels may result in higher than expected loan delinquencies and a decline in demand for our products and services. These negative events may cause us to incur losses and may adversely affect our capital, financial condition and results of operations. .
Our business may be adversely affected by business conditions in Northern and Central California.
We conduct most of our business in Northern and Central California. As a result of this geographic concentration, our results are impacted by the difficult economic conditions in California. The current and on-going deterioration in the economic conditions in California could result in the following consequences, any of which could have a material adverse effect on our business, financial condition, results of operations and cash flows:
problem assets and foreclosures may increase,
demand for our products and services may decline,
low cost or non-interest bearing deposits may decrease, and
collateral for loans made by us, especially real estate, may decline in value, in turn reducing customers’ borrowing power, and reducing the value of assets and collateral associated with our existing loans.
In view of the concentration of our operations and the collateral securing our loan portfolio in both Northern and Central California, we may be particularly susceptible to the adverse effects of any of these consequences, any of which could have a material adverse effect on our business, financial condition, results of operations and cash flows.
We are exposed to risks in connection with the loans we make.
A significant source of risk for us arises from the possibility that we will sustain losses because borrowers, guarantors and related parties may fail to perform in accordance with the terms of their loans. Our earnings are significantly affected by our ability to properly originate, underwrite and service loans. We have underwriting and credit monitoring procedures and credit policies, including the establishment and review of the allowance for loan losses, that we believe to be appropriate to minimize this risk by assessing the likelihood of nonperformance, tracking loan performance and diversifying our respective loan portfolios. Such policies and procedures, however, may not prevent unexpected losses that could adversely affect our results of operations. We could sustain losses if we incorrectly assess the creditworthiness of our borrowers or fail to detect or respond to deterioration in asset quality in a timely manner.
Our allowance for loan losses may not be adequate to cover actual losses.
Like allother financial institutions, we maintain an allowance for loan losses to provide for loan defaults and non-performance. Our allowance for loan losses may not be adequate to cover actual loan losses, and future provisions for loan losses could materially and adversely affect our business, financial condition, results of operations and cash flows. The allowance for loan losses reflects our estimate of the probable losses in our loan portfolio at the relevant balance sheet date. Our allowance for loan losses is based on prior experience, as well as an evaluation of the known risks in the current portfolio, composition and growth of the loan portfolio and economic factors. The determination of an appropriate level of loan loss allowance is an inherently difficult process and is based on numerous assumptions. The amount of future losses is susceptible to changes in economic, operating and other conditions, including changes in interest rates, that may be beyond our control and these losses may exceed current estimates. Federal and state regulatory agencies, as an integral part of their examination process, review our loans and allowance for loan losses. While we believe that our allowance for loan losses is adequate to cover current losses, we cannot assure you that we will not increase the allowance for loan losses further or that the allowance will be adequate to absorb loan losses we actually incur. Either of these occurrences could have a material adverse affect on our business, financial condition and results of operations.
8
Our business may be adversely affected by business conditions in Northern and Central California.
We conduct most of our business in Northern and Central California. As a result of this geographic concentration, our results are impacted by the difficult economic conditions in California. A deterioration in the economic conditions or a prolonged delay in economic recovery in California could result in the following consequences, any of which could have a material adverse effect on our business, financial condition, results of operations and cash flows:
In view of the concentration of our operations and the collateral securing our loan portfolio in both Northern and Central California, we may be particularly susceptible to the adverse effects of any of these consequences, any of which could have a material adverse effect on our business, financial condition, results of operations and cash flows.
A significant majority of the loans in our portfolio are secured by real estate and thea downturn in our real estate markets could hurt our business.
TheA downturn in our real estate markets or prolonged delay in economic recovery in California could hurt our business because manymost of our loans are secured by real estate. Real estate values and real estate markets are generally affected by changes in national, regional or local economic conditions, fluctuations in interest rates and the availability of loans to potential purchasers, changes in tax laws and other governmental statutes, regulations and policies and acts of nature. As real estate prices decline, the value of real estate collateral securing our loans is reduced. As a result, our ability to recover on defaulted loans by foreclosing and selling the real estate collateral could then be diminished and we would be more likely to suffer losses on defaulted loans. As of December 31, 2012,2014, approximately 89.4%90.9% of the book value of our loan portfolio consisted of loans collateralized by various types of real estate. Substantially all of our real estate collateral is located in California. So if there is a significant furtheradversely decline in real estate values in California, the collateral for our loans will provide less security. Real estate values could also be affected by, among other things, earthquakes, drought and national disasters particular to California in particular.our markets. Any such downturn could have a material adverse effect on our business, financial condition, results of operations and cash flows.
We depend on key personnel and the loss of one or more of those key personnel may materially and adversely affect our prospects.
Competition for qualified employees and personnel in the banking industry is intense and there are a limited number of qualified persons with knowledge of, and experience in, the California community banking industry. The process of recruiting personnel with the combination of skills and attributes required to carry out our strategies is often lengthy. Our success depends to a significant degree upon our ability to attract and retain qualified management, loan origination, finance, administrative, marketing and technical personnel and upon the continued contributions of our management and personnel. In particular, our success has been and continues to be highly dependent upon the abilities of our senior management team of Messrs. Smith, O’Sullivan, Bailey, Reddish, Carney, MillerRios, Hunter and Rios,Ms. Ward, who have expertise in banking and experience in the California markets we serve and have targeted for future expansion. We also depend upon a number of other key executives who are California natives or are long-time residents and who are integral to implementing our business plan. The loss of the services of any one of our senior executive management team or other key executives could have a material adverse effect on our business, financial condition, results of operations and cash flows.
We are exposed to risk of environmental liabilities with respect to properties to which we take title.
In the course of our business, we may foreclose and take title to real estate and could be subject to environmental liabilities with respect to these properties. We may be held liable to a governmental entity or to third parties for property damage, personal injury, investigation and clean-up costs incurred by these parties in connection with environmental contamination, or may be required to investigate or clean-up hazardous or toxic substances, or chemical releases at a property. The costs associated with investigation or remediation activities could be substantial. In addition, if we are the owner or former owner of a contaminated site, we may be subject to common law claims by third parties based on damages and costs resulting from environmental contamination emanating from the property. If we become subject to significant environmental liabilities, our business, financial condition, results of operations and cash flows could be materially adversely affected.
9
Strong competition in California could hurt our profits.
Competition in the banking and financial services industry is intense. Our profitability depends upon our continued ability to successfully compete. We compete exclusively in northernNorthern and centralCentral California for loans, deposits and customers with commercial banks, savings and loan associations, credit unions, finance companies, mutual funds, insurance companies, and brokerage and investment banking firms. In particular, our competitors include several major financial companies whose greater resources may afford them a marketplace advantage by enabling them to maintain numerous locations and mount extensive promotional and advertising campaigns. Additionally, banks and other financial institutions with larger capitalization and financial intermediaries not subject to bank regulatory restrictions may have larger lending limits which would allow them to serve the credit needs of larger customers. Areas of competition include interest rates for loans and deposits, efforts to obtain loan and deposit customers and a range in quality of products and services provided, including new technology-driven products and services. Technological innovation continues to contribute to greater competition in domestic and international financial services markets as technological advances enable more companies to provide financial services. We also face competition from out-of-state financial intermediaries that have opened loan production offices or that solicit deposits in our market areas. If we are unable to attract and retain banking customers, we may be unable to continue our loan growth and level of deposits and our business, financial condition, results of operations and cash flows may be adversely affected.
Our previous results may not be indicative of our future results.
We may not be able to sustain our historical rate of growth and level of profitability or may not even be able to grow our business or continue to be profitable at all. Various factors, such as economic conditions, regulatory and legislative considerations and competition, may also impede or prohibit our ability to expand our market presence and financial performance. If we experience a significant decrease in our historical rate of growth, our results of operations and financial condition may be adversely affected due to a high percentage of our operating costs being fixed expenses.
We may be adversely affected by the soundness of other financial institutions.
Financial services institutions are interrelated as a result of clearing, counterparty, or other relationships. We have exposure to many different industries and counterparties, and routinely executes transactions with counterparties in the financial services industry, including commercial banks, brokers and dealers, and other institutional clients. Many of these transactions expose us to credit risk in the event of a default by a counterparty or client. In addition, our credit risk may be exacerbated when the collateral that we hold cannot be realized upon or is liquidated at prices not sufficient to recover the full amount of the credit or derivative exposure due to us. Any such losses could have a material adverse affect on our financial condition and results of operations.
Recent health care legislation could increase our expenses or require us to pass further costs on to our employees, which could adversely affect our operations, financial condition and earnings.
Legislation enacted in 2010 requires companies to provide expanded health care coverage to their employees, such as affordable coverage to part-time employees and coverage to dependent adult children of employees. Companies will also be required to enroll new employees automatically into their health plans. Compliance with these and other new requirements of the health care legislation will increase our employee benefits expense, and may require us to pass these costs on to our employees, which could give us a competitive disadvantage in hiring and retaining qualified employees.
Our business may be adversely affected the continuing drought in California.
California is experiencing the fourth year of a severe drought. A considerable portion of our borrowers are involved in, or are impacted to some extent by, the agricultural industry, which is dependent on water. Agriculture operating loans comprised $34.8 million and $33.5 million, or 1.5% and 2.0%, of our loan portfolio at December 31, 2014 and 2013, respectively. We also originate agriculture real estate loans, which comprised $67.7 million and $55.5 million or 3.0% and 3.3% of our loan portfolio at December 31, 2014 and 2013. As a result of the drought, there are various governmental proposals concerning the distribution or rationing of water. If the amount of water available to agriculture in our market areas becomes increasingly scarce due to drought, rationing and/or diversion, growers may not be able to continue to produce agricultural products at a reasonable profit, which has the potential to force many out of business. While many of our borrowers are not directly involved in agriculture, they could be impacted by difficulties in the agricultural industry because many jobs in our market areas are ancillary to the production, processing, marketing and sales of agricultural products. The drought has the potential to adversely affect agricultural industries as well as consumer purchasing power, and could lead to further unemployment throughout our market area. The drought therefore could have a material adverse effect on our business, financial condition, results of operations and asset quality.
10
Market and Interest Rate Risk
DecreasingLow interest rates could hurt our profits.
Our ability to earn a profit, like that of most financial institutions, depends on our net interest income, which is the difference between the interest income we earn on our interest-earning assets, such as mortgage loans and investments, and the interest expense we pay on our interest-bearing liabilities, such as deposits. Our profitability depends on our ability to manage our assets and liabilities during periods of changing market interest rates. Recently, the FRB has maintained the targeted federal funds rate at record low levels. A sustained decrease in market interest rates could adversely affect our earnings. When interest rates decline, borrowers tend to refinance higher-rate, fixed-rate loans at lower rates. Under those circumstances, we would not be able to reinvest those prepayments in assets earning interest rates as high as the rates on the prepaid loans on investment securities. In addition, our commercial real estate and commercial loans, which carry interest rates that adjust in accordance with changes in the prime rate, will adjust to lower rates.
Our business is subject to interest rate risk and variations in interest rates may negatively affect our financial performance.
Because of the differences in the maturities and repricing characteristics of our interest-earning assets and interest-bearing liabilities, changes in interest rates do not produce equivalent changes in interest income earned on interest-earning assets and interest paid on interest-bearing liabilities. Accordingly, fluctuations in interest rates could adversely affect our interest rate spread and, in turn, our profitability. In addition, loan origination volumes are affected by market interest rates. Rising interest rates, generally, are associated with a lower volume of loan originations while lower interest rates are usually associated with higher loan originations. Conversely, in rising interest rate environments, loan repayment rates may decline and in falling interest rate environments, loan repayment rates may increase. Although we have been successful in generating new loans during 2012,2013, the continuation of historically low long-term interest rate levels may cause additional refinancing of commercial real estate and 1-4 family residence loans, which may depress our loan volumes or cause rates on loans to decline. In addition, an increase in the general level of short-term interest rates on variable rate loans may adversely affect the ability of certain borrowers to pay the interest on and principal of their obligations or reduce the amount they wish to borrow. Additionally, if short-term market rates rise, in order to retain existing deposit customers and attract new deposit customers we may need to increase rates we pay on deposit accounts. Accordingly, changes in levels of market interest rates could materially and adversely affect our net interest spread, asset quality, loan origination volume, business, financial condition, results of operations and cash flows.
Regulatory Risks
Recently enacted financial reform legislation will,has, among other things, createcreated a new Consumer Financial Protection Bureau, tightentightened capital standards and resultresulted in new laws and regulations that are expected to increase our costs of operations.
On July 21,The Dodd-Frank Act, which was enacted in 2010, the President signed the Dodd-Frank Act. This new law significantly changeschanged the current bank regulatory structure and affects the lending, deposit, investment, trading and operating activities of financial institutions and their holding companies. The Dodd-Frank Act requires various federal agencies to adopt a broad range of new implementing rules and regulations, and to prepare numerous studies and reports for Congress. The federal agencies are given significant discretion in drafting the implementing rules and regulations, and consequently, many of the details and much of the impact of the Dodd-Frank Act may not be known for many months or years.
Among other things, the Dodd-Frank Act createscreated a new Consumer Financial Protection Bureau with broad powers to supervise and enforce consumer protection laws. The Consumer Financial Protection BureauCFPB has broad rule-making authority for a wide range of consumer protection laws that apply to all banks and savings institutions, including the authority to prohibit “unfair, deceptive or abusive” acts and practices. The Consumer Financial Protection BureauCFPB has examination and enforcement authority over all banks and savings institutions with more than $10 billion in assets. Banks such as the Bank with $10 billion or less in assets will continue to be examined for compliance with the consumer laws by their primary bank regulators. The Dodd-Frank Act also weakens the federal preemption rules that have been applicable for national banks and federal savings associations, and gives state attorneys general the ability to enforce federal consumer protection laws.
The Dodd-Frank Act requires minimum leverage (Tier 1) and risk based capital requirements for bank and savings and loan holding companies that are no less than those applicable to banks, which will exclude certain instruments that previously have been eligible for inclusion by bank holding companies as Tier 1 capital, such as trust preferred securities (unless such securities were issued prior to May 19, 2010 by a bank holding company with less than $15 billion in assets).
It is difficult to predict at this time what specificthe continuing impact that the Dodd-Frank Act and the yet to be written implementing rules and regulations will have on community banks. However, it is expected that at a minimum they will increase our operating and compliance costs and could increase our interest expense.
11
We operate in a highly regulated environment and we may be adversely affected by changes in laws and regulations. Regulations may prevent or impair our ability to pay dividends, engage in acquisitions or operate in other ways.
We are subject to extensive regulation, supervision and examination by the DFI,DBO, FDIC, and the FRB. See Item 1 – 1—Regulation and Supervision of this report for information on the regulation and supervision which governs our activities. Regulatory authorities have extensive discretion in their supervisory and enforcement activities, including the imposition of restrictions on our operations, the classification of our assets and determination of the level of our allowance for loan losses. Banking regulations, designed primarily for the protection of depositors, may limit our growth and the return to you, our investors,shareholders by restricting certain of our activities, such as:
the payment of dividends to our shareholders,
possible mergers with or acquisitions of or by other institutions,
desired investments,
loans and interest rates on loans,
interest rates paid on deposits,
the possible expansion of branch offices, and
the ability to provide securities or trust services.
We also are subject to capitalization guidelines set forth in federal legislation and could be subject to enforcement actions to the extent that we are found by regulatory examiners to be undercapitalized. We cannot predict what changes, if any, will be made to existing federal and state legislation and regulations or the effect that such changes may have on our future business and earnings prospects. Any change in such regulation and oversight, whether in the form of regulatory policy, regulations, legislation or supervisory action, may have a material impact on our operations.
Compliance with changing regulation of corporate governance and public disclosure may result in additional risks and expenses.
Changing laws, regulations and standards relating to corporate governance and public disclosure, including the Dodd-Frank Act, the Sarbanes-Oxley Act of 2002 and new SEC regulations, are creating additional expense for publicly-traded companies such as TriCo. The application of these laws, regulations and standard may evolve over time as new guidance is provided by regulatory and governing bodies, which could result in continuing uncertainty regarding compliance matters and higher costs necessitated by ongoing revisions to disclosure and governance practices. We are committed to maintaining high standards of corporate governance and public disclosure. As a result, our efforts to comply with evolving laws, regulations and standards have resulted in, and are likely to continue to result in, increased expenses and a diversion of management time and attention. In particular, our efforts to comply with Section 404 of the Sarbanes-Oxley Act of 2002 and the related regulations regarding management’s required assessment of its internal control over financial reporting and its external auditors’ audit of that assessment has required the commitment of significant financial and managerial resources. We expect these efforts to require the continued commitment of significant resources. Further, the members of our board of directors, members of our audit or compensation and management succession committees, our chief executive officer, our chief financial officer and certain other executive officers could face an increased risk of personal liability in connection with the performance of their duties. It may also become more difficult and more expensive to obtain director and officer liability insurance. As a result, our ability to attract and retain executive officers and qualified board and committee members could be more difficult.
We could be adversely affected by new regulations.
Federal and state governments and regulators could pass legislation and adopt policies responsive to current credit conditions that would have an adverse affect on the Company and its financial performance. For example, the Company could experience higher credit losses because of federal or state legislation or regulatory action that limits the Bank’s ability to foreclose on property or other collateral or makes foreclosure less economically feasible.
We could face increased deposit insurance costs.
The FDIC insures deposits at FDIC insured financial institutions up to certain limits. The FDIC charges insured financial institutions premiums to maintain the Deposit Insurance Fund. If the Deposit Insurance Fund suffers further losses, the FDIC could increase assessments rates or impose additional special assessments on the banking industry to replenish the Deposit Insurance Fund. The Company’s profitability could be reduced by any increase in assessment rates or special assessments.
Risks Related to Growth and Expansion
We may fail to realize anticipated cost savings for the merger with North Valley Bancorp or to integrate the business operations and managements of our two companies in an efficient manner.
We acquired North Valley Bancorp and its subsidiary, North Valley Bank, on October 3, 2014. The success of the acquisition will depend, in part, on our ability to realize anticipated cost savings and to combine the businesses of TriCo and North Valley Bancorp in a manner that permits growth opportunities to be realized and does not materially disrupt the existing customer relationships of the Tri Counties Bank or North Valley Bank, nor result in decreased revenues due to any loss of customers.
12
To realize these anticipated benefits, the businesses of TriCo and North Valley and Tri Counties Bank and North Valley Bank must be successfully combined. While management has taken existing leases and other contractual obligations into consideration in developing its estimate of cost savings, changes in transaction volumes, operating systems and procedures and other factors may cause the actual cost savings to be different from these estimates. In addition, difficulties encountered in integrating our information systems could delay or prevent us from realizing some of the estimated cost savings. Such difficulties could also jeopardize customer relationships and cause a loss of deposits or loan customers and the revenue associated with those customers. It is possible that the integration process could result in the loss of key employees, as well as the disruption of each company’s ongoing businesses or inconsistencies in standards, controls, procedures and policies, any or all of which could adversely affect our ability to maintain relationships with customers and employees after the Merger or to achieve the anticipated benefits of the Merger . Integration efforts may also divert management attention and resources. A failure to successfully navigate the complicated integration process could have an adverse effect on the combined companies or the combined company. If the combined company is not able to achieve these cost-savings objectives, the anticipated benefits of the Merger may not be realized fully or at all or may take longer to realize than expected.
Goodwill resulting from the acquisition of North Valley Bancorp may adversely affect our results of operations.
Goodwill and other intangible assets are expected to increase substantially as a result of the acquisition of North Valley Bancorp. Potential impairment of goodwill and amortization of other intangible assets could adversely affect our financial condition and results of operations. We assess our goodwill and other intangible assets and long-lived assets for impairment annually and more frequently when required by U.S. GAAP. We are required to record an impairment charge if circumstances indicate that the asset carrying values exceed their fair values. Our assessment of goodwill, other intangible assets, or long-lived assets could indicate that an impairment of the carrying value of such assets may have occurred that could result in a material, non-cash write-down of such assets, which could have a material adverse effect on our results of operations and future earnings.
If we cannot attract deposits, our growth may be inhibited.
We plan to increase the level of our assets, including our loan portfolio. Our ability to increase our assets depends in large part on our ability to attract additional deposits at favorable rates. We intend to seek additional deposits by offering deposit products that are competitive with those offered by other financial institutions in our markets and by establishing personal relationships with our customers. We cannot assure you that these efforts will be successful. Our inability to attract additional deposits at competitive rates could have a material adverse effect on our business, financial condition, results of operations and cash flows.
There are potential risks associated with future acquisitions and expansions.
We intend to continue to explore expanding our branch system through opening new bank branches and in-store branches in existing or new markets in northernNorthern and centralCentral California. In the ordinary course of business, we evaluate potential branch locations that would bolster our ability to cater to the small business, individual and residential lending markets in California. Any given new branch, if and when opened, will have expenses in excess of revenues for varying periods after opening that may adversely affect our results of operations or overall financial condition.
In addition, to the extent that we acquire other banks in the future, our business may be negatively impacted by certain risks inherent with such acquisitions. These risks include:
incurring substantial expenses in pursuing potential acquisitions without completing such acquisitions,
losing key clients as a result of the change of ownership,
the acquired business not performing in accordance with our expectations,
difficulties arising in connection with the integration of the operations of the acquired business with our operations,
needing to make significant investments and infrastructure, controls, staff, emergency backup facilities or other critical business functions that become strained by our growth,
management needing to divert attention from other aspects of our business,
potentially losing key employees of the acquired business,
incurring unanticipated costs which could reduce our earnings per share,
assuming potential liabilities of the acquired company as a result of the acquisition, and
an acquisition may dilute our earnings per share, in both the short and long term, or it may reduce our tangible capital ratios.
As result of these risks, any given acquisition, if and when consummated, may adversely affect our results of operations or financial condition. In addition, because the consideration for an acquisition may involve cash, debt or the issuance of shares of our stock and may involve the payment of a premium over book and market values, existing shareholders may experience dilution in connection with any acquisition.
13
Our growth and expansion may strain our ability to manage our operations and our financial resources.
Our financial performance and profitability depend on our ability to execute our corporate growth strategy. In addition to seeking deposit and loan and lease growth in our existing markets, we may pursue expansion opportunities in new markets. Continued growth, however, may present operating and other problems that could adversely affect our business, financial condition, results of operations and cash flows. Accordingly, there can be no assurance that we will be able to execute our growth strategy or maintain the level of profitability that we have recently experienced.
Our growth may place a strain on our administrative, operational and financial resources and increase demands on our systems and controls. This business growth may require continued enhancements to and expansion of our operating and financial systems and controls and may strain or significantly challenge them. In addition, our existing operating and financial control systems and infrastructure may not be adequate to maintain and effectively monitor future growth. Our continued growth may also increase our need for qualified personnel. We cannot assure you that we will be successful in attracting, integrating and retaining such personnel.
Our decisions regarding the fair value of assets acquired from North Valley Bancorp, Citizens Bank of Northern California and Granite Community Bank, including the FDIC loss sharing assets associated with Granite, could be inaccurate which could materially and adversely affect our business, financial condition, results of operations, and future prospects.
Management makes various assumptions and judgments about the collectability of acquired loans, including the creditworthiness of borrowers and the value of the real estate and other assets serving as collateral for the repayment of secured loans. In FDIC-assisted acquisitions that include loss sharing agreements, such as our acquisition of Granite Community Bank, we may record a loss sharing asset that we consider adequate to absorb future losses which may occur in the acquired loan portfolio. In determining the size of the loss sharing asset, we analyze the loan portfolio based on historical loss experience, volume and classification of loans, volume and trends in delinquencies and nonaccruals, local economic conditions, and other pertinent information.
If our assumptions are incorrect, the balance of the FDIC indemnification asset may at any time be insufficient to cover future loan losses, and credit loss provisions may be needed to respond to different economic conditions or adverse developments in the acquired loan portfolio. Any increase in future loan losses could have a negative effect on our operating results.
Our ability to obtain reimbursement under the loss sharing agreement on covered assets purchased from the FDIC depends on our compliance with the terms of the loss sharing agreement.
We must certify to the FDIC on a quarterly basis our compliance with the terms of the FDIC loss sharing agreement as a prerequisite to obtaining reimbursement from the FDIC for realized losses on covered assets. The required terms of the agreements are extensive and failure to comply with any of the guidelines could result in a specific asset or group of assets permanently losing their loss sharing coverage. Additionally, Management may decide to forgo loss share coverage on certain assets to allow greater flexibility over the management of certain assets. As of December 31, 2012, $43,429,000,2014, $22,713,000, or 1.7%0.6%, of the Company’s assets were covered by these FDIC loss sharing agreements.
Risks Relating to Dividends and Our Common Stock
Our future ability to pay dividends is subject to restrictions.
Since we are a holding company with no significant assets other than the Bank, we currently depend upon dividends from the Bank for a substantial portion of our revenues. Our ability to continue to pay dividends in the future will continue to depend in large part upon our receipt of dividends or other capital distributions from the Bank. The ability of the Bank to pay dividends or make other capital distributions to us is subject to the restrictions in the California Financial Code and the regulatory authority of the DFI.DBO. As of December 31, 2012,2014, the Bank could have paid $23,568,000$52,798,000 in dividends without the prior approval of the DFI.DBO. The amount that the Bank may pay in dividends is further restricted due to the fact that the Bank must maintain a certain minimum amount of capital to be considered a “well capitalized” institution as further described under Item 1 –- Capital Requirements in this report.
From time to time, we may become a party to financing agreements or other contractual arrangements that have the effect of limiting or prohibiting us or the Bank from declaring or paying dividends. Our holding company expenses and obligations with respect to our trust preferred securities and corresponding junior subordinated deferrable interest debentures issued by us may limit or impair our ability to declare or pay dividends. Finally, our ability to pay dividends is also subject to the restrictions of the California Corporations Code. See “Regulation and Supervision – Restrictions on Dividends and Distributions”.
14
Only a limited trading market exists for our common stock, which could lead to price volatility.
Our common stock is quoted on the NASDAQ Global Select MarketNasdaq and trading volumes have been modest. The limited trading market for our common stock may cause fluctuations in the market value of our common stock to be exaggerated, leading to price volatility in excess of that which would occur in a more active trading market of our common stock. In addition, even if a more active market in our common stock develops, we cannot assure you that such a market will continue or that shareholders will be able to sell their shares.
Anti-takeover provisions and federal law may limit the ability of another party to acquire us, which could cause our stock price to decline.
Various provisions of our articles of incorporation and bylaws could delay or prevent a third party from acquiring us, even if doing so might be beneficial to our shareholders. These provisions provide for, among other things:
specified actions that the Board of Directors shall or may take when an offer to merge, an offer to acquire all assets or a tender offer is received,
a shareholder rights plan which could deter a tender offer by requiring a potential acquiror to pay a substantial premium over the market price of our common stock,
advance notice requirements for proposals that can be acted upon at shareholder meetings, and
the authorization to issue preferred stock by action of the board of directors acting alone, thus without obtaining shareholder approval.
The BHC Act and the Change in Bank Control Act of 1978, as amended, together with federal regulations, require that, depending on the particular circumstances, either FRB approval must be obtained or notice must be furnished to the FRB and not disapproved prior to any person or entity acquiring “control” of a bank holding company such as TriCo. These provisions may prevent a merger or acquisition that would be attractive to shareholders and could limit the price investors would be willing to pay in the future for our common stock.
The amount of common stock owned by, and other compensation arrangements with, our officers and directors may make it more difficult to obtain shareholder approval of potential takeovers that they oppose.
As of December 31, 2012,2014, directors and executive officers beneficially owned approximately 15.5%10.7% of our common stock and our ESOPEmployee Stock Ownership Plan owned approximately 8.6%5.8%. Agreements with our senior management also provide for significant payments under certain circumstances following a change in control. These compensation arrangements, together with the common stock and option ownership of our board of directors and management, could make it difficult or expensive to obtain majority support for shareholder proposals or potential acquisition proposals of us that our directors and officers oppose.
We may issue additional common stock or other equity securities in the future which could dilute the ownership interest of existing shareholders.
In order to maintain our capital at desired or regulatorily-required levels, or to fund future growth, our board of directors may decide from time to time to issue additional shares of common stock, or securities convertible into, exchangeable for or representing rights to acquire shares of our common stock. The sale of these shares may significantly dilute your ownership interest as a shareholder. New investors in the future may also have rights, preferences and privileges senior to our current shareholders which may adversely impact our current shareholders.
Holders of our junior subordinated debentures have rights that are senior to those of our common stockholders.
We have supported our continued growth through the issuance of trust preferred securities from special purpose trusts and accompanying junior subordinated debentures. At December 31, 2012,2014, we had outstanding trust preferred securities and accompanying junior subordinated debentures totaling $41,238,000.with face value of $62,889,000. Payments of the principal and interest on the trust preferred securities are conditionally guaranteed by us. Further, the accompanying junior subordinated debentures we issued to the trusts are senior to our shares of common stock. As a result, we must make payments on the junior subordinated debentures before any dividends can be paid on our common stock and, in the event of our bankruptcy, dissolution or liquidation, the holders of the junior subordinated debentures must be satisfied before any distributions can be made on our common stock.
15
Risks Relating to Systems, Accounting and Internal Controls
If we fail to maintain an effective system of internal and disclosure controls, we may not be able to accurately report our financial results or prevent fraud. As a result, current and potential shareholders could lose confidence in our financial reporting, which would harm our business and the trading price of our securities.
Effective internal control over financial reporting and disclosure controls and procedures are necessary for us to provide reliable financial reports and effectively prevent fraud and to operate successfully as a public company. If we cannot provide reliable financial reports or prevent fraud, our reputation and operating results would be harmed. We continually review and analyze our internal control over financial reporting for Sarbanes-Oxley Section 404 compliance. As part of that process we may discover material weaknesses or significant deficiencies in our internal control as defined under standards adopted by the Public Company Accounting Oversight Board that require remediation. Material weakness is a deficiency, or combination of deficiencies, in internal control over financial reporting, such that there is a reasonable possibility that a material misstatement of the company’s annual or interim financial statements will not be prevented or detected in a timely basis. Significant deficiency is a deficiency or combination of deficiencies, in internal control over financial reporting that is less severe than material weakness, yet important enough to merit attention by those responsible for the oversight of the Company’s financial reporting.
As a result of weaknesses that may be identified in our internal control, we may also identify certain deficiencies in some of our disclosure controls and procedures that we believe require remediation. If we discover weaknesses, we will make efforts to improve our internal and disclosure control. However, there is no assurance that we will be successful. Any failure to maintain effective controls or timely effect any necessary improvement of our internal and disclosure controls could harm operating results or cause us to fail to meet our reporting obligations, which could affect our ability to remain listed with The NASDAQ Global Select Market.Nasdaq. Ineffective internal and disclosure controls could also cause investors to lose confidence in our reported financial information, which would likely have a negative effect on the trading price of our securities.
We rely on communications, information, operating and financial control systems technology and we may suffer an interruption in or breach of the security of those systems.
We rely heavily on our communications, information, operating and financial control systems technology to conduct our business. We rely on third party services providers to provide many of these systems. Any failure, interruption or breach in security of these systems could result in failures or interruptions in our customer relationship management, general ledger, deposit, servicing and loan origination systems. We cannot assure you that such failures, interruptions or security breaches will not occur or, if they do occur, that they will be adequately addressed by us or the third parties service providers on which we rely. The occurrence of any failures, interruptions or security breaches could damage our reputation, result in a loss of customers, expose us to possible financial liability, lead to additional regulatory scrutiny or require that we make expenditures for remediation or prevention. Any of these circumstances could have a material adverse effect on our business, financial condition, results of operations and cash flows.
A failure to implement technological advances could negatively impact our business.
The banking industry is undergoing technological changes with frequent introductions of new technology-driven products and services. In addition to improving customer services, the effective use of technology increases efficiency and enables financial institutions to reduce costs. Our future success will depend, in part, on our ability to address the needs of our customers by using technology to provide products and services that will satisfy customer demands for convenience as well as to create additional efficiencies in our operations. Many of our competitors have substantially greater resources than we do to invest in technological improvements. We may not be able to effectively implement new technology-driven products and services or successfully market such products and services to our customers.
ITEM 1B. UNRESOLVED1B.UNRESOLVED STAFF COMMENTS
None.
ITEM 2. PROPERTIES2.PROPERTIES
The Company is engaged in the banking business through 6681 offices in 2326 counties in Northern and Central California including tenthirteen offices in Shasta County, nine in Butte County, sevensix in Sacramento and Nevada Counties, sixfive in Placer County, four in Stanislaus County,and Humboldt Counties, three each in Stanislaus, Siskiyou, Sutter and KernSutter Counties, two each in Glenn, Mendocino and YoloTrinity Counties, and one each in Colusa, Contra Costa, Del Norte, Fresno, Kern, Lake, Lassen, Madera, Mendocino, Merced, Napa,Sonoma, Tehama, Tulare, Yolo and Yuba Counties. All offices are constructed and equipped to meet prescribed security requirements.
The Company owns eighteentwenty-nine branch office locations, fourfive administrative buildings, and two other buildings that it leases out.out and two that are for sale. The Company leases forty-eightforty-four branch office locations, and three administrative buildings.locations. Most of the leases contain multiple renewal options and provisions for rental increases, principally for changes in the cost of living index, property taxes and maintenance.
16
ITEM 3. LEGAL3.LEGAL PROCEEDINGS
The Bank owns 10,21413,396 shares of Class B common stock of Visa Inc. which are convertible into Class A common stock at a conversion ratio of 0.42060.4121 per Class A share. As of December 31, 2012,2014, the value of the Class A shares was $151.58$262.20 per share. Utilizing the conversion ratio, the value of unredeemed Class A equivalent shares owned by the Bank was $651,000$1,447,000 as of December 31, 2012,2014, and has not been reflected in the accompanying financial statements. The shares of Visa Class B common stock are restricted and may not be transferred. Visa Member Banks are required to fund an escrow account to cover settlements, resolution of pending litigation and related claims. If the funds in the escrow account are insufficient to settle all the covered litigation, Visa may sell additional Class A shares, use the proceeds to settle litigation, and further reduce the conversion ratio. If funds remain in the escrow account after all litigation is settled, the Class B conversion ratio will be increased to reflect that surplus.
On September 27, 2012,January 24, 2014, a putative shareholder class action lawsuit was filed against TriCo, North Valley Bancorp and certain other defendants in connection with TriCo entering into the Company announcedmerger agreement with North Valley Bancorp. The lawsuit, which was filed in the Shasta County, California Superior Court, alleges that the Bankmembers of the North Valley Bancorp board of directors breached their fiduciary duties to North Valley Bancorp shareholders by approving the proposed merger for inadequate consideration; approving the transaction in order receive benefits not equally shared by other North Valley Bancorp shareholders; entering into the merger agreement containing preclusive deal protection devices; and failing to take steps to maximize the value to be paid to the North Valley Bancorp shareholders. The lawsuit alleges claims against TriCo for aiding and abetting these alleged breaches of fiduciary duties. The plaintiff seeks, among other things, declaratory and injunctive relief concerning the alleged breaches of fiduciary duties injunctive relief prohibiting consummation of the merger, rescission, attorneys’ of the merger agreement, fees and costs, and other and further relief. On July 31, 2014 the defendants entered into a tentativememorandum of understanding with the plaintiffs regarding the settlement of this lawsuit. In connection with the settlement contemplated by the memorandum of understanding and in consideration for the full settlement and release of all claims, TriCo and North Valley Bancorp agreed to make certain additional disclosures related to the proposed merger, which are contained in a Current Report on Form 8-K filed by each of the companies. The memorandum of understanding contemplates that the parties will negotiate in good faith and use their reasonable best efforts to enter into a stipulation of settlement. The stipulation of settlement will be subject to customary conditions, including court approval following notice to North Valley Bancorp’s shareholders. In the event that the parties enter into a stipulation of settlement, a hearing will be scheduled at which the court will consider the settlement. There can be no assurance that the parties will ultimately enter into a stipulation of settlement or that the court will approve the settlement even if the parties were to enter into such stipulation. In such event, the proposed settlement as contemplated by the memorandum of understanding may be terminated.
On September 15, 2014, a former employee whoPersonal Banker at one of the Bank’s in-store branches filed a class action lawsuitClass Action Complaint against the Bank in theButte County Superior Court, alleging causes of action related to the observance of meal periods. Plaintiff seeks to represent a class of “current and former hourly-paid or non-exempt ‘personal bankers’, or employees with the same or similar job duties, employed by Defendants within the State of California Kernduring the preceding four years.” The Bank filed an Answer to the Complaint on November 6, 2014, denies the charges, and the Bank intends to vigorously defend the lawsuit against class certification and liability.
On January 20, 2015, a current Personal Banker at one of the Bank’s in-store branches filed a First Amended Complaint against Tri Counties Bank and TriCo Bancshares, dba Tri Counties Bank, in Sacramento County on behalfSuperior Court, alleging causes of herself andaction related to wage statement violations. Plaintiff seeks to represent a putative class of current and former Bankexempt and non-exempt employees serving as assistant branch managers seeking undisclosed damages, alleging thatwho worked for the Bank improperly classified its assistant branch managers as exempt employees under California laws.“during the time period beginning October 18, 2013 through the date of the filing of this action”. The lawsuit alleges claims for: failure to pay overtime compensation; failure to provide meal periods; failure to provide rest periods; failure to provide accurate wage statements; failure to provide suitable seating; declaratory relief; accounting;Company and unfair business practices in violation of California Business and Professions Code section 17200.
On September 26, 2012, after efforts to mediate the claim, the Bank have not yet responded to the First Amended Complaint, deny the charges, and intend to vigorously defend the former employee agreed to settle the case in an amount ranging from $2,039,500 to $2,500,000, depending primarily on the number oflawsuit against class participants who file claims,certification and pending approval by the court, including determination of the method to allocate settlement payments among current and former employees who are members of the defined settlement class, and the portion of the total settlement allocable to attorney’s fees and costs to plaintiff’s counsel. On September 26, 2012, the Bank recorded a $2,090,000 expense and accrued liability in anticipation of approval of this settlement by the court and estimated related payroll taxes.liability.
Neither the Company nor its subsidiaries, are party to any other material pending legal proceeding, nor is their property the subject of any material pending legal proceeding, except routine legal proceedings arising in the ordinary course of their business. None of these proceedings is expected to have a material adverse impact upon the Company’s business, consolidated financial position or results of operations.
ITEM 4. MINE4.MINE SAFETY DISCLOSURES
Inapplicable.
17
PART II
ITEM 5. MARKET5.MARKET FOR REGISTRANT’S COMMON EQUITY, RELATED STOCKHOLDER MATTERS AND ISSUER PURCHASES OF EQUITY SECURITIES
Common Stock Market Prices and Dividends
The Company’s common stock is traded on the NASDAQ Global Select Market System (“NASDAQ”)Nasdaq under the symbol “TCBK.” The following table shows the high and the low closing sale prices for the common stock for each quarter in the past two years, as reported by NASDAQ:Nasdaq:
| 2012: | High | Low | ||||||||||||||
| High | Low | |||||||||||||||
2014: | ||||||||||||||||
Fourth quarter | $ | 17.14 | $ | 14.73 | $ | 26.37 | $ | 22.43 | ||||||||
Third quarter | $ | 16.81 | $ | 14.76 | $ | 24.19 | $ | 21.70 | ||||||||
Second quarter | $ | 17.71 | $ | 14.84 | $ | 26.12 | $ | 22.44 | ||||||||
First quarter | $ | 17.67 | $ | 14.22 | $ | 28.37 | $ | 23.85 | ||||||||
2011: | ||||||||||||||||
2013: | ||||||||||||||||
Fourth quarter | $ | 15.32 | $ | 11.58 | $ | 28.76 | $ | 22.50 | ||||||||
Third quarter | $ | 15.50 | $ | 11.75 | $ | 23.07 | $ | 20.50 | ||||||||
Second quarter | $ | 16.58 | $ | 13.18 | $ | 21.75 | $ | 15.77 | ||||||||
First quarter | $ | 16.76 | $ | 14.53 | $ | 17.90 | $ | 16.31 | ||||||||
As of March 1, 2013February 27, 2015 there were approximately 1,4591,712 shareholders of record of the Company’s common stock. On March 1, 2013,February 27, 2015, the closing sales price was $17.01.$23.90.
The Company has paid cash dividends on its common stock in every quarter since March 1990, and it is currently the intention of the Board of Directors of the Company to continue payment of cash dividends on a quarterly basis. There is no assurance, however, that any dividends will be paid since they are dependent upon earnings, financial condition and capital requirements of the Company and the Bank. As of December 31, 2012, $23,568,0002014, $52,798,000 was available for payment of dividends by the Bank to the Company, under applicable laws and regulations. The Company paid cash dividends of $0.09$0.11 per common share in each of the quarters ended December 31, 2012,2014, September 30, 2012,2014, June 30, 2012,2014, March 31, 2012.2014, December 31, 2011,2013, September 30, 2011,2013, June 30, 2011,2013, and $0.09 per common share in the quarter ended March 31, 2011.2013.
StockIssuer Repurchase Planof Common Stock
The Company adopted a stock repurchase plan on August 21, 2007 for the repurchase of up to 500,000 shares of the Company’s common stock from time to time as market conditions allow. The 500,000 shares authorized for repurchase under this plan represented approximately 3.2% of the Company’s approximately 15,815,000 common shares outstanding as of August 21, 2007. This plan has no stated expiration date for the repurchases. As of December 31, 2012,2014, the Company had purchased 166,600 shares under this plan.
The following table shows the repurchases made by the Company or any affiliated purchaser (as defined in Rule 10b-18(a)(3) under the Exchange Act) during the fourth quarter of 2012:2014:
Period | (a) Total number of shares purchased(1) | (b) Average price paid per share | (c) Total number of shares purchased as of part of publicly announced plans or programs | (d) Maximum number shares that may yet be purchased under the plans or programs(2) | ||||||||||||
Oct. 1-31, 2014 | — | — | — | 333,400 | ||||||||||||
Nov. 1-30, 2014 | — | — | — | 333,400 | ||||||||||||
Dec. 1-31, 2014 | 37,647 | $ | 24.99 | — | 333,400 | |||||||||||
|
|
|
|
|
|
|
| |||||||||
Total | 37,647 | $ | 24.99 | — | 333,400 | |||||||||||
| (1) | ||||||||||||||||
| ||||||||||||||||
| (2) | Does not include shares that may purchased | |||||||||||||||
| ||||||||||||||||
| ||||||||||||||||
| ||||||||||||||||
| pursuant to various equity incentive plans. | |||||||||||||||
18
The following graph presents the cumulative total yearly shareholder return from investing $100 on December 31, 2007,2009, in each of TriCo common stock, the Russell 3000 Index, and the SNL Western Bank Index. The SNL Western Bank Index compiled by SNL Financial includes banks located in California, Oregon, Washington, Montana, Hawaii and Alaska with market capitalization similar to that of TriCo’s. The amounts shown assume that any dividends were reinvested.
TriCo Bancshares
| Period Ending | ||||||||||||||||||||||||
Index | 12/31/09 | 12/31/10 | 12/31/11 | 12/31/12 | 12/31/13 | 12/31/14 | ||||||||||||||||||
TriCo Bancshares | 100.00 | 99.37 | 89.77 | 108.11 | 186.67 | 165.54 | ||||||||||||||||||
Russell 3000 | 100.00 | 116.93 | 118.13 | 137.52 | 183.66 | 206.72 | ||||||||||||||||||
SNL Western Bank | 100.00 | 113.31 | 102.37 | 129.18 | 181.76 | 218.14 | ||||||||||||||||||
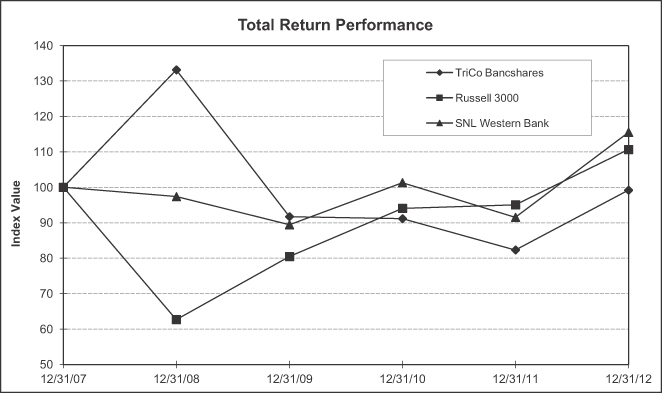
| Period Ending | ||||||||||||||||||||||||
Index | 12/31/07 | 12/31/08 | 12/31/09 | 12/31/10 | 12/31/11 | 12/31/12 | ||||||||||||||||||
TriCo Bancshares | 100.00 | 133.14 | 91.73 | 91.15 | 82.34 | 99.17 | ||||||||||||||||||
Russell 3000 | 100.00 | 62.69 | 80.46 | 94.08 | 95.05 | 110.65 | ||||||||||||||||||
SNL Western Bank | 100.00 | 97.37 | 89.41 | 101.31 | 91.53 | 115.50 | ||||||||||||||||||
Equity Compensation Plans
The following table shows shares reserved for issuance for outstanding options, stock appreciation rights and warrants granted under our equity compensation plans as of December 31, 2012.2014. All of our equity compensation plans have been approved by shareholders.
Plan category | (a) Number of securities to be issued upon exercise of outstanding options, warrants and rights | (b) Weighted average exercise price of outstanding options, warrants and rights | (c) Number of securities remaining available for issuance under equity compensation plans (excluding securities reflected in column (a)) | (a) Number of securities to be issued upon exercise of outstanding options, warrants and rights | (b) Weighted average exercise price of outstanding options, warrants and rights | (c) Number of securities remaining available for issuance under equity compensation plans (excluding securities reflected in column (a)) | ||||||||||||||||||
Equity compensation plans not approved by shareholders | — | — | — | — | — | — | ||||||||||||||||||
Equity compensation plans approved by shareholders | 1,393,935 | $ | 17.07 | 72,000 | 1,102,850 | $ | 18.25 | 822,428 | ||||||||||||||||
|
|
|
|
|
| |||||||||||||||||||
Total | 1,393,935 | $ | 17.07 | 72,000 | 1,102,850 | $ | 18.25 | 822,428 | ||||||||||||||||
19
ITEM 6. SELECTED6.SELECTED FINANCIAL DATA
The following selected consolidated financial data are derived from our consolidated financial statements. This data should be read in connection with our consolidated financial statements and the related notes located at Item 8 of this report.
TRICO BANCSHARES
Financial Summary
(in thousands, except per share amounts)
Year ended December 31, | 2012 | 2011 | 2010 | 2009 | 2008 | 2014 | 2013 | 2012 | 2011 | 2010 | ||||||||||||||||||||||||||||||
Interest income | $ | 108,716 | $ | 102,982 | $ | 104,572 | $ | 112,333 | $ | 121,112 | $ | 121,115 | $ | 106,560 | $ | 108,716 | $ | 102,982 | $ | 104,572 | ||||||||||||||||||||
Interest expense | 7,344 | 10,238 | 14,133 | 20,615 | 31,552 | 4,681 | 4,696 | 7,344 | 10,238 | 14,133 | ||||||||||||||||||||||||||||||
|
|
|
|
|
|
|
|
|
| |||||||||||||||||||||||||||||||
Net interest income | 101,372 | 92,744 | 90,439 | 91,718 | 89,560 | 116,434 | 101,864 | 101,372 | 92,744 | 90,439 | ||||||||||||||||||||||||||||||
Provision for loan losses | 9,423 | 23,060 | 37,458 | 31,450 | 20,950 | |||||||||||||||||||||||||||||||||||
(Benefit from) provision for loan losses | (4,045 | ) | (715 | ) | 9,423 | 23,060 | 37,458 | |||||||||||||||||||||||||||||||||
Noninterest income | 37,980 | 42,813 | 32,695 | 30,329 | 27,087 | 34,516 | 36,829 | 37,980 | 42,813 | 32,695 | ||||||||||||||||||||||||||||||
Noninterest expense | 97,998 | 82,715 | 77,205 | 75,450 | 68,738 | 110,379 | 93,604 | 97,998 | 82,715 | 77,205 | ||||||||||||||||||||||||||||||
|
|
|
|
| ||||||||||||||||||||||||||||||||||||
|
|
|
|
| ||||||||||||||||||||||||||||||||||||
Income before income taxes | 31,931 | 29,782 | 8,471 | 15,147 | 26,959 | 44,616 | 45,804 | 31,931 | 29,782 | 8,471 | ||||||||||||||||||||||||||||||
Provision for income taxes | 12,937 | 11,192 | 2,466 | 5,185 | 10,161 | 18,508 | 18,405 | 12,937 | 11,192 | 2,466 | ||||||||||||||||||||||||||||||
|
|
|
|
|
|
|
|
|
| |||||||||||||||||||||||||||||||
Net income | $ | 18,994 | $ | 18,590 | $ | 6,005 | $ | 9,962 | $ | 16,798 | $ | 26,108 | $ | 27,399 | $ | 18,994 | $ | 18,590 | $ | 6,005 | ||||||||||||||||||||
|
|
|
|
| ||||||||||||||||||||||||||||||||||||
|
|
|
|
| ||||||||||||||||||||||||||||||||||||
Earnings per share: | ||||||||||||||||||||||||||||||||||||||||
Basic | $ | 1.19 | $ | 1.17 | $ | 0.38 | $ | 0.63 | $ | 1.07 | $ | 1.47 | $ | 1.71 | $ | 1.19 | $ | 1.17 | $ | 0.38 | ||||||||||||||||||||
Diluted | $ | 1.18 | $ | 1.16 | $ | 0.37 | $ | 0.62 | $ | 1.05 | $ | 1.46 | $ | 1.69 | $ | 1.18 | $ | 1.16 | $ | 0.37 | ||||||||||||||||||||
Per share: | ||||||||||||||||||||||||||||||||||||||||
Dividends paid | $ | 0.36 | $ | 0.36 | $ | 0.40 | $ | 0.52 | $ | 0.52 | $ | 0.44 | $ | 0.42 | $ | 0.36 | $ | 0.36 | $ | 0.40 | ||||||||||||||||||||
Book value at December 31 | $ | 14.33 | $ | 13.55 | $ | 12.64 | $ | 12.71 | $ | 12.56 | $ | 18.41 | $ | 15.61 | $ | 14.33 | $ | 13.55 | $ | 12.64 | ||||||||||||||||||||
Tangible book value at December 31 | $ | 13.30 | $ | 12.49 | $ | 11.62 | $ | 11.71 | $ | 11.54 | $ | 15.31 | $ | 14.59 | $ | 13.30 | $ | 12.49 | $ | 11.62 | ||||||||||||||||||||
Average common shares outstanding | 15,988 | 15,935 | 15,860 | 15,783 | 15,771 | 17,716 | 16,045 | 15,988 | 15,935 | 15,860 | ||||||||||||||||||||||||||||||
Average diluted common shares outstanding | 16,052 | 16,000 | 16,010 | 16,011 | 16,050 | 17,923 | 16,197 | 16,052 | 16,000 | 16,010 | ||||||||||||||||||||||||||||||
Shares outstanding at December 31 | 16,001 | 15,979 | 15,860 | 15,787 | 15,756 | 22,715 | 16,077 | 16,001 | 15,979 | 15,860 | ||||||||||||||||||||||||||||||
At December 31: | ||||||||||||||||||||||||||||||||||||||||
Loans, net of allowance | $ | 1,522,175 | $ | 1,505,118 | $ | 1,377,000 | $ | 1,460,097 | $ | 1,563,259 | $ | 2,245,939 | $ | 1,633,762 | $ | 1,522,175 | $ | 1,505,118 | $ | 1,377,000 | ||||||||||||||||||||
Total assets | 2,609,269 | 2,555,597 | 2,189,789 | 2,170,520 | 2,043,190 | 3,916,458 | 2,744,066 | 2,609,269 | 2,555,597 | 2,189,789 | ||||||||||||||||||||||||||||||
Total deposits | 2,289,702 | 2,190,536 | 1,852,173 | 1,828,512 | 1,669,270 | 3,380,423 | 2,410,483 | 2,289,702 | 2,190,536 | 1,852,173 | ||||||||||||||||||||||||||||||
Debt financing and notes payable | 9,197 | 72,541 | 62,020 | 66,753 | 102,005 | |||||||||||||||||||||||||||||||||||
Other borrowings | 9,276 | 6,335 | 9,197 | 72,541 | 62,020 | |||||||||||||||||||||||||||||||||||
Junior subordinated debt | 41,238 | 41,238 | 41,238 | 41,238 | 41,238 | 56,272 | 41,238 | 41,238 | 41,238 | 41,238 | ||||||||||||||||||||||||||||||
Shareholders’ equity | 229,359 | 216,441 | 200,397 | 200,649 | 197,932 | 418,172 | 250,946 | 229,359 | 216,441 | 200,397 | ||||||||||||||||||||||||||||||
Financial Ratios: | ||||||||||||||||||||||||||||||||||||||||
For the year: | ||||||||||||||||||||||||||||||||||||||||
Return on average assets | 0.75 | % | 0.82 | % | 0.27 | % | 0.48 | % | 0.85 | % | 0.87 | % | 1.04 | % | 0.75 | % | 0.82 | % | 0.27 | % | ||||||||||||||||||||
Return on average equity | 8.44 | % | 8.93 | % | 2.94 | % | 4.89 | % | 8.70 | % | 8.67 | % | 11.34 | % | 8.44 | % | 8.93 | % | 2.94 | % | ||||||||||||||||||||
Net interest margin1 | 4.32 | % | 4.43 | % | 4.45 | % | 4.77 | % | 4.96 | % | 4.17 | % | 4.18 | % | 4.32 | % | 4.43 | % | 4.45 | % | ||||||||||||||||||||
Net loan losses to average loans | 0.82 | % | 1.37 | % | 2.07 | % | 1.53 | % | 0.69 | % | ||||||||||||||||||||||||||||||
Efficiency ratio1 | 70.19 | % | 60.88 | % | 62.49 | % | 61.53 | % | 58.59 | % | ||||||||||||||||||||||||||||||
Net loan (recoveries) losses to average loans | (0.13 | )% | 0.23 | % | 0.82 | % | 1.37 | % | 2.07 | % | ||||||||||||||||||||||||||||||
Efficiency ratio2 | 72.9 | % | 67.32 | % | 70.19 | % | 60.88 | % | 62.49 | % | ||||||||||||||||||||||||||||||
Average equity to average assets | 8.91 | % | 9.15 | % | 9.25 | % | 9.73 | % | 9.72 | % | 10.00 | % | 9.21 | % | 8.91 | % | 9.15 | % | 9.25 | % | ||||||||||||||||||||
At December 31: | ||||||||||||||||||||||||||||||||||||||||
Equity to assets | 8.79 | % | 8.47 | % | 9.15 | % | 9.24 | % | 9.69 | % | 10.68 | % | 9.15 | % | 8.79 | % | 8.47 | % | 9.15 | % | ||||||||||||||||||||
Total capital to risk-adjusted assets | 14.53 | % | 13.94 | % | 14.20 | % | 13.36 | % | 12.42 | % | 15.63 | % | 14.77 | % | 14.53 | % | 13.94 | % | 14.20 | % | ||||||||||||||||||||
| 1 | Fully taxable equivalent. |
| 2 | The sum of fully taxable equivalent net interest income and noninterest income divided by noninterest expense. |
20
ITEM 7. MANAGEMENT’S7.MANAGEMENT’S DISCUSSION AND ANALYSIS OF FINANCIAL CONDITION AND RESULTS OF OPERATIONS
General
As TriCo Bancshares (referred to in this report as “we”, “our” or the “Company”) has not commenced any business operations independent of Tri Countiesthe Bank, (the “Bank”), the following discussion pertains primarily to the Bank. Average balances, including such balances used in calculating certain financial ratios, are generally comprised of average daily balances for the Company. Within Management’s Discussion and Analysis of Financial Condition and Results of Operations, interest income and net interest income are generally presented on a fully tax-equivalent (FTE) basis. The presentation of interest income and net interest income on a FTE basis is a common practice within the banking industry. Interest income and net interest income are shown on a non-FTE basis in the Part I – Financial Information section of this Form 10-Q,Item 7 this report, and a reconciliation of the FTE and non-FTE presentations is provided below in the discussion of net interest income.
Critical Accounting Policies and Estimates
The Company’s discussion and analysis of its financial condition and results of operations are based upon the Company’sits consolidated financial statements, which have been prepared in accordance with generally accepted accounting principles generally accepted in the United States of America. The preparation of these financial statements requires the Company to make estimates and judgments that affect the reported amounts of assets, liabilities, revenues and expenses, and related disclosure of contingent assets and liabilities. On an on-going basis, the Company evaluates its estimates, including those that materially affect the financial statements and are related to the adequacy of the allowance for loan losses, investments, mortgage servicing rights, fair value measurements, retirement plans, intangible assets and intangible assets.the fair value of acquired assets and liabilities. The Company bases its estimates on historical experience and on various other assumptions that are believed to be reasonable under the circumstances, the results of which form the basis for making judgments about the carrying values of assets and liabilities that are not readily apparent from other sources. Actual results may differ from these estimates under different assumptions or conditions. The Company’s policies related to estimates on the allowance for loan losses, other than temporary impairment of investments and impairment of intangible assets, can be found in Note 1 in the financial statements at Item 8 of this report.
As the Company has not commenced any business operations independent of the Bank, the following discussion pertains primarily to the Bank. Average balances, including balances used in calculating certain financial ratios, are generally comprised of average daily balances for the Company. Within Management’s Discussion and Analysis of Financial Condition and Results of Operations, certain performance measures including interest income, net interest income, net interest yield, and efficiency ratio are generally presented on a fully tax-equivalent (FTE) basis. The Company believes the use of these non-generally accepted accounting principles (non-GAAP) measures provides additional clarity in assessing its results.
On October 3, 2014, TriCo completed the acquisition of North Valley Bancorp following receipt of shareholder approval from both institutions and all required regulatory approvals. As part of the acquisition, North Valley Bank, a wholly-owned subsidiary of North Valley Bancorp, merged with and into Tri Counties Bank. In the acquisition, each share of North Valley common stock was converted into the right to receive 0.9433 shares of TriCo common stock. TriCo issued an aggregate of approximately 6.58 million shares of TriCo common stock to North Valley Bancorp shareholders, which was valued at a total of approximately $151 million based on the closing trading price of TriCo common stock on October 3, 2014 of $21.73. TriCo also assumed North Valley Bancorp’s obligations with respect to its outstanding trust preferred securities. Beginning on October 4, 2014, the effect of revenue and expenses from the operations of North Valley Bancorp, and the TriCo Bancshares common shares issued in consideration of the merger are included in the results of the Company.
North Valley Bank was a full-service commercial bank headquartered in Redding, California. North Valley conducted a commercial and retail banking services which included accepting demand, savings, and money market rate deposit accounts and time deposits, and making commercial, real estate and consumer loans. North Valley Bank had $935 million in assets and 22 commercial banking offices in Shasta, Humboldt, Del Norte, Mendocino, Yolo, Sonoma, Placer and Trinity Counties in Northern California at June 30, 2014.
On October 25, 2014, North Valley Bank’s electronic customer service and other data processing systems were converted onto Tri Counties Bank’s systems. Between January 7, 2015 and January 21, 2015, four Tri Counties Bank branches and four former North Valley Bank branches were consolidated into other Tri Counties Bank or other former North Valley Bank branches. See Note 2 in the financial statements at Item 8 of this report for a discussion about this transaction.
On September 23, 2011, the California Department of Financial InstitutionsDBO closed Citizens Bank of Northern California (“Citizens”), Nevada City, California and appointed the FDIC as receiver. That same date, the Bank assumed the banking operations of Citizens from the FDIC under a whole bank purchase and assumption agreement without loss sharing. With this agreement, the Bank added seven traditional bank branches including two in Grass Valley, and one in each of Nevada City, Penn Valley, Lake of the Pines, Truckee, and Auburn, California. This acquisition is consistent with the Bank’s community banking expansion strategy and provides further opportunity to fill in the Bank’s market presence in the Northern California market.
On May 28, 2010, the Office of the Comptroller of the Currency closed Granite Community Bank (“Granite”), Granite Bay, California and appointed the FDIC as receiver. That same date, the Bank assumed the banking operations of Granite from the FDIC under a whole bank purchase and assumption agreement with loss sharing. Under the terms of the loss sharing
21
agreement, the FDIC will cover a substantial portion of any future losses on loans, related unfunded loan commitments, other real estate owned (OREO)/foreclosed assets and accrued interest on loans for up to 90 days. The FDIC will absorb 80% of losses and share in 80% of loss recoveries on the covered assets acquired from Granite. The loss sharing arrangements for non-single family residential and single family residential loans are in effect for 5 years and 10 years, respectively, and the loss recovery provisions are in effect for 8 years and 10 years, respectively, from the acquisition date. With this agreement, the Bank added one traditional bank branch in each of Granite Bay and Auburn, California. This acquisition is consistent with the Bank’s community banking expansion strategy and provides further opportunity to fill in the Bank’s market presence in the greater Sacramento, California market.
The Company refers to loans and foreclosed assets that are covered by loss sharing agreements as “covered loans” and “covered foreclosed assets”, respectively. In addition, the Company refers to loans purchased or obtained in a business combination as “purchased credit impaired” (PCI) loans, or “purchased non-creditnot credit impaired” (PNCI) loans. The Company refers to loans that it originates as “originated” loans. Additional information regarding the Citizens and Granite Bank acquisitionsNorth Valley Bancorp acquisition can be found in Note 2 in the financial statements at Item 8 of this report. Additional information regarding the definitions and accounting for originated, PNCI and PCI loans can be found in Notes 1, 2, 4 and 5 in the financial statements at Item 8 of this report, and under the headingAsset Quality and Non-Performing Assetsbelow.
Geographical Descriptions
For the purpose of describing the geographical location of the Company’s loans, the Company has defined northern California as that area of California north of, and including, Stockton; central California as that area of the State south of Stockton, to and including, Bakersfield; and southern California as that area of the State south of Bakersfield.
Results of Operations
Overview
The following discussion and analysis is designed to provide a better understanding of the significant changes and trends related to the Company and the Bank’s financial condition, operating results, asset and liability management, liquidity and capital resources and should be read in conjunction with the consolidated financial statements of the Company and the related notes at Item 8 of this report.
Following is a summary of the components of net income for the periods indicated (dollars in thousands):
| Year ended December 31, | Year ended December 31, | |||||||||||||||||||||||
| Components of Net Income | 2012 | 2011 | 2010 | 2014 | 2013 | 2012 | ||||||||||||||||||
Net interest income | $ | 101,372 | $ | 92,744 | $ | 90,439 | $ | 116,434 | $ | 101,864 | $ | 101,372 | ||||||||||||
Provision for loan losses | (9,423 | ) | (23,060 | ) | (37,458 | ) | ||||||||||||||||||
Benefit from (provision for) loan losses | 4,045 | 715 | (9,423 | ) | ||||||||||||||||||||
Noninterest income | 37,980 | 42,813 | 32,695 | 34,516 | 36,829 | 37,980 | ||||||||||||||||||
Noninterest expense | (97,998 | ) | (82,715 | ) | (77,205 | ) | (110,379 | ) | (93,604 | ) | (97,998 | ) | ||||||||||||
Taxes | (12,937 | ) | (11,192 | ) | (2,466 | ) | (18,508 | ) | (18,405 | ) | (12,937 | ) | ||||||||||||
|
|
|
|
|
| |||||||||||||||||||
Net income | $ | 18,994 | $ | 18,590 | $ | 6,005 | $ | 26,108 | $ | 27,399 | $ | 18,994 | ||||||||||||
|
|
|
|
|
| |||||||||||||||||||
Net income per average fully-diluted share | $ | 1.18 | $ | 1.16 | $ | 0.37 | $ | 1.46 | $ | 1.69 | $ | 1.18 | ||||||||||||
Net income as a percentage of average shareholders’ equity | 8.44 | % | 8.93 | % | 2.94 | % | 8.67 | % | 11.34 | % | 8.44 | % | ||||||||||||
Net income as a percentage of average total assets | 0.75 | % | 0.82 | % | 0.27 | % | 0.87 | % | 1.04 | % | 0.75 | % | ||||||||||||
|
|
|
|
|
| |||||||||||||||||||
Net Interest Income
The Company’s primary source of revenue is net interest income, which is the difference between interest income on earning assets and interest expense on interest-bearing liabilities.
Following is a summary of the Company’s net interest income for the periods indicated (dollars in thousands):
| Year ended December 31, | Year ended December 31, | |||||||||||||||||||||||
| Components of Net Interest Income | 2012 | 2011 | 2010 | 2014 | 2013 | 2012 | ||||||||||||||||||
Interest income | $ | 108,716 | $ | 102,982 | $ | 104,572 | $ | 121,115 | $ | 106,560 | $ | 108,716 | ||||||||||||
Interest expense | (7,344 | ) | (10,238 | ) | (14,133 | ) | (4,378 | ) | (4,696 | ) | (7,344 | ) | ||||||||||||
|
|
|
|
|
| |||||||||||||||||||
Net interest income | 101,372 | 92,744 | 90,439 | 116,737 | 101,864 | 101,372 | ||||||||||||||||||
FTE adjustment | 257 | 309 | 413 | 303 | 350 | 257 | ||||||||||||||||||
|
|
|
|
|
| |||||||||||||||||||
Net interest income (FTE) | $ | 101,629 | $ | 93,053 | $ | 90,852 | $ | 116,737 | $ | 102,214 | $ | 101,629 | ||||||||||||
|
|
|
|
|
| |||||||||||||||||||
Net interest margin (FTE) | 4.32 | % | 4.43 | % | 4.45 | % | 4.17 | % | 4.18 | % | 4.32 | % | ||||||||||||
|
|
|
|
|
| |||||||||||||||||||
Net interest income (FTE) for the year ended December 31, 20122014 was $101,629,000,$116,737,000, an increase of $8,576,000$14,523,000 or 9.2%14.2% compared to the year ended December 31, 2011. 2013.
22
The increase in net interest income (FTE) was due primarily to a $353,071,000 (14.4%) increase in the average balance of interest earning assets to $2,796,571,000, and the use of fed funds sold to purchase higher yielding investments throughout 2014 that were partially offset by a 44 basis point decrease in the average yield on loans to 5.62% and a 17 basis point decrease in the average yield on investments to 3.01% during 2012the year ended December 31, 2014 when compared to 2011 is mainly due to the year ended December 31, 2013. The acquisition of CitizensNorth Valley Bancorp on September 23, 2011 and its associated netOctober 3, 2014 contributed approximately $6,730,000, to interest income from loans, including approximately $480,000 of $17,852,000 during 2012 comparedloan purchase discount accretion, and $1,310,000 to $6,117,000interest income from September 23, 2011investments from October 4, 2014 to December 31, 2011. Included in2014. For the net interest income associated withquarter ended December 31, 2014, the Citizens acquisition is $7,572,000 and $3,146,000 fromaverage yields on the accretionacquired North Valley Bancorp loans, including the effect of loan purchase discounts during 2012discount accretion, and 2011,investments were approximately 5.68% and 2.72% (FTE), respectively. Also contributing to the increase in net interest income was a reduction in deposit rates, the flow of deposits from relatively higher paying time deposits to lower paying non-maturity deposits, and the reduction of relatively high cost other borrowings. During 2012, investment opportunities continued to be unattractive given their low market yields and interest rate risk profile. The “Yield” and “Volume/Rate” tables shown below are useful in illustrating and quantifying the developments that affected net interest income during 2012.2014 and 2013.
Net interest income (FTE) for the year ended December 31, 20112013 was $93,053,000,$102,214,000, an increase of $2,201,000$585,000 or 2.4%0.6% compared to the year ended December 31, 2010.2012. The increase in net interest income during 20112013 when compared to 20102012 is mainly due to the acquisitiona decrease in average balance of Citizens on September 23, 2011 and its associated net interest income of $6,117,000 from September 23, 2011 to December 31, 2011. Included in the net interest income associated with the Citizens acquisition is $3,146,000 from the accretion of loan purchase discounts. Also contributing to the increase in net interest income wasother borrowings, a reductionshift in deposit rates and the flow of depositsbalances from relatively higher payinghigh interest rate earning time deposits to lower paying non-maturity deposits. Partially offsetting thenoninterest-earning, demand, and savings deposits, an increase in net interest income related to the Citizens acquisitionaverage balance of investments securities, and an increase in the deposit rate and volume changesaverage balance of loans; all of which were organic loan payoffssubstantially offset by a decrease in excess of loan production during 2011. These loan payoffs in excess of loan production and deposit growth during 2011 were deployed into lower yielding short-term interest-earning balances at the Federal Reserve Bank. During 2011, investment opportunities continued to be unattractive given their low market yields and interest rate risk profile.average yield on loans.
Summary of Average Balances, Yields/Rates and Interest Differential – Yield Tables
The following tables present, for the periods indicated, information regarding the Company’s consolidated average assets, liabilities and shareholders’ equity, the amounts of interest income from average earning assets and resulting yields, and the amount of interest expense paid on interest-bearing liabilities. Average loan balances include nonperforming loans. Interest income includes proceeds from loans on nonaccrual loans only to the extent cash payments have been received and applied to interest income. Yields on securities and certain loans have been adjusted upward to reflect the effect of income thereon exempt from federal income taxation at the current statutory tax rate (dollars in thousands):
| Year ended December 31, 2012 | Year ended December 31, 2014 | |||||||||||||||||||||||
| Average balance | Interest income/ expense | Rates earned/paid | Average balance | Interest income/expense | Rates earned/paid | |||||||||||||||||||
Assets | ||||||||||||||||||||||||
Loans | $ | 1,552,540 | $ | 100,496 | 6.47 | % | $ | 1,847,749 | $ | 103,887 | 5.62 | % | ||||||||||||
Investment securities—taxable | 200,958 | 6,177 | 3.07 | % | ||||||||||||||||||||
Investment securities—nontaxable | 9,529 | 685 | 7.19 | % | ||||||||||||||||||||
Investment securities - taxable | 527,742 | 15,590 | 2.95 | % | ||||||||||||||||||||
Investment securities - nontaxable | 17,024 | 808 | 4.75 | % | ||||||||||||||||||||
Cash at Federal Reserve and other banks | 587,118 | 1,615 | 0.28 | % | 404,056 | 1,133 | 0.28 | % | ||||||||||||||||
|
|
|
| |||||||||||||||||||||
Total earning assets | 2,350,145 | 108,973 | 4.64 | % | 2,796,571 | 121,418 | 4.34 | % | ||||||||||||||||
|
| |||||||||||||||||||||||
Other assets | 176,927 | 216,878 | ||||||||||||||||||||||
|
| |||||||||||||||||||||||
Total assets | $ | 2,527,072 | $ | 3,013,449 | ||||||||||||||||||||
|
| |||||||||||||||||||||||
Liabilities and shareholders’ equity | ||||||||||||||||||||||||
Interest-bearing demand deposits | $ | 471,747 | 784 | 0.17 | % | $ | 605,241 | 484 | 0.08 | % | ||||||||||||||
Savings deposits | 763,065 | 1,212 | 0.16 | % | 926,389 | 1,153 | 0.12 | % | ||||||||||||||||
Time deposits | 372,698 | 2,420 | 0.65 | % | 291,515 | 1,637 | 0.56 | % | ||||||||||||||||
Other borrowings | 45,753 | 1,604 | 3.51 | % | 7,512 | 4 | 0.05 | % | ||||||||||||||||
Junior subordinated debt | 41,238 | 1,324 | 3.21 | % | 44,366 | 1,403 | 3.16 | % | ||||||||||||||||
|
|
|
| |||||||||||||||||||||
Total interest-bearing liabilities | 1,694,501 | 7,344 | 0.43 | % | 1,875,023 | 4,681 | 0.25 | % | ||||||||||||||||
|
| |||||||||||||||||||||||
Noninterest-bearing demand | 572,568 | 801,056 | ||||||||||||||||||||||
Other liabilities | 34,852 | 36,085 | ||||||||||||||||||||||
Shareholders’ equity | 225,151 | 301,285 | ||||||||||||||||||||||
|
| |||||||||||||||||||||||
Total liabilities and shareholders’ equity | $ | 2,527,072 | $ | 3,013,449 | ||||||||||||||||||||
|
| |||||||||||||||||||||||
Net interest spread(1) | 4.21 | % | 4.09 | % | ||||||||||||||||||||
Net interest income and interest margin(2) | $ | 101,629 | 4.32 | % | $ | 116,737 | 4.17 | % | ||||||||||||||||
|
|
|
| |||||||||||||||||||||
| (1) | Net interest spread represents the average yield earned on interest-earning assets less the average rate paid on interest-bearing liabilities. |
| (2) | Net interest margin is computed by dividing net interest income by total average earning assets. |
23
Summary of Average Balances, Yields/Rates and Interest Differential – Yield Tables (continued)
| Year ended December 31, 2011 | Year ended December 31, 2013 | |||||||||||||||||||||||
| Average balance | Interest income/ expense | Rates earned/paid | Average balance | Interest income/expense | Rates earned/paid | |||||||||||||||||||
Assets | ||||||||||||||||||||||||
Loans | $ | 1,442,821 | $ | 92,691 | 6.42 | % | $ | 1,610,725 | $ | 97,548 | 6.06 | % | ||||||||||||
Investment securities—taxable | 262,306 | 8,760 | 3.34 | % | ||||||||||||||||||||
Investment securities—nontaxable | 11,403 | 833 | 7.31 | % | ||||||||||||||||||||
Investment securities - taxable | 224,636 | 6,736 | 3.00 | % | ||||||||||||||||||||
Investment securities - nontaxable | 16,632 | 933 | 5.61 | % | ||||||||||||||||||||
Cash at Federal Reserve and other banks | 386,067 | 1,007 | 0.26 | % | 591,507 | 1,693 | 0.29 | % | ||||||||||||||||
|
|
|
| |||||||||||||||||||||
Total earning assets | 2,102,597 | 103,291 | 4.91 | % | 2,443,500 | 106,910 | 4.38 | % | ||||||||||||||||
|
| |||||||||||||||||||||||
Other assets | 173,311 | 179,267 | ||||||||||||||||||||||
|
| |||||||||||||||||||||||
Total assets | $ | 2,275,908 | $ | 2,622,767 | ||||||||||||||||||||
|
| |||||||||||||||||||||||
Liabilities and shareholders’ equity | ||||||||||||||||||||||||
Interest-bearing demand deposits | $ | 410,870 | $ | 1,217 | 0.30 | % | $ | 524,139 | 528 | 0.10 | % | |||||||||||||
Savings deposits | 661,480 | 1,421 | 0.21 | % | 797,803 | 1,026 | 0.13 | % | ||||||||||||||||
Time deposits | 415,319 | 3,921 | 0.94 | % | 315,253 | 1,891 | 0.60 | % | ||||||||||||||||
Other borrowings | 63,602 | 2,420 | 3.80 | % | 8,026 | 4 | 0.05 | % | ||||||||||||||||
Junior subordinated debt | 41,238 | 1,259 | 3.05 | % | 41,238 | 1,247 | 3.02 | % | ||||||||||||||||
|
|
|
| |||||||||||||||||||||
Total interest-bearing liabilities | 1,592,509 | 10,238 | 0.64 | % | 1,686,459 | 4,696 | 0.28 | % | ||||||||||||||||
|
|
| ||||||||||||||||||||||
Noninterest-bearing demand | 442,174 | 657,377 | ||||||||||||||||||||||
Other liabilities | 33,005 | 37,297 | ||||||||||||||||||||||
Shareholders’ equity | 208,220 | 241,634 | ||||||||||||||||||||||
|
| |||||||||||||||||||||||
Total liabilities and shareholders’ equity | $ | 2,275,908 | $ | 2,622,767 | ||||||||||||||||||||
|
| |||||||||||||||||||||||
Net interest spread(1) | 4.27 | % | 4.10 | % | ||||||||||||||||||||
Net interest income and interest margin(2) | $ | 93,053 | 4.43 | % | $ | 102,214 | 4.18 | % | ||||||||||||||||
|
|
|
| |||||||||||||||||||||
| Year ended December 31, 2010 | Year ended December 31, 2012 | |||||||||||||||||||||||
| Average balance | Interest income/ expense | Rates earned/paid | Average balance | Interest income/expense | Rates earned/paid | |||||||||||||||||||
Assets | ||||||||||||||||||||||||
Loans | $ | 1,464,606 | $ | 93,073 | 6.35 | % | $ | 1,552,540 | $ | 100,496 | 6.47 | % | ||||||||||||
Investment securities—taxable | 263,059 | 10,039 | 3.82 | % | ||||||||||||||||||||
Investment securities—nontaxable | 14,717 | 1,113 | 7.56 | % | ||||||||||||||||||||
Investment securities - taxable | 200,958 | 6,177 | 3.07 | % | ||||||||||||||||||||
Investment securities - nontaxable | 9,529 | 685 | 7.19 | % | ||||||||||||||||||||
Cash at Federal Reserve and other banks | 296,970 | 760 | 0.26 | % | 587,118 | 1,615 | 0.28 | % | ||||||||||||||||
|
|
|
| |||||||||||||||||||||
Total earning assets | 2,039,352 | 104,985 | 5.15 | % | 2,350,145 | 108,973 | 4.64 | % | ||||||||||||||||
|
| |||||||||||||||||||||||
Other assets | 169,290 | 176,927 | ||||||||||||||||||||||
|
| |||||||||||||||||||||||
Total assets | $ | 2,208,642 | $ | 2,527,072 | ||||||||||||||||||||
|
| |||||||||||||||||||||||
Liabilities and shareholders’ equity | ||||||||||||||||||||||||
Interest-bearing demand deposits | $ | 384,077 | 2,242 | 0.58 | % | $ | 471,747 | 784 | 0.17 | % | ||||||||||||||
Savings deposits | 552,104 | 2,277 | 0.41 | % | 763,065 | 1,212 | 0.16 | % | ||||||||||||||||
Time deposits | 544,018 | 5,928 | 1.09 | % | 372,698 | 2,420 | 0.65 | % | ||||||||||||||||
Other borrowings | 62,110 | 2,412 | 3.88 | % | 45,753 | 1,604 | 3.51 | % | ||||||||||||||||
Junior subordinated debt | 41,238 | 1,274 | 3.09 | % | 41,238 | 1,324 | 3.21 | % | ||||||||||||||||
|
|
|
| |||||||||||||||||||||
Total interest-bearing liabilities | 1,583,547 | 14,133 | 0.89 | % | 1,694,501 | 7,344 | 0.43 | % | ||||||||||||||||
|
| |||||||||||||||||||||||
Noninterest-bearing demand | 385,704 | 572,568 | ||||||||||||||||||||||
Other liabilities | 35,196 | 34,852 | ||||||||||||||||||||||
Shareholders’ equity | 204,195 | 225,151 | ||||||||||||||||||||||
|
| |||||||||||||||||||||||
Total liabilities and shareholders’ equity | $ | 2,208,642 | $ | 2,527,072 | ||||||||||||||||||||
|
| |||||||||||||||||||||||
Net interest spread(1) | 4.26 | % | 4.21 | % | ||||||||||||||||||||
Net interest income and interest margin(2) | $ | 90,852 | 4.45 | % | $ | 101,629 | 4.32 | % | ||||||||||||||||
|
|
|
| |||||||||||||||||||||
| (1) | Net interest spread represents the average yield earned on interest-earning assets less the average rate paid on interest-bearing liabilities. |
| (2) | Net interest margin is computed by dividing net interest income by total average earning assets. |
24
Summary of Changes in Interest Income and Expense due to Changes in Average Asset and Liability Balances and Yields Earned and Rates Paid – Volume/Rate Tables
The following table sets forth a summary of the changes in the Company’s interest income and interest expense from changes in average asset and liability balances (volume) and changes in average interest rates for the periods indicated. The rate/volume variance has been included in the rate variance. Amounts are calculated on a fully taxable equivalent basis:
| 2012 over 2011 | 2011 over 2010 | 2014 over 2013 | 2013 over 2012 | |||||||||||||||||||||||||||||||||||||||||||||
| Volume | Rate | Total | Volume | Yield/ Rate | Yield/ Total | Volume | Yield/ Rate | Total | Volume | Yield/ Rate | Total | |||||||||||||||||||||||||||||||||||||
| (dollars in thousands) | (dollars in thousands) | |||||||||||||||||||||||||||||||||||||||||||||||
Increase (decrease) in interest income: | ||||||||||||||||||||||||||||||||||||||||||||||||
Increase (decrease) in | ||||||||||||||||||||||||||||||||||||||||||||||||
interest income: | ||||||||||||||||||||||||||||||||||||||||||||||||
Loans | $ | 7,044 | $ | 761 | $ | 7,805 | $ | (1,383 | ) | $ | 1,001 | $ | (382 | ) | $ | 14,364 | $ | (8,025 | ) | $ | 6,339 | $ | 3,765 | $ | (6,713 | ) | $ | (2,948 | ) | |||||||||||||||||||
Investments—taxable | (2,049 | ) | (534 | ) | (2,583 | ) | (29 | ) | (1,250 | ) | (1,279 | ) | ||||||||||||||||||||||||||||||||||||
Investments—nontaxable | (137 | ) | (11 | ) | (148 | ) | (251 | ) | (29 | ) | (280 | ) | ||||||||||||||||||||||||||||||||||||
Investments - taxable | 9,093 | (239 | ) | 8,854 | 727 | (168 | ) | 559 | ||||||||||||||||||||||||||||||||||||||||
Investments - nontaxable | 22 | (147 | ) | (125 | ) | 511 | (263 | ) | 248 | |||||||||||||||||||||||||||||||||||||||
Cash at Federal Reserve and other banks | 523 | 85 | 608 | 232 | 15 | 247 | (544 | ) | (16 | ) | (560 | ) | 12 | 66 | 78 | |||||||||||||||||||||||||||||||||
|
|
|
|
|
|
|
|
|
|
|
| |||||||||||||||||||||||||||||||||||||
Total | 5,381 | 301 | 5,682 | (1,431 | ) | (263 | ) | (1,694 | ) | 22,935 | (8,427 | ) | 14,508 | 5,015 | (7,078 | ) | (2,063 | ) | ||||||||||||||||||||||||||||||
|
|
|
|
|
|
|
|
|
|
|
| |||||||||||||||||||||||||||||||||||||
Increase (decrease) in interest expense: | ||||||||||||||||||||||||||||||||||||||||||||||||
Demand deposits (interest-bearing) | 183 | (616 | ) | (433 | ) | 155 | (1,180 | ) | (1,025 | ) | 81 | (125 | ) | (44 | ) | 89 | (345 | ) | (256 | ) | ||||||||||||||||||||||||||||
Savings deposits | 213 | (422 | ) | (209 | ) | 448 | (1,304 | ) | (856 | ) | 167 | (40 | ) | 127 | 56 | (242 | ) | (186 | ) | |||||||||||||||||||||||||||||
Time deposits | (401 | ) | (1,100 | ) | (1,501 | ) | (1,403 | ) | (604 | ) | (2,007 | ) | (142 | ) | (112 | ) | (254 | ) | (373 | ) | (156 | ) | (529 | ) | ||||||||||||||||||||||||
Other borrowings | (678 | ) | (138 | ) | (816 | ) | 58 | (50 | ) | 8 | — | — | — | (1,324 | ) | (276 | ) | (1,600 | ) | |||||||||||||||||||||||||||||
Junior subordinated debt | — | 65 | 65 | — | (15 | ) | (15 | ) | 94 | 62 | 156 | — | (77 | ) | (77 | ) | ||||||||||||||||||||||||||||||||
|
|
|
|
|
|
|
|
|
|
|
| |||||||||||||||||||||||||||||||||||||
Total | (683 | ) | (2,211 | ) | (2,894 | ) | (742 | ) | (3,153 | ) | (3,895 | ) | 200 | (215 | ) | (15 | ) | (1,552 | ) | (1,096 | ) | (2,648 | ) | |||||||||||||||||||||||||
|
|
|
|
|
|
|
|
|
|
|
| |||||||||||||||||||||||||||||||||||||
Increase (decrease) in net interest income | $ | 6,064 | $ | 2,512 | $ | 8,576 | $ | (689 | ) | $ | 2,890 | $ | 2,201 | |||||||||||||||||||||||||||||||||||
Increase (decrease) innet interest income | $ | 22,735 | $ | (8,212 | ) | $ | 14,523 | $ | 6,567 | $ | (5,982 | ) | $ | 585 | ||||||||||||||||||||||||||||||||||
|
|
|
|
|
|
|
|
|
|
|
| |||||||||||||||||||||||||||||||||||||
Provision for Loan Losses
The provision for loan losses was $9,423,000during any period is the sum of the allowance for loan losses required at the end of the period and $23,060,000any loan charge offs during the period, less the allowance for loan losses required at the beginning of the period, and less any loan recoveries during the period. See the Tables labeled“Allowance for loan losses – year ended December 31, 2014 and 2013” at Note 5 in Item 8 of Part II of this report for the components that make up the provision for loan losses for the years ended December 31, 2012,2014 and 2011, respectively. 2013.
The Company benefited from a $4,045,000 reversal of provision for loan losses during the year ended December 31, 2014 versus a benefit from reversal of provision for loan losses of $715,000 during the year ended December 31, 2013. As shown in the Table labeled“Allowance for Loan Losses—year ended December 31, 2014” at Note 5 in Item 8 of Part II of this report, all categories of loans except residential real estate mortgage loans, home equity loans and other consumer loans experienced a reversal of provision for loan losses during the year ended December 31, 2014. The level of provision, or reversal of provision, for loan losses of each loan category during the year ended December 31, 2014 was due primarily to a decrease in the required allowance for loan losses as of December 31, 2014 when compared to the required allowance for loan losses as of December 31, 2013 less net charge-offs during the year ended December 31, 2014, and the effect of the changes in the allowance methodology during the year ended December 31, 2014 as described under the heading“Loans and Allowance for Loan Losses”at Note 1 in Item 8 of Part II of this report. All categories of loans except home equity loans and other consumer loans experienced a decrease in the required allowance for loan losses during the year ended December 31, 2014. These decreases in required allowance for loan losses were due primarily to reduced impaired loans, improvements in estimated cash flows and collateral values for the remaining and newly impaired loans, and reductions in historical loss factors that, in part, determine the required loan loss allowance for performing loans in accordance with the Company’s allowance for loan losses methodology as described under the heading“Loans and Allowance for Loan Losses” at Note 1 in Item 8 of Part II of this report. These same factors were also present, to some extent, for home equity loans and other consumer loans, but were more than offset by the effect of increased loan balances or changes in credit quality within the “pass” category of these loan categories resulting in net provisions for loan losses in these categories during the year ended December 31, 2014. For details of the change in nonperforming loans during the year ended December 31, 2013 see the Tables, and associated narratives, labeled“Changes in nonperforming assets during the year ended December 31, 2014”and“Changes in nonperforming assets during the three months ended December 31, September 30, June 30, and March 31, 2014”under the heading“Asset Quality and Non-Performing Assets” below. During the year ended December 31, 2014, the Company made two changes to its allowance for loan loss methodology. The changes in methodology are described under the heading“Allowance for loan losses” in the section below labeled“Financial Condition”. Excluding the effect of the changes in allowance methodology during the year ended December 31, 2014, the reversal of provision for loan losses during the year ended December 31, 2014 would have been approximately $5,484,000, or $1,438,000 more than the $4,046,000 that was actually recorded, and the allowance for loan losses at December 31, 2014 would have been approximately $35,177,000, or $1,438,000 less than the $36,585,000 that was actually recorded.
25
The Company benefited from a $715,000 reversal of provision for loan losses during the year ended December 31, 2013 versus a provision for loan losses of $9,423,000 during the year ended December 31, 2012. The decrease in the provision for loan losses for the year ended December 31, 20122013 as compared to the year ended December 31, 20112012 was primarily the result of improvement in collateral values and estimated cash flows related to nonperforming loans and purchased credit impaired loans, and a reduction in nonperforming loans.
The provision for loan losses was $23,060,000 and $37,458,000 for the years ended December 31, 2011, and 2010, respectively. The decreases in the provision for loan losses for the year ended December 31, 2011 as compared to the year ended December 31, 2010 was primarily the result of changes in the make-up of the originated loan portfolio and the Bank’s loss factors related to the originated loan portfolio in reaction to decreased losses in the construction, commercial real estate, commercial & industrial (C&I), home equity and auto indirect loan portfolios. Included in the provision for loan losses for the year ended December 31, 2011 is $1,562,000 related to loans acquired in the Citizens acquisition and $1,248,000 related to loans acquired in the Granite acquisition.
Management re-evaluates the loss ratios and assumptions of its originated and PNCI loan portfolios and makes changes as appropriate based upon, among other things, changes in loss rates experienced, collateral support for underlying loans, changes and trends in the economy, and changes in the loan mix. Management also re-evaluates expected cash flows for its PCI loan portfolio quarterly and makes changes as appropriate based upon, among other things, changes in loan repayment experience, changes in loss rates experienced, and collateral support for underlying loans.
The provision for loan losses related to originatedOriginated and PNCI loans is based on management’s evaluation of inherent risks in these loan portfolios and a corresponding analysis of the allowance for loan losses. The provision for loan losses related to PCI loan portfolio is based on changes in estimated cash flows expected to be collected on PCI loans. Additional discussion on loan quality, our procedures to measure loan impairment, and the allowance for loan losses is provided under the heading“Asset Quality and Non-Performing Assets” below.
Management re-evaluates the loss ratios and other assumptions used in its calculation of the allowance for loan losses for its Originated and PNCI loan portfolios on a quarterly basis and makes changes as appropriate based upon, among other things, changes in loss rates experienced, collateral support for underlying loans, changes and trends in the economy, and changes in the loan mix. Management also re-evaluates expected cash flows used in its accounting for its PCI loan portfolio, including any required allowance for loan losses, on a quarterly basis and makes changes as appropriate based upon, among other things, changes in loan repayment experience, changes in loss rates experienced, and collateral support for underlying loans.
Noninterest Income
The following table summarizes the Company’s noninterest income for the periods indicated (dollars in thousands):
| Year ended December 31, | Year ended December 31, | |||||||||||||||||||||||
| 2012 | 2011 | 2010 | 2014 | 2013 | 2012 | |||||||||||||||||||
Components of Noninterest Income | ||||||||||||||||||||||||
Service charges on deposit accounts | $ | 14,290 | $ | 14,776 | $ | 15,296 | $ | 11,811 | $ | 12,716 | $ | 14,290 | ||||||||||||
ATM fees and interchange | 7,762 | 7,058 | 6,078 | 9,651 | 8,370 | 7,762 | ||||||||||||||||||
Other service fees | 2,223 | 1,722 | 1,452 | 2,206 | 2,144 | 2,223 | ||||||||||||||||||
Mortgage banking service fees | 1,666 | 1,495 | 1,303 | 1,869 | 1,774 | 1,666 | ||||||||||||||||||
Change in value of mortgage servicing rights | (2,016 | ) | (1,107 | ) | (1,029 | ) | (1,301 | ) | 253 | (2,016 | ) | |||||||||||||
|
|
|
|
|
| |||||||||||||||||||
Total service charges and fees | 23,925 | 23,944 | 23,100 | 24,236 | 25,257 | 23,925 | ||||||||||||||||||
Gain on sale of loans | 6,810 | 3,037 | 3,647 | 2,032 | 5,602 | 6,810 | ||||||||||||||||||
Commissions on sale of nondeposit investment products | 3,209 | 2,105 | 1,209 | 2,995 | 2,983 | 3,209 | ||||||||||||||||||
Increase in cash value of life insurance | 1,820 | 1,885 | 1,847 | 1,953 | 1,727 | 1,820 | ||||||||||||||||||
Change in indemnification asset | (286 | ) | 2,059 | 1,274 | (856 | ) | (1,649 | ) | (286 | ) | ||||||||||||||
Gain on disposition of foreclosed assets | 786 | 680 | 562 | 2,153 | 1,640 | 786 | ||||||||||||||||||
Legal settlement | — | — | 400 | |||||||||||||||||||||
Bargain purchase gain | — | 7,575 | 232 | |||||||||||||||||||||
Gain on life insurance death benefit | 675 | 789 | — | — | — | 675 | ||||||||||||||||||
Other noninterest income | 1,041 | 739 | 424 | 2,003 | 1,269 | 1,041 | ||||||||||||||||||
|
|
|
|
|
| |||||||||||||||||||
Total noninterest income | $ | 37,980 | $ | 42,813 | $ | 32,695 | $ | 34,516 | $ | 36,829 | $ | 37,980 | ||||||||||||
|
|
|
|
|
| |||||||||||||||||||
Noninterest income decreased $4,833,000 (11.3%$2,313,000 (6.3%) to $37,980,000$34,516,000 in 2012. Excluding bargain purchase gains and gain on life insurance death benefits, noninterest income would have increased $2,856,000 (8.3%) to $37,305,000 in 2012 from $34,449,000 in 2011.2014. Service charges on deposit accounts were down $486,000 (3.3%$905,000 (7.1%) due to reduced customer overdrafts and a resulting decrease in non-sufficient funds fees. ATM fees and interchange income was up $704,000 (10.0%revenue increased $1,281,000 (15.3%) due to increased interchange revenue from the negotiation of a more favorable agreement with the Company’s interchange service provider, increased sales efforts in this area, and the acquisition of North Valley Bancorp and its customer point-of-sale transactions that are the result of incentives for such usage.base. Overall, mortgage banking activities, which includes mortgage banking servicing fees, change in value of mortgage servicing rights, and gain on sale of loans, accounted for $6,460,000$2,600,000 of noninterest income in the 20122014 compared to $3,425,000$7,629,000 in 2011.2013. This $3,035,00 (88.6%$5,029,000 (65.9%) increasedecrease in mortgage banking related revenue iswas mainly due to historically lowan increase in mortgage rates an associated level ofthat occurred in May 2013 that resulted in reduced mortgage refinance activity and the Bank’s focus of resources in this area. Commissionsreduced gain on sale of nondeposit investment productsloans in the second half of 2013 and throughout 2014, and a decrease in change in value of mortgage servicing rights as projected servicing fees were reduced due to reduced mortgage rates at the end of 2014 that are expected to result in increased $1,104,000 (52.4%refinance activity and shorter lives of existing servicing assets. Increase in cash value of life insurance improved $226,000 (13.1%) in 2012during 2014 due to the Bank’s focusaddition of resourceslife insurance in this area. The changethe North Valley Bancorp acquisition. Change in indemnification asset from $2,059,000improved $793,000 to a negative contribution to revenue of $856,000 in 2011 to ($286,000) in 20122014 is primarily due to a decrease in estimated loan losses from the loan portfolio and foreclosed assets acquired in the Granite acquisition on May 28, 2010, and the fact that such losses are generally “covered” at the rate of 80% by the FDIC. The actual decrease in estimated losses is reflected in increased interest income, decreased provision for loan losses and/or decreased provision for foreclosed asset losses. The operationsGain on sale of Citizensforeclosed assets increased $513,000 (31.3%) to $2,153,000 during 2012 added $2,585,0002014 primarily due to noninterest income.improved property values.
Noninterest income increased $10,118,000 (30.9%decreased $1,151,000 (3.0%) to $42,813,000$36,829,000 in 2011.2013. Service charges on deposit accounts were down $520,000 (3.4%$1,574,000 (11.0%) due to new overdraft regulations that became effective on July 1, 2010reduced customer overdrafts and caused a resulting decrease in non-sufficient funds fees. ATM fees and
26
interchange income was up $980,000 (16.1%$608,000 (7.8%) due to increased customer point-of-sale transactions that are the result of incentives for such usage.transactions. Overall, mortgage banking activities, which includes mortgage banking servicing fees, change in value of mortgage servicing rights, and gain on sale of loans, accounted for $3,425,000$7,629,000 of noninterest income in the 20112013 compared to $3,921,000$6,460,000 in 2010.2012. This $1,169,000 (18.1%) increase in mortgage banking related revenue is mainly due to historically low mortgage rates and the associated high level of mortgage refinance activity that existed during most of 2013, the Bank’s focus of resources in this area, and an increase in mortgage rates in the second half of 2013 that while significantly decreasing originations, sales, and gain on sale of loans during the second half of 2013, also resulted in an increase in the value of the Company’s mortgage servicing rights during 2013. Commissions on sale of nondeposit investment products increased $896,000 (74.1%decreased $226,000 (7.0%) in 2011 due to increased focus and resources deployed in that area.2013. The change in indemnification asset of $2,059,000 recordedfrom ($286,000) in 20112012 to ($1,649,000) in 2013 is primarily due to an increasea decrease in estimated loan losses from the loan portfolio and foreclosed assets acquired in the Granite acquisition on May 28, 2010, and the fact that such losses are generally “covered” at the rate of 80% by the FDIC. The actual increasedecrease in estimated losses is also reflected in decreasedincreased interest income, increaseddecreased provision for loan losses and/or increaseddecreased provision for foreclosed asset losses. The September 23, 2011 acquisition of Citizens added noninterest income totaling $8,029,000 through December 31, 2011 including a bargain purchase gain of $7,575,000. Also during 2011, the Company recorded a $789,000 gain on life insurance death benefit due to the passing of an insured former employee.
Noninterest Expense
The following table summarizes the Company’s other noninterest expense for the periods indicated (dollars in thousands):
| Year ended December 31, | Year ended December 31, | |||||||||||||||||||||||
| 2012 | 2011 | 2010 | 2014 | 2013 | 2012 | |||||||||||||||||||
Components of Noninterest Expense | ||||||||||||||||||||||||
Salaries and related benefits: | ||||||||||||||||||||||||
Base salaries, net of deferred loan origination costs | $ | 33,093 | $ | 29,753 | $ | 28,255 | $ | 39,342 | $ | 34,404 | $ | 33,093 | ||||||||||||
Incentive compensation | 5,138 | 3,735 | 1,844 | 5,068 | 4,694 | 5,138 | ||||||||||||||||||
Benefits and other compensation costs | 11,721 | 10,715 | 10,006 | 13,134 | 12,838 | 11,721 | ||||||||||||||||||
|
|
|
|
|
| |||||||||||||||||||
Total salaries and related benefits | 49,952 | 44,203 | 40,105 | 57,544 | 51,936 | 49,952 | ||||||||||||||||||
|
|
|
|
|
| |||||||||||||||||||
Other noninterest expense: | ||||||||||||||||||||||||
Occupancy | 7,263 | 6,198 | 5,717 | 8,203 | 7,405 | 7,263 | ||||||||||||||||||
Equipment | 4,444 | 3,770 | 3,975 | 4,514 | 4,162 | 4,444 | ||||||||||||||||||
Data processing and software | 4,793 | 3,980 | 3,163 | 6,512 | 4,844 | 4,793 | ||||||||||||||||||
Assessments | 2,393 | 2,491 | 3,253 | 2,107 | 2,248 | 2,393 | ||||||||||||||||||
ATM network charges | 2,390 | 1,939 | 1,851 | 2,996 | 2,480 | 2,390 | ||||||||||||||||||
Advertising | 2,876 | 2,649 | 2,340 | 2,413 | 1,981 | 2,876 | ||||||||||||||||||
Professional fees | 2,709 | 2,004 | 2,478 | 3,888 | 2,707 | 2,879 | ||||||||||||||||||
Telecommunications | 2,250 | 1,875 | 1,817 | 2,870 | 2,449 | 2,250 | ||||||||||||||||||
Postage | 920 | 935 | 1,037 | 949 | 786 | 920 | ||||||||||||||||||
Courier service | 1,013 | 953 | 826 | 1,055 | 988 | 1,013 | ||||||||||||||||||
Foreclosed asset expense | 1,474 | 755 | 625 | 528 | 514 | 1,474 | ||||||||||||||||||
Intangible amortization | 209 | 177 | 307 | 446 | 209 | 209 | ||||||||||||||||||
Operational losses | 787 | 600 | 394 | 764 | 618 | 787 | ||||||||||||||||||
Provision for foreclosed asset losses | 1,728 | 1,984 | 1,522 | 208 | 682 | 1,728 | ||||||||||||||||||
Change in reserve for unfunded commitments | 875 | 100 | (1,000 | ) | (395 | ) | (1,200 | ) | 875 | |||||||||||||||
Legal settlement | 2,090 | — | — | — | 339 | 2,090 | ||||||||||||||||||
Merger expense | 4,858 | 312 | — | |||||||||||||||||||||
Other | 9,832 | 8,102 | 8,795 | 10,919 | 10,144 | 9,662 | ||||||||||||||||||
|
|
|
|
|
| |||||||||||||||||||
Total other noninterest expenses | 48,046 | 38,512 | 37,100 | 52,835 | 41,668 | 48,046 | ||||||||||||||||||
|
|
|
|
|
| |||||||||||||||||||
Total noninterest expense | $ | 97,998 | $ | 82,715 | $ | 77,205 | $ | 110,379 | $ | 93,604 | $ | 97,998 | ||||||||||||
|
|
|
|
|
| |||||||||||||||||||
Merger expense: | ||||||||||||||||||||||||
Incentive compensation | $ | 1,174 | — | — | ||||||||||||||||||||
Benefits and other compensation costs | 94 | — | — | |||||||||||||||||||||
Data processing and software | 475 | — | — | |||||||||||||||||||||
Professional fees | 2,390 | $ | 312 | — | ||||||||||||||||||||
Other | 725 | — | — | |||||||||||||||||||||
|
|
| ||||||||||||||||||||||
Total merger expense | $ | 4,858 | $ | 312 | — | |||||||||||||||||||
|
|
| ||||||||||||||||||||||
Average full time equivalent staff | 737 | 687 | 667 | 783 | 733 | 737 | ||||||||||||||||||
Noninterest expense to revenue (FTE) | 70.2 | % | 60.9 | % | 62.5 | % | 73.0 | % | 67.3 | % | 70.2 | % | ||||||||||||
Salary and benefit expenses increased $5,749,000 (13.0%$5,608,000 (10.8%) to $49,952,000$57,544,000 in 20122014 compared to 2011.2013. Base salaries increased $3,340,000 (11.2%$4,938,000 (14.4%) to $33,093,000$39,342,000 in 2012.2014 primarily due to the North Valley Bancorp acquisition. The average number of full time equivalent employees increased 50 (6.8%) to 783 during 2014. The increase in base salaries was mainly due to a 50 FTE (7.3%) increase in average full time equivalent staffemployees is due to 737the addition of employees from the North Valley Bancorp acquisition and the addition of operations, compliance, marketing, and administrative employees, that were partially offset by reductions of employees from the consolidation of three, two, one and one Tri Counties Bank branches during 2012,the three months ended December 31, 2013, and annualMarch 31, June 30, and September 30, 2014, respectively. Annual salary merit increases.increases of approximately 3.0% also contributed to the increase in base salary expense. Incentive and commission related salary expenses increased $1,403,000 (37.6%$374,000 (14.4%) to $5,138,000 in 2012
27
$5,068,000 during 2014 due primarily to increases in commissions related to loan production and nondeposit investment product fee production.all types of incentive compensation. Benefits expense, including retirement, medical and workers’ compensation insurance, and taxes, increased $1,006,000 (9.4%$296,000 (2.3%) to $11,721,000$13,134,000 during 2012. The operations of Citizens added $2,452,000 and $751,0002014 due to salaries and benefits expense for the year ended December 31, 2012, and the period from September 23, 2011small to December 31, 2011, respectively.no increases in most benefit types.
Salary and benefit expenses increased $4,098,000 (10.2%$1,984,000 (4.0%) to $44,203,000 in 2011$51,936,000 during the year ended December 31, 2013 compared to 2010.the year ended December 31, 2012. Base salaries increased $1,498,000 (5.3%$1,311,000 (4.0%) to $29,753,000 in 2011.$34,404,000 during the year ended December 31, 2013. The increase in base salaries was mainly due to 3.0%annual merit increases and an increase in averageadministrative, central operations, and electronic banking personnel that were partially offset by a reduction in branch personnel. Average full time equivalent staff and annual merit increases.personnel decreased to 733 during the year ended December 31, 2013 from 737 during the year ended December 31, 2012. Incentive and commission related salary expenses increased $1,891,000 (103%decreased $444,000 (8.6%) to $3,735,000 in 2011$4,694,000 during year ended December 31, 2013 due primarily to increases in management bonuses and otherreduced mortgage loan production incentives tiedwhen compared to net income.the prior year. Benefits expense, including retirement, medical and workers’ compensation insurance, and taxes, increased $709,000 (7.1%$1,117,000 (9.5%) to $10,715,000$12,838,000 during 2011. Included in benefits expense in 2011 wasthe year ended December 31, 2013 primarily due to increased medical insurance costs, employee stock optionownership plan expense, and employer payroll taxes.
Other noninterest expense increased $11,167,000 (26.8%) to $52,835,000 during 2014 compared 2013 December 31, 2013. The increase in other noninterest expense was due primarily to a $4,546,000 increase in merger related expenses to $4,858,000, of $636,000 comparedwhich $1,269,000 are not deductible for tax purposes, a $1,668,000 (34.4%) increase in data processing and software expenses to $550,000$6,512,000, and a $1,181,000 (43.6%) increase in 2010.professional fees to $3,888,000. The increase in merger expenses was due to the North Valley Bancorp acquisition and included stay bonuses, severance pay, and other retention incentives, system conversion and other data processing expenses, professional fees including financial advisor and other consultant fees. The increase in data processing and software expenses was due primarily to increases in ongoing data processing and software expenses some of which are due to increased ongoing processing volume as a result of the North Valley Bancorp acquisition. The increase in professional fees was due primarily to increases in ongoing or non-merger related consulting fees related to compliance, control systems, and operational improvements. Increases in other areas of noninterest expense are primarily due to the North Valley Bancorp acquisition.
Other noninterest expenses increased $9,534,000 (24.8%decreased $6,378,000 (13.3%) to $48,046,000 in$41,668,000 during the year ended December 31, 2013 when compared to the year ended December 31, 2012. The operations of Citizens added $3,333,000 todecrease in other noninterest expense during 2012, comparedis primarily due to $1,114,000decreases of $2,075,000, $1,751,000, $1,046,000, $960,000, and $895,000 in change in reserve for unfunded commitments, legal settlement expense, provision for foreclosed asset losses, foreclosed asset expenses, and advertising and marketing expense, respectively, from September 23, 2011the prior year. The decrease in change in reserve for unfunded commitments was mainly due to December 31, 2011. Changesimproved loss histories for performing originated loans that are used to calculate the required reserve for unfunded commitments. The decrease in legal settlement expense is due to the various categoriesresolution of other noninterest expense are reflecteda legal proceeding, and is further described at Item 3 of Part I of this report. The decreases in the table above. The changes are indicative of the economic environment which has lead to increases in professional loan collection expenses, provision for foreclosed asset losses and foreclosed asset expenses. Occupancy expense increased primarilyare due to seven branches and one admin facility acquired in the Citizens acquisition on September 23, 2011. The increase in change in reserve for unfunded commitments during 2012 is primarily due to increased unfunded construction loan commitments during the three months ended December 31, 2012. The legal settlement expense of $2,090,000 noted for 2012 was previously disclosed on September 27, 2012, and is further described at Item 3 – Legal Proceedings of this report.
Other noninterest expenses increased $1,412,000 (3.8%) to $38,512,000 in 2011. The operations of Citizens from September 23, 2011 to December 31, 2011 added $1,114,000 to other noninterest expense. Changes in the various categories of other noninterest expense are reflected in the table above. The changes are indicative of the economic environment which has lead to increases in professional loan collection expenses, provision for foreclosed asset losses, and foreclosed asset expenses. Occupancy expense increased primarily due to seven branches and one admin facility acquired in the Citizens acquisition on September 23, 2011, and two branches acquired in the Granite acquisition on May 28, 2010. Included in the $1,114,000 of Citizens related other noninterest expense were $296,000 of provision fordecreased foreclosed assets, expense and $271,000improved values of information systems expense including system conversion expense asforeclosed values. During 2013, the Company has begun work to convert the Citizens systems to the Company’s systems. Partially offsetting these increases was a $762,000 decrease in regulatoryBank opened no branches, closed three (leased) branches, closed one (leased) non-branch facility, and deposit insurance assessments.opened its Campus (owned) facility.
Income Taxes
The effective tax rate on income was 40.5%41.5%, 37.6%40.2%, and 29.1%40.5% in 2012, 2011,2014, 2013, and 2010,2012, respectively. The effective tax rate was greater than the federal statutory tax rate due to state tax expense of $3,277,000, $2,845,000,$4,817,000, $4,811,000, and $543,000,$3,277,000, respectively, in these years.years, and $1,310,000 of nondeductible merger expenses in 2014. Tax-exempt income of $428,000, $514,000,$505,000, $583,000, and $700,000,$428,000, respectively, from investment securities, and $2,495,000, $2,674,000,$1,953,000, $1,727,000, and $1,847,000,$2,495,000, respectively, from increase in cash value and gain on death benefit of life insurance in these years helped to reduce the effective tax rate.
Financial Condition
Investment Securities
During 2012 the Company did not sell any investment securities. During 2012 the Company received proceeds from maturities of securities totaling $76,764,000, and used $13,815,000 to purchase securities. During 2011 the Company did not sell any investment securities. During 2011 the Company received proceeds from maturities of securities totaling $84,016,000, and used $25,456,000 to purchase securities. The following table showspresents the Company’savailable for sale investment securities balances atportfolio by major type as of the dates indicated:
| Year ended December 31, | Year ended December 31, | |||||||||||||||||||||||||||||||||||||||
| (dollars in thousands) | 2012 | 2011 | 2010 | 2009 | 2008 | |||||||||||||||||||||||||||||||||||
Securities Available-for-sale: | ||||||||||||||||||||||||||||||||||||||||
| (In thousands) | 2014 | 2013 | 2012 | 2011 | 2010 | |||||||||||||||||||||||||||||||||||
Investment securities available for sale (at fair value): | ||||||||||||||||||||||||||||||||||||||||
Obligations of US government corporations and agencies | $ | 151,701 | $ | 217,384 | $ | 264,181 | $ | 193,130 | $ | 242,977 | $ | 75,120 | $ | 97,143 | $ | 151,701 | $ | 217,384 | $ | 264,181 | ||||||||||||||||||||
Obligations of states and political subdivisions | 9,421 | 10,028 | 12,541 | 17,953 | 22,665 | 3,175 | 5,589 | 9,421 | 10,028 | 12,541 | ||||||||||||||||||||||||||||||
Corporate bonds | 1,905 | 1,811 | 549 | 539 | 919 | 1,908 | 1,915 | 1,905 | 1,811 | 549 | ||||||||||||||||||||||||||||||
Marketable equity securities | 3,002 | — | — | — | — | |||||||||||||||||||||||||||||||||||
|
|
|
|
|
|
|
|
|
| |||||||||||||||||||||||||||||||
Total investment securities | $ | 163,027 | $ | 229,223 | $ | 277,271 | $ | 211,622 | $ | 266,561 | ||||||||||||||||||||||||||||||
Total investment securities available for sale | $ | 83,205 | $ | 104,647 | $ | 163,027 | $ | 229,223 | $ | 277,271 | ||||||||||||||||||||||||||||||
|
|
|
|
|
|
|
|
|
| |||||||||||||||||||||||||||||||
Investment securities available for sale decreased $21,442,000 to $83,205,000 as of December 31, 2014, as compared to December 31, 2013. This decrease is attributable to maturities and principal repayments of $24,016,000, a decrease in fair value of investments securities available for sale of $161,000, amortization of net purchase price premiums of $432,000, acquisition of $17,297,000 from North Valley Bancorp and proceeds for sale of securities of $14,130,000.
28
The following table presents the held to maturity investment securities portfolio by major type as of the dates indicated:
| Year ended December 31, | ||||||||||||||||||||
| (In thousands) | 2014 | 2013 | 2012 | 2011 | 2010 | |||||||||||||||
Investment securities held to maturity (at cost): | ||||||||||||||||||||
Obligations of US government corporations and agencies | $ | 660,836 | $ | 227,864 | — | — | — | |||||||||||||
Obligations of states and political subdivisions | 15,590 | 12,640 | — | — | — | |||||||||||||||
|
|
|
|
|
|
|
|
|
| |||||||||||
Total investment securities held to maturity | $ | 676,426 | $ | 240,504 | — | — | — | |||||||||||||
|
|
|
|
|
|
|
|
|
| |||||||||||
Investment securities held to maturity increased to $435,922,000 as of December 31, 2014, as compared to December 31, 2013. This increase is attributable to purchases of $280,692,000, less principal repayments of $34,172,000, amortization of net purchase price discounts/premiums of $547,000 and the acquisition of $189,949,000 from North Valley Bancorp.
Additional information about the investment portfolio is provided in Note 3 in the financial statements at Item 8 of Part II of this report.
Restricted Equity Securities
Restricted equity securities were $9,647,000$16,956,000 at December 31, 20122014 and $10,610,000$9,163,000 at December 31, 2011.2013. The entire balance of restricted equity securities at December 31, 20122014 and December 31, 20112013 represents the Bank’s investment in the Federal Home Loan Bank of San Francisco (“FHLB”). The decreaseincrease of $963,000$7,793,000 is attributableattributed to acquiring $5,378,000 in FHLB stock from North Valley Bancorp and the redemptionpurchase of $963,000 of$2,415,000 in FHLB stock.
FHLB stock is carried at par and does not have a readily determinable fair value. While technically these are considered equity securities, there is no market for the FHLB stock. Therefore, the shares are considered as restricted investment securities. Management periodically evaluates FHLB stock for other-than-temporary impairment. Management’s determination of whether these investments are impaired is based on its assessment of the ultimate recoverability of cost rather than by recognizing temporary declines in value. The determination of whether a decline affects the ultimate recoverability of cost is influenced by criteria such as (1) the significance of any decline in net assets of the FHLB as compared to the capital stock amount for the FHLB and the length of time this situation has persisted, (2) commitments by the FHLB to make payments required by law or regulation and the level of such payments in relation to the operating performance of the FHLB, (3) the impact of legislative and regulatory changes on institutions and, accordingly, the customer base of the FHLB, and (4) the liquidity position of the FHLB.
As a member of the FHLB system, the Company is required to maintain a minimum level of investment in FHLB stock based on specific percentages of its outstanding mortgages, total assets, or FHLB advances. The Company may request redemption at par value of any stock in excess of the minimum required investment. Stock redemptions are at the discretion of the FHLB.
Loans
The Bank concentrates its lending activities in four principal areas: real estate mortgage loans (residential and commercial loans), consumer loans, commercial loans (including agricultural loans), and real estate construction loans. The interest rates charged for the loans made by the Bank vary with the degree of risk, the size and maturity of the loans, the borrower’s relationship with the Bank and prevailing money market rates indicative of the Bank’s cost of funds.
The majority of the Bank’s loans are direct loans made to individuals, farmers and local businesses. The Bank relies substantially on local promotional activity and personal contacts by bank officers, directors and employees to compete with other financial institutions. The Bank makes loans to borrowers whose applications include a sound purpose, a viable repayment source and a plan of repayment established at inception and generally backed by a secondary source of repayment.
29
Loan Portfolio Composite
The following table shows the Company’s loan balances, including net deferred loan costs, at the dates indicated:
| Year ended December 31, | Year ended December 31, | |||||||||||||||||||||||||||||||||||||||
| (dollars in thousands) | 2012 | 2011 | 2010 | 2009 | 2008 | 2014 | 2013 | 2012 | 2011 | 2010 | ||||||||||||||||||||||||||||||
Real estate mortgage | $ | 1,010,130 | $ | 965,922 | $ | 835,471 | $ | 844,053 | $ | 839,687 | $ | 1,615,359 | $ | 1,107,863 | $ | 1,010,130 | $ | 965,922 | $ | 835,471 | ||||||||||||||||||||
Consumer | 386,111 | 406,330 | 395,771 | 428,722 | 477,435 | 417,084 | 383,163 | 386,111 | 406,330 | 395,771 | ||||||||||||||||||||||||||||||
Commercial | 135,528 | 139,131 | 143,413 | 164,094 | 190,295 | 174,945 | 131,878 | 135,528 | 139,131 | 143,413 | ||||||||||||||||||||||||||||||
Real estate construction | 33,054 | 39,649 | 44,916 | 58,701 | 83,432 | 75,136 | 49,103 | 33,054 | 39,649 | 44,916 | ||||||||||||||||||||||||||||||
|
|
|
|
|
|
|
|
|
| |||||||||||||||||||||||||||||||
Total loans | $ | 1,564,823 | $ | 1,551,032 | $ | 1,419,571 | $ | 1,495,570 | $ | 1,590,849 | $ | 2,282,524 | $ | 1,672,007 | $ | 1,564,823 | $ | 1,551,032 | $ | 1,419,571 | ||||||||||||||||||||
|
|
|
|
|
|
|
|
|
| |||||||||||||||||||||||||||||||
The following table shows the Company’s loan balances, including net deferred loan costs, as a percentage of total loans at the dates indicated:
| Year ended December 31, | Year ended December 31, | |||||||||||||||||||||||||||||||||||||||
| 2012 | 2011 | 2010 | 2009 | 2008 | 2014 | 2013 | 2012 | 2011 | 2010 | |||||||||||||||||||||||||||||||
Real estate mortgage | 64.5 | % | 62.2 | % | 58.8 | % | 56.4 | % | 52.8 | % | 70.7 | % | 66.3 | % | 64.5 | % | 62.2 | % | 58.8 | % | ||||||||||||||||||||
Consumer | 24.7 | % | 26.2 | % | 27.9 | % | 28.7 | % | 30.0 | % | 18.3 | % | 22.9 | % | 24.7 | % | 26.2 | % | 27.9 | % | ||||||||||||||||||||
Commercial | 8.7 | % | 9.0 | % | 10.1 | % | 11.0 | % | 12.0 | % | 7.7 | % | 7.9 | % | 8.7 | % | 9.0 | % | 10.1 | % | ||||||||||||||||||||
Real estate construction | 2.1 | % | 2.6 | % | 3.2 | % | 3.9 | % | 5.2 | % | 3.3 | % | 2.9 | % | 2.1 | % | 2.6 | % | 3.2 | % | ||||||||||||||||||||
|
|
|
|
|
|
|
|
|
| |||||||||||||||||||||||||||||||
Total loans | 100.0 | % | 100.0 | % | 100.0 | % | 100.0 | % | 100.0 | % | 100.0 | % | 100.0 | % | 100.0 | % | 100.0 | % | 100.0 | % | ||||||||||||||||||||
|
|
|
|
|
|
|
|
|
| |||||||||||||||||||||||||||||||
At December 31, 2014 loans, including net deferred loan costs, totaled $2,282,524,000 which was a 36.5% ($610,517,000) increase over the balances at the end of 2013. This increase in loans during 2014 included $499,327,000 of loans acquired in the North Valley Bancorp acquisition on October 3, 2014, and $32,017,000 of purchased single family residential real estate loans. Demand for commercial real estate (real estate mortgage) loans was moderate during 2014. Demand for home equity loans and lines of credit was weak during 2014.
At December 31, 2013 loans, including net deferred loan costs, totaled $1,672,007,000 which was a 6.8% ($107,184,000) increase over the balances at the end of 2012. Demand for commercial real estate (real estate mortgage) loans was weak to modest during 2013. During 2013, the Company purchased $62,698,000 of residential (real estate mortgage) loans. Demand for home equity loans and lines of credit were moderate during 2013. Real estate construction loans increased during 2013 primarily due to one large loan that was originated during 2013.
At December 31, 2012 loans, including net deferred loan costs, totaled $1,564,823,000 which was a 0.9% ($13,791,000) increase over the balances at the end of 2011. Demand for commercial real estate (real estate mortgage) loans was weak to modest during 2012. Demand for home equity loans and lines of credit were weak during 2012. Real estate construction loans declined during 2012 as did auto dealer loans.
At December 31, 2011 loans, including net deferred loan costs, totaled $1,551,032,000 which was a 9.3% ($131,461,000) increase over the balances at the end of 2010. This increase in loans during 2011 included $167,484,000 of loans acquired in the Citizens acquisition on September 23, 2011. Demand for commercial real estate (real estate mortgage) loans was weak during 2011. Demand for home equity loans and lines of credit was weak to modest during 2011. Real estate construction loans declined during 2011 as did auto dealer loans.
Asset Quality and Nonperforming Assets
Nonperforming Assets
Loans originated by the Company, i.e., not purchased or acquired in a business combination, are referred to as originated loans. Originated loans are reported at the principal amount outstanding, net of deferred loan fees and costs. Loan origination and commitment fees and certain direct loan origination costs are deferred, and the net amount is amortized as an adjustment of the related loan’s yield over the actual life of the loan. Originated loans on which the accrual of interest has been discontinued are designated as nonaccrual loans.
Originated loans are placed in nonaccrual status when reasonable doubt exists as to the full, timely collection of interest or principal, or a loan becomes contractually past due by 90 days or more with respect to interest or principal and is not well secured and in the process of collection. When an originated loan is placed on nonaccrual status, all interest previously accrued but not collected is reversed. Income on such loans is then recognized only to the extent that cash is received and where the future collection of principal is probable. Interest accruals are resumed on such loans only when they are brought fully current with respect to interest and principal and when, in the judgment of Management, the loan is estimated to be fully collectible as to both principal and interest.
An allowance for loan losses for originated loans is established through a provision for loan losses charged to expense. Originated loans and deposit related overdrafts are charged against the allowance for loan losses when Management believes that the collectability of the principal is unlikely or, with respect to consumer installment loans, according to an established delinquency schedule. The allowance is an amount that Management believes will be adequate to absorb probable losses inherent in existing loans and leases, based on evaluations of the collectability, impairment and prior loss experience of loans
30
and leases. The evaluations take into consideration such factors as changes in the nature and size of the portfolio, overall portfolio quality, loan concentrations, specific problem loans, and current economic conditions that may affect the borrower’s ability to pay. The Company defines an originated loan as impaired when it is probable the Company will be unable to collect all amounts due according to the contractual terms of the loan agreement. Impaired originated loans are measured based on the present value of expected future cash flows discounted at the loan’s original effective interest rate. As a practical expedient, impairment may be measured based on the loan’s observable market price or the fair value of the collateral if the loan is collateral dependent. When the measure of the impaired loan is less than the recorded investment in the loan, the impairment is recorded through a valuation allowance.
In situations related to originated loans where, for economic or legal reasons related to a borrower’s financial difficulties, the Company grants a concession for other than an insignificant period of time to the borrower that the Company would not otherwise consider, the related loan is classified as a troubled debt restructuring (TDR). The Company strives to identify borrowers in financial difficulty early and work with them to modify to more affordable terms before their loan reaches nonaccrual status. These modified terms may include rate reductions, principal forgiveness, payment forbearance and other actions intended to minimize the economic loss and to avoid foreclosure or repossession of the collateral. In cases where the Company grants the borrower new terms that result in the loan being classified as a TDR, the Company measures any impairment on the restructuring as noted above for impaired loans. TDR loans are classified as impaired until they are fully paid off or charged off. Loans that are in nonaccrual status at the time they become TDR loans, remain in nonaccrual status until the borrower demonstrates a sustained period of performance which the Company generally believes to be six consecutive months of payments, or equivalent. Otherwise, TDR loans are subject to the same nonaccrual and charge-off policies as noted above with respect to their restructured principal balance.
Credit risk is inherent in the business of lending. As a result, the Company maintains an allowance for loan losses to absorb losses inherent in the Company’s originated loan portfolio. This is maintained through periodic charges to earnings. These charges are included in the Consolidated Statements of Income as provision for loan losses. All specifically identifiable and quantifiable losses are immediately charged off against the allowance. However, for a variety of reasons, not all losses are immediately known to the Company and, of those that are known, the full extent of the loss may not be quantifiable at that point in time. The balance of the Company’s allowance for originated loan losses is meant to be an estimate of these unknown but probable losses inherent in the portfolio.
The Company formally assesses the adequacy of the allowance for originated loan losses on a quarterly basis. Determination of the adequacy is based on ongoing assessments of the probable risk in the outstanding originated loan portfolio, and to a lesser extent the Company’s originated loan commitments. These assessments include the periodic re-grading of credits based on changes in their individual credit characteristics including delinquency, seasoning, recent financial performance of the borrower, economic factors, changes in the interest rate environment, growth of the portfolio as a whole or by segment, and other factors as warranted. Loans are initially graded when originated. They are re-graded as they are renewed, when there is a new loan to the same borrower, when identified facts demonstrate heightened risk of nonpayment, or if they become delinquent. Re-grading of larger problem loans occurs at least quarterly. Confirmation of the quality of the grading process is obtained by independent credit reviews conducted by consultants specifically hired for this purpose and by various bank regulatory agencies.
The Company’s method for assessing the appropriateness of the allowance for originated loan losses includes specific allowances for impaired originated loans and leases, formula allowance factors for pools of credits, and allowances for changing environmental factors (e.g., interest rates, growth, economic conditions, etc.). Allowance factors for loan pools were based on historical loss experience by product type and prior risk rating.
During the three months ended March 31, 2012, management changed some of the assumptions utilized in the Allowance for Loan Losses estimate calculation. These changes were intended to more accurately reflect the current risk in the loan portfolio and to better estimate the losses inherent but not yet quantifiable. These changes included the conversion to a historical loss migration analysis intended to better determine the appropriate formula reserve ratio by loan category and risk rating, the addition of an environmental factor related to the delinquency rate of loans not classified as impaired by loan category, the elimination of an unspecified reserve allocation previously intended to account for imprecision inherent in the overall calculation, and the reclassification of risk rating of certain consumer loans based on current credit score in an attempt to better identify the risk in the portfolio. The financial effect of these changes resulted in a net reduction in the calculated Allowance for Loan Losses of $1,388,000 during the three months ended March 31, 2012. Allowances for impaired loans are based on analysis of individual credits. Allowances for changing environmental factors are Management’s best estimate of the probable impact these changes have had on the originated loan portfolio as a whole. The allowance for originated loans is included in the allowance for loan losses.
During the three months ended March 31, 2013, the Company changed the method it uses to estimate net sale proceeds from real estate collateral sales when calculating the allowance for loan losses associated with impaired real estate collateral dependent loans. Previously, the Company used the greater of fifteen percent or actual estimated selling costs. Currently, the Company uses the actual estimated selling costs, and an adjustment to appraised value based on the age of the appraisal.
31
These changes are intended to more accurately reflect the estimated net sale proceeds from the sale of impaired collateral dependent real estate loans. This change in methodology resulted in the allowance for loan losses as of March 31, 2013 being $494,000 more than it would have been without this change in methodology.
During the three months ended June 30, 2013, the Company modified its loss migration analysis methodology used to determine the formula allowance factors. When the Company originally established its loss migration analysis methodology during the quarter ended March 31, 2012, it reviewed the loss experience of each rolling twelve month period over the previous three years in order to calculate an annualized loss rate by loan category and risk rating. The use of three years of loss experience data was originally used because that was the extent of the detailed loss data, by loan category and risk rating that was available at the time. This three year historical look-back period was used through the quarter ended March 31, 2013. Starting with the quarter ended June 30, 2013, the Company reviews all available detailed loss experience data, going back to, and including, the twelve month period ended June 30, 2009, and does not limit the look-back period to the most recent three years of historical loss data. Using this data, the Company calculates loss factors for each quarter from the quarter ended June 30, 2009 to the most recent quarter. The Company then calculates a weighted average formula allowance factor for each loan category and risk rating with the most recent quarterly loss factor being weighted 125%, the quarter ended June 30, 2009 loss factor being weighted 75%, and the loss factors for all the quarters between the most recent quarter and the quarter ended June 30, 2009, being weighted on a linear scale from 75% to 125%. This change is intended to more accurately reflect the risk inherent in the loan portfolio by considering historical loss data for all years as the data for new periods becomes available. This change in methodology resulted in the allowance for loan losses as of June 30, 2013 being $1,314,000 more than it would have been without this change in methodology.
During the three months ended September 30, 2013, the Company modified its methodology used to determine the allowance for changing environmental factors. Previously, the Company compared the current value of each environmental factor to a fixed baseline value. The deviation of the current value from the baseline value was then multiplied by a conversion factor to determine the required allowance related to each environmental factor. As of September 30, 2013, the Company replaced the fixed baseline values with average baseline values derived from historical averages, and adjusted the conversion factors. This change is intended to more accurately reflect the risk inherent in the portfolio by recognizing that baseline, or normal, levels for environmental factors may change over time. This change in methodology resulted in the allowance for loan losses as of September 30, 2013 being $1,665,000 more than it would have been without this change in methodology.
During the three months ended March 31, 2014, the Company modified its methodology used to determine the allowance for changing environmental factors by adding a new environmental factor based on the California Home Affordability Index (“CHAI”). The CHAI measures the percentage of households in California that can afford to purchase the median priced home in California based on current home prices and mortgage interest rates. The use of the CHAI environmental factor consists of comparing the current CHAI to its historical baseline, and allows management to consider the adverse impact that a lower than historical CHAI may have on general economic activity and the performance of our borrowers. Based on an analysis of historical data, management believes this environmental factor gives a better estimate of current economic activity compared to other environmental factors that may lag current economic activity to some extent. This change in methodology resulted in no change to the allowance for loan losses as of March 31, 2014 compared to what it would have been without this change in methodology.
During the three months ended June 30, 2014, the Company refined the method it uses to evaluate historical losses for the purpose of estimating the pool allowance for unimpaired loans. In the third quarter of 2010, the Company moved from a six point grading system (Grades A-F) to a nine point risk rating system (Risk Ratings 1-9), primarily to allow for more distinction within the “Pass” risk rating. Initially, there was not sufficient loss experience within the nine point scale to complete a migration analysis for all nine risk ratings, all loans risk rated Pass or 2-5 were grouped together, a loss rate was calculated for that group, and that loss rate was established as the loss rate for risk rating 4. The reserve ratios for risk ratings 2, 3 & 5 were then interpolated from that figure. As of June 30, 2014, the Company was able to compile twelve quarters of historical loss information for all risk ratings, and use that information to calculate the loss rates for each of the nine risk ratings without interpolation. This refinement led to an increase of $1,438,000 in the reserve requirement for unimpaired loans, driven primarily by home equity lines of credit with a risk rating of 5 or “Pass-Watch.”
Loans purchased or acquired in a business combination are referred to as acquired loans. Acquired loans are valued as of acquisition date in accordance with Financial Accounting Standards Board Accounting Standards Codification (“FASB ASC”) Topic 805,Business Combinations. Loans acquired with evidence of credit deterioration since origination for which it is probable that all contractually required payments will not be collected are referred to as purchased credit impaired (PCI) loans. PCI loans are accounted for under FASB ASC Topic 310-30,Loans and Debt Securities Acquired with Deteriorated Credit Quality. Under FASB ASC Topic 805 and FASB ASC Topic 310-30, PCI loans are recorded at fair value at acquisition date, factoring in credit losses expected to be incurred over the life of the loan. Accordingly, an allowance for loan losses is not carried over or recorded as of the acquisition date. Fair value is defined as the present value of the future estimated principal and interest payments of the loan, with the discount rate used in the present value calculation representing the estimated effective yield of the loan. Default rates, loss severity, and prepayment speed assumptions are periodically reassessed and our estimate of future payments is adjusted accordingly. The difference between contractual future payments
32
and estimated future payments is referred to as the nonaccretable difference. The difference between estimated future payments and the present value of the estimated future payments is referred to as the accretable yield. The accretable yield represents the amount that is expected to be recorded as interest income over the remaining life of the loan. If after acquisition, the Company determines that the estimated future cash flows of a PCI loan are expected to be more than the originally estimated, an increase in the discount rate (effective yield) would be made such that the newly increased accretable yield would be recognized, on a level yield basis, over the remaining estimated life of the loan. If, after acquisition, the Company determines that the estimated future cash flows of a PCI loan are expected to be less than the previously estimated, the discount rate would first be reduced until the present value of the reduced cash flow estimate equals the previous present value however, the discount rate may not be lowered below its original level at acquisition. If the discount rate has been lowered to its original level and the present value has not been sufficiently lowered, an allowance for loan loss would be established through a provision for loan losses charged to expense to decrease the present value to the required level. If the estimated cash flows improve after an allowance has been established for a loan, the allowance may be partially or fully reversed depending on the improvement in the estimated cash flows. Only after the allowance has been fully reversed may the discount rate be increased. PCI loans are put on nonaccrual status when cash flows cannot be reasonably estimated. PCI loans on nonaccrual status are accounted for using the cost recovery method or cash basis method of income recognition. PCI loans are charged off when evidence suggests cash flows are not recoverable. Foreclosed assets from PCI loans are recorded in foreclosed assets at fair value with the fair value at time of foreclosure representing cash flow from the loan. ASC 310-30 allows PCI loans with similar risk characteristics and acquisition time frame to be “pooled” and have their cash flows aggregated as if they were one loan. The Company elected to use the “pooled” method of ASC 310-30 for PCI – other loans in the acquisition of certain assets and liabilities of Granite Community Bank (“Granite”) and Citizens Bank of Northern California (“Citizens”).Citizens.
Acquired loans that are not PCI loans are referred to as purchased not credit impaired (PNCI) loans. PNCI loans are accounted for under FASB ASC Topic 310-20,Receivables – Nonrefundable Fees and Other Costs,in which interest income is accrued on a level-yield basis for performing loans. For income recognition purposes, this method assumes that all contractual cash flows will be collected, and no allowance for loan losses is established at the time of acquistion. Post-acquisition date, an allowance for loan losses may need to be established for acquired loans through a provision charged to earnings for credit losses incurred subsequent to acquisition. Under ASC 310-20, the loss would be measured based on the probable shortfall in relation to the contractual note requirements, consistent with our allowance for loan loss policy for similar loans.
When referring to PNCI and PCI loans we will use the terms “nonaccretable difference”, “accretable yield”, or “purchase discount”. Nonaccretable difference is the difference between undiscounted contractual cash flows due and undiscounted cash flows we expect to collect, or put another way, it is the undiscounted contractual cash flows we do not expect to collect. Accretable yield is the difference between undiscounted cash flows we expect to collect and the value at which we have recorded the loan on our financial statements. On the date of acquisition, all purchased loans are recorded on our consolidated financial statements at estimated fair value. Purchase discount is the difference between the estimated fair value of loans on the date of acquisition and the principal amount owed by the borrower, net of charge offs, on the date of acquisition. We may also refer to “discounts to principal balance of loans owed, net of charge-offs”. Discounts to principal balance of loans owed, net of charge-offs is the difference between principal balance of loans owed, net of charge-offs, and loans as recorded on our financial statements. Discounts to principal balance of loans owed, net of charge-offs arise from purchase discounts, and equal the purchase discount on the acquisition date.
Loans are also categorized as “covered” or “noncovered”. Covered loans refer to loans covered by a Federal Deposit Insurance Corporation (“FDIC”)FDIC loss sharing agreement. Noncovered loans refer to loans not covered by a FDIC loss sharing agreement.
Originated loans and PNCI loans are reviewed on an individual basis for reclassification to nonaccrual status when any one of the following occurs: the loan becomes 90 days past due as to interest or principal, the full and timely collection of additional interest or principal becomes uncertain, the loan is classified as doubtful by internal credit review or bank regulatory agencies, a portion of the principal balance has been charged off, or the Company takes possession of the collateral. Loans that are placed on nonaccrual even though the borrowers continue to repay the loans as scheduled are classified as “performing nonaccrual” and are included in total nonperforming loans. The reclassification of loans as nonaccrual does not necessarily reflect Management’s judgment as to whether they are collectible.
Interest income on originated nonaccrual loans that would have been recognized during the years ended December 31, 2012, 20112014, 2013 and 2010,2012, if all such loans had been current in accordance with their original terms, totaled $5,281,000, $5,422,000,$2,734,000, $1,524,000, and $5,169,000,$5,281,000, respectively. Interest income actually recognized on these originated loans during the years ended December 31, 2014, 2013 and 2012 2011was $81,000, $273,000, and 2010 was $936,000, $1,497,000 and $1,956,000, respectively. Interest income on PNCI nonaccrual loans that would have been recognized during the years ended December 31, 20122014, 2013 and 2011,2012, if all such loans had been current in accordance with their original terms, totaled $284,000$254,000, $295,000, and $4,000, respectively.$284,000. Interest income actually recognized on these PNCI loans during the years ended December 31, 2014, 2013 and 2012 was $4,000, $38,000, and 2011 was $136,000 and $5,000, respectively. The Company had no PNCI loans during 2010.$136,000.
The Company’s policy is to place originated loans and PNCI loans 90 days or more past due on nonaccrual status. In some instances when an originated loan is 90 days past due Management does not place it on nonaccrual status because the loan is
33
well secured and in the process of collection. A loan is considered to be in the process of collection if, based on a probable specific event, it is expected that the loan will be repaid or brought current. Generally, this collection period would not exceed 30 days. Loans where the collateral has been repossessed are classified as foreclosed assets.
Management considers both the adequacy of the collateral and the other resources of the borrower in determining the steps to be taken to collect nonaccrual loans. Alternatives that are considered are foreclosure, collecting on guarantees, restructuring the loan or collection lawsuits.
The following tables settable sets forth the amount of the Bank’s nonperforming assets as of the dates indicated. For purposes of the following table, “PCI – other” loans that are 90 days past due and still accruing are not considered nonperforming loans:
“Performingloans. “Performing nonaccrual loans” are loans that may be current for both principal and interest payments, or are less than 90 days past due, but for which payment in full of both principal and interest is not expected, and are not well secured and in the process of collection:
| December 31, | December 31, | |||||||||||||||||||||||||||||||||||||||
| (dollars in thousands) | 2012 | 2011 | 2010 | 2009 | 2008 | 2014 | 2013 | 2012 | 2011 | 2010 | ||||||||||||||||||||||||||||||
Performing nonaccrual loans | $ | 49,045 | $ | 61,164 | $ | 36,518 | $ | 22,870 | $ | 22,600 | $ | 45,072 | $ | 48,112 | $ | 49,045 | $ | 61,164 | $ | 36,518 | ||||||||||||||||||||
Nonperforming nonaccrual loans | 23,471 | 23,647 | 39,224 | 26,301 | 9,994 | 2,517 | 5,104 | 23,471 | 23,647 | 39,224 | ||||||||||||||||||||||||||||||
|
|
|
|
|
|
|
|
|
| |||||||||||||||||||||||||||||||
Total nonaccrual loans | 72,516 | 84,811 | 75,742 | 49,171 | 32,594 | 47,589 | 53,216 | 72,516 | 84,811 | 75,742 | ||||||||||||||||||||||||||||||
Originated and PNCI loans 90 days past due and still accruing | — | 920 | 245 | 700 | 187 | — | — | — | 920 | 245 | ||||||||||||||||||||||||||||||
|
|
|
|
|
|
|
|
|
| |||||||||||||||||||||||||||||||
Total nonperforming loans | 72,516 | 85,731 | 75,987 | 49,871 | 32,781 | 47,589 | 53,216 | 72,516 | 85,731 | 75,987 | ||||||||||||||||||||||||||||||
Noncovered foreclosed assets | 5,957 | 13,268 | 5,000 | 3,726 | 1,185 | 4,449 | 5,588 | 5,957 | 13,268 | 5,000 | ||||||||||||||||||||||||||||||
Covered foreclosed assets | 1,541 | 3,064 | 4,913 | — | — | 445 | 674 | 1,541 | 3,064 | 4,913 | ||||||||||||||||||||||||||||||
|
|
|
|
|
|
|
|
|
| |||||||||||||||||||||||||||||||
Total nonperforming assets | $ | 80,014 | $ | 102,063 | $ | 85,900 | $ | 53,597 | $ | 33,966 | $ | 52,483 | $ | 59,478 | $ | 80,014 | $ | 102,063 | $ | 85,900 | ||||||||||||||||||||
|
|
|
|
|
|
|
|
|
| |||||||||||||||||||||||||||||||
U.S. government, including its agencies and its government-sponsored agencies, guaranteed portion of nonperforming loans | $ | 131 | $ | 3,061 | $ | 3,937 | $ | 4,975 | $ | 5,256 | ||||||||||||||||||||||||||||||
Indemnified portion of covered foreclosed assets | $ | 1,233 | $ | 2,451 | $ | 3,930 | — | — | ||||||||||||||||||||||||||||||||
U.S. government, including its agenciesand its government-sponsored agencies,guaranteed portion of nonperforming loans | $ | 123 | $ | 101 | $ | 131 | $ | 3,061 | $ | 3,937 | ||||||||||||||||||||||||||||||
Indemnified portion ofcovered foreclosed assets | $ | 356 | $ | 539 | $ | 1,233 | $ | 2,451 | $ | 3,930 | ||||||||||||||||||||||||||||||
Nonperforming assets to total assets | 3.07 | % | 3.99 | % | 3.92 | % | 2.24 | % | 1.41 | % | 1.88 | % | 2.30 | % | 3.07 | % | 3.99 | % | 3.92 | % | ||||||||||||||||||||
Nonperforming loans to total loans | 4.63 | % | 5.53 | % | 5.35 | % | 2.99 | % | 1.73 | % | 2.08 | % | 3.18 | % | 4.63 | % | 5.53 | % | 5.35 | % | ||||||||||||||||||||
Allowance for loan losses to nonperforming loans | 59 | % | 54 | % | 56 | % | 79 | % | 100 | % | ||||||||||||||||||||||||||||||
Allowance for loan losses, unamortized loan fees, and discounts to loan principal balances owed | 5.30 | % | 6.34 | % | 3.74 | % | 2.48 | % | 1.79 | % | ||||||||||||||||||||||||||||||
Allowance for loan losses to nonperforming loans 77% | Allowance for loan losses to nonperforming loans 77% |
| 72 | % | 59 | % | 54 | % | 56 | % | ||||||||||||||||||||||||||||||
Allowance for loan losses, unamortized loan fees,and discounts to loan principal balances owed | 3.31 | % | 4.09 | % | 5.30 | % | 6.34 | % | 3.74 | % | ||||||||||||||||||||||||||||||
| December 31, 2012 | ||||||||||||||||||||
| (dollars in thousands) | Originated | PNCI | PCI - cash basis | PCI - other | Total | |||||||||||||||
Performing nonaccrual loans | $ | 38,646 | $ | 1,428 | $ | 8,971 | — | $ | 49,045 | |||||||||||
Nonperforming nonaccrual loans | 23,123 | 348 | — | — | 23,471 | |||||||||||||||
|
|
|
|
|
|
|
|
|
| |||||||||||
Total nonaccrual loans | 61,769 | 1,776 | 8,971 | — | 72,516 | |||||||||||||||
Originated loans 90 days past due and still accruing | — | — | — | — | — | |||||||||||||||
|
|
|
|
|
|
|
|
|
| |||||||||||
Total nonperforming loans | 61,769 | 1,776 | 8,971 | — | 72,516 | |||||||||||||||
Noncovered foreclosed assets | 5,172 | — | — | 785 | 5,957 | |||||||||||||||
Covered foreclosed assets | — | — | — | 1,541 | 1,541 | |||||||||||||||
|
|
|
|
|
|
|
|
|
| |||||||||||
Total nonperforming assets | $ | 66,941 | $ | 1,776 | $ | 8,971 | $ | 2,326 | $ | 80,014 | ||||||||||
|
|
|
|
|
|
|
|
|
| |||||||||||
U.S. government, including its agencies and its government-sponsored agencies, guaranteed portion of nonperforming loans | $ | 131 | — | — | — | $ | 131 | |||||||||||||
Indemnified portion of covered foreclosed assets | — | — | — | $ | 1,233 | $ | 1,233 | |||||||||||||
Nonperforming assets to total assets | 3.07 | % | ||||||||||||||||||
Nonperforming loans to total loans | 4.42 | % | 1.81 | % | 100.00 | % | — | 4.63 | % | |||||||||||
Allowance for loan losses to nonperforming loans | 58 | % | 111 | % | 12 | % | n/m | 59 | % | |||||||||||
Allowance for loan losses, unamortized loan fees, and discounts to loan principal balances owed | 2.76 | % | 13.78 | % | 61.60 | % | 24.63 | % | 5.30 | % | ||||||||||
34
The following tables set forth the amount of the Bank’s nonperforming assets as of the dates indicated. For purposes of the following tables, “PCI – other” loans that are 90 days past due and still accruing are not considered nonperforming loans. “Performing nonaccrual loans” are loans that may be current for both principal and interest payments, or are less than 90 days past due, but for which payment in full of both principal and interest is not expected, and are not well secured and in the process of collection:
| December 31, 2014 | ||||||||||||||||||||
| (dollars in thousands) | Originated | PNCI | PCI - cash basis | PCI - other | Total | |||||||||||||||
Performing nonaccrual loans | $ | 30,449 | $ | 1,233 | $ | 5,587 | $ | 7,803 | $ | 45,072 | ||||||||||
Nonperforming nonaccrual loans | 2,080 | 413 | 24 | — | 2,517 | |||||||||||||||
|
|
|
|
|
|
|
|
|
| |||||||||||
Total nonaccrual loans | 32,529 | 1,646 | 5,611 | 7,803 | 47,589 | |||||||||||||||
Originated loans 90 days past due and still accruing | — | — | — | — | — | |||||||||||||||
|
|
|
|
|
|
|
|
|
| |||||||||||
Total nonperforming loans | 32,529 | 1,646 | 5,611 | 7,803 | 47,589 | |||||||||||||||
Noncovered foreclosed assets | 3,316 | — | — | 1,133 | 4,449 | |||||||||||||||
Covered foreclosed assets | — | — | — | 445 | 445 | |||||||||||||||
|
|
|
|
|
|
|
|
|
| |||||||||||
Total nonperforming assets | $ | 35,845 | $ | 1,646 | $ | 5,611 | $ | 9,381 | $ | 52,483 | ||||||||||
|
|
|
|
|
|
|
|
|
| |||||||||||
U.S. government, including its agencies and its government-sponsored agencies, guaranteed portion of nonperforming loans | $ | 123 | — | — | — | $ | 123 | |||||||||||||
Indemnified portion of covered foreclosed assets | — | — | — | $ | 356 | $ | 356 | |||||||||||||
Nonperforming assets to total assets | 1.28 | % | 0.06 | % | 0.20 | % | 0.34 | % | 1.88 | % | ||||||||||
Nonperforming loans to total loans | 2.02 | % | 0.27 | % | 99.98 | % | 16.50 | % | 2.08 | % | ||||||||||
Allowance for loan losses to nonperforming loans | 92 | % | 200 | % | 6 | % | 39 | % | 77 | % | ||||||||||
Allowance for loan losses, unamortized loan fees, and discounts to loan principal balances owed | 2.14 | % | 3.30 | % | 64.45 | % | 21.09 | % | 3.31 | % | ||||||||||
| December 31, 2013 | ||||||||||||||||||||
| (dollars in thousands) | Originated | PNCI | PCI - cash basis | PCI - other | Total | |||||||||||||||
Performing nonaccrual loans | $ | 40,294 | $ | 1,649 | $ | 6,169 | — | $ | 48,112 | |||||||||||
Nonperforming nonaccrual loans | 4,837 | 217 | 50 | — | 5,104 | |||||||||||||||
|
|
|
|
|
|
|
|
|
| |||||||||||
Total nonaccrual loans | 45,131 | 1,866 | 6,219 | — | 53,216 | |||||||||||||||
Originated and PNCI loans 90 days past due and still accruing | — | — | — | — | — | |||||||||||||||
|
|
|
|
|
|
|
|
|
| |||||||||||
Total nonperforming loans | 45,131 | 1,866 | 6,219 | — | 53,216 | |||||||||||||||
Noncovered foreclosed assets | 5,479 | — | — | $ | 109 | 5,588 | ||||||||||||||
Covered foreclosed assets | — | — | — | 674 | 674 | |||||||||||||||
|
|
|
|
|
|
|
|
|
| |||||||||||
Total nonperforming assets | $ | 50,610 | $ | 1,866 | $ | 6,219 | $ | 783 | $ | 59,478 | ||||||||||
|
|
|
|
|
|
|
|
|
| |||||||||||
U.S. government, including its agencies and its government-sponsored agencies, guaranteed portion of nonperforming loans | $ | 101 | $ | 101 | ||||||||||||||||
Indemnified portion of covered foreclosed assets | — | — | — | $ | 539 | $ | 539 | |||||||||||||
Nonperforming assets to total assets | 2.30 | % | ||||||||||||||||||
Nonperforming loans to total loans | 3.04 | % | 1.38 | % | 100.0 | % | — | 3.18 | % | |||||||||||
Allowance for loan losses to nonperforming loans | 69 | % | 153 | % | 6 | % | n/m | 72 | % | |||||||||||
Allowance for loan losses, unamortized loan fees, and discounts to loan principal balances owed | 2.36 | % | 7.62 | % | 64.5 | % | 22.93 | % | 4.09 | % | ||||||||||
n/m – not meaningful
Performing nonaccrual loans Nonperforming nonaccrual loans Total nonaccrual loans Originated and PNCI loans 90 days past due and still accruing Total nonperforming loans Noncovered foreclosed assets Covered foreclosed assets Total nonperforming assets U.S. government, including its agencies and its government-sponsored agencies, guaranteed portion of nonperforming loans Indemnified portion of covered foreclosed assets Nonperforming assets to total assets Nonperforming loans to total loans Allowance for loan losses to nonperforming loans Allowance for loan losses, unamortized loan fees, and discounts to loan principal balances owed December 31, 2011 (dollars in thousands) Originated PNCI PCI -
cash basis PCI -
other Total $ 52,208 $ 97 $ 8,859 — $ 61,164 23,067 13 567 — 23,647 75,275 110 9,426 — 84,811 500 420 — — 920 75,775 530 9,426 — 85,731 6,209 — — 7,059 13,268 — — — 3,064 3,064 $ 81,984 $ 530 $ 9,426 $ 10,123 $ 102,063 $ 3,061 — — — $ 3,061 — — — $ 2,451 $ 2,451 3.99 % 5.67 % 0.39 % 100.00 % — 5.53 % 55 % 46 % 11 % n/m 54 % 3.27 % 12.13 % 62.09 % 27.37 % 6.34 %
n/m – not meaningful35
The following table shows the activity in the balance of nonperforming assets for the year ended December 31, 2012:2014:
| (dollars in thousands): | Balance at December 31, 2012 | New NPA | Advances/ Capitalized Costs | Pay-downs/ Sales/ | Charge-offs/ Write-downs | Transfers to Foreclosed Assets | Category Changes | Balance at December 31, 2011 | Balance at December 31, 2014 | New NPA | Advances/ Capitalized Costs | Pay-downs /Sales /Upgrades | Charge-offs/ Write-downs | Transfers to Foreclosed Assets | Category Changes | Balance at December 31, 2013 | ||||||||||||||||||||||||||||||||||||||||||||||||
Real estate mortgage: | ||||||||||||||||||||||||||||||||||||||||||||||||||||||||||||||||
Residential | $ | 4,894 | $ | 2,912 | $ | 60 | $ | (3,817 | ) | $ | (1,558 | ) | $ | (1,228 | ) | — | $ | 8,525 | $ | 4,613 | $ | 1,797 | $ | 25 | $ | (1,216 | ) | (171 | ) | (781 | ) | — | $ | 4,959 | ||||||||||||||||||||||||||||||
Commercial | 39,727 | 20,056 | 582 | (18,789 | ) | (3,457 | ) | (4,505 | ) | $ | 1,155 | 44,685 | 26,343 | 7,931 | 1,049 | (11,706 | ) | (110 | ) | (3,659 | ) | 967 | 31,871 | |||||||||||||||||||||||||||||||||||||||||
Consumer | ||||||||||||||||||||||||||||||||||||||||||||||||||||||||||||||||
Home equity lines | 16,500 | 11,702 | 749 | (2,951 | ) | (8,042 | ) | (1,845 | ) | (96 | ) | 16,983 | 10,376 | 3,002 | 607 | (2,737 | ) | (1,094 | ) | (653 | ) | (350 | ) | 11,601 | ||||||||||||||||||||||||||||||||||||||||
Home equity loans | 514 | 464 | 45 | (238 | ) | (385 | ) | (26 | ) | 96 | 558 | 1,367 | 670 | 2 | (179 | ) | (28 | ) | (167 | ) | 350 | 719 | ||||||||||||||||||||||||||||||||||||||||||
Auto indirect | 174 | 132 | 1 | (384 | ) | (83 | ) | — | — | 508 | 18 | 2 | — | (35 | ) | (3 | ) | — | — | 54 | ||||||||||||||||||||||||||||||||||||||||||||
Other consumer | 92 | 418 | — | (102 | ) | (334 | ) | — | — | 110 | 186 | 330 | — | (55 | ) | (120 | ) | (31 | ) | — | 62 | |||||||||||||||||||||||||||||||||||||||||||
Commercial | 6,771 | 3,948 | 1,673 | (4,258 | ) | (1,251 | ) | (254 | ) | (1,155 | ) | 8,068 | 2,186 | 2,797 | 417 | (881 | ) | (479 | ) | — | (967 | ) | 1,299 | |||||||||||||||||||||||||||||||||||||||||
Construction: | ||||||||||||||||||||||||||||||||||||||||||||||||||||||||||||||||
Residential | 3,312 | 496 | 12 | (1,893 | ) | (406 | ) | (524 | ) | — | 5,627 | 2,401 | 4 | — | (118 | ) | (4 | ) | — | 46 | 2,473 | |||||||||||||||||||||||||||||||||||||||||||
Commercial | 532 | 152 | — | (187 | ) | (100 | ) | — | — | 667 | 99 | 171 | — | (135 | ) | (69 | ) | — | (46 | ) | 178 | |||||||||||||||||||||||||||||||||||||||||||
|
|
|
|
|
|
|
|
|
|
|
|
|
|
|
| |||||||||||||||||||||||||||||||||||||||||||||||||
Total nonperforming loans | 72,516 | 40,280 | 3,122 | (32,619 | ) | (15,616 | ) | (8,382 | ) | — | 85,731 | 47,589 | 16,704 | 2,100 | (17,062 | ) | (2,078 | ) | (5,291 | ) | — | 53,216 | ||||||||||||||||||||||||||||||||||||||||||
Noncovered foreclosed assets | 5,957 | — | 758 | (14,776 | ) | (1,267 | ) | 7,974 | — | 13,268 | 4,449 | 695 | 462 | (7,391 | ) | (196 | ) | 5,291 | — | 5,588 | ||||||||||||||||||||||||||||||||||||||||||||
Covered foreclosed assets | 1,541 | — | 225 | (1,695 | ) | (461 | ) | 408 | — | 3,064 | 445 | — | — | (217 | ) | (12 | ) | — | — | 674 | ||||||||||||||||||||||||||||||||||||||||||||
|
|
|
|
|
|
|
|
|
|
|
|
|
|
|
| |||||||||||||||||||||||||||||||||||||||||||||||||
Total nonperforming assets | $ | 80,014 | $ | 40,280 | $ | 4,105 | $ | (49,090 | ) | $ | (17,344 | ) | — | — | $ | 102,063 | $ | 52,483 | $ | 17,399 | $ | 2,562 | $ | (24,670 | ) | $ | (2,286 | ) | — | — | $ | 59,478 | ||||||||||||||||||||||||||||||||
|
|
|
|
|
|
|
|
|
|
|
|
|
|
|
| |||||||||||||||||||||||||||||||||||||||||||||||||
The table above does not include deposit overdraft charge-offs.
The following tables and narratives describe the activity in the balance of nonperforming assets during each of the three-month periods ending March 31, June 30, September 30, and December 31, 2012.2014. These tables and narratives are presented in chronological order:
Changes in nonperforming assets during the three months ended December 31, 20122014
| (In thousands): | Balance at December 31, 2012 | New NPA | Advances/ Capitalized Costs | Pay-downs/ Sales/ Upgrades | Charge-offs/ Write-downs | Transfers to Foreclosed Assets | Category Changes | Balance at September 30, 2012 | ||||||||||||||||||||||||||||||||||||||||||||||||||||||||
| (in thousands): | Balance at December 31, 2014 | New NPA | Advances/ Capitalized Costs | Pay-downs /Sales /Upgrades | Charge-offs/ Write-downs | Transfers to Foreclosed Assets | Category Changes | Balance at September 30, 2014 | ||||||||||||||||||||||||||||||||||||||||||||||||||||||||
Real estate mortgage: | ||||||||||||||||||||||||||||||||||||||||||||||||||||||||||||||||
Residential | $ | 4,894 | 165 | — | (1,614 | ) | (640 | ) | (438 | ) | — | $ | 7,421 | $ | 4,613 | 1,351 | — | $ | (426 | ) | $ | (4 | ) | $ | (675 | ) | — | $ | 4,367 | |||||||||||||||||||||||||||||||||||
Commercial | 39,727 | 9,285 | — | (9,994 | ) | (1,449 | ) | (1,374 | ) | — | 43,259 | 26,343 | 6,139 | — | (2,043 | ) | (3 | ) | — | — | 22,250 | |||||||||||||||||||||||||||||||||||||||||||
Consumer | ||||||||||||||||||||||||||||||||||||||||||||||||||||||||||||||||
Home equity lines | 16,500 | 2,184 | 13 | (752 | ) | (1,303 | ) | (501 | ) | — | 16,859 | 10,376 | 640 | 120 | (349 | ) | (102 | ) | (111 | ) | (64 | ) | 10,242 | |||||||||||||||||||||||||||||||||||||||||
Home equity loans | 514 | 80 | 45 | (65 | ) | (215 | ) | — | — | 669 | 1,367 | 524 | — | (42 | ) | (17 | ) | — | 64 | 838 | ||||||||||||||||||||||||||||||||||||||||||||
Auto indirect | 174 | 5 | — | (56 | ) | — | — | — | 225 | 18 | 2 | — | (4 | ) | (3 | ) | — | — | 23 | |||||||||||||||||||||||||||||||||||||||||||||
Other consumer | 92 | 70 | — | (19 | ) | (65 | ) | — | — | 106 | 186 | 235 | — | (31 | ) | (37 | ) | (31 | ) | — | 50 | |||||||||||||||||||||||||||||||||||||||||||
Commercial | 6,771 | 810 | — | (2,461 | ) | (49 | ) | (254 | ) | — | 8,725 | 2,186 | 2,165 | — | (222 | ) | (78 | ) | — | — | 321 | |||||||||||||||||||||||||||||||||||||||||||
Construction: | ||||||||||||||||||||||||||||||||||||||||||||||||||||||||||||||||
Residential | 3,312 | 53 | — | (495 | ) | (44 | ) | — | — | 3,798 | 2,401 | — | — | (36 | ) | — | — | — | 2,437 | |||||||||||||||||||||||||||||||||||||||||||||
Commercial | 532 | 152 | — | (137 | ) | (32 | ) | — | — | 549 | 99 | — | — | (15 | ) | — | — | — | 114 | |||||||||||||||||||||||||||||||||||||||||||||
|
|
|
|
|
|
|
|
|
|
|
|
|
|
|
| |||||||||||||||||||||||||||||||||||||||||||||||||
Total nonperforming loans | 72,516 | 12,804 | 58 | (15,593 | ) | (3,797 | ) | (2,567 | ) | — | 81,611 | 47,589 | 11,056 | 120 | (3,168 | ) | (244 | ) | (817 | ) | — | 40,642 | ||||||||||||||||||||||||||||||||||||||||||
Noncovered foreclosed assets | 5,957 | — | 508 | (4,703 | ) | (208 | ) | 2,567 | — | 7,793 | 4,449 | 695 | — | (1,570 | ) | (69 | ) | 817 | — | 4,576 | ||||||||||||||||||||||||||||||||||||||||||||
Covered foreclosed assets | 1,541 | — | — | (851 | ) | — | — | — | 2,392 | 445 | — | (75 | ) | — | — | — | 520 | |||||||||||||||||||||||||||||||||||||||||||||||
|
|
|
|
|
|
|
|
|
|
|
|
|
|
|
| |||||||||||||||||||||||||||||||||||||||||||||||||
Total nonperforming assets | $ | 80,014 | $ | 12,804 | $ | 566 | $ | (21,147 | ) | $ | (4,005 | ) | — | — | $ | 91,796 | $ | 52,483 | $ | 11,751 | $ | 120 | $ | (4,813 | ) | $ | (313 | ) | — | — | $ | 45,738 | ||||||||||||||||||||||||||||||||
|
|
|
|
|
|
|
|
|
|
|
|
|
|
|
| |||||||||||||||||||||||||||||||||||||||||||||||||
Nonperforming assets decreasedincreased during the fourth quarter of 20122014 by $11,782,000 (12.83%$6,745,000 (14.75%) to $80,014,000$52,483,000 at December 31, 20122014 compared to $91,796,000$45,738,000 at September 30, 2012.2014. The decreaseincrease in nonperforming assets during the fourth quarter of 20122014 was primarily the result of new nonperforming loans of $12,804,000,$11,056,000, including $9,411,000 in nonperforming loans from the acquisition of North Valley Bancorp, new foreclosed assets of $695,000 also from the North Valley Bancorp acquisition, advances on existing nonperforming loans and capitalized costs on foreclosed assets of $566,000,$120,000, less pay-downs, sales or upgrades of nonperforming loans to performing status totaling $15,593,000,$3,168,000, less dispositions of foreclosed assets totaling $5,554,000,$1,645,000, less loan charge-offs of $3,797,000,$244,000, and less write-downs of foreclosed assets of $208,000. Included$70,000.
The $9,411,000 in the $15,593,000 of pay-downs, sales or upgrades of nonperforming loans were sales of $9,739,000. The loan sales of $9,739,000 were comprised of $190,000 of residential real estate secured loans in central California, $201,000 of residential real estate secured loans in northern California, $3,537,000 of commercial real estate secured loans in central California, $5,280,000 of commercial real estate secured loans in northern California, $227,000 in Home Equity Lines of Credit located in northern California, $173,000 in residential construction loans in northern California and $129,000 in commercial construction loans in central California. Proceeds net of selling costs infrom the amount of $9,810,000 were received on the sale resulting in a net gain on sale of $71,000.
The $12,804,000 in new nonperforming loans during the fourth quarter of 2012North Valley Bancorp acquisition was comprised of increases of $165,000 on twosix residential real estate loans $9,285,000 on 10with total outstanding balances of $853,000, 15 commercial real estate loans $2,264,000with $6,135,000 outstanding, one home equity line of credit with a balance of $98,000, four home equity loans with $161,000 in outstanding balances, four nonperforming consumer loans with $64,000 outstanding, and four nonperforming C&I loans with $2,100,000 outstanding.
Other new nonperforming loans of $1,645,000 was comprised of $811,000 on 25four residential real estate loans, $3,000 on a single commercial real estate loan, $906,000 on 15 home equity lines and loans, $5,000$2,000 on threetwo indirect auto loans, $70,000$202,000 on 24 consumer loans, $810,000and $64,000 on 14four C&I loans, $53,000 on two residential construction loans, and $152,000 on a single commercial construction loan.loans.
The $9,285,000$853,000 in newacquired nonperforming residential real estate loans is primarily made up of two loans totaling $721,000 secured by single-family residences in Northern California. The $6,135,000 in acquired nonperforming commercial real estate loans wasis primarily made up
36
comprised of two loans totaling $600,000 secured by single-family residences in Northern California, a single loan with $792,000 outstanding secured by a multi-family residence in the amount of $379,000Northern California, four loans totaling $3,096,000 secured by retail buildings in Northern California, a single loan with $377,000 outstanding secured by a commercial retail buildingwarehouse in northernNorthern California, a single loan in the amount of $3,597,000$607,000 secured by a commercial retail buildinghealth club in centralNorthern California, and a single loan in the amount of $4,563,000$355,000 secured by a commercial office building centralmobile-home park in Northern California. Related charge-offsAll other acquired nonperforming loans have less than $250,000 outstanding and are discussed below.spread throughout the company’s footprint.
The $810,000 in new nonperforming C&I loans was primarily made up of a single loan in the amount of $544,000 secured by an assignment of a note receivable and deed of trust northern California. Related charge-offs are discussed below.
Loan charge-offs during the three months ended December 31, 20122014
In the fourth quarter of 2012,2014, the Company recorded $3,797,000$244,000 in loan charge-offs and $209,000$173,000 in deposit overdraft charge-offs less $801,000$406,000 in loan recoveries and $183,000$99,000 in deposit overdraft recoveries resulting in $3,023,000$88,000 of net charge-offs.loan recoveries. Primary causes of the loan charges taken in the fourth quarter of 20122014 were gross charge-offs of $640,000$4,000 on ninea two residential real estate loans, $1,449,000$3,000 on 14a single commercial real estate loans, $1,518,000loan, $119,000 on 36four home equity lines and loans, $66,000$3,000 on 23two indirect auto loans, $37,000 on 17 other consumer loans, $49,000and $78,000 on eightthree C&I loans, $44,000 on two residential construction loans, and $32,000 on a single commercial construction loan.
The $1,425,000 in charge-offsloans. During the bank took in its commercial real estate portfolio was primarily comprisedfourth quarter of a $510,000 charge on a loan secured by a commercial warehouse in central California. The remaining $915,000 was spread over 12 loans spread throughout the Company’s footprint.2014, there were no individual charges greater than $250,000.
Differences between the amounts explained in this section and the total charge-offs listed for a particular category are generally made up of individual charges of less than $250,000 each. Generally losses are triggered by non-performance by the borrower and calculated based on any difference between the current loan amount and the current value of the underlying collateral less any estimated costs associated with the disposition of the collateral.
Changes in nonperforming assets during the three months ended September 30, 20122014
| (In thousands): | Balance at September 30, 2012 | New NPA | Advances/ Capitalized Costs | Pay-downs/ Sales | Charge-offs/ Write-downs | Transfers to Foreclosed Assets | Category Changes | Balance at June 30, 2012 | ||||||||||||||||||||||||||||||||||||||||||||||||||||||||
| (in thousands): | Balance at September 30, 2014 | New NPA | Advances/ Capitalized Costs | Pay-downs /Sales /Upgrades | Charge-offs/ Write-downs | Transfers to Foreclosed Assets | Category Changes | Balance at June 30, 2014 | ||||||||||||||||||||||||||||||||||||||||||||||||||||||||
Real estate mortgage: | ||||||||||||||||||||||||||||||||||||||||||||||||||||||||||||||||
Residential | $ | 7,421 | $ | 1,270 | $ | 1 | $ | (989 | ) | $ | (370 | ) | $ | (292 | ) | — | $ | 7,801 | $ | 4,367 | $ | 188 | 1 | $ | (441 | ) | $ | (31 | ) | $ | (106 | ) | — | $ | 4,756 | |||||||||||||||||||||||||||||
Commercial | 43,259 | 1,399 | 193 | (1,488 | ) | (340 | ) | (233 | ) | $ | 19 | 43,709 | 22,250 | 861 | — | (3,299 | ) | (50 | ) | (47 | ) | — | 24,785 | |||||||||||||||||||||||||||||||||||||||||
Consumer | ||||||||||||||||||||||||||||||||||||||||||||||||||||||||||||||||
Home equity lines | 16,859 | 2,923 | 324 | (976 | ) | (1,635 | ) | (171 | ) | (18 | ) | 16,412 | 10,242 | 345 | 34 | (552 | ) | (137 | ) | (205 | ) | (77 | ) | 10,834 | ||||||||||||||||||||||||||||||||||||||||
Home equity loans | 669 | 164 | — | (32 | ) | (13 | ) | — | 18 | 532 | 838 | — | 1 | (53 | ) | — | — | 77 | 813 | |||||||||||||||||||||||||||||||||||||||||||||
Auto indirect | 225 | 22 | — | (66 | ) | (11 | ) | — | — | 280 | 23 | — | — | (13 | ) | — | — | — | 36 | |||||||||||||||||||||||||||||||||||||||||||||
Other consumer | 106 | 26 | — | (32 | ) | (37 | ) | — | — | 149 | 50 | 18 | — | (4 | ) | (13 | ) | — | — | 49 | ||||||||||||||||||||||||||||||||||||||||||||
Commercial | 8,725 | 298 | 1,267 | (1,269 | ) | (625 | ) | — | $ | (19 | ) | 9,073 | 321 | 61 | — | (173 | ) | (10 | ) | — | — | 443 | ||||||||||||||||||||||||||||||||||||||||||
Construction: | ||||||||||||||||||||||||||||||||||||||||||||||||||||||||||||||||
Residential | 3,798 | 96 | — | (559 | ) | (93 | ) | — | — | 4,354 | 2,437 | — | — | (31 | ) | — | — | — | 2,468 | |||||||||||||||||||||||||||||||||||||||||||||
Commercial | 549 | — | — | (18 | ) | — | — | — | 567 | 114 | 102 | — | (4 | ) | — | — | — | 16 | ||||||||||||||||||||||||||||||||||||||||||||||
|
|
|
|
|
|
|
|
|
|
|
|
|
|
|
| |||||||||||||||||||||||||||||||||||||||||||||||||
Total nonperforming loans | 81,611 | 6,198 | 1,785 | (5,429 | ) | (3,124 | ) | (696 | ) | — | 82,877 | 40,642 | 1,575 | 36 | (4,570 | ) | (241 | ) | (358 | ) | — | 44,200 | ||||||||||||||||||||||||||||||||||||||||||
Noncovered foreclosed assets | 7,793 | — | 86 | (2,702 | ) | (433 | ) | $ | 696 | — | 10,146 | 4,576 | — | — | (949 | ) | (97 | ) | $ | 358 | — | 5,264 | ||||||||||||||||||||||||||||||||||||||||||
Covered foreclosed assets | 2,392 | — | — | (205 | ) | — | — | — | 2,597 | 520 | — | — | — | (1 | ) | — | — | 521 | ||||||||||||||||||||||||||||||||||||||||||||||
|
|
|
|
|
|
|
|
|
|
|
|
|
|
|
| |||||||||||||||||||||||||||||||||||||||||||||||||
Total nonperforming assets | $ | 91,796 | $ | 6,198 | $ | 1,871 | $ | (8,336 | ) | $ | (3,557 | ) | — | — | $ | 95,620 | $ | 45,738 | $ | 1,575 | $ | 36 | $ | (5,519 | ) | $ | (339 | ) | — | — | $ | 49,985 | ||||||||||||||||||||||||||||||||
|
|
|
|
|
|
|
|
|
|
|
|
|
|
|
| |||||||||||||||||||||||||||||||||||||||||||||||||
Nonperforming assets decreased during the third quarter of 20122014 by $3,824,000 (4.0%$4,247,000 (8.50%) to $91,796,000$45,738,000 at September 30, 20122014 compared to $95,620,000$49,985,000 at June 30, 2012.2014. The decrease in nonperforming assets during the third quarter of 20122014 was primarily the result of new nonperforming loans of $6,198,000,$1,575,000, advances on existing nonperforming loans and capitalized costs on foreclosed assets of $1,871,000,$36,000, less pay-downs, sales or upgrades of nonperforming loans to performing status totaling $5,429,000,$4,570,000, less dispositions of foreclosed assets totaling $2,907,000,$949,000, less loan charge-offs of $3,124,000,$241,000, and less write-downs of foreclosed assets of $433,000.$98,000.
The primary causes of the $6,198,000$1,575,000 in new nonperforming loans during the third quarter of 2012 were2014 was comprised of increases of $1,270,000$188,000 on 11two residential real estate loans, $1,399,000$861,000 on ninefive commercial real estate loans, $3,087,000$345,000 on 37seven home equity lines and loans, $22,000$18,000 on eight indirect auto loans, $26,000 on 1713 consumer loans, $298,000$61,000 on 10four C&I loans, and $96,000$102,000 on one residentiala single commercial construction loan.
The $1,399,000$861,000 in new nonperforming commercial real estate loans was primarily comprisedmade up of one loan totaling $318,000in the amount of $360,000 secured by a commercial retail buildingmulti-family investment property in northern California and a $559,000 loan secured by a gas station in central California. Related charge-offs are discussed below.
Loan charge-offs during the three months ended September 30, 20122014
In the third quarter of 2012,2014, the Company recorded $3,124,000$241,000 in loan charge-offs and $243,000$105,000 in deposit overdraft charge-offs less $947,000$1,211,000 in loan recoveries and $188,000$64,000 in deposit overdraft recoveries resulting in $2,233,000$929,000 of net charge-offs.loan recoveries. Primary causes of the loan charges taken in the firstthird quarter of 20122014 were gross charge-offs of $370,000$31,000 on eighta single residential real estate loans, $340,000loan, $50,000 on 10three commercial real estate loans, $1,648,000$137,000 on 31four home equity lines and loans, $11,000$13,000 on five auto indirect loans, $37,000 on 1612 other consumer loans, $625,000and $10,000 on 11three C&I loans, and $93,000 on two residential construction loans.
During the third quarter of 2012,2014, there were no individual charges greater than $250,000. Generally losses are triggered by non-performance by the borrower and calculated based on any difference between the current loan amount and the current value of the underlying collateral less any estimated costs associated with the disposition of the collateral.
Activity in the balance of nonperforming assets for the periods indicated (continued):
37
Changes in nonperforming assets during the three months ended June 30, 20122014
| (In thousands): | Balance at June 30, 2012 | New NPA | Advances/ Capitalized Costs | Pay-downs/ Sales | Charge-offs/ Write-downs | Transfers to Foreclosed Assets | Category Changes | Balance at March 31, 2012 | ||||||||||||||||||||||||||||||||||||||||||||||||||||||||
| (in thousands): | Balance at June 30, 2014 | New NPA | Advances/ Capitalized Costs | Pay-downs /Sales /Upgrades | Charge-offs/ Write-downs | Transfers to Foreclosed Assets | Category Changes | Balance at March 31, 2014 | ||||||||||||||||||||||||||||||||||||||||||||||||||||||||
Real estate mortgage: | ||||||||||||||||||||||||||||||||||||||||||||||||||||||||||||||||
Residential | $ | 7,801 | $ | 703 | $ | 44 | $ | (622 | ) | $ | (325 | ) | $ | (295 | ) | — | $ | 8,296 | $ | 4,756 | $ | 186 | $ | 24 | $ | (182 | ) | — | — | — | $ | 4,728 | ||||||||||||||||||||||||||||||||
Commercial | 43,709 | 5,322 | 389 | (3,330 | ) | (363 | ) | (2,206 | ) | $ | 1,136 | 42,761 | 24,785 | 71 | 1,045 | (4,643 | ) | $ | (44 | ) | $ | (3,287 | ) | — | 31,643 | |||||||||||||||||||||||||||||||||||||||
Consumer | ||||||||||||||||||||||||||||||||||||||||||||||||||||||||||||||||
Home equity lines | 16,412 | 4,128 | 25 | (717 | ) | (2,477 | ) | (374 | ) | (78 | ) | 15,905 | 10,834 | 785 | 19 | (485 | ) | (677 | ) | (116 | ) | $ | (126 | ) | 11,434 | |||||||||||||||||||||||||||||||||||||||
Home equity loans | 532 | 175 | — | (112 | ) | (117 | ) | (26 | ) | 78 | 534 | 813 | 46 | — | (64 | ) | (11 | ) | — | 126 | 716 | |||||||||||||||||||||||||||||||||||||||||||
Auto indirect | 280 | 37 | — | (73 | ) | (32 | ) | — | — | 348 | 36 | — | — | (8 | ) | — | — | — | 44 | |||||||||||||||||||||||||||||||||||||||||||||
Other consumer | 149 | 120 | — | (21 | ) | (97 | ) | — | — | 147 | 49 | 29 | — | (13 | ) | (39 | ) | — | — | 72 | ||||||||||||||||||||||||||||||||||||||||||||
Commercial | 9,073 | 2,383 | — | (165 | ) | (295 | ) | — | (1,136 | ) | 8,286 | 443 | 170 | — | (377 | ) | (152 | ) | — | — | 802 | |||||||||||||||||||||||||||||||||||||||||||
Construction: | ||||||||||||||||||||||||||||||||||||||||||||||||||||||||||||||||
Residential | 4,354 | 78 | 12 | (658 | ) | (201 | ) | (524 | ) | — | 5,647 | 2,468 | — | — | (42 | ) | — | — | — | 2,510 | ||||||||||||||||||||||||||||||||||||||||||||
Commercial | 567 | — | — | (16 | ) | (68 | ) | — | — | 651 | 16 | — | — | (3 | ) | — | — | — | 19 | |||||||||||||||||||||||||||||||||||||||||||||
|
|
|
|
|
|
|
|
|
|
|
|
|
|
|
| |||||||||||||||||||||||||||||||||||||||||||||||||
Total nonperforming loans | 82,877 | 12,946 | 470 | (5,714 | ) | (3,975 | ) | (3,425 | ) | — | 82,575 | 44,200 | 1,287 | 1,088 | (5,817 | ) | (923 | ) | (3,403 | ) | — | 51,968 | ||||||||||||||||||||||||||||||||||||||||||
Noncovered foreclosed assets | 10,146 | — | 164 | (3,992 | ) | (543 | ) | 3,017 | — | 11,500 | 5,264 | (687 | ) | (3 | ) | 3,403 | — | 2,551 | ||||||||||||||||||||||||||||||||||||||||||||||
Covered foreclosed assets | 2,597 | — | — | (639 | ) | (461 | ) | 408 | — | 3,289 | 521 | — | — | (142 | ) | (1 | ) | — | — | 664 | ||||||||||||||||||||||||||||||||||||||||||||
|
|
|
|
|
|
|
|
|
|
|
|
|
|
|
| |||||||||||||||||||||||||||||||||||||||||||||||||
Total nonperforming assets | $ | 95,620 | $ | 12,946 | $ | 634 | $ | (10,345 | ) | $ | (4,979 | ) | — | — | $ | 97,364 | $ | 49,985 | $ | 1,287 | $ | 1,088 | $ | (6,646 | ) | $ | (927 | ) | — | — | $ | 55,183 | ||||||||||||||||||||||||||||||||
|
|
|
|
|
|
|
|
|
|
|
|
|
|
|
| |||||||||||||||||||||||||||||||||||||||||||||||||
Nonperforming assets decreased during the second quarter of 20122014 by $1,744,000 (1.8%$5,198,000 (9.42%) to $95,620,000$49,985,000 at June 30, 20122014 compared to $97,364,000$55,183,000 at March 31, 2012.2014. The decrease in nonperforming assets during the second quarter of 20122014 was primarily the result of new nonperforming loans of $12,946,000,$1,287,000, advances on existing nonperforming loans and capitalized costs on foreclosed assets of $634,000,$1,088,000, less pay-downs, sales or upgrades of nonperforming loans to performing status totaling $5,714,000,$5,817,000, less dispositions of foreclosed assets totaling $4,631,000,$829,000, less loan charge-offs of $3,975,000,$923,000, and less write-downs of foreclosed assets of $1,004,000.$4,000.
The primary causes of the $12,946,000$1,287,000 in new nonperforming loans during the second quarter of 2012 were2014 was comprised of increases of $703,000$186,000 on eightthree residential real estate loans, $5,322,000$71,000 on 15two commercial real estate loans, $4,303,000$831,000 on 4410 home equity lines and loans, $37,000$29,000 on seven indirect auto loans, $120,000 on 20eight consumer loans, $2,383,000and $170,000 on 21eight C&I loans, and $78,000 on one residential construction loan.loans.
The $5,322,000 in new nonperforming commercial real estate loans was primarily comprised of three loans totaling $1,262,000 secured by commercial retail buildings in northern California, a $1,906,000 loan secured by a commercial warehouse in northern California, two loans totaling $733,000 secured by light industrial commercial property in northern California and a $462,000 loan secured by mixed-use commercial property in northern California.
The $2,383,000 in new nonperforming C&I loans was primarily comprised of a $818,000 loan secured by equipment in northern California and two loans totaling $882,000 secured by accounts receivable, inventory and equipment in northern California.
Loan charge-offs during the three months ended June 30, 20122014
In the second quarter of 2012,2014, the Company recorded $3,976,000$923,000 in loan charge-offs and $212,000$105,000 in deposit overdraft charge-offs less $1,025,000$878,000 in loan recoveries and $188,000$88,000 in deposit overdraft recoveries resulting in $2,975,000$62,000 of net loan charge-offs. Primary causes of the loan charges taken in the firstsecond quarter of 20122014 were gross charge-offs of $325,000$44,000 on seven residential real estate loans, $363,000 on fivefour commercial real estate loans, $2,595,000$688,000 on 4211 home equity lines and loans, $32,000$39,000 on eight auto indirect loans, $97,000 on 25nine other consumer loans, $295,000and $170,000 on 14seven C&I loans, $201,000 on three residential construction loans and $68,000 on one commercial construction loan.
The $363,000 in gross charge-offsloans. During the bank recorded in its commercial real estate portfolio was primarily comprisedsecond quarter of a single loan secured by a commercial warehouse in central California in the amount of $290,000.
Differences between the amounts explained in this section and the total charge-offs listed for a particular category are generally made up of2014, there were no individual charges of lessgreater than $250,000 each. Generally losses are triggered by non-performance by the borrower and calculated based on any difference between the current loan amount and the current value of the underlying collateral less any estimated costs associated with the disposition of the collateral.
Activity in the balance of nonperforming assets for the periods indicated (continued):
Changes in nonperforming assets during the three months ended March 31, 20122014
| (In thousands): | Balance at March 31, 2012 | New NPA | Advances/ Capitalized Costs | Pay-downs/ Sales | Charge-offs/ Write-downs | Transfers to Foreclosed Assets | Category Changes | Balance at December 31, 2011 | ||||||||||||||||||||||||||||||||||||||||||||||||||||||||
| (in thousands): | Balance at March 31, 2014 | New NPA | Advances/ Capitalized Costs | Pay-downs /Sales /Upgrades | Charge-offs/ Write-downs | Transfers to Foreclosed Assets | Category Changes | Balance at December 31, 2013 | ||||||||||||||||||||||||||||||||||||||||||||||||||||||||
Real estate mortgage: | ||||||||||||||||||||||||||||||||||||||||||||||||||||||||||||||||
Residential | $ | 8,296 | $ | 774 | $ | 15 | $ | (592 | ) | $ | (223 | ) | $ | (203 | ) | — | $ | 8,525 | $ | 4,728 | $ | 72 | — | $ | (167 | ) | $ | (136 | ) | — | — | $ | 4,959 | |||||||||||||||||||||||||||||||
Commercial | 42,761 | 4,050 | — | (3,977 | ) | (1,305 | ) | (692 | ) | — | 44,685 | 31,643 | 860 | $ | 4 | (1,721 | ) | (13 | ) | $ | (325 | ) | $ | 967 | 31,871 | |||||||||||||||||||||||||||||||||||||||
Consumer | ||||||||||||||||||||||||||||||||||||||||||||||||||||||||||||||||
Home equity lines | 15,905 | 2,467 | 387 | (508 | ) | (2,625 | ) | (799 | ) | — | 16,983 | 11,434 | 1,232 | 434 | (1,351 | ) | (178 | ) | (221 | ) | (83 | ) | 11,601 | |||||||||||||||||||||||||||||||||||||||||
Home equity loans | 534 | 45 | — | (28 | ) | (41 | ) | — | — | 558 | 716 | 100 | 1 | (20 | ) | — | (167 | ) | 83 | 719 | ||||||||||||||||||||||||||||||||||||||||||||
Auto indirect | 348 | 68 | 1 | (189 | ) | (40 | ) | — | — | 508 | 44 | — | — | (10 | ) | — | — | — | 54 | |||||||||||||||||||||||||||||||||||||||||||||
Other consumer | 147 | 202 | — | (30 | ) | (135 | ) | — | — | 110 | 72 | 48 | — | (7 | ) | (31 | ) | — | — | 62 | ||||||||||||||||||||||||||||||||||||||||||||
Commercial | 8,286 | 457 | 406 | (364 | ) | (281 | ) | — | — | 8,068 | 802 | 401 | 417 | (109 | ) | (239 | ) | — | (967 | ) | 1,299 | |||||||||||||||||||||||||||||||||||||||||||
Construction: | ||||||||||||||||||||||||||||||||||||||||||||||||||||||||||||||||
Residential | 5,647 | 269 | — | (181 | ) | (68 | ) | — | — | 5,627 | 2,510 | 4 | — | (9 | ) | (4 | ) | — | 46 | 2,473 | ||||||||||||||||||||||||||||||||||||||||||||
Commercial | 651 | — | — | (16 | ) | — | — | — | 667 | 19 | 69 | — | (113 | ) | (69 | ) | — | $ | (46 | ) | 178 | |||||||||||||||||||||||||||||||||||||||||||
|
|
|
|
|
|
|
|
|
|
|
|
|
|
|
| |||||||||||||||||||||||||||||||||||||||||||||||||
Total nonperforming loans | 82,575 | 8,332 | 809 | (5,885 | ) | (4,718 | ) | (1,694 | ) | — | 85,731 | 51,968 | 2,786 | 856 | (3,507 | ) | (670 | ) | (713 | ) | — | 53,216 | ||||||||||||||||||||||||||||||||||||||||||
Noncovered foreclosed assets | 11,500 | — | — | (3,379 | ) | (83 | ) | 1,694 | — | 13,268 | 2,551 | — | 462 | (4,186 | ) | (26 | ) | $ | 713 | — | 5,588 | |||||||||||||||||||||||||||||||||||||||||||
Covered foreclosed assets | 3,289 | — | 225 | — | — | — | — | 3,064 | 664 | — | — | — | (10 | ) | — | — | 674 | |||||||||||||||||||||||||||||||||||||||||||||||
|
|
|
|
|
|
|
|
|
|
|
|
|
|
|
| |||||||||||||||||||||||||||||||||||||||||||||||||
Total nonperforming assets | $ | 97,364 | $ | 8,332 | $ | 1,034 | $ | (9,264 | ) | $ | (4,801 | ) | — | — | $ | 102,063 | $ | 55,183 | $ | 2,786 | $ | 1,318 | $ | (7,693 | ) | $ | (706 | ) | — | — | $ | 59,478 | ||||||||||||||||||||||||||||||||
|
|
|
|
|
|
|
|
|
|
|
|
|
|
|
| |||||||||||||||||||||||||||||||||||||||||||||||||
Nonperforming assets decreased during the first quarter of 20122014 by $4,699,000 (4.6%$4,295,000 (7.22%) to $97,364,000$55,183,000 at March 31, 20122014 compared to $102,063,000$59,478,000 at December 31, 2011.2013. The decrease in nonperforming assets during the first quarter of 20122014 was primarily the result of new nonperforming loans of $8,332,000,$2,786,000, advances on existing nonperforming loans and capitalized costs on foreclosed assets of $1,034,000,$1,318,000, less pay-downs, sales or upgrades of nonperforming loans to performing status totaling $5,885,000,$3,507,000, less dispositions of foreclosed assets totaling $3,379,000,$4,186,000, less loan charge-offs of $4,718,000,$670,000, and less write-downs of foreclosed assets of $83,000.$36,000.
38
The primary causes of the $8,332,000$2,786,000 in new nonperforming loans during the first quarter of 2012 were2014 was comprised of increases of $774,000$72,000 on sixone residential real estate loans, $4,050,000loan, $860,000 on 12six commercial real estate loans, $2,512,000$1,332,000 on 4217 home equity lines and loans, $68,000$48,000 on 16 indirect auto loans, $202,000 on 2014 consumer loans, $457,000$401,000 on 10nine C&I loans, and $269,000$4,000 on fourone residential construction loans.loan, and $69,000 on one commercial construction loan.
The $4,050,000$860,000 in new nonperforming commercial real estate loans was primarily comprisedmade up of fourtwo loans totaling $1,913,000$514,000 secured by commercial office buildingsagricultural production land in northern California, a $962,000 loan secured by a commercial retail building in northern California and a $470,000 loan secured by a commercial warehouse in northerncentral California. Related charge-offs are discussed below.
Loan charge-offs during the three months ended March 31, 20122014
In the first quarter of 2012,2014, the Company recorded $4,718,000$670,000 in loan charge-offs and $204,000$96,000 in deposit overdraft charge-offs less $244,000$2,068,000 in loan recoveries and $220,000$130,000 in deposit overdraft recoveries resulting in $4,458,000$1,432,000 of net charge-offs.loan recoveries. Primary causes of the loan charges taken in the first quarter of 20122014 were gross charge-offs of $223,000$136,000 on nineone residential real estate loans, $1,305,000loan, $13,000 on sixone commercial real estate loans, $2,666,000loan, $178,000 on 477 home equity lines and loans, $40,000$31,000 on 13 auto indirect loans, $135,000 on 1714 other consumer loans, $281,000$239,000 on 15eight C&I loans, and $2,000$4,000 on twoone residential construction loans.
The $1,305,000 in charge-offsloan, and $69,000 on one commercial construction loan. During the bank took in its commercial real estate portfolio was primarily the resultfirst quarter of a $607,000 charge on a loan secured by a commercial warehouse in northern California and a $541,000 charge on a loan secured by an industrial plant facility in northern California. The remaining $157,000 was spread over four loans spread throughout the Company’s footprint.
Differences between the amounts explained in this section and the total charge-offs listed for a particular category are generally made up of2014, there were no individual charges of lessgreater than $250,000 each. Generally losses are triggered by non-performance by the borrower and calculated based on any difference between the current loan amount and the current value of the underlying collateral less any estimated costs associated with the disposition of the collateral.
Allowance for Loan Losses
The Company’s allowance for loan losses is comprised of allowances for originated, PNCI and PCI loans. All such allowances are established through a provision for loan losses charged to expense.
Originated and PNCI loans, and deposit related overdrafts are charged against the allowance for originated loan losses when Management believes that the collectability of the principal is unlikely or, with respect to consumer installment loans, according to an established delinquency schedule. The allowances for originated and PNCI loan losses are amounts that Management believes will be adequate to absorb probable losses inherent in existing originated loans, based on evaluations of the collectability, impairment and prior loss experience of those loans and leases. The evaluations take into consideration such factors as changes in the nature and size of the portfolio, overall portfolio quality, loan concentrations, specific problem loans, and current economic conditions that may affect the borrower’s ability to pay. The Company defines an originated or PNCI loan as impaired when it is probable the Company will be unable to collect all amounts due according to the contractual terms of the loan agreement. Impaired originated and PNCI loans are measured based on the present value of expected future cash flows discounted at the loan’s original effective interest rate. As a practical expedient, impairment may be measured based on the loan’s observable market price or the fair value of the collateral if the loan is collateral dependent. When the measure of the impaired loan is less than the recorded investment in the loan, the impairment is recorded through a valuation allowance.
In situations related to originated and PNCI loans where, for economic or legal reasons related to a borrower’s financial difficulties, the Company grants a concession for other than an insignificant period of time to the borrower that the Company would not otherwise consider, the related loan is classified as a troubled debt restructuring (TDR). The Company strives to identify borrowers in financial difficulty early and work with them to modify to more affordable terms before their loan reaches nonaccrual status. These modified terms may include rate reductions, principal forgiveness, payment forbearance and other actions intended to minimize the economic loss and to avoid foreclosure or repossession of the collateral. In cases where the Company grants the borrower new terms that provide for a reduction of either interest or principal, the Company measures any impairment on the restructuring as noted above for impaired loans. TDR loans are classified as impaired until they are fully paid off or charged off. Loans that are in nonaccrual status at the time they become TDR loans, remain in nonaccrual status until the borrower demonstrates a sustained period of performance which the Company generally believes to be six consecutive months of payments, or equivalent. Otherwise, TDR loans are subject to the same nonaccrual and charge-off policies as noted above with respect to their restructured principal balance.
Credit risk is inherent in the business of lending. As a result, the Company maintains an allowance for loan losses to absorb losses inherent in the Company’s originated and PNCI loan portfolios. These are maintained through periodic charges to earnings. These charges are included in the Consolidated Income Statements as provision for loan losses. All specifically identifiable and quantifiable losses are immediately charged off against the allowance. However, for a variety of reasons, not all losses are immediately known to the Company and, of those that are known, the full extent of the loss may not be quantifiable at that point in time. The balance of the Company’s allowances for originated and PNCI loan losses are meant to be an estimate of these unknown but probable losses inherent in these portfolios.
The Company formally assesses the adequacy of the allowance for originated and PNCI loan losses on a quarterly basis. Determination of the adequacy is based on ongoing assessments of the probable risk in the outstanding originated and PNCI loan portfolios, and to a lesser extent the Company’s originated and PNCI loan commitments. These assessments include the periodic re-grading of credits based on changes in their individual credit characteristics including delinquency, seasoning, recent financial performance of the borrower, economic factors, changes in the interest rate environment, growth of the portfolio as a whole or by segment, and other factors as warranted. Loans are initially graded when originated or acquired. They are re-graded as they are renewed, when there is a new loan to the same borrower, when identified facts demonstrate heightened risk of nonpayment, or if they become delinquent. Re-grading of larger problem loans occurs at least quarterly. Confirmation of the quality of the grading process is obtained by independent credit reviews conducted by consultants specifically hired for this purpose and by various bank regulatory agencies.
39
The Company’s method for assessing the appropriateness of the allowance for originated and PNCI loan losses includes specific allowances for impaired loans and leases, formula allowance factors for pools of credits, and allowances for changing environmental factors (e.g., interest rates, growth, economic conditions, etc.). Allowance factors for loan pools are based on historical loss experience by product type and prior risk rating. Allowances for impaired loans are based on analysis of individual credits. Allowances for changing environmental factors are Management’s best estimate of the probable impact these changes have had on the originated or PNCI loan portfolio as a whole. The allowances for originated and PNCI loans are included in the allowance for loan losses.
As noted above, the allowances for originated and PNCI loan losses consists of a specific allowance, a formula allowance, and an allowance for environmental factors. The first component, the specific allowance, results from the analysis of identified credits that meet management’s criteria for specific evaluation. These loans are reviewed individually to determine if such loans are considered impaired. Impaired loans are those where management has concluded that it is probable that the borrower will be unable to pay all amounts due under the contractual terms. Impaired loans are specifically reviewed and evaluated individually by management for loss potential by evaluating sources of repayment, including collateral as applicable, and a specified allowance for loan losses is established where necessary.
During the three months ended March 31, 2013, the Company changed the method it uses to estimate net sale proceeds from real estate collateral sales when calculating the allowance for loan losses associated with impaired real estate collateral dependent loans. Previously, the Company used the greater of fifteen percent or actual estimated selling costs. Currently, the Company uses the actual estimated selling costs, and an adjustment to appraised value based on the age of the appraisal. These changes are intended to more accurately reflect the estimated net sale proceeds from the sale of impaired collateral dependent real estate loans. This change in methodology resulted in the allowance for loan losses as of March 31, 2013 being $494,000 more than it would have been without this change in methodology.
The second component of the allowance for originated and PNCI loan losses, the formula allowance, is an estimate of the probable losses that have occurred across the major loan categories in the Company’s originated and PNCI loan portfolios. This analysis is based on loan grades by pool and the loss history of these pools. This analysis covers the Company’s entire originated and PNCI loan portfolios including unused commitments but excludes any loans that were analyzed individually and assigned a specific allowance as discussed above. The total amount allocated for this component is determined by applying loss estimation factors to outstanding loans and loan commitments. The loss factors were previously based primarily on the Company’s historical loss experience tracked over a five-year period and adjusted as appropriate for the input of current trends and events. Because historical loss experience varies for the different categories of originated loans, the loss factors applied to each category also differed. In addition, there is a greater chance that the Company would suffer a loss from a loan that was risk rated less than satisfactory than if the loan was last graded satisfactory. Therefore, for any given category, a larger loss estimation factor was applied to less than satisfactory loans than to those that the Company last graded as satisfactory. The resulting formula allowance was the sum of the allocations determined in this manner.
During the three month periodmonths ended June 30, 2013, the Company modified its loss migration analysis methodology used to determine the formula allowance factors. When the Company originally established its loss migration analysis methodology during the quarter ended March 31, 2012, the Company converted to a loss migration analysis to determine the formula allowance. Under this method, the Companyit reviewed the loss experience of each quarter over the previous three years and determinedin order to calculate an annualized loss rate by loan category as well asand risk rating. The use of three years of loss experience data was originally used because that was the extent of the detailed loss data, by loan category and risk rating that was available at the beginningtime. This three year historical look-back period was used through the quarter ended March 31, 2013. Starting with the quarter ended June 30, 2013, the Company reviews all available detailed loss experience data, going back to, and including, the quarter end June 30, 2008, and does not limit the look-back period to the most recent three years of historical loss data. Using this data, the Company calculates loss factors for each period reviewed. Aquarter from the quarter ended June 30, 2009 to the most recent quarter. The Company then calculates a weighted average was then applied to arrive at the average annualized loss rateformula allowance factor for each loan category and risk rating which was then applied againstwith the net recorded investmentmost recent quarterly loss factor being weighted 125%, the quarter ended June 30, 2009 loss factor being weighted 75%, and the loss factors for all loansthe quarters between the most recent quarter and the quarter ended June 30, 2009, being weighted on a linear scale from 75% to 125%. This change is intended to more accurately reflect the risk inherent in the loan portfolio by category and risk rating not classifiedconsidering historical loss data for all years as impaired. The effect of thisthe data for new periods becomes available. This change in methodology resulted in a net reductionthe allowance for loan losses as of June 30, 2013 being $1,314,000 more than it would have been without this change in formula allowance required of $3,296,000. This loss migration approach was promoted by regulatory agencies and implemented bymethodology.
During the three months ended June 30, 2014, the Company during the three month period ended March 31, 2012 as this was the first period in which sufficient historical data could be compiled to support the analysis.
In addition to updatingrefined the method it uses to evaluate historical losses for the purpose of estimating the pool allowance for unimpaired loans. In the third quarter of 2010, the Company moved from a six point grading system (Grades A-F) to a nine point risk rating system (Risk Ratings 1-9), primarily to allow for more distinction within the “Pass” risk rating. Initially, there was not sufficient loss experience within the nine point scale to complete a migration analysis for all nine risk ratings, all loans risk rated Pass or 2-5 were grouped together, a loss rate was calculated for that group, and that loss rate was established as the loss rate for risk rating 4. The reserve ratios for risk ratings
40
2, 3 and 5 were then interpolated from that figure. As of June 30, 2014, the Company was able to compile twelve quarters of historical loss information for all risk ratings and use that information to calculate the loss rates for each of the nine risk ratings without interpolation. This refinement led to an increase of $1,438,000 in the reserve requirement for unimpaired loans, driven primarily by which the estimated formula allowance required is calculated, management also improved the monitoring and risk recognition within its consumer portfolio. Previously, consumer loanshome equity lines of credit with no identified credit weakness had a risk rating of “Pass” assigned, and this would generally only change if the loan went 90 days past due, at which time the risk rating was systematically downgraded to “Substandard” and the loan was placed in nonaccrual. For the period ended March 31, 2012, management has chosen to monitor consumer loans based on current credit score and assign a risk rating of “Special Mention” for those scores below a certain threshold. This change is primarily intended to more effectively monitor and manage the risk in the Company’s portfolio of consumer loans and lines of credit secured by junior liens on 1-4 family residential properties. The current credit score allows us to better account for increasing default risk in these types of loans. It is also the only reasonably available tool that can be used to attempt to monitor the performance of the senior lien on the associated properties, as the Company does not generally service both the 1st and 2nd loans in these instances. The result of this change in methodology resulted in an additional required formula allowance of $1,874,000. $1,596,000 of this additional requirement is specifically related to loans and lines of credit secured by junior liens on 1-4 family residential properties.5 or “Pass-Watch.”
The third component of the allowances for originated and PNCI loan losses, the environmental factor allowance, is a component that is not allocated to specific loans or groups of loans, but rather is intended to absorb losses that may not be provided for by the other components.
There are several primary reasons that the other components discussed above might not be sufficient to absorb the losses present in the originated and PNCI loan portfolios, and the environmental factor allowance is used to provide for the losses that have occurred because of them.
The first reason is that there are limitations to any credit risk grading process. The volume of originated and PNCI loans makes it impractical to re-grade every loan every quarter. Therefore, it is possible that some currently performing originated or PNCI loans not recently graded will not be as strong as their last grading and an insufficient portion of the allowance will have been allocated to them. Grading and loan review often must be done without knowing whether all relevant facts are at hand. Troubled borrowers may deliberately or inadvertently omit important information from reports or conversations with lending officers regarding their financial condition and the diminished strength of repayment sources.
The second reason is that the loss estimation factors are based primarily on historical loss totals. As such, the factors may not give sufficient weight to such considerations as the current general economic and business conditions that affect the Company’s borrowers and specific industry conditions that affect borrowers in that industry. The factors might also not give sufficient weight to other environmental factors such as changing economic conditions and interest rates, portfolio growth, entrance into new markets or products, and other characteristics as may be determined by Management.
Specifically, in assessing how much environmental factor allowance needed to be provided, management considered the following:
with respect to the economy, management considered the effects of changes in GDP, unemployment, CPI, debt statistics, housing starts, housing sales, auto sales, agricultural prices, and other economic factors which serve as indicators of economic health and trends and which may have an impact on the performance of our borrowers, and
with respect to changes in the interest rate environment, management considered the recent changes in interest rates and the resultant economic impact it may have had on borrowers with high leverage and/or low profitability; and
with respect to changes in energy prices, management considered the effect that increases, decreases or volatility may have on the performance of our borrowers, and
with respect to loans to borrowers in new markets and growth in general, management considered the relatively short seasoning of such loans and the lack of experience with such borrowers, and
with respect to the potential imprecision in the total Allowance for Loan Losses calculation, management previously included an unspecified reserve equal to 1.00% of the total allowance and reserve for unfunded commitments calculated. For the period ended March 31, 2012, this unspecified reserve was eliminated resulting in a reduction in allowances required of $425,000, and
with respect to loans that have not yet been identified as impaired, management considered the volume and severity of past due loans. This environmental consideration was added to the Company’s Allowance for Loan Losses methodology for the period ended March 31, 2012 and resulted in additional allowances required of $459,000.
Each of these considerations was assigned a factor and applied to a portion or the entire originated and PNCI loan portfolios. Since these factors are not derived from experience and are applied to large non-homogeneous groups of loans, they are available for use across the portfolio as a whole.
During the three months ended September 30, 2013, the Company modified its methodology used to determine the allowance for changing environmental factors. Previously, the Company compared the current value of each environmental factor to a fixed baseline value. The deviation of the current value from the baseline value was then multiplied by a conversion factor to determine the required allowance related to each environmental factor. As of September 30, 2013, the Company replaced the fixed baseline values with average baseline values derived from historical averages, and adjusted the conversion factors. This change is intended to more accurately reflect the risk inherent in the portfolio by recognizing that baseline, or normal, levels for environmental factors may change over time. This change in methodology resulted in the allowance for loan losses as of September 30, 2013 being $1,665,000 more than it would have been without this change in methodology.
During the three months ended March 31, 2014, the Company modified its methodology used to determine the allowance for changing environmental factors by adding a new environmental factor based on the California Home Affordability Index (“CHAI”). The CHAI measures the percentage of households in California that can afford to purchase the median priced
41
home in California based on current home prices and mortgage interest rates. The use of the CHAI environmental factor consists of comparing the current CHAI to its historical baseline, and allows management to consider the adverse impact that a lower than historical CHAI may have on general economic activity and the performance of our borrowers. Based on an analysis of historical data, management believes this environmental factor gives a better estimate of current economic activity compared to other environmental factors that may lag current economic activity to some extent. This change in methodology resulted in no change to the allowance for loan losses as of March 31, 2014 compared to what it would have been without this change in methodology.
Acquired loans are valued as of acquisition date in accordance with Financial Accounting Standards Board Accounting Standards Codification (“FASB ASC”) Topic 805,Business Combinations. Loans purchased with evidence of credit deterioration since origination for which it is probable that all contractually required payments will not be collected are referred to as purchased credit impaired (PCI) loans. PCI loans are accounted for under FASB ASC Topic 310-30,Loans and Debt Securities Acquired with Deteriorated Credit Quality. In addition, because of the significant credit discounts associated with the loans acquired in the Granite acquisition, the Company elected to account for all loans acquired in the Granite acquisition under FASB ASC Topic 310-30, and classify them all as PCI loans. Under FASB ASC Topic 805 and FASB ASC Topic 310-30, PCI loans are recorded at fair value at acquisition date, factoring in credit losses expected to be incurred over the life of the loan. Accordingly, an allowance for loan losses is not carried over or recorded as of the acquisition date. Fair value is defined as the present value of the future estimated principal and interest payments of the loan, with the discount rate used in the present value calculation representing the estimated effective yield of the loan. The difference between contractual future payments and estimated future payments is referred to as the nonaccretable difference. The difference between estimated future payments and the present value of the estimated future payments is referred to as the accretable yield. The accretable yield represents the amount that is expected to be recorded as interest income over the remaining life of the loan. If after acquisition, the Company determines that the future cash flows of a PCI loan are expected to be more than the originally estimated, an increase in the discount rate (effective yield) would be made such that the newly increased accretable yield would be recognized, on a level yield basis, over the remaining estimated life of the loan. If after acquisition, the Company determines that the future cash flows of a PCI loan are expected to be less than the previously estimated, the discount rate would first be reduced until the present value of the reduced cash flow estimate equals the previous present value however, the discount rate may not be lowered below its original level. If the discount rate has been lowered to its original level and the present value has not been sufficiently lowered, an allowance for loan loss would be established through a provision for loan losses charged to expense to decrease the present value to the required level. If the estimated cash flows improve after an allowance has been established for a loan, the allowance may be partially or fully reversed depending on the improvement in the estimated cash flows. Only after the allowance has been fully reversed may the discount rate be increased. PCI loans are put on nonaccrual status when cash flows cannot be reasonably estimated. PCI loans are charged off when evidence suggests cash flows are not recoverable. Foreclosed assets from PCI loans are recorded in foreclosed assets at fair value with the fair value at time of foreclosure representing cash flow from the loan. ASC 310-30 allows PCI loans with similar risk characteristics and acquisition time frame to be “pooled” and have their cash flows aggregated as if they were one loan.
The Components of the Allowance for Loan Losses
The following table sets forth the Bank’s allowance for loan losses as of the dates indicated (dollars in thousands):
| December 31, | December 31, | |||||||||||||||||||||||||||||||||||||||
| 2012 | 2011 | 2010 | 2009 | 2008 | 2014 | 2013 | 2012 | 2011 | 2010 | |||||||||||||||||||||||||||||||
Allowance for originated and PNCI loan losses: | ||||||||||||||||||||||||||||||||||||||||
Specific allowance | $ | 4,505 | $ | 5,993 | $ | 6,945 | $ | 8,627 | $ | 5,850 | $ | 4,267 | $ | 3,975 | $ | 4,505 | $ | 5,993 | $ | 6,945 | ||||||||||||||||||||
Formula allowance | 29,314 | 32,023 | 31,070 | 23,361 | 17,989 | 22,076 | 24,611 | 29,314 | 32,023 | 31,070 | ||||||||||||||||||||||||||||||
Environmental factors allowance | 3,919 | 3,687 | 2,948 | 3,485 | 3,751 | 6,815 | 5,619 | 3,919 | 3,687 | 2,948 | ||||||||||||||||||||||||||||||
|
|
|
|
|
|
|
|
|
| |||||||||||||||||||||||||||||||
Allowance for originated and PNCI loan losses | 37,738 | 41,703 | 40,963 | 35,473 | 27,590 | 33,158 | 34,205 | 37,738 | 41,703 | 40,963 | ||||||||||||||||||||||||||||||
Allowance for PCI loan losses | 4,910 | 4,211 | 1,608 | — | — | 3,427 | 4,040 | 4,910 | 4,211 | 1,608 | ||||||||||||||||||||||||||||||
|
|
|
|
|
|
|
|
|
| |||||||||||||||||||||||||||||||
Allowance for loan losses | $ | 42,648 | $ | 45,914 | $ | 42,571 | $ | 35,473 | $ | 27,590 | $ | 36,585 | $ | 38,245 | $ | 42,648 | $ | 45,914 | $ | 42,571 | ||||||||||||||||||||
|
|
|
|
|
|
|
|
|
| |||||||||||||||||||||||||||||||
Allowance for loan losses to loans | 2.73 | % | 2.96 | % | 3.00 | % | 2.37 | % | 1.73 | % | 1.60 | % | 2.29 | % | 2.73 | % | 2.96 | % | 3.00 | % | ||||||||||||||||||||
Based on the current conditions of the loan portfolio, management believes that the $42,648,000$36,585,000 allowance for loan losses at December 31, 20122014 is adequate to absorb probable losses inherent in the Bank’s loan portfolio. No assurance can be given, however, that adverse economic conditions or other circumstances will not result in increased losses in the portfolio.
42
The following table summarizes the allocation of the allowance for loan losses between loan types:
| December 31, | December 31, | |||||||||||||||||||||||||||||||||||||||
| (dollars in thousands) | 2012 | 2011 | 2010 | 2009 | 2008 | 2014 | 2013 | 2012 | 2011 | 2010 | ||||||||||||||||||||||||||||||
Real estate mortgage | $ | 12,305 | $ | 15,621 | $ | 15,707 | $ | 7,689 | $ | 10,967 | $ | 12,313 | $ | 12,854 | $ | 12,305 | $ | 15,621 | $ | 15,707 | ||||||||||||||||||||
Consumer | 23,461 | 20,506 | 17,779 | 17,026 | 8,470 | 18,201 | 18,238 | 23,461 | 20,506 | 17,779 | ||||||||||||||||||||||||||||||
Commercial | 4,703 | 6,545 | 5,991 | 6,958 | 7,002 | 4,226 | 4,331 | 4,703 | 6,545 | 5,991 | ||||||||||||||||||||||||||||||
Real estate construction | 2,179 | 3,242 | 3,094 | 3,800 | 1,151 | 1,845 | 2,822 | 2,179 | 3,242 | 3,094 | ||||||||||||||||||||||||||||||
|
|
|
|
|
|
|
|
|
| |||||||||||||||||||||||||||||||
Total allowance for loan losses | $ | 42,648 | $ | 45,914 | $ | 42,571 | $ | 35,473 | $ | 27,590 | $ | 36,585 | $ | 38,245 | $ | 42,648 | $ | 45,914 | $ | 42,571 | ||||||||||||||||||||
|
|
|
|
|
|
|
|
|
| |||||||||||||||||||||||||||||||
The following table summarizes the allocation of the allowance for loan losses between loan types as a percentage of the total allowance for loan losses:
| December 31, | December 31, | |||||||||||||||||||||||||||||||||||||||
| 2012 | 2011 | 2010 | 2009 | 2008 | 2014 | 2013 | 2012 | 2011 | 2010 | |||||||||||||||||||||||||||||||
Real estate mortgage | 28.9 | % | 34.0 | % | 36.9 | % | 21.7 | % | 50.5 | % | 33.7 | % | 33.6 | % | 28.9 | % | 34.0 | % | 36.9 | % | ||||||||||||||||||||
Consumer | 55.0 | % | 44.7 | % | 41.8 | % | 48.0 | % | 32.3 | % | 49.7 | % | 47.7 | % | 55.0 | % | 44.7 | % | 41.8 | % | ||||||||||||||||||||
Commercial | 11.0 | % | 14.2 | % | 14.1 | % | 19.6 | % | 11.9 | % | 11.6 | % | 11.3 | % | 11.0 | % | 14.2 | % | 14.1 | % | ||||||||||||||||||||
Real estate construction | 5.1 | % | 7.1 | % | 7.2 | % | 10.7 | % | 5.3 | % | 5.0 | % | 7.4 | % | 5.1 | % | 7.1 | % | 7.2 | % | ||||||||||||||||||||
|
|
|
|
|
|
|
|
|
| |||||||||||||||||||||||||||||||
Total allowance for loan losses | 100.0 | % | 100.0 | % | 100.0 | % | 100.0 | % | 100.0 | % | 100.0 | % | 100.0 | % | 100.0 | % | 100.0 | % | 100.0 | % | ||||||||||||||||||||
|
|
|
|
|
|
|
|
|
| |||||||||||||||||||||||||||||||
The following table summarizes the allocation of the allowance for loan losses between loan types as a percentage of the total loans:
| December 31, | December 31, | |||||||||||||||||||||||||||||||||||||||
| 2012 | 2011 | 2010 | 2009 | 2008 | 2014 | 2013 | 2012 | 2011 | 2010 | |||||||||||||||||||||||||||||||
Real estate mortgage | 1.22 | % | 1.62 | % | 1.88 | % | 0.91 | % | 1.31 | % | 0.76 | % | 1.16 | % | 1.22 | % | 1.62 | % | 1.88 | % | ||||||||||||||||||||
Consumer | 6.08 | % | 5.05 | % | 4.49 | % | 3.97 | % | 1.77 | % | 4.36 | % | 4.76 | % | 6.08 | % | 5.05 | % | 4.49 | % | ||||||||||||||||||||
Commercial | 3.47 | % | 4.70 | % | 4.18 | % | 4.24 | % | 3.68 | % | 2.42 | % | 3.28 | % | 3.47 | % | 4.70 | % | 4.18 | % | ||||||||||||||||||||
Real estate construction | 6.59 | % | 8.18 | % | 6.89 | % | 6.47 | % | 1.38 | % | 2.46 | % | 5.75 | % | 6.59 | % | 8.18 | % | 6.89 | % | ||||||||||||||||||||
|
|
|
|
|
|
|
|
|
| |||||||||||||||||||||||||||||||
Total allowance for loan losses | 2.73 | % | 2.96 | % | 3.00 | % | 2.37 | % | 1.73 | % | 1.60 | % | 2.29 | % | 2.73 | % | 2.96 | % | 3.00 | % | ||||||||||||||||||||
|
|
|
|
|
|
|
|
|
| |||||||||||||||||||||||||||||||
43
The following tables summarize the activity in the allowance for loan losses, reserve for unfunded commitments, and allowance for losses (which is comprised of the allowance for loan losses and the reserve for unfunded commitments) for the years indicated (dollars in thousands):
| Year ended December 31, | Year ended December 31, | |||||||||||||||||||||||||||||||||||||||
| 2012 | 2011 | 2010 | 2009 | 2008 | 2014 | 2013 | 2012 | 2011 | 2010 | |||||||||||||||||||||||||||||||
Allowance for loan losses: | ||||||||||||||||||||||||||||||||||||||||
Balance at beginning of period | $ | 45,914 | $ | 42,571 | $ | 35,473 | $ | 27,590 | $ | 17,331 | $ | 38,245 | $ | 42,648 | $ | 45,914 | $ | 42,571 | $ | 35,473 | ||||||||||||||||||||
Provision for loan losses | 9,423 | 23,060 | 37,458 | 31,450 | 20,950 | |||||||||||||||||||||||||||||||||||
(Benefit from) provision for loan losses | (4,045 | ) | (715 | ) | 9,423 | 23,060 | 37,458 | |||||||||||||||||||||||||||||||||
Loans charged off: | ||||||||||||||||||||||||||||||||||||||||
Real estate mortgage: | ||||||||||||||||||||||||||||||||||||||||
Residential | (1,558 | ) | (1,655 | ) | (1,498 | ) | (583 | ) | (691 | ) | (171 | ) | (46 | ) | (1,558 | ) | (1,655 | ) | (1,498 | ) | ||||||||||||||||||||
Commercial | (3,457 | ) | (4,451 | ) | (8,281 | ) | (1,223 | ) | (18 | ) | (110 | ) | (2,038 | ) | (3,457 | ) | (4,451 | ) | (8,281 | ) | ||||||||||||||||||||
Consumer: | ||||||||||||||||||||||||||||||||||||||||
Home equity lines | (8,042 | ) | (9,746 | ) | (11,221 | ) | (7,487 | ) | (2,942 | ) | (1,094 | ) | (2,651 | ) | (8,042 | ) | (9,746 | ) | (11,221 | ) | ||||||||||||||||||||
Home equity loans | (385 | ) | (789 | ) | (1,339 | ) | (656 | ) | (409 | ) | (29 | ) | (94 | ) | (385 | ) | (789 | ) | (1,339 | ) | ||||||||||||||||||||
Auto indirect | (83 | ) | (427 | ) | (1,403 | ) | (2,806 | ) | (2,710 | ) | (3 | ) | (68 | ) | (83 | ) | (427 | ) | (1,403 | ) | ||||||||||||||||||||
Other consumer | (1,202 | ) | (1,158 | ) | (1,687 | ) | (1,238 | ) | (1,237 | ) | (599 | ) | (887 | ) | (1,202 | ) | (1,158 | ) | (1,687 | ) | ||||||||||||||||||||
Commercial | (1,251 | ) | (2,534 | ) | (3,539 | ) | (3,219 | ) | (709 | ) | (479 | ) | (1,599 | ) | (1,251 | ) | (2,534 | ) | (3,539 | ) | ||||||||||||||||||||
Construction: | ||||||||||||||||||||||||||||||||||||||||
Residential | (406 | ) | (634 | ) | (4,666 | ) | (7,737 | ) | (3,203 | ) | (4 | ) | (20 | ) | (406 | ) | (634 | ) | (4,666 | ) | ||||||||||||||||||||
Commercial | (100 | ) | (653 | ) | (94 | ) | (89 | ) | — | (69 | ) | (140 | ) | (100 | ) | (653 | ) | (94 | ) | |||||||||||||||||||||
|
|
|
|
|
|
|
|
|
| |||||||||||||||||||||||||||||||
Total loans charged off | (16,484 | ) | (22,047 | ) | (33,728 | ) | (25,038 | ) | (11,919 | ) | (2,558 | ) | (7,543 | ) | (16,484 | ) | (22,047 | ) | (33,728 | ) | ||||||||||||||||||||
Recoveries of previously charged-off loans: | ||||||||||||||||||||||||||||||||||||||||
Real estate mortgage: | ||||||||||||||||||||||||||||||||||||||||
Residential | 147 | 126 | 2 | 40 | — | 2 | 345 | 147 | 126 | 2 | ||||||||||||||||||||||||||||||
Commercial | 1,020 | 127 | 1,456 | 71 | 58 | 540 | 994 | 1,020 | 127 | 1,456 | ||||||||||||||||||||||||||||||
Consumer: | ||||||||||||||||||||||||||||||||||||||||
Home equity lines | 398 | 573 | 138 | 98 | 13 | 960 | 1,053 | 398 | 573 | 138 | ||||||||||||||||||||||||||||||
Home equity loans | 100 | 45 | 15 | — | — | 34 | 41 | 100 | 45 | 15 | ||||||||||||||||||||||||||||||
Auto indirect | 215 | 379 | 505 | 484 | 441 | 86 | 195 | 215 | 379 | 505 | ||||||||||||||||||||||||||||||
Other consumer | 860 | 839 | 816 | 677 | 685 | 495 | 759 | 860 | 839 | 816 | ||||||||||||||||||||||||||||||
Commercial | 643 | 173 | 205 | 71 | 31 | 1,268 | 340 | 643 | 173 | 205 | ||||||||||||||||||||||||||||||
Construction: | ||||||||||||||||||||||||||||||||||||||||
Residential | 412 | 28 | 231 | 30 | — | 1,377 | 63 | 412 | 28 | 231 | ||||||||||||||||||||||||||||||
Commercial | — | 40 | — | — | — | 181 | 65 | — | 40 | — | ||||||||||||||||||||||||||||||
|
|
|
|
|
|
|
|
|
| |||||||||||||||||||||||||||||||
Total recoveries of previously charged off loans | 3,795 | 2,330 | 3,368 | 1,471 | 1,228 | 4,944 | 3,855 | 3,795 | 2,330 | 3,368 | ||||||||||||||||||||||||||||||
|
|
|
|
|
|
|
|
|
| |||||||||||||||||||||||||||||||
Net charge-offs | (12,689 | ) | (19,717 | ) | (30,360 | ) | (23,567 | ) | (10,691 | ) | 2,386 | (3,688 | ) | (12,689 | ) | (19,717 | ) | (30,360 | ) | |||||||||||||||||||||
|
|
|
|
|
|
|
|
|
| |||||||||||||||||||||||||||||||
Balance at end of period | $ | 42,648 | $ | 45,914 | $ | 42,571 | $ | 35,473 | $ | 27,590 | $ | 36,585 | $ | 38,245 | $ | 42,648 | $ | 45,914 | $ | 42,571 | ||||||||||||||||||||
|
|
|
|
|
|
|
|
|
| |||||||||||||||||||||||||||||||
| Year ended December 31, | ||||||||||||||||||||||||||||||||||||||||
| 2014 | 2013 | 2012 | 2011 | 2010 | ||||||||||||||||||||||||||||||||||||
Reserve for unfunded commitments: | ||||||||||||||||||||||||||||||||||||||||
Balance at beginning of period | $ | 2,740 | $ | 2,640 | $ | 3,640 | $ | 2,565 | $ | 2,090 | $ | 2,415 | $ | 3,615 | $ | 2,740 | $ | 2,640 | $ | 3,640 | ||||||||||||||||||||
Provision for losses – unfunded commitments | 875 | 100 | (1,000 | ) | 1,075 | 475 | (270 | ) | (1,200 | ) | 875 | 100 | (1,000 | ) | ||||||||||||||||||||||||||
|
|
|
|
|
|
|
|
|
| |||||||||||||||||||||||||||||||
Balance at end of period | $ | 3,615 | $ | 2,740 | $ | 2,640 | $ | 3,640 | $ | 2,565 | $ | 2,145 | $ | 2,415 | $ | 3,615 | $ | 2,740 | $ | 2,640 | ||||||||||||||||||||
|
|
|
|
|
|
|
|
|
| |||||||||||||||||||||||||||||||
Balance at end of period: | ||||||||||||||||||||||||||||||||||||||||
Allowance for loan losses | $ | 42,648 | $ | 45,914 | $ | 42,571 | $ | 35,473 | $ | 27,590 | $ | 36,585 | $ | 38,245 | $ | 42,648 | $ | 45,914 | $ | 42,571 | ||||||||||||||||||||
Reserve for unfunded commitments | 3,615 | 2,740 | 2,640 | 3,640 | 2,565 | 2,145 | 2,415 | 3,615 | 2,740 | 2,640 | ||||||||||||||||||||||||||||||
|
|
|
|
|
|
|
|
|
| |||||||||||||||||||||||||||||||
Allowance for loan losses and reserve for unfunded commitments | $ | 46,263 | $ | 48,654 | $ | 45,211 | $ | 39,113 | $ | 30,155 | $ | 38,730 | $ | 40,660 | $ | 46,263 | $ | 48,654 | $ | 45,211 | ||||||||||||||||||||
|
|
|
|
|
|
|
|
|
| |||||||||||||||||||||||||||||||
As a percentage of total loans at end of period: | ||||||||||||||||||||||||||||||||||||||||
Allowance for loan losses | 2.73 | % | 2.96 | % | 3.00 | % | 2.37 | % | 1.73 | % | 1.60 | % | 2.29 | % | 2.73 | % | 2.96 | % | 3.00 | % | ||||||||||||||||||||
Reserve for unfunded commitments | 0.23 | % | 0.18 | % | 0.18 | % | 0.24 | % | 0.16 | % | 0.10 | % | 0.14 | % | 0.23 | % | 0.18 | % | 0.18 | % | ||||||||||||||||||||
|
|
|
|
|
|
|
|
|
| |||||||||||||||||||||||||||||||
Allowance for loan losses and reserve for unfunded commitments | 2.96 | % | 3.14 | % | 3.18 | % | 2.61 | % | 1.89 | % | 1.70 | % | 2.43 | % | 2.96 | % | 3.14 | % | 3.18 | % | ||||||||||||||||||||
|
|
|
|
|
|
|
|
|
| |||||||||||||||||||||||||||||||
Average total loans | $ | 1,552,540 | $ | 1,442,821 | $ | 1,464,606 | $ | 1,542,147 | $ | 1,549,014 | $ | 1,847,749 | $ | 1,610,725 | $ | 1,552,540 | $ | 1,442,821 | $ | 1,464,606 | ||||||||||||||||||||
Ratios: | ||||||||||||||||||||||||||||||||||||||||
Net charge-offs during period to average loans outstanding during period | 0.82 | % | 1.37 | % | 2.07 | % | 1.53 | % | 0.69 | % | (0.13 | )% | 0.23 | % | 0.82 | % | 1.37 | % | 2.07 | % | ||||||||||||||||||||
Provision for loan losses to average loans outstanding | 0.61 | % | 1.60 | % | 2.56 | % | 2.04 | % | 1.35 | % | (0.22 | )% | (0.04 | )% | 0.61 | % | 1.60 | % | 2.56 | % | ||||||||||||||||||||
Allowance for loan losses to loans at year end | 2.73 | % | 2.96 | % | 3.00 | % | 2.37 | % | 1.73 | % | 1.60 | % | 2.29 | % | 2.73 | % | 2.96 | % | 3.00 | % | ||||||||||||||||||||
44
Foreclosed Assets, Net of Allowance for Losses
The following tables detail the components and summarize the activity in foreclosed assets, net of allowances for losses for the years indicated (dollars in thousands):
| (dollars in thousands): | Balance at December 31, 2012 | New NPA | Advances/ Capitalized Costs | Sales | Valuation Adjustments | Transfers from Loans | Category Changes | Balance at December 31, 2011 | Balance at December 31, 2014 | New NPA | Advances/ Capitalized Costs | Sales | Valuation Adjustments | Transfers from Loans | Category Changes | Balance at 2013 | ||||||||||||||||||||||||||||||||||||||||||||||||
Noncovered: | ||||||||||||||||||||||||||||||||||||||||||||||||||||||||||||||||
Land & Construction | $ | 1,676 | — | — | $ | (3,549 | ) | $ | (587 | ) | $ | 778 | — | $ | 5,034 | $ | 1,974 | $ | 204 | — | $ | (603 | ) | $ | (50 | ) | $ | 1,845 | — | $ | 578 | |||||||||||||||||||||||||||||||||
Residential real estate | 1,742 | — | $ | 833 | (5,452 | ) | (336 | ) | 3,507 | — | 3,190 | 1,622 | 244 | $ | 462 | (2,621 | ) | (87 | ) | 1,680 | — | 1,944 | ||||||||||||||||||||||||||||||||||||||||||
Commercial real estate | 2,539 | — | (75 | ) | (5,775 | ) | (344 | ) | 3,689 | — | 5,044 | 853 | 247 | — | (4,167 | ) | (59 | ) | 1,766 | — | 3,066 | |||||||||||||||||||||||||||||||||||||||||||
|
|
|
|
|
|
|
|
|
|
|
|
|
|
|
| |||||||||||||||||||||||||||||||||||||||||||||||||
Total noncovered | 5,957 | — | 758 | (14,776 | ) | (1,267 | ) | 7,974 | — | 13,268 | 4,449 | 695 | 462 | (7,391 | ) | (196 | ) | 5,291 | — | 5,588 | ||||||||||||||||||||||||||||||||||||||||||||
|
|
|
|
|
|
|
|
|
|
|
|
|
|
|
| |||||||||||||||||||||||||||||||||||||||||||||||||
Covered: | ||||||||||||||||||||||||||||||||||||||||||||||||||||||||||||||||
Land & Construction | 712 | — | — | (779 | ) | (308 | ) | — | — | 1,799 | 445 | — | — | (217 | ) | (12 | ) | — | — | 674 | ||||||||||||||||||||||||||||||||||||||||||||
Residential real estate | — | — | — | (121 | ) | (59 | ) | — | — | 180 | — | — | — | — | — | — | — | — | ||||||||||||||||||||||||||||||||||||||||||||||
Commercial real estate | 829 | — | 225 | (795 | ) | (94 | ) | 408 | — | 1,085 | — | — | — | — | — | — | — | — | ||||||||||||||||||||||||||||||||||||||||||||||
|
|
|
|
|
|
|
|
|
|
|
|
|
|
|
| |||||||||||||||||||||||||||||||||||||||||||||||||
Total covered | 1,541 | — | 225 | (1,695 | ) | (461 | ) | 408 | — | 3,064 | 445 | — | — | (217 | ) | (12 | ) | — | — | 674 | ||||||||||||||||||||||||||||||||||||||||||||
|
|
|
|
|
|
|
|
|
|
|
|
|
|
|
| |||||||||||||||||||||||||||||||||||||||||||||||||
Total foreclosed assets | $ | 7,498 | — | $ | 983 | $ | (16,471 | ) | $ | (1,728 | ) | $ | 8,382 | — | $ | 16,332 | $ | 4,894 | $ | 695 | $ | 462 | $ | (7,608 | ) | $ | (208 | ) | $ | 5,291 | — | $ | 6,262 | |||||||||||||||||||||||||||||||
|
|
|
|
|
|
|
|
|
|
|
|
|
|
|
| |||||||||||||||||||||||||||||||||||||||||||||||||
| (dollars in thousands): | Balance at December 31, 2011 | New NPA | Advances/ Capitalized Costs | Sales | Valuation Adjustments | Transfers from Loans | Category Changes | Balance at December 31, 2010 | Balance at December 31, 2013 | New NPA | Advances/ Capitalized Costs | Sales | Valuation Adjustments | Transfers from Loans | Category Changes | Balance at December 31, 2012 | ||||||||||||||||||||||||||||||||||||||||||||||||
Noncovered: | ||||||||||||||||||||||||||||||||||||||||||||||||||||||||||||||||
Land & Construction | $ | 5,034 | $ | 4,027 | — | $ | (735 | ) | $ | (802 | ) | $ | 333 | — | $ | 2,211 | $ | 578 | — | — | $ | (1,107 | ) | $ | (70 | ) | $ | 79 | — | $ | 1,676 | |||||||||||||||||||||||||||||||||
Residential real estate | 3,190 | 442 | — | (3,816 | ) | (318 | ) | 4,433 | — | 2,449 | 1,944 | — | $ | 480 | (2,853 | ) | (101 | ) | 2,676 | — | 1,742 | |||||||||||||||||||||||||||||||||||||||||||
Commercial real estate | 5,044 | 3,943 | — | (1,243 | ) | (139 | ) | 2,143 | — | 340 | 3,066 | — | — | (7,032 | ) | (430 | ) | 7,989 | — | 2,539 | ||||||||||||||||||||||||||||||||||||||||||||
|
|
|
|
|
|
|
|
|
|
|
|
|
|
|
| |||||||||||||||||||||||||||||||||||||||||||||||||
Total noncovered | 13,268 | 8,412 | — | (5,794 | ) | (1,259 | ) | 6,909 | — | 5,000 | 5,588 | — | 480 | (10,992 | ) | (601 | ) | 10,744 | — | 5,957 | ||||||||||||||||||||||||||||||||||||||||||||
|
|
|
|
|
|
|
|
|
|
|
|
|
|
|
| |||||||||||||||||||||||||||||||||||||||||||||||||
Covered: | ||||||||||||||||||||||||||||||||||||||||||||||||||||||||||||||||
Land & Construction | 1,799 | — | 9 | (917 | ) | (334 | ) | 25 | — | 3,016 | 674 | — | — | (267 | ) | — | 229 | — | 712 | |||||||||||||||||||||||||||||||||||||||||||||
Residential real estate | 180 | — | — | — | (6 | ) | — | — | 186 | — | — | — | — | — | — | — | — | |||||||||||||||||||||||||||||||||||||||||||||||
Commercial real estate | 1,085 | — | — | (241 | ) | (385 | ) | — | — | 1,711 | — | — | — | (1,012 | ) | (81 | ) | 264 | — | 829 | ||||||||||||||||||||||||||||||||||||||||||||
|
|
|
|
|
|
|
|
|
|
|
|
|
|
|
| |||||||||||||||||||||||||||||||||||||||||||||||||
Total covered | 3,064 | — | 9 | (1,158 | ) | (725 | ) | 25 | — | 4,913 | 674 | — | — | (1,279 | ) | (81 | ) | 493 | — | 1,541 | ||||||||||||||||||||||||||||||||||||||||||||
|
|
|
|
|
|
|
|
|
|
|
|
|
|
|
| |||||||||||||||||||||||||||||||||||||||||||||||||
Total foreclosed assets | $ | 16,332 | $ | 8,412 | $ | 9 | $ | (6,952 | ) | $ | (1,984 | ) | $ | 6,934 | — | $ | 9,913 | $ | 6,262 | — | $ | 480 | $ | (12,271 | ) | $ | (682 | ) | $ | 11,237 | — | $ | 7,498 | |||||||||||||||||||||||||||||||
|
|
|
|
|
|
|
|
|
|
|
|
|
|
|
| |||||||||||||||||||||||||||||||||||||||||||||||||
Premises and Equipment
Premises and equipment were comprised of:
| December 31, 2012 | December 31, 2011 | December 31, 2014 | December 31, 2013 | |||||||||||||
| (In thousands) | (In thousands) | |||||||||||||||
Land & land improvements | $ | 5,929 | $ | 4,400 | $ | 8,933 | $ | 5,975 | ||||||||
Buildings | 23,090 | 20,251 | 39,638 | 30,103 | ||||||||||||
Furniture and equipment | 25,877 | 24,291 | 28,446 | 27,881 | ||||||||||||
|
|
|
| |||||||||||||
| 54,896 | 48,942 | 77,017 | 63,959 | |||||||||||||
Less: Accumulated depreciation | (32,101 | ) | (30,241 | ) | (33,570 | ) | (32,397 | ) | ||||||||
|
|
|
| |||||||||||||
| 22,795 | 18,701 | 43,447 | 31,562 | |||||||||||||
Construction in progress | 4,190 | 1,192 | 46 | 50 | ||||||||||||
|
|
|
| |||||||||||||
Total premises and equipment | $ | 26,985 | $ | 19,893 | $ | 43,493 | $ | 31,612 | ||||||||
|
|
|
| |||||||||||||
During the year ended December 31, 2012,2014, premises and equipment increased $7,092,000$11,881,000 due to purchases of $10,792,000,$16,841,000, that were partially offset by depreciation of $3,250,000$4,615,000 and disposals of premises and equipment with net book value of $450,000.$345,000. Included in the $10,792,000$16,841,000 of purchases during the year ended December 31, 20122014 is $4,408,000$11,936,000 related to the Company’s new campus and operations center in Chico, CA. Asacquisition of December 31, 2012 the campus and operations center had a cost basis, included in construction in progress, as follows: land & land improvements $427,000, building $4,987,000, and furniture and equipment $186,000. Upon its estimated completion in the second quarter of 2013, the campus and operations center is expected to have an approximate cost basis as follows: land & land improvements $427,000, building $6,816,000, and furniture and equipment $2,075,000.
Intangible Assets
Intangible assets at December 31, 20112014 and 20102013 were comprised of the following:
| December 31, | December 31, | |||||||||||||||
| 2012 | 2011 | 2014 | 2013 | |||||||||||||
| (dollars in thousands) | (In thousands) | |||||||||||||||
Core-deposit intangible | $ | 1,092 | $ | 1,301 | $ | 7,051 | $ | 883 | ||||||||
Goodwill | 15,519 | 15,519 | 63,462 | 15,519 | ||||||||||||
|
|
|
| |||||||||||||
Total intangible assets | $ | 16,611 | $ | 16,820 | $ | 70,513 | $ | 16,402 | ||||||||
|
|
|
| |||||||||||||
45
The core-deposit intangible assetsasset resulted from the Bank’s acquisition of North Valley Bancorp in 2014, Citizens in 2011, and Granite in 2010,2010. The goodwill intangible asset includes $47,943,000 from the North Valley Bancorp acquisition in 2014, and the 2003 acquisition of North State National Bank. The core-deposit intangible related to$15,519,000 from the North State National Bank acquisition became fully amortized in 2011. The goodwill intangible asset resulted from the North State National Bank acquisition.2003 . Amortization of core deposit intangible assets amounting to $446,000, $209,000, $177,000, and $307,000$209,000 was recorded in 2012, 2011,2014, 2013, and 2010,2012, respectively.
Deposits
Deposits at December 31, 20122014 increased $99,166,000 (4.5%$969,940,000 (40.2%) over the 20112013 year-end balances to $2,289,702,000. All$3,380,423,000. Contributing to the $969,940,000 increase in deposits during the year ended December 31, 2014 is $801,956,000 of deposits acquired on October 3, 2014 through the acquisition of North Valley Bancorp. Excluding the deposits acquired from North Valley Bancorp, all categories of deposits were up in 2012 with the exception of money market accounts and time certificates. Included in the December 31, 2012 certificate of deposit balances is $5,000,000 from the State of California.
Deposits at December 31, 2011 increased $338,363,000 (18.3%) over the 2010 year-end balances to $2,190,536,000. All categories of deposits were up in 20112014 except time certificates. Included in the December 31, 20112014 certificate of deposit balancesbalance is $5,000,000 from the State of California. The Bank participates in a deposit program offered by the State of California whereby the State may make deposits at the Bank’s request subject to collateral and creditworthiness constraints. The negotiated rates on these State deposits are generally more favorable than other wholesale funding sources available to the Bank.
Deposits at December 31, 2013 increased $120,781,000 (5.3%) over the 2012 year-end balances to $2,410,483,000. All categories of deposits were up in 2013 except time certificates. Included in the December 31, 2013 certificate of deposit balance is $5,000,000 from the State of California.
Long-Term Debt
See Note 16 to the consolidated financial statements at Item 8 of this report for information about the Company’s other borrowings, including long-term debt.
Junior Subordinated Debt
See Note 17 to the consolidated financial statements at Item 8 of this report for information about the Company’s junior subordinated debt.
Equity
See Note 19 and Note 29 in the consolidated financial statements at Item 8 of this report for a discussion of shareholders’ equity and regulatory capital, respectively. Management believes that the Company’s capital is adequate to support anticipated growth, meet the cash dividend requirements of the Company and meet the future risk-based capital requirements of the Bank and the Company.
Market Risk Management
Overview.The goal for managing the assets and liabilities of the Bank is to maximize shareholder value and earnings while maintaining a high quality balance sheet without exposing the Bank to undue interest rate risk. The Board of Directors has overall responsibility for the Company’s interest rate risk management policies. The Bank has an Asset and Liability Management Committee (ALCO) which establishes and monitors guidelines to control the sensitivity of earnings to changes in interest rates.
Asset/Liability Management. Activities involved in asset/liability management include but are not limited to lending, accepting and placing deposits, investing in securities and issuing debt. Interest rate risk is the primary market risk associated with asset/liability management. Sensitivity of earnings to interest rate changes arises when yields on assets change in a different time period or in a different amount from that of interest costs on liabilities. To mitigate interest rate risk, the structure of the balance sheet is managed with the goal that movements of interest rates on assets and liabilities are correlated and contribute to earnings even in periods of volatile interest rates. The asset/liability management policy sets limits on the acceptable amount of variance in net interest margin and market value of equity under changing interest environments. Market value of equity is the net present value of estimated cash flows from the Bank’s assets, liabilities and off-balance sheet items. The Bank uses simulation models to forecast net interest margin and market value of equity.
Simulation of net interest margin and market value of equity under various interest rate scenarios is the primary tool used to measure interest rate risk. Using computer-modeling techniques, the Bank is able to estimate the potential impact of changing interest rates on net interest margin and market value of equity. A balance sheet forecast is prepared using inputs of actual loan, securities and interest-bearing liability (i.e. deposits/borrowings) positions as the beginning base.
In the simulation of net interest income, the forecast balance sheet is processed against various interest rate scenarios. These various interest rate scenarios include a flat rate scenario, which assumes interest rates are unchanged in the future, and rate ramp scenarios including -100, +100, and +200 basis points around the flat scenario. These ramp scenarios assume that interest rates increase or decrease evenly (in a “ramp” fashion) over a twelve-month period and remain at the new levels beyond twelve months.
46
The following table summarizes the projected effect on net interest income and net income due to changing interest rates as measured against a flat rate (no interest rate change) scenario over the succeeding twelve month period. The simulation results shown below assume no changes in the structure of the Company’s balance sheet over the twelve months being measured (a “flat” balance sheet scenario), and that deposit rates will track general interest rate changes by approximately 50%:
Interest Rate Risk Simulation of Net Interest Income and Net Income as of December 31, 20122014
| Change in Interest | Estimated Change in Net Interest Income (NII) | |
| Rates (Basis Points) | (as % of “flat” NII) | |
+200 (ramp) | ||
+100 (ramp) | ||
+ 0 (flat) | — | |
-100 (ramp) |
In the simulation of market value of equity, the forecast balance sheet is processed against various interest rate scenarios. These various interest rate scenarios include a flat rate scenario, which assumes interest rates are unchanged in the future, and rate shock scenarios including -100, +100, and +200 basis points around the flat scenario. These rate shock scenarios assume that interest rates increase or decrease immediately (in a “shock” fashion) and remain at the new level in the future.
The following table summarizes the effect on market value of equity due to changing interest rates as measured against a flat rate (no change) scenario:
Interest Rate Risk Simulation of Market Value of Equity as of December 31, 20122014
| Change in Interest | Estimated Change in Market Value of Equity (MVE) | |
| Rates (Basis Points) | (as % of “flat” MVE) | |
+200 (shock) | ||
+100 (shock) | ||
+ 0 (flat) | — | |
-100 (shock) |
These results indicate that given a “flat” balance sheet scenario, and if deposit rates track general interest rate changes by approximately 50%, the Company’s balance sheet is neutral toslightly liability sensitive over a twelve month time horizon for rates up, and slightly asset sensitive over a twelve month time horizon. “Neutral sensitivity”horizon for rates down. “Liability sensitive” implies that net interest income does not changedecreases when interest rates change.rise, and increase when interest rates decrease. “Asset sensitive” implies that net interest income increases when interest rates rise, and decrease when interest rates decrease. “Neutral sensitivity” implies that net interest income does not change when interest rates change. The asset liability management policy limits aggregate market risk, as measured in this fashion, to an acceptable level within the context of risk-return trade-offs.
The simulation results noted above do not incorporate any management actions that might moderate the negative consequences of interest rate deviations. In addition, the simulation results noted above contain various assumptions such as a flat balance sheet, and the rate that deposit interest rates change as general interest rates change. Therefore, they do not reflect likely actual results, but serve as estimates of interest rate risk.
As with any method of measuring interest rate risk, certain shortcomings are inherent in the method of analysis presented in the preceding tables. For example, although certain of the Bank’sCompany’s assets and liabilities may have similar maturities or repricing time frames, they may react in different degrees to changes in market interest rates. In addition, the interest rates on certain of the Bank’sCompany’s asset and liability categories may precede, or lag behind, changes in market interest rates. Also, the actual rates of prepayments on loans and investments could vary significantly from the assumptions utilized in deriving the results as presented in the preceding tables. Further, a change in U.S. Treasury rates accompanied by a change in the shape of the treasury yield curve could result in different estimations from those presented herein. Accordingly, the results in the preceding tables should not be relied upon as indicative of actual results in the event of changing market interest rates. Additionally, the resulting estimates of changes in market value of equity are not intended to represent, and should not be construed to represent, estimates of changes in the underlying value of the Bank.Company.
Interest rate sensitivity is a function of the repricing characteristics of the Bank’sCompany’s portfolio of assets and liabilities. One aspect of these repricing characteristics is the time frame within which the interest-bearing assets and liabilities are subject to change in interest rates either at replacement, repricing or maturity. An analysis of the repricing time frames of interest-bearing assets and liabilities is sometimes called a “gap” analysis because it shows the gap between assets and liabilities repricing or maturing in each of a number of periods. Another aspect of these repricing characteristics is the relative
47
magnitude of the repricing for each category of interest earning asset and interest-bearing liability given various changes in market interest rates. Gap analysis gives no indication of the relative magnitude of repricing given various changes in interest rates. Interest rate sensitivity management focuses on the maturity of assets and liabilities and their repricing during periods of changes in market interest rates. Interest rate sensitivity gaps are measured as the difference between the volumes of assets and liabilities in the Bank’sCompany’s current portfolio that are subject to repricing at various time horizons.
The following interest rate sensitivity table shows the Bank’sCompany’s repricing gaps as of December 31, 2012.2014. In this table transaction deposits, which may be repriced at will by the Bank,Company, have been included in the less than 3-month category. The inclusion of all of the transaction deposits in the less than 3-month repricing category causes the BankCompany to appear liability sensitive. Because the BankCompany may reprice its transaction deposits at will, transaction deposits may or may not reprice immediately with changes in interest rates.
Due to the limitations of gap analysis, as described above, the BankCompany does not actively use gap analysis in managing interest rate risk. Instead, the BankCompany relies on the more sophisticated interest rate risk simulation model described above as its primary tool in measuring and managing interest rate risk.
Interest Rate Sensitivity – December 31, 2012
Interest Rate Sensitivity – December 31, 2014 (dollars in thousands) | Repricing within: | |||||||||||||||||||
| Less than 3 months | 3 - 6 months | 6 - 12 months | 1 - 5 years | Over 5 years | ||||||||||||||||
Interest-earning assets: | ||||||||||||||||||||
Cash at Federal Reserve and other banks | $ | 517,578 | — | — | — | — | ||||||||||||||
Securities | 25,530 | $ | 27,036 | $ | 52,398 | $ | 326,087 | $ | 328,580 | |||||||||||
Loans | 558,341 | 118,973 | 207,847 | 1,154,392 | 242,970 | |||||||||||||||
|
|
|
|
|
|
|
|
|
| |||||||||||
Total interest-earning assets | 1,101,449 | 146,009 | 260,245 | 1,480,479 | $ | 571,550 | ||||||||||||||
|
|
|
|
|
|
|
|
|
| |||||||||||
Interest-bearing liabilities | ||||||||||||||||||||
Transaction deposits | 1,938,511 | — | — | — | — | |||||||||||||||
Time | 119,271 | 75,800 | 87,606 | 75,335 | — | |||||||||||||||
Other borrowings | 9,276 | — | — | — | — | |||||||||||||||
Junior subordinated debt | 56,272 | — | — | — | — | |||||||||||||||
|
|
|
|
|
|
|
|
|
| |||||||||||
Total interest-bearing liabilities | $ | 2,123,330 | $ | 75,800 | $ | 87,606 | $ | 75,335 | — | |||||||||||
|
|
|
|
|
|
|
|
|
| |||||||||||
Interest sensitivity gap | $ | (1,021,881 | ) | $ | 70,209 | $ | 172,639 | $ | 1,405,144 | $ | 571,550 | |||||||||
Cumulative sensitivity gap | $ | (1,021,881 | ) | $ | (951,672 | ) | $ | (779,033 | ) | $ | 626,111 | $ | 1,197,661 | |||||||
As a percentage of earning assets: | ||||||||||||||||||||
Interest sensitivity gap | (28.7 | %) | 2.0 | % | 4.8 | % | 39.5 | % | 16.0 | % | ||||||||||
Cumulative sensitivity gap | (28.7 | %) | (26.7 | %) | (21.9 | %) | 17.6 | % | 33.6 | % | ||||||||||
| Repricing within: | ||||||||||||||||||||
| (dollars in thousands) | Less than 3 months | 3 - 6 months | 6 - 12 months | 1 - 5 years | Over 5 years | |||||||||||||||
Interest-earning assets: | ||||||||||||||||||||
Cash at Federal Reserve and other banks | $ | 667,813 | — | — | — | — | ||||||||||||||
Securities | 17,033 | $ | 14,837 | $ | 27,361 | $ | 76,088 | $ | 27,708 | |||||||||||
Loans | 504,818 | 86,607 | 139,620 | 675,299 | 158,479 | |||||||||||||||
|
|
|
|
|
|
|
|
|
| |||||||||||
Total interest-earning assets | 1,189,664 | 101,444 | 166,981 | 751,387 | $ | 186,187 | ||||||||||||||
|
|
|
|
|
|
|
|
|
| |||||||||||
Interest-bearing liabilities | ||||||||||||||||||||
Transaction deposits | 1,266,389 | — | — | — | — | |||||||||||||||
Time | 118,426 | 69,687 | 70,594 | 79,773 | — | |||||||||||||||
Other borrowings | 9,197 | — | — | — | — | |||||||||||||||
Junior subordinated debt | 41,238 | — | — | — | — | |||||||||||||||
|
|
|
|
|
|
|
|
|
| |||||||||||
Total interest-bearing liabilities | $ | 1,435,250 | $ | 69,687 | $ | 70,594 | $ | 79,773 | — | |||||||||||
|
|
|
|
|
|
|
|
|
| |||||||||||
Interest sensitivity gap | $ | (245,586 | ) | $ | 31,757 | $ | 96,387 | $ | 671,614 | $ | 186,187 | |||||||||
Cumulative sensitivity gap | $ | (245,586 | ) | $ | (213,829 | ) | $ | (117,442 | ) | $ | 554,172 | $ | 740,359 | |||||||
As a percentage of earning assets: | ||||||||||||||||||||
Interest sensitivity gap | (10.3 | %) | 1.3 | % | 4.0 | % | 28.0 | % | 7.8 | % | ||||||||||
Cumulative sensitivity gap | (10.3 | %) | (8.9 | %) | (4.9 | %) | 23.1 | % | 30.9 | % | ||||||||||
Liquidity
Liquidity refers to the Bank’sCompany’s ability to provide funds at an acceptable cost to meet loan demand and deposit withdrawals, as well as contingency plans to meet unanticipated funding needs or loss of funding sources. These objectives can be met from either the asset or liability side of the balance sheet. Asset liquidity sources consist of the repayments and maturities of loans, selling of loans, short-term money market investments, maturities of securities and sales of securities from the available-for-sale portfolio. These activities are generally summarized as investing activities in the Consolidated Statement of Cash Flows. Net cash providedused by investing activities totaled approximately $24,823,000$178,724,000 in 2012. A net decrease2014. Net increases in investment and loan balances used $210,789,000 and proceeds from$114,095,000 of cash, respectively. The Company acquired $141,405,000 of cash through the saleacquisition of other real estate owned were the major sourcesNorth Valley Bancorp on October 3, 2014, and this is classified as an investing source of funds in this category.cash.
Liquidity may also be generated from liabilities through deposit growth and borrowings. These activities are included under financing activities in the Consolidated Statement of Cash Flows. In 2012,2014, financing activities provide funds totaling $30,315,000$163,667,000 due mainly to a $99,166,000$167,984,000 increase in deposit balances.balances, excluding $801,956,000 of deposits from the North Valley Bancorp acquisition. Dividends paid and a decrease in short-term other borrowings used $5,757,000 and $63,344,000$7,807,000 of funds, respectively.cash during 2014. The Bank also had available correspondent banking lines of credit totaling $5,000,000$15,000,000 at December 31, 2012.2014. In addition, at December 31, 2012,2014, the Company had loans and securities available to pledge towards future borrowings from the Federal Home Loan Bank and the Federal Reserve Bank of up to $507,404,000$865,466,000 and $88,050,000,$138,545,000, respectively. As of December 31, 2012,2014, the Company had $9,197,000$9,276,000 of other borrowings as described in Note 16 of the consolidated financial statements of the Company and the related notes at Item 8 of this report. While these sources are expected to continue to provide significant amounts of funds in the future, their mix, as well as the possible use of other sources, will depend on future economic and market conditions. Liquidity is also provided or used through the results of operating activities. In 2012,2014, operating activities provided cash of $56,486,000.$27,417,000.
The Bank classifies its entireCompany’s investment portfolio assecurities available for sale (AFS). The AFS securities plus cash and cash equivalents in excess of reserve requirements totaled $880,332,000$636,317,000 at December 31, 2012,2014, which was 33.7%16.2% of total assets at that time. This was updown from $846,355,000$664,656,000 and 33.1%24.2% at the end of 2011.2013.
It is anticipated that loan
48
Loan demand may remain weak during 2013, although such demand2015 will be dictated by economic and competitive conditions. The Company aggressively solicits non-interest bearing demand deposits and money market checking deposits, which are the least sensitive to interest rates. The growth of deposit balances is subject to heightened competition, the success of the Company’s sales efforts, delivery of superior customer service and market conditions. The reduction in the federal funds rate and various Federal Reserve interest rate manipulation efforts have resulted in historic low short-term and long-term interest rates, which could impact deposit volumes in the future. Depending on economic conditions, interest rate levels, and a variety of other conditions, deposit growth may be used to fund loans, to reduce short-term borrowings or purchase investment securities. However, due to concerns such as uncertainty in the general economic environment, competition and political uncertainty, loan demand and levels of customer deposits are not certain.
The principal cash requirements of the Company are dividends on common stock when declared. The Company is dependent upon the payment of cash dividends by the Bank to service its commitments. Shareholder dividends are expected to continue subject to the Board’s discretion and continuing evaluation of capital levels, earnings, asset quality and other factors. The Company expects that the cash dividends paid by the Bank to the Company will be sufficient to meet this payment schedule. Dividends from the Bank are subject to certain regulatory restrictions.
The maturity distribution of certificates of deposit in denominations of $100,000 or more is set forth in the following table. These deposits are generally more rate sensitive than other deposits and, therefore, are more likely to be withdrawn to obtain higher yields elsewhere if available. The Bank participates in a program wherein the State of California places time deposits with the Bank at the Bank’s option. At December 31, 2012, 20112014, 2013 and 2010,2012, the Bank had $5,000,000, $5,000,000 and $5,000,000, respectively, of these State deposits.
Certificates of Deposit in Denominations of $100,000 or More
| Amounts as of December 31, | ||||||||||||
| (dollars in thousands) | 2012 | 2011 | 2010 | |||||||||
Time remaining until maturity: | ||||||||||||
Less than 3 months | $ | 73,180 | $ | 82,497 | $ | 91,208 | ||||||
3 months to 6 months | 32,384 | 49,613 | 49,976 | |||||||||
6 months to 12 months | 34,311 | 46,446 | 54,316 | |||||||||
More than 12 months | 40,320 | 41,818 | 40,491 | |||||||||
|
|
|
|
|
| |||||||
Total | $ | 180,195 | $ | 220,374 | $ | 235,991 | ||||||
|
|
|
|
|
| |||||||
Time remaining until maturity: Less than 3 months 3 months to 6 months 6 months to 12 months More than 12 months Total Amounts as of December 31, (dollars in thousands) 2014 2013 2012 $ 66,199 $ 61,205 $ 73,180 36,166 39,580 32,384 41,787 16,772 34,311 36,488 40,090 40,320 $ 180,640 $ 157,647 $ 180,195
Loan demand also affects the Bank’sCompany’s liquidity position. The following table presents the maturities of loans, net of deferred loan costs, at December 31, 2012:2014:
| Within One Year | After One But Within 5 Years | After 5 Years | Total | Within One Year | After One But Within 5 Years | After 5 Years | Total | |||||||||||||||||||||||||
| (dollars in thousands) | (dollars in thousands) | |||||||||||||||||||||||||||||||
Loans with predetermined interest rates: | ||||||||||||||||||||||||||||||||
Real estate mortgage | $ | 50,582 | $ | 115,439 | $ | 158,386 | $ | 324,407 | $ | 45,864 | $ | 142,106 | $ | 763,681 | $ | 951,651 | ||||||||||||||||
Consumer | 13,304 | 31,418 | 30,143 | 74,865 | 4,834 | 34,862 | 217,511 | 257,207 | ||||||||||||||||||||||||
Commercial | 11,499 | 26,735 | 2,388 | 40,622 | 35,136 | 38,142 | 18,433 | 91,711 | ||||||||||||||||||||||||
Real estate construction | 7,790 | 2,539 | 8,722 | 19,051 | 17,394 | 22,674 | 4,693 | 44,761 | ||||||||||||||||||||||||
|
|
|
|
|
|
|
| |||||||||||||||||||||||||
| $ | 83,175 | $ | 176,131 | $ | 199,639 | $ | 458,945 | 103,228 | 237,784 | 1,004,318 | 1,345,330 | |||||||||||||||||||||
|
|
|
|
|
|
|
| |||||||||||||||||||||||||
Loans with floating interest rates: | ||||||||||||||||||||||||||||||||
Real estate mortgage | $ | 47,686 | $ | 173,515 | $ | 464,522 | $ | 685,723 | 28,618 | 109,346 | 525,744 | 663,708 | ||||||||||||||||||||
Consumer | 1,627 | 7,534 | 302,085 | 311,246 | 2,155 | 19,103 | 138,619 | 159,877 | ||||||||||||||||||||||||
Commercial | 66,173 | 22,170 | 6,563 | 94,906 | 35,665 | 33,121 | 14,448 | 83,234 | ||||||||||||||||||||||||
Real estate construction | 3,031 | 7,558 | 3,414 | 14,003 | 5,717 | 4,367 | 20,291 | 30,375 | ||||||||||||||||||||||||
|
|
|
|
|
|
|
| |||||||||||||||||||||||||
| $ | 118,517 | $ | 210,777 | $ | 776,584 | $ | 1,105,878 | 72,155 | 165,937 | 699,102 | 937,194 | |||||||||||||||||||||
|
|
|
|
|
|
|
| |||||||||||||||||||||||||
Total loans | $ | 201,692 | $ | 386,908 | $ | 976,223 | $ | 1,564,823 | $ | 175,383 | $ | 403,721 | $ | 1,703,420 | $ | 2,282,524 | ||||||||||||||||
|
|
|
|
|
|
|
| |||||||||||||||||||||||||
49
The maturity distribution and yields of the investment portfolio at December 31, 20122014 is presented in the following table. The timing of the maturities indicated in the table below is based on final contractual maturities. Most mortgage-backed securities return principal throughout their contractual lives. As such, the weighted average life of mortgage-backed securities based on outstanding principal balance is usually significantly shorter than the final contractual maturity indicated below. Yields on tax exempt securities are shown on a tax equivalent basis. At December 31, 2012, the Bank had no held-to-maturity securities.
| Within One Year | After One Year but Through Five Years | After Five Years but Through Ten Years | After Ten Years | Total | Within One Year | After One Year but Through Five Years | After Five Years but Through Ten Years | After Ten Years | Total | |||||||||||||||||||||||||||||||||||||||||||||||||||||||||||||||||||||||
| Amount | Yield | Amount | Yield | Amount | Yield | Amount | Yield | Amount | Yield | AmountYield | AmountYield | AmountYield | AmountYield | AmountYield | ||||||||||||||||||||||||||||||||||||||||||||||||||||||||||||||||||
| Securities Available-for-Sale | (dollars in thousands) | |||||||||||||||||||||||||||||||||||||||||||||||||||||||||||||||||||||||||||||||
| (dollars in thousands) | ||||||||||||||||||||||||||||||||||||||||||||||||||||||||||||||||||||||||||||||||
Securities Available for Sale | ||||||||||||||||||||||||||||||||||||||||||||||||||||||||||||||||||||||||||||||||
Obligations of US government corporations and agencies | $ | 1,046 | 4.55 | % | $ | 4,117 | 4.33 | % | $ | 44,843 | 2.75 | % | $ | 101,695 | 3.94 | % | $ | 151,701 | 3.60 | % | $ | 34 | 2.97 | % | $ | 812 | 4.61 | % | $ | 29,464 | 2.98 | % | $ | 44,810 | 3.70 | % | $ | 75,120 | 3.42 | % | ||||||||||||||||||||||||||||||||||||||||
Obligations of states and political subdivisions | 2,236 | 7.66 | % | — | — | 5,613 | 7.10 | % | 1,572 | 6.70 | % | 9,421 | 7.16 | % | — | — | 322 | 6.32 | % | 2,853 | 6.97 | % | — | — | 3,175 | 6.90 | % | |||||||||||||||||||||||||||||||||||||||||||||||||||||
Corporate bonds | — | — | 1,905 | 1.84 | % | — | — | — | — | 1,905 | 1.84 | % | 1,908 | 1.78 | % | — | — | — | — | — | — | 1,908 | 1.78 | % | ||||||||||||||||||||||||||||||||||||||||||||||||||||||||
Marketable equity securities | — | — | — | — | — | — | 3,002 | — | 3,002 | — | ||||||||||||||||||||||||||||||||||||||||||||||||||||||||||||||||||||||
|
|
|
|
|
|
|
|
|
|
|
|
|
|
|
|
|
|
|
| |||||||||||||||||||||||||||||||||||||||||||||||||||||||||||||
Total securities available-for-sale | $ | 3,282 | 6.67 | % | $ | 6,022 | 3.52 | % | $ | 50,456 | 3.24 | % | $ | 103,267 | 3.98 | % | $ | 163,027 | 3.63 | % | ||||||||||||||||||||||||||||||||||||||||||||||||||||||||||||
Total securities available for sale | $ | 1,942 | 1.80 | % | $ | 1,134 | 5.11 | % | $ | 32,317 | 3.34 | % | $ | 47,812 | 3.46 | % | $ | 83,205 | 3.39 | % | ||||||||||||||||||||||||||||||||||||||||||||||||||||||||||||
|
|
|
|
|
|
|
|
|
|
|
|
|
|
|
|
|
|
|
| |||||||||||||||||||||||||||||||||||||||||||||||||||||||||||||
| Within One Year | After One Year but Through Five Years | After Five Years but Through Ten Years | After Ten Years | Total | ||||||||||||||||||||||||||||||||||||
| AmountYield | AmountYield | AmountYield | AmountYield | AmountYield | ||||||||||||||||||||||||||||||||||||
| (dollars in thousands) | ||||||||||||||||||||||||||||||||||||||||
Securities Held to Maturity | ||||||||||||||||||||||||||||||||||||||||
Obligations of US government corporations and agencies | — | — | — | — | — | — | $ | 660,836 | 2.71 | % | $ | 660,836 | 2.71 | % | ||||||||||||||||||||||||||
Obligations of states and political subdivisions | — | — | — | — | $ | 1,118 | 4.13 | % | 14,472 | 4.38 | % | 15,590 | 4.36 | % | ||||||||||||||||||||||||||
|
|
|
|
|
|
|
|
|
|
|
|
|
|
|
|
|
|
|
| |||||||||||||||||||||
Total securities held to maturity | — | — | — | — | $ | 1,118 | 4.13 | % | $ | 675,308 | 2.74 | % | $ | 676,426 | 2.75 | % | ||||||||||||||||||||||||
|
|
|
|
|
|
|
|
|
|
|
|
|
|
|
|
|
|
|
| |||||||||||||||||||||
Off-Balance Sheet Items
The Bank has certain ongoing commitments under operating and capital leases. See Note 18 of the financial statements at Item 8 of this report for the terms. These commitments do not significantly impact operating results. As of December 31, 20122014 commitments to extend credit and commitments related to the Bank’s deposit overdraft privilege product were the Bank’s only financial instruments with off-balance sheet risk. The Bank has not entered into any material contracts for financial derivative instruments such as futures, swaps, options, etc. Commitments to extend credit were $560,159,000$673,706,000 and $534,370,000$557,987,000 at December 31, 2012 and 2011,2014and 2013, respectively, and represent 35.8%29.5% of the total loans outstanding at year-end 20122014 versus 34.5%33.4% at December 31, 2011.2013. Commitments related to the Bank’s deposit overdraft privilege product totaled $69,675,000$101,060,000 and $61,623,000$68,932,000 at December 31, 20122014 and 2011,2013, respectively.
50
Certain Contractual Obligations
The following chart summarizes certain contractual obligations of the Company as of December 31, 2012:2014:
| (dollars in thousands) | Total | Less than one year | 1-3 years | 3-5 years | More than 5 years | |||||||||||||||
Other collateralized borrowings, fixed rate of 0.05% payable on January 2, 2013 | $ | 9,197 | $ | 9,197 | — | — | — | |||||||||||||
Junior subordinated debt(2) | 20,619 | — | — | — | 20,619 | |||||||||||||||
Junior subordinated debt(3) | 20,619 | — | — | — | 20,619 | |||||||||||||||
Operating lease obligations | 9,608 | 2,772 | 3,953 | 1,571 | 1,312 | |||||||||||||||
Deferred compensation(1) | 8,442 | 1,096 | 2,125 | 1,682 | 3,539 | |||||||||||||||
Supplemental retirement plans(1) | 3,450 | 472 | 772 | 690 | 1,516 | |||||||||||||||
Construction contract(4) | 4,154 | 4,154 | — | — | — | |||||||||||||||
|
|
|
|
|
|
|
|
|
| |||||||||||
Total contractual obligations | $ | 76,089 | $ | 17,691 | $ | 6,850 | $ | 3,943 | $ | 47,605 | ||||||||||
|
|
|
|
|
|
|
|
|
| |||||||||||
| (dollars in thousands) | Total | Less than one year | 1-3 years | 3-5 years | More than 5 years | |||||||||||||||
Time deposits | $ | 358,012 | $ | 282,629 | $ | 63,623 | $ | 11,757 | $ | 3 | ||||||||||
Other collateralized borrowings, fixed rate of 0.05% payable on January 2, 2015 | 9,276 | 9,276 | — | — | — | |||||||||||||||
Junior subordinated: | ||||||||||||||||||||
TriCo Trust I(1) | 20,619 | — | — | — | 20,619 | |||||||||||||||
TriCo Trust II(2) | 20,619 | — | — | — | 20,619 | |||||||||||||||
North Valley Trust II(3) | 6,186 | — | — | — | 6,186 | |||||||||||||||
North Valley Trust III(4) | 5,155 | — | — | — | 5,155 | |||||||||||||||
North Valley Trust IV(5) | 10,310 | — | — | — | 10,310 | |||||||||||||||
Operating lease obligations | 11,147 | 3,419 | 4,366 | 2,182 | 1,180 | |||||||||||||||
Deferred compensation(6) | 6,990 | 1,240 | 1,917 | 1,600 | 2,233 | |||||||||||||||
Supplemental retirement plans(6) | 8,750 | 1,145 | 2,037 | 1,849 | 3,719 | |||||||||||||||
|
|
|
|
|
|
|
|
|
| |||||||||||
Total contractual obligations | $ | 457,064 | $ | 297,709 | $ | 71,943 | $ | 17,388 | $ | 70,024 | ||||||||||
|
|
|
|
|
|
|
|
|
| |||||||||||
| (1) | Junior subordinated debt, adjustable rate of three-month LIBOR plus 3.05%, callable in whole or in part by the Company on a quarterly basis beginning October 7, 2008, matures October 7, 2033. |
| (2) | Junior subordinated debt, adjustable rate of three-month LIBOR plus 2.55%, callable in whole or in part by the Company on a quarterly basis beginning July 23, 2009, matures July 23, 2034. |
| (3) | Junior subordinated debt, adjustable rate of three-month LIBOR plus 3.25%, callable in whole or in part by the Company on a quarterly basis beginning April 24, 2008, matures April 24, 2033. |
| (4) | Junior subordinated debt, adjustable rate of three-month LIBOR plus 2.80%, callable in whole or in part by the Company on a quarterly basis beginning July 23, 2009, matures July 23, 2034. |
| (5) | Junior subordinated debt, adjustable rate of three-month LIBOR plus 1.33%, callable in whole or in part by the Company on a quarterly basis beginning March 15, 2011, matures March 15, 2036. |
| (6) | These amounts represent known certain payments to participants under the Company’s deferred compensation and supplemental retirement plans. See Note 25 in the financial statements at Item 8 of this report for additional information related to the Company’s deferred compensation and supplemental retirement plan liabilities. |
ITEM 7A. QUANTITATIVE AND QUALITATIVE DISCLOSURES ABOUT MARKET RISK
See “Market Risk Management” under Item 7 of this report which is incorporated herein.
ITEM 8. FINANCIAL8.FINANCIAL STATEMENTS AND SUPPLEMENTARY DATA
INDEX TO FINANCIAL STATEMENTS
| Page | ||||
Consolidated Balance Sheets as of December 31, | ||||
Management’s Report on Internal Control over Financial Reporting | ||||
Reports of Independent Registered Public Accounting | ||||
51
| At December 31, | At December 31, | |||||||||||||||
| 2012 | 2011 | 2014 | 2013 | |||||||||||||
| (in thousands, except share data) | (in thousands, except share data) | |||||||||||||||
Assets: | ||||||||||||||||
Cash and due from banks | $ | 81,086 | $ | 73,652 | $ | 93,150 | $ | 76,915 | ||||||||
Cash at Federal Reserve and other banks | 667,813 | 563,623 | 517,578 | 521,453 | ||||||||||||
|
|
|
| |||||||||||||
Cash and cash equivalents | 748,899 | 637,275 | 610,728 | 598,368 | ||||||||||||
Securities available-for-sale | 163,027 | 229,223 | ||||||||||||||
Investment securities: | ||||||||||||||||
Available for sale | 83,205 | 104,647 | ||||||||||||||
Held to maturity | 676,426 | 240,504 | ||||||||||||||
Restricted equity securities | 9,647 | 10,610 | 16,956 | 9,163 | ||||||||||||
Loans held for sale | 12,053 | 10,219 | 3,579 | 2,270 | ||||||||||||
Loans | 1,564,823 | 1,551,032 | 2,282,524 | 1,672,007 | ||||||||||||
Allowance for loan losses | (42,648 | ) | (45,914 | ) | (36,585 | ) | (38,245 | ) | ||||||||
|
|
|
| |||||||||||||
Total loans, net | 1,522,175 | 1,505,118 | 2,245,939 | 1,633,762 | ||||||||||||
Foreclosed assets, net | 7,498 | 16,332 | 4,894 | 6,262 | ||||||||||||
Premises and equipment, net | 26,985 | 19,893 | 43,493 | 31,612 | ||||||||||||
Cash value of life insurance | 50,582 | 50,403 | 92,337 | 52,309 | ||||||||||||
Accrued interest receivable | 6,636 | 7,312 | 9,275 | 6,516 | ||||||||||||
Goodwill | 15,519 | 15,519 | 63,462 | 15,519 | ||||||||||||
Other intangible assets, net | 1,092 | 1,301 | 7,051 | 883 | ||||||||||||
Mortgage servicing rights | 4,552 | 4,603 | 7,378 | 6,165 | ||||||||||||
Indemnification asset | 1,997 | 4,405 | ||||||||||||||
Other assets | 38,607 | 43,384 | 51,735 | 36,086 | ||||||||||||
|
|
|
| |||||||||||||
Total assets | $ | 2,609,269 | $ | 2,555,597 | $ | 3,916,458 | $ | 2,744,066 | ||||||||
|
| |||||||||||||||
|
| |||||||||||||||
Liabilities and Shareholders’ Equity: | ||||||||||||||||
Liabilities: | ||||||||||||||||
Deposits: | ||||||||||||||||
Noninterest-bearing demand | $ | 684,833 | $ | 541,276 | $ | 1,083,900 | $ | 789,458 | ||||||||
Interest-bearing | 1,604,869 | 1,649,260 | 2,296,523 | 1,621,025 | ||||||||||||
|
| |||||||||||||||
|
| |||||||||||||||
Total deposits | 2,289,702 | 2,190,536 | 3,380,423 | 2,410,483 | ||||||||||||
Accrued interest payable | 1,036 | 1,674 | 978 | 938 | ||||||||||||
Reserve for unfunded commitments | 3,615 | 2,740 | 2,145 | 2,415 | ||||||||||||
Other liabilities | 35,122 | 30,427 | 49,192 | 31,711 | ||||||||||||
Other borrowings | 9,197 | 72,541 | 9,276 | 6,335 | ||||||||||||
Junior subordinated debt | 41,238 | 41,238 | 56,272 | 41,238 | ||||||||||||
|
|
|
| |||||||||||||
Total liabilities | 2,379,910 | 2,339,156 | 3,498,286 | 2,493,120 | ||||||||||||
|
| |||||||||||||||
|
| |||||||||||||||
Commitments and contingencies (Note 18) | ||||||||||||||||
Shareholders’ equity: | ||||||||||||||||
Common stock, no par value: 50,000,000 shares authorized; issued and outstanding: | ||||||||||||||||
16,000,838 at December 31, 2012 | 85,561 | |||||||||||||||
15,978,958 at December 31, 2011 | 84,079 | |||||||||||||||
22,714,964 at December 31, 2014 | 244,318 | |||||||||||||||
16,076,662 at December 31, 2013 | 89,356 | |||||||||||||||
Retained earnings | 141,639 | 128,551 | 176,057 | 159,733 | ||||||||||||
Accumulated other comprehensive income, net of tax | 2,159 | 3,811 | (2,203 | ) | 1,857 | |||||||||||
|
|
|
| |||||||||||||
Total shareholders’ equity | 229,359 | 216,441 | 418,172 | 250,946 | ||||||||||||
|
| |||||||||||||||
|
| |||||||||||||||
Total liabilities and shareholders’ equity | $ | 2,609,269 | $ | 2,555,597 | $ | 3,916,458 | $ | 2,744,066 | ||||||||
|
|
|
| |||||||||||||
The accompanying notes are an integral part of these consolidated financial statements.
52
CONSOLIDATED STATEMENTS OF INCOME
| Years ended December 31, | Years ended December 31, | |||||||||||||||||||||||
| 2012 | 2011 | 2010 | 2014 | 2013 | 2012 | |||||||||||||||||||
| (in thousands, except per share data) | (in thousands, except per share data) | |||||||||||||||||||||||
Interest and dividend income: | ||||||||||||||||||||||||
Loans, including fees | $ | 100,496 | $ | 92,691 | $ | 93,073 | $ | 103,887 | $ | 97,548 | $ | 100,496 | ||||||||||||
Debt securities: | ||||||||||||||||||||||||
Taxable | 6,072 | 8,733 | 10,007 | 14,753 | 6,349 | 6,072 | ||||||||||||||||||
Tax exempt | 428 | 524 | 700 | 505 | 583 | 428 | ||||||||||||||||||
Dividends | 105 | 27 | 32 | 837 | 387 | 105 | ||||||||||||||||||
Interest bearing cash at | ||||||||||||||||||||||||
Federal Reserve and other banks | 1,615 | 1,007 | 760 | 1,133 | 1,693 | 1,615 | ||||||||||||||||||
|
|
|
|
|
| |||||||||||||||||||
Total interest and dividend income | 108,716 | 102,982 | 104,572 | 121,115 | 106,560 | 108,716 | ||||||||||||||||||
|
|
| ||||||||||||||||||||||
|
|
| ||||||||||||||||||||||
Interest expense: | ||||||||||||||||||||||||
Deposits | 4,416 | 6,559 | 10,447 | 3,274 | 3,445 | 4,416 | ||||||||||||||||||
Other borrowings | 1,604 | 2,420 | 2,412 | 4 | 4 | 1,604 | ||||||||||||||||||
Junior subordinated debt | 1,324 | 1,259 | 1,274 | 1,403 | 1,247 | 1,324 | ||||||||||||||||||
|
|
|
|
|
| |||||||||||||||||||
Total interest expense | 7,344 | 10,238 | 14,133 | 4,681 | 4,696 | 7,344 | ||||||||||||||||||
|
|
|
|
|
| |||||||||||||||||||
Net interest income | 101,372 | 92,744 | 90,439 | 116,434 | 101,864 | 101,372 | ||||||||||||||||||
Provision for loan losses | 9,423 | 23,060 | 37,458 | |||||||||||||||||||||
|
|
| ||||||||||||||||||||||
(Benefit from) provision for loan losses | (4,045 | ) | (715 | ) | 9,423 | |||||||||||||||||||
|
|
| ||||||||||||||||||||||
Net interest income after provision for loan losses | 91,949 | 69,684 | 52,981 | 120,479 | 102,579 | 91,949 | ||||||||||||||||||
|
|
| ||||||||||||||||||||||
|
|
| ||||||||||||||||||||||
Noninterest income: | ||||||||||||||||||||||||
Service charges and fees | 23,925 | 23,944 | 23,100 | 24,236 | 25,257 | 23,925 | ||||||||||||||||||
Gain on sale of loans | 6,810 | 3,037 | 3,647 | 2,032 | 5,602 | 6,810 | ||||||||||||||||||
Commissions on sale of non-deposit investment products | 3,209 | 2,105 | 1,209 | 2,995 | 2,983 | 3,209 | ||||||||||||||||||
Increase in cash value of life insurance | 1,820 | 1,885 | 1,847 | 1,953 | 1,727 | 1,820 | ||||||||||||||||||
Bargain purchase gain | — | 7,575 | 232 | |||||||||||||||||||||
Other | 2,216 | 4,267 | 2,660 | 3,300 | 1,260 | 2,216 | ||||||||||||||||||
|
|
|
|
|
| |||||||||||||||||||
Total noninterest income | 37,980 | 42,813 | 32,695 | 34,516 | 36,829 | 37,980 | ||||||||||||||||||
|
|
| ||||||||||||||||||||||
|
|
| ||||||||||||||||||||||
Noninterest expense: | ||||||||||||||||||||||||
Salaries and related benefits | 49,952 | 44,203 | 40,105 | 57,544 | 51,936 | 49,952 | ||||||||||||||||||
Other | 48,046 | 38,512 | 37,100 | 52,835 | 41,668 | 48,046 | ||||||||||||||||||
|
|
|
|
|
| |||||||||||||||||||
Total noninterest expense | 97,998 | 82,715 | 77,205 | 110,379 | 93,604 | 97,998 | ||||||||||||||||||
|
|
| ||||||||||||||||||||||
|
|
| ||||||||||||||||||||||
Income before income taxes | 31,931 | 29,782 | 8,471 | 44,616 | 45,804 | 31,931 | ||||||||||||||||||
|
|
|
|
|
| |||||||||||||||||||
Provision for income taxes | 12,937 | 11,192 | 2,466 | 18,508 | 18,405 | 12,937 | ||||||||||||||||||
|
|
|
|
|
| |||||||||||||||||||
Net income | $ | 18,994 | $ | 18,590 | $ | 6,005 | $ | 26,108 | $ | 27,399 | $ | 18,994 | ||||||||||||
|
|
| ||||||||||||||||||||||
|
|
| ||||||||||||||||||||||
Earnings per share: | ||||||||||||||||||||||||
Basic | $ | 1.19 | $ | 1.17 | $ | 0.38 | $ | 1.47 | $ | 1.71 | $ | 1.19 | ||||||||||||
Diluted | $ | 1.18 | $ | 1.16 | $ | 0.37 | $ | 1.46 | $ | 1.69 | $ | 1.18 | ||||||||||||
The accompanying notes are an integral part of these consolidated financial statements.
53
CONSOLIDATED STATEMENTS OF COMPREHENSIVE INCOME
| Years ended December 31, | Years ended December 31, | |||||||||||||||||||||||
| 2012 | 2011 | 2010 | 2014 | 2013 | 2012 | |||||||||||||||||||
| (in thousands, except per share data) | (in thousands, except per share data) | |||||||||||||||||||||||
Net income | $ | 18,994 | $ | 18,590 | $ | 6,005 | $ | 26,108 | $ | 27,399 | $ | 18,994 | ||||||||||||
Other comprehensive (loss) income, net of tax: | ||||||||||||||||||||||||
Unrealized holding (losses) gains onsecurities arising during the period | (1,216 | ) | 1,504 | (24 | ) | |||||||||||||||||||
Unrealized holding (losses) gains on securities arising during the period | (94 | ) | (2,452 | ) | (1,216 | ) | ||||||||||||||||||
Change in minimum pension liability | (2 | ) | 1,140 | (943 | ) | (4,114 | ) | 1,750 | (2 | ) | ||||||||||||||
Change in joint beneficiary agreement liability | (434 | ) | (143 | ) | (1 | ) | 148 | 400 | (434 | ) | ||||||||||||||
|
|
|
|
|
| |||||||||||||||||||
Other comprehensive (loss) income | (1,652 | ) | 2,501 | (968 | ) | (4,060 | ) | (302 | ) | (1,652 | ) | |||||||||||||
|
|
|
|
|
| |||||||||||||||||||
Comprehensive income | $ | 17,342 | $ | 21,091 | $ | 5,037 | $ | 22,048 | $ | 27,097 | $ | 17,342 | ||||||||||||
|
|
|
|
|
| |||||||||||||||||||
The accompanying notes are an integral part of these unaudited condensed consolidated financial statements.
CONSOLIDATED STATEMENTS OF CHANGES IN SHAREHOLDERS’ EQUITY
Years Ended December 31, 2011, 20102014, 2013 and 20092012
| Shares of Common Stock | Common Stock | Retained Earnings | Accumulated Other Comprehensive Income | Total | ||||||||||||||||||||||||||||||||||||
| (in thousands, except share data) | ||||||||||||||||||||||||||||||||||||||||
Balance at December 31, 2009 | 15,787,753 | $ | 79,508 | $ | 118,863 | $ | 2,278 | $ | 200,649 | |||||||||||||||||||||||||||||||
Net income | 6,005 | 6,005 | ||||||||||||||||||||||||||||||||||||||
Other comprehensive loss | (968 | ) | (968 | ) | ||||||||||||||||||||||||||||||||||||
Stock option vesting | 800 | 800 | ||||||||||||||||||||||||||||||||||||||
Stock options exercised | 146,403 | 1,229 | 1,229 | |||||||||||||||||||||||||||||||||||||
Tax benefit of stock options exercised | 390 | 390 | ||||||||||||||||||||||||||||||||||||||
Repurchase of common stock | (74,018 | ) | (373 | ) | (991 | ) | (1,364 | ) | ||||||||||||||||||||||||||||||||
Dividends paid ($0.40 per share) | (6,344 | ) | (6,344 | ) | ||||||||||||||||||||||||||||||||||||
|
|
|
|
| ||||||||||||||||||||||||||||||||||||
Balance at December 31, 2010 | 15,860,138 | $ | 81,554 | $ | 117,533 | $ | 1,310 | $ | 200,397 | |||||||||||||||||||||||||||||||
Net income | 18,590 | 18,590 | ||||||||||||||||||||||||||||||||||||||
Other comprehensive income | 2,501 | 2,501 | ||||||||||||||||||||||||||||||||||||||
Stock option vesting | 830 | 830 | ||||||||||||||||||||||||||||||||||||||
Stock option forfeiture | (114 | ) | (114 | ) | ||||||||||||||||||||||||||||||||||||
Stock options exercised | 296,250 | 2,428 | 2,428 | |||||||||||||||||||||||||||||||||||||
Tax benefit of stock options exercised | 296 | 296 | ||||||||||||||||||||||||||||||||||||||
Repurchase of common stock | (177,430 | ) | (915 | ) | (1,830 | ) | (2,745 | ) | ||||||||||||||||||||||||||||||||
Dividends paid ($0.36 per share) | (5,742 | ) | (5,742 | ) | ||||||||||||||||||||||||||||||||||||
|
|
|
|
| Shares of Common Stock | Common Stock | Retained Earnings | Accumulated Other Comprehensive Income | Total | |||||||||||||||||||||||||||||||
| (in thousands, except share data) | ||||||||||||||||||||||||||||||||||||||||
Balance at December 31, 2011 | 15,978,958 | $ | 84,079 | $ | 128,551 | $ | 3,811 | $ | 216,441 | 15,978,958 | $ | 84,079 | $ | 128,551 | $ | 3,811 | $ | 216,441 | ||||||||||||||||||||||
Net income | 18,994 | 18,994 | 18,994 | 18,994 | ||||||||||||||||||||||||||||||||||||
Other comprehensive loss | (1,652 | ) | (1,652 | ) | (1,652 | ) | (1,652 | ) | ||||||||||||||||||||||||||||||||
Stock option vesting | 1,083 | 1,083 | 1,083 | 1,083 | ||||||||||||||||||||||||||||||||||||
Stock options exercised | 36,000 | 430 | 430 | 36,000 | 430 | 430 | ||||||||||||||||||||||||||||||||||
Tax benefit of stock options exercised | 44 | 44 | 44 | 44 | ||||||||||||||||||||||||||||||||||||
Repurchase of common stock | (14,120 | ) | (75 | ) | (149 | ) | (224 | ) | (14,120 | ) | (75 | ) | (149 | ) | (224 | ) | ||||||||||||||||||||||||
Dividends paid ($0.36 per share) | (5,757 | ) | (5,757 | ) | ||||||||||||||||||||||||||||||||||||
|
|
|
|
| ||||||||||||||||||||||||||||||||||||
Dividends paid ($ 0.36 per share) | (5,757 | ) | (5,757 | ) | ||||||||||||||||||||||||||||||||||||
|
|
|
|
| ||||||||||||||||||||||||||||||||||||
Balance at December 31, 2012 | 16,000,838 | $ | 85,561 | $ | 141,639 | $ | 2,159 | $ | 229,359 | 16,000,838 | $ | 85,561 | $ | 141,639 | $ | 2,159 | $ | 229,359 | ||||||||||||||||||||||
Net income | 27,399 | 27,399 | ||||||||||||||||||||||||||||||||||||||
Other comprehensive loss | (302 | ) | (302 | ) | ||||||||||||||||||||||||||||||||||||
Stock option vesting | 1,151 | 1,151 | ||||||||||||||||||||||||||||||||||||||
Stock options forfeited | (22 | ) | (22 | ) | ||||||||||||||||||||||||||||||||||||
Stock options exercised | 248,765 | 3,240 | 3,240 | |||||||||||||||||||||||||||||||||||||
Tax benefit of stock options exercised | 356 | 356 | ||||||||||||||||||||||||||||||||||||||
Repurchase of common stock | (172,941 | ) | (930 | ) | (2,560 | ) | (3,490 | ) | ||||||||||||||||||||||||||||||||
Dividends paid ($ 0.42 per share) | (6,745 | ) | (6,745 | ) | ||||||||||||||||||||||||||||||||||||
|
|
|
|
|
|
|
|
|
| |||||||||||||||||||||||||||||||
Balance at December 31, 2013 | 16,076,662 | $ | 89,356 | $ | 159,733 | $ | 1,857 | $ | 250,946 | |||||||||||||||||||||||||||||||
Net income | 26,108 | 26,108 | ||||||||||||||||||||||||||||||||||||||
Other comprehensive loss | (4,060 | ) | (4,060 | ) | ||||||||||||||||||||||||||||||||||||
Stock option vesting | 965 | 965 | ||||||||||||||||||||||||||||||||||||||
RSU vesting | 126 | 126 | ||||||||||||||||||||||||||||||||||||||
PSU vesting | 42 | 42 | ||||||||||||||||||||||||||||||||||||||
Stock options exercised | 166,020 | 2,875 | 2,875 | |||||||||||||||||||||||||||||||||||||
Tax benefit of stock options exercised | 225 | 225 | ||||||||||||||||||||||||||||||||||||||
Issuance of common stock | 6,575,550 | 151,303 | 151,303 | |||||||||||||||||||||||||||||||||||||
Repurchase of common stock | (103,268 | ) | (574 | ) | (1,977 | ) | (2,551 | ) | ||||||||||||||||||||||||||||||||
Dividends paid ($ 0.44 per share) | (7,807 | ) | (7,807 | ) | ||||||||||||||||||||||||||||||||||||
|
|
|
|
| ||||||||||||||||||||||||||||||||||||
Balance at December 31, 2014 | 22,714,964 | $ | 244,318 | $ | 176,057 | $ | (2,203 | ) | $ | 418,172 | ||||||||||||||||||||||||||||||
|
|
|
|
| ||||||||||||||||||||||||||||||||||||
The accompanying notes are an integral part of these consolidated financial statements.
54
CONSOLIDATED STATEMENTS OF CASH FLOWS
| Years Ended December 31, | Years Ended December 31, | |||||||||||||||||||||||
| 2012 | 2011 | 2010 | 2014 | 2013 | 2012 | |||||||||||||||||||
| (in thousands) | (in thousands) | |||||||||||||||||||||||
Operating activities: | ||||||||||||||||||||||||
Net income | $ | 18,994 | $ | 18,590 | $ | 6,005 | $ | 26,108 | $ | 27,399 | $ | 18,994 | ||||||||||||
Adjustments to reconcile net income to net cash provided by operating activities: | ||||||||||||||||||||||||
Depreciation of premises and equipment, and amortization | 4,292 | 3,309 | 3,492 | 5,735 | 4,623 | 4,292 | ||||||||||||||||||
Amortization of intangible assets | 209 | 177 | 307 | 446 | 209 | 209 | ||||||||||||||||||
Provision for loan losses | 9,423 | 23,060 | 37,458 | |||||||||||||||||||||
(Benefit from) provision for loan losses | (4,045 | ) | (715 | ) | 9,423 | |||||||||||||||||||
Amortization of investment securities premium, net | 1,151 | 1,435 | 1,185 | 970 | 752 | 1,151 | ||||||||||||||||||
Originations of loans for resale | (225,602 | ) | (119,855 | ) | (179,504 | ) | (49,241 | ) | (123,834 | ) | (225,602 | ) | ||||||||||||
Proceeds from sale of loans originated for resale | 238,352 | 116,556 | 181,259 | 49,394 | 137,859 | 238,352 | ||||||||||||||||||
Gain on sale of loans | (6,810 | ) | (3,037 | ) | (3,647 | ) | (2,032 | ) | (5,602 | ) | (6,810 | ) | ||||||||||||
Change in market value of mortgage servicing rights | 2,016 | 1,107 | 1,029 | 1,301 | (253 | ) | 2,016 | |||||||||||||||||
Provision for losses on foreclosed assets | 1,728 | 1,984 | 1,522 | 208 | 682 | 1,728 | ||||||||||||||||||
Gain on sale of foreclosed assets | (786 | ) | (680 | ) | (562 | ) | (2,153 | ) | (1,640 | ) | (786 | ) | ||||||||||||
Loss on disposal of fixed assets | 420 | 15 | 58 | (49 | ) | 39 | 420 | |||||||||||||||||
Increase in cash value of life insurance | (1,820 | ) | (1,885 | ) | (1,847 | ) | (1,953 | ) | (1,727 | ) | (1,820 | ) | ||||||||||||
Gain on life insurance death benefit | (675 | ) | (789 | ) | — | — | — | (675 | ) | |||||||||||||||
Proceeds from life insurance death benefit | 4,423 | — | — | |||||||||||||||||||||
Stock option vesting expense | 1,083 | 830 | 800 | |||||||||||||||||||||
Equity compensation vesting expense | 1,133 | 1,151 | 1,083 | |||||||||||||||||||||
Stock option excess tax benefits | (44 | ) | (296 | ) | (390 | ) | (225 | ) | (356 | ) | (44 | ) | ||||||||||||
Bargain purchase gain | — | (7,575 | ) | (232 | ) | |||||||||||||||||||
Deferred income tax benefit | (384 | ) | (1,691 | ) | (4,867 | ) | ||||||||||||||||||
Deferred income tax expense (benefit) | (993 | ) | 2,526 | (383 | ) | |||||||||||||||||||
Change in: | ||||||||||||||||||||||||
Reserve for unfunded commitments | 875 | 100 | (1,000 | ) | (395 | ) | (1,200 | ) | 875 | |||||||||||||||
Interest receivable | 676 | (181 | ) | 632 | (619 | ) | 120 | 676 | ||||||||||||||||
Interest payable | (638 | ) | (477 | ) | (1,463 | ) | (67 | ) | (98 | ) | (638 | ) | ||||||||||||
Other assets and liabilities, net | 9,603 | 967 | 10,951 | 3,894 | 1,151 | 9,602 | ||||||||||||||||||
|
|
|
|
|
| |||||||||||||||||||
Net cash from operating activities | 56,486 | 31,664 | 51,186 | 27,417 | 41,086 | 52,063 | ||||||||||||||||||
|
|
|
|
|
| |||||||||||||||||||
Investing activities: | ||||||||||||||||||||||||
Proceeds from maturities of securities available-for-sale | 76,764 | 84,016 | 92,427 | |||||||||||||||||||||
Purchases of securities available-for-sale | (13,815 | ) | (25,456 | ) | (156,348 | ) | ||||||||||||||||||
Redemption of restricted equity securities, net | 963 | 449 | 837 | |||||||||||||||||||||
Loan principal (increases) decreases, net | (44,601 | ) | 9,363 | 102,890 | ||||||||||||||||||||
Proceeds from maturities of securities available for sale | 24,016 | 53,468 | 76,764 | |||||||||||||||||||||
Proceeds from sale of securities available for sale | 14,130 | — | — | |||||||||||||||||||||
Purchases of securities available for sale | — | — | (13,815 | ) | ||||||||||||||||||||
Proceeds from maturities of securities held to maturity | 34,172 | 4,391 | — | |||||||||||||||||||||
Purchases of securities held to maturity | (280,692 | ) | (244,967 | ) | — | |||||||||||||||||||
(Purchase) redemption of restricted equity securities, net | (2,415 | ) | 484 | 963 | ||||||||||||||||||||
Loan origination and principal collections, net | (82,079 | ) | (59,411 | ) | (44,601 | ) | ||||||||||||||||||
Loans purchased | (32,017 | ) | (62,698 | ) | — | |||||||||||||||||||
Proceeds from sale of premises and equipment | 30 | 1 | 6 | 121 | 12 | 30 | ||||||||||||||||||
Improvement of foreclosed assets | (983 | ) | — | (139 | ) | (462 | ) | (479 | ) | (983 | ) | |||||||||||||
Proceeds from sale of other real estate owned | 17,257 | 7,632 | 5,172 | 9,762 | 13,910 | 17,257 | ||||||||||||||||||
Purchases of premises and equipment | (10,792 | ) | (3,350 | ) | (3,156 | ) | (4,665 | ) | (8,313 | ) | (10,792 | ) | ||||||||||||
Cash received from acquisitions | — | 80,706 | 18,764 | |||||||||||||||||||||
Life insurance proceeds | — | 706 | 4,423 | |||||||||||||||||||||
Cash received from acquisition, net | 141,405 | — | — | |||||||||||||||||||||
|
|
|
|
|
| |||||||||||||||||||
Net cash from investing activities | 24,823 | 153,361 | 60,453 | |||||||||||||||||||||
Net cash (used) provided by investing activities | (178,724 | ) | (302,897 | ) | 29,246 | |||||||||||||||||||
|
|
|
|
|
| |||||||||||||||||||
Financing activities: | ||||||||||||||||||||||||
Net increase (decrease) in deposits | 99,166 | 98,464 | (71,340 | ) | 167,984 | 120,781 | 99,166 | |||||||||||||||||
Net change in other borrowings | (63,344 | ) | (11,517 | ) | (9,733 | ) | 2,941 | (2,862 | ) | (63,344 | ) | |||||||||||||
Stock option excess tax benefits | 44 | 296 | 390 | 225 | 356 | 44 | ||||||||||||||||||
Repurchase of common stock | — | (753 | ) | (338 | ) | (292 | ) | (501 | ) | — | ||||||||||||||
Dividends paid | (5,757 | ) | (5,742 | ) | (6,344 | ) | (7,807 | ) | (6,745 | ) | (5,757 | ) | ||||||||||||
Exercise of stock options | 206 | 436 | 203 | 616 | 251 | 206 | ||||||||||||||||||
|
|
|
|
|
| |||||||||||||||||||
Net cash from financing activities | 30,315 | 81,184 | (87,162 | ) | 163,667 | 111,280 | 30,315 | |||||||||||||||||
|
|
|
|
|
| |||||||||||||||||||
Net change in cash and cash equivalents | 111,624 | 266,209 | 24,477 | 12,360 | (150,531 | ) | 111,624 | |||||||||||||||||
|
|
|
|
|
| |||||||||||||||||||
Cash and cash equivalents and beginning of year | 637,275 | 371,066 | 346,589 | 598,368 | 748,899 | 637,275 | ||||||||||||||||||
|
|
|
|
|
| |||||||||||||||||||
Cash and cash equivalents at end of year | $ | 748,899 | $ | 637,275 | $ | 371,066 | $ | 610,728 | $ | 598,368 | $ | 748,899 | ||||||||||||
|
|
|
|
|
| |||||||||||||||||||
Supplemental disclosure of noncash activities: | ||||||||||||||||||||||||
Unrealized (loss) gain on securities available for sale | $ | (2,096 | ) | $ | 2,594 | $ | (41 | ) | $ | (162 | ) | $ | (4,232 | ) | $ | (2,096 | ) | |||||||
Loans transferred to foreclosed assets | 8,382 | 6,943 | 7,690 | 5,291 | 11,717 | 8,382 | ||||||||||||||||||
Loans transferred to held-for-sale | 9,739 | — | — | — | — | 9,739 | ||||||||||||||||||
Market value of shares tendered in-lieu of cash to pay for exercise of options and/or related taxes | 224 | 1,992 | 1,026 | 2,259 | 2,989 | 224 | ||||||||||||||||||
Supplemental disclosure of cash flow activity: | ||||||||||||||||||||||||
Cash paid for interest expense | 7,982 | 10,715 | 15,596 | 4,641 | 4,794 | 7,982 | ||||||||||||||||||
Cash paid for income taxes | 10,995 | 16,625 | 2,825 | 22,685 | $ | 17,395 | $ | 10,995 | ||||||||||||||||
Assets acquired in acquisition | — | 270,304 | 100,282 | 978,682 | — | — | ||||||||||||||||||
Liabilities assumed in acquisition | — | $ | 262,729 | $ | 100,050 | 827,372 | — | — | ||||||||||||||||
The accompanying notes are an integral part of these consolidated financial statements.
55
NOTES TO CONSOLIDATED FINANCIAL STATEMENTS
Years Ended December 31, 2012, 20112014, 2013 and 20102012
Note 1—1 – Summary of Significant Accounting Policies
Description of Business and Basis of Presentation
TriCo Bancshares (the “Company”) is a California corporation organized to act as a bank holding company for Tri Counties Bank.Bank (the “Bank”). The Company and the Bank are headquartered in Chico, California. The Bank is a state-chartered financial institutionCalifornia-chartered bank that is engaged in the general commercial banking business in the26 California counties of Butte, Contra Costa, Del Norte, Fresno, Glenn, Kern, Lake, Lassen, Madera, Mendocino, Merced, Napa, Nevada, Placer, Sacramento, Shasta, Siskiyou, Stanislaus, Sutter, Tehama, Tulare, Yolo and Yuba.counties. Tri Counties Bank currently operates from 4157 traditional branches and 2516 in-store branches. The Company also formed twohas five capital subsidiary business trusts TriCo Capital Trust I and TriCo Capital Trust II (collectively, the Capital Trusts), to issue that issued trust preferred securities.securities, including two organized by TriCo and three acquired with the acquisition of North Valley Bancorp. See Note 17 – Junior Subordinated Debt.
The consolidated financial statements are prepared in accordance with accounting policies generally accepted in the United States of America and general practices in the banking industry. The financial statements include the accounts of the Company. All inter-company accounts and transactions have been eliminated in consolidation. For financial reporting purposes, the Company’s investments in the Capital Trusts of $1,238,000$1,690,000 are accounted for under the equity method and, accordingly, are not consolidated and are included in other assets on the consolidated balance sheet. The subordinated debentures issued and guaranteed by the Company and held by the Capital Trusts are reflected as debt on the Company’s consolidated balance sheet.
Use of Estimates in the Preparation of Financial Statements
The preparation of financial statements in conformity with accounting principles generally accepted in the United States of America requires Management to make estimates and assumptions that affect the reported amounts of assets and liabilities and disclosure of contingent assets and liabilities at the date of the financial statements and the reported amounts of revenues and expenses during the reporting period. On an on-going basis, the Company evaluates its estimates, including those related to the adequacy of the allowance for loan losses, investments, intangible assets, income taxes and contingencies. The Company bases its estimates on historical experience and on various other assumptions that are believed to be reasonable under the circumstances, the results of which form the basis for making judgments about the carrying values of assets and liabilities that are not readily apparent from other sources. Actual results may differ from these estimates under different assumptions or conditions. The allowance for loan losses, indemnification asset, foreclosed assets, goodwill and other intangible assets, income taxes, fair value of assets acquired and liabilities assumed in business combinations, the valuation of securities available-for-sale, and the valuation of mortgage servicing rights are the only accounting estimates that materially affect the Company’s consolidated financial statements.
As described in Note 2, the Bank assumed the banking operations of two failed financial institutions from the FDIC under whole bank purchase agreements.Company acquired North Valley Bancorp on October 3, 2014. The acquired assets and assumed liabilities were measured at estimated fair value values under the acquisition method of accounting. The Company made significant estimates and exercised significant judgment in accounting for the acquisitions.acquisition. The Company determined loan fair values based on loan file reviews, loan risk ratings, appraised collateral values, expected cash flows and historical loss factors. Foreclosed assets were primarily valued based on appraised values of the repossessed loan collateral. Land and building were valued based on appraised values. An identifiable intangible was also recorded representing the fair value of the core deposit customer base based on an evaluation of the cost of such deposits relative to alternative funding sources. The fair value of time deposits and borrowings were determined based on the present value of estimated future cash flows using current rates as of the acquisition date.
Significant Group Concentration of Credit Risk
The Company grants agribusiness, commercial, consumer, and residential loans to customers located throughout the northern San Joaquin Valley, the Sacramento Valley and northern mountain regions of California. The Company has a diversified loan portfolio within the business segments located in this geographical area. The Company currently classifies all its operation into one business segment that it denotes as community banking.
Cash and Cash Equivalents
For purposes of the consolidated statements of cash flows, cash and cash equivalents include cash on hand, amounts due from banks, and federal funds sold. Net cash flows are reported for loan and deposit transactions and other borrowings.
Investment Securities
The Company classifies its debt and marketable equity securities into one of three categories: trading, available-for-saleavailable for sale or held-to-maturity.held to maturity. Trading securities are bought and held principally for the purpose of selling in the near term. Held-to-maturityHeld to maturity securities are those securities which the Company has the ability and intent to hold until maturity. These securities are carried at cost adjusted for amortization of premium and accretion of discount, computed by the effective interest method over their contractual lives. All other securities not included in trading or held-to-maturityheld to maturity are classified as available-for-sale. During the years ended December 31, 2012 and 2011, the Company did not have any securities classified as either held-to-maturity or trading. Available-for-saleavailable for sale. Available for sale securities are recorded at fair value. Unrealized gains and losses, net of the related tax effect, on available-for-saleavailable for sale securities are reported as a separate component of other accumulated comprehensive income in shareholders’ equity until realized. Premiums and discounts are amortized or accreted over the life of the related investment security as an adjustment to yield using the effective interest method. Dividend and interest income are recognized when earned. Realized gains and losses are derived from the amortized cost of the security sold. During the years ended December 31, 2014 and 2013, the Company did not have any securities classified as trading.
The Company assesses other-than-temporary impairment (“OTTI”) based on whether it intends to sell a security or if it is likely that the Company would be required to sell the security before recovery of the amortized cost basis of the investment, which may be maturity. For
56
debt securities, if we intend to sell the security or it is likely that we will be required to sell the security before recovering its cost basis, the entire impairment loss would be recognized in earnings as an OTTI. If we do not intend to sell the security and it is not likely that we will be required to sell the security but we do not expect to recover the entire amortized cost basis of the security, only the portion of the impairment loss representing credit losses would be recognized in earnings. The credit loss on a security is measured as the difference between the amortized cost basis and the present value of the cash flows expected to be collected. Projected cash flows are discounted by the original or current effective interest rate depending on the nature of the security being measured for potential OTTI. The remaining impairment related to all other factors, the difference between the present value of the cash flows expected to be collected and fair value, is recognized as a charge to other comprehensive income (“OCI”). Impairment losses related to all other factors are presented as separate categories within OCI. The accretion of the amount recorded in OCI increases the carrying value of the investment and does not affect earnings. If there is an indication of additional credit losses the security is re-evaluated according to the procedures described above. No OTTI losses were recognized during the years ended December 31, 2012, 2011,2014 and 2010.
Restricted Equity Securities
Restricted equity securities represent the Company’s investment in the stock of the Federal Home Loan Bank of San Francisco (“FHLB”) and are carried at par value, which reasonably approximates its fair value. While technically these are considered equity securities, there is no market for the FHLB stock. Therefore, the shares are considered as restricted investment securities. Management periodically evaluates FHLB stock for other-than-temporary impairment. Management’s determination of whether these investments are impaired is based on its assessment of the ultimate recoverability of cost rather than by recognizing temporary declines in value. The determination of whether a decline affects the ultimate recoverability of cost is influenced by criteria such as (1) the significance of any decline in net assets of the FHLB as compared to the capital stock amount for the FHLB and the length of time this situation has persisted, (2) commitments by the FHLB to make payments required by law or regulation and the level of such payments in relation to the operating performance of the FHLB, (3) the impact of legislative and regulatory changes on institutions and, accordingly, the customer base of the FHLB, and (4) the liquidity position of the FHLB.
As a member of the FHLB system, the Company is required to maintain a minimum level of investment in FHLB stock based on specific percentages of its outstanding mortgages, total assets, or FHLB advances. The Company may request redemption at par value of any stock in excess of the minimum required investment. Stock redemptions are at the discretion of the FHLB.
Loans Held for Sale
Loans originated and intended for sale in the secondary market are carried at the lower of aggregate cost or fair value, as determined by aggregate outstanding commitments from investors of current investor yield requirements. Net unrealized losses are recognized through a valuation allowance by charges to noninterest income.
Mortgage loans held for sale are generally sold with the mortgage servicing rights retained by the Company. Gains or losses on the sale of loans that are held for sale are recognized at the time of the sale and determined by the difference between net sale proceeds and the net book value of the loans less the estimated fair value of any retained mortgage servicing rights.
Loans and Allowance for Loan Losses
Loans originated by the Company, i.e., not purchased or acquired in a business combination, are referred to as originated loans. Originated loans that management has the intent and ability to hold for the foreseeable future or until maturity or payoff are reported at the principal amount outstanding, net of deferred loan fees and costs. Loan origination and commitment fees and certain direct loan origination costs are deferred, and the net amount is amortized as an adjustment of the related loan’s yield over the actual life of the loan. Originated loans on which the accrual of interest has been discontinued are designated as nonaccrual loans.
Originated loans are placed in nonaccrual status when reasonable doubt exists as to the full, timely collection of interest or principal, or a loan becomes contractually past due by 90 days or more with respect to interest or principal and is not well secured and in the process of collection. When an originated loan is placed on nonaccrual status, all interest previously accrued but not collected is reversed. Income on such loans is then recognized only to the extent that cash is received and where the future collection of principal is probable. Interest accruals are resumed on such loans only when they are brought fully current with respect to interest and principal and when, in the judgment of Management, the loan is estimated to be fully collectible as to both principal and interest.
An allowance for loan losses for originated loans is established through a provision for loan losses charged to expense. The allowance is maintained at a level which, in management’sManagement’s judgment, is adequate to absorb probable incurred credit losses inherent in the loan portfolio as of the balance sheet date. Originated loans and deposit related overdrafts are charged against the allowance for loan losses when Management believes that the collectability of the principal is unlikely or, with respect to consumer installment loans, according to an established delinquency schedule. The allowance is an amount that Management believes will be adequate to absorb probable incurred losses inherent in existing loans and leases, based on evaluations of the collectability, impairment and prior loss experience of loans and leases. The evaluations take into consideration such factors as changes in the nature and size of the portfolio, overall portfolio quality, loan concentrations, specific problem loans, and current economic conditions that may affect the borrower’s ability to pay. The Company defines an originated loan as impaired when it is probable the Company will be unable to collect all amounts due according to the contractual terms of the loan agreement. Impaired originated loans are measured based on the present value of expected future cash flows discounted at the loan’s original effective interest rate. As a practical expedient, impairment may be measured based on the loan’s observable market price or the fair value of the collateral if the loan is collateral dependent. When the measure of the impaired loan is less than the recorded investment in the loan, the impairment is recorded through a valuation allowance.
57
In situations related to originated loans where, for economic or legal reasons related to a borrower’s financial difficulties, the Company grants a concession for other than an insignificant period of time to the borrower that the Company would not otherwise consider, the related loan is classified as a troubled debt restructuring (TDR). The Company strives to identify borrowers in financial difficulty early and work with them to modify to more affordable terms before their loan reaches nonaccrual status. These modified terms may include rate reductions, principal forgiveness, payment forbearance and other actions intended to minimize the economic loss and to avoid foreclosure or repossession of the collateral. In cases where the Company grants the borrower new terms that result in the loan being classified as a TDR, the Company measures any impairment on the restructuring as noted above for impaired loans. TDR loans are classified as impaired until they are fully paid off or charged off. Loans that are in nonaccrual status at the time they become TDR loans, remain in nonaccrual status until the borrower demonstrates a sustained period of performance which the Company generally believes to be six consecutive months of payments, or equivalent. Otherwise, TDR loans are subject to the same nonaccrual and charge-off policies as noted above with respect to their restructured principal balance.
Credit risk is inherent in the business of lending. As a result, the Company maintains an allowance for loan losses to absorb probable incurred losses inherent in the Company’s originated loan portfolio. This is maintained through periodic charges to earnings. These charges are included in the Consolidated Statements of Income as provision for loan losses. All specifically identifiable and quantifiable losses are immediately charged off against the allowance. However, for a variety of reasons, not all losses are immediately known to the Company and, of those that are known, the full extent of the loss may not be quantifiable at that point in time. The balance of the Company’s allowance for originated loan losses is meant to be an estimate of these unknown but probable losses inherent in the portfolio.
The Company formally assesses the adequacy of the allowance for originated loan losses on a quarterly basis. Determination of the adequacy is based on ongoing assessments of the probable risk in the outstanding originated loan portfolio, and to a lesser extent the Company’s originated loan commitments. These assessments include the periodic re-grading of credits based on changes in their individual credit characteristics including delinquency, seasoning, recent financial performance of the borrower, economic factors, changes in the interest rate environment, growth of the portfolio as a whole or by segment, and other factors as warranted. Loans are initially graded when originated. They are re-graded as they are renewed, when there is a new loan to the same borrower, when identified facts demonstrate heightened risk of nonpayment, or if they become delinquent. Re-grading of larger problem loans occurs at least quarterly. Confirmation of the quality of the grading process is obtained by independent credit reviews conducted by consultants specifically hired for this purpose and by various bank regulatory agencies.
The Company’s method for assessing the appropriateness of the allowance for originated loan losses includes specific allowances for impaired originated loans and leases, formula allowance factors for pools of credits, and allowances for changing environmental factors (e.g., interest rates, growth, economic conditions, etc.). Allowance factors for loan pools were based on historical loss experience by product type and prior risk rating.
During the three months ended March 31, 2012, management2013, the Company changed somethe method it uses to estimate net sale proceeds from real estate collateral sales when calculating the allowance for loan losses associated with impaired real estate collateral dependent loans. Previously, the Company used the greater of fifteen percent or actual estimated selling costs. Currently, the Company uses the actual estimated selling costs, and an adjustment to appraised value based on the age of the assumptions utilized in the Allowance for Loan Losses estimate calculation.appraisal. These changes wereare intended to more accurately reflect the current riskestimated net sale proceeds from the sale of impaired collateral dependent real estate loans. This change in methodology resulted in the allowance for loan portfolio and to better estimatelosses as of March 31, 2013 being $494,000 more than it would have been without this change in methodology.
During the losses inherent but not yet quantifiable. These changes includedthree months ended June 30, 2013, the conversion to a historicalCompany modified its loss migration analysis intendedmethodology used to better determine the appropriate formula reserve ratioallowance factors. When the Company originally established its loss migration analysis methodology during the quarter ended March 31, 2012, it reviewed the loss experience of each rolling twelve month period over the previous three years in order to calculate an annualized loss rate by loan category and risk rating. The use of three years of loss experience data was originally used because that was the extent of the detailed loss data by loan category and risk rating that was available at the addition of an environmental factor relatedtime. This three year historical look-back period was used through the quarter ended March 31, 2013. Starting with the quarter ended June 30, 2013, the Company reviews all available detailed loss experience data, going back to, and including, the twelve month period ended June 30, 2009, and does not limit the look-back period to the delinquency ratemost recent three years of loans not classified as impaired byhistorical loss data. Using this data, the Company calculates loss factors for each quarter from the quarter ended June 30, 2009 to the most recent quarter. The Company then calculates a weighted average formula allowance factor for each loan category and risk rating with the elimination of an unspecified reserve allocation previouslymost recent quarterly loss factor being weighted 125%, the quarter ended June 30, 2009 loss factor being weighted 75%, and the loss factors for all the quarters between the most recent quarter and the quarter ended June 30, 2009, being weighted on a linear scale from 75% to 125%. This change is intended to account for imprecisionmore accurately reflect the risk inherent in the overall calculation,loan portfolio by considering historical loss data for all years as the data for new periods becomes available. This change in methodology resulted in the allowance for loan losses as of June 30, 2013 being $1,314,000 more than it would have been without this change in methodology.
During the three months ended September 30, 2013, the Company modified its methodology used to determine the allowance for changing environmental factors. Previously, the Company compared the current value of each environmental factor to a fixed baseline value. The deviation of the current value from the baseline value was then multiplied by a conversion factor to determine the required allowance related to each environmental factor. As of September 30, 2013, the Company replaced the fixed baseline values with average baseline values derived from historical averages, and adjusted the reclassification of risk rating of certain consumer loans based on current credit score in an attemptconversion factors. This change is intended to better identifymore accurately reflect the risk inherent in the portfolio. The financial effect of these changesportfolio by recognizing that baseline, or normal, levels for environmental factors may change over time. This change in methodology resulted in a net reductionthe allowance for loan losses as of September 30, 2013 being $1,665,000 more than it would have been without this change in the calculated Allowance for Loan Losses of $1,388,000 duringmethodology.
58
During the three months ended March 31, 2012. Allowances for impaired loans are based on analysis of individual credits. Allowances2014, the Company modified its methodology used to determine the allowance for changing environmental factors are Management’s bestby adding a new environmental factor based on the California Home Affordability Index (“CHAI”). The CHAI measures the percentage of households in California that can afford to purchase the median priced home in California based on current home prices and mortgage interest rates. The use of the CHAI environmental factor consists of comparing the current CHAI to its historical baseline, and allows management to consider the adverse impact that a lower than historical CHAI may have on general economic activity and the performance of our borrowers. Based on an analysis of historical data, management believes this environmental factor gives a better estimate of the probable impact these changes have had on the originated loan portfolio as a whole. The allowance for originated loans is includedcurrent economic activity compared to other environmental factors that may lag current economic activity to some extent. This change in methodology resulted in no change to the allowance for loan losses.losses as of March 31, 2014 compared to what it would have been without this change in methodology.
During the three months ended June 30, 2014, the Company refined the method it uses to evaluate historical losses for the purpose of estimating the pool allowance for unimpaired loans. In the third quarter of 2010, the Company moved from a six point grading system (Grades A-F) to a nine point risk rating system (Risk Ratings 1-9), primarily to allow for more distinction within the “Pass” risk rating. Initially, there was not sufficient loss experience within the nine point scale to complete a migration analysis for all nine risk ratings, all loans risk rated Pass or 2-5 were grouped together, a loss rate was calculated for that group, and that loss rate was established as the loss rate for risk rating 4. The reserve ratios for risk ratings 2, 3 and 5 were then interpolated from that figure. As of June 30, 2014, the Company was able to compile twelve quarters of historical loss information for all risk ratings and use that information to calculate the loss rates for each of the nine risk ratings without interpolation. This refinement led to an increase of $1,438,000 in the reserve requirement for unimpaired loans, driven primarily by home equity lines of credit with a risk rating of 5 or “Pass-Watch.”
Loans purchased or acquired in a business combination are referred to as acquired loans. Acquired loans are valued as of the acquisition date in accordance with Financial Accounting Standards Board Accounting Standards Codification (“FASB ASC”) Topic 805,Business Combinations. Loans acquired with evidence of credit deterioration since origination for which it is probable that all contractually required payments will not be collected are referred to as purchased credit impaired (PCI) loans. PCI loans are accounted for under FASB ASC Topic 310-30,Loans and Debt Securities Acquired with Deteriorated Credit Quality. Under FASB ASC Topic 805 and FASB ASC Topic 310-30, PCI loans are recorded at fair value at acquisition date, factoring in credit losses expected to be incurred over the life of the loan. Accordingly, an allowance for loan losses is not carried over or recorded as of the acquisition date. Fair value is defined as the present value of the future estimated principal and interest payments of the loan, with the discount rate used in the present value calculation representing the estimated effective yield of the loan. Default rates, loss severity, and prepayment speed assumptions are periodically reassessed and our estimate of future payments is adjusted accordingly. The difference between contractual future payments and estimated future payments is referred to as the nonaccretable difference. The difference between estimated future payments and the present value of the estimated future payments is referred to as the accretable yield. The accretable yield represents the amount that is expected to be recorded as interest income over the remaining life of the loan. If after acquisition, the Company determines that the estimated future cash flows of a PCI loan are expected to be more than originally estimated, an increase in the discount rate (effective yield) would be made such that the newly increased accretable yield would be recognized, on a level yield basis, over the remaining estimated life of the loan. If, after acquisition, the Company determines that the estimated future cash flows of a PCI loan are expected to be less than previously estimated, the discount rate would first be reduced until the present value of the reduced cash flow estimate equals the previous present value however, the discount rate may not be lowered below its original level at acquisition. If the discount rate has been lowered to its original level and the present value has not been sufficiently lowered, an allowance for loan loss would be established through a provision for loan losses charged to expense to decrease the present value to the required level. If the estimated cash flows improve after an allowance has been established for a loan, the allowance may be partially or fully reversed depending on the improvement in the estimated cash flows. Only after the allowance has been fully reversed may the discount rate be increased. PCI loans are put on nonaccrual status when cash flows cannot be reasonably estimated. PCI loans on nonaccrual status are accounted for using the cost recovery method or cash basis method of income recognition. The Company refers to PCI loans on nonaccrual status that are accounted for using the cash basis method of income recognition as “PCI – cash basis” loans; and the Company refers to all other PCI loans as “PCI – other” loans PCI loans are charged off when evidence suggests cash flows are not recoverable. Foreclosed assets from PCI loans are recorded in foreclosed assets at fair value with the fair value at time of foreclosure representing cash flow from the loan. ASC 310-30 allows PCI loans with similar risk characteristics and acquisition time frame to be “pooled” and have their cash flows aggregated as if they were one loan. The Company elected to use the “pooled” method of ASC 310-30 for PCI – other loans in the acquisition of certain assets and liabilities of Granite Community Bank, N.A. (“Granite”) during 2010 and Citizens Bank of Northern California (“Citizens”). during 2011.
Acquired loans that are not PCI loans are referred to as purchased not credit impaired (PNCI) loans. PNCI loans are accounted for under FASB ASC Topic 310-20,Receivables – Nonrefundable Fees and Other Costs,in which interest income is accrued on a level-yield basis for performing loans. For income recognition purposes, this method assumes that all contractual cash flows will be collected, and no allowance for loan losses is established at the time of acquistion.acquisition. Post-acquisition date, an allowance for loan losses may need to be established for acquired loans through a provision charged to earnings for credit losses incurred subsequent to acquisition. Under ASC 310-20, the loss would be measured based on the probable shortfall in relation to the contractual note requirements, consistent with our allowance for loan loss policy for similar loans.
Throughout these financial statements, and in particular in Note 4 and Note 5, when we refer to “Loans” or “Allowance for loan losses” we mean all categories of loans, including Originated, PNCI, PCI – cash basis, and PCI – other. When we are not referring to all categories of loans, we will indicate which we are referring to – Originated, PNCI, PCI – cash basis, or PCI – other.
When referring to PNCI and PCI loans we will use the terms “nonaccretable difference”, “accretable yield”, or “purchase discount”. Nonaccretable difference is the difference between undiscounted contractual cash flows due and undiscounted cash flows we expect to collect, or put another way, it is the undiscounted contractual cash flows we do not expect to collect. Accretable yield is the difference
59
between undiscounted cash flows we expect to collect and the value at which we have recorded the loan on our financial statements. On the date of acquisition, all purchased loans are recorded on our consolidated financial statements at estimated fair value. Purchase discount is the difference between the estimated fair value of loans on the date of acquisition and the principal amount owed by the borrower, net of charge offs, on the date of acquisition. We may also refer to “discounts to principal balance of loans owed, net of charge-offs”. Discounts to principal balance of loans owed, net of charge-offs is the difference between principal balance of loans owed, net of charge-offs, and loans as recorded on our financial statements. Discounts to principal balance of loans owed, net of charge-offs arise from purchase discounts, and equal the purchase discount on the acquisition date.
Loans are also categorized as “covered” or “noncovered”. Covered loans refer to loans covered by a Federal Deposit Insurance Corporation (“FDIC”) loss sharing agreement. Noncovered loans refer to loans not covered by a FDIC loss sharing agreement.
Foreclosed Assets
Foreclosed assets include assets acquired through, or in lieu of, loan foreclosure. Foreclosed assets are held for sale and are initially recorded at fair value less estimated costs to sell at the date of foreclosure, establishing a new cost basis. Subsequent to foreclosure, management periodically performs valuations and the assets are carried at the lower of carrying amount or fair value less cost to sell. Revenue and expenses from operations and changes in the valuation allowance are included in other noninterest expense. Gain or loss on sale of foreclosed assets is included in noninterest income. Foreclosed assets that are not subject to a FDIC loss-share agreement are referred to as noncovered foreclosed assets.
Foreclosed assets acquired through FDIC-assisted acquisitions that are subject to a FDIC loss-share agreement, and all assets acquired via foreclosure of covered loans are referred to as covered foreclosed assets. Covered foreclosed assets are reported exclusive of expected reimbursement cash flows from the FDIC. Foreclosed covered loan collateral is transferred into covered foreclosed assets at the loan’s carrying value, inclusive of the acquisition date fair value discount.
Covered foreclosed assets are initially recorded at estimated fair value less estimated costs to sell on the acquisition date based on similar market comparable valuations less estimated selling costs. Any subsequent valuation adjustments due to declines in fair value will be charged to noninterest expense, and will be mostly offset by noninterest income representing the corresponding increase to the FDIC indemnification asset for the offsetting loss reimbursement amount. Any recoveries of previous valuation adjustments will be credited to noninterest expense with a corresponding charge to noninterest income for the portion of the recovery that is due to the FDIC.
Premises and Equipment
Land is carried at cost. Land improvements, buildings and equipment, including those acquired under capital lease, are stated at cost less accumulated depreciation and amortization. Depreciation and amortization expenses are computed using the straight-line method over the estimated useful lives of the related assets or lease terms. Asset lives range from 3-10 years for furniture and equipment and 15-40 years for land improvements and buildings.
Goodwill and Other Intangible Assets
Goodwill represents the excess of costs over fair value of net assets of businesses acquired. Goodwill and other intangible assets acquired in a purchase business combination and determined to have an indefinite useful life are not amortized, but instead tested for impairment at least annually. Intangible assets with estimable useful lives are amortized over their respective estimated useful lives to their estimated residual values, and reviewed for impairment.
The Company has an identifiable intangible asset consisting of core deposit intangibles (CDI). CDI are amortized over their respective estimated useful lives, and reviewed for impairment.
Impairment of Long-Lived Assets and Goodwill
Long-lived assets, such as premises and equipment, and purchased intangibles subject to amortization, are reviewed for impairment whenever events or changes in circumstances indicate that the carrying amount of an asset may not be recoverable. Recoverability of assets to be held and used is measured by a comparison of the carrying amount of an asset to estimated undiscounted future cash flows expected to be generated by the asset. If the carrying amount of an asset exceeds its estimated future cash flows, an impairment charge is recognized by the amount by which the carrying amount of the asset exceeds the fair value of the asset. Assets to be disposed of would be separately presented in the balance sheet and reported at the lower of the carrying amount or fair value less costs to sell, and are no longer depreciated. The assets and liabilities of a disposed group classified as held for sale would be presented separately in the appropriate asset and liability sections of the consolidated balance sheet.
As of December 31 of each year, goodwill is tested for impairment, and is tested for impairment more frequently if events and circumstances indicate that the asset might be impaired. An impairment loss is recognized to the extent that the carrying amount exceeds the asset’s fair value. This determination is made at the reporting unit level. The Company may choose to first assess qualitative factors to determine whether the existence of events or circumstances leads to a determination that it is more likely than not that the fair value of a reporting unit is less than its carrying amount. If, after assessing the totality of events or circumstances, the Company determines it is not more likely than not
that the fair value of a reporting unit is less than its carrying amount, then goodwill is deemed not to be impaired. However, if the Company concludes otherwise, or if the Company elected not to first assess qualitative factors, then the Company performs the first step of a two-step impairment test by calculating the fair value of the reporting unit and comparing the fair value with the carrying amount of the reporting unit. Second, if the carrying amount of the reporting unit exceeds its fair value, an impairment loss is recognized for any excess of the carrying amount of the reporting unit’s goodwill over the implied fair value of that goodwill. The implied fair value of goodwill is determined by allocating the fair value of the reporting unit in a manner similar to a purchase price allocation. The residual fair value after this allocation is
60
the implied fair value of the reporting unit goodwill. Currently, and historically, the Company is comprised of only one reporting unit that operates within the business segment it has identified as “community banking”. Goodwill was not impaired as of December 31, 2012 or 20112014 because the fair value of the reporting unit exceeded its carrying value.
Mortgage Servicing Rights
Mortgage servicing rights (MSR) represent the Company’s right to a future stream of cash flows based upon the contractual servicing fee associated with servicing mortgage loans. Our MSR arise from residential and commercial mortgage loans that we originate and sell, but retain the right to service the loans. The net gain from the retention of the servicing right is included in gain on sale of loans in noninterest income when the loan is sold. Fair value is based on market prices for comparable mortgage servicing contracts, when available, or alternatively, is based on a valuation model that calculates the present value of estimated future net servicing income. The valuation model incorporates assumptions that market participants would use in estimating future net servicing income, such as the cost to service, the discount rate, the custodial earnings rate, an inflation rate, ancillary income, prepayment speeds and default rates and losses. Servicing fees are recorded in noninterest income when earned.
We accountThe Company accounts for MSR at fair value. The determination of fair value of our MSR requires management judgment because they are not actively traded. The determination of fair value for MSR requires valuation processes which combine the use of discounted cash flow models and extensive analysis of current market data to arrive at an estimate of fair value. The cash flow and prepayment assumptions used in our discounted cash flow model are based on empirical data drawn from the historical performance of our MSR, which we believe are consistent with assumptions used by market participants valuing similar MSR, and from data obtained on the performance of similar MSR. The key assumptions used in the valuation of MSR include mortgage prepayment speeds and the discount rate. These variables can, and generally will, change from quarter to quarter as market conditions and projected interest rates change. The key risks inherent with MSR are prepayment speed and changes in interest rates. The Company uses an independent third party to determine fair value of MSR.
Indemnification AssetAsset/Liability
The Company accounts for amounts receivable or payable under its loss-share agreements entered into with the FDIC in connection with its purchase and assumption of certain assets and liabilities of Granite as indemnification assets in accordance with FASB ASC Topic 805,Business Combinations. FDIC indemnification assets are initially recorded at fair value, based on the discounted value of expected future cash flows under the loss-share agreements. The difference between the fair value and the undiscounted cash flows the Company expects to collect from or pay to the FDIC will be accreted into noninterest income over the life of the FDIC indemnification asset. FDIC indemnification assets are reviewed quarterly and adjusted for any changes in expected cash flows based on recent performance and expectations for future performance of the covered portfolios. These adjustments are measured on the same basis as the related covered loans and covered other real estate owned. Any increases in cash flow of the covered assets over those expected will reduce the FDIC indemnification asset and any decreases in cash flow of the covered assets under those expected will increase the FDIC indemnification asset. Increases and decreases to the FDIC indemnification asset are recorded as adjustments to noninterest income.
Reserve for Unfunded Commitments
The reserve for unfunded commitments is established through a provision for losses – unfunded commitments charged to noninterest expense. The reserve for unfunded commitments is an amount that Management believes will be adequate to absorb probable losses inherent in existing commitments, including unused portions of revolving lines of credits and other loans, standby letters of credits, and unused deposit account overdraft privilege. The reserve for unfunded commitments is based on evaluations of the collectability, and prior loss experience of unfunded commitments. The evaluations take into consideration such factors as changes in the nature and size of the loan portfolio, overall loan portfolio quality, loan concentrations, specific problem loans and related unfunded commitments, and current economic conditions that may affect the borrower’s or depositor’s ability to pay.
During the three months ended June 30, 2013, the Company modified the methodology employed to estimate potential losses on unfunded commitments. Similar to the Allowance for Loan Losses, the Company performs a migration analysis of historical loss experience. Prior to this quarter, the loss experience of each quarter over the previous three years was reviewed in order to calculate an annualized loss rate by loan category. Going forward, the Company has chosen to review all loss experience available since the conversion to a loss migration analysis. This change is intended to more accurately reflect the risk inherent in the unfunded commitments and appropriately consider all losses incurred in prior years. This change in methodology resulted in the reserve for unfunded commitments as of June 30, 2013 being $335,000 more than it would have been without this change in methodology.
Income Taxes
The Company’s accounting for income taxes is based on an asset and liability approach. The Company recognizes the amount of taxes payable or refundable for the current year, and deferred tax assets and liabilities for the future tax consequences that have been recognized in its financial statements or tax returns. The measurement of tax assets and liabilities is based on the provisions of enacted tax laws. A valuation allowance, if needed, reduces deferred tax assets to the expected amount most likely to be realized. Realization of deferred tax assets is dependent upon the generation of a sufficient level of future taxable income and recoverable taxes paid in prior years. Although realization is not assured, management believes it is more likely than not that all of the deferred tax assets will be realized. Interest and/or penalties related to income taxes are reported as a component of noninterest income.
Off-Balance Sheet Credit Related Financial Instruments
In the ordinary course of business, the Company has entered into commitments to extend credit, including commitments under credit card arrangements, commercial letters of credit, and standby letters of credit. Such financial instruments are recorded when they are funded.
61
Geographical Descriptions
For the purpose of describing the geographical location of the Company’s loans, the Company has defined northern California as that area of California north of, and including, Stockton; central California as that area of the state south of Stockton, to and including, Bakersfield; and southern California as that area of the state south of Bakersfield.
Reclassifications
Certain amounts reported in previous consolidated financial statements have been reclassified to conform to the presentation in this report. These reclassifications did not affect previously reported net income or total shareholders’ equity.
Recent Accounting Pronouncements
FASB issued ASU No. 2011-032014-04,, Transfers and ServicingReceivables (Topic 860)310): ReconsiderationReclassification of Effective Control for Repurchase Agreements.Residential Real Estate Collateralized Consumer Mortgage Loans upon Foreclosure. This UpdateASU 2014-04 clarifies when an in substance repossession or foreclosure occurs, that is, intended to improve financial reporting of repurchase agreements and other agreements that both entitle and obligatewhen a transferor to repurchase or redeem financial assets before their maturity. ASU 2011-03 removes from the assessment of effective control (i) the criterion requiring the transferorcreditor should be considered to have received physical possession of residential real estate property collateralizing a consumer mortgage loan such that the ability to repurchase or redeemloan receivable should be derecognized and the financial assets on substantially the agreed terms, even in the event of default by the transferee, and (ii) the collateral maintenance guidance related to that criterion.real estate property recognized. ASU 2011-03 was adopted by the Company on January 1, 2012 and did not have a significant impact on the Company’s consolidated financial statements.
FASB issued ASU No. 2011-04, Fair Value Measurement (Topic 820): Amendments to Achieve Common Fair Value Measurement and Disclosure Requirements in U.S. GAAP and IFRSs.ASU 2011-04 amends Topic 820, Fair Value Measurements and Disclosures, to converge the fair value measurement guidance in U.S. generally accepted accounting principles and International Financial Reporting Standards. ASU 2011-04 clarifies the application of existing fair value measurement requirements, changes certain principles in Topic 820 and requires additional fair value disclosures. ASU 2011-042014-04 is effective for public business entities for annual periods, and interim periods within those annual periods, beginning after December 15, 2011, and did not have a significant impact on the Company’s consolidated financial statements.
FASB issued2014. ASU No. 2011-05, Comprehensive Income (Topic 220): Presentation of Comprehensive Income. ASU 2011-05 amends Topic 220, Comprehensive Income, to require that all nonowner changes in stockholders’ equity be presented in either a single continuous statement of comprehensive income or in two separate but consecutive statements. Additionally, ASU 2011-05 requires entities to present, on the face of the financial statements, reclassification adjustments for items that are reclassified from other comprehensive income to net income in the statement or statements where the components of net income and the components of other comprehensive income are presented. The option to present components of other comprehensive income as part of the statement of changes in stockholders’ equity was eliminated. ASU 2011-05 is effective for annual periods beginning after December 15, 2011, and did not have a significant impact on the Company’s consolidated financial statements.
FASB issued ASU No. 2011-08, Intangibles – Goodwill and Other (Topic 350): Testing Goodwill for Impairment. ASU 2011-08 amends Topic 350, Intangibles – Goodwill and Other, to give entities the option to first assess qualitative factors to determine whether the existence of events or circumstances leads to a determination that it is more likely than not that the fair value of a reporting unit is less than its carrying amount. If, after assessing the totality of events or circumstances, an entity determines it is not more likely than not that the fair value of a reporting unit is less than its carrying amount, then performing the two-step impairment test is unnecessary. However, if an entity concludes otherwise, then it is required to perform the first step of the two-step impairment test by calculating the fair value of the reporting unit and comparing the fair value with the carrying amount of the reporting unit. ASU 2011-08 is effective for annual and interim impairment tests beginning after December 15, 2011, and did not have a significant impact on the Company’s consolidated financial statements.
FASB issued ASU No. 2011-11, Balance Sheet (Topic 210): Disclosures about Offsetting Assets and Liabilities.ASU 2011-11 requires an entity to disclose information about offsetting and related arrangements to enable users of its financial statements to understand the effect of those arrangements on its financial position. An entity is required to apply the amendments for annual reporting periods beginning on or after January 1, 2013, and interim periods within those annual periods. An entity should provide the disclosures required by those amendments retrospectively for all comparative periods presented. The Update2014-04 is not expected to have a significant impact on the Company’s consolidated financial statements.
FASB issued ASU No. 2011-12,2014-08,Comprehensive IncomePresentation of Financial Statements (Topic 220)205) and Property, Plant, and Equipment (Topic 360): DeferralReporting Discontinued Operations and Disclosures of Disposals of Components of an Entity.ASU 2014-08 improves the Effective Datedefinition of discontinued operations by limiting discontinued operations reporting to disposals of components of an entity that represent strategic shifts that have (or will have) a major effect on an entity’s operations and financial results. ASU 2014-08 requires expanded disclosures for Amendmentsdiscontinued operations that provide users of financial statements with more information about the assets, liabilities, revenues, and expenses of discontinued operations. ASU 2014-08 also requires an entity to disclose the pretax profit or loss of an individually significant component of an entity that does not qualify for discontinued operations reporting, and provide users with information about the financial effects of significant disposals that do not qualify for discontinued operations reporting. The amendments in ASU 2014-08 include several changes to the Presentation of Reclassifications of Items Out of Accumulated Other Comprehensive Income in Accounting Standards Update No. 2011-05.Codification to improve the organization and readability of Subtopic 205-20 and Subtopic 360-10, Property, Plant, and Equipment—Overall. ASU 2011-12 updates and supersedes certain pending paragraphs relating to the presentation on the face of the financial statements the effects of reclassifications out of accumulated other comprehensive income on the components of net income and other comprehensive income. This Update is effective concurrent with ASU 2011-05, and did not have a significant impact on the Company’s consolidated financial statements.
FASB issued ASU No. 2012-06,Business Combinations (Topic 805): Subsequent Accounting for an Indemnification Asset Recognized at the Acquisition Date as a Result of a Government-Assisted Acquisition of a Financial Institution.ASU 2012-06 requires that when a reporting entity recognizes an indemnification asset (in accordance with Subtopic 805-20) as a result of a government-assisted acquisition of a financial institution and subsequently a change in the cash flows expected to be collected on the indemnification asset occurs (as a result of a change in cash flows expected to be collected on the assets subject to indemnification), the reporting entity should subsequently account for the change in the measurement of the indemnification asset on the same basis as the change in the assets subject to indemnification. Any amortization of changes in value should be limited to the contractual term of the indemnification agreement (that is, the lesser of the term of the indemnification agreement and the remaining life of the indemnified assets). This Update2014-08 is effective for public business entities for annual periods, and interim impairment testsperiods within those annual periods, beginning after December 15, 2012, and2014. ASU 2014-08 is not expected to have a significant impact on the Company’s consolidated financial statements.
Note 2—Business Combinations
On September 23, 2011, the California Department of Financial Institutions closed Citizens Bank of Northern California (“Citizens”), Nevada City, California and appointed the FDIC as receiver. That same date, the Bank assumed the banking operations of CitizensFASB issued ASU No. 2014-09,Revenue from the FDIC under a whole bank purchase and assumption agreement without loss sharing. With this agreement, the Bank added one administration building and seven traditional bank branches, including two in Grass Valley, and one in each of Nevada City, Penn Valley, LakeContracts with Customers (Topic 606).The core principle of the Pines, Truckee,guidance under ASU 2014-09 is that an entity should recognize revenue to depict the transfer of promised goods or services to customers in an amount that reflects the consideration to which the entity expects to be entitled in exchange for those goods or services. ASU 2014-09 is effective for a public entity for annual reporting periods beginning after December 15, 2016, including interim periods within that reporting period. Early application is not permitted. The Company is currently evaluating the effects of ASU 2014-09 on its financial statements and Auburn, California. This acquisition isdisclosures, if any.
FASB issued ASU No. 2014-11,Transfers and Servicing (Topic 860): Repurchase-to-Maturity Transactions, Repurchase Financings, and Disclosures.ASU 2014-11 requires that repurchase-to-maturity transactions be accounted for as secured borrowings consistent with the Bank’s community banking expansion strategyaccounting for other repurchase agreements. In addition, ASU 2014-11 requires separate accounting for repurchase financings, which entails the transfer of a financial asset executed contemporaneously with a repurchase agreement with the same counterparty. ASU 2014-11 requires entities to disclose certain information about transfers accounted for as sales in transactions that are economically similar to repurchase agreements. In addition, ASU 2014-11 requires disclosures related to collateral, remaining contractual tenor and provides further opportunityof the potential risks associated with repurchase agreements, securities lending transactions and repurchase-to-maturity transactions. ASU 2014-11 is effective for public business entities for the first interim or annual period beginning after December 15, 2014. An entity is required to fillpresent changes in accounting for transactions outstanding on the effective date as a cumulative-effect adjustment to retained earnings as of the beginning of the period of adoption. Earlier application for a public business entity is prohibited. ASU 2014-11 is not expected to have a significant impact on the Company’s consolidated financial statements.
FASB issued ASU No. 2014-12,Compensation—Stock Compensation (Topic 718): Accounting for Share-Based Payments When the Terms of an Award Provide That a Performance Target Could Be achieved after the Requisite Service Period.ASU 2014-12 requires that a performance target that affects the vesting of a share-based payment award and that could be achieved after the requisite service period be treated as a performance condition. A reporting entity should apply existing guidance in Topic 718 as it relates to awards with performance conditions that affect vesting to account for such awards. As such, the performance target should not be reflected in estimating the grant-date fair value of the award. Compensation cost should be recognized in the Bank’speriod in which it becomes probable that the performance target will be achieved and should represent the compensation cost attributable to the period(s) for which the requisite service has already been rendered. If the performance target becomes probable of being achieved before the end of the requisite service period, the remaining unrecognized compensation cost should be recognized prospectively over the remaining requisite service period. The total amount of compensation cost recognized during and after the requisite service period should reflect the number of awards that are expected to vest and should be adjusted to reflect those awards that ultimately vest. The requisite service period ends when the employee can cease rendering service and still be eligible to vest in the award if the performance target is achieved. The stated vesting period (which includes the period in which the performance target could be achieved) may differ from the requisite service period. Current U.S. GAAP does not contain explicit guidance on whether to treat a performance target that could be achieved after the requisite service period as a performance condition that affects vesting or as a nonvesting condition that affects the grant-date fair value of an award. ASU 2014-12 provides explicit guidance for those awards. For all entities, ASU 2014-12 is effective for annual periods and interim periods within those annual periods beginning after December 15, 2015. Earlier adoption is permitted.
FASB issued ASU No. 2014-14,Receivables—Troubled Debt Restructurings by Creditors (Topic 310): Classification of Certain Government Mortgage Loans upon Foreclosure.ASU 2014-14 requires that a mortgage loan be derecognized and that a separate other receivable be
62
recognized upon foreclosure if the following conditions are met: 1) the loan has a government guarantee that is not separable from the loan before foreclosure, 2) at the time of foreclosure, the creditor has the intent to convey the real estate property to the guarantor and make a claim on the guarantee, and the creditor has the ability to recover under that claim, and 3) at the time of foreclosure, any amount of the claim that is determined on the basis of the fair value of the real estate is fixed. Upon foreclosure, the separate other receivable should be measured based on the amount of the loan balance (principal and interest) expected to be recovered from the guarantor. For public business entities, ASU 2014-14 is effective for annual periods and interim periods within those annual periods beginning after December 15, 2014. Earlier adoption is permitted.
Note 2 - Business Combinations
On October 3, 2014, TriCo completed its acquisition of North Valley Bancorp originally announced January 21, 2014. Based on a fixed exchange ratio of 0.9433 shares of TriCo common stock for each share of North Valley Bancorp common stock, North Valley Bancorp shareholders received 6,575,550 shares of TriCo common stock and $6,823 of cash in-lieu of fractional shares. The 6,575,550 shares of TriCo common stock issued to North Valley Bancorp shareholders represented, on a pro forma basis, approximately 28.9% of the 22,714,964 shares of the combined company outstanding on October 3, 2014. Based on TriCo’s closing stock price of $23.01 on October 3, 2014, North Valley Bancorp shareholders received consideration valued at $151,310,000 or approximately $21.71 per share of North Valley common stock outstanding.
The acquisition of North Valley Bancorp was to expand the Company’s market presence in Northern California. The customer base and locations of North Valley Bancorp’s branches had significant overlap when compared to the Company’s Northern California market.customer base and branch locations. This made North Valley Bancorp a very good fit in terms of potential cost savings and future growth potential. With the levels of excess capital at the time, the acquisitions fit well into the Company’s growth strategy.
North Valley Bancorp, was headquartered in Redding, California, and was the parent of North Valley Bank that had approximately $935 million in assets and 22 commercial banking offices in Shasta, Humboldt, Del Norte, Mendocino, Yolo, Sonoma, Placer and Trinity Counties in Northern California at June 30, 2014. In connection with the acquisition, North Valley Bank was merged into Tri Counties Bank on October 3, 2014.
On October 25, 2014, North Valley Bank’s electronic customer service and other data processing systems were converted into Tri Counties Bank’s systems. Between January 7, 2015 and January 21, 2015, four Tri Counties Bank branches and four former North Valley Bank branches were consolidated into other Tri Counties Bank or other former North Valley Bank branches.
Beginning on October 4, 2014, the effect of revenue and expenses from the operations of North Valley Bancorp, and the issuance of TriCo Bancshares common shares as consideration in the merger are included in the results of the Company.
The assets acquired and liabilities assumed for the Citizens acquisition have beenfrom North Valley Bancorp were accounted for underin accordance with ASC 805 “Business Combinations,” using the acquisition method of accounting (formerly the purchase method). The assets and liabilities, both tangible and intangible, were recorded at their estimated fair values on the October 3, 2014 acquisition date, and its results of operations are included in the Company’s consolidated statements of income since that date. The excess of the fair value of consideration transferred over total identifiable net assets was recorded as goodwill. The goodwill arising from the acquisition consists largely of the synergies and economies of scale expected from combining the operations of the Company and North Valley Bancorp. None of the goodwill is deductible for income tax purposes as the acquisition was accounted for as a tax-free exchange. The fair value estimate for loans is considered provisional as additional information related to the fair value of such loans as of October 3, 2014 may become available in the acquisition date. Thefuture. Management may adjust the fair valuesvalue of loans acquired from North Valley Bancorp for a period of up to one year from the date of the acquisition. Any adjustment to the fair value of loans acquired from North Valley Bancorp would have residual effects on deferred tax assets and goodwill.
63
The following table discloses the calculation of the fair value of consideration transferred, the total identifiable net assets acquired and liabilities assumed were determined based on the requirements ofresulting goodwill relating to the Fair Value Measurements and Disclosures topic of the FASB ASC. The tax treatment of FDIC assisted acquisitions is complex and subject to interpretations that may result in future adjustments of deferred taxes as of the acquisition date. The terms of the agreement provide for the FDIC to indemnify the Bank against claims with respect to liabilities of Citizens not assumed by the Bank and certain other types of claims identified in the agreement.
A summary of the net assets received in the Citizens acquisition, at their estimated fair values, is presented below:North Valley Bancorp acquisition:
| Citizens | ||||
| (in thousands) | September 23, 2011 | |||
Asset acquired: | ||||
Cash and cash equivalents | $ | 80,707 | ||
Securities available-for-sale | 9,353 | |||
Restricted equity securities | 1,926 | |||
Loans | 167,484 | |||
Core deposit intangible | 898 | |||
Foreclosed assets | 8,412 | |||
Other assets | 1,524 | |||
|
| |||
Total assets acquired | $ | 270,304 | ||
|
| |||
Liabilities assumed: | ||||
Deposits | $ | 239,899 | ||
Other borrowings | 22,038 | |||
Other liabilities | 792 | |||
|
| |||
Total liabilities assumed | $ | 262,729 | ||
|
| |||
Net assets acquired/bargain purchase gain | $ | 7,575 | ||
|
| |||
In FDIC-assisted transactions, only certain assets and liabilities are transferred to the acquirer and, depending on the nature and amount of the acquirer’s bid, the FDIC may be required to make a cash payment to the acquirer. In the Citizens acquisition, net assets with a cost basis of $26,682,000 were transferred to the Bank. In the Citizens acquisition, the Company recorded a bargain purchase gain of $7,575,000 representing the excess of the estimated fair value of the assets acquired over the estimated fair value of the liabilities assumed.
| (in thousands) | North Valley Bancorp October 3, 2014 | |||
Fair value of consideration transferred: | ||||
Fair value of shares issued | $ | 151,303 | ||
Cash consideration | 7 | |||
|
| |||
Total fair value of consideration transferred | 151,310 | |||
|
| |||
Asset acquired: | ||||
Cash and cash equivalents | 141,412 | |||
Securities available for sale | 17,297 | |||
Securities held to maturity | 189,949 | |||
Restricted equity securities | 5,378 | |||
Loans | 499,327 | |||
Foreclosed assets | 695 | |||
Premises and equipment | 11,936 | |||
Cash value of life insurance | 38,075 | |||
Core deposit intangible | 6,614 | |||
Other assets | 20,056 | |||
|
| |||
Total assets acquired | 930,739 | |||
|
| |||
Liabilities assumed: | ||||
Deposits | 801,956 | |||
Other liabilities | 10,429 | |||
Junior subordinated debt | 14,987 | |||
|
| |||
Total liabilities assumed | 827,372 | |||
|
| |||
Total net assets acquired | 103,367 | |||
|
| |||
Goodwill recognized | $ | 47,943 | ||
|
| |||
A summary of the estimated fair value adjustments resulting in the bargain purchase gaingoodwill recorded in the CitizensNorth Valley Bancorp acquisition are presented below:
| Citizens | ||||||||
| (in thousands) | September 23, 2011 | North Valley Bancorp October 3, 2014 | ||||||
Value of stock consideration paid to North Valley Bancorp Shareholders | 151,303 | |||||||
Cash payments to North | ||||||||
Valley Bancorp Shareholders | 7 | |||||||
Cost basis net assets acquired | $ | 26,682 | $ | (98,040 | ) | |||
Cash payment received from FDIC | 44,140 | |||||||
Fair value adjustments: | ||||||||
Cash and cash equivalents | 539 | |||||||
Loans | (57,745 | ) | 5,832 | |||||
Foreclosed assets | (5,609 | ) | ||||||
Premises and Equipment | (4,785 | ) | ||||||
Core deposit intangible | 898 | (6,283 | ) | |||||
Deposits | (382 | ) | ||||||
Borrowings | (28 | ) | ||||||
Deferred income taxes | 6,293 | |||||||
Junior subordinated debt | (6,664 | ) | ||||||
Other | (920 | ) | 280 | |||||
|
| |||||||
Bargain purchase gain | $ | 7,575 | ||||||
Goodwill | $ | 47,943 | ||||||
|
| |||||||
The Bank acquired only certain assets and assumed certain liabilitiesloan portfolio of Citizens. A significant portion of Citizens’s operations, its facilities and its central operations and administrative functions were not retained by the Bank. Therefore, disclosure of supplemental pro forma financial information, especially prior period comparison is deemed neither practical nor meaningful given the troubled nature of Citizens prior toNorth Valley Bancorp was recorded at fair value at the date of each acquisition. The Bank did not immediately acquire all the banking facilities, furniture or equipmentA valuation of CitizensNorth Valley Bancorp’s loan portfolio was performed as part of the purchaseacquisition date to assess the fair value of the loan portfolio. The North Valley Bancorp loan portfolio was segmented into two groups; loans with credit deterioration (PCI loans) and assumption agreement. However,loans without credit deterioration (PNCI). For North Valley Bancorp PNCI loans, the Bank hadpresent value of estimated future cash flows, based primarily on contractual cash flows, was used to determine fair value. For North Valley Bancorp PCI loans, the optionpresent value of estimated future cash flows, based primarily on liquidation value of collateral, was used to leasedetermine fair value.
North Valley Bancorp PNCI loans were grouped into pools based on similar loan characteristics such as loan type, payment amortization method, and fixed or variable interest rates. A discounted cash flow schedule was prepared for each pool in which the real estatepresent value of all estimated future cash flows was calculated using a specifically calculated discount rate for each pool. The discount rate used to estimate the fair value of each loan pool was composed of the sum of: an estimated cost of funds rate, an estimated capital charge reflecting the market participant required return on capital, estimated loan servicing costs, and purchasea liquidity premium. All PNCI loan pools included some estimate regarding prepayment rates, and estimated principal default and loss rates, based primarily on North Valley Bancorp’s historical loss experience. The difference between the furnituresum of recorded balances of the North Valley Bancorp PNCI loans in each pool and equipment from the FDIC.present value of each pool represented the total discount (if the recorded value exceeded the present value) or premium (if the present value exceeded the
64
recorded value) for each pool. The term of this option expired 90 days from the acquisition date. Priortotal discount, or premium, for each pool was then allocated to the expirationindividual loans within each pool based on outstanding loan balance, individual loan risk rating as compared to the weighted average risk rating of the option,pool, and the contractual payments remaining for the individual loan as compared to the pool.
North Valley Bancorp PCI loans were fair valued on an individual basis. A discounted cash flow schedule was prepared for each loan in which the present value of all future estimated cash flows was calculated using a specifically calculated discount rate, estimated liquidation value and estimated liquidation timing for each loan. The Bank agreed to purchase essentially alldiscount rate used in the calculation of the furniture and equipment, and assume allpresent value of North Valley Bancorp PCI loans was composed of the property leases exceptsum of: an estimated cost of funds rate, an estimated capital charge reflecting the market participant required return on capital, estimated loan servicing costs, and a liquidity premium. The difference between the recorded balance and the present value of each North Valley Bancorp PCI loan represented the discount for the administration building and Citizen’s Auburn branch. During the three months ended March 31, 2012, the Bank transferred the operationseach PCI loan. All North Valley Bancorp PCI loans had recorded values in excess of Citizen’s Auburn branch to the Bank’s existing branch in Auburn, and vacated the Citizen’s administration building.their present value of estimated future cash flows.
The Company identified the loans acquired in the Citizens acquisition as either PNCI or PCI loans. The Company identified certain of the CitizensNorth Valley Bancorp PCI loans as having cash flows that were not reasonably estimable and elected to placeplaced these loans in nonaccrual status under ASC 310-30 and included them in the cashcategory of loans the Company refers to as “PCI – other” loans.
The following table presents the cost basis, method forfair value discount, and fair value of loans acquired from North Valley Bancorp on October 3, 2014:
| North Valley Bancorp Acquired Loans October 3, 2014 | ||||||||||||
| (in thousands) | Cost Basis | Discount | Fair Value | |||||||||
PNCI | $ | 502,637 | $ | (12,721 | ) | $ | 489,916 | |||||
PCI – other | 11,488 | (2,077 | ) | 9,411 | ||||||||
|
|
|
|
|
| |||||||
Total | $ | 514,125 | $ | (14,798 | ) | $ | 499,327 | |||||
|
|
|
|
|
| |||||||
Although the discount on PNCI loans is completely accretable to interest income recognition (“over the remaining life of such loans, the discount on PCI – cash basis” loans). The Company electedother loans from the North Valley Bancorp acquisition are not accretable into interest income until the loan principal balance has been reduced to use the ASC 310-30 “pooled”loan’s fair value recorded at acquisition. This method of accounting for all other Citizens PCI loans (“the PCI – other” loans).other loans from the North Valley Bancorp acquisition is often referred to as the “cost recovery” method of income recognition.
The following table presents a reconciliation of the undiscounted contractual cash flows, nonaccretable difference, accretable yield, fair value, purchase discount, and principal balance of loans for the variousPNCI and PCI—other categories of Citizens PNCI and PCINorth Valley Bancorp loans as of the acquisition date. For North Valley Bancorp PCI – other loans, the purchase discount does not necessarily represent cash flows to be collected as a portion of it is a nonaccretable difference:collected:
| Citizens Loans – September 23, 2011 | North Valley Bancorp Loans – October 3, 2014 | |||||||||||||||||||||||||||
| (in thousands) | PNCI | PCI - other | PCI - cash basis | Total | PNCI | PCI—other | Total | |||||||||||||||||||||
Undiscounted contractual cash flows | $ | 230,106 | $ | 69,346 | $ | 35,205 | $ | 334,657 | $ | 718,731 | $ | 15,706 | $ | 734,437 | ||||||||||||||
Undiscounted cash flows not expected to be collected (nonaccretable difference) | — | (26,846 | ) | (24,517 | ) | (51,363 | ) | — | (6,295 | ) | (6,295 | ) | ||||||||||||||||
|
|
|
|
|
|
| ||||||||||||||||||||||
Undiscounted cash flows expected to be collected | 230,106 | 42,500 | 10,688 | 283,295 | 718,731 | 9,411 | 728,142 | |||||||||||||||||||||
Accretable yield at acquisition | (105,664 | ) | (10,146 | ) | — | (115,810 | ) | (228,815 | ) | — | (228,815 | ) | ||||||||||||||||
|
|
|
|
|
|
| ||||||||||||||||||||||
Estimated fair value of loans acquired at acquisition | 124,442 | 32,354 | 10,688 | 167,484 | 489,916 | 9,411 | 499,327 | |||||||||||||||||||||
Purchase discount | 20,364 | 23,207 | 14,174 | 57,745 | 12,721 | 2,077 | 14,798 | |||||||||||||||||||||
|
|
|
|
|
|
| ||||||||||||||||||||||
Principal balance loans acquired | $ | 144,806 | $ | 55,561 | $ | 24,862 | $ | 225,229 | $ | 502,637 | $ | 11,488 | $ | 514,125 | ||||||||||||||
|
|
|
|
|
|
| ||||||||||||||||||||||
In estimatingAs part of the fairacquisition of North Valley Bancorp, the Company performed a valuation of premises and equipment acquired. This valuation resulted in a $4,785,000 increase in the net book value of Citizens PNCI loans at the acquisition date, the Company calculated the contractual amountland and timingbuildings acquired, and was based on current appraisals of undiscounted principalsuch land and interest payments on an individual loan basis and then discounted those cash flows using an appropriate market rate of interest adjusted for liquidity and credit loss risks inherent in each loan. The Citizens PNCI loans expected accretable yield above represents undiscounted interest, and along with the purchase discount, is accounted for using an effective interest method consistent with our accounting for originated loans.buildings.
In estimating the fair value of Citizens PCI – cash basis loans at the acquisition date, the Company calculated the contractual amount and timing of undiscounted principal and interest payments and estimated the amount of undiscounted expected principal recovery using historic loss rates or estimated collateral values if applicable. The difference between these two amounts represents the nonaccretable difference. The Company used its estimaterecognized a core deposit intangible of the amount of undiscounted expected principal recovery as the fair value of the Citizens PCI – cash basis loans, and placed these loans in nonaccrual status. Interest income and principal reductions on these PCI – cash basis loans are recorded only when they are received. At each financial reporting date, the carrying value of each PCI – cash basis loan is compared to an updated estimate of expected principal payment or recovery for each loan. To the extent that the loan carrying amount exceeds the updated expected principal payment or recovery, a provision for loan loss would be recorded as a charge to income and an allowance for loan loss established.
In estimating the fair value of Citizens PCI – other loans at the acquisition date, the Company calculated the contractual amount and timing of undiscounted principal and interest payments and estimated the amount and timing of undiscounted expected principal and interest payments. The difference between these two amounts represents the nonaccretable difference. On the acquisition date, the amount by which the undiscounted expected cash flows exceed the estimated fair value of the acquired loans is the “accretable yield”. The accretable yield is then measured at each financial reporting date and represents the difference between the remaining undiscounted expected cash flows and the current carrying value of the loans. For PCI loans the accretable yield is accreted into interest income over the life of the estimated remaining cash flows. For further information regarding the accounting for PCI – other loans, and acquired loans in general, see the discussion under the heading “Loans and Allowance for Loan Losses” in Note 1 above.
The operations of Citizens, included in the Company’s operating results from September 23, 2011 to December 31, 2011, added approximately $6,171,000 and $54,000 to interest income and interest expense, respectively, $1,462,000 to provision for loan losses, $8,029,000 to noninterest income, including a bargain purchase gain of $7,575,000, and $1,865,000 to noninterest expense. Included in the $6,171,000 of Citizens$6,614,000 related interest income recorded from September 23, 2011 to December 31, 2011, is $3,146,000 of interest income from fair value discount accretion. Citizens’ results of operations prior to the acquisition are not included in the Company’s operating results. As of December 31, 2011, nonrecurring expenses related to the Citizens acquisition were insignificant.
On May 28, 2010, the OfficeA valuation of the Comptroller of the Currency closed Granite Community Bank (“Granite”), Granite Bay, California and appointed the FDIC as receiver. That same date, the Bank assumed the banking operations of Granite from the FDIC under a whole bank purchase and assumption agreement with loss sharing. Under the terms of the loss sharing agreement, the FDIC will cover a substantial portion of any future losses on loans, related unfunded loan commitments, other real estate owned (OREO)/foreclosed assets and accrued interest on loanstime deposits for up to 90 days. The FDIC will absorb 80% of losses and share in 80% of loss recoveries on the covered assets acquired from Granite. The loss sharing arrangements for non-single family residential and single family residential loans are in effect for 5 years and 10 years, respectively, and the loss recovery provisions are in effect for 8 years and 10 years, respectively, from the acquisition date. With this agreement, the Bank added one traditional bank branch in each of Granite Bay, Roseville and Auburn, California. This acquisition is consistent with the Bank’s community banking expansion strategy and provides further opportunity to fill in the Bank’s market presence in the greater Sacramento, California market.
The assets acquired and liabilities assumed for the Granite acquisition have been accounted for under the acquisition method of accounting (formerly the purchase method). The assets and liabilities, both tangible and intangible, were recorded at their estimated fair values as of the acquisition dates. The fair values of the assets acquired and liabilities assumed were determined based on the requirements of the Fair Value Measurements and Disclosures topic of the FASB ASC. The tax treatment of FDIC assisted acquisitions is complex and subject to interpretations that may result in future adjustments of deferred taxesNorth Valley Bancorp was also performed as of the acquisition date. Time deposits were split into similar pools based on size, type of time deposits, and maturity. A discounted cash flow analysis was performed on the pools based on current market rates currently paid on similar time deposits. The termsvaluation resulted in no material fair value discount or premium, and none was recorded.
The fair value of junior subordinated debentures assumed from North Valley Bancorp was estimated using a discounted cash flow method based on the current market rates for similar liabilities. As a result a discount of $6,664,000 was recorded on the junior subordinated debentures acquired from North Valley Bancorp. The discount on the subordinated debentures will be amortized using the effective yield method the remaining life to maturity of the agreements providedebentures at acquisition which range from 18 years to 21 years.
65
The Company assumed 13 lease contracts from North Valley Bancorp. The fair value measurements of theses leasehold interests were performed to determine whether the lease terms were favorable or unfavorable relative to current market rates of similar leases. The fair value of leasehold interests was recorded based on estimated future cash flow projections using market rates for similar leases. As a result, on the acquisition dates, we recorded unfavorable leasehold interests of $293,000.
The Company recorded a $6,293,000 reduction in deferred tax assets due to the tax effects of the other acquisition accounting fair value adjustments noted above, and a $1,341,000 decrease in the North Valley Bancorp deferred tax asset related to net operating loss carryforwards that the Company determined will not be realizable.
During the 2014, the Company recorded approximately $4,858,000 in one-time costs associated with the acquisition of North Valley Bancorp, including $1,269,000 that was not tax deductible. These costs included expense related to severance and other salaries and benefits expenses, consulting fees, legal fees, contract termination fees, and other expense. The system integration and conversion for North Valley Bancorp was completed during the fourth quarter of 2014. The Company consolidated four former North Valley Bank, and four Tri Counties Bank branches into other Tri Counties Bank branches or other former North Valley Bank branches during January 2015.
The table below presents the unaudited proforma information as if the acquisition of North Valley Bancorp had occurred on January 1, 2013 after giving effect to certain acquisition accounting adjustments. The proforma information for the FDICyears ended December 31, 2014 and 2013 includes acquisition adjustments for the amortization/accretion on loans, core deposit intangibles, junior subordinated debt and related income tax effects. The proforma financial information also includes one-time costs associated with the acquisitions but does not include expected costs savings synergies that we expect to indemnify the Bank against claims with respect to liabilities of Graniteachieve. The unaudited pro forma financial information is not assumed by the Bank and certain other types of claims identified in the agreement. The applicationnecessarily indicative of the acquisition methodresults of accounting resulted inoperations that would have occurred had the recognition of a bargain purchase gain of $232,000 intransaction been effected on the Granite acquisition. A summary of the net assets received in the Granite acquisition, at their estimated fair values, is presented below:assumed date.
| Granite | ||||
| (in thousands) | May 28, 2010 | |||
Asset acquired: | ||||
Cash and cash equivalents | $ | 18,764 | ||
Securities available-for-sale | 2,954 | |||
Restricted equity securities | 696 | |||
Covered loans | 64,802 | |||
Premises and equipment | 17 | |||
Core deposit intangible | 562 | |||
Covered foreclosed assets | 4,629 | |||
FDIC indemnification asset | 7,466 | |||
Other assets | 392 | |||
|
| |||
Total assets acquired | $ | 100,282 | ||
|
| |||
Liabilities assumed: | ||||
Deposits | $ | 95,001 | ||
Other borrowings | 5,000 | |||
Other liabilities | 49 | |||
|
| |||
Total liabilities assumed | 100,050 | |||
|
| |||
Net assets acquired/bargain purchase gain | $ | 232 | ||
|
| |||
| Proforma for the | ||||||||
| Year Ended December 31, | ||||||||
| 2014 | 2013 | |||||||
(Unaudited, in thousands, except per share data) | ||||||||
Summarized Income Statement Data: | ||||||||
Net interest income | $ | 139,520 | $ | 132,635 | ||||
Provision for (benefit from) loan losses | (4,045 | ) | (715 | ) | ||||
Noninterest income | 43,587 | 50,966 | ||||||
Noninterest expense | 147,295 | 133,073 | ||||||
|
|
|
| |||||
Income before income taxes | 39,857 | 51,243 | ||||||
Income taxes | 16,453 | 20,091 | ||||||
|
|
|
| |||||
Net income | $ | 23,404 | $ | 31,152 | ||||
|
|
|
| |||||
Basic earnings per share | $ | 1.03 | $ | 1.38 | ||||
Diluted earnings per share | $ | 1.02 | $ | 1.37 | ||||
The loan portfolioIt is impracticable to separately provide information regarding the revenue and foreclosed assets acquired in the Granite acquisition are covered by a loss sharing agreement between the Bank and the FDIC, and are referred to as “covered loans” and “covered foreclosed assets”, respectively. These covered loans and covered foreclosed assets are recorded in Loans and Foreclosed assets, respectively,earnings of North Valley Bancorp included in the Company’s consolidated balance sheet. Collectively these balances are referredincome statement from the October 3, 2014 acquisition date to as “covered assets”.
In FDIC-assisted transactions, only certain assets and liabilities are transferred toDecember 31, 2014 because the acquirer and, depending onoperations of North Valley Bancorp were substantially comingled with the nature and amountoperations of the acquirer’s bid, the FDIC may be required to make a cash payment to the acquirer. In the Granite acquisition, net assets with a cost basis of $4,345,000 were transferred to the Bank. In the Granite acquisition, the Company recorded a bargain purchase gain of $232,000 representing the excess of the estimated fair value of the assets acquired over the estimated fair value of the liabilities assumed.
The Bank did not immediately acquire all the real estate, banking facilities, furniture or equipment of Granite as part of the purchase and assumption agreement. However, the Bank had the option to purchase or lease the real estate and furniture and equipment from the FDIC. During the quarter ended September 30, 2010, the Bank elected to close the Roseville branch and assume the leases for the Granite Bay and Auburn branches. The Bank purchased the existing furniture and equipment in the Granite Bay and Auburn branches from the FDIC for approximately $100,000.
A summary of the estimated fair value adjustments resulting in the bargain purchase gain in the Granite acquisition are presented below:
| Granite | ||||
| (in thousands) | May 28, 2010 | |||
Cost basis net assets acquired | $ | 4,345 | ||
Cash payment received from FDIC | 3,940 | |||
Fair value adjustments: | ||||
Securities available-for-sale | (118 | ) | ||
Loans | (13,189 | ) | ||
Foreclosed assets | (2,616 | ) | ||
Core deposit intangible | 562 | |||
FDIC indemnification asset | 7,466 | |||
Deposits | (209 | ) | ||
Other | 51 | |||
|
| |||
Bargain purchase gain | $ | 232 | ||
|
| |||
Because of the significant credit discounts associated with the loans acquired in the Granite acquisition, the Company elected to account for all loans acquired in the Granite acquisition using the ASC 310-30 “pooled” method of accounting and thus categorize them as PCI – other loans.
In estimating the fair value of the covered loans at the acquisition date, we (a) calculated the contractual amount and timing of undiscounted principal and interest payments and (b) estimated the amount and timing of undiscounted expected principal and interest payments. The difference between these two amounts represents the nonaccretable difference.
On the acquisition date, the amount by which the undiscounted expected cash flows exceed the estimated fair value of the acquired loans is the “accretable yield”. The accretable yield is then measured at each financial reporting date and represents the difference between the remaining undiscounted expected cash flows and the current carrying value of the loans.
The following table presents a reconciliation of the undiscounted contractual cash flows, nonaccretable difference, accretable yield, fair value, purchase discount, and principal balance of loans for the Granite loans as of the acquisition date. For PCI loans, the purchase discount does not necessarily represent cash flows to be collected as a portionsystem conversion date of it is a nonaccretable difference:October 25, 2014.
| Granite Loans May 28, 2010 | ||||
| (in thousands) | PCI - other | |||
Undiscounted contractual cash flows | $ | 99,179 | ||
Undiscounted cash flows not expected to be collected (nonaccretable difference) | (11,226 | ) | ||
|
| |||
Undiscounted cash flows expected to be collected | 87,953 | |||
Accretable yield at acquisition | (23,151 | ) | ||
|
| |||
Estimated fair value of loans acquired at acquisition | 64,802 | |||
Purchase discount | 13,189 | |||
|
| |||
Principal balance loans acquired | $ | 77,991 | ||
|
| |||
66
Note 3—3 - Investment Securities
The amortized cost and estimated fair values of investments in debt and equity securities are summarized in the following tables:
| December 31, 2012 | December 31, 2014 | |||||||||||||||||||||||||||||||
| Amortized Cost | Gross Unrealized Gains | Gross Unrealized Losses | Estimated Fair Value | Amortized Cost | Gross Unrealized Gains | Gross Unrealized Losses | Estimated Fair Value | |||||||||||||||||||||||||
| Securities Available-for-Sale | (in thousands) | |||||||||||||||||||||||||||||||
| (in thousands) | ||||||||||||||||||||||||||||||||
Securities Available for Sale | ||||||||||||||||||||||||||||||||
Obligations of U.S. government corporations and agencies | $ | 143,633 | $ | 8,068 | — | $ | 151,701 | $ | 71,144 | 4,001 | (25 | ) | $ | 75,120 | ||||||||||||||||||
Obligations of states and political subdivisions | 9,098 | 323 | — | 9,421 | 3,130 | 45 | — | 3,175 | ||||||||||||||||||||||||
Corporate debt securities | 1,862 | 43 | — | 1,905 | 1,891 | 17 | — | 1,908 | ||||||||||||||||||||||||
Marketable equity securities | 3,000 | 2 | — | 3,002 | ||||||||||||||||||||||||||||
|
|
|
|
|
|
|
| |||||||||||||||||||||||||
Total securities available-for-sale | $ | 154,593 | $ | 8,434 | — | $ | 163,027 | |||||||||||||||||||||||||
Total securities available for sale | $ | 79,165 | $ | 4,065 | $ | (25 | ) | $ | 83,205 | |||||||||||||||||||||||
|
|
|
|
|
|
|
| |||||||||||||||||||||||||
Securities Held to Maturity | ||||||||||||||||||||||||||||||||
Obligations of U.S. government corporations and agencies | $ | 660,836 | 13,055 | (677 | ) | $ | 673,214 | |||||||||||||||||||||||||
Obligations of states and political subdivisions | 15,590 | 130 | (155 | ) | 15,565 | |||||||||||||||||||||||||||
|
|
|
| |||||||||||||||||||||||||||||
Total securities held to maturity | $ | 676,426 | $ | 13,185 | $ | (832 | ) | $ | 688,779 | |||||||||||||||||||||||
|
|
|
| |||||||||||||||||||||||||||||
| December 31, 2011 | ||||||||||||||||
| Amortized Cost | Gross Unrealized Gains | Gross Unrealized Losses | Estimated Fair Value | |||||||||||||
| Securities Available-for-Sale | (in thousands) | |||||||||||||||
Obligations of U.S. government corporations and agencies | $ | 207,284 | $ | 10,100 | — | $ | 217,384 | |||||||||
Obligations of states and political subdivision | 9,561 | 467 | — | 10,028 | ||||||||||||
Corporate debt securities | 1,848 | — | $ | (37 | ) | 1,811 | ||||||||||
|
|
|
|
|
|
|
| |||||||||
Total securities available-for-sale | $ | 218,693 | $ | 10,567 | $ | (37 | ) | $ | 229,223 | |||||||
|
|
|
|
|
|
|
| |||||||||
| December 31, 2013 | ||||||||||||||||
| Amortized Cost | Gross Unrealized Gains | Gross Unrealized Losses | Estimated Fair Value | |||||||||||||
| (in thousands) | ||||||||||||||||
Securities Available for Sale | ||||||||||||||||
Obligations of U.S. government corporations and agencies | $ | 93,055 | $ | 4,445 | $ | (357 | ) | $ | 97,143 | |||||||
Obligations of states and political subdivisions | 5,513 | 77 | (1 | ) | 5,589 | |||||||||||
Corporate debt securities | 1,877 | 38 | — | 1,915 | ||||||||||||
|
|
|
|
|
|
|
| |||||||||
Total securities available for sale | $ | 100,445 | $ | 4,560 | $ | (358 | ) | $ | 104,647 | |||||||
|
|
|
|
|
|
|
| |||||||||
Securities Held to Maturity | ||||||||||||||||
Obligations of U.S. government corporations and agencies | $ | 227,864 | $ | 298 | $ | (5,540 | ) | $ | 222,622 | |||||||
Obligations of states and political subdivisions | 12,640 | — | (1,455 | ) | 11,185 | |||||||||||
|
|
|
|
|
|
|
| |||||||||
Total securities held to maturity | $ | 240,504 | $ | 298 | $ | (6,995 | ) | $ | 233,807 | |||||||
|
|
|
|
|
|
|
| |||||||||
Investment securities totaling $14,130,000 were sold in 2014 resulting in no gain or loss on sale. No investment securities were sold during 2012, 20112013, or 2010.2012. Investment securities with an aggregate carrying value of $66,911,000$143,992,000 and $110,763,000$62,064,000 at December 31, 20122014 and 2011,2013, respectively, were pledged as collateral for specific borrowings, lines of credit and local agency deposits.
The amortized cost and estimated fair value of debt securities at December 31, 20122014 by contractual maturity are shown below. Actual maturities may differ from contractual maturities because borrowers may have the right to call or prepay obligations with or without call or prepayment penalties. At December 31, 2012,2014, obligations of U.S. government corporations and agencies with a cost basis totaling $143,633,000$755,591,000 consist almost entirely of mortgage-backed securities whose contractual maturity, or principal repayment, will follow the repayment of the underlying mortgages. For purposes of the following table, the entire outstanding balance of these mortgage-backed securities issued by U.S. government corporations and agencies is categorized based on final maturity date. At December 31, 2012,2014, the Company estimates the average remaining life of these mortgage-backed securities issued by U.S. government corporations and agencies to be approximately 3.15.3 years. Average remaining life is defined as the time span after which the principal balance has been reduced by half.
| Amortized Cost | Estimated Fair Value | |||||||||||||||||||||||
| Investment Securities | (in thousands) | Available for Sale | Held to Maturity | |||||||||||||||||||||
| (In thousands) | Amortized Cost | Estimated Fair Value | Amortized Cost | Estimated Fair Value | ||||||||||||||||||||
Due in one year | $ | 3,155 | $ | 3,282 | $ | 1,924 | $ | 1,942 | — | — | ||||||||||||||
Due after one year through five years | 5,705 | 6,022 | 1,095 | 1,135 | — | — | ||||||||||||||||||
Due after five years through ten years | 48,567 | 50,456 | 30,977 | 32,316 | $ | 1,118 | $ | 1,106 | ||||||||||||||||
Due after ten years | 97,166 | 103,267 | 45,169 | 47,812 | 675,308 | 687,673 | ||||||||||||||||||
|
|
|
|
|
| |||||||||||||||||||
Totals | 154,593 | $ | 163,027 | $ | 79,165 | $ | 83,205 | $ | 676,426 | $ | 688,779 | |||||||||||||
|
|
|
|
|
| |||||||||||||||||||
67
Gross unrealized losses on investment securities and the fair value of the related securities, aggregated by investment category and length of time that individual securities have been in a continuous unrealized loss position, were as follows:
| ||||||||||||||||||||||||
| ||||||||||||||||||||||||
| ||||||||||||||||||||||||
| ||||||||||||||||||||||||
| ||||||||||||||||||||||||
| ||||||||||||||||||||||||
| Less than 12 months | 12 months or more | Total | ||||||||||||||||||||||
| Fair Value | Unrealized Loss | Fair Value | Unrealized Loss | Fair Value | Unrealized Loss | |||||||||||||||||||
| December 31, 2014 | (in thousands) | |||||||||||||||||||||||
Securities Available for Sale: | ||||||||||||||||||||||||
Obligations of U.S. government corporations and agencies | $ | 6,774 | (25 | ) | — | — | 6,774 | (25 | ) | |||||||||||||||
Obligations of states and political subdivisions | — | — | — | — | — | — | ||||||||||||||||||
Corporate debt securities | — | — | — | — | — | — | ||||||||||||||||||
Marketable equity securities | — | — | — | — | — | — | ||||||||||||||||||
|
|
|
|
|
|
|
|
|
|
|
| |||||||||||||
Total securities available-for-sale | $ | 6,774 | (25 | ) | — | — | 6,774 | (25 | ) | |||||||||||||||
|
|
|
|
|
|
|
|
|
|
|
| |||||||||||||
Securities Held to Maturity: | ||||||||||||||||||||||||
Obligations of U.S. government corporations and agencies | $ | 335 | (1 | ) | 56,288 | (676 | ) | 56,623 | (677 | ) | ||||||||||||||
Obligations of states and political subdivisions | 1,600 | (26 | ) | 1,858 | (129 | ) | 3,458 | (155 | ) | |||||||||||||||
Corporate debt securities | — | — | — | — | — | — | ||||||||||||||||||
|
|
|
|
|
|
|
|
|
|
|
| |||||||||||||
Total securities held-to-maturity | $ | 1,935 | (27 | ) | 58,146 | (805 | ) | 60,081 | (832 | ) | ||||||||||||||
|
|
|
|
|
|
|
|
|
|
|
| |||||||||||||
| Less than 12 months | 12 months or more | Total | Less than 12 months | 12 months or more | Total | |||||||||||||||||||||||||||||||||||||||||||
| Fair Value | Unrealized Loss | Fair Value | Unrealized Loss | Fair Value | Unrealized Loss | Fair Value | Unrealized Loss | Fair Value | Unrealized Loss | Fair Value | Unrealized Loss | |||||||||||||||||||||||||||||||||||||
| (in thousands) | ||||||||||||||||||||||||||||||||||||||||||||||||
December 31, 2011 | ||||||||||||||||||||||||||||||||||||||||||||||||
Securities Available-for-Sale: | ||||||||||||||||||||||||||||||||||||||||||||||||
| December 31, 2013 | (in thousands) | |||||||||||||||||||||||||||||||||||||||||||||||
Securities Available for Sale: | ||||||||||||||||||||||||||||||||||||||||||||||||
Obligations of U.S. government corporations and agencies | $ | 10 | — | — | — | $ | 10 | — | $ | 10,287 | $ | (357 | ) | — | — | $ | 10,287 | $ | (357 | ) | ||||||||||||||||||||||||||||
Obligations of states and political subdivisions | — | — | — | — | — | — | 199 | (1 | ) | — | — | 199 | (1 | ) | ||||||||||||||||||||||||||||||||||
Corporate debt securities | 1,811 | $ | (37 | ) | — | — | 1,811 | $ | (37 | ) | — | — | — | — | — | — | ||||||||||||||||||||||||||||||||
|
|
|
|
|
|
|
|
|
|
|
| |||||||||||||||||||||||||||||||||||||
Total securities available-for-sale | $ | 1,821 | $ | (37 | ) | — | — | $ | 1,821 | $ | (37 | ) | $ | 10,486 | $ | (358 | ) | — | — | $ | 10,486 | $ | (358 | ) | ||||||||||||||||||||||||
|
|
|
|
|
|
|
|
|
|
|
| |||||||||||||||||||||||||||||||||||||
Securities Held to Maturity: | ||||||||||||||||||||||||||||||||||||||||||||||||
Obligations of U.S. government corporations and agencies | $ | 188,218 | $ | (5,540 | ) | — | — | $ | 188,218 | $ | (5,540 | ) | ||||||||||||||||||||||||||||||||||||
Obligations of states and political subdivisions | 11,185 | (1,455 | ) | — | — | 11,185 | (1,455 | ) | ||||||||||||||||||||||||||||||||||||||||
Corporate debt securities | — | — | — | — | — | — | ||||||||||||||||||||||||||||||||||||||||||
|
|
|
|
|
| |||||||||||||||||||||||||||||||||||||||||||
Total securities held-to-maturity | $ | 199,403 | $ | (6,995 | ) | — | — | $ | 199,403 | $ | (6,995 | ) | ||||||||||||||||||||||||||||||||||||
|
|
|
|
|
| |||||||||||||||||||||||||||||||||||||||||||
Obligations of U.S. government corporations and agencies: Unrealized losses on investments in obligations of U.S. government corporations and agencies are caused by interest rate increases. The contractual cash flows of these securities are guaranteed by U.S. Government Sponsored Entities (principally Fannie Mae and Freddie Mac). It is expected that the securities would not be settled at a price less than the amortized cost of the investment. Because the decline in fair value is attributable to changes in interest rates and not credit quality, and because the Company does not intend to sell and more likely than not will not be required to sell, these investments are not considered other-than-temporarily impaired. At December 31, 2012, no2014, 8 debt securities representing obligations of U.S. government corporations and agencies had unrealized losses.losses with aggregate depreciation of 1.10% from the Company’s amortized cost basis.
Obligations of states and political subdivisions: The unrealized losses on investments in obligations of states and political subdivisions were caused by increases in required yields by investors in these types of securities. It is expected that the securities would not be settled at a price less than the amortized cost of the investment. Because the decline in fair value is attributable to changes in interest rates and not credit quality, and because the Company does not intend to sell and more likely than not will not be required to sell, these investments are not considered other-than-temporarily impaired. At December 31, 2012, no2014, 5 debt securities representing obligations of states and political subdivisions had unrealized losses.losses with aggregate depreciation of 4.26% from the Company’s amortized cost basis.
Corporate debt securities: The unrealized losses on investments in corporate debt securities were caused by increases in required yields by investors in similar types of securities. It is expected that the securities would not be settled at a price less than the amortized cost of the investment. Because the decline in fair value is attributable to changes in interest rates and not credit quality, and because the Company does not intend to sell and more likely than not will not be required to sell, these investments are not considered other-than-temporarily impaired. At December 31, 2012,2014, no corporate debt securities had unrealized losses.
Marketable equity securities: At December 31, 2014, no marketable equity securities had unrealized losses.
68
Note 4—4 – Loans
A summary of loan balances follows (in thousands):
| December 31, 2012 | December 31, 2014 | |||||||||||||||||||||||||||||||||||||||
| Originated | PNCI | PCI - Cash basis | PCI - Other | Total | Originated | PNCI | PCI - Cash basis | PCI - Other | Total | |||||||||||||||||||||||||||||||
Mortgage loans on real estate: | ||||||||||||||||||||||||||||||||||||||||
Residential 1-4 family | $ | 121,255 | $ | 5,413 | — | $ | 5,016 | $ | 131,684 | $ | 154,594 | $ | 120,821 | — | $ | 4,005 | $ | 279,420 | ||||||||||||||||||||||
Commercial | 775,124 | 72,090 | $ | 1,289 | 29,943 | 878,446 | 928,797 | 376,225 | — | 30,917 | 1,335,939 | |||||||||||||||||||||||||||||
|
|
|
|
|
|
|
|
|
| |||||||||||||||||||||||||||||||
Total mortgage loan on real estate | 896,379 | 77,503 | 1,289 | 34,959 | 1,010,130 | 1,083,391 | 497,046 | — | 34,922 | 1,615,359 | ||||||||||||||||||||||||||||||
Consumer: | ||||||||||||||||||||||||||||||||||||||||
Home equity lines of credit | 311,671 | 16,788 | 7,612 | 5,954 | 342,025 | 305,166 | 38,397 | $ | 5,478 | 3,543 | 352,584 | |||||||||||||||||||||||||||||
Home equity loans | 13,011 | 342 | 49 | 155 | 13,557 | 23,559 | 6,985 | 125 | 645 | 31,314 | ||||||||||||||||||||||||||||||
Auto Indirect | 3,816 | — | — | — | 3,816 | 112 | — | — | — | 112 | ||||||||||||||||||||||||||||||
Other | 24,263 | 2,418 | — | 32 | 26,713 | 28,230 | 4,770 | — | 74 | 33,074 | ||||||||||||||||||||||||||||||
|
|
|
|
|
|
|
|
|
| |||||||||||||||||||||||||||||||
Total consumer loans | 352,761 | 19,548 | 7,661 | 6,141 | 386,111 | 357,067 | 50,152 | 5,603 | 4,262 | 417,084 | ||||||||||||||||||||||||||||||
Commercial | 125,122 | 869 | 22 | 9,515 | 135,528 | 126,611 | 40,899 | 8 | 7,427 | 174,945 | ||||||||||||||||||||||||||||||
Construction: | ||||||||||||||||||||||||||||||||||||||||
Residential | 11,877 | — | — | 6,582 | 18,459 | 21,135 | 16,808 | — | 675 | 38,618 | ||||||||||||||||||||||||||||||
Commercial | 11,196 | — | — | 3,399 | 14,595 | 24,545 | 11,973 | — | — | 36,518 | ||||||||||||||||||||||||||||||
|
|
|
|
|
|
|
|
|
| |||||||||||||||||||||||||||||||
Total construction | 23,073 | — | — | 9,981 | 33,054 | 45,680 | 28,781 | — | 675 | 75,136 | ||||||||||||||||||||||||||||||
|
|
|
|
|
|
|
|
|
| |||||||||||||||||||||||||||||||
Total loans, net of deferred loan fees | $ | 1,397,335 | $ | 97,920 | $ | 8,972 | $ | 60,596 | $ | 1,564,823 | ||||||||||||||||||||||||||||||
|
|
|
|
| ||||||||||||||||||||||||||||||||||||
Total loans, net of deferred loan fees and discounts | $ | 1,612,749 | $ | 616,878 | $ | 5,611 | $ | 47,286 | $ | 2,282,524 | ||||||||||||||||||||||||||||||
|
|
|
|
| ||||||||||||||||||||||||||||||||||||
Total principal balance of loans owed, net of charge-offs | $ | 1,400,147 | $ | 111,286 | $ | 20,621 | $ | 75,277 | $ | 1,607,331 | $ | 1,617,542 | $ | 634,490 | $ | 14,805 | $ | 56,016 | $ | 2,322,853 | ||||||||||||||||||||
Unamortized net deferred loan fees | (2,812 | ) | — | — | — | (2,812 | ) | (4,793 | ) | — | — | — | (4,793 | ) | ||||||||||||||||||||||||||
Discounts to principal balance of loans owed, net of charge-offs | — | (13,366 | ) | (11,649 | ) | (14,681 | ) | (39,696 | ) | — | (17,612 | ) | (9,194 | ) | (8,730 | ) | (35,536 | ) | ||||||||||||||||||||||
|
|
|
|
|
|
|
|
|
| |||||||||||||||||||||||||||||||
Total loans, net of unamortized deferred loan fees | $ | 1,397,335 | $ | 97,920 | $ | 8,972 | $ | 60,596 | $ | 1,564,823 | ||||||||||||||||||||||||||||||
|
|
|
|
| ||||||||||||||||||||||||||||||||||||
Total loans, net of unamortized deferred loan fees and discounts | $ | 1,612,749 | $ | 616,878 | $ | 5,611 | $ | 47,286 | $ | 2,282,524 | ||||||||||||||||||||||||||||||
|
|
|
|
| ||||||||||||||||||||||||||||||||||||
Noncovered loans | $ | 1,397,335 | $ | 97,920 | $ | 8,972 | $ | 18,708 | $ | 1,522,935 | $ | 1,612,749 | $ | 616,878 | $ | 5,611 | $ | 25,018 | $ | 2,260,256 | ||||||||||||||||||||
Covered loans | — | — | — | 41,888 | 41,888 | — | — | — | 22,268 | 22,268 | ||||||||||||||||||||||||||||||
|
|
|
|
|
|
|
|
|
| |||||||||||||||||||||||||||||||
Total loans, net of unamortized deferred loan fees | $ | 1,397,335 | $ | 97,920 | $ | 8,972 | $ | 60,596 | $ | 1,564,823 | ||||||||||||||||||||||||||||||
|
|
|
|
| ||||||||||||||||||||||||||||||||||||
Total loans, net of unamortized deferred loan fees and discounts | $ | 1,612,749 | $ | 616,878 | $ | 5,611 | $ | 47,286 | $ | 2,282,524 | ||||||||||||||||||||||||||||||
|
|
|
|
| ||||||||||||||||||||||||||||||||||||
Allowance for loan losses | $ | (35,769 | ) | $ | (1,969 | ) | $ | (1,054 | ) | $ | (3,856 | ) | $ | (42,648 | ) | $ | (29,860 | ) | $ | (3,296 | ) | $ | (348 | ) | $ | (3,081 | ) | $ | (36,585 | ) | ||||||||||
|
|
|
|
|
|
|
|
|
| |||||||||||||||||||||||||||||||
69
A summary of loan balances follows (in thousands):
| December 31, 2011 | December 31, 2013 | |||||||||||||||||||||||||||||||||||||||
| Originated | PNCI | PCI - Cash basis | PCI - Other | Total | Originated | PNCI | PCI - Cash basis | PCI - Other | Total | |||||||||||||||||||||||||||||||
Mortgage loans on real estate: | ||||||||||||||||||||||||||||||||||||||||
Residential 1-4 family | $ | 118,320 | $ | 14,750 | — | $ | 6,516 | $ | 139,586 | $ | 129,882 | $ | 60,475 | — | $ | 4,656 | $ | 195,013 | ||||||||||||||||||||||
Commercial | 699,682 | 93,428 | — | 33,226 | 826,336 | 824,912 | 57,678 | — | 30,260 | 912,850 | ||||||||||||||||||||||||||||||
|
|
|
|
|
|
|
|
|
| |||||||||||||||||||||||||||||||
Total mortgage loan on real estate | 818,002 | 108,178 | — | 39,742 | 965,922 | 954,794 | 118,153 | — | 34,916 | 1,107,863 | ||||||||||||||||||||||||||||||
Consumer: | ||||||||||||||||||||||||||||||||||||||||
Home equity lines of credit | 321,834 | 20,902 | $ | 8,615 | 5,954 | 357,305 | 316,207 | 13,576 | $ | 6,200 | 3,883 | 339,866 | ||||||||||||||||||||||||||||
Home equity loans | 14,320 | 367 | — | 157 | 14,844 | 13,849 | 253 | — | 486 | 14,588 | ||||||||||||||||||||||||||||||
Auto Indirect | 10,821 | — | — | — | 10,821 | 946 | — | — | — | 946 | ||||||||||||||||||||||||||||||
Other | 20,270 | 3,041 | — | 49 | 23,360 | 25,608 | 2,074 | — | 81 | 27,763 | ||||||||||||||||||||||||||||||
|
|
|
|
|
|
|
|
|
| |||||||||||||||||||||||||||||||
Total consumer loans | 367,245 | 24,310 | 8,615 | 6,160 | 406,330 | 356,610 | 15,903 | 6,200 | 4,450 | 383,163 | ||||||||||||||||||||||||||||||
Commercial | 123,486 | 1,805 | 811 | 13,029 | 139,131 | 124,650 | 693 | 19 | 6,516 | 131,878 | ||||||||||||||||||||||||||||||
Construction: | ||||||||||||||||||||||||||||||||||||||||
Residential | 13,908 | — | — | 8,214 | 22,122 | 30,367 | — | — | 1,566 | 31,933 | ||||||||||||||||||||||||||||||
Commercial | 12,744 | — | — | 4,783 | 17,527 | 17,125 | — | — | 45 | 17,170 | ||||||||||||||||||||||||||||||
|
|
|
|
|
|
|
|
|
| |||||||||||||||||||||||||||||||
Total construction | 26,652 | — | — | 12,997 | 39,649 | 47,492 | — | — | 1,611 | 49,103 | ||||||||||||||||||||||||||||||
|
|
|
|
|
|
|
|
|
| |||||||||||||||||||||||||||||||
Total loans, net of deferred loan fees | $ | 1,335,385 | $ | 134,293 | $ | 9,426 | $ | 71,928 | $ | 1,551,032 | ||||||||||||||||||||||||||||||
|
|
|
|
| ||||||||||||||||||||||||||||||||||||
Total loans, net of deferred loan fees and discounts | $ | 1,483,546 | $ | 134,749 | $ | 6,219 | $ | 47,493 | $ | 1,672,007 | ||||||||||||||||||||||||||||||
|
|
|
|
| ||||||||||||||||||||||||||||||||||||
Total principal balance of loans owed, net of charge-offs | $ | 1,337,693 | $ | 152,549 | $ | 22,137 | $ | 94,660 | $ | 1,607,039 | $ | 1,487,240 | $ | 142,786 | $ | 16,475 | $ | 56,879 | $ | 1,703,380 | ||||||||||||||||||||
Unamortized net deferred loan fees | (2,308 | ) | — | — | — | (2,308 | ) | (3,694 | ) | — | — | — | (3,694 | ) | ||||||||||||||||||||||||||
Discounts to principal balance of loans owed, net of charge-offs | — | (18,256 | ) | (12,711 | ) | (22,732 | ) | (53,699 | ) | — | (8,037 | ) | (10,256 | ) | (9,386 | ) | (27,679 | ) | ||||||||||||||||||||||
|
|
|
|
|
|
|
|
|
| |||||||||||||||||||||||||||||||
Total loans, net of unamortized deferred loan fees | $ | 1,335,385 | $ | 134,293 | $ | 9,426 | $ | 71,928 | $ | 1,551,032 | ||||||||||||||||||||||||||||||
|
|
|
|
| ||||||||||||||||||||||||||||||||||||
Total loans, net of unamortized deferred loan fees and discounts | $ | 1,483,546 | $ | 134,749 | $ | 6,219 | $ | 47,493 | $ | 1,672,007 | ||||||||||||||||||||||||||||||
|
|
|
|
| ||||||||||||||||||||||||||||||||||||
Noncovered loans | $ | 1,335,385 | $ | 134,293 | $ | 9,426 | $ | 22,857 | $ | 1,501,961 | $ | 1,483,546 | $ | 134,749 | $ | 6,219 | $ | 19,581 | $ | 1,644,095 | ||||||||||||||||||||
Covered loans | — | — | — | 49,071 | 49,071 | — | — | — | 27,912 | 27,912 | ||||||||||||||||||||||||||||||
|
|
|
|
|
|
|
|
|
| |||||||||||||||||||||||||||||||
Total loans, net of unamortized deferred loan fees | $ | 1,335,385 | $ | 134,293 | $ | 9,426 | $ | 71,928 | $ | 1,551,032 | ||||||||||||||||||||||||||||||
Total loans, net of unamortized deferred loan fees and discounts | $ | 1,483,546 | $ | 134,749 | $ | 6,219 | $ | 47,493 | $ | 1,672,007 | ||||||||||||||||||||||||||||||
|
|
|
|
|
|
|
|
|
| |||||||||||||||||||||||||||||||
Allowance for loan losses | $ | (31,354 | ) | $ | (2,850 | ) | $ | (385 | ) | $ | (3,656 | ) | $ | (38,245 | ) | |||||||||||||||||||||||||
|
|
|
|
| ||||||||||||||||||||||||||||||||||||
Allowance for loan loss | $ | (41,458 | ) | $ | (245 | ) | $ | (1,034 | ) | $ | (3,177 | ) | $ | (45,914 | ) | |||||||||||||||||||||||||
|
|
|
|
| ||||||||||||||||||||||||||||||||||||
The following is a summary of the change in accretable yield for PCI – other loans during the periods indicated (in thousands):
| Year ended December 31, | Year ended December 31, | |||||||||||||||
| 2012 | 2011 | 2014 | 2013 | |||||||||||||
Change in accretable yield: | ||||||||||||||||
Balance at beginning of period | $ | 25,145 | $ | 17,717 | $ | 18,232 | $ | 22,337 | ||||||||
Acquisitions | — | 10,146 | ||||||||||||||
Accretion to interest income | (7,756 | ) | (5,457 | ) | (4,368 | ) | (6,305 | ) | ||||||||
Reclassification (to) from nonaccretable difference | 4,948 | 2,739 | 1,009 | 2,201 | ||||||||||||
|
|
|
| |||||||||||||
Balance at end of period | $ | 22,337 | $ | 25,145 | $ | 14,873 | $ | 18,232 | ||||||||
|
|
|
| |||||||||||||
Throughout these financial statements, and in particular in this Note 4 and
70
Note 5 when we refer to “Loans” or “Allowance for loan losses” we mean all categories of loans, including Originated, PNCI, PCI – cash basis, and PCI – other. When we are not referring to all categories of loans, we will indicate which we are referring to – Originated, PNCI, PCI – cash basis, or PCI – other.
Note 5—Allowance for Loan Losses
The following tables summarize the activity in the allowance for loan losses, and ending balance of loans, net of unearned fees for the periods indicated.
| Allowance for Loan Losses – Year Ended December 31, 2012 | Allowance for Loan Losses - Year Ended December 31, 2014 | |||||||||||||||||||||||||||||||||||||||||||||||||||||||||||||||||||||||||||||||
| RE Mortgage | Home Equity | Auto Indirect | Other Consum. | C&I | Construction | Total | RE Mortgage | Home Equity | Auto Indirect | Other Consum. | Construction | |||||||||||||||||||||||||||||||||||||||||||||||||||||||||||||||||||||
| (in thousands) | Resid. | Comm. | Lines | Loans | Resid. | Comm. | Resid. | Comm. | Lines | Loans | C&I | Resid. | Comm. | Total | ||||||||||||||||||||||||||||||||||||||||||||||||||||||||||||||||||
Beginning balance | $ | 2,404 | $ | 13,217 | $ | 18,258 | $ | 1,101 | $ | 215 | $ | 932 | $ | 6,545 | $ | 1,817 | $ | 1,425 | $ | 45,914 | $ | 3,154 | $ | 9,700 | $ | 16,375 | $ | 1,208 | $ | 66 | $ | 589 | $ | 4,331 | $ | 1,559 | $ | 1,263 | $ | 38,245 | ||||||||||||||||||||||||||||||||||||||||
Charge-offs | (1,558 | ) | (3,457 | ) | (8,042 | ) | (385 | ) | (83 | ) | (1,202 | ) | (1,251 | ) | (406 | ) | (100 | ) | (16,484 | ) | (171 | ) | (110 | ) | (1,094 | ) | (29 | ) | (3 | ) | (599 | ) | (479 | ) | (4 | ) | (69 | ) | (2,558 | ) | ||||||||||||||||||||||||||||||||||||||||
Recoveries | 147 | 1,020 | 398 | 100 | 215 | 860 | 643 | 412 | — | 3,795 | 2 | 540 | 960 | 34 | 86 | 495 | 1,268 | 1,377 | 181 | 4,943 | ||||||||||||||||||||||||||||||||||||||||||||||||||||||||||||
Provision | 2,530 | (1,998 | ) | 10,753 | 339 | (104 | ) | 106 | (1,234 | ) | (423 | ) | (546 | ) | 9,423 | |||||||||||||||||||||||||||||||||||||||||||||||||||||||||||||||||
(Benefit) provision | 101 | (903 | ) | (565 | ) | 584 | (140 | ) | 234 | (894 | ) | (1,498 | ) | (964 | ) | (4,045 | ) | |||||||||||||||||||||||||||||||||||||||||||||||||||||||||||||||
|
|
|
|
|
|
|
|
|
|
|
|
|
|
|
|
|
|
|
| |||||||||||||||||||||||||||||||||||||||||||||||||||||||||||||
Ending balance | $ | 3,523 | $ | 8,782 | $ | 21,367 | $ | 1,155 | $ | 243 | $ | 696 | $ | 4,703 | $ | 1,400 | $ | 779 | $ | 42,648 | $ | 3,086 | $ | 9,227 | $ | 15,676 | $ | 1,797 | $ | 9 | $ | 719 | $ | 4,226 | $ | 1,434 | $ | 411 | $ | 36,585 | ||||||||||||||||||||||||||||||||||||||||
|
|
|
|
|
|
|
|
|
|
|
|
|
|
|
|
|
|
|
| |||||||||||||||||||||||||||||||||||||||||||||||||||||||||||||
Ending balance: | ||||||||||||||||||||||||||||||||||||||||||||||||||||||||||||||||||||||||||||||||
Individ. evaluated for impairment | $ | 631 | $ | 515 | $ | 2,264 | $ | 81 | $ | 5 | $ | 47 | $ | 840 | $ | 11 | $ | 111 | $ | 4,505 | $ | 974 | $ | 410 | $ | 1,974 | $ | 284 | — | $ | 142 | $ | 423 | $ | 60 | — | $ | 4,267 | ||||||||||||||||||||||||||||||||||||||||||
|
|
|
|
|
|
|
|
|
|
|
|
|
|
|
|
|
|
|
| |||||||||||||||||||||||||||||||||||||||||||||||||||||||||||||
Loans pooled for evaluation | $ | 2,526 | $ | 8,026 | $ | 17,862 | $ | 995 | $ | 238 | $ | 649 | $ | 2,342 | $ | 430 | $ | 165 | $ | 33,233 | $ | 1,915 | $ | 8,408 | $ | 13,251 | $ | 1,513 | $ | 9 | $ | 572 | $ | 2,569 | $ | 332 | $ | 322 | $ | 28,891 | ||||||||||||||||||||||||||||||||||||||||
|
|
|
|
|
|
|
|
|
|
|
|
|
|
|
|
|
|
|
| |||||||||||||||||||||||||||||||||||||||||||||||||||||||||||||
Loans acquired with deteriorated credit quality | $ | 366 | $ | 241 | $ | 1,241 | $ | 79 | — | — | $ | 1,521 | $ | 959 | $ | 503 | $ | 4,910 | $ | 197 | $ | 409 | $ | 451 | — | — | $ | 5 | $ | 1,234 | $ | 1,042 | $ | 89 | $ | 3,427 | ||||||||||||||||||||||||||||||||||||||||||||
|
|
|
|
|
|
|
|
|
|
|
|
|
|
|
|
|
|
|
| |||||||||||||||||||||||||||||||||||||||||||||||||||||||||||||
| Loans, net of unearned fees - As of December 31, 2014 | ||||||||||||||||||||||||||||||||||||||||||||||||||||||||||||||||||||||||||||||||
| RE Mortgage | Home Equity | Auto Indirect | Other Consum. | Construction | ||||||||||||||||||||||||||||||||||||||||||||||||||||||||||||||||||||||||||||
| (in thousands) | Resid. | Comm. | Lines | Loans | C&I | Resid. | Comm. | Total | ||||||||||||||||||||||||||||||||||||||||||||||||||||||||||||||||||||||||
Ending balance: | ||||||||||||||||||||||||||||||||||||||||||||||||||||||||||||||||||||||||||||||||
Total loans | $ | 279,420 | $ | 1,335,939 | $ | 352,584 | $ | 31,314 | $ | 112 | $ | 33,074 | $ | 174,945 | $ | 38,618 | $ | 35,518 | $ | 2,282,524 | ||||||||||||||||||||||||||||||||||||||||||||||||||||||||||||
|
|
|
|
|
|
|
|
|
| |||||||||||||||||||||||||||||||||||||||||||||||||||||||||||||||||||||||
Individ. evaluated for impairment | $ | 7,188 | $ | 41,932 | $ | 6,968 | $ | 1,278 | $ | 18 | $ | 323 | $ | 1,757 | $ | 2,683 | $ | 99 | $ | 62,246 | ||||||||||||||||||||||||||||||||||||||||||||||||||||||||||||
|
|
|
|
|
|
|
|
|
| |||||||||||||||||||||||||||||||||||||||||||||||||||||||||||||||||||||||
Loans pooled for evaluation | $ | 268,227 | $ | 1,263,090 | $ | 336,595 | $ | 29,266 | $ | 94 | $ | 32,677 | $ | 165,753 | $ | 35,260 | $ | 36,419 | $ | 2,167,381 | ||||||||||||||||||||||||||||||||||||||||||||||||||||||||||||
|
|
|
|
|
|
|
|
|
| |||||||||||||||||||||||||||||||||||||||||||||||||||||||||||||||||||||||
Loans acquired with deteriorated credit quality | $ | 4,005 | $ | 30,917 | $ | 9,021 | $ | 770 | — | $ | 74 | $ | 7,435 | $ | 675 | — | $ | 52,897 | ||||||||||||||||||||||||||||||||||||||||||||||||||||||||||||||
|
|
|
|
|
|
|
|
|
| |||||||||||||||||||||||||||||||||||||||||||||||||||||||||||||||||||||||
| Allowance for Loan Losses - Year Ended December 31, 2013 | ||||||||||||||||||||||||||||||||||||||||||||||||||||||||||||||||||||||||||||||||
| RE Mortgage | Home Equity | Auto Indirect | Other Consum. | Construction | ||||||||||||||||||||||||||||||||||||||||||||||||||||||||||||||||||||||||||||
| (in thousands) | Resid. | Comm. | Lines | Loans | C&I | Resid. | Comm. | Total | ||||||||||||||||||||||||||||||||||||||||||||||||||||||||||||||||||||||||
Beginning balance | $ | 3,523 | $ | 8,782 | $ | 21,367 | $ | 1,155 | $ | 243 | $ | 696 | $ | 4,703 | $ | 1,400 | $ | 779 | $ | 42,648 | ||||||||||||||||||||||||||||||||||||||||||||||||||||||||||||
Charge-offs | (46 | ) | (2,038 | ) | (2,651 | ) | (94 | ) | (68 | ) | (887 | ) | (1,599 | ) | (20 | ) | (140 | ) | (7,543 | ) | ||||||||||||||||||||||||||||||||||||||||||||||||||||||||||||
Recoveries | 345 | 994 | 1,053 | 41 | 195 | 759 | 340 | 63 | 65 | 3,855 | ||||||||||||||||||||||||||||||||||||||||||||||||||||||||||||||||||||||
(Benefit) provision | (668 | ) | 1,962 | (3,394 | ) | 106 | (304 | ) | 21 | 887 | 116 | 559 | (715 | ) | ||||||||||||||||||||||||||||||||||||||||||||||||||||||||||||||||||
|
|
|
|
|
|
|
|
|
| |||||||||||||||||||||||||||||||||||||||||||||||||||||||||||||||||||||||
Ending balance | $ | 3,154 | $ | 9,700 | $ | 16,375 | $ | 1,208 | $ | 66 | $ | 589 | $ | 4,331 | $ | 1,559 | $ | 1,263 | $ | 38,245 | ||||||||||||||||||||||||||||||||||||||||||||||||||||||||||||
|
|
|
|
|
|
|
|
|
| |||||||||||||||||||||||||||||||||||||||||||||||||||||||||||||||||||||||
Ending balance: | ||||||||||||||||||||||||||||||||||||||||||||||||||||||||||||||||||||||||||||||||
Individ. evaluated for impairment | $ | 775 | $ | 1,198 | $ | 1,140 | $ | 169 | $ | 1 | $ | 8 | $ | 585 | $ | 91 | $ | 8 | $ | 3,975 | ||||||||||||||||||||||||||||||||||||||||||||||||||||||||||||
|
|
|
|
|
|
|
|
|
| |||||||||||||||||||||||||||||||||||||||||||||||||||||||||||||||||||||||
Loans pooled for evaluation | $ | 2,039 | $ | 7,815 | $ | 14,749 | $ | 1,039 | $ | 65 | $ | 581 | $ | 2,402 | $ | 751 | $ | 789 | $ | 30,230 | ||||||||||||||||||||||||||||||||||||||||||||||||||||||||||||
|
|
|
|
|
|
|
|
|
| |||||||||||||||||||||||||||||||||||||||||||||||||||||||||||||||||||||||
Loans acquired with deteriorated credit quality | $ | 340 | $ | 687 | $ | 486 | — | — | — | $ | 1,344 | $ | 717 | $ | 466 | $ | 4,040 | |||||||||||||||||||||||||||||||||||||||||||||||||||||||||||||||
|
|
|
|
|
|
|
|
|
| |||||||||||||||||||||||||||||||||||||||||||||||||||||||||||||||||||||||
| Loans, net of unearned fees - As of December 31, 2013 | ||||||||||||||||||||||||||||||||||||||||||||||||||||||||||||||||||||||||||||||||
| RE Mortgage | Home Equity | Auto Indirect | Other Consum. | Construction | ||||||||||||||||||||||||||||||||||||||||||||||||||||||||||||||||||||||||||||
| (in thousands) | Resid. | Comm. | Lines | Loans | C&I | Resid. | Comm. | Total | ||||||||||||||||||||||||||||||||||||||||||||||||||||||||||||||||||||||||
Ending balance: | ||||||||||||||||||||||||||||||||||||||||||||||||||||||||||||||||||||||||||||||||
Total loans | $ | 195,013 | $ | 912,850 | $ | 339,866 | $ | 14,588 | $ | 946 | $ | 27,763 | $ | 131,878 | $ | 31,933 | $ | 17,170 | $ | 1,672,007 | ||||||||||||||||||||||||||||||||||||||||||||||||||||||||||||
|
|
|
|
|
|
|
|
|
| |||||||||||||||||||||||||||||||||||||||||||||||||||||||||||||||||||||||
Individ. evaluated for impairment | $ | 7,342 | $ | 59,936 | $ | 6,918 | $ | 778 | $ | 60 | $ | 90 | $ | 3,177 | $ | 2,756 | $ | 178 | $ | 81,235 | ||||||||||||||||||||||||||||||||||||||||||||||||||||||||||||
|
|
|
|
|
|
|
|
|
| |||||||||||||||||||||||||||||||||||||||||||||||||||||||||||||||||||||||
Loans pooled for evaluation | $ | 183,015 | $ | 822,654 | $ | 322,865 | $ | 13,324 | $ | 886 | $ | 27,592 | $ | 122,166 | $ | 27,611 | $ | 16,947 | $ | 1,537,060 | ||||||||||||||||||||||||||||||||||||||||||||||||||||||||||||
|
|
|
|
|
|
|
|
|
| |||||||||||||||||||||||||||||||||||||||||||||||||||||||||||||||||||||||
Loans acquired with deteriorated credit quality | $ | 4,656 | $ | 30,260 | $ | 10,083 | $ | 486 | — | $ | 81 | $ | 6,535 | $ | 1,566 | $ | 45 | $ | 53,712 | |||||||||||||||||||||||||||||||||||||||||||||||||||||||||||||
|
|
|
|
|
|
|
|
|
| |||||||||||||||||||||||||||||||||||||||||||||||||||||||||||||||||||||||
| Loans, net of unearned fees – As of December 31, 2012 | ||||||||||||||||||||||||||||||||||||||||
| RE Mortgage | Home Equity | Auto Indirect | Other Consum. | C&I | Construction | Total | ||||||||||||||||||||||||||||||||||
| (in thousands) | Resid. | Comm. | Lines | Loans | Resid. | Comm. | ||||||||||||||||||||||||||||||||||
Ending balance: | ||||||||||||||||||||||||||||||||||||||||
Total loans | $ | 131,684 | $ | 878,446 | $ | 342,025 | $ | 13,557 | $ | 3,816 | $ | 26,713 | $ | 135,528 | $ | 18,459 | $ | 14,595 | $ | 1,564,823 | ||||||||||||||||||||
|
|
|
|
|
|
|
|
|
|
|
|
|
|
|
|
|
|
|
| |||||||||||||||||||||
Individ. evaluated for impairment | $ | 6,586 | $ | 71,077 | $ | 10,056 | $ | 528 | $ | 197 | $ | 121 | $ | 8,562 | $ | 3,596 | $ | 607 | $ | 101,330 | ||||||||||||||||||||
|
|
|
|
|
|
|
|
|
|
|
|
|
|
|
|
|
|
|
| |||||||||||||||||||||
Loans pooled for evaluation | $ | 120,082 | $ | 776,137 | $ | 318,403 | $ | 12,825 | $ | 3,619 | $ | 26,560 | $ | 117,429 | $ | 8,281 | $ | 10,589 | $ | 1,393,925 | ||||||||||||||||||||
|
|
|
|
|
|
|
|
|
|
|
|
|
|
|
|
|
|
|
| |||||||||||||||||||||
Loans acquired with deteriorated credit quality | $ | 5,016 | $ | 31,232 | $ | 13,566 | $ | 204 | — | $ | 32 | $ | 9,537 | $ | 6,582 | $ | 3,399 | $ | 69,568 | |||||||||||||||||||||
|
|
|
|
|
|
|
|
|
|
|
|
|
|
|
|
|
|
|
| |||||||||||||||||||||
| Allowance for Loan Losses – Year Ended December 31, 2011 | ||||||||||||||||||||||||||||||||||||||||
| RE Mortgage | Home Equity | Auto Indirect | Other Consum. | C&I | Construction | Total | ||||||||||||||||||||||||||||||||||
| (in thousands) | Resid. | Comm. | Lines | Loans | Resid. | Comm. | ||||||||||||||||||||||||||||||||||
Beginning balance | $ | 3,007 | $ | 12,700 | $ | 15,054 | $ | 795 | $ | 1,229 | $ | 701 | $ | 5,991 | $ | 1,824 | $ | 1,270 | $ | 42,571 | ||||||||||||||||||||
Charge-offs | (1,655 | ) | (4,451 | ) | (9,746 | ) | (789 | ) | (427 | ) | (1,158 | ) | (2,534 | ) | (634 | ) | (653 | ) | (22,047 | ) | ||||||||||||||||||||
Recoveries | 126 | 127 | 573 | 45 | 379 | 839 | 173 | 28 | 40 | 2,330 | ||||||||||||||||||||||||||||||
Provision | 926 | 4,841 | 12,377 | 1,050 | (966 | ) | 550 | 2,915 | 599 | 768 | 23,060 | |||||||||||||||||||||||||||||
|
|
|
|
|
|
|
|
|
|
|
|
|
|
|
|
|
|
|
| |||||||||||||||||||||
Ending balance | $ | 2,404 | $ | 13,217 | $ | 18,258 | $ | 1,101 | $ | 215 | $ | 932 | $ | 6,545 | $ | 1,817 | $ | 1,425 | $ | 45,914 | ||||||||||||||||||||
|
|
|
|
|
|
|
|
|
|
|
|
|
|
|
|
|
|
|
| |||||||||||||||||||||
Ending balance: | ||||||||||||||||||||||||||||||||||||||||
Individ. evaluated for impairment | $ | 460 | $ | 1,620 | $ | 2,365 | $ | 73 | $ | 29 | $ | 24 | $ | 193 | $ | 258 | $ | 971 | $ | 5,993 | ||||||||||||||||||||
|
|
|
|
|
|
|
|
|
|
|
|
|
|
|
|
|
|
|
| |||||||||||||||||||||
Loans pooled for evaluation | $ | 1,750 | $ | 11,374 | $ | 14,531 | $ | 978 | $ | 186 | $ | 892 | $ | 4,618 | $ | 1,324 | $ | 57 | $ | 35,710 | ||||||||||||||||||||
|
|
|
|
|
|
|
|
|
|
|
|
|
|
|
|
|
|
|
| |||||||||||||||||||||
Loans acquired with deteriorated credit quality | $ | 194 | $ | 223 | $ | 1,362 | $ | 50 | — | $ | 16 | $ | 1,734 | $ | 235 | $ | 397 | $ | 4,211 | |||||||||||||||||||||
|
|
|
|
|
|
|
|
|
|
|
|
|
|
|
|
|
|
|
| |||||||||||||||||||||
| Loans, net of unearned fees – As of December 31, 2011 | ||||||||||||||||||||||||||||||||||||||||
| RE Mortgage | Home Equity | Auto Indirect | Other Consum. | C&I | Construction | Total | ||||||||||||||||||||||||||||||||||
| (in thousands) | Resid. | Comm. | Lines | Loans | Resid. | Comm. | ||||||||||||||||||||||||||||||||||
Ending balance: | ||||||||||||||||||||||||||||||||||||||||
Total loans | $ | 139,586 | $ | 826,336 | $ | 357,305 | $ | 14,844 | $ | 10,821 | $ | 23,360 | $ | 139,131 | $ | 22,122 | $ | 17,527 | $ | 1,551,032 | ||||||||||||||||||||
|
|
|
|
|
|
|
|
|
|
|
|
|
|
|
|
|
|
|
| |||||||||||||||||||||
Individ. evaluated for impairment | $ | 10,167 | $ | 71,893 | $ | 9,388 | $ | 661 | $ | 571 | $ | 109 | $ | 9,526 | $ | 5,627 | $ | 6,899 | $ | 114,841 | ||||||||||||||||||||
|
|
|
|
|
|
|
|
|
|
|
|
|
|
|
|
|
|
|
| |||||||||||||||||||||
Loans pooled for evaluation | $ | 122,903 | $ | 721,217 | $ | 333,348 | $ | 14,026 | $ | 10,250 | $ | 23,202 | $ | 115,765 | $ | 8,281 | $ | 5,845 | $ | 1,354,837 | ||||||||||||||||||||
|
|
|
|
|
|
|
|
|
|
|
|
|
|
|
|
|
|
|
| |||||||||||||||||||||
Loans acquired with deteriorated credit quality | $ | 6,516 | $ | 33,226 | $ | 14,569 | $ | 157 | — | $ | 49 | $ | 13,840 | $ | 8,214 | $ | 4,783 | $ | 81,354 | |||||||||||||||||||||
|
|
|
|
|
|
|
|
|
|
|
|
|
|
|
|
|
|
|
| |||||||||||||||||||||
Beginning balance Charge-offs Recoveries Provision Ending balance Ending balance: Individ. evaluated for impairment Loans pooled for evaluation Loans acquired with deteriorated credit quality Allowance for Loan Losses – Year Ended December 31, 2010 RE Mortgage Home Equity Auto
Indirect Other
Consum. C&I Construction Total (in thousands) Resid. Comm. Lines Loans Resid. Comm. $ 2,618 $ 5,071 $ 13,483 $ 940 $ 1,986 $ 616 $ 6,958 $ 2,067 $ 1,734 $ 35,473 (1,498 ) (8,281 ) (11,221 ) (1,339 ) (1,403 ) (1,687 ) (3,539 ) (4,666 ) (94 ) (33,728 ) 2 1,456 138 15 505 816 205 231 — 3,368 1,885 14,454 12,654 1,179 141 956 2,367 4,192 (370 ) 37,458 $ 3,007 $ 12,700 $ 15,054 $ 795 $ 1,229 $ 701 $ 5,991 $ 1,824 $ 1,270 $ 42,571 $ 1,654 $ 1,042 $ 2,933 $ 78 $ 239 $ 14 $ 590 $ 116 $ 279 $ 6,945 $ 1,348 $ 11,658 $ 12,097 $ 717 $ 991 $ 687 $ 4,334 $ 1,196 $ 990 $ 34,018 $ 5 — $ 24 — — — $ 1,067 $ 512 — $ 1,608
| Loans, net of unearned fees – As of December 31, 2010 | ||||||||||||||||||||||||||||||||||||||||
| RE Mortgage | Home Equity | Auto Indirect | Other Consum. | C&I | Construction | Total | ||||||||||||||||||||||||||||||||||
| (in thousands) | Resid. | Comm. | Lines | Loans | Resid. | Comm. | ||||||||||||||||||||||||||||||||||
Ending balance: | ||||||||||||||||||||||||||||||||||||||||
Total loans | $ | 130,487 | $ | 704,984 | $ | 337,809 | $ | 17,676 | $ | 24,657 | $ | 15,629 | $ | 143,413 | $ | 23,905 | $ | 21,011 | $ | 1,419,571 | ||||||||||||||||||||
|
|
|
|
|
|
|
|
|
|
|
|
|
|
|
|
|
|
|
| |||||||||||||||||||||
Individ. evaluated for impairment | $ | 12,193 | $ | 54,808 | $ | 10,741 | $ | 770 | $ | 1,386 | $ | 83 | $ | 5,978 | $ | 6,923 | $ | 7,424 | $ | 100,306 | ||||||||||||||||||||
|
|
|
|
|
|
|
|
|
|
|
|
|
|
|
|
|
|
|
| |||||||||||||||||||||
Loans pooled for evaluation | $ | 110,697 | $ | 624,437 | $ | 319,996 | $ | 16,906 | $ | 23,271 | $ | 15,546 | $ | 127,071 | $ | 12,519 | $ | 13,587 | $ | 1,264,030 | ||||||||||||||||||||
|
|
|
|
|
|
|
|
|
|
|
|
|
|
|
|
|
|
|
| |||||||||||||||||||||
Loans acquired with deteriorated credit quality | $ | 7,597 | $ | 25,739 | $ | 7,072 | — | — | — | $ | 10,364 | $ | 4,463 | — | $ | 55,235 | ||||||||||||||||||||||||
|
|
|
|
|
|
|
|
|
|
|
|
|
|
|
|
|
|
|
| |||||||||||||||||||||
| Allowance for Loan Losses - Year Ended December 31, 2012 | ||||||||||||||||||||||||||||||||||||||||
| RE Mortgage | Home Equity | Auto Indirect | Other Consum. | Construction | ||||||||||||||||||||||||||||||||||||
| (in thousands) | Resid. | Comm. | Lines | Loans | C&I | Resid. | Comm. | Total | ||||||||||||||||||||||||||||||||
Beginning balance | $ | 2,404 | $ | 13,217 | $ | 18,258 | $ | 1,101 | $ | 215 | $ | 932 | $ | 6,545 | $ | 1,817 | $ | 1,425 | $ | 45,914 | ||||||||||||||||||||
Charge-offs | (1,558 | ) | (3,457 | ) | (8,042 | ) | (385 | ) | (83 | ) | (1,202 | ) | (1,251 | ) | (406 | ) | (100 | ) | (16,484 | ) | ||||||||||||||||||||
Recoveries | 147 | 1,020 | 398 | 100 | 215 | 860 | 643 | 412 | — | 3,795 | ||||||||||||||||||||||||||||||
Provision (benefit) | 2,530 | (1,998 | ) | 10,753 | 339 | (104 | ) | 106 | (1,234 | ) | (423 | ) | (546 | ) | 9,423 | |||||||||||||||||||||||||
|
|
|
|
|
|
|
|
|
|
|
|
|
|
|
|
|
|
|
| |||||||||||||||||||||
Ending balance | $ | 3,523 | $ | 8,782 | $ | 21,367 | $ | 1,155 | $ | 243 | $ | 696 | $ | 4,703 | $ | 1,400 | $ | 779 | $ | 42,648 | ||||||||||||||||||||
|
|
|
|
|
|
|
|
|
|
|
|
|
|
|
|
|
|
|
| |||||||||||||||||||||
Ending balance: | ||||||||||||||||||||||||||||||||||||||||
Individ. evaluated for impairment | $ | 631 | $ | 515 | $ | 2,264 | $ | 81 | $ | 5 | $ | 47 | $ | 840 | $ | 11 | $ | 111 | $ | 4,505 | ||||||||||||||||||||
|
|
|
|
|
|
|
|
|
|
|
|
|
|
|
|
|
|
|
| |||||||||||||||||||||
Loans pooled for evaluation | $ | 2,526 | $ | 8,026 | $ | 17,862 | $ | 995 | $ | 238 | $ | 649 | $ | 2,342 | $ | 430 | $ | 165 | $ | 33,233 | ||||||||||||||||||||
|
|
|
|
|
|
|
|
|
|
|
|
|
|
|
|
|
|
|
| |||||||||||||||||||||
Loans acquired with deteriorated credit quality | $ | 366 | $ | 241 | $ | 1,241 | $ | 79 | — | — | $ | 1,521 | $ | 959 | $ | 503 | $ | 4,910 | ||||||||||||||||||||||
|
|
|
|
|
|
|
|
|
|
|
|
|
|
|
|
|
|
|
| |||||||||||||||||||||
| Loans, net of unearned fees – As of December 31, 2012 | ||||||||||||||||||||||||||||||||||||||||
| RE Mortgage | Home Equity | Auto Indirect | Other Consum. | Construction | ||||||||||||||||||||||||||||||||||||
| (in thousands) | Resid. | Comm. | Lines | Loans | C&I | Resid. | Comm. | Total | ||||||||||||||||||||||||||||||||
Ending balance: | ||||||||||||||||||||||||||||||||||||||||
Total loans | $ | 131,684 | $ | 878,446 | $ | 342,025 | $ | 13,557 | $ | 3,816 | $ | 26,713 | $ | 135,528 | $ | 18,459 | $ | 14,595 | $ | 1,564,823 | ||||||||||||||||||||
|
|
|
|
|
|
|
|
|
|
|
|
|
|
|
|
|
|
|
| |||||||||||||||||||||
Individ. evaluated for impairment | $ | 6,586 | $ | 71,077 | $ | 10,056 | $ | 528 | $ | 197 | $ | 121 | $ | 8,562 | $ | 3,596 | $ | 607 | $ | 101,330 | ||||||||||||||||||||
|
|
|
|
|
|
|
|
|
|
|
|
|
|
|
|
|
|
|
| |||||||||||||||||||||
Loans pooled for evaluation | $ | 120,082 | $ | 776,137 | $ | 318,403 | $ | 12,825 | $ | 3,619 | $ | 26,560 | $ | 117,429 | $ | 8,281 | $ | 10,589 | $ | 1,393,925 | ||||||||||||||||||||
|
|
|
|
|
|
|
|
|
|
|
|
|
|
|
|
|
|
|
| |||||||||||||||||||||
Loans acquired with deteriorated credit quality | $ | 5,016 | $ | 31,232 | $ | 13,566 | $ | 204 | — | $ | 32 | $ | 9,537 | $ | 6,582 | $ | 3,399 | $ | 69,568 | |||||||||||||||||||||
|
|
|
|
|
|
|
|
|
|
|
|
|
|
|
|
|
|
|
| |||||||||||||||||||||
As part of the on-going monitoring of the credit quality of the Company’s loan portfolio, management tracks certain credit quality indicators including, but not limited to, trends relating to (i) the level of criticized and classified loans, (ii) net charge-offs, (iii) non-performing loans, and (iv) delinquency within the portfolio.
The Company utilizes a risk grading system to assign a risk grade to each of its loans. Loans are graded on a scale ranging from Pass to Loss. A description of the general characteristics of the risk grades is as follows:
| • | Pass – This grade represents loans ranging from acceptable to very little or no credit risk. These loans typically meet most if not all policy standards in regard to: loan amount as a percentage of collateral value, debt service coverage, profitability, leverage, and working capital. |
| • | Special Mention – This grade represents “Other Assets Especially Mentioned” in accordance with regulatory guidelines and includes loans that display some potential weaknesses which, if left unaddressed, may result in deterioration of the repayment prospects for the asset or may inadequately protect the Company’s position in the future. These loans warrant more than normal supervision and attention. |
| • | Substandard – This grade represents “Substandard” loans in accordance with regulatory guidelines. Loans within this rating typically exhibit weaknesses that are well defined to the point that repayment is jeopardized. Loss potential is, however, not necessarily evident. The underlying collateral supporting the credit appears to have sufficient value to protect the Company from loss of principal and accrued interest, or the loan has been written down to the point where this is true. There is a definite need for a well defined workout/rehabilitation program. |
| • | Doubtful – This grade represents “Doubtful” loans in accordance with regulatory guidelines. An asset classified as Doubtful has all the weaknesses inherent in a loan classified Substandard with the added characteristic that the weaknesses make collection or liquidation in full, on the basis of currently existing facts, conditions and values, highly questionable and improbable. Pending factors include proposed merger, acquisition, or liquidation procedures, capital injection, perfecting liens on additional collateral, and financing plans. |
| • | Loss – This grade represents “Loss” loans in accordance with regulatory guidelines. A loan classified as Loss is considered uncollectible and of such little value that its continuance as a bankable asset is not warranted. This classification does not mean that the loan has absolutely no recovery or salvage value, but rather that it is not practical or desirable to defer writing off the loan, even though some recovery may be affected in the future. The portion of the loan that is graded loss should be charged off no later than the end of the quarter in which the loss is identified. |
72
The following tables present ending loan balances by loan category and risk grade for the periods indicated:
| Credit Quality Indicators – As of December 31, 2012 | ||||||||||||||||||||||||||||||||||||||||
| RE Mortgage | Home Equity | Auto Indirect | Other Consum. | C&I | Construction | Total | ||||||||||||||||||||||||||||||||||
| (in thousands) | Resid. | Comm. | Lines | Loans | Resid. | Comm. | ||||||||||||||||||||||||||||||||||
Originated loans: | ||||||||||||||||||||||||||||||||||||||||
Pass | $ | 108,946 | $ | 686,593 | $ | 291,701 | $ | 11,892 | $ | 2,949 | $ | 23,154 | $ | 113,595 | $ | 7,744 | $ | 10,221 | $ | 1,256,795 | ||||||||||||||||||||
Special mention | 3,122 | 21,184 | 6,955 | 555 | 531 | 958 | 3,224 | 285 | 356 | 37,170 | ||||||||||||||||||||||||||||||
Substandard | 9,187 | 67,347 | 13,015 | 564 | 336 | 151 | 8,303 | 3,848 | 619 | 103,370 | ||||||||||||||||||||||||||||||
|
|
|
|
|
|
|
|
|
|
|
|
|
|
|
|
|
|
|
| |||||||||||||||||||||
Total originated | $ | 121,255 | $ | 775,124 | $ | 311,671 | $ | 13,011 | $ | 3,816 | $ | 24,263 | $ | 125,122 | $ | 11,877 | $ | 11,196 | $ | 1,397,335 | ||||||||||||||||||||
|
|
|
|
|
|
|
|
|
|
|
|
|
|
|
|
|
|
|
| |||||||||||||||||||||
PNCI loans: | ||||||||||||||||||||||||||||||||||||||||
Pass | $ | 4,968 | $ | 64,917 | $ | 15,915 | $ | 342 | — | $ | 2,240 | $ | 848 | — | — | $ | 89,230 | |||||||||||||||||||||||
Special mention | — | 5,249 | 193 | — | — | 104 | 21 | — | — | 5,567 | ||||||||||||||||||||||||||||||
Substandard | 436 | 1,924 | 680 | — | — | 74 | — | — | — | 3,114 | ||||||||||||||||||||||||||||||
Loss | 9 | — | — | — | — | — | — | — | — | 9 | ||||||||||||||||||||||||||||||
|
|
|
|
|
|
|
|
|
|
|
|
|
|
|
|
|
|
|
| |||||||||||||||||||||
Total PNCI | $ | 5,413 | $ | 72,090 | $ | 16,788 | $ | 342 | — | $ | 2,418 | $ | 869 | — | — | $ | 97,920 | |||||||||||||||||||||||
|
|
|
|
|
|
|
|
|
|
|
|
|
|
|
|
|
|
|
| |||||||||||||||||||||
PCI loans | $ | 5,016 | $ | 31,232 | $ | 13,566 | $ | 204 | — | $ | 32 | $ | 9,537 | $ | 6,582 | $ | 3,399 | $ | 69,568 | |||||||||||||||||||||
|
|
|
|
|
|
|
|
|
|
|
|
|
|
|
|
|
|
|
| |||||||||||||||||||||
Total loans | $ | 131,684 | $ | 878,446 | $ | 342,025 | $ | 13,557 | $ | 3,816 | $ | 26,713 | $ | 135,528 | $ | 18,459 | $ | 14,595 | $ | 1,564,823 | ||||||||||||||||||||
|
|
|
|
|
|
|
|
|
|
|
|
|
|
|
|
|
|
|
| |||||||||||||||||||||
| Credit Quality Indicators – As of December 31, 2011 | Credit Quality Indicators – As of December 31, 2014 | |||||||||||||||||||||||||||||||||||||||||||||||||||||||||||||||||||||||||||||||
| RE Mortgage | Home Equity | Auto Indirect | Other Consum. | C&I | Construction | Total | RE Mortgage | Home Equity | Auto Indirect | Other Consum. | Construction | |||||||||||||||||||||||||||||||||||||||||||||||||||||||||||||||||||||
| (in thousands) | Resid. | Comm. | Lines | Loans | Resid. | Comm. | Resid. | Comm. | Lines | Loans | C&I | Resid. | Comm. | Total | ||||||||||||||||||||||||||||||||||||||||||||||||||||||||||||||||||
Originated loans: | ||||||||||||||||||||||||||||||||||||||||||||||||||||||||||||||||||||||||||||||||
Pass | $ | 103,611 | $ | 574,167 | $ | 305,290 | $ | 13,478 | $ | 9,686 | $ | 19,871 | $ | 107,877 | $ | 6,872 | $ | 5,387 | $ | 1,146,239 | $ | 146,949 | $ | 883,102 | $ | 292,244 | $ | 20,976 | $ | 66 | $ | 27,396 | $ | 124,707 | $ | 18,112 | $ | 24,436 | $ | 1,537,988 | ||||||||||||||||||||||||||||||||||||||||
Special mention | 1,020 | 46,518 | 1,295 | — | 33 | 10 | 6,709 | 903 | 430 | 56,918 | 1,122 | 11,521 | 3,590 | 743 | 11 | 591 | 636 | 622 | — | 18,836 | ||||||||||||||||||||||||||||||||||||||||||||||||||||||||||||
Substandard | 13,689 | 78,997 | 15,249 | 842 | 1,102 | 389 | 8,900 | 6,133 | 6,927 | 132,228 | 6,523 | 34,174 | 9,332 | 1,840 | 35 | 243 | 1,268 | 2,401 | 109 | 55,925 | ||||||||||||||||||||||||||||||||||||||||||||||||||||||||||||
Loss | — | — | — | — | — | — | — | — | — | — | ||||||||||||||||||||||||||||||||||||||||||||||||||||||||||||||||||||||
|
|
|
|
|
|
|
|
|
|
|
|
|
|
|
|
|
|
|
| |||||||||||||||||||||||||||||||||||||||||||||||||||||||||||||
Total originated | $ | 118,320 | $ | 699,682 | $ | 321,834 | $ | 14,320 | $ | 10,821 | $ | 20,270 | $ | 123,486 | $ | 13,908 | $ | 12,744 | $ | 1,335,385 | $ | 154,594 | $ | 928,797 | $ | 305,166 | $ | 23,559 | $ | 112 | $ | 28,230 | $ | 126,611 | $ | 21,135 | $ | 24,545 | $ | 1,612,749 | ||||||||||||||||||||||||||||||||||||||||
|
|
|
|
|
|
|
|
|
|
|
|
|
|
|
|
|
|
|
| |||||||||||||||||||||||||||||||||||||||||||||||||||||||||||||
PNCI loans: | ||||||||||||||||||||||||||||||||||||||||||||||||||||||||||||||||||||||||||||||||
Pass | $ | 14,576 | $ | 83,735 | $ | 20,053 | $ | 367 | — | $ | 3,034 | $ | 1,707 | — | — | $ | 123,472 | $ | 119,643 | $ | 359,537 | $ | 36,531 | $ | 6,813 | — | $ | 4,399 | $ | 40,628 | $ | 16,808 | $ | 11,973 | $ | 596,332 | ||||||||||||||||||||||||||||||||||||||||||||
Special mention | — | 9,693 | 548 | — | — | 4 | — | — | — | 10,245 | 547 | 12,979 | 936 | 147 | — | 230 | 268 | — | — | 15,107 | ||||||||||||||||||||||||||||||||||||||||||||||||||||||||||||
Substandard | 174 | — | 301 | — | — | 3 | 98 | — | — | 576 | 631 | 3,709 | 930 | 25 | — | 141 | 3 | — | — | 5,439 | ||||||||||||||||||||||||||||||||||||||||||||||||||||||||||||
Loss | — | — | — | — | — | — | — | — | — | — | ||||||||||||||||||||||||||||||||||||||||||||||||||||||||||||||||||||||
|
|
|
|
|
|
|
|
|
|
|
|
|
|
|
|
|
|
|
| |||||||||||||||||||||||||||||||||||||||||||||||||||||||||||||
Total PNCI | $ | 14,750 | $ | 93,428 | $ | 20,902 | $ | 367 | — | $ | 3,041 | $ | 1,805 | — | — | $ | 134,293 | $ | 120,821 | $ | 376,225 | $ | 38,397 | $ | 6,985 | — | $ | 4,770 | $ | 40,899 | $ | 16,808 | $ | 11,973 | $ | 616,878 | ||||||||||||||||||||||||||||||||||||||||||||
|
|
|
|
|
|
|
|
|
|
|
|
|
|
|
|
|
|
|
| |||||||||||||||||||||||||||||||||||||||||||||||||||||||||||||
PCI loans | $ | 6,516 | $ | 33,226 | $ | 14,569 | $ | 157 | — | $ | 49 | $ | 13,840 | $ | 8,214 | $ | 4,783 | $ | 81,354 | $ | 4,005 | $ | 30,917 | $ | 9,021 | $ | 770 | — | $ | 74 | $ | 7,435 | $ | 675 | — | $ | 52,897 | |||||||||||||||||||||||||||||||||||||||||||
|
|
|
|
|
|
|
|
|
|
|
|
|
|
|
|
|
|
|
| |||||||||||||||||||||||||||||||||||||||||||||||||||||||||||||
Total loans | $ | 139,586 | $ | 826,336 | $ | 357,305 | $ | 14,844 | $ | 10,821 | $ | 23,360 | $ | 139,131 | $ | 22,122 | $ | 17,527 | $ | 1,551,032 | $ | 279,420 | $ | 1,335,939 | $ | 352,584 | $ | 31,314 | $ | 112 | $ | 33,074 | $ | 174,945 | $ | 38,618 | $ | 36,518 | $ | 2,282,524 | ||||||||||||||||||||||||||||||||||||||||
|
|
|
|
|
|
|
|
|
|
|
|
|
|
|
|
|
|
|
| |||||||||||||||||||||||||||||||||||||||||||||||||||||||||||||
| Credit Quality Indicators – As of December 31, 2013 |
|
| |||||||||||||||||||||||||||||||||||||||||||||||||||||||||||||||||||||||||||||
| RE Mortgage | Home Equity | Auto Indirect | Other Consum. | Construction | ||||||||||||||||||||||||||||||||||||||||||||||||||||||||||||||||||||||||||||
| (in thousands) | Resid. | Comm. | Lines | Loans | C&I | Resid. | Comm. | Total | ||||||||||||||||||||||||||||||||||||||||||||||||||||||||||||||||||||||||
Originated loans: | ||||||||||||||||||||||||||||||||||||||||||||||||||||||||||||||||||||||||||||||||
Pass | $ | 121,969 | $ | 768,596 | $ | 203,232 | $ | 12,284 | $ | 717 | $ | 24,653 | $ | 121,580 | $ | 25,836 | $ | 16,571 | $ | 1,394,438 | ||||||||||||||||||||||||||||||||||||||||||||||||||||||||||||
Special mention | 1,265 | �� | 15,862 | 4,529 | 504 | 118 | 756 | 938 | 96 | 343 | 24,411 | |||||||||||||||||||||||||||||||||||||||||||||||||||||||||||||||||||||
Substandard | 6,648 | 40,454 | 9,446 | 1,061 | 111 | 196 | 2,122 | 4,435 | 211 | 64,684 | ||||||||||||||||||||||||||||||||||||||||||||||||||||||||||||||||||||||
Loss | — | — | — | — | — | 3 | 10 | — | — | 13 | ||||||||||||||||||||||||||||||||||||||||||||||||||||||||||||||||||||||
|
|
|
|
|
|
|
|
|
| |||||||||||||||||||||||||||||||||||||||||||||||||||||||||||||||||||||||
Total originated | $ | 129,882 | $ | 824,912 | $ | 316,207 | $ | 13,849 | $ | 946 | $ | 25,608 | $ | 124,650 | $ | 30,367 | $ | 17,125 | $ | 1,483,546 | ||||||||||||||||||||||||||||||||||||||||||||||||||||||||||||
|
|
|
|
|
|
|
|
|
| |||||||||||||||||||||||||||||||||||||||||||||||||||||||||||||||||||||||
PNCI loans: | ||||||||||||||||||||||||||||||||||||||||||||||||||||||||||||||||||||||||||||||||
Pass | $ | 59,798 | $ | 48,548 | $ | 12,716 | $ | 253 | — | $ | 2,020 | $ | 380 | — | — | $ | 123,715 | |||||||||||||||||||||||||||||||||||||||||||||||||||||||||||||||
Special mention | — | 5,810 | 195 | — | — | 18 | 313 | — | — | 6,336 | ||||||||||||||||||||||||||||||||||||||||||||||||||||||||||||||||||||||
Substandard | 677 | 3,320 | 665 | — | — | 36 | — | — | — | 4,698 | ||||||||||||||||||||||||||||||||||||||||||||||||||||||||||||||||||||||
Loss | — | — | — | — | — | — | — | — | — | — | ||||||||||||||||||||||||||||||||||||||||||||||||||||||||||||||||||||||
|
|
|
|
|
|
|
|
|
| |||||||||||||||||||||||||||||||||||||||||||||||||||||||||||||||||||||||
Total PNCI | $ | 60,475 | $ | 57,678 | $ | 13,576 | $ | 253 | — | $ | 2,074 | $ | 693 | — | — | $ | 134,749 | |||||||||||||||||||||||||||||||||||||||||||||||||||||||||||||||
|
|
|
|
|
|
|
|
|
| |||||||||||||||||||||||||||||||||||||||||||||||||||||||||||||||||||||||
PCI loans | $ | 4,656 | $ | 30,260 | $ | 10,083 | $ | 486 | — | $ | 81 | $ | 6,535 | $ | 1,566 | $ | 45 | $ | 53,712 | |||||||||||||||||||||||||||||||||||||||||||||||||||||||||||||
|
|
|
|
|
|
|
|
|
| |||||||||||||||||||||||||||||||||||||||||||||||||||||||||||||||||||||||
Total loans | $ | 195,013 | $ | 912,850 | $ | 339,866 | $ | 14,588 | $ | 946 | $ | 27,763 | $ | 131,878 | $ | 31,933 | $ | 17,170 | $ | 1,672,007 | ||||||||||||||||||||||||||||||||||||||||||||||||||||||||||||
|
|
|
|
|
|
|
|
|
| |||||||||||||||||||||||||||||||||||||||||||||||||||||||||||||||||||||||
Consumer loans, whether unsecured or secured by real estate, automobiles, or other personal property, are susceptible to three primary risks; non-payment due to income loss, over-extension of credit and, when the borrower is unable to pay, shortfall in collateral value. Typically non-payment is due to loss of job and will follow general economic trends in the marketplace driven primarily by rises in the unemployment rate. Loss of collateral value can be due to market demand shifts, damage to collateral itself or a combination of the two.
Problem consumer loans are generally identified by payment history of the borrower (delinquency). The Bank manages its consumer loan portfolios by monitoring delinquency and contacting borrowers to encourage repayment, suggest modifications if appropriate, and, when continued scheduled payments become unrealistic, initiate repossession or foreclosure through appropriate channels. Collateral values may be determined by appraisals obtained through Bank approved, licensed appraisers, qualified independent third parties, public value information (blue book values for autos), sales invoices, or other appropriate means. Appropriate valuations are obtained at initiation of the credit and periodically (every 3-12 months depending on collateral type) once repayment is questionable and the loan has been classified.
Commercial real estate loans generally fall into two categories, owner-occupied and non-owner occupied. Loans secured by owner occupied real estate are primarily susceptible to changes in the business conditions of the related business. This may be driven by, among other things, industry changes, geographic business changes, changes in the individual fortunes of the business owner, and general economic conditions and changes in business cycles. These same risks apply to commercial loans whether secured by equipment or other personal property or unsecured. Losses on loans secured by owner occupied real estate, equipment, or other personal property generally are dictated by the value of underlying collateral at the time of default and liquidation of the collateral. When default is driven by issues related specifically to the business owner, collateral values tend to provide better repayment support and may result in little or no loss. Alternatively, when default is driven by more general economic conditions, underlying collateral generally has devalued more and results in larger losses due to default. Loans secured by non-owner occupied real estate are primarily susceptible to risks associated with swings in occupancy or vacancy and related shifts in lease rates, rental rates or room rates. Most often these shifts are a result of changes in general economic or market conditions or overbuilding and resultant over-supply. Losses are dependent on value of underlying collateral at the time of default. Values are generally driven by these same factors and influenced by interest rates and required rates of return as well as changes in occupancy costs.
73
Construction loans, whether owner occupied or non-owner occupied commercial real estate loans or residential development loans, are not only susceptible to the related risks described above but the added risks of construction itself including cost over-runs, mismanagement of the project, or lack of demand or market changes experienced at time of completion. Again, losses are primarily related to underlying collateral value and changes therein as described above.
Problem C&I loans are generally identified by periodic review of financial information which may include financial statements, tax returns, rent rolls and payment history of the borrower (delinquency). Based on this information the Bank may decide to take any of several courses of action including demand for repayment, additional collateral or guarantors, and, when repayment becomes unlikely through borrower’s income and cash flow, repossession or foreclosure of the underlying collateral.
Collateral values may be determined by appraisals obtained through Bank approved, licensed appraisers, qualified independent third parties, public value information (blue book values for autos), sales invoices, or other appropriate means. Appropriate valuations are obtained at initiation of the credit and periodically (every 3-12 months depending on collateral type) once repayment is questionable and the loan has been classified.
Once a loan becomes delinquent and repayment becomes questionable, a Bank collection officer will address collateral shortfalls with the borrower and attempt to obtain additional collateral. If this is not forthcoming and payment in full is unlikely, the Bank will estimate its probable loss, using a recent valuation as appropriate to the underlying collateral less estimated costs of sale, and charge the loan down to the estimated net realizable amount. Depending on the length of time until ultimate collection, the Bank may revalue the underlying collateral and take additional charge-offs as warranted. Revaluations may occur as often as every 3-12 months depending on the underlying collateral and volatility of values. Final charge-offs or recoveries are taken when collateral is liquidated and actual loss is known. Unpaid balances on loans after or during collection and liquidation may also be pursued through lawsuit and attachment of wages or judgment liens on borrower’s other assets.
The following table shows the ending balance of current, past due, and nonaccrual originated loans by loan category as of the date indicated:
| Analysis of Past Due and Nonaccrual Originated Loans – As of December 31, 2012 | Analysis of Past Due and Nonaccrual Originated Loans – As of December 31, 2014 | |||||||||||||||||||||||||||||||||||||||||||||||||||||||||||||||||||||||||||||||
| RE Mortgage | Home Equity | Auto Indirect | Other Consum. | C&I | Construction | Total | RE Mortgage | Home Equity | Auto Indirect | Other Consum. | Construction | |||||||||||||||||||||||||||||||||||||||||||||||||||||||||||||||||||||
| (in thousands) | Resid. | Comm. | Lines | Loans | Resid. | Comm. | Resid. | Comm. | Lines | Loans | C&I | Resid. | Comm. | Total | ||||||||||||||||||||||||||||||||||||||||||||||||||||||||||||||||||
Originated loan balance: | ||||||||||||||||||||||||||||||||||||||||||||||||||||||||||||||||||||||||||||||||
Past due: | ||||||||||||||||||||||||||||||||||||||||||||||||||||||||||||||||||||||||||||||||
30-59 Days | $ | 1,702 | $ | 2,695 | $ | 3,371 | $ | 67 | $ | 77 | $ | 67 | $ | 1,848 | $ | 309 | — | $ | 10,136 | $ | 1,296 | $ | 735 | $ | 2,066 | $ | 615 | $ | 4 | $ | 64 | $ | 739 | — | — | $ | 5,519 | |||||||||||||||||||||||||||||||||||||||||||
60-89 Days | 278 | 1,578 | 819 | 33 | 40 | 40 | 138 | — | — | 2,926 | 919 | — | 296 | 192 | — | 24 | 99 | — | — | 1,530 | ||||||||||||||||||||||||||||||||||||||||||||||||||||||||||||
> 90 Days | 674 | 13,829 | 3,395 | 217 | 79 | 14 | 4,782 | 42 | $ | 94 | 23,126 | 100 | 900 | 754 | 202 | 17 | 46 | 61 | — | — | 2,080 | |||||||||||||||||||||||||||||||||||||||||||||||||||||||||||
|
|
|
|
|
|
|
|
|
|
|
|
|
|
|
|
|
|
|
| |||||||||||||||||||||||||||||||||||||||||||||||||||||||||||||
Total past due | $ | 2,654 | $ | 18,102 | $ | 7,585 | $ | 317 | $ | 196 | $ | 121 | $ | 6,768 | $ | 351 | $ | 94 | $ | 36,188 | $ | 2,315 | $ | 1,635 | $ | 3,116 | $ | 1,009 | $ | 21 | $ | 134 | $ | 899 | — | — | $ | 9,129 | ||||||||||||||||||||||||||||||||||||||||||
Current | 118,601 | 757,022 | 304,086 | 12,694 | 3,620 | 24,142 | 118,354 | 11,526 | 11,102 | 1,361,147 | 152,279 | 927,162 | 302,050 | 22,550 | 91 | 28,096 | 125,712 | 21,135 | 24,545 | 1,603,620 | ||||||||||||||||||||||||||||||||||||||||||||||||||||||||||||
|
|
|
|
|
|
|
|
|
|
|
|
|
|
|
|
|
|
|
| |||||||||||||||||||||||||||||||||||||||||||||||||||||||||||||
Total orig. loans | $ | 121,255 | $ | 775,124 | $ | 311,671 | $ | 13,011 | $ | 3,816 | $ | 24,263 | $ | 125,122 | $ | 11,877 | $ | 11,196 | $ | 1,397,335 | $ | 154,594 | $ | 928,797 | $ | 305,166 | $ | 23,559 | $ | 112 | $ | 28,230 | $ | 126,611 | $ | 21,135 | $ | 24,545 | $ | 1,612,749 | ||||||||||||||||||||||||||||||||||||||||
|
|
|
|
|
|
|
|
|
|
|
|
|
|
|
|
|
|
|
| |||||||||||||||||||||||||||||||||||||||||||||||||||||||||||||
> 90 Days and still accruing | — | — | — | — | — | — | — | — | — | — | — | — | — | — | — | — | — | — | — | — | ||||||||||||||||||||||||||||||||||||||||||||||||||||||||||||
|
|
|
|
|
|
|
|
|
|
|
|
|
|
|
|
|
|
|
| |||||||||||||||||||||||||||||||||||||||||||||||||||||||||||||
Nonaccrual loans | $ | 4,781 | $ | 37,220 | $ | 8,486 | $ | 465 | $ | 174 | $ | 49 | $ | 6,750 | $ | 3,312 | $ | 532 | $ | 61,769 | $ | 3,430 | $ | 20,736 | $ | 4,336 | $ | 1,197 | $ | 18 | $ | 66 | $ | 246 | $ | 2,401 | $ | 99 | $ | 32,529 | ||||||||||||||||||||||||||||||||||||||||
|
|
|
|
|
|
|
|
|
|
|
|
|
|
|
|
|
|
|
| |||||||||||||||||||||||||||||||||||||||||||||||||||||||||||||
The following table shows the ending balance of current, past due, and nonaccrual PNCI loans by loan category as of the date indicated:
| Analysis of Past Due and Nonaccrual PNCI Loans – As of December 31, 2012 | Analysis of Past Due and Nonaccrual PNCI Loans – As of December 31, 2014 | |||||||||||||||||||||||||||||||||||||||||||||||||||||||||||||||||||||||||||||||
| RE Mortgage | Home Equity | Auto Indirect | Other Consum. | C&I | Construction | Total | RE Mortgage | Home Equity | Auto Indirect | Other Consum. | C&I | Construction | ||||||||||||||||||||||||||||||||||||||||||||||||||||||||||||||||||||
| (in thousands) | Resid. | Comm. | Lines | Loans | Resid. | Comm. | Resid. | Comm. | Lines | Loans | Resid. | Comm. | Total | |||||||||||||||||||||||||||||||||||||||||||||||||||||||||||||||||||
PNCI loan balance: | ||||||||||||||||||||||||||||||||||||||||||||||||||||||||||||||||||||||||||||||||
Past due: | ||||||||||||||||||||||||||||||||||||||||||||||||||||||||||||||||||||||||||||||||
30-59 Days | $ | 1,024 | $ | 500 | $ | 124 | — | — | $ | 31 | — | — | — | $ | 1,679 | $ | 2,041 | $ | 260 | $ | 275 | — | — | $ | 25 | $ | 67 | — | — | $ | 2,668 | |||||||||||||||||||||||||||||||||||||||||||||||||
60-89 Days | — | — | 63 | — | — | — | — | — | — | 63 | 24 | — | 118 | — | — | 3 | — | — | — | 145 | ||||||||||||||||||||||||||||||||||||||||||||||||||||||||||||
> 90 Days | 43 | 148 | 157 | — | — | — | — | — | — | 348 | 239 | — | 73 | 25 | — | 76 | — | — | — | 413 | ||||||||||||||||||||||||||||||||||||||||||||||||||||||||||||
|
|
|
|
|
|
|
|
|
|
|
|
|
|
|
|
|
|
|
| |||||||||||||||||||||||||||||||||||||||||||||||||||||||||||||
Total past due | $ | 1,067 | $ | 648 | $ | 344 | — | — | $ | 31 | — | — | — | $ | 2,090 | $ | 2,304 | $ | 260 | $ | 466 | $ | 25 | — | $ | 104 | $ | 67 | — | — | $ | 3,226 | ||||||||||||||||||||||||||||||||||||||||||||||||
Current | 4,346 | 71,442 | 16,444 | $ | 342 | — | 2,387 | $ | 869 | — | — | 95,830 | 118,517 | 375,965 | 37,931 | 6,960 | — | 4,666 | 40,832 | 16,808 | 11,973 | $ | 613,652 | |||||||||||||||||||||||||||||||||||||||||||||||||||||||||
|
|
|
|
|
|
|
|
|
|
|
|
|
|
|
|
|
|
|
| |||||||||||||||||||||||||||||||||||||||||||||||||||||||||||||
Total PNCI loans | $ | 5,413 | $ | 72,090 | $ | 16,788 | $ | 342 | — | $ | 2,418 | $ | 869 | — | — | $ | 97,920 | $ | 120,821 | $ | 376,225 | $ | 38,397 | $ | 6,985 | — | $ | 4,770 | $ | 40,899 | $ | 16,808 | $ | 11,973 | $ | 616,878 | ||||||||||||||||||||||||||||||||||||||||||||
|
|
|
|
|
|
|
|
|
|
|
|
|
|
|
|
|
|
|
| |||||||||||||||||||||||||||||||||||||||||||||||||||||||||||||
> 90 Days and still accruing | — | — | — | — | — | — | — | — | — | — | — | — | — | — | — | — | — | — | — | — | ||||||||||||||||||||||||||||||||||||||||||||||||||||||||||||
|
|
|
|
|
|
|
|
|
|
|
|
|
|
|
|
|
|
|
| |||||||||||||||||||||||||||||||||||||||||||||||||||||||||||||
Nonaccrual loans | $ | 113 | $ | 1,218 | $ | 403 | — | — | $ | 42 | — | — | — | $ | 1,776 | $ | 799 | $ | 366 | $ | 346 | $ | 25 | — | $ | 110 | — | — | — | $ | 1,646 | |||||||||||||||||||||||||||||||||||||||||||||||||
|
|
|
|
|
|
|
|
|
|
|
|
|
|
|
|
|
|
|
| |||||||||||||||||||||||||||||||||||||||||||||||||||||||||||||
74
The following table shows the ending balance of current, past due, and nonaccrual originated loans by loan category as of the date indicated:
| Analysis of Past Due and Nonaccrual Originated Loans – As of December 31, 2011 | Analysis of Past Due and Nonaccrual Originated Loans – As of December 31, 2013 | |||||||||||||||||||||||||||||||||||||||||||||||||||||||||||||||||||||||||||||||
| RE Mortgage | Home Equity | Auto Indirect | Other Consum. | C&I | Construction | Total | RE Mortgage | Home Equity | Auto Indirect | Other Consum. | C&I | Construction | ||||||||||||||||||||||||||||||||||||||||||||||||||||||||||||||||||||
| (in thousands) | Resid. | Comm. | Lines | Loans | Resid. | Comm. | Resid. | Comm. | Lines | Loans | Resid. | Comm. | Total | |||||||||||||||||||||||||||||||||||||||||||||||||||||||||||||||||||
Originated loan balance: | ||||||||||||||||||||||||||||||||||||||||||||||||||||||||||||||||||||||||||||||||
Past due: | ||||||||||||||||||||||||||||||||||||||||||||||||||||||||||||||||||||||||||||||||
30-59 Days | $ | 1,715 | $ | 7,509 | $ | 2,586 | $ | 52 | $ | 181 | $ | 46 | $ | 683 | $ | 921 | — | $ | 13,693 | $ | 2,272 | $ | 2,304 | $ | 3,121 | $ | 264 | $ | 24 | $ | 40 | $ | 296 | — | — | $ | 8,321 | |||||||||||||||||||||||||||||||||||||||||||
60-89 Days | 750 | 1,171 | 2,629 | 281 | 56 | 153 | 1,334 | 92 | — | 6,466 | 284 | — | 1,070 | 16 | 1 | 16 | 76 | — | $ | 198 | 1,661 | |||||||||||||||||||||||||||||||||||||||||||||||||||||||||||
> 90 Days | 3,279 | 9,892 | 3,129 | 114 | 130 | 5 | 4,929 | 2,088 | — | 23,566 | 447 | 2,213 | 1,050 | 312 | 33 | 7 | 749 | 13 | — | 4,824 | ||||||||||||||||||||||||||||||||||||||||||||||||||||||||||||
|
|
|
|
|
|
|
|
|
|
|
|
|
|
|
|
|
|
|
| |||||||||||||||||||||||||||||||||||||||||||||||||||||||||||||
Total past due | 5,744 | 18,572 | 8,344 | 447 | 367 | 204 | 6,946 | 3,101 | — | 43,725 | $ | 3,003 | $ | 4,517 | $ | 5,241 | $ | 592 | $ | 58 | $ | 63 | $ | 1,121 | $ | 13 | $ | 198 | $ | 14,806 | ||||||||||||||||||||||||||||||||||||||||||||||||||
Current | 112,576 | 681,110 | 313,490 | 13,873 | 10,454 | 20,066 | 116,540 | 10,807 | 12,744 | 1,291,660 | 126,879 | 820,395 | 310,966 | 13,257 | 888 | 25,545 | 123,529 | 30,354 | 16,927 | 1,468,740 | ||||||||||||||||||||||||||||||||||||||||||||||||||||||||||||
|
|
|
|
|
|
|
|
|
|
|
|
|
|
|
|
|
|
|
| |||||||||||||||||||||||||||||||||||||||||||||||||||||||||||||
Total orig. loans | $ | 118,320 | $ | 699,682 | $ | 321,834 | $ | 14,320 | $ | 10,821 | $ | 20,270 | $ | 123,486 | $ | 13,908 | $ | 12,744 | $ | 1,335,385 | $ | 129,882 | $ | 824,912 | $ | 316,207 | $ | 13,849 | $ | 946 | 25,608 | $ | 124,650 | $ | 30,367 | $ | 17,125 | $ | 1,483,546 | |||||||||||||||||||||||||||||||||||||||||
|
|
|
|
|
|
|
|
|
|
|
|
|
|
|
|
|
|
|
| |||||||||||||||||||||||||||||||||||||||||||||||||||||||||||||
> 90 Days and still accruing | — | $ | 500 | — | — | — | — | — | — | — | $ | 500 | — | — | — | — | — | — | — | — | — | — | ||||||||||||||||||||||||||||||||||||||||||||||||||||||||||
|
|
|
|
|
|
|
|
|
|
|
|
|
|
|
|
|
|
|
| |||||||||||||||||||||||||||||||||||||||||||||||||||||||||||||
Nonaccrual loans | $ | 8,525 | $ | 43,765 | $ | 8,307 | $ | 509 | $ | 509 | $ | 109 | $ | 7,257 | $ | 5,627 | $ | 667 | $ | 75,275 | $ | 4,697 | $ | 30,732 | $ | 4,972 | $ | 719 | $ | 54 | $ | 26 | $ | 1,280 | $ | 2,473 | $ | 178 | $ | 45,131 | ||||||||||||||||||||||||||||||||||||||||
|
|
|
|
|
|
|
|
|
|
|
|
|
|
|
|
|
|
|
| |||||||||||||||||||||||||||||||||||||||||||||||||||||||||||||
The following table shows the ending balance of current, past due, and nonaccrual PNCI loans by loan category as of the date indicated:
| Analysis of Past Due and Nonaccrual PNCI Loans – As of December 31, 2011 | ||||||||||||||||||||||||||||||||||||||||
| RE Mortgage | Home Equity | Auto Indirect | Other Consum. | C&I | Construction | Total | ||||||||||||||||||||||||||||||||||
| (in thousands) | Resid. | Comm. | Lines | Loans | Resid. | Comm. | ||||||||||||||||||||||||||||||||||
PNCI loan balance: | ||||||||||||||||||||||||||||||||||||||||
Past due: | ||||||||||||||||||||||||||||||||||||||||
30-59 Days | — | $ | 118 | $ | 63 | — | — | — | — | — | — | $ | 181 | |||||||||||||||||||||||||||
60-89 Days | $ | 76 | — | 39 | — | — | — | — | — | — | 115 | |||||||||||||||||||||||||||||
> 90 Days | — | 420 | 14 | — | — | — | — | — | — | 434 | ||||||||||||||||||||||||||||||
|
|
|
|
|
|
|
|
|
|
|
|
|
|
|
|
|
|
|
| |||||||||||||||||||||
Total past due | 76 | 538 | 116 | — | — | — | — | — | — | 730 | ||||||||||||||||||||||||||||||
Current | 14,674 | 92,890 | 20,786 | $ | 367 | — | $ | 3,041 | $ | 1,805 | — | — | 133,563 | |||||||||||||||||||||||||||
|
|
|
|
|
|
|
|
|
|
|
|
|
|
|
|
|
|
|
| |||||||||||||||||||||
Total PNCI loans | $ | 14,750 | $ | 93,428 | $ | 20,902 | $ | 367 | — | $ | 3,041 | $ | 1,805 | — | — | $ | 134,293 | |||||||||||||||||||||||
|
|
|
|
|
|
|
|
|
|
|
|
|
|
|
|
|
|
|
| |||||||||||||||||||||
> 90 Days and still accruing | — | $ | 420 | — | — | — | — | — | — | — | $ | 420 | ||||||||||||||||||||||||||||
|
|
|
|
|
|
|
|
|
|
|
|
|
|
|
|
|
|
|
| |||||||||||||||||||||
Nonaccrual loans | — | — | $ | 110 | — | — | — | — | — | — | $ | 110 | ||||||||||||||||||||||||||||
|
|
|
|
|
|
|
|
|
|
|
|
|
|
|
|
|
|
|
| |||||||||||||||||||||
PNCI loan balance: Past due: 30-59 Days 60-89 Days > 90 Days Total past due Current Total PNCI loans > 90 Days and still accruing Nonaccrual loans Analysis of Past Due and Nonaccrual PNCI Loans – As of December 31, 2013 RE Mortgage Home Equity Auto
Indirect Other Construction (in thousands) Resid. Comm. Lines Loans Consum. C&I Resid. Comm. Total $ 799 $ 512 $ 313 — — $ 49 — — — $ 1,673 — 352 38 — — — — — — 390 — 217 — — — — — — — 217 $ 799 $ 1,081 $ 351 — — $ 49 — — — $ 2,280 59,676 56,597 13,225 $ 253 — 2,025 $ 693 — — 132,469 $ 60,475 $ 57,678 $ 13,576 $ 253 — $ 2,074 $ 693 — — $ 134,749 — — — — — — — — — — $ 262 $ 1,139 $ 429 — — $ 36 — — — $ 1,866
Impaired originated loans are those where management has concluded that it is probable that the borrower will be unable to pay all amounts due under the contractual terms. The following tables show the recorded investment (financial statement balance), unpaid principal balance, average recorded investment, and interest income recognized for impaired Originated and PNCI loans, segregated by those with no related allowance recorded and those with an allowance recorded for the periods indicated.
| Impaired Originated Loans – As of December 31, 2012 | Impaired Originated Loans – As of December 31, 2014 | |||||||||||||||||||||||||||||||||||||||||||||||||||||||||||||||||||||||||||||||
| RE Mortgage | Home Equity | Auto Indirect | Other Consum. | C&I | Construction | Total | RE Mortgage | Home Equity | Auto Indirect | Other Consum. | Construction | |||||||||||||||||||||||||||||||||||||||||||||||||||||||||||||||||||||
| (in thousands) | Resid. | Comm. | Lines | Loans | Resid. | Comm. | Resid. | Comm. | Lines | Loans | C&I | Resid. | Comm. | Total | ||||||||||||||||||||||||||||||||||||||||||||||||||||||||||||||||||
With no related allowance recorded: | ||||||||||||||||||||||||||||||||||||||||||||||||||||||||||||||||||||||||||||||||
Recorded investment | $ | 3,520 | $ | 66,031 | $ | 4,241 | $ | 361 | $ | 163 | $ | 19 | $ | 4,238 | $ | 3,554 | $ | 284 | $ | 82,411 | $ | 3,287 | $ | 38,477 | $ | 3,001 | $ | 750 | $ | 14 | $ | 25 | $ | 412 | $ | 2,401 | $ | 99 | $ | 48,466 | ||||||||||||||||||||||||||||||||||||||||
|
|
|
|
|
|
|
|
|
|
|
|
|
|
|
|
|
|
|
| |||||||||||||||||||||||||||||||||||||||||||||||||||||||||||||
Unpaid principal | $ | 5,349 | $ | 70,709 | $ | 6,691 | $ | 781 | $ | 311 | $ | 40 | $ | 4,613 | $ | 8,227 | $ | 484 | $ | 97,205 | $ | 5,138 | $ | 41,949 | $ | 6,094 | $ | 1,187 | $ | 49 | $ | 32 | $ | 433 | $ | 6,588 | $ | 190 | $ | 61,660 | ||||||||||||||||||||||||||||||||||||||||
|
|
|
|
|
|
|
|
|
|
|
|
|
|
|
|
|
|
|
| |||||||||||||||||||||||||||||||||||||||||||||||||||||||||||||
Average recorded Investment | $ | 6,329 | $ | 61,299 | $ | 4,311 | $ | 329 | $ | 263 | $ | 42 | $ | 7,500 | $ | 3,505 | $ | 517 | $ | 84,095 | $ | 3,826 | $ | 45,915 | $ | 3,355 | $ | 651 | $ | 35 | $ | 21 | $ | 1,030 | $ | 2,437 | $ | 84 | $ | 57,354 | ||||||||||||||||||||||||||||||||||||||||
|
|
|
|
|
|
|
|
|
|
|
|
|
|
|
|
|
|
|
| |||||||||||||||||||||||||||||||||||||||||||||||||||||||||||||
Interest income Recognized | $ | 71 | $ | 2,513 | $ | 58 | $ | 1 | $ | 3 | — | $ | 73 | $ | 20 | $ | 10 | $ | 2,749 | $ | 38 | $ | 995 | $ | 26 | $ | 6 | — | $ | 1 | $ | 26 | — | $ | 3 | $ | 1,095 | |||||||||||||||||||||||||||||||||||||||||||
|
|
|
|
|
|
|
|
|
|
|
|
|
|
|
|
|
|
|
| |||||||||||||||||||||||||||||||||||||||||||||||||||||||||||||
With an allowance recorded: | ||||||||||||||||||||||||||||||||||||||||||||||||||||||||||||||||||||||||||||||||
Recorded investment | $ | 2,867 | $ | 3,258 | $ | 5,412 | $ | 167 | $ | 34 | $ | 30 | $ | 4,324 | $ | 42 | $ | 323 | $ | 16,457 | $ | 2,724 | $ | 2,943 | $ | 3,185 | $ | 504 | $ | 4 | $ | 41 | $ | 1,338 | $ | 282 | — | $ | 11,021 | |||||||||||||||||||||||||||||||||||||||||
|
|
|
|
|
|
|
|
|
|
|
|
|
|
|
|
|
|
|
| |||||||||||||||||||||||||||||||||||||||||||||||||||||||||||||
Unpaid principal | $ | 3,432 | $ | 3,556 | $ | 7,103 | $ | 396 | $ | 51 | $ | 32 | $ | 4,992 | $ | 42 | $ | 523 | $ | 20,127 | $ | 2,865 | $ | 3,101 | $ | 3,533 | $ | 597 | $ | 6 | $ | 41 | $ | 1,438 | $ | 282 | — | $ | 11,863 | |||||||||||||||||||||||||||||||||||||||||
|
|
|
|
|
|
|
|
|
|
|
|
|
|
|
|
|
|
|
| |||||||||||||||||||||||||||||||||||||||||||||||||||||||||||||
Related allowance | $ | 603 | $ | 352 | $ | 2,237 | $ | 81 | $ | 5 | $ | 12 | $ | 840 | $ | 11 | $ | 111 | $ | 4,252 | $ | 797 | $ | 302 | $ | 1,769 | $ | 284 | — | $ | 11 | $ | 423 | $ | 60 | — | $ | 3,646 | ||||||||||||||||||||||||||||||||||||||||||
|
|
|
|
|
|
|
|
|
|
|
|
|
|
|
|
|
|
|
| |||||||||||||||||||||||||||||||||||||||||||||||||||||||||||||
Average recorded Investment | $ | 3,890 | $ | 7,841 | $ | 6,331 | $ | 317 | $ | 102 | $ | 49 | $ | 2,800 | $ | 1,543 | $ | 6,570 | $ | 29,443 | $ | 2,677 | $ | 4,119 | $ | 2,982 | $ | 365 | $ | 4 | $ | 25 | $ | 1,428 | $ | 283 | $ | 55 | $ | 11,938 | ||||||||||||||||||||||||||||||||||||||||
|
|
|
|
|
|
|
|
|
|
|
|
|
|
|
|
|
|
|
| |||||||||||||||||||||||||||||||||||||||||||||||||||||||||||||
Interest income Recognized | $ | 67 | $ | 129 | $ | 103 | $ | 16 | $ | 1 | $ | 1 | $ | 100 | $ | 6 | $ | 5 | $ | 428 | $ | 91 | $ | 144 | $ | 71 | $ | 13 | — | — | $ | 71 | $ | 19 | — | $ | 409 | |||||||||||||||||||||||||||||||||||||||||||
|
|
|
|
|
|
|
|
|
|
|
|
|
|
|
|
|
|
|
| |||||||||||||||||||||||||||||||||||||||||||||||||||||||||||||
| Impaired PNCI Loans – As of December 31, 2012 | ||||||||||||||||||||||||||||||||||||||||
| RE Mortgage | Home Equity | Auto Indirect | Other Consum. | C&I | Construction | Total | ||||||||||||||||||||||||||||||||||
| (in thousands) | Resid. | Comm. | Lines | Loans | Resid. | Comm. | ||||||||||||||||||||||||||||||||||
With no related allowance recorded: | ||||||||||||||||||||||||||||||||||||||||
Recorded investment | — | $ | 1,468 | $ | 365 | — | — | — | — | — | — | $ | 1,833 | |||||||||||||||||||||||||||
|
|
|
|
|
|
|
|
|
|
|
|
|
|
|
|
|
|
|
| |||||||||||||||||||||
Unpaid principal | — | $ | 3,452 | $ | 586 | — | — | — | — | — | — | $ | 4,038 | |||||||||||||||||||||||||||
|
|
|
|
|
|
|
|
|
|
|
|
|
|
|
|
|
|
|
| |||||||||||||||||||||
Average recorded Investment | $ | 16 | $ | 2,097 | $ | 308 | $ | 11 | — | $ | 31 | $ | 11 | — | — | $ | 2,474 | |||||||||||||||||||||||
|
|
|
|
|
|
|
|
|
|
|
|
|
|
|
|
|
|
|
| |||||||||||||||||||||
Interest income Recognized | — | $ | 133 | $ | 5 | — | — | — | — | — | — | $ | 138 | |||||||||||||||||||||||||||
|
|
|
|
|
|
|
|
|
|
|
|
|
|
|
|
|
|
|
| |||||||||||||||||||||
With an allowance recorded: Recorded investment | $ | 199 | $ | 320 | $ | 38 | — | — | $ | 72 | — | — | — | $ | 629 | |||||||||||||||||||||||||
|
|
|
|
|
|
|
|
|
|
|
|
|
|
|
|
|
|
|
| |||||||||||||||||||||
Unpaid principal | $ | 225 | $ | 331 | $ | 41 | — | — | $ | 76 | — | — | — | $ | 673 | |||||||||||||||||||||||||
|
|
|
|
|
|
|
|
|
|
|
|
|
|
|
|
|
|
|
| |||||||||||||||||||||
Related allowance | $ | 28 | $ | 163 | $ | 27 | — | — | $ | 35 | — | — | — | $ | 253 | |||||||||||||||||||||||||
|
|
|
|
|
|
|
|
|
|
|
|
|
|
|
|
|
|
|
| |||||||||||||||||||||
Average recorded Investment | $ | 213 | $ | 121 | $ | 148 | — | — | $ | 43 | — | — | — | $ | 525 | |||||||||||||||||||||||||
|
|
|
|
|
|
|
|
|
|
|
|
|
|
|
|
|
|
|
| |||||||||||||||||||||
Interest income Recognized | $ | 9 | $ | 12 | $ | 1 | — | — | $ | 2 | — | — | — | $ | 24 | |||||||||||||||||||||||||
|
|
|
|
|
|
|
|
|
|
|
|
|
|
|
|
|
|
|
| |||||||||||||||||||||
75
With no related allowance recorded: Recorded investment Unpaid principal Average recorded Investment Interest income Recognized With anallowance recorded: Recorded investment Unpaid principal Related allowance Average recorded Investment Interest income Recognized Impaired Originated Loans – As of December 31, 2011 RE Mortgage Home Equity Auto
Indirect Other
Consum. C&I Construction Total (in thousands) Resid. Comm. Lines Loans Resid. Comm. $ 6,921 $ 61,205 $ 5,101 $ 224 $ 424 $ 39 $ 8,473 $ 1,809 $ 571 $ 84,767 $ 8,663 $ 72,408 $ 8,519 $ 528 $ 777 $ 56 $ 9,229 $ 2,857 $ 916 $ 103,953 $ 6,557 $ 53,346 $ 5,228 $ 458 $ 569 $ 44 $ 6,687 $ 3,942 $ 3,590 $ 80,421 $ 58 $ 2,235 $ 99 $ 7 $ 15 $ 2 $ 381 — $ 4 $ 2,801 $ 3,246 $ 10,688 $ 4,177 $ 350 $ 147 $ 70 $ 964 $ 3,818 $ 6,328 $ 29,788 $ 3,760 $ 11,094 $ 4,977 $ 666 $ 193 $ 75 $ 1,040 $ 8,698 $ 6,330 $ 36,833 $ 460 $ 1,613 $ 2,365 $ 73 $ 29 $ 24 $ 200 $ 258 $ 971 $ 5,993 $ 4,611 $ 10,019 $ 4,770 $ 215 $ 407 $ 52 $ 1,023 $ 2,334 $ 3,578 $ 27,009 $ 77 $ 588 $ 122 $ 3 $ 2 $ 2 $ 36 $ (16 ) $ 387 $ 1,201
| Impaired PNCI Loans – As of December 31, 2014 | ||||||||||||||||||||||||||||||||||||||||
| RE Mortgage | Home Equity | Auto Indirect | Other Consum. | Construction | ||||||||||||||||||||||||||||||||||||
| (in thousands) | Resid. | Comm. | Lines | Loans | C&I | Resid. | Comm. | Total | ||||||||||||||||||||||||||||||||
With no related allowance recorded: | ||||||||||||||||||||||||||||||||||||||||
Recorded investment | $ | 343 | $ | 366 | $ | 346 | $ | 25 | — | $ | 37 | $ | 7 | — | — | $ | 1,124 | |||||||||||||||||||||||
|
|
|
|
|
|
|
|
|
|
|
|
|
|
|
|
|
|
|
| |||||||||||||||||||||
Unpaid principal | $ | 353 | $ | 2,620 | $ | 374 | $ | 25 | — | $ | 54 | $ | 7 | — | — | $ | 3,433 | |||||||||||||||||||||||
|
|
|
|
|
|
|
|
|
|
|
|
|
|
|
|
|
|
|
| |||||||||||||||||||||
Average recorded Investment | $ | 246 | $ | 753 | $ | 287 | $ | 12 | — | $ | 36 | $ | 10 | — | — | $ | 1,344 | |||||||||||||||||||||||
|
|
|
|
|
|
|
|
|
|
|
|
|
|
|
|
|
|
|
| |||||||||||||||||||||
Interest income Recognized | $ | 14 | — | $ | (1 | ) | — | — | — | $ | 1 | — | — | $ | 14 | |||||||||||||||||||||||||
|
|
|
|
|
|
|
|
|
|
|
|
|
|
|
|
|
|
|
| |||||||||||||||||||||
With an allowance recorded: | ||||||||||||||||||||||||||||||||||||||||
Recorded investment | $ | 834 | $ | 146 | $ | 436 | — | — | $ | 220 | — | — | — | $ | 1,636 | |||||||||||||||||||||||||
|
|
|
|
|
|
|
|
|
|
|
|
|
|
|
|
|
|
|
| |||||||||||||||||||||
Unpaid principal | $ | 852 | $ | 146 | $ | 436 | — | — | $ | 220 | — | — | — | $ | 1,654 | |||||||||||||||||||||||||
|
|
|
|
|
|
|
|
|
|
|
|
|
|
|
|
|
|
|
| |||||||||||||||||||||
Related allowance | $ | 177 | $ | 108 | $ | 205 | — | — | $ | 131 | — | — | — | $ | 621 | |||||||||||||||||||||||||
|
|
|
|
|
|
|
|
|
|
|
|
|
|
|
|
|
|
|
| |||||||||||||||||||||
Average recorded Investment | $ | 516 | $ | 148 | $ | 319 | — | — | $ | 124 | — | — | — | $ | 1,107 | |||||||||||||||||||||||||
|
|
|
|
|
|
|
|
|
|
|
|
|
|
|
|
|
|
|
| |||||||||||||||||||||
Interest income Recognized | $ | 8 | $ | 8 | $ | 20 | — | — | $ | 12 | — | — | — | $ | 48 | |||||||||||||||||||||||||
|
|
|
|
|
|
|
|
|
|
|
|
|
|
|
|
|
|
|
| |||||||||||||||||||||
| Impaired Originated Loans – As of December 31, 2013 | ||||||||||||||||||||||||||||||||||||||||
| RE Mortgage | Home Equity | Auto Indirect | Other Consum. | Construction | ||||||||||||||||||||||||||||||||||||
| (in thousands) | Resid. | Comm. | Lines | Loans | C&I | Resid. | Comm. | Total | ||||||||||||||||||||||||||||||||
With no related allowance recorded: | ||||||||||||||||||||||||||||||||||||||||
Recorded investment | $ | 4,366 | $ | 53,352 | $ | 3,710 | $ | 552 | $ | 55 | $ | 16 | $ | 1,648 | $ | 2,473 | $ | 69 | $ | 66,241 | ||||||||||||||||||||
|
|
|
|
|
|
|
|
|
|
|
|
|
|
|
|
|
|
|
| |||||||||||||||||||||
Unpaid principal | $ | 6,489 | $ | 58,894 | $ | 7,299 | $ | 1,249 | $ | 123 | $ | 21 | $ | 1,665 | $ | 6,611 | $ | 138 | $ | 82,489 | ||||||||||||||||||||
|
|
|
|
|
|
|
|
|
|
|
|
|
|
|
|
|
|
|
| |||||||||||||||||||||
Average recorded Investment | $ | 4,123 | $ | 58,205 | $ | 4,410 | $ | 463 | $ | 93 | $ | 18 | $ | 2,154 | $ | 1,567 | $ | 83 | $ | 71,116 | ||||||||||||||||||||
|
|
|
|
|
|
|
|
|
|
|
|
|
|
|
|
|
|
|
| |||||||||||||||||||||
Interest income Recognized | $ | 336 | $ | 3,361 | $ | 352 | $ | 36 | $ | 12 | $ | 1 | $ | 113 | $ | 108 | $ | 7 | $ | 4,326 | ||||||||||||||||||||
|
|
|
|
|
|
|
|
|
|
|
|
|
|
|
|
|
|
|
| |||||||||||||||||||||
With an allowance recorded: | ||||||||||||||||||||||||||||||||||||||||
Recorded investment | $ | 2,630 | $ | 5,296 | $ | 2,779 | $ | 226 | $ | 4 | $ | 10 | $ | 1,517 | $ | 284 | $ | 109 | $ | 12,855 | ||||||||||||||||||||
|
|
|
|
|
|
|
|
|
|
|
|
|
|
|
|
|
|
|
| |||||||||||||||||||||
Unpaid principal | $ | 2,689 | $ | 5,659 | $ | 3,053 | $ | 291 | $ | 6 | $ | 10 | $ | 1,616 | $ | 284 | $ | 288 | $ | 13,896 | ||||||||||||||||||||
|
|
|
|
|
|
|
|
|
|
|
|
|
|
|
|
|
|
|
| |||||||||||||||||||||
Related allowance Average recorded | $ | 648 | $ | 1,084 | $ | 968 | $ | 169 | $ | 1 | $ | 5 | $ | 585 | $ | 91 | $ | 7 | $ | 3,558 | ||||||||||||||||||||
|
|
|
|
|
|
|
|
|
|
|
|
|
|
|
|
|
|
|
| |||||||||||||||||||||
Investment | $ | 2,245 | $ | 6,077 | $ | 3,064 | $ | 141 | $ | 12 | $ | 7 | $ | 1,817 | $ | 1,499 | $ | 188 | $ | 15,050 | ||||||||||||||||||||
|
|
|
|
|
|
|
|
|
|
|
|
|
|
|
|
|
|
|
| |||||||||||||||||||||
Interest income Recognized | $ | 124 | $ | 287 | $ | 146 | $ | 18 | $ | 1 | $ | 2 | $ | 95 | $ | 19 | $ | 15 | $ | 707 | ||||||||||||||||||||
|
|
|
|
|
|
|
|
|
|
|
|
|
|
|
|
|
|
|
| |||||||||||||||||||||
| Impaired PNCI Loans – As of December 31, 2013 | ||||||||||||||||||||||||||||||||||||||||
| RE Mortgage | Home Equity | Auto Indirect | Other Consum. | Construction | ||||||||||||||||||||||||||||||||||||
| (in thousands) | Resid. | Comm. | Lines | Loans | C&I | Resid. | Comm. | Total | ||||||||||||||||||||||||||||||||
With no related allowance recorded: | ||||||||||||||||||||||||||||||||||||||||
Recorded investment | $ | 148 | $ | 1,139 | $ | 227 | — | — | $ | 36 | $ | 12 | — | — | $ | 1,562 | ||||||||||||||||||||||||
|
|
|
|
|
|
|
|
|
|
|
|
|
|
|
|
|
|
|
| |||||||||||||||||||||
Unpaid principal | $ | 158 | $ | 3,323 | $ | 287 | — | — | $ | 45 | $ | 12 | — | — | $ | 3,825 | ||||||||||||||||||||||||
|
|
|
|
|
|
|
|
|
|
|
|
|
|
|
|
|
|
|
| |||||||||||||||||||||
Average recorded Investment | $ | 37 | $ | 1,005 | $ | 333 | — | — | $ | 39 | $ | 7 | — | — | $ | 1,421 | ||||||||||||||||||||||||
|
|
|
|
|
|
|
|
|
|
|
|
|
|
|
|
|
|
|
| |||||||||||||||||||||
Interest income Recognized | $ | 11 | $ | 233 | $ | 21 | — | — | $ | 5 | $ | 1 | — | — | $ | 271 | ||||||||||||||||||||||||
|
|
|
|
|
|
|
|
|
|
|
|
|
|
|
|
|
|
|
| |||||||||||||||||||||
With an allowance recorded: | ||||||||||||||||||||||||||||||||||||||||
Recorded investment | $ | 198 | $ | 149 | $ | 203 | — | — | $ | 28 | — | — | — | $ | 578 | |||||||||||||||||||||||||
|
|
|
|
|
|
|
|
|
|
|
|
|
|
|
|
|
|
|
| |||||||||||||||||||||
Unpaid principal | $ | 207 | $ | 149 | $ | 215 | — | — | $ | 28 | — | — | — | $ | 599 | |||||||||||||||||||||||||
|
|
|
|
|
|
|
|
|
|
|
|
|
|
|
|
|
|
|
| |||||||||||||||||||||
Related allowance | $ | 128 | $ | 114 | $ | 172 | — | — | $ | 3 | — | — | — | $ | 417 | |||||||||||||||||||||||||
|
|
|
|
|
|
|
|
|
|
|
|
|
|
|
|
|
|
|
| |||||||||||||||||||||
Average recorded Investment | $ | 275 | $ | 250 | $ | 162 | — | — | $ | 29 | — | ��� | — | $ | 716 | |||||||||||||||||||||||||
|
|
|
|
|
|
|
|
|
|
|
|
|
|
|
|
|
|
|
| |||||||||||||||||||||
Interest income Recognized | $ | 12 | $ | 9 | $ | 10 | — | — | $ | 1 | — | — | — | $ | 32 | |||||||||||||||||||||||||
|
|
|
|
|
|
|
|
|
|
|
|
|
|
|
|
|
|
|
| |||||||||||||||||||||
As a result
76
| Impaired Originated Loans – As of December 31, 2012 | ||||||||||||||||||||||||||||||||||||||||
| RE Mortgage | Home Equity | Auto Indirect | Other | C&I | Construction | |||||||||||||||||||||||||||||||||||
| (in thousands) | Resid. | Comm. | Lines | Loans | Consum. | Resid. | Comm. | Total | ||||||||||||||||||||||||||||||||
With no related allowance recorded: | ||||||||||||||||||||||||||||||||||||||||
Recorded investment | $ | 3,520 | $ | 66,031 | $ | 4,241 | $ | 361 | $ | 163 | $ | 19 | $ | 4,238 | $ | 3,554 | $ | 284 | $ | 82,411 | ||||||||||||||||||||
|
|
|
|
|
|
|
|
|
|
|
|
|
|
|
|
|
|
|
| |||||||||||||||||||||
Unpaid principal | $ | 5,349 | $ | 70,709 | $ | 6,691 | $ | 781 | $ | 311 | $ | 40 | $ | 4,613 | $ | 8,227 | $ | 484 | $ | 97,205 | ||||||||||||||||||||
|
|
|
|
|
|
|
|
|
|
|
|
|
|
|
|
|
|
|
| |||||||||||||||||||||
Average recorded Investment | $ | 6,329 | $ | 61,299 | $ | 4,311 | $ | 329 | $ | 263 | $ | 42 | $ | 7,500 | $ | 3,505 | $ | 517 | $ | 84,095 | ||||||||||||||||||||
|
|
|
|
|
|
|
|
|
|
|
|
|
|
|
|
|
|
|
| |||||||||||||||||||||
Interest income Recognized | $ | 71 | $ | 2,513 | $ | 58 | $ | 1 | $ | 3 | — | $ | 73 | $ | 20 | $ | 10 | $ | 2,749 | |||||||||||||||||||||
|
|
|
|
|
|
|
|
|
|
|
|
|
|
|
|
|
|
|
| |||||||||||||||||||||
With an allowance recorded: | ||||||||||||||||||||||||||||||||||||||||
Recorded investment | $ | 2,867 | $ | 3,258 | $ | 5,412 | $ | 167 | $ | 34 | $ | 30 | $ | 4,324 | $ | 42 | $ | 323 | $ | 16,457 | ||||||||||||||||||||
|
|
|
|
|
|
|
|
|
|
|
|
|
|
|
|
|
|
|
| |||||||||||||||||||||
Unpaid principal | $ | 3,432 | $ | 3,556 | $ | 7,103 | $ | 396 | $ | 51 | $ | 32 | $ | 4,992 | $ | 42 | $ | 523 | $ | 20,127 | ||||||||||||||||||||
|
|
|
|
|
|
|
|
|
|
|
|
|
|
|
|
|
|
|
| |||||||||||||||||||||
Related allowance | $ | 603 | $ | 352 | $ | 2,237 | $ | 81 | $ | 5 | $ | 12 | $ | 840 | $ | 11 | $ | 111 | $ | 4,252 | ||||||||||||||||||||
|
|
|
|
|
|
|
|
|
|
|
|
|
|
|
|
|
|
|
| |||||||||||||||||||||
Average recorded Investment | $ | 3,890 | $ | 7,841 | $ | 6,331 | $ | 317 | $ | 102 | $ | 49 | $ | 2,800 | $ | 1,543 | $ | 6,570 | $ | 29,443 | ||||||||||||||||||||
|
|
|
|
|
|
|
|
|
|
|
|
|
|
|
|
|
|
|
| |||||||||||||||||||||
Interest income Recognized | $ | 67 | $ | 129 | $ | 103 | $ | 16 | $ | 1 | $ | 1 | $ | 100 | $ | 6 | $ | 5 | $ | 428 | ||||||||||||||||||||
|
|
|
|
|
|
|
|
|
|
|
|
|
|
|
|
|
|
|
| |||||||||||||||||||||
| Impaired PNCI Loans – As of December 31, 2012 | ||||||||||||||||||||||||||||||||||||||||
| RE Mortgage | Home Equity | Auto Indirect | Other Consum. | Construction | ||||||||||||||||||||||||||||||||||||
| (in thousands) | Resid. | Comm. | Lines | Loans | C&I | Resid. | Comm. | Total | ||||||||||||||||||||||||||||||||
With no related allowance recorded: | ||||||||||||||||||||||||||||||||||||||||
Recorded investment | — | $ | 1,468 | $ | 365 | — | — | — | — | — | — | $ | 1,833 | |||||||||||||||||||||||||||
|
|
|
|
|
|
|
|
|
|
|
|
|
|
|
|
|
|
|
| |||||||||||||||||||||
Unpaid principal | — | $ | 3,452 | $ | 586 | — | — | — | — | — | — | $ | 4,038 | |||||||||||||||||||||||||||
|
|
|
|
|
|
|
|
|
|
|
|
|
|
|
|
|
|
|
| |||||||||||||||||||||
Average recorded Investment | $ | 16 | $ | 2,097 | $ | 308 | $ | 11 | — | $ | 31 | $ | 11 | — | — | $ | 2,474 | |||||||||||||||||||||||
|
|
|
|
|
|
|
|
|
|
|
|
|
|
|
|
|
|
|
| |||||||||||||||||||||
Interest income Recognized | — | $ | 133 | $ | 5 | — | — | — | — | — | — | $ | 138 | |||||||||||||||||||||||||||
|
|
|
|
|
|
|
|
|
|
|
|
|
|
|
|
|
|
|
| |||||||||||||||||||||
With an allowance recorded: | ||||||||||||||||||||||||||||||||||||||||
Recorded investment | $ | 199 | $ | 320 | $ | 38 | — | — | $ | 72 | — | — | — | $ | 629 | |||||||||||||||||||||||||
|
|
|
|
|
|
|
|
|
|
|
|
|
|
|
|
|
|
|
| |||||||||||||||||||||
Unpaid principal | $ | 225 | $ | 331 | $ | 41 | — | — | $ | 76 | — | — | — | $ | 673 | |||||||||||||||||||||||||
|
|
|
|
|
|
|
|
|
|
|
|
|
|
|
|
|
|
|
| |||||||||||||||||||||
Related allowance | $ | 28 | $ | 163 | $ | 27 | — | — | $ | 35 | — | — | — | $ | 253 | |||||||||||||||||||||||||
|
|
|
|
|
|
|
|
|
|
|
|
|
|
|
|
|
|
|
| |||||||||||||||||||||
Average recorded Investment | $ | 213 | $ | 121 | $ | 148 | — | — | $ | 43 | — | — | — | $ | 525 | |||||||||||||||||||||||||
|
|
|
|
|
|
|
|
|
|
|
|
|
|
|
|
|
|
|
| |||||||||||||||||||||
Interest income Recognized | $ | 9 | $ | 12 | $ | 1 | — | — | $ | 2 | — | — | — | $ | 24 | |||||||||||||||||||||||||
|
|
|
|
|
|
|
|
|
|
|
|
|
|
|
|
|
|
|
| |||||||||||||||||||||
At December 31, 2014, $45,676,000 of adopting the amendments in ASU No. 2011-02 discussed in Note 1, the Company reassessed all loan modifications that occurred on or after January 1, 2011 for potential identificationOriginated loans were TDRs and classified as TDRs.impaired. The Company identified ten credits totaling approximately $3,800,000 with a related allowancehad obligations to lend $54,000 of $15,000 which are considered TDR’s under the clarified guidance.additional funds on these TDRs as of December 31, 2014. At December 31, 2014, $1,307,000 of PNCI loans were TDRs and classified as impaired. The Company had no obligations to lend additional funds on these TDRs as of December 31, 2014.
At December 31, 2013, $56,739,000 of Originated loans were TDRs and classified as impaired. The Company had obligations to lend $25,000 of additional funds on these TDRs as of December 31, 2013. At December 31, 2013, $901,000 of PNCI loans were TDRs and classified as impaired. The Company had no obligations to lend additional funds on these TDRs as of December 31, 2013.
| Impaired PNCI Loans – As of December 31, 2011 | ||||||||||||||||||||||||||||||||||||||||
| RE Mortgage | Home Equity | Auto Indirect | Other Consum. | C&I | Construction | Total | ||||||||||||||||||||||||||||||||||
| (in thousands) | Resid. | Comm. | Lines | Loans | Resid. | Comm. | ||||||||||||||||||||||||||||||||||
With no related allowance recorded: | ||||||||||||||||||||||||||||||||||||||||
Recorded investment | — | — | $ | 110 | $ | 87 | — | — | $ | 89 | — | — | $ | 286 | ||||||||||||||||||||||||||
|
|
|
|
|
|
|
|
|
|
|
|
|
|
|
|
|
|
|
| |||||||||||||||||||||
Unpaid principal | — | — | $ | 126 | $ | 89 | — | — | $ | 98 | — | — | $ | 313 | ||||||||||||||||||||||||||
|
|
|
|
|
|
|
|
|
|
|
|
|
|
|
|
|
|
|
| |||||||||||||||||||||
Average recorded Investment | — | — | $ | 55 | $ | 44 | — | — | $ | 45 | — | — | $ | 144 | ||||||||||||||||||||||||||
|
|
|
|
|
|
|
|
|
|
|
|
|
|
|
|
|
|
|
| |||||||||||||||||||||
Interest income Recognized | — | — | $ | 5 | $ | 2 | — | — | $ | 3 | — | — | $ | 10 | ||||||||||||||||||||||||||
|
|
|
|
|
|
|
|
|
|
|
|
|
|
|
|
|
|
|
| |||||||||||||||||||||
With anallowance recorded: | ||||||||||||||||||||||||||||||||||||||||
Recorded investment | — | — | — | — | — | — | — | — | — | — | ||||||||||||||||||||||||||||||
|
|
|
|
|
|
|
|
|
|
|
|
|
|
|
|
|
|
|
| |||||||||||||||||||||
Unpaid principal | — | — | — | — | — | — | — | — | — | — | ||||||||||||||||||||||||||||||
|
|
|
|
|
|
|
|
|
|
|
|
|
|
|
|
|
|
|
| |||||||||||||||||||||
Related allowance | — | — | — | — | — | — | — | — | — | — | ||||||||||||||||||||||||||||||
|
|
|
|
|
|
|
|
|
|
|
|
|
|
|
|
|
|
|
| |||||||||||||||||||||
Average recorded Investment | — | — | — | — | — | — | — | — | — | — | ||||||||||||||||||||||||||||||
|
|
|
|
|
|
|
|
|
|
|
|
|
|
|
|
|
|
|
| |||||||||||||||||||||
Interest income Recognized | — | — | — | — | — | — | — | — | — | — | ||||||||||||||||||||||||||||||
|
|
|
|
|
|
|
|
|
|
|
|
|
|
|
|
|
|
|
| |||||||||||||||||||||
With no related allowance recorded: Recorded investment Unpaid principal Average recorded Investment Interest income Recognized With an allowance recorded: Recorded investment Unpaid principal Related allowance Average recorded Investment Interest income Recognized Impaired Originated Loans – As of December 31, 2010 RE Mortgage Home Equity Auto
Indirect Other
Consum. C&I Construction Total (in thousands) Resid. Comm. Lines Loans Resid. Comm. $ 6,192 $ 45,487 $ 5,354 $ 691 $ 714 $ 49 $ 4,900 $ 6,075 $ 6,609 $ 76,071 $ 7,521 $ 52,962 $ 8,755 $ 1,002 $ 1,349 $ 52 $ 5,571 $ 10,854 $ 6,797 $ 94,863 $ 4,599 $ 32,575 $ 4,688 $ 425 $ 607 $ 66 $ 3,330 $ 8,137 $ 3,962 $ 58,389 $ 99 $ 1,609 $ 93 $ 17 $ 37 $ 4 $ 186 $ 123 $ 377 $ 2,545 $ 5,975 $ 9,349 $ 5,362 $ 79 $ 667 $ 34 $ 1,081 $ 850 $ 828 $ 24,225 $ 6,278 $ 11,122 $ 6,379 $ 82 $ 793 $ 37 $ 1,398 $ 1,235 $ 898 $ 28,222 $ 1,654 $ 1,042 $ 2,933 $ 78 $ 239 $ 14 $ 590 $ 116 $ 279 $ 6,945 $ 4,204 $ 5,844 $ 4,373 $ 326 $ 1,112 $ 84 $ 1,285 $ 1,597 $ 563 $ 19,388 $ 222 $ 506 $ 129 $ 5 $ 17 $ 1 $ 46 $ 14 $ 22 $ 962
At December 31, 2012, $57,223,000 of Originated loans were TDRTDRs and classified as impaired. The Company had obligations to lend $137,000 of additional funds on these TDRTDRs as of December 31, 2012. At December 31, 2012, $950,000 of PNCI loans were TDRTDRs and classified as impaired. The Company had no obligations to lend additional funds on these TDRTDRs as of December 31, 2012.
At December 31, 2011, $66,160,000 of Originated loans were TDR and classified as impaired. The Company had obligations to lend $258,000 of additional funds on these TDR as of December 31, 2011. At December 31, 2011, $176,000 of PNCI loans were TDR and classified as impaired. The Company had no obligations to lend additional funds on these TDR as of December 31, 2011.
At December 31, 2010, $48,074,000 of Originated loans were TDR and classified as impaired. The Company had obligations to lend $415,000 of additional funds on these TDR as of December 31, 2010. At December 31, 2010, the Company had no PNCI loans.
77
The following tables show certain information regarding Troubled Debt Restructurings (TDRs) that occurred during the periods indicated:
| TDR Information for the Year Ended December 31, 2012 | ||||||||||||||||||||||||||||||||||||||||
| RE Mortgage | Home Equity | Auto | Other | Construction | ||||||||||||||||||||||||||||||||||||
| (in thousands) | Resid. | Comm. | Lines | Loans | Indirect | Consum. | C&I | Resid. | Comm. | Total | ||||||||||||||||||||||||||||||
Number | 4 | 15 | 11 | — | — | 1 | 9 | 3 | — | 43 | ||||||||||||||||||||||||||||||
Pre-mod outstanding principal balance | $ | 822 | $ | 3,220 | $ | 1,598 | — | — | $ | 38 | $ | 1,105 | $ | 317 | — | $ | 7,098 | |||||||||||||||||||||||
Post-mod outstanding principal balance | $ | 842 | $ | 3,402 | $ | 1,678 | — | — | $ | 38 | $ | 1,105 | $ | 328 | — | $ | 7,393 | |||||||||||||||||||||||
Financial impact due to TDR taken as additional provision | $ | (11 | ) | $ | 212 | $ | 60 | — | — | — | $ | 317 | — | — | $ | 578 | ||||||||||||||||||||||||
Number that defaulted during the period | 1 | 13 | 5 | 1 | — | — | 3 | 2 | 3 | 28 | ||||||||||||||||||||||||||||||
Recorded investment of TDRs that defaulted during the period | $ | 112 | $ | 8,904 | $ | 500 | $ | 46 | — | — | $ | 1,238 | $ | 139 | $ | 256 | $ | 11,915 | ||||||||||||||||||||||
Financial impact due to the default of previous TDR taken as charge-offs or additional provisions | — | — | $ | (13 | ) | $ | (1 | ) | — | — | $ | 50 | — | — | $ | 36 | ||||||||||||||||||||||||
| TDR Information for the Year Ended December 31, 2011 | TDR Information for the Year Ended December 31, 2014 | |||||||||||||||||||||||||||||||||||||||||||||||||||||||||||||||||||||||||||||||
| RE Mortgage | Home Equity | Auto | Other | Construction | RE Mortgage | Home Equity | Auto Indirect | Other Consum. | C&I | Construction | ||||||||||||||||||||||||||||||||||||||||||||||||||||||||||||||||||||||
| (in thousands) | Resid. | Comm. | Lines | Loans | Indirect | Consum. | C&I | Resid. | Comm. | Total | ||||||||||||||||||||||||||||||||||||||||||||||||||||||||||||||||||||||
| (dollars in thousands) | Resid. | Comm. | Lines | Loans | Auto Indirect | Other Consum. | C&I | Resid. | Comm. | Total | ||||||||||||||||||||||||||||||||||||||||||||||||||||||||||||||||||||||
Number | 14 | 37 | 14 | 4 | 2 | — | 30 | 5 | 4 | 110 | 5 | 7 | 6 | 2 | 1 | 2 | 31 | |||||||||||||||||||||||||||||||||||||||||||||||||||||||||||||||
Pre-mod outstanding principal balance | $ | 2,403 | $ | 15,394 | $ | 2,261 | $ | 457 | $ | 40 | — | $ | 5,222 | $ | 1,421 | $ | 534 | $ | 27,732 | $ | 1,048 | $ | 1,980 | $ | 940 | $ | 100 | — | $ | 147 | $ | 218 | $ | 102 | $ | 219 | $ | 4,754 | ||||||||||||||||||||||||||||||||||||||||||
Post-mod outstanding principal balance | $ | 2,524 | $ | 15,514 | $ | 2,377 | $ | 481 | $ | 40 | — | $ | 5,312 | $ | 1,416 | $ | 534 | $ | 28,198 | $ | 1,050 | $ | 1,890 | $ | 967 | $ | 102 | — | $ | 147 | $ | 219 | $ | 85 | $ | 196 | $ | 4,656 | ||||||||||||||||||||||||||||||||||||||||||
Financial impact due to TDR taken as additional provision | — | $ | 258 | 29 | — | — | — | $ | 57 | $ | 7 | — | $ | 352 | $ | 91 | $ | 22 | — | $ | (1 | ) | — | $ | 66 | $ | 101 | — | — | $ | 279 | |||||||||||||||||||||||||||||||||||||||||||||||||
Number that defaulted during the period | 3 | 5 | — | — | 4 | — | 6 | 2 | — | 20 | 2 | 2 | 1 | — | — | — | 1 | — | — | 6 | ||||||||||||||||||||||||||||||||||||||||||||||||||||||||||||
Recorded investment of TDRs that defaulted during the period | $ | 393 | $ | 917 | — | — | $ | 301 | — | $ | 720 | $ | 2,808 | — | $ | 5,139 | $ | 344 | $ | 423 | $ | 20 | — | — | — | $ | 116 | — | — | $ | 903 | |||||||||||||||||||||||||||||||||||||||||||||||||
Financial impact due to the default of previous TDR taken as charge-offs or additional provisions | $ | (1 | ) | $ | 50 | — | — | — | — | $ | 49 | — | — | $ | 98 | — | — | — | — | — | — | $ | (8 | ) | — | — | $ | (8 | ) | |||||||||||||||||||||||||||||||||||||||||||||||||||
| TDR Information for the Year Ended December 31, 2013 | ||||||||||||||||||||||||||||||||||||||||
| RE Mortgage | Home Equity | Auto Indirect | Other Consum. | C&I | Construction | |||||||||||||||||||||||||||||||||||
| (dollars in thousands) | Resid. | Comm. | Lines | Loans | Resid. | Comm. | Total | |||||||||||||||||||||||||||||||||
Number | 9 | 11 | 12 | 2 | — | — | 8 | — | — | 42 | ||||||||||||||||||||||||||||||
Pre-mod outstanding principal balance | $ | 2,173 | $ | 13,145 | $ | 1,546 | $ | 251 | — | — | $ | 274 | — | — | $ | 17,389 | ||||||||||||||||||||||||
Post-mod outstanding principal balance | $ | 2,177 | $ | 13,146 | $ | 1,557 | $ | 253 | — | — | $ | 275 | — | — | $ | 17,408 | ||||||||||||||||||||||||
Financial impact due to TDR taken as additional provision | $ | 148 | $ | 27 | $ | 340 | $ | (1 | ) | — | — | $ | 88 | — | — | $ | 602 | |||||||||||||||||||||||
Number that defaulted during the period | 4 | 8 | 3 | 1 | — | — | 4 | 1 | — | 21 | ||||||||||||||||||||||||||||||
Recorded investment of TDRs that defaulted during the period | $ | 443 | $ | 1,702 | $ | 150 | $ | 15 | — | — | $ | 1,363 | $ | 73 | — | $ | 3,746 | |||||||||||||||||||||||
Financial impact due to the default of previous TDR taken as charge-offs or additional provisions | $ | (3 | ) | $ | 7 | — | — | — | — | $ | 3 | $ | 5 | — | $ | 12 | ||||||||||||||||||||||||
Modifications classified as Troubled Debt Restructurings can include one or a combination of the following: rate modifications, term extensions, interest only modifications, either temporary or long-term, payment modifications, and collateral substitutions/additions.
For all new Troubled Debt Restructurings, an impairment analysis is conducted. If the loan is determined to be collateral dependent, any additional amount of impairment will be calculated based on the difference between estimated collectible value and the current carrying balance of the loan. This difference could result in an increased provision and is typically charged off. If the asset is determined not to be collateral dependent, the impairment is measured on the net present value difference between the expected cash flows of the restructured loan and the cash flows which would have been received under the original terms. The effect of this could result in a requirement for additional provision to the reserve. The effect of these required provisions for the period are indicated above.
Typically if a TDR defaults during the period, the loan is then considered collateral dependent and, if it was not already considered collateral dependent, an appropriate provision will be reserved or charge will be taken. The additional provisions required resulting from default of previously modified TDR’s are noted above.
78
Note 6—6 – Foreclosed Assets
A summary of the activity in the balance of foreclosed assets follows (in(dollars in thousands):
| Year ended December 31, 2012 | Year ended December 31, 2011 | Year ended December 31, 2014 | Year ended December 31, 2013 | |||||||||||||||||||||||||||||||||||||||||||||
| Noncovered | Covered | Total | Noncovered | Covered | Total | Noncovered | Covered | Total | Noncovered | Covered | Total | |||||||||||||||||||||||||||||||||||||
Beginning balance, net | $ | 13,268 | $ | 3,064 | $ | 16,332 | $ | 5,000 | $ | 4,913 | $ | 9,913 | $ | 5,588 | $ | 674 | $ | 6,262 | $ | 5,957 | $ | 1,541 | $ | 7,498 | ||||||||||||||||||||||||
Acquisitions | — | — | — | 8,412 | — | 8,412 | 695 | — | 695 | — | — | — | ||||||||||||||||||||||||||||||||||||
Additions/transfers from loans | 8,732 | 633 | 9,365 | 6,909 | 34 | 6,943 | 5,753 | — | 5,753 | 11,224 | 493 | 11,717 | ||||||||||||||||||||||||||||||||||||
Dispositions/sales | (14,776 | ) | (1,695 | ) | (16,471 | ) | (5,794 | ) | (1,158 | ) | (6,952 | ) | (7,391 | ) | (217 | ) | (7,608 | ) | (10,992 | ) | (1,279 | ) | (12,271 | ) | ||||||||||||||||||||||||
Valuation adjustments | (1,267 | ) | (461 | ) | (1,728 | ) | (1,259 | ) | (725 | ) | (1,984 | ) | (196 | ) | (12 | ) | (208 | ) | (601 | ) | (81 | ) | (682 | ) | ||||||||||||||||||||||||
|
|
|
|
|
|
|
|
|
|
|
| |||||||||||||||||||||||||||||||||||||
Ending balance, net | $ | 5,957 | $ | 1,541 | $ | 7,498 | $ | 13,268 | $ | 3,064 | $ | 16,332 | $ | 4,449 | $ | 445 | $ | 4,894 | $ | 5,588 | $ | 674 | $ | 6,262 | ||||||||||||||||||||||||
|
|
|
|
|
|
|
|
|
|
|
| |||||||||||||||||||||||||||||||||||||
Ending valuation allowance | $ | (1,357 | ) | $ | (666 | ) | $ | (2,023 | ) | $ | (1,570 | ) | $ | (776 | ) | $ | (2,346 | ) | $ | (208 | ) | — | $ | (208 | ) | $ | (414 | ) | — | $ | (414 | ) | ||||||||||||||||
|
|
|
|
|
|
|
|
|
|
|
| |||||||||||||||||||||||||||||||||||||
Ending number of foreclosed assets | 34 | 5 | 39 | 62 | 11 | 73 | 28 | 1 | 29 | 28 | 4 | 32 | ||||||||||||||||||||||||||||||||||||
|
|
|
|
|
|
|
|
|
|
|
| |||||||||||||||||||||||||||||||||||||
Proceeds from sale of foreclosed assets | $ | 15,319 | $ | 1,938 | $ | 17,257 | $ | 6,368 | $ | 1,264 | $ | 7,632 | $ | 9,517 | $ | 245 | $ | 9,762 | $ | 12,483 | $ | 1,427 | $ | 13,910 | ||||||||||||||||||||||||
|
|
|
|
|
|
|
|
|
|
|
| |||||||||||||||||||||||||||||||||||||
Gain on sale of foreclosed assets | $ | 543 | $ | 243 | $ | 786 | $ | 574 | $ | 106 | $ | 680 | $ | 2,125 | $ | 28 | $ | 2,153 | $ | 1,492 | $ | 148 | $ | 1,640 | ||||||||||||||||||||||||
|
|
|
|
|
|
|
|
|
|
|
| |||||||||||||||||||||||||||||||||||||
Note 7—7 - Premises and Equipment
Premises and equipment were comprised of:
| December 31, 2014 | December 31, 2013 | |||||||||||||||
| December 31, 2012 | December 31, 2011 | |||||||||||||||
| (In thousands) | (In thousands) | |||||||||||||||
Land & land improvements | $ | 5,929 | $ | 4,400 | $ | 8,933 | $ | 5,975 | ||||||||
Buildings | 23,090 | 20,251 | 39,638 | 30,103 | ||||||||||||
Furniture and equipment | 25,877 | 24,291 | 28,446 | 27,881 | ||||||||||||
|
|
|
| |||||||||||||
| 54,896 | 48,942 | 77,017 | 63,959 | |||||||||||||
Less: Accumulated depreciation | (32,101 | ) | (30,241 | ) | (33,570 | ) | (32,397 | ) | ||||||||
|
|
|
| |||||||||||||
| 22,795 | 18,701 | 43,447 | 31,562 | |||||||||||||
Construction in progress | 4,190 | 1,192 | 46 | 50 | ||||||||||||
|
|
|
| |||||||||||||
Total premises and equipment | $ | 26,985 | $ | 19,893 | $ | 43,493 | $ | 31,612 | ||||||||
|
|
|
| |||||||||||||
Depreciation expense for premises and equipment amounted to $4,648,000, $3,635,000, and $3,250,000 $2,561,000,in 2014, 2013, and $2,731,000 in 2012, 2011, and 2010, respectively.
Note 8—8 – Cash Value of Life Insurance
A summary of the activity in the balance of cash value of life insurance follows (in(dollars in thousands):
| Year ended December 31, | Year ended December 31, | |||||||||||||||
| 2012 | 2011 | 2014 | 2013 | |||||||||||||
Beginning balance | $ | 50,403 | $ | 50,541 | $ | 52,309 | $ | 50,582 | ||||||||
Acquisitions | 38,075 | — | ||||||||||||||
Increase in cash value of life insurance | 1,820 | 1,885 | 1,953 | 1,727 | ||||||||||||
Gain on life insurance death benefit | 675 | 789 | ||||||||||||||
Death benefit | (2,316 | ) | (2,812 | ) | ||||||||||||
|
|
|
| |||||||||||||
Ending balance | $ | 50,582 | $ | 50,403 | $ | 92,337 | $ | 52,309 | ||||||||
|
|
|
| |||||||||||||
End of period death benefit | $ | 94,754 | $ | 96,132 | $ | 165,966 | $ | 95,513 | ||||||||
Number of policies owned | 133 | 139 | 189 | 133 | ||||||||||||
Insurance companies used | 6 | 6 | 14 | 6 | ||||||||||||
Current and former employees and directors covered | 36 | 38 | 60 | 36 | ||||||||||||
As of December 31, 2012,2014, the Bank was the owner and beneficiary of 133189 life insurance policies, issued by six14 life insurance companies, covering 3660 current and former employees and directors. These life insurance policies are recorded on the Company’s financial statements at their reported cash (surrender) values. As a result of current tax law and the nature of these policies, the Bank records any increase in cash value of these policies as nontaxable noninterest income. If the Bank decided to surrender any of the policies prior to the death of the insured, such surrender may result in a tax expense related to the life-to-date cumulative increase in cash value of the policy. If the Bank retains such policies until the death of the insured, the Bank would receive nontaxable proceeds from the insurance company equal to the death benefit of the policies. The Bank has entered into Joint Beneficiary Agreements (JBAs) with certain of the insured that for certain of the policies provide some level of sharing of the death benefit, less the cash surrender value, among the Bank and the beneficiaries of the insured upon the receipt of death benefits. See Note 15 of these consolidated financial statements for additional information on JBAs.
79
Note 9—9 - Goodwill and Other Intangible Assets
The following table summarizes the Company’s goodwill intangible as of December 31, 2012 and 2011.the dates indicated:
| (Dollar in Thousands) | December 31, 2012 | Additions | Reductions | December 31, 2011 | December 31, 2014 | Additions | Reductions | December 31, 2013 | ||||||||||||||||||||||||
Goodwill | $ | 15,519 | — | — | $ | 15,519 | $ | 63,462 | $ | 47,943 | — | $ | 15,519 | |||||||||||||||||||
|
|
|
|
|
|
|
| |||||||||||||||||||||||||
The following table summarizes the Company’s core deposit intangibles as of December 31, 2012 and 2011.the dates indicated:
| (Dollar in Thousands) | December 31, 2012 | Additions | Reductions | Fully Depreciated | December 31, 2011 | December 31, 2014 | Additions | Reductions/ Amortization | Fully Depreciated | December 31, 2013 | ||||||||||||||||||||||||||||||
Core deposit intangibles | $ | 1,460 | — | — | — | $ | 1,460 | $ | 8,074 | $ | 6,614 | — | — | $ | 1,460 | |||||||||||||||||||||||||
Accumulated amortization | (368 | ) | $ | (209 | ) | — | — | (159 | ) | (1,023 | ) | — | $ | (446 | ) | — | (577 | ) | ||||||||||||||||||||||
|
|
|
|
|
|
|
|
|
| |||||||||||||||||||||||||||||||
Core deposit intangibles, net | $ | 1,092 | $ | (209 | ) | — | — | $ | 1,301 | $ | 7,051 | $ | 6,614 | $ | (446 | ) | — | $ | 883 | |||||||||||||||||||||
|
|
|
|
|
|
|
|
|
| |||||||||||||||||||||||||||||||
The Company recorded additions to CDI of $6,614,000 in conjunction with the North Valley Bancorp acquisition on October 3, 2014, $898,000 in conjunction with the Citizens acquisition on September 23, 2011, and $562,000 in conjunction with the Granite acquisition on May 28, 2010. The following table summarizes the Company’s estimated core deposit intangible amortization (dollars in thousands):
Years Ended | Estimated Core Deposit Intangible Amortization | Estimated Core Deposit Intangible Amortization | ||||||
2013 | 209 | |||||||
2014 | 209 | |||||||
2015 | 209 | $ | 1,157 | |||||
2016 | 209 | 1,157 | ||||||
2017 | 209 | 1,109 | ||||||
2018 | $ | 47 | 1,044 | |||||
2019 | 948 | |||||||
Thereafter | $ | 1,636 | ||||||
Note 10—10 - Mortgage Servicing Rights
The following tables summarize the activity in, and the main assumptions we used to determine the fair value of mortgage servicing rights for the periods indicated (dollars in thousands):
| Years ended December 31, | Years ended December 31, | |||||||||||||||||||||||
| 2012 | 2011 | 2010 | 2014 | 2013 | 2012 | |||||||||||||||||||
Balance at beginning of period | $ | 4,603 | $ | 4,605 | $ | 4,089 | $ | 6,165 | $ | 4,552 | $ | 4,603 | ||||||||||||
Additions | 1,965 | 1,105 | 1,545 | |||||||||||||||||||||
Acquisition | 1,944 | — | — | |||||||||||||||||||||
Originations | 570 | 1,360 | 1,965 | |||||||||||||||||||||
Change in fair value | (2,016 | ) | (1,107 | ) | (1,029 | ) | (1,301 | ) | 253 | (2,016 | ) | |||||||||||||
|
|
|
|
|
| |||||||||||||||||||
Balance at end of period | $ | 4,552 | $ | 4,603 | $ | 4,605 | $ | 7,378 | $ | 6,165 | $ | 4,552 | ||||||||||||
|
|
| ||||||||||||||||||||||
|
|
| ||||||||||||||||||||||
Contractually specified servicing fees, late fees and ancillary fees earned | $ | 1,666 | $ | 1,495 | $ | 1,303 | $ | 1,869 | $ | 1,774 | $ | 1,666 | ||||||||||||
Balance of loans serviced at: | ||||||||||||||||||||||||
Beginning of period | $ | 598,185 | $ | 573,300 | $ | 505,947 | $ | 680,197 | $ | 666,512 | $ | 598,185 | ||||||||||||
End of period | $ | 666,512 | $ | 598,185 | $ | 573,300 | $ | 840,288 | $ | 680,197 | $ | 666,512 | ||||||||||||
Weighted-average prepayment speed (CPR) | 20.3 | % | 19.3 | % | 15.4 | % | 12.0 | % | 10.3 | % | 20.3 | % | ||||||||||||
Discount rate | 10.0 | % | 9.0 | % | 9.0 | % | ||||||||||||||||||
Weighted-average discount rate | 10.0 | % | 10.0 | % | 10.0 | % | ||||||||||||||||||
The changes in fair value of MSRs that occurred during 20122014 and 20112013 were mainly due to changes in principal balances and changes in estimate life of the MSRs.
Note 11—11 - Indemnification Asset
A summary of the activity in the balance of indemnification asset (liability) included in other assets is follows (in thousands):
| Year ended December 31, | ||||||||||||
| 2012 | 2011 | 2010 | ||||||||||
Beginning balance | $ | 4,405 | $ | 5,640 | — | |||||||
Additions | — | — | $ | 7,466 | ||||||||
Effect of actual covered losses and change in estimated future covered losses | (245 | ) | 2,059 | 1,274 | ||||||||
Reimbursable expenses incurred | 69 | 393 | 160 | |||||||||
Payments received | (2,232 | ) | (3,687 | ) | (3,260 | ) | ||||||
|
|
|
|
|
| |||||||
Ending balance | $ | 1,997 | $ | 4,405 | $ | 5,640 | ||||||
|
|
|
|
|
| |||||||
| Year ended December 31, | ||||||||||||
| 2014 | 2013 | 2012 | ||||||||||
Beginning balance | $ | 206 | $ | 1,997 | $ | 4,405 | ||||||
Effect of actual covered losses (recoveries) and increase (decrease) in estimated future covered losses | (869 | ) | (1,419 | ) | (245 | ) | ||||||
Reimbursable (revenue) expenses incurred | 69 | (159 | ) | 69 | ||||||||
Payments made (received) | 245 | (213 | ) | (2,232 | ) | |||||||
|
|
|
|
|
| |||||||
Ending balance | $ | (349 | ) | $ | 206 | $ | 1,997 | |||||
|
|
|
|
|
| |||||||
80
Note 12—12 – Other Assets
Other assets were comprised of (in thousands):
| As of December 31, | As of December 31, | |||||||||||||||
| 2012 | 2011 | 2014 | 2013 | |||||||||||||
Deferred tax asset, net (Note 22) | $ | 28,935 | $ | 27,810 | $ | 37,706 | $ | 26,781 | ||||||||
Prepaid expense including FDIC assessment and taxes | 3,455 | 8,459 | ||||||||||||||
Prepaid expense | 2,034 | 2,131 | ||||||||||||||
Software | 1,550 | 1,530 | 1,327 | 1,318 | ||||||||||||
Life insurance proceeds receivable | 706 | 2,811 | ||||||||||||||
Advanced compensation | 1,440 | 1,363 | 908 | 1,175 | ||||||||||||
TriCo Capital Trust I & II | 1,238 | 1,238 | ||||||||||||||
Capital Trusts | 1,690 | 1,238 | ||||||||||||||
Miscellaneous other assets | 1,283 | 173 | 8,070 | 3,443 | ||||||||||||
|
|
|
| |||||||||||||
Total other assets | $ | 38,607 | $ | 43,384 | $ | 51,735 | $ | 36,086 | ||||||||
|
|
|
| |||||||||||||
The majority of prepaid expenses & miscellaneous other assets at December 31, 2012 and 2011 consisted of prepaid FDIC assessment. In November of 2009, the FDIC adopted an amendment to its assessment regulations to require insured institutions to prepay, on December 30, 2009, their estimated quarterly risk-based assessments for the fourth quarter of calendar 2009 and for all of the calendar years 2010, 2011 and 2012. The amount of the prepayment was generally determined based upon an institution’s assessment rate in effect on September 30, 2009, adjusted to reflect a 5% growth and as an assessment rate increase of three cents per $100 of deposits effective January 1, 2011. The Bank’s prepayment amount was $10,544,000.
Note 13—13 - Deposits
A summary of the balances of deposits follows (in thousands):
| December 31, | December 31, | |||||||||||||||
| 2012 | 2011 | 2014 | 2013 | |||||||||||||
Noninterest-bearing demand | $ | 684,833 | $ | 541,276 | $ | 1,083,900 | $ | 789,458 | ||||||||
Interest-bearing demand | 503,465 | 431,565 | 782,385 | 533,351 | ||||||||||||
Savings | 762,924 | 797,182 | 1,156,126 | 798,986 | ||||||||||||
Time certificates, $100,000 and over | 180,195 | 220,374 | ||||||||||||||
Time certificates, $250,000 and over | 38,217 | 31,542 | ||||||||||||||
Other time certificates | 158,285 | 200,139 | 319,795 | 257,146 | ||||||||||||
|
|
|
| |||||||||||||
Total deposits | $ | 2,289,702 | $ | 2,190,536 | $ | 3,380,423 | $ | 2,410,483 | ||||||||
|
|
|
| |||||||||||||
Certificate of deposit balances of $5,000,000 and $5,000,000 from the State of California were included in time certificates, $100,000$250,000 and over, at December 31, 20122014 and 2011,2013, respectively. The Bank participates in a deposit program offered by the State of California whereby the State may make deposits at the Bank’s request subject to collateral and credit worthiness constraints. The negotiated rates on these State deposits are generally more favorable than other wholesale funding sources available to the Bank. Overdrawn deposit balances of $1,408,000$1,216,000 and $1,343,000$1,212,000 were classified as consumer loans at December 31, 20122014 and 2011,2013, respectively.
At December 31, 2012,2014, the scheduled maturities of time deposits were as follows (in thousands):
| Scheduled Maturities | Scheduled Maturities | |||||||
2013 | $ | 258,707 | ||||||
2014 | 26,152 | |||||||
2015 | 26,303 | $ | 282,629 | |||||
2016 | 16,276 | 46,606 | ||||||
2017 | 11,042 | 17,017 | ||||||
2018 | 6,241 | |||||||
2019 | 5,516 | |||||||
Thereafter | — | 3 | ||||||
|
| |||||||
Total | $ | 338,480 | $ | 358,012 | ||||
|
| |||||||
Note 14—14 – Reserve for Unfunded Commitments
The following tables summarize the activity in reserve for unfunded commitments for the periods indicated (dollars in thousands):
| Years ended December 31, | ||||||||||||
| 2012 | 2011 | 2010 | ||||||||||
Balance at beginning of period | $ | 2,740 | $ | 2,640 | $ | 3,640 | ||||||
Provision for losses – Unfunded commitments | 875 | 100 | (1,000 | ) | ||||||||
|
|
|
|
|
| |||||||
Balance at end of period | $ | 3,615 | $ | 2,740 | $ | 2,640 | ||||||
|
|
|
|
|
| |||||||
| Years ended December 31, | ||||||||||||
| 2014 | 2013 | 2012 | ||||||||||
Balance at beginning of period | $ | 2,415 | $ | 3,615 | $ | 2,740 | ||||||
Acquisitions | 125 | — | — | |||||||||
Provision for losses – Unfunded commitments | (395 | ) | (1,200 | ) | 875 | |||||||
|
|
|
|
|
| |||||||
Balance at end of period | $ | 2,145 | $ | 2,415 | $ | 3,615 | ||||||
|
|
|
|
|
| |||||||
Note 15—15 – Other Liabilities
Other liabilities were comprised of (in thousands):
| December 31, | December 31, | |||||||||||||||
| 2012 | 2011 | 2014 | 2013 | |||||||||||||
Deferred compensation | $ | 7,738 | $ | 8,209 | $ | 7,408 | $ | 7,357 | ||||||||
Pension liability | 16,345 | 15,003 | 26,798 | 14,634 | ||||||||||||
Joint beneficiary agreements | 2,736 | 2,323 | 2,728 | 2,623 | ||||||||||||
Accrued legal settlement | 2,090 | — | ||||||||||||||
Miscellaneous other liabilities | 6,213 | 4,892 | 12,258 | 7,097 | ||||||||||||
|
|
|
| |||||||||||||
Total other liabilities | $ | 35,122 | $ | 30,427 | $ | 49,192 | $ | 31,711 | ||||||||
|
|
|
| |||||||||||||
81
Note 16—16 - Other Borrowings
A summary of the balances of other borrowings follows:
| December 31, | ||||||||
| 2012 | 2011 | |||||||
| (in thousands) | ||||||||
Borrowing under security repurchase agreement, rate fixed at 4.72%, matured on August 30, 2012 | — | $ | 50,000 | |||||
FHLB fixed rate borrowings: | ||||||||
Matured January 25, 2012, effective rate 0.24% | — | 3,000 | ||||||
Matured April 6, 2012, effective rate 0.26% | — | 5,013 | ||||||
Matured April 25, 2012, effective rate 0.26% | — | 3,001 | ||||||
Matured July 25, 2012, effective rate 0.34% | — | 3,000 | ||||||
Other collateralized borrowings, fixed rate, as of December 31, 2012 of 0.05%, payable on January 2, 2013 | $ | 9,197 | 8,527 | |||||
|
|
|
| |||||
Total other borrowings | $ | 9,197 | $ | 72,541 | ||||
|
|
|
| |||||
| December 31, | ||||||||
| 2014 | 2013 | |||||||
| (in thousands) | ||||||||
Other collateralized borrowings, fixed rate, as of December 31, 2014 of 0.05%, payable on January 2, 2014 | $ | 9,276 | $ | 6,335 | ||||
|
|
|
| |||||
Total other borrowings | $ | 9,276 | $ | 6,335 | ||||
|
|
|
| |||||
During August 2007, the Company entered into a security repurchase agreement with principal balance of $50,000,000 and terms as described above. The Company did not enter into any other borrowings or repurchase agreements during 20122014 or 2011. The average balance of repurchase agreements for 2012 and 2011 was $33,333,000 and $50,000,000, respectively, with an average rate of 4.72% during both 2012 and 2011.2013.
The Company had $9,197,000$9,276,000 and $8,527,000$6,335,000 of other collateralized borrowings at December 31, 20122014 and December 31, 2011,2013, respectively. Other collateralized borrowings are generally overnight maturity borrowings from non-financial institutions that are collateralized by securities owned by the Company. As of December 31, 2012,2014, the Company has pledged as collateral and sold under agreements to repurchase investment securities with fair value of $27,411,000$29,298,000 under these other collateralized borrowings.
As part of the Citizens acquisition on September 23, 2011, the Company assumed borrowings with principal balances totaling $22,000,000 and fair values totaling $22,028,000 of which all has since matured . These borrowings from the Federal Home Loan Bank of San Francisco (FHLB) were collateralized under the Bank’s line of credit at the FHLB as described below.
The Company maintains a collateralized line of credit with the Federal Home Loan Bank of San Francisco. Based on the FHLB stock requirements at December 31, 2012,2014, this line provided for maximum borrowings of $507,404,000$865,466,000 of which none was outstanding, leaving $507,404,000$865,466,000 available. As of December 31, 2012,2014, the Company hashad designated investment securities with a fair value of $108,917,000 and loans totaling $998,856,000$1,217,944,000 as potential collateral under this collateralized line of credit with the FHLB.
The Company maintains a collateralized line of credit with the Federal Reserve Bank of San Francisco. As of December 31, 2012,2014, this line provided for maximum borrowings of $88,050,000$138,545,000 of which none was outstanding, leaving $88,050,000$138,545,000 available. As of December 31, 2012,2014, the Company has designated investment securities with fair value of $57,000$451,000 and loans totaling $110,747,000$200,282,000 as potential collateral under this collateralized line of credit with the FRB.
The Company has available unused correspondent banking lines of credit from commercial banks totaling $5,000,000$15,000,000 for federal funds transactions at December 31, 2012.
Note 17—17 – Junior Subordinated Debt
On July 31, 2003, the Company formed a subsidiary business trust, TriCo Capital Trust I, to issue trust preferred securities. Concurrently with the issuance of the trust preferred securities, the trust issued 619 shares of common stock to the Company for $1,000 per share or an aggregate of $619,000. In addition, the Company issued a Junior Subordinated Debenturejunior subordinated debenture to the Trusttrust in the amount of $20,619,000. The terms of the Junior Subordinated Debenturejunior subordinated debenture are materially consistent with the terms of the trust preferred securities issued by TriCo Capital Trust I. Also on July 31, 2003, TriCo Capital Trust I completed an offering of 20,000 shares of cumulative trust preferred securities for cash in an aggregate amount of $20,000,000. The trust preferred securities are mandatorily redeemable upon maturity on October 7, 2033 with an interest rate that resets quarterly at three-month LIBOR plus 3.05%. TriCo Capital Trust I has the right to redeem the trust preferred securities on or after October 7, 2008. The trust preferred securities were issued through an underwriting syndicate to which the Company paid underwriting fees of $7.50 per trust preferred security or an aggregate of $150,000. The net proceeds of $19,850,000 were used to finance the opening of new branches, improve bank services and technology, repurchase shares of the Company’s common stock under its repurchase plan and increase the Company’s capital. The trust preferred securities have not been and will not be registered under the Securities Act of 1933, as amended, or applicable state securities laws and were sold pursuant to an exemption from registration under the Securities Act of 1933. The trust preferred securities may not be offered or sold in the United States absent registration or an applicable exemption from the registration requirements of the Securities Act of 1933, as amended, and applicable state securities laws.
The $20,619,000 of junior subordinated debentures issued by TriCo Capital Trust I are reflected as junior subordinated debt in the consolidated balance sheets. The common stock issued by TriCo Capital Trust I are recorded in other assets in the consolidated balance sheets. As of December 31, 2012, The TriCo Capital Trust I debentures carried an interest rate of 3.39%.
On June 22, 2004, the Company formed a second subsidiary business trust, TriCo Capital Trust II, to issue trust preferred securities. Concurrently with the issuance of the trust preferred securities, the trust issued 619 shares of common stock to the Company for $1,000 per share or an aggregate of $619,000. In addition, the Company issued a Junior Subordinated Debenturejunior subordinated debenture to the Trusttrust in the amount of $20,619,000. The terms of the Junior Subordinated Debenturejunior subordinated debenture are materially consistent with the terms of the trust preferred securities issued by TriCo Capital Trust II. Also on June 22, 2004, TriCo Capital Trust II completed an offering of 20,000 shares of cumulative trust preferred securities for cash in an aggregate amount of $20,000,000. The trust preferred securities are mandatorily redeemable upon maturity on July 23, 2034 with an interest rate that resets quarterly at three-month LIBOR plus 2.55%. TriCo Capital Trust II has the right to redeem the trust preferred securities on or after July 23, 2009. The trust preferred securities were issued through an underwriting syndicate to which the Company paid underwriting fees of $2.50 per trust preferred security or an aggregate of $50,000. The net proceeds of $19,950,000 were used to finance the opening of new branches, improve bank services and technology, repurchase shares of the Company’s common stock under its repurchase plan and increase the Company’s capital. The trust preferred securities have not been and will not be registered under the Securities Act of 1933, as amended, or applicable state securities laws and were sold pursuant to an exemption from registration under the Securities Act of 1933. The trust preferred securities may not be offered or sold in the United States absent registration or an applicable exemption from the registration requirements
As a result of the Securities ActCompany’s acquisition of 1933, as amended, and applicable state securities laws.
The $20,619,000 ofNorth Valley Bancorp on October 3, 2014, the Company assumed the junior subordinated debentures issued by TriCoNorth Valley Bancorp to North Valley Capital Trusts II, III & IV with face amounts of $6,186,000, $5,155,000 and $10,310,000, respectively. Also, as a result of the North Valley Bancorp acquisition, the Company acquired common stock interests in North Valley Capital Trusts II, III and IV with face valley of $186,000, $155,000, and $310,000, respectively. At the acquisition date of October 3, 2014, the junior subordinated debentures associated with North Valley Capital Trust II, III and IV were recorded on the Company’s books at their fair values of $5,006,000, $3,918,000, and $6,063,000, respectively. The related fair value discounts to face value of these debentures will be amortized over the remaining time to maturity for each of these debentures using the effective interest method. Similar, and proportional, discounts were applied to the acquired common stock interest in North Valley Capital Trusts II, III and IV, and these discounts will be proportionally amortized over the remaining time to maturity for each related debenture.
82
TriCo Capital Trusts I and II, and North Valley Capital Trusts II, III and IV are collectively referred to as the Capital Trusts. The recorded book values of the junior subordinated debentures issued by the Capital Trusts are reflected as junior subordinated debt in the Company’s consolidated balance sheets. The common stock issued by TriCothe Capital Trust IITrusts and owned by the Company is recorded in other assets in the Company’s consolidated balance sheets. AsThe recorded book value of December 31, 2012, The TriCo Capital Trust II debentures carried an interest rate of 2.87%.
Thethe debentures issued by TriCothe Capital Trust I and TriCo Capital Trust II,Trusts, less the recorded book value of the common securitiesstock of TriCothe Capital Trust I and TriCo Capital Trust II, continueTrusts owned by the Company, continues to qualify as Tier 1 or Tier 2 capital under interim guidance issued by the Board of Governors of the Federal Reserve System (Federal Reserve Board).
The following table summarizes the terms and recorded balance of each subordinated debenture as of the date indicated (dollars in thousands):
Subordinated Debt Series | Maturity Date | Face Value | Coupon Rate (Variable) 3 mo. LIBOR + | As of December 31, 2014 | ||||||||||||||||
| Current Coupon Rate | Recorded Book Value | |||||||||||||||||||
TriCo Cap Trust I | 10/7/2033 | $ | 20,619 | 3.05 | % | 3.28 | % | $ | 20,619 | |||||||||||
TriCo Cap Trust II | 7/23/2034 | 20,619 | 2.55 | % | 2.78 | % | 20,619 | |||||||||||||
North Valley Trust II | 4/24/2033 | 6,186 | 3.25 | % | 3.48 | % | 5,015 | |||||||||||||
North Valley Trust III | 4/24/2034 | 5,155 | 2.80 | % | 3.03 | % | 3,927 | |||||||||||||
North Valley Trust IV | 3/15/2036 | 10,310 | 1.33 | % | 1.57 | % | 6,092 | |||||||||||||
|
|
|
| |||||||||||||||||
| $ | 62,889 | $ | 56,272 | |||||||||||||||||
|
|
|
| |||||||||||||||||
Note 18—18 - Commitments and Contingencies
Restricted Cash Balances— Reserves (in the form of deposits with the San Francisco Federal Reserve Bank) of $31,594,000$57,616,000 and $20,143,000$38,359,000 were maintained to satisfy Federal regulatory requirements at December 31, 20122014 and 2011.2013. These reserves are included in cash and due from banks in the accompanying consolidated balance sheets.
Lease Commitments— The Company leases 4753 sites under non-cancelable operating leases. The leases contain various provisions for increases in rental rates, based either on changes in the published Consumer Price Index or a predetermined escalation schedule. Substantially all of the leases provide the Company with the option to extend the lease term one or more times following expiration of the initial term. The Company currently does not have any capital leases.
At December 31, 2012,2014, future minimum commitments under non-cancelable operating leases with initial or remaining terms of one year or more are as follows:
| Operating Leases | Operating Leases | |||||||
| (in thousands) | (in thousands) | |||||||
2013 | $ | 2,772 | ||||||
2014 | 2,417 | |||||||
2015 | 1,536 | $ | 3,419 | |||||
2016 | 954 | 2,510 | ||||||
2017 | 617 | 1,856 | ||||||
2018 | 1,323 | |||||||
2019 | 859 | |||||||
Thereafter | 1,312 | 1,180 | ||||||
|
| |||||||
Future minimum lease payments | $ | 9,608 | $ | 11,147 | ||||
|
| |||||||
Rent expense under operating leases was $4,786,000 in 2014, $4,300,000 in 2013, and $4,332,000 in 2012, $3,810,000 in 2011, and $3,049,000 in 2010.2012. Rent expense was offset by rent income of $225,000 in 2014, $216,000 in 2013, and $138,000 in 2012, $32,000 in 2011, and $86,000 in 2010.2012.
Financial Instruments with Off-Balance-Sheet Risk— The Company is a party to financial instruments with off-balance sheet risk in the normal course of business to meet the financing needs of its customers. These financial instruments include commitments to extend credit, standby letters of credit, and deposit account overdraft privilege. Those instruments involve, to varying degrees, elements of risk in excess of the amount recognized in the balance sheet. The contract amounts of those instruments reflect the extent of involvement the Company has in particular classes of financial instruments.
The Company’s exposure to loss in the event of nonperformance by the other party to the financial instrument for commitments to extend credit and standby letters of credit written is represented by the contractual amount of those instruments. The Company uses the same credit policies in making commitments and conditional obligations as it does for on-balance sheet instruments. The Company’s exposure to loss in the event of nonperformance by the other party to the financial instrument for deposit account overdraft privilege is represented by the overdraft privilege amount disclosed to the deposit account holder.
83
The following table presents a summary of the Bank’s commitments and contingent liabilities:
| (in thousands) | December 31, 2012 | December 31, 2011 | December 31, 2014 | December 31, 2013 | ||||||||||||
Financial instruments whose amounts represent risk: | ||||||||||||||||
Commitments to extend credit: | ||||||||||||||||
Commercial loans | $ | 123,517 | $ | 119,634 | $ | 177,557 | $ | 136,986 | ||||||||
Consumer loans | 369,467 | 380,489 | 392,705 | 360,194 | ||||||||||||
Real estate mortgage loans | 27,959 | 22,277 | 36,139 | 35,309 | ||||||||||||
Real estate construction loans | 36,311 | 6,646 | 49,774 | 22,897 | ||||||||||||
Standby letters of credit | 2,905 | 5,324 | 17,531 | 2,601 | ||||||||||||
Deposit account overdraft privilege | 69,675 | 61,623 | 101,060 | 68,932 | ||||||||||||
Commitments to extend credit are agreements to lend to a customer as long as there is no violation of any condition established in the contract. Commitments generally have fixed expiration dates of one year or less or other termination clauses and may require payment of a fee. Since many of the commitments are expected to expire without being drawn upon, the total commitment amounts do not necessarily represent future cash requirements. The Company evaluates each customer’s credit worthiness on a case-by-case basis. The amount of collateral obtained, if deemed necessary by the Company upon extension of credit, is based on Management’s credit evaluation of the customer. Collateral held varies, but may include accounts receivable, inventory, property, plant and equipment, residential properties, and income-producing commercial properties.
Standby letters of credit are conditional commitments issued by the Company to guarantee the performance of a customer to a third party. Those guarantees are primarily issued to support private borrowing arrangements. Most standby letters of credit are issued for one year or less. The credit risk involved in issuing letters of credit is essentially the same as that involved in extending loan facilities to customers. Collateral requirements vary, but in general follow the requirements for other loan facilities.
Deposit account overdraft privilege amount represents the unused overdraft privilege balance available to the Company’s deposit account holders who have deposit accounts covered by an overdraft privilege. The Company has established an overdraft privilege for certain of its deposit account products whereby all holders of such accounts who bring their accounts to a positive balance at least once every thirty days receive the overdraft privilege. The overdraft privilege allows depositors to overdraft their deposit account up to a predetermined level. The predetermined overdraft limit is set by the Company based on account type.
Legal Proceedings—The Bank owns 10,21413,396 shares of Class B common stock of Visa Inc. which are convertible into Class A common stock at a conversion ratio of 0.42060.4121 per Class A share. As of December 31, 2012,2014, the value of the Class A shares was $151.58$262.20 per share. Utilizing the conversion ratio, the value of unredeemed Class A equivalent shares owned by the CompanyBank was $651,000$1,447,000 as of December 31, 2012,2014, and has not been reflected in the accompanying financial statements. The shares of Visa Class B common stock are restricted and may not be transferred. Visa Member Banks are required to fund an escrow account to cover settlements, resolution of pending litigation and related claims. If the funds in the escrow account are insufficient to settle all the covered litigation, Visa may sell additional Class A shares, use the proceeds to settle litigation, and further reduce the conversion ratio. If funds remain in the escrow account after all litigation is settled, the Class B conversion ratio will be increased to reflect that surplus.
On January 24, 2014, a putative shareholder class action lawsuit was filed against TriCo, North Valley Bancorp and certain other defendants in connection with TriCo entering into the merger agreement with North Valley Bancorp. The lawsuit, which was filed in the Shasta County, California Superior Court, alleges that the members of the North Valley Bancorp board of directors breached their fiduciary duties to North Valley Bancorp shareholders by approving the proposed merger for inadequate consideration; approving the transaction in order receive benefits not equally shared by other North Valley Bancorp shareholders; entering into the merger agreement containing preclusive deal protection devices; and failing to take steps to maximize the value to be paid to the North Valley Bancorp shareholders. The lawsuit alleges claims against TriCo for aiding and abetting these alleged breaches of fiduciary duties. The plaintiff seeks, among other things, declaratory and injunctive relief concerning the alleged breaches of fiduciary duties injunctive relief prohibiting consummation of the merger, rescission, attorneys’ of the merger agreement, fees and costs, and other and further relief. On July 31, 2014 the defendants entered into a memorandum of understanding with the plaintiffs regarding the settlement of this lawsuit. In connection with the settlement contemplated by the memorandum of understanding and in consideration for the full settlement and release of all claims, TriCo and North Valley Bancorp agreed to make certain additional disclosures related to the proposed merger, which are contained in a Current Report on Form 8-K filed by each of the companies. The memorandum of understanding contemplates that the parties will negotiate in good faith and use their reasonable best efforts to enter into a stipulation of settlement. The stipulation of settlement will be subject to customary conditions, including court approval following notice to North Valley Bancorp’s shareholders. In the event that the parties enter into a stipulation of settlement, a hearing will be scheduled at which the court will consider the settlement. There can be no assurance that the parties will ultimately enter into a stipulation of settlement or that the court will approve the settlement even if the parties were to enter into such stipulation. In such event, the proposed settlement as contemplated by the memorandum of understanding may be terminated.
On September 27, 2012, the Company announced that the Bank entered into a tentative settlement with15, 2014, a former employee whoPersonal Banker at one of the Bank’s in-store branches filed a class action lawsuitClass Action Complaint against the Bank in theButte County Superior Court, alleging causes of action related to the observance of meal periods. Plaintiff seeks to represent a class of “current and former hourly-paid or non-exempt ‘personal bankers’, or employees with the same or similar job duties, employed by Defendants within the State of California Kernduring the preceding four years.” The Bank filed an Answer to the Complaint on November 6, 2014, denies the charges, and the Bank intends to vigorously defend the lawsuit against class certification and liability.
84
On January 20, 2015, a current Personal Banker at one of the Bank’s in-store branches filed a First Amended Complaint against Tri Counties Bank and TriCo Bancshares, dba Tri Counties Bank, in Sacramento County on behalfSuperior Court, alleging causes of herself andaction related to wage statement violations. Plaintiff seeks to represent a putative class of current and former Bankexempt and non-exempt employees serving as assistant branch managers seeking undisclosed damages, alleging thatwho worked for the Bank improperly classified its assistant branch managers as exempt employees under California laws.“during the time period beginning October 18, 2013 through the date of the filing of this action”. The lawsuit alleges claims for: failure to pay overtime compensation; failure to provide meal periods; failure to provide rest periods; failure to provide accurate wage statements; failure to provide suitable seating; declaratory relief; accounting;Company and unfair business practices in violation of California Business and Professions Code section 17200.
On September 26, 2012, after efforts to mediate the claim, the Bank have not yet responded to the First Amended Complaint, deny the charges, and intend to vigorously defend the former employee agreedlawsuit against class certification and liability.
Neither the Company nor its subsidiaries, are party to settleany other material pending legal proceeding, nor is their property the casesubject of any material pending legal proceeding, except routine legal proceedings arising in an amount ranging from $2,039,500the ordinary course of their business. None of these proceedings is expected to $2,500,000, depending primarily on the number of class participants who file claims, and pending approval by the court, including determination of the method to allocate settlement payments among current and former employees who are members of the defined settlement class, and the portion of the total settlement allocable to attorney’s fees and costs to plaintiff’s counsel. On September 26, 2012, the Bank recordedhave a $2,090,000 expense and accrued liability in anticipation of approval of this settlement by the court and estimated related payroll taxes.
The Company is a defendant in other legal actions arising from normal business activities. Management believes, after consultation with legal counsel, that these actions are without merit or that the ultimate liability, if any, resulting from them will not materially affectmaterial adverse impact upon the Company’s business, consolidated financial position or results fromof operations.
Other Commitments and Contingencies—The Company has entered into employment agreements or change of control agreements with certain officers of the Company providing severance payments and accelerated vesting of benefits under supplemental retirement agreements to the officers in the event of a change in control of the Company and termination for other than cause or after a substantial and material change in the officer’s title, compensation or responsibilities.
Mortgage loans sold to investors may be sold with servicing rights retained, with only the standard legal representations and warranties regarding recourse to the Bank. Management believes that any liabilities that may result from such recourse provisions are not significant.
The Bank has entered into a contract with Modern Building Inc. for the construction of a building to house the Bank’s operations and other facilities. Currently, total payments from the Bank to Modern Building Inc. under the contract are estimated to be $7,013,000. As of December 31, 2012, payments totaling $2,859,000 have been made leaving $4,154,000 of estimated future contractual payments to be made under the contract. Future contractual payments under this contract are subject to change.
Note 19—19 – Shareholders’ Equity
Dividends Paid
The Bank paid to the Company cash dividends in the aggregate amounts of $8,270,000, $8,175,000, and $8,522,000 $7,185,000,in 2014, 2013, and $7,650,000, in 2012, 2011, and 2010, respectively. The Bank is regulated by the Federal Deposit Insurance Corporation (FDIC) and the State of California Department of Financial Institutions.Business Oversight. Absent approval from the Commissioner of Financial InstitutionsDepartment of California,Business Oversight, California banking laws generally limit the Bank’s ability to pay dividends to the lesser of (1) retained earnings or (2) net income for the last three fiscal years, less cash distributions paid during such period. Under this regulation,law, at December 31, 2012,2014, the Bank may pay dividends of $23,568,000.
Shareholders’ Rights Plan
On June 25, 2001, the Company announced that its Board of Directors adopted and entered into a Shareholder Rights PlanAgreement designed to protect and maximize shareholder value and to assist the Board of Directors in ensuring fair and equitable benefit to all shareholders in the event of a hostile bid to acquire the Company.
The Company adopted this Rights PlanAgreement to protect shareholders from coercive or otherwise unfair takeover tactics. In general terms, the Rights Plan imposeswould have imposed a significant penalty upon any person or group that acquiresacquired 15% or more of the Company’s outstanding common stock without approval of the Company’s Board of Directors. The
On June 4, 2014, the Company entered into an amendment to its Rights Plan was not adopted in response to any known attempt to acquire controlAgreement that accelerated the expiration of the Company.
UnderRights from July 10, 2021 to July 1, 2014 and had the effect of terminating the Rights Plan, a dividend of one Preferred Stock Purchase Right was declared for each common share held of recordAgreement as of that date. At the closetime of business on July 10, 2001. No separate certificates evidencing the termination, all Rights will be issued unless and until they become exercisable.
The Rights generally will not become exercisable unless an acquiring entity accumulates or initiates a tender offerdistributed to purchase 15% or moreholders of the Company’s common stock. In that event, each Right will entitle the holder, other than the unapproved acquirer and its affiliates,stock pursuant to purchase either the Company’s common stock or shares in an acquiring entity at one-half of market value.
The Right’s initial exercise price, which is subject to adjustment, is $49.00 per Right. The Company’s Board of Directors generally will be entitled to redeem the Rights at a redemption price of $.01 per Right until an acquiring entity acquires a 15% position. The Rights were scheduled to expire on July 10, 2011, but on July 8, 2011, the Company extended the expiration date to July 10, 2021.Agreement expired.
Stock Repurchase Plan
On August 21, 2007, the Board of Directors adopted a plan to repurchase, as conditions warrant, up to 500,000 shares of the Company’s common stock on the open market. The timing of purchases and the exact number of shares to be purchased will depend on market conditions. The 500,000 shares authorized for repurchase under this stock repurchase plan represented approximately 3.2% of the Company’s 15,814,662 outstanding common shares as of August 21, 2007. This stock repurchase plan has no expiration date. As of December 31, 2012,2013, the Company had repurchased 166,600 shares under this plan.
Stock Repurchased Under Equity Compensation Plans
During the years ended December 31, 2012, 2011,2014, 2013, and 2010,2012, employees tendered 14,120, 177,430,103,268, 172,941, and 74,018 shares,14,120, respectively, of the Company’s common stock with market value of $224,000, $2,745,000,$2,551,000, $3,490,000, and $1,364,000,$224,000, respectively, in lieu of cash to exercise options to purchase shares of the Company’s stock and to pay income taxes related to such exercises as permitted by the Company’s shareholder-approved equity compensation plans. The tendered shares were retired. The market value of tendered shares is the last market trade price at closing on the day an option is exercised. Stock repurchased under equity incentive plans are not counted in the total of stock repurchased under the stock repurchase plan announced August 21, 2007.
Note 20—20 - Stock Options and Other Equity-Based Incentive Instruments
In March 2009, the Company’s Board of Directors adopted the TriCo Bancshares 2009 Equity Incentive Plan (2009 Plan) covering officers, employees, directors of, and consultants to, the Company. The 2009 Plan was approved by the Company’s shareholders in May 2009. The 2009 Plan allows for the grantgranting of the following types of equity awards (“Awards”)“stock awards” (Awards): incentive stock options, nonstatutory stock options, performance awards, restricted stock, restricted stock unit (RSU) awards and stock appreciation rights. SubjectRSUs that vest based solely on the grantee remaining in the service of the Company for a certain amount of time, are referred to as “service condition vesting RSUs”. RSUs that vest based on the grantee remaining in the service of the Company for a certain adjustments,amount of time and a market condition such as the total return of the Company’s common stock versus the total return of an index of bank stocks, are referred to as “market plus service condition vesting RSUs”. In May 2013, the Company’s shareholders approved an amendment to the 2009 Plan increasing the maximum aggregate number of shares of TriCo’s common stock which may be issued pursuant to or subject to Awards is 650,000.from 650,000 to 1,650,000. The number of shares available for issuance under the 2009 Plan shall beis reduced by: (i) one share for each share of common stock issued pursuant to a stock option or a
85
Stock Appreciation Right and (ii) two shares for each share of common stock issued pursuant to a Performance Award, a Restricted Stock Award or a Restricted Stock Unit Award. When Awards made under the 2009 Plan expire or are forfeited or cancelled, the underlying shares will become available for future Awards under the 2009 Plan. To the extent that a share of common stock pursuant to an Award that counted as two shares against the number of shares again becomes available for issuance under the 2009 Plan, the number of shares of common stock available for issuance under the 2009 Plan shall increase by two shares. Shares awarded and delivered under the 2009 Plan may be authorized but unissued, or reacquired shares. As of December 31, 2012, 578,0002014, 706,000 options for the purchase of common shares, remainand 46,286 restricted stock units were outstanding, and 72,000822,428 shares remain available for grant,issuance, under the 2009 Plan.
In May 2001, the Company adopted the TriCo Bancshares 2001 Stock Option Plan (2001 Plan) covering officers, employees, directors of, and consultants to, the Company. Under the 2001 Plan, the option exercise price cannot be less than the fair market value of the Common Stock at the date of grant except in the case of substitute options. Options for the 2001 Plan expire on the tenth anniversary of the grant date. Vesting schedules under the 2001 Plan are determined individually for each grant. As of December 31, 2012, 815,9352014, 396,850 options for the purchase of common shares remainwere outstanding under the 2001 Plan. As of May 2009, as a result of the shareholder approval of the 2009 Plan, no new options may be granted under the 2001 Plan.
Stock option activity during 2012 is summarized in the following table:table for the dates indicated:
| Number of Shares | Option Price per Share | Weighted Average Exercise Price | Weighted Average Fair Value on Date of Grant | Number of Shares | Option Price per Share | Weighted Average Exercise Price | ||||||||||||||||||||||||||
Outstanding at December 31, 2011 | 1,250,935 | $11.72 to $25.91 | $ | 17.18 | ||||||||||||||||||||||||||||
Outstanding at December 31, 2013 | 1,246,370 | $ | 12.63 | to | $ | 25.91 | $ | 18.04 | ||||||||||||||||||||||||
Options granted | 179,000 | $14.76 to $15.34 | $15.28 | $6.63 | 22,500 | $ | 23.21 | to | $ | 23.21 | $ | 23.21 | ||||||||||||||||||||
Options exercised | (36,000) | $11.72 to $12.60 | $11.95 | (166,020 | ) | $ | 14.54 | to | $ | 20.58 | $ | 17.32 | ||||||||||||||||||||
Options forfeited | — | — to — | — | — | — | to | — | - | ||||||||||||||||||||||||
Outstanding at December 31, 2012 | 1,393,935 | $12.60 to $25.91 | $ | 17.07 | ||||||||||||||||||||||||||||
Outstanding at September 30, 2014 | 1,102,850 | $ | 12.63 | to | $ | 25.91 | $ | 18.25 | ||||||||||||||||||||||||
The following table shows the number, weighted-average exercise price, intrinsic value, and weighted average remaining contractual life of options exercisable, options not yet exercisable and total options outstanding as of December 31, 2012:2014:
| Currently Exercisable | Currently Not Exercisable | Total Outstanding | Currently Exercisable | Currently Not Exercisable | Total Outstanding | |||||||||||||||||||
Number of options | 967,875 | 426,060 | 1,393,935 | 818,350 | 284,500 | 1,102,850 | ||||||||||||||||||
Weighted average exercise price | $ | 17.74 | $ | 15.55 | $ | 17.07 | $ | 18.62 | $ | 17.19 | $ | 18.25 | ||||||||||||
Intrinsic value (thousands) | $ | 1,194 | $ | 591 | $ | 1,785 | ||||||||||||||||||
Intrinsic value (in thousands) | $ | 5,007 | $ | 2,136 | $ | 7,143 | ||||||||||||||||||
Weighted average remaining contractual term (yrs.) | 3.5 | 8.8 | 5.1 | 4.5 | 7.6 | 5.3 | ||||||||||||||||||
The 426,060284,500 options that are currently not currently exercisable as of December 31, 20122014 are expected to vest, on a weighted-average basis, over the next 2.142.6 years, and the Company is expected to recognize $2,766,000$1,783,000 of pre-tax compensation costs related to these options as they vest. The Company did not modify any option grants in 2012, 2011,during 2013 or 2010.2014.
The following table shows the total intrinsic value of options exercised, the total fair value of options vested, total compensation costs for options recognized in income, and total tax benefit recognized in income related to compensation costs for options during the periods indicated:
| Years Ended December 31, | Years Ended December 31, | |||||||||||||||||||||||
| 2012 | 2011 | 2010 | 2014 | 2013 | 2012 | |||||||||||||||||||
Intrinsic value of options exercised | $ | 138,000 | $ | 2,087,000 | $ | 1,429,000 | $ | 1,209,000 | $ | 1,777,000 | $ | 138,000 | ||||||||||||
Fair value of options that vested | $ | 1,083,000 | $ | 830,000 | $ | 800,000 | $ | 965,000 | $ | 1,150,000 | $ | 1,083,000 | ||||||||||||
Total compensation costs for options recognized in income | $ | 1,083,000 | $ | 830,000 | $ | 800,000 | $ | 965,000 | $ | 1,150,000 | $ | 1,083,000 | ||||||||||||
Total tax benefit recognized in income related to compensation costs for options | $ | 455,000 | $ | 349,000 | $ | 336,000 | $ | 378,000 | $ | 484,000 | $ | 455,000 | ||||||||||||
Weighted average fair value of grants (per option) | $ | 6.63 | $ | 6.27 | $ | 7.93 | $ | 8.17 | $ | 8.91 | $ | 6.63 | ||||||||||||
The fair value of the Company’s stock option grants is estimated on the measurement date, which, for the Company, is the date of grant. The fair value of stock options is estimated using the Black-Scholes option-pricing model. The Company estimated expected market price volatility and expected term of the options based on historical data and other factors. The weighted-average assumptions used to determine the fair value of options granted are detailed in the table below:
| Years Ended December 31, | Years Ended December 31, | |||||||||||||||||||||||
| 2012 | 2011 | 2010 | 2014 | 2013 | 2012 | |||||||||||||||||||
Assumptions used to value option grants: | ||||||||||||||||||||||||
Average expected terms (years) | 8.8 | 8.8 | 8.5 | 6.3 | 7.0 | 8.8 | ||||||||||||||||||
Volatility | 51.5 | % | 51.2 | % | 49.7 | % | 42.1 | % | 56.2 | % | 51.5 | % | ||||||||||||
Annual rate of dividends | 2.36 | % | 2.48 | % | 2.05 | % | 1.90 | % | 1.87 | % | 2.36 | % | ||||||||||||
Discount rate | 1.49 | % | 1.70 | % | 2.82 | % | 1.69 | % | 1.26 | % | 1.49 | % | ||||||||||||
86
Restricted stock unit (RSU) activity is summarized in the following table for the dates indicated:
| Service Condition Vesting RSUs | Market Plus Service Condition Vesting RSUs | |||||||||||||||
Number of RSUs | Weighted Date of Grant | Number of RSUs | Weighted Average Fair Value on Date of Grant | |||||||||||||
Outstanding at December 31, 2013 | — | — | — | — | ||||||||||||
RSUs granted | 30,642 | $ | 22.54 | 15,366 | $ | 21.39 | ||||||||||
RSUs added through dividend credits | 278 | — | ||||||||||||||
RSUs released | — | — | ||||||||||||||
RSUs forfeited/expired | — | — | ||||||||||||||
Outstanding at December 31, 2014 | 30,920 | 15,366 | ||||||||||||||
The 30,642 of service condition vesting RSUs granted during 2014 include a feature whereby each RSU outstanding is credited with a dividend amount equal to any common stock cash dividend declared and paid, and the credited amount is divided by the closing price of the Company’s stock on the dividend payable date to arrive at an additional amount of RSUs outstanding under the original grant. The 30,920 of service condition vesting RSUs that are currently outstanding as of December 31, 2014 are expected to vest, and be released, on a weighted-average basis, over the next 2.8 years. The Company is expected to recognize $566,000 of pre-tax compensation costs related to these service condition vesting RSUs between December 31, 2014 and their vesting dates. During the three months ended December 31, 2014, the Company modified 13,749 service condition vesting RSUs that were granted on August 11, 2014 such that their vesting schedule was changed from 100% vesting on August 11, 2018 to 25% vesting on each of August 11, 2015, 2016, 2017 and 2018.
The 15,366 of market plus service condition vesting RSUs that are currently outstanding as of December 31, 2014 are expected to vest, and be released, on a weighted-average basis, over the next 2.6 years. The Company is expected to recognize $286,000 of pre-tax compensation costs related to these RSUs between December 31, 2014 and their vesting dates. As of December 31, 2014, the number of market plus service condition vesting RSUs outstanding that will actually vest, and be released, may be reduced to zero or increased to 23,049 depending on the total return of the Company’s common stock versus the total return of an index of bank stocks from the grant date to the vesting date. The Company did not modify any market plus service condition vesting RSUs during 2014.
87
Note 21—21 - Noninterest Income and Expenses
The components of other noninterest income were as follows (in thousands):Expense
| Years Ended December 31, | ||||||||||||||||||||||||
| The components of other noninterest income were as follows (in thousands): | Years Ended December 31, | |||||||||||||||||||||||
| 2012 | 2011 | 2010 | 2014 | 2013 | 2012 | |||||||||||||||||||
Service charges on deposit accounts | $ | 14,290 | $ | 14,776 | $ | 15,296 | $ | 11,811 | $ | 12,716 | $ | 14,290 | ||||||||||||
ATM and interchange fees | 7,762 | 7,058 | 6,078 | 9,651 | 8,370 | 7,762 | ||||||||||||||||||
Other service fees | 2,223 | 1,722 | 1,452 | 2,206 | 2,144 | 2,223 | ||||||||||||||||||
Mortgage banking service fees | 1,666 | 1,495 | 1,303 | 1,869 | 1,774 | 1,666 | ||||||||||||||||||
Change in value of mortgage servicing rights | (2,016 | ) | (1,107 | ) | (1,029 | ) | (1,301 | ) | 253 | (2,016 | ) | |||||||||||||
|
|
|
|
|
| |||||||||||||||||||
Total service charges and fees | 23,925 | 23,944 | 23,100 | 24,236 | 25,257 | 23,925 | ||||||||||||||||||
|
|
|
|
|
| |||||||||||||||||||
Gain on sale of loans | 6,810 | 3,037 | 3,647 | 2,032 | 5,602 | 6,810 | ||||||||||||||||||
Commissions on sale of non-deposit investment products | 3,209 | 2,105 | 1,209 | 2,995 | 2,983 | 3,209 | ||||||||||||||||||
Increase in cash value of life insurance | 1,820 | 1,885 | 1,847 | 1,953 | 1,727 | 1,820 | ||||||||||||||||||
Change in indemnification asset | (286 | ) | 2,059 | 1,274 | (856 | ) | (1,649 | ) | (286 | ) | ||||||||||||||
Gain on sale of foreclosed assets | 786 | 680 | 562 | 2,153 | 1,640 | 786 | ||||||||||||||||||
Legal settlement | — | — | 400 | |||||||||||||||||||||
Bargain purchase gain | — | 7,575 | 232 | |||||||||||||||||||||
Sale of customer checks | 346 | 271 | 213 | 450 | 377 | 346 | ||||||||||||||||||
Lease brokerage income | 276 | 248 | 116 | 504 | 337 | 276 | ||||||||||||||||||
Loss on disposal of fixed assets | (420 | ) | (15 | ) | (58 | ) | ||||||||||||||||||
Gain (loss) on disposal of fixed assets | 49 | (39 | ) | (420 | ) | |||||||||||||||||||
Commission rebates | (56 | ) | (58 | ) | (67 | ) | — | — | (56 | ) | ||||||||||||||
Gain on life insurance death benefit | 675 | 789 | — | — | — | 675 | ||||||||||||||||||
Other | 895 | 293 | 220 | 1,000 | 594 | 895 | ||||||||||||||||||
|
|
|
|
|
| |||||||||||||||||||
Total other noninterest income | 14,055 | 18,869 | 9,595 | 10,280 | 11,572 | 14,055 | ||||||||||||||||||
|
|
|
|
|
| |||||||||||||||||||
Total noninterest income | $ | 37,980 | $ | 42,813 | $ | 32,695 | $ | 34,516 | $ | 36,829 | $ | 37,980 | ||||||||||||
|
|
|
|
|
| |||||||||||||||||||
Mortgage loan servicing fees, net of change in fair value of mortgage loan servicing rights, totaling $568,000, $2,027,000, and ($350,000), $388,000, and $274,000, were recorded in service charges and fees noninterest income for the years ended December 31, 2012, 2011,2014, 2013, and 2010,2012, respectively.
The components of noninterest expense were as follows (in thousands):
| Years Ended December 31, | Years Ended December 31, | |||||||||||||||||||||||
| 2012 | 2011 | 2010 | 2014 | 2013 | 2012 | |||||||||||||||||||
Base salaries, net of deferred loan origination costs | $ | 33,093 | $ | 29,753 | $ | 28,255 | $ | 39,342 | $ | 34,404 | $ | 33,093 | ||||||||||||
Incentive compensation | 5,138 | 3,735 | 1,844 | 5,068 | 4,694 | 5,138 | ||||||||||||||||||
Benefits and other compensation costs | 11,721 | 10,715 | 10,006 | 13,134 | 12,838 | 11,721 | ||||||||||||||||||
|
|
|
|
|
| |||||||||||||||||||
Total salaries and benefits expense | 49,952 | 44,203 | 40,105 | 57,544 | 51,936 | 49,952 | ||||||||||||||||||
|
|
| ||||||||||||||||||||||
|
|
| ||||||||||||||||||||||
Occupancy | 7,263 | 6,198 | 5,717 | 8,203 | 7,405 | 7,263 | ||||||||||||||||||
Equipment | 4,444 | 3,770 | 3,975 | 4,514 | 4,162 | 4,444 | ||||||||||||||||||
Data processing and software | 4,793 | 3,980 | 3,163 | 6,512 | 4,844 | 4,793 | ||||||||||||||||||
Assessments | 2,393 | 2,491 | 3,253 | 2,107 | 2,248 | 2,393 | ||||||||||||||||||
ATM network charges | 2,390 | 1,939 | 1,851 | 2,996 | 2,480 | 2,390 | ||||||||||||||||||
Advertising | 2,876 | 2,649 | 2,340 | 2,413 | 1,981 | 2,876 | ||||||||||||||||||
Professional fees | 2,709 | 2,004 | 2,478 | 3,888 | 2,707 | 2,879 | ||||||||||||||||||
Telecommunications | 2,250 | 1,875 | 1,817 | 2,870 | 2,449 | 2,250 | ||||||||||||||||||
Postage | 920 | 935 | 1,037 | 949 | 786 | 920 | ||||||||||||||||||
Courier service | 1,013 | 953 | 826 | 1,055 | 988 | 1,013 | ||||||||||||||||||
Foreclosed assets expense | 1,474 | 755 | 625 | 528 | 514 | 1,474 | ||||||||||||||||||
Intangible amortization | 209 | 177 | 307 | 446 | 209 | 209 | ||||||||||||||||||
Operational losses | 787 | 600 | 394 | 764 | 618 | 787 | ||||||||||||||||||
Provision for foreclosed asset losses | 1,728 | 1,984 | 1,522 | 208 | 682 | 1,728 | ||||||||||||||||||
Change in reserve for unfunded commitments | 875 | 100 | (1,000 | ) | (395 | ) | (1,200 | ) | 875 | |||||||||||||||
Legal settlement | 2,090 | — | — | — | 339 | 2,090 | ||||||||||||||||||
Merger expense | 4,858 | 312 | — | |||||||||||||||||||||
Other | 9,832 | 8,102 | 8,795 | 10,919 | 10,144 | 9,662 | ||||||||||||||||||
|
|
|
|
|
| |||||||||||||||||||
Total other noninterest expense | 48,046 | 38,512 | 37,100 | 52,835 | 41,668 | 48,046 | ||||||||||||||||||
|
|
|
|
|
| |||||||||||||||||||
Total noninterest expense | $ | 97,998 | $ | 82,715 | $ | 77,205 | $ | 110,379 | $ | 93,604 | $ | 97,998 | ||||||||||||
|
|
|
|
|
| |||||||||||||||||||
Merger expense: | ||||||||||||||||||||||||
Incentive compensation | $ | 1,174 | — | — | ||||||||||||||||||||
Benefits and other compensation costs | 94 | — | — | |||||||||||||||||||||
Data processing and software | 475 | — | — | |||||||||||||||||||||
Professional fees | 2,390 | $ | 312 | — | ||||||||||||||||||||
Other | 725 | — | — | |||||||||||||||||||||
|
|
| ||||||||||||||||||||||
Total merger expense | $ | 4,858 | $ | 312 | — | |||||||||||||||||||
|
|
| ||||||||||||||||||||||
88
Note 22—22 - Income Taxes
The components of consolidated income tax expense are as follows:
| 2012 | 2011 | 2010 | 2014 | 2013 | 2012 | |||||||||||||||||||
| (in thousands) | (in thousands) | |||||||||||||||||||||||
Current tax expense | ||||||||||||||||||||||||
Federal | $ | 9,895 | $ | 9,645 | $ | 5,509 | $ | 14,485 | $ | 11,618 | $ | 9,895 | ||||||||||||
State | 3,425 | 3,238 | 1,824 | 5,016 | 4,261 | 3,425 | ||||||||||||||||||
|
|
|
|
|
| |||||||||||||||||||
| 13,320 | 12,883 | 7,333 | 19,501 | 15,879 | 13,320 | |||||||||||||||||||
|
|
|
|
|
| |||||||||||||||||||
Deferred tax benefit | ||||||||||||||||||||||||
Deferred tax expense (benefit) | ||||||||||||||||||||||||
Federal | (235 | ) | (1,298 | ) | (3,586 | ) | (794 | ) | 1,976 | (235 | ) | |||||||||||||
State | (148 | ) | (393 | ) | (1,281 | ) | (199 | ) | 550 | (148 | ) | |||||||||||||
|
|
|
|
|
| |||||||||||||||||||
| (383 | ) | (1,691 | ) | (4,867 | ) | (993 | ) | 2,526 | (383 | ) | ||||||||||||||
|
|
|
|
|
| |||||||||||||||||||
Total tax expense | $ | 12,937 | $ | 11,192 | $ | 2,466 | $ | 18,508 | $ | 18,405 | $ | 12,937 | ||||||||||||
|
|
|
|
|
| |||||||||||||||||||
A deferred tax asset or liability is recognized for the tax consequences of temporary differences in the recognition of revenue and expense for financial and tax reporting purposes. The net change during the year in the deferred tax asset or liability results in a deferred tax expense or benefit.
Taxes recorded directly to shareholders’ equity are not included in the preceding table. These taxes (benefits) relating to changes in unfunded status of the supplemental retirement plans amounting to ($2,000)$(2,984,000) in 2014, $1,269,000 in 2013, and $(2,000) in 2012, $828,000 in 2011, and ($684,000) in 2010, andtaxes (benefits) related to unrealized gains and losses on available-for-sale investment securities amounting to ($880,000)$(68,000) in 2012, $1,090,0002014, $(1,780,000) in 2011,2013, and ($17,000)$(880,000) in 2010,2012, taxes (benefits) related to employee stock options of $97,000 in 2014, $138,000 in 2013, and $13,000 in 2012, $114,000 in 2011, and $0 in 2010, and taxes (benefits) related to changes in joint beneficiary agreement liability of $0 in 2014, $0 in 2013, and $64,000 in 2012, ($105,000) in 2011, and $0 in 2010, were recorded directly to shareholders’ equity.
The temporary differences, tax effected, which give rise to the Company’s net deferred tax asset recorded in other assets are as follows as of December 31 for the years indicated:
| 2012 | 2011 | 2014 | 2013 | |||||||||||||
| (in thousands) | (in thousands) | |||||||||||||||
Deferred tax assets: | ||||||||||||||||
Allowance for losses | $ | 19,073 | $ | 20,457 | $ | 16,284 | $ | 17,096 | ||||||||
Deferred compensation | 3,254 | 3,452 | 3,115 | 3,093 | ||||||||||||
Accrued pension liability | 5,272 | 4,709 | 7,925 | 5,817 | ||||||||||||
Accrued bonus | 980 | — | 1,149 | 1,037 | ||||||||||||
Other accrued expenses | 879 | — | 124 | — | ||||||||||||
Unfunded status of the supplemental retirement plans | 1,600 | 1,598 | 3,315 | 331 | ||||||||||||
State taxes | 1,297 | 1,106 | 1,713 | 1,390 | ||||||||||||
Intangible amortization | — | 53 | ||||||||||||||
Stock option expense | 1,879 | 1,436 | 2,534 | 2,225 | ||||||||||||
Nonaccrual interest | 1,889 | 2,280 | 2,714 | 1,840 | ||||||||||||
Joint beneficiary agreement liability | — | 1,041 | ||||||||||||||
OREO write downs | 198 | 331 | ||||||||||||||
Acquisition cost basis | 482 | 113 | 6,017 | 699 | ||||||||||||
OREO write downs | 1,103 | 1,300 | ||||||||||||||
Other, net | — | 218 | ||||||||||||||
Tax credits | 490 | — | ||||||||||||||
Net operating loss carryforwards | 7,128 | — | ||||||||||||||
Other | 625 | — | ||||||||||||||
|
|
|
| |||||||||||||
Total deferred tax assets | 37,708 | 37,763 | 53,331 | 33,859 | ||||||||||||
|
|
|
| |||||||||||||
Deferred tax liabilities: | ||||||||||||||||
Securities income | (1,038 | ) | (1,197 | ) | (1,362 | ) | (986 | ) | ||||||||
Unrealized gain on securities | (3,547 | ) | (4,427 | ) | (1,699 | ) | (1,767 | ) | ||||||||
Depreciation | (344 | ) | (427 | ) | (3,072 | ) | (392 | ) | ||||||||
Merger related fixed asset valuations | (379 | ) | (379 | ) | (54 | ) | (379 | ) | ||||||||
Securities accretion | (150 | ) | (168 | ) | (287 | ) | (256 | ) | ||||||||
Mortgage servicing rights valuation | (1,641 | ) | (1,503 | ) | (2,977 | ) | (2,416 | ) | ||||||||
Indemnification asset | (840 | ) | (1,852 | ) | 147 | (87 | ) | |||||||||
Core deposit intangible | (2,802 | ) | (193 | ) | ||||||||||||
Junior subordinated debt | (2,782 | ) | — | |||||||||||||
Prepaid expenses and other | (834 | ) | — | (737 | ) | (602 | ) | |||||||||
|
|
|
| |||||||||||||
Total deferred tax liability | (8,773 | ) | (9,953 | ) | (15,625 | ) | (7,078 | ) | ||||||||
|
|
|
| |||||||||||||
Net deferred tax asset | $ | 28,935 | $ | 27,810 | $ | 37,706 | $ | 26,781 | ||||||||
|
|
|
| |||||||||||||
As part of the merger with North Valley, TriCo acquired federal and state net operating loss carryforwards, capital loss carryforwards, and tax credit carryforwards. These tax attribute carryforwards will be subject to provisions of the tax law that limit the use of such losses and credits generated by a company prior to the date certain ownership changes occur. The amount of the Company’s net operating loss carryforwards that would be subject to these limitations as of December 31, 2014 are $13.7 million and $35.2 million for federal and California, respectively. The amount of the Company’s capital loss carryforwards that would be subject to these limitations as of December 31, 2014 are $131,000 and $404,000 for federal and California, respectively. The amount of the Company’s tax credits that would be subject to these limitations as of December 31, 2014 are $69,000 and $2.7 million for federal and California, respectively. Due to the limitation, a significant
89
portion of the state tax credits will expire regardless of whether the Company generates future taxable income. As such, the Company has recorded the future benefit of these tax credits at the value which is more likely than not to be realized. These tax loss and tax credit carryforwards expire at various dates beginning in 2015.
The Company believes that a valuation allowance is not needed to reduce the deferred tax assets as it is more likely than not that the results of future operations will generate sufficient taxable income to realize the deferred tax assets.
As part of the North Valley merger, TriCo inherited an unrecognized tax benefit for tax positions claimed on prior year tax returns filed by North Valley. The Company had noan unrecognized tax benefits atbenefit of $245,000 as of December 31, 2012,2014, the recognition of which would reduce the Company’s tax expense by $158,000. Management does not expect the unrecognized tax benefit will materially change in the next 12 months. A summary of changes in the Company’s unrecognized tax benefit (including interest and penalties) in 2014 is as follows:
(in thousands) | UTB | Interest/Penalties | Total | |||||||||
As of December 31, 2013 | — | — | — | |||||||||
Additions for tax positions for prior years | 227 | 18 | 245 | |||||||||
|
|
|
|
|
| |||||||
As of December 31, 2014 | 227 | 18 | 245 | |||||||||
|
|
|
|
|
| |||||||
During the years ended December 31, 2011 or2014 and December 31, 2010.2013, the Company recognized no interest and penalties related to taxes. During the year ended December 31, 2012, the Company recognized interest and penalties related to taxes of $22,000 and $5,000, respectively. During the years ended December 31, 2011 and 2010 the Company recognized no interest and penalties. The Company files income tax returns in the U.S. federal jurisdiction, and California. With few exceptions, the Company is no longer subject to U.S. federal and state/local income tax examinations by tax authorities for years before 20092011 and 2008,2010, respectively.
The provisions for income taxes applicable to income before taxes for the years ended December 31, 2012, 20112014, 2013 and 20102012 differ from amounts computed by applying the statutory Federal income tax rates to income before taxes. The effective tax rate and the statutory federal income tax rate are reconciled as follows:
| Years Ended December 31, | Years Ended December 31, | |||||||||||||||||||||||
| 2012 | 2011 | 2010 | 2014 | 2013 | 2012 | |||||||||||||||||||
Federal statutory income tax rate | 35.0 | % | 35.0 | % | 35.0 | % | 35.0 | % | 35.0 | % | 35.0 | % | ||||||||||||
State income taxes, net of federal tax benefit | 6.7 | 6.2 | 4.2 | 7.0 | 6.8 | 6.7 | ||||||||||||||||||
Tax-exempt interest on municipal obligations | (0.5 | ) | (0.6 | ) | (2.8 | ) | (0.4 | ) | (0.4 | ) | (0.5 | ) | ||||||||||||
Tax-exempt life insurance related income | (2.0 | ) | (3.1 | ) | (7.6 | ) | (1.5 | ) | (1.3 | ) | (2.0 | ) | ||||||||||||
Non-deductible joint beneficiary agreement expense | 0.3 | — | — | 0.2 | 0.2 | 0.3 | ||||||||||||||||||
Non-deductible merger expense | 1.0 | — | — | |||||||||||||||||||||
Other | 1.0 | 0.1 | 0.3 | 0.2 | (0.1 | ) | 1.0 | |||||||||||||||||
|
|
|
|
|
| |||||||||||||||||||
Effective Tax Rate | 40.5 | % | 37.6 | % | 29.1 | % | 41.5 | % | 40.2 | % | 40.5 | % | ||||||||||||
|
|
|
|
|
| |||||||||||||||||||
Note 23—23 - Earnings Per Share
Basic earnings per share represents income available to common shareholders divided by the weighted-average number of common shares outstanding during the period. Diluted earnings per share reflects additional common shares that would have been outstanding if dilutive potential common shares had been issued, as well as any adjustments to income that would result from assumed issuance. Potential common shares that may be issued by the Company relate solely from outstanding stock options, and are determined using the treasury stock method. Earnings per share have been computed based on the following:
| Years ended December 31, | Years ended December 31, | |||||||||||||||||||||||
| 2012 | 2011 | 2010 | 2014 | 2013 | 2012 | |||||||||||||||||||
Net income (in thousands) | $ | 18,994 | $ | 18,590 | $ | 6,005 | $ | 26,108 | $ | 27,399 | $ | 18,994 | ||||||||||||
|
|
|
|
|
| |||||||||||||||||||
(number of shares in thousands) | ||||||||||||||||||||||||
Average number of common shares outstanding | 15,988 | 15,935 | 15,860 | 17,716 | 16,045 | 15,988 | ||||||||||||||||||
Effect of dilutive stock options | 64 | 65 | 150 | 207 | 152 | 64 | ||||||||||||||||||
|
|
|
|
|
| |||||||||||||||||||
Average number of common shares outstanding used to calculate diluted earnings per share | 16,052 | 16,000 | 16,010 | 17,923 | 16,197 | 16,052 | ||||||||||||||||||
|
|
|
|
|
| |||||||||||||||||||
Based on an average of quarterly computations, there were 95,600, 407,985 and 967,120 831,095,options and 578,310, optionsrestricted stock units excluded from the computation of annual diluted earnings per share for the years ended December 31, 2012, 20112014, 2013 and 2010,2012, respectively, because the effect of these options wasand restricted stock units were antidilutive.
90
Note 24—24 – Comprehensive Income
Accounting principles generally require that recognized revenue, expenses, gains and losses be included in net income. Although certain changes in assets and liabilities, such as unrealized gains and losses on available-for-sale securities, are reported as a separate component of the equity section of the balance sheet, such items, along with net income, are components of comprehensive income. The components of other comprehensive income and related tax effects are as follows:
| Years Ended December 31, | ||||||||||||
| 2012 | 2011 | 2010 | ||||||||||
| (in thousands) | ||||||||||||
Unrealized holding (losses) gains on available-for-sale securities | $ | (2,096 | ) | $ | 2,594 | $ | (41 | ) | ||||
Tax effect | 880 | (1,090 | ) | 17 | ||||||||
|
|
|
|
|
| |||||||
Unrealized holding (losses) gains on available-for-sale securities, net of tax | (1,216 | ) | 1,504 | (24 | ) | |||||||
|
|
|
|
|
| |||||||
Change in unfunded status of the supplemental retirement plans | (4 | ) | 1,968 | (1,627 | ) | |||||||
Tax effect | 2 | (828 | ) | 684 | ||||||||
|
|
|
|
|
| |||||||
Change in unfunded status of the supplemental retirement plans, net of tax | (2 | ) | 1,140 | (943 | ) | |||||||
|
|
|
|
|
| |||||||
Change in joint beneficiary agreement liability | (370 | ) | (248 | ) | (1 | ) | ||||||
Tax effect | (64 | ) | 105 | — | ||||||||
|
|
|
|
|
| |||||||
Change in joint beneficiary agreement liability, net of tax | (434 | ) | (143 | ) | (1 | ) | ||||||
|
|
|
|
|
| |||||||
| $ | (1,652 | ) | $ | 2,501 | $ | (968 | ) | |||||
|
|
|
|
|
| |||||||
Unrealized holding (losses) gains on available for sale securities before reclassifications Amounts reclassified out of accumulated other comprehensive income Unrealized holding (losses) gains on available for sale securities after reclassifications Tax effect Unrealized holding (losses) gains on available for sale securities, net of tax Change in unfunded status of the supplemental retirement plans before reclassifications Amounts reclassified out of accumulated other comprehensive income: Amortization of prior service cost Amortization of actuarial losses Total amounts reclassified out of accumulated other comprehensive income Change in unfunded status of the supplemental retirement plans after reclassifications Tax effect Change in unfunded status of the supplemental retirement plans, net of tax Change in joint beneficiary agreement liability before reclassifications Amounts reclassified out of accumulated other comprehensive income Change in joint beneficiary agreement liability after reclassifications Tax effect Change in joint beneficiary agreement liability, net of tax Total other comprehensive (loss) income Years Ended December 31, 2014 2013 2012 (in thousands) $ (162 ) $ (4,232 ) $ (2,096 ) — — — (162 ) (4,232 ) (2,096 ) 68 1,780 880 (94 ) (2,452 ) (1,216 ) (7,253 ) 2,575 (445 ) 138 153 153 17 291 288 155 444 441 (7,098 ) 3,019 (4 ) 2,984 (1,269 ) 2 (4,114 ) 1,750 (2 ) 148 400 (370 ) — — — 148 400 (370 ) — — (64 ) 148 400 (434 ) $ (4,060 ) $ (302 ) $ (1,652 )
The components of accumulated other comprehensive income, included in shareholders’ equity, are as follows:
| December 31, | December 31, | |||||||||||||||
| 2012 | 2011 | 2014 | 2013 | |||||||||||||
| (in thousands) | (in thousands) | |||||||||||||||
Net unrealized gains on available-for-sale securities | $ | 8,434 | $ | 10,530 | ||||||||||||
Net unrealized gains on available for sale securities | $ | 4,040 | $ | 4,202 | ||||||||||||
Tax effect | (3,547 | ) | (4,427 | ) | (1,699 | ) | (1,767 | ) | ||||||||
|
|
|
| |||||||||||||
Unrealized holding gains on available-for-sale securities, net of tax | 4,887 | 6,103 | ||||||||||||||
|
| |||||||||||||||
Unrealized holding gains on available for sale securities, net of tax | 2,341 | 2,435 | ||||||||||||||
|
| |||||||||||||||
Unfunded status of the supplemental retirement plans | (3,806 | ) | (3,802 | ) | (7,885 | ) | (787 | ) | ||||||||
Tax effect | 1,600 | 1,598 | 3,315 | 331 | ||||||||||||
|
|
|
| |||||||||||||
Unfunded status of the supplemental retirement plans, net of tax | (2,206 | ) | (2,204 | ) | (4,570 | ) | (456 | ) | ||||||||
|
| |||||||||||||||
|
| |||||||||||||||
Joint beneficiary agreement liability | (522 | ) | (152 | ) | 26 | (122 | ) | |||||||||
Tax effect | 0 | 64 | — | — | ||||||||||||
|
|
|
| |||||||||||||
Joint beneficiary agreement liability, net of tax | (522 | ) | (88 | ) | 26 | (122 | ) | |||||||||
|
|
|
| |||||||||||||
Accumulated other comprehensive income | $ | 2,159 | $ | 3,811 | $ | (2,203 | ) | $ | 1,857 | |||||||
|
|
|
| |||||||||||||
Note 25—25 – Retirement Plans
401(k) Plan
The Company sponsors a 401(k) Plan whereby substantially all employees age 21 and over with 90 days of service may participate. Participants may contribute a portion of their compensation subject to certain limits based on federal tax laws. TheDuring 2014, 2013, and 2012 the Company doesdid not contribute to the 401(k) Plan. The Company did not incur any material expenses attributable to the 401(k) Plan during 2012, 2011,2014, 2013, and 2010.2012.
Employee Stock Ownership Plan
Substantially all employees with at least one year of service are covered by a discretionary employee stock ownership plan (ESOP). Contributions are made to the plan at the discretion of the Board of Directors. Contributions to the plan totaling $1,294,000 in 2014, $1,648,000 in 2013, and $1,229,000 in 2012, $1,084,000 in 2011, and $1,046,000 in 2010, are included in salary expense. Company shares owned by the ESOP are paid dividends and included in the calculation of earnings per share exactly as other common shares outstanding.
Deferred Compensation Plans
The Company has deferred compensation plans for certain directors and key executives, which allow certain directors and key executives designated by the Board of Directors of the Company to defer a portion of their compensation. The Company has purchased insurance on the lives of the participants and intends to hold these policies until death as a cost recovery of the Company’s deferred compensation obligations of $7,738,000,$7,408,000 and $8,209,000$7,357,000 at December 31, 20122014 and 2011,2013, respectively. Earnings credits on deferred balances totaling $551,000 in 2014, $568,000 in 2013, and $599,000 in 2012, $649,000 in 2011, and $683,000 in 2010, are included in noninterest expense.2012.
91
Supplemental Retirement Plans
The Company has supplemental retirement plans for certain directors and key executives. These plans are non-qualified defined benefit plans and are unsecured and unfunded. The Company has purchased insurance on the lives of the participants and intends to hold these policies until death as a cost recovery of the Company’s retirement obligations. The cash values of the insurance policies purchased to fund the deferred compensation obligations and the supplemental retirement obligations were $50,582,000$92,337,000 and $50,403,000$52,309,000 at December 31, 20122014 and 2011,2013, respectively.
The Company recorded in other liabilities the unfunded status of the supplemental retirement plans of $3,806,000$7,885,000 and $3,802,000$787,000 related to the supplemental retirement plans as of December 31, 20122014 and 2011,2013, respectively. These amounts represent the amount by which the projected benefit obligations for these retirement plans exceeded the fair value of plan assets plus amounts previously accrued related to the plans. The projected benefit obligation is recorded in other liabilities.
At December 31, 20122014 and 2011,2013, the unfunded status of the supplemental retirement plans of $3,806,000$7,885,000 and $3,802,000$787,000 were offset by a reduction of shareholders’ equity accumulated other comprehensive loss of $2,206,000$4,570,000 and $2,204,000,$456,000, respectively, representing the after-tax impact of the unfunded status of the supplemental retirement plans, and the related deferred tax asset of $1,600,000$3,315,000 and $1,598,000,$331,000, respectively. The Company expects to recognize approximately $291,000 of the net actuarial loss reported in the following table as of December 31, 2012 as a component of net periodic benefit cost during 2013.
Amounts recognized as a component of accumulated other comprehensive loss as of year-end that have not been recognized as a component of the combined net period benefit cost of the Company’s defined benefit pension plans are presented in the following table. The Company expects to recognize approximately $823,000 of the net actuarial loss reported in the following table as of December 31, 2014 as a component of net periodic benefit cost during 2015.
| December 31, | ||||||||
| (in thousands) | 2012 | 2011 | ||||||
Net actuarial loss | $ | (3,123 | ) | $ | (3,515 | ) | ||
Deferred tax benefit | 1,313 | 1,478 | ||||||
|
|
|
| |||||
Amount included in accumulated other comprehensive loss, net of tax | $ | 1,810 | $ | 2,037 | ||||
|
|
|
| |||||
| December 31, | ||||||||
| (in thousands) | 2014 | 2013 | ||||||
Transition obligation | $ | 9 | $ | 11 | ||||
Prior service cost | (173 | ) | (35 | ) | ||||
Net actuarial loss | 8,049 | 811 | ||||||
|
|
|
| |||||
Amount included in accumulated other comprehensive loss | $ | 7,885 | 787 | |||||
Deferred tax benefit | (3,315 | ) | (331 | ) | ||||
|
|
|
| |||||
Amount included in accumulated other comprehensive loss, net of tax | $ | 4,570 | $ | 456 | ||||
|
|
|
| |||||
Information pertaining to the activity in the supplemental retirement plans, using a measurement date of December 31, is as follows:
| December 31, | December 31, | |||||||||||||||
| 2012 | 2011 | 2014 | 2013 | |||||||||||||
| (in thousands) | (in thousands) | |||||||||||||||
Change in benefit obligation: | ||||||||||||||||
Benefit obligation at beginning of year | $ | (15,002 | ) | $ | (15,643 | ) | $ | (14,634 | ) | $ | (16,345 | ) | ||||
Acquisition | (4,150 | ) | — | |||||||||||||
Service cost | (680 | ) | (657 | ) | (652 | ) | (742 | ) | ||||||||
Interest cost | (687 | ) | (840 | ) | (739 | ) | (643 | ) | ||||||||
Actuarial (loss)/gain | (447 | ) | 1,428 | (7,254 | ) | 2,573 | ||||||||||
Benefits paid | 471 | 710 | 631 | 523 | ||||||||||||
|
|
|
| |||||||||||||
Benefit obligation at end of year | $ | (16,345 | ) | $ | (15,002 | ) | $ | (26,798 | ) | $ | (14,634 | ) | ||||
|
|
|
| |||||||||||||
Change in plan assets: | ||||||||||||||||
Fair value of plan assets at beginning of year | $ | — | $ | — | $ | — | $ | — | ||||||||
|
|
|
| |||||||||||||
Fair value of plan assets at end of year | $ | — | $ | — | $ | — | $ | — | ||||||||
|
| |||||||||||||||
|
| |||||||||||||||
Funded status | $ | (16,345 | ) | $ | (15,002 | ) | $ | (26,798 | ) | $ | (14,634 | ) | ||||
Unrecognized net obligation existing at January 1, 1986 | 13 | 15 | 9 | 11 | ||||||||||||
Unrecognized net actuarial loss | 3,675 | 3,516 | 8,049 | 811 | ||||||||||||
Unrecognized prior service cost | 118 | 271 | (173 | ) | (35 | ) | ||||||||||
Accumulated other comprehensive income | (3,806 | ) | (3,802 | ) | (7,885 | ) | (787 | ) | ||||||||
|
|
|
| |||||||||||||
Accrued benefit cost | $ | (16,345 | ) | $ | (15,002 | ) | $ | (26,798 | ) | $ | (14,634 | ) | ||||
|
|
|
| |||||||||||||
Accumulated benefit obligation | $ | (14,285 | ) | $ | (11,995 | ) | $ | (24,739 | ) | $ | (12,954 | ) | ||||
92
The following table sets forth the net periodic benefit cost recognized for the supplemental retirement plans:
| Years Ended December 31, | Years Ended December 31, | |||||||||||||||||||||||
| 2012 | 2011 | 2010 | 2014 | 2013 | 2012 | |||||||||||||||||||
| (in thousands) | (in thousands) | |||||||||||||||||||||||
Net pension cost included the following components: | ||||||||||||||||||||||||
Service cost-benefits earned during the period | $ | 680 | $ | 657 | $ | 523 | $ | 652 | $ | 743 | $ | 680 | ||||||||||||
Interest cost on projected benefit obligation | 687 | 840 | 764 | 739 | 643 | 687 | ||||||||||||||||||
Amortization of net obligation at transition | 2 | 2 | 2 | 2 | 2 | 2 | ||||||||||||||||||
Amortization of prior service cost | 153 | 153 | 153 | 138 | 153 | 153 | ||||||||||||||||||
Recognized net actuarial loss | 288 | 386 | 218 | 16 | 291 | 288 | ||||||||||||||||||
|
|
|
|
|
| |||||||||||||||||||
Net periodic pension cost | $ | 1,810 | $ | 2,038 | $ | 1,660 | $ | 1,547 | $ | 1,832 | $ | 1,810 | ||||||||||||
|
|
|
|
|
| |||||||||||||||||||
The following table sets forth assumptions used in accounting for the plans:
| Years Ended December 31, | ||||||||||||
| 2012 | 2011 | 2010 | ||||||||||
Discount rate used to calculate benefit obligation | 4.00 | % | 4.65 | % | 5.50 | % | ||||||
Discount rate used to calculate net periodic pension cost | 4.00 | % | 4.65 | % | 5.50 | % | ||||||
Average annual increase in executive compensation | 2.50 | % | 4.00 | % | 4.00 | % | ||||||
Average annual increase in director compensation | 2.50 | % | 2.50 | % | 2.50 | % | ||||||
Discount rate used to calculate benefit obligation Discount rate used to calculate net periodic pension cost Average annual increase in executive compensation Average annual increase in director compensation Years Ended December 31, 2014 2013 2012 3.65 % 4.85 % 4.00 % 3.65 % 4.85 % 4.00 % 2.50 % 2.50 % 2.50 % 2.50 % 2.50 % 2.50 %
The following table sets forth the expected benefit payments to participants and estimated contributions to be made by the Company under the supplemental retirement plans for the years indicated:
Years Ended | Expected Benefit Payments to Participants | Estimated Company Contributions | Expected Benefit Payments to Participants | Estimated Company Contributions | ||||||||||||
| (in thousands) | (in thousands) | |||||||||||||||
2013 | $ | 563 | $ | 563 | ||||||||||||
2014 | 569 | 569 | ||||||||||||||
2015 | 569 | 569 | $ | 1,145 | $ | 1,145 | ||||||||||
2016 | 550 | 550 | 1,036 | 1,036 | ||||||||||||
2017 | 539 | 539 | 1,001 | 1,001 | ||||||||||||
2018-2022 | $ | 5,826 | $ | 5,826 | ||||||||||||
2018 | 1,330 | 1,330 | ||||||||||||||
2019 | 519 | 519 | ||||||||||||||
2020-2024 | $ | 3,719 | $ | 3,719 | ||||||||||||
Note 26—26 – Related Party Transactions
Certain directors, officers, and companies with which they are associated were customers of, and had banking transactions with, the Company or the Bank in the ordinary course of business. It is the Company’s policy that all loans and commitments to lend to officers and directors be made on substantially the same terms, including interest rates and collateral, as those prevailing at the time for comparable transactions with other borrowers of the Bank.
The following table summarizes the activity in these loans for 2012 and 2011the periods indicated (in thousands):
Balance December 31, 2010 | $ | 2,571 | ||||||
Balance December 31, 2012 | $ | 2,368 | ||||||
Advances/new loans | 378 | 1,154 | ||||||
Removed/payments | (1,185 | ) | (886 | ) | ||||
|
| |||||||
Balance December 31, 2011 | $ | 1,764 | ||||||
Balance December 31, 2013 | $ | 2,636 | ||||||
Advances/new loans | 1,568 | 2,106 | ||||||
Removed/payments | (964 | ) | (1,610 | ) | ||||
|
| |||||||
Balance December 31, 2012 | $ | 2,368 | ||||||
Balance December 31, 2014 | $ | 3,132 | ||||||
|
| |||||||
Director Chrysler is a principal owner and CEO of Modern Building Inc. Modern Building Inc. provided construction services to Tri Counties Bankthe Company related to new and existing Bank facilities for aggregate payments of $1,181,000, $4,261,000, and $3,587,000 $754,000during 2014, 2013 and $182,000 during 2012, 2011 and 2010, respectively. At December 31, 2012, the Bank owed Modern Building Inc. approximately $1,065,000 for construction services provided during 2012.
Note 27—27 – Fair Value Measurement
The Company utilizes fair value measurements to record fair value adjustments to certain assets and liabilities and to determine fair value disclosures. In estimating fair value, the Company utilizes valuation techniques that are consistent with the market approach, income approach, and/or the cost approach. Inputs to valuation techniques include the assumptions that market participants would use in pricing an asset or liability including assumptions about the risk inherent in a particular valuation technique, the effect of a restriction on the sale or use of an asset and the risk of nonperformance. Securities available-for-sale and mortgage servicing rights are recorded at fair value on a recurring basis. Additionally, from time to time, the Company may be required to record at fair value other assets on a nonrecurring basis, such as loans held for sale, loans held for investment and certain other assets. These nonrecurring fair value adjustments typically involve application of lower of cost or market accounting or impairment write-downs of individual assets.
93
The Company groups assets and liabilities at fair value in three levels, based on the markets in which the assets and liabilities are traded and the observable nature of the assumptions used to determine fair value. These levels are:
Level 1 | Valuation is based upon quoted prices for identical instruments traded in active markets. | |
| Level 2 | Valuation is based upon quoted prices for similar instruments in active markets, quoted prices for identical or similar instruments in markets that are not active, and model-based valuation techniques for which all significant assumptions are observable in the market. | |
| Level 3 | Valuation is generated from model-based techniques that use at least one significant assumption not observable in the market. These unobservable assumptions reflect estimates of assumptions that market participants would use in pricing the asset or liability. Valuation techniques include use of option pricing models, discounted cash flow models and similar techniques. | |
Securities available-for-saleavailable for sale –- Securities available-for-saleavailable for sale are recorded at fair value on a recurring basis. Fair value measurement is based upon quoted prices, if available. If quoted prices are not available, fair values are measured using independent pricing models or other model-based valuation techniques such as the present value of future cash flows, adjusted for the security’s credit rating, prepayment assumptions and other factors such as credit loss assumptions. Level 1 securities include those traded on an active exchange, such as the New York Stock Exchange, U.S. Treasury securities that are traded by dealers or brokers in active over-the-counter markets and money market funds. Level 2 securities include mortgage-backed securities issued by government sponsored entities, municipal bonds and corporate debt securities. The Company had no securities classified as Level 3 during any of the periods covered in these financial statements.
Loans held for sale – Loans held for sale are carried at the lower of cost or fair value. The fair value of loans held for sale is based on what secondary markets are currently offering for loans with similar characteristics. As such, we classify those loans subjected to nonrecurring fair value adjustments as Level 2.
Impaired originated and PNCI loans – Originated and PNCI loans are not recorded at fair value on a recurring basis. However, from time to time, an originated or PNCI loan is considered impaired and an allowance for loan losses is established. Originated and PNCI loans for which it is probable that payment of interest and principal will not be made in accordance with the contractual terms of the loan agreement are considered impaired. The fair value of an impaired originated or PNCI loan is estimated using one of several methods, including collateral value, fair value of similar debt, enterprise value, liquidation value and discounted cash flows. Those impaired originated and PNCI loans not requiring an allowance represent loans for which the fair value of the expected repayments or collateral exceed the recorded investments in such loans. Impaired originated and PNCI loans where an allowance is established based on the fair value of collateral require classification in the fair value hierarchy. When the fair value of the collateral is based on an observable market price or a current appraised value which uses substantially observable data, the Company records the impaired originated or PNCI loan as nonrecurring Level 2. When an appraised value is not available or management determines the fair value of the collateral is further impaired below the appraised value, or the appraised value contains a significant unobservable assumption, such as deviations from comparable sales, and there is no observable market price, the Company records the impaired originated or PNCI loan as nonrecurring Level 3.
Foreclosed assets –- Foreclosed assets include assets acquired through, or in lieu of, loan foreclosure. Foreclosed assets are held for sale and are initially recorded at fair value at the date of foreclosure, establishing a new cost basis. Subsequent to foreclosure, management periodically performs valuations and the assets are carried at the lower of carrying amount or fair value less cost to sell. When the fair value of foreclosed assets is based on an observable market price or a current appraised value which uses substantially observable data, the Company records the impaired originated loan as nonrecurring Level 2. When an appraised value is not available or management determines the fair value of the collateral is further impaired below the appraised value, or the appraised value contains a significant unobservable assumption, such as deviations from comparable sales, and there is no observable market price, the Company records the foreclosed asset as nonrecurring Level 3. Revenue and expenses from operations and changes in the valuation allowance are included in other noninterest expense.
Mortgage servicing rights –- Mortgage servicing rights are carried at fair value. A valuation model, which utilizes a discounted cash flow analysis using a discount rate and prepayment speed assumptions is used in the computation of the fair value measurement. While the prepayment speed assumption is currently quoted for comparable instruments, the discount rate assumption currently requires a significant degree of management judgment and is therefore considered an unobservable input. As such, the Company classifies mortgage servicing rights subjected to recurring fair value adjustments as Level 3. Additional information regarding mortgage servicing rights can be found in Note 10 in the consolidated financial statements at Item 1 of this report.
The table below presents the recorded amount of assets and liabilities measured at fair value on a recurring basis (in thousands):
| Fair value at December 31, 2012 | Total | Level 1 | Level 2 | Level 3 | ||||||||||||||||||||||||||||
| Fair value at December 31, 2014 | Total | Level 1 | Level 2 | Level 3 | ||||||||||||||||||||||||||||
Securities available-for-sale: | ||||||||||||||||||||||||||||||||
Obligations of U.S. government corporations and agencies | $ | 151,701 | — | $ | 151,701 | — | $ | 75,120 | — | $ | 75,120 | — | ||||||||||||||||||||
Obligations of states and political subdivisions | 9,421 | — | 9,421 | — | 3,175 | — | 3,175 | — | ||||||||||||||||||||||||
Corporate debt securities | 1,905 | — | 1,905 | — | 1,908 | — | 1,908 | — | ||||||||||||||||||||||||
Marketable equity securities | 3,002 | $ | 3,002 | — | — | |||||||||||||||||||||||||||
Mortgage servicing rights | 4,552 | — | — | 4,552 | 7,378 | — | — | $ | 7,378 | |||||||||||||||||||||||
|
|
|
|
|
|
|
| |||||||||||||||||||||||||
Total assets measured at fair value | $ | 167,579 | — | $ | 163,027 | $ | 4,552 | $ | 90,583 | $ | 3,002 | $ | 80,203 | $ | 7,378 | |||||||||||||||||
|
|
|
|
|
|
|
| |||||||||||||||||||||||||
| Fair value at December 31, 2011 | Total | Level 1 | Level 2 | Level 3 | ||||||||||||
Securities available-for-sale: | ||||||||||||||||
Obligations of U.S. government corporations and agencies | $ | 217,384 | — | $ | 217,384 | — | ||||||||||
Obligations of states and political subdivisions | 10,028 | — | 10,028 | — | ||||||||||||
Corporate debt securities | 1,811 | — | 1,811 | — | ||||||||||||
Mortgage servicing rights | 4,603 | — | — | 4,603 | ||||||||||||
|
|
|
|
|
|
|
| |||||||||
Total assets measured at fair value | $ | 233,826 | — | $ | 229,223 | $ | 4,603 | |||||||||
|
|
|
|
|
|
|
| |||||||||
94
| Fair value at December 31, 2013 | Total | Level 1 | Level 2 | Level 3 | ||||||||||||
Securities available-for-sale: | ||||||||||||||||
Obligations of U.S. government corporations and agencies | $ | 97,143 | — | $ | 97,143 | — | ||||||||||
Obligations of states and political subdivisions | 5,589 | — | 5,589 | — | ||||||||||||
Corporate debt securities | 1,915 | — | 1,915 | — | ||||||||||||
Mortgage servicing rights | 6,165 | — | — | 6,165 | ||||||||||||
|
|
|
|
|
|
|
| |||||||||
Total assets measured at fair value | $ | 110,812 | — | $ | 104,647 | $ | 6,165 | |||||||||
|
|
|
|
|
|
|
| |||||||||
Transfers between levels of the fair value hierarchy are recognized on the actual date of the event or circumstances that caused the transfer, which generally corresponds with the Company’s quarterly valuation process. There were no transfers between any levels during 20122014 or 2011.2013.
The following table provides a reconciliation of assets and liabilities measured at fair value using significant unobservable inputs (Level 3) on a recurring basis during the years ended December 31, 20122014 and 2011.2013. Had there been any transfer into or out of Level 3 during 20122014 or 2011,2013, the amount included in the “Transfers into (out of) Level 3” column would represent the beginning balance of an item in the period (interim quarter) during which it was transferred (in thousands):
| Year ended December 31, | Beginning Balance | Transfers into (out of) Level 3 | Change Included in Earnings | Issuances | Ending Balance | |||||||||||||||
2012: Mortgage servicing rights | $ | 4,603 | — | $ | (2,016 | ) | $ | 1,965 | $ | 4,552 | ||||||||||
2011: Mortgage servicing rights | $ | 4,605 | — | $ | (1,107 | ) | $ | 1,105 | $ | 4,603 | ||||||||||
| Year ended December 31, | Beginning Balance | Transfers into (out of) Level 3 | Change Included in Earnings | Issuances | Ending Balance | |||||||||||||||
2014: Mortgage servicing rights | $ | 6,165 | $ | 1,944 | $ | (1,301 | ) | $ | 570 | $ | 7,378 | |||||||||
2013: Mortgage servicing rights | $ | 4,552 | — | $ | 253 | $ | 1,360 | $ | 6,165 | |||||||||||
The Company’s method for determining the fair value of mortgage servicing rights is described in Note 1. The key unobservable inputs used in determining the fair value of mortgage servicing rights are mortgage prepayment speeds and the discount rate used to discount cash projected cash flows. Generally, any significant increases in the mortgage prepayment speed and discount rate utilized in the fair value measurement of the mortgage servicing rights will result in a negative fair value adjustments (and decrease in the fair value measurement). Conversely, a decrease in the mortgage prepayment speed and discount rate will result in a positive fair value adjustment (and increase in the fair value measurement). Note 10 contains additional information regarding mortgage servicing rights.
The following table presents quantitative information about recurring Level 3 fair value measurements at December 31, 2012:2014:
| Fair Value (in thousands) | Valuation Technique | Unobservable Inputs | Range, Weighted Average | |||||||
Mortgage Servicing Rights | $ | 4,552 | Discounted cash flow | Constant prepayment rate | 6.7%-33.0%, 20.3% | |||||
| Discount rate | 10.0%-10.0%, 10.0% | |||||||||
| Fair Value (in thousands) | Valuation Technique | Unobservable Inputs | Range, Weighted Average | |||||||||||
Mortgage Servicing Rights | $ | 7,378 | Discounted cash flow | Constant prepayment rate | 5.7%-23.4%, 12.0% | |||||||||
| Discount rate | 10.0%-12.0%, 10.0% | |||||||||||||
The tables below present the recorded amount of assets and liabilities measured at fair value on a nonrecurring basis, as of the dates indicated, that had a write-down or an additional allowance provided during the periods indicated (in thousands):
| Year ended December 31, 2012 | Total | Level 1 | Level 2 | Level 3 | Total Gains (Losses) | |||||||||||||||
Fair value: | ||||||||||||||||||||
Impaired Originated & PNCI loans | $ | 29,584 | — | — | $ | 29,584 | $ | (2,890 | ) | |||||||||||
Foreclosed assets | 2,910 | — | — | 2,910 | (842 | ) | ||||||||||||||
|
|
|
|
|
|
|
|
|
| |||||||||||
Total assets measured at fair value | $ | 32,494 | — | — | $ | 32,494 | $ | (3,732 | ) | |||||||||||
|
|
|
|
|
|
|
|
|
| |||||||||||
| Year ended December 31, 2011 | Total | Level 1 | Level 2 | Level 3 | Total Gains (Losses) | |||||||||||||||||||||||||||||||||||
| Year ended December 31, 2014 | Total | Level 1 | Level 2 | Level 3 | Total Gains (Losses) | |||||||||||||||||||||||||||||||||||
Fair value: | ||||||||||||||||||||||||||||||||||||||||
Impaired Originated & PNCI loans | $ | 27,158 | — | — | $ | 27,158 | $ | (11,869 | ) | $ | 2,480 | — | — | $ | 2,480 | $ | (636 | ) | ||||||||||||||||||||||
Foreclosed assets | 5,439 | — | — | 5,439 | (1,144 | ) | 2,611 | — | — | 2,611 | $ | (137 | ) | |||||||||||||||||||||||||||
|
|
|
|
|
|
|
|
|
| |||||||||||||||||||||||||||||||
Total assets measured at fair value | $ | 32,597 | — | — | $ | 32,597 | $ | (13,013 | ) | $ | 5,091 | — | — | $ | 5,091 | $ | (773 | ) | ||||||||||||||||||||||
|
|
|
|
|
|
|
|
|
| |||||||||||||||||||||||||||||||
| Year ended December 31, 2013 | Total | Level 1 | Level 2 | Level 3 | Total Gains (Losses) | |||||||||||||||||||||||||||||||||||
Fair value: | ||||||||||||||||||||||||||||||||||||||||
Impaired Originated & PNCI loans | $ | 20,334 | — | — | $ | 20,334 | $ | (2,539 | ) | |||||||||||||||||||||||||||||||
Foreclosed assets | 948 | — | — | 948 | (397 | ) | ||||||||||||||||||||||||||||||||||
|
|
|
|
| ||||||||||||||||||||||||||||||||||||
Total assets measured at fair value | $ | 21,282 | — | — | $ | 21,282 | $ | (2,936 | ) | |||||||||||||||||||||||||||||||
|
|
|
|
| ||||||||||||||||||||||||||||||||||||
The impaired Originated and PNCI loan amount above represents impaired, collateral dependent loans that have been adjusted to fair value. When we identify a collateral dependent loan as impaired, we measure the impairment using the current fair value of the collateral, less selling costs. Depending on the characteristics of a loan, the fair value of collateral is generally estimated by obtaining external appraisals. If we determine that the value of the impaired loan is less than the recorded investment in the loan, we recognize this impairment and adjust the carrying value of the loan to fair value through the allowance for loan and lease losses. The loss represents charge-offs or impairments on collateral dependent loans for fair value adjustments based on the fair value of collateral. The carrying value of loans fully charged-off is zero.
95
The foreclosed assets amount above represents impaired real estate that has been adjusted to fair value. Foreclosed assets represent real estate which the Bank has taken control of in partial or full satisfaction of loans. At the time of foreclosure, other real estate owned is recorded at the lower of the carrying amount of the loan or fair value less costs to sell, which becomes the property’s new basis. Any write-downs based on the asset’s fair value at the date of acquisition are charged to the allowance for loan and lease losses. After foreclosure, management periodically performs valuations such that the real estate is carried at the lower of its new cost basis or fair value, net of estimated costs to sell. Fair value adjustments on other real estate owned are recognized within net loss on real estate owned. The loss represents impairments on non-covered other real estate owned for fair value adjustments based on the fair value of the real estate.
The Company’s property appraisals are primarily based on the sales comparison approach and income approach methodologies, which consider recent sales of comparable properties, including their income generating characteristics, and then make adjustments to reflect the general assumptions that a market participant would make when analyzing the property for purchase. These adjustments may increase or decrease an appraised value and can vary significantly depending on the location, physical characteristics and income producing potential of each property. Additionally, the quality and volume of market information available at the time of the appraisal can vary from period to period and cause significant changes to the nature and magnitude of comparable sale adjustments. Given these variations, comparable sale adjustments are generally not a reliable indicator for how fair value will increase or decrease from period to period. Under certain circumstances, management discounts are applied based on specific characteristics of an individual property.
The following table presents quantitative information about Level 3 fair value measurements for financial instruments measured at fair value on a nonrecurring basis at December 31, 2012:2014:
| Fair Value (in thousands) | Valuation Technique | Unobservable Inputs | Range, Weighted Average | |||||||
Impaired Originated & PNCI loans | $ | 29,584 | Sales comparison approach | Adjustment for differences between comparable sales | (0.0)%-(42.4)%, (10.0)% | |||||
| Income approach | Capitalization rate | 7.5%-9.5 %, 9.2% | ||||||||
Foreclosed assets | $ | 2,910 | Sales comparison approach | Adjustment for differences between comparable sales | (7.5)%-(7.5)%, (7.5)% | |||||
| Income approach | Capitalization rate | 8.5%-8.5, 8.5% | ||||||||
Valuation Technique Unobservable Inputs Impaired Originated & PNCI loans Fair Value
(in thousands) Range, Weighted Average $ 2,480 Sales comparison approach Adjustment for differences between comparable sales (5.0)%-(42.5)%, (10.1)% Income approach Capitalization rate 9.09%-9.09 %, 9.09% Foreclosed assets $ 2,611 Sales comparison approach Adjustment for differences between comparable sales (5.0)%-(29.4)%, (8.2)%
In addition to the methods and assumptions used to estimate the fair value of each class of financial instrument noted above, the following methods and assumptions were used to estimate the fair value of other classes of financial instruments for which it is practical to estimate the fair value.
Short-term Instruments—Cash and due from banks, fed funds purchased and sold, interest receivable and payable, and short-term borrowings are considered short-term instruments. For these short-term instruments their carrying amount approximates their fair value.
Securities held to maturity – The fair value of securities held to maturity is based upon quoted prices, if available. If quoted prices are not available, fair values are measured using independent pricing models or other model-based valuation techniques such as the present value of future cash flows, adjusted for the security’s credit rating, prepayment assumptions and other factors such as credit loss assumptions. Level 1 securities include those traded on an active exchange, such as the New York Stock Exchange, U.S. Treasury securities that are traded by dealers or brokers in active over-the-counter markets and money market funds. Level 2 securities include mortgage-backed securities issued by government sponsored entities, municipal bonds and corporate debt securities. The Company had no securities held to maturity classified as Level 3 during any of the periods covered in these financial statements.
Restricted Equity Securities—The carryingIt is not practical to determine the fair value of restricted equity securities approximates fair value as the shares can only be redeemed by the issuing institution at par.due to restrictions placed on its transferability.
Originated and PNCI loans—- The fair value of variable rate originated and PNCI loans is the current carrying value. The interest rates on these originated and PNCI loans are regularly adjusted to market rates. The fair value of other types of fixed rate originated and PNCI loans is estimated by discounting the future cash flows using current rates at which similar loans would be made to borrowers with similar credit ratings for the same remaining maturities. The allowance for loan losses is a reasonable estimate of the valuation allowance needed to adjust computed fair values for credit quality of certain originated and PNCI loans in the portfolio.
PCI Loans—PCI loans are measured at estimated fair value on the date of acquisition. Carrying value is calculated as the present value of expected cash flows and approximates fair value.
FDIC Indemnification Asset—The fair value of the FDIC indemnification asset is based on the discounted value of expected future cash flows under the loss-share agreement.
Deposit Liabilities—- The fair value of demand deposits, savings accounts, and certain money market deposits is the amount payable on demand at the reporting date. These values do not consider the estimated fair value of the Company’s core deposit intangible, which is a significant unrecognized asset of the Company. The fair value of time deposits and other borrowings is based on the discounted value of contractual cash flows.
Other Borrowings—- The fair value of other borrowings is calculated based on the discounted value of the contractual cash flows using current rates at which such borrowings can currently be obtained.
96
Junior Subordinated Debentures— - The fair value of junior subordinated debentures is estimated using a discounted cash flow model. The future cash flows of these instruments are extended to the next available redemption date or maturity date as appropriate based upon the spreads of recent issuances or quotes from brokers for comparable bank holding companies compared to the contractual spread of each junior subordinated debenture measured at fair value.
Commitments to Extend Credit and Standby Letters of Credit— - The fair value of commitments is estimated using the fees currently charged to enter into similar agreements, taking into account the remaining terms of the agreements and the present credit worthiness of the counter parties. For fixed rate loan commitments, fair value also considers the difference between current levels of interest rates and the committed rates. The fair value of letters of credit is based on fees currently charged for similar agreements or on the estimated cost to terminate them or otherwise settle the obligation with the counter parties at the reporting date.
Fair values for financial instruments are management’s estimates of the values at which the instruments could be exchanged in a transaction between willing parties. These estimates are subjective and may vary significantly from amounts that would be realized in actual transactions. In addition, other significant assets are not considered financial assets including, any mortgage banking operations, deferred tax assets, and premises and equipment. Further, the tax ramifications related to the realization of the unrealized gains and losses can have a significant effect on the fair value estimates and have not been considered in any of these estimates.
The estimated fair values of financial instruments that are reported at amortized cost in the Corporation’s consolidated balance sheets, segregated by the level of the valuation inputs within the fair value hierarchy utilized to measure fair value, were as follows (in thousands):
| December 31, 2012 | December 31, 2011 | December 31, 2014 | December 31, 2013 | |||||||||||||||||||||||||||||
| Carrying Amount | Fair Value | Carrying Amount | Fair Value | Carrying Amount | Fair Value | Carrying Amount | Fair Value | |||||||||||||||||||||||||
Financial assets: | ||||||||||||||||||||||||||||||||
Level 1 inputs: | ||||||||||||||||||||||||||||||||
Cash and due from banks | $ | 81,086 | $ | 81,086 | $ | 73,652 | $ | 73,652 | $ | 93,150 | $ | 93,150 | $ | 76,915 | $ | 76,915 | ||||||||||||||||
Cash at Federal Reserve and other banks | 667,813 | 667,813 | 563,623 | 563,623 | 517,578 | 517,578 | 521,453 | 521,453 | ||||||||||||||||||||||||
Level 2 inputs: | ||||||||||||||||||||||||||||||||
Securities held to maturity | 676,426 | 688,779 | 240,504 | 233,807 | ||||||||||||||||||||||||||||
Restricted equity securities | 9,647 | 9,647 | 10,610 | 10,610 | 16,956 | N/A | 9,163 | N/A | ||||||||||||||||||||||||
Loans held for sale | 12,053 | 12,053 | 10,219 | 10,219 | 3,579 | 3,579 | 2,270 | 2,270 | ||||||||||||||||||||||||
Level 3 inputs: | ||||||||||||||||||||||||||||||||
Loans, net | 1,522,175 | 1,607,044 | 1,505,118 | 1,579,084 | 2,282,524 | 2,379,155 | 1,672,007 | 1,760,274 | ||||||||||||||||||||||||
Indemnification asset | 1,997 | 1,997 | 4,405 | 4,405 | ||||||||||||||||||||||||||||
Indemnification (liability) asset | (349 | ) | (349 | ) | 206 | 206 | ||||||||||||||||||||||||||
Financial liabilities: | ||||||||||||||||||||||||||||||||
Level 2 inputs: | ||||||||||||||||||||||||||||||||
Deposits | 2,289,702 | 2,291,841 | 2,190,536 | 2,193,170 | 3,380,423 | 3,380,486 | 2,410,483 | 2,411,402 | ||||||||||||||||||||||||
Other borrowings | 9,197 | 9,197 | 72,541 | 74,027 | 9,276 | 9,276 | 6,335 | 6,335 | ||||||||||||||||||||||||
Level 3 inputs: | ||||||||||||||||||||||||||||||||
Junior subordinated debt | 41,238 | 28,042 | 41,238 | 25,980 | 56,272 | 45,053 | 41,238 | 25,774 | ||||||||||||||||||||||||
| Contract Amount | Fair Value | Contract Amount | Fair Value | |||||||||||||||||||||||||||||
Off-balance sheet: | ||||||||||||||||||||||||||||||||
Level 3 inputs: | ||||||||||||||||||||||||||||||||
Commitments | $ | 656,175 | $ | 6,562 | $ | 555,386 | $ | 5,554 | ||||||||||||||||||||||||
Standby letters of credit | 17,531 | 175 | 2,601 | 26 | ||||||||||||||||||||||||||||
Overdraft privilege commitments | 101,060 | 1,011 | 68,932 | 689 | ||||||||||||||||||||||||||||
| Contract Amount | Fair Value | Contract Amount | Fair Value | |||||||||||||
Off-balance sheet: | ||||||||||||||||
Level 3 inputs: | ||||||||||||||||
Commitments | $ | 557,254 | $ | 5,573 | $ | 529,046 | $ | 5,290 | ||||||||
Standby letters of credit | 2,905 | 29 | 5,324 | 53 | ||||||||||||
Overdraft privilege commitments | 69,675 | 697 | 61,623 | 616 | ||||||||||||
97
Note 28—28 - TriCo Bancshares Condensed Financial Statements (Parent Only)
Condensed Balance Sheets
| December 31, | December 31, | |||||||||||||||
| 2012 | 2011 | 2014 | 2013 | |||||||||||||
| (in thousands) | (in thousands) | |||||||||||||||
Assets | ||||||||||||||||
Cash and Cash equivalents | $ | 2,511 | $ | 706 | $ | 2,229 | $ | 2,520 | ||||||||
Investment in Tri Counties Bank | 267,118 | 256,010 | 470,797 | 288,746 | ||||||||||||
Other assets | 1,238 | 1,238 | 1,902 | 1,280 | ||||||||||||
|
|
|
| |||||||||||||
Total assets | $ | 270,867 | $ | 257,954 | $ | 474,928 | $ | 292,546 | ||||||||
|
|
|
| |||||||||||||
Liabilities and shareholders’ equity | ||||||||||||||||
Other liabilities | $ | 270 | $ | 275 | $ | 484 | $ | 362 | ||||||||
Junior subordinated debt | 41,238 | 41,238 | 56,272 | 41,238 | ||||||||||||
|
|
|
| |||||||||||||
Total liabilities | 41,508 | 41,513 | 56,756 | 41,600 | ||||||||||||
|
|
|
| |||||||||||||
Shareholders’ equity: | ||||||||||||||||
Common stock, no par value: authorized 50,000,000 shares; issued and outstanding 15,978,958 and 15,860138 shares, respectively | 85,561 | 84,079 | ||||||||||||||
Common stock, no par value: authorized 50,000,000 shares; issued and outstanding 22,714,964 and 16,076,662 shares, respectively | 244,318 | 89,356 | ||||||||||||||
Retained earnings | 141,639 | 128,551 | 176,057 | 159,733 | ||||||||||||
Accumulated other comprehensive loss, net | 2,159 | 3,811 | (2,203 | ) | 1,857 | |||||||||||
|
|
|
| |||||||||||||
Total shareholders’ equity | 229,359 | 216,441 | 418,172 | 250,946 | ||||||||||||
|
|
|
| |||||||||||||
Total liabilities and shareholders’ equity | $ | 270,867 | $ | 257,954 | $ | 474,928 | $ | 292,546 | ||||||||
|
|
|
| |||||||||||||
Condensed Statements of Income
| Years ended December 31, | ||||||||||||
| 2012 | 2011 | 2010 | ||||||||||
| (in thousands) | ||||||||||||
Interest expense | $ | (1,325 | ) | $ | (1,259 | ) | $ | (1,274 | ) | |||
Administration expense | (669 | ) | (582 | ) | (643 | ) | ||||||
|
|
|
|
|
| |||||||
Loss before equity in net income of Tri Counties Bank | (1,994 | ) | (1,841 | ) | (1,917 | ) | ||||||
Equity in net income of Tri Counties Bank: | ||||||||||||
Distributed | 8,522 | 7,185 | 7,650 | |||||||||
(Over) under distributed | 11,632 | 12,470 | (534 | ) | ||||||||
Income tax benefit | 834 | 776 | 806 | |||||||||
|
|
|
|
|
| |||||||
Net income | $ | 18,994 | $ | 18,590 | $ | 6,005 | ||||||
|
|
|
|
|
| |||||||
Interest expense Administration expense Loss before equity in net income of Tri Counties Bank Equity in net income of Tri Counties Bank: Distributed Undistributed Income tax benefit Net income Condensed Statements of Comprehensive Income Net income Other comprehensive (loss) income, net of tax: Unrealized holding (losses) gains on securities arising during the period Change in minimum pension liability Change in joint beneficiary agreement liability Other comprehensive (loss) income Net income Operating activities: Net income Adjustments to reconcile net income to net cash provided by operating activities: Undistributed equity in earnings of Tri Counties Bank Stock option vesting expense Stock option excess tax benefits Net change in other assets and liabilities Net cash provided by operating activities Investing activities: None Financing activities: Issuance of common stock through option exercise Stock option excess tax benefits Repurchase of common stock Cash dividends paid — common Net cash used for financing activities (decrease) increase in cash and cash equivalents Cash and cash equivalents at beginning of year Cash and cash equivalents at end of year Condensed Statements of Comprehensive Income Years ended December 31, 2014 2013 2012 (in thousands) $ (1,403 ) $ (1,247 ) $ (1,325 ) (2,720 ) (862 ) (669 ) (4,123 ) (2,109 ) (1,994 ) 8,270 8,175 8,522 20,720 20,446 11,632 1,241 887 834 $ 26,108 $ 27,399 $ 18,994 Years ended December 31, 2014 2013 2012 (in thousands) $ 26,108 $ 27,399 $ 18,994 (94 ) (2,452 ) (1,216 ) (4,114 ) 1,750 (2 ) 148 400 (434 ) (4,060 ) (302 ) (1,652 ) $ 22,048 $ 27,097 $ 17,342 Condensed Statements of Cash Flows Years ended December 31, 2014 2013 2012 (in thousands) $ 26,108 $ 27,399 $ 18,994 (20,720 ) (20,446 ) (11,632 ) 1,133 1,151 1,083 (225 ) (356 ) (44 ) 671 (1,100 ) (1,089 ) 6,967 6,648 7,312 616 251 206 225 356 44 (292 ) (501 ) — (7,807 ) (6,745 ) (5,757 ) (7,258 ) (6,639 ) (5,507 ) (291 ) 9 1,805 2,520 2,511 706 $ 2,229 $ 2,520 $ 2,511
| Years ended December 31, | ||||||||||||
| 2012 | 2011 | 2010 | ||||||||||
| (in thousands) | ||||||||||||
Net income | $ | 18,994 | $ | 18,590 | $ | 6,005 | ||||||
Other comprehensive (loss) income, net of tax: | ||||||||||||
Unrealized holding (losses) gains on securities arising during the period | (1,216 | ) | 1,504 | (24 | ) | |||||||
Change in minimum pension liability | (2 | ) | 1,140 | (943 | ) | |||||||
Change in joint beneficiary agreement liability | (434 | ) | (143 | ) | (1 | ) | ||||||
|
|
|
|
|
| |||||||
Other comprehensive (loss) income | (1,652 | ) | 2,501 | (968 | ) | |||||||
|
|
|
|
|
| |||||||
Net income | $ | 17,342 | $ | 21,091 | $ | 5,037 | ||||||
|
|
|
|
|
| |||||||
Condensed Statements of Cash Flows98
| Years ended December 31, | ||||||||||||
| 2012 | 2011 | 2010 | ||||||||||
| (in thousands) | ||||||||||||
Operating activities: | ||||||||||||
Net income | $ | 18,994 | $ | 18,590 | $ | 6,005 | ||||||
Adjustments to reconcile net income to net cash provided by operating activities: | ||||||||||||
Over (under) distributed equity in earnings of Tri Counties Bank | (11,632 | ) | (12,470 | ) | 534 | |||||||
Stock option vesting expense | 1,083 | 830 | 800 | |||||||||
Stock option excess tax benefits | (44 | ) | (296 | ) | (390 | ) | ||||||
Net change in other assets and liabilities | (1,089 | ) | (818 | ) | (802 | ) | ||||||
|
|
|
|
|
| |||||||
Net cash provided by operating activities | 7,312 | 5,836 | 6,147 | |||||||||
Investing activities: None | ||||||||||||
Financing activities: | ||||||||||||
Issuance of common stock through option exercise | 206 | 436 | 203 | |||||||||
Stock option excess tax benefits | 44 | 296 | 390 | |||||||||
Repurchase of common stock | — | (753 | ) | (338 | ) | |||||||
Cash dividends paid — common | (5,757 | ) | (5,742 | ) | (6,344 | ) | ||||||
|
|
|
|
|
| |||||||
Net cash used for financing activities | (5,507 | ) | (5,763 | ) | (6,089 | ) | ||||||
|
|
|
|
|
| |||||||
Increase in cash and cash equivalents | 1,805 | 73 | 58 | |||||||||
Cash and cash equivalents at beginning of year | 706 | 633 | 575 | |||||||||
|
|
|
|
|
| |||||||
Cash and cash equivalents at end of year | $ | 2,511 | $ | 706 | $ | 633 | ||||||
|
|
|
|
|
| |||||||
Note 29—29 - Regulatory Matters
The Company is subject to various regulatory capital requirements administered by federal banking agencies. Failure to meet minimum capital requirements can initiate certain mandatory, and possibly additional discretionary actions by regulators that, if undertaken, could have a direct material effect on the Company’s consolidated financial statements. Under capital adequacy guidelines and the regulatory framework for prompt corrective action, the Company must meet specific capital guidelines that involve quantitative measures of the Company’s assets, liabilities and certain off-balance-sheet items as calculated under regulatory accounting practices. The Company’s capital amounts and classification are also subject to qualitative judgments by the regulators about components, risk weightings and other factors.
Quantitative measures established by regulation to ensure capital adequacy require the Company to maintain minimum amounts and ratios (set forth in the table below) of total and Tier 1 capital to risk-weighted assets, and of Tier 1 capital to average assets. Management believes, as of December 31, 2012,2014, that the Company meets all capital adequacy requirements to which it is subject.
As of December 31, 2012,2014, the Bank was well capitalized under the regulatory framework for prompt corrective action. To be categorized as well capitalized the Bank must maintain minimum total risk-based, Tier 1 risk-based and Tier 1 leverage ratios as set forth in the table below. There are no conditions or events since that date that Management believes have changed the institution’s category. The Bank’s actual capital amounts and ratios are also presented in the table.
| Actual | Minimum Capital Requirement | Minimum To Be Well Capitalized Under Prompt Corrective Action Provisions | Actual | Minimum Capital Requirement | Minimum To Be Well Capitalized Under Prompt Corrective Action Provisions | |||||||||||||||||||||||||||||||||||||||||||
| Amount | Ratio | Amount | Ratio | Amount | Ratio | Amount | Ratio | Amount | Ratio | Amount | Ratio | |||||||||||||||||||||||||||||||||||||
| (dollars in thousands) | (dollars in thousands) | |||||||||||||||||||||||||||||||||||||||||||||||
As of December 31, 2012: | ||||||||||||||||||||||||||||||||||||||||||||||||
As of December 31, 2014: | ||||||||||||||||||||||||||||||||||||||||||||||||
Total Capital (to Risk Weighted Assets): | ||||||||||||||||||||||||||||||||||||||||||||||||
Consolidated | $ | 273,979 | 14.53 | % | $ | 150,896 | 8.0 | % | N/A | N/A | $ | 436,955 | 15.63 | % | $ | 223,603 | 8.0 | % | N/A | N/A | ||||||||||||||||||||||||||||
Tri Counties Bank | $ | 271,723 | 14.42 | % | $ | 150,796 | 8.0 | % | $ | 188,495 | 10.0 | % | $ | 433,286 | 15.51 | % | $ | 223,449 | 8.0 | % | $ | 279,311 | 10.0 | % | ||||||||||||||||||||||||
Tier 1 Capital (to Risk Weighted Assets): | ||||||||||||||||||||||||||||||||||||||||||||||||
Consolidated | $ | 250,133 | 13.27 | % | $ | 75,448 | 4.0 | % | N/A | N/A | $ | 401,971 | 14.38 | % | $ | 111,801 | 4.0 | % | N/A | N/A | ||||||||||||||||||||||||||||
Tri Counties Bank | $ | 247,892 | 13.16 | % | $ | 75,398 | 4.0 | % | $ | 113,097 | 6.0 | % | $ | 398,325 | 14.26 | % | $ | 111,724 | 4.0 | % | $ | 167,587 | 6.0 | % | ||||||||||||||||||||||||
Tier 1 Capital (to Average Assets): | ||||||||||||||||||||||||||||||||||||||||||||||||
Consolidated | $ | 250,133 | 9.82 | % | $ | 101,918 | 4.0 | % | N/A | N/A | $ | 401,971 | 10.80 | % | $ | 148,819 | 4.0 | % | N/A | N/A | ||||||||||||||||||||||||||||
Tri Counties Bank | $ | 247,892 | 9.73 | % | $ | 101,866 | 4.0 | % | $ | 127,333 | 5.0 | % | $ | 398,325 | 10.71 | % | $ | 148,734 | 4.0 | % | $ | 185,918 | 5.0 | % | ||||||||||||||||||||||||
As of December 31, 2011: | ||||||||||||||||||||||||||||||||||||||||||||||||
As of December 31, 2013: | ||||||||||||||||||||||||||||||||||||||||||||||||
Total Capital (to Risk Weighted Assets): | ||||||||||||||||||||||||||||||||||||||||||||||||
Consolidated | $ | 258,871 | 13.94 | % | $ | 148,529 | 8.0 | % | N/A | N/A | $ | 297,429 | 14.77 | % | $ | 161,064 | 8.0 | % | N/A | N/A | ||||||||||||||||||||||||||||
Tri Counties Bank | $ | 258,425 | 13.93 | % | $ | 148,429 | 8.0 | % | $ | 185,536 | 10.0 | % | $ | 295,212 | 14.67 | % | $ | 160,961 | 8.0 | % | $ | 201,201 | 10.0 | % | ||||||||||||||||||||||||
Tier 1 Capital (to Risk Weighted Assets): | ||||||||||||||||||||||||||||||||||||||||||||||||
Consolidated | $ | 235,349 | 12.68 | % | $ | 74,265 | 4.0 | % | N/A | N/A | $ | 272,071 | 13.51 | % | $ | 80,532 | 4.0 | % | N/A | N/A | ||||||||||||||||||||||||||||
Tri Counties Bank | $ | 234,919 | 12.66 | % | $ | 74,214 | 4.0 | % | $ | 111,322 | 6.0 | % | $ | 269,870 | 13.41 | % | $ | 80,480 | 4.0 | % | $ | 120,720 | 6.0 | % | ||||||||||||||||||||||||
Tier 1 Capital (to Average Assets): | ||||||||||||||||||||||||||||||||||||||||||||||||
Consolidated | $ | 235,349 | 9.46 | % | $ | 99,563 | 4.0 | % | N/A | N/A | $ | 272,071 | 10.17 | % | $ | 107,017 | 4.0 | % | N/A | N/A | ||||||||||||||||||||||||||||
Tri Counties Bank | $ | 234,919 | 9.44 | % | $ | 99,511 | 4.0 | % | $ | 124,389 | 5.0 | % | $ | 269,870 | 10.09 | % | $ | 106,965 | 4.0 | % | $ | 133,706 | 5.0 | % | ||||||||||||||||||||||||
99
Note 30—30 - Summary of Quarterly Results of Operations (unaudited)
The following table sets forth the results of operations for the four quarters of 20122014 and 2011,2013, and is unaudited; however, in the opinion of Management, it reflects all adjustments (which include only normal recurring adjustments) necessary to present fairly the summarized results for such periods.
| 2012 Quarters Ended | 2014 Quarters Ended | |||||||||||||||||||||||||||||||
| December 31, | September 30, | June 30, | March 31, | December 31, | September 30, | June 30, | March 31, | |||||||||||||||||||||||||
| (dollars in thousands, except per share data) | (dollars in thousands, except per share data) | |||||||||||||||||||||||||||||||
Interest and dividend income: | ||||||||||||||||||||||||||||||||
Loans: | ||||||||||||||||||||||||||||||||
Discount accretion PCI – cash basis | $ | 42 | $ | 24 | $ | 108 | $ | 18 | $ | 107 | $ | 290 | $ | 69 | $ | 203 | ||||||||||||||||
Discount accretion PCI – other | 979 | 1,192 | 886 | 776 | 919 | 822 | 811 | 984 | ||||||||||||||||||||||||
Discount accretion PNCI | 841 | 591 | 1,391 | 1,286 | 796 | 402 | 624 | 379 | ||||||||||||||||||||||||
Regular interest Purchased loans | 3,226 | 3,251 | 3,439 | 3,420 | ||||||||||||||||||||||||||||
All other loan interest income | 19,157 | 20,472 | 19,968 | 19,429 | 28,914 | 23,466 | 22,929 | 22,172 | ||||||||||||||||||||||||
|
|
|
|
|
|
|
| |||||||||||||||||||||||||
Total loan interest income | 24,245 | 25,530 | 25,792 | 24,929 | 30,736 | 24,980 | 24,433 | 23,738 | ||||||||||||||||||||||||
Debt securities, dividends and interest bearing cash at Banks (not FTE) | 1,898 | 1,935 | 2,152 | 2,235 | 5,671 | 4,151 | 3,985 | 3,421 | ||||||||||||||||||||||||
|
|
|
|
|
|
|
| |||||||||||||||||||||||||
Total interest income | 26,143 | 27,465 | 27,944 | 27,164 | 36,407 | 29,131 | 28,418 | 27,159 | ||||||||||||||||||||||||
Interest expense | 1,372 | 1,834 | 2,010 | 2,128 | 1,437 | 1,082 | 1,075 | 1,087 | ||||||||||||||||||||||||
|
|
|
|
|
|
|
| |||||||||||||||||||||||||
Net interest income | 24,771 | 25,631 | 25,934 | 25,036 | 34,970 | 28,049 | 27,343 | 26,072 | ||||||||||||||||||||||||
Provision for loan losses | 1,524 | 532 | 3,371 | 3,996 | ||||||||||||||||||||||||||||
(Benefit from) provision for loan losses | (1,421 | ) | (2,977 | ) | 1,708 | (1,355 | ) | |||||||||||||||||||||||||
|
|
|
|
|
|
|
| |||||||||||||||||||||||||
Net interest income after provision for loan losses | 23,247 | 25,099 | 22,563 | 21,040 | 36,391 | 31,026 | 25,635 | 27,427 | ||||||||||||||||||||||||
Noninterest income | 10,011 | 9,127 | 10,577 | 8,265 | 9,755 | 8,589 | 7,877 | 8,295 | ||||||||||||||||||||||||
Noninterest expense | 25,126 | 25,590 | 24,367 | 22,915 | 36,566 | 25,380 | 25,116 | 23,317 | ||||||||||||||||||||||||
|
|
|
|
|
|
|
| |||||||||||||||||||||||||
Income before income taxes | 8,132 | 8,636 | 8,773 | 6,390 | 9,580 | 14,235 | 8,396 | 12,405 | ||||||||||||||||||||||||
Income tax expense | 3,410 | 3,616 | 3,452 | 2,459 | 3,930 | 6,001 | 3,537 | 5,040 | ||||||||||||||||||||||||
|
|
|
|
|
|
|
| |||||||||||||||||||||||||
Net income | $ | 4,722 | $ | 5,020 | $ | 5,321 | $ | 3,931 | $ | 5,650 | $ | 8,234 | $ | 4,859 | $ | 7,365 | ||||||||||||||||
|
|
|
|
|
|
|
| |||||||||||||||||||||||||
Per common share: | ||||||||||||||||||||||||||||||||
Net income (diluted) | $ | 0.29 | $ | 0.31 | $ | 0.33 | $ | 0.25 | $ | 0.25 | $ | 0.50 | $ | 0.30 | $ | 0.45 | ||||||||||||||||
|
|
|
|
|
|
|
| |||||||||||||||||||||||||
Dividends | $ | 0.09 | $ | 0.09 | $ | 0.09 | $ | 0.09 | $ | 0.11 | $ | 0.11 | $ | 0.11 | $ | 0.11 | ||||||||||||||||
|
|
|
|
|
|
|
| |||||||||||||||||||||||||
| 2011 Quarters Ended | 2013 Quarters Ended | |||||||||||||||||||||||||||||||
| December 31, | September 30, | June 30, | March 31, | December 31, | September 30, | June 30, | March 31, | |||||||||||||||||||||||||
| (dollars in thousands, except per share data) | (dollars in thousands, except per share data) | |||||||||||||||||||||||||||||||
Interest and dividend income: | ||||||||||||||||||||||||||||||||
Loans: | ||||||||||||||||||||||||||||||||
Discount accretion PCI – cash basis | $ | 418 | $ | 28 | $ | — | $ | — | $ | 255 | $ | 140 | $ | 129 | $ | 167 | ||||||||||||||||
Discount accretion PCI – other | 949 | 223 | 185 | 136 | 893 | 898 | 732 | 597 | ||||||||||||||||||||||||
Discount accretion PNCI | 1,738 | — | — | — | 568 | 1,115 | 815 | 766 | ||||||||||||||||||||||||
Regular interest Purchased loans | 3,651 | 978 | 872 | 835 | ||||||||||||||||||||||||||||
All other loan interest income | 20,491 | 20,758 | 20,678 | 20,751 | 22,754 | 22,970 | 22,207 | 22,542 | ||||||||||||||||||||||||
|
|
|
|
|
|
|
| |||||||||||||||||||||||||
Total loan interest income | 27,247 | 21,987 | 21,735 | 21,722 | 24,470 | 25,123 | 23,883 | 24,072 | ||||||||||||||||||||||||
Debt securities, dividends and interest bearing cash at Banks (not FTE) | 2,362 | 2,485 | 2,732 | 2,712 | 2,992 | 2,413 | 1,873 | 1,734 | ||||||||||||||||||||||||
|
|
|
|
|
|
|
| |||||||||||||||||||||||||
Total interest income | 29,609 | 24,472 | 24,467 | 24,434 | 27,462 | 27,536 | 25,756 | 25,806 | ||||||||||||||||||||||||
Interest expense | 2,329 | 2,465 | 2,714 | 2,730 | 1,123 | 1,169 | 1,167 | 1,237 | ||||||||||||||||||||||||
|
|
|
|
|
|
|
| |||||||||||||||||||||||||
Net interest income | 27,280 | 22,007 | 21,753 | 21,704 | 26,339 | 26,367 | 24,589 | 24,569 | ||||||||||||||||||||||||
Provision for loan losses | 5,429 | 5,069 | 5,561 | 7,001 | ||||||||||||||||||||||||||||
Provision for (benefit from) loan losses | 172 | (393 | ) | 614 | (1,108 | ) | ||||||||||||||||||||||||||
|
|
|
|
|
|
|
| |||||||||||||||||||||||||
Net interest income after provision for loan losses | 21,851 | 16,938 | 16,192 | 14,703 | 26,167 | 26,760 | 23,975 | 25,677 | ||||||||||||||||||||||||
Noninterest income | 10,489 | 14,723 | 8,251 | 9,350 | 7,353 | 9,127 | 10,131 | 10,218 | ||||||||||||||||||||||||
Noninterest expense | 22,076 | 20,873 | 20,095 | 19,671 | 24,878 | 23,616 | 23,509 | 21,601 | ||||||||||||||||||||||||
|
|
|
|
|
|
|
| |||||||||||||||||||||||||
Income before income taxes | 10,264 | 10,788 | 4,348 | 4,382 | 8,642 | 12,271 | 10,597 | 14,294 | ||||||||||||||||||||||||
Income tax expense | 3,715 | 4,318 | 1,577 | 1,582 | 3,406 | 4,910 | 4,272 | 5,817 | ||||||||||||||||||||||||
|
|
|
|
|
|
|
| |||||||||||||||||||||||||
Net income | $ | 6,549 | $ | 6,470 | $ | 2,771 | $ | 2,800 | $ | 5,236 | $ | 7,361 | $ | 6,325 | $ | 8,477 | ||||||||||||||||
|
|
|
|
|
|
|
| |||||||||||||||||||||||||
Per common share: | ||||||||||||||||||||||||||||||||
Net income (diluted) | $ | 0.41 | $ | 0.40 | $ | 0.17 | $ | 0.18 | $ | 0.32 | $ | 0.45 | $ | 0.39 | $ | 0.53 | ||||||||||||||||
|
|
|
|
|
|
|
| |||||||||||||||||||||||||
Dividends | $ | 0.09 | $ | 0.09 | $ | 0.09 | $ | 0.09 | $ | 0.11 | $ | 0.11 | $ | 0.11 | $ | 0.09 | ||||||||||||||||
|
|
|
|
|
|
|
| |||||||||||||||||||||||||
100
MANAGEMENT’S REPORT ON INTERNAL CONTROL OVER FINANCIAL REPORTING
Management of TriCo Bancshares is responsible for establishing and maintaining effective internal control over financial reporting. Internal control over financial reporting is a process designed to provide reasonable assurance regarding the reliability of financial reporting and the preparation of financial statements for external purposes in accordance with U.S. generally accepted accounting principles.
Under the supervision and with the participation of management, including the principal executive officer and principal financial officer, the Company conducted an evaluation of the effectiveness of internal control over financial reporting based on the framework in the 2013 Internal Control – Integrated Framework issued by the Committee of Sponsoring Organizations of the Treadway Commission. The Company has excluded the current year acquisition of North Valley Bancorp representing approximately 24% of total assets at December 31, 2014 from the scope of management’s report on internal control over financial reporting. Based on this evaluation under the framework in the 2013 Internal Control – Integrated Framework, management of the Company has concluded the Company maintained effective internal control over financial reporting, as such term is defined in Securities Exchange Act of 1934 Rules 13a-15(f), as of December 31, 2012.2014.
Internal control over financial reporting cannot provide absolute assurance of achieving financial reporting objectives because of its inherent limitations. Internal control over financial reporting is a process that involves human diligence and compliance and is subject to lapses in judgment and breakdowns resulting from human failures. Internal control over financial reporting can also be circumvented by collusion or improper management override. Because of such limitations, there is a risk that material misstatements may not be prevented or detected on a timely basis by internal control over financial reporting. However, these inherent limitations are known features of the financial reporting process. Therefore, it is possible to design into the process safeguards to reduce, though not eliminate, this risk.
Management is also responsible for the preparation and fair presentation of the consolidated financial statements and other financial information contained in this report. The accompanying consolidated financial statements were prepared in conformity with U.S. generally accepted accounting principles and include, as necessary, best estimates and judgments by management.
Crowe Horwath LLP, an independent registered public accounting firm, has audited the Company’s consolidated financial statements as of and for the year ended December 31, 2012,2014, and the Company’s effectiveness of internal control over financial reporting as of December 31, 2012,2014, as stated in its reports,report, which areis included herein.
/s/ Richard P. Smith |
President and Chief Executive Officer |
/s/ Thomas J. Reddish |
| Thomas J. Reddish |
Executive Vice President and Chief Financial Officer |
March 18, 201313, 2015
101
REPORT OF INDEPENDENT REGISTERED PUBLIC ACCOUNTING FIRM
Board of Directors
TriCo Bancshares
Chico, California
We have audited the accompanying consolidated balance sheetsheets of TriCo Bancshares (the “Company”) as of December 31, 20122014 and 2013, and the related consolidated statements of income, comprehensive income, changes in shareholders’stockholders’ equity, and cash flows for each of the year then ended.years in the three-year period ended December 31, 2014. We also have audited TriCo Bancshares’Bancshares’s internal control over financial reporting as of December 31, 2012,2014, based on criteria established in the 2013 Internal Control – Integrated Framework issued by the Committee of Sponsoring Organizations of the Treadway Commission (COSO). TriCo Bancshares’Bancshares’s management is responsible for these financial statements, for maintaining effective internal control over financial reporting, and for its assessment of the effectiveness of internal control over financial reporting, included in the accompanying Management’s Report on Internal Control Over Financial Reporting. Our responsibility is to express an opinion on these financial statements and an opinion on the Company’s internal control over financial reporting based on our audits.
We conducted our audits in accordance with the standards of the Public Company Accounting Oversight Board (United States). Those standards require that we plan and perform the audits to obtain reasonable assurance about whether the financial statements are free of material misstatement and whether effective internal control over financial reporting was maintained in all material respects. Our auditaudits of the financial statements included examining, on a test basis, evidence supporting the amounts and disclosures in the financial statements, assessing the accounting principles used and significant estimates made by management, and evaluating the overall financial statement presentation. Our audit of internal control over financial reporting included obtaining an understanding of internal control over financial reporting, assessing the risk that a material weakness exists, and testing and evaluating the design and operating effectiveness of internal control based on the assessed risk. Our audits also included performing such other procedures as we considered necessary in the circumstances. We believe that our audits provide a reasonable basis for our opinions.
A company’s internal control over financial reporting is a process designed to provide reasonable assurance regarding the reliability of financial reporting and the preparation of financial statements for external purposes in accordance with generally accepted accounting principles. A company’s internal control over financial reporting includes those policies and procedures that (1) pertain to the maintenance of records that, in reasonable detail, accurately and fairly reflect the transactions and dispositions of the assets of the company; (2) provide reasonable assurance that transactions are recorded as necessary to permit preparation of financial statements in accordance with generally accepted accounting principles, and that receipts and expenditures of the company are being made only in accordance with authorizations of management and directors of the company; and (3) provide reasonable assurance regarding prevention or timely detection of unauthorized acquisition, use, or disposition of the company’s assets that could have a material effect on the financial statements.
Because of its inherent limitations, internal control over financial reporting may not prevent or detect misstatements. Also, projections of any evaluation of effectiveness to future periods are subject to the risk that controls may become inadequate because of changes in conditions, or that the degree of compliance with the policies or procedures may deteriorate.
As permitted, the Company has excluded the operations of North Valley Bank acquired during 2014, which is described in Note 2 of the consolidated financial statements, from the scope of management’s report on internal control over financial reporting. As such, it has also been excluded from the scope of our audit of internal control over financial reporting.
In our opinion, the financial statements referred to above present fairly, in all material respects, the financial position of TriCo Bancshares as of December 31, 2012,2014 and 2013, and the results of its operations and its cash flows for each of the year thenyears in the three-year period ended December 31, 2014 in conformity with accounting principles generally accepted in the United States of America. Also in our opinion, TriCo Bancshares maintained, in all material respects, effective internal control over financial reporting as of December 31, 2012,2014, based on criteria established in the 2013 Internal Control – Integrated Framework issued by COSO.
/s/ Crowe Horwath LLP
Sacramento, California
March 18, 2013
REPORT OF INDEPENDENT REGISTERED PUBLIC ACCOUNTING FIRM
To the BoardCommittee of Directors and Stockholders
TriCo Bancshares
We have audited the accompanying consolidated balance sheet of TriCo Bancshares (the Company) as of December 31, 2011, and the related consolidated statements of income, comprehensive income, changes in shareholders’ equity and cash flows for eachSponsoring Organizations of the two years in the period ended December 31, 2011. These consolidated financial statements are the responsibility of the Company’s management. Our responsibility is to express an opinion on these consolidated financial statements based on our audits.Treadway Commission.
We conducted our audits in accordance with the standards of the Public Company Accounting Oversight Board (United States). Those standards require that we plan and perform the audit to obtain reasonable assurance about whether the consolidated financial statements are free of material misstatement. An audit includes examining, on a test basis, evidence supporting the amounts and disclosures in the consolidated financial statements. An audit also includes assessing the accounting principles used and significant estimates made by management, as well as evaluating the overall consolidated financial statement presentation. We believe that our audits provide a reasonable basis for our opinion.
In our opinion, the consolidated financial statements referred to above present fairly, in all material respects, the consolidated financial position of TriCo Bancshares as of December 31, 2011, and the consolidated results of its operations and its cash flows for each of the two years in the period ended December 31, 2011 in conformity with generally accepted accounting principles in the United States of America.
/s/ Moss Adams LLP
Stockton, California
| /s/ Crowe Horwath LLP |
| Sacramento, California |
March 13, 20122015
102
ITEM 9. CHANGES9.CHANGES IN AND DISAGREEMENTS WITH ACCOUNTANTS ON ACCOUNTING AND FINANCIAL DISCLOSURE
On June 13, 2012, the Company, at the direction of the Audit Committee of the Board of Directors, dismissed Moss Adams LLP as the Company’s principal independent accounting firm.None.
During the Company’s two most recent fiscal years ended December 31, 2010 and 2011 and from January 1, 2012 through June 13, 2012, there were no disagreements between the Company and Moss Adams LLP on any matter of accounting principle or practice, financial statement disclosure, or auditing scope or procedure that, if not resolved to Moss Adams LLP’s satisfaction, would have caused it to make reference to the matter in conjunction with its report on the Company’s consolidated financial statements for the relevant year, and there were no reportable events as defined in Item 304(a)(1)(v) of Regulation S-K.
The audit report of Moss Adams LLP on the consolidated financial statements of the Company and its subsidiary as of December 31, 2011 and 2010 and for each of the years in the three-year period ended December 31, 2011, contained no adverse opinion or disclaimer of opinion and were not qualified or modified as to uncertainty, audit scope or accounting principles.
The Company furnished a copy of the above disclosure to Moss Adams LLP and requested that Moss Adams LLP provide a letter addressed to the U.S. Securities and Exchange Commission stating whether or not it agrees with the statements made above. A copy of the letter from Moss Adams LLP was filed with the Commission on a Form 8-K on June 19, 2012.
On June 19, 2012, the Audit Committee of the Board of Directors approved the engagement of Crowe Horwath LLP (“Crowe”) as the Company’s independent registered public accounting firm for the fiscal year ending December 31, 2012. During the Company’s two fiscal years ended December 31, 2011 and 2010 and through June 19, 2012, neither the Company, nor anyone on its behalf, consulted with Crowe regarding either (i) the application of accounting principles to a specified transaction, either completed or proposed; or the type of audit opinion that might be rendered on the Company’s consolidated financial statements; and as such, no written report or oral advice was provided, and none was an important factor considered by the Company in reaching a decision as to the accounting, auditing, or financial reporting issues; or (ii) or any matter that was either the subject of a disagreement or a reportable event.
ITEM 9A. CONTROLS9A.CONTROLS AND PROCEDURES
(a) Evaluation of Disclosure Controls and Procedures
As of December 31, 2012,2014, the end of the period covered by this Annual Report on Form 10-K, the Company’s Chief Executive Officer and Chief Financial Officer evaluated the effectiveness of the Company’s disclosure controls and procedures (as defined in Rule 13a-15(e) under the Securities Exchange Act of 1934). Based upon that evaluation, the Company’s Chief Executive Officer and Chief Financial Officer each concluded that as of December 31, 2012,2014, the Company’s disclosure controls and procedures were effective to ensure that the information required to be disclosed by the Company in this Annual Report on Form 10-K was recorded, processed, summarized and reported within the time periods specified in the SEC’s rules and instructions for Form 10-K.
(b) Management’s Report on Internal Control over Financial Reporting and Attestation Report of Registered Public Accounting Firm
Management’s report on internal control over financial reporting is set forth on page 105101 of this report and is incorporated herein by reference. The effectiveness of the Company’s internal control over financial reporting as of December 31, 20122014 has been audited by Crowe Horwath LLP, an independent registered public accounting firm, as stated in its report, which is set forth on page 106102 of this report and is incorporated herein by reference.
(c) Changes in Internal Control over Financial Reporting
No change in the Company’s internal control over financial reporting occurred during the fourth quarter of the year ended December 31, 2012,2014, that has materially affected, or is reasonably likely to materially affect, the Company’s internal control over financial reporting.
ITEM 9B. OTHER9B.OTHER INFORMATION
All information required to be disclosed in a current report on Form 8-K during the fourth quarter of 20122014 was so disclosed.
103
PART III
ITEM 10. DIRECTORS,10.DIRECTORS, EXECUTIVE OFFICERS AND CORPORATE GOVERNANCE
The information required by this Item 10 isshall either be incorporated herein by reference from the Company’s Proxy Statement for the 20132015 annual meeting of shareholders, to be held on May 9, 2013, which will be filed with the Commission pursuant to Regulation 14A.14A or included in an amendment to this Form 10-K.
ITEM 11. EXECUTIVE11.EXECUTIVE COMPENSATION
The information required by this Item 11 isshall either be incorporated herein by reference from the Company’s Proxy Statement for the 20132015 annual meeting of shareholders, to be held on May 9, 2013, which will be filed with the Commission pursuant to Regulation 14A.14A or included in an amendment to this Form 10-K.
ITEM 12. SECURITY12.SECURITY OWNERSHIP OF CERTAIN BENEFICIAL OWNERS AND MANAGEMENT AND RELATED STOCKHOLDER MATTERS
The information required by this Item 12 isshall either be incorporated herein by reference from the Company’s Proxy Statement for the 20132015 annual meeting of shareholders, to be held on May 9, 2013, which will be filed with the Commission pursuant to Regulation 14A.14A or included in an amendment to this Form 10-K.
ITEM 13. CERTAIN13.CERTAIN RELATIONSHIPS AND RELATED TRANSACTIONS, AND DIRECTOR INDEPENDENCE
The information required by this Item 13 isshall either be incorporated herein by reference from the Company’s Proxy Statement for the 20132015 annual meeting of shareholders, to be held on May 9, 2013, which will be filed with the Commission pursuant to Regulation 14A.14A or included in an amendment to this Form 10-K.
ITEM 14. PRINCIPAL14.PRINCIPAL ACCOUNTANT FEES AND SERVICES
The information required by this Item 14 isshall either be incorporated herein by reference from the Company’s Proxy Statement for the 20132015 annual meeting of shareholders, to be held on May 9, 2013, which will be filed with the Commission pursuant to Regulation 14A.14A or included in an amendment to this Form 10-K.
PART IV
ITEM 15. EXHIBITS15.EXHIBITS AND FINANCIAL STATEMENT SCHEDULES
| (a) | Documents filed as part of this report: |
| 1. | All Financial Statements. |
The consolidated financial statements of Registrant are included in Item 8 of this report, and are incorporated herein by reference.
| 2. | Financial statement schedules. |
Schedules have been omitted because they are not applicable or are not required under the instructions contained in Regulation S-X or because the information required to be set forth therein is included in the consolidated financial statements or notes thereto at Item 8 of this report.
| 3. | Exhibits. |
The exhibit list required by this item is incorporated by reference to the Exhibit Index filed with this report.
| (b) | Exhibits filed: |
See Exhibit Index under Item 15(a)(3) above for the list of exhibits required to be filed by Item 601 of regulation S-K with this report.
| (c) | Financial statement schedules filed: |
See Item 15(a)(2) above.
104
Pursuant to the requirements of Section 13 or 15(d) of the Securities Exchange Act of 1934, the Registrant has duly caused this report to be signed on its behalf by the undersigned, thereunto duly authorized.
| Date: March | 13, 2015 | TRICO BANCSHARES | |||||||||
| By: | /s/ Richard P. Smith | ||||||||||
| Richard P. Smith, President and Chief Executive Officer | |||||||||||
Pursuant to the requirements of the Securities Exchange Act of 1934, this report has been signed below by the following persons on behalf of the Registrant in the capacities and on the dates indicated.
| Date: March | 13, 2015 | /s/ Richard P. Smith | ||||||
| Richard P. Smith, President, Chief Executive | ||||||||
| Officer and Director (Principal Executive Officer) | ||||||||
| Date: March | 13, 2015 | /s/ Thomas J. Reddish | ||||||
| Thomas J. Reddish, Executive Vice President and Chief Financial | ||||||||
| Officer (Principal Financial and Accounting Officer) | ||||||||
| Date: March | 13, 2015 | /s/ Donald J. Amaral | ||||||
| Donald J. Amaral, Director | ||||||||
| Date: March | 13, 2015 | /s/ William J. Casey | ||||||
| William J. Casey, Director and Chairman of the Board | ||||||||
| Date: March | 13, 2015 | /s/ Craig S. Compton | ||||||
| Craig S. Compton, Director | ||||||||
| Date: March | 13, 2015 | /s/ L. Gage Chrysler | ||||||
| L. Gage Chrysler, Director | ||||||||
| Date: March | 13, 2015 | /s/ Cory W. Giese | ||||||
| Cory W. Giese, Director | ||||||||
| Date: March | 13, 2015 | /s/ John S.A. Hasbrook | ||||||
| John S.A. Hasbrook, Director | ||||||||
| Date: March | 13, 2015 | /s/ Patrick A. Kilkenny | ||||||
| Patrick A. Kilkenny, Director | ||||||||
| Date: March | 13, 2015 | /s/ Michael W. Koehnen | ||||||
| Michael W. Koehnen, Director | ||||||||
| Date: March 13, 2015 | /s/ Martin A. Mariani | |||||||
| Martin A. Mariani, Director | ||||||||
| Date: March 13, 2015 | /s/ W. Virginia Walker | |||||||
| W. Virginia Walker, Director | ||||||||
| Date: March 13, 2015 | /s/ J. M. “Mike” Wells, Jr. | |||||||
| J. M. “Mike” Wells, Jr., Director | ||||||||
105
EXHIBIT INDEX
Exhibit | Exhibit | |
| 2.1 | Purchase and Assumption Agreement Whole Bank All Deposits, among the Federal Deposit Insurance Corporation, receiver of Granite Community Bank, N.A., Granite Bay, California, the Federal Deposit Insurance Corporation and Tri Counties Bank, dated as of May 28, 2010, and related addendum | |
| 2.2 | Purchase and Assumption Agreement Whole Bank All Deposits, among the Federal Deposit Insurance Corporation, receiver of Citizens Bank of Northern California, Nevada City, California, the Federal Deposit Insurance Corporation and Tri Counties Bank, dated as of September 23, 2011, and related addendum | |
| 2.3 | Agreement and Plan of Merger and Reorganization by and between TriCo and North Valley Bancorp dated January 21, 2014 (incorporated by reference to Exhibit 2.1 to TriCo’s Current Report on Form 8-K filed January 21, 2014). | |
| 3.1 | Restated Articles of Incorporation | |
| 3.2 | Bylaws of TriCo, | |
| 4.1 | ||
| | ||
| Form of Change of Control Agreement dated as of | ||
| | TriCo’s 1995 Incentive Stock Option Plan | |
| | TriCo’s 2001 Stock Option Plan, as amended | |
| | TriCo’s 2009 Equity Incentive | |
| | Amended Employment Agreement between TriCo and Richard Smith dated as of | |
| | Transaction Bonus Agreement between TriCo Bancshares and Richard P. Smith dated as of August 7, 2014 (incorporated by reference to Exhibit 10.4 to TriCo’s Form 8-K filed on August 13, 2014). | |
| 10.7* | Tri Counties Bank Executive Deferred Compensation Plan restated April 1, 1992, and January 1, 2005 | |
| | Tri Counties Bank Deferred Compensation Plan for Directors effective January 1, 2005 | |
| | 2005 Tri Counties Bank Deferred Compensation Plan for Executives and Directors effective January 1, 2005 | |
| | Tri Counties Bank Supplemental Retirement Plan for Directors dated September 1, 1987, as restated January 1, 2001, and amended and restated January 1, 2004 | |
| | 2004 TriCo Bancshares Supplemental Retirement Plan for Directors effective January 1, 2004 | |
| | Tri Counties Bank Supplemental Executive Retirement Plan effective September 1, 1987, as amended and restated January 1, 2004 | |
| | 2004 TriCo Bancshares Supplemental Executive Retirement Plan effective January 1, 2004 | |
| | Form of Joint Beneficiary Agreement effective March 31, 2003 between Tri Counties Bank and each of George Barstow, Dan Bay, Ron Bee, Craig Carney, Robert Elmore, Greg Gill, Richard Miller, Richard O’Sullivan, Thomas Reddish, Jerald Sax, and Richard Smith | |
| | Form of Joint Beneficiary Agreement effective March 31, 2003 between Tri Counties Bank and each of Don Amaral, William Casey, Craig Compton, John Hasbrook, Michael Koehnen, Donald Murphy, Carroll Taresh, and Alex Vereschagin | |
| | Form of | |
| | Form of | |
106
Exhibit No. | Exhibit | |
| 10.18* | Form of Indemnification Agreement between TriCo and its directors and executive officers (incorporated by reference to Exhibit 10.1 to TriCo’s Current Report on Form 8-K filed September 10, 2013). | |
| 10.19* | Form of Indemnification Agreement between Tri Counties Bank its directors and executive officers (incorporated by reference to Exhibit 10.2 to TriCo’s Current Report on Form 8-K filed September 10, 2013). | |
| 10.20* | Form of Stock Option Agreement and Grant Notice pursuant to TriCo’s 2009 Equity Incentive Plan (incorporated by reference to Exhibit 10.1 to TriCo’s Current Report on Form 8-K filed May 25, 2010). | |
| 10.21* | Form of | |
| 10.22* | Form of | |
| 10.23* | Form of 2014 Performance Award Agreement and Grant Notice pursuant to TriCo’s 2009 Equity Incentive Plan (incorporated by reference to Exhibit 10.3 to TriCo’s Current Report on Form 8-K filed August 13, 2014). | |
| 21.1 | ||
| 23.1 | ||
| Independent Registered Public Accounting Firm’s Consent | ||
| 31.1 | Rule 13a-14(a)/15d-14(a) Certification of CEO | |
| 31.2 | Rule 13a-14(a)/15d-14(a) Certification of CFO | |
| 32.1 | Section 1350 Certification of CEO | |
| 32.2 | Section 1350 Certification of CFO | |
| 101.INS | XBRL Instance Document | |
| 101.SCH | XBRL Taxonomy Extension Schema Document | |
| 101.CAL | XBRL Taxonomy Extension Calculation Linkbase Document | |
| 101.LAB | XBRL Taxonomy Extension Label Linkbase Document | |
| 101.PRE | XBRL Taxonomy Extension Presentation Linkbase Document | |
| 101.DEF | XBRL Taxonomy Extension Definition Linkbase Document | |
| * | Management contract or compensatory plan or arrangement |
111107