| x | ANNUAL REPORT PURSUANT TO SECTION 13 OR 15(d) OF THE SECURITIES EXCHANGE ACT OF 1934 |
| ¨ | TRANSITION REPORT PURSUANT TO SECTION 13 OR 15(d) OF THE SECURITIES EXCHANGE ACT OF 1934 |
| Delaware | 20-0484934 | |
(State or other jurisdiction of incorporation or organization) | (I.R.S. Employer Identification No.) | |
| 333 North Canyons Parkway, Livermore, CA | 94551 | |
| (Address of principal executive offices) | (Zip Code) | |
Title of each class: | Name of each exchange on which registered: | |
| Common Stock, par value $.0001 per share | NASDAQ Global Select Market | |
| Large accelerated filer | ¨ | Accelerated filer | ||||
| Non-accelerated filer | Smaller reporting company | ¨ | ||||
The number
registrant’s common stock were outstanding.
our opportunities and expectations for growth in the student lending, healthcare and other markets; anticipated trends and challenges in our business and competition in the markets in which we operate; our client relationships and future growth opportunities; the adaptability of our technology platform to new markets and processes; our ability to invest in and utilize our data and analytics capabilities to expand our capabilities; our growth strategy of expanding in our existing markets and considering strategic alliances or acquisitions; our ability to meet our liquidity and working capital needs; maintaining, protecting and enhancing our intellectual property; our expectations regarding future expenses; expected future financial performance; and our ability to comply with and adapt to industry regulations and compliance demands. Given these uncertainties, you should not place undue reliance on these forward-looking statements. Corporation. Our website address is www.performantcorp.com. 29 Guaranty Agencies, or "GAs". 2023. FS. recovery outsourcing models. We refer to the patented technology that supports our proprietary workflows as “Smart Bins.” Smart Bins disaggregate otherwise complex recovery processes into a series of simple, efficient and consistent steps that are easily configurable and applicable to different types of recovery-related applications. Our workflow processes integrate a broad range of functions that encompass each stage of a recovery process. Recovery Services private healthcare clients • We use our enhanced data analytics capabilities, which we refer to as Performant Insight, to offer a variety of services from post- and pre-payment audit of healthcare claims to detection of fraud, waste and abuse of healthcare claims, to coordination of benefits and pharmacy fraud detection influenced by our performance under our contracts and our ability to recover funds from defaulted student loans, as measured against the performance of competitors who may service a similar pool of defaulted loans for the same client. To the extent we perform well under our existing contracts and differentiate our services from those of our competitors, we may receive a relatively greater number of student loan placements under these contracts and may improve our ability to obtain future contracts from these clients and other potential clients. services with these initial private healthcare clients, but also gain entry into other related private healthcare opportunities. entirely contingency-based, and our fee for a particular recovery depends on the type of recovery facilitated. We also receive incremental performance incentives based upon our performance as compared to other contractors with the Department of Education, which are comprised of additional inventory allocation volumes and incentive fees. To participate in the Department of Education contracts, firms must follow a highly competitive selection process. For the latest Department of Education contract, the fourth major contract the Department of Education has outsourced to selected vendors, we were selected as one of 17 unrestricted vendors and initiated work on this contract in the fourth quarter of 2009. Our current contract with the Department of Education will expire in April 2015. We are currently subject to a competitive rebidding process for the next contract with the Department of Education. We understand that five other recovery service providers under the current contract have recently received notice from the Department of Education stating an intention to extend their existing contracts past April 2015. To date, we have not received notice of any such extension from the Department of Education, and we are unsure whether we will be provided any such extension of our current contract or when the new contracts will be awarded. We do not believe the Department of Education has completed the current contract extension process. However, due to the timing of the rehabilitation process for loans placed with us by the Department of Education, we expect there will be a minimal impact on our revenues in 2015 if we do not receive an extension of our current contract. Despite notice of their intent to extend the current contract for five recovery service providers, we believe the Department of Education is not permitted to selectively extend the contract for individual recovery service providers. Because all federally-supported student loans are being originated by the Department of Education as a result of SAFRA, our relationship with the Department of Education will become increasingly more important over time. The Department of Education was responsible for approximately 2014. recovery firms must follow in communicating with consumer debtors, including the time, place and manner of such communications. Further, it prohibits harassment or abuse by debt recovery firms, including the threat of violence or criminal prosecution, obscene language or repeated telephone calls made with the intent to abuse or harass. The FDCPA also places restrictions on communications with individuals other than consumer debtors in connection with the collection of any consumer debt and sets forth specific procedures to be followed when communicating with such third parties for purposes of obtaining location information about the consumer. In addition, the FDCPA contains various notice and disclosure requirements and prohibits unfair or misleading representations by debt recovery firms. Finally, the FDCPA imposes certain limitations on lawsuits to collect debts against consumers. Insight. results in the event we are successful in obtaining a second RAC contract, depending on a variety of factors including, among other things, CMS’s evaluation of provider compliance with the new rules, the rules ultimately adopted by CMS with respect to medical necessity reviews of Medicare reimbursement claims associated with short stay inpatient admissions and, more generally, the scope of improper claims that CMS allows us to pursue and our ability to successfully identify improper claims within the permitted scope. In connection with the award of the new RAC contract, CMS has indicated that it is reviewing certain aspects of the RAC contract including the amount of medical records that RAC vendors may request and the timeframes for review and communications between RAC vendors and providers. of typically several firms engaged to provide recovery services to a particular client and, if we are successful in being engaged, we then face continuing competition from the client’s other retained firms based on the client’s benchmarking of the recovery rates of its several vendors. Some of our current and potential competitors in the markets in which we operate may have greater financial, marketing, technological or other resources than we do. The ability of any of our competitors and potential competitors to adopt new and effective technology to better serve our markets may allow them to gain market strength. Increasing levels of competition in the future may result in lower recovery fees, lower volumes of contracted recovery services or higher costs for resources. Any inability to compete effectively in the markets that we serve could adversely affect our business, financial condition and results of operations. changed the structure of the government-supported student loan market by assigning responsibility for all new government-supported student loan originations to the Department of Education, rather than originations by private institutions and backed by one of the amount of defaulted student loans and other receivables that our clients place with us for recovery; the timing of placements of student loans and other receivables which are entirely in the discretion of our clients; the loss or gain of significant clients or changes in the contingency fee rates or other significant terms of our business arrangements with our significant clients; technological and operational issues that may affect our clients and regulatory changes in the markets we service; and general industry and macroeconomic conditions. operations. current or potential clients and adversely impact our financial condition and results of operations. While we have backup systems in many of our operating facilities, an extended outage of utility or network services may harm our ability to operate our business. Further, the situations we plan for and the amount of insurance coverage we maintain for losses as result of failures of our operating systems and infrastructure may not be adequate in any particular case. FCRA and other federal and state regulations that affect our student loan recovery business may result in significant costs, including litigation costs. We may also become subject to regulations promulgated by the United States Consumer Financial Protection Bureau, or CFPB, which was established in July 2011 as part of the Dodd-Frank Act to, among other things, establish regulations regarding consumer financial protection laws. business practices or pay substantial damages or settlement costs as a result of litigation proceedings, which could adversely affect our business operations and results of operations. Moreover, any acquisition may result in a potentially dilutive issuance of equity securities, the incurrence of additional debt and amortization of expenses related to intangible assets, all of which could adversely affect our results of operations and stock price. The price of our common stock could be volatile, and you may not be able to sell your shares at or above the public offering price. mergers and other business combination transactions, including proposed transactions that would result in our stockholders receiving a premium price for their shares; other acquisitions or dispositions of businesses or assets; incurrence of indebtedness and the issuance of equity securities; repurchase of stock and payment of dividends; and the issuance of shares to management under our equity incentive plans. Page ITEM 1.1 ITEM 1A.18ITEM 1B.31ITEM 2.32ITEM 3.32ITEM 4.32ITEM 5. 323334505151 ITEM 9A.51 ITEM 9B.52ITEM 10. 52525252 52 52factsfact contained in this Annual Report on Form 10-K, including statements regarding our future results of operations and financial position, strategy and plans, and our expectations for future operations, are forward-looking statements. The words “believe,” “may,” “estimate,” “continue,” “anticipate,” “design,” “intend,” “expect” and similar expressions are intended to identify forward-looking statements. We have based these forward-looking statements largely on our current expectations and projections about future events and trends that we believe may affect our financial condition, results of operations, strategy, short-term and long-term business operations and objectives, and financial needs. Forward-looking statements include, but are not limited to, statements about:We note thatThere are a variety of factors could cause actual results and experience to differ materially from the anticipated results or expectations expressed in our forward-looking statements. Given these uncertainties, you should not place undue reliance on these forward-looking statements. Forward-looking statements are also subject to risks and uncertainties that could cause actual results to differ materially from those expected. These risks and uncertainties include, but are not limited to, those risks discussed in Item 1A of this report.reports filed with the Securities and Exchange Commission.ITEM 1. Business2012,2014, we provided recovery services on approximately $8.2$9.9 billion of combined student loans and other delinquent federal and state receivables and recovered approximately $482$244 million in improper Medicare payments. Our clients include 1113 of the 3130 public sector participants in the student loan industry and these relationships average more than 10 years in length, including a 22-year25-year relationship with the Department of Education. AccordingWe are currently subject to a competitive rebidding process for the next contract with the Department of Education, total government-supported student loan originations were estimated to be approximately $115 billion in 2012, and, asEducation. As of September 30, 2012,2014, approximately $78$100.5 billion of government-supported student loans were in default. In the healthcare market, we are currently one of four prime Medicare Recovery Audit Contractors, or RACs, in the United States for the Centers for Medicare and Medicaid Services, or CMS, and are currently$554$591.2 billion of claims in 2011,2013, of which approximately $43$44 billion were estimated to be improper payments.$150,000$130,000 of revenues per employee during 2012,2014, based on the average number of employees during the year.for our clients to recover, our business objectives are aligned with those of our clients and we are generally not reliant on their spending budgets. Further, our business model does not require significant capital expenditures and we do not purchase loans or obligations.We believe we benefit from a significant degree of revenue visibility due to reasonably predictable recovery outcomes in a substantial portion of our business. 2012,2014, we generated approximately $210.1$195.4 million in revenues, $23.0$9.4 million in net income, $69.6$44.7 million in adjusted EBITDA and $30.6$15.3 million in adjusted net income. See “Adjusted“Managements Discussion and Analysis of Financial Condition and Results of Operations - Adjusted EBITDA and Adjusted Net Income” in Item 7 below for a definition of adjusted EBITDA and adjusted net income and reconciliations of adjusted EBITDA and adjusted net income to net income determined in accordance with generally accepted accounting principles.Corporation in 2005.Student lending is a large and critically-important market in the United States. According to the Department of Education, total government-supported student loan originations were estimated to be approximately $115 billion in the year ended September 30, 2012, and the aggregate dollar amount of these loans has grown at a compound annual growth rate of 11% from 2002 through 2012. This growth has been supported by general demographic trends, increased enrollment, and rising costs of tuition and other expenses that increase the need for borrowed funds among students. In addition to strong underlying origination growth, the default rates among student loan borrowers have increased in recent years. The “cohort default rate,” which is the measure utilized by the Department of Education to track the percentage of government-supported loan borrowers that enter repayment in a certain year ended September 30 and default by the end of the next year ended September 30, has risen from approximately 5% in 2006 to approximately 9% in 2010, the last year for which data is available.31 GAs.$44.7$66.0 billion in the FDSLP and approximately $32.7$34.5 billion in the FFELP as of September 30, 2012.2014. These programs collectively guaranteed approximately $706$977 billion of federal government-supported student loans according to the Congressional Budget Office as of September 30, 2011.2013. Given the operational and logistical complexity involved in managing the recovery of defaulted student loans, the Department of Education and the GAs generally choose to outsource these services to third parties.The tables below show government-supported student loan originations and government-supported default inventory for the years ended 2007 through 2012 as reported by the Department of Education.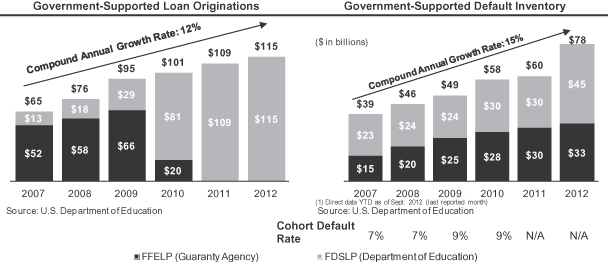
$2.7$2.9 trillion in 20112013 and is forecast to grow at a 6%5.7% compound annual growth rate through 2021.2023. In particular, CMS indicates that federal government-related healthcare spending for 20112013 totaled approximately $1.2$1.0 trillion. This federal government-related spending included approximately $554$591.2 billion for Medicare, which provides a range of healthcare coverage primarily to elderly and disabled Americans, and $408$431.1 billion for Medicaid, which provides federal matching funds for states to finance healthcare for individuals at or below the public assistance level.The tables below show total U.S. healthcare expenditures from 2011 through 2021 and total Medicare spending from 2011 through 2021 as estimated by CMS.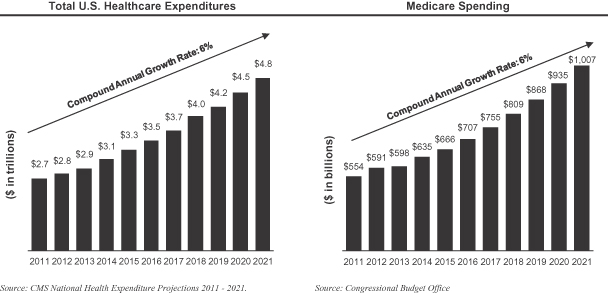
$554$591.2 billion of 2011 Medicare spending in 2013, the Department of Health and Human Services estimated that approximately $43$48 billion, or 8%approximately 8.6%, was improper, and that Medicare is the federal program with the largest amount of improper payments. Medicare improper payments generally involve incorrect coding, procedures performed which were not medically necessary, and incomplete documentation or claims submitted based on outdated fee schedules, among other issues. Likewise, Medicaid improper payments were estimated to be $22 billion, or 5%, of total Medicaid payments for 2011. The following table illustrates the proportion of improper payments among federal programs in the year ended September 30, 2011, according to the Office of Management and Budget.Top Federal Programs with Improper Payments in the Year Ended September 30, 2011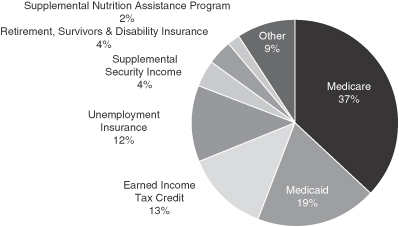
Total = $115 billion(1)Other includes National School Lunch, Pell Grant, and 67 additional programs.that have been paid to healthcare providers. The program was implemented by designating one prime contractor in each of the four major regions in the United States: West, Midwest, South, and Northeast.$1.5 trillion$961 billion in spending in 20112013 and private expenditures are projected to grow more than 5%5.7% annually through 2021.We believe that the demand for recovery of delinquent state taxes will grow asdeficits.deficits, many states have focused on recovery of delinquent state taxes. According to the Center on Budget and Policy Priorities, an independent think tank, 4331 U.S. states faced projected budget shortfalls totaling $107$55 billion in the year ended September 30, 2012, with at least 31 states anticipating deficits for fiscal year 2013. The economic recession hasbeginning in 2008 led to lower income and sales taxes from both individuals and corporations, reducing overall tax revenues and leading to large budget deficits at the state government level. While many states have received federal aid, most have cut services and increased taxes to help close the budget shortfall and have evaluated outsourcing at least some aspect of delinquent tax recovery.Service,Service), or FS, a bureau of the Department of the Treasury, or FMS.Treasury. Since 1996, the FMSFS has recovered more than $54$63 billion in delinquent federal and state debt. For the fiscal year ended September 30, 2011,2013, federal agency recoveries in this market totaled more than $6.2$7 billion,$700$13 million over 2010.2012. A significant portion of these collections are processed by private collection firms on behalf of the FMS.•Scalable and flexible technology-enabled services platform. We have built a proprietary technology platform that is highly flexible, intuitive and easy to use for our recovery and claims specialists. Our platform is easily configurable and deployable across multiple markets and processes. For example, we have successfully extended our platform from the student loan market to the state tax, federal treasury receivables and the healthcare recovery markets, each having its own industry complexities and specific regulations.•Advanced, technology-enabled workflow processes. Our technology-enabled workflow processes, developed over many years of operational experience in recovery services, disaggregate otherwise complex recovery processes into a series of simple, efficient and consistent steps that are easily configurable and applicable to different types of recovery-related applications. We believe our workflow software is highly intuitive and helps our recovery and claims specialists manage each step of the recovery process, while automating a series of otherwise manually-intensive and document-intensive steps in the recovery process. We believe our streamlined workflow technology drives higher efficiencies in our operations, as illustrated by our ability to generate in excess of $150,000 of revenues per employee during 2012, based on the average number of employees during the year. We believe our streamlined workflow technology also improves recovery results relative to more labor-intensive outsourcing models.•Enhanced data and analytics capabilities. Our data and analytics capabilities allow us to achieve strong recovery rates for our clients. We have collected recovery-related data for over two decades, which we combine with large volumes of client and third-party data to effectively analyze our clients’ delinquent or defaulted assets and improper payments. We have also developed a number of analytics tools that we use to score our clients’ recovery inventory, determine the optimal recovery process and allocation of resources, and achieve higher levels of recovery results for our clients. In addition, we utilize analytics tools to continuously measure and test our recovery workflow processes to drive refinements and further enhance the quality and effectiveness of our capabilities. Finally, through astrategic investment, we have acquired enhanced data analytics capabilities, which we refer to as Performant Insight. This investment allows us to expand our capabilities into several new areas including the detection of fraud, waste and abuse in various markets and has assisted in our recovery activities for CMS.•Long-standing client relationships. We believe our long-standing focus on achieving superior recovery performance for our clients and the significant value our clients derive from this focus have helped us achieve long-tenured client relationships, strong contract retention and better access to new clients and future growth opportunities. We have business relationships with 11 of the 31 public sector participants in the student loan market and these relationships average more than 10 years in length, including an approximate 22-year relationship with the Department of Education. In the healthcare market, we have a seven-year relationship with CMS and are currently one of only four prime Medicare RAC contractors.•Extensive domain expertise in complex and regulated markets. We have extensive experience and domain expertise in providing recovery services for government and private institutions that generally operate in complex and regulated markets. We have demonstrated our ability to develop domain expertise in new markets such as healthcare and state tax and federal Treasury receivables. We believe we have the necessary organizational experience to understand and adapt to evolving public policy and how it shapes the regulatory environment and objectives of our clients. We believe this helps us identify and anticipate growth opportunities. For example, we successfully identified government healthcare as a potential growth opportunity that has thus far led to the award of three contracts to us by CMS. Together with our flexible technology platform, we have the ability to adapt our business strategy, to allocate resources and to respond to changes in our regulatory environment to capitalize on new growth opportunities.•Proven and experienced management team. Our management team has significant industry experience and has demonstrated strong execution capabilities. Our senior management team, led by Lisa Im, has been with us for an average of approximately 10 years. This team has successfully grown our revenue base and service offerings beyond the original student loan market into healthcare and delinquent state tax and private financial institutions receivables. Our management team’s industry experience, combined with deep and specialized understanding of complex and highly regulated industries, has enabled us to maintain long-standing client relationships and strong financial results.•Expand our student loan recovery volume. According to the Department of Education, total government-supported student loan originations were estimated to be approximately $115 billion in 2012, and have grown at a 11% compound annual growth rate from 2002 through 2012. The balance of defaulted government-supported student loans was estimated to be approximately $78 billion as of September 30, 2012. While we have long-standing relationships with some of the largest participants in the government-supported student loan market, we believe there are significant opportunities within this growing market to increase the volume of student loans placed with us by existing and new clients. For example, under our contract with the Department of Education, we believe there is an opportunity to grow our placement volume through strong performance. Further, as a result of our relationships with five of the seven largest GAs, we believe we are well-positioned to benefit as a result of any consolidation of smaller GAs over the coming years.•Expand our recovery services in the healthcare market. According to CMS, Medicare spending totaled approximately $554 billion in 2011 and is expected to increase to $1 trillion in 2021, representing a compound annual growth rate of 6%. In the private healthcare market, spending totaled $1.5 trillion in 2011 and is expected to grow more than 6% annually through 2021, according to CMS’ National Health Expenditures Projections. As these large markets continue to grow, we expect the needfor recovery services to increase in the public and private healthcare markets. In the public healthcare space, we intend to utilize the experience gained through our contracts with CMS to pursue additional recovery opportunities in areas such as Medicare Secondary Payor Recovery and state Medicaid recovery. In addition, through our enhanced analytics capabilities, we intend to pursue opportunities to find and eliminate losses prior to payment for healthcare services including the detection of fraud, waste and abuse in the public and private healthcare markets.•Pursue strategic alliances and acquisitions. We intend to selectively consider opportunities to grow through strategic alliances or acquisitions that are complementary to our business. These opportunities may enhance our existing capability or enable us to enter new markets or provide new products or services, such as our licensing of new applied data modeling analytics capabilities that can be used to identify fraudulent or erroneous healthcare claims prior to payment. enhanced analytics capabilities will extend our potential markets, permitting us to pursue significant new business opportunities. We intend to accelerateFor example, we have expanded the use of our data analytics capabilities in the healthcare sector to
Student Loans Healthcare Other Markets • Analyze millions of Medicare Parts A for public and B claims as the prime contractor for recovery services for improper payments in the Northeast region of the United States and provide recovery and audit services for the Department of Education • Provide claims audit, pharmacy management and coordination of benefits functions for one of the nation’s largest health care organizations Our geographical region accounted for approximately 23% of all Medicare spending in 2009 according to CMS. Our relationship with CMS began in 2005 with an initial demonstration contract to recover improper payments for Medicare Secondary Payor claims.WeTo accelerate our abilityprovide Medicare auditappeal in which the appellate court recently remanded the case back to the lower court to rule on the merits of the case. There is a related injunction barring the award of three of the four new RAC contracts pending resolution of this litigation. A fifth RAC contract, which is a new type of RAC contract covering the identification and recovery services across our region following ourof improper claims for durable medical equipment, prosthetics, orthotics and supplies and home health and hospice claims, was not covered by the injunction and was awarded to another party in January 2015. The Company is not a party to this litigation. CMS has stated that the injunction will delay the award of the three contracts until the judge’s ruling on the injunction, which is not expected to occur until late summer 2015. It is uncertain whether CMS will award the RAC contract we outsource certain aspects of our healthcare recovery processnot covered by the injunction in the interim period or will wait to three different subcontractors. Two of these subcontractors provide a specific service to us in connection with our claims recovery process, and one subcontractor is engaged to provideaward all of the new RAC contracts at the same time. CMS also recently announced that it extended our existing RAC contract through December 31, 2015, along with a limited scope of procedures we will be allowed to conduct and a limited scope of claim types we will be permitted to pursue during this extended period. CMS has further indicated they may, at their discretion, approve additional issues that we will be permitted to review and audit during the RAC contract extension period.claims within a portion ofseveral national commercial health plans. Our audit and analytic capabilities have allowed us not only to expand our region. According to CMS, the geographic area allocated to this subcontractor represented approximately 17% of the total Medicare spending in our region in 2009.tennumerous state and municipal governments. Delinquent obligations are placed with us by our clients and we utilize a process that is similar to the student loan recovery process for recovering these obligations.a strategic investment, we acquired enhancedour data analytics capabilities, which we refer to as Performant Insight. Performant Insight, added new capabilities in data warehousing and data processing tools that accelerated our abilitywe are able to review, aggregate, and synthesize very large volumes of structured and unstructured data, at high speeds, from the initial intake of disparate data sources, to the warehousing of the data, to the analysis and reporting of the data. We believe we have built a differentiated, next-generation “end-to-end” data processing solution that will maximize value for current and future customers.enhanced analytics capabilities will extend our potential markets, permitting us to pursue significant new business opportunities. We intend to acceleratehave expanded the use of our data analytics capabilities in the healthcare sector to offer a variety of services from post and pre-payment audit of healthcare claims in both the public and private healthcare sector, to detection of fraud, waste and abuse of healthcare claims, to coordination of benefits and pharmacy fraud detection. For example, in February 2013, we announced a strategic relationship to offer recovery services to identify improper coding, billing and payments for the specialty pharmacy customers of Magellan Health Services Inc. (NASDAQ: MGLN).While our revenues from analytics services are limited to date, we believe these services represent a meaningful future opportunity. We currently offer analytics services to one of the largest national healthcare organizations where our analytics services provide real-time financial and operational cost analyses to help support a broad range of compliance and fiscal management functions across the organization, including claims audit, pharmacy management and coordination of benefits. In addition, we are developing strategies to deploy these services in markets other than healthcare.2224 years. We restructure and recover defaulted student loans distributed directly by the Department of Education as part of the FDSLP. Due to its limited resources and recovery capabilities, the Department of Education outsources much of its defaulted student loan portfolio to third-party vendors for recovery. Recovery fees are13.8%27.2% of our revenues for the year ended December 31, 2012.In addition, we were awarded a contract in January 2013 with the Department of Education to conduct a payment recapture of goods and services, which excludes grants and student loans, contracted for by the department. Under this contract, we identify, evaluate and report the causes for contract overpayments and provide recovery services to assist the Department of Education in recovering these improper payments.severala few years as there generally is a lag between originations and defaults of at least three to four years. When a borrower stops making regular payments on a FFELP loan, the GA is obligated to reimburse the lender approximately 97% of the loan’s principal and accrued interest. GAs then seek to recover and restructure these obligations. The GAs with which we contract generally structure one to1112 of the 3129 active GAs in the U.S., including Great Lakes Higher Education Guaranty Corporation and American Student Assistance Corporation, and American Education Services, each of which waswere responsible for 18.7%, 12.1%15.1% and 10.7%12.7%, respectively, of our revenues for the year ended December 31, 2012.2014. We have had relationships with some GA clients for over 25 years.seven-yearnine-year relationship with CMS. Under our RAC contract with CMS awarded in 2009, we identify and facilitate the recovery of improper PartsPart A and Part B Medicare payments in the Northeast region of the United States and whichStates. The RAC contract accounted for approximately 25.8%14.9% of our revenues for the year ended December 31, 2012.2014. We are currently subject to a competitive rebidding process for the next RAC contract with CMS. The fees that we receive for identifying these improper payments from CMS are entirely contingency-based, and the contingency-fee percentage depends on the methods of recovery, and, in some cases, the type of improper payment that we identify.1517 years in the recovery of delinquent receivables owed to a number of different federal agencies. The debt obligations we help to recover on behalf of the Department of the Treasury include commercial and individual debt obligations. We are one of the four firms servicing the current Department of the Treasury contract. Similar to our other recovery contracts, our fees under this contract are contingency-based. We view this as an important strategic relationship, as it provides us valuable insight into other business opportunities within the federal government.a Senior Vice President of Salesan appropriate sales and Marketing and a salesmarketing team covering various markets. new data analytics business, is supported by staff in Miami Lakes, Florida. We have designed our infrastructure for scalability and redundancy, which allows us to continue to operate in the event of an outage at either datacenter. We maintain an information systems environment with advanced network security intrusion detection and prevention with 24x7 monitoring and security incident response capabilities. We utilize encryption technologies to protect sensitive data on our systems, all data during transmission and all data on redundancy or backup media. We also maintain a comprehensive enterprise-wide information security system based upon recognized standards, including the NIST800 53 and ISO 27002 Code of Practice for Information Security Program Management, to uphold high security standards needed for the protection of sensitive information.issued a request for quotesis currently in connection with the re-biddingprocurement process for the next round of RAC contract in February 2013. Although our RAC contract is currently set to expire in 2014, CMS may terminate our RAC contract as early as August 2013 in connection with this re-bidding process.contracts. We expect that our competition will include the other three RAC service providers: Health Management Systems, Inc., Connolly Consulting, Inc. and CGI Group. We also may face competition from the subcontractors of the current prime RAC contractors, who may seek to use their experience as subcontractors to become prime contractors, and a variety of healthcare consulting and healthcare information services companies are potential competitors.companies. Some of these potential competitors for the secondnext RAC contract may have greater financial and other resources than we do. According to the request for quotes, the competitive factors for this new RAC contract are demonstrated experience in effective recovery services in the healthcare market, sufficient capacity to address claims volumes, maintenance of high standards of recovery practices,technical approach for identifying improper payments, key personnel and staffing, financial capability to perform under the RAC contract and recovery fee rates. We believe that our seven yeareight-year relationship with CMS and our related experience in providing recovery services to identify improper payments allows us to compete favorably with respect to many of these factors. We expect that our performance in identifying claims, managing the claims processes under the current RAC contract, and established systems integration with CMS and related Medicare administrative contractors will also be key factors in determining our continued service to CMS. an annually two table top disaster exercises, conduct routine security risk assessments and maintain a continuous improvement process as part of our security risk mitigation and management activity.ofor settlement of any such claims have not been significant.2012,2014, we havehad two U.S. patents, both covering aspects of the workflow management systems and methods incorporated into our technology-enabled services platform. These patents will expire in December 2019.September 2024. We routinely assess appropriate occasions for seeking additional patent protection for those aspects of our platform and other technologies that we believe may provide competitive advantages to our business. We also rely on certain unpatented proprietary expertise and other know-how, licensed and acquired third-party technologies, and continuous improvements and other developments of our various technologies, all intended to maintain our leadership position in the industry.2012,2014, we ownhad five trademarks registered with the U.S. Patent and Trademark office: Performant,DCS, Performant Recovery, Performant Technologies, Discovery Analytics, and Performant Business Services. We are in the process of registering additional trademarks supporting our business, and we claim common law trademark rights in numerous additional trademarks.2012,2014, we had approximately 1,5001,484 full-time employees. None of our employees is a member of a labor union and we consider our employee relations to be good. the Annual Report on Form 10-K, quarterly reports on Form 10-Q, current reports on Form 8-K and amendments to those reports, if any, or other filings filed or furnished pursuant to Section 13(a) or 15(d) of the Securities Exchange Act of 1934, as amended, or the Exchange Act, proxy and information statements. All reports that we file with the SEC may be read and copied at the SEC’s Public Reference Room at 100 F Street, N.E., Washington, DC, 20549. Information about the operation of the Public Reference Room can be obtained by calling the SEC at 1-800-SEC-0330.ITEM 1A.Risk Factorsfivefour largest clients represented 81%70% of our revenues for the year ended December 31, 2012,2014, and 75% of our revenues for the year ended December 31, 2013, and any termination of or deterioration in our relationship with any of these clients would result in a decline in our revenues.threetwo GAs. Revenues from our fivefour largest clients represented 81%70% of our revenues for the year ended December 31, 2012. We expect that our revenues will become increasingly concentrated with our major clients as a result of rising business volumes under our RAC contract, which accounted for approximately 25.8%2014 and 75% of our revenues in 2012, compared to approximately 13.2%for the year ended December 31, 2013. All of our revenues in 2011. Ifcontracts with these clients are subject to periodic renewal and re-bidding processes and if we lose one of these clients or if the terms of our relationships with any of these clients become less favorable to us, our revenues would decline, which would harm our business, financial condition and results of operations.subject to periodic renewal or re-bidding processes, are not exclusive and do not commit our clients to provide specified volumes of businessbusiness. In addition, the terms of these contracts may be changed unilaterally and ason short notice by our clients. As a consequence, there is no assurance that we will be able to maintain our revenues and operating results.loanloans and other receivables, which represented approximately 63.0%83% of our revenues in 2012,2014 and 74% of our revenues in the year ended December 31, 2013, enable our clients to unilaterally terminate their contractual relationship with us at any time without penalty, potentially leading to loss of business or renegotiation of terms. Our contracts generally are subject to a periodic rebidding process at the end of the contract term. Further, most of our contracts in these markets allow our clients to unilaterally change the volume of loans and other receivables that are placed with us or the payment terms at any given time. In addition, most of our contracts are not exclusive, with our clients retaining multiple service providers with whom we must compete for placements of loans or other obligations. Therefore, despite our contractual relationships with our clients, our contracts do not provide assurance that we will generate a minimum amount of revenues or that we will receive a specific volume of placements.loansloan and receivables clients, which include four of our five largest clients in 2012, do not renew their agreements with us upon contract expiration,2014 and 2013, reduce the volume of student loan placements provided to us, modify the terms of service, including the success fees we are able to earn upon recovery of defaulted student loans, or any of these clients establish more favorable relationships with our competitors. For example, we have been advised that our contractual arrangementin 2013 in connection with the Department of Education is under review as a result of the Department of Education’s decision to have its recovery vendors promote income-basedincome‑based repayment, or IBR, to defaulted student loans. The IBR program provides flexibility on the required monthly payment for student loan borrowers at an amount intended to be affordable based on a borrower’s income and family size. As a result of the increased application of the IBR program to defaulted student loans, we expect that there will be an increase in the number of loans that become eligible for rehabilitation because more defaulted student loan borrowers will be able to make qualifying payments. In connection with the implementation of the IBR program, we have been advised that the Department of Education will reduceunilaterally reduced the contingency fee rate that we will receive for rehabilitating student loans by approximately 18% effective March 1, 2013, although this change is still subject to further review and finalization by13%. Further, in October 2014, the Department of Education. Any changesEducation announced a change to a fixed fee of $1,710 payable for each loan that is rehabilitated in place of a recovery fee that historically had been based on a percentage of the balance of the rehabilitated loan.contingency fee percentagesnumber of appeals by healthcare providers to the third, or ALJ, level of appeal relating to claims we have audited, and there can be no assurance that our estimated liability for such appeals will be adequate.compensation termsclaims by the provider. Healthcare providers have the right to appeal a claim and may pursue additional levels of appeal if the initial appeal is found in favor of CMS. We accrue an estimated liability for appeals at the time revenue is recognized based on our estimate of the amount of revenue probable of being refunded to CMS following successful appeal based on historical data and other trends relating to such appeals. In addition, if our estimate of liability for appeals with respect to revenues recognized during a prior period changes, we increase or decrease the estimated liability reserve in the current period. Over the course of our existing RAC contract, healthcare providers have increased their pursuit of appeals beyond the first and second levels of appeal to the third level of appeal, where cases are heard by administrative law judges, or ALJs. In our experience, decisions at the third level of appeal are the least favorable as ALJs exercise greater discretion and there is less predictability in the ALJ decisions as compared to appeals at the first or second levels. The pursuit of third level appeals by healthcare providers has also resulted in a backlog of claims at that level of appeal. This increase of ALJ appeals and backlog of claims at the third level of appeal is the primary reason our total estimated liability for appeals (consisting of the estimated liability for appeals plus the contra-accounts-receivable estimated allowance for appeals) has grown from a balance of $5.6 million at December 31, 2012, to $16.4 million at December 31, 2013 to $18.6 million as of December 31, 2014. Our estimates for our appeal reserve are subject to uncertainties, and accordingly we may underestimate the number of successful appeals or the financial impact of successful appeals in a given year or period. To the extent that the amount of commissions that we are required to return to CMS as a result of successful appeals exceeds our estimated appeals reserve, our revenues in the applicable period will be reduced by the amount of such excess. If we underestimate the amount of commissions that are subject to successful appeal, our revenues in future periods could be adversely affected.future contractsin excess of the amount we have reserved for appeals, which could have a significantmaterial negative impact our financial position and liquidity.results.allconnection with obtaining, retaining and performing under our existing client contracts, including our contracts with the Department of the markets in which we operateEducation and CMS, and an inability to compete effectively in the future could harm our relationships with our clients, which would impact our ability to maintain our revenues and operating results.ThoseIn addition, those recovery vendors who produce the highest recovery rates from a client often will be allocated additional placements and in some cases additional success fees. Accordingly, maintaining high levels of recovery performance, and doing so in a cost-effective manner, are important factors in our ability to maintain and grow our revenues and net income and the failure to achieve these objectives could harm our business, financial condition and results of operations.Similarly, we faced a highly competitive bidding process to become one of the four prime RAC contractors that provide recovery services for improper Medicare payments. CMS issued a request for quotes in connection with the re-bidding for the RAC contract in February 2013. Although our RAC contract is currently set to expire in 2014, CMS may terminate our RAC contract as early as August 2013 in connection with the re-bidding process for new RAC contracts. We expect that this process will be competitive. The failure to retain this contract or a significant adverse change in the terms of this contract, which generated approximately 25.8% of our revenues in the year ended December 31, 2012, would seriously harm our ability to maintain or increase our revenues and operating results.2012,2014, revenues under contracts with the U.S. federal government accounted for approximately 42%46% of our total revenues, compared to 27%48% for the year ended December 31, 2011.2013. In addition, fees payable by the U.S. federal government are expected to become a larger percentage of our total revenues over the next several years as a result of legislation that has transferred responsibility for all new student loan origination to the Department of Education. The continuation and exercise of renewal options on existing government contracts and any new government contracts are, among other things, contingent upon the availability of adequate funding for the applicable federal government agency. Changes in federal government spending could directly affect our financial performance. Administration’s proposed budgeton December 26, 2013, reduced the compensation paid to GAs for the year ending September 30, 2013, included a proposal designedrehabilitation of student loans, effective July 1, 2014. This “revenue enhancement” measure reduced from 18.5% to redirect federal government spending to an alternative federal program by decreasing16.0% of the outstanding loan balance, the amount that GAs are compensatedcan charge borrowers when they rehabilitate defaulted loans. Whilea rehabilitated loan is sold by the Obama Administration’s budget proposal was not approved by Congress,GA and eliminated entirely the GAs retention of 18.5% of the outstanding loan balance as a fee for rehabilitation services. The reduction in June 2012,compensation the GAs receive resulted in a bill containing similar provisions reducingdecrease of approximately 25.0% in the compensation ofcontingency fee percentage that we receive from the GAs for assisting in the rehabilitation of defaulted student loans. Further, in October 2014, the Department of Education announced a new fee structure with respect to payment for rehabilitated loans was subsequently introducedto provide a fixed fee of $1,710 payable for each loan that is rehabilitated in place of a recovery fee that historically had been based as a percentage of the balance of the rehabilitated loan. Any additional decrease in the U.S. Senate.3130 government-supported GAs. This legislation, and any future changes in the legislation and regulations that govern these markets, may require us to adapt our business to the new circumstances and we may be unable to do so in a manner that does not adversely affect our business and operations.TheGAs. AsGAs, as a result of SAFRA, the Department of Education will ultimately become the sole source of revenues in this market, although the GAs will continue to service their existing student loan portfolios for many years to come. As a result, over time, and assuming we are successful in entering into a new contract with the Department of Education under the current rebidding process, defaults on student loans originated by the Department of Education will predominate and our ability to maintain the revenues we had previously received from a number of GA clients will depend on our relationship with a single client, the Department of Education. While we have 2224 years of experience in performing student loan recovery services for the Department of Education, we are one of 17 unrestricted recovery service providers on the current Department of Education contract. In 2012, student loanWe understand that five other recovery work forservice providers under the current contract have recently received notice from the Department of Education generated revenuesstating an intention to extend their existing contracts past April 2015, which is the expiration date for the current contract. To date, we have not received notice of $29.0 million, or approximately 13.8% of our total revenues. Theany such extension from the Department of Education, is expected to initiate aand we are unsure whether we will be provided any such extension of our current contract re-compete process duringor when the first half of 2013.new contracts will be awarded. If our relationship with the Department of Education terminates or deteriorates or if the Department of Education, ultimately as the sole holder of defaulted student loans, requires its contractors to agree to less favorable terms, our revenues would significantly decrease, and our business, financial condition and results of operations would be harmed.3129 GAs. This speculation has heightened as a result of the reduction of fees that the GAs will receive for rehabilitating student loans as a result of the Bipartisan Budget Act of 2013. If GAs that are our clients are combined with GAs with whom we do not have a relationship, we could suffer a loss of business. We currently have relationships with 1112 of the 3129 GAs and threetwo of our GA clients were each responsible for more than 10% of our total revenues in 2012.the year ended December 31, 2014 and 2013. The consolidation of our GA clients with others and the failure to provide recovery services to the consolidated entity could decrease our revenues, which could negatively impact our business, financial condition and results of operations.Our ability to derive revenues under our RAC contract will depend in part on the number and types of potentially improper claims that we are allowed to pursue by CMS as well as the amounts that we are allowed to recover for CMS, and our results of operations may be harmed if the scope of claims that we are allowed to pursue is limited.While we are the prime contractor responsible for review of Medicare records for all Part A and Part B claims in our region pursuant to the terms of our RAC contract with CMS, we are not permitted to seek the recovery of an improper claim unless that particular type of claim has been pre-approved by CMS to ensure compliance with applicable Medicare payment policies, as well as national and local coverage determinations. While the revenues we earn under our contract with CMS are determined primarily by the aggregate volume of Medicare claims in our region and our ability to successfully identify improper payments within these claims, the long-term growth of the revenues we derive under our RAC contract will also depend in part on CMS expanding the scope of potentially improper claims that we are allowed to pursue under our RAC contract. If we are unable to continue to identify improper claims within the types of claims that we are permitted to pursue from time to time or if CMS does not expand the scope of potentially improper claims that we are allowed to pursue, our results of operations could be adversely affected.Further, the improper claims approved by CMS and identified by us may be challenged by affected parties and these challenges may lead to changes in our RAC contract instituted by CMS. For example, in November 2012 the American Hospital Association and four hospitals filed a lawsuit against Kathleen Sebelius, the Secretary of the Department of Health and Human Services. The lawsuit claims, among other things, that CMS is acting improperly in completely denying payment for claims initially made under Medicare Part A (inpatient) that should have been made under Medicare Part B (outpatient), rather than remitting the difference between the Part A and Part B payments. This type of improper claim has accounted for a substantial portion of the claims we have identified under our RAC contract. If our contingency fee payment from CMS for identifying these claims is based on the difference between a Part A and Part B payment, our revenues may be harmed.contract;contact;For example, a technology system upgrade at the Department of Education caused fluctuations in our operating results. This upgrade significantly decreased the volume of student loan placements by the Department of Education to all recovery vendors, including us, during 2011 and through September 30, 2012. While we and the other recovery vendors have recently received substantially larger placement volume in the fourth quarter of 2012 as a result of the completion of this technology system upgrade, the majority of the revenues from these placements will be delayed until the third quarter of 2013 because we do not begin to earn rehabilitation revenues from a given placement until at least nine months after receipt of a placement. In addition, for approximately twelve months beginning in September 2011, this technology system upgrade prevented the Department of Education from processing a portion of rehabilitated student loans and accordingly we were not able to recognize certain revenues associated with rehabilitation of loans for this client. However, the Department of Education continued to pay us based on invoices submitted and we recorded these cash receipts as deferred revenues on our balance sheet.Further, our claim recovery volume is currently impacted by a system adjustment that is being implemented by CMS for its Periodic Income Payment providers, or PIP providers. PIP providers are reimbursed for Medicare claims through different processes than other healthcare providers, and CMS is in the process of making certain system adjustments in order to allow these claims to be processed. Prior to April 2012, we were not permitted to audit Medicare claims for these PIP providers, which we estimate to account for approximately 20% of Medicare claims in our region. The improper payments to PIP providers that we have identified were not processed by CMS from April 2012 until January 2013, when a small portion of such payments began to be processed manually. As a result, we will not recognize any revenues from identified improper payments to PIP providers as of December 31, 2012, but we have incurred expenses related to these claims. We estimate that this delayed our recognition of approximately $6 million in revenues in 2012, although we began to recognize a portion of these revenues starting in the first quarter of 2013. CMS remains in the process of implementing the necessary changesto its systems that would allow these claims to be processed automatically and allow us to recognize these revenues and we believe that the necessary upgrade will be complete in the second quarter of 2013. While we believe that this delay in automatic processing is temporary, we are uncertain as to when automatic processing will begin and the failure of CMS to process these and future claims on a timely basis will delay our recognition of the revenues until this is resolved. Because our revenues are dependent on many factors, some of which are outside of our control, we may experience significant fluctuations in our results of operations and as a result volatility in our stock price.Changes in these factors could lead to a reduction in overall recovery rates by our clients, which in turn could adversely affect our business, financial condition and results of operations. In addition,For example, during the global financial crisis beginning in 2008, the market for securitized student loan portfolios was disrupted, resulting in delays in the ability of some GA clients to resell rehabilitated student loans and, as a result, delayingdelays our ability to recognize revenues from these rehabilitated loans.We may not be able Changes in the overall economy could lead to maintain or increasea reduction in overall recovery rates by our profitability,clients, which in turn could adversely affect our business, financial condition and our recent financial results may not be indicative of our future financial results.We may not succeed in maintaining our profitability on a quarterly or annual basis and could incur quarterly or annual losses in future periods. We have incurred additional operating expenses associated with being a public company and we intend to continue to increase our operating expenses as we grow our business. We also expect to continue to make investments in our proprietary technology platform and hire additional employees and subcontractors as we expand our healthcare recovery and other operations, thus incurring additional expenses. If our revenues do not increase to offset these increases in expenses, our operating results could be adversely affected. Our historical revenues and net income growth rates are not indicative of future growth rates. According to CMS, thegeographic area allocated to this subcontractor accounted for approximately 17% of total Medicare spending in our region in 2009. While we believe that we perform appropriate due diligence before we hire subcontractors, our subcontractors may not provide adequate service or otherwise comply with the terms set forth in their agreements. In the event a subcontractor provides deficient performance to one or more of our clients, any such client may reduce the volume of services we are providing under an existing contract or may terminate the relevant contract entirely and we may face claims for breach of contract. Any such disruption in our relations with our clients as a result of services provided by any of our subcontractors could adversely affect our revenues and operating results.ChangesIn addition, the CFPB has investigatory and enforcement authority with respect to existingwhether persons are engaged in unlawful acts or practices in connection with the collection of consumer debts. On April 12, 2013, we received a Civil Investigative Demand, or a CID, from the CFPB requesting production of documents and answers to questions generally related to the Company’s debt collection practices and procedures. The CFPB has not alleged a violation by us of any law or regulation. We responded to the CID, but have not been examined by the CFPB. In light of the possibility that the CFPB may issue interpretative regulations orfor the adoptionFDCPA, the issuance of newsuch regulations could adversely affect our business and results of operations if we are not able to adapt our services and client relationships to meet theany new regulatory structure.The requirements of being a public company may strain our resources, divert management’s attention and affect our ability to attract and retain executive management and qualified board members.As a public company, we are subject to the reporting requirements of the Exchange Act, the Sarbanes-Oxley Act of 2002, or the Sarbanes-Oxley Act, the Dodd-Frank Act and other applicable securities rules and regulations. Compliance with these rules and regulations has increased our legal and financial compliance costs, made some activities more difficult, time-consuming or costly and increased or will continue to increase demand on our systems and resources, particularly after we are no longer an “emerging growth company.” The Exchange Act requires, among other things,structure that we file annual, quarterly and current reports with respect to our business and operating results. The Sarbanes-Oxley Act requires, among other things, that we maintain effective disclosure controls and procedures and internal control over financial reporting. In order to maintain and, if required, improve our disclosure controls and procedures and internal control over financial reporting to meet this standard, significant resources and management oversight maymight be required. As a result, management’s attention may be diverted from other business concerns, which could adversely affect our business and operating results. Although we have already hired additional employees to comply with these requirements, we may need to hire more employees in the future or engage outside consultants, which will increase our costs and expenses.will first applyapplied to our annual report on Form 10-K for the year endingended December 31, 2013 and complying with these requirements can be difficult. For example, in June 2012, our independent registered public accounting firmwe determined that we had incorrectly accounted for our mandatorily redeemable preferred stock, which required audit adjusting entries for the three-year period ended December 31, 2011. Our failure to detect this error was deemed to be a deficiency in internal control and this deficiency was considered to be a material weakness. To address this situation, our independent registered public accounting firm recommended that the Company emphasize the importance of thoroughly researching all new accounting policies and revisiting accounting policies set for existing transactions when changes in the business or reporting requirements occur or are expected to occur. To prevent issues like these in the future, we have bolstered our technical accounting expertise and, where appropriate, engaged outside consultants with specialized knowledge.As we only recently became a public company following the completion of our initial public offering on August 15, 2012, weWe have limited accounting personnel and other resources with which to address our internal controls and procedures. If we fail to timely achieve and maintain the adequacy of our internal control over financial reporting, we may not be able to produce reliable financial reports or help prevent fraud. Our failure to achieve and maintain effective internal control over financial reporting could prevent us from filing our periodic reports on a timely basis, which could result in the loss of investor confidence in the reliability of our financial statements, harm our business and negatively impact the trading price of our common stock.the later of the year following our first annual report required to be filed with the SEC, or the datesuch time that we are no longer an “emerging growth company” as defined in the JOBS Act, if we continue to take advantage of the exemptions contained in the JOBS Act. At such time, our independent registered public accounting firm may issue a report that is adverse in the event it is not satisfied with the level at which our controls are documented, designed or operating. Our remediation efforts may not enable us to avoid a material weakness in the future.misappropriationother violation of our patents, trademarks, copyrights, trade secrets, or other intellectual property rights could adversely affect any competitive advantage we currently derive or may derive from our proprietary technology platform and we may incur significant costs associated with litigation that may be necessary to enforce our intellectual property rights.Our current or future indebtedness could adversely affect our business and financial condition and reduce the funds available to us for other purposes, and our failure to comply with the covenants contained in our credit agreement could result in an event of default that could adversely affect our results of operations.As of December 31, 2012, our total debt was $147.8 million. For the year ended December 31, 2012, our consolidated interest expense was approximately $12.4 million. Our ability to make scheduled payments or to refinance our debt obligations and to fund our other liquidity needs depends on our financial and operating performance, which is subject to prevailing economic and competitive conditions and to certain financial, business and other factors beyond our control. We cannot make assurances that we will maintain a level of cash flows from operating activities sufficient to permit us to pay the principal and interest on our indebtedness and to fund our other liquidity needs. If our cash flows and capital resources are insufficient to fund our debt service obligations and allow us to maintain compliance with the covenants under our credit agreement or to fund our other liquidity needs, we may be forced to reduce or delay capital expenditures, sell assets or operations, seek additional capital or restructure or refinance our indebtedness. We cannot ensure that we would be able to take any of these actions, that these actions would be successful and permit us to meet our scheduled debt service obligations or that these actions would be permitted under the terms of our existing or future debt agreements, including our credit agreement. If we cannot make scheduled payments on our debt, we will be in default and, as a result, our debt holders could declare all outstanding principal and interest to be due and payable, the lenders under our credit agreement could terminate their commitments to lend us money and foreclose against the assets securing our borrowings and we could be forced into bankruptcy or liquidation.Our debt agreements contain, and any agreements to refinance our debt likely will contain, financial and restrictive covenants that limit our ability to incur additional debt, including to finance future operations or other capital needs, and to engage in other activities that we may believe are in our long-term best interests, including to dispose of or acquire assets. Our failure to comply with these covenants may result in an event of default, which, if not cured or waived, could accelerate the maturity of our indebtedness or result in modifications to our credit terms. If our indebtedness is accelerated, we may not have sufficient cash resources to satisfy our debt obligations and we may not be able to continue our operations as planned.If securities analysts do not publish research or if securities analysts or other third parties publish inaccurate or unfavorable research about us, the price of our common stock could decline.The trading market for our common stock relies in part on the research and reports that securities analysts and other third parties choose to publish about us. We do not control whether these analysts or other third parties provide research regarding our company. The price of our common stock could decline if one or more securities analysts downgrade our common stock or if one or more securities analysts or other third parties publish inaccurate or unfavorable research about us or cease publishing reports about us.Risks Related to Our Common StockWe are subject to certain phase-in provisions of the NASDAQ Marketplace Rules and, as a result, we will not immediately be subject to certain corporate governance provisions.Because of our public offering in February 2013, Parthenon Capital Partners no longer controls a majority of our common stock. As a result, we will no longer be a “controlled company” within the meaning of the corporate governance standards of the NASDAQ Global Select Market. However, we will rely on phase-in provisions for certain stock exchange corporate governance requirements, including:the requirement that a majority of the board of directors consists of independent directors;the requirement that nominating and corporate governance matters be decided solely by independent directors; andthe requirement that employee and officer compensation matters be decided solely by independent directors.We intend to utilize each of these phase-in provisions. As a result, we do not have a majority of independent directors and our nominating and corporate governance and compensation functions are not decided solely by independent directors. Accordingly, you do not have the same protections afforded to stockholders of companies that are subject to all of the stock exchange corporate governance requirements.volatile.$7.55$3.65 on November 27, 2012January 29, 2015 to a high sales price of $14.09 on March 4, 2013. The trading price of our common stock may be significantly affected by various factors, including: quarterly fluctuations in our operating results; the financial projections we may provide to the public, any changes in those projections or our failure to meet those projections; changes in investors’ and analysts’ perception of the business risks and conditions of our business; our ability to meet the earnings estimates and other performance expectations of financial analysts or investors; unfavorable commentary or downgrades of our stock by equity research analysts; termination of lock-up agreements or other restrictions on the ability of our existing stockholders to sell their shares after our public offering in February 2013 and our initial public offering; changes in our capital structure, such as future issuances of debt or equity securities; lawsuits threatened or filed against us; strategic actions by us or our competitors, such as acquisitions or restructurings; new legislation or regulatory actions; changes in our relationship with any of our significant clients; fluctuations in the stock prices of our peer companies or in stock markets in general; and general economic conditions.Future sales, or the perception of future sales, of our common stock may lower our stock price.If our existing stockholders sell a large number of shares of our common stock, the market price of our common stock could decline significantly. In addition, the perception in the public market that our existing stockholders might sell shares of common stock could depress the market price of our common stock, regardless of the actual plans of our existing stockholders. As of March 20, 2013, a total of 46,720,569 shares of common stock were outstanding, assuming that there are no exercises of options after December 31, 2012. Of these shares, the 9,200,000 shares of common stock sold in our February 2013 offering and the 10,350,000 shares that were sold in our initial public offering, will be freely tradable in the public market without restriction or further registration under the Securities Act of 1933, or the Securities Act, unless these shares are held by “affiliates,” as that term is defined in Rule 144 under the Securities Act. 27,728,773 shares are subject to lock-up agreements entered into in connection with our February 2013 offering restricting the sale of those shares until May 2013, unless otherwise extended. The underwriters may waive the lock-up restriction and allow any of the stockholders subject to this restriction to sell their shares at any time.stockholder hasstockholders have the ability to controlinfluence significant corporate activities and our majority stockholder’ssignificant stockholders' interests may not coincide with yours.48.7%27.4% and 19.9% of our common stock, respectively, as of March 20, 2013.December 31, 2014. As a result of itstheir ownership, Parthenon Capital Partner has Partners and Invesco Ltd. havecontrol decision-makinginfluence decision‑making with respect to our business direction and policies. Parthenon Capital Partners and Invesco Ltd. may have interests different from our other stockholders’ interests, and may vote in a manner adverse to those interests. Matters over which Parthenon Capital Partners and Invesco Ltd. can, directly or indirectly, exercise influence include:the election of our board of directors and the appointment and removal of our officers;cause at such time as Parthenon Capital Partners no longer beneficially owns a majority of our outstanding shares;cause; authorizing blank check preferred stock, which could be issued with voting, liquidation, dividend and other rights superior to our common stock; limiting the ability of our stockholders to call and bring business before special meetings and to take action by written consent in lieu of a meeting at such time as Parthenon Capital Partners no longer beneficially owns a majority of our outstanding shares;meeting; limiting our ability to engage in certain business combinations with any “interested stockholder,” other than Parthenon Capital Partners, for a three-year period following the time that the stockholder became an interested stockholder; requiring advance notice of stockholder proposals for business to be conducted at meetings of our stockholders and for nominations of candidates for election to our board of directors; requiring a super majority vote for certain amendments to our amended and restated certificate of incorporation and amended and restated bylaws after the time when Parthenon Capital Partners ceased to beneficially own a majority of our outstanding shares, which occurred in February 2013;bylaws; and limiting the determination of the number of directors on our board of directors and when Parthenon Capital Partners is no longer our majority stockholder, the filling of vacancies or newly created seats on the board, to our board of directors then in office. These provisions, alone or together, could have the effect of delaying or deterring a change in control, could limit the opportunity for our stockholders to receive a premium for their shares of our common stock, and could also affect the price that some investors are willing to pay for our common stock.Because we do not intend to pay cash dividends in the foreseeable future, you may not receive any return on investment unless you are able to sell your common stock for a price greater than your purchase price.For the foreseeable future, we intend to retain any earnings to finance the development and expansion of our business, and we do not anticipate paying any cash dividends on our common stock. In addition, our ability to pay dividends is subject to restrictive covenants contained in our credit agreement. As a result, you may not receive any return on investment unless you are able to sell your common stock for a price greater than your purchase price.ITEM 1B.Unresolved Staff CommentsNone.
2012 Third Quarter (beginning August 10, 2012) Fourth Quarter payment of cash dividends. Consolidated Statement of Operations Data: Revenues Operating expenses: Salaries and benefits Other operating expense Impairment of trade name Total operating expenses Income from operations Debt extinguishment costs(1) Interest expense Interest income Income before provision for income taxes Provision for income taxes Net income Accrual for preferred stock dividends Net income (loss) available to common shareholders Net income (loss) per share attributable to common shareholders(2) Basic Diluted Weighted average shares (in thousands) Basic Diluted Consolidated Balance Sheet Data: Cash and cash equivalents Total assets Total debt Total liabilities Redeemable preferred stock Total stockholders’ (deficit) equity Student Lending Healthcare Other Total Revenues We are currently subject to a competitive rebidding process for the next contract with the Department of Education. We understand that five other recovery service providers under the current contract have recently received notice from the Department of Education stating an intention to extend their existing contracts past April 2015, which is the expiration date for the current contract. To date, we have not received notice of any such extension from the Department of Education and we are unsure whether we will be provided any such extension of our current contract or when the new contracts will be awarded. We do not believe the Department of Education has completed the current contract extension process. However, due to the timing of the rehabilitation process for loans placed with us by the Department of Education, we expect there will be a minimal impact on our revenues in 2015 if we • Repayment in full of the loan • Regular structured payments, typically according to a renegotiated payment plan • After a defaulted borrower has made nine consecutive recurring payments, the loan is eligible for rehabilitation • Restructure and consolidate a number of outstanding loans into a single loan, typically with one monthly payment and an extended maturity • If we are unable to obtain voluntary repayment, payments may be obtained through wage garnishment after certain administrative requirements are met • We are paid a percentage of the full payment that is made • We are paid a percentage of each payment • We are paid based on a percentage of the overall value of the rehabilitated loan • We are paid based on a percentage of overall value of the restructured loan • We are paid a percentage of each payment Student Lending: Placement Volume Placement Revenue as a percentage of Placement Volume Healthcare: Net Claim Recovery Volume Claim Recovery Fee Rate rehabilitated student loans and accordingly we were not able to recognize certain revenues associated with rehabilitation of loans for this client. However, the Department of Education continued to pay us based on invoices submitted and we recorded these cash receipts as deferred revenues on our balance sheet. make during the transition period, and by suspending records requests during other periods. of Education’s decision to have its recovery vendors promote IBR to defaulted student loans. The IBR program provides flexibility on the required monthly payment for student loan borrowers at an amount intended to be affordable based on a borrower’s income and family size. As a result of the increased application of the IBR program to defaulted student loans, we expect that there will be an increase in the number of loans that become eligible for rehabilitation because more defaulted student loan borrowers will be able to make qualifying payments. In connection with the implementation of the IBR program, loan. Retention increasing healthcare costs, as well as the fiscal budget tightening of federal, state and local governments as a result of general economic weakness and lower tax revenues. 2012. 2013 Consolidated Statement of Operations Data: Revenues Operating expenses: Salaries and benefits Other operating expense Impairment of trade name Total operating expenses Income from operations Debt extinguishment costs Interest expense Interest income Income before provision for income taxes Provision for income taxes Net income Accrual for preferred stock dividends Net income available to common shareholders lower bonus expense. current RAC contract. of approximately 1.9%. Consolidated Statement of Operations Data: Revenues Operating expenses: Salaries and benefits Other operating expense Impairment of trade name Total operating expenses Income from operations Interest expense Interest income Income before provision for income taxes Provision for income taxes Net income Net cash provided by operating activities Net cash used in investing activities Net cash used in financing activities 2012: audit appeals. existing covenants and add certain new covenants. the lenders in May 2014. incur additional indebtedness; create or permit liens; pay dividends or other distributions to our equity holders; purchase or redeem certain equity interests of our equity holders, including any warrants, options and other security rights; pay management fees or similar fees to any of our equity holders; make any redemption, prepayment, defeasance, repurchase or any other payment with respect to any subordinated debt; consolidate, merge or sell assets, including the capital stock of our subsidiaries; enter into transactions with our affiliates; enter into different business lines; make investments. 2014. Long-Term Debt Obligations Interest Payments Operating Lease Obligations Purchase Obligations Total although depreciation and amortization are non-cash charges, the assets being depreciated and amortized may have to be replaced in the future, and adjusted EBITDA does not reflect cash capital expenditure requirements for such replacements or for new capital expenditure requirements; adjusted EBITDA does not reflect interest expense on our indebtedness; adjusted EBITDA does not reflect changes in, or cash requirements for, our working capital needs; adjusted EBITDA does not reflect tax payments; adjusted EBITDA and adjusted net income do not reflect the potentially dilutive impact of equity-based compensation; adjusted EBITDA and adjusted net income do not reflect the impact of certain non-operating expenses resulting from matters we do not consider to be indicative of our core operating performance; and other companies may calculate adjusted EBITDA and adjusted net income differently than we do, which reduces its usefulness as a comparative measure. Reconciliation of Adjusted EBITDA: Net income Provision for income taxes Interest expense Interest income Debt extinguishment costs(1) Depreciation and amortization Impairment of trade name(2) Non-core operating expenses(3) Advisory fee(4) Stock based compensation Adjusted EBITDA Reconciliation of Adjusted Net Income: Net income Debt extinguishment costs(1) Impairment of trade name(2) Non–core operating expenses(3) Advisory fee(4) Stock based compensation Amortization of intangibles(5) Deferred financing amortization costs(6) Tax adjustments(7) Adjusted net income rates with respect to the borrowings under our senior secured credit facility, which bear interest at a variable rate based on the prime rate or LIBOR. For example, if the interest rate on our borrowings increased 100 basis points (1%) from the credit facility floor of 1.5%, our annual interest expense would increase by approximately 2014. 2014. Consolidated Financial Statements of Performant Financial Corporation and Subsidiaries For the Years Ended December 31, Corporation: 12, 2015 Current assets: Cash and cash equivalents Trade accounts receivable, net of allowance for doubtful accounts of $65 and $77, respectively and estimated allowance for appeals of $1,199 and $484, respectively Deferred income taxes Prepaid expenses and other current assets Debt issuance costs, current portion Total current assets Property, equipment, and leasehold improvements, net Identifiable intangible assets, net Goodwill Debt issuance costs Other assets Total assets Liabilities, Redeemable Preferred Stock and Stockholders’ Equity (Deficit) Liabilities: Current liabilities: Current maturities of notes payable Accrued salaries and benefits Accounts payable Other current liabilities Income taxes payable Deferred revenue Estimated liability for appeals Total current liabilities Notes payable, net of current portion Line of credit, drawn Deferred compensation Deferred income taxes Other liabilities Total liabilities Commitments and contingencies Redeemable preferred stock Series A convertible preferred stock, $0.0001 par value. Authorized, 50,000 and 18,000 shares; issued and outstanding, 0 and 5,296 shares at December 31, 2012 and 2011, respectively Stockholders’ equity (deficit): Due from stockholders Common stock, $0.0001 par value. Authorized, 500,000 and 50,000 shares at December 31, 2012 and 2011, respectively; issued and outstanding 45,392 and 37,667 shares at December 31, 2012 and 2011, respectively Additional paid-in capital Accumulated deficit Total stockholders’ equity (deficit) Total liabilities, redeemable preferred stock, and stockholders’ equity (deficit) Revenues Operating expenses: Salaries and benefits Other operating expenses Impairment of trade name Total operating expenses Income from operations Debt extinguishment costs Interest expense Interest income Income before provision for income taxes Provision for income taxes Net income Accrual for preferred stock dividends Net income available to common shareholders Net income per share attributable to common shareholders (see Note 1) Basic Diluted Weighted average shares (see Note 1) Basic Diluted 2012 Balance, December 31, 2009 Increase in redemption value of Series A preferred stock Interest on notes receivable from stockholders Stock-based compensation expense Net income Balance, December 31, 2010 Increase in redemption value of Series A preferred stock Interest on notes receivable from stockholders Stock-based compensation expense Net income Balance, December 31, 2011 Increase in redemption value of Series A preferred stock Conversion of Series A preferred stock to Series B preferred stock which was immediately redeemed for cash Conversion of Series B preferred stock to common Exercise of stock options Issuance of stock Purchase of treasury stock Interest on notes receivable from stockholders Repayment of notes receivable from stockholders Stock-based compensation expense Income tax benefit from employee stock options Net income Balance, December 31, 2012 Cash flows from operating activities: Net income Adjustments to reconcile net income to net cash provided by operating activities: Loss on disposal of assets Impairment of intangible asset Depreciation and amortization Write-off of unamortized debt issuance costs Deferred income taxes Stock-based compensation Interest expense from debt issuance costs and amortization of discount note payable Interest income on notes receivable from stockholders Changes in operating assets and liabilities: Trade accounts receivable Prepaid expenses and other current assets Other assets Accrued salaries and benefits Accounts payable Other current liabilities Income taxes payable Deferred revenue Estimated liability for appeals Other liabilities Net cash provided by operating activities Cash flows from investing activities: Purchase of property, equipment, and leasehold improvements Purchase of perpetual software license and computer equipment Net cash used in investing activities Cash flows from financing activities: Borrowing under notes payable Borrowing under line of credit Redemption of preferred stock Repayment of notes payable Repayment of line of credit Debt issuance costs paid Proceeds from exercise of stock options Proceeds from issuance of stock Repayment of promissory notes from stockholders Income tax benefit from employee stock options Payment to stockholders Purchase of treasury stock Payment of purchase obligation Net cash used in financing activities Net increase in cash and cash equivalents Cash and cash equivalents at beginning of year Cash and cash equivalents at end of year Supplemental disclosures of cash flow information: Cash paid for income taxes Cash paid for interest Cash paid as debt extinguisment Supplemental disclosure of non-cash investing and financing activities: Obligation to sellers of perpetual license Issuance of common stock as part of debt issuance costs effect to the stock split for all periods presented by reclassifying the par value of the additional shares issued in connection with the stock split to additional paid-in capital. Concurrently with the stock split, the authorized Common Stock was increased from 25,000,000 shares to 60,000,000 shares. On August 15, 2012, the authorized Common Stock was increased to 500,000,000 shares and the authorized preferred stock was increased to 50,000,000 shares. appeals of claims for which commissions were previously collected. In addition to the Rank other current assets includes $5.6 million of amounts estimated to become due from subcontractors. The Company employs subcontractors to audit claims as part of an audit & recovery contract, and to the extent that audits by these subcontractors are overturned on appeal, the fees associated with such claims are contractually refundable to the Company. At December 31, 2014, the receivable associated with estimated future overturns of subcontractor audits was $5.6 million. In addition, at December 31, 2014, Prepaid expenses and other current assets includes a net receivable of $3.0 million for subcontractor fees for already overturned audits refundable to the Company once the Company refunds its fees to the client as prime contractor. By comparison, at December 31, 2013, there was a net subcontractor payable under this contract of $3.7 million that was offset by a subcontractor receivable for estimated future overturns of subcontractor audits of $5.2 million, with the net asset of $1.5 million included in Other liabilities. options and restricted stock units. Weighted average shares outstanding – basic Dilutive effect of stock options Weighted average shares outstanding – diluted anti-dilutive. our consolidated financial statements. For the year ended December 31, Total revenue Net income available to common shareholders Earnings per share attributable to common shareholders Basic Diluted Land Building and leasehold improvements Furniture, equipment, and automobile Computer hardware and software Less accumulated depreciation and amortization Property, equipment and leasehold improvements, net December 31, 2012 Amortizable intangibles: Customer contracts and related relationships Perpetual license Total intangible assets December 31, 2011 Amortizable intangibles: Customer contracts and related relationships Total intangible assets Year Ending December 31, 2013 2014 2015 2016 2017 Thereafter Total Year Ending December 31, 2013 2014 2015 2016 2017 Thereafter Total payments of $0.2 million beginning in June 2012, with the outstanding principal balance due March 19, 2018. As of December 31, 2014. 2014. Year Ending December 31, 2013 2014 2015 2016 2017 Thereafter Total Conversion price – The initial Conversion Price of the shares issued in May 2006 was $5.67 per share. In order to prevent dilution of the conversion rights granted to the holders of the Series A Preferred Stock, the Conversion Price was subject to adjustment from time to time under certain circumstances. If the Company (i) declared a dividend on the Common Stock payable in shares of its capital stock (including Common Stock), (ii) subdivided the outstanding Common Stock, (iii) combined the outstanding Common Stock into a smaller number of shares, or (iv) issued any shares of its capital stock in a reclassification of the Common Stock, then, in each such case, the Conversion Price was to be proportionately adjusted so that, in connection with a conversion of the shares of Series A Preferred Stock after such date, the holder of shares of Series A Preferred Stock would have been entitled to receive the aggregate number and kind of shares of capital stock, which, if the conversion had occurred immediately prior to such date, the holder would have owned upon such conversion and been entitled to receive by virtue of such dividend, subdivision, combination, or reclassification. as Compensation periods of four or five-years. Outstanding at December 31, 2009 Granted Forfeited Exercised Outstanding at December 31, 2010 Granted Forfeited Exercised Outstanding at December 31, 2011 Granted Forfeited Exercised Outstanding at December 31, 2012 Vested or expected to vest(1) at December 31, 2012 Exercisable at December 31, 2012 Expected volatility Expected dividends Expected term (years) Risk-free interest rate Weighted-average estimated fair value of options granted during the year four years. The company did not realize any tax benefits related to the restricted stock units during the year ended December 31, 2014 and 2013. 2012. Current: Federal State Deferred: Federal State Total Expense (Benefit) Federal income at the statutory rate State income tax, net of federal benefit Permanent differences Other Deferred tax assets: Bad debt reserve Vacation accrual Remeasurement expense nonqualified stock options Amortization of deferred finance costs Acquisition costs Bonus accrual State tax deferral Stock option compensation Deferred revenue State tax credits Estimated liability for appeals Other Valuation allowance Deferred tax liabilities: Identifiable intangible assets Book versus tax depreciation Amortization of deferred finance costs Other Net deferred tax liabilities Unrecognized tax benefits balance at December 31, 2011 Increase related to prior year tax positions Decrease related to prior year tax positions Increase related to current year tax positions Settlements Lapse of statute of limitations Unrecognized tax benefits balance at December 31, 2012 For tax year before 2011, the Company is no longer subject to Federal and certain other state tax examinations. merger is not completed due to our failure to complete the required financing of the consideration payable under the Merger Agreement. 12, 2015 Name Title Date /s/ Lisa C. Im /s/ Todd R. Ford 2012 2012 2011 2010 2012 2011 20102012,2014, we operated fivesix separate office locations throughout the United States. The largest of these facilities is in Livermore, California and serves as our corporate headquarters, as well as a data center and production location. Our Livermore facility representsis comprised of approximately 50,291 square feet of space and has a lease expiration of September 2017.October 2021. We also lease production centers in California, Oregon, Florida and Texas and own a production/data center in Oregon.operationsoperations.ITEM 4.Mine Safety DisclosuresITEM 5.Market for Registrant’s Common Equity, Related Stockholder Matters and Issuer Purchases of Equity SecuritiesmarketMarket under the symbol “PFMT” on August 10, 2012. Prior to that, there was no public market for our common stock. The table sets forth, for the periods indicated below, the high and low sales prices per share of our common stock as reported by NASDAQ since August 10, 2012. High Low 12.18 9.20 11.84 7.55 2012 High Low Third Quarter (beginning August 10, 2012) 12.18 9.20 Fourth Quarter 11.84 7.55 2013 First Quarter 14.09 10.06 Second Quarter 13.26 9.25 Third Quarter 12.01 10.27 Fourth Quarter 11.02 �� 9.26 2014 First Quarter 11.56 7.11 Second Quarter 10.32 8.10 Third Quarter 10.97 8.04 Fourth Quarter 9.02 5.95 20, 2013,12, 2015, the closing price as reported by NASDAQ of our common stock was $13.00$3.90 per share.2012,2014, we had approximately 3810 holders of record of our common stock.However, we expect to reevaluate our dividend policy on a regular basis and may, subject to compliance with the covenants in ourOur credit agreement and other considerations, determine to pay dividends incontains a covenant prohibiting the future. Our ability to pay dividends is subject to restrictive covenants contained in our credit agreement.Unregistered Sales of Equity SecuritiesIn connection with the consummation of our IPO, we paid $0.9 million to FTP Securities LLC, or FT Partners, through the issuance of 103,500 shares of our common stock valued at $9.00 per share as consideration for financial advisory services provided by FT Partners. The securities issued were exempt from registration pursuant to Section 4(2) of the Securities Act of 1933, as amended.ITEM 6.Selected Financial Data20122014 and 2011,2013, and the selected consolidated statements of operations data for each year ended December 31, 2012, 20112014, 2013 and 2010,2012, have been derived from our audited consolidated financial statements which are included elsewhere in this annual report. The selected consolidated balance sheet data as of December 31, 2010, 20092011 and 2008,2010, and the selected consolidated statements of operations data for the years ended December 31, 20092011 and 20082010 have been derived from our audited consolidated financial statements not included in this annual Year Ended December 31, 2012 2011 2010 2009 2008 (in thousands) $ 210,073 $ 162,974 $ 123,519 $ 109,832 $ 98,967 83,002 67,082 58,113 53,728 49,109 71,305 49,199 33,655 32,110 26,730 — 13,400 — — — 154,307 129,681 91,768 85,838 75,839 55,766 33,293 31,751 23,994 23,128 (3,679 ) — — — — (12,414 ) (13,530 ) (15,230 ) (16,017 ) (16,361 ) 64 125 118 104 217 39,737 19,888 16,639 8,081 6,984 16,786 7,516 6,664 3,071 3,113 $ 22,951 $ 12,372 $ 9,975 $ 5,010 $ 3,871 2,038 6,495 5,771 5,128 4,556 $ 20,913 $ 5,877 $ 4,204 $ (118 ) $ (685 ) Year Ended December 31, 2012 2011 2010 2009 2008 $ 0.48 $ 0.14 $ 0.10 $ (0.00 ) $ (0.02 ) $ 0.44 $ 0.13 $ 0.09 $ (0.00 ) $ (0.02 ) 43,985 42,962 42,962 42,962 42,653 47,599 45,742 45,019 42,962 42,653 Year Ended December 31, 2014 2013 2012 2011 2010 (in thousands) Consolidated Statement of Operations Data: Revenues $ 195,378 $ 255,302 $ 210,073 $ 162,974 $ 123,519 Operating expenses: Salaries and benefits 93,676 96,762 83,002 67,082 58,113 Other operating expense 74,433 85,671 71,305 49,199 33,655 Impairment of trade name — — — 13,400 — Total operating expenses 168,109 182,433 154,307 129,681 91,768 Income from operations 27,269 72,869 55,766 33,293 31,751 — — (3,679 ) — — Interest expense (10,171 ) (11,564 ) (12,414 ) (13,530 ) (15,230 ) Interest income 1 1 64 125 118 Income before provision for income taxes 17,099 61,306 39,737 19,888 16,639 Provision for income taxes 7,699 24,967 16,786 7,516 6,664 Net income 9,400 36,339 22,951 12,372 9,975 Accrual for preferred stock dividends — — 2,038 6,495 5,771 Net income available to common shareholders $ 9,400 $ 36,339 $ 20,913 $ 5,877 $ 4,204 Basic $ 0.19 $ 0.77 $ 0.48 $ 0.14 $ 0.10 Diluted $ 0.19 $ 0.74 $ 0.44 $ 0.13 $ 0.09 Weighted average shares (in thousands) Basic 48,816 47,492 43,985 42,962 42,962 Diluted 49,834 49,386 47,599 45,742 45,019 (1) Represents debt extinguishment costs comprised of approximately $3.3 million of fees paid to lenders in connection with our new credit facility and approximately $0.3 million of unamortized debt issuance costs in connection with our old credit facility. (2) Please see Note 1 to our consolidated financial statements for an explanation of the calculations of our basic and diluted net income per share of common stock. As of December 31, 2012 2011 2010 2009 2008 (in thousands) $ 37,843 $ 20,004 $ 11,078 $ 8,924 $ 9,108 211,745 182,299 181,390 180,735 183,783 147,769 103,383 117,331 127,298 134,215 187,672 139,756 151,231 161,077 167,617 — 58,248 51,753 45,982 40,854 24,073 (15,705 ) (21,594 ) (26,324 ) (26,688 ) As of December 31, 2014 2013 2012 2011 2010 (in thousands) Consolidated Balance Sheet Data: Cash and cash equivalents $ 80,298 $ 81,909 $ 37,843 $ 20,004 $ 11,078 Total assets 262,829 257,260 211,745 182,299 181,390 Total debt 111,795 133,304 147,769 103,383 117,331 Total liabilities 171,657 183,026 187,672 139,756 151,231 Redeemable preferred stock — — — 58,248 51,753 Total stockholders’ (deficit) equity 91,172 74,234 24,073 (15,705 ) (21,594 ) ITEM 7.Management’s Discussion and Analysis of Financial Condition and Results of Operations Year Ended
December 31, 2012 2011 2010 (in thousands) $ 132,445 $ 122,253 $ 103,672 54,747 21,549 1,821 22,881 19,172 18,026 $ 210,073 $ 162,974 $ 123,519 Year Ended December 31, 2014 2013 2012 (in thousands) Student Lending $ 138,275 $ 163,708 $ 132,445 Healthcare 32,526 67,531 54,747 Other 24,577 24,063 22,881 Total Revenues $ 195,378 $ 255,302 $ 210,073 Full Repayment Recurring Payments Rehabilitation Loan Restructuring Wage Garnishment 2012,2014, we had three MSA clients in the student loan market.theour initial RAC contract, we outsourced certain aspects of our healthcare recovery process to three different subcontractors. Two of these subcontractors provide a specific service to us in connection with our claims recovery process, and one subcontractor is engaged to provide all of the audit and recovery services for claims within a portion of our region. According to CMS, the geographic area allocated to this subcontractor represented approximately 17% of the total Medicare spending in our region in 2009. We recognize all of the Year Ended
December 31, 2012 2011 2010 (dollars in thousands) $ 5,768,945 $ 6,241,483 $ 5,294,971 2.30 % 1.96 % 1.96 % $ 482,202 $ 188,573 $ 15,494 11.35 % 11.43 % 11.76 % Year Ended December 31, 2014 2013 2012 (dollars in thousands) Student Lending: Placement Volume $ 6,679,403 $ 6,607,485 $ 5,768,945 Placement Revenue as a percentage of Placement Volume 2.07 % 2.48 % 2.30 % Healthcare: Net Claim Recovery Volume $ 287,829 $ 598,071 $ 482,202 Claim Recovery Fee Rate 11.30 % 11.29 % 11.35 % In addition to our main components of operating expenses, in 2011 we incurred a $13.4 million impairment expense to write off the carrying amount of the trade name intangible asset due to our plan to retire our Diversified Collection Services, Inc. trade name, which we report as impairment of trade name. We expect a significant portion of our expenses to increase as we grow our business. However, we expect certain expenses, including our corporate and general administrative expenses, to grow at a slower rate than our revenues. As a result, and over the long term, we expect our overall expenses to modestly decline as a percentage of revenues.We also expect to incur additional professional fees and other expenses resulting from future expansion and the compliance requirements of operating as a public company, including increased audit and legal expenses, investor relations expenses, increased insurance expenses, particularly for directors’ and officers’ liability insurance, and the costs of complying with Section 404 of the Sarbanes-Oxley Act. While these costs may initially increase as a percentage of our revenues, we expect that in the future these expenses will increase at a slower rate than our overall business volume, and that they will eventually represent a smaller percentage of our revenues.effects of client concentrationretention and macroeconomic factors.have recently received substantially larger placement volume in the fourth quarter of 2012 as a result of the completion of this technology system upgrade, the majority of the revenues from these placements will be delayedwere not recognized until the third quarter of 2013 because we do not begin to earn rehabilitation revenues from a given placement until at least nine months after receipt of a placement. In addition, for approximately twelve months beginning in September 2011, the Department of Education was not able to process a portion of The amount of placement volume that we receive is also dependent on the client relationships that we maintain. We analyze the profitability of each of our student lending clients, and sometimes determine that our resources servicing a specific client should be allocated elsewhere. As a result of this process, we decided to terminate an unprofitable contract with a commercial bank, which we do not expect will have a significant effect on revenues or net income in future periods. Our decision to terminate this contract, as discussed above, accounts for a substantial portion of the 7.6% decrease in Placement Volume in the year ended December 31, 2012, compared to the prior year period.Further, our claim recovery volume is currently impacted by a system adjustment that is being implemented by for its PIP providers. PIP providers are reimbursed for Medicare claims through different processes than other healthcare providers, and CMS is in the process of making certain system adjustments in order to allow these claims to be processed. Prior to April 2012, we were not permitted to audit Medicare claims for these PIP providers, which we estimate to account for approximately 20% of Medicare claims in our region. The improper payments to PIP providers that we have identified were not processed by CMS from April 2012 until January 2013, when a small portion of such payments began to be processed manually. As a result, we will not recognize any revenues from identified improper payments to PIP providers as of December 31, 2012, but we have incurred expenses related to these claims. We estimate that this delayed our recognition of approximately $6 million in revenues in 2012, although we began to recognize a portion of these revenues starting in the first quarter of 2013. CMS remains in the process of implementing the necessaryhas made changes to its systems that would allow these claims to be processed automatically and allow us to recognize these revenues. While we believe that this delay in automatic processing is temporary, we are uncertain of when automatic processing will begin and the failure of CMS to process these and future claims on a timely basis will delay our recognitionpermitted audit scope during the course of the revenues until this is resolved.In addition, the improper claims approved by CMS and identified by us may be challenged by affected parties and these challenges may lead to changes in our RAC contract instituted by CMS.that have had a significant effect on our revenues. For example, in November 2012September 2013, CMS announced that beginning October 1, 2013, we and the American Hospital Associationother RAC contractors would not be able to review and four hospitals filed a lawsuit against Kathleen Sebelius, the Secretaryaudit (i) whether inpatient care delivered to patients with hospital stays lasting less than two midnights was medically necessary and therefore deserving of the Department of Health and Human Services. The lawsuit claims, among other things, that CMS is acting improperly in completely denying payment for claims initially madehigher reimbursement levels under Medicare Part A (inpatient) that should have been made under Medicare Part B (outpatient), ratheror (ii) whether inpatient treatment was medically necessary for admissions spanning more than remitting the difference between the Part A and Part B payments. This typetwo midnights. In connection with these restrictions, hospitals cannot bill CMS for inpatient services on hospital stays lasting less than two midnights. Fees associated with recoveries initiated by us based upon improper claims for inpatient reimbursement of improper claim has accounted forthese short stays had represented a substantial portion of the claimsrevenues we have identifiedearned under our existing RAC contract. IfThe continued suspension of this type of review activity or restrictions on other types of review activities could have a material adverse effect on our contingency fee payment fromhealthcare revenues and operating results.for identifying these claims is basedhas implemented transition procedures that have significantly affected our operations during the transition period by placing restrictions on the difference between a Part Atypes of claims and Part B payment, our future revenuesthe amount of certain medical records requests that we may be effected.have been advised thatearn under our contractual arrangement with the Department of Education is under reviewhave been subject to unilateral change by the Department of Education as a result of the Departmentwe have been advised that the Department of Education will reduceinitially reduced the contingency fee rate that we will receive for rehabilitating student loans by approximately 18%13% effective March 1, 2013, although this change is still subject to further review and finalization by2013.Education. We expectEducation announced a change to a fixed fee of $1,710 payable for each loan that revenues derived fromis rehabilitated in place of a recovery fee that historically had been based on a percentage of the increased volumebalance of the rehabilitated students loans will offset the decrease in contingency fee rates that we receive from the Department of Education.Concentration2012, four2014 and 2013, three providers of student loans each accounted for more than 10% of our revenues during such period and they collectively accounted for 55% and 49%, respectively of our total revenues during this period.such periods. Our contract with the Department of Education, which generated 27.2% of our revenues in 2014, is currently the subject to a competitive bidding process. Our contracts with these clients entitle them to unilaterally terminate their contractual relationship with us at any time without penalty. If we lose one of our significant clients, including if one of our significant clients is consolidated by an entity that does not use our services, if the terms of compensation for our services change or if there is a reduction in the level of placements provided by any of these clients, our revenues could decline.25.8%14.9% and 26.2% of our total revenues infor the year, ended December 31, 2012. CMS issued2014 and December 31, 2013, respectively. Our audit work under our existing RAC contract expired in June 2014, but we have been permitted to resume certain audit work with respect to a request for quoteslimited number of claims pursuant to a contract extension that runs through December 31, 2015. We are currently participating in connection with the re-biddinga competitive bidding process for the next RAC contract. The award of the new RAC contracts has been delayed due in part to a bid protest followed by a lawsuit and a subsequent appeal process which is still underway. Pending a decision on appeal, the contract in February 2013. Although our RAC contract is currently set to expire in 2014, CMS may terminate our RAC contract as early as August 2013 in connection with this re-bidding process.award process has been enjoined. While we believe our performance under the existing agreement and the experience we have gained in performing this contract position us well to renew the agreement, failure to renew the agreement or renewal on substantially less favorable terms could significantly harm our revenues and results of operations.given claim or incurshas agreed to an offset against future Medicare claims. Providersother claims by the provider. Healthcare providers have the right to appeal a claim and may pursue additional level of appeals if the initial appeal is found in favor of CMS. We accrue an estimated liability for appeals at the time revenue is recognized based on our estimate of the amount of commissions received which are subject to appeal and which we estimate arerevenue probable of being returned to providersCMS following successful appeal. appeal based on historical data and other trends relating to such appeals. In addition, if our estimate of liability for appeals with respect to revenues recognized during a prior period changes, we increase or decrease the estimated liability for appeals in the current period.Our estimatesResolution of appeals can take a very long time to resolve and there is a significant backlog in the system for resolving appeals, as over the course of our existing RAC contract, healthcare providers have increased their pursuit of appeals beyond the first and second levels of appeals to the third level of appeal, where cases are based onheard by administrative law judges, or ALJs. In our historical experience, withdecisions at the third level of appeal are the least favorable as ALJs exercise greater discretion and there is less predictability in the ALJ decisions as compared to appeals activity underat the first or second levels. This increase of ALJ appeals and backlog of claims at the third level of appeal is the primary reason our CMS contract since January 2010. Duringtotal estimated liability for appeals (consisting of the year endedestimated liability for appeals plus the contra-accounts-receivable estimated allowance for appeals) has grown from a balance of $5.6 million at December 31, 2012, we reserved an amount equal to 14%$16.4 million at December 31, 2013 to $18.6 million as of gross revenues from our CMS contract. We have increased ourDecember 31, 2014. The balance of the estimated liability for appeal in 2012 due to recent trends in our historical data related to the likelihood of successful appeals. Commencing on December 31, 2011,appeals was also increased because during 2014 we established a separate line itemobserved an increase in the current liabilities sectionpercentage of our balance sheet entitled “Estimated liability for appeals” to reflect our estimate of this liability. appeals that are being found in providers’ favor at the ALJ level.$4.4$18.6 million balance as of December 31, 2012,2014, represents our best estimate of the probable amount of losses related to appeals of claims for which commissions were previously collected. We estimate that it is reasonably possible that we could be required to pay up to an additional approximately $1.5$5.4 million as a result of potentially successful appeals. To the extent that required payments by us related to successful appeals exceed the amount accrued, revenues in the applicable period would be reduced by the amount of the excess. We similarly accrue an allowance against accounts receivable related to commissions yet to be collected, which was $1.2 million as of December 31, 2012, based on the same estimates used to establish the estimated liability for appeals of commissions received. Our inability to correctly estimate the estimated liabilities and allowance against accounts receivable could adversely affect our revenues in future periods.Specifically,determined usingmore likely than not to have occurred. If we can support the conclusion that it is more likely than not that the fair value of a reporting unit is greater than its carrying amount, then we would not need to perform the two-step impairment test. TheIf we cannot support such a conclusion, or we do not elect to perform the qualitative assessment, then the first step of the goodwill impairment test is used to identifybook value,carrying amount, including goodwill. If the fair value of the reporting unit exceeds its book value, goodwill is considered not impaired and the second step of the impairment test is unnecessary. If the book value of thereporting unit exceeds its fair value, the second step of the goodwill impairment test isThe Company performed to measure the amount of impairment loss, if any. The second step of the goodwill impairment test compares the implied fair value of the reporting unit’s goodwill with the book value of that goodwill. If the book value of the reporting unit’s goodwill exceeds the implied fair value of that goodwill, an impairment loss is recognized in an amount equal to that excess. The implied fair value of goodwill is determined in the same manner as the amount of goodwill recognized in a business combination. That is, the fair value of the reporting unit is allocated to all of the assets and liabilities of that unit as if the reporting unit had been acquired in a business combination and the fair value of the reporting unit was the purchase price paid to acquire the reporting unit. In September 2011, the Financial Accounting Standards Board, or FASB, issued Accounting Standards Update, or ASU, 2011-08,Intangibles—Goodwill and Other (Topic 350): Testing Goodwill for Impairment. This ASU permits an entity to make a qualitative assessment of whether it is more likely than not that a reporting unit’sgoodwill fair value is less than its carrying amount before applying the two-step goodwillfor 2014, 2013 and 2012 and concluded that there was no need to perform an impairment test. If an entity concludes it is not more likely than not that the fair value of a reporting unit is less than its carrying amount, it need not perform the two-step impairment test. The ASU permits early adoption, and based on our qualitative assessment we concluded that we are not required to perform the two-step impairment test at December 31, 2011 and December 31, 2012.2012, 20112014, 2013 or 2010.20122014 compared to the Year Ended December 31, 2011 Year Ended December 31, 2012 2011 $ Change % Change (in thousands) $ 210,073 $ 162,974 $ 47,099 29 % 83,002 67,082 15,920 24 % 71,305 49,199 22,106 45 % — 13,400 (13,400 ) -100 % 154,307 129,681 24,626 19 % 55,766 33,293 22,473 68 % (3,679 ) — (3,679 ) 0 % (12,414 ) (13,530 ) 1,116 -8 % 64 125 (61 ) -49 % 39,737 19,888 19,849 100 % 16,786 7,516 9,270 123 % $ 22,951 $ 12,372 $ 10,579 86 % 2,038 6,495 (4,457 ) -69 % $ 20,913 $ 5,877 $ 15,036 256 % Year Ended December 31, 2014 2013 $ Change % Change (in thousands) Consolidated Statements of Operations Data: Revenues $ 195,378 $ 255,302 $ (59,924 ) (23 )% Operating expenses: Salaries and benefits 93,676 96,762 (3,086 ) (3 )% Other operating expense 74,433 85,671 (11,238 ) (13 )% Total operating expenses 168,109 182,433 (14,324 ) (8 )% Income from operations 27,269 72,869 (45,600 ) (63 )% Interest expense (10,171 ) (11,564 ) 1,393 (12 )% Interest income 1 1 — — % Income before provision for income taxes 17,099 61,306 (44,207 ) (72 )% Provision for income taxes 7,699 24,967 (17,268 ) (69 )% Net income $ 9,400 $ 36,339 $ (26,939 ) (74 )% $210.1$195.4 million for the year ended December 31, 2012, an increase2014, a decrease of $47.1$59.9 million or 28.9%23%, compared to total revenues of $163.0$255.3 million for the year ended December 31, 2011. This increase2013. The decrease is due to a decline in revenues is primarily due to an increase of $33.2 million in revenues received from CMS underboth our RAC contract as a result of higher claim recovery volume and an increase of $4.8 million generated from a new default-aversion service contract that commenced in May 2012, for a new service offering we provide in other markets we serve. Revenues from student lending increased by 8.3% in 2012 to $132.4 million from $122.2 million in the prior year period.Salaries and BenefitsSalaries and benefits expense was $83.0healthcare markets.2012, an increase2014, representing a decrease of $15.9$25.4 million, or 23.7%16%, compared to the year ended December 31, 2013. This decrease was primarily due to lower rehabilitation fees paid to us by our guaranty agency clients a result of the reduction that guaranty agencies can charge borrowers due to the Federal budget act that became effective July 1,2014, and to new documentation requirements imposed by our guaranty agency clients as they implemented income-based repayment programs. The new documentation requirements require additional time and interaction with borrowers, which delayed some loans from qualifying for rehabilitation during 2014.$67.1$96.8 million for the year ended December 31, 2011. This increase is2013. The decrease in salaries and benefits expense was primarily due to hiring of new employees to provide services under our RAC contract with CMS, an increase in expenses associated with the engagement of additional software engineers to assist in the integration of a recently acquired software license and an increase in expenses associated with the hiring of additional administrative employees.$71.3$74.4 million for the year ended December 31, 2012, an increase2014, a decrease of $22.1$11.2 million, or 44.9%13%, compared to other operating expense of $49.2$85.7 million for the year ended December 31, 2011. This increase is2013. The decrease in other operating expenses was primarily due to (i) an additional $10 million of subcontractorlower third party collection fees incurred in connection with increased services provided underand lower communication and postage expense resulting from the RAC contract and MSA contracts and (ii) $1.3 million paid to an affiliate of Parthenon Capital Partners in connection with the termination of an advisory services agreement, and an additional $0.9 million paid to Parthenon Capital Partners at the closingwind-down of our initial public offering also as a result of the termination of the advisory agreement.Impairment of Trade NameWe did not recognize an impairment expense for intangible assets in 2012. In 2011, we recorded $13.4 million of impairment expense to write off the carrying value of our former trade name, Diversified Collection Services Inc., due to our decision to retire that trade name. Year Ended December 31, 2013 2012 $ Change % Change (in thousands) Consolidated Statement of Operations Data: Revenues $ 255,302 $ 210,073 $ 45,229 22 % Operating expenses: Salaries and benefits 96,762 83,002 13,760 17 % Other operating expense 85,671 71,305 14,366 20 % Total operating expenses 182,433 154,307 28,126 18 % Income from operations 72,869 55,766 17,103 31 % Debt extinguishment costs — (3,679 ) 3,679 (100 )% Interest expense (11,564 ) (12,414 ) 850 (7 )% Interest income 1 64 (63 ) (98 )% Income before provision for income taxes 61,306 39,737 21,569 54 % Provision for income taxes 24,967 16,786 8,181 49 % Net income 36,339 22,951 13,388 58 % Accrual for preferred stock dividends — 2,038 (2,038 ) (100 )% Net income available to common shareholders $ 36,339 $ 20,913 $ 15,426 74 % compared to $33.3representing an increase of $17.1 million, or 31%.30, 2011, representing an increase of $22.5 million, or 67.5%.Debt Extinguishment CostsAs a result of the entry into our new credit facility and the repayment of all amounts owed under our then existing credit facility in31, 2013. In March 2012, we incurred debt extinguishment costs of $3.7 million comprised of approximately $3.3 million in fees paid to the lenders in connection with oura new credit facility and approximately $0.3facility.of unamortized debt issuance costs associated with our old credit facility. We did not incur a similar expense infor the year ended December 31, 2011.Interest ExpenseInterest expense was2013, compared to $12.4 million for the year ended December 31, 2012, comparedrepresenting a decrease of 7%. Interest expense decreased due to $13.5repayments of principal under our credit agreement, resulting in a lower outstanding balance during 2013.2011, representing a decrease of 8.2% due to lower interest rates under the new credit agreement as2013 compared to the interest rates under our old credit agreement.Income TaxesIncome tax expense was $16.8 million for the year ended December 31, 2012, compared to $7.5 million for the year ended December 31, 2011, representing an increase of 123.3%48.7% consistent with the increase in income before provision for income taxes. Our effective income tax rate increaseddecreased to 40.7% for the year ended December 31, 2013 from 42.2% for the year ended December 31, 2012 from 37.8% for2012. The decrease in the year ended December 31, 2011.Approximately 2.5%effective tax rate is the result of the increase results fromapproximately 0.7% decrease due to changes in the state tax rate, which includeand approximately 1% decrease due to income tax benefits associated with increases in stock options exercises as a 2011 one-time benefit from a change in California tax lawresult of 2.3%. In addition, approximately 1.9%two follow on offerings during the year, and the end of the lock-up periods for certain employees. These decreases were offset by approximately a 1.7% increase wasas a result of the non-deductible expenses associated with the follow on offerings. The 2012 effective tax rate includes a one-time tax expense due to the non-deductible termination of an advisory services agreement in 2012.2012, which represented an increase of $10.6 million compared to net income of $12.4 million for the year ended December 31, 2011.Year Ended December 31, 2011 compared to the Year Ended December 31, 2010The following table presents our historical operating results for the periods presented: Year Ended December 31, 2011 2010 $ Change % Change (in thousands) $ 162,974 $ 123,519 $ 39,455 32 % 67,082 58,113 8,969 15 % 49,199 33,655 15,544 46 % 13,400 — 13,400 0 % 129,681 91,768 37,913 41 % 33,293 31,751 1,542 5 % (13,530 ) (15,230 ) 1,700 -11 % 125 118 7 6 % 19,888 16,639 3,249 20 % 7,516 6,664 852 13 % $ 12,372 $ 9,975 2,397 24 % RevenuesTotal revenues were $163.0 million for the year ended December 31, 2011, an increase of $39.5 million, or 31.9%, compared to total revenues of $123.5 million for the year ended December 31, 2010. Of this increase, $19.7 million is attributable to increased recovery activity on our RAC contract with CMS and reflects the first full-year of our recovery activity related to this contract. The remaining increase was primarily a result of an increase in revenues from our student lending markets, due largely to an approximately 17.9% increase in placement volume from 2010 to 2011.Salaries and BenefitsSalaries and benefits was $67.1 million for the year ended December 31, 2011, an increase of $9.0 million, or 15.4%, compared to salaries and benefits expense of $58.1 million for the year ended December 31, 2010. This increase is primarily due to an increase in employee headcount associated with hiring to staff our operations under the RAC contract. Our employee headcount was 1,280 as of December 31, 2011, an increase of 160, or 14.3%, over the employee headcount of 1,120 as of December 31, 2010.Other Operating ExpenseOther operating expense was $49.2 million for the year ended December 31, 2011, an increase of $15.5 million, or 46.2%, compared to other operating expense of $33.7 million for the year ended December 31, 2010. This increase is primarily due to the use of subcontractors as we expand our operations in our healthcare market to help address the new and significant claims activity, along with increases in payments to healthcare providers for the transfer of medical records as required under the RAC contract. In addition, we recorded a $1.2 million expense in 2011 related to a legal settlement that was paid out in the first quarter of 2012.Income From OperationsAs a result of the factors described above, income from operations was $33.3 million, for the year ended December 31, 2011, as compared to $31.8 million for the year ended December 31, 2010. This reflects an expense of $13.4 million related to impairment expenses to write off the carrying amount of the trade name intangible assets due to the retirement of a former trade name. Income from operations excluding this expense totaled $46.7 million for the year ended December 31, 2011, which represents an increase of $14.9 million, or 47.1%, as compared to income from operations for the year ended December 31, 2010.Interest ExpenseInterest expense was $13.5 million for the year ended December 31, 2011, a decrease of $1.7 million from $15.2 million for the year ended December 31, 2010. The reduction in interest expense is due primarily to lower notes payable balances resulting from principal repayments.Income TaxesIncome tax expense of $7.5 million for the year ended December 31, 2011, represented an effective tax rate of 37.8% of income before provision for income tax. Income tax expense of $6.7 million was recorded for the year ended December 31, 2010, and represented an effective tax rate of 40%.Net IncomeAs a result of the factors described above, net income was $12.4 million for the year ended December 31, 2011, which represented an increase of $2.4 million over net income of $10.0 million for the year ended December 31, 2010. Excluding the impairment expenses to write off the carrying amount of the trade name, net income would have been $20.7 million for the year ended December 31, 2011.$37.8$80.3 million as of December 31, 2012,2014, consist primarily of cash on deposit with banks. We expect that operating cash flows will continue to be a primary source of liquidity for our operating needs. There are currently no borrowings outstanding under our revolving credit facility other than a $1.4$2.0 million letterletters of credit. Due to our operating cash flows, and our existing cash and cash equivalents, and availability under our revolving credit facility, we believe that we have the ability to meet our working capital and capital expenditure needs for the foreseeable future.2012, 20112014, 2013 and 2010: Year Ended
December 31, 2012 2011 2010 (in thousands) $ 37,005 $ 28,985 $ 18,214 (12,193 ) (6,111 ) (4,921 ) (6,973 ) (13,948 ) (11,139 ) Year Ended December 31, 2014 2013 2012 (in thousands) Net cash provided by operating activities $ 27,866 $ 61,206 $ 37,005 Net cash used in investing activities (10,146 ) (12,503 ) (12,193 ) Net cash used in financing activities (19,331 ) (4,637 ) (6,973 ) higher claim recovery volumesthe increase of appeals brought by healthcare providers and the overall backlog of claims subject to appeals under our RAC contract with CMS.We generated $29.0 million of cash from operating activities during the year ended December 31, 2011, primarily resulting from our net income of $12.4 million, non-cash depreciation and amortization of $7.8 million, an impairment expense to write off the carrying amount of the trade name intangible asset due to the retirement of the Diversified Collection Services, Inc. trade name of $13.4 million and changes in operating assets and liabilities of $3.8 million, offset by non-cash deferred income taxes of $9.6 million.We generated $18.2 million of cash from operating activities during the year ended December 31, 2010, primarily resulting from our net income of $10.0 million, non-cash depreciation, amortization and impairment of intangible assets of $7.2 million and interest expense from debt issuance costs of $2.0 million, partially offset by non-cash changes in operating assets and liabilities of $1.5 million. We used $6.1 million and $4.9 million of cash in investing activities for the purchase of property, equipment and leasehold improvements during the years ended December 31, 2011 and 2010, primarily for investments in information technology systems and infrastructure to support increased business volumes.costs.We used $13.9costs.of cash in financing activitiesand $12.1 million for the repaymentEstimated liability for appeals and the Net payable to client, respectively, represent obligations that we expect to pay in the near term, although it is difficult to predict the precise timing of notes payable during the year ended December 31, 2011. We used $11.1 millionassociated cash outflows as they are dependent on the processing and resolution of cash in financing activities during the year ended December 31, 2010, comprised of $10.0 million used for the repayment of notes payable and $1.2 million used for debt issuance costs., and (iii) a $11.0 million revolving credit facility that expires in March 2017, which had a borrowing capacity of $9.6 million as of December 31, 2012.2017. On June 28, 2012, we increasedamended the credit agreement to increase the amount of our borrowings under our term B loan by $19.5 million. We may also requestOn November 4, 2014, we further amended the lenderscredit agreement to increase the sizemodify a number of the term B loan or other term loans by up to an additional $10.5 million at any time prior to March 19, 2014.(c)(B) the difference between the then effective applicable margins for LIBOR loans and base rate loans and (d) 2.5% or (ii) a London Interbank Offered Rate, or Libor,LIBOR rate determined by reference to the highest of (a) a LiborLIBOR rate published in Reuters or another national publication and (b) 1.5%. The term A loan and the revolving credit facility currently have an applicable margin of 4.25% for base rate loans and 5.25% for LiborLIBOR rate loans.loans, in each case based on a total debt to EBITDA ratio of less than 4.00 to 1.00. The term B loan (including the incremental term B loan) currently has an applicable margin of 4.75% for base rate loans and 5.75% for LiborLIBOR rate loans.loans, in each case based on a total debt to EBITDA ratio of less than 4.00 to 1.00. The minimum per annum interest rate that we are required to pay is 6.75% for the term A loan and revolving credit facility and 7.25% for the term B loan. Interest is due at the end of each month for base rate loans and at the end of each LiborLIBOR period for LiborLIBOR rate loans unless the LiborLIBOR period is greater than 3 months, in which case interest is due at the last day of each 3-month interval of such LiborLIBOR period.We appliedWith respect to (ii) above, the proceeds from our initial public offeringCompany made a pro rata prepayment of approximately $11.5 million to our cash balances.merge;and(ii) a total debt to EBITDA ratio, (iii) an interest coverage ratio, (iv) a minimum EBITDA amount,(v) a minimum required adjusted cash amount, and (vi) maximum capital expenditures, as such terms are defined in our credit agreement. These financial covenants are tested at the end of each year, quarter beginning on December 31, 2012.or month, as applicable. The table below further describes these financial covenants, as well as our current status under these covenants as of December 31, 2012.Financial CovenantCovenantRequirementActual Ratio atDecember 31, 2012Fixed charge coverage ratio (minimum)1.20 to 1.01.93Total debt to EBITDA ratio (maximum)3.25 to 1.02.11Financial Covenant Fixed charge coverage ratio (minimum)* 1.20 to 1.0 1.38 Total debt to EBITDA ratio (maximum)* 3.25 to 1.0 2.33 Interest coverage ratio (minimum)** 2.25 to 1.0 5.35 EBITDA (minimum)** $20,000,000 $48,052,000 Required Adjusted Cash Amount (minimum)*** $35,000,000 $59,313,000 Capital Expenditures **** $12,500,000 $10,146,000 2012: Payments Due by Period Contractual Obligations Total Less
Than
1 Year 1-3
Years 3-5
Years More
Than
5 Years $ 147,769 $ 11,040 $ 22,080 $ 21,293 $ 93,356 45,785 10,446 18,611 15,255 1,473 6,754 1,740 3,178 1,771 65 3,698 3,650 48 — — $ 204,006 $ 26,876 $ 43,917 $ 38,319 $ 94,894 Payments Due by Period Contractual Obligations Total Long-Term Debt Obligations $ 111,795 $ 9,820 $ 18,939 $ 83,036 $ — Interest Payments 22,263 7,723 13,254 1,286 — Operating Lease Obligations 7,797 2,290 3,423 1,269 815 Purchase Obligations 7,423 7,423 — — — Total $ 149,278 $ 27,256 $ 35,616 $ 85,591 $ 815 (1) We entered into our new credit agreement on March 19, 2012 and amended it on June 28, 2012, with all outstanding indebtedness under our prior loan facility paid in full. Long-term debt obligations and interest payments presented in this table relate solely to our new credit agreement, as amended. 2012, 20112014, 2013 and 20102012 to actual net income for these periods: Year Ended December 31, 2012 2011 2010 (in thousands) $ 22,951 $ 12,372 $ 9,975 16,786 7,516 6,664 12,414 13,530 15,230 (64 ) (125 ) (118 ) 3,679 — — 9,505 7,766 7,213 — 13,400 — 47 2,548 1,108 2,641 634 759 1,614 120 629 $ 69,573 $ 57,761 $ 41,460 Year Ended December 31, 2012 2011 2010 (in thousands) $ 22,951 $ 12,372 $ 9,975 3,679 — — — 13,400 — 47 2,548 1,108 2,641 634 759 1,614 120 629 3,676 3,043 3,043 1,161 1,254 1,997 (5,126 ) (8,400 ) (3,014 ) $ 30,643 $ 24,971 $ 14,497 Year Ended December 31, 2014 2013 2012 (in thousands) Reconciliation of Adjusted EBITDA: Net income $ 9,400 $ 36,339 $ 22,951 Provision for income taxes 7,699 24,967 16,786 Interest expense 10,171 11,564 12,414 Interest income (1 ) (1 ) (64 ) — — 3,679 1,276 2,893 — Depreciation and amortization 12,450 10,655 9,505 — — 47 — — 2,641 Stock based compensation 3,707 2,994 1,614 Adjusted EBITDA $ 44,702 $ 89,411 $ 69,573 Year Ended December 31, 2014 2013 2012 (in thousands) Reconciliation of Adjusted Net Income: Net income $ 9,400 $ 36,339 $ 22,951 — — 3,679 1,276 2,893 — — — 47 — — 2,641 Stock based compensation 3,707 2,994 1,614 3,737 3,731 3,676 1,055 1,125 1,161 (3,910 ) (4,297 ) (5,126 ) Adjusted net income $ 15,265 $ 42,785 $ 30,643 (1) Represents debt extinguishment costs comprised of approximately $3.3 million of fees paid to lenders in connection with our new credit facility and approximately $0.3 million of unamortized debt issuance costs in connection with our old credit facility. (2) Represents impairmentdirect and incremental costs associated with the Company's secondary offerings in February and April 2013, and expenses to write off the carrying amount of the trade name intangible asset due to the plan to retire the Diversified Collection Services, Inc. trade name.incurred in 2014 for potential acquisition and related financing.(3) Represents professional fees and settlement costs related to strategic corporate development activities and a $1.2 million legal settlement in 2011.activities.(4) Represents expenses incurred under an advisory services agreement with Parthenon Capital Partners, which was terminated in April 2012.2012 and the August 2012 expense of $0.9 million associated with a payment to a financial advisor as part of the Company's initial public offering. See Note 11 “Related"Related Party Transactions.”"(5)Represents amortization of capitalized expenses related to the acquisition of Performant by an affiliate of Parthenon Capital Partners in 2004 and an acquisition in the first quarter of 2012 to enhance our analytics capabilities.(6)Represents amortization of capitalized financing costs related to debt offerings conducted in 2009, 2010 and 2012.(7)Represents tax adjustments assuming a marginal tax rate of 40%.Off-Balance Sheet ArrangementsWe have no off-balance sheet arrangements.UnderJOBS Act, emerging growth companies can delay adoptingFASB ASC by creating a new or revised accounting standards until such time as those standards apply to private companies. However, we do not intend to elect to take advantage of this extended transition period providedTopic 606, Revenue from Contracts with Customers. The new guidance will supersede the revenue recognition requirements in Section 7(a)(2)(B)Topic 605, Revenue Recognition, and most industry-specific guidance on revenue recognition throughout the Industry Topics of the Securities Act as allowed by Section 107(b)(1)Codification. The core principle of the JOBS Act.In December 2011, FASB issued ASU No. 2011-11,Balance Sheet (Topic 210): Disclosures about Offsetting Assets and Liabilities. ASU 2011-11 requiresguidance is that an entity should recognize revenue to depict the transfer of promised goods or services to customers in an amount that reflects the consideration to which the entity expects to be entitled in exchange for those goods or services. To achieve that core principle, an entity should apply the following steps:information about offsettingsufficient qualitative and related arrangementsquantitative information to enable users of financial statements to understand the effectnature, amount, timing and uncertainty of those arrangements on its financial position,revenue and to allow investors to better compare financial statements prepared under GAAPcash flows arising from contracts with financial statements prepared under International Financial Reporting Standards (IFRS).customers. The new standardsamendments in this ASU are effective for annual periods beginning January 1, 2013, and interim periods within those annual periods. Retrospective application is required. We have implemented the provisions of ASU 2011-11 as of January 1, 2013. We do not believe our adoption of the new guidance will have an impact on our consolidated financial statements.In June 2011, the FASB issued ASU 2011-05,Comprehensive Income (Topic 220): Presentation of Comprehensive Income. Under this ASU, an entity will have the option to present the components of net income and comprehensive income in either one or two consecutive financial statements. The ASU eliminates the option in GAAP to present other comprehensive income in the statement of changes in equity. An entity should apply the ASU retrospectively. For a nonpublic entity, the ASU is effective for fiscal years ending after December 15, 2012, and interim and annual periods thereafter. Early adoption is permitted. In December 2011, the FASB decided to defer the effective date of those changes in ASU 2011-05 that relate only to the presentation of reclassification adjustments in the statement of income by issuing ASU 2011-12,Comprehensive Income (Topic 220): Deferral of the Effective Date for Amendments to the Presentation of Reclassifications of Items Out of Accumulated Other Comprehensive income in Accounting Standards Update 2011-05. We adopted this new guidance with no impact to our consolidated financial statements.In May 2011, the FASB issued ASU 2011-04,Fair Value Measurement (Topic 820): Amendments to Achieve Common Fair Value Measurement and Disclosure Requirements in U.S. GAAP and IFRS. The new standards do not extend the use of fair value but, rather, provide guidance about how fair value should be applied where it already is required or permitted under IFRS or GAAP. For GAAP, most of the changes are clarifications of existing guidance or wording changes to align with IFRS. A nonpublic entity is required to apply the ASU prospectively for annualreporting periods beginning after December 15, 2011.2016, including interim periods within that reporting period. Early adoption is not permitted. This amendment is to be either retrospectively adopted to each prior reporting period presented or retrospectively with the cumulative effect of initially applying this ASU recognized at the date of initial application. We adoptedare currently evaluating the impact of the adoption of this new guidance with no impact to our consolidated financial statements.$1.5$1.1 million. In July 2012, we entered into an interest rate cap agreement per the terms of our senior secured credit agreement. The interest rate cap agreement is effective beginning in October 2012, and matures in October 2014, with a total notional amount of $75 million and a cap on LIBOR at 2.0%. If the LIBOR rate were to increase by 100 basis points (1.0%) above the credit facility floor of 1.5% for a year, we would receive a payment from the interest rate cap of approximately $0.4 million.ITEM 8.Financial Statements and Supplementary DataITEM 9.Changes in and Disagreements with Accountants on Accounting and Financial DisclosureNone.ITEM 9A.Controls and Procedures2012.2012.2014. Management based its assessment on criteria established in “Internal Control Integrated Framework” issued by the Committee of Sponsoring Organizations of the Treadway Commission (“COSO”). Based on this evaluation, management concluded that its internal control over financial reporting was effective as of December 31, 2012.quarteryear ended December 31, 2012,2014, that has materially affected, or is reasonably likely to materially affect, our internal control over financial reporting, other than those noted above.ITEM 12.Security Ownership of Certain Beneficial Owners and Management and Related Stockholder MattersITEM 13.Certain Relationships and Related Transactions, and Director IndependenceITEM 14.Principal Accounting Fees and ServicesITEM 15.Exhibits, Financial Statement SchedulesExhibitNumberDescription 3.1Description 2.1 Agreement and Plan of Merger, dated as of January 28, 2015, by and among Performant Financial Corporation. Project Phoenix Merger Sub, Inc. Premier Healthcare Exchange, Inc. and the other parties thereto (incorporated by reference to Exhibit 2.1 to the Company's Current Report on Form 8-K filed January 29, 2015) 3.1 Restated Certificate of Incorporation of Registrant (incorporated by reference to Exhibit 3.1(b) to the Company’s Registration Statement on Form S-1/A filed July 23,30, 2012)3.2 Amended and Restated Bylaws of Registrant (incorporated by reference to Exhibit 3.2(b) to the Company’s Registration Statement on Form S-1/A filed July 23, 2012) 4.2 Amended and Restated Registration Rights Agreement, dated as of August 15, 2012, among the Registrant and the persons listed thereon (incorporated by reference to Exhibit 4.2 to the Company’s Registration Statement on Form S-1/A filed July 23, 2012) 10.1 Form of Indemnification Agreement between the Registrant and its officers and directors (incorporated by reference to Exhibit 10.1 to the Company’s Registration Statement on Form S-1/A filed July 30, 2012) 10.2 2004 Equity Incentive Plan and form of agreements thereunder (incorporated by reference to Exhibit 10.2 to the Company’s Registration Statement on Form S-1 filed July 3, 2012) 10.3 2004 DCS Holdings Stock Option Plan and form of agreements thereunder (incorporated by reference to Exhibit 10.3 to the Company’s Registration Statement on Form S-1 filed July 3, 2012) 10.4 2007 Stock Option Plan and form of agreements thereunder (incorporated by reference to Exhibit 10.4 to the Company’s Registration Statement on Form S-1 filed July 3,23, 2012)10.5 Recovery Audit Contractor contract by and between Diversified Collection Services, Inc. and Center for Medicare and Medicaid Services dated as of October 3, 2008, as amended (incorporated by reference to Exhibit 10.5 to the Company’s Registration Statement on Form S-1/A filed July 23, 2012) 10.6 Credit Agreement, dated as of March 19, 2012, by and among DCS Business Services, Inc., the Lenders party Hereto, Madison Capital Funding LLC, and ING Capital (incorporated by reference to Exhibit 10.6 to the Company’s Registration Statement on Form S-1/A filed July 23, 2012) 10.7 Form of Change of Control Agreement, as amended (incorporated by reference to Exhibit 10.7 to the Company’s Registration Statement on Form S-1/A filed July 30, 2012) 10.8 Employment Agreement between the Registrant and Lisa Im, dated as of April 15, 2012, as amended (incorporated by reference to Exhibit 10.8 to the Company’s Registration Statement on Form S-1/A filed July 23, 2012) 10.9 Employment Agreement between the Registrant and Jon D. Shaver dated as of March 31, 2003, as amended (incorporated by reference to Exhibit 10.9 to the Company’s Registration Statement on Form S-1/A filed July 23, 2012) 10.10 Repurchase Agreement between the Registrant and Lisa C. Im dated as of July 3, 2012 (incorporated by reference to Exhibit 10.10 to the Company’s Registration Statement on Form S-1 filed July 3, 2012) 10.11 Repurchase Agreement between the Registrant and Jon D. Shaver dated as of July 3, 2012 (incorporated by reference to Exhibit 10.11 to the Company’s Registration Statement on Form S-1 filed July 3, 2012) ExhibitNumber Description10.12 Director Nomination Agreement between the Registrant and Parthenon DCS Holdings, LLC dated as of July 20, 2012 (incorporated by reference to Exhibit 10.12 to the Company’s Registration Statement on Form S-1/A filed July 23, 2012) 10.13 Advisory Services Agreement between Diversified Collection Services, Inc. and Parthenon Capital, LLC dated as of January 8, 2004, as amended (incorporated by reference to Exhibit 10.13 to the Company’s Registration Statement on Form S-1/A filed July 23, 2012) 10.14Exhibit
NumberDescription 10.14 Termination of the Advisory Services Agreement between Diversified Collection Services, Inc. and Parthenon Capital, LLC dated as of January 8, 2004, as amended, dated as of April 13, 2012 (incorporated by reference to Exhibit 10.14 to the Company’s Registration Statement on Form S-1/A filed July 23, 2012) 10.15 2012 Stock Incentive PlanPlan*10.16 Amendment No. 1 to Credit Agreement dated as of March 19, 2012, by and among DCS Business Services, Inc., the Lenders party thereto, Madison Capital Funding LLC,and ING Capital* 10.17 Amendment No. 2 Credit Agreement, dated as of November 4 2014, by and among Performant Business Services, Inc., the Lenders party thereto, and Madison Capital Funding LLC. (incorporated by reference to Exhibit 10.1510.1 to the Company’s Registration StatementCompany's Quarterly Report on Form S-1/A10-Q filed July 23, 2012)November 10, 2014)21 List of Subsidiaries 23 Consent of KPMG LLP, Independent Registered Public Accounting Firm 24 Powers of Attorney (included in the signature page to this report) 31.1 Rule 13a-14(a)/15d-14(a) Certification, executed by Lisa C. Im 31.2 Rule 13a-14(a)/15d-14(a) Certification, executed by Hakan L. Orvell 32.1 Furnished Statement of the Chief Executive Officer under 18 U.S.C. Section 1350 32.2 Furnished Statement of the Chief Financial Officer under 18 U.S.C. Section 1350 101.INS XBRL Instance Document 101.SCH XBRL Taxonomy Extension Scheme 101.CAL XBRL Taxonomy Extension Calculation Linkbase 101.DEF XBRL Taxonomy Extension Definition Linkbase Document 101.LAB XBRL Taxonomy Extension Label Linkbase 101.PRE XBRL Taxonomy Extension Presentation Linkbase Page 2012, 20112014, 2013 and 2010 F-2 F-3 F-4 F-5 F-6 Corporation20122014 and 2011, and2013, the related consolidated statements of operations, changes in redeemable preferred stock and stockholders’ equity (deficit), and cash flows for each of the years in the three‑year period ended December 31, 2014, and the related Schedule II for the three-year period ended December 31, 2012.2014. These consolidated financial statements are the responsibility of the Company’s management. Our responsibility is to express an opinion on these consolidated financial statements based on our audits.20122014 and 2011,2013, and the results of their operations and their cash flows for each of the years in the three-yearthree‑year period ended December 31, 2012,2014, in conformity with U.S. generally accepted accounting principles.21, 2013Assets December 31,
2012 December 31,
2011 $ 37,843 $ 20,004 23,044 19,398 3,798 5,348 2,876 3,292 1,125 595 68,686 48,637 20,669 14,915 36,244 36,516 81,572 81,572 3,844 — 730 659 $ 211,745 $ 182,299 $ 11,040 $ 8,134 9,288 7,138 1,403 60 8,252 8,475 430 470 2,187 2,214 4,378 450 36,978 26,941 136,729 87,051 — 8,198 — 1,761 11,271 14,647 2,694 1,158 187,672 139,756 — 58,248 — (2,266 ) 4 4 35,970 19,371 (11,901 ) (32,814 ) 24,073 (15,705 ) $ 211,745 $ 182,299 Assets December 31,
2014 December 31,
2013Current assets: Cash and cash equivalents $ 80,298 $ 81,909 Trade accounts receivable, net of allowance for doubtful accounts of $32 and $32, respectively and estimated allowance for appeals of $0 and $1,160, respectively 15,047 19,649 Deferred income taxes 7,605 6,847 Prepaid expenses and other current assets 12,559 4,400 Income tax receivable 4,394 — Debt issuance costs, current portion 986 1,055 Total current assets 120,889 113,860 Property, equipment, and leasehold improvements, net 27,647 26,247 Identifiable intangible assets, net 29,093 32,513 Goodwill 82,522 81,572 Debt issuance costs, net of current portion 2,456 2,789 Other assets 222 279 Total assets $ 262,829 $ 257,260 Liabilities and Stockholders’ Equity Current liabilities: Current maturities of notes payable $ 9,820 $ 10,763 Accrued salaries and benefits 5,380 11,826 Accounts payable 1,370 2,383 Other current liabilities 8,452 5,311 Income taxes payable — 103 Estimated liability for appeals 18,625 15,283 Net payable to client 12,110 — Total current liabilities 55,757 45,669 Notes payable, net of current portion 101,975 122,541 Deferred income taxes 11,666 12,612 Other liabilities 2,259 2,204 Total liabilities 171,657 183,026 Commitments and contingencies Stockholders’ equity: Common stock, $0.0001 par value. Authorized, 500,000 shares at December 31, 2014 and 2013, respectively; issued and outstanding, 49,350 and 48,316 shares at December 31, 2014 and 2013, respectively 5 5 Additional paid-in capital 57,329 49,791 Retained earnings 33,838 24,438 Total stockholders’ equity 91,172 74,234 Total liabilities and stockholders’ equity $ 262,829 $ 257,260 For the Years Ended December 31, 2012 2011 2010 $ 210,073 $ 162,974 $ 123,519 83,002 67,082 58,113 71,305 49,199 33,655 — 13,400 — 154,307 129,681 91,768 55,766 33,293 31,751 (3,679 ) — — (12,414 ) (13,530 ) (15,230 ) 64 125 118 39,737 19,888 16,639 16,786 7,516 6,664 $ 22,951 $ 12,372 $ 9,975 2,038 6,495 5,771 $ 20,913 $ 5,877 $ 4,204 $ 0.48 $ 0.14 $ 0.10 $ 0.44 $ 0.13 $ 0.09 43,985 42,962 42,962 47,599 45,742 45,019 For the Years Ended December 31, 2014 2013 2012 Revenues $ 195,378 $ 255,302 $ 210,073 Operating expenses: Salaries and benefits 93,676 96,762 83,002 Other operating expenses 74,433 85,671 71,305 Total operating expenses 168,109 182,433 154,307 Income from operations 27,269 72,869 55,766 Debt extinguishment costs — — (3,679 ) Interest expense (10,171 ) (11,564 ) (12,414 ) Interest income 1 1 64 Income before provision for income taxes 17,099 61,306 39,737 Provision for income taxes 7,699 24,967 16,786 Net income $ 9,400 $ 36,339 $ 22,951 Accrual for preferred stock dividends — — 2,038 Net income available to common shareholders $ 9,400 $ 36,339 $ 20,913 Net income per share attributable to common shareholders (see Note 1) Basic $ 0.19 $ 0.77 $ 0.48 Diluted $ 0.19 $ 0.74 $ 0.44 Weighted average shares (see Note 1) Basic 48,816 47,492 43,985 Diluted 49,834 49,386 47,599 2012, 20112014, 2013 and 2010 Redeemable Preferred Stock
Series A
Convertible Preferred Stock Due From
Stockholders Common Stock Additional
Paid-In
Capital Accumulated
Deficit Total Shares Amount Shares Amount 5,296 $ 45,982 $ (2,161 ) 37,667 $ 4 $ 18,728 $ (42,895 ) $ (26,324 ) — 5,771 — — — — (5,771 ) (5,771 ) — — (103 ) — — — — (103 ) — — 106 — — 523 — 629 — — — — — — 9,975 9,975 5,296 51,753 (2,158 ) 37,667 4 19,251 (38,691 ) (21,594 ) — 6,495 — — — — (6,495 ) (6,495 ) — — (108 ) — — — — (108 ) — — — — — 120 — 120 — — — — — — 12,372 12,372 5,296 58,248 (2,266 ) 37,667 4 19,371 (32,814 ) (15,705 ) — 2,038 — — — — (2,038 ) (2,038 ) — (60,286 ) — — — — — — (5,296 ) — — 5,296 — — — — — — — 284 — 175 — 175 — — — 2,243 — 15,420 — 15,420 — — — (98 ) — (1,225 ) — (1,225 ) — — (57 ) — — — — (57 ) — — 2,323 — — — — 2,323 — — — — — 1,614 — 1,614 — — — — — 615 — 615 — — — — — — 22,951 22,951 — $ — $ — 45,392 $ 4 $ 35,970 $ (11,901 ) $ 24,073 Common Stock Retained Earnings (Deficit) Total Shares Amount Shares Amount Balance, December 31, 2011 5,296 $ 58,248 $ (2,266 ) 37,667 $ 4 $ 19,371 $ (32,814 ) $ (15,705 ) Increase in redemption value of Series A preferred stock — 2,038 — — — — (2,038 ) (2,038 ) Conversion of Series A preferred stock to Series B preferred stock which was immediately redeemed for cash — (60,286 ) — — — — — — Conversion of Series B preferred stock to common (5,296 ) — — 5,296 — — — — Exercise of stock options — — — 284 — 175 — 175 Issuance of stock — — — 2,243 — 15,420 — 15,420 Purchase of treasury stock — — — (98 ) — (1,225 ) — (1,225 ) Interest on notes receivable from stockholders — — (57 ) — — — — (57 ) Repayment of notes receivable from stockholders — — 2,323 — — — — 2,323 Stock-based compensation expense — — — — — 1,614 — 1,614 Income tax benefit from employee stock options — — — — — 615 — 615 Net income — — — — — — 22,951 22,951 Balance, December 31, 2012 — — — 45,392 4 35,970 (11,901 ) 24,073 Exercise of stock options — — — 2,924 1 1,767 — 1,768 Stock-based compensation expense — — — — — 2,994 — 2,994 Income tax benefit from employee stock options — — — — — 9,060 — 9,060 Net income — — — — — — 36,339 36,339 Balance, December 31, 2013 — — — 48,316 5 49,791 24,438 74,234 Exercise of stock options — — — 1,034 — 610 — 610 Stock-based compensation expense — — — — — 3,707 — 3,707 Income tax benefit from employee stock options — — — — — 3,221 — 3,221 Net income — — — — — — 9,400 9,400 Balance, December 31, 2014 — $ — $ — 49,350 $ 5 $ 57,329 $ 33,838 $ 91,172 For the Years Ended December 31, 2012 2011 2010 $ 22,951 $ 12,372 $ 9,975 51 — — — 13,400 — 9,505 7,766 7,213 335 — — (1,826 ) (9,640 ) 32 1,614 120 629 1,272 1,254 1,997 (57 ) (108 ) (103 ) (3,646 ) (5,392 ) 1,610 416 (94 ) (664 ) (71 ) 372 (394 ) 2,150 2,542 (69 ) 1,343 (3 ) (255 ) (1,223 ) 4,714 (1,882 ) (40 ) 470 — (27 ) 2,214 — 3,928 450 — 330 (1,452 ) 125 37,005 28,985 18,214 (11,356 ) (6,111 ) (4,921 ) (837 ) — — (12,193 ) (6,111 ) (4,921 ) 156,000 — — 4,500 — — (60,286 ) — — (103,416 ) (13,948 ) (9,967 ) (12,698 ) — — (3,074 ) — (1,172 ) 175 — — 12,624 — — 2,323 — — 615 — — (1,761 ) — — (1,225 ) — — (750 ) — — (6,973 ) (13,948 ) (11,139 ) 17,839 8,926 2,154 20,004 11,078 8,924 $ 37,843 $ 20,004 $ 11,078 $ 18,037 $ 15,830 $ 6,209 $ 11,178 $ 12,246 $ 13,048 $ 3,344 $ — $ — $ 3,250 $ — $ — $ 2,796 $ — $ — For the Years Ended December 31, 2014 2013 2012 Cash flows from operating activities: Net income $ 9,400 $ 36,339 $ 22,951 Adjustments to reconcile net income to net cash provided by operating activities: Loss on disposal of assets 33 1 51 Depreciation and amortization 12,450 10,655 9,505 Write-off of unamortized debt issuance costs — — 335 Deferred income taxes (1,703 ) (1,708 ) (1,826 ) Stock-based compensation 3,707 2,994 1,614 Interest expense from debt issuance costs and amortization of discount note payable 1,177 1,247 1,272 Interest income on notes receivable from stockholders — — (57 ) Changes in operating assets and liabilities: Trade accounts receivable 4,602 3,395 (3,646 ) Prepaid expenses and other current assets (8,159 ) (1,524 ) 416 Income tax receivable (4,394 ) — — Other assets 57 451 (71 ) Accrued salaries and benefits (6,446 ) 2,538 2,150 Accounts payable (1,013 ) 980 1,343 Other current liabilities 1,873 (2,941 ) (1,223 ) Income taxes payable (103 ) (327 ) (40 ) Deferred revenue — (2,187 ) (27 ) Estimated liability for appeals 3,342 10,905 3,928 Net payable to client 12,110 — — Other liabilities 933 388 330 Net cash provided by operating activities 27,866 61,206 37,005 Cash flows from investing activities: Purchase of property, equipment, and leasehold improvements (10,146 ) (12,503 ) (11,356 ) Purchase of perpetual software license and computer equipment — — (837 ) Net cash used in investing activities (10,146 ) (12,503 ) (12,193 ) Cash flows from financing activities: Borrowing under notes payable — — 156,000 Borrowing under line of credit — — 4,500 Redemption of preferred stock — — (60,286 ) Repayment of notes payable (21,509 ) (14,465 ) (103,416 ) Repayment of line of credit — — (12,698 ) Debt issuance costs paid (653 ) — (3,074 ) Proceeds from exercise of stock options 610 1,768 175 Proceeds from issuance of stock — — 12,624 Repayment of promissory notes from stockholders — — 2,323 Income tax benefit from employee stock options 3,221 9,060 615 Payment to stockholders — — (1,761 ) Purchase of treasury stock — — (1,225 ) Payment of purchase obligation (1,000 ) (1,000 ) (750 ) Net cash used in financing activities (19,331 ) (4,637 ) (6,973 ) Net increase (decrease) in cash and cash equivalents (1,611 ) 44,066 17,839 Cash and cash equivalents at beginning of year 81,909 37,843 20,004 Cash and cash equivalents at end of year $ 80,298 $ 81,909 $ 37,843 Supplemental disclosures of cash flow information: Cash paid for income taxes $ 10,185 $ 17,396 $ 18,037 Cash paid for interest $ 8,978 $ 10,294 $ 11,178 Cash paid as debt extinguishment $ — $ — $ 3,344 Supplemental disclosure of non-cash investing and financing activities: Obligation payable to sellers of perpetual license $ — $ — $ 3,250 Issuance of common stock as part of debt issuance costs $ — $ — $ 2,796 2012, 20112014, 2013 and 201020121.1. Summary of Significant Accounting Policies (a) Organization and Nature of Business CompanyThe Company's services help identify, restructure and recover delinquent or defaulted assets and improper payments for both government and private clients in a broad range of markets. Company clients typically operate in complex and regulated environments and outsource their recovery needs in order to reduce losses on billions of dollars of defaulted student loans, improper healthcare payments and delinquent state tax and federal treasury receivables. The Company generally provides our services on an outsourced basis, where we handle many or all aspects of the clients’ recovery processes.and Performant Technologies, Inc., and Performant Europe Ltd. Effective August 13, 2012, we changed the name of our wholly owned subsidiary from DCS Business Services, Inc. (DCSBS) to Performant Business Services, Inc., and DCSBS’ wholly owned subsidiaries from Diversified Collection Services, Inc. (DCS), and Vista Financial, Inc. (VFI), to Performant Recovery, Inc., and Performant Technologies, Inc., respectively. PFC is a Delaware corporation headquartered in California and was formed in 2003. Performant Business Services, Inc. is a Nevada corporation founded in 1997. Recovery is a California corporation founded in 1976. Performant Technologies, Inc. is a California corporation that was formed in 2004.(b) Principles of Consolidation 2012,2014, all of the Company’s subsidiaries are 100% owned. All significant intercompany balances and transactions have been eliminated in consolidation.(c) Use of Estimates in the Preparation of Consolidated Financial Statements (d) Stock Split (e) Cash and Cash Equivalents (f) Hosted Service Installation and Implementation Deliverables (g) Property, Equipment, and Leasehold Improvements (h) Goodwill and Other Intangible Assets In accordance with Accounting Standard Update (ASU) 2011-08, Intangibles – Goodwill and Other (Topic 350): Testing Goodwill for Impairment, the Company performed a qualitative assessment of whether it is more likely than not that goodwill fair value is less than its carrying amount for 2012, and concluded that there was no need toperform an impairment test. 2011,2014, 2013 and again2012 and concluded that there was no need to perform an impairment test. The Company applied impairment tests to its goodwill and determined that no impairment loss had occurred during 2010.–to 20 years. The perpetual license is amortized over its estimated useful life of 5 years.(i) Impairment of Long-Lived Assets 20122014, 2013 and 2010. In 2011, the Company recorded $13.4 million of impairment expense to write off the carrying amount of its former trade name, Diversified Collection Services, Inc. (DCS). The Company determined that the DCS trade name would not be used in the future, and retired the trade name intangible asset accordingly.2012.(j) System Developments UpdateCodification (ASC) Subtopic 350-40,Internal-Use Software, which specifies that costs incurred during the application stage of development should be capitalized. All other costs are expensed as incurred. During 2012, 20112014, 2013 and 2010,2012, costs of $5.4$7.2 million, $2.5$4.9 million and $2.1$5.4 million respectively, were capitalized for projects in the application stage of development, with depreciation expense of $2.4$4.0 million, $2.1$2.6 million and $1.5$2.4 million respectively, for completed projects.(k) Debt Issuance Costs cost iscosts are amortized to interest expense in accordance with key terms of the notes as amended.(l) Revenues, Accounts Receivable, and Estimated Liability for Appeals offset.has agreed to an offset against other claims by the provider. Providers have the right to appeal a claim and may pursue additional appeals if the initial appeal is found in favor of CMS. The Company accrues an estimated liability for appeals at the time revenue is recognized based on the Company's estimate of the amount of commissions received which are subject to appeal and which the Company estimates arerevenue probable of being returnedrefunded to providersCMS following successful appeal. In addition, if the Company's estimate of the liability for appeals with respect to revenues recognized during a prior period changes, the Company increases or decreases current period accruals based on such change in estimated liability. At December 31, 2012,2014, a total of $5.6$18.6 million was presented as an allowance against revenue, representing the Company’s estimate of claims that may be overturned. Of this amount, $1.2$0.0 million was related to amounts in accounts receivable and $4.4$18.6 million was related to commissions which had already been received. The balanceszero allowance against accounts receivable at December 31, 20122014 is due to the fact that the receivable from CMS is netted against an offsetting payable for overturned audits, and 2011, were $4.4at December 31, 2014, the amount of the payable exceeded the amount of the receivable as discussed in note 1(m). The total accrued liability for appeals of $18.6 million has therefore been presented in the caption estimated liability for appeals at December 31, 2014. At December 31, 2013, the total appeals-related liability was $16.4 million, comprised of an estimated liability for appeals of $15.3 million and $0.5a contra-accounts-receivable estimated allowance for appeals of $1.1 million. The $18.6 million respectively, representbalance at December 31, 2014 and the $15.3 million balance as of December 31, 2013, represents the Company’s best estimate of the probable amount of losses related to$4.4$18.6 million amount accrued at December 31, 2012,2014, the Company estimates that it is reasonably possible that it could be required to pay an additional amount up to approximately $1.5$5.4 million as a result of potentially successful appeals. To the extent that required payments by the Company exceed the amount accrued, revenues in the applicable period would be reduced by the amount of the excess.Rank 2014 Revenue 1 $53,211 27.2% 2 29,444 15.1% 3 29,171 14.9% 4 24,855 12.7% Rank 2013 Revenue 1 $66,820 26.2% 2 51,566 20.2% 3 42,056 16.5% 4 30,902 12.1% 2012 Revenue Percent of
total revenue 1 $ 54,130 25.8 % 2 39,183 18.7 % 3 29,027 13.8 % 4 25,469 12.1 % 5 22,397 10.7 % For the year ended December 31, 2011, the Company had 5 clients whose individual revenues exceeded 10%Rank 2012 Revenue 1 $54,130 25.8% 2 39,183 18.7% 3 29,027 13.8% 4 25,469 12.1% 5 22,397 10.7% 58%57%, 50%63% and 53%58% of total revenue in 2012, 20112014, 2013 and 2010,2012, respectively. Accounts receivable due from these three customers were 63%39%, 25%59% and 41%63% of total trade receivables at December 31, 2012, 20112014, 2013 and 2010,2012, respectively. Trade accounts receivable are recorded at the invoiced amount and do not bear interest. Amounts collected on trade accounts receivable are included in net cash provided by operating activities in the consolidated statements of cash flows. The Company determines the allowance for doubtful accounts by specific identification. Account balances are charged off against the allowance after all means of collection have been exhausted and the potential for recovery is considered remote. The allowance for doubtful accounts was $0.1$0.0 million for both December 31, 2014 and $0.1December 31, 2013, respectively.(m) Net Payable to Client 20122014. At December 31, 2013, the net of the outstanding accounts receivable invoices of $12.8 million was offset against a payable for overturned audits of $5.9 million for a net receivable of $6.9 million, presented in Accounts receivable. The Company expects that the net payable-to client balance will be paid to the client within the next twelve months.(n) Prepaid Expenses and Other Current Assets 2011, respectively.(m)Legal Expenses(n)Comprehensive Income(o)Fair Value of Financial Instruments(p)Income Taxes(q)Preferred Stock(r)Stock Options2011of $3.2 million, $9.1 million and 2010 of $0.6 million, $0 millionrespectively.$0 million, respectively.(s)Earnings per ShareBasic2013, basic earnings per share is calculated by dividing net income available to common shareholders by the sum of the weighted average number of common shares outstanding during the periodyear. For the year ended December 31, 2012, basic earnings per share is calculated by dividing net income available to common shareholders by the weighted average number of common shares outstanding during the year plus the weighted average number of shares of Series A preferred sharesConvertible Preferred Stock outstanding during the period. The Series A sharesConvertible Preferred Stock are included in the basic denominator because they could be converted into common shares for no cash consideration (via conversion units as further described in Note 7), and were thus considered outstanding common shares in computing basic earnings per share. Diluted earnings per share is calculated by dividing net income available to common shareholders by the weighted average number of common shares and dilutive common shares equivalents outstanding during the period. The Company’s common share equivalents consist of stock options. Year Ended December 31, 2012 2011 2010 43,985 42,962 42,962 3,614 2,780 2,057 47,599 45,742 45,019 Years Ended December 31, 2014 2013 2012 Weighted average shares outstanding – basic 48,816 47,492 43,985 Dilutive effect of stock options 1,018 1,894 3,614 Weighted average shares outstanding – diluted 49,834 49,386 47,599 2012,2014, the Company excluded 2,894,013 options from the calculation of diluted earnings per share options to purchase 2,364,000 sharesfor the year ended December 31, 2014 because such outstandingthe options’ combined exercise price, unamortized fair value and excess tax benefits were greater during the year than the average market price of ourfor the Company's common shares in each of those periodsstock because their effect would be anti-dilutive (i.e., including such options would result in higher earnings per share).(t)Recent Accounting PronouncementsDecember 2011,May 2014, FASB issued an ASU that amends the FASB issued ASU No. 2011-11, Balance Sheet (Topic 210): Disclosures about Offsetting AssetsASC by creating a new Topic 606, Revenue from Contracts with Customers. The new guidance will supersede the revenue recognition requirements in Topic 605, Revenue Recognition, and Liabilities. ASU 2011-11 requiresmost industry-specific guidance on revenue recognition throughout the Industry Topics of the Codification. The core principle of the guidance is that an entity should recognize revenue to depict the transfer of promised goods or services to customers in an amount that reflects the consideration to which the entity expects to be entitled in exchange for those goods or services. To achieve that core principle, an entity should apply the following steps:information about offsettingsufficient qualitative and related arrangementsquantitative information to enable users of financial statements to understand the effectnature, amount, timing and uncertainty of those arrangements on its financial position,revenue and to allow investors to better compare financial statements prepared under U.S. GAAPcash flows arising from contracts with financial statements prepared under International Financial Reporting Standards (IFRS).customers. The new standardsamendments in this ASU are effective for annual periods beginning January 1, 2013, and interim periods within those annual periods. Retrospective application is required. The Company implemented the provisions of ASU 2011-11 as of January 1, 2013. The Company does not believe its adoption of the new guidance will have an impact on its consolidated financial statement.In June 2011, the FASB issued ASU 2011-05, Comprehensive Income (Topic 220): Presentation of Comprehensive Income. Under this ASU, an entity will have the option to present the components of net income and comprehensive income in either one or two consecutive financial statements. The ASU eliminates the option in U.S. GAAP to present other comprehensive income in the statement of changes in equity. An entity should apply the ASU retrospectively. For a nonpublic entity, the ASU is effective for fiscal years ending after December 15, 2012, and interim and annual periods thereafter. Early adoption is permitted. In December 2011, the FASB decided to defer the effective date of those changes in ASU 2011-05 that relate only to the presentation of reclassification adjustments in the statement of operations by issuing ASU 2011-12, Comprehensive Income (Topic 220): Deferral of the Effective Date for Amendments to the Presentation of Reclassifications of Items Out of Accumulated Other Comprehensive income in Accounting Standards Update No. 2011-05. The Company adopted this new accounting guidance with no impact to our consolidated financial statements.In May 2011, the FASB issued ASU 2011-04, Fair Value Measurement (Topic 820): Amendments to Achieve Common Fair Value Measurement and Disclosure Requirements in U.S. GAAP and IFRSs. The new standards do not extend the use of fair value but, rather, provide guidance about how fairvalue should be applied where it already is required or permitted under IFRS or U.S. GAAP. For U.S. GAAP, most of the changes are clarifications of existing guidance or wording changes to align with IFRS. A nonpublic entity is required to apply the ASU prospectively for annualreporting periods beginning after December 15, 2011. The Company2016, including interim periods within that reporting period. Early adoption is not permitted. This amendment is to be either retrospectively adopted to each prior reporting period presented or retrospectively with the cumulative effect of initially applying this ASU 2011-04 in 2012 with norecognized at the date of initial application. We are currently evaluating the impact of the adoption of this guidance to our consolidated financial statements.(v)ReclassificationsCertain reclassifications have been made2011 balancesaccounting for share-based payment awards that require a specific performance target to conformbe achieved in order for employees to become eligible to vest in the 2012 presentation. Such reclassificationsawards. ASU 2014-12 is effective for annual reporting periods (including interim periods) beginning after December 15, 2015, with early adoption permitted. The adoption of this guidance will not have noa material effect on net income or retained earnings as previously reported.2.Acquisition$3.68$3.7 million. The purchase agreement calls for a total of $4.0 million in cash payments to be made over an approximate 3 year period, beginning with an initial payment of $0.8 million which was made in February 2012, followed by quarterly payments of $0.3 million. As part of the transaction valuation, these payments were discounted to a present value using an estimate of our incremental borrowing rate. Computer equipment $ 280 Perpetual license 3,250 Customer relationships 150 Total identifiable assets acquired $ 3,680 The following represents our pro forma Consolidated Statements of Income as if HOPS had been included in our consolidated results for the years ending December 31, 2012 and 2011 ( in thousands, except for per share data): 2012 2011 $ 211,329 $ 164,230 $ 18,751 $ 3,715 $ 0.43 $ 0.09 $ 0.39 $ 0.08 3.3. Property, Equipment, and Leasehold Improvements 20122014 and 20112013 (in thousands): December 31,
2012 December 31,
2011 $ 1,767 $ 1,767 5,500 4,797 4,408 3,612 40,886 31,197 52,561 41,373 (31,892 ) (26,458 ) $ 20,669 $ 14,915 December 31, 2013 Land $ 1,767 $ 1,767 Building and leasehold improvements 5,966 5,773 Furniture, equipment, and automobile 5,193 4,932 Computer hardware and software 60,229 52,021 73,155 64,493 Less accumulated depreciation and amortization (45,508 ) (38,246 ) Property, equipment and leasehold improvements, net $ 27,647 $ 26,247 $5.8$8.7 million, $4.7$6.9 million and $4.2$5.8 million for the years ended December 31, 2014, 2013 and 2012, 2011 and 2010, respectively.4.Identifiable Intangible Assets20122014 and 20112013 (in thousands): Gross
Amounts Accumulated
Amortization Net $ 62,198 $ (28,608 ) $ 33,590 3,250 (596 ) 2,654 $ 65,448 $ (29,204 ) $ 36,244 Gross
Amounts Accumulated
Amortization Net $ 62,046 $ (25,530 ) $ 36,516 $ 62,046 $ (25,530 ) $ 36,516 December 31, 2014 Net Amortizable intangibles: Customer contracts and related relationships $ 62,451 $ (34,774 ) $ 27,677 Perpetual license 3,313 (1,897 ) 1,416 Total intangible assets $ 65,764 $ (36,671 ) $ 29,093 December 31, 2013 Net Amortizable intangibles: Customer contracts and related relationships $ 62,198 $ (31,689 ) $ 30,509 Perpetual license 3,250 (1,246 ) 2,004 Total intangible assets $ 65,448 $ (32,935 ) $ 32,513 2012, 20112014, 2013 and 2010,2012, amortization expense related to intangible assets amounted to $3.7 million, $3.0$3.7 million and $3.0,$3.7 million, respectively. Amount $ 3,731 3,731 3,731 3,696 3,097 18,258 $ 36,244 5.Credit AgreementYear Ending December 31, Amount 2015 $ 3,803 2016 3,768 2017 3,167 2018 3,094 2019 3,090 Thereafter 12,171 Total $ 29,093 Amount $ 11,040 11,040 11,040 11,040 10,253 93,356 $ 147,769 Year Ending December 31, Amount 2015 $9,820 2016 9,820 2017 9,119 2018 83,036 Total $111,795 2.50%2.5% floor) +4.25% or LIBOR (subject to a 1.50%1.5% floor) +5.25%, which was 6.75% at December 31, 2012.2014. The Term A loan requires quarterly payments of $2.5 million beginning in June 2012, with the remaining outstanding principal balance due March 19, 2017. As of December 31, 2012,2014, the Term A loan ending balance, including the current portion was $49.5$26.1 million.2012.2014. The Term B loan requires quarterly2012,2014, the Term B loan ending balance, including the current portion was $98.3$85.7 million.+ 4.25%+4.25% or LIBOR + 5.25%+5.25%, which was 6.75% at December 31, 2012.2014. Both the Prime and the LIBOR alternatives are subject to minimum rate floors. In addition, a facility fee of 0.5% is assessed on the commitment amount. There were no outstanding borrowings under this line of credit at December 31, 2012, and a letter2014, but there are letters of credit outstanding in the amount of $1.4$2.0 million, leaving remaining borrowing capacity under the line of credit of $9.6$9.0 million at December 31, 2012.2014. The line of credit expires in March 19, 2017.2012.215,044215,000 shares of Common Stock issued as compensation to an investment bank acting as financial advisor valued at approximately $2.8 million, based upon a price of $13 per share. These costs are being amortized to expense over the life of the new loans.$0.04$0.0 million paid to third parties for legal and other services. Debt issuance costs are being amortized to interest expense over the life of the new loans. Accumulated amortization of debt issuance costs amounted to $0.9$3.1 million at December 31, 2012.6.Commitments and Contingencies20122014 are as follows (in thousands): Amount $ 1,740 1,769 1,409 986 785 65 $ 6,754 Year Ending December 31, Amount 2015 $ 2,290 2016 1,938 2017 1,485 2018 668 2019 601 Thereafter 815 Total $ 7,797 $2.4$2.9 million, $1.9$2.6 million and $1.9$2.4 million for the yearyears ended December 31, 2014, 2013 and 2012, 2011 and 2010, respectively.7.Capital Stockhashad authority to issue iswas 96,000,000, consisting of 18,000,000 shares of Series A Participating Senior Preferred Stock (Series A Preferred Stock), $0.0001 par value per share (Series A Preferred Stock); 18,000,000 shares of Series B Redeemable Senior Preferred Stock, $0.0001 par value per share (Series B Preferred Stock); and 60,000,000 shares of Common Stock, $0.0001 par value per share. On August 15, 2012, the authorized Common Stock was increased to 500,000,000 shares and the authorized preferred stock was increased to 50,000,000 shares.(a) Series A Preferred Stock (b)Redemption of Series A Preferred StockOn March 19, 2012, the Company recapitalized. As partthe recapitalization, 3,897,000 shares of Series A Convertible Preferred Stock were converted into conversion units, which consisted of one share of Series B Preferred Stock and one share of Common Stock. The Series B Preferred shares plus accrued dividends were redeemed for cash of $44 million, and 3,897,000 sharesShares of Common Stock were issued to the holders of the redeemed Series A Convertible Preferred Stock.In June 2012, the remaining 1,399,000 shares of Series A Convertible Preferred Stock were converted into conversion units of one share of Series B Preferred Stock and one share of Common Stock. The shares Series B Preferred Stock plus accrued dividends were redeemed for cash of $16.3 million and 1,399,000 shares of Common Stock were issued to the holders of the redeemed Series A Convertible Preferred Stock.(c)Issuance of Shares of Common Stock as Compensation(d)Initial Public Offering8.8. Stock-based Compensation (a) Stock Options has established the 2004 DCS Holdings Stock Option Plan, the DCS Holdings, Inc. 2004 Equity Incentive Plan (Performant Financial Corporation is the new name of DCS Holdings, Inc.), the Performant Financial Corporation 2007 Stock Option Plan, and the Performant Financial Corporation 2012 Stock Incentive Plan (the Plans). Under the terms of the 2004 DCS Holdings Stock Option Plan, stock options may be granted for up to 4,000,000 shares of the Company’s authorized but unissued Common Stock. The 2004 DCS Holdings Stock Option Plan was terminated on the completion of the Company’s initial public offering in August 2012. No shares of our common stock are available under our 2004 Stock Option Plan other than for satisfying exercises of stock options granted under this plan prior to termination.providesprovide for the granting of incentive stock options within the meaning of Section 422 of the Code to employees and the granting of nonstatutory stock options, restricted stock, stock appreciation rights, stock unit awards and cash-based awards to employees, non-employeenon-a five-year period.$1.6$3.7 million, $0.1$3.0 million and $0.6$1.6 million for the years ended December 31, 2014, 2013, and 2012, 2011, and 2010, respectively. Outstanding
Options Weighted
average
exercise price
per share Weighted
average
remaining
contractual life
(Years) Aggregate
Instrinsic Value
(in thousands) 5,443,500 $ 0.61 6.90 202,000 1.50 (134,750 ) 0.56 — — 5,510,750 0.64 6.00 180,000 5.50 (25,282 ) 0.74 (718 ) 0.50 �� 5,664,750 0.80 5.20 2,549,109 10.32 (19,077 ) 7.99 (285,058 ) 0.61 7,909,724 $ 3.85 5.89 $ 49,410 7,514,238 $ 3.66 5.64 $ 48,387 4,854,960 $ 0.64 3.86 $ 45,927 Outstanding at December 31, 2011 5,664,750 $ 0.80 5.20 Granted 2,549,109 10.32 Forfeited (19,077 ) 7.99 Exercised (285,058 ) 0.61 Outstanding at December 31, 2012 7,909,724 3.85 5.89 Granted 313,600 11.85 Forfeited (102,381 ) 10.05 Exercised (2,908,122 ) 0.60 Outstanding at December 31, 2013 5,212,821 6.03 6.62 Granted 254,000 9.69 Forfeited (410,625 ) 10.53 Exercised (1,032,813 ) 0.62 Outstanding at December 31, 2014 4,023,383 $ 7.18 6.41 $ 7,641 3,980,118 $ 7.16 6.38 $ 7,634 Exercisable at December 31, 2014 2,475,868 $ 5.32 5.47 $ 7,510 (1)(1) Options expected to vest reflect an estimated forfeiture rate. 2011was $9.69, $11.85 and 2010 was $10.32, $5.50 and $1.50, respectively, per share. The aggregate intrinsic value of our stock options (the amount by which the market price of the stock on the date of exercise exceeded the exercise price of the option) exercised during the years ended December 31, 2014, 2013 and 2012, 2011 and 2010, was $2.9$8.8 million, $0$31.3 million and $0$2.9 million, respectively. At December 31, 2012, 2011,2014, 2013, and 2010,2012, there was $12.0$7.5 million, $0.6$10.5 million and $0.4$12 million, respectively, of unrecognized stock-based compensation expense related to non-vested stock-based compensation arrangements, which the Company expects to recognize over a weighted-average period of 4.212.74 years as stock-based compensation expense.$0 millionduring 2014, 2013 and $0 million during 2012, 2011 and 2010, respectively. For the years ended December 31, 2012, 20112014, 2013 and 2010,2012, we realized a $0.6$3.2 million, $0$9.1 million and $0$0.6 million tax benefit from the exercise of stock options, respectively. For the Year Ended December 31, 2012 2011 2010 48.3 % 39.8 % 40.6 % 0.0 0.0 0.0 6.5 6.3 6.3 1.01 % 1.2 % 2.8 % $ 5.22 $ 2.23 $ 0.66 For the Years Ended December 31, 2014 2013 2012 Expected volatility 51.0% 54.2% 48.3% Expected dividends —% —% —% Expected term (years) 6.1 6.2 6.5 Risk-free interest rate 1.9% 1.5% 1.0% Weighted-average estimated fair value of options granted during the year $4.85 $6.23 $5.22 (b) Restricted Stock Units Option Agreements issued under the 2004 DCS Holdings Stock Option Plan allowparticipants to exercise options whether or not vesting has occurred, provided that the participants enter into a restricted stock agreement. The restricted stock agreement is to specify that the stock issued for unvested options will continue vesting, with the unvested shares subject to repurchase at the lower of original costyear ended December 31: Weighted average Number of grant date Awards fair value Outstanding at December 31, 2012 — $ — Granted 5,263 10.59 Forfeited — — Vested and converted to shares — — Outstanding at December 31, 2013 5,263 $ 10.59 Granted 488,545 9.27 Forfeited (30,900 ) 9.26 Vested and converted to shares (1,316 ) 10.59 Outstanding at December 31, 2014 461,592 $ 9.28 Expected to vest at December 31, 2014 438,510 $ 9.28 fair market value.In January 2005, two executives exercised a portion of their options, including unvested options, by entering into restricted stock agreements with the Company. The restricted stock agreements allow for the executives to receive dividend payments, subject to forfeiture if the executives leave the Company prior to the vesting of the restricted shares. On February 4, 2005, forfeitable dividends of $1 million were paid on the executives’ unvested restricted shares. This amount has been recorded as “due from stockholders” in the equity caption of the consolidated balance sheet, and is being amortized into compensation expense as the underlying unvested restricted shares vest. Compensation expense associated with the forfeitable dividends received on unvested restricted shares2013, there was $0 million, $0$3.5 million and $0.1 million inof compensation expense yet to be recognized related to non-vested restricted stock units. The unrecognized expense as of December 31, 2014 is expected to be recognized over the remaining weighted-average vested period of 3.3 years. 1,316 and none of the restricted stock units vested during the years ended December 31, 2014 and 2013, respectively. Restricted stock units granted under the Performant Financial Corporation 2012 2011Stock Incentive Plan generally vest over periods between2010, respectively.9.Employee Benefit Plan2012, 20112014, 2013 and 2010.10.Income Taxes 2012 2011 2010 $ 15,142 $ 14,053 $ 5,500 3,470 3,103 1,132 18,612 17,156 6,632 $ (1,599 ) $ (7,350 ) $ (172 ) (227 ) (2,290 ) 204 (1,826 ) (9,640 ) 32 $ 16,786 $ 7,516 $ 6,664 2014 2013 2012 Current: Federal $ 6,802 $ 21,526 $ 15,142 State 2,600 5,149 3,470 9,402 26,675 18,612 Deferred: Federal $ (1,625 ) $ (866 ) $ (1,599 ) State (78 ) (842 ) (227 ) (1,703 ) (1,708 ) (1,826 ) Total Expense (Benefit) $ 7,699 $ 24,967 $ 16,786 2012, 20112014, 2013 and 20102012 is as follows: 2012 2011 2010 35 % 35 % 35 % 5 % 3 % 5 % 2 % 1 % 2 % 0 % -1 % -2 % 42 % 38 % 40 % 2014 2013 2012 Federal income at the statutory rate 35 % 35 % 35 % State income tax, net of federal benefit 10 % 5 % 5 % Permanent differences 2 % 1 % 2 % Other (2 )% — % — % 45 % 41 % 42 % 2012,2014, and 20112013 (in thousands): 2012 2011 $ 26 $ 30 909 315 1,767 1,137 3,082 1,822 197 229 — 483 1,373 1,041 — 690 91 1,284 566 386 1,260 366 82 559 9,353 8,342 (351 ) (148 ) 9,002 8,194 (13,007 ) (14,307 ) (3,446 ) (3,029 ) — (135 ) (22 ) (22 ) (16,475 ) (17,493 ) $ (7,473 ) $ (9,299 ) 2014 2013 Deferred tax assets: Bad debt reserve $ 13 $ 13 Vacation accrual 685 1,020 Nonqualified stock options 3,059 1,526 Debt issuance costs 643 848 Acquisition costs 630 158 State tax deferral 934 1,474 Deferred revenue 273 352 State tax credits 305 290 Net operating loss 110 47 Estimated liability for appeals 5,313 4,277 Other 304 118 Total deferred tax assets 12,269 10,123 Valuation allowance (349 ) (147 ) Total deferred tax assets net of valuation allowance 11,920 9,976 Deferred tax liabilities: Identifiable intangible assets (10,227 ) (11,176 ) Fixed assets (5,732 ) (4,543 ) Other (22 ) (22 ) Total deferred tax liabilities (15,981 ) (15,741 ) Net deferred tax liabilities $ (4,061 ) $ (5,765 ) $0.4$0.3 million and $0.1 million, as of December 31, 20122014 and December 31, 2013, respectively, primarily related to California enterprise zone tax credits for which it is not more likely than not that the tax benefit will be realized. The total amount of the valuation allowance represented includes increases from the amount recorded as of December 31, 2011 due to the generation of additional tax credits in 2012, for which it is not more likely than not that the tax benefit will be realized.$0.6$0.3 million, which, can be carried forward indefinitely.due to the Assembly Bill 93 and Senate Bill 90 signed on July 11, 2013, are now limited to a 10 year carryforward, and will expire in 2024. The Company has state net operating loss carryforwards of $0.4 million which expire in 2020.20122014 from its unrecognized tax benefits as of December 31, 20112012 (in thousands): $ — 115 — 164 — — $ 279 Unrecognized tax benefits balance at December 31, 2012 $ 279 Increase related to prior year tax positions 357 Increase related to current year tax positions 49 Settlements (139 ) Unrecognized tax benefits balance at December 31, 2013 546 Increase related to prior year tax positions 444 Decrease related to prior year tax positions (42 ) Unrecognized tax benefits balance at December 31, 2014 $ 948 20122014 and 2011,2013, we had approximately $0.3$0.9 million and $0$0.5 million of unrecognized tax benefits, respectively. We do not expect any significant change in unrecognized tax benefits during the next twelve months. The Company records interest expense and penalties related to unrecognized tax benefits in selling, general, and administrative expenses.income tax expense. The amount of accrued interest was not material at December 31, 20122014 and 2011,2013, respectively. No penalties were recognized in 20122014 or accrued at December 31, 20122014, and 2011,2013 respectively. Unrecognized tax benefits of approximately $0.30.9 million which, if recognized, would favorably affect the Company’s effective income tax rate.2008,2010, the Company is no longer subject to federal orCalifornia, Texas, and certain state state tax examinations.11.Related Party Transactionsstock.stock during 2012 and 2013. As a result, these entities are considered related parties. Interest expense under these arrangements totaled $11.1 million, $12.3$10.3 million and $13.2$11.1 million for the years ended December 31, 2012, 20112013 and 2010,2012, respectively, and the debt extinguishment expense associated with the recapitalization totaled $3.3 million for the year ended December 31, 2012.12.Other Commitments and Contingencies(a) Trust Funds (a)Trust Funds$1.4$9.7 million and $1.8$1.1 million at December 31, 20122014 and 2011,2013, respectively.(b) Litigation 13.Subsequent EventsIn2013,28, 2015, we entered into an Agreement and Plan of Merger (“Merger Agreement”) with Premier Healthcare Exchange, Inc., a Delaware corporation (“PHX”), pursuant to which, PHX would become our wholly-owned indirect subsidiary. The Merger Agreement contains customary closing conditions, including completion of a financing by us to fund the Company completed a secondary offeringconsideration payable under the terms of the Merger Agreement. The purchase price under the Merger Agreement is approximately $108 million in which sellingcash, subject to certain adjustments, and certain PHX stockholders issuedwill also exchange shares for $22 million of our common stock. We also could be obligated to pay up to an additional $19.1 million in cash pursuant to an earnout arrangement based on PHX in revenues in 2015. On January 28, 2015 we announced proposed concurrent public offerings of $80 million aggregate principal amount of convertible senior notes due 2020 and sold 9,200,000$50 million of shares of our common stock at a public offering price of $10.65 per share. The Company did not receive any proceeds fromto finance the salecash portion of the sharesconsideration payable under the Merger Agreement. On January 30, 2015, we announced our decision to withdraw the proposed public offerings of convertible senior notes and common stock. The Merger Agreement is currently terminable by either us or PHX without penalty, except that we are obligated to pay an expense termination fee of $750,000 in the selling stockholders. The Company paidevent the related offering expenses.PERFORMANT FINANCIAL CORPORATIONBy:PERFORMANT FINANCIAL CORPORATION By: /s/ Lisa C. Im Lisa C. Im Chief Executive Officer 21, 2013 Lisa C. Im Chief Executive Officer (Principal Executive Officer) and DirectorBoard Chair March 21, 201312, 2015Lisa C. Im /s/ Hakan L. Orvell Hakan L. Orvell Chief Financial Officer (Principal Financial and Accounting Officer) March 21, 201312, 2015/s/ Dr. Jon D. Shaver Dr. Jon D. Shaver Chairman of the Board and Director March 21, 2013Todd R. Ford Director March 21, 201312, 2015Todd R. Ford /s/ Brian P. Golson Brian P. Golson Director March 21, 201312, 2015Brian P. Golson /s/ William D. Hansen William D. Hansen Director March 21, 201312, 2015Bradley F. Fluegel /s/ William C. Kessinger William C. Kessinger Director March 21, 201312, 2015Bruce Hansen /s/ Jeffrey S. Stein Jeffrey S. Stein Director March 21, 201312, 2015William D. Hansen 2012, 20112014, 2013 and 2010Description Balance at
Beginning of
Period Additions
Charged
against Revenue Recoveries Charge-offs Balance at
End of Period $ 77 — 2 (14 ) $ 65 $ 45 28 14 (10 ) $ 77 $ 221 37 — (213 ) $ 45 Description Recoveries Charge-offs 2014 $ 32 — — — $ 32 2013 $ 65 — 2 (35 ) $ 32 2012 $ 77 — 2 (14 ) $ 65 Description Balance at
Beginning of Additions
Charged
against Revenue Appeals found
in Providers
Favor Balance at
End of Period $ 934 8,589 (3,946 ) $ 5,577 * $ 101 1,743 (910 ) 934 * $ — 101 — 101 * Description 2014 $ 16,443 8,624 (6,442 ) $ 18,625 * 2013 $ 5,577 12,791 (1,925 ) $ 16,443 * 2012 $ 934 8,589 (3,946 ) $ 5,577 * * Includes $1,199, $484$0, $1,160 and $101$1,199 related to the estimated allowance for appeals that apply to uncollected accounts receivable as of 2012, 20112014, 2013 and 2010,2012, respectively.ExhibitNumberDescription 3.1Description 2.1 Agreement and Plan of Merger, dated as of January 28, 2015, by and among Performant Financial Corporation, Project Phoenix Merger Sub, Inc., Premier Healthcare Exchange, Inc. and the other parties thereto (incorporated by reference to Exhibit 2.1 to the Company's Current Report on Form 8-K filed January 29, 2015) 3.1 Restated Certificate of Incorporation of Registrant (incorporated by reference to Exhibit 3.1(b) to the Company’sCompany's Registration Statement on Form S-1/A filed July 23,30, 2012)3.2 Amended and Restated Bylaws of Registrant (incorporated by reference to Exhibit 3.2(b) to the Company’sCompany's Registration Statement on Form S-1/A filed July 23, 2012)4.2 Amended and Restated Registration Rights Agreement, dated as of August 15, 2012, among the Registrant and the persons listed thereon (incorporated by reference to Exhibit 4.2 to the Company’sCompany's Registration Statement on Form S-1/A filed July 23, 2012)10.1 Form of Indemnification Agreement between the Registrant and its officers and directors (incorporated by reference to Exhibit 10.1 to the Company’sCompany's Registration Statement on Form S-1/A filed July 30, 2012)10.2 2004 Equity Incentive Plan and form of agreements thereunder (incorporated by reference to Exhibit 10.2 to the Company’sCompany's Registration Statement on Form S-1 filed July 3, 2012)10.3 2004 DCS Holdings Stock Option Plan and form of agreements thereunder (incorporated by reference to Exhibit 10.3 to the Company’sCompany's Registration Statement on Form S-1 filed July 3, 2012)10.4 2007 Stock Option Plan and form of agreements thereunder (incorporated by reference to Exhibit 10.4 to the Company’sCompany's Registration Statement on Form S-1 filed July 3,23, 2012)10.5 Recovery Audit Contractor contract by and between Diversified Collection Services, Inc. and Center for Medicare and Medicaid Services dated as of October 3, 2008, as amended (incorporated by reference to Exhibit 10.5 to the Company’sCompany's Registration Statement on Form S-1/A filed July 23, 2012)10.6 Credit Agreement, dated as of March 19, 2012, by and among DCS Business Services, Inc., the Lenders party Hereto, Madison Capital Funding LLC, and ING Capital (incorporated by reference to Exhibit 10.6 to the Company’sCompany's Registration Statement on Form S-1/A filed July 23, 2012)10.7 Form of Change of Control Agreement, as amended (incorporated by reference to Exhibit 10.7 to the Company’sCompany's Registration Statement on Form S-1/A filed July 30, 2012)10.8 Employment Agreement between the Registrant and Lisa Im, dated as of April 15, 2012, as amended (incorporated by reference to Exhibit 10.8 to the Company’sCompany's Registration Statement on Form S-1/A filed July 23, 2012)10.9 Employment Agreement between the Registrant and Jon D. Shaver dated as of March 31, 2003, as amended (incorporated by reference to Exhibit 10.9 to the Company’sCompany's Registration Statement on Form S-1/A filed July 23, 2012)10.10 Repurchase Agreement between the Registrant and Lisa C. Im dated as of July 3, 2012 (incorporated by reference to Exhibit 10.10 to the Company’sCompany's Registration Statement on Form S-1 filed July 3, 2012)10.11 Repurchase Agreement between the Registrant and Jon D. Shaver dated as of July 3, 2012 (incorporated by reference to Exhibit 10.11 to the Company’sCompany's Registration Statement on Form S-1 filed July 3, 2012)10.12 Director Nomination Agreement between the Registrant and Parthenon DCS Holdings, LLC dated as of July 20, 2012 (incorporated by reference to Exhibit 10.12 to the Company’sCompany's Registration Statement on Form S-1/A filed July 23, 2012)10.13 Advisory Services Agreement between Diversified Collection Services, Inc. and Parthenon Capital, LLC dated as of January 8, 2004, as amended (incorporated by reference to Exhibit 10.13 to the Company’sCompany's Registration Statement on Form S-1/A filed July 23, 2012)ExhibitNumber Description10.14 Termination of the Advisory Services Agreement between Diversified Collection Services, Inc. and Parthenon Capital, LLC dated as of January 8, 2004, as amended, dated as of April 13, 2012 (incorporated by reference to Exhibit 10.14 to the Company’sCompany's Registration Statement on Form S-1/A filed July 23, 2012)10.15 2012 Stock Incentive PlanPlan*Exhibit
NumberDescription 10.16 Amendment No. 1 to Credit Agreement Credit Agreement, dated as of March 19, 2012, by and among DCS Business Services, Inc., the Lenders party thereto, Madison Capital Funding LLC, and ING Capital* 10.17 Amendment No. 2 to Credit Agreement, dated as of November 4, 2014, by and among Performant Business Services, Inc., the Lenders thereto, and Madison Capital Funding LLC. (incorporated by reference to Exhibit 10.1510.1 to the Company’s Registration StatementCompany's Quarterly Report on Form S-1/A10-Q filed July 23, 2012)November 10, 2014)21 List of Subsidiaries 23 Consent of KPMG LLP, Independent Registered Public Accounting Firm 24 Powers of Attorney (included in the signature page to this report) 31.1 Rule 13a-14(a)/15d-14(a) Certification, executed by Lisa C. Im 31.2 Rule 13a-14(a)/15d-14(a) Certification, executed by Hakan L. Orvell 32.1 Furnished Statement of the Chief Executive Officer under 18 U.S.C. Section 1350 32.2 Furnished Statement of the Chief Financial Officer under 18 U.S.C. Section 1350 101.INS XBRL Instance Document 101.SCH XBRL Taxonomy Extension Scheme 101.CAL XBRL Taxonomy Extension Calculation Linkbase 101.DEF XBRL Taxonomy Extension Definition Linkbase Document 101.LAB XBRL Taxonomy Extension Label Linkbase 101.PRE XBRL Taxonomy Extension Presentation Linkbase