MISSOURI | | | | MISSOURI | | 43-1450818 | (State or other jurisdiction of | | (IRS Employer | incorporation or organization) | | (IRS Employer
Identification No.) | | | | 12555 Manchester Road | | | Des Peres, Missouri | | 63131 | (Address of principal executive offices) | | (Zip Code) |
(314) 515-2000
Registrant’sRegistrant's telephone number, including area code (314) 515-2000
Securities registered pursuant to Section 12(b) of the Act: | | | Title of each class | | Name of each exchange on which registered | NONENone | | NONENone |
Securities registered pursuant to Section 12(g) of the Act: Limited Partnership Interests (Title of Class) Indicate by check mark if the registrant is a well-known seasoned issuer, as defined in Rule 405 of the Securities Act. YES ¨o NO x Indicate by check mark if the registrant is not required to file reports pursuant to Section 13 or Section 15(d) of the Act. YES ¨o NO x Indicate by check mark whether the registrant (1) has filed all reports required to be filed by Section 13 or 15(d) of the Securities Exchange Act of 1934 during the preceding 12 months (or for such shorter period that the registrant was required to file such reports), and (2) has been subject to such filing requirements for the past 90 days. YES x NO ¨o Indicate by check mark whether the registrant has submitted electronically and posted on its corporate Web site, if any, every Interactive Data File required to be submitted and posted pursuant to Rule 405 of Regulation S-T (§232.405 of this chapter) during the preceding 12 months (or for such shorter period that the registrant was required to submit and post such files). YES x NO ¨o Indicate by check mark if disclosure of delinquent filers pursuant to Item 405 of Regulations S-K (§229.405 of this chapter) is not contained herein, and will not be contained, to the best of registrant’sregistrant's knowledge, in definitive proxy or information statements incorporated by reference in Part III of this Form 10-K or any amendment to this Form 10-K.x Indicate by check mark whether the registrant is a large accelerated filer, an accelerated filer, a non-accelerated filer, or a smaller reporting company. See the definitions of “large accelerated filer,” “accelerated filer” and “smaller reporting company” in Rule 12b-2 of the Exchange Act. (Check one): | | | | | | | Large accelerated filer | o | ¨
| | Accelerated filer | | ¨o
| | | | | Non-accelerated filer | x | x (Do(Do not check if a smaller reporting company)
| | Smaller reporting company | | ¨o
|
Indicated by check mark whether the registrant is a shell company (as defined in Rule 12b-2 of the Act). Yes ¨o No x As of February 22, 2013, 648,89726, 2016, 914,542 units of limited partnership interest (“Interests”) are outstanding, each representing $1,000 of limited partner capital. There is no public or private market for such Interests. DOCUMENTS INCORPORATED BY REFERENCE None
THE JONES FINANCIAL COMPANIES, L.L.L.P. TABLE OF CONTENTS PART I
2
PART I The Jones Financial Companies, L.L.L.P. (“JFC”) is a registered limited liability limited partnership organized under the Missouri Revised Uniform Limited Partnership Law of the State of Missouri Revised Statutes.Act. Unless expressly stated, or the context otherwise requires, the terms “Registrant” and “Partnership” refer to JFC and all of its consolidated subsidiaries. The Partnership’s principal operating subsidiary, Edward D. Jones & Co., L.P. (“Edward Jones”), was organized onin February 20, 1941 and reorganized as a limited partnership onin May 23, 1969. JFC was organized onin June 5, 1987 and, along with Edward Jones, was reorganized onin August 28, 1987. As of December 31, 2012,2015, the Partnership operates in two geographic operating segments, the United States of America (“U.S.”) and Canada. Edward Jones is comprised of a U.S. registered broker-dealer in the U.S. and (throughone of Edward Jones’ subsidiaries is a subsidiary) a Canadian registered broker-dealer and primarily serves individual investors. Asin Canada. JFC is the ultimate parent company of Edward Jones JFCand is a holding company. Edward Jones primarily derives its revenue from the retail brokerage business through the sale of listed and unlisted securities and insurance products, investment banking, principal transactions, distribution of mutual fund shares, and through fees related to assets held by and account services provided to its clients.clients, including investment advisory services, the purchase or sale of listed and unlisted securities and insurance products, and principal transactions. Edward Jones primarily conducts business in the U.S. and Canada with its clients, various brokers, dealers, clearing organizations, depositories and banks in the U.S. and in Canada.banks. For financial information related to these two operating segments for the years ended December 31, 2012, 20112015, 2014 and 2010,2013, see Part II, Item 7 – Management’s Discussion and Analysis of Financial Condition and Results of Operations and Part II, Item 8 – Financial Statements and Supplementary Data – Note 1613 to the Consolidated Financial Statements. 3
PART I Item 1. | Business, continued |
ORGANIZATIONAL STRUCTUREOrganizational Structure.
At December 31, 2012,2015, the Partnership was organized as follows:  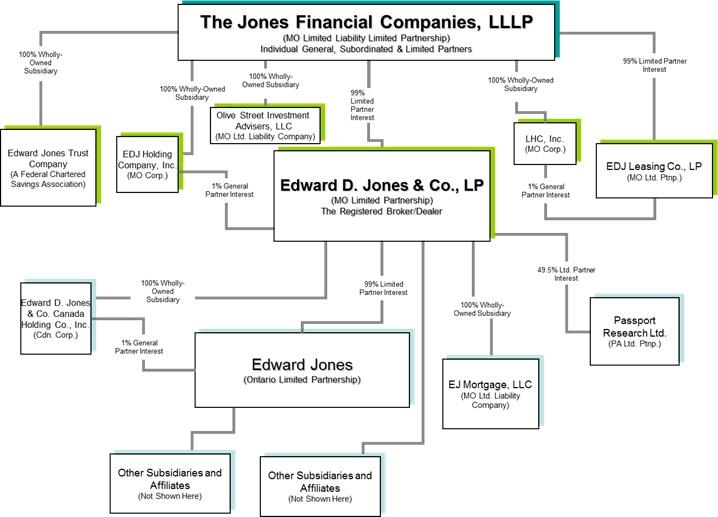
For additional information about the Partnership’s other subsidiaries and affiliates, see Exhibit 21.21.1. During 2009, Edward Jones sold 100% of the issued and outstanding shares of its subsidiary, Edward Jones Limited, a United Kingdom (“U.K.”) private limited company engaged in the retail financial services business in the U.K.
Branch Office Network. The Partnership primarily serves serious, long-term individual long-term investors in small to medium-size towns and metropolitan suburbs through its extensive network of branch offices. The Partnership's business model is designed to serve clients through personal relationships with financial advisors and branch office administrators ("BOA") located in the communities where its clients live and work. Financial advisors and BOAs provide tailored solutions and services to their clients while leveraging the resources of the Partnership's home office. The Partnership operated 11,41212,482 branch offices as of February 22, 2013,December 31, 2015, primarily staffed by a single financial advisor and a branch office administrator.BOA. Of this total, the Partnership operated 10,85411,904 branch offices in the U.S. (located in all 50 states, predominantly in communities with populations of under 50,000states) and metropolitan suburbs) and 558578 branch offices in Canada.
4
PART I Item 1. | Business, continued |
Governance.Governance.Unlike a corporation, the Partnership is not governed by a board of directors and has no individuals who are designated as directors. Moreover, none of its securities are listed on a securities exchange and therefore the governance requirements that generally apply to many companies that file periodic reports with the U.S. Securities and Exchange Commission (“SEC”) reporting companies do not apply to it. Under the terms of the Partnership’s EighteenthNineteenth Amended and Restated Agreement of Registered Limited Liability Limited Partnership, Agreement (“the Partnershipdated June 6, 2014, as amended (the “Partnership Agreement”), the Partnership’s Managing Partner has primary responsibility for administering the Partnership’s business, determining its policies and controlling the management and conduct of the Partnership’s business, andits management. The Managing Partner also has the power to admit and dismiss general partners of JFC and to adjust the proportion of their respective interests in JFC. As of February 22, 2013,December 31, 2015, JFC was composed of 373380 general partners, 14,00919,873 limited partners and 297362 subordinated limited partners. See Part III, Item 10 – Directors, Executive Officers and Corporate Governance for a description of the governance structure of the Partnership.
Revenues by Source. The following table sets forth on a continuing operations basis, for the past three years, the sources of the Partnership’s revenues.revenues for the past three years. Due to the interdependence of the activities and departments of the Partnership’s investment business and the inherently arbitrary assumptions required to allocate overhead, it is impractical to identify and specify expenses applicable to each aspect of the Partnership’s operations. Further information on revenue related to the Partnership’s reportable segments is provided in Part II, Item 8 – Financial Statements and Supplementary Data – Note 1613 to the Consolidated Financial Statements and Part II, Item 7 – Management’s Discussion and Analysis of Financial Condition and Results of Operations. | | | | | | | | | | | | | | | | | | | | | | | | | (Dollars in thousands) | | 2012 | | | 2011 | | | 2010 | | Asset-based fees | | $ | 2,042,392 | | | | 41 | % | | $ | 1,776,883 | | | | 39 | % | | $ | 1,397,333 | | | | 33 | % | Commissions | | | | | | | | | | | | | | | | | | | | | | | | | Mutual funds | | | 1,050,948 | | | | 20 | % | | | 866,005 | | | | 19 | % | | | 856,020 | | | | 21 | % | Listed securities | | | 450,293 | | | | 9 | % | | | 392,743 | | | | 9 | % | | | 338,605 | | | | 8 | % | Insurance | | | 388,889 | | | | 8 | % | | | 385,184 | | | | 8 | % | | | 326,698 | | | | 8 | % | Over-the-counter securities | | | 88,896 | | | | 2 | % | | | 54,755 | | | | 1 | % | | | 54,529 | | | | 1 | % | | | | | | | | | | | | | | | | | | | | | | | | | | Total commissions | | | 1,979,026 | | | | 39 | % | | | 1,698,687 | | | | 37 | % | | | 1,575,852 | | | | 38 | % | Account and activity fees | | | 573,949 | | | | 11 | % | | | 522,898 | | | | 11 | % | | | 503,264 | | | | 12 | % | Principal transactions | | | 155,895 | | | | 3 | % | | | 284,231 | | | | 6 | % | | | 320,777 | | | | 8 | % | Interest and dividends | | | 133,469 | | | | 3 | % | | | 130,150 | | | | 3 | % | | | 126,769 | | | | 3 | % | Investment banking | | | 111,539 | | | | 2 | % | | | 153,100 | | | | 3 | % | | | 208,615 | | | | 5 | % | Other revenue | | | 31,148 | | | | 1 | % | | | 11,553 | | | | 1 | % | | | 30,489 | | | | 1 | % | | | | | | | | | | | | | | | | | | | | | | | | | | Total revenue | | $ | 5,027,418 | | | | 100 | % | | $ | 4,577,502 | | | | 100 | % | | $ | 4,163,099 | | | | 100 | % | | | | | | | | | | | | | | | | | | | | | | | | | |
($ millions) | | 2015 | | | 2014 | | | 2013 | | Fee revenue | | | | | | | | | | | | | | | | | | | | | | | | | Asset-based fees | | $ | 3,399 | | | | 51% | | | $ | 3,089 | | | | 49% | | | $ | 2,523 | | | | 44% | | Account and activity fees | | | 690 | | | 10% | | | | 617 | | | | 10% | | | | 568 | | | | 10% | | Total fee revenue | | | 4,089 | | | 61% | | | | 3,706 | | | | 59% | | | | 3,091 | | | | 54% | | Trade revenue | | | 2,425 | | | | 36% | | | | 2,460 | | | | 38% | | | | 2,439 | | | | 43% | | Interest and dividends | | | 158 | | | 3% | | | | 135 | | | | 2% | | | | 134 | | | | 2% | | Other revenue | | | 22 | | | 0% | | | | 32 | | | | 1% | | | | 52 | | | | 1% | | Total revenue | | $ | 6,694 | | | 100% | | | $ | 6,333 | | | | 100% | | | $ | 5,716 | | | | 100% | |
Asset-based Fees The Partnership earns fees from investment advisory services offered in the U.S. through Edward Jones Advisory SolutionsSolutions® (“Advisory Solutions”), and Edward Jones Managed Account ProgramProgram® (“MAP”) and in Canada through Edward Jones Portfolio ProgramProgram® (“Portfolio Program”) and Edward Jones Guided Portfolios® (“Guided Portfolios”). Advisory Solutions and MAP are both registered as investment advisory programs with the SECcreated under the Investment Advisers Act of 1940. Portfolio Program isand Guided Portfolios are not requiredsubject to be registered under this actAct as services from this programthese programs are only offered in Canada. In January 2016 the Partnership announced its intention to wind down the MAP program offered in the U.S. The Partnership stopped accepting new assets in the MAP program in January 2016 and intends to close the program by mid-2017. MAP represents less than 1% of asset-based fees revenue and the Partnership expects most of the client assets will be transferred to other programs which offer investment advisory services. Through Advisory Solutions, providesfinancial advisors provide investment advisory services to its clients for a monthlyan annual fee based upon the average daily market value of their assets in the program, and consists of a managed account investedprogram. Clients can choose to invest in Advisory Solutions Fund Models, which invests in affiliated mutual funds, unaffiliated mutual funds, and exchange-traded funds (ETFs) and money market funds, or Advisory Solutions Unified Managed Account models, which also include separately managed allocations (SMAs). PART I
Item 1.
| Business, continued
|
For this program,allocations. When investing in Advisory Solutions, the client mustmay elect either a research or a custom account model. If the client elects a research type model, the Partnership assumes full investment discretion on the account whichand the client assets will be invested in one of numerous different research models developed and managed by Edward Jones’ Mutual Fund Research department.Jones. If the client elects to build a custom model, the Partnership assumes limited investment discretion on the account developedand the investments are selected by the client and his or her financial advisor. The vast majority of client assets within Advisory Solutions are invested in research models.
5
PART I Item 1. | Business, continued |
In 2013, in order to addressaccommodate the current size and expected growth in investment advisory services offered through Advisory Solutions, in 2013as well as potentially lower client investment management expense, the Partnership is planningformed the Bridge Builder Trust (the "Trust") to introduce a newoffer additional fund options for clients invested in Advisory Solutions. The Trust added seven sub-advised mutual fund designed solely for Advisory Solutions.funds to its series in 2015, bringing the total to eight sub-advised funds. At its discretion, the Trust may add additional funds in the future. Olive Street Investment Advisers, L.L.C. (“OLV”("OLV"), a 100% wholly-owned subsidiary of JFC and a Missouri limited liability company, was established in December 2012 to beis the investment adviser to a newthe current sub-advised mutual fund trust.funds. For each of the sub-advised mutual funds in the Trust, OLV is intended to havehas primary responsibility for allocation of funds, setting the mutual fund’s overall investment strategies and the selection and management of subadvisors, and supervisory responsibility for the general management of the trust,mutual funds and selecting and managing sub-advisers, subject to the review and approval by itsof the Trust's board of trustees. As of December 31, 2015, the Trust had client assets under management of $22.6 billion. Through the MAP and Portfolio Program, offerfinancial advisors provide investment advisory services to clients by using independent investment managers and proprietary asset allocation models. Guided Portfolios is a non-discretionary, fee-based program with structured investment guidelines. Fees for a monthly feethese programs are based uponon the average value of client assets in the program, by using independent investment managers. In addition to the advisory programs mentioned above, the Partnership also earns asset-based fees from the trust and investment management services offered to its clients through Edward Jones Trust Company (“EJTC”).program.
The Partnership also earns revenue on clients’ assets through service fees on most of its clients’ assets which are held byand other revenues received under agreements with mutual fund companies and insurance companies. The fees generally range from 15 to 25 basis points (0.15% to 0.25%) of the value of the client assets so held. In addition, theThe Partnership earns revenue sharing from certain mutual fund and insurance vendors.companies. In most cases, this is additional compensation paid by investment advisers, insurance companies or distributors based on a percentage of average vendor assets held by the Partnership’s clients.
In addition to the advisory programs mentioned above, the Partnership earns asset-based fees from the trust services and investment management services offered to its clients on those products covered under the revenue sharing agreements. Revenue sharing agreements that provide forthrough Edward Jones Trust Company (“EJTC”), a fixed annual payment are also included in asset-based fees.wholly-owned subsidiary of JFC. The Partnership is a 49.5% limited partner of Passport Research, Ltd. (“Passport Research”), the investment adviser to certainfor two money market funds made available to the Partnership’sEdward Jones clients. Revenue from this source is primarily based on client assets in the funds. However, due to the current low interest rate environment, the investment adviser voluntarily chose (beginning in March 2009) to reduce certain fees charged to the funds to a level that will maintain a positive client yield on funds. For further information on this reduction of fees, see Part II, Item 7A – Quantitative and Qualitative Disclosures About Market Risk. The Partnership has entered into a non-binding letter of intent to acquire the remaining 50.5% of Passport Research from Federated Investment Management Company ("Federated"), the general partner of Passport Research. The transaction is not expected to have a material impact on the Consolidated Financial Statements. Federated approved the transfer on February 18, 2016 and the transfer is expected to be completed in the fourth quarter of 2016, subject to customary regulatory and fund shareholder approvals. CommissionsAccount and Activity Fees
CommissionsAccount and activity fees include shareholder accounting service fees, Individual Retirement Account (“IRA”) custodial service fees, and other product/service fees.
The Partnership charges fees to certain mutual fund companies for shareholder accounting services, including maintaining client account information and providing other administrative services for the mutual funds. The Partnership acts as the custodian for clients’ IRAs and the clients are charged an annual fee for this and other account services. Account and activity fees also include sales-based revenue is primarily comprisedsharing fees, insurance contract services, and fees earned through a co-branded credit card with a major credit card company. Trade Revenue Trade revenue consists of commissions, charges to clients for the purchase or sale of securities, mutual fund shares, listed and unlisted equity securities and insurance products. The following briefly describes the Partnership’s sourcesproducts, principal transactions and investment banking. Trade revenue is impacted by trading volume, size of commissions revenue.trades and market volatility.
6
PART I Item 1. | Business, continued |
Commissions – Mutual Funds.Funds. The Partnership distributes mutual fund shares in continuous offerings and new underwritings. As a dealer in mutual fund shares, the Partnership receives a dealer’s discount which generally ranges from 1% to 5% of the purchase price of the shares, depending on the terms of each fund’s prospectus and the amount of the purchase. Commissions – EquitiesListed Securities Transactions.. The Partnership receives a commission when it acts as an agent for a client in the purchase or sale of listed securities. These securities include common and preferred stocks and debt securities traded on and off the securities exchanges.unlisted (over-the-counter) securities. The commission is based on the value of the securities purchased or sold. Commissions – Insurance ProductsInsurance.. The Partnership sells life insurance, long-term care insurance, disability insurance, fixed and variable annuities and other types of insurance products of unaffiliated insurance companies to its clients through its financial advisors who hold insurance sales licenses. As an agent for the insurance companies, the Partnership receives commissions on the premiums paid for the policies. Principal TransactionsOver-the-Counter Securities Transactions. Partnership. Revenue is earned from the Partnership's distribution of and participation in principal trading activities in unlisted (over-the-counter) securities transactions are similar to its activities as a broker in listed securities. In connection with client orders to buy or sell securities, the Partnership charges a commission for agency transactions. Account and Activity Fees
Revenue sources include sub-transfer agent accounting services fees, Individual Retirement Account (“IRA”) custodial services fees, and other product/service fees.
The Partnership charges fees to certain mutual funds for sub-transfer agent accounting services, including maintaining client account information and providing other administrative services for the mutual funds. Also, the Partnership acts as the custodian for clients’ IRA accounts and the clients are charged an annual fee for this service. Account and activity fees also include sales based revenue sharing fees pursuant to arrangements with certain mutual fund and insurance vendors where the vendors pay additional compensation to the Partnership based on a percentage of current year sales by the Partnership of products supplied by these vendors. The Partnership receives revenue through a co-branded credit card with a major credit card company and from offering mortgage loans to its clients through a joint venture. However, the joint venture partner has elected to terminate the joint venture arrangement in April 2013 and the Partnership will discontinue offering mortgage loans to its clients at this time.
Principal Transactions
The Partnership makes a market inmunicipal obligations, over-the-counter corporate securities, municipal obligations, government obligations,certificates of deposit, unit investment trusts, mortgage-backed securities and certificates of deposit.government obligations. The Partnership’s market-makingprincipal trading activities are conducted with other dealers in the “wholesale” and “retail” markets where the Partnership acts as a dealer buying from and selling to its clients. In making markets inprincipal trading of securities, the Partnership exposes its capital to the risk of fluctuation in the fair value of its security positions. The Partnership maintains securities positions in inventory solely to support its business of buying securities from and selling securities to its retail clients and does not seek to profit by engaging in proprietary trading for its own account.
PART I
Item 1.
| Business, continued
|
Investment Banking The related unrealized gains and losses for these securities are recorded within trade revenue.
Revenue which was previously classified as investment banking was reclassified to principal transactions for all periods presented. Investment banking revenue is primarily derived from the Partnership’s distribution of unit investment trusts corporate and participation in municipal obligations and government sponsored enterprise obligations. Investment banking revenueunderwriting activities. Revenue also includes underwriting fee revenue related to underwriting and management fees as well as gross acquisition profit / profit/loss and volume concession revenue, which is earned and collected from the issuer. The Partnership’s investment banking activities are performed primarily by its Syndicate, Investment Banking and Unit Investment Trust departments. The principal service which the Partnership renders as an investment banker is the underwriting and distribution of securities, either in a primary distribution on behalf of the issuer of such securities or in a secondary distribution on behalf of a holder of such securities. The roles the Partnership may play include senior manager, co-manager, syndicate member, selling group member, dealer or distributor and encompass both negotiated and competitively bid offerings.
The Partnership historically has not, and does not presently engage in other investment banking activities, such as assisting in mergers and acquisitions, arranging private placement of securities issues with institutions, or providing consulting and financial advisory services to entities. In the caseAs of an underwritten offering managed byDecember 31, 2015, the Partnership closed the Syndicate, Investment Bankingnegotiated municipal obligations underwriting portion of the investment banking business. The revenue and Unit Investment Trust departments may form underwriting syndicates and workcosts associated with the branch office network for sales of the Partnership’s own participation and with other members of the syndicate in the pricing and negotiation of other terms. In offerings managed by others in which the Partnership participates as a syndicate, selling group member, dealer or distributor, these departments serve as active coordinators between the managing underwriter and the Partnership’s branch office network.closure were immaterial.
The underwriting activity of the Partnership involves substantial risks. An underwriter may incur losses if it is unable to resell the securities it is committed to purchase or if it is forced to liquidate all or part of its commitment at less than the agreed upon purchase price. Furthermore, the commitment of capital to an underwriting may adversely affect the Partnership’s capital position and, as such, its participation in an underwriting may be limited by the requirement that it must at all times be in compliance with the SEC’s uniform net capital requirements (the “Uniform Net Capital Rule”).
Interest and Dividends Interest and dividends revenue is earned on client margin (loan) account balances, cash and cash equivalents, cash and investments segregated under federal regulations, securities purchased under agreements to resell, partnership loans, for general partnership interests, inventory securities and investment securities. Loans secured by securities held in client margin accounts provide a source of income to the Partnership. The Partnership is permitted to use securities owned by margin clients having an aggregate market value of generally up to 140% of the debit balance in margin accounts as collateral for the borrowings. The Partnership may also use funds provided by free credit balances in client accounts to finance client margin account borrowings. The Partnership’s interest income is impacted by the level of client margin (loan) account balances, cash and cash equivalents, cash and investments segregated under federal regulations, securities purchased under agreements to resell, partnership loans, for general partnership interests, inventory securities and investment securities and the interest rates earned on each. PART I
Item 1.
| Business, continued
|
Significant Revenue Source As of December 31, 2012,2015, the Partnership distributed mutual funds for approximately 7570 mutual fund vendors, includingcompanies. One company, American Funds Distributors, Inc. which represents 19%, represented 20% of the Partnership’s total revenue for the year ended December 31, 2012. This revenue2015, which consisted of commissions,revenue from trades, asset-based fees and account and activity fees, which are described above. All of theThe revenue generated from this vendorcompany relates to business conducted with the Partnership’s U.S. segment.
7
PART I Item 1. | Business, continued |
BUSINESS OPERATIONS Research Department.The Partnership maintains a Research department to provide specific investment recommendations and market information for clients. The department supplements its own research with the services of an independent research service.services. In addition, the Research department provides recommendations for asset allocation, portfolio rebalancing and investment selections for Advisory Solutions client accounts. Client Account Administration and Operations.Employees in the The Partnership has an Operations division arethat is responsible for activities relating to client securities and the processing of transactions with other broker-dealers, exchanges and clearing organizations. These activities include receipt, identification and delivery of funds and securities, internal financial controls, accounting and personnel functions, office services, custody of client securities and the handling of margin accounts. The Partnership processes substantiallyvirtually all of its own transactions. To expedite the processing of orders, the Partnership’s branch office system isoffices are linked to the home office locations through an extensive communications network. Orders for securities are generally captured at the branch electronically, routed to the home office and forwarded to the appropriate market for execution. The Partnership’s processing of paperwork following the execution of a security transaction is generally automated. There is considerable fluctuation during any one year and from year to year in theThe volume of transactions the Partnership processes.processes fluctuates considerably. The Partnership records such transactions and posts its books on a daily basis. The Partnership has a computerized branch office communication system which is principally utilized for entry of security orders, quotations, messages between offices, research of various client account information, and cash and security receipts functions. Home office personnel, including operationsthose in the Operations and compliance personnel,Compliance divisions, monitor day-to-day operations to determine compliance with applicable laws, rules and regulations. Failure to keep current and accurate books and records can render the Partnership liable to disciplinary action by governmental and self-regulatory organizations (“SROs”).
The Partnership clears and settles virtually all of its listed and over-the-counter equities, municipal bond, corporate bond, mutual fund and annuity transactions for its U.S. broker-dealer through the National Securities Clearing Corporation (“NSCC”), Fixed Income Clearing Corporation (“FICC”) and Depository Trust Company (“DTC”), which are all subsidiaries of the Depository Trust and Clearing Corporation located in New York, New York. In conjunction with clearing and settling transactions with NSCC, the Partnership holds client securities on deposit with DTC in lieu of maintaining physical custody of the certificates. The Partnership also uses a major bank for custody and settlement of U.S. treasury securities and Government National Mortgage Association (“GNMA”)Association), Federal National Mortgage Association (“FNMA”) and Federal Home Loan Mortgage Corporation issues. The Canada broker-dealer handles the routing and settlement of client transactions. In addition, the Canada broker-dealer is a member of the Canadian Depository of Securities (“FHLMC”CDS”) issues.and FundServ for clearing and settlement of transactions. CDS effects clearing of securities on the Canadian National Stock Exchange, Toronto Stock Exchange (“TSX”) and TSX Venture Exchange (“CDNX”). Client securities on deposit are also held with CDS and National Bank Correspondent Network. The Partnership is substantially dependent upon the operational capacity and ability of NSCC, DTC, FICC, and Canadian Depository of Securities (“CDS”).CDS. Any serious delays in the processing of securities transactions encountered by these clearing and depository companies may result in delays of delivery of cash or securities to the Partnership’s clients. PART I
Item 1.
| Business, continued
|
Broadridge Financial Solutions, Inc. (“Broadridge”), along with its U.S. business, Securities Processing Solutions, U.S., and its international business, Securities Processing Solutions, International, provide automated data processing services for client account activity and related records for the Partnership in the U.S. and Canada, respectively. The Partnership does not employ its own floor brokers for transactions on exchanges. The Partnership has arrangements with other brokers to execute the Partnership’s transactions in return for a commission based on the size and type of trade. If, for any reason, any of the Partnership’s clearing, settling or executing agents were to fail, the Partnership and its clients would be subject to possible loss. To the extent that the Partnership would not be able to meet the obligations to the clients, such clients might experience delays in obtaining the protections afforded them.
8
PART I Item 1. | Business, continued |
The CanadianCanada broker-dealer has an agreement with Broadridge to provide the securities processing systems, as well as an agreement with Computershare Trust Company of Canada to act as trustee for cash balances held by clients in their retirement accounts. The CanadianCanada broker-dealer is the custodian for client securities and manages all related securities and cash processing, such as trades, dividends, corporate actions, client cash receipts and disbursements, client tax reporting and statements. The Canadian broker-dealer handles the routing and settlement of client transactions. In addition, the Canadian broker-dealer is a member of CDS and FundServ for clearing and settlement of transactions. CDS effects clearing of securities on the Canadian National Stock Exchange (“CNQ”), Toronto Stock Exchange (“TSX”) and TSX Venture Exchange (“CDNX”). Client securities on deposit are also held with CDS and National Bank Correspondent Network (“NBCN”).
Employees.Employees. The Partnership’s financial advisors are employees (or general partners of the Partnership) and are not independent contractors.. As of February 22, 2013,December 31, 2015, the Partnership had approximately 38,00041,000 full and part-time employees and general partners, including its 12,53014,508 financial advisors. The Partnership’s financial advisors are generally compensated on a commission basis and may in addition, be entitled to bonus compensation based on their respective branch office profitability and the profitability of the Partnership. The Partnership has in the past paidpays bonuses to its non-financial advisor employees pursuant to a discretionary formula established by management.management based on the profitability of the Partnership. Employees of the Partnership in the U.S. are bonded under a blanket policy as required by Financial Industry Regulation Authority, Inc. (“FINRA”) rules.policy. The per occurrencePartnership has an aggregate annual coverage limit for employees in the U.S. is $5.0 million,of $50,000,000 subject to a $2.0 million deductible provision. In addition, there is excess coverage with an annual aggregate amount of $45.0 million.deductibles. Employees of the Partnership in Canada are bonded under a blanket policy as required by the Investment Industry Regulation Organization of Canada (“IIROC”). The Partnership has an annual aggregate amount of coverage for employees in Canada is CAD $25.0 million,of C$50,000,000 with a per occurrence limit of C$25,000,000, subject to a CAD $0.05 million deductible provision per occurrence.deductible. The Partnership maintains ana comprehensive initial training program for prospective financial advisors that spans nearly four months which includes preparation for regulatory exams, concentrated instruction in the classroom and on-the-job training in a branch office. During the first phase, U.S. trainees spend nearly two months studyingstudy Series 7 and Series 66 examination materials and takingtake the examinations. In Canada, financial advisors have the requisite examinations completed prior to being hired. After passing the requisite examinations, trainees spend one week incomplete a comprehensive training program in one of the Partnership’s home office training facilities, followed by seven weeks of on-the-job training in their market andrespective markets in a nearby branch location.locations. This training includes reviewing investments, compliance requirements, office procedures, and understanding client needs, as well as establishing a base of potential clients. One final week is then spent inTo complete the initial comprehensive training program, the trainees return to a home office training facility to complete the initial training program. PART I
Item 1.
| Business, continued
|
Five months later,for additional training. Later in their careers, the financial advisor attends anadvisors attend additional training class in aat home office location, and subsequently,office. In addition, the Partnership offers periodic continuing training to its experienced financial advisors for the entirety of their career.careers. Training programs for the more experienced financial advisors continue to focus on meeting client needs and effective management of the branch office.
The Partnership considers its employee relations to be good and believes that its compensation and employee benefits, which include medical, life and disability insurance plans, and profit sharing and deferred compensation retirement plans,401(k) plan, are competitive with those offered by other firms principally engaged in the securities business. Competition.Competition.The Partnership is subject to intense competition in all phases of its business from other securities firms, many of which are substantially larger than the Partnership in terms of capital, brokerage volume and underwriting activities. In addition, the Partnership encounters competition from other organizations such as banks, insurance companies, and others offering financial services and advice. The Partnership also competes with a number of firms offering discount brokerage services, usually with lower levels of personalized service to individual clients. Further, the financial services industry continues to evolve technologically, with some firms now providing lower cost, computer-based "robo-advice" with limited or no personalized service to clients. Clients are freeable to transfer their business to competing organizations at any time, although a fee may be charged to do so.time. There is also intense competition among firms for financial advisors. The Partnership experiences continued efforts by competing firms to hire away its financial advisors, although the Partnership believes that its rate of turnover of financial advisors is in line with that of other comparable firms. REGULATION Broker-Dealer and Investment Adviser Regulation Broker-dealers areRegulation. The securities industry is subject to extensive federal and state laws, rules and regulations whichthat cover all aspects of the securities business, including sales methods, trade practices among broker-dealers, use and safekeeping of client funds and securities, client payment and margin requirements, capital structure of securities firms, record-keeping, and the conduct of directors, officers and employees.
9
PART I Item 1. | Business, continued |
The SEC is the federalU.S. agency responsible for the administration of the U.S.federal securities laws. Its mission is to protect investors, maintain fair, orderly and efficient markets, and facilitate capital formation. Edward Jones is registered as a broker-dealer and investment adviser with the SEC. Edward Jones is subject to periodic examinations by the SEC, review by a designated examining authority, and certain periodic and ad hoc reporting requirements of securities and customer funds. Much of the regulation of broker-dealers has been delegated to SROs, principally FINRA.FINRA, by the SEC. FINRA adopts rules (which are subject to approval by the SEC) that govern the broker-dealer industry and conducts periodic examinations of Edward Jones’ operations. Securities firms are also subject to regulation by state securities commissions and insurance regulators in those states in which they conduct business. Since Edward Jones is registered as a broker-dealer and sells insurance products in all 50 states, Puerto Rico, the U.S. Virgin Islands and the District of Columbia, Puerto RicoEdward Jones is subject to state regulation in all of these states and the U.S. Virgin Islands.territories. The SEC, SROs and state securities commissionsauthorities may conduct administrative proceedings which can result in censure, fine, suspension or expulsion of a broker-dealer, its officers or employees. Edward Jones has in the past been, and may in the future be, the subject of regulatory actions by various agencies that have the authority to regulate its activities (see Part I, Item 3 – Legal Proceedings for more information). PART I
Item 1.
| Business, continued
|
As an investment dealer in all provinces and territories of Canada, the CanadianEdward Jones' Canada broker-dealer is subject to provincial, territorial and federal laws. All provinces and territorial jurisdictions have established securities administrators to fulfill the administration of securities laws. The CanadianEdward Jones' Canada broker-dealer is also subject to the regulation of the CanadianCanada SRO, IIROC, which oversees the business conduct and financial affairs of its member firms, as well as all trading activity on debt and equity marketplaces in Canada. IIROC fulfills its regulatory obligations by implementing and enforcing rules regarding the proficiency, business and financial conduct of member firms and their registered employees, and marketplace integrity rules regarding trading activity on CanadianCanada debt and equity marketplaces. In addition, Edward Jones, OLV and Passport Research are subject to the rules and regulations promulgated under the Investment Advisers Act of 1940 (“Investment Advisers Act”), which requires investment advisers to register with the SEC. Edward Jones, OLV and Passport Research are registered investment advisers. The rules and regulations promulgated under the Investment Advisers Act govern all aspects of the investment advisory business, including registration, trading practices, custody of client funds and securities, record-keeping, advertising and business conduct. Edward Jones, OLV and Passport Research are subject to periodic examinations by the SEC which is authorized to institute proceedings and impose sanctions for violations of the Investment Advisers Act. Pursuant to U.S. federal law, Edward Jones as a broker-dealer belongs to the Securities Investors Protection Corporation (“SIPC”). For clients in the U.S., SIPC provides $500,000 of coverage for missing cash and securities includingin a client's account, with a maximum of $250,000 for cash claims. Pursuant to IIROC requirements, the CanadianCanada broker-dealer belongs to the Canadian Investor Protection Fund (“CIPF”), a non-profit organization that provides investor protection for investment dealer insolvency. For clients in Canada, CIPF limits coverage to CAD $1,000,000C$1,000,000 in total, which can be any combination of securities and cash. The Partnership currently maintains additional protection for U.S. clients provided by Underwriters at Lloyd’s. The additional protection contract provided by Underwriters at Lloyd’s protects clients’ accounts in excess of the SIPC coverage subject to specified limits. This policy covers theft, misplacement, destruction, burglary, embezzlement or abstraction of cash and client securities up to an aggregate limit of $900 million$900,000,000 (with maximum cash coverage limited to $1,900,000 per client) for covered claims of all U.S. clients of Edward Jones. Market losses are not covered by SIPC or the additional protection. In addition, Edward Jonesthe Partnership has cash and OLV are subjectinvestments segregated in special reserve bank accounts for the benefit for U.S. clients pursuant to the rules and regulationsCustomer Protection Rule 15c3-3 of the Investment AdvisersSecurities Exchange Act of 1940, which require investment advisers to register with the SEC. The Investment Advisers Act’s rules and regulations govern all aspects of the investment advisory business, including registration, trading practices, custody of client funds and securities, record-keeping, advertising and business conduct.1934, as amended (“Customer Protection Rule”).
10
PART I Item 1. | Business, continued |
Additional legislation, changes in rules promulgated by the SEC, the Department of Labor ("DOL") and SROs, and/or changes in the interpretation or enforcement of existing laws and rules, may directly affect the operations and profitability of broker-dealers and investment advisers. With the passage of the Dodd-Frank Wall Street Reform and Consumer Protection Act (“Dodd-Frank Act”), the SEC has been directed to study existing practices in the industry and granted discretionary rulemaking authority to establish, among other things, comparable standards of conduct for broker-dealers and investment advisers when providing personalized investment advice about securities to retail clients and such other clients as the SEC provides by rule. The SEC may engage in rulemaking or issue interpretive guidance concerning the standard of conduct for broker-dealers and investment advisers. FINRA or other regulatory authorities may also issue rules related to the Dodd–Frank Act, but it is unclearAct. In addition, the DOL has published a proposed rule on the definition of the term "fiduciary" and exemptions related thereto in the context of the Employee Retirement Income Security Act. The Partnership cannot predict at this time what impact such rulemaking activities will have on the Partnership or its operations. PART I
Item 1.
| Business, continued
|
Trust Regulation of EJTC and Regulation of JFC as EJTC’s Parent PursuantParent. EJTC is a federally chartered savings and loan association that operates under a limited purpose “trust-only” charter, which generally restricts EJTC to the Dodd-Frank Act, effective July 21, 2011 authority for theacting solely in a trust or fiduciary capacity. EJTC and JFC are subject to supervision and regulation of EJTC was transferred from the Office of Thrift Supervision (“OTS”) toby the Office of the Comptroller of the Currency (“OCC”). As of the same date, responsibility for the supervision and regulation of JFC, based on its status as a savings and loan holding company (“SLHC”) (which such status is the result of its 100% ownership of EJTC), was transferred from the OTS to the Board of Governors of the Federal Reserve System (“FRB”). The Dodd-Frank Act, however, allows entities controlling a savings association that functions solely in a trust or fiduciary capacity to cease to be a SLHC. On October 31, 2012, JFC received confirmation from the FRB that its request to deregister as a SLHC had been approved. JFC is now subject to supervision and regulation as a holding company by the OCC.
Uniform Net Capital Rule Rule.As a result of its activities as a broker-dealer and a member firm of FINRA, Edward Jones is subject to the Uniform Net Capital Rule 15c3-1 of the Securities Exchange Act of 1934, as amended (“Uniform Net Capital Rule”) which is designed to measure the general financial integrity and liquidity of a broker-dealer and the minimum net capital deemed necessary to meet the broker-dealer’s continuing commitments to its clients. The Uniform Net Capital Rule provides for two methods of computing net capital and Edward Jones has adopted what is generally referred to as the alternative method. Minimum required net capital under the alternative method is equal to the greater of $0.25 million$250,000 or 2% of the aggregate debit items, as defined.defined under the Customer Protection Rule. The Uniform Net Capital Rule prohibits withdrawal of equity capital whether by payment of dividends, repurchase of stock or other means, if net capital would thereafter be less than minimum requirements. Additionally, certain withdrawals require the approval of the SEC to the extent they exceed defined levels even though such withdrawals would not cause net capital to be less than 5% of aggregate debit items. In computing net capital, various adjustments are made to exclude assets which are not readily convertible into cash and to provide a conservative valuation of other assets, such as securities owned. Failure to maintain the required net capital may subject Edward Jones to suspension or expulsion by FINRA, the SEC and other regulatory bodies and/or exchanges and may ultimately require liquidation. Edward Jones has, at all times, been in compliance with the Uniform Net Capital Rule. The CanadianCanada broker-dealer and EJTC are also required to maintain specified levels of regulatory capital. Each subsidiaryof these subsidiaries has, at all times, been in compliance with the applicable capital requirements in the jurisdictions in which it operates. PART I
AVAILABLE INFORMATIONItem 1.
| Business, continued
|
The Partnership files annual, quarterly, and current reports and other information with the SEC. The Partnership’s SEC filings are available to the public on the SEC’s website at www.sec.gov. FORWARD-LOOKING STATEMENTS This Annual Report on Form 10-K, and in particular Part II, Item 7 – Management’s Discussion and Analysis of Financial Condition and Results of Operations, contains forward-looking statements within the meaning of U.S. securities laws. You can identify forward-looking statements by the use of the words “believe,” “expect,” “anticipate,” “intend,” “estimate,” “project,” “will,” “should,” and other expressions which predict or indicate future events and trends and which do not relate to historical matters. You should not rely on forward-looking statements, because they involve known and unknown risks, uncertainties and other factors, some of which are beyond the control of the Partnership. These risks, uncertainties and other factors may cause the actual results, performance or achievements of the Partnership to be materially different from the anticipated future results, performance or achievements expressed or implied by the forward-looking statements.
11
PART I Item 1. | Business, continued |
Some of the factors that might cause differences between forward-looking statements and actual events include, but are not limited to, the following: (1) general economic conditions;conditions, including an economic downturn or volatility in the U.S. and/or global securities markets; (2) regulatory actions; (3) changes in legislation or regulation, including new regulations under the Dodd-Frank Act;Act and any rules promulgated by the DOL; (4) actions of competitors; (5) litigation; (6) the ability of clients, other broker-dealers, banks, depositories and clearing organizations to fulfill contractual obligations; (7) changes in interest rates; (8) changes in technology;technology and other technology-related risks; (9) a fluctuation or decline in the fair value of securities; and (10) the risks discussed under Part I, Item 1A – Risk Factors. These forward-looking statements were based on information, plans, and estimates at the date of this report, and the Partnership does not undertake to update any forward-looking statements to reflect changes in underlying assumptions or factors, new information, future events or other changes. 12
PART I The Partnership is subject to a number of risks potentially impacting its business, financial condition, results of operations and cash flows. In addition to the risks and uncertainties discussed elsewhere in this Annual Report on Form 10-K, or in the Partnership’s other filings with the SEC, the following are some important factors that could cause the Partnership’s actual results to differ materially from results experienced in the past or those projected in any forward-looking statement. The risks and uncertainties described below are not the only ones facing the Partnership. Additional risks and uncertainties not presently known to the Partnership or that the Partnership currently deems immaterial could also have a material adverse effect on the Partnership’s business and operations. If any of the matters included in the following risks were to occur, the Partnership’s business, financial condition, results of operations and cash flows could be materially adversely affected. RISK RELATED TO THE PARTNERSHIP’S BUSINESS MMARKETarket CONDITIONSonditions —As a part of the securities industry, a downturn in the U.S. and/or global securities markets historically has, and in the past had, andfuture could in the future have, a significant negative effect on revenues and could significantly reduce or eliminate profitability of the Partnership.Partnership. General political and economic conditions and events such as U.S. fiscal monetary policy, economic recession, natural disasters, terrorist attacks, war, changes in local economic and political conditions, regulatory changes or changes in the law, or interest rate or currency rate fluctuations could create a downturn in the U.SU.S. and/or global securities markets. The securities industry, and therefore the Partnership, is highly dependent upon market prices and volumes which are highly unpredictable and volatile in nature. Events such as global recession, frozen credit markets, and institutional failures and government-sponsored bailouts of a number of large financial services companies, as well as debt ceiling debates, and sovereign credit downgrades, could make the capital markets increasingly volatile. Weakened global economic conditions and an unsettled nature of financial markets, among other things, could cause significant declines in the Partnership’s net revenues which willwould adversely impact its overall financial results. WithAs the Partnership’s composition of net revenue nowbecomes more heavily weighted towards asset-based fee revenue, than trade revenue as in the past, a decrease in the market value of assets due to market declines can causehave a much moregreater negative impact on the Partnership’s financial results than experienced in prior years, due to the fact that asset-based fees are earned on the value of the underlying client assets. Conversely, in times
Market volatility could also cause clients to move their investments to lower margin products, or withdraw them, which could have an adverse impact on the profitability of improved market conditions the Partnership’s asset-based fee revenue would be positively impacted due to the increase in the market value of assets on which fees are earned.Partnership. In addition, the Partnership could experience a material reduction in volume and lower securities prices in times of unfavorable economic conditions, which would result in lower commissiontrade revenue, decreased margins and losses in dealer inventory accounts and syndicate positions. This would have a material adverse impact on the profitability of the Partnership’s operations. Financial markets continueFurthermore, if the market were to experience volatility anda downturn or the riskseconomy were to sustained global economic growth remain high. Furthermore,enter into a recession, the Partnership would be subject to increased risk of its clients being unable to meet their commitments, such as margin obligations if there was an economic recession.obligations. If clients are unable to meet their margin obligations, the Partnership has an increased risk of losing money on margin transactions and incurring additional expenses defending or pursuing claims. Developments such as lower revenues and declining profit margins could reduce or eliminate the Partnership’s profitability.
13
PART I Item 1A. | Risk Factors, continued |
LEGISLATIVEANDegislativeand REGULATORYegulatory INITIATIVESnitiatives —Newly adoptedProposed, potential and recently enacted federal and state legislation, rules and pending regulatory proposals intended to reform the financial services industryregulations could significantly impact the regulation and operation of the Partnership and its subsidiaries, its revenue and its profitability.subsidiaries. In addition, such laws, rules and regulations may significantly alter or restrict the Partnership’s historic business practices, which could negatively affect its operating results. The Partnership is subject to extensive regulation by federal and state regulatory agencies and by SROs, within the industry.SROs. The Partnership operates in a regulatory environment that is subject to ongoing change and has seen significantly increased regulation in recent years. The Partnership may be adversely affected as a result of new or revised legislation or regulations, changes in federal, state or foreign tax laws and regulations, or by changes in the interpretation or enforcement of existing laws and regulations. The Partnership continues to monitor several regulatory initiatives and proposed, potential and enacted legislation and rules (“Legislative and Regulatory Initiatives”), including, but not limited to: The Dodd-Frank Act.Act. The Dodd-Frank Act, passed by the U.S. Congress and signed by the Presidentinto law in July 21, 2010, includes provisions that could potentially impact the Partnership’s operations. Since the passage of the Dodd-Frank Act, the Partnership has not been required to enact material changes to its operations. However, the Partnership continues to review and evaluate the provisions of the Dodd-Frank Act and the impending rules to determine what impact or potential impact itthey may have on the financial services industry, the Partnership and its operations. Among the numerous potentially impactful provisions in the Dodd-Frank Act are: (i) pursuant to Section 913 of the Dodd-Frank Act, the SEC staff issued a study recommending a universal fiduciary standard of care applicable to both broker-dealers and investment advisers when providing personalized investment advice about securities to retail clients, and such other clients as the SEC provides by rule. The standard of conduct is expected to require the broker-dealer and investment adviser to act in the best interest of the client without regard to the financial or other interest of the broker-dealer or investment adviser providing the advice;rule; and (ii) pursuant to Section 914 of the Dodd-Frank Act, a new SRO is expected to be proposed to regulate investment advisers.advisers could be proposed. In addition, the Dodd-Frank Act contains new or enhanced regulations that could impact specific securities products offered by the Partnership to investors and specific securities transactions. Proposed rules related to all of these provisions have not yet been adopted by regulators. It is unclearThe Partnership cannot predict what impact any such rules, if adopted, would have on the Partnership. Additionally, the Partnership continues to monitor several other proposed regulations and rules that do not presently appear as though they will have a material impact on the Partnership, such as Title X of the Dodd-Frank Act, which established the Bureau of Consumer Financial Protection with broad authority to issue new regulations, and proposed rules related to Section 956 of the Dodd-Frank Act, which would prohibit certain types of incentive-based compensation arrangements. In their present form, the Partnership does not believe these regulations and rules will have a material impact on the Partnership, but if revised the impact on the Partnership could be material.
It is expected that FINRA or other regulatory authorities will continue to issue rules related to the Dodd-Frank Act in the future and the Partnership will continue to monitor and review any such rules.
PART I
Item 1A.
| Risk Factors, continued
|
Department of Labor. Fiduciary Rule Proposal. In 2010, the Department of Labor (the “DOL”)DOL proposed a modification to a rule that would have impacted the Employee Retirement Income Security Act’s definition of “fiduciary” and potentially limited certain of Edward Jones’ business practices. In September 2011, the DOL announced that it was withdrawing the proposed rule and stated its intention to re-propose the rule in the future. On April 20, 2015, the DOL published in the Federal Register its proposed rule on the definition of the term "fiduciary" and exemptions related thereto. As proposed, the rule would impact qualified accounts, specifically, IRAs and other retirement accounts. The DOL held public hearings on the proposed rule in August 2015. At this time, the DOL has not yet re-proposedpublished a final rule and has publicly expressed there will be changes to the proposal in the final rule. As proposed, the rule butwould impact a significant portion of client assets under care. As proposed, the Partnership expects such re-proposal to occur in the near future. The DOL has indicated that the re-proposed rule willwould have a material impact IRAs and has indicated an intention to address what has been generally described as “third party payments,” such as revenue sharing. The Partnership cannot predict what the re-proposed rule will say, what its scope will be, when or if it will be re-proposed or adopted, or what the impact will be on the Partnership. However, any such rule could impact the operations of Edward Jones and the profitability of the Partnership. International Financial Reporting Standards. The International Accounting Standards Board developed a core set of accounting standards to act as a framework for financial reporting known as the International Financial Reporting Standards (“IFRS”). By 2007, the majority of listed European Union companies, including banks and insurance companies, began using IFRS to prepare financial statements. In contrast, the majority of public companies in the U.S. prepare financial statements under accounting principles generally accepted in the U.S. (“GAAP”).
The SEC is evaluating adoption of IFRS in the U.S. It is unclear at this time whether the SEC will propose mandatory adoption of IFRS or some other form of GAAP and IFRS harmonization.
The Partnership is currently waiting on further guidance from the SEC to determine what impact, if any, the adoption of IFRS in the U.S. could have on its financial position orPartnership's results of operations. If adopted, IFRS could significantly impact the way the Partnership determines income before allocations to partners, allocations to partners, or returns on partnership capital. In addition, switching to IFRS would be a complex endeavor for the Partnership. The Partnership may need to develop new systems and controls around the principles of IFRS and the specific costs associated with this conversion are uncertain.
Rule 12b-1 Fees. The Partnership receives various payments in connection with the purchase, sale and on-going servicing of mutual fund shares by its clients. Those payments include Rule 12b-1 fees (i.e., service fees) and expense reimbursements. Rule 12b-1, under the Investment Company Act of 1940, allows a mutual fund to pay distribution and marketing expenses out of the fund’s assets. The SEC currently does not limit the size of Rule 12b-1 fees that funds may pay. FINRA does impose such limitations. However, in July, 2010 the SEC proposed reform of Rule 12b-1. The proposal called for the rescission of Rule 12b-1 and a proposed new Rule 12b-2 which would allow funds to deduct a fee on an annual basis of up to 25 basis points to pay for distribution expenses without a cumulative cap on this fee. Additionally, the proposal includes other amendments that would permit funds to deduct an asset-based distribution fee in which the fund may deduct ongoing sales charges with no annual limit, but cumulatively the asset-based distribution fee could not exceed the amount of the highest front-end load for a particular fund. The proposed rule also allows funds to create and distribute a class of shares at net asset value and dealers could establish their own fee schedule. The proposal includes additional requirements for disclosure on trade confirmations and in fund documents. These proposed rules have not been enacted and the Partnership cannot predict with any certainty whether or which of these proposals will be enacted in their current form, revised form or not enacted at all. In addition, the Partnership is committing significant resources to be prepared for the opportunities and challenges that will arise as a result of the final rule. We are not yet able to determinepredict how the potential financialfinal DOL rules may differ from the proposed rules. As such, the Partnership cannot predict at this time the full extent of any adverse impact on itsour operating results related to this proposed reform of Rule 12b-1. For further information onor the amount of Rule 12b-1 fees earned by the Partnership, see Item 7 – Management’s Discussion and Analysis of Financial Condition and Results of Operations.overall financial services industry.
PART I
Item 1A.
| Risk Factors, continued
|
Health Care Reform.The Patient Protection and Affordable Care Act, (“PPACA”)which was signed into law in March, 2010. PPACA requires employers2010, amended and revised by the Health Care and Education and Reconciliation Act of 2010 (collectively referred to provide affordable coverage with a minimum essential benefit to full-time employees or pay a financial penalty.as the “Affordable Care Act”). The billAffordable Care Act contains provisions that go into effectwill be implemented over the next several years that expand employee eligibility formay impact the Partnership’s medical plan and places limits on plan design. Regulatory guidance required to fully assess the impact of this law is still forthcoming. Accordingly, thePartnership. The Partnership is not yet able to determine the full potential financial impact of the Affordable Care Act. Money Market Mutual Funds. The SEC adopted amendments to the rules that govern money market mutual funds in July 2014. The amendments preserve stable net asset value for certain retail funds and government funds. The amendments also impose, under certain circumstances, liquidity fees and redemption gates on non-government funds. The Partnership continues to evaluate the impact of these amendments on its operating results in future years.operations and to consider the implementation of policies and procedures to address the amendments. Federal “Do Not Call” Regulations.The Partnership is also subject to federal
14
PART I Item 1A. | Risk Factors, continued |
These Legislative and state regulations like other businesses and must evaluate and adapt to new regulations as they are adopted. In particular, the Partnership believes the federal “do not call” regulations enacted in recent years have affectedRegulatory Initiatives may impact the manner in which many of its financial advisors conduct their businesses. While the Partnership believes it is in compliancemarkets its products and services, manages its business and operations, and interacts with these regulations, these regulationsclients and regulators, any or all of which could materially impact the Partnership’s future revenues or results of operations. Money Market Mutual Funds. In May 2010,operations, financial condition, and liquidity. Regulatory changes or changes in the SEC adopted several reforms to money market funds (“MMF”) that were designed to, among other things, strengthen maturity limitations,law could increase diversification,compliance costs which would adversely impact our profitability. However, the Partnership cannot presently predict when or if any of the proposed or potential Legislative and improve liquidity standards. Following those reforms, the President’s Working Group on Financial Markets, the Financial Stability Oversight Council (“FSOC”), and the SEC continued to evaluate and discuss additional reforms to address what they perceived to be structural vulnerabilities in MMFs. In November 2012, the FSOC, using its authority under the Dodd-Frank Act, proposed structural reforms to MMFs. Specifically, the FSOC proposed three alternatives for consideration: requiring MMFs to have (i) a floating net asset value; (ii) a net asset value buffer of 1% with a requirement that a percentage of a shareholder’s highest account value in excess of $100,000 during the previous 30 days be made available for redemption on a delayed basis and be the first amount at risk under certain MMF loss scenarios; and (iii) a net asset value buffer of 3% with other measures that could include more stringent investment diversification requirements, increased minimum liquidity levels, and/or more robust disclosure requirements. These FSOC alternatives are only proposals; they are not rules. It is unclear whether the proposalsRegulatory Initiatives will be adopted in their current form, in a modified form,enacted or at all. It is likelythe impact that any FSOC recommendation would require rulemaking by the SEC, which the SEC would likely propose for further public comment. Based on that, while MMF reforms in the nature of FSOC’s proposals couldLegislative and Regulatory Initiatives will have an impact on the Partnership’s MMF, it is currently unclear what that impact would be.Partnership.
Any of the foregoing regulatory initiatives could adversely affect the Partnership’s business operations, business model, and profitability. The Partnership cannot predict with any certainty whether or which of the regulatory proposals that have not yet been adopted will be adopted, and if so whether they will be adopted in their current form or adopted subject to further revisions. If adopted, some of these initiatives could significantly and adversely impact the Partnership’s operating costs, its structure, its ability to generate revenue, and its overall profitability.
CCOMPETITIONompetition —The Partnership is subject to intense competition for clients and personnel, and many of its competitors have greater resources. All aspects of the Partnership’s business are highly competitive. The Partnership competes for clients and personnel directly with other securities firms and increasingly with other types of organizations and other businesses offering financial services, such as banks and insurance companies. PART I
Item 1A.
| Risk Factors, continued
|
Many of these organizations have substantially greater capital and additional resources, and some entities offer a wider range of financial services. Over the past several years, there has been significant consolidation of firms in the financial services industry, forcing the Partnership to compete with larger firms with greater capital and resources, brokerage volume and underwriting activities, and more competitive pricing. Also, the Partnership continues to compete with a number of firms offering discount brokerage services, usually with lower levels of personalized service to individual clients. Further, the financial services industry continues to evolve technologically, with some firms now providing lower cost, computer-based "robo-advice" with limited or no personalized service to clients. Clients are freeable to transfer their business to competing organizations at any time, although theretime. The Partnership's continued ability to compete based on a business model designed to serve clients through personalized relationships with financial advisors and branch teams in order to provide tailored solutions may be impacted by the evolving financial services industry and client needs. If financial advisors do not meet client needs, the Partnership could lose clients, thereby reducing revenues and profitability. Further, the Partnership faces increased competition for clients from larger firms in its non-urban markets, and from a fee to do so.broad range of firms in the urban and suburban markets in which the Partnership competes. Competition among financial services firms also exists for financial advisors and other personnel. The Partnership’s continued ability to expand its business and to compete effectively depends on the Partnership’s ability to attract qualified employees and to retain and motivate current employees. In addition, the Partnership's business is dependent on financial advisors' ability to attract and retain clients and assets. If the Partnership���sPartnership’s profitability decreases, then bonuses paid to financial advisors and other personnel, along with profit-sharing contributions, may be decreased or eliminated, increasing the risk that personnel could be hired away by competitors. In addition, the Partnership has recently faced increased competition from larger firms in its non-urban markets, and from a broad range of firmsduring an extended downturn in the urban and suburban markets in whicheconomy, there is increased risk the Partnership competes.Partnership’s more successful financial advisors may leave because a significant portion of their compensation is variable based on the Partnership’s profitability. The competitive pressure the Partnership experiences could have an adverse effect on its business, results of operations, financial condition and cash flow. For additional information, see Part I, Item 1—1 – Business Operations—– Business Operations – Competition. BBRANCHranch OFFICEffice SYSTEMystem —The Partnership’s system of maintaining branch offices primarily staffed by one financial advisor may expose the Partnership to risk of loss or liability from the activities of the financial advisors and to increases in rent related to increased real property values. MostThe vast majority of the Partnership’s branch offices are staffed by a single financial advisor and a branch office administrator withoutadministrator. Branch offices do not have an onsite supervisor as would be found at broker-dealers with multi-broker branches. The Partnership’s primary supervisory activity is conducted from its home offices. Although this method of supervision is designed to comply with all applicable industry and regulatory requirements, it is possible that the Partnership is exposed to a risk of loss arising from alleged imprudent or illegal actions of its financial advisors. Furthermore, the Partnership may be exposed to further losses if additional time elapses before its supervisory personnel detect problem activity.
15
PART I Item 1A. | Risk Factors, continued |
The Partnership maintains personal financial and account information and other documents and instruments for its clients at its branch offices, both physically and in electronic format. Despite reasonable precautions, because the branch offices are relatively small and some are in remote locations, the security systems at these branch offices may not prevent theft of such information. If security of a branch is breached and personal financial and account information is stolen, the Partnership’s clients may suffer financial harm and the Partnership could suffer financial harm, reputational damage and regulatory issues. In addition, the Partnership leases its branch office spaces and a material increase in the value of real property may increase the amount of rent paid, which will negatively impact the Partnership’s profitability. PART I
Item 1A.
| Risk Factors, continued
|
INABILITYTOnability to ACHIEVE OURchieve Financial Advisor GROWTHrowth RATEate —If the Partnership is unable to fully achieve its goals for hiring financial advisors or the attrition rate of its financial advisors is higher than its expectations, the Partnership may not be able to meet its planned growth rates or maintain its current number of financial advisors.
Historically, during times of market downturnsvolatility it is more difficult for the Partnership to attract qualified applicants for financial advisor positions. In addition, the Partnership relies heavily on referrals from its current financial advisors in recruiting new financial advisors. During an economic downturn,times of market volatility, current financial advisors can be less effective in recruiting potential new financial advisors through referrals. Regardless of the presence of a market downturn, the Partnership may not be able to meet its hiring objectives. For instance,volatility, the Partnership has not met annual hiring objectives in eight of the last 10 years from 2002 through 2011. For 2012, the Partnership methistorically been able to consistently meet its annual hiring objective, but theregrowth objectives. There can be no assurance that the Partnership will be able to hiregrow at desired rates in future periods or maintain its current number of financial advisors. A significant number of the Partnership’s financial advisors have been licensed as brokers for less than three years. As a result of their relative inexperience, many of these financial advisors have encountered or may encounter difficulties developing or expanding their businesses. Consequently, the Partnership has periodically experienced higher rates of attrition, particularly with respect to the less experienced financial advisors and especially during times of market downturns.volatility. The Partnership generally loses more than half of its financial advisors who have been licensed for less than three years. In the past, theThe Partnership also has experiencedmay experience increased financial advisor attrition due to increased competition from other financial services companies and efforts by those firms to recruit its financial advisors. There can be no assurance that the attrition rates the Partnership has experienced in the past will not continue or increase in the future. In addition, the Partnership raised the performance standards for its financial advisors in 2011, which may attribute to higher attrition for financial advisors unable to meet these performance standards. Either the failure to achieve hiring goals or an attrition rate higher than anticipated may result in a decline in the revenue the Partnership receives from asset-based fees, commissions and other securities related revenues. As a result, theThe Partnership may not be able to either maintain its current number of financial advisors or achieve the level of net growth upon which its business model is based and its revenues and results of operations may be adversely impacted. Increased Financial Advisor Compensation — Compensation paid to new financial advisors, as well as current financial advisors participating in a retirement transition plan, could negatively impact the Partnership’s profitability and capital if the increased compensation does not help retain financial advisors and clients. In order to attract candidates to become financial advisors, the Partnership has recently increased the compensation paid toprovides new financial advisors a minimum base compensation, as well as a bonus based on the amount of new assets gathered, during the first three years as a financial advisor. The intent is to attract a greater number of high quality recruits with an enhanced level of base compensation in order to meet the Partnership’s growth objectives.objectives and to serve more clients. If the Partnership increases new financial advisor base compensation and does not comparativelyresult in a corresponding increase in the level of productivity and retention rate of these financial advisors, then thethis additional compensation could negatively impact the Partnership’s financial performance in future periods.
16
PART I Item 1A. | Risk Factors, continued |
Additionally, to better transition clients to a new financial advisor when their current financial advisor retires, as well as to retain quality financial advisors until retirement, the Partnership, in certain circumstances, offers individually tailored retirement transition plans to financial advisors. These retirement transition plans may offer increased financial consideration prior to and after retirement for financial advisors who provide client transition services in accordance with a retirement and transition employment agreement. If this increased financial consideration does not increase client asset retention or help to retain quality financial advisors until retirement, the additional financial consideration could negatively impact the Partnership’s profitability and capital in future periods. In addition, the Partnership expects that the retirement transition plans will result in higher financial advisor compensation expense in the future. LLITIGATIONANDitigation and REGULATORYegulatory INVESTIGATIONSANDnvestigations and PROCEEDINGSroceedings —As a securities firm, the Partnership is subject to litigation involving civil plaintiffs seeking substantial damages and regulatory investigations and proceedings, which have increased over time and are expected to continue to increase even as global market conditions improve.increase. Many aspects of the Partnership’s business involve substantial litigation and regulatory risks. The Partnership is, from time to time, subject to examinations, and informal inquiries and investigations by regulatory and other governmental agencies. agencies, as well as the SROs of which it is a member, including FINRA. Such matters have in the past, and could in the future, lead to formal actions, which may impact the Partnership’s business. In the ordinary course of business, the Partnership also is subject to arbitration claims, lawsuits and other significant litigation such as class action suits. Over time, there has been increasing litigation involving the securities industry, including class action suits that generally seek substantial damages. The Partnership has incurred significant expenses to defend and/or settle claims in the past. In view of the inherent difficulty of predicting the outcome of such matters, particularly in cases in which claimants seek substantial or indeterminate damages or in actions which are at very preliminary stages, the Partnership cannot predict with certainty the eventual loss or range of loss related to such matters. Due to the uncertainty related to litigation and regulatory investigations and proceedings, the Partnership cannot determine if future litigation will have a material adverse effect on its consolidated financial condition. Such legal actions may be material to future operating results for a particular period or periods. See Part I, Item 3 – Legal Proceedings for more information regarding certain unresolved claims. RRELIANCEONeliance on THIRDhird PARTIESarties —The Partnership’s dependence on third-party organizations exposes the Partnership to disruption if their products and services are no longer offered or supported or develop defects.defects. The Partnership incurs obligations to its clients which are supported by obligations from firms within the industry, especially those firms with which the Partnership maintains relationships by which securities transactions are executed. The inability of an organization with which the Partnership does a large volume of business to promptly meet its obligations could result in substantial losses to the Partnership. The Partnership is particularly dependent on Broadridge, which acts as the Partnership’s primary vendor for providing accounting and record-keeping for client accounts in both the U.S. and Canada. The Partnership’s communications and information systems are integrated with the information systems of Broadridge. There are relatively few alternative providers to Broadridge and although the Partnership has analyzed the feasibility of performing Broadridge’s functions internally, the Partnership may not be able to do it in a cost-effective manner or otherwise. The Partnership also utilizes the sub-accounting functionality of The Bank of New York Mellon Corporation (“BNY Mellon”) for mutual fund investments held by the Partnership’s clients. BNY Mellon’s sub-accounting technology solution enables the Partnership to provide fund shareholder accounting services to mutual funds. Consequently, any new computer systems or software packages implemented by Broadridgethese third parties which are not compatible with the Partnership’s systems, or any other interruption or the cessation of service by Broadridgethese third parties as a result of systems limitations or failures, could cause unanticipated disruptions in the Partnership’s business which may result in financial losses and/or disciplinary action by governmental agencies and/or SROs.
17
PART I Item 1A. | Risk Factors, continued |
CANADIANanada OPERATIONSperations —The Partnership is focusing heavily on efforts,has made, and intends to continue to make, substantial investments to support the potential profitability of its CanadianCanada operations, which have not yet achieved profitability. The Partnership commenced operations in Canada in 1994 and plans to continue to expand its branch system in Canada. The CanadianCanada operations have operated at a substantial deficit from inception. The Partnership mayintends to make additional investments in its CanadianCanada operations to address short-term liquidity, capital, or expansion needs, which could be substantial. However, the number of Canadian financial advisors employed by the Partnership has declined since 2009. This decline could affect the ability of the Partnership to reach its profitability goals for the Canadian segment. There is no assurance the CanadianCanada operations will ultimately become profitable. For further information on the CanadianCanada operations, see Part II, Item 8 – Financial Statements and Supplementary Data – Note 1613 to the Consolidated Financial Statements. Capital Requirements; Uniform NetCAPITAL LIMITATIONS; UNIFORM NET CAPITALapital and Customer Protection RULEules —The SEC’s Uniform Net Capital Rule imposes minimum net capital requirements and could limit the Partnership’s ability to engage in certain activities which are crucial to its business. Adequacy of capital is vitally important to broker-dealers, and lack of sufficient capital may limit the Partnership’s ability to compete effectively. In particular, lack of sufficient capital or compliance with the Uniform Net Capital Rule may limit Edward Jones’ ability to commit to certain securities activities such as underwriting and trading, which require significant amounts of capital, its ability to expand margin account balances, as well as its commitment to new activities requiring an investment of capital. FINRA regulations and the Uniform Net Capital Rule may restrict Edward Jones’ ability to expand its business operations, including opening new branch offices or hiring additional financial advisors. Consequently, a significant operating loss or an extraordinary charge against net capital could adversely affect Edward Jones’ ability to expand or even maintain its present levels of business. In addition, pursuant to the Customer Protection Rule, the Partnership has cash and investments segregated in special reserve bank accounts for the benefit for U.S. clients. Increased regulations for the banking industry may impact the Partnership's ability to find institutions to place those segregated client funds. In addition to the regulatory requirements applicable to Edward Jones, EJTC and the CanadianCanada broker-dealer are subject to regulatory capital requirements in the U.S. and in Canada. Failure by the Partnership to maintain the required net capital for any of its subsidiaries may subject it to disciplinary actions by the SEC, FINRA, IIROC, OCC or other regulatory bodies, which could ultimately require its liquidation. In the U.S., Edward Jones may be unable to expand its business and may be required to restrict its withdrawal of subordinated debt and partnership capital in order to meet its net capital requirements. LLIQUIDITYiquidity —The Partnership’s business in the securities industry requires that sufficient liquidity be available to maintain its business activities, and it may not always have access to sufficient funds.funds. Liquidity, or ready access to funds, is essential to the Partnership’s business. The currentA tight credit market environment could have a negative impact on itsthe Partnership’s ability to maintain sufficient liquidity to meet its working capital needs. Short-term and long-term financing are two sources of liquidity that could be affected by the currenta tight credit market. AsIn a result of the concerns about the stability of the markets in general, sometight credit market, lenders have reducedmay reduce their lending to borrowers, including the Partnership. There is no assurance that financing will be available at attractive terms, or at all, in the future. A significant decrease in the Partnership’s access to funds could negatively affect its business and financial management in addition to its reputation in the industry. PART I
Item 1A.
| Risk Factors, continued
|
In addition, there is increased focus by regulators on the importance of effective liquidity risk management practices. Many limited partners subordinated limited partners and general partners have financed the initial and subsequentfinance their Partnership capital contributions by obtaining personal bank loans. Any such bank loan agreement is and will be between the limited partner and the bank. The Partnership performs certain administrative functions for the majority of limited partner bank loans, but does not guarantee thelimited partner bank loans, nor can limited partners pledge their Partnership interestInterests as collateral for the bank loan. Partnersloans. Limited partners who finance all or a portion of their Partnership interestInterests with bank financingloans may be more likely to request the withdrawal of capital to repay such obligations should the Partnership experience a period of reduced earnings. Any withdrawals by general partners, subordinated limited partners or limited partners are subject to the terms of the Partnership Agreement and would reduce the Partnership’s available liquidity and capital.
18
PART I Item 1A. | Risk Factors, continued |
The Partnership makes loans available to those general partners (other than those who are members of the Executive Committee) thatwho require financing for some or all of their individualPartnership capital contributions. Additionally, in limited circumstances, a general partner capital contributions.may withdraw from the Partnership and become a subordinated limited partner while he or she still has an outstanding partnership loan. Loans made by the Partnership to general partners are generally for a period of one year, but are expected to be renewed and bear interest at aan interest rate defined in the loan documents. The Partnership recognizes interest income for the interest paid byhas full recourse against any general partners in connection with such loans. General partners borrowing from thepartner that defaults on his or her Partnership are required to repay such loans by applying earnings received from the Partnership to such loans. As a result,loan obligations. However, there is no assurance that general partner’spartners will be able to repay the interest and/or the principal amount of their Partnership loans at or prior to its maturity. If general partners are unable to repay the interest and/or the principal amount of their Partnership loans at or prior to maturity, the Partnership could be adversely impacted. UUPGRADEOFpgrade of TECHNOLOGICALechnological SYSTEMSystems —The Partnership maywill engage in significant technology initiatives in the future which may be costly and could lead to disruptions. From time to time, the Partnership has engaged in significant technology initiatives and expects to continue to do so in the future. Such initiatives are not only necessary to better meet the needs of the Partnership’s clients, but also to satisfy new industry standards and practices, and better secure the transmission of clients’ information on the Partnership’s systems.systems, and improve operational efficiency. With any major system replacement, there will be a period of education and adjustment for the branch and home office employees utilizing the system. Following any upgrade or replacement, if the Partnership’s systems or equipment doesdo not operate properly, isare disabled or failsfail to perform due to increased demand (which might occur during market upswings or downturns), or if a new system or system upgrade contains a major problem, the Partnership could experience unanticipated disruptions in service, including interrupted trading, slower response times, decreased client service and client satisfaction, and delays in the introduction of new products and services, any of which could result in financial losses, liability to clients, regulatory intervention or reputational damage. Further, the inability of the Partnership’s systems to accommodate a significant increase in volume of transactions also could constrain its ability to expand its business. PART I
Item 1A.
| Risk Factors, continued
|
INTERESTnterest RATEate ENVIRONMENTnvironment —The Partnership’s profitability is impacted by thea low interest rate environment.
The currentA low interest rate environment adversely impacts the interest income the Partnership earns from clients’ margin loans, the investment of excess funds, and securities the Partnership owns, as well as the fees earned by the Partnership through its minority ownership in Passport Research, which is the investment adviser for two money market funds made available to the Edward Jones money market funds.Partnership's clients. While thea low interest rate environment positively impacts the Partnership’s expenses related to liabilities that finance certain assets, such as amounts payable to clients and other interest-bearing liabilities, its interest bearinginterest-bearing liabilities are less impacted by short-term interest rates compared to its interest earning assets, resulting in interest income being more sensitive to the currenta low interest rate environment than interest expense.
CCREDITredit RISKisk —The Partnership is subject to credit risk due to the nature of the transactions it processes for its clients. The Partnership is exposed to the risk that third parties who owe it money, securities or other assets will not meet their obligations. Many of the transactions in which the Partnership engages expose it to credit risk in the event of default by its counterparty or client, such as cash balances held at various major U.S. financial institutions, which typically exceed FDICFederal Deposit Insurance Corporation (“FDIC”) insurance coverage limits. In addition, the Partnership’s credit risk may be increased when the collateral it holds cannot be realized or is liquidated at prices insufficient to recover the full amount of the obligation due to the Partnership. See Part III, Item 710 – Management’s DiscussionDirectors, Executive Officers and Analysis of Financial Condition and Results of Operations,Corporate Governance, for more information about the Partnership’s credit risk.
19
PART I Item 1A. | Risk Factors, continued |
LACKOFackof CAPITALapital PERMANENCYermanency —Because the Partnership’s capital is subject to mandatory liquidationredemption either upon the death or withdrawal request of a partner, the capital is not permanent and a significant mandatory liquidationredemption could lead to a substantial reduction in the Partnership’s capital, which could, in turn, have a material adverse effect on the Partnership’s business. Under the terms of the Partnership Agreement, a partner’s capital balance is liquidatedredeemed upon death. In addition, partners may request withdrawals offrom their partnership capital accounts, subject to certain limitations on the timing of those withdrawals. Accordingly, partnershipthe Partnership’s capital is not permanent and is dependent upon current and future partners to both maintain their existing capital and make additional capital contributions in the Partnership. Any withdrawal requests by general partners, subordinated limited partners or limited partners would reduce the Partnership’s available liquidity and capital. The Managing Partner may decline a withdrawal request if that withdrawal would result in the Partnership violating any agreement, such as a loan agreement, or any applicable laws, rules or regulations. Under the terms of the Partnership Agreement, limited partners who request the withdrawal of their capital are repaid their capital in three equal annual installments beginning the monthno earlier than 90 days after their withdrawal request. Thenotice is received by the Managing Partner may, in his discretion, allow a limited partner to accelerate the withdrawal of his or her capital.Partner. The capital of general partners requesting the withdrawal of capital from the Partnership may be converted to subordinated limited partner capital or, at the discretion of the Managing Partner, redeemed by the Partnership. The withdrawalcapital of subordinated limited partnerpartners requesting withdrawal of their subordinated limited partnership capital is repaid in six equal annual installments beginning the monthno earlier than 90 days after their request for withdrawal. Liquidationswithdrawal is received by the Managing Partner. The Partnership’s Managing Partner has discretion to waive or modify these withdrawal restrictions and to accelerate the return of capital. Redemptions upon the death of a partner are generally required to be made within six months of the date of death. Due to the nature of the liquidationredemption requirements of the Partnership's capital as set forth in the Partnership Agreement, the Partnership accounts for its capital as a liability, in accordance with GAAP.U.S generally accepted accounting principles (“GAAP”). If the Partnership’s capital declines by a substantial amount due to liquidationdeath or withdrawal, the Partnership may not have sufficient capital to operate or expand its business or to meet withdrawal requests by partners. PART I
Item 1A.
| Risk Factors, continued
|
INTERRUPTIONOF BUSINESSAND OPERATIONS —Any substantial disruption to the Partnership’s businessUnderwriting, Syndicate and operations could lead to significant financial loss to its business and operations as well as harm relations with its clients.Trading Position Risks —
The Partnership relies heavily on communications and information systems to conduct its business. The Partnership’s home office facilities and its existing computer system and network, including its backup systems, are vulnerable to damage or interruption from human error, natural disasters, power loss, sabotage, computer viruses, intentional acts of vandalism, attempts by others to gain unauthorized access to the Partnership’s information technology system, and similar events. Such an event could substantially disrupt the Partnership’s business by causing physical harm to its home office facilities and its technological systems. In addition, the Partnership’s reputation and business may suffer if clients experience data or financial loss from a significant interruption. The Partnership’s primary data center is located in St. Louis, Missouri. The Partnership has a data center in Tempe, Arizona, which currently operates as a secondary data center to its primary data center in St. Louis and is designed to enable the Partnership to maintain service during a system disruption contained in St. Louis. A prolonged interruption of either site might result in a delay in service and substantial additional costs and expenses. While the Partnership has disaster recovery and business continuity planning processes, and interruption and property insurance to mitigate and help protect it against such losses, there can be no assurance that the Partnership is fully protected from such an event. In 2011, the Partnership began re-purposing its secondary data center in Tempe, Arizona in order to be able to operate this facility as a primary data center for processing the most critical systems such that they could run in St. Louis, Missouri or Tempe, Arizona. As of December 31, 2012, this is still in process and is expected to take another two to three years to complete.
UNDERWRITING, SYNDICATEAND TRADING POSITION RISKS —The Partnership engages in underwriting activities and maintains inventory in securities, both of which can expose the Partnership to material losses and liability.
Participation as a manager or syndicate member in the underwriting of fixed income and equity securities subjects the Partnership to substantial risk. As an underwriter, the Partnership is subject to risk of substantial liability, expense and adverse publicity resulting from possible claims against it as an underwriter under federal and state securities laws. Such laws and regulations impose substantial potential liabilities on underwriters for material misstatements or omissions inOver the document used to describe the offered securities. In addition,past several years, there exists a potential for possible conflict of interest between an underwriter’s desire to sell its securities and its obligation to its clients not to recommend unsuitable securities. There has been an increasing incidence ofincreased litigation in these areas. These lawsuits are frequently brought by large classes of purchasers of underwritten securities. Such lawsuits often name underwriters as defendants and typically seek substantial amounts in damages. Further, as an underwriter, the Partnership may incur losses if it is unable to resell the securities it is committed to purchase or if it is forced to liquidate all or part of its commitment at less than the agreed upon purchase price. In addition, the commitment of capital to an underwriting may adversely affect the Partnership’s capital position and, as such, the Partnership’s participation in an underwriting may be limited by the requirement that it must at all times be in compliance with the SEC’s Uniform Net Capital Rule. In maintaining inventory in fixed income and equity securities, the Partnership is exposed to a substantial risk of loss, depending upon the nature and extent of fluctuations in market prices.
20
PART I Item 1A. | Risk Factors, continued |
Business InterruptionRISKOFisk — Any substantial disruption to the Partnership’s business and operations, including cybersecurity attacks, could lead to significant financial loss to the Partnership’s business and operations, as well as harm the Partnership’s reputation and client relationships. The Partnership relies heavily on communications and information systems to conduct its business. The Partnership’s home office facilities and its existing computer system and network, including its backup systems, are vulnerable to damage or interruption from human error, natural disasters, power loss, sabotage, cybersecurity attacks, computer viruses and other malicious code, intentional acts of vandalism, attempts by others to gain unauthorized access to the Partnership’s information technology system, market disruptions due to third-party technology errors, and similar events. The risk of these types of events occurring has grown recently due to increased use of the internet and mobile devices, as well as increased sophistication of external parties who may attempt to cause harm. The Partnership has not experienced any material losses relating to cybersecurity attacks or other information security breaches. The Partnership has processes in place designed to safeguard and monitor against business interruptions, cyberattacks or other disruptions. However, there can be no assurance the Partnership will not suffer such losses in the future. Such an event could substantially disrupt the Partnership’s business by causing physical harm to its home office facilities and its technological systems, jeopardizing the Partnership’s, its clients’ or third parties’ confidential information, or causing interruptions or malfunctions in the Partnership’s, its clients’ or third parties’ operations. In addition, the Partnership’s reputation and business may suffer if clients experience data or financial loss from a significant interruption or cybersecurity attack. The Partnership has primary data centers in Missouri and Arizona. These data centers act as disaster recovery sites for each other. While these data centers are designed to be redundant for each other, a prolonged interruption of either site might result in a delay in service and substantial costs and expenses. While the Partnership has disaster recovery and business continuity planning processes, and interruption and property insurance to mitigate and help protect it against such losses, there can be no assurance that the Partnership is fully protected from such an event. Risk of INFLATIONnflation —An increase in inflation could affect securities prices and as a result, the profitability and capital of the Partnership. Inflation and future expectations of inflation can negatively influence securities prices, as well as activity levels in the securities markets. As a result, the Partnership’s profitability and capital may be adversely affected by inflation and inflationary expectations. Additionally, the impact of inflation on the Partnership’s operating expenses may affect profitability to the extent that additional costs are not recoverable through increased prices of services offered by the Partnership. TTRANSACTIONransaction VOLUMEolume VOLATILITYolatility —Significant increases and decreases in the number of transactions by the Partnership’s clients can have a material negative effect on the Partnership’s profitability and its ability to efficiently process and settle these transactions. Significant volatility in the number of client transactions may result in operational problems such as a higher incidence of failures to deliver and receive securities and errors in processing transactions, and such volatility may also result in increased personnel and related processing costs. In the past, the Partnership has experienced adverse effects on its profitability resulting from significant reductions in securities sales and likewise, has encountered operational problems arising from unanticipated high transaction volume. The Partnership is not able to control such decreases and increases, and there is no assurance that it will not encounter such problems and resulting losses in future periods. In addition, significant transaction volume could result in inaccurate books and records, which would expose the Partnership to disciplinary action by governmental agencies and SROs. Investment Advisory Activities — The Partnership’s investment advisory businesses may be affected by the investment performance of its portfolios and operational risks associated with the size of the program. Poor investment returns, due to either general market conditions or underperformance of programs constructed by the Partnership (relative to the programs of the Partnership’s competitors or to benchmarks) may affect the Partnership's ability to retain existing assets under care and to attract new clients or additional assets from existing clients. Should there be a reduction in assets under care in programs which generate asset-based fees the Partnership will experience a decrease in net revenue. 21
PART I Item 1A. | Risk Factors, continued |
Based on the current size of the investment advisory program, it may experience concentration risks associated with the level and percentage of holdings in individual funds within the program which could result in additional operational and regulatory risks for the Partnership. As a result of the size of the program, the Partnership is also exposed to that risk that trading volumes and program activity could impact the Partnership's ability to process transactions in a timely manner. Proprietary Mutual Funds — The Partnership’s business may be affected by operational risks, investment performance and the heightened regulatory requirements it faces as a result of sponsoring proprietary mutual funds and managing sub-advisers and other third party service providers. As a sponsor and investment adviser to proprietary mutual funds, the Partnership, through its ownership of OLV, may experience additional operational risk and regulatory requirements attributed to its responsibility to oversee the investment management of the funds. Due to the size and number of sub-advisers within proprietary mutual funds, there is a heightened risk associated with the Partnership's ability to perform ongoing due diligence and supervision. Poor investment returns, due to either general market conditions or underperformance, of proprietary mutual funds may affect the Partnership's ability to expand the Trust, develop new mutual funds, attract new client assets, and retain existing client assets.
22
PART I Item 1A. | Risk Factors, continued |
RISKS RELATED TO AN INVESTMENT IN LIMITED PARTNERSHIP INTERESTS HHOLDINGolding COMPANYompany — JFC is a holding company; as a consequence, JFC’s ability to satisfy its obligations under the Partnership Agreement will depend in large part on the ability of its subsidiaries to pay distributions or dividends to JFC, which is restricted by law and contractual obligations. Since JFC is a holding company, the principal sources of cash available to it are distributions or dividends from its subsidiaries and other payments under intercompany arrangements with its subsidiaries. Accordingly, JFC’s ability to generate the funds necessary to satisfy its obligations with respect to the Interests, including the 7.5% “guaranteed payment” (for tax purposes, within the meaning of the Internal Revenue Code)Code of 1986, as amended (the “IRC”)) to limited partners pursuant to Section 3.3 of the Partnership Agreement (the “7.5% Payment”), will be dependent on distributions, dividends, and intercompany payments from its subsidiaries, and if those sources are insufficient, JFC may be unable to satisfy such obligations. JFC’s principal operating subsidiaries, including Edward Jones, are subject to various statutory and regulatory restrictions applicable to broker-dealers generally that limit the amount of cash distributions, dividends, loans and advances that those subsidiaries may pay to JFC. Regulations relating to capital requirements affecting some of JFC’s subsidiaries also restrict their ability to pay distributions or dividends and make loans to JFC. See subheading “Regulation” ofPart I, Item 1 “Business”– Business – Regulation for a discussion of this Annual Report on Form 10-K.these requirements. In addition, JFC’s subsidiaries may be restricted under the terms of their financing arrangements from paying distributions or dividends to JFC, or may be required to maintain specified levels of capital. Moreover, JFC or its subsidiaries may enter into financing arrangements in the future which may include additional restrictions or debt covenant requirements further restricting distributions to JFC, which may impact JFC’s ability to make distributions to its limited partners. SAVAILABILITYOFufficiency of Distributions to Repay FINANCINGinancing — Limited partners may finance their purchase of the Interests with a bank loan, but theloan. The Partnership does not guarantee those loans and distributions may be insufficient to pay the interest or principal due on the loans. Many limited partners finance the purchases of their Interests by obtaining personal bank loans. Any such bank loan agreement is between the limited partner and the bank. The Partnership performs certain administrative functions for the majority of limited partner bank loans, but does not guarantee the bank loans, nor can limited partners pledge their Partnership interestInterests as collateral for the bank loan. Limited partners who have chosen to finance a portion of the purchase price of their Interests assume all risks associated with the loan, including the legal obligation to repay the loan. There is no assurance that distributions from the Partnership will be sufficient to pay the interest on a limited partner’s loan or repay the principal amount of the loan at or prior to its maturity. There also can be no assurance that such distributions will be sufficient to pay all income taxes due each year arising from a limited partner’s share of the Partnership’s income. Furthermore, in the event the Partnership experiences a loss which leads to its liquidation, there is no assurance there will be sufficient capital available to distribute to the limited partners for the repayment of any loans. Status As Partner For Tax Purposes and Tax Risks — Limited partners are subject to income tax liabilities on the Partnership’s income, whether or not income is distributed, and may have an increased chance of being audited. Limited partners may also be subject to passive loss rules as a result of their investment. Limited partners are required to file tax returns and pay income tax in those states and foreign jurisdictions in which the Partnership operates, as well as in the limited partner’s state of residence or domicile. Limited partners are liable for income taxes on their pro rata share of the Partnership’s taxable income. The amount of income the limited partner pays tax on can significantly exceed the net income earned on the Interests and the income distributed to such limited partner, which results in a disproportionate share of income being used to pay taxes. The Partnership’s income tax returns may be audited by government authorities, and such audit may result in the audit of the returns of the limited partners (and, consequently, an amendment of their tax returns). A limited partner’s share of the Partnership’s income or losses could be subject to the passive loss rules. Under specific circumstances, certain income may be classified as portfolio income or passive income for purposes of the passive loss rules. In addition, under certain circumstances, a limited partner may be allocated a share of the Partnership’s passive losses, the deductibility of which will be limited by the passive loss rules. 23
PART I Item 1A. | Risk Factors, continued |
Possible Tax Law Changes – From time to time, legislative changes to the IRC or state laws may be adopted that could increase the tax rate applicable to the limited partners’ net income earned and/or subject the net income earned to additional taxes currently not applicable. Congress may enact legislation that subjects a limited partner’s share of the Partnership’s taxable income to self-employment tax. Such legislation, if ever enacted, may substantially reduce a limited partner’s after-tax return from his or her Interest. Other tax law changes may substantially impact a limited partner’s Interest and cannot be predicted. NONon-VOTINGoting INTERESTSnterests; NONon-TRANSFERABILITYOFransferability of INTERESTSnterests; ABSENCEOFbsence of MARKET;arket, PRICErice FORor INTERESTSnterests —The Interests are non-voting and non-transferable, no market for the Interests exists or is expected to develop, and the price only represents book value. None of the limited partners in their capacity as limited partners may vote or otherwise participate in the management of the Partnership’s business. The Managing Partner has the authority to amend the Partnership Agreement without the consent of the limited partners, subordinated limited partners or general partners. None of the limited partners may sell, pledge, exchange, transfer or assign their Interests without the express written consent of the Managing Partner (which is not expected to be given). Because there is no market for the Interests, there is no fair market value for the Interests. The price ($1,000 per Interest) at which the Interests were offered represents the book value of each Interest. Capital could decline to a point where the book value of the Interests could be less than the price paid. RRISKOFisk of DILUTIONilution —The Interests may be diluted from time to time, which could lead to decreased returns to the limited partners. The Managing Partner has the ability, in his or her sole discretion, to issue additional Interests or Partnership capital. The Partnership filed a Registration Statement on Form S-8 with the SEC on January 17, 2014, to register $350 million of Interests to be issued pursuant to the Partnership’s 2014 Employee Limited Partnership Interest Purchase Plan (the “Plan”). On January 2, 2015, the Partnership issued $292 million of Interests in connection with the Plan. In addition, on January 4, 2016, the Partnership issued additional Interests to individuals participating in retirement transition plans pursuant to the Plan. The remaining $58 million of Interests may be issued in connection with the Plan at the discretion of the Partnership in the future. The issuance of Interests will reduce the percentage of participation in net income by general partners, subordinated limited partners and pre-existing limited partners. Any additionissuance of newadditional Interests will decrease the Partnership’s net interest income by the 7.5% PaymentsPayment for any such additional Interests, and holders of existing Interests may suffer decreased returns on their investment because the amount of the Partnership’s net income they participate in may be reduced as a consequence. Additionally,Accordingly, the issuance of additional Interests will reduce the Partnership’s net interest income and profitability. In 2015, the Partnership retains approximately 23%retained 13.8% of the general partners’ net income as capital which is credited monthly to the general partners’ Adjusted Capital Contributions (as defined in the Partnership Agreement). Beginning in 2013, the Partnership decreased the amount of retentionRetention for 2016 is expected to approximately 14% of net income allocated to general partners.remain at a similar level as 2015. Such retention, along with any additional capital contributions by general partners, will reduce the percentage of participation in net income by limited partners. There is no requirement to retain a minimum amount of general partners’ net income, and the percentage of retained net income could change at any time in the future. In accordance with the Partnership Agreement, the percentage of income allocated to limited partners is reset annually and the amount of retained general partner income and any additional issuance of general partnership capital reduces the income allocated to limited partners.
24
PART I Item 1A. | Risk Factors, continued |
LIMITATIONOFimitationof LIABILITYiability; INDEMNIFICATIONndemnification —The Partnership Agreement limits the liability of the Managing Partner and general partners by indemnifying them under certain circumstances, which may limit a limited partner’s rights against them and could reduce the accumulated profits distributable to limited partners. The Partnership Agreement provides that none of the general partners, including the Managing Partner, will be liable to any person for any acts or omissions performed or omitted by such partner on behalf of the Partnership (even if such action, omission or failure to act constituted negligence) as long as such partner has (a) not (a) committed fraud, (b) acted or failed to act in subjective good faith or in a manner which involveddid not involve intentional misconduct, or a knowing violation of law or which was grossly negligent, orand (c) not derived improper personal benefit. PART I
Item 1A.
| Risk Factors, continued
|
The Partnership also must indemnify theany general partners,partner, including the Managing Partner, from any claim in connection to acts or omissions performed in connection with the business of the Partnership and from costs or damages stemming from a claim attributable to acts or omissions by such partner, unless such act or omission was not in good faith on behalf of the Partnership, was not in a manner reasonably believed by the partner to be within the scope of his or her authority, norand was not in the best interests of the Partnership. The Partnership does not have to indemnify any general partner, including the Managing Partner, in instances of fraud, for acts or omissions not in good faith or which involve intentional misconduct, a knowing violation of the law, or gross negligence, or for any acts or omissions where such partner derived improper personal benefit. As a result of these provisions, the limited partners will have more limited rights against such partners than they would have absent the limitations in the Partnership Agreement. Indemnification of the general partners could deplete the Partnership’s assets unless the Partnership's indemnification obligation is covered by insurance, which the Partnership may or may not obtain, or which insurance may not be available at a reasonable price or at all or in an amount sufficient to cover the indemnification obligation. The Partnership Agreement does not provide for indemnification of limited partners. Risk Of Loss — The Interests are equity interests in the Partnership. As a result, and in accordance with the Partnership Agreement, the right of return of a limited partner’s Capital Contribution (as defined in the Partnership Agreement) is subordinate to all existing and future claims of the Partnership’s general creditors, including any of its subordinated creditors. In the event of a partial or total liquidation of the Partnership or in the event there were insufficient Partnership assets to satisfy the claims of its general creditors, the limited partners may not be entitled to receive their entire Capital Contribution amounts back. Limited partner capital accounts are not guaranteed. However, as a class, the limited partners would be entitled to receive their aggregate Capital Contributions back prior to the return of any capital contributions to the subordinated limited partners or the general partners. If the Partnership suffers losses in any year but liquidation procedures described above are not undertaken and the Partnership continues, the amounts of such losses would be absorbed in the capital accounts of the partners as described in the Partnership Agreement, and each limited partner in any event remains entitled to receive annual 7.5% Payments on his or her contributed capital under the terms of the Partnership Agreement. However, as there would be no accumulated profits in such a year, limited partners would not receive any sums representing participation in net income of the Partnership. In addition, although the amount of such annual 7.5% Payments to limited partners are charged as an expense to the Partnership and are payable whether or not the Partnership earns any accumulated profits during any given period, no reserve fund has been set aside to enable the Partnership to make such payments. Therefore, such payments to the limited partners are subject to the Partnership’s ability to service this annual 7.5% Payment, of which there is no assurance. Foreign Exchange Risk For Canada Residents — Each foreign limited partner has the risk that he or she will lose value on his or her investment in the Interests due to fluctuations in the applicable exchange rate; furthermore, foreign limited partners may owe tax on a disposition of the Interests solely as the result of a movement in the applicable exchange rate. All investors purchase Interests using U.S. dollars. As a result, limited partners who reside in Canada may risk having the value of their investment, expressed in Canadian currency, decrease over time due to movements in the applicable currency exchange rates. Accordingly, such limited partner may have a loss upon disposition of his or her investment solely due to a downward fluctuation in the applicable exchange rate.
25
PART I ITEM 1B.Item 1A.
| Risk Factors, continued |
In addition, changes in exchange rates could have an impact on Canadian federal income tax consequences for a limited partner, if such limited partner is a resident in Canada for purposes of the Income Tax Act (Canada). The disposition by such limited partner of an Interest, including as a result of the withdrawal of the limited partner from the Partnership or the Partnership’s dissolution, may result in the realization of a capital gain (or capital loss) by such limited partner. The amount of such capital gain (or capital loss) generally will be the amount, if any, by which the proceeds of disposition of such Interest, less any reasonable costs of disposition, each expressed in Canadian currency using the exchange rate on the date of disposition, exceed (or are exceeded by) the adjusted cost base of such Interest, expressed in Canadian currency using the exchange rate on the date of each transaction that is relevant in determining the adjusted cost base. Accordingly, because the exchange rate for those currencies may fluctuate between the date or dates on which the adjusted cost base of a limited partner’s Interest is determined and the date on which the Interest is disposed of, a Canadian-resident limited partner may realize a capital gain or capital loss on the disposition of his or her Interest solely as a result of fluctuations in exchange rates. 26
PART I ITEM 1B. | UNRESOLVEDUNRESOLVED STAFF COMMENTS
|
None. The Partnership primarily conducts its U.S. home office operations from two campus locations in St. Louis, Missouri and one campus location in Tempe, Arizona. As of December 31, 2012,2015, the Partnership’s U.S. home office consisted of 1814 separate buildings totaling approximately 2.0 million square feet. Of the 1814 U.S. home office buildings, two buildings areone building is leased through an operating lease and the remaining 1613 are owned by the Partnership. The land for the Tempe, Arizona campus is leased. In addition, the Partnership leases its CanadianCanada home office facility in Mississauga, Ontario through an operating lease. The Partnership also maintains facilities in 11,41512,482 branch locations as of December 31, 2012,2015, which are located in the U.S. and Canada and are predominantly rented under cancelable leases. See Part II, Item 8 – Financial Statements and Supplementary Data – Notes 1411 and 1714 to the Consolidated Financial Statements for information regarding non-cancelable lease commitments and related party transactions, respectively. PART I
In the normal course of its business, the Partnership is named, from time to time, as a defendant in various legal actions, including arbitrations, class actions and other litigation. Certain of these legal actions may include claims for substantial compensatory and/or punitive damages or claims for indeterminate amounts of damages. The Partnership is involved, from time to time, in various legal matters, including arbitrations, class actions, other litigation, and investigations and proceedings by governmental organizations and SROs, certain of which may result in adverse judgments, fines or penalties.SROs. CountrywideCountrywide. ThereIn the past several years, there have been fourfive cases filed against Edward Jones (in addition to numerous other issuers and underwriters) asserting various claims under the U.S. Securities Act of 1933 (the “Securities Act”) in connection with registration statements and prospectus supplements issued for certain mortgage-backed certificates issued between 2005 and 2007. 2007, four of which have appeals that are currently pending. Three of these cases arewere purported class actions (David H. Luther, et al. v. Countrywide Financial Corporation, et al.al. filed in 2007.;2007 in the Superior Court of the State of California, County of Los Angeles; Maine State Retirement System, et al. v. Countrywide Financial Corporation, et al.al. filed in 2010; in the U.S. District Court for the Central District of California; andWestern Conference of Teamsters Pension Trust Fund v. Countrywide Financial Corporation, et al.al. filed in 2010). All three cases remain pending in the Superior Court of the State of California, County of Los Angeles) filed against numerous issuers and underwriters, including Edward Jones. The plaintiffs sought compensatory damages and reasonable costs and fees, including attorneys’ and experts’ fees. The U.S. District Court for the Central District of California. Plaintiffs seek unspecified compensatory damages, attorneys’ fees, costs, expenses and rescission. In November 2010,California granted final approval of a settlement for these three cases on December 6, 2013. The approved settlement is not expected to have a material adverse impact on the Court in theMaine State case dismissed all of plaintiffs’ claimsPartnership’s consolidated financial condition. On January 14, 2014, some objectors to the extent they related to any certificates for which Edward Jones acted as dealer. TheWestern Conferencesettlement filed a notice of Teamsters case has been stayed by agreementappeal of the parties.Court’s final judgment and dismissal, and the appeal is currently pending in the U.S. Court of Appeals for the Ninth Circuit. On August 10, 2012, the Federal Deposit Insurance Corporation,FDIC, in its capacity as receiver for Colonial Bank, filed a separate lawsuit (FDIC v. Countrywide Securities Corporation, Inc., et al.) in the U.S. District Court for the Central District of California against numerous issuers and underwriters, including Edward Jones. However,The plaintiff does not allege that it purchased any tranchesought compensatory damages and attorneys’ fees and costs. On April 8, 2013, the Court dismissed this case based on statute of any offering for which Edward Jones acted as dealer. Following defendant’s motion to dismiss, plaintiffslimitations grounds. The FDIC filed a notice of appeal of the Court’s dismissal on October 3, 2013 and filed their first amended complaintopening brief on NovemberApril 6, 2012.2015. The parties have agreed to a briefing schedule on defendants’ motion to dismiss. Lehman Brothers. Edward Jones was named as a defendant in three actions related to its underwriting of Lehman Brothers Holdings Inc. (“Lehman Brothers”) notes that are or wereappeal is currently pending in the U.S. District Court of Appeals for the Southern District of New York (“SDNY”). Two of the suits were putative class action suits originally brought by plaintiffs in state court in Arkansas (the “Arkansas Plaintiffs”), which asserted Securities Act claims based upon two offerings of Lehman Brothers’ notes in 2007. The Court dismissed those actions on December 11, 2012. The Arkansas Plaintiffs will have the right to appeal the dismissal order. The third suit was amended in October 2011 to assert a Section 11 claim against Edward Jones related to three offerings of Lehman bonds in January and February 2008. Plaintiffs, American National Life Insurance Company of Texas, Comprehensive Investment Services Inc., The Moody Foundation, and American National Insurance Company, allege to have purchased $3 million of securities in these offerings, but did not make any of these purchases through Edward Jones. This action names several other purported underwriters as defendants, as well as Lehman Brothers’ former auditor. On January 6, 2012, Edward Jones and other defendants moved to dismiss this action. The motion was fully briefed as of March 5, 2012. The Court has not yet ruled on the motion to dismiss.Ninth Circuit.
27
PART I Item 3. | Legal Proceedings, continued |
Nicholas Maxwell,Daniel Ezersky, individually and on behalf of all others similarly situated.situated. On March 14, 2013, Edward Jones was named as a defendant in a putative class action complaintlawsuit in Alameda Superior Court.the Circuit Court of St. Louis County, Missouri. The complaint asserted causes of action for unlawful wage deductions (Labor Code sections 221, 223, 400-410, 2800, 2802, Cal. Code Reg. title 8, section 11040(8)); California Unfair Competition Law violations (Business and Professions Code sections 17200-04); and waiting time penalties (Labor Code sections 201-203). Plaintiff allegespetition alleged that Edward Jones improperly chargedbreached its California financial advisors fees, costs,fiduciary duties and expenses related to trading errors or “broken” trades, and failed to timely pay wages at termination; howeverwas unjustly enriched through the use of an online life insurance needs calculator that plaintiff does not allege a specificclaims inflated the amount of damages. Plaintiff filedinsurance he needed. The plaintiff sought damages on behalf of Missouri residents who purchased certain life insurance products from Edward Jones between March of 2008 and the complaint on Decemberpresent, including: actual damages, or alternatively, judgment in an amount equal to profits gained from the sale of term, whole life or universal life insurance to plaintiff/damages class; punitive damages; injunctive relief; costs, including reasonable fees and expert witness expenses; and reasonable attorneys’ fees. On August 18, 2012 and2014, Edward Jones filed its answera motion for summary judgment, which was subsequently granted by the Court. Plaintiff filed a notice of appeal, and the Missouri Court of Appeals for the Eastern District affirmed summary judgment on February 6, 2013. There is a case management conference scheduled for July 10, 2013.October 20, 2015. On January 26, 2016, the Supreme Court of Missouri denied the plaintiff's application to transfer the case.
TribuneTribune. In August 2011, retirees of Times Mirror/Tribune Company filed suit in the U.S. District Court for the SDNYSouthernDistrict of New York (“SDNY”) against numerous brokerage firms and banks, including Edward Jones, claiming that a fraudulent transfer occurred during the 2007 Times Mirror/Tribune Company merger. Plaintiffs allege that payments made to Tribune Company shareholders, of which Edward Jones’ customers received approximately $6.5 million, constituted fraudulent transfers. The case has been consolidated inOn June 1, 2015, the U.S. District Court for the SDNY along with a number of similar casesentered an Order dismissing Edward Jones without prejudice from the lawsuit captioned In Re: Tribune Company Fraudulent Conveyance Litigation, Marc S. Kirschner, as partLitigation Trustee for the Tribune Litigation Trust v. FitzSimons, et al. Two of the multi-district litigation process. Yavapai County Litigation. In September, 2009, threeother related lawsuits, Deutsche Bank Trust Company Americas v. Ametek, Inc., and Niese v. Alliance Bernstein L.P., were filed indismissed by the State of Arizona; all three lawsuits were consolidated and are pending before the U.S. District Court for the DistrictSDNY in 2013 and the dismissal was appealed to the U.S. Court of Arizona. The actions relate to bonds underwrittenAppeals for the Second Circuit. No decision has been issued by the U.S. Court of Appeals for the Second Circuit.
Mutual Fund Share Class Waivers. On May 5, 2015, FINRA’s Enforcement Department advised Edward Jones that it was investigating whether any violations of the federal securities laws or rules have occurred with respect to mutual fund purchases and other brokerage firmssales charge waivers for the purpose of financing construction of an event center in Prescott Valley, Arizona.certain retirement plan and charitable organization accounts. As previously disclosed, on October 26, 2015, Edward Jones, sold approximately $2.9 million ofwithout admitting or denying the bonds. The plaintiffs allegefindings, entered into a settlement agreement with FINRA in connection with this investigation. On June 12, 2015, the underwriters, including Edward Jones, made material misrepresentations and omissions in the preliminary official statement and/or in the official statement. One of the matters was filed as a putative class action in which the plaintiffs seek to represent all purchasers of the issued bonds. Allstate is suing as a purchaser of the bonds and Wells Fargo filed a separate action as indenture trustee on behalf of all bond holders. The Court entered an order in November, 2010 dismissing several of the claims against Edward Jones, including all claims brought on behalf of the class. The remaining claims against Edward Jones stem from allegations that defendants violated certain state securities acts and committed common law torts. Plaintiffs are seeking an unspecified amount of damages including attorneys’ fees, costs, expense, rescission or statutory damages, out-of-pocket damages and prejudgment interest. In 2011, Edward Jones filed a third-party complaint and counterclaim against Wells Fargo Bank, N.A., solely in its capacity as indenture trustee, asserting claims for negligent misrepresentation based on Wells Fargo’s involvement with the bond documents and official statement. In the Matter of Edward D. Jones & Co., L.P. Municipal Bond Pricing. On April 27, 2012, the SEC’s Division of Enforcement of the SEC informed Edward Jones that it had commenced an investigation into Nebraska Public Power District’s (“NPPD”) Taxable Build America Bonds, which formed part of NPPD’s 2009 General Revenue Bonds offering. Edward Jones was a co-manager of said offering.is also investigating this matter. The investigation inquired into whether Edward Jones and others may have engaged in possible violations of the Securities Act, the U.S. Securities Exchange Act of 1934 (the “Exchange Act”) (including Section 10(b) and Rule 10b-5 thereunder), and MSRB Rules. In January 2013, the SEC commenced a second investigation that subsumed the one just described, relating more generally to municipal bond pricing, which also inquired into possible violations of the Securities Act, Exchange Act (including Section 10(b) and Rule 10b-5 thereunder), and MSRB Rules.SEC’s review is ongoing. Consistent with its practice, Edward Jones is cooperating fully with the SEC with respect to these investigations. The SEC has stated to Edward Jones with respect to each of the investigations described above that the “investigation is a non-public, fact-finding, informal inquiry, which should not be construed as an indication that the Commission or its staff have determined that any violations of law have occurred,” and the SEC has not taken any action against Edward Jones or others with respect to either investigation.
New Hampshire Investigation. In March 2012, Edward Jones received an inquiry from the State of New Hampshire in connection with its investigation into Edward Jones’ procedures regarding compliance with federal and state telemarketing rules. The state has requested documentation and interviewed individuals at Edward Jones. Edward Jones is engaged in ongoing discussions with the state and has produced documents as requested by the state.
PART I
Item 3.ITEM 4.
| Legal Proceedings, continued
|
FINRA Letter of Acceptance Waiver and Consent. FINRA initiated an investigation into certain procedures at Edward Jones, and alleged that prior to July 13, 2012 Edward Jones did not establish and maintain written supervisory procedures to ensure that registered representatives’ Uniform Applications for Securities Industry Registration or Transfer (“Form U4”) were updated to reflect unsatisfied judgments and liens of which Edward Jones’ payroll department was on notice. As a result, FINRA alleged that Edward Jones did not timely file Form U4 amendments in such circumstances in violation of Article V, Section 2(c) of the FINRA By-Laws, FINRA Rule 2010, and NASD Rules 3010(b) and 2110. Without admitting or denying the findings, Edward Jones entered into a Letter of Acceptance, Waiver and Consent which included a censure and a fine of $35,000.
PART I
ITEM 4.
| MINE SAFETY DISCLOSURES |
None.
PART IINot applicable.
28
PART II ITEM 5. | MARKET FOR REGISTRANT’S COMMON EQUITY, RELATED STOCKHOLDER MATTERS AND ISSUER PURCHASES OF EQUITY SECURITIES |
There is no established public trading market for the Partnership’s limited partnership and subordinated limited partnership interestsInterests and their assignment or transfer is prohibited. As of February 22, 2013,26, 2016, the Partnership was composed of 14,00919,790 limited partners and 297391 subordinated limited partners. On January 4, 2016, the Partnership issued an aggregate of $370,500 of Interests to certain retired associates of Edward Jones for aggregate consideration of $370,500 in a private placement in reliance on the exemption from registration under Section 4(a)(2) of the Securities Act and Rule 506 of Regulation D promulgated thereunder. PART II
ITEM 6. | SELECTED FINANCIAL DATA |
The following information sets forth, for the past five years, selected financial data determined from the audited financial statements. All information included in the Annual Report on Form 10-K is presented on a continuing operations basis unless otherwise noted.
Summary Consolidated Statements of Income Data: (All dollars in millions, except per unit information and units outstanding)
| | For the years ended December 31, | | ($ millions, except per unit information and units outstanding) | | 2015 | | | 2014 | | | 2013 | | | 2012 | | | 2011 | | | | | | | | | | | | | | | | | | | | | | | Net revenue | | $ | 6,619 | | | $ | 6,278 | | | $ | 5,657 | | | $ | 4,965 | | | $ | 4,510 | | | | | | | | | | | | | | | | | | | | | | | Income before allocations to partners | | $ | 838 | | | $ | 770 | | | $ | 674 | | | $ | 555 | | | $ | 482 | | | | | | | | | | | | | | | | | | | | | | | Income allocated to limited partners per weighted average $1,000 equivalent limited partnership unit outstanding | | $ | 131.42 | | | $ | 129.40 | | | $ | 121.12 | | | $ | 109.84 | | | $ | 104.66 | | | | | | | | | | | | | | | | | | | | | | | Weighted average $1,000 equivalent limited partnership units outstanding | | | 921,747 | | | | 636,481 | | | | 644,856 | | | | 655,663 | | | | 668,450 | |
| | | | | | | | | | | | | | | | | | | | | | | | 2012 | | | 2011 | | | 2010 | | | 2009 | | | 2008 | | Total revenue | | $ | 5,027 | | | $ | 4,578 | | | $ | 4,163 | | | $ | 3,548 | | | $ | 3,821 | | Interest expense | | | 62 | | | | 68 | | | | 56 | | | | 58 | | | | 72 | | | | | | | | | | | | | | | | | | | | | | | Net revenue | | $ | 4,965 | | | $ | 4,510 | | | $ | 4,107 | | | $ | 3,490 | | | $ | 3,749 | | | | | | | | | | | | | | | | | | | | | | | Income from continuing operations | | $ | 555 | | | $ | 482 | | | $ | 393 | | | $ | 269 | | | $ | 385 | | Loss from discontinued operations | | | — | | | | — | | | | — | | | | (105 | ) | | | (73 | ) | | | | | | | | | | | | | | | | | | | | | | Income before allocations to partners | | $ | 555 | | | $ | 482 | | | $ | 393 | | | $ | 164 | | | $ | 312 | | | | | | | | | | | | | | | | | | | | | | | Income allocated to limited partners per weighted average $1,000 equivalent limited partnership unit outstanding | | $ | 109.84 | | | $ | 104.66 | | | $ | 96.07 | | | $ | 41.44 | | | $ | 86.21 | | Weighted average $1,000 equivalent limited partnership units outstanding | | | 655,663 | | | | 668,450 | | | | 455,949 | | | | 471,597 | | | | 489,920 | |
In accordance with Financial Accounting Standards Board (“FASB”) Accounting Standards Codification (“ASC”) No. 480,Distinguishing Liabilities from Equity (“ASC 480”), the Partnership presents net income of $0 on its Consolidated Statements of Income. See Part II, Item 8 – Financial Statements and Supplementary Data – Note 1 to the Consolidated Financial Statements for further discussion. PART II
Item 6.
| Selected Financial Data, continued
|
Summary Consolidated Statements of Financial Condition Data: (All dollars in millions)
| | As of December 31, | | ($ millions) | | 2015 | | | 2014 | | | 2013 | | | 2012 | | | 2011 | | | | | | | | | | | | | | | | | | | | | | | Total assets | | $ | 16,356 | | | $ | 14,770 | | | $ | 13,795 | | | $ | 13,042 | | | $ | 9,584 | | | | | | | | | | | | | | | | | | | | | | | Other liabilities exclusive of subordinated liabilities and partnership capital subject to mandatory redemption | | $ | 13,746 | | | $ | 12,552 | | | $ | 11,664 | | | $ | 10,959 | | | $ | 7,528 | | | | | | | | | | | | | | | | | | | | | | | Subordinated liabilities | | | — | | | | — | | | | 50 | | | | 100 | | | | 150 | | | | | | | | | | | | | | | | | | | | | | | Partnership capital subject to mandatory redemption | | | 2,610 | | | | 2,218 | | | | 2,081 | | | | 1,983 | | | | 1,906 | | | | | | | | | | | | | | | | | | | | | | | Total liabilities | | $ | 16,356 | | | $ | 14,770 | | | $ | 13,795 | | | $ | 13,042 | | | $ | 9,584 | |
| | | | | | | | | | | | | | | | | | | | | | | | 2012 | | | 2011 | | | 2010 | | | 2009 | | | 2008 | | Total assets(1) | | $ | 13,042 | | | $ | 9,584 | | | $ | 8,241 | | | $ | 7,168 | | | $ | 6,992 | | | | | | | | | | | | | | | | | | | | | | | Bank loans | | $ | — | | | $ | — | | | $ | — | | | $ | 58 | | | $ | 43 | | Long-term debt | | | 6 | | | | 7 | | | | 66 | | | | 59 | | | | 9 | | Other liabilities exclusive of subordinated liabilities and partnership capital subject to mandatory redemption(2) | | | 10,953 | | | | 7,521 | | | | 6,366 | | | | 5,327 | | | | 5,203 | | | | | | | | | | | | | | | | | | | | | | | | | | 10,959 | | | | 7,528 | | | | 6,432 | | | | 5,444 | | | | 5,255 | | | | | | | | | | | | | | | | | | | | | | | Subordinated liabilities | | | 100 | | | | 150 | | | | 204 | | | | 257 | | | | 261 | | | | | | | | | | | | | | | | | | | | | | | Partnership capital subject to mandatory redemption, net of reserve for anticipated withdrawals | | | 1,812 | | | | 1,758 | | | | 1,497 | | | | 1,437 | | | | 1,413 | | Reserve for anticipated withdrawals | | | 171 | | | | 148 | | | | 108 | | | | 30 | | | | 63 | | | | | | | | | | | | | | | | | | | | | | | Partnership capital subject to mandatory redemption(3) | | | 1,983 | | | | 1,906 | | | | 1,605 | | | | 1,467 | | | | 1,476 | | | | | | | | | | | | | | | | | | | | | | | Total liabilities and partnership capital | | $ | 13,042 | | | $ | 9,584 | | | $ | 8,241 | | | $ | 7,168 | | | $ | 6,992 | | | | | | | | | | | | | | | | | | | | | | |
(1)
| Assets include amounts reclassified as discontinued operations of $95 for 2008.
|
(2)
| Liabilities include amounts reclassified as discontinued operations of $56 for 2008.
|
(3)
| Partnership capital include amounts reclassified as discontinued operations of $39 for 2008.
|
PART II
29
PART II ITEM 7. | MANAGEMENT’S DISCUSSION AND ANALYSIS OF FINANCIAL CONDITION ANDCONDITIONAND RESULTS OF OPERATIONS |
The following Management’s Discussion and Analysis is intended to help the reader understand the results of operations and the financial condition of the Partnership. Management’s Discussion and Analysis should be read in conjunction with the Partnership’s Consolidated Financial Statements and accompanying notes included in Part II, Item 8 – Financial Statements and Supplementary Data of this Annual Report on Form 10-K. All amounts are presented in millions, except as otherwise noted. Basis of Presentation The Partnership broadly categorizes its net revenues into four categories: fee revenue, trade revenue (revenue from client buy or sell transactions of securities), fee revenue, net interest and dividends revenue (net of interest expense) and other revenue. In the Partnership’s Consolidated Statements of Income, trade revenue is composed of commissions, principal transactions and investment banking. Feefee revenue is composed of asset-based fees and account and activity fees. These sources of revenue are affected by a number of factors. Trade revenue is impacted bycomposed of commissions earned from the numberpurchase or sale of financial advisors, trading volume (client dollars invested), mix of themutual fund shares, listed and unlisted equities and insurance products, in which clients invest, margins earned on the transactions and market volatility.principal transactions. Asset-based fees are generally a percentage of the total value of specific assets in client accounts. These fees are impacted by client dollars invested in and divested from the accounts which generate asset-based fees and change in market values of the assets. Account and activity fees and other revenue are impacted by the number of client accounts and the variety of services provided to those accounts, among other factors. Trade revenue is impacted by the number of financial advisors, trading volume (client dollars invested), mix of the products in which clients invest, margins earned on the transactions and market volatility. Net interest and dividends revenue is impacted by the amount of cash and investments, receivables from clients and payables to clients, the variability of interest rates earned and paid on such balances, the number of Interests, and the balances of general partner loans, long-term debt and liabilities subordinated to claims of general creditors.partnership loans. 30
PART II Item 7. | Management’s Discussion and Analysis of Financial Condition and Results of Operations, continued |
OVERVIEW The following table sets forth the change in major categories of the Consolidated Statements of Income as well as several key related metrics for the last three years. Management of the Partnership relies on this financial information and the related metrics to evaluate the Partnership’s operating performance and financial condition. All amounts are presented in millions, except the number of financial advisors and as otherwise noted. | | | | For the years ended December 31, | | % Change | | | For the years ended December 31, | | | % Change | | | | | 2012 | | 2011 | | 2010 | | 2012 vs. 2011 | | 2011 vs. 2010 | | | 2015 | | | 2014 | | | 2013 | | | 2015 vs. 2014 | | | 2014 vs. 2013 | | Revenue: | | | | | | | | | | | | | | | | | | | | | | | | | | | | | | | Trade revenue: | | | | | | | | | | | | Commissions | | $ | 1,979.0 | | | $ | 1,698.7 | | | $ | 1,575.8 | | | | 17 | % | | | 8 | % | | Principal transactions | | | 155.9 | | | | 284.2 | | | | 320.8 | | | | -45 | % | | | -11 | % | | Investment banking | | | 111.6 | | | | 153.1 | | | | 208.6 | | | | -27 | % | | | -27 | % | | | | | | | | | | | | | | | | | | | Total trade revenue | | | 2,246.5 | | | | 2,136.0 | | | | 2,105.2 | | | | 5 | % | | | 1 | % | | | | | | | | | | | | | | | | | | | % of net revenue | | | 45 | % | | | 47 | % | | | 51 | % | | | | | | Fee revenue: | | | | | | | | | | | | | | | | | | | | | | | | | | | | | | | Asset-based | | | 2,042.4 | | | | 1,776.9 | | | | 1,397.3 | | | | 15 | % | | | 27 | % | | $ | 3,399 | | | $ | 3,089 | | | $ | 2,523 | | | | 10 | % | | | 22 | % | Account and activity | | | 573.9 | | | | 522.9 | | | | 503.3 | | | | 10 | % | | | 4 | % | | | 690 | | | | 617 | | | | 568 | | | | 12 | % | | | 9 | % | | | | | | | | | | | | | | | | | | Total fee revenue | | | 2,616.3 | | | | 2,299.8 | | | | 1,900.6 | | | | 14 | % | | | 21 | % | | | 4,089 | | | | 3,706 | | | | 3,091 | | | | 10 | % | | | 20 | % | | | | | | | | | | | | | | | | | | % of net revenue | | | | 62 | % | | | 59 | % | | | 55 | % | | | | | | | | | Trade revenue | | | | 2,425 | | | | 2,460 | | | | 2,439 | | | | -1 | % | | | 1 | % | % of net revenue | | | 53 | % | | | 51 | % | | | 46 | % | | | | | | | 37 | % | | | 39 | % | | | 43 | % | | | | | | | | | Net interest and dividends | | | 71.2 | | | | 62.5 | | | | 70.5 | | | | 14 | % | | | -11 | % | | | 83 | | | | 80 | | | | 75 | | | | 4 | % | | | 7 | % | Other revenue | | | 31.2 | | | | 11.6 | | | | 30.5 | | | | 169 | % | | | -62 | % | | | 22 | | | | 32 | | | | 52 | | | | -31 | % | | | -38 | % | | | | | | | | | | | | | | | | | | Net revenue | | | 4,965.2 | | | | 4,509.9 | | | | 4,106.8 | | | | 10 | % | | | 10 | % | | | 6,619 | | | | 6,278 | | | | 5,657 | | | | 5 | % | | | 11 | % | Operating expenses | | | 4,410.2 | | | | 4,028.1 | | | | 3,714.0 | | | | 9 | % | | | 8 | % | | | 5,781 | | | | 5,508 | | | | 4,983 | | | | 5 | % | | | 11 | % | | | | | | | | | | | | | | | | | | Income before allocations to partners | | $ | 555.0 | | | $ | 481.8 | | | $ | 392.8 | | | | 15 | % | | | 23 | % | | $ | 838 | | | $ | 770 | | | $ | 674 | | | | 9 | % | | | 14 | % | | | | | | | | | | | | | | | | | | | | | | | | | | | | | | | | | | | | | Related metrics: | | | | | | | | | | | | | | | | | | | | | | | | | | | | | | | Client dollars invested(1): | | | | | | | | | | | | | | | | | | | | | | | | | | | | | | | Trade ($ billions) | | $ | 97.4 | | | $ | 88.4 | | | $ | 87.8 | | | | 10 | % | | | 1 | % | | $ | 113.6 | | | $ | 112.8 | | | $ | 107.9 | | | | 1 | % | | | 5 | % | Advisory programs ($ billions) | | $ | 11.9 | | | $ | 17.8 | | | $ | 21.6 | | | | -33 | % | | | -18 | % | | $ | 13.8 | | | $ | 19.8 | | | $ | 18.8 | | | | -30 | % | | | 5 | % | Client households at year end (millions) | | | 4.52 | | | | 4.48 | | | | 4.46 | | | | 1 | % | | | 0 | % | | Client households at year end | | | | 5.0 | | | | 4.7 | | | | 4.6 | | | | 6 | % | | | 2 | % | Net new assets for the year ($ billions) (2) | | | $ | 49.2 | | | $ | 52.3 | | | $ | 41.2 | | | | -6 | % | | | 27 | % | Client assets under care: | | | | | | | | | | | | | | | | | | | | | | | | | | | | | | | Total: | | | | | | | | | | | | | | | | | | | | | | | | | | | | | | | At year end ($ billions) | | $ | 668.7 | | | $ | 591.2 | | | $ | 572.6 | | | | 13 | % | | | 3 | % | | $ | 876.5 | | | $ | 866.2 | | | $ | 787.1 | | | | 1 | % | | | 10 | % | Average ($ billions) | | $ | 636.9 | | | $ | 586.1 | | | $ | 535.8 | | | | 9 | % | | | 9 | % | | $ | 881.3 | | | $ | 831.6 | | | $ | 726.4 | | | | 6 | % | | | 14 | % | Advisory Programs: | | | | | | | | | | | | Advisory programs: | | | | | | | | | | | | | | | | | | | | | | At year end ($ billions) | | $ | 87.4 | | | $ | 68.8 | | | $ | 53.7 | | | | 27 | % | | | 28 | % | | $ | 142.2 | | | $ | 136.9 | | | $ | 115.6 | | | | 4 | % | | | 18 | % | Average ($ billions) | | $ | 78.8 | | | $ | 63.6 | | | $ | 40.8 | | | | 24 | % | | | 56 | % | | $ | 142.4 | | | $ | 127.7 | | | $ | 101.0 | | | | 12 | % | | | 26 | % | Financial advisors: | | | | | | | | | | | | Financial advisors (actual): | | | | | | | | | | | | | | | | | | | | | | At year end | | | 12,463 | | | | 12,242 | | | | 12,616 | | | | 2 | % | | | -3 | % | | | 14,508 | | | | 14,000 | | | | 13,158 | | | | 4 | % | | | 6 | % | Average | | | 12,273 | | | | 12,359 | | | | 12,694 | | | | -1 | % | | | -3 | % | | | 14,294 | | | | 13,557 | | | | 12,784 | | | | 5 | % | | | 6 | % | Attrition % | | | 10.7 | % | | | 14.1 | % | | | 16.2 | % | | | n/a | | | | n/a | | | | 9.7 | % | | | 8.9 | % | | | 9.4 | % | | n/a | | | n/a | | Dow Jones Industrial Average: | | | | | | | | | | | | Dow Jones Industrial Average (actual): | | | | | | | | | | | | | | | | | | | | | | At year end | | | 13,104 | | | | 12,218 | | | | 11,578 | | | | 7 | % | | | 6 | % | | | 17,425 | | | | 17,823 | | | | 16,577 | | | | -2 | % | | | 8 | % | Average for year | | | 12,965 | | | | 11,958 | | | | 10,669 | | | | 8 | % | | | 12 | % | | | 17,587 | | | | 16,778 | | | | 15,010 | | | | 5 | % | | | 12 | % | S&P 500 Index: | | | | | | | | | | | | S&P 500 Index (actual): | | | | | | | | | | | | | | | | | | | | | | At year end | | | 1,426 | | | | 1,258 | | | | 1,258 | | | | 13 | % | | | 0 | % | | | 2,044 | | | | 2,059 | | | | 1,848 | | | | -1 | % | | | 11 | % | Average for year | | | 1,379 | | | | 1,268 | | | | 1,139 | | | | 9 | % | | | 11 | % | | | 2,061 | | | | 1,931 | | | | 1,644 | | | | 7 | % | | | 17 | % |
(1) | Client dollars invested related to trade revenue includesrepresents the principal amount of clients’ buy and sell transactions generating a commission.resulting in revenues. Client dollars invested related to advisory programs revenue represents the net inflows of client dollars into the programs. |
(2) | Net new assets represents cash and securities inflows and outflows from new and existing clients. In the fourth quarter of 2014, net new assets was revised to exclude mutual fund capital gain distributions received by U.S. clients. Previously reported amounts were recast to conform to the current definition.
|
31
PART II Item 7. | Management’s Discussion and Analysis of Financial Condition and Results of Operations, continued |
20122015 versus 20112014 Overview
During 2012, global market and economic conditions improved overallThe Partnership experienced strong financial results during 2015 compared to 2011 even though concerns about U.S.2014, including record net revenue and global economic growthincome before allocations to partners. Results benefitted from net new assets and an uncertain political environment led investorsmarket conditions. Despite market volatility, the average S&P 500 Index increased 7% and the average Dow Jones Industrial Average increased 5%. However, results began to remain cautious. Despite these concerns,soften beginning in September 2015 due to market declines.
The Partnership’s key performance measures were strong during 2015 and financial advisors attracted $49.2 billion in net new assets. Average client assets under care grew 6% to $881.3 billion for the Partnership experienced record financial resultsyear ended December 31, 2015, which included a 12% increase in 2012 through continued focus on providing solutionsthe advisory programs’ average assets under care to its clients.$142.4 billion. The inflow of client dollars into advisory programs was $13.8 billion for 2015 compared to $19.8 billion in 2014 as the programs continue to mature. Net revenue increased 10%5% to $5.0$6.6 billion in 2012 compared to 2011, which is2015. This increase was led by a record for the Partnership. This significant growth in net revenue is primarily attributable to a 14%10% increase in total fee revenue, primarily due to higher levels of asset values on which fees were earned, driven by the continued investment of client dollars into advisory programs and increases in average market values. The rate of growth slowed beginning in September 2015 and continued for the overall riseremainder of 2015 due to market declines and fewer client dollars invested. Operating expenses increased 5% in the equity market daily averages, evidenced by the 9%2015 compared to 2014, primarily due to increased compensation expense for financial advisors, due to higher revenues on which they are paid, and for home office and branch associates, due to an increase in the dailynumber of personnel. Overall, the increase in net revenue, partially offset by the increase in operating expenses, generated income before allocations to partners of $838, a 9% increase over 2014. 2014 versus 2013 Overview The Partnership experienced very strong financial results during 2014 compared to a successful 2013, including record net revenue, income before allocations to partners and client assets under care. Financial results benefitted from net new assets and rising market conditions in 2014, including increases of 17% in the average S&P 500 Index and the 8% increase12% in the daily average Dow Jones Industrial Average. These factors also contributed to a changing composition of net revenue, which was 45% trade and 53% fee revenue in 2012, compared to 47% trade and 51% fee revenue in 2011. Operating expenses increased 9% in 2012 compared to 2011, primarily due to an increase in compensation and benefits driven by increased financial advisor productivity as well as higher variable incentive compensation due to the increase in the Partnership’s profitability.
The impact of the 10% increase in net revenues, partially offset by a 9% increase in operating expenses resulted in a 15% increase in income before allocations to partners to $555.0 million.
The Partnership’s key performance measures were relatively strong during 2014 and financial advisors attracted $52.3 billion in 2012.net new assets. Average client assets under care grew 9% in 201214% to $636.9$831.6 billion, which included a 24%26% increase in the average advisory programsprograms’ average assets under care to $78.8$127.7 billion. In addition, client dollars invested relatingrelated to trade revenue were up 10%5% to $97.4$112.8 billion. 2011 versus 2010 Overview
The Partnership experienced improved financial results in 2011 compared to 2010 despite some challenging economic and market conditions throughout 2011 caused by the debt ceiling crisis, a downgrade of the U.S. credit rating and concerns over European debt, all of which caused increased market volatility. This volatility is reflected in the fact that the S&P 500 Index was as low as 1,099 in October of 2011 and as high as 1,364 in April 2011, a 24% swing, ending the year at 1,258, the same as it started the year. However, the 2011 daily average S&P 500 Index was up 11% year-over-year and the Dow Jones Industrial Average daily average was up 12% year-over-year.
The Partnership’s key performance measures were relatively strong in 2011. Average client assets under care grew 9% in 2011 to $586.1 billion, which included a 56% increase in the average advisory programs assets under care to $63.6 billion. In addition, client dollars invested relating to trade revenue were up slightly 1% to $88.4 billion.
In 2011, netNet revenue increased 10%11% to $4.5$6.3 billion compared to 2010.in 2014. This increase was drivenled by a 21%20% increase in total fee revenue, primarily due to higher levels of asset values on which fees were earned, driven by the continued investment of client dollars into advisory programs and the overall rise in the equity market daily averages. These factors also contributed to a changing composition of net revenue, which was 47% trade and 51% fee revenue in 2011, compared to 51% trade and 46% fee revenue in 2010.
PART II
Item 7.
| Management’s Discussion and Analysis of Financial Condition and Results of Operations, continued
|
markets. Operating expenses increased 8%11% in 20112014 compared to 2010,2013, primarily due to an increase inincreased compensation and benefitsexpense driven by increasedhigher revenues on which financial advisor productivity as well asadvisors are paid and higher variable incentive compensation due to the increase in the Partnership’s profitability. The impact ofOverall, the increase in net revenues andrevenue, partially offset by the increase in operating expenses, resulted in a 23% increase ingenerated income before allocations to Partners.partners of $770, a 14% increase over 2013.
RESULTS OF OPERATIONS FOR THE YEARS ENDED DECEMBER 31, 2012, 20112015, 2014 AND 20102013 The discussion below details the significant fluctuations and their drivers for each of the major categories of the Partnership’s Consolidated Statements of Income. 32
PART II Item 7. | Management’s Discussion and Analysis of Financial Condition and Results of Operations, continued |
Fee Revenue Fee revenue, which consists of asset-based fees and account and activity fees, increased 10% in 2015 to $4,089 and 20% in 2014 to $3,706. The increases in fee revenue for both 2015 and 2014 were primarily due to growth of market value of client assets and continued investment in advisory programs. A discussion of fee revenue components follows. Asset-based | | Years Ended December 31, | | | % Change | | | | 2015 | | | 2014 | | | 2013 | | | 2015 vs. 2014 | | | 2014 vs. 2013 | | Asset-based fee revenue: | | | | | | | | | | | | | | | | | | | | | Advisory programs fees | | $ | 1,955 | | | $ | 1,732 | | | $ | 1,368 | | | | 13 | % | | | 27 | % | Service fees | | | 1,211 | | | | 1,129 | | | | 959 | | | | 7 | % | | | 18 | % | Revenue sharing | | | 184 | | | | 184 | | | | 155 | | | | — | | | | 19 | % | Trust fees | | | 40 | | | | 39 | | | | 34 | | | | 3 | % | | | 15 | % | Cash solutions | | | 9 | | | | 5 | | | | 7 | | | | 80 | % | | | -29 | % | Total asset-based fee revenue | | $ | 3,399 | | | $ | 3,089 | | | $ | 2,523 | | | | 10 | % | | | 22 | % | | | | | | | | | | | | | | | | | | | | | | Related metrics ($ billions): | | | | | | | | | | | | | | | | | | | | | Average U.S. client asset values(1): | | | | | | | | | | | | | | | | | | | | | Mutual fund assets held outside of advisory programs | | $ | 392.2 | | | $ | 363.7 | | | $ | 312.9 | | | | 8 | % | | | 16 | % | Advisory programs | | | 140.9 | | | | 126.8 | | | | 100.6 | | | | 11 | % | | | 26 | % | Insurance | | | 73.3 | | | | 70.4 | | | | 62.6 | | | | 4 | % | | | 12 | % | Cash solutions | | | 20.1 | | | | 20.0 | | | | 19.9 | | | | 1 | % | | | 1 | % | Total client asset values | | $ | 626.5 | | | $ | 580.9 | | | $ | 496.0 | | | | 8 | % | | | 17 | % |
(1) | Assets on which the Partnership earns asset-based fee revenue. The U.S. portion of consolidated asset-based fee revenue was 98% for all periods presented. |
2015 vs. 2014 – Asset-based fee revenue increased 10% in 2015 to $3,399 primarily due to greater advisory programs fees and service fees. The growth in advisory programs and service fees revenue was primarily due to continued investment of client assets and increases in the market value of the underlying assets. Investment of client dollars in advisory programs included new client assets and assets converted from existing clients previously held with the Partnership outside of advisory programs. The inflow of client dollars into advisory programs was $13.8 billion for 2015 compared to $19.8 billion in the prior year as the advisory programs continue to mature. 2014 vs. 2013 – Asset-based fee revenue increased 22% in 2014 to $3,089 primarily due to greater advisory programs fees and service fees. Advisory programs fee revenue growth was primarily due to increased investment of client dollars into advisory programs and increases in the market value of the underlying assets. Investment of client dollars includes new client assets and assets converted from existing clients, previously held with the Partnership outside of advisory programs. Service fees and revenue sharing increased in 2014 due to increases in the market value of the underlying assets as well as continued investment of client dollars into mutual fund products, which includes new client assets. Advisory programs fees include $30, $8 and $1 for 2015, 2014 and 2013, respectively, for investment advisory fees the Trust pays OLV for performing investment advisory services. OLV has contractually agreed to waive these fees to the extent such fees exceed the investment advisory fees OLV is contractually obligated to pay the sub-advisers to the funds in the Trust, which are recognized in professional and consulting fees expense. Thus, while the Partnership anticipates the investment advisory fees earned by OLV to increase as a result of the increase in assets invested in the Trust, there will be no impact on the Partnership's net income. The Trust added one mutual fund in 2014 and seven mutual funds in 2015. At its discretion, the Trust may add additional funds in the future. 33
PART II Item 7. | Management’s Discussion and Analysis of Financial Condition and Results of Operations, continued |
Account and Activity | | Years Ended December 31, | | | % Change | | | | 2015 | | | 2014 | | | 2013 | | | 2015 vs. 2014 | | | 2014 vs. 2013 | | Account and activity fee revenue: | | | | | | | | | | | | | | | | | | | | | Shareholder accounting services fees | | $ | 424 | | | $ | 385 | | | $ | 350 | | | | 10 | % | | | 10 | % | Retirement account fees | | | 136 | | | | 126 | | | | 126 | | | | 8 | % | | | 0 | % | Insurance contract service fees | | | 46 | | | | 15 | | | | — | | | | 207 | % | | | 100 | % | Other account and activity fees | | | 84 | | | | 91 | | | | 92 | | | | -8 | % | | | -1 | % | Total account and activity fee revenue | | $ | 690 | | | $ | 617 | | | $ | 568 | | | | 12 | % | | | 9 | % | | | | | | | | | | | | | | | | | | | | | | Related metrics: | | | | | | | | | | | | | | | | | | | | | Average client: | | | | | | | | | | | | | | | | | | | | | Shareholder accounting holdings serviced | | | 24.2 | | | | 21.9 | | | | 19.8 | | | | 11 | % | | | 11 | % | Retirement accounts | | | 5.1 | | | | 4.6 | | | | 4.2 | | | | 11 | % | | | 10 | % |
2015 vs. 2014 – Account and activity fee revenue increased 12% in 2015 to $690 primarily led by growth in shareholder accounting services fees due to the increase in the average number of client mutual fund holdings serviced. Insurance contract service fees are fees earned for administrative support under contracts with certain insurance companies that were primarily entered into in the latter portion of 2014. 2014 vs. 2013 – Account and activity fee revenue increased 9% in 2014 to $617 primarily led by growth in shareholder accounting services fees due to the increase in the average number of client mutual fund holdings serviced. The increase in insurance contract service fees was due to new contracts as noted above. Retirement account fees were flat, even though the number of retirement accounts increased, as more accounts reached the asset level at which fees are waived. Trade Revenue Trade revenue, which consists of commissions and principal transactions, and investment banking revenue, increased 5% to $2.2 billion during 2012 anddecreased 1% to $2.1 billion$2,425 during 2011.2015 and increased 1% to $2,460 during 2014. The decrease in trade revenue for 2015 was primarily due to a decrease in the margin earned, partially offset by the impact of increased client dollars invested. The increase in trade revenue for 20122014 was primarily due to the impact of increased client dollars invested, partially offset by a decrease in the margin earned on client dollars invested. The increase in trade revenue for 2011 was primarily due to the impact of increased client dollars invested, as well as the increase in the margin earned on client dollars invested. A discussion specific to each component of trade revenue follows.earned. | | Years Ended December 31, | | | % Change | | | | 2015 | | | 2014 | | | 2013 | | | 2015 vs. 2014 | | | 2014 vs. 2013 | | Trade revenue(1): | | | | | | | | | | | | | | | | | | | | | Commissions: | | | | | | | | | | | | | | | | | | | | | Mutual funds | | $ | 1,146 | | | $ | 1,139 | | | $ | 1,167 | | | | 1 | % | | | -2 | % | Equities | | | 635 | | | | 636 | | | | 594 | | | | 0 | % | | | 7 | % | Insurance products | | | 363 | | | | 393 | | | | 373 | | | | -8 | % | | | 5 | % | Total commissions | | | 2,144 | | | | 2,168 | | | | 2,134 | | | | -1 | % | | | 2 | % | Principal transactions | | | 281 | | | | 292 | | | | 305 | | | | -4 | % | | | -4 | % | Total trade revenue | | $ | 2,425 | | | $ | 2,460 | | | $ | 2,439 | | | | -1 | % | | | 1 | % | | | | | | | | | | | | | | | | | | | | | | Commissions related metrics: | | | | | | | | | | | | | | | | | | | | | Client dollars invested ($ billions) | | $ | 91.8 | | | $ | 91.9 | | | $ | 87.3 | | | | 0 | % | | | 5 | % | Margin per $1,000 invested | | $ | 23.3 | | | $ | 23.6 | | | $ | 24.4 | | | | -1 | % | | | -3 | % | U.S. business days | | | 252 | | | | 252 | | | | 252 | | | | — | | | | — | |
(1) | In conjunction with the 2015 closure of the negotiated municipal obligations underwriting portion of the investment banking business, the Partnership revised the presentation of trade revenue within this table to reclass investment banking to principal transactions. The revenue and costs associated with the closure were immaterial to the Partnership's Consolidated Financial Statements. Prior period figures were recast to conform to the new presentation. |
34
PART II Item 7. | Management’s Discussion and Analysis of Financial Condition and Results of Operations, continued |
Commissions – Mutual funds | | | | | | | | | | | | | | | | | | | | | | | | Years Ended December 31, | | | % Change | | | | | 2012 | | | 2011 | | | 2010 | | | 2012 vs. 2011 | | | 2011 vs. 2010 | | Commissions revenue ($ millions): | | | | | | | | | | | | | | | | | | | | | Mutual funds | | $ | 1,050.9 | | | $ | 866.0 | | | $ | 856.0 | | | | 21 | % | | | 1 | % | Equities | | | 539.2 | | | | 447.5 | | | | 393.0 | | | | 20 | % | | | 14 | % | Insurance | | | 388.9 | | | | 385.2 | | | | 326.7 | | | | 1 | % | | | 18 | % | Corporate bonds | | | — | | | | — | | | | 0.1 | | | | 0 | % | | | -100 | % | | | | | | | | | | | | | | | | | | | | | | Total commissions revenue | | $ | 1,979.0 | | | $ | 1,698.7 | | | $ | 1,575.8 | | | | 17 | % | | | 8 | % | | | | | | | | | | | | | | | | | | | | | | Related metrics: | | | | | | | | | | | | | | | | | | | | | Client dollars invested ($ billions) | | $ | 79.4 | | | $ | 65.3 | | | $ | 61.0 | | | | 22 | % | | | 7 | % | Margin per $1,000 invested | | $ | 24.90 | | | $ | 26.00 | | | $ | 25.90 | | | | -4 | % | | | 0 | % | U.S. business days | | | 250 | | | | 252 | | | | 252 | | | | -1 | % | | | 0 | % |
Commissions2015 vs. 2014 – Mutual funds revenue increased 17%1% in 20122015 to $2.0 billion$1,146. The increase was primarily due to a 22%an increase in client dollars invested, in commission generating transactions resulting from the continued improvement in market conditions and the fact that clients are continuing to reinvest their dollars from maturing fixed income products into mutual fund and equity products. This increase was partially offset by a 4% decrease in the margin earned per $1,000 invested caused by a shift from higher-margin equityinvested. As the average trade size of mutual fund transactions increased and additional breakpoints were earned, the margin earned on these transactions decreased, resulting in lower commissions earned per $1,000 invested.
2014 vs. 2013 – Mutual funds revenue decreased 2% in 2014 to lower-margin debt mutual funds. Commissions revenue increased 8% in 2011 to $1.7 billion$1,139. The decrease was primarily due to a decrease in the margin earned per $1,000 invested due to larger trade sizes as previously noted.
Commissions – Equities 2015 vs. 2014 – Equities revenue of $635 was essentially flat in 2015 compared to 2014. The slight decrease was primarily attributable to fewer client dollars invested due to market volatility during the second half of 2015. Market volatility resulted from external factors, including speculation over the Federal Reserve raising interest rates, volatility in the price of oil and slowing growth in China. 2014 vs. 2013 – Equities revenue increased 7% in 2014 to $636. The increase was primarily attributable to an increase in client dollars invested due to the continued strong equity market. Commissions – Insurance Products 2015 vs. 2014 – Insurance revenue decreased 8% in commission generating transactions resulting from improved2015 to $363. The decrease was primarily due to a decrease in client dollars invested reflecting reduced market conditions and the fact that clients are generally reinvestingdemand for insurance products. Clients shifted their dollars from maturing fixed income products intoinvestments to mutual fund and equityadvisory products due to their relatively stronger market performance and the higher cost of insurance products. 2014 vs. 2013 – Insurance revenue increased 5% in 2014 to $393. The increase was primarily due to an increase in client dollars invested due to strong overall market performance. Principal Transactions 2015 vs. 2014 – Principal transactions revenue decreased 4% in 2015 to $281. The decrease was primarily due to a decrease in the margin earned per $1,000 invested. Client investment purchases continued to shift towards unit investment trusts with shorter maturities, which have lower margins, due to the sustained low interest rate environment. 2014 vs. 2013 – Principal transactions revenue decreased 4% in 2014 to $292. The decrease was primarily due to a decrease in the margin earned per $1,000 invested as client investment purchases shifted towards products with shorter maturities which have lower margins. The decrease in revenue was also due to a decline in client dollars invested resulting from a weak fixed income market.
35
PART II Item 7. | Management’s Discussion and Analysis of Financial Condition and Results of Operations, continued |
Principal TransactionsNet Interest and Dividends
| | | | | | | | | | | | | | | | | | | | | | | | Years Ended December 31, | | | % Change | | | | | 2012 | | | 2011 | | | 2010 | | | 2012 vs. 2011 | | | 2011 vs. 2010 | | Principal transactions revenue ($ millions): | | | | | | | | | | | | | | | | | | | | | State and municipal obligations | | $ | 116.0 | | | $ | 212.6 | | | $ | 239.5 | | | | -45 | % | | | -11 | % | Corporate bonds and notes | | | 16.6 | | | | 35.2 | | | | 43.5 | | | | -53 | % | | | -19 | % | Certificates of deposit | | | 13.1 | | | | 13.5 | | | | 14.8 | | | | -3 | % | | | -9 | % | Unit investment trusts | | | 4.2 | | | | 11.0 | | | | 7.4 | | | | -62 | % | | | 49 | % | Government and agency obligations | | | 3.1 | | | | 5.9 | | | | 8.9 | | | | -47 | % | | | -34 | % | Collateralized mortgage obligations | | | 1.6 | | | | 3.5 | | | | 6.3 | | | | -54 | % | | | -44 | % | Net inventory gains | | | 1.3 | | | | 2.5 | | | | 0.4 | | | | -48 | % | | | 525 | % | | | | | | | | | | | | | | | | | | | | | | Total principal transactions revenue | | $ | 155.9 | | | $ | 284.2 | | | $ | 320.8 | | | | -45 | % | | | -11 | % | | | | | | | | | | | | | | | | | | | | | | Related metrics: | | | | | | | | | | | | | | | | | | | | | Client dollars invested ($ billions) | | $ | 13.6 | | | $ | 18.0 | | | $ | 20.2 | | | | -24 | % | | | -11 | % | Margin per $1,000 invested | | $ | 11.30 | | | $ | 15.70 | | | $ | 15.80 | | | | -28 | % | | | -1 | % | U.S. business days | | | 250 | | | | 252 | | | | 252 | | | | -1 | % | | | 0 | % |
| | Years Ended December 31, | | | % Change | | | | 2015 | | | 2014 | | | 2013 | | | 2015 vs. 2014 | | | 2014 vs. 2013 | | Net interest and dividends revenue: | | | | | | | | | | | | | | | | | | | | | Client loan interest | | $ | 125 | | | $ | 110 | | | $ | 108 | | | | 14 | % | | | 2 | % | Short-term investing interest | | | 21 | | | | 15 | | | | 14 | | | | 40 | % | | | 7 | % | Other interest and dividends | | | 12 | | | | 10 | | | | 12 | | | | 20 | % | | | -17 | % | Limited partnership interest expense | | | (69 | ) | | | (48 | ) | | | (48 | ) | | | 44 | % | | | — | | Other interest expense | | | (6 | ) | | | (7 | ) | | | (11 | ) | | | -14 | % | | | -36 | % | Total net interest and dividends revenue | | $ | 83 | | | $ | 80 | | | $ | 75 | | | | 4 | % | | | 7 | % | | | | | | | | | | | | | | | | | | | | | | Related metrics: | | | | | | | | | | | | | | | | | | | | | Average aggregate client loan balance | | $ | 2,738.9 | | | $ | 2,336.5 | | | $ | 2,109.4 | | | | 17 | % | | | 11 | % | Average rate earned | | | 4.58 | % | | | 4.69 | % | | | 5.12 | % | | | -2 | % | | | -8 | % | | | | | | | | | | | | | | | | | | | | | | Average funds invested | | $ | 10,063.1 | | | $ | 9,316.8 | | | $ | 8,764.6 | | | | 8 | % | | | 6 | % | Average rate earned | | | 0.21 | % | | | 0.16 | % | | | 0.16 | % | | | 31 | % | | | — | | | | | | | | | | | | | | | | | | | | | | | Weighted average $1,000 equivalent limited partnership units outstanding | | | 921,747 | | | | 636,481 | | | | 644,856 | | | | 45 | % | | | -1 | % |
Principal transactions
2015 vs. 2014 – Net interest and dividends revenue decreased 45%increased 4% in 20122015 to $155.9 million$83. Results reflected a 14% increase in client loan interest primarily due to an increase in the current low interest rate environment and the continued improvement in equity market conditions, which led clients to reinvest their dollars from maturing fixed income products into mutual fund and equity products. This resulted inaverage aggregate client loan balance, slightly offset by a 24% decrease in the average rate earned. The increase in interest income was offset by a 44% increase in limited partnership interest expense due to the issuance of $292 in Interests in connection with the Plan in January 2015. 2014 vs. 2013 – Net interest and dividends revenue increased 7% in 2014 to $80. Results reflected a 2% increase in client dollars investedloan interest primarily due to an increase in products that resultedthe average aggregate client loan balance, partially offset by a decrease in principal transactions revenue. In addition, margins per $1,000 invested decreased 28%the average rate earned due to new relationship-based pricing. Results were also positively impacted by a decrease in 2012 as client investments shifted inother interest expense primarily due to lower average debt balances during the current period towards products with shorter maturities, which have lower margins.as a result of debt repayments. Principal transactionsOther Revenue
Other revenue decreased 11%31% to $22 in 20112015 and decreased 38% to $284.2 million$32 in 2014. The fluctuation in both years was primarily attributable to changes in the value of investments held related to the Partnership’s nonqualified deferred compensation plan. The increase in investment value in 2015 was less than in 2014 due to a relatively smaller increase in market performance during 2015 compared to 2014. The Partnership has chosen to hedge the continued low interest rate environment and improved equity market conditions, which led clients to reinvest their dollars from maturing fixed income products into mutual fund and equity products. This resultedfuture liability for the plan by purchasing investments in an 11% decreaseamount similar to the future expected liability. As the market value of these investments fluctuates, the gains or losses are recorded in client dollars investedother revenue with an offset in products that resultedcompensation and fringe benefits expense, resulting in principal transactions revenue.minimal net impact to the Partnership’s income before allocations to partners. 36
PART II Item 7. | Management’s Discussion and Analysis of Financial Condition and Results of Operations, continued |
Investment BankingOperating Expenses
| | | | | | | | | | | | | | | | | | | | | | | | Years Ended December 31, | | | % Change | | | | | 2012 | | | 2011 | | | 2010 | | | 2012 vs. 2011 | | | 2011 vs. 2010 | | Investment banking revenue ($ millions): | | | | | | | | | | | | | | | | | | | | | Distribution | | $ | 106.9 | | | $ | 141.2 | | | $ | 191.1 | | | | -24 | % | | | -26 | % | Underwriting | | | 4.7 | | | | 11.9 | | | | 17.5 | | | | -61 | % | | | -32 | % | | | | | | | | | | | | | | | | | | | | | | Total investment banking revenue | | $ | 111.6 | | | $ | 153.1 | | | $ | 208.6 | | | | -27 | % | | | -27 | % | | | | | | | | | | | | | | | | | | | | | | Related metrics: | | | | | | | | | | | | | | | | | | | | | Client dollars invested ($ billions) | | $ | 4.3 | | | $ | 5.1 | | | $ | 6.6 | | | | -16 | % | | | -23 | % | Margin per $1,000 invested | | $ | 26.00 | | | $ | 29.90 | | | $ | 31.60 | | | | -13 | % | | | -5 | % | U.S. business days | | | 250 | | | | 252 | | | | 252 | | | | -1 | % | | | 0 | % |
| | Years Ended December 31, | | | % Change | | | | 2015 | | | 2014 | | | 2013 | | | 2015 vs. 2014 | | | 2014 vs. 2013 | | Operating expenses: | | | | | | | | | | | | | | | | | | | | | Compensation and benefits: | | | | | | | | | | | | | | | | | | | | | Financial advisor | | $ | 2,655 | | | $ | 2,535 | | | $ | 2,289 | | | | 5 | % | | | 11 | % | Home office and branch | | | 1,166 | | | | 1,100 | | | | 1,028 | | | | 6 | % | | | 7 | % | Variable compensation | | | 820 | | | | 801 | | | | 643 | | | | 2 | % | | | 25 | % | Total compensation and benefits | | | 4,641 | | | | 4,436 | | | | 3,960 | | | | 5 | % | | | 12 | % | Occupancy and equipment | | | 382 | | | | 367 | | | | 356 | | | | 4 | % | | | 3 | % | Communications and data processing | | | 286 | | | | 289 | | | | 292 | | | | -1 | % | | | -1 | % | Professional and consulting fees | | | 87 | | | | 59 | | | | 48 | | | | 47 | % | | | 23 | % | Advertising | | | 69 | | | | 70 | | | | 58 | | | | -1 | % | | | 21 | % | Postage and shipping | | | 51 | | | | 51 | | | | 51 | | | | — | | | | — | | Other operating expenses | | | 265 | | | | 236 | | | | 218 | | | | 12 | % | | | 8 | % | Total operating expenses | | $ | 5,781 | | | $ | 5,508 | | | $ | 4,983 | | | | 5 | % | | | 11 | % | | | | | | | | | | | | | | | | | | | | | | Related metrics (actual): | | | | | | | | | | | | | | | | | | | | | Number of branches: | | | | | | | | | | | | | | | | | | | | | At year end | | | 12,482 | | | | 12,016 | | | | 11,647 | | | | 4 | % | | | 3 | % | Average | | | 12,250 | | | | 11,810 | | | | 11,510 | | | | 4 | % | | | 3 | % | Financial advisors: | | | | | | | | | | | | | | | | | | | | | At year end | | | 14,508 | | | | 14,000 | | | | 13,158 | | | | 4 | % | | | 6 | % | Average | | | 14,294 | | | | 13,557 | | | | 12,784 | | | | 5 | % | | | 6 | % | Branch office administrators(1)(3): | | | | | | | | | | | | | | | | | | | | | At year end | | | 14,407 | | | | 14,008 | | | | 13,444 | | | | 3 | % | | | 4 | % | Average | | | 14,223 | | | | 13,714 | | | | 13,309 | | | | 4 | % | | | 3 | % | Home office associates(1)(3): | | | | | | | | | | | | | | | | | | | | | At year end | | | 5,913 | | | | 5,621 | | | | 5,435 | | | | 5 | % | | | 3 | % | Average | | | 5,803 | | | | 5,573 | | | | 5,425 | | | | 4 | % | | | 3 | % | Home office associates(1) per 100 financial advisors (average) | | | 40.6 | | | | 41.1 | | | | 42.4 | | | | -1 | % | | | -3 | % | Branch office administrators(1) per 100 financial advisors (average) | | | 99.5 | | | | 101.2 | | | | 104.1 | | | | -2 | % | | | -3 | % | Average operating expenses per financial advisor(2) | | $ | 161,326 | | | $ | 160,212 | | | $ | 160,435 | | | | 1 | % | | | — | |
Investment banking revenue decreased 27% in 2012 to $111.6 million. Due to the continued low interest rate environment and lower supply of state and municipal obligations, the demand for investment banking products decreased by 16% in 2012. The decrease in investment banking revenue was further caused by a 13% decrease in in the margin earned per $1,000 invested, resulting from a shift in client investments away from higher margin municipal and corporate unit investment trusts towards lower margin equity unit investment trusts.
(1) | Counted on a full-time equivalent ("FTE") basis. |
(2) | Operating expenses used in calculation represent total operating expenses less financial advisor and variable compensation. In 2015, payroll taxes were combined with compensation and benefits and financial advisor salary and subsidy was combined with financial advisor compensation. The 2014 and 2013 operating expense amounts used in the calculation were recast to conform to the new presentation. |
(3) | The methodology used to calculate FTEs was revised at the beginning of 2014. Metrics were updated to conform to the new methodology.
|
Investment banking revenue decreased 27% in 2011 to $153.1 million. Due to the continued low interest rate environment and lower supply of state and municipal obligations, the demand for investment banking products decreased by 23% in 2011. The decrease in investment banking revenue was further caused by a 5% decrease in the margin earned per $1,000 invested, resulting from a shift in client investments away from higher margin municipal and corporate unit investment trusts towards lower margin equity unit investment trusts.37
PART II Item 7. | Management’s Discussion and Analysis of Financial Condition and Results of Operations, continued |
Fee Revenue2015 vs. 2014
Fee revenueOperating expenses increased 14%5% in 20122015 to $2.6 billion and 21% in 2011 to $2.3 billion. A discussion specific to each component of fee revenue follows.
Asset-based
| | | | | | | | | | | | | | | | | | | | | | | | Years Ended December 31, | | | % Change | | | | | 2012 | | | 2011 | | | 2010 | | | 2012 vs. 2011 | | | 2011 vs. 2010 | | Asset-based fee revenue ($ millions): | | | | | | | | | | | | | | | | | | | | | Advisory programs fees | | $ | 1,052.5 | | | $ | 849.6 | | | $ | 543.9 | | | | 24 | % | | | 56 | % | Service fees | | | 808.7 | | | | 765.0 | | | | 693.9 | | | | 6 | % | | | 10 | % | Revenue sharing | | | 138.6 | | | | 129.0 | | | | 119.0 | | | | 7 | % | | | 8 | % | Trust fees | | | 28.4 | | | | 23.9 | | | | 19.6 | | | | 19 | % | | | 22 | % | Cash solutions | | | 14.2 | | | | 9.4 | | | | 20.9 | | | | 51 | % | | | -55 | % | | | | | | | | | | | | | | | | | | | | | | Total asset-based fee revenue | | $ | 2,042.4 | | | $ | 1,776.9 | | | $ | 1,397.3 | | | | 15 | % | | | 27 | % | | | | | | | | | | | | | | | | | | | | | | Related metrics ($ billions): | | | | | | | | | | | | | | | | | | | | | Average U.S. client asset values(1): | | | | | | | | | | | | | | | | | | | | | Mutual fund assets held outside of advisory programs | | $ | 329.3 | | | $ | 305.3 | | | $ | 274.0 | | | | 8 | % | | | 11 | % | Advisory programs | | | 78.8 | | | | 63.6 | | | | 40.8 | | | | 24 | % | | | 56 | % | Insurance | | | 54.6 | | | | 50.4 | | | | 44.8 | | | | 8 | % | | | 13 | % | Cash solutions | | | 18.4 | | | | 17.9 | | | | 18.8 | | | | 3 | % | | | -5 | % | | | | | | | | | | | | | | | | | | | | | | Total client asset values | | $ | 481.1 | | | $ | 437.2 | | | $ | 378.4 | | | | 10 | % | | | 16 | % | | | | | | | | | | | | | | | | | | | | | |
(1)
| Assets on which the partnership earns asset-based fee revenue. U.S. asset-based fee revenue represents 97% of consolidated asset-based fee revenue for the years ended December 31, 2012, 2011 and 2010.
|
Asset-based fee revenue increased 15% in 2012 to $2.0 billion primarily due to increases in advisory programs fees. Advisory programs fee revenue increased 24% primarily due to market appreciation of asset values as well as continued investment of client dollars into the advisory programs. A majority of client assets held in the advisory programs were converted from other client investments previously held with the Partnership.
Asset-based fee revenue increased 27% in 2011 to $1.8 billion primarily due to increases in advisory programs fees. Advisory programs fee revenue increased 56% primarily due to market appreciation of asset values as well as continued investment of client dollars into the advisory programs.
PART II
Item 7.
| Management’s Discussion and Analysis of Financial Condition and Results of Operations, continued
|
Account and Activity
| | | | | | | | | | | | | | | | | | | | | | | | Years Ended December 31, | | | % Change | | | | | 2012 | | | 2011 | | | 2010 | | | 2012 vs. 2011 | | | 2011 vs. 2010 | | Account and activity fee revenue ($ millions): | | | | | | | | | | | | | | | | | | | | | Sub-transfer agent services | | $ | 322.2 | | | $ | 289.1 | | | $ | 273.7 | | | | 11 | % | | | 6 | % | Retirement account fees | | | 141.6 | | | | 136.9 | | | | 132.7 | | | | 3 | % | | | 3 | % | Other account and activity fees | | | 110.1 | | | | 96.9 | | | | 96.9 | | | | 14 | % | | | 0 | % | | | | | | | | | | | | | | | | | | | | | | Total account and activity fee revenue | | $ | 573.9 | | | $ | 522.9 | | | $ | 503.3 | | | | 10 | % | | | 4 | % | | | | | | | | | | | | | | | | | | | | | | Related metrics (millions): | | | | | | | | | | | | | | | | | | | | | Average client accounts: | | | | | | | | | | | | | | | | | | | | | Sub-transfer agent services(1) | | | 18.4 | | | | 17.1 | | | | 15.8 | | | | 8 | % | | | 8 | % | Retirement accounts | | | 3.7 | | | | 3.5 | | | | 3.4 | | | | 6 | % | | | 3 | % |
(1)
| Amount represents average number of individual mutual fund holdings serviced, on which the Partnership recognizes sub-transfer agent services revenue.
|
Account and activity fee revenue increased 10% in 2012 to $573.9 million primarily due to increases in revenue from sub-transfer agent services and other account and activity fees. Sub-transfer agent services increased primarily due to increases in the number of average client holdings serviced as well as a contract rate adjustment effective for 2012. Other account and activity fees increased primarily due to increases in various other types of fees including credit card revenue and other transaction fees.
Account and activity fee revenue increased 4% in 2011 to $522.9 million primarily due to increases in revenue from sub-transfer agent services and retirement account fees. Sub-transfer agent services and retirement account fees increased primarily due to increases in the number of average client holdings serviced and the number of accounts, respectively.
PART II
Item 7.
| Management’s Discussion and Analysis of Financial Condition and Results of Operations, continued
|
Net Interest and Dividends
| | | | | | | | | | | | | | | | | | | | | | | | Years Ended December 31, | | | % Change | | | | | 2012 | | | 2011 | | | 2010 | | | 2012 vs. 2011 | | | 2011 vs. 2010 | | Net interest and dividends revenue ($ millions): | | | | | | | | | | | | | | | | | | | | | Client loan interest | | $ | 112.9 | | | $ | 115.2 | | | $ | 112.7 | | | | -2 | % | | | 2 | % | Short-term investing interest | | | 11.3 | | | | 7.4 | | | | 9.9 | | | | 53 | % | | | -25 | % | Other interest and dividends | | | 9.2 | | | | 7.5 | | | | 4.2 | | | | 23 | % | | | 79 | % | Interest expense | | | (62.2 | ) | | | (67.6 | ) | | | (56.3 | ) | | | -8 | % | | | 20 | % | | | | | | | | | | | | | | | | | | | | | | Total net interest and dividends revenue | | $ | 71.2 | | | $ | 62.5 | | | $ | 70.5 | | | | 14 | % | | | -11 | % | | | | | | | | | | | | | | | | | | | | | | Related metrics ($ millions): | | | | | | | | | | | | | | | | | | | | | Average aggregate client loan balance | | $ | 2,187.9 | | | $ | 2,213.9 | | | $ | 2,144.3 | | | | -1 | % | | | 3 | % | Average rate earned | | | 5.15 | % | | | 5.20 | % | | | 5.26 | % | | | -1 | % | | | -1 | % | Average funds invested | | $ | 6,560.0 | | | $ | 4,815.0 | | | $ | 4,046.8 | | | | 36 | % | | | 19 | % | Average rate earned | | | 0.17 | % | | | 0.15 | % | | | 0.24 | % | | | 13 | % | | | -38 | % | Weighted average $1,000 equivalent limited partnership units outstanding | | | 655,663 | | | | 668,450 | | | | 455,949 | | | | -2 | % | | | 47 | % |
Net interest and dividends revenue increased 14% in 2012 to $71.2 million$5,781 primarily due to a decrease$205 increase in interest expensecompensation and increasesbenefits, a $29 increase in short-term investing interestother operating expenses primarily related to legal, travel and other interestexpenses, and dividends. Interest expense decreaseda $28 increase in 2012professional and consulting fees primarily due to lower average debt balances during the current period related to debt repaymentsfees paid by OLV to sub-advisers. The fees paid to sub-advisers are offset by investment advisory fee revenue earned by OLV, resulting in 2011 and 2012. Other interest and dividends revenueno impact on the Partnership's net income (see further discussion in "Fee Revenue – Asset-based" section above).
Financial advisor compensation increased 23%5% in 2015 primarily due to an increase in interest income recognized on general partner partnership loans. See further discussion of these loans in Note 10 to the Consolidated Financial Statements. Interest income from cash and cash equivalents, cash and investments segregated under federal regulations and securities purchased under agreements to resell increased 53% in 2012 primarily due to an increase in the average funds invested on these types of investments as well as an increase in the rate earned. The related average funds invested increased 36% and included $5.6 billion of funds that were segregated in special reserve bank accounts for the benefit of U.S. clients under SEC rule 15c3-3, compared to $3.9 billion in 2011. The average rate earned on total funds invested increased 13% to 0.17% and the average rate earned on the segregated funds invested increased 15% to 0.16%. See the Liquidity and Capital Resources discussion below for additional information.
Net interest and dividends revenue decreased 11% in 2011 to $62.5 million primarily due to an increase in interest expense and a decrease in short-term investing interest partially offset by an increase in other interest and dividends. Interest expense increased in 2011 primarily due to an increase ($15.9 million) in the minimum 7.5% annual return on the additional limited partnership interests resulting from the limited partnership offering completed in January 2011. This increase was partially offset by a decrease in debt interest expense of $4.9 million (25%), due to lower average debt balances outstanding caused by debt repayments during 2011 and 2010. Other interest and dividends revenue increased 79% primarily due to an increase in interest income recognized on general partner partnership loans.
PART II
Item 7.
| Management’s Discussion and Analysis of Financial Condition and Results of Operations, continued
|
Interest income from cash and cash equivalents, cash and investments segregated under federal regulations and securities purchased under agreements to resell decreased 25% in 2011 primarily due to a decrease in rates earned on these types of investments, partially offset by an increase in average funds invested. The related average funds invested increased 19% in 2011 and included $3.9 billion of funds that were segregated in special reserve bank accounts for the benefit of U.S. clients under SEC Rule 15c3-3, compared to $3.0 billion in 2010. The average rate earned on total funds invested decreased 38% to 0.15% and the average rate earned on the segregated funds invested decreased 44% to 0.14%. See the Liquidity and Capital Resources discussion below for additional information.
Other Revenue
Other revenue increased 169% to $31.2 million in 2012 and decreased 62% to $11.6 million in 2011. The fluctuations in both years are primarily attributable to changes in the value of the investments held related to the Partnership’s non-qualified deferred compensation plan. As the market value of these investments fluctuates, the gains or losses are reflected in other revenue with an offset in compensation and fringe benefits expense, which results in no net impact to the Partnership’s income before allocations to partners.
PART II
Item 7.
| Management’s Discussion and Analysis of Financial Condition and Results of Operations, continued
|
Operating Expenses
| | | | | | | | | | | | | | | | | | | | | | | | Years Ended December 31, | | | % Change | | | | | 2012 | | | 2011 | | | 2010 | | | 2012 vs. 2011 | | | 2011 vs. 2010 | | Operating expenses ($ millions): | | | | | | | | | | | | | | | | | | | | | Compensation and benefits | | $ | 3,285.2 | | | $ | 2,940.1 | | | $ | 2,643.7 | | | | 12 | % | | | 11 | % | Occupancy and equipment | | | 353.0 | | | | 356.6 | | | | 343.3 | | | | -1 | % | | | 4 | % | Communications and data processing | | | 279.3 | | | | 289.4 | | | | 290.1 | | | | -3 | % | | | 0 | % | Payroll and other taxes | | | 186.0 | | | | 171.1 | | | | 159.9 | | | | 9 | % | | | 7 | % | Advertising | | | 56.3 | | | | 54.2 | | | | 55.7 | | | | 4 | % | | | -3 | % | Postage and shipping | | | 47.6 | | | | 48.5 | | | | 49.8 | | | | -2 | % | | | -3 | % | Clearance fees | | | 12.6 | | | | 12.6 | | | | 11.6 | | | | 0 | % | | | 9 | % | Other operating expenses | | | 190.2 | | | | 155.6 | | | | 159.9 | | | | 22 | % | | | -3 | % | | | | | | | | | | | | | | | | | | | | | | Total operating expenses | | $ | 4,410.2 | | | $ | 4,028.1 | | | $ | 3,714.0 | | | | 9 | % | | | 8 | % | | | | | | | | | | | | | | | | | | | | | | Related metrics: | | | | | | | | | | | | | | | | | | | | | Number of branches | | | | | | | | | | | | | | | | | | | | | At period end | | | 11,415 | | | | 11,408 | | | | 11,375 | | | | 0 | % | | | 0 | % | Average | | | 11,396 | | | | 11,394 | | | | 11,306 | | | | 0 | % | | | 1 | % | Financial advisors: | | | | | | | | | | | | | | | | | | | | | At period end | | | 12,463 | | | | 12,242 | | | | 12,616 | | | | 2 | % | | | -3 | % | Average | | | 12,273 | | | | 12,359 | | | | 12,694 | | | | -1 | % | | | -3 | % | Branch employees(1): | | | | | | | | | | | | | | | | | | | | | At period end | | | 13,619 | | | | 12,889 | | | | 13,002 | | | | 6 | % | | | -1 | % | Average | | | 13,365 | | | | 13,130 | | | | 12,665 | | | | 2 | % | | | 4 | % | Home office employees(1): | | | | | | | | | | | | | | | | | | | | | At period end | | | 5,087 | | | | 4,933 | | | | 4,898 | | | | 3 | % | | | 1 | % | Average | | | 5,008 | | | | 4,919 | | | | 4,866 | | | | 2 | % | | | 1 | % | Home office employees(1) per 100 financial advisors (average) | | | 40.8 | | | | 39.8 | | | | 38.3 | | | | 3 | % | | | 4 | % | Branch employees(1) per 100 financial advisors (average) | | | 108.9 | | | | 106.2 | | | | 99.8 | | | | 3 | % | | | 6 | % | Average operating expenses per financial advisor(2) | | $ | 177,177 | | | $ | 166,096 | | | $ | 159,000 | | | | 7 | % | | | 4 | % |
(1)
| Counted on a full-time equivalent (“FTEs”) basis.
|
(2)
| Operating expenses used in calculation represents total operating expenses less financial advisor and variable compensation.
|
Operating expenses increased 9% in 2012 to $4.4 billion primarily due to a 12% increase in compensation and benefits resulting from increases in financial advisor compensation, variable incentive compensation and salary and fringe benefit expense (described below). The remaining operating expenses increased 3% ($37.0 million) primarily due to a 9% increase in payroll and other taxes caused by the increases in compensation and a 22% increase in other operating expenses.
Financial advisor compensation (excluding financial advisor salary and subsidy and variable incentive compensation) increased 9% ($141.6 million) in 2012 primarily due to increases in trade and asset-based fee revenuerevenues on which financial advisor commissions are paid. Financialpaid, as well as growth in the number of financial advisors and increased participation in the Partnership's compensation initiatives. The Partnership expects financial advisor salarycompensation to continue to increase as more financial advisors participate in these compensation initiatives, which are intended to attract new, and subsidyretain quality financial advisors. One initiative expected to result in future expense increases is the offering of retirement transition plans to retiring financial advisors in certain circumstances. Such retirement transition plans offer financial consideration to retiring financial advisors who provide client transition services.
Home office and branch compensation and benefits expense increased 21% ($22.6 million)6% in 2015 primarily due to new financial advisor compensation initiatives implemented in July 2012, in addition to more financial advisors participating in the programs. PART II
Item 7.
| Management’s Discussionhigher wages and Analysis of Financial Condition and Results of Operations, continued
|
Salary and fringe benefit expense increased 8% ($64.5 million) in 2012 primarily due to salary increases, increases in fringe benefits expense caused by increased healthcare costs, and increases inas well as more personnel to support increased productivityclient activity and the growth of the Partnership’s financial advisor network. On a full-time equivalent basis, theThe average number of both the Partnership’s home office associates and branch employeesoffice administrators (“BOAs”) increased 2%4%.
Variable incentive compensation expands and contracts in relation to revenues, income before allocations to partners and the Partnership’s related profit margin. Asprofitability and margin earned. A significant portion of the Partnership’s financial results and profit margin improve, a significant portionPartnership's profits is allocated to variable incentive compensation and paid to employeesassociates in the form of increasedbonuses and profit sharing and bonuses. As a result, variable incentivesharing. Variable compensation increased 31% ($118.8 million)2% in 20122015 to $497.0 million.$820. In the second half of 2015 variable compensation decreased 8% compared to the second half of 2014 as financial results softened due to market declines and fewer client dollars invested. The Partnership uses the ratios of both the number of home office associates and the number of branch employeesBOAs per 100 financial advisors and the average operating expenses per financial advisor as key metrics in managing its costs. In 2012,2015, the average number of the home office employeesassociates and BOAs per 100 financial advisors increased 3%decreased 1% and 2%, resulting from the impact of the 2% increase in the average number of home office employees, as well as the 1% decrease in the average number of financial advisors. This result is despiterespectively. These ratios reflect the Partnership’s longer term cost management strategy to grow its financial advisor network at a faster pace than its home office and branch support staff. Lack of growth in the number of financial advisors in 2013 could result in growing home office compensation costs at a faster rate than financial advisors, which would cause the average operating expense per financial advisor to increase. Although the average number of financial advisors in 2012 decreased 1% as compared to 2011, the number of financial advisors at December 31, 2012 increased 2% as compared to December 31, 2011. The average number of branch employees per 100 financial advisors increased 3% due to the impact of the 2% increase in the average number of branch employees, as well as the 1% decrease in the average number of financial advisors. This is the result of increased branch employee hours in support of increased financial advisor productivity. The average operating expense per financial advisor increased 7%1% primarily due to increases in home office employees’ salary and fringe benefit expenses and branch operating expenses to supportcompensation and benefit expense, partially offset by the Partnership’simpact of spreading those costs over more financial advisor network, in addition to a decrease in the average number of financial advisors. 2014 vs. 2013 Operating expenses increased 8%11% in 20112014 to $4.0 billion$5,508 primarily due to an 11%a $476 increase in compensation and benefits, resulting from increasesa $12 increase in financial advisor compensation, salary and fringe benefitadvertising expense and variable incentive compensation described below. The remaining operating expenses increased 2% ($17.7 million) due to a 7%an $18 increase in payroll and other taxes caused by increases in compensation and a 4% increase in occupancy and equipment costs primarily due to increased rent expense.operating expenses. Financial advisor compensation (excluding financial advisor salary and subsidy and variable incentive compensation) increased 12% ($176.0 million)11% in 20112014 primarily due to increases in trade and asset-based fee revenueand trade revenues on which financial advisor commissions are paid. Financial advisor salary and subsidy decreased 20% ($27.5 million) primarily due to fewer financial advisor hires participatingpaid, as well as growth in these compensation programs. The Partnership found that potential new financial advisors who would have to leave successful positions in a different industry or at a different firm to embrace a new opportunity at Edward Jones were reluctant to change jobs. To help address this issue, effective January 2011, the Partnership raised the base pay to better recruit certain financial advisors. However, financial advisor growth was a challenge for the Partnership in 2011, as the number of financial advisors decreasedand increased participation in 2011 compared to 2010.the Partnership's compensation initiatives. PART II
Item 7.
| Management’s Discussion and Analysis of Financial Condition and Results of Operations, continued
|
SalaryHome office and fringe benefitbranch compensation and benefits expense increased 5% ($43.9 million)7% in 20112014 primarily due to salary increases, increases in fringe benefits expense caused by increased healthcare costshigher wages and increases inmore personnel to support increased productivity of the Partnership’s financial advisor network. On a full-time equivalent basis,The average number of both the Partnership’s home office associates and BOAs increased 3%. Variable compensation increased 25% in 2014 to $801, reflecting the Partnership's strong financial results.
In 2014, the average number of both the Partnership’s home office associates and branch employees increased 1% and 4%, respectively. Variable incentive compensation expands and contracts in relation to revenues, income before allocations to partners and the Partnership’s related profit margin. As the Partnership’s financial results and profit margin improve, a significant portion is allocated to variable incentive compensation and paid to employees in the form of increased profit sharing and bonuses. As a result, variable incentive compensation increased 38% ($103.7 million) in 2011.
In 2011, the average number of home office employeesBOAs per 100 financial advisors increased 4%, due to the decrease in the average number of financial advisors, as well as the 1% increase in the average number of home office employees. This result is despitedecreased 3%. These ratios reflect the Partnership’s longer term cost management strategy to grow its financial advisor network at a faster pace than its home office and branch support staff. The average number of branch employees per 100 financial advisors increased 6% primarily due to the impact of the decrease in the average number of financial advisors, as well as the 4% increase in the number of branch employees. This is the result of increased branch employee hours in support of increased financial advisor productivity. The average operating expense per financial advisor increased 4%was flat primarily due to increases in home office employees’ salaryassociates’ compensation and fringe benefitbenefits expenses and branch operating expenses to support the Partnership’s financial advisor network, in addition to a decrease inoffset by the average numberimpact of spreading those costs over more financial advisors.
38
PART II Item 7. | Management’s Discussion and Analysis of Financial Condition and Results of Operations, continued |
Segment Information An operating segment is defined as a component of an entity that has all of the following characteristics: it engages in business activities from which it may earn revenues and incur expenses; the entity’s chief operating decision-maker (or decision-making group) regularly reviews its operating results for resource allocation and to assess performance; and it has discrete financial information is available. Operating segments may be combined in certain circumstances into reportable segments for financial reporting. The Partnership has determined it has two operating and reportable segments based upon geographic location, the U.S. and Canada. Each segment, in its own geographic location, primarily derives its revenuesrevenue from the retail brokerage business through the sale of listed and unlisted securities and insurance products, investment banking, principal transactions, as a distributordistribution of mutual fund shares, and through revenuesfees related to assets held by and account services provided to its clients.clients, including investment advisory services, the purchase or sale of listed and unlisted securities and insurance products, and principal transactions. The Partnership evaluates thesegment performance of its segments based upon income (loss) before allocationallocations to partners, as well as income before variable incentive compensation.compensation (“pre-variable income”). Variable incentive compensation is determined at the Partnership level for profit sharing and home office associate and branch employeeBOA bonus amounts, and therefore is allocated to each geographic segment independent of that segment’s individual income before variable incentive compensation. The amount of financialpre-variable income. Financial advisor bonuses isare determined in part by the Partnership's overall Partnership’s profitability, as well as the performance of the individual financial advisors at the segment. As such, bothadvisors. Both income (loss) before allocationallocations to partners and pre-variable income before variable incentive compensation are considered in evaluating segment performance. The CanadianCanada segment information, as reported in the following table, is based upon the Consolidated Financial Statements of the Partnership’s CanadianCanada operations without eliminating any intercompany items, such as management fees that it payspaid to affiliated entities. The U.S. segment information is derived from the Partnership’s Consolidated Financial Statements less the Canada segment information as presented. This is consistent with how management reviewsviews the segments in order to assess performance.
39
PART II Item 7. | Management’s Discussion and Analysis of Financial Condition and Results of Operations, continued |
FinancialThe following table shows financial information aboutfor the Partnership’s reportable segments is presented in the following table. All amounts are presented in millions, except the number of financial advisors and as otherwise noted.segments.
| | | | Years Ended December 31, | | % Change | | | Years Ended December 31, | | | % Change | | | | | 2012 | | 2011 | | 2010 | | 2012 vs. 2011 | | 2011 vs. 2010 | | | 2015 | | | 2014 | | | 2013 | | | 2015 vs. 2014 | | | 2014 vs. 2013 | | Net revenue: | | | | | | | | | | | | | | | | | | | | | | | | | | | | | | | United States of America | | $ | 4,789.9 | | | $ | 4,324.5 | | | $ | 3,939.8 | | | | 11 | % | | | 10 | % | | U.S. | | | $ | 6,432 | | | $ | 6,074 | | | $ | 5,457 | | | | 6 | % | | | 11 | % | Canada | | | 175.3 | | | | 185.4 | | | | 167.0 | | | | -5 | % | | | 11 | % | | | 187 | | | | 204 | | | | 200 | | | | -8 | % | | | 2 | % | Total net revenue | | | | 6,619 | | | | 6,278 | | | | 5,657 | | | | 5 | % | | | 11 | % | | | | | | | | | | | | | | | | | | | | | | | | | | | | | | | | | | | | | Total net revenue | | | 4,965.2 | | | | 4,509.9 | | | | 4,106.8 | | | | 10 | % | | | 10 | % | | Operating expenses (excluding variable compensation): | | | | | | | | | | | | | | | | | | | | | | | | | | | | | | | United States of America | | | 3,734.4 | | | | 3,468.6 | | | | 3,261.7 | | | | 8 | % | | | 6 | % | | U.S. | | | | 4,782 | | | | 4,515 | | | | 4,147 | | | | 6 | % | | | 9 | % | Canada | | | 178.8 | | | | 181.2 | | | | 177.7 | | | | -1 | % | | | 2 | % | | | 179 | | | | 192 | | | | 193 | | | | -7 | % | | | -1 | % | Total operating expenses | | | | 4,961 | | | | 4,707 | | | | 4,340 | | | | 5 | % | | | 8 | % | | | | | | | | | | | | | | | | | | | | | | | | | | | | | | | | | | | | | Total operating expenses | | | 3,913.2 | | | | 3,649.8 | | | | 3,439.4 | | | | 7 | % | | | 6 | % | | Pre-variable income (loss): | | | | | | | | | | | | United States of America | | | 1,055.5 | | | | 855.9 | | | | 678.1 | | | | 23 | % | | | 26 | % | | Pre-variable income: | | | | | | | | | | | | | | | | | | | | | | U.S. | | | | 1,650 | | | | 1,559 | | | | 1,310 | | | | 6 | % | | | 19 | % | Canada | | | (3.5 | ) | | | 4.2 | | | | (10.7 | ) | | | -183 | % | | | 139 | % | | | 8 | | | | 12 | | | | 7 | | | | -33 | % | | | 71 | % | Total pre-variable income | | | | 1,658 | | | | 1,571 | | | | 1,317 | | | | 6 | % | | | 19 | % | | | | | | | | | | | | | | | | | | | | | | | | | | | | | | | | | | | | | Total pre-variable income | | | 1,052.0 | | | | 860.1 | | | | 667.4 | | | | 22 | % | | | 29 | % | | Variable incentive compensation: | | | | | | | | | | | | United States of America | | | 485.2 | | | | 366.7 | | | | 266.1 | | | | 32 | % | | | 38 | % | | Variable compensation: | | | | | | | | | | | | | | | | | | | | | | U.S. | | | | 803 | | | | 781 | | | | 626 | | | | 3 | % | | | 25 | % | Canada | | | 11.8 | | | | 11.6 | | | | 8.5 | | | | 2 | % | | | 36 | % | | | 17 | | | | 20 | | | | 17 | | | | -15 | % | | | 18 | % | Total variable compensation | | | | 820 | | | | 801 | | | | 643 | | | | 2 | % | | | 25 | % | | | | | | | | | | | | | | | | | | | | | | | | | | | | | | | | | | | | | Total variable incentive compensation | | | 497.0 | | | | 378.3 | | | | 274.6 | | | | 31 | % | | | 38 | % | | Income (loss) before allocation to partners: | | | | | | | | | | | | United States of America | | | 570.3 | | | | 489.2 | | | | 412.0 | | | | 17 | % | | | 19 | % | | Income (loss) before allocations to partners: | | | | | | | | | | | | | | | | | | | | | | U.S. | | | | 847 | | | | 778 | | | | 684 | | | | 9 | % | | | 14 | % | Canada | | | (15.3 | ) | | | (7.4 | ) | | | (19.2 | ) | | | -107 | % | | | 61 | % | | | (9 | ) | | | (8 | ) | | | (10 | ) | | | -13 | % | | | 20 | % | | | | | | | | | | | | | | | | | | Total income before allocation to partners | | $ | 555.0 | | | $ | 481.8 | | | $ | 392.8 | | | | 15 | % | | | 23 | % | | Total income before allocations to partners | | | $ | 838 | | | $ | 770 | | | $ | 674 | | | | 9 | % | | | 14 | % | | | | | | | | | | | | | | | | | | | | | | | | | | | | | | | | | | | | | Client assets under care ($ billions): | | | | | | | | | | | | | | | | | | | | | | | | | | | | | | | United States of America | | | | | | | | | | | | U.S. | | | | | | | | | | | | | | | | | | | | | | At year end | | $ | 651.9 | | | $ | 576.4 | | | $ | 557.3 | | | | 13 | % | | | 3 | % | | $ | 859.2 | | | $ | 846.9 | | | $ | 768.8 | | | | 1 | % | | | 10 | % | Average | | $ | 621.1 | | | $ | 570.5 | | | $ | 521.9 | | | | 9 | % | | | 9 | % | | $ | 862.9 | | | $ | 812.4 | | | $ | 708.9 | | | | 6 | % | | | 15 | % | Canada | | | | | | | | | | | | | | | | | | | | | | | | | | | | | | | At year end | | $ | 16.8 | | | $ | 14.8 | | | $ | 15.3 | | | | 14 | % | | | -3 | % | | $ | 17.3 | | | $ | 19.3 | | | $ | 18.3 | | | | -10 | % | | | 5 | % | Average | | $ | 15.9 | | | $ | 15.6 | | | $ | 13.9 | | | | 2 | % | | | 12 | % | | $ | 18.4 | | | $ | 19.2 | | | $ | 17.5 | | | | -4 | % | | | 10 | % | Financial advisors: | | | | | | | | | | | | United States of America | | | | | | | | | | | | | | | | | | | | | | | | | | | | | | | | | | Net new assets for the year ($ billions): | | | | | | | | | | | | | | | | | | | | | | U.S. | | | $ | 47.7 | | | $ | 50.7 | | | $ | 40.0 | | | | -6 | % | | | 27 | % | Canada | | | $ | 1.5 | | | $ | 1.6 | | | $ | 1.2 | | | | -6 | % | | | 33 | % | | | | | | | | | | | | | | | | | | | | | | | Financial advisors (actual): | | | | | | | | | | | | | | | | | | | | | | U.S. | | | | | | | | | | | | | | | | | | | | | | At year end | | | 11,822 | | | | 11,622 | | | | 11,980 | | | | 2 | % | | | -3 | % | | | 13,839 | | | | 13,287 | | | | 12,483 | | | | 4 | % | | | 6 | % | Average | | | 11,652 | | | | 11,740 | | | | 12,016 | | | | -1 | % | | | -2 | % | | | 13,597 | | | | 12,856 | | | | 12,131 | | | | 6 | % | | | 6 | % | Canada | | | | | | | | | | | | | | | | | | | | | | | | | | | | | | | At year end | | | 641 | | | | 620 | | | | 636 | | | | 3 | % | | | -3 | % | | | 669 | | | | 713 | | | | 675 | | | | -6 | % | | | 6 | % | Average | | | 621 | | | | 619 | | | | 677 | | | | 0 | % | | | -9 | % | | | 697 | | | | 701 | | | | 653 | | | | -1 | % | | | 7 | % |
United States of America
Net revenue increased 11% in 2012 primarily due to increases in asset-based fee revenue, trade revenue and account and activity fees. Asset-based fee revenue increased 15% ($263.9 million) primarily due to increases in advisory program fee revenue of 24% ($201.4 million) which is the result of continued growth of the client assets under care in advisory programs.
40
PART II Item 7. | Management’s Discussion and Analysis of Financial Condition and Results of Operations, continued |
The increase to tradeU.S.
2015 vs. 2014 Net revenue ofincreased 6% ($121.0 million) isin 2015 primarily due to the impact of increased client dollars invested, partially offset by a decreaseincreases in the margin earned on client dollars invested in 2012 compared to 2011. The increase inasset-based fee revenue and account and activity fees offee revenue. Asset-based fee revenue increased 10% ($51.6 million) is301) primarily the result of increases in revenue from sub-transfer agent services primarily caused bydue to an increase in advisory programs fee revenue of 12% ($214), reflecting the continued growth in client assets. Account and activity fee revenue increased 12% ($75) primarily due to an increase in shareholder accounting services fees resulting from the increase in the average number of average client mutual fund holdings serviced. Operating expenses (excluding variable incentive compensation) increased 8%6% in 20122015 primarily due to increases in financial advisor compensation and salary and fringe benefits. The increases inHigher financial advisor compensation werewas due to increases in trade and asset-based fee revenue on which financial advisor commissions are paid. SalaryCompensation and fringebenefits expense also increased due to wage increases and more personnel to support increased client activity and growth of the Partnership's financial advisor network. 2014 vs. 2013 Net revenue increased 11% in 2014 primarily due to increases in asset-based fee revenue and account and activity fee revenue. Asset-based fee revenue increased 22% ($552) primarily due to an increase in advisory programs fee revenue of 26% ($360), reflecting the continued growth in client assets. Account and activity fee revenue increased 9% ($50) primarily due to an increase in shareholder accounting services fees resulting from the increase in the average number of client mutual fund holdings serviced. Strong market performance also contributed to overall revenue growth. Operating expenses (excluding variable compensation) increased 9% in 2014 primarily due to higher financial advisor compensation and benefits. The increase in financial advisor compensation was due to increases in asset-based fee and trade revenues on which financial advisor commissions are paid. Compensation and benefits expense increased due to salarywage increases and increasedmore personnel to support increased productivity of the Partnership’s financial advisor network as well as an increase in healthcare costs.network. Net revenue increased 10% in 2011 primarily due to increases in asset-based fee revenue, trade revenue and account and activity fees. Asset-based fee revenue increased 27% ($370.6 million) primarily due to increases in advisory program fee revenue of 56% ($305.7 million) which is the result of continued growth of the client assets under care in advisory programs. The increase to trade revenue of 1% ($30.8 million) is primarily due to an increase in the margin earned on client dollars invested, as well as the impact of increased client dollars invested. The increase in account and activity fees of 3% ($17.1 million) is primarily the result of increases in revenue from sub-transfer agent services primarily caused by an increase in the number of average client holdings serviced.Canada
Operating expenses (excluding variable incentive compensation) increased 6% in 2011 primarily due to increases in financial advisor compensation and salary and fringe benefits. These increases were partially offset by a decrease in financial advisor salary and subsidy expense. The increases in financial advisor compensation were due to increases in trade and asset-based fee revenue on which financial advisor commissions are paid. Salary and fringe benefits expense increased due to salary increases and increased personnel to support increased productivity of the Partnership’s financial advisor network. Financial advisor salary and subsidy decreased due to fewer financial advisor hires participating in these compensation programs.
Canada2015 vs. 2014
Net revenue decreased 5%8% in 20122015 primarily due to a decrease in trade revenue, partially offset by an increase in asset-based fee revenue. Trade revenue decreased 9%25% ($10.5 million)25) due to decreases in the amount of client dollars invested and the margin earned, primarily from mutual funds. Asset-based fee revenue increased 13% ($9) due to an increased investment of client dollars in advisory programs. Operating expenses (excluding variable compensation) decreased 7% in 2015 due to a decrease in client dollars invested. This decrease is consistent with the lower levels of client activity and unfavorable market conditions, reflected in the 8% decrease in the daily average of the TSX. Operating expenses (excluding variable incentive compensation) decreased 1% in 2012 primarily due to decreases in financial advisor compensation caused by aattributable to the decrease in trade revenue on which financial advisor commissions are paid.
Despite the decrease inAs a result, pre-variable income decreased 33% to $8 in 2012, the Canadian business segment continues to focus2015. The Partnership remains focused on strategies to achieveachieving profitability in Canada. This includes several strategic initiatives to increase revenue and reducecontrol expenses. Revenue initiatives include the plan to grow the number of financial advisors, client assets under care and the depth of financial solutions provided to clientsclients.
2014 vs. 2013 Net revenue increased 2% in 2014 primarily due to an increase in asset-based fee revenue, partially offset by a decrease in trade revenue. Asset-based fee revenue increased 23% ($14) due to an increase in client assets under care resulting from the investment of client dollars and higher market values of the underlying assets. Trade revenue declined 8% ($9) due to decreases in the margin earned, primarily from mutual funds, and the roll outamount of additional advisory programs. Expense reduction efforts put into place over the past few years includedclient dollars invested. Operating expenses (excluding variable compensation) decreased 1% in 2014. As a change to new financial advisor compensation, conversion of certain communication systems to lower-cost options and review and renegotiation of several vendor contracts.result, pre-variable income increased 71% ($5) in 2014. 41
PART II Item 7. | Management’s Discussion and Analysis of Financial Condition and Results of Operations, continued |
The Canadian business segment has experienced a slight increase in the average number of financial advisors in 2012 and a 3% growth year-over-year, however, if this trend does not continue, a decrease in the number of financial advisors could impact the Partnership’s ability to grow revenue in the future, and thus could impact the ability of the Partnership to reach profitability for the Canadian business segment.
Net revenue increased 11% in 2011 primarily due to increases in asset-based fee revenue of 22% ($8.9 million) and trade revenue of 6% ($6.1 million). Canada asset-based fee revenue increased in 2011 primarily due to the increase in average asset values on which these fees are earned, mostly due to the overall improved market conditions year-over-year, reflected in the 10% increase in the daily average of the TSX. Canada trade revenue increased in 2011 primarily the result of increased client dollars invested.
Operating expenses (excluding variable incentive compensation) increased 2% in 2011 primarily due to increases in financial advisor compensation caused by increases in trade and asset-based fee revenue on which financial advisor commissions are paid and increases in home office and branch salary and fringe benefits resulting from increased personnel to support increased productivity of the Partnership’s financial advisor network. These increases were partially offset by decreases in financial advisor salary and subsidy, which decreased due to fewer financial advisor hires participating in these compensation programs.
LEGISLATIVE AND REGULATORY REFORM As discussed more fully in the “Legislative and Regulatory Initiatives” risk factor in Part I, Item 1A – Risk Factors – Legislative and Regulatory Initiatives, the Partnership continues to monitor several regulatory initiativesLegislative and proposed rules,Regulatory Initiatives, including the possibility of a universal fiduciary standard of care applicable to both broker-dealers and investment advisers under the Dodd-Frank Act, limits on fees paid by mutual funds (often called 12b-1 fees),the DOL fiduciary rule proposal and enacted reforms to the regulation of money market funds. These regulatory initiatives The Legislative and proposed rulesRegulatory Initiatives may impact the manner in which the Partnership markets its products and services, manages its business and operations, and interacts with clients and regulators, any or all of which could materially impact the Partnership’s results of operations, financial condition, and liquidity. However, the Partnership cannot presently predict when or if these changesany proposed of potential Legislative and Regulatory Initiatives will be enacted or the impact that these changesany Legislative and Regulatory Initiatives will have on the Partnership. MUTUAL FUNDS AND ANNUITIESINSURANCE PRODUCTS The Partnership derived 74%75%, 70%77% and 66%75% of its total revenue from sales and services related to mutual fund and annuityinsurance products in 2012, 20112015, 2014 and 2010,2013, respectively. In addition, the Partnership derived 19%from one mutual fund company 20%, 19%20% and 21%19% of its total revenue in 2012, 20112015, 2014 and 2010, respectively, from one mutual fund vendor. All of the2013, respectively. The revenue generated from this vendorcompany relates to business conducted with the Partnership’s U.S. segment. Significant reductions in thethese revenues from this mutual fund source due to regulatory reform or other changes to the Partnership’s relationship with mutual fund vendorscompanies could have a material adverse effect on the Partnership’s results of operations. PART II
Item 7.
| Management’s Discussion and Analysis of Financial Condition and Results of Operations, continued
|
LIQUIDITY AND CAPITAL RESOURCES The Partnership requires liquidity to cover its operating expenses, net capital requirements, capital expenditures, debt repayment obligations, distributions to partners and redemptions of partnership interests. The principal sources for meeting the Partnership’s liquidity requirements include existing liquidity and capital resources of the Partnership, discussed further below, and funds generated from operations. The Partnership believes that the liquidity provided by these sources will be sufficient to meet its capital and liquidity requirements for the next twelve months. Depending on conditions in the capital markets and other factors, the Partnership will, from time to time, consider the issuance of debt and additional partnership capital, the proceeds of which could be used to meet growth needs or for other purposes. Partnership Capital The Partnership’s growth in capital has historically been throughthe result of the sale of limited partnership interestsInterests to its employeesassociates and existing limited partners, the sale of subordinated limited partnership interests to its current or retiring general partners, and retention of general partner earnings. The Partnership filed a Registration Statement on Form S-8 with the SEC on January 17, 2014, to register $350 of Interests pursuant to the Plan. On January 2, 2015, the Partnership issued $292 of Interests in connection with the Plan. In addition, on January 4, 2016, the Partnership issued additional Interests to individuals participating in retirement transition plans pursuant to the Plan. The remaining $58 of Interests may be issued in connection with the Plan at the discretion of the Partnership in the future. Proceeds from the Plan are used toward working capital and general corporate purposes and to ensure there is adequate general liquidity of the Partnership for future needs, including growing the number of financial advisors. The issuance of Interests reduces the Partnership's net interest income and profitability. The Partnership’s capital subject to mandatory redemption at December 31, 2012,2015, net of reserve for anticipated withdrawals, was $1.8 billion,$2,348, an increase of $53.9 million$375 from December 31, 2011.2014, which includes proceeds from the issuance of Interests in connection with the Plan in 2015. This increase in the Partnership’s capital subject to mandatory redemption was primarily due to the retention of general partner earnings ($97.2 million)85) and the issuance ofadditional capital contributions related to limited partner, subordinated limited partner and general partner interests ($36.1 million)296, $43 and $132, respectively), partially offset by the net increase in Partnership loans outstanding ($20) and redemption of limited partner, and subordinated limited partner and general partner interests ($11.5 million12, $9 and $7.8 million,$140, respectively) and the increase of partnership loans outstanding during the year ended December 31, 2012 ($83.4 million). During the years ended December 31, 2012, 20112015, 2014 and 2010,2013, the Partnership retained 23.0%, 23.0% and 27.6%, respectively,13.8% of income allocated to general partners. Beginning in 2013, the Partnership decreased the amount of retention to 13.8% of net income allocated to general partners, due to the increase in individual income tax rates in 2013 and current capital needs. The decrease in the percentage of retention of income allocated to general partners is not expected to have a material impact on the Partnership’s capital or liquidity. 42
PART II Item 7. | Management’s Discussion and Analysis of Financial Condition and Results of Operations, continued |
Under the terms of the Partnership Agreement, a partner’s capital is required to be redeemed by the Partnership in the event of the partner’s death or withdrawal from the Partnership, subject to compliance with ongoing regulatory capital requirements. In the event of a partner’s death, the Partnership must generally redeemredeems the partner’s capital within six months. The Partnership has withdrawal restrictions in place limitingwhich govern the amountwithdrawal of capital that can be withdrawn at the discretion of the partner.capital. Under the terms of the Partnership Agreement, limited partners withdrawingrequesting withdrawal from the Partnership are to be repaid their capital in three equal annual installments beginning the monthno earlier than 90 days after their withdrawal.withdrawal notice is received by the Managing Partner. The capital of general partners withdrawingrequesting withdrawal from the Partnership is converted to subordinated limited partnership capital or, at the discretion of the Managing Partner, redeemed by the Partnership. Subordinated limited partners requesting withdrawal are repaid their capital in six equal annual installments beginning the monthno earlier than 90 days after their request for withdrawal of contributed capital.capital is received by the Managing Partner. The Partnership’s Managing Partner has discretion to waive or modify these withdrawal restrictions and to accelerate the return of capital. PART II
Item 7.
| Management’s Discussion and Analysis of Financial Condition and Results of Operations, continued
|
GeneralThe Partnership makes loans available to those general partners (other than members of the Executive Committee members) may elect to finance a portionCommittee) who require financing for some or all of their purchasepartnership capital contributions. It is anticipated that a majority of future general and subordinated limited partnership interestscapital contributions (other than for Executive Committee members) requiring financing will be financed through loans made availablepartnership loans. In limited circumstances a general partner may withdraw from the Partnership.Partnership and become a subordinated limited partner while he or she still has an outstanding partnership loan. Loans made by the Partnership to general partners are generally for a period of one year but are expected to be renewed and bear interest at the primeinterest rate as defined in the loan documents. The Partnership will recognizerecognizes interest income for the interest paid by general partners in connection with suchreceived related to these loans. General partnersPartners borrowing from the Partnership will be required to repay such loans by applying the earnings received from the Partnership to such loans, net of amounts retained by the Partnership, and amounts distributed for income taxes. However, prior to 2013, any bank loans entered into by general partners to finance their capital contributions in the Partnership were repaid prior to any applicationtaxes and 5% of earnings towards that partner’s Partnership loan. In 2013, there are no longer any bank loans related to capital contributions of general partners (other than Executive Committee members) or subordinated limited partners duedistributed to the fact that the Partnership paid, through earnings on behalf of the general partners, the $35.4 million outstanding balances on these bank loans on January 18, 2013, prior to their original one-year maturity date of February 22, 2013. In connection with this payoff, the Partnership issued $11.2 million of Partnership loans. This activity coupled with additional 2013 issuances of Partnership loans for general partner interests as well as payments made, resulted in Partnership loans outstanding of $250 million as of February 22, 2013. All future purchases of general partnership interests (other than for Executive Committee members) will be financed through Partnership loans.partner. The Partnership will havehas full recourse against any general partner that defaults on loan obligations to the Partnership. The Partnership does not anticipate that general partner loans will have an adverse impact on the Partnership’s short-term liquidity or capital resources.
In addition, the Partnership has not and will not provide loans to members of the Executive Committee. Executive Committee members who require financing for some or all of their partnership capital contributions will continue to borrow directly from banks willing to provide such financing on an individual basis. Other partnersPartners may also choose to have individual banking arrangements for their partnership capital contributions.
Any bank financing of purchases of partnership interests (only for limited partners and Executive Committee members from 2013 and forward)capital contributions is in the form of unsecured bank loan agreements and areis between the individual and the bank. Additionally,The Partnership does not guarantee these bank loans, nor can the partner pledge his or her partnership interest as collateral for the bank loan. The Partnership has performedperforms certain administrative functions in connection with its limited partners who have elected to finance a portion of the purchase oftheir partnership interestscapital contributions through individual unsecured bank loan agreements from banks with whom the Partnership has other banking relationships. For all individual purchaseslimited partner capital contributions financed through such bank loan agreements, each agreement instructs the Partnership to apply the proceeds from the liquidationredemption of that individual’s capital account to the repayment of theirthe limited partner's bank loan prior to any funds being released to the partner. In addition, the partner is required to apply partnership earnings, net of any distributions to pay taxes, to service the interest and principal on the bank loan. Should a subordinated limited or limited partner’s individual bank loan not be renewed upon maturity for any reason, the Partnership could experience increased requests for capital liquidations, which could adversely impact the Partnership’s liquidity. In addition, limited partners who finance all or a portion of their partnership interestcapital contributions with bank financing may be more likely to request the withdrawal of capital to meet bank financing requirements should the partners experience a period of reduced earnings. As a partnership, any withdrawals by general partners, subordinated limited partners or limited partners would reduce the Partnership’s available liquidity and capital. As mentioned above, manyMany of the same banks that provide financing to limited partners also provide various forms of financing to the Partnership. To the extent these banks increase credit available to the partners, financing available to the Partnership may be reduced.
43
PART II Item 7. | Management’s Discussion and Analysis of Financial Condition and Results of Operations, continued |
The Partnership, while not a party to any partner unsecured bank loan agreements, does facilitate making payments of allocated income to certain banks on behalf of the limited partner. The following table represents amounts related to partnership loans as well as bank loans (for which the Partnership facilitates certain administrative functions). Partners may have arranged their own bank loans to finance their partnership capital for which the Partnership does not facilitate certain administrative functions and therefore any such loans are not included in the table. | | | | | | | | | | | | | | | | | | | | As of December 31, 2012 | | ($ in thousands) | | Limited
Partnership
Interests | | | Subordinated
Limited
Partnership
Interests | | | General
Partnership
Interests | | | Total
Partnership
Capital | | Partnership capital(1): | | | | | | | | | | | | | | | | | Total partnership capital | | $ | 650,735 | | | $ | 283,709 | | | $ | 1,048,067 | | | $ | 1,982,511 | | | | | | | | | | | | | | | | | | | Partnership capital owned by partners with individual loans | | $ | 198,677 | | | $ | 425 | | | $ | 537,701 | | | $ | 736,803 | | | | | | | | | | | | | | | | | | | Partnership capital owned by partners with individual loans as a percent of total partnership capital | | | 30.5 | % | | | 0.1 | % | | | 51.3 | % | | | 37.2 | % | Partner loans: | | | | | | | | | | | | | | | | | Bank loans | | $ | 51,791 | | | $ | 147 | | | $ | 35,246 | | | $ | 87,184 | | Partnership loans | | | — | | | | — | | | | 170,264 | | | | 170,264 | | | | | | | | | | | | | | | | | | | Total loans | | $ | 51,791 | | | $ | 147 | | | $ | 205,510 | | | $ | 257,448 | | | | | | | | | | | | | | | | | | | Partner loans as a percent of total partnership capital | | | 8.0 | % | | | 0.1 | % | | | 19.6 | % | | | 13.0 | % | Partner loans as a percent of partnership capital owned by partners with loans | | | 26.1 | % | | | 34.6 | % | | | 38.2 | % | | | 34.9 | % |
| | As of December 31, 2015 | | | | Limited Partnership Interests | | | Subordinated Limited Partnership Interests | | | General Partnership Interests | | | Total Partnership Capital | | Total partnership capital(1) | | $ | 916 | | | $ | 370 | | | $ | 1,280 | | | $ | 2,566 | | Partnership capital owned by partners with individual loans | | $ | 426 | | | $ | 4 | | | $ | 647 | | | $ | 1,077 | | Partnership capital owned by partners with individual loans as a percent of total partnership capital | | | 46.5 | % | | | 1.1 | % | | | 50.5 | % | | | 42.0 | % | Partner loans | | $ | 102 | | | $ | 2 | | | $ | 216 | | | $ | 320 | | Partner loans as a percent of total partnership capital | | | 11.1 | % | | | 0.5 | % | | | 16.9 | % | | | 12.5 | % | Partner loans as a percent of partnership capital owned by partners with loans | | | 23.9 | % | | | 50.0 | % | | | 33.4 | % | | | 29.7 | % |
(1) | PartnershipTotal partnership capital, as defined for this table, is before the reduction of partnership loans and is net of reserve for anticipated withdrawals.
|
Historically, neither the amount of partnership capital financed with individual loans as indicated in the table above, nor the amount of partner capital withdrawal requests, has had a significant impact on the Partnership’s liquidity or capital resources. PART II
Item 7.
| Management’s Discussion and Analysis of Financial Condition and Results of Operations, continued
|
Partnership DebtLines of Credit
The following table shows the composition of the Partnership’s aggregate bank lines of credit in place as of December 31, 20122015 and 2011 are as follows:2014: | | | | | | 2015 | | | 2014 | | ($ in thousands) | | 2012 | | | 2011 | | | 2011 Credit Facility | | $ | 395,000 | | | $ | 395,000 | | | 2013 Credit Facility | | | $ | 400 | | | $ | 400 | | Uncommitted secured credit facilities | | | 415,000 | | | | 595,000 | | | | 290 | | | | 365 | | | | | | | | | | Total bank lines of credit | | $ | 810,000 | | | $ | 990,000 | | | $ | 690 | | | $ | 765 | | | | | | | | | |
In March 2011,November 2013, the Partnership entered into a three-year $395 million$400 committed unsecured revolving line of credit (the “2011(“2013 Credit Facility”), which has a maturityan expiration date of March 18, 2014.November 15, 2018. The 20112013 Credit Facility is intended to provide short-term liquidity to the Partnership should the need arise. In addition, the Partnership has uncommitted lines of credit that are subject to change at the discretion of the banks. Based on credit market conditions and the uncommitted nature of these credit facilities, it is possible that these lines of credit could decrease or not be available in the future. During 2012, the Partnership’s uncommitted lines of credit were reduced by $180.0 million to $415.0 million. The reduction was not related to the Partnership’s creditworthiness. Actual borrowing availability on the uncommitted secured lines is based on client margin securities and partnershipfirm-owned securities, which would serve as collateral on loans in the event the Partnership borrowed against these lines. On October 30, 2015, the Partnership's uncommitted lines of credit were reduced by $75 under an agreement with one of the banks. This reduction was not due to the Partnership's financial condition and this bank still participates in the 2013 Credit Facility. There were no amounts outstanding on the 20112013 Credit Facility andor the uncommitted lines of credit as of December 31, 20122015 and 2011.2014. In addition, the Partnership did not have any draws against these lines of creditscredit during the yearyears ended December 31, 20122015, 2014 and 2011.2013. The Partnership is in compliance with allFor details on covenants related to its outstanding debt agreements aslines of December 31, 2012. For further details on covenants,credit, see discussion regarding debt covenants in the NotesNote 6 to the Consolidated Financial Statements.
44
PART II Item 7. | Management’s Discussion and Analysis of Financial Condition and Results of Operations, continued |
Cash Activity As of December 31, 2012,2015, the Partnership had $600.9 million$937 in cash and cash equivalents and $1.1 billion$843 in securities purchased under agreements to resell, which generally have maturities of less than one week. This totals $1.7 billiontotaled $1,780 of Partnership liquidity as of December 31, 2012,2015, a 13%7% ($0.2 billion)113 million) increase from $1.5 billion$1,667 at December 31, 2011. In addition,2014. This increase was primarily due to timing of client cash activity and the resulting requirement for segregation. The Partnership also had $7.7 billion$9,982 and $4.5 billion$8,848 in cash and investments segregated under federal regulations as of December 31, 20122015 and 2011,2014, respectively, which was not available for general use. Capital Expenditures The Partnership estimates 2016 capital spending of approximately $75 for construction and facilities improvements at home office locations in St. Louis and various branch offices and for technology upgrades. Regulatory Requirements As a result of its activities as a U.S. broker-dealer, Edward Jones is subject to the net capital provisions of Rule 15c3-1 of the Securities Exchange Act of 1934, as amended ("Exchange Act"), and capital compliance rules of the FINRA Rule 4110. Under the alternative method permitted by the rules, Edward Jones must maintain minimum net capital, as defined, equal to the greater of $0.25 million or 2% of aggregate debit items arising from client transactions. The net capital rules also provide that Edward Jones’ partnership capital may not be withdrawn if the resulting net capital would be less than minimum requirements. Additionally, certain withdrawals of partnership capital require the approval of the SEC and FINRA to the extent they exceed defined levels, even though such withdrawals would not cause net capital to be less than minimum requirements. The Partnership’s Canada broker-dealer is a registered securities dealer regulated by IIROC. Under the regulations prescribed by IIROC, the Partnership is required to maintain minimum levels of risk-adjusted capital, which are dependent on the nature of the Partnership’s assets and operations. The following table shows the Partnership’s net capital figures for its U.S. and Canada broker-dealers as of December 31, 2015 and 2014: | | 2015 | | | 2014 | | | % Change | | U.S.: | | | | | | | | | | | | | Net capital | | $ | 1,140 | | | $ | 999 | | | | 14 | % | Net capital in excess of the minimum required | | $ | 1,083 | | | $ | 948 | | | | 14 | % | Net capital as a percentage of aggregate debit items | | | 40.1 | % | | | 38.9 | % | | | 3 | % | Net capital after anticipated capital withdrawals, as a percentage of aggregate debit items | | | 26.0 | % | | | 31.1 | % | | | -16 | % | | | | | | | | | | | | | | Canada: | | | | | | | | | | | | | Regulatory risk adjusted capital | | $ | 24 | | | $ | 31 | | | | -23 | % | Regulatory risk adjusted capital in excess of the minimum required to be held by IIROC | | $ | 19 | | | $ | 27 | | | | -30 | % |
Net capital and the related capital percentage may fluctuate on a daily basis. In addition, EJTC was in compliance with regulatory capital requirements. OFF BALANCE SHEET ARRANGEMENTS The Partnership does not have any significant off-balance-sheet arrangements.
45
PART II Item 7. | Management’s Discussion and Analysis of Financial Condition and Results of Operations, continued |
As of December 31, 2012, Edward Jones’ net capital of $711.9 million was 34.0% of aggregate debit items and its net capital in excess of the minimum required was $670.1 million. Net capital after anticipated capital withdrawals, as a percentage of aggregate debit items was 18.5%. Net capital and the related capital percentage may fluctuate on a daily basis.
As of December 31, 2012, the Partnership’s Canadian broker-dealer’s regulatory risk adjusted capital of $38.5 million was $27.6 million in excess of the capital required to be held by IIROC. In addition, EJTC was in compliance with regulatory capital requirements.
The Partnership and its subsidiaries are subject to examination by the Internal Revenue Service (“IRS”) and by various state and foreign taxing authorities in the jurisdictions in which the Partnership and its subsidiaries conduct business. In 2012, the IRS began an examination of Edward Jones’ income tax returns for the years ended 2009 and 2010. This event is not expected to have a material impact to the Partnership.
OFF BALANCE SHEET ARRANGEMENTS
The Partnership does not have any significant off-balance-sheet arrangements.
PART II
Item 7.
| Management’s Discussion and Analysis of Financial Condition and Results of Operations, continued
|
CONTRACTUAL COMMITMENTS AND OBLIGATIONS The following table summarizes the Partnership’s long-term financingrental commitments and obligations, as of December 31, 2012.2015. Subsequent to December 31, 2012,2015, these commitments and obligations may have fluctuated based on the changing business environment. The interest on financing commitments is based upon the stated rates of the underlying instruments, which range from 7.28% to 7.33%. For further disclosure regarding long-term debt, liabilities subordinated to claims of general creditors and rental commitments, see Notes 8, 9 and 14, respectively,Note 11 to the Consolidated Financial Statements. | | | | | | | | | | | | | | | | | | | | | | | | | | | | | (Dollars in thousands) | | Payments Due by Period | | | | | 2013 | | | 2014 | | | 2015 | | | 2016 | | | 2017 | | | Thereafter | | | Total | | Long-term debt | | $ | 1,073 | | | $ | 1,153 | | | $ | 1,240 | | | $ | 1,333 | | | $ | 704 | | | $ | — | | | $ | 5,503 | | Liabilities subordinated to claims of general creditors | | | 50,000 | | | | 50,000 | | | | — | | | | — | | | | — | | | | — | | | | 100,000 | | Interest on financing commitments1 | | | 5,863 | | | | 2,117 | | | | 198 | | | | 104 | | | | 15 | | | | — | | | | 8,297 | | Rental commitments | | | 129,984 | | | | 35,871 | | | | 24,370 | | | | 17,081 | | | | 12,634 | | | | 41,498 | | | | 261,438 | | | | | | | | | | | | | | | | | | | | | | | | | | | | | | | Total financing commitments and obligations | | $ | 186,920 | | | $ | 89,141 | | | $ | 25,808 | | | $ | 18,518 | | | $ | 13,353 | | | $ | 41,498 | | | $ | 375,238 | | | | | | | | | | | | | | | | | | | | | | | | | | | | | | |
| | Payments Due by Period | | | | 2016 | | | 2017 | | | 2018 | | | 2019 | | | 2020 | | | Thereafter | | | Total | | Rental commitments | | $ | 143 | | | $ | 39 | | | $ | 26 | | | $ | 17 | | | $ | 11 | | | $ | 18 | | | $ | 254 | |
1
| Interest paid may vary depending on timing of principal payments in addition to changes in variable interest rates on underlying obligations.
|
In addition to the above table, the Partnership has a revolving unsecured line of credit outstanding as of December 31, 20122015 (see Note 76 to the Consolidated Financial Statements). Additionally, the Partnership would incur termination fees of approximately $71 million in 2013$113 at December 31, 2015 in the event the Partnership terminated existing contractual commitments with certain vendors providing ongoing services.services primarily for information technology, operations and marketing. These termination fees will decrease over the related contract periods, which generally expire within the next three years. CRITICAL ACCOUNTING POLICIES The Partnership’s financial statements are prepared in accordance with GAAP, which may require judgment and involve estimation processes to determine its assets, liabilities, revenues and expenses which affect its results of operations. The Partnership believes that of its significant accounting policies, the following critical policies requirepolicy requires estimates that involve a higher degree of judgment and complexity. Asset-Based Fees. Due to the timing of receipt of information, the Partnership must use estimates in recording the accruals related to certain asset-based fees. These accruals are based on historical trends and are adjusted to reflect market conditions for the period covered. Additional adjustments, if needed, are recorded in subsequent periods.
Legal Reserves.Reserves. The Partnership provides for potential losses that may arise out of various legal matters, including arbitrations, class actions, other litigation, regulatoryand investigations and proceedings by governmental organizations and other contingenciesSROs to the extent that such losses can be estimated, in accordance with ASC No. 450,Contingencies. See Note 1512 to the Consolidated Financial Statements and Part I, Item 3 – Legal Proceedings for further discussion of these items. The Partnership regularly monitors its exposures for potential losses. The Partnership’s total liability with respect to litigation and regulatory proceedings represents the best estimate of probable losses after considering, among other factors, the progress of each case, the Partnership’s experience and discussions with legal counsel. PART II
Item 7.
| Management’s Discussion and Analysis of Financial Condition and Results of Operations, continued
|
Included in Part II, Item 7A – Quantitative and Qualitative Disclosures about Market Risk and in the notes to the financial statements (see Note 1 to the Consolidated Financial Statements),Statements, are additional discussions of the Partnership’s accounting policies. THE EFFECTS OF INFLATION The Partnership’s net assets are primarily monetary, consisting of cash and cash equivalents, cash and investments segregated under federal regulations, firm-owned securities owned and net payable to clients.receivables, less liabilities. Monetary net assets are primarily liquid in nature and would not be significantly affected by inflation. Inflation and future expectations of inflation influence securities prices, as well as activity levels in the securities markets. As a result, profitability and capital may be impacted by inflation and inflationary expectations. Additionally, inflation’s impact on the Partnership’s operating expenses may affect profitability to the extent that additional costs are not recoverable through increased prices of services offered by the Partnership.
46
PART II Item 7. | Management’s Discussion and Analysis of Financial Condition and Results of Operations, continued |
RECENTLY ISSUED ACCOUNTING STANDARDS In December 2011,May 2014, the FinancialFASB and the International Accounting Standards Board (“IASB”) jointly issued Accounting Standards Update (“ASU”) No. 2011-11,Disclosures about Offsetting Assets2014-09, Revenue from Contracts with Customers (“ASU 2014-09”), a comprehensive new revenue recognition standard that will supersede nearly all existing revenue recognition guidance. The objective of ASU 2014-09 is for a company to recognize revenue when it transfers promised goods or services to customers in an amount that reflects the consideration to which the entity expects to be entitled in exchange for those goods or services. In August 2015, the FASB deferred the effective date by one year and Liabilities (“ASU 2011-11”),2014-09 will now be effective for the first quarter of 2018. An entity can elect to establish requirements for an entityadopt ASU 2014-09 using one of two methods, either full retrospective adoption to disclose information about offsettingeach prior reporting period, or recognize the cumulative effect of adoption at the date of initial application. The Partnership is in the process of evaluating the new standard and related arrangements to enable users of its financial statements to understanddoes not know the effect, of those arrangementsif any, ASU 2014-09 will have on its financial position. The amendments in this update arethe Consolidated Financial Statements or which adoption method will be used. In February 2015, the FASB issued ASU No. 2015-02, Consolidation (Topic 810) – Amendments to the Consolidation Analysis (“ASU 2015-02”), which will be effective for interim and annual periods beginningthe first quarter of 2016. ASU 2015-02 provides updated guidance on or after January 1, 2013. Adoption isconsolidation of variable interest entities. ASU 2015-02 will not expected to have a material impact on the Partnership’s Consolidated Financial Statements. In January 2016, the FASB issued ASU No. 2016-01, Financial Instruments – Overall (Subtopic 825-10) – Recognition and Measurement of Financial Assets and Financial Liabilities ("ASU 2016-01"), which will be effective for the first quarter of 2018. ASU 2016-01 provides a comprehensive framework for the classification and measurement of financial assets and liabilities. The Partnership is in the process of evaluating the new standard and does not expect ASU 2016-01 will have a material impact on the Consolidated Financial Statements. PART II
In February 2016, the FASB issued ASU No. 2016-02, Leases (Topic 842) ("ASU 2016-02"), which will be effective for the first quarter of 2019. ASU 2016-02 requires lessees to recognize leases with terms greater than 12 months on the balance sheet as lease assets and lease liabilities. The Partnership is in the process of evaluating the impact of ASU 2016-02. 47
PART II ITEM 7A. | QUANTITATIVE AND QUALITATIVEQUALITATIVE DISCLOSURES ABOUT MARKET RISK |
Various levels of management within the Partnership manage the Partnership’s risk exposure. Position limits in trading and inventory accounts are established and monitored on an ongoing basis. Credit risk related to various financing activities is reduced by the industry practice of obtaining and maintaining collateral. The Partnership monitors its exposure to counterparty risk through the use of credit exposure information, the monitoring of collateral values and the establishment of credit limits. For further discussion of monitoring, see the Risk Management discussion in Part III, Item 10 – Directors, Executive Officers and Corporate Governance of this Annual Report on Form 10-K.Report. All amounts are presented in millions, except as otherwise noted. The Partnership is exposed to market risk from changes in interest rates. Such changes in interest rates impact the income from interest earning assets, primarily receivables from clients on margin balances and short-term investments, which averaged $2.2$2.7 billion and $6.6$10.1 billion for the year ended December 31, 2012,2015, respectively. The changes in interest rates may also have an impact on the expense related to liabilities that finance these assets, such as amounts payable to clients and other interest and non-interest bearing liabilities. The Partnership performed an analysis of its financial instruments and assessed the related interest rate risk and materiality in accordance with the SEC rules. Under current market conditions and based on current levels of interest earning assets and the liabilities that finance these assets, the Partnership estimates that a 100 basis point (1.00%) increase in short-term interest rates could increase its annual net interest income by approximately $80 million.$90. Conversely, the Partnership estimates that a 100 basis point (1.00%) decrease in short-term interest rates could decrease the Partnership’s annual net interest income by approximately $13 million.$21. A decrease in short-term interest rates currently has a less significant impact on net interest income due to the current low interest rate environment. The Partnership has two distinct types of interest bearing assets: client receivables from margin accounts and short-term, primarily overnight, investments, which are primarily comprised of cash and cash equivalents, investments segregated under federal regulations, and securities purchased under agreements to resell. These investments have earned interest at an average rate of approximately 1721 basis points (0.17%(0.21%) in 2012,2015, and therefore the financial dollar impact of further decline in rates iswould be minimal. The Partnership has put in place an interest rate floor for the interest charged related to its client margin loans, which helps to limit the negative impact of declining interest rates.
In addition to the interest earning assets and liabilities noted above, the Partnership’s revenue earned related to its minority ownership interest in the advisorinvestment adviser to the Edward Jones money market funds is also impacted by changes in interest rates. As discussed in Part I, Item 1—1 - Business, as a 49.5% limited partner of Passport Research, Ltd., the investment adviser to certainfor two money market funds made available to Edward Jones clients, the Partnership receives a portion of the income of the investment adviser.Passport Research. Due to the current historically low interest rate environment, the investment adviser voluntarily chose (beginning in March 2009) to reduce certain fees charged to the funds to a level that will maintain a positive client yield on the funds. This reduction of fees reduced the Partnership’s cash solutions revenue by approximately $90 million$100 for each of the years ended December 31, 20122015, 2014 and 20112013, respectively, and is expected to continue at that level in future periods, based upon the current interest rate environment. Alternatively, if the interest rate environment improved such that this reduction in fees was no longer necessary to maintain a positive client yield, the Partnership’s revenue could increase annually by that same level. PART II
48
PART II ITEM 8. | FINANCIAL STATEMENTSSTATEMENTS AND SUPPLEMENTARY DATA |
Financial Statements Included in this Item | | | | | | | Page No. | | | | | Management’sManagement's Report on Internal Control over Financial Reporting
| | | 66 | 50 | | | | Report of Independent Registered Public Accounting Firm | | | 67 | 51 | | | | Consolidated Statements of Financial Condition as of December 31, 20122015 and 20112014 | | | 69 | 52 | | | | Consolidated Statements of Income for the years ended December 31, 2012, 20112015, 2014 and 20102013 | | | 70 | 53 | | | | Consolidated Statements of Changes in Partnership Capital Subject to Mandatory Redemption for the years ended December 31, 2012, 20112015, 2014 and 20102013 | | | 71 | 54 | | | | Consolidated Statements of Cash Flows for the years ended December 31, 2012, 20112015, 2014 and 20102013 | | | 72 | 55 | | | | Notes to Consolidated Financial Statements | | | 73 | 56 |
49
PART II Item 8.Financial Statements and Supplementary Data, continued Item 8.
| Financial Statements and Supplementary Data, continued
|
MANAGEMENT’SMANAGEMENT’S REPORT ON INTERNAL CONTROL
OVER FINANCIAL REPORTING Management of The Jones Financial Companies, L.L.L.P. and all wholly-owned subsidiaries (collectively, the “Partnership”), is responsible for establishing and maintaining adequate internal control over financial reporting. The Partnership’s internal control over financial reporting is a process designed under the supervision of the Partnership’s chief executive officer and chief financial officer to provide reasonable assurance regarding the reliability of financial reporting and the preparation of the Partnership’s financial statements for external purposes in accordance with U.S. generally accepted accounting principles. As of the end of the Partnership’s 20122015 fiscal year, management conducted an assessment of the effectiveness of the Partnership’s internal control over financial reporting based on the framework established in Internal Control – Integrated Framework issued by the Committee of Sponsoring Organizations of the Treadway Commission (COSO)(2013). Based on this assessment, management has determined that the Partnership’s internal control over financial reporting as of December 31, 20122015 was effective. The Partnership’s internal control over financial reporting includes policies and procedures that pertain to the maintenance of records that, in reasonable detail, accurately and fairly reflect transactions and dispositions of assets; provide reasonable assurances that transactions are recorded as necessary to permit preparation of financial statements in accordance with U.S. generally accepted accounting principles, and that receipts and expenditures are being made only in accordance with authorizations of management of the Partnership; and provide reasonable assurance regarding prevention or timely detection of unauthorized acquisition, use or disposition of the Partnership’s assets that could have a material effect on its financial statements. The Partnership’s internal control over financial reporting as of December 31, 20122015 has been audited by PricewaterhouseCoopers LLP, an independent registered public accounting firm, as stated in their accompanying report, which expresses an unqualified opinion on the effectiveness of the Partnership’s internal control over financial reporting as of December 31, 2012.2015. 50
PART II Item 8.Financial Statements and Supplementary Data, continued Item 8.
| Financial Statements and Supplementary Data, continued
|
REPORT OF INDEPENDENT REGISTEREDREGISTERED PUBLIC ACCOUNTING FIRM To The Jones Financial Companies, L.L.L.P. In our opinion, the accompanying Consolidated Statements Ofof Financial Condition and the related Consolidated Statements of Income, of Changes in Partnership Capital Subject To Mandatory Redemption and of Cash Flows present fairly, in all material respects, the consolidated financial position of The Jones Financial Companies, L.L.L.P. and its subsidiaries (the “Partnership”"Partnership") at December 31, 20122015 and 2011,2014, and the results of their operations and their cash flows for each of the three years in the period ended December 31, 20122015 in conformity with accounting principles generally accepted in the United States of America. In addition, in our opinion, the financial statement schedules listed in the index appearing under Item 15(a)(2) present fairly, in all material respects, the information set forth therein when read in conjunction with the related Consolidated Financial Statements. Also in our opinion, the Partnership maintained, in all material respects, effective internal control over financial reporting as of December 31, 2012,2015, based on criteria established in Internal Control—Control - Integrated Framework (2013) issued by the Committee of Sponsoring Organizations of the Treadway Commission (COSO)(“COSO”). The Partnership’sPartnership's management is responsible for these financial statements and financial statement schedules, for maintaining effective internal control over financial reporting and for its assessment of the effectiveness of internal control over financial reporting, included in the accompanying Management’sManagement's Report on Internal Control over Financial Reporting. Our responsibility is to express opinions on these financial statements, on the financial statement schedules, and on the Partnership’s internal control over financial reporting based on our integrated audits. We conducted our audits in accordance with the standards of the Public Company Accounting Oversight Board (United States). Those standards require that we plan and perform the audits to obtain reasonable assurance about whether the financial statements are free of material misstatement and whether effective internal control over financial reporting was maintained in all material respects. Our audits of the financial statements included examining, on a test basis, evidence supporting the amounts and disclosures in the financial statements, assessing the accounting principles used and significant estimates made by management, and evaluating the overall financial statement presentation. Our audit of internal control over financial reporting included obtaining an understanding of internal control over financial reporting, assessing the risk that a material weakness exists, and testing and evaluating the design and operating effectiveness of internal control based on the assessed risk. Our audits also included performing such other procedures as we considered necessary in the circumstances. We believe that our audits provide a reasonable basis for our opinions. A company’s internal control over financial reporting is a process designed to provide reasonable assurance regarding the reliability of financial reporting and the preparation of financial statements for external purposes in accordance with generally accepted accounting principles. A company’s internal control over financial reporting includes those policies and procedures that (i) pertain to the maintenance of records that, in reasonable detail, accurately and fairly reflect the transactions and dispositions of the assets of the company; (ii) provide reasonable assurance that transactions are recorded as necessary to permit preparation of financial statements in accordance with generally accepted accounting principles, and that receipts and expenditures of the company are being made only in accordance with authorizations of management and directors of the company; and (iii) provide reasonable assurance regarding prevention or timely detection of unauthorized acquisition, use, or disposition of the company’s assets that could have a material effect on the financial statements. PART II
Item 8.
| Financial Statements and Supplementary Data, continued
|
Because of its inherent limitations, internal control over financial reporting may not prevent or detect misstatements. Also, projections of any evaluation of effectiveness to future periods are subject to the risk that controls may become inadequate because of changes in conditions, or that the degree of compliance with the policies or procedures may deteriorate. /s/ PricewaterhouseCoopers, LLP St. Louis, Missouri April 1, 2013March 11, 2016
51
PART II Item 8.Financial Statements and Supplementary Data, continued Item 8.
| Financial Statements and Supplementary Data, continued
|
THE JONES FINANCIAL COMPANIES, L.L.L.P. CONSOLIDATED STATEMENTS OF FINANCIAL CONDITION | | | | | | December 31, | | | December 31, | | | | | December 31, | | | December 31, | | | (Dollars in thousands) | | 2012 | | | 2011 | | | (Dollars in millions) | | | 2015 | | | 2014 | | ASSETS: | | | | | | | | | | | | | Cash and cash equivalents | | $ | 600,936 | | | $ | 819,506 | | | $ | 937 | | | $ | 1,033 | | | | | | | | | | | | Cash and investments segregated under federal regulations | | | 7,714,642 | | | | 4,472,526 | | | | 9,982 | | | | 8,848 | | | | | | | | | | | | Securities purchased under agreements to resell | | | 1,092,586 | | | | 676,448 | | | | 843 | | | | 634 | | | | | | | | | | | | Receivable from: | | | | | | | | | | | | | Clients | | | 2,266,874 | | | | 2,353,308 | | | | 3,060 | | | | 2,789 | | Mutual funds, insurance companies and other | | | | 450 | | | | 437 | | Brokers, dealers and clearing organizations | | | 189,119 | | | | 103,805 | | | | 160 | | | | 122 | | Mutual funds, insurance companies and other | | | 355,507 | | | | 300,007 | | | | | | | | | | | | | Securities owned, at fair value: | | | | | | | | | | | | | Investment securities | | | | 201 | | | | 161 | | Inventory securities | | | 74,552 | | | | 74,666 | | | | 36 | | | | 69 | | Investment securities | | | 111,904 | | | | 104,502 | | | | | | | | | | | | | Equipment, property and improvements, at cost, net of accumulated depreciation and amortization | | | 537,049 | | | | 579,439 | | | | 559 | | | | 549 | | | | | | | | | | | | Other assets | | | 99,074 | | | | 99,379 | | | | 128 | | | | 128 | | | | | | | | | | | | | | | | | TOTAL ASSETS | | $ | 13,042,243 | | | $ | 9,583,586 | | | $ | 16,356 | | | $ | 14,770 | | | | | | | | | | | | | | | | | LIABILITIES: | | | | | | | | | | | | | Payable to: | | | | | | | | | | | | | Clients | | $ | 10,075,684 | | | $ | 6,727,090 | | | $ | 12,499 | | | $ | 11,320 | | Brokers, dealers and clearing organizations | | | 65,477 | | | | 80,247 | | | | 71 | | | | 88 | | Securities sold, not yet purchased, at fair value | | | 22,327 | | | | 7,586 | | | | | | | | | | | | | Accrued compensation and employee benefits | | | 665,509 | | | | 540,416 | | | | 994 | | | | 980 | | Accounts payable and accrued expenses | | | 124,850 | | | | 165,970 | | | Long-term debt | | | 5,503 | | | | 6,500 | | | | | | | | | | | | | Accounts payable, accrued expenses and other | | | | 182 | | | | 164 | | | | | | | | | | | 13,746 | | | | 12,552 | | | | | 10,959,350 | | | | 7,527,809 | | | | | | | | | | Commitments and contingencies (Notes 11 and 12) | | | | | | | | | | | | | | | | | | | | | | | | | Liabilities subordinated to claims of general creditors | | | 100,000 | | | | 150,000 | | | Commitments and contingencies (Notes 14 and 15) | | | | | | Partnership capital subject to mandatory redemption, net of reserve for anticipated withdrawals | | | 1,812,247 | | | | 1,758,365 | | | | 2,348 | | | | 1,973 | | | | | | | | | | | | Reserve for anticipated withdrawals | | | 170,646 | | | | 147,412 | | | | 262 | | | | 245 | | | | | | | | | | | | | | | | | Total partnership capital subject to mandatory redemption | | | 1,982,893 | | | | 1,905,777 | | | | 2,610 | | | | 2,218 | | | | | | | | | | | | | | | | | TOTAL LIABILITIES | | $ | 13,042,243 | | | $ | 9,583,586 | | | $ | 16,356 | | | $ | 14,770 | | | | | | | | | |
The accompanying notes are an integral part of these Consolidated Financial Statements. 52
PART II Item 8.Financial Statements and Supplementary Data, continued Item 8.
| Financial Statements and Supplementary Data, continued
|
THE JONES FINANCIAL COMPANIES, L.L.L.P. CONSOLIDATED STATEMENTS OF INCOME | | | | | | | | For the Years Ended December 31, | | (Dollars in thousands, except per | | For the Years Ended December 31, | | | unit information and units outstanding) | | 2012 | | | 2011 | | | 2010 | | | (Dollars in millions, except per unit information and units outstanding) | | | 2015 | | | 2014 | | | 2013 | | Revenue: | | | | | | | | | | | | | | | | | | | Trade revenue | | | | | | | | Commissions | | $ | 1,979,026 | | | $ | 1,698,687 | | | $ | 1,575,852 | | | Principal transactions | | | 155,895 | | | | 284,231 | | | | 320,777 | | | Investment banking | | | 111,539 | | | | 153,100 | | | | 208,615 | | | | | | | | | | | | | | Total trade revenue | | | 2,246,460 | | | | 2,136,018 | | | | 2,105,244 | | | Fee revenue | | | | | | | | | | | | | | | | | | | Asset-based | | | 2,042,392 | | | | 1,776,883 | | | | 1,397,333 | | | $ | 3,399 | | | $ | 3,089 | | | $ | 2,523 | | Account and activity | | | 573,949 | | | | 522,898 | | | | 503,264 | | | | 690 | | | | 617 | | | | 568 | | | | | | | | | | | | | Total fee revenue | | | 2,616,341 | | | | 2,299,781 | | | | 1,900,597 | | | | 4,089 | | | | 3,706 | | | | 3,091 | | Trade revenue | | | | 2,425 | | | | 2,460 | | | | 2,439 | | Interest and dividends | | | 133,469 | | | | 130,150 | | | | 126,769 | | | | 158 | | | | 135 | | | | 134 | | Other revenue | | | 31,148 | | | | 11,553 | | | | 30,489 | | | | 22 | | | | 32 | | | | 52 | | | | | | | | | | | | | Total revenue | | | 5,027,418 | | | | 4,577,502 | | | | 4,163,099 | | | | 6,694 | | | | 6,333 | | | | 5,716 | | Interest expense | | | 62,243 | | | | 67,641 | | | | 56,323 | | | | 75 | | | | 55 | | | | 59 | | | | | | | | | | | | | Net revenue | | | 4,965,175 | | | | 4,509,861 | | | | 4,106,776 | | | | 6,619 | | | | 6,278 | | | | 5,657 | | Operating expenses: | | | | | | | | | | | | | | | | | | | Compensation and benefits | | | 3,285,171 | | | | 2,940,088 | | | | 2,643,683 | �� | | | 4,641 | | | | 4,436 | | | | 3,960 | | Occupancy and equipment | | | 352,968 | | | | 356,555 | | | | 343,305 | | | | 382 | | | | 367 | | | | 356 | | Communications and data processing | | | 279,320 | | | | 289,358 | | | | 290,070 | | | | 286 | | | | 289 | | | | 292 | | Payroll and other taxes | | | 185,954 | | | | 171,125 | | | | 159,916 | | | Professional and consulting fees | | | | 87 | | | | 59 | | | | 48 | | Advertising | | | 56,255 | | | | 54,201 | | | | 55,677 | | | | 69 | | | | 70 | | | | 58 | | Postage and shipping | | | 47,587 | | | | 48,487 | | | | 49,848 | | | | 51 | | | | 51 | | | | 51 | | Clearance fees | | | 12,648 | | | | 12,564 | | | | 11,562 | | | Other operating expenses | | | 190,252 | | | | 155,700 | | | | 159,930 | | | | 265 | | | | 236 | | | | 218 | | | | | | | | | | | | | Total operating expenses | | | 4,410,155 | | | | 4,028,078 | | | | 3,713,991 | | | | 5,781 | | | | 5,508 | | | | 4,983 | | | | | | | | | | | | | | | | | | | | | | | | Income before allocations to partners | | | 555,020 | | | | 481,783 | | | | 392,785 | | | | 838 | | | | 770 | | | | 674 | | | | | | | | | | | | | | | | Allocations to partners: | | | | | | | | | | | | | | | | | | | Limited partners | | | 72,018 | | | | 69,960 | | | | 43,803 | | | | 121 | | | | 82 | | | | 78 | | Subordinated limited partners | | | 60,551 | | | | 50,292 | | | | 41,720 | | | | 93 | | | | 87 | | | | 73 | | General partners | | | 422,451 | | | | 361,531 | | | | 307,262 | | | | 624 | | | | 601 | | | | 523 | | | | | | | | | | | | | Net income | | $ | — | | | $ | — | | | $ | — | | | $ | — | | | $ | — | | | $ | — | | | | | | | | | | | | | | | | | | | | | | | | Income allocated to limited partners per weighted average $1,000 equivalent limited partnership unit outstanding | | $ | 109.84 | | | $ | 104.66 | | | $ | 96.07 | | | $ | 131.42 | | | $ | 129.40 | | | $ | 121.12 | | | | | | | | | | | | | | | | | | | | | | | | Weighted average $1,000 equivalent limited partnership units outstanding | | | 655,663 | | | | 668,450 | | | | 455,949 | | | | 921,747 | | | | 636,481 | | | | 644,856 | | | | | | | | | | | | |
The accompanying notes are an integral part of these Consolidated Financial Statements. 53
PART II Item 8.Financial Statements and Supplementary Data, continued Item 8.
| Financial Statements and Supplementary Data, continued
|
THE JONES FINANCIAL COMPANIES, L.L.L.P. CONSOLIDATED STATEMENTS OF CHANGES IN PARTNERSHIP CAPITAL SUBJECT TO MANDATORY REDEMPTION FOR THE YEARS ENDED DECEMBER 31, 2012, 20112015, 2014 and 20102013 | (Dollars in thousands) | | Limited
Partnership
Capital | | Subordinated
Limited
Partnership
Capital | | General
Partnership
Capital | | Total | | | TOTAL PARTNERSHIP CAPITAL SUBJECT TO MANDATORY REDEMPTION, DECEMBER 31, 2009 | | $ | 475,737 | | | $ | 198,913 | | | $ | 792,162 | | | $ | 1,466,812 | | | | | | | | | | | | | | | | | (Dollars in millions) | | | Limited Partnership Capital | | | Subordinated Limited Partnership Capital | | | General Partnership Capital | | | Total | | TOTAL PARTNERSHIP CAPITAL SUBJECT TO MANDATORY REDEMPTION, DECEMBER 31, 2012 | | | $ | 696 | | | $ | 302 | | | $ | 985 | | | $ | 1,983 | | Reserve for anticipated withdrawals | | | (12,736 | ) | | | (2,972 | ) | | | (14,576 | ) | | | (30,284 | ) | | | (45 | ) | | | (19 | ) | | | (107 | ) | | | (171 | ) | | | | | | | | | | | | | | | Partnership capital subject to mandatory redemption, net of reserve for anticipated withdrawals, December 31, 2009 | | $ | 463,001 | | | $ | 195,941 | | | $ | 777,586 | | | $ | 1,436,528 | | | Partnership capital subject to mandatory redemption, net of reserve for anticipated withdrawals, December 31, 2012 | | | $ | 651 | | | $ | 283 | | | $ | 878 | | | $ | 1,812 | | Partnership loans outstanding, December 31, 2012 | | | | — | | | | — | | | | 170 | | | | 170 | | Total partnership capital, including capital financed with partnership loans, net of reserve for anticipated withdrawals, December 31, 2012 | | | | 651 | | | | 283 | | | | 1,048 | | | | 1,982 | | Issuance of partnership interests | | | — | | | | 35,984 | | | | — | | | | 35,984 | | | | — | | | | 32 | | | | 103 | | | | 135 | | Redemption of partnership interests | | | (11,652 | ) | | | (9,957 | ) | | | (38,982 | ) | | | (60,591 | ) | | | (10 | ) | | | (10 | ) | | | (95 | ) | | | (115 | ) | Income allocated to partners | | | 43,803 | | | | 41,720 | | | | 307,262 | | | | 392,785 | | | | 78 | | | | 73 | | | | 523 | | | | 674 | | Withdrawals and distributions | | | (15,598 | ) | | | (26,273 | ) | | | (157,862 | ) | | | (199,733 | ) | | | | | | | | | | | | | | | | TOTAL PARTNERSHIP CAPITAL SUBJECT TO MANDATORY REDEMPTION, DECEMBER 31, 2010 | | $ | 479,554 | | | $ | 237,415 | | | $ | 888,004 | | | $ | 1,604,973 | | | | | | | | | | | | | | | | | Distributions | | | | (31 | ) | | | (49 | ) | | | (300 | ) | | | (380 | ) | Total partnership capital, including capital financed with partnership loans | | | | 688 | | | | 329 | | | | 1,279 | | | | 2,296 | | Partnership loans outstanding, December 31, 2013 | | | | — | | | | — | | | | (215 | ) | | | (215 | ) | TOTAL PARTNERSHIP CAPITAL SUBJECT TO MANDATORY REDEMPTION, DECEMBER 31, 2013 | | | $ | 688 | | | $ | 329 | | | $ | 1,064 | | | $ | 2,081 | | Reserve for anticipated withdrawals | | | (28,205 | ) | | | (15,447 | ) | | | (64,596 | ) | | | (108,248 | ) | | | (48 | ) | | | (24 | ) | | | (151 | ) | | | (223 | ) | | | | | | | | | | | | | | | Partnership capital subject to mandatory redemption, net of reserve for anticipated withdrawals, December 31, 2010 | | $ | 451,349 | | | $ | 221,968 | | | $ | 823,408 | | | $ | 1,496,725 | | | Partnership capital subject to mandatory redemption, net of reserve for anticipated withdrawals, December 31, 2013 | | | $ | 640 | | | $ | 305 | | | $ | 913 | | | $ | 1,858 | | Partnership loans outstanding, December 31, 2013 | | | | — | | | | — | | | | 215 | | | | 215 | | Total partnership capital, including capital financed with partnership loans, net of reserve for anticipated withdrawals, December 31, 2013 | | | | 640 | | | | 305 | | | | 1,128 | | | | 2,073 | | Issuance of partnership interests | | | 223,560 | | | | 35,182 | | | | 103,790 | | | | 362,532 | | | | — | | | | 47 | | | | 94 | | | | 141 | | Redemption of partnership interests | | | (12,683 | ) | | | (1,736 | ) | | | (82,772 | ) | | | (97,191 | ) | | | (8 | ) | | | (16 | ) | | | (101 | ) | | | (125 | ) | Income allocated to partners | | | 69,960 | | | | 50,292 | | | | 361,531 | | | | 481,783 | | | | 82 | | | | 87 | | | | 601 | | | | 770 | | Withdrawals and distributions | | | (26,482 | ) | | | (34,623 | ) | | | (190,114 | ) | | | (251,219 | ) | | | | | | | | | | | | | | | | Distributions | | | | (30 | ) | | | (60 | ) | | | (353 | ) | | | (443 | ) | Total partnership capital, including capital financed with partnership loans | | | 705,704 | | | | 271,083 | | | | 1,015,843 | | | | 1,992,630 | | | | 684 | | | | 363 | | | | 1,369 | | | | 2,416 | | Partnership loans outstanding | | | — | | | | — | | | | (86,853 | ) | | | (86,853 | ) | | | | | | | | | | | | | | | | TOTAL PARTNERSHIP CAPITAL SUBJECT TO MANDATORY REDEMPTION, DECEMBER 31, 2011 | | $ | 705,704 | | | $ | 271,083 | | | $ | 928,990 | | | $ | 1,905,777 | | | | | | | | | | | | | | | | | Partnership loans outstanding, December 31, 2014 | | | | — | | | | (1 | ) | | | (197 | ) | | | (198 | ) | TOTAL PARTNERSHIP CAPITAL SUBJECT TO MANDATORY REDEMPTION, DECEMBER 31, 2014 | | | $ | 684 | | | $ | 362 | | | $ | 1,172 | | | $ | 2,218 | | Reserve for anticipated withdrawals | | | (43,478 | ) | | | (15,669 | ) | | | (88,265 | ) | | | (147,412 | ) | | | (52 | ) | | | (27 | ) | | | (166 | ) | | | (245 | ) | | | | | | | | | | | | | | | Partnership capital subject to mandatory redemption, net of reserve for anticipated withdrawals, December 31, 2011 | | $ | 662,226 | | | $ | 255,414 | | | $ | 840,725 | | | $ | 1,758,365 | | | Partnership loans outstanding, December 31, 2011 | | | — | | | | — | | | | 86,853 | | | | 86,853 | | | | | | | | | | | | | | | | | Total partnership capital, including capital financed with partnership loans, net of reserve for anticipated withdrawals, December 31, 2011 | | | 662,226 | | | | 255,414 | | | | 927,578 | | | | 1,845,218 | | | Partnership capital subject to mandatory redemption, net of reserve for anticipated withdrawals, December 31, 2014 | | | $ | 632 | | | $ | 335 | | | $ | 1,006 | | | $ | 1,973 | | Partnership loans outstanding, December 31, 2014 | | | | — | | | | 1 | | | | 197 | | | | 198 | | Total partnership capital, including capital financed with partnership loans, net of reserve for anticipated withdrawals, December 31, 2014 | | | | 632 | | | | 336 | | | | 1,203 | | | | 2,171 | | Issuance of partnership interests | | | — | | | | 36,134 | | | | 103,157 | | | | 139,291 | | | | 296 | | | | 43 | | | | 132 | | | | 471 | | Redemption of partnership interests | | | (11,491 | ) | | | (7,839 | ) | | | (79,840 | ) | | | (99,170 | ) | | | (12 | ) | | | (9 | ) | | | (140 | ) | | | (161 | ) | Income allocated to partners | | | 72,018 | | | | 60,551 | | | | 422,451 | | | | 555,020 | | | | 121 | | | | 93 | | | | 624 | | | | 838 | | Withdrawals and distributions | | | (27,195 | ) | | | (41,352 | ) | | | (218,655 | ) | | | (287,202 | ) | | | | | | | | | | | | | | | | Distributions | | | | (47 | ) | | | (67 | ) | | | (377 | ) | | | (491 | ) | Total partnership capital, including capital financed with partnership loans | | | 695,558 | | | | 302,908 | | | | 1,154,691 | | | | 2,153,157 | | | | 990 | | | | 396 | | | | 1,442 | | | | 2,828 | | Partnership loans outstanding, December 31, 2012 | | | — | | | | — | | | | (170,264 | ) | | | (170,264 | ) | | | | | | | | | | | | | | | | TOTAL PARTNERSHIP CAPITAL SUBJECT TO MANDATORY REDEMPTION, DECEMBER 31, 2012 | | $ | 695,558 | | | $ | 302,908 | | | $ | 984,427 | | | $ | 1,982,893 | | | | | | | | | | | | | | | | | Partnership loans outstanding, December 31, 2015 | | | | — | | | | (2 | ) | | | (216 | ) | | | (218 | ) | TOTAL PARTNERSHIP CAPITAL SUBJECT TO MANDATORY REDEMPTION, DECEMBER 31, 2015 | | | $ | 990 | | | $ | 394 | | | $ | 1,226 | | | $ | 2,610 | | Reserve for anticipated withdrawals | | | (44,823 | ) | | | (19,199 | ) | | | (106,624 | ) | | | (170,646 | ) | | | (74 | ) | | | (26 | ) | | | (162 | ) | | | (262 | ) | | | | | | | | | | | | | | | Partnership capital subject to mandatory redemption, net of reserve for anticipated withdrawals, December 31, 2012 | | $ | 650,735 | | | $ | 283,709 | | | $ | 877,803 | | | $ | 1,812,247 | | | Partnership capital subject to mandatory redemption, net of reserve for anticipated withdrawals, December 31, 2015 | | | $ | 916 | | | $ | 368 | | | $ | 1,064 | | | $ | 2,348 | |
The accompanying notes are an integral part of these Consolidated Financial Statements. 54
PART II Item 8.Financial Statements and Supplementary Data, continued Item 8.
| Financial Statements and Supplementary Data, continued
|
THE JONES FINANCIAL COMPANIES, L.L.L.P. CONSOLIDATED STATEMENTS OF CASH FLOWS | | | | | | | | For the years ended December 31, | | | | | For the years ended December 31, | | | (Dollars in thousands) | | 2012 | | 2011 | | 2010 | | | (Dollars in millions) | | | 2015 | | | 2014 | | | 2013 | | CASH FLOWS FROM OPERATING ACTIVITIES: | | | | | | | | | | | | | | | | | | | Net income | | $ | — | | | $ | — | | | $ | — | | | $ | — | | | $ | — | | | $ | — | | Adjustments to reconcile net income to net cash provided by operating activities: | | | | | | | | | | | | | | | | | | | Income before allocations to partners | | | 555,020 | | | | 481,783 | | | | 392,785 | | | | 838 | | | | 770 | | | | 674 | | Depreciation and amortization | | | 80,148 | | | | 90,609 | | | | 98,187 | | | | 83 | | | | 82 | | | | 82 | | | | | | | | | | | | | | | | Changes in assets and liabilities: | | | | | | | | | | | | | | | | | | | Cash and investments segregated under federal regulations | | | (3,242,116 | ) | | | (858,363 | ) | | | (802,009 | ) | | | (1,134 | ) | | | (413 | ) | | | (720 | ) | Securities purchased under agreements to resell | | | (416,138 | ) | | | 278,761 | | | | (188,932 | ) | | | (209 | ) | | | 392 | | | | 67 | | Net payable to clients | | | 3,435,028 | | | | 1,085,328 | | | | 723,968 | | | | 908 | | | | 235 | | | | 487 | | Net receivable from brokers, dealers and clearing organizations | | | (100,084 | ) | | | 8,124 | | | | (26,795 | ) | | | (55 | ) | | | 35 | | | | 55 | | Receivable from mutual funds, insurance companies and other | | | (55,500 | ) | | | (8,922 | ) | | | 7,051 | | | | (13 | ) | | | (32 | ) | | | (50 | ) | Securities owned, net | | | 7,453 | | | | (3,700 | ) | | | (11,151 | ) | | Securities owned | | | | (7 | ) | | | 13 | | | | (57 | ) | Other assets | | | 305 | | | | (5,113 | ) | | | (18,079 | ) | | | — | | | | (33 | ) | | | 4 | | Accrued compensation and employee benefits | | | 125,093 | | | | 34,195 | | | | 125,674 | | | | 14 | | | | 137 | | | | 178 | | Accounts payable and accrued expenses | | | (41,975 | ) | | | (21,974 | ) | | | 14,221 | | | | | | | | | | | | | | Accounts payable, accrued expenses and other | | | | 19 | | | | 20 | | | | (11 | ) | Net cash provided by operating activities | | | 347,234 | | | | 1,080,728 | | | | 314,920 | | | | 444 | | | | 1,206 | | | | 709 | | | | | | | | | | | | | | | | | | | | | | | | CASH FLOWS FROM INVESTING ACTIVITIES: | | | | | | | | | | | | | | | | | | | Purchase of equipment, property and improvements, net | | | (36,903 | ) | | | (54,230 | ) | | | (95,653 | ) | | | (94 | ) | | | (90 | ) | | | (84 | ) | | | | | | | | | | | | Net cash used in investing activities | | | (36,903 | ) | | | (54,230 | ) | | | (95,653 | ) | | | (94 | ) | | | (90 | ) | | | (84 | ) | | | | | | | | | | | | | | | | | | | | | | | CASH FLOWS FROM FINANCING ACTIVITIES: | | | | | | | | | | | | | | | | | | | Repayment of bank loans | | | — | | | | — | | | | (58,000 | ) | | Issuance of long-term debt | | | — | | | | — | | | | 14,806 | | | Repayment of long-term debt | | | (997 | ) | | | (59,897 | ) | | | (7,709 | ) | | Repayment of liabilities subordinated to claims of general creditors | | | (50,000 | ) | | | (53,700 | ) | | | (53,700 | ) | | Repayment of subordinated liabilities | | | | — | | | | (50 | ) | | | (50 | ) | Issuance of partnership interests (net of partnership loans) | | | 45,121 | | | | 270,839 | | | | 35,984 | | | | 352 | | | | 55 | | | | 40 | | Redemption of partnership interests | | | (99,170 | ) | | | (97,191 | ) | | | (60,591 | ) | | | (161 | ) | | | (125 | ) | | | (115 | ) | Withdrawals and distributions from partnership capital | | | (434,614 | ) | | | (359,467 | ) | | | (230,017 | ) | | Repayment of general partnership loans | | | 10,759 | | | | 4,840 | | | | — | | | Distributions from partnership capital (net of partnership loans) | | | | (637 | ) | | | (563 | ) | | | (490 | ) | Issuance of partnership loans | | | | — | | | | — | | | | (11 | ) | Net cash used in financing activities | | | | (446 | ) | | | (683 | ) | | | (626 | ) | Net (decrease) increase in cash and cash equivalents | | | | (96 | ) | | | 433 | | | | (1 | ) | | | | | | | | | | | | | | | | | | | | | | | Net cash used in financing activities | | | (528,901 | ) | | | (294,576 | ) | | | (359,227 | ) | | | | | | | | | | | | | Net (decrease) increase in cash and cash equivalents | | | (218,570 | ) | | | 731,922 | | | | (139,960 | ) | | CASH AND CASH EQUIVALENTS | | | | | | | | CASH AND CASH EQUIVALENTS: | | | | | | | | | | | | | | Beginning of year | | | 819,506 | | | | 87,584 | | | | 227,544 | | | | 1,033 | | | | 600 | | | | 601 | | | | | | | | | | | | | End of year | | $ | 600,936 | | | $ | 819,506 | | | $ | 87,584 | | | $ | 937 | | | $ | 1,033 | | | $ | 600 | | | | | | | | | | | | | | | | | | | | | | | | Cash paid for interest | | $ | 62,524 | | | $ | 67,904 | | | $ | 56,403 | | | $ | 75 | | | $ | 55 | | | $ | 59 | | | | | | | | | | | | | Cash paid for taxes (Note 12) | | $ | 4,132 | | | $ | 5,087 | | | $ | 4,043 | | | Cash paid for taxes (Note 9) | | | $ | 12 | | | $ | 10 | | | $ | 7 | | | | | | | | | | | | | | | | | | | | | | | | NON-CASH ACTIVITIES: | | | | | | | | | | | | | | | | | | | Additions of equipment, property and improvements in accounts payable and accrued expenses | | $ | 516 | | | $ | 1,371 | | | $ | 2,153 | | | Issuance of general partnership interests through partnership loans in current year | | | $ | 119 | | | $ | 86 | | | $ | 95 | | | | | | | | | | | | | | | | | | | | | | | | Issuance of general partnership interests through partnership loans in current period | | $ | 94,170 | | | $ | 91,693 | | | $ | — | | | | | | | | | | | | | | Repayment of partnership loans through distributions from partnership capital in current year | | | $ | 99 | | | $ | 103 | | | $ | 61 | |
The accompanying notes are an integral part of these Consolidated Financial Statements. 55
PART II Item 8.Financial Statements and Supplementary Data, continued Item 8.
| Financial Statements and Supplementary Data, continued
|
THE JONES FINANCIAL COMPANIES, L.L.L.P. NOTES TO CONSOLIDATED FINANCIAL STATEMENTS (Dollars in thousands,millions, except per unit information and the number of financial advisors) NOTE 1 – SUMMARY OF SIGNIFICANT ACCOUNTING POLICIES The Partnership’s Business and Basis of Accounting.The accompanying Consolidated Financial Statements include the accounts of The Jones Financial Companies, L.L.L.P. and all wholly-owned subsidiaries (collectively, the “Partnership”). All material intercompany balances and transactions have been eliminated in consolidation. Non-controlling minority interests are accounted for under the equity method. The results of the Partnership’s subsidiarysubsidiaries in Canada for the twelve month periods ended November 30, 2015, 2014 and 2013 are included in the Partnership’s Consolidated Financial Statements for the twelve month periods ended November 30, 2012, 2011 and 2010 because of the timing of the Partnership’s financial reporting process. The Partnership’s principal operating subsidiary, Edward D. Jones & Co., L.P. (“Edward Jones”), is compriseda registered broker-dealer in the United States (“U.S.”), and one of twoEdward Jones’ subsidiaries is a registered broker-dealersbroker-dealer in Canada. Through these entities, the Partnership primarily servingserves individual investors in the United States of America (“U.S.”) and through a subsidiary, Canada. Edward Jones primarily derives its revenues from the retail brokerage business through the sale of listed and unlisted securities and insurance products, investment banking, principal transactions, distribution of mutual fund shares, and through fees related to assets held by and account services provided to its clients.clients, including investment advisory services, the purchase or sale of securities and insurance products, and principal transactions. The Partnership conducts business inthroughout the U.S. and Canada with its clients, various brokers, dealers, clearing organizations, depositories and banks. For financial information related to the Partnership’s two operating segments for the years ended December 31, 2012, 20112015, 2014 and 2010,2013, see Note 1613 to the Consolidated Financial Statements. Trust services are offered to Edward Jones’ U.S. clients through Edward Jones Trust Company (“EJTC”), a wholly-owned subsidiary of the Partnership. Investment banking revenue, which is included in trade revenue, is primarily derived from the Partnership's distribution of unit investment trusts and participation in municipal obligations underwriting activities. A small portion of investment banking revenue includes underwriting fee revenue related to underwriting and management fees as well as gross acquisition profit/loss and volume concession revenue, which is earned and collected from the issuer. As of December 31, 2015, the Partnership closed the negotiated municipal obligations underwriting portion of the investment banking business. The revenue and costs associated with the closure were immaterial. The Consolidated Financial Statements have been prepared on the accrual basis of accounting in conformity with accounting principles generally accepted in the U.S. (“GAAP”) which require the use of certain estimates by management in determining the Partnership’s assets, liabilities, revenues and expenses. Actual results could differ from these estimates. The Partnership has evaluated subsequent events through the date these Consolidated Financial Statements were issued and identified no matters requiring disclosure. Partnership Agreement.Under the terms of the Partnership’s EighteenthNineteenth Amended and Restated Agreement of Registered Limited Liability Limited Partnership, Agreementdated June 6, 2014, as amended (the “Partnership Agreement”), a partner’s capital is required to be redeemed by the Partnership in the event of the partner’s death or withdrawal from the Partnership, subject to compliance with ongoing regulatory capital requirements. In the event of a partner’s death, the Partnership must generally redeemredeems the partner’s capital within six months. The Partnership has withdrawal restrictions in place limitingwhich govern the amountwithdrawal of capital that can be withdrawn at the discretion of the partner.capital. Under the terms of the Partnership Agreement, limited partners withdrawingrequesting withdrawal from the Partnership are to be repaid their capital in three equal annual installments beginning the monthno earlier than 90 days after their withdrawal.withdrawal notice is received by the Managing Partner. The capital of general partners withdrawingrequesting withdrawal from the Partnership is converted to subordinated limited partnership capital or, at the discretion of the Managing Partner, redeemed by the Partnership. Subordinated limited partners requesting withdrawal are repaid their capital in six equal annual installments beginning the monthno earlier than 90 days after their request for withdrawal of contributed capital.capital is received by the Managing Partner. The Partnership’s Managing Partner has discretion to waive or modify these withdrawal restrictions and to accelerate the return of capital. All current and future partnership capital is subordinate to all current and future liabilities of the Partnership. The Partnership Agreement includes additional terms. 56
PART II Item 8.Financial Statements and Supplementary Data, continued | Financial Statements and Supplementary Data, continued
|
Transaction Risk.Revenue Recognition. Due to the timing of receipt of information, the Partnership must use estimates in recording the accruals related to certain asset-based fees. These accruals are based on historical trends and are adjusted to reflect market conditions for the period covered. The Partnership’s securities activities involve execution, settlement and financing of various securities transactions for clients. The Partnership may be exposed to risk of loss in the event clients, other brokers and dealers, banks, depositories or clearing organizations are unable to fulfill contractual obligations. For transactions in which it extends credit to clients, the Partnership seeks to control the risks associated with these activities by requiring clients to maintain margin collateral in compliance with various regulatory and internal guidelines. Cash balances held at various major U.S. financial institutions, which typically exceed Federal Deposit Insurance Corporation insurance coverage limits, subject the Partnership to a concentration of credit risk. Additionally, the Partnership’s Canadian broker-dealer may also have cash deposits in excess of the applicable insured amounts. The Partnership regularly monitors the credit ratings of these financial institutions in order to mitigate the credit risk that exists with the deposits in excess of insured amounts.
Revenue Recognition.The Partnership’s commissions, principal transactions and investment banking revenues aretrade revenue is recorded on a trade date basis. All otherClients’ securities transactions are recorded on the date they settle. Other forms of revenue are recorded on an accrual basis. The Partnership classifies its revenue into the following categories:
Commissions revenue consists of charges to clients for the purchase or sale of listed and unlisted securities, insurance products and mutual fund shares.
Principal transactions revenue is the result of the Partnership’s participation in market-making activities in over-the-counter corporate securities, municipal obligations, government obligations, unit investment trusts, mortgage-backed securities and certificates of deposit.
Investment banking revenue is derived from the Partnership’s distribution of unit investment trusts, corporate and municipal obligations, and government sponsored enterprise obligations.
Asset-based fee revenue is derived from fees determined by the underlying value of client assets.assets and includes advisory programs, service fees and revenue sharing. Most asset-based fee revenue is generated from fees for investment advisory services within the Partnership’s advisory programs, including in the U.S., Edward Jones Advisory SolutionsSolutions® (“Advisory Solutions”), which consists of numerous different research models, and Edward Jones Managed Account ProgramProgram® (“MAP”) and in Canada, Edward Jones Portfolio Program. Program® and Edward Jones Guided Portfolios®. The Partnership also earns asset-based fee revenue through service fees and other revenues received under agreements with mutual fund and insurance companies, based on the underlying value of the Partnership’s clients’ assets invested in those companies’ products, including revenue related to the Partnership’sEdward Jones' ownership interest in Passport Research, Ltd. (“Passport Research”), the investment adviser for two money market funds made available to the Edward Jones Money Market Funds.clients. In addition, the Partnership earns revenue sharing from certain mutual fund and insurance companies. In most cases, this is additional compensation paid by investment advisers, insurance companies or distributors based on a percentage of average assets held by the Partnership’s clients. Account and activity fee revenue includes fees received from mutual fund companies for sub-transfer agentshareholder accounting services performed by the Partnership and retirement account fees primarily consisting of self-directed IRAindividual retirement account custodian account fees. This revenue category also includes other activity-based fee revenue from clients, mutual fund companies and insurance companies. Trade revenue is composed primarily of commissions and principal transactions. Commissions revenue consists of charges to clients for the purchase or sale of mutual fund shares, listed and unlisted equity securities and insurance products. Revenue from principal transactions primarily results from the Partnership’s distribution of and participation in principal trading activities in municipal obligations, over-the-counter corporate obligations, certificates of deposit, unit investment trusts, and government obligations, and from investment banking. Interest and dividends revenue is earned on client margin (loan) account balances, cash and cash equivalents, cash and investments segregated under federal regulations, securities purchased under agreements to resell and partnership loans for general partnership interests, inventory securities and investment securities.loans. PART II
Item 8.
| Financial Statements and Supplementary Data, continued
|
The Partnership derived 19%, 19% and 21% of its total revenue forFor the years ended December 31, 2012, 20112015, 2014 and 2010,2013, the Partnership earned 20%, 20% and 19%, respectively, of its total revenue from one mutual fund vendor. All of thecompany. The revenue generated from this vendor relatescompany related to business conducted with the Partnership’s U.S. segment. Significant reductions in the revenues from this mutual fund sourcerevenue due to regulatory reform or other changes to the Partnership’s relationship with this mutual fund vendorcompany could have a material impact on the Partnership’s results of operations.
Foreign Exchange.Assets and liabilities denominated in a foreign currency are translated at the exchange rate at the end of the period. Revenue and expenses denominated in a foreign currency are translated using the average exchange rate for each period. Foreign exchange gains and losses are included in other revenue on the Consolidated Statements of Income.
57
PART II Item 8.Financial Statements and Supplementary Data, continued Fair Value.Substantially all of the Partnership’s financial assets and financial liabilities covered under Financial Accounting Standards Board (“FASB”) Accounting Standards Codification (“ASC”) No. 820,Fair Value Measurement and Disclosure(“ (“ASC 820”), are carried at fair value or at contracted amounts which approximate fair value. Uponvalue given the adoption of fair value guidance set forth in FASB ASC No. 825,Financial Instruments, the Partnership elected notshort time to take the fair value option on all debt and liabilities subordinated to the claims of general creditors.maturity. Fair value of a financial instrument is defined as the price that would be received to sell an asset or paid to transfer a liability in an orderly transaction between market participants at the measurement date, also known as the “exit price.” Financial assets are marked to bid prices and financial liabilities are marked to offer prices. The Partnership’s financial assets and financial liabilities recorded at fair value in the Consolidated Statements of Financial Condition are categorized based upon the level of judgment associated with the inputs used to measure their fair value. Hierarchical levels, defined by ASC 820 with the related amount of subjectivity associated with the inputs to value these assets and liabilities at fair value for each level, are as follows: Level I – Inputs are unadjusted, quoted prices in active markets for identical assets or liabilities at the measurement date. The types of assets and liabilities categorized as Level I generally are government and agency obligations, equities listed in active markets, unit investment trusts andU.S. treasuries, investments in publicly traded mutual funds with quoted market prices.prices, equities listed in active markets, and government and agency obligations. Level II – Inputs (other than quoted prices included in Level I) are either directly or indirectly observable for the asset or liability through correlation with related market data at the measurement date and for the duration of the instrument’s anticipated life. The Partnership uses the market approach valuation technique which incorporates pricesthird-party pricing services and other relevant observable information (such as market interest rates, yield curves, prepayment risk and credit risk generated by market transactions involving identical or comparable assets or liabilitiesliabilities) in valuing these types of investments. When third-party pricing services are used, the methods and assumptions used are reviewed by the Partnership. The types of assets and liabilities categorized as Level II generally are certificates of deposit, state and municipal obligations, collateralized mortgage obligations and corporate bonds and notes. Level III – Inputs are both unobservable and significant to the overall fair value measurement. These inputs reflect management’s best estimate of what market participants would use in pricing the asset or liability at the measurement date. Consideration is given to the risk inherent in the valuation technique and the inputs to the model. The Partnership did not have any assets or liabilities categorized as Level III during the periods ended December 31, 20122015 and 2011.2014. In addition, there were no transfers into or out of Levels I, II or III during these periods. PART II
Item 8.
| Financial Statements and Supplementary Data, continued
|
The Partnership estimates the fair value of long-term debt and the liabilities subordinated to claims of general creditors, based on the present value of future principal and interest payments associated with the debt, using current rates obtained from external lenders that are extended to organizations for debt of a similar nature as that of the Partnership (Level II input).
Cash and Cash Equivalents. The Partnership considers all highly liquid investments with original maturities of three months or less to be cash equivalents. Cash and Investments Segregated under Federal Regulations. Cash, of $6,607,714investments and $3,513,902 and investments of $1,106,928 and $958,624 as of December 31, 2012 and 2011, respectively, werethe related interest receivable are segregated in special reserve bank accounts for the benefit of U.S. clients underpursuant to the Customer Protection Rule 15c3-3 of the Securities and Exchange Commission (“SEC”Act of 1934, as amended (the "Exchange Act"). . Securities Purchased Under Agreements to Resell.The Partnership participates in short-term resale agreements collateralized by government and agency securities. These transactions are reported as collateralized financing.financing and are carried at cost plus accrued interest. The fair value of the underlying collateral, as determined daily, plus accrued interest, must equal or exceed 102% of the carrying amount of the transaction.transaction in U.S. agreements and must equal or exceed 100% in Canada agreements. It is the Partnership’s policy to have such underlying resale agreement collateral delivered to the Partnership or deposited in its accounts at its custodian banks. Resale agreements are carried at the amount at which the securities will be subsequently resold, as specified in the agreements. The Partnership considers these financing receivables to be of good credit quality and, in response,as a result, has not recorded a related allowance for credit loss due to the fact that these securities are fully collateralized and, as a result,loss. In addition, the Partnership considers risk related to these securitiesresale agreements to be minimal. Securities Borrowing and Lending Activities. Securities borrowed and securities loaned transactionsminimal due to the fact that these resale agreements are reported as collateralized financings. Securities borrowed transactions require the Partnership to deposit cash or other collateral with the lender. In securities loaned transactions, the Partnership receives collateral in the form of cash or other collateral. Collateral for both securities borrowed and securities loaned is based on 102% of thefully collateralized. The fair value of the underlying securities loaned. The Partnership monitors the fair valuecollateral related to these agreements was $858 and $644 as of securities borrowedDecember 31, 2015 and loaned on a daily basis, with additional collateral obtained2014, respectively, and was not repledged or refunded as necessary. Securities borrowedsold.
58
PART II Item 8.Financial Statements and securities loaned are included in receivable from and payable to brokers, dealers and clearing organizations in the Consolidated Statements of Financial Condition.Supplementary Data, continued Collateral.The Partnership reports as assets collateral it has pledged in secured borrowings and other arrangements when the secured party cannot sell or repledge the assets or the Partnership can substitute collateral or otherwise redeem it on short notice. The Partnership does not report collateral it has received in secured lending and other arrangements as an asset when the debtor has the right to redeem or substitute the collateral on short notice. Securities Owned and Sold, Not Yet Purchased.Purchased. Securities owned and sold, not yet purchased, including inventory securities and investment securities, are recorded on a trade-date basis at fair value which is determined by using quoted market prices, third-party pricing services or other relevant observable information.dealer prices. The Partnership records the related unrealized gains and losses for inventory securities and certain investment securities in principal transactionstrade revenue within trade revenue.in the Consolidated Statements of Income. The unrealized gains and losses for investment securities related to the nonqualified deferred compensation plan are recorded in other revenue in the Consolidated Statements of Income. PART II
Item 8.
| Financial Statements and Supplementary Data, continued
|
Equipment, Property and Improvements. Equipment, including furniture and fixtures, is recorded at cost and depreciated using straight-line and accelerated methods over estimated useful lives of three to twelveseven years. Buildings are depreciated using the straight-line method over their useful lives, which are estimated at thirty years. Leasehold improvements are amortized based on the term of the lease or the economic useful life of the improvement, whichever is less. When assets are retired or otherwise disposed of, the cost and related accumulated depreciation or amortization is removed from the respective category and any related gain or loss is recorded as other revenue in the Consolidated Statements of Income. The cost of maintenance and repairs is charged against income as incurred, whereas significant enhancements are capitalized. Long-lived assets are reviewed for impairment whenever events or changes in circumstances indicate that the book value of the asset may not be fully recoverable. If impairment is indicated, the asset value is written down to its fair value. Non-qualified Deferred Compensation Plan.The Partnership has a non-qualified deferred compensation plan for certain financial advisors. The Partnership has recorded a liability for the future payments due to financial advisors participating in the non-qualified deferred compensation plan. As the future amounts due to financial advisors change in accordance with plan requirements, the Partnership records the change in future amounts owed to financial advisors as an increase or decrease in accrued compensation in the Consolidated Statements of Financial Condition and employeecompensation and benefits expense.expense in the Consolidated Statements of Income. The Partnership has chosen to hedge this future liability by purchasing investment securities in an amount similar to the future liability expected to be due in accordance with the plan. As the fair value of theThese securities are included in investment securities fluctuates,in the Consolidated Statements of Financial Condition and the unrealized gains orand losses are reflectedrecorded in other revenue.revenue in the Consolidated Statements of Income. Each period, the net impact of the change in future amounts owed to financial advisors in the non-qualified deferred compensation plan and the change in investment securities are approximately the same, resulting in minimal net impact onin the Partnership’s financial results.Consolidated Financial Statements. Retirement Transition Plan. The Partnership, in certain circumstances, offers individually tailored retirement transition plans to retiring financial advisors. Each retirement transition plan compensates a retiring financial advisor for successfully providing client transition services in accordance with a retirement and transition employment agreement. Generally, the retirement and transition employment agreement is for five years. During the first two years the retiring financial advisor remains an employee and provides transition services, which include, but are not limited to, the successful transition of client accounts and assets to successor financial advisors, as well as mentoring and providing training and support to successor financial advisors. The financial advisor retires at the end of year two and is subject to a non-compete agreement for three years. Most retiring financial advisors participating in a retirement transition plan are paid ratably over four years. Compensation expense is generally recognized ratably over the two-year transition period which aligns with the service period of the agreement. As of December 31, 2015, $35 was accrued for future payments to advisors who have already started a plan.Successor financial advisors receive reduced compensation on transitioned assets. Lease Accounting.The Partnership enters into lease agreements for certain home office facilities as well as branch office locations. The associated lease expense is recognized on a straight-line basis over the minimum lease terms. Income Taxes. Income Generally, income taxes have not been provided for in the Consolidated Financial Statements sincedue to the Partnership is organized as a partnership andtax structure where each partner is liable for itshis or her own tax payments. Any subsidiaries’For the jurisdictions in which the Partnership is liable for payments, the income tax provisions are insignificantimmaterial (see Note 12)9). Reclassification. Reclassification.Certain prior year balances have been reclassified to conform to the current year presentation. 59
PART II Item 8.Financial Statements and Supplementary Data, continued Partnership Capital Subject to Mandatory Redemption.FASB ASC No. 480,Distinguishing Liabilities from Equity (“ASC 480”), established standards for classifying and measuring certain financial instruments with characteristics of both liabilities and equity. Under the provisions of ASC 480, the obligation to redeem a partner’s capital in the event of a partner’s death is one of the criteria requiring capital to be classified as a liability. Since the Partnership Agreement obligates the Partnership to redeem a partner’s capital after a partner’s death, ASC 480 requires all of the Partnership’s equity capital to be classified as a liability. IncomeIn accordance with ASC 480, income allocable to limited, subordinated limited and general partners areis classified as a reduction of income before allocations to partners, which results in a presentation of $0 net income for the years ended December 31, 2012, 20112015, 2014 and 2010.2013. The financial statement presentations required to comply with ASC 480 do not alter the Partnership’s treatment of income, income allocations or capital for any other purposes. PART II
Item 8.
| Financial Statements and Supplementary Data, continued
|
Net income, as defined in the Partnership Agreement, is equivalent to income before allocations to partners on the Consolidated Statements of Income. Such income, if any, for each calendar year is allocated to the Partnership’s three classes of capital in accordance with the formulas prescribed in the Partnership Agreement. Income allocations are based upon partner capital contributions including capital contributions financed with loans from the Partnership. First, limited partners are allocated net income (as defined in the Partnership Agreement) in accordance with the prescribed formula for their share of net income. Limited partners do not share in the net loss in any year in which there is a net loss and the Partnership is not dissolved or liquidated. Thereafter, subordinated limited partners and general partners are allocated any remaining net income or net loss based on formulas as defined in the Partnership Agreement. Recently Issued Accounting Standards.In December 2011, FASB issued Accounting Standards Update (“ASU”) No. 2011-11,Disclosures about Offsetting Assets and Liabilities (“ASU 2011-11”), to establish requirements for an entity to disclose information about offsetting and related arrangements to enable users of its financial statements to understand the effect of those arrangements on its financial position. The amendments in this update are effective for interim and annual periods beginning on or after January 1, 2013. Adoption is not expected to have a material impact on the Partnership’s Consolidated Financial Statements.
NOTE 2 – RECEIVABLE FROM AND PAYABLE TO CLIENTS
Receivable from and payable to clients include margin balances and amounts due on cash transactions. The value of securities owned by clients and held as collateral for these receivables is not reflected in the Consolidated Financial Statements. Substantially all amounts payable to clients are subject to withdrawal upon client request. The Partnership pays interest on certain credit balances in client accounts. The Partnership considers these financing receivables to be of good credit quality due to the fact that these receivables are primarily collateralized by the related client investments and, as a result, the Partnership considers risk related to these receivables to be minimal.
PART II
Item 8.
| Financial Statements and Supplementary Data, continued
|
NOTE 3 – RECEIVABLE FROM AND PAYABLE TO BROKERS, DEALERS AND CLEARING ORGANIZATIONS
The components of receivable from and payable to brokers, dealers and clearing organizations as of December 31, 2012 and 2011 are as follows:
| | | | | | | | | | | | 2012 | | | 2011 | | Receivable from money market funds | | $ | 88,084 | | | $ | 58,598 | | Receivable from clearing organizations | | | 53,242 | | | | 32,111 | | Securities failed to deliver | | | 2,582 | | | | 4,757 | | Other | | | 45,211 | | | | 8,339 | | | | | | | | | | | Total receivable from brokers, dealers and clearing organizations | | $ | 189,119 | | | $ | 103,805 | | | | | | | | | | | Payable to clearing organizations | | $ | 53,874 | | | $ | 37,654 | | Securities failed to receive | | | 10,723 | | | | 14,218 | | Payable to brokers and dealers | | | 864 | | | | 28,315 | | Securities loaned | | | 16 | | | | 60 | | | | | | | | | | | Total payable to brokers, dealers and clearing organizations | | $ | 65,477 | | | $ | 80,247 | | | | | | | | | | |
NOTE 4 – RECEIVABLE FROM MUTUAL FUNDS, INSURANCE COMPANIES, AND OTHER
Receivable from mutual funds, insurance companies and other is primarily composed of amounts due to the Partnership for asset-based fees and fees for sub-transfer agent accounting services from the mutual fund vendors and insurance companies as well as a receivable from a retirement account trustee. This receivable from the retirement account trustee represents deposits held with the trustee for the Partnership’s Canadian client’s retirement account funds as required by Canadian regulations. The prior year balance for this receivable includes approximately $148,500 that has been reclassified from receivable from brokers, dealers and clearing organizations to conform to the current year presentation.
PART II
Item 8.
| Financial Statements and Supplementary Data, continued
|
NOTE 5 – FAIR VALUE
The following table sets forth the Partnership’s financial instruments measured at fair value:
| | | | | | | | | | | | | | | | | | | | Financial Assets at Fair Value as of | | | | | December 31, 2012 | | | | | Level I | | | Level II | | | Level III | | | Total | | Investments segregated under federal regulations | | | | | | | | | | | | | | | | | U.S. treasuries | | $ | 1,006,928 | | | $ | — | | | $ | — | | | $ | 1,006,928 | | Certificates of deposit | | | — | | | | 100,000 | | | | — | | | | 100,000 | | | | | | | | | | | | | | | | | | | Total investments segregated under federal regulations | | $ | 1,006,928 | | | $ | 100,000 | | | $ | — | | | $ | 1,106,928 | | | | | | | | | | | | | | | | | | | Securities owned: | | | | | | | | | | | | | | | | | Inventory securities: | | | | | | | | | | | | | | | | | State and municipal obligations | | $ | — | | | $ | 46,705 | | | $ | — | | | $ | 46,705 | | Equities | | | 17,845 | | | | — | | | | — | | | | 17,845 | | Certificates of deposit | | | — | | | | 4,236 | | | | — | | | | 4,236 | | Corporate bonds and notes | | | — | | | | 3,183 | | | | — | | | | 3,183 | | Collateralized mortgage obligations | | | — | | | | 1,417 | | | | — | | | | 1,417 | | Government and agency obligations | | | 1,036 | | | | — | | | | — | | | | 1,036 | | Unit investment trusts | | | 130 | | | | — | | | | — | | | | 130 | | | | | | | | | | | | | | | | | | | Total inventory securities | | $ | 19,011 | | | $ | 55,541 | | | $ | — | | | $ | 74,552 | | | | | | | | | | | | | | | | | | | Investment securities: | | | | | | | | | | | | | | | | | Mutual funds | | $ | 89,743 | | | $ | — | | | $ | — | | | $ | 89,743 | | Government and agency obligations | | | 14,678 | | | | — | | | | — | | | | 14,678 | | Equities | | | 6,184 | | | | — | | | | — | | | | 6,184 | | Corporate bonds and notes | | | — | | | | 810 | | | | — | | | | 810 | | State and municipal obligations | | | — | | | | 305 | | | | — | | | | 305 | | Collateralized mortgage obligations | | | — | | | | 184 | | | | — | | | | 184 | | | | | | | | | | | | | | | | | | | Total investment securities | | $ | 110,605 | | | $ | 1,299 | | | $ | — | | | $ | 111,904 | | | | | | | | | | | | | | | | | | | | | | | | Financial Liabilities at Fair Value as of | | | | | December 31, 2012 | | | | | Level I | | | Level II | | | Level III | | | Total | | Securities sold, not yet purchased: | | | | | | | | | | | | | | | | | Mutual funds | | $ | 12,014 | | | $ | — | | | $ | — | | | $ | 12,014 | | Equities | | | 5,133 | | | | — | | | | — | | | | 5,133 | | Certificates of deposit | | | — | | | | 2,774 | | | | — | | | | 2,774 | | Corporate bonds and notes | | | — | | | | 1,492 | | | | — | | | | 1,492 | | State and municipal obligations | | | — | | | | 588 | | | | — | | | | 588 | | Government and agency obligations | | | 202 | | | | — | | | | — | | | | 202 | | Unit investment trusts | | | 112 | | | | — | | | | — | | | | 112 | | Collateralized mortgage obligations | | | — | | | | 12 | | | | — | | | | 12 | | | | | | | | | | | | | | | | | | | Total securities sold, not yet purchased | | $ | 17,461 | | | $ | 4,866 | | | $ | — | | | $ | 22,327 | | | | | | | | | | | | | | | | | | |
PART II
Item 8.
| Financial Statements and Supplementary Data, continued
|
| | | | | | | | | | | | | | | | | | | | Financial Assets at Fair Value as of | | | | | December 31, 2011 | | | | | Level I | | | Level II | | | Level III | | | Total | | Investments segregated under federal regulations | | | | | | | | | | | | | | | | | U.S. treasuries | | $ | 708,624 | | | $ | — | | | $ | — | | | $ | 708,624 | | Certificates of deposit | | | — | | | | 250,000 | | | | — | | | | 250,000 | | | | | | | | | | | | | | | | | | | Total investments segregated under federal regulations | | $ | 708,624 | | | $ | 250,000 | | | $ | — | | | $ | 958,624 | | | | | | | | | | | | | | | | | | | Securities owned: | | | | | | | | | | | | | | | | | Inventory securities: | | | | | | | | | | | | | | | | | State and municipal obligations | | $ | — | | | $ | 41,484 | | | $ | — | | | $ | 41,484 | | Equities | | | 20,285 | | | | — | | | | — | | | | 20,285 | | Corporate bonds and notes | | | — | | | | 6,647 | | | | — | | | | 6,647 | | Certificates of deposit | | | — | | | | 5,390 | | | | — | | | | 5,390 | | Government and agency obligations | | | 398 | | | | — | | | | — | | | | 398 | | Collateralized mortgage obligations | | | — | | | | 249 | | | | — | | | | 249 | | Unit investment trusts | | | 213 | | | | — | | | | — | | | | 213 | | | | | | | | | | | | | | | | | | | Total inventory securities | | $ | 20,896 | | | $ | 53,770 | | | $ | — | | | $ | 74,666 | | | | | | | | | | | | | | | | | | | Investment securities: | | | | | | | | | | | | | | | | | Mutual funds | | $ | 77,266 | | | $ | — | | | $ | — | | | $ | 77,266 | | Government and agency obligations | | | 14,507 | | | | — | | | | — | | | | 14,507 | | Equities | | | 6,932 | | | | — | | | | — | | | | 6,932 | | State and municipal obligations | | | — | | | | 4,902 | | | | — | | | | 4,902 | | Corporate bonds and notes | | | — | | | | 653 | | | | — | | | | 653 | | Collateralized mortgage obligations | | | — | | | | 242 | | | | — | | | | 242 | | | | | | | | | | | | | | | | | | | Total investment securities | | $ | 98,705 | | | $ | 5,797 | | | $ | — | | | $ | 104,502 | | | | | | | | | | | | | | | | | | | | | | | | Financial Liabilities at Fair Value as of | | | | | December 31, 2011 | | | | | Level I | | | Level II | | | Level III | | | Total | | Securities sold, not yet purchased: | | | | | | | | | | | | | | | | | Corporate bonds and notes | | $ | — | | | $ | 3,336 | | | $ | — | | | $ | 3,336 | | Equities | | | 3,210 | | | | — | | | | — | | | | 3,210 | | State and municipal obligations | | | — | | | | 303 | | | | — | | | | 303 | | Certificates of deposit | | | — | | | | 277 | | | | — | | | | 277 | | Government and agency obligations | | | 260 | | | | — | | | | — | | | | 260 | | Unit investment trusts | | | 129 | | | | — | | | | — | | | | 129 | | Collateralized mortgage obligations | | | — | | | | 71 | | | | — | | | | 71 | | | | | | | | | | | | | | | | | | | Total securities sold, not yet purchased | | $ | 3,599 | | | $ | 3,987 | | | $ | — | | | $ | 7,586 | | | | | | | | | | | | | | | | | | |
The Partnership attempts to reduce its exposure to market price fluctuations of its inventory securities through the sale of U.S. government securities and, to a limited extent, the sale of fixed income futures contracts. The amount of the securities purchased or sold will fluctuate on a daily basis due to changes in inventory securities owned, interest rates and market conditions. Futures contracts are settled daily, and any gain or loss is recognized in principal transactions revenue. The notional amount of futures contracts outstanding were $2,000 and $3,500 at December 31, 2012 and 2011, respectively. The average notional amount of futures contracts outstanding throughout the years ended December 31, 2012 and 2011 were approximately $4,700 and $5,400, respectively. The underlying assets of these contracts are not reflected in the Partnership’s Consolidated Financial Statements; however, the related mark-to-market adjustment gain of $7 and loss of $10 are included in the Consolidated Statements of Financial Condition as of December 31, 2012 and 2011. The total gains or losses related to these assets, recorded within the Consolidated Statements of Income were losses of $410, $1,129 and $844 for the years ended December 31, 2012, 2011 and 2010, respectively. These gains and losses are reflected as a component of net inventory gains, which are included in principal transactions revenue on the Partnership’s Consolidated Statements of Income.
PART II
Item 8.
| Financial Statements and Supplementary Data, continued
|
The following table shows the estimated fair values of long-term debt and liabilities subordinated to claims of general creditors as of December 31, 2012 and 2011:
| | | | | | | | | | | | 2012 | | | 2011 | | Long-term debt | | $ | 6,091 | | | $ | 6,968 | | Liabilities subordinated to claims of general creditors | | | 103,396 | | | | 157,762 | | | | | | | | | | | Total | | $ | 109,487 | | | $ | 164,730 | | | | | | | | | | |
See Notes 8 and 9 for carrying values of long-term debt and liabilities subordinated to claims of general creditors, respectively.
NOTE 6 – EQUIPMENT, PROPERTY AND IMPROVEMENTS
Equipment, property and improvements as of December 31, 2012 and 2011 are summarized as follows:
| | | | | | | | | | | | 2012 | | | 2011 | | Land | | $ | 18,745 | | | $ | 18,742 | | Buildings and improvements | | | 793,655 | | | | 787,714 | | Equipment, furniture and fixtures | | | 613,568 | | | | 665,374 | | | | | | | | | | | Total equipment, property and improvements | | | 1,425,968 | | | | 1,471,830 | | Accumulated depreciation and amortization | | | (888,919 | ) | | | (892,391 | ) | | | | | | | | | | Equipment, property and improvements, net | | $ | 537,049 | | | $ | 579,439 | | | | | | | | | | |
Depreciation and amortization expense on equipment, property and improvements is included in the Consolidated Statements of Income within the communications and data processing, and occupancy and equipment categories.
The Partnership has recorded $516 and $1,371 of accrued costs which are included in equipment, property and improvements in the Consolidated Financial Statements as of December 31, 2012 and 2011, respectively.
The Partnership has purchased Industrial Revenue Bonds issued by St. Louis County related to certain self-constructed and purchased real and personal property. This provides for potential property tax benefits over the life of the bonds (generally 10 years). The Partnership is therefore both the bondholder and the debtor / lessee for these properties. The Partnership has exercised its right to offset the amounts invested in and the obligations for these bonds and has therefore excluded any bond related balances in the Consolidated Statements of Financial Condition.
PART II
Item 8.
| Financial Statements and Supplementary Data, continued
|
NOTE 7 – LINES OF CREDIT
The following table shows the composition of the Partnership’s aggregate bank lines of credit in place as of December 31, 2012 and 2011:
| | | | | | | | | | | | 2012 | | | 2011 | | 2011 Credit Facility | | $ | 395,000 | | | $ | 395,000 | | Uncommitted secured credit facilities | | | 415,000 | | | | 595,000 | | | | | | | | | | | Total lines of credit | | $ | 810,000 | | | $ | 990,000 | | | | | | | | | | |
In March 2011, the Partnership entered into an agreement with 10 banks for a three year $395,000 committed unsecured revolving line of credit (the “2011 Credit Facility”), which has a maturity date of March 18, 2014. The 2011 Credit Facility is intended to provide short-term liquidity to the Partnership should the need arise. The 2011 Credit Facility has a tiered interest rate margin based on the Partnership’s leverage ratio (ratio of total debt to total capitalization). Borrowings made with a three day advance notice will have a rate of LIBOR plus a margin ranging from 1.50% to 2.25%. Same day borrowings, which are subject to certain borrowing notification cutoff times, will have a rate consisting of a margin ranging from 0.50% to 1.25% plus the greater of the prime rate, the federal funds effective rate plus 1.00% or the one month LIBOR rate plus 1.00%. In accordance with the 2011 Credit Facility, the Partnership is required to maintain a leverage ratio of no more than 35% and minimum partnership capital, net of reserve for anticipated withdrawals, of at least $1,200,000 plus 50% of subsequent issuances of partnership capital. As of December 31, 2012, the Partnership is in compliance with all covenants related to the 2011 Credit Facility. As of the date of this filing, the Partnership has not borrowed against the 2011 Credit Facility.
The Partnership’s uncommitted lines of credit are subject to change at the discretion of the banks and, therefore, due to credit market conditions and the uncommitted nature of these credit facilities, it is possible that these lines of credit could decrease or not be available in the future. The Partnership’s uncommitted lines of credit were reduced by $180,000 during 2012 from $595,000 to $415,000.
Actual borrowing availability on the uncommitted secured lines is based on client margin securities and partnership securities, which would serve as collateral on loans in the event the Partnership borrowed against these lines. There were no amounts outstanding on the uncommitted lines of credit as of December 31, 2012 and 2011. In addition, the Partnership did not have any draws against these lines of credits during the years ended December 31, 2012 and 2011.
PART II
Item 8.
| Financial Statements and Supplementary Data, continued
|
NOTE 8 – LONG-TERM DEBT
Long-term debt as of December 31, 2012 and 2011 is composed of the following:
| | | | | | | | | | | | 2012 | | | 2011 | | Note payable, collateralized by real estate, fixed rate of 7.28%, principal and interest due in fluctuating monthly installments, with a final installment on June 1, 2017 | | $ | 5,503 | | | $ | 6,500 | | | | | | | | | | | | | $ | 5,503 | | | $ | 6,500 | | | | | | | | | | |
Scheduled annual principal payments, as of December 31, 2012, are as follows:
| | | | | 2013 | | $ | 1,073 | | 2014 | | | 1,153 | | 2015 | | | 1,240 | | 2016 | | | 1,333 | | 2017 | | | 704 | | Thereafter | | | — | | | | | | | | | $ | 5,503 | | | | | | |
In 2002, the Partnership entered into a $13,100 fixed rate mortgage on a home office building located on its Tempe, Arizona Campus location. The note payable is collateralized by the building, which has a cost of $15,758 and a carrying value of $9,796 as of December 31, 2012.
PART II
Item 8.
| Financial Statements and Supplementary Data, continued
|
NOTE 9 – LIABILITIES SUBORDINATED TO CLAIMS OF GENERAL CREDITORS
Liabilities subordinated to claims of general creditors as of December 31, 2012 and 2011 consist of:
| | | | | | | | | | | | 2012 | | | 2011 | | Capital notes 7.33%, due in annual installments of $50,000 commencing on June 12, 2010 with a final installment on June 12, 2014 | | $ | 100,000 | | | $ | 150,000 | | | | | | | | | | | | | $ | 100,000 | | | $ | 150,000 | | | | | | | | | | |
Required annual principal payments, as of December 31, 2012, are as follows:
| | | | | 2013 | | $ | 50,000 | | 2014 | | | 50,000 | | 2015 | | | — | | 2016 | | | — | | 2017 | | | — | | Thereafter | | | — | | | | | | | | | $ | 100,000 | | | | | | |
The capital note agreements contain restrictions which, among other things, require Edward Jones to maintain certain financial ratios, restrict encumbrance of assets and creation of indebtedness and limit the withdrawal of its partnership capital. As of December 31, 2012, Edward Jones was required, under the note agreements, to maintain minimum partnership capital subject to mandatory redemption of $400,000 and regulatory net capital of $156,833. Edward Jones was in compliance with all restrictions as of December 31, 2012 and 2011.
The liabilities subordinated to claims of general creditors are subject to cash subordination agreements approved by Financial Industry Regulatory Authority (“FINRA”) and, therefore, are included in Edward Jones’ computation of net capital under the SEC’s Uniform Net Capital Rule.
In June 2012, the Partnership paid the annual scheduled installment on the 7.33% capital notes in the amount of $50,000.
PART II
Item 8.
| Financial Statements and Supplementary Data, continued
|
NOTE 10 – PARTNERSHIP CAPITAL SUBJECT TO MANDATORY REDEMPTION
The following table shows the Partnership’s capital subject to mandatory redemption as of December 31, 2012 and 2011:
| | | | | | | | | | | | 2012 | | | 2011 | | Partner capital issued: | | | | | | | | | Limited partnership capital | | $ | 650,735 | | | $ | 662,226 | | Subordinated limited partnership capital | | | 283,709 | | | | 255,414 | | General partnership capital issued | | | 1,048,067 | | | | 927,578 | | | | | | | | | | | Total partner capital issued | | | 1,982,511 | | | | 1,845,218 | | Partnership loans outstanding: | | | | | | | | | General partnership loans outstanding at beginning of period | | | (86,853 | ) | | | — | | General partnership loans issued during the period | | | (94,170 | ) | | | (91,693 | ) | Repayment of general partnership loans during the period | | | 10,759 | | | | 4,840 | | | | | | | | | | | Total partnership loans outstanding | | | (170,264 | ) | | | (86,853 | ) | Partnership capital subject to mandatory redemption, net of reserve for anticipated withdrawals | | | 1,812,247 | | | | 1,758,365 | | Reserve for anticipated withdrawals | | | 170,646 | | | | 147,412 | | | | | | | | | | | Partnership capital subject to mandatory redemption | | $ | 1,982,893 | | | $ | 1,905,777 | | | | | | | | | | |
Net income, as defined in the Partnership Agreement, is equivalent to income before allocations to partners on the Consolidated Statements of Income. Such income, if any, for each calendar year is allocated to the Partnership’s three classes of capital in accordance with the formulas prescribed in the Partnership Agreement. Income allocations are based upon partner capital contributions including capital contributions financed with loans from the Partnership, as indicated in the previous table. First, limited partners are allocated net income (as defined in the Partnership Agreement) in accordance with the prescribed formula for their share of net income. Limited partnersgenerally do not share in the net loss in any year in which there is a net loss and the Partnership is not dissolved or liquidated. Thereafter, subordinated limited partners and general partners are allocated any remaining net income or net loss based on formulas as defined in the Partnership Agreement.
The Partnership makes loans available to those general partners (other than members of the Executive Committee, which consists of the Managing Partner and the executive officers of the Partnership) that require financing for some or all of their partnership capital contributions. Loans made by the Partnership to general partners are generally for a period of one year but are expected to be renewed and bear interest at the prime rate, as defined in the loan documents. The Partnership recognizes interest income for the interest paid by general partners in connection with such loans. The outstanding amount of general partner loans financed through the Partnership is reflected as a reduction to total general partnership capital in the Partnership’s Consolidated Statements of Changes in Partnership Capital Subject to Mandatory Redemption. As of December 31, 2012 and 2011, the outstanding amount of general partner loans financed through the Partnership amounted to $170,264 and $86,853, respectively. Interest income from these loans, which is included in interest and dividends in the Partnership’s Consolidated Statements of Income, was $5,717 and $2,888 for the years ended December 31, 2012 and 2011, respectively. PART II
Item 8.
| Financial Statements and Supplementary Data, continued
|
The limited partnership capital subject to mandatory redemption is held by current and former employeesassociates and general partners of the Partnership. Limited partners participate in the Partnership’s profits and are paid a minimum 7.5% annual return on the face amount of their capital, in accordance with the Partnership Agreement. The minimum 7.5% annual return totaled $49,181, $50,137 and $34,225 for the years ended December 31, 2012, 2011 and 2010, respectively. These amounts are included as a component of interest expense in the Partnership’s Consolidated Statements of Income.
The subordinated limited partnership capital subject to mandatory redemption is held by current and former general partners of the Partnership. Subordinated limited partners receive a percentage of the Partnership’s net income of the Partnership determined in accordance with the Partnership Agreement. The subordinated limited partnership capital subject to mandatory redemption is subordinated to the limited partnership capital. The general partnership capital subject to mandatory redemption is held by current general partners of the Partnership. General partners receive a percentage of the Partnership’s net income of the Partnership determined in accordance with the Partnership Agreement. The general partnership capital subject to mandatory redemption is subordinated to the limited partnership capital and the subordinated limited partnership capital. Recently Issued Accounting Standards. In May 2014, the FASB and the International Accounting Standards Board (“IASB”) jointly issued Accounting Standards Update (“ASU”) No. 2014-09, Revenue from Contracts with Customers (“ASU 2014-09”), a comprehensive new revenue recognition standard that will supersede nearly all existing revenue recognition guidance. The objective of ASU 2014-09 is for a company to recognize revenue when it transfers promised goods or services to customers in an amount that reflects the consideration to which the entity expects to be entitled in exchange for those goods or services. In August 2015, the FASB deferred the effective date of ASU 2014-09 to the first quarter of 2018. An entity can elect to adopt ASU 2014-09 using one of two methods, either full retrospective adoption to each prior reporting period, or recognize the cumulative effect of adoption at the date of initial application. The Partnership is in the process of evaluating the new standard and does not know the effect, if any, ASU 2014-09 will have on the Consolidated Financial Statements or which adoption method will be used. In February 2015, the FASB issued ASU No. 2015-02, Consolidation (Topic 810) – Amendments to the Consolidation Analysis (“ASU 2015-02”), which will be effective for the first quarter of 2016. ASU 2015-02 provides updated guidance on consolidation of variable interest entities. ASU 2015-02 will not have a material impact on the Consolidated Financial Statements. In January 2016, the FASB issued ASU No. 2016-01, Financial Instruments – Overall (Subtopic 825-10) – Recognition and Measurement of Financial Assets and Financial Liabilities ("ASU 2016-01"), which will be effective for the first quarter of 2018. ASU 2016-01 provides a comprehensive framework for the classification and measurement of financial assets and liabilities. The Partnership is in the process of evaluating the new standard and does not expect ASU 2016-01 will have a material impact on the Consolidated Financial Statements. 60
PART II Item 8.Financial Statements and Supplementary Data, continued In February 2016, the FASB issued ASU No. 2016-02, Leases (Topic 842) ("ASU 2016-02"), which will be effective for the first quarter of 2019. ASU 2016-02 requires lessees to recognize leases with terms greater than 12 months on the balance sheet as lease assets and lease liabilities. The Partnership is in the process of evaluating the impact of ASU 2016-02. NOTE 112 – RECEIVABLE FROM AND PAYABLE TO CLIENTS Receivable from clients is primarily composed of margin loan balances. The value of securities owned by clients and held as collateral for these receivables is not reflected in the Consolidated Financial Statements. Collateral held as of December 31, 2015 and 2014 was $3,954 and $3,595, respectively, and was not repledged or sold. The Partnership considers these financing receivables to be of good credit quality due to the fact that these receivables are primarily collateralized by the related client investments and, as a result, the Partnership considers risk related to these receivables to be minimal. Payable to clients is composed of cash amounts held by the Partnership due to clients. Substantially all amounts payable to clients are subject to withdrawal upon client request. The Partnership pays interest on the vast majority of credit balances in client accounts. NOTE 3 – RECEIVABLE FROM MUTUAL FUNDS, INSURANCE COMPANIES AND OTHER The following table shows the Partnership's receivable from mutual funds, insurance companies and other as of December 31, 2015 and 2014: | | 2015 | | | 2014 | | Asset-based fees from mutual fund and insurance companies | | $ | 211 | | | $ | 200 | | Deposit for Canadian retirement accounts | | | 187 | | | | 189 | | Fees for shareholder accounting services | | | 52 | | | | 48 | | Total | | $ | 450 | | | $ | 437 | |
61
PART II Item 8.Financial Statements and Supplementary Data, continued NOTE 4 – FAIR VALUE The following tables show the Partnership's financial instruments measured at fair value: | | Financial Assets at Fair Value as of | | | | December 31, 2015 | | | | Level I | | | Level II | | | Level III | | | Total | | Cash equivalents: | | | | | | | | | | | | | | | | | Certificates of deposit | | $ | — | | | $ | 150 | | | $ | — | | | $ | 150 | | | | | | | | | | | | | | | | | | | Investments segregated under federal regulations: | | | | | | | | | | | | | | | | | U.S. treasuries | | $ | 2,706 | | | $ | — | | | $ | — | | | $ | 2,706 | | Certificates of deposit | | | — | | | | 300 | | | | — | | | | 300 | | Total investments segregated under federal regulations | | $ | 2,706 | | | $ | 300 | | | $ | — | | | $ | 3,006 | | | | | | | | | | | | | | | | | | | Securities owned: | | | | | | | | | | | | | | | | | Investment securities: | | | | | | | | | | | | | | | | | Mutual funds(1) | | $ | 192 | | | $ | — | | | $ | — | | | $ | 192 | | Equities | | | 4 | | | | — | | | | — | | | | 4 | | Government and agency obligations | | | 4 | | | | — | | | | — | | | | 4 | | Corporate bonds and notes | | | — | | | | 1 | | | | — | | | | 1 | | Total investment securities | | $ | 200 | | | $ | 1 | | | $ | — | | | $ | 201 | | | | | | | | | | | | | | | | | | | Inventory securities: | | | | | | | | | | | | | | | | | Equities | | $ | 17 | | | $ | — | | | $ | — | | | $ | 17 | | State and municipal obligations | | | — | | | | 11 | | | | — | | | | 11 | | Mutual funds | | | 7 | | | | — | | | | — | | | | 7 | | Corporate bonds and notes | | | — | | | | 1 | | | | — | | | | 1 | | Total inventory securities | | $ | 24 | | | $ | 12 | | | $ | — | | | $ | 36 | |
| | Financial Liabilities at Fair Value as of | | | | December 31, 2015 | | | | Level I | | | Level II | | | Level III | | | Total | | Securities sold, not yet purchased(2): | | | | | | | | | | | | | | | | | Mutual funds | | $ | 3 | | | $ | — | | | $ | — | | | $ | 3 | | Equities | | | 2 | | | | — | | | | — | | | | 2 | | Corporate bonds and notes | | | — | | | | 1 | | | | — | | | | 1 | | Total securities sold, not yet purchased | | $ | 5 | | | $ | 1 | | | $ | — | | | $ | 6 | |
(1) | The mutual funds balance consists primarily of securities held to hedge future liabilities related to the non-qualified deferred compensation plan. |
(2) | Securities sold, not yet purchased are included within accounts payable, accrued expenses and other in the Consolidated Statements of Financial Condition. |
62
PART II Item 8.Financial Statements and Supplementary Data, continued | | Financial Assets at Fair Value as of | | | | December 31, 2014 | | | | Level I | | | Level II | | | Level III | | | Total | | Cash equivalents: | | | | | | | | | | | | | | | | | Certificate of deposit | | $ | — | | | $ | 100 | | | $ | — | | | $ | 100 | | | | | | | | | | | | | | | | | | | Investments segregated under federal regulations: | | | | | | | | | | | | | | | | | U.S. treasuries | | $ | 1,109 | | | $ | — | | | $ | — | | | $ | 1,109 | | Certificates of deposit | | | — | | | | 225 | | | | — | | | | 225 | | Total investments segregated under federal regulations | | $ | 1,109 | | | $ | 225 | | | $ | — | | | $ | 1,334 | | | | | | | | | | | | | | | | | | | Securities owned: | | | | | | | | | | | | | | | | | Investment securities: | | | | | | | | | | | | | | | | | Mutual funds | | $ | 136 | | | $ | — | | | $ | — | | | $ | 136 | | Government and agency obligations | | | 19 | | | | — | | | | — | | | | 19 | | Equities | | | 5 | | | | — | | | | — | | | | 5 | | Corporate bonds and notes | | | — | | | | 1 | | | | — | | | | 1 | | Total investment securities | | $ | 160 | | | $ | 1 | | | $ | — | | | $ | 161 | | | | | | | | | | | | | | | | | | | Inventory securities: | | | | | | | | | | | | | | | | | State and municipal obligations | | $ | — | | | $ | 40 | | | $ | — | | | $ | 40 | | Equities | | | 17 | | | | — | | | | — | | | | 17 | | Mutual funds | | | 5 | | | | — | | | | — | | | | 5 | | Certificates of deposit | | | — | | | | 3 | | | | — | | | | 3 | | Corporate bonds and notes | | | — | | | | 2 | | | | — | | | | 2 | | Other | | | 1 | | | | 1 | | | | — | | | | 2 | | Total inventory securities | | $ | 23 | | | $ | 46 | | | $ | — | | | $ | 69 | |
| | Financial Liabilities at Fair Value as of | | | | December 31, 2014 | | | | Level I | | | Level II | | | Level III | | | Total | | Securities sold, not yet purchased: | | | | | | | | | | | | | | | | | Equities | | $ | 2 | | | $ | — | | | $ | — | | | $ | 2 | | Corporate bonds and notes | | | — | | | | 1 | | | | — | | | | 1 | | Total securities sold, not yet purchased | | $ | 2 | | | $ | 1 | | | $ | — | | | $ | 3 | |
NOTE 5 – EQUIPMENT, PROPERTY AND IMPROVEMENTS The following table shows equipment, property and improvements as of December 31, 2015 and 2014: | | 2015 | | | 2014 | | Land | | $ | 25 | | | $ | 26 | | Buildings and improvements | | | 886 | | | | 846 | | Equipment, furniture and fixtures | | | 611 | | | | 613 | | Equipment, property and improvements, at cost | | | 1,522 | | | | 1,485 | | Accumulated depreciation and amortization | | | (963 | ) | | | (936 | ) | Equipment, property and improvements, net | | $ | 559 | | | $ | 549 | |
63
PART II Item 8.Financial Statements and Supplementary Data, continued Depreciation and amortization expense on equipment, property and improvements of $83, $82 and $82 is included in the Consolidated Statements of Income within the communications and data processing and occupancy and equipment categories for the years ended December 31, 2015, 2014 and 2013, respectively. The Partnership's capital expenditures were $94, $90 and $84 for the years ended 2015, 2014 and 2013, respectively. The capital expenditures in 2015 were primarily related to construction and facilities improvements at the north campus location in St. Louis and branch offices for technology support. The Partnership has purchased Industrial Revenue Bonds issued by St. Louis County related to certain self-constructed and purchased real and personal property. This provides for potential property tax benefits over the life of the bonds (generally 10 years). The Partnership is therefore both the bondholder and the debtor/lessee for these properties. The Partnership has exercised its right to offset the amounts invested in and the obligations for these bonds and has therefore excluded any bond related balances in the Consolidated Statements of Financial Condition. The amount issued as of December 31, 2015 and 2014 was approximately $350 for both periods. NOTE 6 – LINES OF CREDIT The following table shows the composition of the Partnership's aggregate bank lines of credit in place as of December 31, 2015 and 2014: | | 2015 | | | 2014 | | 2013 Credit Facility | | $ | 400 | | | $ | 400 | | Uncommitted secured credit facilities | | | 290 | | | | 365 | | Total lines of credit | | $ | 690 | | | $ | 765 | |
In November 2013, the Partnership entered into an agreement with 12 banks for a five-year $400 committed unsecured revolving line of credit ("2013 Credit Facility"), with an expiration date of November 15, 2018 and replaced a similar credit facility. The 2013 Credit Facility is intended to provide short-term liquidity to the Partnership should the need arise. The 2013 Credit Facility has a tiered interest rate margin based on the Partnership's leverage ratio (ratio of total debt to total capitalization). Borrowings made with a three-day advance notice will have a rate of LIBOR plus a margin ranging from 1.25% to 2.00%. Same day borrowings, which are subject to certain borrowing notification cutoff times, will have a rate consisting of a margin ranging from 0.25% to 1.00% plus the greater of the prime rate, the federal funds effective rate plus 1.00%, or the one-month LIBOR rate plus 1.00%. In accordance with the terms of the 2013 Credit Facility, the Partnership is required to maintain a leverage ratio of no more than 35% and minimum partnership capital, net of reserve for anticipated withdrawals, of at least $1,382 plus 50% of subsequent issuances of partnership capital. As of December 31, 2015, the Partnership was in compliance with all covenants related to the 2013 Credit Facility. The Partnership's uncommitted lines of credit are subject to change at the discretion of the banks and, therefore, due to credit market conditions and the uncommitted nature of these credit facilities, it is possible that these lines of credit could decrease or not be available in the future. In addition, to the extent these banks provide financing to partners for capital contributions, financing available to the Partnership may be reduced. Actual borrowing availability on the uncommitted lines of credit is based on client margin securities and firm-owned securities, which would serve as collateral in the event the Partnership borrowed against these lines. On October 30, 2015, the Partnership's uncommitted lines of credit were reduced by $75 under an agreement with one of the banks. This reduction was not due to the Partnership's financial condition and this bank still participates in the 2013 Credit Facility. There were no amounts outstanding on the 2013 Credit Facility or the uncommitted lines of credit as of December 31, 2015 and 2014. In addition, the Partnership did not have any draws against these lines of credit during the years ended December 31, 2015, 2014 and 2013, respectively. 64
PART II Item 8.Financial Statements and Supplementary Data, continued NOTE 7 – PARTNERSHIP CAPITAL SUBJECT TO MANDATORY REDEMPTION The Partnership makes loans available to those general partners who require financing for some or all of their Partnership capital contributions except for members of the Executive Committee (as defined in the Partnership Agreement). In limited circumstances a general partner may withdraw from the Partnership and become a subordinated limited partner while he or she still has an outstanding Partnership loan. It is anticipated that a majority of future general and subordinated limited partnership capital contributions (other than for Executive Committee members) requiring financing will be financed through Partnership loans. Loans made by the Partnership to partners are generally for a period of one year but are expected to be renewed and bear interest at the prime rate, as defined in the loan documents. The Partnership recognizes interest income for the interest earned related to these loans. The outstanding amount of Partnership loans financed through the Partnership is reflected as a reduction to total Partnership capital. As of December 31, 2015 and 2014, the outstanding amount of Partnership loans financed through the Partnership was $218 and $198, respectively. Interest income earned from these loans, which is included in interest and dividends in the Consolidated Statements of Income, was $8, $7 and $8 for the years ended December 31, 2015, 2014 and 2013, respectively. The minimum 7.5% annual return on the face amount of limited partnership capital was $69, $48 and $48 for the years ended December 31, 2015, 2014 and 2013, respectively. These amounts are included as a component of interest expense in the Consolidated Statements of Income. The following table shows the roll forward of outstanding Partnership loans for the years ended December 31, 2015 and 2014: | | 2015 | | | 2014 | | Partnership loans outstanding at beginning of year | | $ | 198 | | | $ | 215 | | Partnership loans issued during the year | | | 119 | | | | 86 | | Repayment of Partnership loans during the year | | | (99 | ) | | | (103 | ) | Total Partnership loans outstanding | | $ | 218 | | | $ | 198 | |
The Partnership filed a Registration Statement on Form S-8 with the Securities and Exchange Commission ("SEC") on January 17, 2014, to register $350 of Interests to be issued pursuant to the Partnership's 2014 Employee Limited Partnership Interest Purchase Plan (the "Plan"). On January 2, 2015, the Partnership issued $292 of Interests in connection with the Plan. In addition, on January 4, 2016, the Partnership issued additional Interests to individuals participating in retirement transition plans pursuant to the Plan. The remaining $58 of Interests may be issued in connection with the Plan at the discretion of the Partnership in the future. NOTE 8 – NET CAPITAL REQUIREMENTS As a result of its activities as a broker-dealer, Edward Jones is subject to the net capital provisions of Rule 15c3-1 ofunder the Securities Exchange Act of 1934 (“Exchange Act”) and capital compliance rules of the FINRAFinancial Industry Regulatory Authority (“FINRA”) Rule 4110. Under the alternative method permitted by the rules, Edward Jones must maintain minimum net capital equal to the greater of $250$0.25 or 2% of aggregate debit items arising from client transactions. The net capital rules also provide that Edward Jones’ partnership capital may not be withdrawn if resulting net capital would be less than minimum requirements. Additionally, certain withdrawals require the approval of the SEC and FINRA to the extent they exceed defined levels, even though such withdrawals would not cause net capital to be less than minimum requirements. AtThe Partnership’s Canada broker-dealer is a registered securities dealer regulated by the Investment Industry Regulatory Organization of Canada (“IIROC”). Under the regulations prescribed by IIROC, the Partnership's Canada broker-dealer is required to maintain minimum levels of risk-adjusted capital, which are dependent on the nature of the Partnership's Canada broker-dealer’s assets and operations.
65
PART II Item 8.Financial Statements and Supplementary Data, continued The following table shows the Partnership’s net capital figures for its U.S. and Canada broker-dealers as of December 31, 2012, Edward Jones’ net capital of $711,894 was 34.0% of aggregate debit items2015 and its net capital in excess of the minimum required was $670,072. Net capital after anticipated capital withdrawals, as a percentage of aggregate debit items, was 18.5%. 2014: | | 2015 | | | 2014 | | U.S.: | | | | | | | | | Net capital | | $ | 1,140 | | | $ | 999 | | Net capital in excess of the minimum required | | $ | 1,083 | | | $ | 948 | | Net capital as a percentage of aggregate debit items | | | 40.1 | % | | | 38.9 | % | Net capital after anticipated capital withdrawals, as a percentage of aggregate debit items | | | 26.0 | % | | | 31.1 | % | | | | | | | | | | Canada: | | | | | | | | | Regulatory risk adjusted capital | | $ | 24 | | | $ | 31 | | Regulatory risk adjusted capital in excess of the minimum required to be held by IIROC | | $ | 19 | | | $ | 27 | |
Net capital and the related capital percentages may fluctuate on a daily basis. At December 31, 2012, the Partnership’s Canadian broker-dealer’s regulatory risk adjusted capital of $38,488 was $27,567 in excess of the capital required to be held by the Investment Industry Regulatory Organization of Canada (“IIROC”). In addition, EJTC was in compliance as of December 31, 2012, with its regulatory capital requirements.
PART II
Item 8.
| Financial Statements and Supplementary Data, continued
|
NOTE 129 – INCOME TAXES The Partnership is treated as sucha pass through entity for federal and state income tax purposes and generally does not incur income taxes. Instead, its earnings and losses are included in the income tax returns of its individualthe general and limited partners. However, the PartnershipPartnership's structure does include certain subsidiaries which are corporations that are subject to income tax. As of December 31, 20122015 and 2011,2014, the Partnership’sPartnership's tax basis of net assets and liabilities exceeds the book basis by $82,925$203 and $129,348,$126, respectively. The primary difference between financial statement basis and tax basis is related to the deferral for tax purposes in deducting accrued expenses until they are paid. Since the Partnership is treated as sucha pass through entity for federal and state income tax purposes, the difference between the tax basis and the book basis of assets and liabilities will impact the future tax liabilities of the partners. The tax differences will not impact the net income of the Partnership. FASB ASC No. 740,Income Taxes,, requires the Partnership to determine whether a tax position is greater than fifty percent likely of being realized upon settlement with the applicable taxing authority, which could result in the Partnership recording a tax liability that would reduce net partnership capital. The Partnership did not have any significant uncertain tax positions as of December 31, 20122015 and 20112014 and is not aware of any tax positions that will significantly change during the next twelve months. Edward Jones isThe Partnership and its subsidiaries are generally subject to examination by the Internal Revenue Service (“IRS”("IRS") and by various state and foreign taxing authorities in the jurisdictions in which Edward Jones conductsthe Partnership and its subsidiaries conduct business. In 2012, the IRS began an examination of Edward Jones’ income tax returns for the years ended 2009 and 2010. This event is not expected to have a material impact to the Partnership. Tax years prior to 20082012 are generally no longer subject to examination by U.S. federal,the IRS, state, local or foreign tax authorities. NOTE 1310 – EMPLOYEE BENEFIT PLANS The Partnership maintains a Profit Sharingprofit sharing and Deferred Compensation401(k) plan covering all eligible U.S. employees in the U.S. and principals, a Group Registered Retirement Savings Plan covering all eligible Canada employees in Canada.and principals, and a Deferred Profit Sharing Plan covering all eligible Canada employees. Contributions to the plans are at the discretion of the Partnership. Additionally, participants may contribute on a voluntary basis. Approximately $133,300, $115,600The Partnership contributed approximately $169, $158 and $94,100 were provided by the Partnership for its contributions to the plans$141 for the years ended December 31, 2012, 20112015, 2014 and 2010,2013, respectively. PART II
Item 8.
| Financial Statements and Supplementary Data, continued
|
NOTE 1411 – COMMITMENTS, GUARANTEES AND RISKS The Partnership leases home office and branch office space under numerous non-cancelable operating leases.leases from non-affiliates and financial advisors. Branch offices are leased generally for terms of three to five years. Rent expense is recognized on a straight-line basis over the minimum lease term. Rent and other lease relatedlease-related expenses were $229,300, $227,500,approximately $254, $242, and $218,100$234 for the years ended December 31, 2012, 20112015, 2014 and 2010,2013, respectively. 66
PART II Item 8.Financial Statements and Supplementary Data, continued The Partnership’sPartnership's non-cancelable lease commitments greater than one year as of December 31, 2012,2015, are summarized below: | 2013 | | $ | 129,984 | | | 2014 | | | 35,871 | | | 2015 | | | 24,370 | | | 2016 | | | 17,081 | | $ | 143 | | 2017 | | | 12,634 | | | 39 | | 2018 | | | 26 | | 2019 | | | 17 | | 2020 | | | 11 | | Thereafter | | | 41,498 | | | 18 | | | | | | | | | $ | 261,438 | | | | | | | | Total | | $ | 254 | |
The Partnership’sPartnership's annual rent expense is greater than its annual future lease commitments because the annual future lease commitments include only non-cancelable lease payments greater than one year. In addition to the commitments discussed above, the Partnership has a revolving unsecured line of credit outstanding as of December 31, 2012 (see Note 7), as well as2015, the Partnership would have incurred termination fees of $70,700 as of December 31, 2012approximately $113 in the event the Partnership terminated existing contractual commitments with certain vendors providing ongoing services.services primarily for information technology, operations and marketing. These termination fees will decrease over the related contract periods, which generally expire within the next three years. As of December 31, 2015, the Partnership also has a revolving unsecured line of credit available (see Note 6). The Partnership provides margin loans to its clients in accordance with Federal Reserve Board Regulation T and FINRA Rule 4210, which loans are collateralized by securities in client accounts. The Partnership could be liable for the margin requirement of its client margin securities transactions. To mitigate this risk, the Partnership monitors required margin levels and requires clients to deposit additional collateral or reduce positions to meet minimum collateral requirements. The Partnership's securities activities involve execution, settlement and financing of various securities transactions for clients. The Partnership may be exposed to risk of loss in the event clients, other brokers and dealers, banks, depositories or clearing organizations are unable to fulfill contractual obligations. The Partnership has controls in place to ensure client activity is monitored and to mitigate the risk of clients' inability to meet their obligations to the Partnership. Therefore, the Partnership considers its potential to make payments under these client transactions to be remote and accordingly, no liability has been recognized for these transactions. Cash balances held at various major U.S. financial institutions, which typically exceed Federal Deposit Insurance Corporation insurance coverage limits, subject the Partnership to a concentration of credit risk. Additionally, the Partnership's Canada broker-dealer may also have cash deposits in excess of the applicable insured amounts. The Partnership regularly monitors the credit ratings of these financial institutions in order to help mitigate the credit risk that exists with the deposits in excess of insured amounts. The Partnership has credit exposure to U.S. government and agency securities which are held as collateral for its resell agreements, investment securities and segregated investments. The Partnership's primary exposure on resell agreements is with the counterparty and the Partnership would only have exposure to U.S. government and agency credit risk in the event of the counterparty's default on the resell agreements. The Partnership provides guarantees to securities clearing houses and exchanges under their standard membership agreements, which require a member to guarantee the performance of other members. Under these agreements, if a member becomes unable to satisfy its obligations to the clearing houses and exchanges, all other members would be required to meet any shortfall. The Partnership's liability under these arrangements is not quantifiable and may exceed the cash and securities it has posted as collateral. However, the Partnership considers the likelihood that the Partnership will be required to make payments under these agreements to be remote. Accordingly, no liability has been recognized for these transactions. 67
PART II Item 8.Financial Statements and Supplementary Data, continued Item 8.
| Financial Statements and Supplementary Data, continued
|
NOTE 1512 – CONTINGENCIES In the normal course of its business, the Partnership has been named as a defendant in various legal actions, including arbitrations, class actions and other litigation. Certain of these legal actions include claims for substantial compensatory and/or punitive damages or claims for indeterminate amounts of damages. The Partnership is also involved, from time to time, in various legal and regulatory matters, including arbitrations, class actions, other litigation, and examinations, investigations and proceedings by governmental authorities and self-regulatory agencies, certain oforganizations, which may result in adverse judgments, fines or penalties.losses. In addition, the Partnership provides for potential losses that may arise related to other contingencies. The Partnership assesses its liabilities and contingencies utilizing available information. For those matters where it is probable the Partnership will incur a potential loss and the amount of the loss is reasonably estimable, in accordance with FASB ASC No. 450,Contingencies (“ASC 450”), an accrued liability has been established. These reserves representThis liability represents the Partnership’s aggregate estimate of the potential loss contingency at December 31, 2015 and areis believed to be sufficient at this time.sufficient. Such aggregate liability may be adjusted from time to time to reflect any relevant developments. For such matters where an accrued liability has not been established and the Partnership believes a loss is both reasonably possible and estimable, as well as for matters where an accrued liability has been recorded but for which an exposure to loss in excess of the amount accrued is both reasonably possible and estimable, the current estimated aggregated range of additional possible loss is $4,000$1 to $51,000.$17 as of December 31, 2015. This range of reasonably possible loss does not necessarily represent the Partnership’sPartnership's maximum loss exposure as the Partnership was not able to estimate a range of reasonably possible loss for all matters. Further, the matters underlying any disclosed estimated range will change from time to time, and actual results may vary significantly. While the outcome of these matters is inherently uncertain, based on information currently available, the Partnership believes that its established reservesliabilities at December 31, 2015 are adequate and the liabilities arising from such proceedingsmatters will not have a material adverse effect on the consolidated financial position, results of operations or cash flows of the Partnership. However, based on future developments and the potential unfavorable resolution of these matters, the outcome could be material to the Partnership’s future consolidated operating results for a particular period or periods. PART II
Item 8.
| Financial Statements and Supplementary Data, continued
|
NOTE 1613 – SEGMENT INFORMATION An operating segment is defined as a component of an entity that has all of the following characteristics: it engages in business activities from which it may earn revenues and incur expenses; its operating results are regularly reviewed by the entity’s chief operating decision-maker (or decision-making group) for resource allocation and to assess performance; and it has discrete financial information is available. Operating segments may be combined in certain circumstances into reportable segments for financial reporting. The Partnership has determined it has two operating and reportable segments based upon geographic location, the U.S. and Canada. Each segment, in its own geographic location, primarily derives its revenuesrevenue from the retail brokerage business through the sale of listed and unlisted securities and insurance products, investment banking, principal transactions, as a distributordistribution of mutual fund shares, and through revenuesfees related to assets held by and account services provided to its clients. The accounting policiesclients, including investment advisory services, the purchase or sale of the segments are the same as those described in “Note 1 – Summary of Significant Accounting Policies.” Financial information about the Partnership’s reportable segments is presented in the following table. For the computation of its segment information, the Partnership allocates costs incurred by the U.S. entity in support of Canadian operations to the Canadian segment.listed and unlisted securities and insurance products, and principal transactions.
The Partnership evaluates thesegment performance of its segments based upon income (loss) before allocationallocations to partners, as well as income before variable incentive compensation.compensation (“pre-variable income”). Variable incentive compensation is determined at the Partnership level for profit sharing and home office associate and branch employeeoffice administrator bonus amounts, and therefore is allocated to each geographic segment independent of that segment’s individual income before variable incentive compensation. The amount of financialpre-variable income. Financial advisor bonuses isare determined in part by the overall PartnershipPartnership’s profitability, as well as the performance of the individual financial advisors at the segment. As such, bothadvisors. Both income (loss) before allocationallocations to partners and pre-variable income before variable incentive compensation are considered in evaluating segment performance. Long-lived assets are not disclosed because the balances are not used for evaluating segment performance and deciding how to allocate resources to segments. However, total assets from continuing operations for each segment are provided for informational purposes.purposes, as well as capital expenditures and depreciation and amortization. The Canadianaccounting policies of the segments are the same as those described in Note 1 – Summary of Significant Accounting Policies. For computation of segment information, as reportedthe Partnership allocates costs incurred by the U.S. entity in support of Canada operations to the following tableCanada segment. Canada segment information is based upon the Consolidated Financial Statements of the Partnership’s CanadianCanada operations without eliminating any intercompany items, such as management fees that it payspaid to affiliated entities. The U.S. segment information is derived from the Partnership’s Consolidated Financial Statements less the Canada segment information as presented. This is consistent with how management reviews the segments in order to assess performance. 68
PART II Item 8.Financial Statements and Supplementary Data, continued Item 8.
| Financial Statements and Supplementary Data, continued
|
FinancialThe following table shows financial information for the Partnership’s reportable segments is presented in the following table for the years ended December 31, 2012, 20112015, 2014 and 2010:2013:
| | | | | | | | 2015 | | | 2014 | | | 2013 | | | | | 2012 | | 2011 | | 2010 | | | Financial metrics: | | | | | | | | Net revenue: | | | | | | | | | | | | | | | | | | | United States of America | | $ | 4,789,850 | | | $ | 4,324,451 | | | $ | 3,939,831 | | | U.S. | | | $ | 6,432 | | | $ | 6,074 | | | $ | 5,457 | | Canada | | | 175,325 | | | | 185,410 | | | | 166,945 | | | | 187 | | | | 204 | | | | 200 | | | | | | | | | | | | | Total net revenue | | $ | 4,965,175 | | | $ | 4,509,861 | | | $ | 4,106,776 | | | $ | 6,619 | | | $ | 6,278 | | | $ | 5,657 | | | | | | | | | | | | | | | | | | | | | | | | Net interest and dividends revenue: | | | | | | | | | | | | | | | | | | | United States of America | | $ | 66,912 | | | $ | 57,647 | | | $ | 66,775 | | | U.S. | | | $ | 81 | | | $ | 76 | | | $ | 70 | | Canada | | | 4,314 | | | | 4,862 | | | | 3,671 | | | | 2 | | | | 4 | | | | 5 | | | | | | | | | | | | | Total net interest and dividends revenue | | $ | 71,226 | | | $ | 62,509 | | | $ | 70,446 | | | $ | 83 | | | $ | 80 | | | $ | 75 | | | | | | | | | | | | | | | | | | | | | | | | Pre-variable income (loss): | | | | | | | | United States of America | | $ | 1,055,550 | | | $ | 855,862 | | | $ | 678,110 | | | Pre-variable income: | | | | | | | | | | | | | | U.S. | | | $ | 1,650 | | | $ | 1,559 | | | $ | 1,310 | | Canada | | | (3,482 | ) | | | 4,189 | | | | (10,715 | ) | | | 8 | | | | 12 | | | | 7 | | Total pre-variable income | | | $ | 1,658 | | | $ | 1,571 | | | $ | 1,317 | | | | | | | | | | | | | | | | | | | | | | | | Total pre-variable income | | | 1,052,068 | | | | 860,051 | | | | 667,395 | | | Variable incentive compensation: | | | | | | | | United States of America | | | 485,196 | | | | 366,663 | | | | 266,100 | | | Variable compensation: | | | | | | | | | | | | | | U.S. | | | $ | 803 | | | $ | 781 | | | $ | 626 | | Canada | | | 11,852 | | | | 11,605 | | | | 8,510 | | | | 17 | | | | 20 | | | | 17 | | Total variable compensation | | | $ | 820 | | | $ | 801 | | | $ | 643 | | | | | | | | | | | | | | | | | | | | | | | | Total variable incentive compensation | | | 497,048 | | | | 378,268 | | | | 274,610 | | | Income (loss) before allocation to partners: | | | | | | | | United States of America | | | 570,354 | | | | 489,199 | | | | 412,010 | | | Income (loss) before allocations to partners: | | | | | | | | | | | | | | U.S. | | | $ | 847 | | | $ | 778 | | | $ | 684 | | Canada | | | (15,334 | ) | | | (7,416 | ) | | | (19,225 | ) | | | (9 | ) | | | (8 | ) | | | (10 | ) | | | | | | | | | | | | Total Income before allocation to partners | | $ | 555,020 | | | $ | 481,783 | | | $ | 392,785 | | | Total income before allocations to partners | | | $ | 838 | | | $ | 770 | | | $ | 674 | | | | | | | | | | | | | | | | | | | | | | | | Capital expenditures: | | | | | | | | | | | | | | | | | | | United States of America | | $ | 36,700 | | | $ | 53,219 | | | $ | 90,500 | | | U.S. | | | $ | 93 | | | $ | 88 | | | $ | 81 | | Canada | | | 1,058 | | | | 1,793 | | | | 2,494 | | | | 1 | | | | 2 | | | | 3 | | | | | | | | | | | | | Total capital expenditures | | $ | 37,758 | | | $ | 55,012 | | | $ | 92,994 | | | $ | 94 | | | $ | 90 | | | $ | 84 | | | | | | | | | | | | | | | | | | | | | | | | Depreciation and amortization: | | | | | | | | | | | | | | | | | | | United States of America | | $ | 78,226 | | | $ | 88,118 | | | $ | 95,548 | | | U.S. | | | $ | 81 | | | $ | 80 | | | $ | 80 | | Canada | | | 1,922 | | | | 2,491 | | | | 2,639 | | | | 2 | | | | 2 | | | | 2 | | | | | | | | | | | | | Total depreciation and amortization | | $ | 80,148 | | | $ | 90,609 | | | $ | 98,187 | | | $ | 83 | | | $ | 82 | | | $ | 82 | | | | | | | | | | | | | | | | | | | | | | | | Total assets: | | | | | | | | United States of America | | $ | 12,617,643 | | | $ | 9,158,882 | | | $ | 7,785,698 | | | Total assets at year end: | | | | | | | | | | | | | | U.S. | | | $ | 15,897 | | | $ | 14,290 | | | $ | 13,341 | | Canada | | | 424,600 | | | | 424,704 | | | | 455,452 | | | | 459 | | | | 480 | | | | 454 | | | | | | | | | | | | | Total assets | | $ | 13,042,243 | | | $ | 9,583,586 | | | $ | 8,241,150 | | | $ | 16,356 | | | $ | 14,770 | | | $ | 13,795 | | | | | | | | | | | | | | | | | | | | | | | | Non-financial metrics: | | | | | | | | Financial Advisors (as of year-end): | | | | | | | | United States of America | | | 11,822 | | | | 11,622 | | | | 11,980 | | | Financial advisors at year end: | | | | | | | | | | | | | | U.S. | | | | 13,839 | | | | 13,287 | | | | 12,483 | | Canada | | | 641 | | | | 620 | | | | 636 | | | | 669 | | | | 713 | | | | 675 | | | | | | | | | | | | | Total financial advisors | | | 12,463 | | | | 12,242 | | | | 12,616 | | | | 14,508 | | | | 14,000 | | | | 13,158 | | | | | | | | | | | | |
69
PART II Item 8.Financial Statements and Supplementary Data, continued Item 8.
| Financial Statements and Supplementary Data, continued
|
NOTE 1714 – RELATED PARTIES Edward Jones owns a 49.5% limited partnership interest in Passport Research, the investment adviser for two money market funds made available to the Edward Jones money market funds. The Partnership does not have management responsibility with regard to the adviser.clients. Approximately 0.2%0.1%, 0.2%0.03% and 0.5%0.1% of the Partnership’sPartnership's total revenues were derived from thethis limited partnership interest in Passport Research during 2015, 2014 and 2013, respectively. The Partnership has entered into a non-binding letter of intent to acquire the investment adviserremaining 50.5% of Passport Research from Federated Investment Management Company ("Federated"), the general partner of Passport Research. The transaction is not expected to have a material impact on the funds during 2012, 2011Consolidated Financial Statements. Federated approved the transfer on February 18, 2016 and 2010, respectively.the transfer is expected to be completed in the fourth quarter of 2016, subject to customary regulatory and fund shareholder approvals. As of December 31, 2015, Edward Jones leases approximately 10% of its branch office space from its financial advisors.advisors (see Note 11). Rent expense related to these leases approximated $20,000$27, $25 and $23 for the years ended December 31, 2012, 20112015, 2014 and 2010.2013, respectively. These leases are executed and maintained in the samea similar manner as those entered into with third parties. The Bridge Builder Trust (the "Trust") was formed to offer additional fund options for Advisory Solutions clients. Olive Street Investment Advisers, L.L.C. ("OLV"), a wholly-owned subsidiary of the Partnership, is the investment adviser to the sub-advised mutual funds in the Trust. OLV has contractually agreed to waive any investment adviser fees above those amounts paid to the sub-advisers. The investment adviser fee revenue earned by OLV, included within advisory programs fees on the Consolidated Statements of Income, is offset by the expense paid to the sub-advisers, included within professional and consulting fees. The total amounts recognized for the years ended December 31, 2015, 2014 and 2013 were $30, $8 and $1, respectively. In the normal course of business, partners and employeesassociates of the Partnership and its affiliates use the brokerage services and trust services of the Partnership for the same services as unrelated third parties, with certain discounts on commissions and fees for certain services. The Partnership has included balances arising from such transactions in the Consolidated Statements of Financial ConditionStatements on the same basis as other clients. The Partnership earnsrecognizes interest income for the interest earned from general partners who elect to finance a portion or all of their purchase of general partnership interestscapital contributions through loans made available from the Partnership. These partnership loans were first made available to general partners in 2011. Partnership (see Note 7). NOTE 15 – QUARTERLY INFORMATION (Unaudited) | | 2015 Quarters Ended | | | | Mar 27 | | | Jun 26 | | | Sep 25 | | | Dec 31 | | Net revenue | | $ | 1,635 | | | $ | 1,681 | | | $ | 1,645 | | | $ | 1,658 | | Income before allocations to partners | | $ | 214 | | | $ | 222 | | | $ | 208 | | | $ | 194 | | Income allocated to limited partners per weighted average $1,000 equivalent limited partnership unit outstanding | | $ | 33.54 | | | $ | 34.83 | | | $ | 32.67 | | | $ | 30.38 | |
| | 2014 Quarters Ended | | | | Mar 28 | | | Jun 27 | | | Sep 26 | | | Dec 31 | | Net revenue | | $ | 1,490 | | | $ | 1,564 | | | $ | 1,583 | | | $ | 1,641 | | Income before allocations to partners | | $ | 186 | | | $ | 194 | | | $ | 195 | | | $ | 195 | | Income allocated to limited partners per weighted average $1,000 equivalent limited partnership unit outstanding | | $ | 31.27 | | | $ | 32.67 | | | $ | 32.77 | | | $ | 32.69 | |
70
PART II Item 8.Financial Statements and Supplementary Data, continued NOTE 16 – OFFSETTING ASSETS AND LIABILITIES The Partnership earned interestdoes not offset financial instruments in the Consolidated Statements of $5,717 and $2,888Financial Condition. However, the Partnership enters into master netting arrangements with counterparties for securities purchased under agreements to resell that are subject to net settlement in the event of default. These agreements create a right of offset for the years ended December 31, 2012amounts due to and 2011, respectively, on such partnership loans. due from the same counterparty in the event of default or bankruptcy. The amount of partnership loans for general partner interests outstandingfollowing table shows the Partnership's securities purchased under agreements to resell as of December 31, 20122015 and 2011 was $170,264 and $86,853, respectively. PART II
2014: | | | | | | Gross amounts | | Net amounts | | | Gross amounts not offset | | | | | | | | | | | | offset in the | | presented in the | | | in the Consolidated | | | | | | | | Gross | | | Consolidated | | Consolidated | | | Statements of Financial | | | | | | | | amounts of | | | Statements of | | Statements of | | | Condition | | | | | | | | recognized | | | Financial | | Financial | | | Financial | | Securities | | | | | | | | assets | | | Condition | | Condition | | | instruments | | collateral(1) | | | Net amount | | 2015 | | $ | 843 | | | — | | | 843 | | | — | | | (843 | ) | | $ | — | | 2014 | | $ | 634 | | | — | | | 634 | | | — | | | (634 | ) | | $ | — | |
Item 8.(1)
| Financial StatementsActual collateral was greater than 102% of the related assets in U.S. agreements and Supplementary Data, continuedgreater than 100% in Canada agreements for all periods presented.
|
NOTE 18 – QUARTERLY INFORMATION
(Unaudited)
| | | | | | | | | | | | | | | | | | | | 2012 | | | | | Quarters Ended | | | | | March 30 | | | June 29 | | | September 28 | | | December 31 | | Total revenue | | $ | 1,222,446 | | | $ | 1,230,238 | | | $ | 1,269,435 | | | $ | 1,305,299 | | Income before allocations to partners | | $ | 138,565 | | | $ | 138,962 | | | $ | 130,861 | | | $ | 146,632 | | Income before allocations to partners per weighted average $1,000 equivalent limited partnership unit outstanding | | $ | 27.42 | | | $ | 27.50 | | | $ | 25.90 | | | $ | 29.02 | | | | | | | 2011 | | | | | Quarters Ended | | | | | March 25 | | | June 24 | | | September 30 | | | December 31 | | Total revenue | | $ | 1,123,893 | | | $ | 1,169,757 | | | $ | 1,166,777 | | | $ | 1,117,076 | | Income before allocations to partners | | $ | 117,639 | | | $ | 124,397 | | | $ | 115,620 | | | $ | 124,127 | | Income before allocations to partners per weighted average $1,000 equivalent limited partnership unit outstanding | | $ | 25.55 | | | $ | 27.03 | | | $ | 25.11 | | | $ | 26.97 | |
In accordance with ASC 480, the Partnership presents net income of $0 on its Consolidated Statement of Income. See Note 1 to the Consolidated Financial Statements for further discussion.
PART II
71
PART II ITEM 9. | CHANGE IN AND DISAGREEMENTS WITH ACCOUNTANTSACCOUNTANTS ON ACCOUNTING AND FINANCIAL DISCLOSURE |
None. ITEM 9A. | CONTROLS AND PROCEDURES |
Evaluation of Disclosure Controls and Procedures. As required by Rule 13a-15e13a-15(e) under the Exchange Act, as of the end of the period covered by this Annual Report on Form 10-K, the Partnership’s certifying officers, the Chief Executive Officer and the Chief Financial Officer, carried out an evaluation, with the participation of its management, of the effectiveness of the design and operation of ourthe Partnership's disclosure controls and procedures. In designing and evaluating our disclosure controls and procedures, we recognize that any controls and procedures, no matter how well designed and operated, can provide only reasonable assurance of achieving the desired control objectives, and we were required to apply our judgment in evaluating and implementing possible controls and procedures. Based on that evaluation, our Chief Executive Officer and Chief Financial Officer have concluded that, as of the date of completion of the evaluation, our disclosure controls and procedures were effective to ensure that information required to be disclosed by the Partnership in the reports we file or submit under the Exchange Act is recorded, processed, summarized and reported, within the time periods specified in the SEC’sSEC's rules and forms. We will continue to review and document our disclosure controls and procedures, including our internal controls and procedures for financial reporting, on an ongoing basis, and may from time to time make changes aimed at enhancing their effectiveness and to ensure that our systems evolve with our business. Management’sManagement's report on internal control over financial reporting and the report of independent registered public accounting firm are set forth in Part II, Item 8 – Financial Statements and Supplementary Data of this Annual Report on Form 10-K.
Changes in Internal Control Over Financial Reporting. There was no change in the Partnership’sPartnership's internal control over financial reporting (as defined in Rules 13a-15(f) and 15d-15(f) under the Exchange Act) that occurred during the quarter ended December 31, 20122015 that has materially affected, or is reasonably likely to materially affect, its internal control over financial reporting. ITEM 9B. | OTHER INFORMATION |
None. PART III
72
PART III ITEM 10. | DIRECTORS, EXECUTIVE OFFICERSOFFICERS AND CORPORATE GOVERNANCE |
JFC does not have a board of directors. As of February 22, 2013,26, 2016, the Partnership was composed of 373403 general partners, 14,00919,790 limited partners and 297391 subordinated limited partners. Managing Partner. Under the terms of the Partnership Agreement, the Managing Partner has primary responsibility for administering the Partnership’s business, determining its policies, and controlling the management and conduct of the Partnership’s business andbusiness. In addition, the Managing Partner has the power to admit and dismiss general partners and to fix the proportion of their respective interests in the Partnership. The Managing Partner serves for an indefinite term and may be removed by a majority vote of the Executive Committee (as discussed below) or a vote of the general partners holding a majority percentage ownership in the Partnership. If at any time the office of the Managing Partner is vacant, the Executive Committee will succeed to all the powers and duties of the Managing Partner until a new Managing Partner is elected by a majority of the Executive Committee. The Partnership does not have a formal code of ethics that applies to its Executive Committee members, as it relies on the core values and beliefs of the Partnership, as well as the Partnership Agreement. The Partnership’s operating subsidiaries are managed by JFC, under the leadership of the Managing Partner, pursuant to a services agreement.agreements. Executive Committee.Committee. The Executive Committee consists of the Managing Partner and the executive officers of the Partnership, which are five to nine additional general partners appointed by the Managing Partner, with the specific number determined by the Managing Partner. The purpose of the Executive Committee is to provide counsel and advice to the Managing Partner in discharging his functions, including the consideration of partnership compensation, ensuring the Partnership’s business risks are managed appropriately and helping to establish the strategic direction of the Partnership. In addition, the Executive Committee takes an active role in identifying, measuring and controlling the risks to which the Partnership is subject. Executive Committee members serve for an indefinite term and may be removed by the Managing Partner or a vote of general partners holding a majority percentage ownership in the Partnership. Furthermore, in the event the position of Managing Partner is vacant, the Executive Committee shall succeed to all of the powers and duties of the Managing Partner.Partner until a new Managing Partner is elected by a majority of the Executive Committee. The Partnership does not have a formal code of ethics that applies to its Executive Committee members, as it relies on the core values and beliefs of the Partnership, as well as the Partnership Agreement. Throughout 2012,2015, the Executive Committee was comprised of James D. Weddle, Chairman, Kevin D. Bastien, Brett A. Campbell,Kenneth R. Cella, Jr., Norman L. Eaker, Gary D. Reamey,Penny Pennington, Daniel J. Timm and James A. Tricarico, Jr. Gary D. Reamey retired from the Partnership and stepped down fromThe Managing Partner appointed general partner Timothy J. Kirley as a member of the Executive Committee at the end of 2012.effective January 15, 2016. The following table is a listing as of February 22, 2013,26, 2016 of the members of the Executive Committee, each member’s age, the year in which each member became an Executive Committee member, the year in which each member became a general partner and each member’s area of responsibility. Under terms of the Partnership Agreement, all general partners, including the members of the Executive Committee, are required to retire in their capacity as general partners at the age of 65. The members’ biographies are below. | | | | | | | | | | | | | | Executive | | General | | Area of | Name | | Age | | Committee | | Partner | | Responsibility | James D. Weddle | | 59 | | 2005 | | 1984 | | Managing Partner | Kevin D. Bastien | | 47 | | 2010 | | 1998 | | Chief Financial Officer | Brett A. Campbell | | 54 | | 2006 | | 1993 | | Client Strategies Group | Norman L. Eaker | | 56 | | 2005 | | 1984 | | Firm Administration | Daniel J. Timm | | 54 | | 2009 | | 1998 | | Branch Development | James A. Tricarico, Jr. | | 60 | | 2007 | | 2006 | | Legal and Compliance |
PART III
Item 10.
| Directors, Executive Officers and Corporate Governance, continued
|
| | | | Executive | | General | | | Name | | Age | | Committee | | Partner | | Area of Responsibility | James D. Weddle | | 62 | | 2005 | | 1984 | | Managing Partner | Kevin D. Bastien | | 50 | | 2010 | | 1998 | | Chief Financial Officer | Kenneth R. Cella, Jr. | | 46 | | 2014 | | 2002 | | Branch Development | Norman L. Eaker | | 59 | | 2005 | | 1984 | | Firm Administration | Timothy J. Kirley | | 62 | | 2016 | | 1994 | | Canadian Operations | Penny Pennington | | 52 | | 2014 | | 2006 | | Client Strategies Group | Daniel J. Timm | | 57 | | 2009 | | 1998 | | Branch Development | James A. Tricarico, Jr. | | 63 | | 2007 | | 2006 | | Legal and Compliance |
James D. Weddle, Managing Partner –Mr. Weddle joined the Partnership in 1976, was named a general partner in 1984 and has served as Managing Partner since January 2006. Mr. Weddle hasPreviously he worked in the Research department and as a financial advisor, in research, mutual fund sales, marketing and branch administration.has been responsible for the Mutual Fund Sales, Financial Advisor Training and Branch Administration departments. Mr. Weddle earned his bachelorbachelor's degree from DePauw University and his MBA from Washington University in St. Louis. Mr. Weddle is a member of the FINRA Board of Governors. 73
PART III Item 10. | Directors, Executive Officers and Corporate Governance, continued |
Kevin D. Bastien, Chief Financial Officer –Mr. Bastien joined the Partnership in 1996, was named a general partner in 1998 and has served as Chief Financial Officer since January 2009. Previously he has had responsibilitybeen responsible for various areas of the Finance division including tax, partnership accounting, coordinating overall finance support for international operations and the Sourcing Office, which negotiates all Partnership financial commitments. Mr. Bastien earned his bachelorbachelor’s and master’s degrees in accounting from Southern Illinois University at Carbondale.Carbondale and is a certified public accountant. Kenneth R. Cella, Jr., Branch Development – Brett A. Campbell, Client Strategies Group –Mr. CampbellCella joined the Partnership in 1984 as a financial advisor1990 and was named a general partner in 1993. He2002. Mr. Cella assumed shared responsibility for the Branch Development division, which encompasses Financial Advisor Talent Acquisition, Branch Office Administrator Talent Acquisition and Performance, Branch Training, Branch Administration, Branch Insights, Learning and Support, and Branch and Region Development, in July 2014. Previously he worked as a financial advisor and has been responsible for Financial Advisor Training and Branch Development. Today, he is responsible forvarious areas of the Client Strategies Group, which encompasses all ofincluding mutual funds, insurance, banking and advisory areas and for the firm’s products and services as well as the Research department, Investment Banking, Trust Company and Marketing division.Branch Training department. Mr. Campbell is a certified public accountant and is a member of the American Institute of CPA’s. Mr. CampbellCella earned his bachelorbachelor’s degree summa cum laude from Ball Statethe University of Missouri-St. Louis and graduated Kellogg Management Institute at Northwestern University.an MBA from Washington University in St. Louis. Norman L. Eaker, Chief Administrative Officer –Mr. Eaker joined the Partnership in 1981, and was named a general partner in 1984. Mr. Eaker1984 and has served as the director of Internal Audit andChief Administrative Officer since 2008. As Chief Administrative Officer, Mr. Eaker is currently responsible for Firm Administration, which encompasses the Operations, Service, Human Resources and Information Systems divisions. Previously he has been responsible for the Internal Audit division and various areas within the Operations division. Mr. Eaker graduatedearned his bachelor’s degree from the University of Missouri–St. Louis. Mr. Eaker is a member of the Operations and Technology Steering Committee of the Securities Industry and Financial Markets Association (SIFMA)("SIFMA"). Timothy J. Kirley, Canadian Operations – Mr. Kirley joined the Partnership in 1983 and was named a general partner in 1994. Mr. Kirley served as the Partnership's Chief Strategy Officer since 2010 until he assumed responsibility for Canada operations in September 2015. Previously, he worked as a financial advisor and helped launch Edward Jones Limited in the United Kingdom. Mr. Kirley earned his bachelor's degree from Southern Illinois University-Carbondale and an MBA from Washington University in St. Louis. Penny Pennington, Client Strategies Group – Ms. Pennington joined the Partnership in 1999 and was named a general partner in 2006. Ms. Pennington assumed responsibility for the Client Strategies Group, which encompasses all of the Partnership’s advice and guidance, products and services, marketing, and branch support related to helping clients achieve their financial goals, in September 2014. Previously she worked as a financial advisor and has been responsible for the New Financial Advisor Training department, BOA Development department and Branch and Region Development division. Ms. Pennington earned her bachelor’s degree from the University of Virginia and earned her MBA from the Kellogg School of Management at Northwestern University. Daniel J. Timm, Branch Development –Mr. Timm joined the Partnership in 1983 as a financial advisor and was named a general partner in 1998. Mr. Timm assumed shared responsibility for the Branch Development division, which encompasses Financial Advisor Talent Acquisition, Branch Office Administrator Talent Acquisition and Performance, Branch Training, Branch Administration, Branch Insights, Learning and Support, and Branch and Region Development, in July 2014. Previously he worked as a financial advisor and has been responsible for recruitingvarious areas of the Branch Development division, including the Financial Advisor Training, Financial Advisor Development and hiring, trainingBranch Administration departments. Mr. Timm earned his bachelor’s degree and developmentMBA from the University of all financial advisors and branch employees, as well as branch administration and leadership development. HeMissouri–Columbia. Mr. Timm is also a member of the SIFMA Private Client Steering Committee and Bulls Roundtable. He earned his bachelor degree in atmospheric science and MBA in finance from the University of Missouri–Columbia. James A. Tricarico, Jr., General Counsel,Chief Legal Officer –Mr. Tricarico joined the Partnership as general partner and general counselGeneral Counsel in 2006. Mr. Tricarico is the Partnership's Chief Legal Officer with responsibility for the Legal and Compliance divisions and Government Relations. Prior to joining the Partnership, he was in private practice and before that he served as general counsel and executive vice president of a large broker-dealer. Mr. Tricarico earned his bachelor’s degree from Fordham University and his law degree from New York Law School (cum laude). Mr. Tricarico is a member of the Board of Directors and the General CounselsExecutive Committee of the Board of SIFMA and is the Past President and a member of the Executive Committee of the Compliance and Legal Society of SIFMA and the National Arbitration and Mediation Committee of FINRA Dispute Resolution. He earned his bachelor degree from Fordham University and his law degree cum laude from New York Law School.SIFMA. 74
PART III Item 10. | Directors, Executive Officers and Corporate Governance, continued |
Management Committee.The Management Committee consists of up to 25 general partners appointed by the Managing Partner, with the specific number determined by the Managing Partner, and includes the members of the Executive Committee. As of February 22, 2013,26, 2016, the Management Committee consisted of 1922 general partners. The Management Committee is generally comprised of general partners with overall responsibility for a significant or critical functional division or area of the Partnership’s operating subsidiaries. The Management Committee meets weekly, is operational in nature, and is responsible for identifying, developing and accomplishing the Partnership’s objectives through, among other means, sharing information across divisions and identifying and resolving risk management issues for the Partnership. General partners on the Management Committee serve for an indefinite term and may be removed by the Managing Partner. Audit Committee.Committee. The Audit Committee was created by way of the Partnership Agreement. The Audit Committee operates according to its charter adopted by the Executive Committee. Pursuant to its charter and the Partnership Agreement, the Audit Committee is directly responsible for the appointment, compensation, retention and oversight of the work of anythe Partnership's independent registered public accounting firm engaged by the Partnership for the purpose of preparing or issuing an audit report.auditors. The Audit Committee is responsible for the development and maintenance of an understanding of the Partnership’s financial statements and the financial reporting process, overseeing the Partnership’s efforts to comply with the financial reporting control requirements of the Sarbanes Oxley Act of 2002 (“Sarbanes Oxley”) and providing input to the Partnership’s Internal Audit division regarding audit topics and the resolution of outstanding audit findings. In 2012 As of February 26, 2016, the Audit Committee was comprised of James A. Tricarico, Jr., Chairman, James D. Weddle, Kevin D. Bastien, Brett A. Campbell, Norman L. Eaker, Penny Pennington, Anthony Damico, who is a member of the Management Committee and the general partner responsible for the Internal Audit division, Joseph G. Porter, who isLisa M. Dolan, a member of the Management Committee and a general partner in the Finance division, and independent members of the committee Ed Glotzbach who is an independent member of the committee. and Mark Wuller. Mr. Bastien meets the requirements adopted by the SEC for qualification as an “audit committee financial expert.” Because Mr. Bastien is a general partner, he would not meet the definition of “independent” under the rules of the NYSE.New York Stock Exchange (“NYSE”). However, since the Partnership’s securities are not listed on any exchange, it is not subject to the listing requirements of the NYSE or any other securities exchanges. General partners on the Audit Committee members serve for an indefinite term and may be removed by the Managing Partner. RISK MANAGEMENT Overview The Partnership’s business model and activities expose it to a number of different risks. The most significant risks to which the Partnership is subject include business and operational risk, credit risk, market and liquidity risk, and legal, regulatory and reputational risk. The identification and ongoing management of the Partnership’s risk is critical to its long-term business success and related financial performance. The Partnership is governed by an Executive Committee, which is ultimately responsible for overall risk management. Throughout 2012,As of February 26, 2016, the Executive Committee consisted of the Partnership’s Managing Partner and sixseven other general partners, each responsible for broad functional areas of the Partnership. As previously disclosed, Gary D. Reamey retired from the Partnership and stepped down from the Executive Committee effective December 31, 2012, bringing the total number of Executive Committee members to six. The Executive Committee is responsible for providing advice and counsel to the Managing Partner and helps establish the strategic direction of the Partnership. In addition, the Executive Committee takes an active role in identifying, measuring and controlling the risks to which the Partnership is subject. The Executive Committee communicates regularly, meets monthly and also conducts periodic planning sessions to meet its responsibilities. PART III
Item 10.
| Directors, Executive Officers and Corporate Governance, continued
|
The Management Committee assists the Executive Committee in its ongoing risk management responsibilities through its day-to-day operations. The Management Committee is responsible for identifying, developing and accomplishing the Partnership’s objectives. In addition, the Management Committee is responsible for sharing information across divisions and identifying issues and risks with other members of the Management Committee. The Management Committee meets weekly and provides a forum to both identify and resolve risk management issues for the Partnership. Several other committees and departments support the Executive Committee’s risk management responsibilities by managing certain components of the risk management process. Some of the more prominent committees and departments and their primary responsibilities, as they relate to risk management, are listed below: 75
PART III Item 10. | Directors, Executive Officers and Corporate Governance, continued |
Audit Committee—Committee -responsible for the development and maintenance of an understanding of the Partnership’s financial statements and the financial reporting process, overseeing the Partnership’s efforts to comply with the financial reporting control requirements of Sarbanes Oxley, overseeing the independent auditorsauditors' qualifications and independence, and providing input to the Partnership’s Internal Audit division regarding audit topics and the resolution of outstanding audit findings. New Products and Services Committee—Committee -responsible for ensuring that all new products and services are aligned with clients’ needs, are consistent with the Partnership’s objectives and strategies, and that all areas of the Partnership are sufficiently prepared to support, service, and supervise any new activities. A new product or service has to be approved by the New Products and Services Committee and the Executive Committee before being offered to clients. Credit Review Committee—Committee -establishes policies governing the Partnership’s client margin accounts. The committee discusses and monitors the risks associated with the Partnership’s client margin practices and current trends in the industry. The committee reviews large client margin balances, the quality of the collateral supporting those accounts, and the credit exposure related to those accounts to minimize potential losses. Any margin loan over $2.5 million is subject to approval by the Chief Financial Officer. Capital Markets Committee—Committee -approves new issue equity offerings and primary fixed income inventory commitments above $10.0$10 million. The approval is based upon Partnership guidelines and credit quality standards administered by the Partnership’s Product Review department. Additionally, a member of the Capital Markets Committee is responsible both for the hedging strategies employed by the Partnership to reduce inventory risk and for the communication of those strategies to the Capital Markets Committee. Finance Risk Committee –-reviews the Partnership’s financial liquidity, cash investment portfolio and capital adequacy and assesses major exposures to financial institutions. These exposures include banks in which the Partnership has deposits or on which it depends for funding. Product Review Department—Department -analyzes proposed new investments prior to them being made broadly available to the Partnership’s clients, and performs ongoing due diligence activities on all products broadly marketed by the Partnership. PART III
Item 10.
| Directors, Executive Officers and Corporate Governance, continued
|
In addition to the committees and department discussed above, each of the Partnership’s divisions also assists the Executive Committee in its ongoing risk management activities through their day-to-day responsibilities. As part of the financial services industry, the Partnership’s business is subject to inherent risks. As a result, despite its risk management efforts and activities, there can be no absolute assurance that the Partnership will not experience significant unexpected losses due to the realization of certain operational or other risks to which the Partnership is subject. The following discussion highlights the Partnership’s procedures and policies designed to identify, assess, and manage the primary risks of its operations. Business and Operational Risk There is an element of operational risk inherent within the Partnership’s business. The Partnership is exposed to operational risk and its business model is dependent on complex technology systems, and there is a degree of exposure to systems failure. A business continuity planning process has been established to respond to severe business disruptions. The Partnership has established a data center in Tempe, Arizona, that operates as a secondary data center to its primary data center locatedcenters in St. Louis, MissouriArizona and which isMissouri. These data centers act as disaster recovery sites for each other. While these data centers are designed to enable the Partnership to maintain service duringbe redundant for each other, a system disruption contained to St. Louis. A prolonged interruption of either site might result in a delay in service and substantial costs and expenses. In 2011, the Partnership began re-purposing its secondary data center in Tempe, Arizona in order to be able to operate this facility as a primary data center for processing the most critical systems such that they could run in St. Louis, Missouri or Tempe, Arizona. As of December 31, 2012, this is still in process and is expected to take another two to three years to complete. In order to address the Partnership’s risk of identifying fraudulent or inappropriate activity, the Partnership implemented an anonymous ethics hotline for employees to report suspicious activity for review and disciplinary action when necessary. The Partnership’s Internal Audit and Compliance divisions investigate reports as they are received. The Internal Audit and Compliance divisions review other Partnership activity to assist in risk identification and identification of other inappropriate activities. In addition, the Partnership communicates and provides ongoing training regarding the Partnership’s privacy requirements to better protect client information. The Partnership is also exposed to operational risk as a result of its reliance on third parties to provide technology, processing and other business support services. The Partnership’s Sourcing Office primarily manages that risk by reviewing key vendors through a vendor due diligence and oversight process. 76
PART III Item 10. | Directors, Executive Officers and Corporate Governance, continued |
Credit Risk The Partnership is subject to credit risk due to the very nature of the transactions it processes for its clients. In order to manage this risk, the Partnership limits certain client transactions by, in some cases, requiring payment at the time or in advance of a client transaction being accepted. The Partnership manages the credit risk arising out of the client margin loans it offers by limiting the amount and controlling the quality of collateral held in the client’s account against those loans. In accordance with the FINRA rules, the Partnership requires, in the event of a decline in the market value of the securities in a margin account, the client to deposit additional securities or cash so that, at all times, the loan to the client is no greater than 75% of the value of the securities in the account (or to sell a sufficient amount of securities in order to maintain this percentage). The Partnership, however, generally imposes a more stringent maintenance requirement, which requires that the loan to the client be no greater than 65% of the value of the securities in the account. PART III
Item 10.
| Directors, Executive Officers and Corporate Governance, continued
|
The Partnership purchases and holds securities inventory positions for retail sales to its clients and does not trade those positions for the purpose of generating gains for its own account. To monitor inventory positions, the Partnership has an automated trading system designed to report trading positions and risks. This system requires traders to mark positions to market and to report positions at the trader level, department level and for the Partnership as a whole. There are established trading and inventory limits for each trader and each department, and activity exceeding those limits is subject to supervisory review. By maintaining an inventory hedging strategy, the Partnership has attempted to avoid material inventory losses or gains in the past (see Note 5 to the Consolidated Financial Statements for further details).past. The objective of the hedging strategy is to mitigate the risks of carrying its inventory positions and not to generate profit for the Partnership. The compensation of the Partnership’s traders is not directly tied to gains or losses incurred by the Partnership on the inventory, which eliminates the incentive to hold inappropriate inventory positions. The Partnership also has credit exposure with counterparties as a result of its ongoing, routine business activities. This credit exposure can arise from the settlement of client transactions, related failures to receive and deliver, or related to the Partnership’s overnight investing activities with other financial institutions. The Partnership monitors its exposure to such counterparties on a regular basis through the activities of its Finance Risk Committee in order to minimize its risk of loss related to such exposure. Market and Liquidity Risk Market risk is the risk of declining revenue or the value of financial instruments held by the Partnership as a result of fluctuations in interest rates, equity prices or overall market conditions. Liquidity risk is the risk of insufficient financial resources to meet the short-term or long-term cash needs of the Partnership. For a discussion of the Partnership’s market and liquidity risk, see “ItemPart I, Item 1A – Risk Factors and Part II, Item 7A – Quantitative and Qualitative Disclosures about Market Risk”.Risk. Legal, Regulatory and Reputational Risk In the normal course of business, from time to time, the Partnership is named as a defendant in various legal actions, including arbitrations, class actions and other litigation. Certain of these legal actions include claims for substantial compensatory and/or punitive damages or claims for indeterminate amounts of damages. Further, the Partnership is involved, from time to time, in various legal matters, including arbitrations, class actions, other litigation, and investigations and proceedings by governmental organizations and self-regulatory agencies, certain of which may result in adverse judgments, fines or penalties. Theorganizations. Over the past several years, the number of legal actions and investigations has increased among many firms in the financial services industry, including the Partnership. The Partnership has established, through its overall compliance program, a variety of policies and procedures (including written supervisory procedures) designed to avoid legal claims or regulatory issues. As a normal course of business, new accounts and client transactions are reviewed on a daily basis, in part, through the Partnership’s field supervision function, to mitigate the risk of non-compliance with regulatory requirements as well as any resulting negative impact on the Partnership’s reputation. To minimize the risk of regulatory non-compliance, each branch office is subject to an annual on siteonsite branch audit, to review the financial advisor’s business and competency. PART III
Item 10.
| Directors, Executive Officers and Corporate Governance, continued
|
Additionally, certain branches are visited regularly by field supervision directors to assure reasonable compliance. The Partnership’s Compliance division works with other business areas to advise and consult on business activities to help ensure compliance with regulatory requirements and Partnership policies. The Partnership also has a clear awareness of privacy issues,rules and regulations, uses client information responsibly, and trains its employees on privacy requirements, all of which come under the responsibility of the Partnership’s Chief Privacy Officer. The Partnership has specific policies related to prevention of fraud and money laundering and providing initial as well as annual training and review of competency to help mitigate regulatory risks. 77
PART III ITEM 11. | EXECUTIVEEXECUTIVE COMPENSATION
|
COMPENSATION DISCUSSION AND ANALYSIS The Partnership’s compensation program allocates profits to general partners, including members of its Executive Committee, primarily based upon their ownership interestinterests in the Partnership. As general partners, Executive Committee members as general partners benefit annually from the profits of the Partnership through current cash payments from short-term results and from having an opportunity to continue to share in the long-term profitability of the organization. By owning general partnership interests, Executive Committee members are encouraged to balance short-term and long-term results of the Partnership as they have a significant amount of capital at risk. Also, by sharing in any annual operating loss of the Partnership, all general partners, including Executive Committee members, have a direct incentive to manage risk and focus on the shortshort- and long-term financial results of the Partnership. Compensation Components The Executive Committee members’ compensation components are the same as the Partnership’sPartnership's other general partners. The components consist of base salary, deferred compensation, and the income allocated to partners.allocations of Partnership net income. Executive Committee members do not receive any bonus,bonuses, stock awards, option awards, non-equity incentive plan compensation, or any other elements besidesother than those disclosed below related to their general partnership interest.capital ownership interest in the Partnership. Salary –Each Executive Committee member receives an amount of fixed compensation in the form of annual salary. In establishing the salaries listed on the Summary Compensation Table, the Partnership considers individual experience, responsibilities and tenure. Because the Partnership’s principal compensation of Executive Committee members is based on general partnership ownership interests in the Partnership and specialfrom allocations of Partnership net income, allocable to general partners, it does not benchmark the compensation of its Executive Committee members with compensation to executives at other companies in setting its base salaries, or otherwise in determining the compensation to its Executive Committee members. Each Executive Committee member receives aan annual salary generally ranging from $175,000—$250,000 annually.$175,000 to $250,000. In addition to base salary, under the Partnership Agreement the Managing Partner has the discretion to allocate an additional $3 million (in the aggregate) in compensation to general partners. In 2012 and 2011 no amounts were allocated by the Managing Partner. However, in 2010, the Managing Partner allocated $0.1 million. None of the Executive Committee members listed in the table below received this allocation in 2010.
Deferred Compensation –Each Executive Committee member is a participant in the Partnership’s profit sharing and 401(k) plan, a qualified deferred compensation plan, which also covers all eligible employeesgeneral partners and associates of the Partnership’s subsidiaries. Each Executive Committee member receives contributions based upon the overall profitability of the Partnership. Contributions to the plan are made annually within the discretion of the Partnership and have historically been determined based on approximately twenty-four percent24% of the Partnership’s net income before allocations to partners. Allocation of the Partnership’s contribution among participants is determined by each participant’s relative level of eligible earnings, including their respective allocations of income.earnings. The plan is a tax-qualified retirement plan. PART III
Item 11.
| Executive Compensation, continued
|
Income Allocated to Partners –The majority of allthe Partnership's general partners’ compensation, (includingincluding that of the Executive Committee members)members, comes from the memberstheir capital ownership interests in the Partnership as general partners, subordinated limited partners and limited partners.partners pursuant to the Partnership Agreement. Of the Partnership’s net income allocated to general partners, including the Executive Committee members, ninety-two percent92% is allocable based upon their capitalrespective general partner ownership interestinterests in the Partnership. ThisGeneral partner ownership interest isinterests are set at the discretion of the Partnership’s Managing Partner, with input from the Executive Committee. CapitalGeneral partner ownership interests as general partners in the Partnership, held by each Executive Committee member ranged from 1.40%1.25% to 2.70%2.04% in 2012, 1.30% to 2.79% in 2011, and2015, 1.00% to 2.89%2.20% in 2010.2014, and 1.55% to 2.50% in 2013. The remaining eight percent8% of net income allocated to general partners is allocable among the general partners, which includes the Executive Committee members,distributed based on merit and/or need as determined by the Managing Partner in consultation with the Executive Committee. None of Pursuant to the Partnership Agreement, the Partnership's net income allocated to subordinated limited partners and net income allocated to limited partners, including the applicable Executive Committee members, listedis allocated based upon their respective subordinated limited partner ownership interests and limited partner ownership interests in the table below received this 8% allocation in 2012, 2011 or 2010.Partnership. In addition, limited partners receive the 7.5% Payment pursuant to the Partnership Agreement. Subordinated limited partner ownership interests and limited partner ownership interests are set at the discretion of the Partnership's Managing Partner. 78
PART III Item 11. | Executive Compensation, continued |
Summary Compensation Table The following table identifies the compensation of the Partnership’s Managing Partner (“CEO”), the Chief Financial Officer (“CFO”), and the three other most highly compensated Executive Committee members based on total compensation in 20122015 (including respective income allocation). | | | | | | | | | | | | | | | | | | | | | | | | | | | | Year | | | Salaries | | | Deferred
Compen-
sation | | | Income
Allocated to
Partners(1) | | | Other
Compensation | | | Total | | James D. Weddle | | | 2012 | | | $ | 250,000 | | | $ | 11,475 | | | $ | 10,863,819 | | | $ | — | | | $ | 11,125,294 | | CEO | | | 2011 | | | | 250,000 | | | | 10,609 | | | | 9,552,406 | | | | — | | | | 9,813,015 | | | | | 2010 | | | | 250,000 | | | | 9,849 | | | | 8,491,878 | | | | — | | | | 8,751,727 | | Kevin D. Bastien | | | 2012 | | | $ | 175,000 | | | $ | 11,475 | | | $ | 6,255,984 | | | $ | — | | | $ | 6,442,459 | | CFO | | | 2011 | | | | 175,000 | | | | 10,609 | | | | 5,057,572 | | | | — | | | | 5,243,181 | | | | | 2010 | | | | 175,000 | | | | 9,849 | | | | 3,908,027 | | | | — | | | | 4,092,876 | | Gary D. Reamey | | | 2012 | | | $ | 175,000 | | | $ | 11,475 | | | $ | 9,133,509 | | | $ | 1,125,135 | (3) | | $ | 10,445,119 | | General Partner- | | | 2011 | | | | 175,000 | | | | 10,609 | | | | 8,346,374 | | | | 386,249 | (4) | | | 8,918,232 | | Canadian Operations(2) | | | 2010 | | | | 175,000 | | | | 9,849 | | | | 7,482,205 | | | | 383,181 | (5) | | | 8,050,235 | | Norman L. Eaker | | | 2012 | | | $ | 175,000 | | | $ | 11,475 | | | $ | 9,237,983 | | | $ | — | | | $ | 9,424,458 | | General Partner - | | | 2011 | | | | 175,000 | | | | 10,609 | | | | 8,058,963 | | | | — | | | | 8,244,572 | | Firm Administration | | | 2010 | | | | 175,000 | | | | 9,849 | | | | 7,035,541 | | | | — | | | | 7,220,390 | | Brett A. Campbell | | | 2012 | | | $ | 175,000 | | | $ | 11,475 | | | $ | 9,095,065 | | | $ | — | | | $ | 9,281,540 | | General Partner - | | | 2011 | | | | 175,000 | | | | 10,609 | | | | 7,923,529 | | | | — | | | | 8,109,138 | | Client Strategies Group | | | 2010 | | | | 175,000 | | | | 9,849 | | | | 6,905,160 | | | | — | | | | 7,090,009 | |
| | | | | | | | | | | | Income | | | | | | | | | | | | | | Deferred | | | Allocated | | | | | | | | Year | | Salaries | | | Compensation | | | to Partners(1) | | | Total | | James D. Weddle | | 2015 | | $ | 250,000 | | | $ | 13,171 | | | $ | 13,689,769 | | | $ | 13,952,940 | | CEO | | 2014 | | | 250,000 | | | | 12,818 | | | | 13,655,081 | | | | 13,917,899 | | | | 2013 | | | 250,000 | | | | 12,291 | | | | 12,658,728 | | | | 12,921,019 | | Kevin D. Bastien | | 2015 | | $ | 175,000 | | | $ | 13,171 | | | $ | 10,985,450 | | | $ | 11,173,621 | | CFO | | 2014 | | | 175,000 | | | | 12,818 | | | | 10,265,697 | | | | 10,453,515 | | | | 2013 | | | 175,000 | | | | 12,291 | | | | 8,430,646 | | | | 8,617,937 | | Norman L. Eaker | | 2015 | | $ | 175,000 | | | $ | 13,171 | | | $ | 11,569,841 | | | $ | 11,758,012 | | General Partner - Firm Administration | | 2014 | | | 175,000 | | | | 12,818 | | | | 11,814,257 | | | | 12,002,075 | | | | 2013 | | | 175,000 | | | | 12,291 | | | | 10,836,785 | | | | 11,024,076 | | Daniel J. Timm | | 2015 | | $ | 175,000 | | | $ | 13,171 | | | $ | 11,040,079 | | | $ | 11,228,250 | | General Partner - Branch Development | | 2014 | | | 175,000 | | | | 12,818 | | | | 11,119,514 | | | | 11,307,332 | | | | 2013 | | | 175,000 | | | | 12,291 | | | | 9,655,616 | | | | 9,842,907 | | James A. Tricarico, Jr. | | 2015 | | $ | 175,000 | | | $ | 13,171 | | | $ | 10,118,177 | | | $ | 10,306,348 | | General Partner - Legal | | | | | | | | | | | | | | | | | | |
(1) | Income Allocatedallocated to Partnerspartners includes earningsallocations from general partner, interests and any subordinated limited partnership orpartner and limited partnership investmentpartner capital ownership interests in the Partnership. |
(2)
| Effective January 1, 2012, David L. Lane assumed responsibility as leader of Canadian Operations from Mr. Reamey, who remained with the Partnership as a member None of the Executive Committee and a senior partner through 2012 when he retired frommembers received any portion of the Partnership.8% net income allocation for the periods presented in the table.
|
(3)
| Related to Mr. Reamey’s assignment in Canada, amount includes cost of living adjustment of $34,920, housing allowance of $56,315 and tax equalization reimbursement of $1,033,900.
|
(4)
| Related to Mr. Reamey’s assignment in Canada, amount includes cost of living adjustment of $35,903, housing allowance of $57,901 and tax equalization reimbursement of $292,445.
|
(5)
| Related to Mr. Reamey’s assignment in Canada, amount includes cost of living adjustment of $34,051, housing allowance of $54,913 and tax equalization reimbursement of $294,217.
|
79
PART III ITEM 12. | SECURITY OWNERSHIP OF CERTAIN BENEFICIAL OWNERSOWNERS AND MANAGEMENT AND RELATED STOCKHOLDER MATTERS |
As the Partnership is organized as a limited partnership, its management is vested in the general partners thereof and there are no other outstanding “voting” or “equity” securities. It is the opinionresponsible for management of the Partnership that the general partnership interests are not securities within the meaning of federal and state securities laws primarily because each of thebusiness. The general partners participates in the management and conduct of the business. In connection withhave designated the Partnership’s outstanding limitedExecutive Committee as its executive officers. For additional information regarding the Partnership’s Executive Committee, refer to Part III, Item 10 – Directors, Executive Officers and subordinatedCorporate Governance.
The following table shows the ownership of limited partnership interests (which are inby each case non-voting securities), 321 ofExecutive Committee member and the general partners also own limited partnership interests and 48 of the general partners also own subordinated limited partnership interests,Executive Committee members as noted in the table below. No person is the beneficial owner of more than 2.5% of the Partnership’s general partner interests. Asa group as of February 22, 2013:26, 2016:
| Title of Class | | Name of Beneficial
Owner | | Amount of
Beneficial
Owner | | | % of
Class | | | Name of Beneficial Owner | | Amount Beneficially Owned | | | % of Class | | Limited Partnership Interests | | All General Partners
as a Group | | $ | 47,766,100 | | | | 7 | % | | James D. Weddle | | $ | — | | | | 0% | | Subordinated Limited Partnership Interests | | All General Partners
as a Group | | $ | 78,060,396 | | | | 26 | % | | Limited Partnership Interests | | | Kevin D. Bastien | | | — | | | | 0% | | Limited Partnership Interests | | | Kenneth R. Cella, Jr. | | | 115,600 | | | * | | Limited Partnership Interests | | | Norman L. Eaker | | | — | | | | 0% | | Limited Partnership Interests | | | Timothy J. Kirley | | | 12,000 | | | * | | Limited Partnership Interests | | | Penny Pennington | | | 27,000 | | | * | | Limited Partnership Interests | | | Daniel J. Timm | | | 105,000 | | | * | | Limited Partnership Interests | | | James A. Tricarico, Jr. | | | — | | | | 0% | | Limited Partnership Interests | | | All Executive Committee Members as a Group (8 persons) | | $ | 259,600 | | | * | |
* | Each of these Executive Committee members and the Executive Committee members as a group own less than 1% of the limited partnership interests outstanding. |
80
PART III ITEM 13. | CERTAIN RELATIONSHIPS AND RELATED TRANSACTIONS, AND DIRECTOR INDEPENDENCE |
In the ordinary course of its business the Partnership has extended credit to certain of its partners and employees in connection with their purchase of securities. Such extensions of credit have been made on substantially the same terms, including with respect to interest rates and collateral requirements, as those prevailing at the time for comparable transactions with non-affiliated persons, and did not involve more than the normal risk of collectability or present other unfavorable features. The Partnership also, from time to time and in the ordinary course of business, enters into transactions involving the purchase or sale of securities from or to partners or employees and members of their immediate families, as principal. Such purchases and sales of securities on a principal basis are affected on substantially the same terms as similar transactions with unaffiliated third parties. The Partnership leases approximately 10% of its branch office space from its financial advisors. Rent expense related to these leases approximated $20.0$27 million, $25 million and $23 million for the years ended December 31, 2012, 20112015, 2014 and 2010.2013, respectively. These leases are executed and maintained in the samea similar manner as those entered into with third parties. In 2011, theThe Partnership began makingmakes loans available to those general partners (other than members of the Executive Committee)Committee, which consists of the executive officers of the Partnership) that desire financing for some or all of their new purchases of individual partnership capital interests. See the Liquidity section ofPart II, Item 7 – Management’s Discussion and Analysis of Financial Condition and Results of Operations – Liquidity for further information.
Policy for Review and Approval of Transactions with Related Persons The Partnership’s policy with respect to related person transactions applies to transactions, arrangements and relationships (or any series of similar transactions, arrangements or relationships) that are reportable by the Partnership under paragraph (a) of Item 404 of SEC Regulation S-K in which the aggregate amount involved exceeds $120,000 in any calendar year, and in which a related person has or will have a direct or indirect material interest. For purposes of the policy, the term ‘‘related person’’ is definedhas the meaning set forth in Item 404(a) of SEC Regulation S-K 404(a)‘‘Transactions with related persons, promoters and certain control persons’’. Under the policy, the Partnership’s CFO or General CounselChief Legal Officer will determine whether a transaction meets the requirements of a related person transaction pursuant to Item 404(a) of SEC Regulation S-K 404(a) requiring approval by the Audit Committee. Transactions that fall within the definition will be referred to the Audit Committee for approval, ratification or other action. Based on its consideration of all of the relevant facts and circumstances, the Audit Committee will decide whether or not to approve such transaction and will approve only those transactions that it determines are in the best interest of the Partnership. If the Partnership’s CFO or General CounselChief Legal Officer becomes aware of an existing transaction with a related person which has not been approved under this policy, the matter will be referred to the Audit Committee. The Audit Committee will evaluate all options available, including ratification, revision or termination of such transaction. There are two contracts as well as three family relationship agreements in place asAs of December 31, 2012 that meet2015, the requirementfollowing transactions met the definition of a related person transaction pursuant to Item 404(a) of SEC Regulation S-K 404(a).S-K. These contracts were subject to review by appropriate areas within the Partnership including the Partnership’s Finance and Legal areas prior to execution.
81
PART III Item 13. | Certain Relationships and Related Transactions, and Director Independence, continued |
Touch of Class, Inc. On July 28, 2008,August 1, 2012, the Partnership entered into a five year master vendor agreement with Touch of Class, Inc. to provide artwork in the Partnership’s branch offices.offices through July 31, 2015. This agreement was amended as of August 1, 2012July 31, 2015 to extend the agreement through July 31, 2015.2016. Touch of Class, Inc. is 100% owned by Shelia Timm, and Eric Timm and Ashley Timm, spouse, son and son,daughter, respectively, of Daniel J. Timm, a member of the Partnership’s Executive Committee. The total amount paid to Touch of Class, Inc. in 20122015 pursuant to this agreement was approximately $190,000.$540,000. Cassidy TurleyCushman & Wakefield
On September 1, 2004, theThe Partnership entered intohad two agreements with Cassidy Turley,DTZ, one to manage the Partnership’s branch office leases and one to manage the Partnership’s home office facilities. Each agreement was for a term of five years.facilities, which were effective until December 31, 2015. DTZ merged with Cushman & Wakefield on September 1, 2015. On May 3, 2010January 1, 2016 each agreement was amended and extended for a period of five years. Cassidy Turleyone year. Cushman & Wakefield is a leading commercial real estate services provider with more than 3,70043,000 professionals in more than 60 officescountries across the country.world. Lyle Gilbertson, a principal of Cassidy Turley,Cushman & Wakefield, is the brother-in-law of Norman L. Eaker, a member of the Partnership’s Executive Committee. The total amount paid to Cassidy TurleyCushman & Wakefield in 20122015 pursuant to this agreement was approximately $10$11.7 million.
Family Relationships The Partnership has an anti-nepotism policy in the home office. However, the Partnership encourages the recruitment of family and friends to be financial advisors and branch office administrators. As such, it is very common for family members to be employed by the Partnership and paid consistent with the compensation programs provided to other financial advisors and branch office administrators of the Partnership. The following summarizes Family Relationships with members of the Partnership’s Executive Committee. Brett A. Campbell, a member of the Partnership’s Executive Committee, has a brother, Robert Campbell, who was employed by the Partnership as a financial advisor during 2012 (and presently). Mr. Campbell earned approximately $590,000 in compensation during 2012 and has been employed by the Partnership for 32 years. The compensation program under which Mr. Campbell is paid is consistent with the compensation programs provided to other financial advisors of the Partnership.
Daniel J. Timm, a member of the Partnership’s Executive Committee, has a sister-in-law, Kim Renk, who was employed by the Partnership as a financial advisor during 20122015 (and presently). Ms. Renk earned approximately $390,000$625,000 in compensation during 20122015 and has been employed by the Partnership for 1821 years. The compensation program under which Ms. Renk is paid is consistent with the compensation programs provided to other financial advisors of the Partnership. James D. Weddle, a member of the Partnership’s Executive Committee, has a son-in-law, Travis Selner, who was employed by the Partnership as a financial advisor during 20122015 (and presently). Mr. Selner earned approximately $240,000$265,000 in compensation during 20122015 and has been employed by the Partnership for seven10 years. The compensation program under which Mr. Selner is paid is consistent with the compensation programs provided to other financial advisors of the Partnership. 82
PART III ITEM 14. | PRINCIPAL ACCOUNTINGACCOUNTING FEES AND SERVICES |
The following table presents fees paid and accrued by the Partnership to its independent registered public accountants, PricewaterhouseCoopers LLP. | | | | | | | | | (Dollars in thousands) | | 2012 | | | 2011 | | Fees paid by the Partnership: | | | | | | | | | Audit fees | | $ | 2,320 | | | $ | 2,228 | | Audit-related fees (1) | | | 970 | | | | 931 | | Tax fees (2) | | | 29 | | | | 572 | | Other (3) | | | 927 | | | | 100 | | | | | | | | | | | Total fees | | $ | 4,246 | | | $ | 3,831 | | | | | | | | | | |
($ thousands) | | 2015 | | | 2014 | | Audit fees | | $ | 2,625 | | | $ | 2,648 | | Audit-related fees(1) | | | 1,217 | | | | 1,566 | | Tax fees(2) | | | 1,357 | | | | 164 | | Other(3) | | | 26 | | | | 123 | | Total fees | | $ | 5,225 | | | $ | 4,501 | |
(1) | Audit-related fees consist primarily of fees for internal control reviews, attestation/agreed-upon procedures, employee benefit plan audits, and consultations concerning financial accounting and reporting standards. |
(2) | Tax fees consist of fees for services relating to tax compliance and consultation on tax matters, and other tax planning and advice. |
(3) | Other primarily consists of fees for advisoryconsulting services, primarily related to potential enhancements to certain service offerings.including assessment projects in both 2015 and 2014. |
The Audit Committee pre-approved all audit and non-audit related services in fiscal year 2012years 2015 and 2011.2014. No services were provided under the de minimis fee exception to the audit committee pre-approval requirements. PART IV
83
PART IV ITEM 15. | EXHIBITS AND FINANCIALFINANCIAL STATEMENT SCHEDULES |
INDEX | | | | | | | | | | | | | | | | | | Page No. | | | | | | | | | Page No. | | | | | (a) | | | (1 | ) | (1) | The following financial statements are included in Part II, Item 8: | | | | | | | | | | | | | | |
| Management’s Report on Internal Control over Financial Reporting | | | 66 | 50 | | | | | | | | | | |
| Report of Independent Registered Public Accounting Firm | | | 67 | 51 | | | | | | | | | | |
| Consolidated Statements of Financial Condition as of December 31, 20122015 and 20112014 | | | 69 | 52 | | | | | | | | | | |
| Consolidated Statements of Income for the years ended December 31, 2012, 20112015, 2014 and 20102013 | | | 70 | 53 | | | | | | | | | | |
| Consolidated Statements of Changes in Partnership Capital Subject to Mandatory Redemption for the years ended December 31, 2012, 20112015, 2014 and 20102013 | | | 71 | 54 | | | | | | | | | | |
| Consolidated Statements of Cash Flows for the years ended December 31, 2012, 20112015, 2014 and 20102013 | | | 72 | 55 | | | | | | | | | | |
| Notes to Consolidated Financial Statements | | | 73 | 56 | | | | | | | | (2 | ) | (2) | The following financial statements are included in Schedule I: | | | | | | | | | | | | | | |
| Parent Company Only Condensed Statements of Financial Condition as of December 31, 20122015 and 20112014 | | | 115 | 88 | | | | | | | | | | |
| Parent Company Only Condensed Statements of Income for the years ended December 31, 2012, 20112015, 2014 and 20102013 | | | 116 | 89 | | | | | | | | | | |
| Parent Company Only Condensed Statements of Cash Flows for the years ended December 31, 2012, 20112015, 2014 and 20102013 | | | 117 | 90 | | | | | | | | | | | Schedules
| Other schedules are omitted because they are not required, inapplicable, or the information is otherwise shown in the Consolidated Financial Statements or notes thereto. | | | | | | (b) | | | | | | Exhibits | | | | | | | | | | | | | | | Reference is made to the Exhibit Index hereinafter contained. | | | | |
PART IV
SIGNATURESSIGNATURES
Pursuant to the requirements of Section 13 or 15(d) of the Securities Exchange Act of 1934, the Registrant has duly caused this report to be signed on its behalf by the undersigned, thereunto duly authorized.authorized. | | | THE JONES FINANCIAL COMPANIES, L.L.L.P. | | | By: | | /s/ James D. Weddle | | | James D. Weddle | | | Managing Partner (Principal Executive Officer) | | | April 1, 2013March 11, 2016
|
Pursuant to the requirements of the Securities Exchange Act of 1934, this report has been signed below by the following persons on behalf of the Registrant in the capacities and on the dates indicated: | | | | | Signatures | | Title | | Date | | | | | | /s/ James D. Weddle | | Managing Partner | | March 11, 2016 | James D. Weddle | | Managing Partner
(Principal Executive Officer) | | April 1, 2013
| | | | | | /s/ Kevin D. Bastien | | Chief Financial Officer | | March 11, 2016 | Kevin D. Bastien | | Chief Financial Officer
(Principal Financial and Accounting Officer) | | April 1, 2013
|
PART IV
EXHIBIT INDEX TO ANNUAL REPORT ON FORM 10-K
FOR THE YEAR ENDED DECEMBER 31, 2012
85
EXHIBIT INDEX Exhibit
Number | | | | | Description | | | | 3.1 | | | * | | | EighteenthNineteenth Amended and Restated Agreement of Registered Limited Liability Limited Partnership, of the Registrant, dated as of November 26, 2010,June 6, 2014, incorporated by reference tofrom Exhibit 3.1 to the Registrant’sThe Jones Financial Companies, L.L.L.P. Form 8-K dated November 26, 2010.June 6, 2014.
| | | | 3.2 | | | ** | | | Ninth Amendment of EighteenthTwentieth Restated Certificate of Limited Partnership.Partnership of The Jones Financial Companies, L.L.L.P., dated November 20, 2015. | 3.3 | ** | Tenth Amendment of Twentieth Restated Certificate of Limited Partnership of The Jones Financial Companies, L.L.L.P., dated January 22, 2016. | 10.13.4
| | | * | | * | Note Purchase Agreement by Edward D.Eleventh Amendment of Twentieth Restated Certificate of Limited Partnership of The Jones & Co.Financial Companies, L.L.L.P., L.P., for $250,000,000 aggregate principal amount of 7.33% subordinated capital notes due June 12, 2014, incorporated by reference to the Registrant’s Quarterly Report on Form 10-Q for the quarter ended June 28, 2002.dated February 16, 2016.
| | | | 10.2 | | | * | | | Ordinance No. 24,183 relating to certain existing Agreement entered into by St. Louis County, Missouri, in connection with the issuance of its Taxable Industrial Revenue Bonds (Edward Jones Des Peres Project) approved November 12, 2009, incorporated by reference to Exhibit 10.5 to the Registrant’s Annual Report on Form 10-K for the year ended December 31, 2009.
| | | | 10.3
| | | * | | | Ordinance No. 24,182 authorizing Amendments of certain existing Agreements entered into by St. Louis County, Missouri, in connection with the issuance of its Taxable Industrial Revenue Bonds (Edward Jones Maryland Heights Project) approved November 12, 2009, incorporated by reference tofrom Exhibit 10.6 to the Registrant’s Annual Report on Form 10-K for the year ended December 31, 2009. | | | | 10.410.3
| | | * | | | Lease between Eckelkamp Office Center South, L.L.C., a Missouri Limited Liability Company, as Landlord and Edward D. Jones & Co., L.P., as Tenant, dated February 3, 2000, incorporated by reference tofrom the Registrant’s Annual Report on Form 10-K for the year ended December 31, 2001. | | | | 10.510.4
| | | * | | | Share Purchase Agreement between Edward D. Jones & Co., L.P. and Towry Law Finance Company Limited, dated October 22, 2009, incorporated by reference to Exhibit 10.21 tofrom the Registrant’s Annual Report on Form 10-K for the year ended December 31, 2009. | | | | 10.610.5
| | | * | | | Amended and Restated Credit Agreement by The Jones Financial Companies, L.L.L.P. and Wells Fargo Bank, National Association, for a $395,000,000$400,000,000 revolving line of credit, dated March 18, 2011.November 15, 2013, incorporated by reference from Exhibit 10.6 to the Registrant's Annual Report on Form 10-K for the year ended December 31, 2013. | | | | 10.710.6
| | | * | | | Eleventh Amended and Restated Agreement of Limited Partnership Agreement of Edward D. Jones & Co., L.P. dated March 10, 2010, incorporated by reference tofrom Exhibit 3.3 to the Registrant’s Annual Report on Form 10-K for the year ended December 31, 2009. | 10.7 | * | The Jones Financial Companies, L.L.L.P. 2014 Employee Limited Partnership Interest Purchase Plan, incorporated by reference from Exhibit 99.1 to the Form S-8 Registration Statement (File No. 333-193431) filed on January 17, 2014. (Constitutes a management contract or compensatory plan or arrangement) | 2121.1
| | | ** | | | Subsidiaries of the Registrant | | | | 23.1 | | | ** | | | Consent of Independent Registered Public Accounting Firm filed herewith. |
PART IV
Exhibit Index to Annual Report on Form 10-K for the Year Ended December 31, 2012, continued
| | | | | Exhibit
Number
| | | | Description
| | | | 31.1 | | ** | | Certification of Chief Executive Officer pursuant to Rule 13a-14(a)/15(d)-14(a) of the Securities Act of 1934, as amended, as adopted pursuant to section 302 of the Sarbanes-Oxley Act of 2002. | | | | 31.2 | | ** | | Certification of Chief Financial Officer pursuant to Rule 13a-14(a)/15(d)-14(a) of the Securities Act of 1934, as amended, as adopted pursuant to section 302 of the Sarbanes-Oxley Act of 2002. | | | | 32.1 | | ** | | Certification of Chief Executive Officer pursuant to 18 U.S.C. section 1350, as adopted pursuant to section 906 of the Sarbanes-Oxley Act of 2002. |
86
EXHIBIT INDEX Exhibit Number | | Description | 32.2 | | ** | | Certification of Chief Financial Officer pursuant to 18 U.S.C. section 1350, as adopted pursuant to section 906 of the Sarbanes-Oxley Act of 2002. | | | | 99.1 | | * | | Order Instituting Administrative and Cease and Desist proceedings, Making Findings, and Imposing Remedial Sanctions and a Cease-and-Desist Order Pursuant to Section 8A of the Securities Act of 1933 and Sections 15(b) and 21C of the Securities Exchange Act of 1934, dated December 22, 2004, incorporated by reference tofrom Exhibit 99.1 to the Registrant’s Form 8-K dated December 27, 2004. | | | | 99.2 | | * | | NASD Letter of Acceptance, Waiver and Consent, dated December 22, 2004, incorporated by reference tofrom Exhibit 99.2 to the Registrant’s Form 8-K dated December 27, 2004. | | | | 99.3 | | * | | NYSE Stipulation of Facts and Consent to Penalty, dated December 22, 2004, incorporated by reference tofrom Exhibit 99.3 to the Registrant’s Form 8-K dated December 27, 2004. | | | | 99.4 | | * | | Deferred Consideration Agreement, dated December 22, 2004, incorporated by reference to Exhibit 99.4 tofrom the Registrant’s Form 8-K dated December 27, 2004. | | | | 101.INS | | *** | | XBRL Instance Document | | | | 101.SCH | | *** | | XBRL Taxonomy Extension Schema | | | | 101.CAL | | *** | | XBRL Taxonomy Extension Calculation | | | | 101.DEF | | *** | | XBRL Extension Definition | | | | 101.LAB | | *** | | XBRL Taxonomy Extension Label | | | | 101.PRE | | *** | | XBRL Taxonomy Extension Presentation |
PART II
Exhibit Index to Annual Report on Form 10-K for the Year Ended December 31, 2012, continued
| | | * | | Incorporated by reference to previously filed exhibits. | | |
** | | Filed herewith. | | | ***
| | Attached as Exhibit 101 to this Annual Report on Form 10-K for the annual period ended December 31, 2012 are the following materials formatted in XBRL (Extensible Business Reporting Language) (i) Consolidated Statements of Financial Condition, (ii) Consolidated Statements of Income, (iii) Consolidated Statements of Cash Flows, and (iv) Notes to Consolidated Financial Statements, tagged as blocks of text.
|
SCHEDULE
87
Schedule I CONDENSED STATEMENTS OF FINANCIAL CONDITIONTHE JONES FINANCIAL COMPANIES, L.L.L.P. (Parent Company Only) CONDENSED STATEMENTS OF FINANCIAL CONDITION | | | | | | December 31, | | | December 31, | | (Dollars in thousands) | | December 31,
2012 | | | December 31,
2011 | | | (Dollars in millions) | | | 2015 | | | 2014 | | ASSETS: | | | | | | | | | | | | | | | | | | | | | | | Cash and cash equivalents | | $ | 285,384 | | | $ | 149,826 | | | $ | 331 | | | $ | 119 | | | | | | | | | | | | Investment securities | | | 12,576 | | | | 15,224 | | | | 9 | | | | 9 | | | | | | | | | | | | Investment in subsidiaries | | | 1,673,619 | | | | 1,729,936 | | | | 2,255 | | | | 2,076 | | | | | | | | | | | | Other assets | | | 11,699 | | | | 11,150 | | | | 15 | | | | 15 | | | | | | | | | | | | | | | | | TOTAL ASSETS | | $ | 1,983,278 | | | $ | 1,906,136 | | | $ | 2,610 | | | $ | 2,219 | | | | | | | | | | | | | | | | | LIABILITIES: | | | | | | | | | | | | | | | | | | | | | | | Accounts payable and accrued expenses | | $ | 385 | | | $ | 359 | | | $ | — | | | $ | 1 | | | | | | | | | | | | Partnership capital subject to mandatory redemption | | | 1,982,893 | | | | 1,905,777 | | | | 2,610 | | | | 2,218 | | | | | | | | | | | | | | | | | TOTAL LIABILITIES | | $ | 1,983,278 | | | $ | 1,906,136 | | | $ | 2,610 | | | $ | 2,219 | | | | | | | | | |
These financial statements should be read in conjunction with the notesNotes to the Consolidated Financial Statements of The Jones Financial Companies, L.L.L.P. 88
Schedule I THE JONES FINANCIAL COMPANIES, L.L.L.P. (Parent Company Only) CONDENSED STATEMENTS OF INCOME | | | | | | | | For the Years Ended December 31, | | | | | For the Years Ended | | | (Dollars in thousands) | | December
31, 2012 | | December
31, 2011 | | December
31, 2010 | | | (Dollars in millions) | | | 2015 | | | 2014 | | | 2013 | | NET REVENUE | | | | | | | | | | | | | | | | | | | Subsidiary earnings | | $ | 548,308 | | | $ | 482,926 | | | $ | 394,861 | | | $ | 833 | | | $ | 764 | | | $ | 667 | | Management fee income | | | 78,016 | | | | 78,485 | | | | 62,438 | | | | 99 | | | | 78 | | | | 76 | | Other | | | 8,606 | | | | 1,166 | | | | 1 | | | | 7 | | | | 7 | | | | 9 | | | | | | | | | | | | | | | | | | | | | | | | Total revenue | | | 634,930 | | | | 562,577 | | | | 457,300 | | | | 939 | | | | 849 | | | | 752 | | | | | | | | | | | | | | | | Interest expense | | | 49,194 | | | | 50,231 | | | | 34,227 | | | | 69 | | | | 48 | | | | 48 | | | | | | | | | | | | | | | | | | | | | | | | Net revenue | | | 585,736 | | | | 512,346 | | | | 423,073 | | | | 870 | | | | 801 | | | | 704 | | | | | | | | | | | | | | | | | | | | | | | | OPERATING EXPENSES | | | | | | | | | | | | | | | | | | | Compensation and benefits | | | 28,836 | | | | 28,348 | | | | 28,203 | | | | 30 | | | | 30 | | | | 28 | | Payroll and other taxes | | | 256 | | | | 151 | | | | 316 | | | Other operating expenses | | | 1,624 | | | | 2,064 | | | | 1,769 | | | | 2 | | | | 1 | | | | 2 | | | | | | | | | | | | | | | | | | | | | | | | Total operating expenses | | | 30,716 | | | | 30,563 | | | | 30,288 | | | | 32 | | | | 31 | | | | 30 | | | | | | | | | | | | | | | | | | | | | | | | INCOME BEFORE ALLOCATIONS TO PARTNERS | | $ | 555,020 | | | $ | 481,783 | | | $ | 392,785 | | | $ | 838 | | | $ | 770 | | | $ | 674 | | | | | | | | | | | | | | | | Allocations to partners | | | (555,020 | ) | | | (481,783 | ) | | | (392,785 | ) | | | (838 | ) | | | (770 | ) | | | (674 | ) | | | | | | | | | | | | | | | | | | | | | | | NET INCOME | | $ | — | | | $ | — | | | $ | — | | | $ | — | | | $ | — | | | $ | — | | | | | | | | | | | | |
These financial statements should be read in conjunction with the notesNotes to the Consolidated Financial Statements of The Jones Financial Companies, L.L.L.P. 89
Schedule I THE JONES FINANCIAL COMPANIES, L.L.L.P. (Parent Company Only) CONDENSED STATEMENTS OF CASH FLOWS | | | | | | | | For the Years Ended December 31, | | (Dollars in millions) | | | 2015 | | | 2014 | | | 2013 | | CASH FLOWS FROM OPERATING ACTIVITIES: | | | | | | | | | | | | | | | | | For the Years Ended | | | | | | | | | | | | | | (Dollars in thousands) | | December
31, 2012 | | December
31, 2011 | | December
31, 2010 | | | CASH FLOWS FROM OPERATING ACTIVITIES: | | | | | | | | Net income | | $ | — | | | $ | — | | | $ | — | | | $ | — | | | $ | — | | | $ | — | | Adjustments to reconcile net income to net cash provided by operating activities: | | | | | | | | | | | | | | | | | | | Income before allocations to partners | | | 555,020 | | | | 481,783 | | | | 392,785 | | | | 838 | | | | 770 | | | | 674 | | Changes in assets and liabilities: | | | | | | | | | | | | | | | | | | | Investment securities | | | 2,648 | | | | (15,224 | ) | | | — | | | | — | | | | — | | | | 4 | | Investment in subsidiaries | | | 56,317 | | | | (136,358 | ) | | | (132,000 | ) | | | (179 | ) | | | (267 | ) | | | (136 | ) | Other assets | | | (549 | ) | | | (1,287 | ) | | | (353 | ) | | | — | | | | (3 | ) | | | — | | Accounts payable and accrued expenses | | | 26 | | | | (1,292 | ) | | | (6,840 | ) | | | (1 | ) | | | — | | | | 1 | | | | | | | | | | | | | Net cash provided by operating activities | | | 613,462 | | | | 327,622 | | | | 253,592 | | | | 658 | | | | 500 | | | | 543 | | | | | | | | | | | | | | | | | | | | | | | | CASH FLOWS FROM FINANCING ACTIVITIES: | | | | | | | | | | | | | | | | | | | Issuance of partnership interests | | | 45,121 | | | | 270,839 | | | | 35,984 | | | | | | | | | | | | | | | | | Issuance of partnership interests (net of partnership loans) | | | | 352 | | | | 55 | | | | 40 | | Redemption of partnership interests | | | (99,170 | ) | | | (97,191 | ) | | | (60,591 | ) | | | (161 | ) | | | (125 | ) | | | (115 | ) | Withdrawals and distributions from partnership capital | | | (434,614 | ) | | | (359,467 | ) | | | (230,017 | ) | | Repayment of general partnership loans | | | 10,759 | | | | 4,840 | | | | — | | | | | | | | | | | | | | Distributions from partnership capital (net of partnership loans) | | | | (637 | ) | | | (563 | ) | | | (490 | ) | Issuance of partnership loans | | | | — | | | | — | | | | (11 | ) | Net cash used in financing activities | | | (477,904 | ) | | | (180,979 | ) | | | (254,624 | ) | | | (446 | ) | | | (633 | ) | | | (576 | ) | | | | | | | | | | | | | | | | | | | | | | | Net increase (decrease) in cash and cash equivalents | | | 135,558 | | | | 146,643 | | | | (1,032 | ) | | | 212 | | | | (133 | ) | | | (33 | ) | | | | | | | | | | | | | | | CASH AND CASH EQUIVALENTS: | | | | | | | | | | | | | | | | | | | | | | | | | | | | | | | | | Beginning of year | | | 149,826 | | | | 3,183 | | | | 4,215 | | | | 119 | | | | 252 | | | | 285 | | | | | | | | | | | | | End of year | | $ | 285,384 | | | $ | 149,826 | | | $ | 3,183 | | | $ | 331 | | | $ | 119 | | | $ | 252 | | | | | | | | | | | | | | | | | | | | | | | | NON-CASH ACTIVITIES: | | | | | | | | | | | | | | | | | | | | | | | | | | | | Issuance of general partnership interests through partnership loans in current period | | | $ | 119 | | | $ | 86 | | | $ | 95 | | Repayment of partnership loans through distributions from partnership capital in current period | | | $ | 99 | | | $ | 103 | | | $ | 61 | |
These financial statements should be read in conjunction with the notesNotes to the Consolidated Financial Statements of The Jones Financial Companies, L.L.L.P. 11790
|